EverQuote Announces Second Quarter 2025 Financial Results
●Second Quarter Revenue Growth of 34% Year-Over-Year to $156.6 million
●Second Quarter Variable Marketing Dollars Increase 25% Year-Over-Year to $45.5 million
●Delivers Second Quarter Record Net Income of $14.7 million and Adjusted EBITDA of $22.0 million
●Announces $50.0 million Inaugural Share Repurchase Program
CAMBRIDGE, Mass., August 4, 2025 (GLOBE NEWSWIRE) -- EverQuote, Inc. (Nasdaq: EVER), a leading online insurance marketplace, today announced financial results for the second quarter ended June 30, 2025.
“We achieved strong results in the second quarter, growing revenue 34% year-over-year and achieving record operating cash flow,” said Jayme Mendal, CEO of EverQuote. “Our team is executing well against an increasingly stable backdrop with healthy carrier profitability, and we are focused on helping carriers and agents accelerate growth by leveraging our data advantage and increasingly layering on AI-driven efficiency applications. We continue making progress towards our vision to become the leading growth partner to P&C insurance providers by efficiently delivering better performing referrals, bigger traffic scale and a broader suite of products and services.”
Also announced today, EverQuote’s Board of Directors has approved a share repurchase program that authorizes the Company to purchase up to $50.0 million of the Company’s Class A common stock from time to time, in open market transactions at prevailing prices or by other means in accordance with federal securities laws.
“We delivered a strong second quarter, and have been successful in driving incremental efficiency through disciplined expense management and by leveraging AI with other technology investments, as we continue to scale,” said Joseph Sanborn, CFO of EverQuote. “Today, we are pleased to announce our inaugural share repurchase program, representing our success in delivering strong free cash flow and confidence in our trajectory. We plan to be opportunistic with capital allocation and remain confident in our ability to invest in long-term sustainable growth, while maintaining a strong balance sheet.”
Second Quarter 2025 Highlights:
(Unless otherwise noted, all comparisons are relative to the second quarter of 2024).
●Total revenue grew 34% to $156.6 million.
●Automotive insurance vertical revenue of $139.6 million, an increase of 36%.
●Home and renters insurance vertical revenue of $17.0 million, an increase of 23%.
●Variable Marketing Dollars grew to $45.5 million, compared to $36.5 million, an increase of 25%.
●GAAP net income increased to $14.7 million, compared to a GAAP net income of $6.4 million.
●Adjusted EBITDA increased to $22.0 million, compared to $12.9 million. Adjusted EBITDA margin expanded to a record 14%.
●Record operating cash flow of $25.3 million, compared to $12.4 million.
●Ended the quarter with $148.2 million in cash and cash equivalents, a sequential increase of 19% from $125.0 million at the end of the first quarter of 2025.
Third Quarter 2025 Outlook:
●Revenue of $163.0 - $169.0 million, representing 15% year-over-year growth at the midpoint.
●Variable Marketing Dollars of $47.0 - $50.0 million, representing 10% year-over-year growth at the midpoint.
●Adjusted EBITDA of $22.0 - $24.0 million, representing 22% year-over-year growth at the midpoint.
Share repurchases under the new $50 million program may be made from time to time on the open market, pursuant to Rule 10b5-1 trading plans, or by other legally permissible means. The share repurchase program expires on July 22, 2026, does not obligate EverQuote, Inc. to acquire a specific number of shares, and may be suspended, modified, or terminated at any time, without prior notice. The number of shares to be repurchased will depend on market conditions and other factors. Repurchases under the program are expected to be funded from a combination of existing cash balances and future cash flow.
With respect to the Company’s expectations under “Third Quarter 2025 Outlook” above, the Company has not reconciled the non-GAAP measure Adjusted EBITDA to the GAAP measure net income (loss) in this press release because the Company does not provide guidance for stock-based compensation expense, depreciation and amortization expense, legal settlement expense, interest income, and income taxes on a consistent basis as the Company is unable to quantify these amounts without unreasonable efforts, which would be required to include a reconciliation of Adjusted EBITDA to GAAP net income (loss). In addition, the Company believes such a reconciliation would imply a degree of precision that could be confusing or misleading to investors.
Conference Call and Webcast Information
EverQuote will host a conference call and live webcast to discuss its second quarter 2025 financial results at 4:30 p.m. Eastern Time today, August 4, 2025. To access the conference call, dial Toll Free: +1 (800) 715-9871 for the US, or +1 (646) 307-1963 for international callers, and provide conference ID 8699350. The live webcast and replay will be available on the Investors section of the Company’s website at https://investors.everquote.com.
Safe Harbor Statement
This press release contains forward-looking statements, within the meaning of Section 27A of the Securities Act of 1933, as amended, and Section 21E of the Securities Exchange Act of 1934, as amended. All statements other than statements of historical fact contained in this press release, including statements regarding our future results of operations and financial position, business strategy and plans, and objectives of management for future operations, are forward-looking statements. These statements involve known and unknown risks, uncertainties, and other important factors that may cause our actual results, performance or achievements to be materially different from any future results, performance, or achievements expressed or implied by the forward-looking statements. In some cases, you can identify forward-looking statements by terms such as “may,” “should,” “expects,” “might,” “plans,” “anticipates,” “could,” “intends,” “target,” “projects,” “contemplates,” “believes,” “estimates,” “predicts,” “potential,” “seek,” “would” or “continue,” or the negative of these terms or other similar expressions. The forward-looking statements in this press release are only predictions. We have based these forward-looking statements largely on our current expectations and projections about future events and financial trends that we believe may affect our business, financial condition, liquidity and results of operations. Although we believe that the expectations reflected in the forward-looking statements are reasonable, we cannot guarantee that the future results, levels of activity, performance or events and circumstances reflected in the forward-looking statements will be achieved or occur. These forward-looking statements speak only as of the date of this press release and are subject to a number of risks, uncertainties and assumptions described in our annual report on Form 10-K, our quarterly reports on Form 10-Q and our current reports on Form 8-K as filed with the Securities and Exchange Commission (“SEC”) from time to time. Additional information will also be set forth in the Company's annual report on Form 10-Q for the quarter ended June 30, 2025, which will be filed with the SEC. Because forward-looking statements are inherently subject to risks and uncertainties, some of which cannot be predicted or quantified, you should not rely on these forward-looking statements as predictions of future events. The events and circumstances reflected in our forward-looking statements may not be achieved or occur and actual results could differ materially from those projected in the forward-looking statements. While we may elect to update these forward-looking statements at some point in the future, whether as a result of any new information, future events, or otherwise, we have no current intention of doing
so except to the extent required by applicable law. Some of the key factors that could cause actual results to differ include: (1) our dependence on revenue from the property and casualty insurance industries, and specifically automotive insurance, and exposure to risks related to those industries; (2) our dependence on our relationships with insurance providers with no long-term minimum financial commitments; (3) our reliance on a small number of insurance providers for a significant portion of our revenue; (4) our dependence on third-party media sources for a significant portion of visitors to our websites and marketplace; (5) our ability to attract consumers searching for insurance to our websites and marketplace through Internet search engines, display advertising, social media, content-based online advertising and other online sources; (6) any limitations restricting our ability to market to users or collect and use data derived from user activities; (7) risks related to cybersecurity incidents or other network disruptions; (8) risks related to the use of artificial intelligence; (9) our ability to develop new and enhanced products and services to attract and retain consumers and insurance providers, and to successfully monetize them; (10) the impact of competition in our industry and innovation by our competitors; (11) our ability to hire and retain necessary qualified employees to expand our operations; (12) our ability to stay abreast of and comply with new or modified laws and regulations that currently apply or become applicable to our business, including with respect to the insurance industry, telemarketing restrictions and data privacy requirements; (13) our ability to protect our intellectual property rights and maintain and build our brand; (14) our future financial performance, including our expectations regarding our revenue, cost of revenue, variable marketing dollars, operating expenses, cash flows and ability to achieve, and maintain, future profitability; (15) our ability to properly collect, process, store, share, disclose and use consumer information and other data; (16) any impacts of economic or legislative developments, including inflation, potential tariffs and the One Big Beautiful Bill Act; and (17) the future trading prices of our Class A common stock, including any impacts resulting from our share repurchase program.
About EverQuote
EverQuote operates a leading online marketplace for insurance shopping, connecting consumers with insurance provider customers, which includes both carriers and agents. Our vision is to be the leading growth partner for property and casualty, or P&C, insurance providers. Our results-driven marketplace, powered by our proprietary data and technology platform, is improving the way insurance providers attract and connect with consumers shopping for insurance.
For more information, visit https://investors.everquote.com and follow on LinkedIn.
Investor Relations Contact
Brinlea Johnson
The Blueshirt Group
(415) 269-2645
EVERQUOTE, INC.
STATEMENTS OF OPERATIONS
|
|
|
|
|
|
|
|
|
|
|
|
|
|
|
|
|
|
|
Three Months Ended June 30, |
|
|
Six Months Ended June 30, |
|
|
|
2025 |
|
|
2024 |
|
|
2025 |
|
|
2024 |
|
|
|
(in thousands except per share) |
|
Revenue |
|
$ |
156,629 |
|
|
$ |
117,140 |
|
|
$ |
323,261 |
|
|
$ |
208,205 |
|
Cost and operating expenses(1): |
|
|
|
|
|
|
|
|
|
|
|
|
Cost of revenue |
|
|
4,842 |
|
|
|
5,011 |
|
|
|
10,222 |
|
|
|
10,052 |
|
Sales and marketing |
|
|
121,055 |
|
|
|
90,913 |
|
|
|
250,485 |
|
|
|
161,697 |
|
Research and development |
|
|
7,772 |
|
|
|
7,043 |
|
|
|
15,257 |
|
|
|
13,887 |
|
General and administrative |
|
|
8,460 |
|
|
|
7,881 |
|
|
|
16,900 |
|
|
|
14,511 |
|
Legal settlement |
|
|
332 |
|
|
|
— |
|
|
|
8,232 |
|
|
|
— |
|
Total cost and operating expenses |
|
|
142,461 |
|
|
|
110,848 |
|
|
|
301,096 |
|
|
|
200,147 |
|
Income from operations |
|
|
14,168 |
|
|
|
6,292 |
|
|
|
22,165 |
|
|
|
8,058 |
|
Other income (expense): |
|
|
|
|
|
|
|
|
|
|
|
|
Interest income |
|
|
918 |
|
|
|
456 |
|
|
|
1,626 |
|
|
|
842 |
|
Other income (expense), net |
|
|
(22 |
) |
|
|
60 |
|
|
|
(53 |
) |
|
|
101 |
|
Total other income, net |
|
|
896 |
|
|
|
516 |
|
|
|
1,573 |
|
|
|
943 |
|
Income before income taxes |
|
|
15,064 |
|
|
|
6,808 |
|
|
|
23,738 |
|
|
|
9,001 |
|
Income tax expense |
|
|
(363 |
) |
|
|
(406 |
) |
|
|
(1,047 |
) |
|
|
(692 |
) |
Net income |
|
$ |
14,701 |
|
|
$ |
6,402 |
|
|
$ |
22,691 |
|
|
$ |
8,309 |
|
Net income per share: |
|
|
|
|
|
|
|
|
|
|
|
|
Basic |
|
$ |
0.40 |
|
|
$ |
0.18 |
|
|
$ |
0.63 |
|
|
$ |
0.24 |
|
Diluted |
|
$ |
0.39 |
|
|
$ |
0.17 |
|
|
$ |
0.60 |
|
|
$ |
0.23 |
|
Weighted average common shares outstanding, basic and diluted: |
|
|
|
|
|
|
|
|
|
|
|
|
Basic |
|
|
36,327 |
|
|
|
34,910 |
|
|
|
36,104 |
|
|
|
34,649 |
|
Diluted |
|
|
38,014 |
|
|
|
36,698 |
|
|
|
37,841 |
|
|
|
36,154 |
|
|
|
|
|
|
|
|
|
|
|
|
|
|
(1) Amounts include stock-based compensation expense, as follows: |
|
|
|
|
|
|
Three Months Ended June 30, |
|
|
Six Months Ended June 30, |
|
|
|
2025 |
|
|
2024 |
|
|
2025 |
|
|
2024 |
|
|
|
(in thousands) |
|
Cost of revenue |
|
$ |
39 |
|
|
$ |
42 |
|
|
$ |
48 |
|
|
$ |
78 |
|
Sales and marketing |
|
|
2,006 |
|
|
|
1,652 |
|
|
|
3,571 |
|
|
|
3,246 |
|
Research and development |
|
|
1,558 |
|
|
|
1,426 |
|
|
|
2,928 |
|
|
|
2,738 |
|
General and administrative |
|
|
2,957 |
|
|
|
2,220 |
|
|
|
5,433 |
|
|
|
3,796 |
|
|
|
$ |
6,560 |
|
|
$ |
5,340 |
|
|
$ |
11,980 |
|
|
$ |
9,858 |
|
EVERQUOTE, INC.
BALANCE SHEET DATA
|
|
|
|
|
|
|
|
|
|
|
|
|
|
|
|
|
|
|
June 30, |
|
|
December 31, |
|
|
|
|
|
|
|
2025 |
|
|
2024 |
|
|
|
|
|
|
|
(in thousands) |
|
Cash and cash equivalents |
|
|
|
|
|
$ |
148,188 |
|
|
$ |
102,116 |
|
Working capital |
|
|
|
|
|
|
140,281 |
|
|
|
99,131 |
|
Total assets |
|
|
|
|
|
|
241,419 |
|
|
|
210,530 |
|
Total liabilities |
|
|
|
|
|
|
71,152 |
|
|
|
75,162 |
|
Total stockholders' equity |
|
|
|
|
|
|
170,267 |
|
|
|
135,368 |
|
EVERQUOTE, INC.
STATEMENTS OF CASH FLOWS
|
|
|
|
|
|
|
|
|
|
|
|
|
|
|
|
|
|
|
Three Months Ended June 30, |
|
|
Six Months Ended June 30, |
|
|
|
2025 |
|
|
2024 |
|
|
2025 |
|
|
2024 |
|
|
|
(in thousands) |
|
Cash flows from operating activities: |
|
|
|
|
|
|
|
|
|
|
|
|
Net income |
|
$ |
14,701 |
|
|
$ |
6,402 |
|
|
$ |
22,691 |
|
|
$ |
8,309 |
|
Adjustments to reconcile net income to net cash
provided by operating activities: |
|
|
|
|
|
|
|
|
|
|
|
|
Depreciation and amortization expense |
|
|
918 |
|
|
|
1,236 |
|
|
|
2,139 |
|
|
|
2,499 |
|
Stock-based compensation expense |
|
|
6,560 |
|
|
|
5,340 |
|
|
|
11,980 |
|
|
|
9,858 |
|
Provision for bad debt |
|
|
— |
|
|
|
(10 |
) |
|
|
— |
|
|
|
8 |
|
Unrealized foreign currency transaction (gains) losses |
|
|
75 |
|
|
|
1 |
|
|
|
110 |
|
|
|
(3 |
) |
Litigation accrual settled with sale of assets |
|
|
(59 |
) |
|
|
— |
|
|
|
7,841 |
|
|
|
— |
|
Changes in operating assets and liabilities: |
|
|
|
|
|
|
|
|
|
|
|
|
Accounts receivable |
|
|
6,843 |
|
|
|
(9,737 |
) |
|
|
6,386 |
|
|
|
(26,860 |
) |
Prepaid expenses and other current assets |
|
|
(1,491 |
) |
|
|
342 |
|
|
|
(995 |
) |
|
|
1,314 |
|
Commissions receivable, current and non-current |
|
|
859 |
|
|
|
1,321 |
|
|
|
1,873 |
|
|
|
2,644 |
|
Operating lease right-of-use assets |
|
|
281 |
|
|
|
755 |
|
|
|
548 |
|
|
|
1,252 |
|
Other assets |
|
|
— |
|
|
|
(291 |
) |
|
|
— |
|
|
|
(291 |
) |
Accounts payable |
|
|
1,747 |
|
|
|
8,615 |
|
|
|
(1,018 |
) |
|
|
24,483 |
|
Accrued expenses and other current liabilities |
|
|
(4,406 |
) |
|
|
(832 |
) |
|
|
(2,288 |
) |
|
|
1,038 |
|
Deferred revenue |
|
|
(454 |
) |
|
|
29 |
|
|
|
(119 |
) |
|
|
27 |
|
Operating lease liabilities |
|
|
(277 |
) |
|
|
(793 |
) |
|
|
(545 |
) |
|
|
(1,460 |
) |
Net cash provided by operating activities |
|
|
25,297 |
|
|
|
12,378 |
|
|
|
48,603 |
|
|
|
22,818 |
|
Cash flows from investing activities: |
|
|
|
|
|
|
|
|
|
|
|
|
Acquisition of property and equipment, including costs
capitalized for development of internal-use software |
|
|
(1,461 |
) |
|
|
(852 |
) |
|
|
(2,594 |
) |
|
|
(1,622 |
) |
Net cash used in investing activities |
|
|
(1,461 |
) |
|
|
(852 |
) |
|
|
(2,594 |
) |
|
|
(1,622 |
) |
Cash flows from financing activities: |
|
|
|
|
|
|
|
|
|
|
|
|
Proceeds from exercise of stock options |
|
|
373 |
|
|
|
1,186 |
|
|
|
2,335 |
|
|
|
2,614 |
|
Tax withholding payments related to net share settlement |
|
|
(986 |
) |
|
|
(414 |
) |
|
|
(2,279 |
) |
|
|
(843 |
) |
Net cash provided by (used in) financing activities |
|
|
(613 |
) |
|
|
772 |
|
|
|
56 |
|
|
|
1,771 |
|
Effect of exchange rate changes on cash, cash equivalents
and restricted cash |
|
|
(3 |
) |
|
|
1 |
|
|
|
7 |
|
|
|
(4 |
) |
Net increase in cash, cash equivalents
and restricted cash |
|
|
23,220 |
|
|
|
12,299 |
|
|
|
46,072 |
|
|
|
22,963 |
|
Cash, cash equivalents and restricted cash at beginning
of period |
|
|
124,968 |
|
|
|
48,620 |
|
|
|
102,116 |
|
|
|
37,956 |
|
Cash, cash equivalents and restricted cash at end
of period |
|
$ |
148,188 |
|
|
$ |
60,919 |
|
|
$ |
148,188 |
|
|
$ |
60,919 |
|
EVERQUOTE, INC.
FINANCIAL AND OPERATING METRICS
Revenue by vertical:
|
|
|
|
|
|
|
|
|
|
|
|
|
|
|
Three Months Ended June 30, |
|
|
Change |
|
|
|
2025 |
|
|
2024 |
|
|
% |
|
|
|
(in thousands) |
|
|
|
|
Automotive |
|
$ |
139,584 |
|
|
$ |
102,622 |
|
|
|
36.0 |
% |
Home and renters |
|
|
17,034 |
|
|
|
13,884 |
|
|
|
22.7 |
% |
Other |
|
|
11 |
|
|
|
634 |
|
|
|
-98.3 |
% |
Total revenue |
|
$ |
156,629 |
|
|
$ |
117,140 |
|
|
|
33.7 |
% |
|
|
|
|
|
|
|
|
|
|
|
|
|
|
|
Six Months Ended June 30, |
|
|
Change |
|
|
|
2025 |
|
|
2024 |
|
|
% |
|
|
|
(in thousands) |
|
|
|
|
Automotive |
|
$ |
292,299 |
|
|
$ |
180,160 |
|
|
|
62.2 |
% |
Home and renters |
|
|
30,938 |
|
|
|
26,573 |
|
|
|
16.4 |
% |
Other |
|
|
24 |
|
|
|
1,472 |
|
|
|
-98.4 |
% |
Total revenue |
|
$ |
323,261 |
|
|
$ |
208,205 |
|
|
|
55.3 |
% |
Other financial and non-financial metrics:
|
|
|
|
|
|
|
|
|
|
|
|
|
|
|
Three Months Ended June 30, |
|
|
Change |
|
|
|
2025 |
|
|
2024 |
|
|
% |
|
|
|
(in thousands) |
|
|
|
|
Income from operations |
|
$ |
14,168 |
|
|
$ |
6,292 |
|
|
|
125.2 |
% |
Net income |
|
$ |
14,701 |
|
|
$ |
6,402 |
|
|
|
129.6 |
% |
Variable marketing dollars |
|
$ |
45,520 |
|
|
$ |
36,455 |
|
|
|
24.9 |
% |
Adjusted EBITDA(1) |
|
$ |
21,956 |
|
|
$ |
12,928 |
|
|
|
69.8 |
% |
|
|
|
|
|
|
|
|
|
|
|
|
|
|
|
Six Months Ended June 30, |
|
|
Change |
|
|
|
2025 |
|
|
2024 |
|
|
% |
|
|
|
(in thousands) |
|
|
|
|
Income from operations |
|
$ |
22,165 |
|
|
$ |
8,058 |
|
|
|
175.1 |
% |
Net income |
|
$ |
22,691 |
|
|
$ |
8,309 |
|
|
|
173.1 |
% |
Variable marketing dollars |
|
$ |
92,380 |
|
|
$ |
67,273 |
|
|
|
37.3 |
% |
Adjusted EBITDA(1) |
|
$ |
44,463 |
|
|
$ |
20,516 |
|
|
|
116.7 |
% |
(1) Adjusted EBITDA is a non-GAAP measure. Please see “EverQuote, Inc. Reconciliation of Non-GAAP Measures to GAAP” below for more information.
To supplement the Company’s financial statements presented in accordance with GAAP and to provide investors with additional information regarding EverQuote’s financial results, the Company has presented Adjusted EBITDA as a non-GAAP financial measure. This non-GAAP financial measure is not based on any standardized methodology prescribed by GAAP and is not necessarily comparable to similarly titled measures presented by other companies.
The Company defines Adjusted EBITDA as net income (loss), excluding the impact of stock-based compensation expense; depreciation and amortization expense; legal settlement expense; interest income; and income taxes. The most directly comparable GAAP measure is net income (loss). The Company monitors and presents Adjusted EBITDA because it is a key measure used by management and the board of directors to understand and evaluate operating performance, to establish budgets and to develop operational goals for managing EverQuote’s business. In particular, the Company believes that excluding the impact of these items in calculating Adjusted EBITDA can provide a useful measure for period-to-period comparisons of EverQuote’s core operating performance.
The Company uses Adjusted EBITDA to evaluate EverQuote’s operating performance and trends and make planning decisions. The Company believes that this non-GAAP financial measure helps identify underlying trends in EverQuote’s business that could otherwise be masked by the effect of the items that the Company excludes in the calculations of Adjusted EBITDA. Accordingly, the Company believes that this financial measure provides useful information to investors and others in understanding and evaluating EverQuote’s operating results, enhancing the overall understanding of the Company’s past performance and future prospects.
The Company’s non-GAAP financial measures are not prepared in accordance with GAAP and should not be considered in isolation of, or as an alternative to, measures prepared in accordance with GAAP. There are a number of limitations related to the use of Adjusted EBITDA rather than net income (loss), which is the most directly comparable financial measure calculated and presented in accordance with GAAP. In addition, other companies may use other measures to evaluate their performance, which could reduce the usefulness of the Company’s non-GAAP financial measures as tools for comparison.
The following table reconciles Adjusted EBITDA to net income (loss), the most directly comparable financial measure calculated and presented in accordance with GAAP.
EVERQUOTE, INC.
RECONCILIATION OF NON-GAAP MEASURES TO GAAP
|
|
|
|
|
|
|
|
|
|
|
|
|
|
|
|
|
|
|
Three Months Ended June 30, |
|
|
Six Months Ended June 30, |
|
|
|
2025 |
|
|
2024 |
|
|
2025 |
|
|
2024 |
|
|
|
(in thousands) |
|
Net income |
|
$ |
14,701 |
|
|
$ |
6,402 |
|
|
$ |
22,691 |
|
|
$ |
8,309 |
|
Stock-based compensation |
|
|
6,560 |
|
|
|
5,340 |
|
|
|
11,980 |
|
|
|
9,858 |
|
Depreciation and amortization |
|
|
918 |
|
|
|
1,236 |
|
|
|
2,139 |
|
|
|
2,499 |
|
Legal settlement |
|
|
332 |
|
|
|
— |
|
|
|
8,232 |
|
|
|
— |
|
Interest income |
|
|
(918 |
) |
|
|
(456 |
) |
|
|
(1,626 |
) |
|
|
(842 |
) |
Income tax expense |
|
|
363 |
|
|
|
406 |
|
|
|
1,047 |
|
|
|
692 |
|
Adjusted EBITDA |
|
$ |
21,956 |
|
|
$ |
12,928 |
|
|
$ |
44,463 |
|
|
$ |
20,516 |
|

Investor Presentation�August 2025 Exhibit 99.2
Disclaimer This presentation contains forward-looking statements, within the meaning of Section 27A of the Securities Act of 1933, as amended, and Section 21E of the Securities Exchange Act of 1934, as amended. All statements other than statements of historical fact contained in this presentation, including statements regarding our future results of operations and financial position, business strategy and plans, and objectives of management for future operations, are forward-looking statements. These statements involve known and unknown risks, uncertainties, and other important factors that may cause our actual results, performance or achievements to be materially different from any future results, performance, or achievements expressed or implied by the forward-looking statements. In some cases, you can identify forward-looking statements by terms such as “may,” “should,” “expects,” “might,” “plans,” “anticipates,” “could,” “intends,” “target,” “projects,” “contemplates,” “believes,” “estimates,” “predicts,” “potential,” “seek,” “would” or “continue,” or the negative of these terms or other similar expressions. The forward-looking statements in this presentation are only predictions. We have based these forward-looking statements largely on our current expectations and projections about future events and financial trends that we believe may affect our business, financial condition liquidity and results of operations. Although we believe that the expectations reflected in the forward-looking statements are reasonable, we cannot guarantee that the future results, levels of activity, performance or events and circumstances reflected in the forward-looking statements will be achieved or occur. These forward-looking statements speak only as of the date of this presentation and are subject to a number of risks, uncertainties and assumptions described in our annual report on Form 10-K, our quarterly reports on Form 10-Q and our current reports on Form 8-K as filed with the Securities and Exchange Commission (“SEC”) from time to time. Additional information will also be set forth in the Company’s annual report on Form 10-Q for the fiscal quarter ended June 30, 2025, which will be filed with the SEC. Because forward-looking statements are inherently subject to risks and uncertainties, some of which cannot be predicted or quantified, you should not rely on these forward-looking statements as predictions of future events. The events and circumstances reflected in our forward-looking statements may not be achieved or occur and actual results could differ materially from those projected in the forward-looking statements. While we may elect to update these forward-looking statements at some point in the future, whether as a result of any new information, future events, or otherwise, we have no current intention of doing so except to the extent required by applicable law. Some of the key factors that could cause actual results to differ include: (1) our dependence on revenue from the property and casualty insurance industries, and specifically automotive insurance, and exposure to risks related to those industries; (2) our dependence on our relationships with insurance providers with no long-term minimum financial commitments; (3) our reliance on a small number of insurance providers for a significant portion of our revenue; (4) our dependence on third-party media sources for a significant portion of visitors to our websites and marketplace; (5) our ability to attract consumers searching for insurance to our websites and marketplace through Internet search engines, display advertising, social media, content-based online advertising and other online sources; (6) any limitations restricting our ability to market to users or collect and use data derived from user activities; (7) risks related to cybersecurity incidents or other network disruptions; (8) risks related to the use of artificial intelligence; (9) our ability to develop new and enhanced products and services to attract and retain consumers and insurance providers, and to successfully monetize them; (10) the impact of competition in our industry and innovation by our competitors; (11) our ability to hire and retain necessary qualified employees to expand our operations; (12) our ability to stay abreast of and comply with new or modified laws and regulations that currently apply or become applicable to our business, including with respect to the insurance industry, telemarketing restrictions and data privacy requirements; (13) our ability to protect our intellectual property rights and maintain and build our brand; (14) our future financial performance, including our expectations regarding our revenue, cost of revenue, variable marketing dollars, operating expenses, cash flows and ability to achieve, and maintain, future profitability; (15) our ability to properly collect, process, store, share, disclose and use consumer information and other data; (16) any impacts of economic or legislative developments, including inflation, potential tariffs and the One Big Beautiful Bill Act; and (17) the future trading prices of our Class A common stock, including any impacts resulting from our share repurchase program. The Company’s presentation also contains estimates, projections, & other information concerning the Company’s industry, the Company’s business & the markets for certain of the Company’s products & services, including data regarding the estimated size of those markets. The information concerning our industry contained in this presentation is based on our general knowledge of and expectations concerning the industry. The Company’s market position, market share and industry market size are based on estimates using our internal data and estimates, data from various industry analyses, our internal research and adjustments and assumptions that we believe to be reasonable. Information that is based on estimates, forecasts, projections, market research, or similar methodologies is inherently subject to uncertainties & actual events or circumstances may differ materially from events & circumstances reflected in this information. Unless otherwise expressly stated, the Company obtained this industry, business, market & other data from reports, research surveys, studies & similar data prepared by market research firms & other third parties, from industry, general publications, & from government data & similar sources. We have not independently verified data from these sources and cannot guarantee their accuracy or completeness. The Company presents Adjusted EBITDA as a non-GAAP measure, which is not a substitute for or superior to, other measures of financial performance prepared in accordance with U.S. GAAP. A reconciliation to the most directly comparable GAAP measures is included in the Appendix to these slides.

Our vision:��To be the leading growth partner for �P&C insurance providers
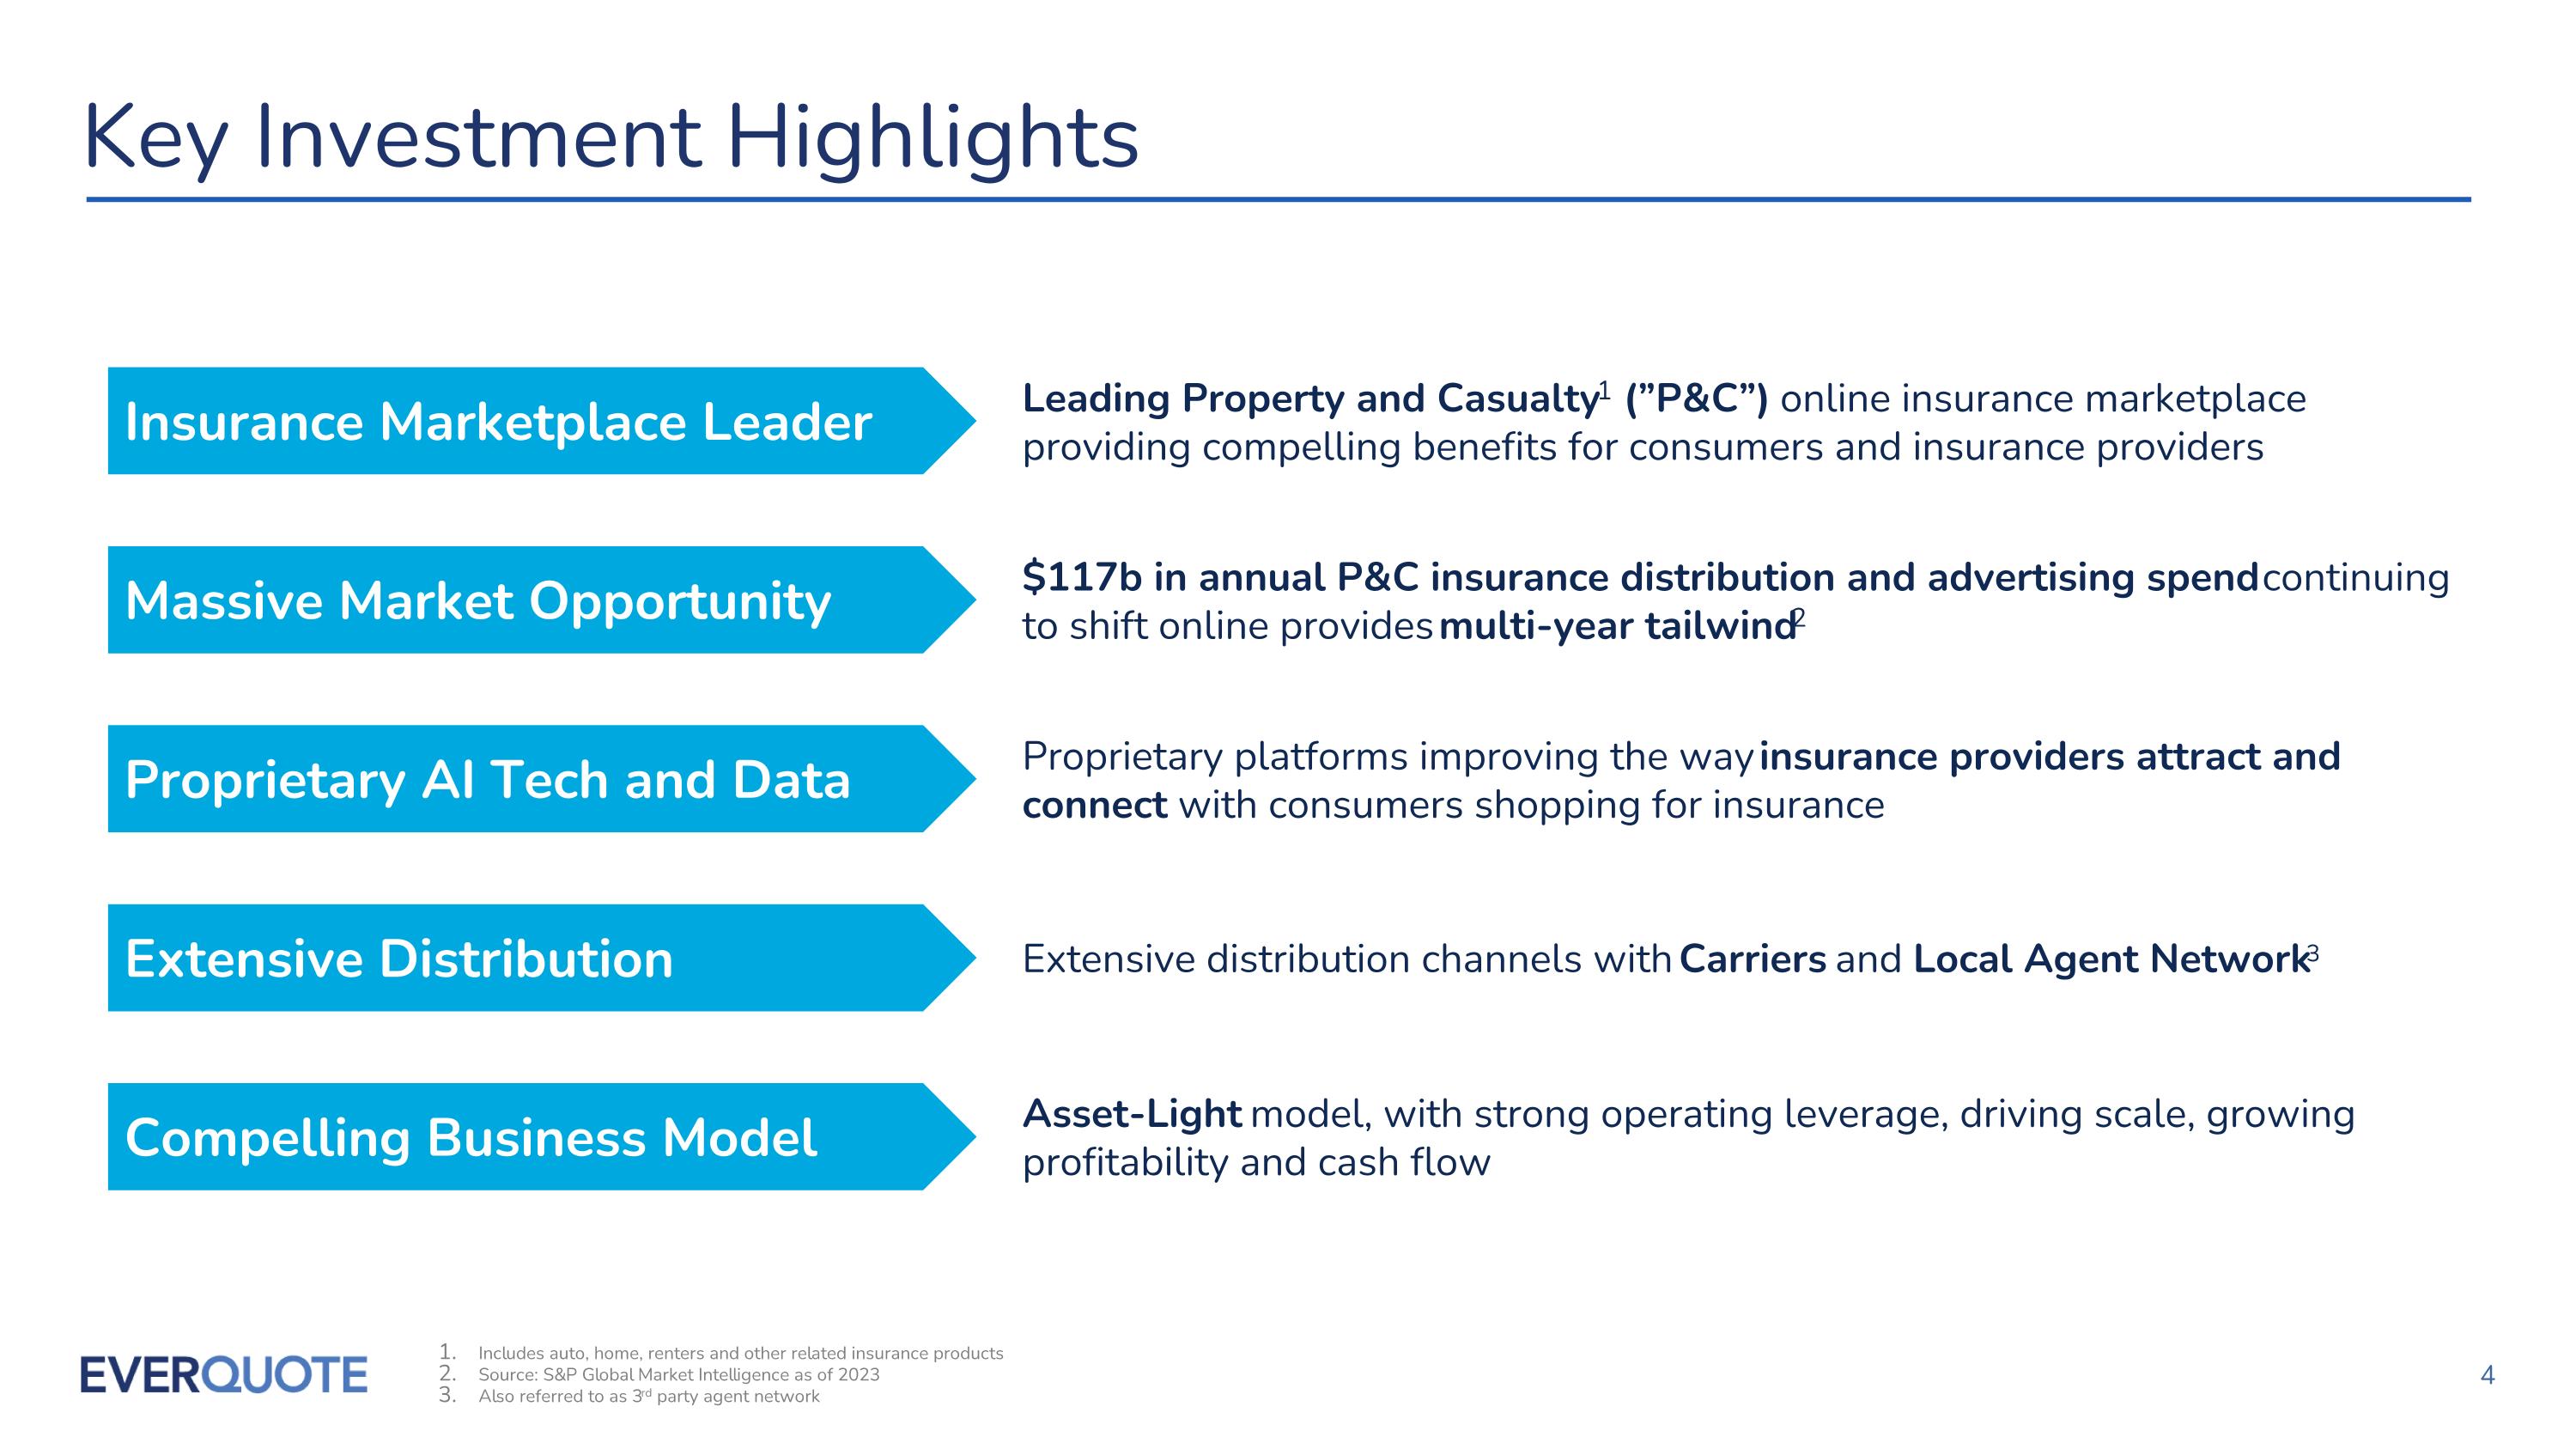
Extensive distribution channels with Carriers and Local Agent Network3 Asset-Light model, with strong operating leverage, driving scale, growing profitability and cash flow Key Investment Highlights Insurance Marketplace Leader Massive Market Opportunity Proprietary AI Tech and Data Extensive Distribution Compelling Business Model Leading Property and Casualty1 (”P&C”) online insurance marketplace providing compelling benefits for consumers and insurance providers $117b in annual P&C insurance distribution and advertising spend continuing to shift online provides multi-year tailwind2 Proprietary platforms improving the way insurance providers attract and connect with consumers shopping for insurance Includes auto, home, renters and other related insurance products Source: S&P Global Market Intelligence as of 2023 Also referred to as 3rd party agent network
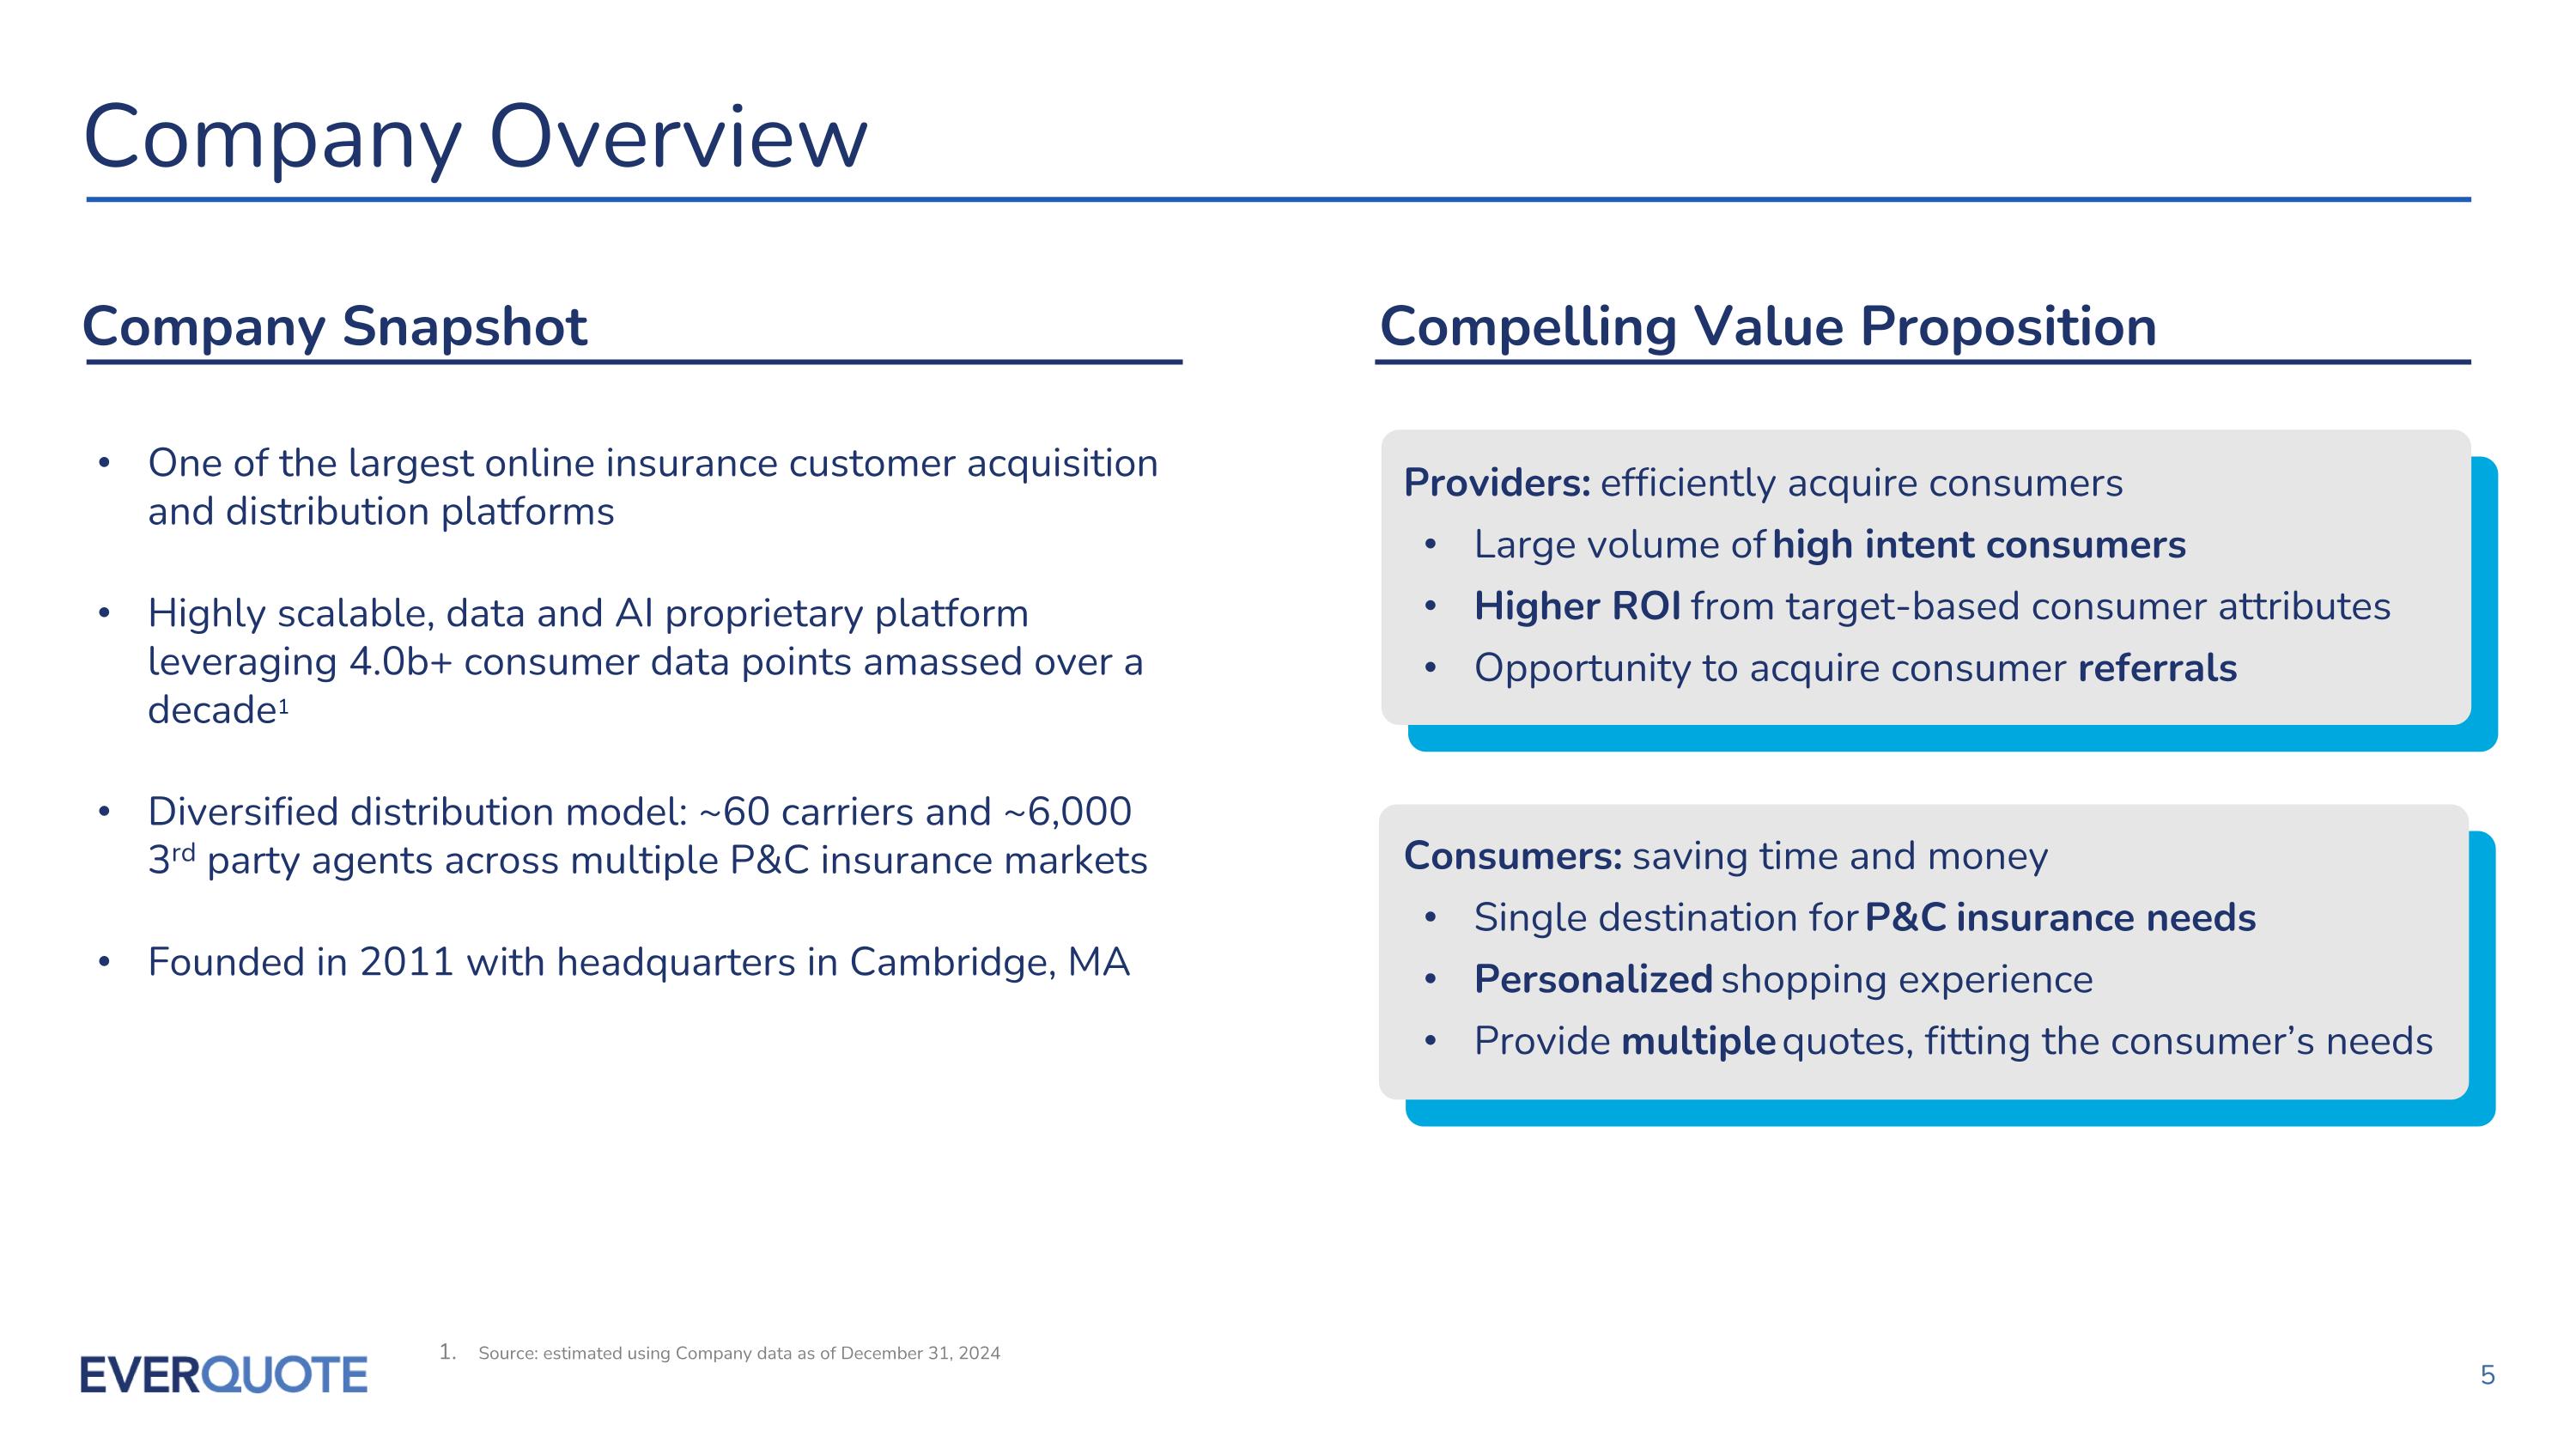
Company Overview One of the largest online insurance customer acquisition and distribution platforms Highly scalable, data and AI proprietary platform leveraging 4.0b+ consumer data points amassed over a decade1 Diversified distribution model: ~60 carriers and ~6,000 3rd party agents across multiple P&C insurance markets Founded in 2011 with headquarters in Cambridge, MA Company Snapshot Compelling Value Proposition Providers: efficiently acquire consumers Large volume of high intent consumers Higher ROI from target-based consumer attributes Opportunity to acquire consumer referrals Source: estimated using Company data as of December 31, 2024 Consumers: saving time and money Single destination for P&C insurance needs Personalized shopping experience Provide multiple quotes, fitting the consumer’s needs
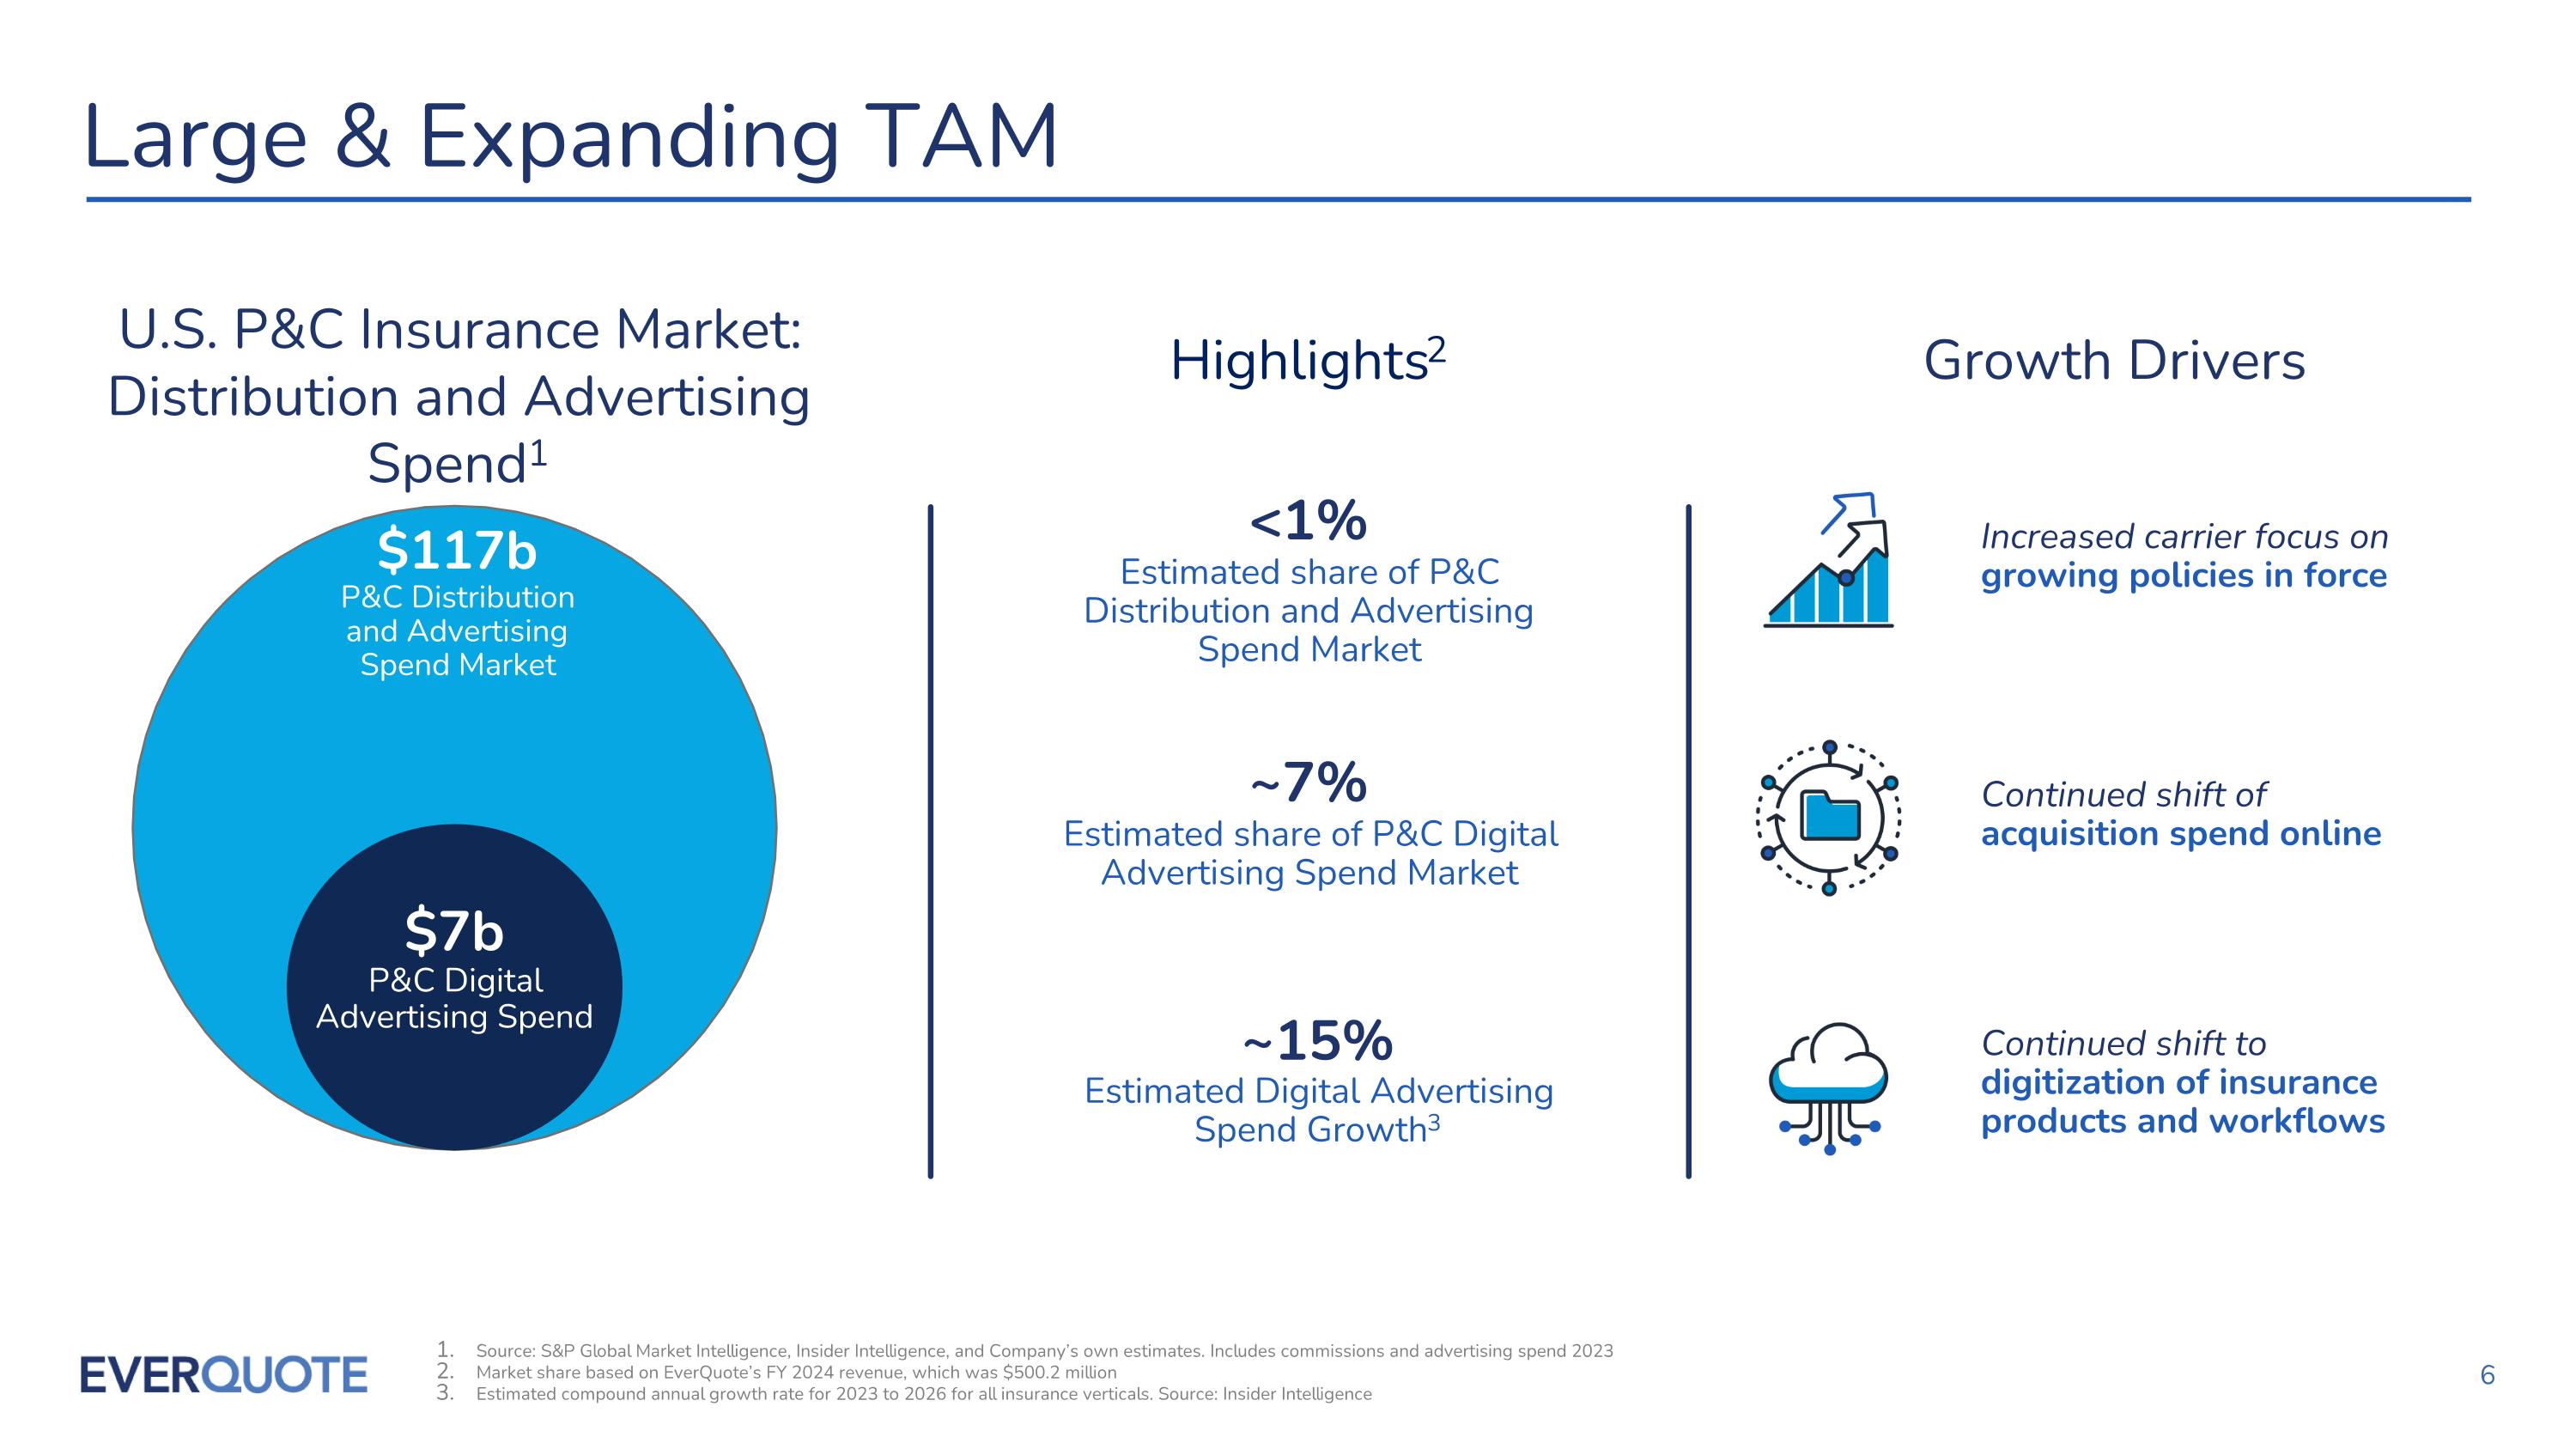
Large & Expanding TAM Growth Drivers U.S. P&C Insurance Market: Distribution and Advertising Spend1 ~15% Estimated Digital Advertising Spend Growth3 Increased carrier focus on growing policies in force Continued shift of acquisition spend online Continued shift to digitization of insurance products and workflows Estimated share of P&C Digital Advertising Spend Market ~7% Estimated share of P&C Distribution and Advertising Spend Market <1% Source: S&P Global Market Intelligence, Insider Intelligence, and Company’s own estimates. Includes commissions and advertising spend 2023 Market share based on EverQuote’s FY 2024 revenue, which was $500.2 million Estimated compound annual growth rate for 2023 to 2026 for all insurance verticals. Source: Insider Intelligence Highlights2 $7b P&C Digital Advertising Spend $117b P&C Distribution and Advertising Spend Market
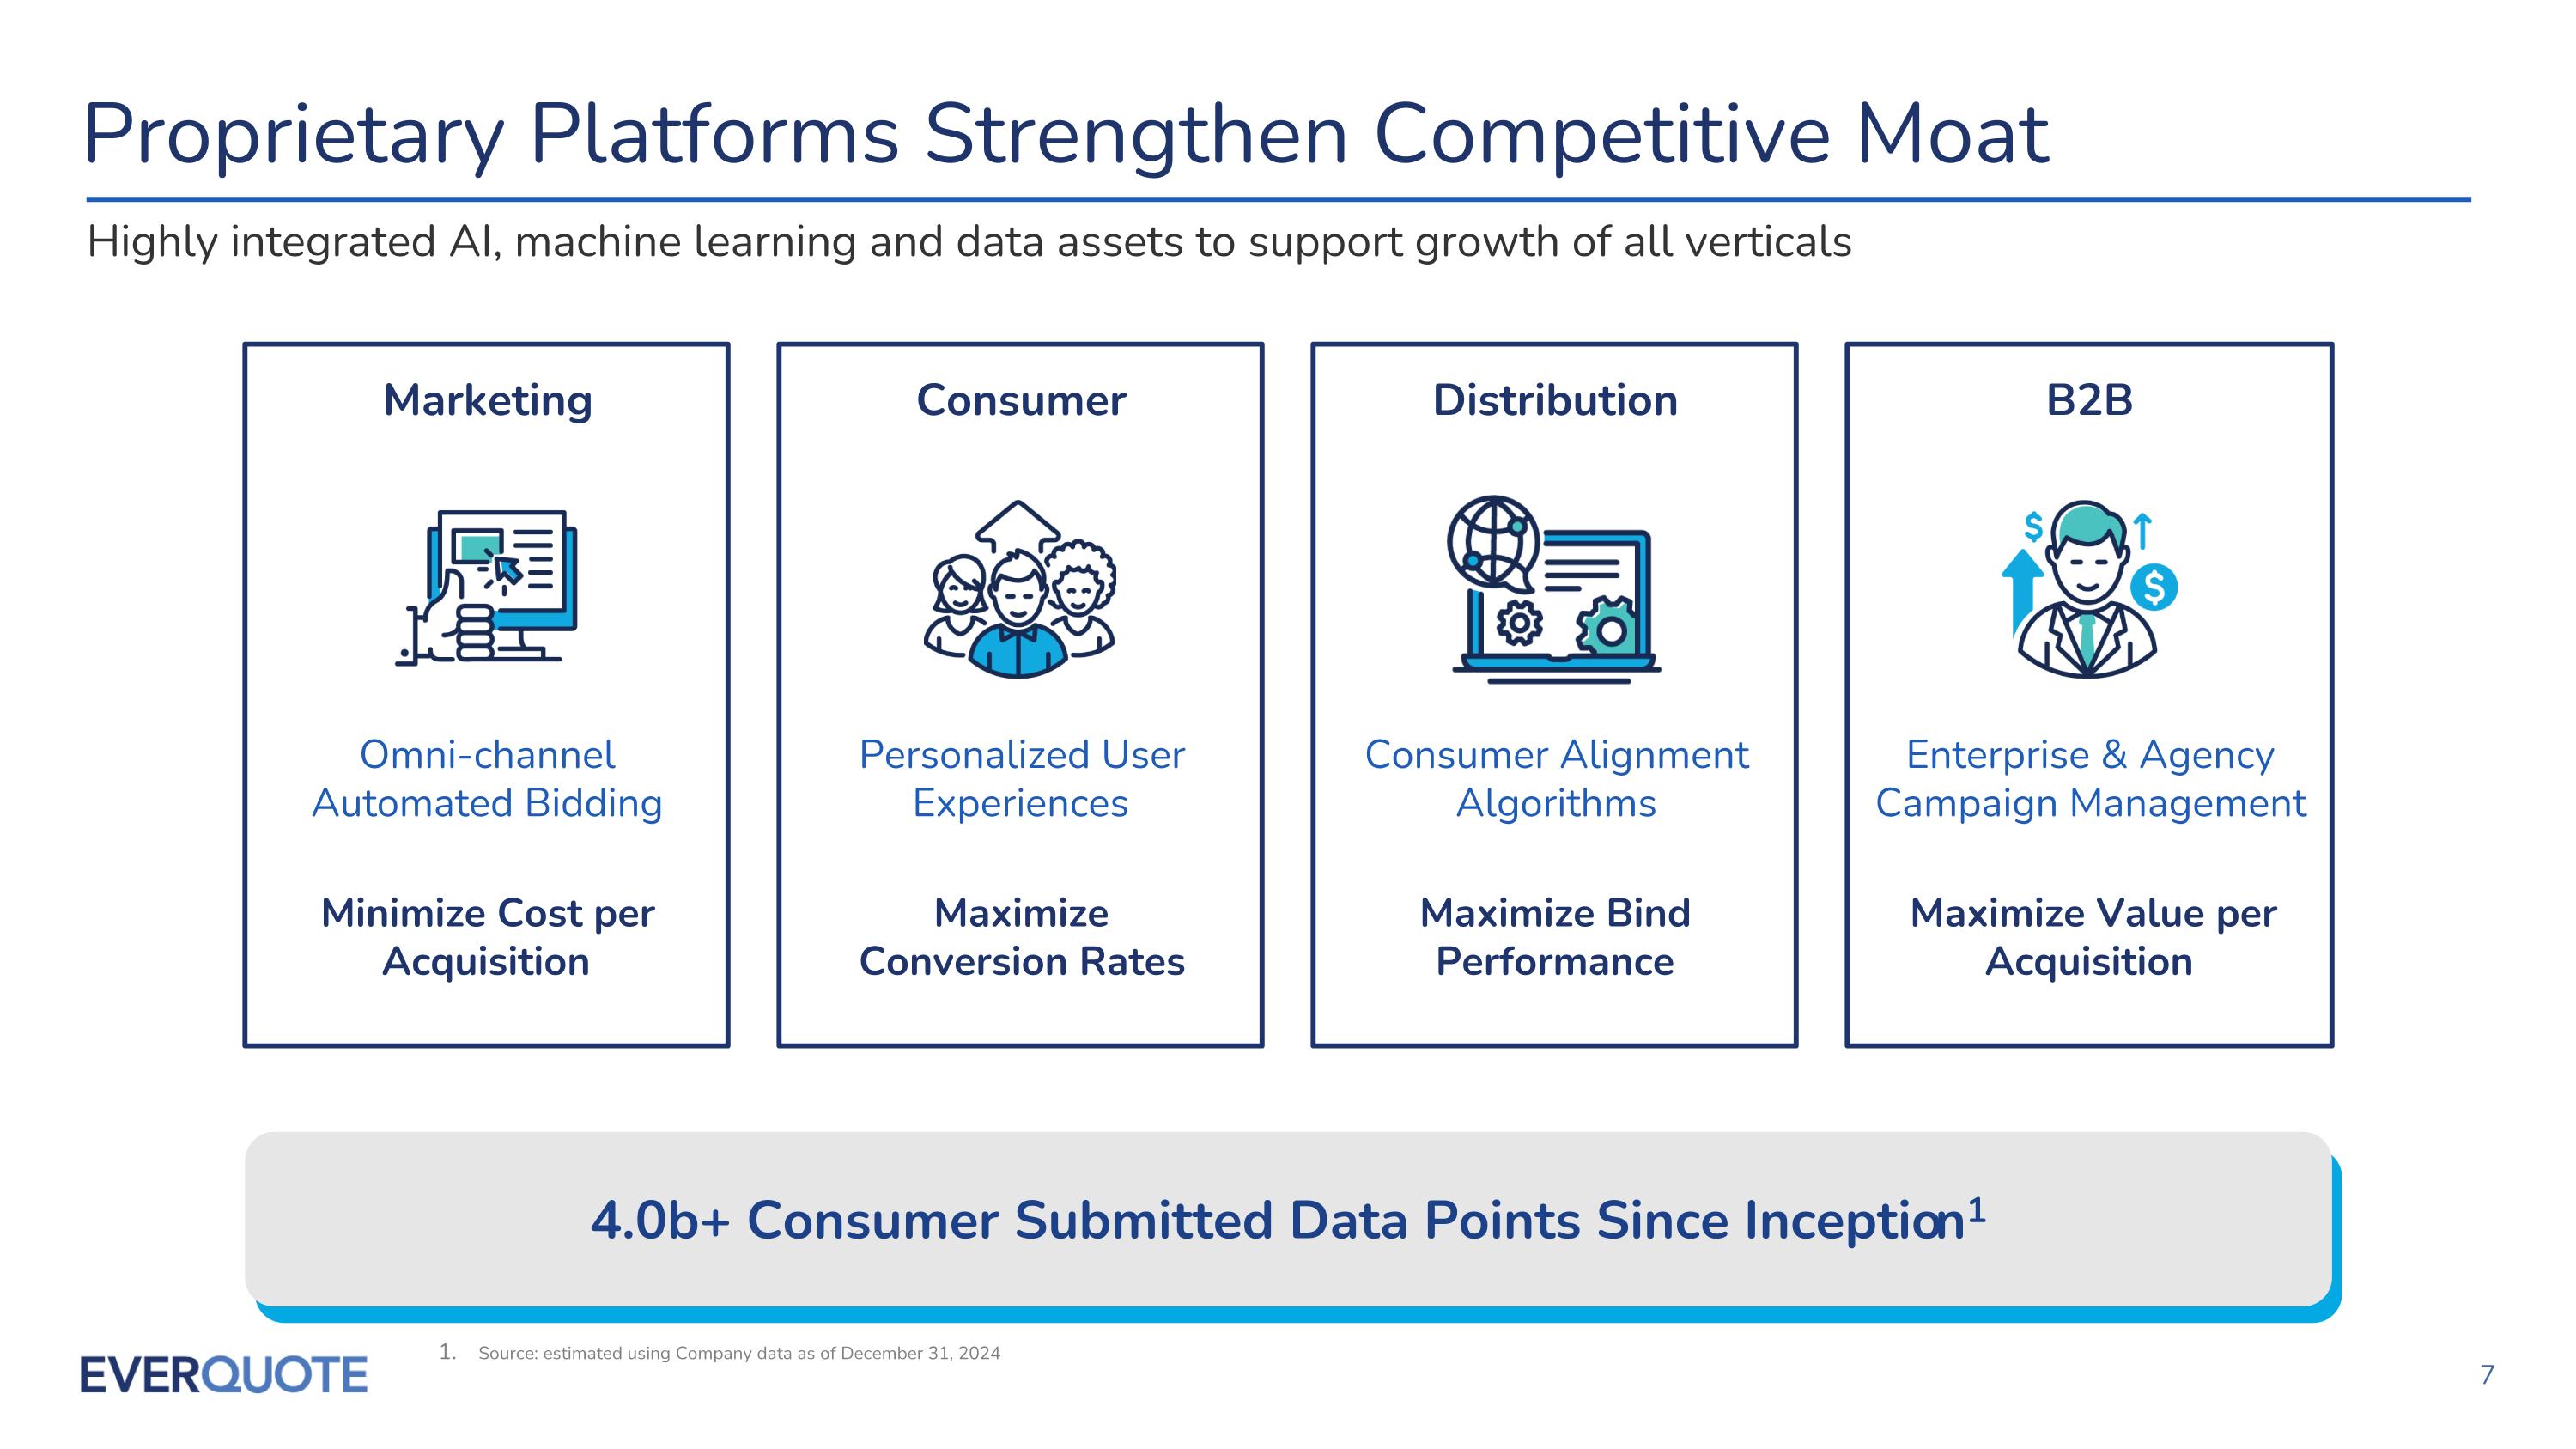
Proprietary Platforms Strengthen Competitive Moat Minimize Cost per Acquisition Omni-channel Automated Bidding Marketing Maximize Conversion Rates Consumer Personalized User Experiences Maximize Bind Performance Consumer Alignment Algorithms Distribution Maximize Value per Acquisition Enterprise & Agency Campaign Management B2B Highly integrated AI, machine learning and data assets to support growth of all verticals Source: estimated using Company data as of December 31, 2024 4.0b+ Consumer Submitted Data Points Since Inception1
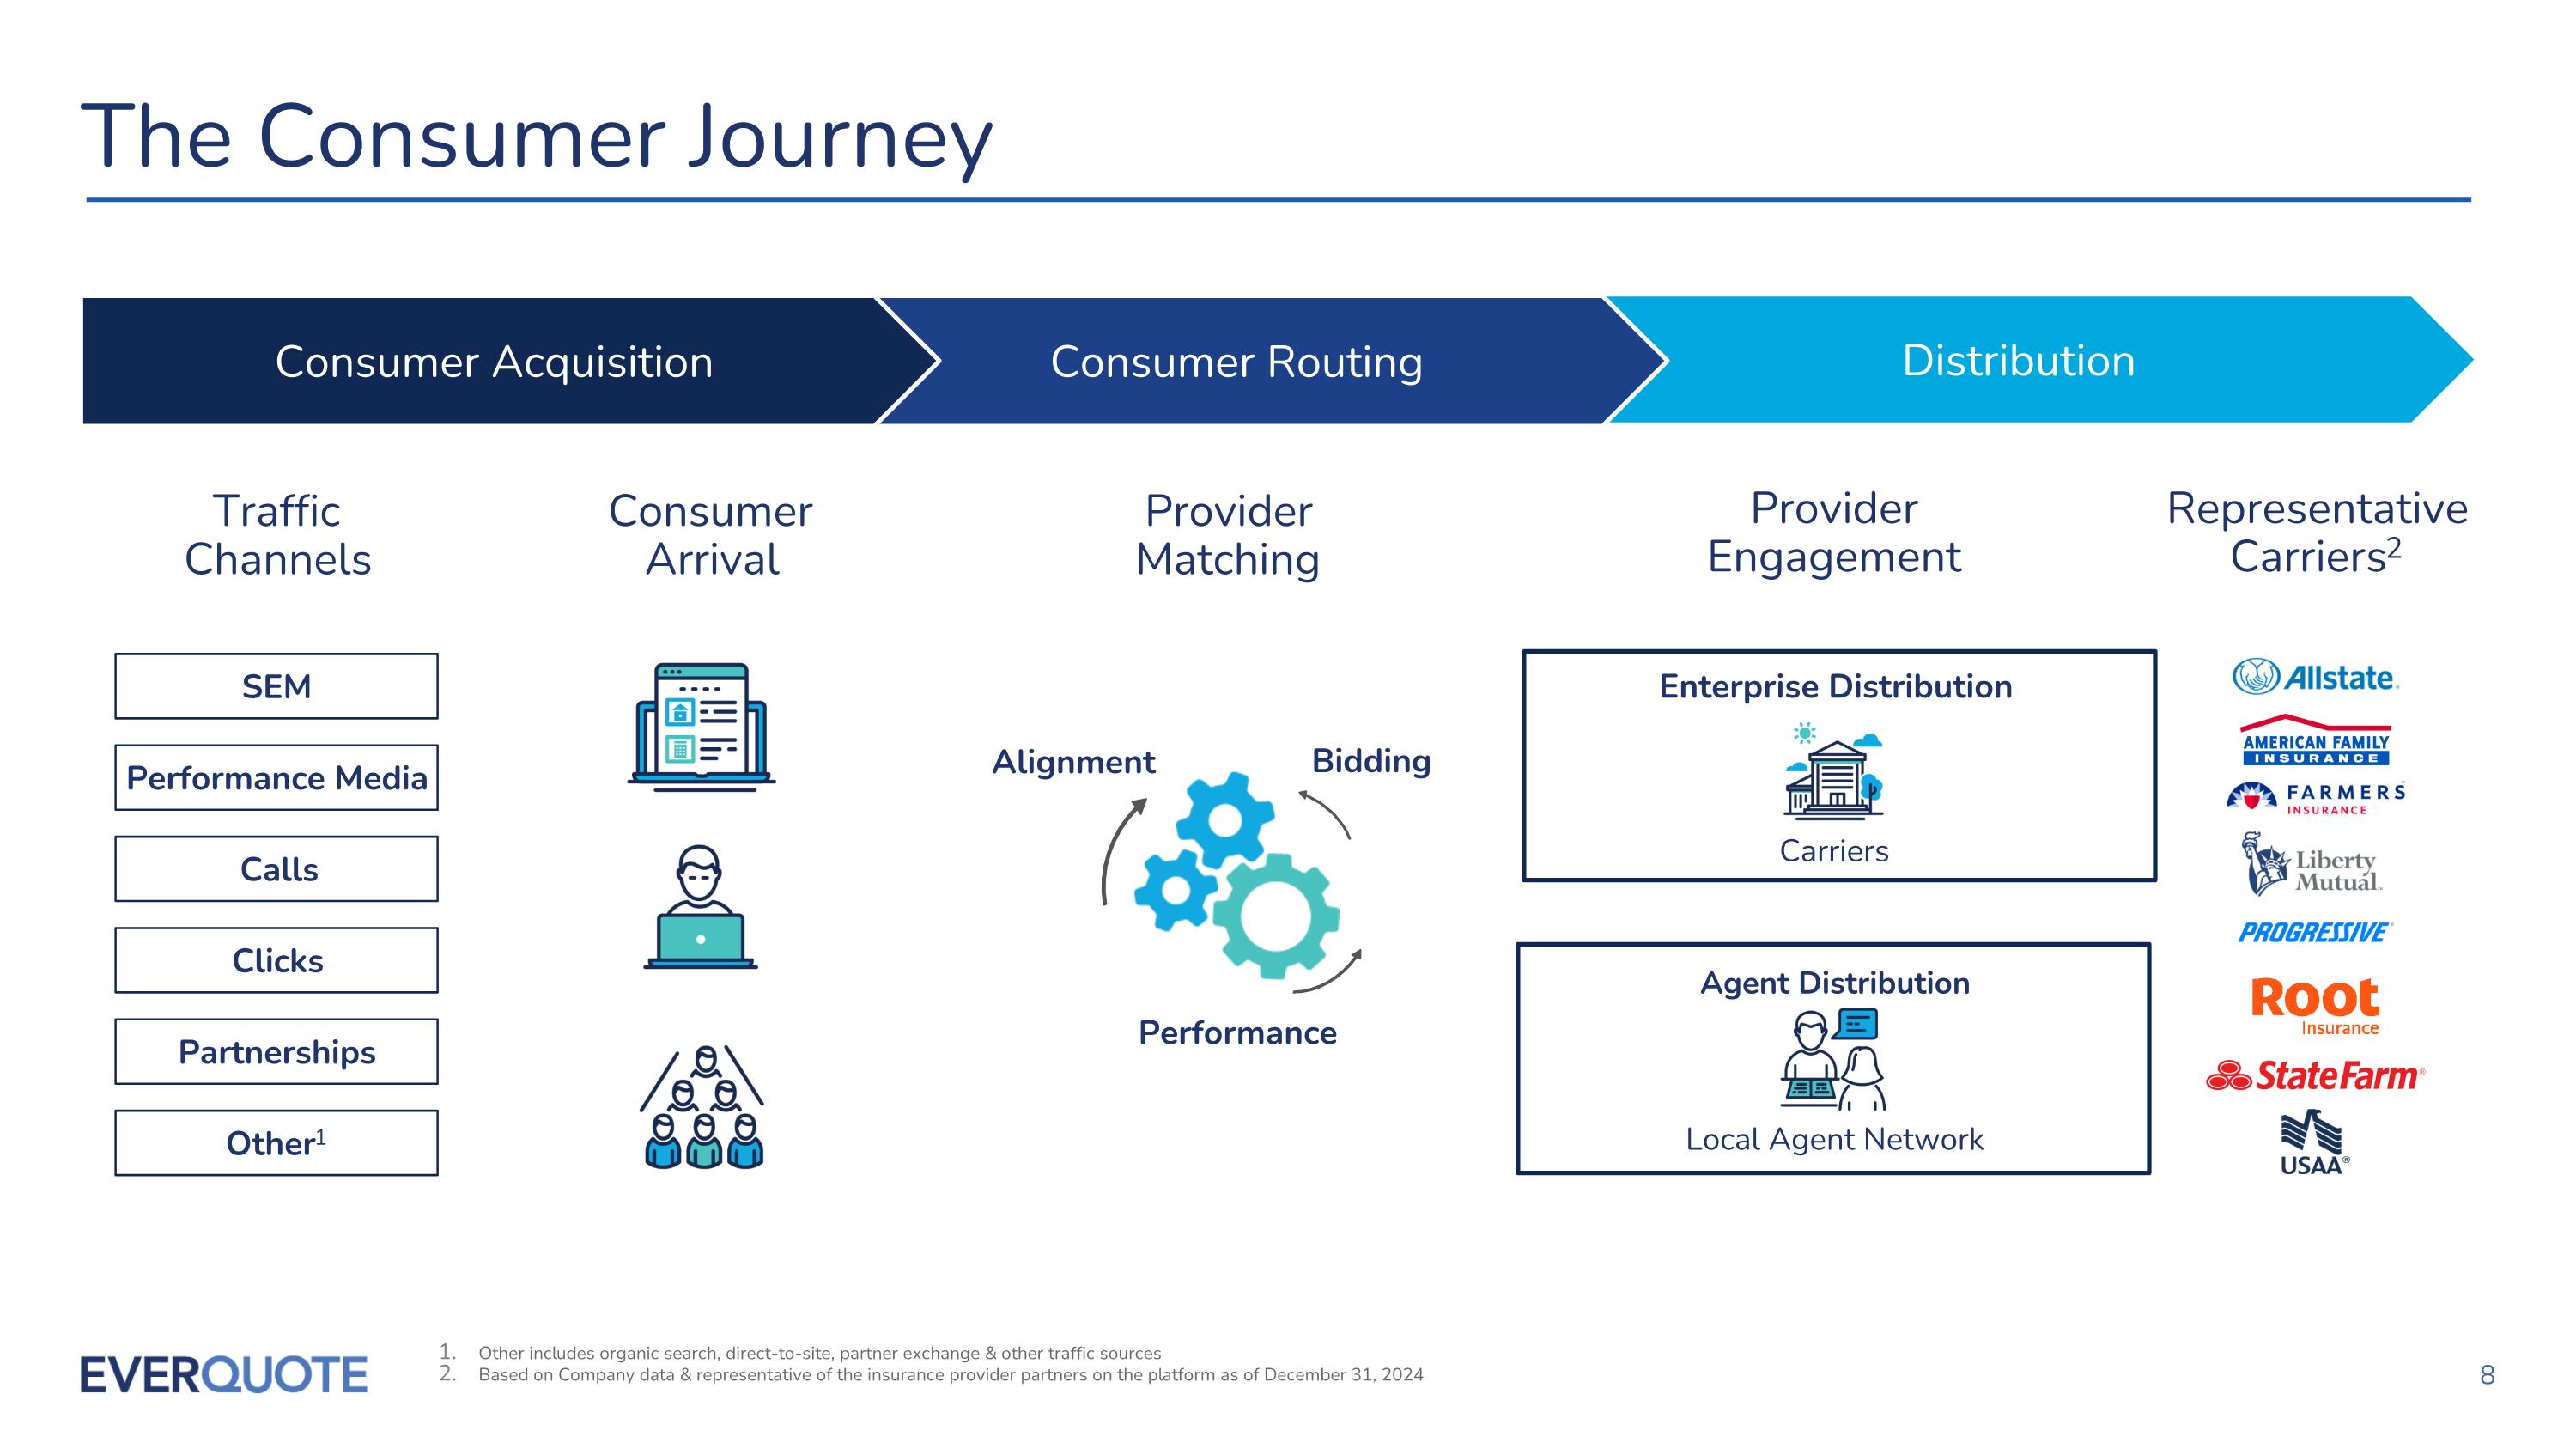
Distribution The Consumer Journey Traffic Channels Provider Engagement Consumer Arrival Provider Matching Partnerships Performance Media Other1 SEM Clicks Calls Consumer Routing Consumer Acquisition Performance Alignment Bidding Carriers Enterprise Distribution Agent Distribution Local Agent Network Other includes organic search, direct-to-site, partner exchange & other traffic sources Based on Company data & representative of the insurance provider partners on the platform as of December 31, 2024 Representative Carriers2
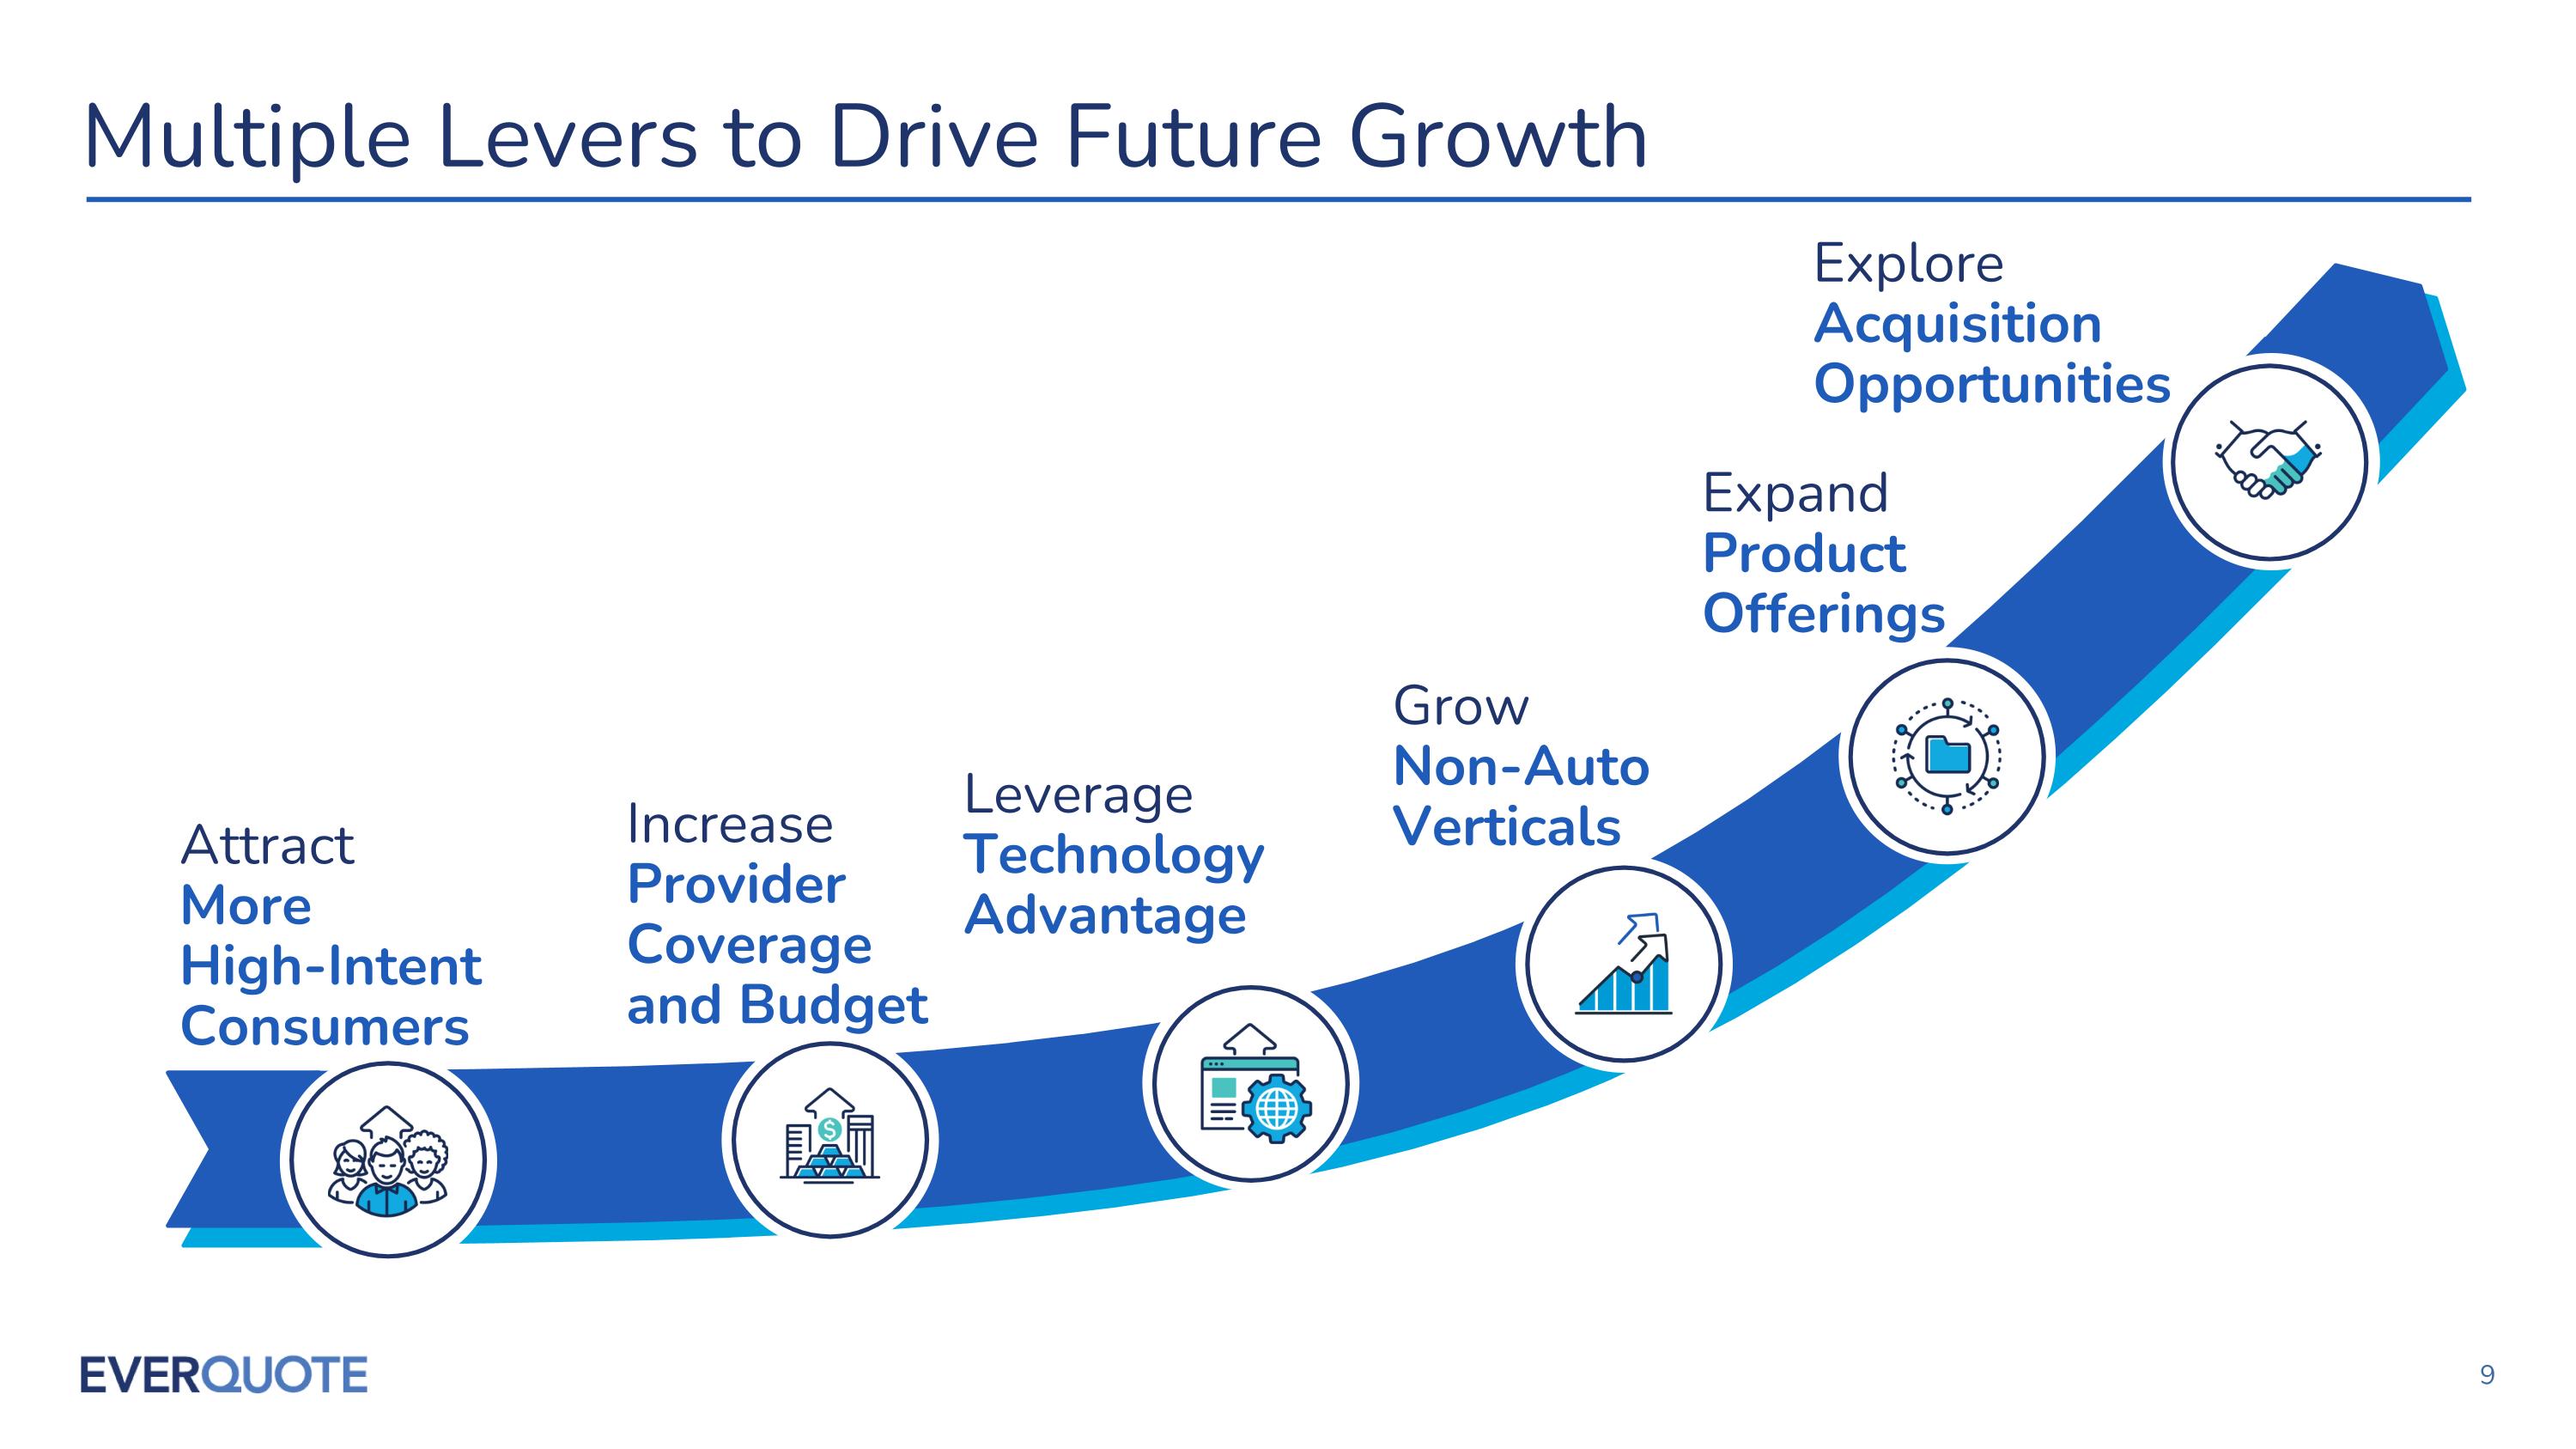
Multiple Levers to Drive Future Growth Attract �More High-Intent Consumers Explore Acquisition Opportunities Increase�Provider Coverage �and Budget Grow�Non-Auto Verticals Expand Product Offerings Leverage�Technology Advantage

Financial Highlights
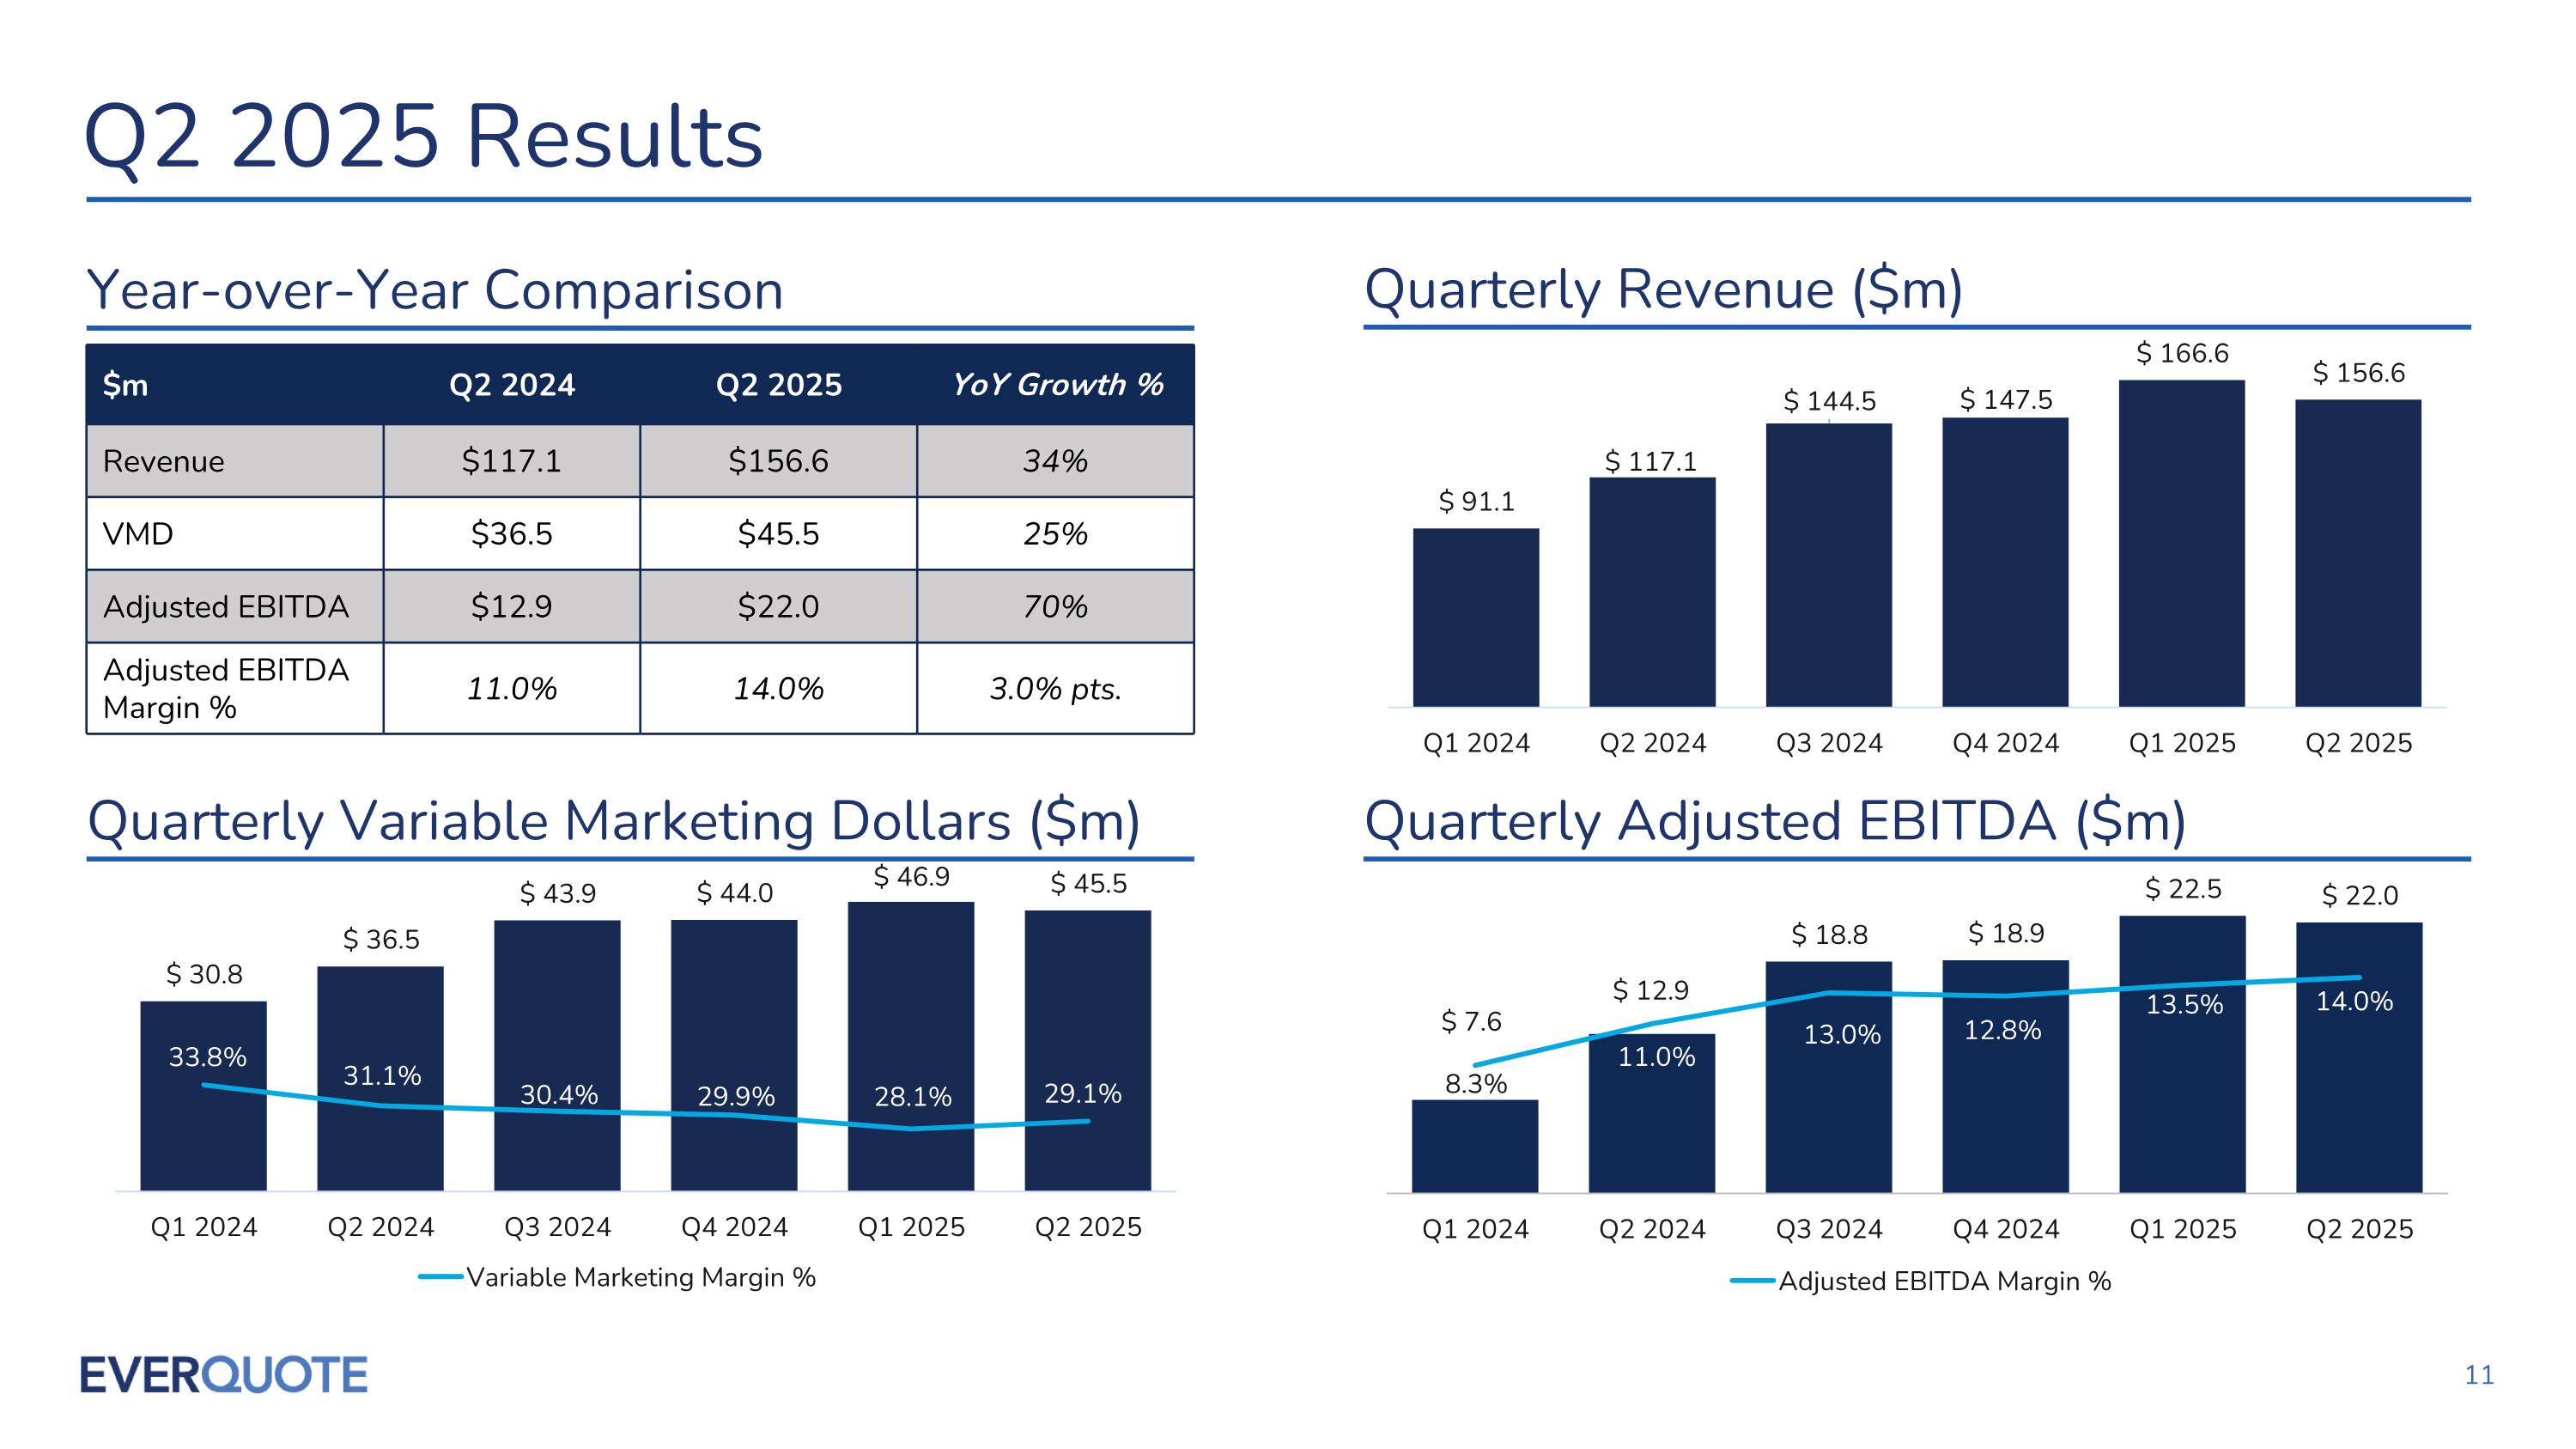
Q2 2025 Results Quarterly Revenue ($m) Year-over-Year Comparison Quarterly Adjusted EBITDA ($m) Quarterly Variable Marketing Dollars ($m) $m Q2 2024 Q2 2025 YoY Growth % Revenue $117.1 $156.6 34% VMD $36.5 $45.5 25% Adjusted EBITDA $12.9 $22.0 70% Adjusted EBITDA Margin % 11.0% 14.0% 3.0% pts.
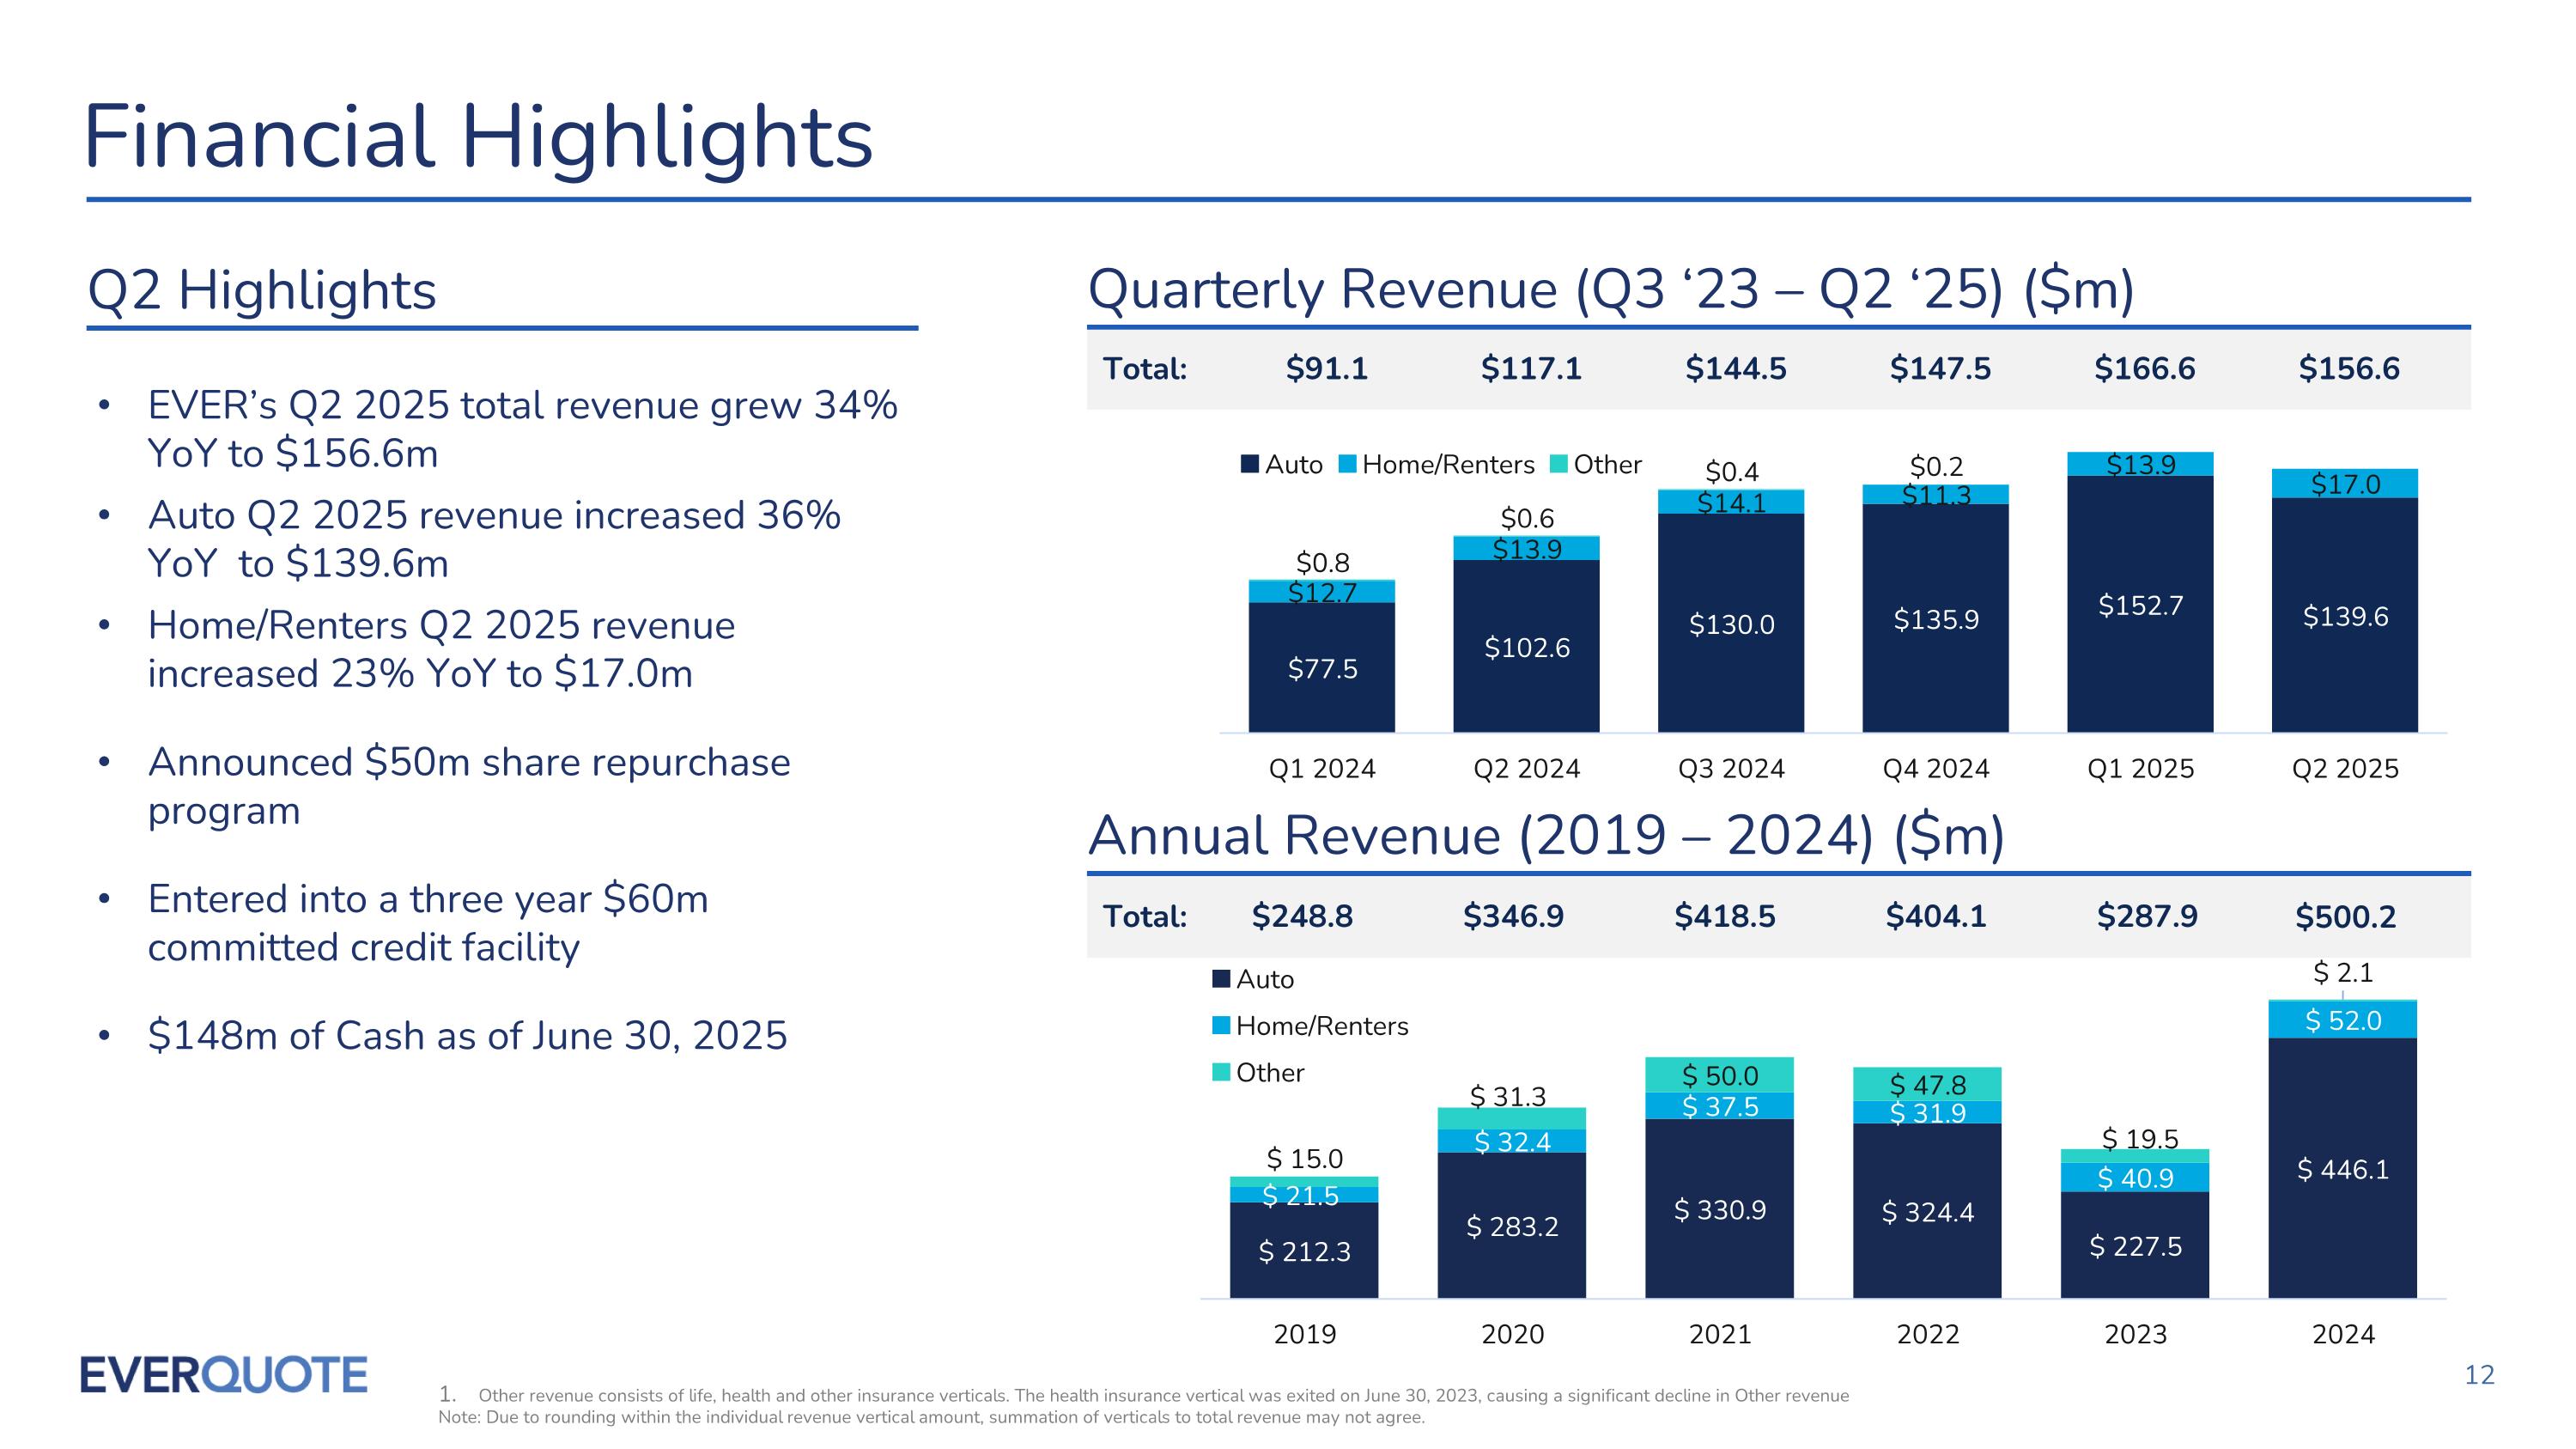
Financial Highlights Quarterly Revenue (Q3 ‘23 – Q2 ‘25) ($m) Q2 Highlights EVER’s Q2 2025 total revenue grew 34% YoY to $156.6m Auto Q2 2025 revenue increased 36% YoY to $139.6m Home/Renters Q2 2025 revenue increased 23% YoY to $17.0m Announced $50m share repurchase program Entered into a three year $60m committed credit facility $148m of Cash as of June 30, 2025 $147.5 $144.5 $156.6 Total: Other revenue consists of life, health and other insurance verticals. The health insurance vertical was exited on June 30, 2023, causing a significant decline in Other revenue Note: Due to rounding within the individual revenue vertical amount, summation of verticals to total revenue may not agree. $500.2 $248.8 $346.9 $418.5 $404.1 Total: $287.9 Annual Revenue (2019 – 2024) ($m) $91.1 $117.1 $166.6
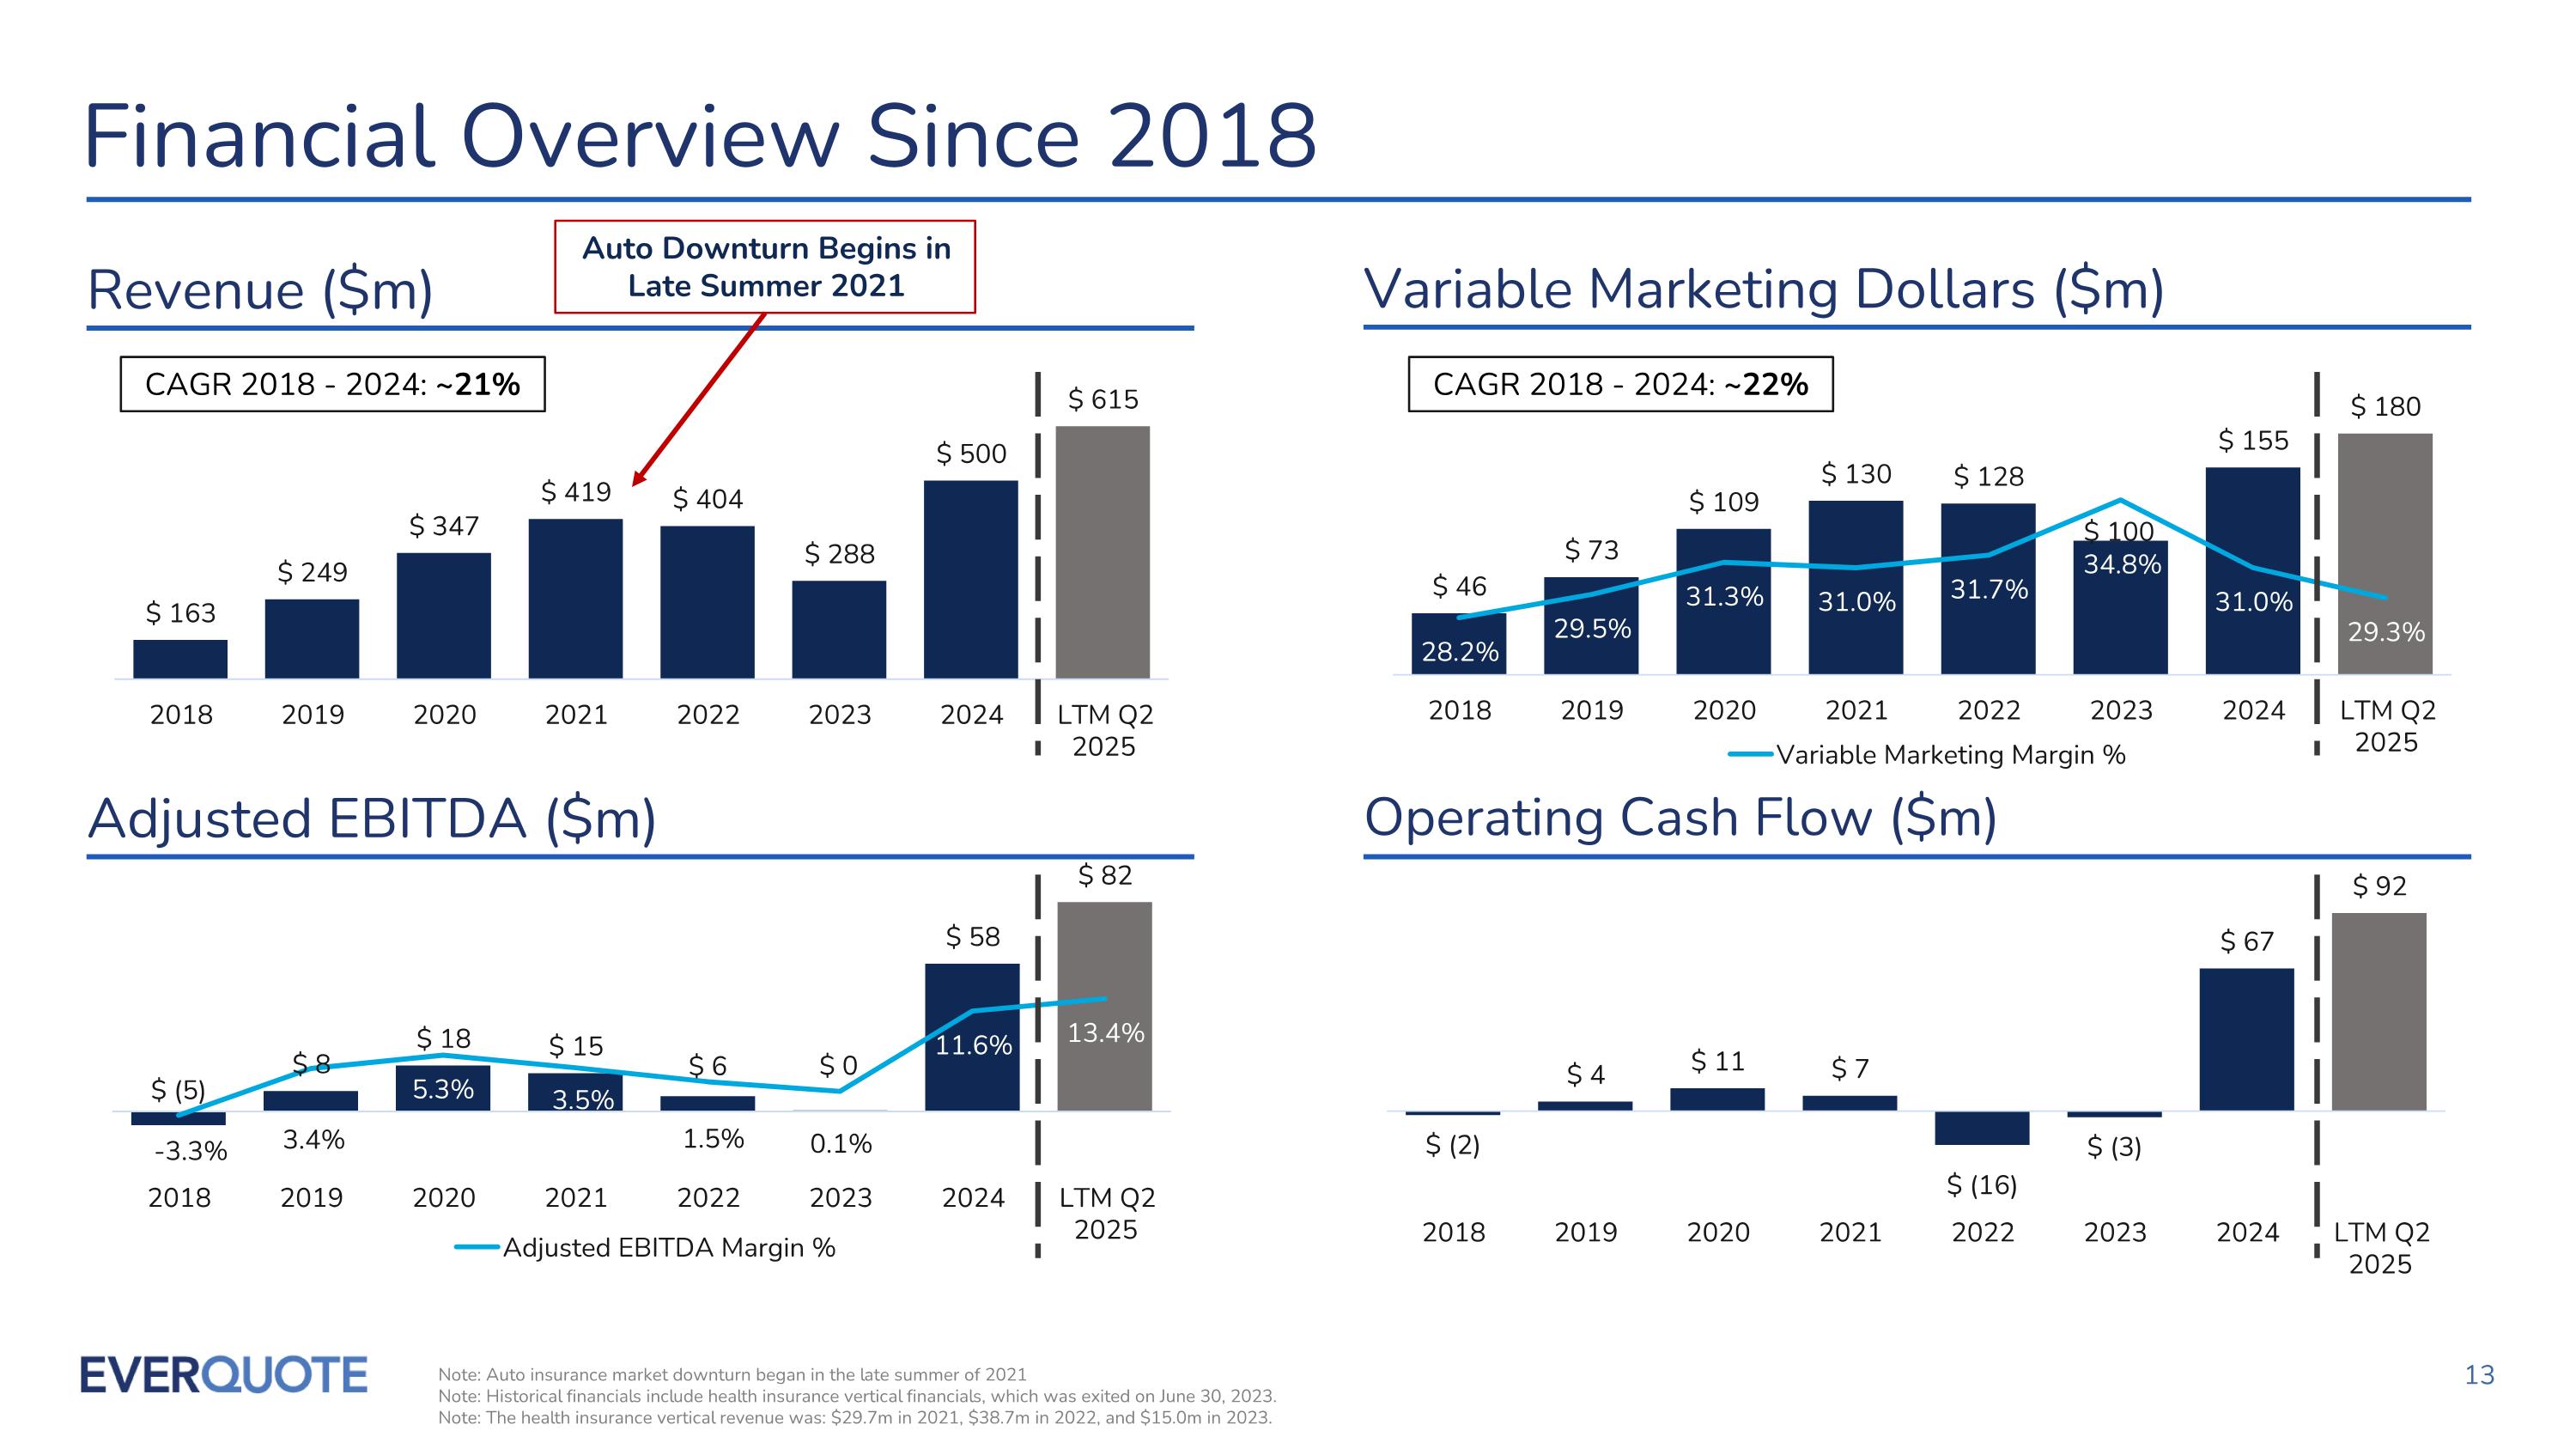
Financial Overview Since 2018 Variable Marketing Dollars ($m) Revenue ($m) Note: Auto insurance market downturn began in the late summer of 2021 Note: Historical financials include health insurance vertical financials, which was exited on June 30, 2023. Note: The health insurance vertical revenue was: $29.7m in 2021, $38.7m in 2022, and $15.0m in 2023. Operating Cash Flow ($m) Adjusted EBITDA ($m) Auto Downturn Begins in Late Summer 2021 CAGR 2018 - 2024: ~22% CAGR 2018 - 2024: ~21%

NASDAQ: EVER

Appendix
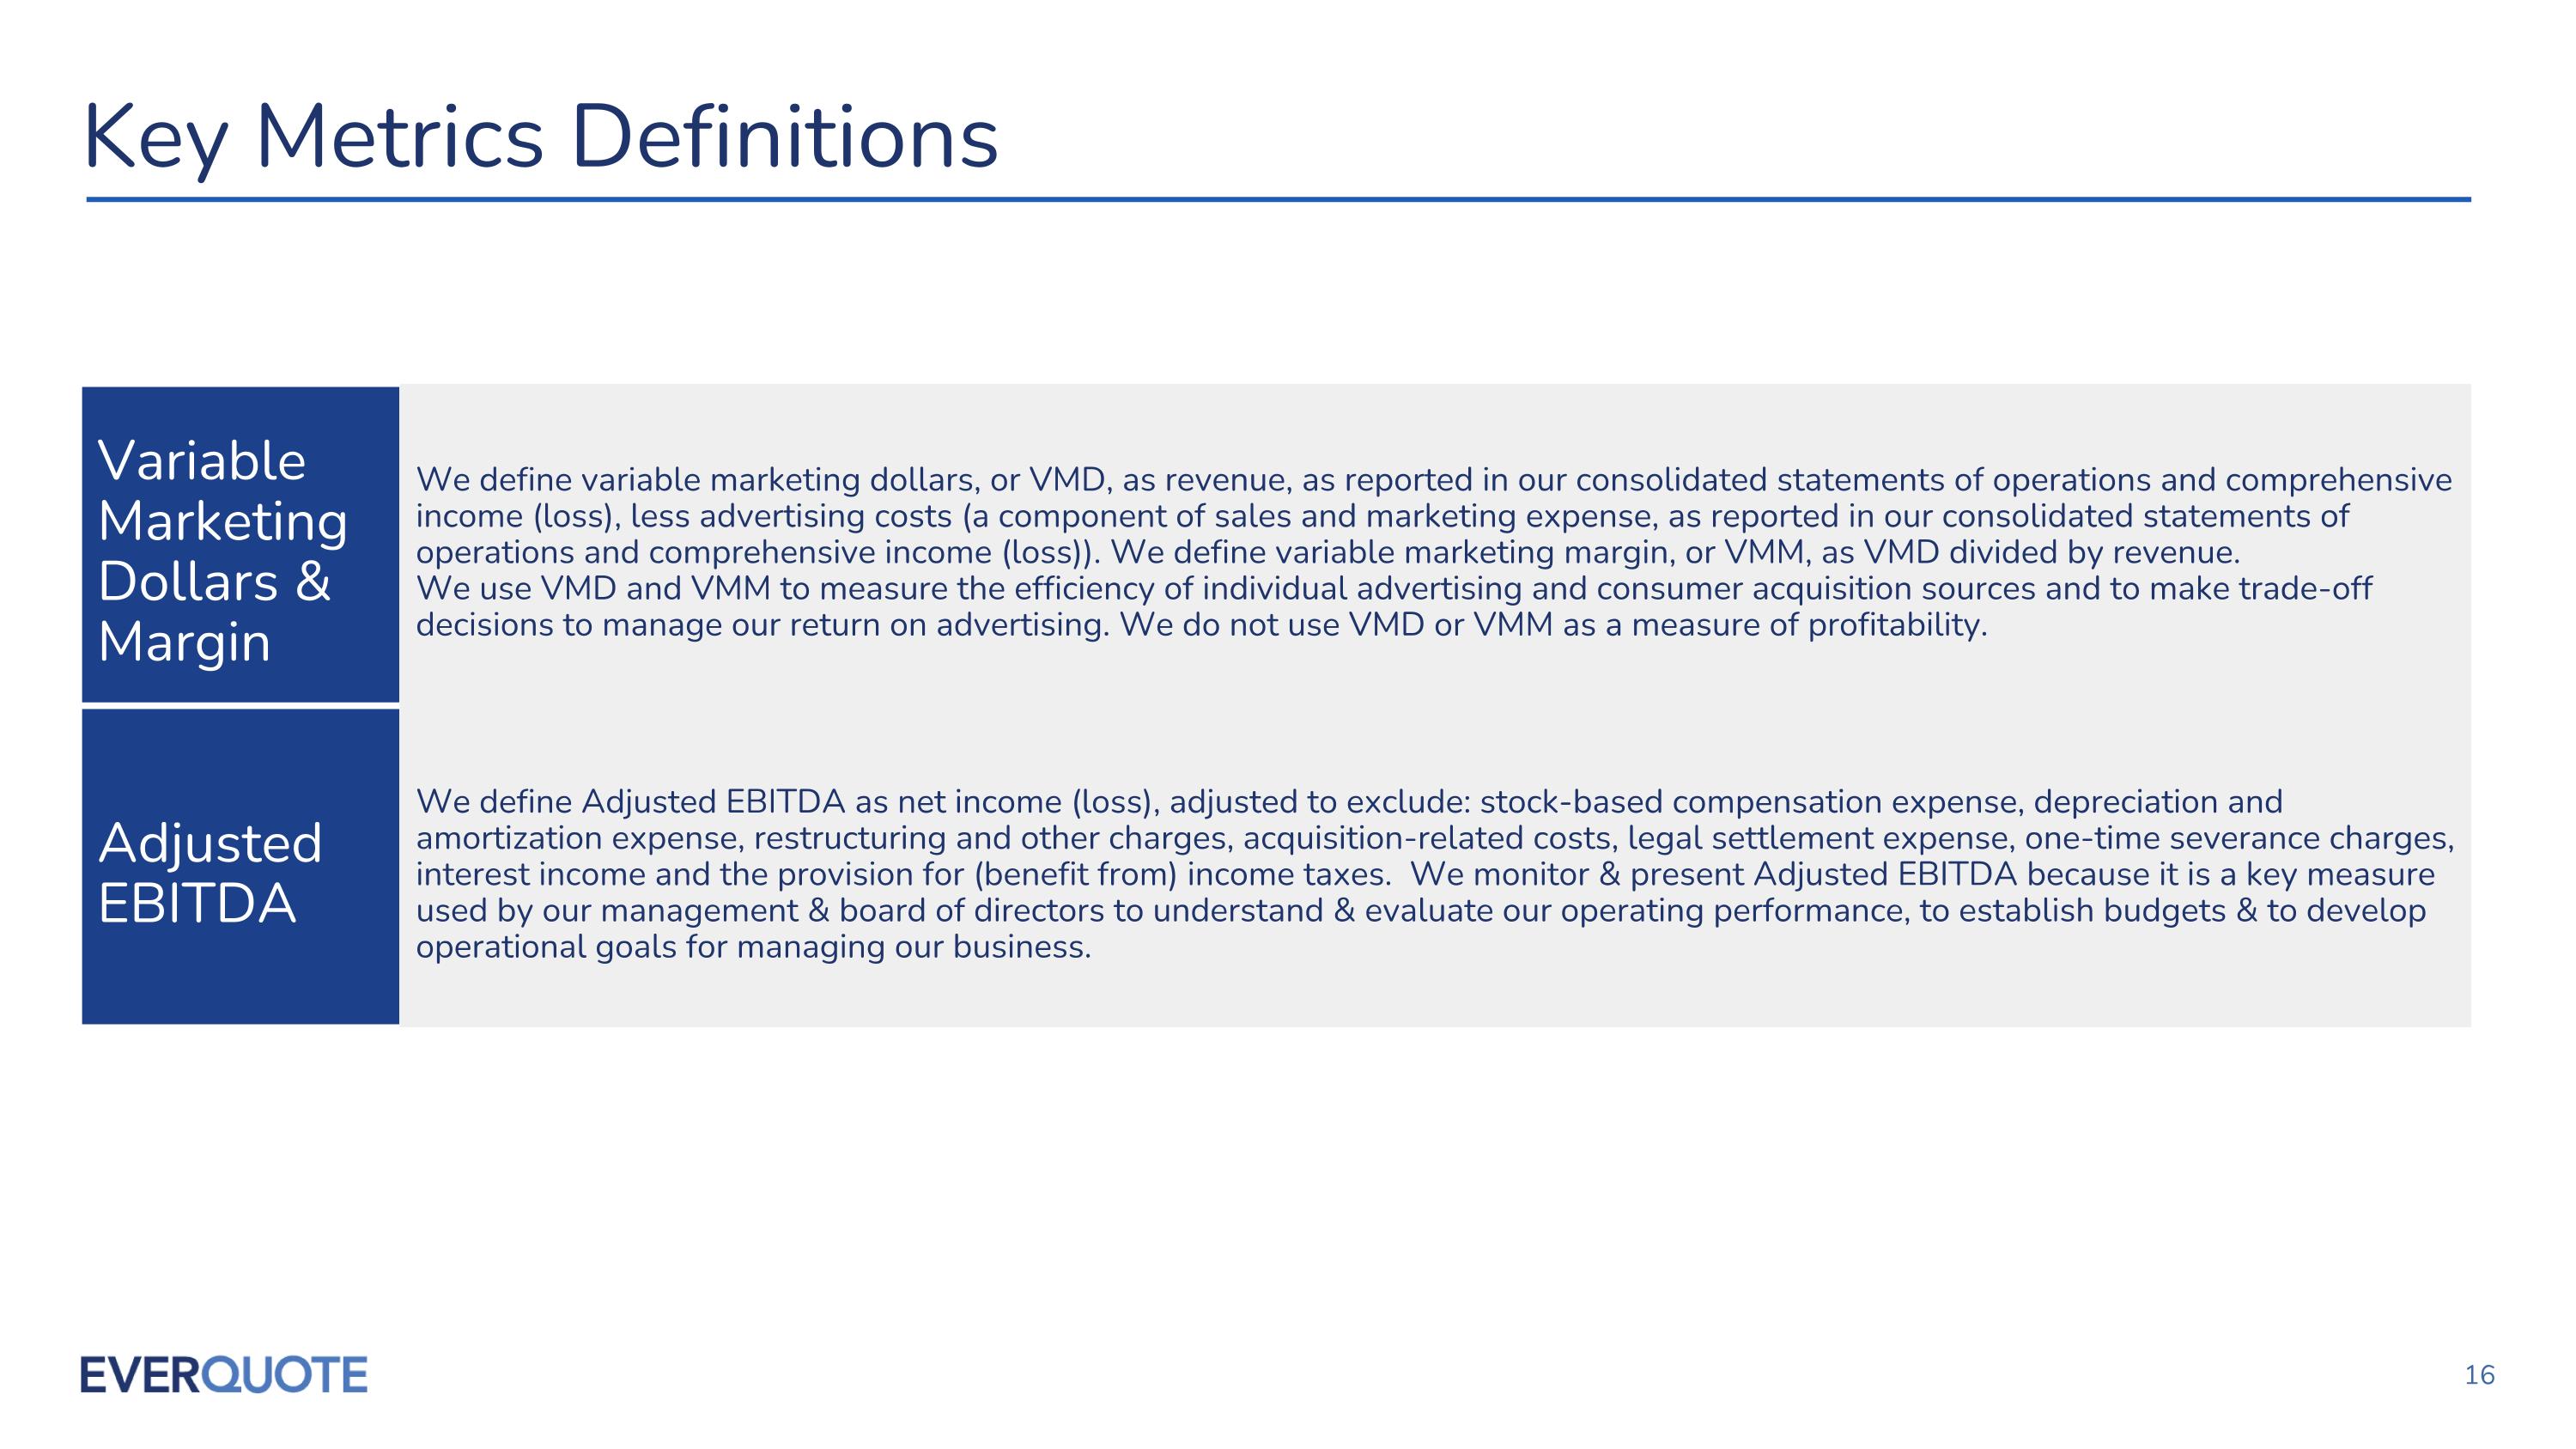
Key Metrics Definitions Variable Marketing Dollars & Margin We define variable marketing dollars, or VMD, as revenue, as reported in our consolidated statements of operations and comprehensive income (loss), less advertising costs (a component of sales and marketing expense, as reported in our consolidated statements of operations and comprehensive income (loss)). We define variable marketing margin, or VMM, as VMD divided by revenue.�We use VMD and VMM to measure the efficiency of individual advertising and consumer acquisition sources and to make trade-off decisions to manage our return on advertising. We do not use VMD or VMM as a measure of profitability. Adjusted EBITDA We define Adjusted EBITDA as net income (loss), adjusted to exclude: stock-based compensation expense, depreciation and amortization expense, restructuring and other charges, acquisition-related costs, legal settlement expense, one-time severance charges, interest income and the provision for (benefit from) income taxes. We monitor & present Adjusted EBITDA because it is a key measure used by our management & board of directors to understand & evaluate our operating performance, to establish budgets & to develop operational goals for managing our business.
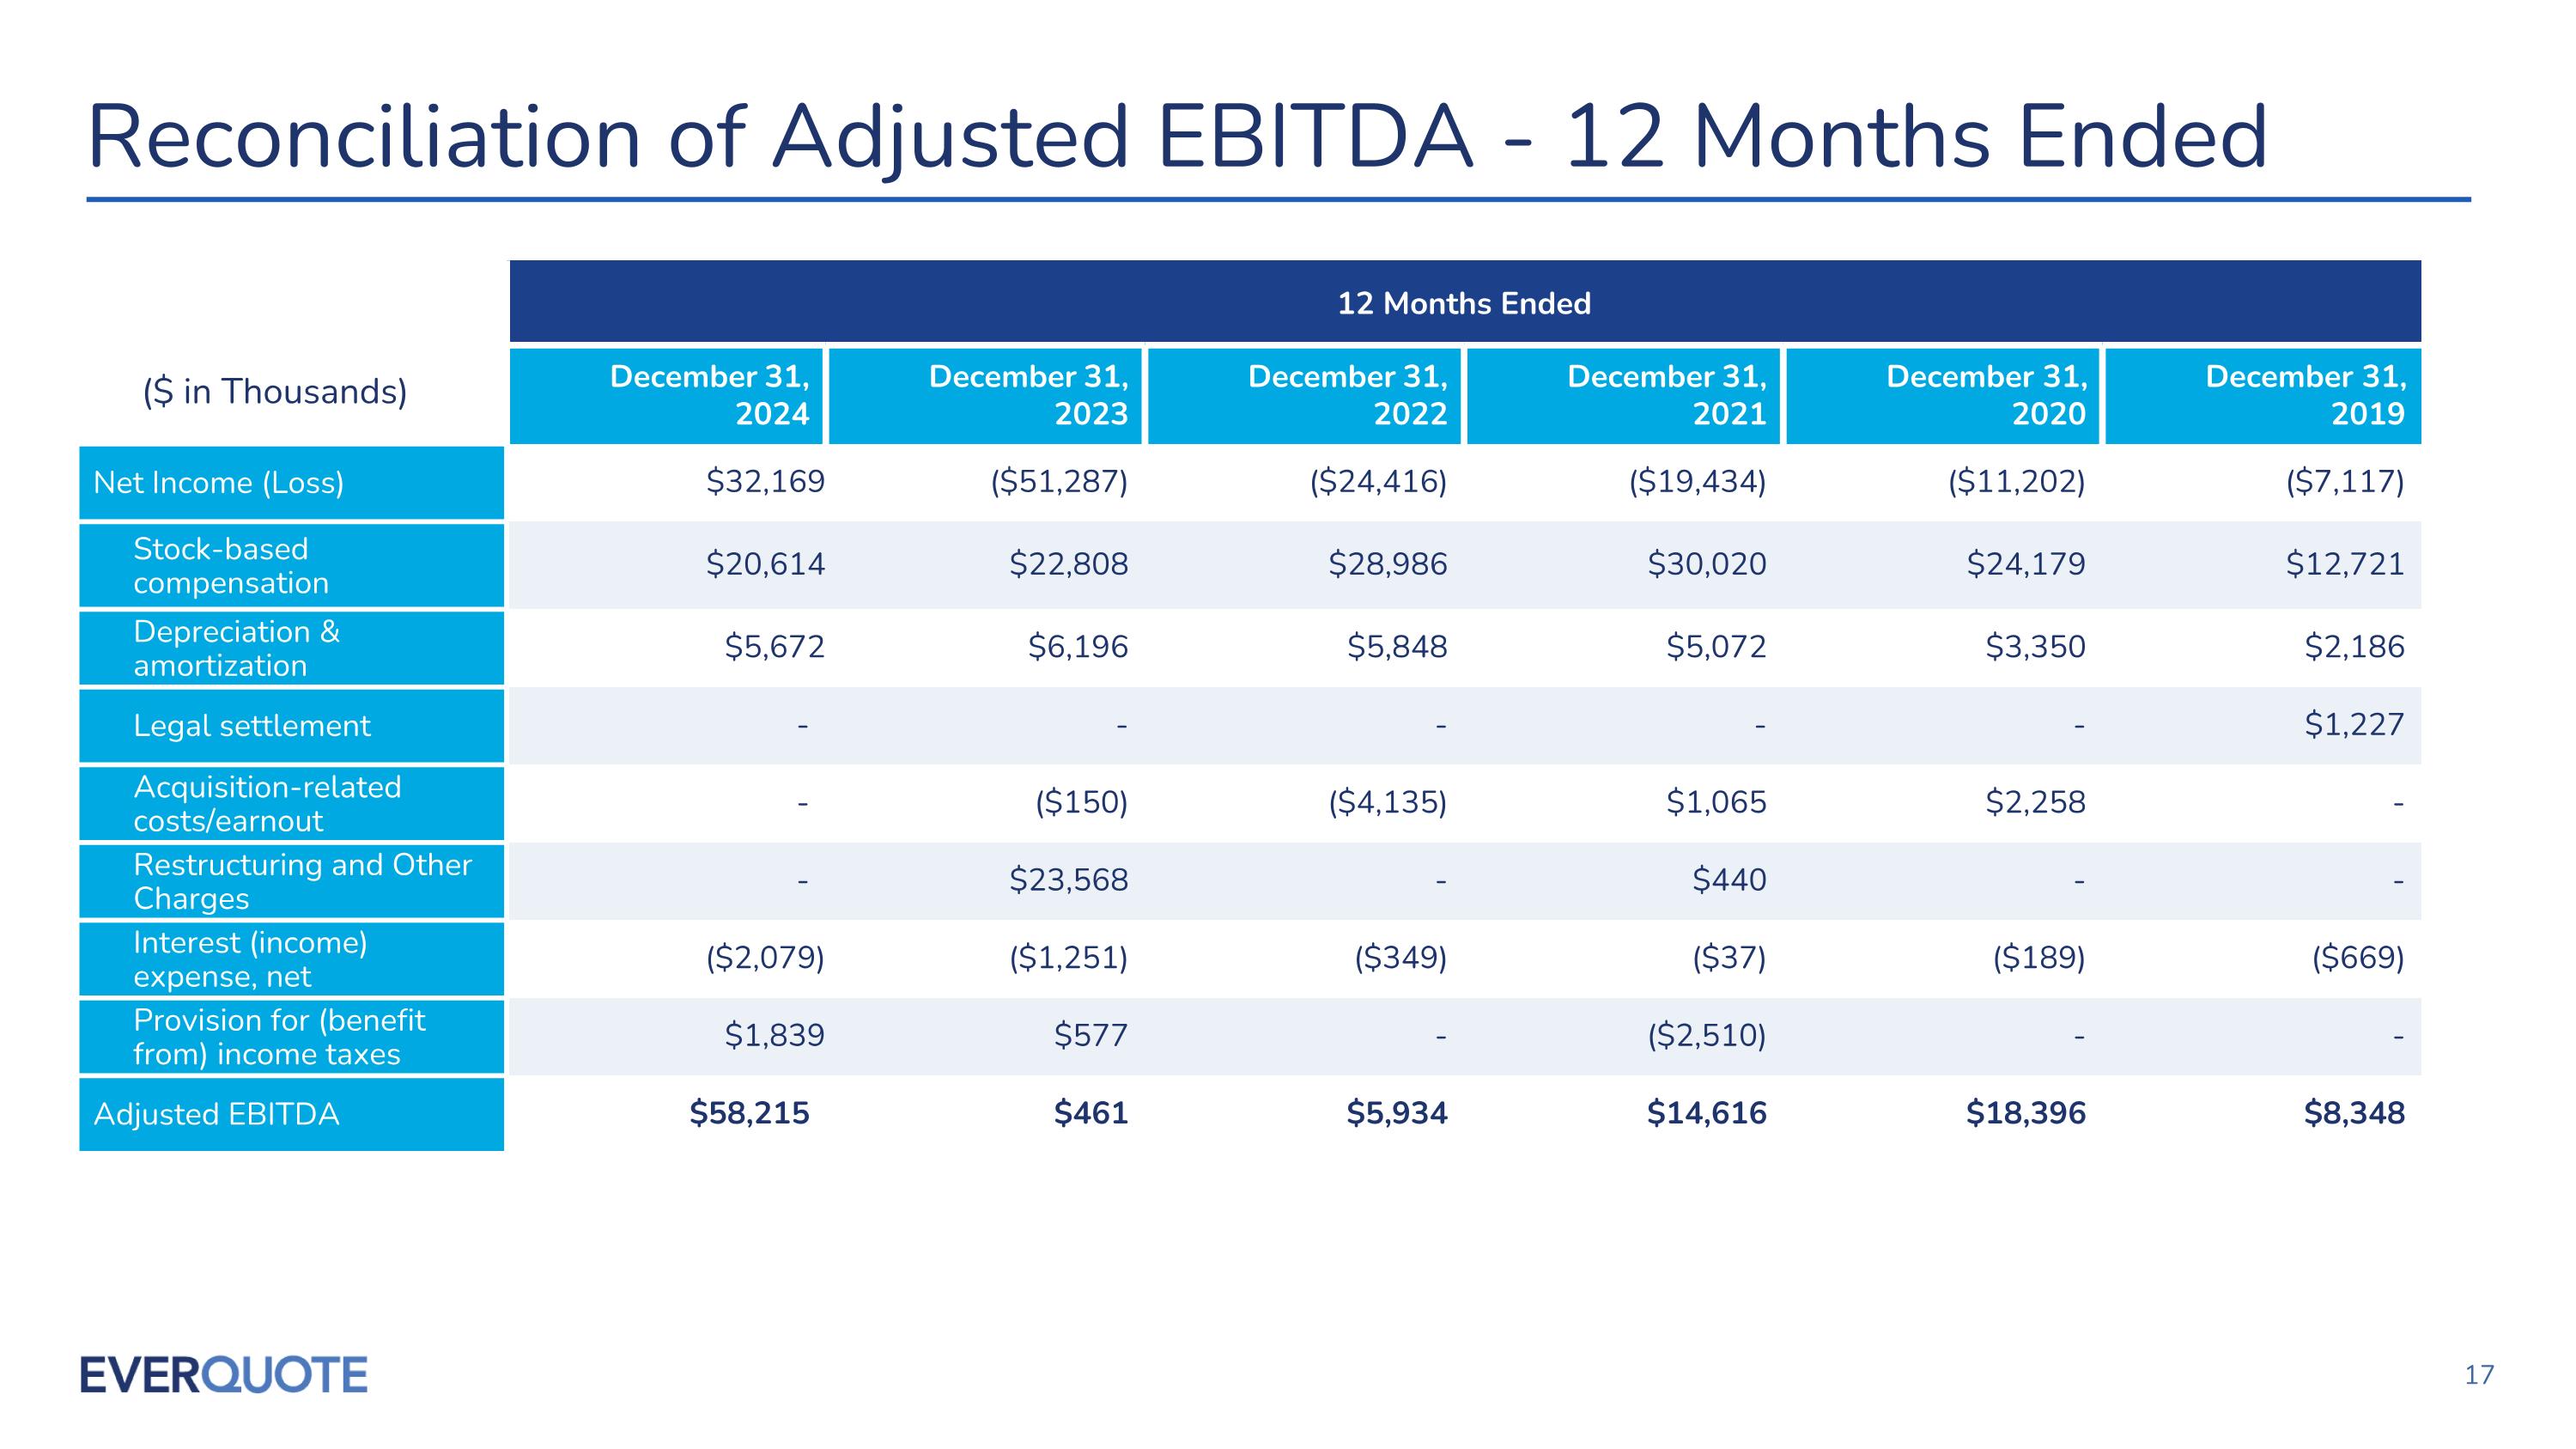
Reconciliation of Adjusted EBITDA - 12 Months Ended 12 Months Ended December 31, 2024 December 31, 2023 December 31, 2022 December 31, 2021 December 31, 2020 December 31, 2019 Net Income (Loss) $32,169 ($51,287) ($24,416) ($19,434) ($11,202) ($7,117) Stock-based compensation $20,614 $22,808 $28,986 $30,020 $24,179 $12,721 Depreciation & amortization $5,672 $6,196 $5,848 $5,072 $3,350 $2,186 Legal settlement - - - - - $1,227 Acquisition-related costs/earnout - ($150) ($4,135) $1,065 $2,258 - Restructuring and Other Charges - $23,568 - $440 - - Interest (income) expense, net ($2,079) ($1,251) ($349) ($37) ($189) ($669) Provision for (benefit from) income taxes $1,839 $577 - ($2,510) - - Adjusted EBITDA $58,215 $461 $5,934 $14,616 $18,396 $8,348 ($ in Thousands)
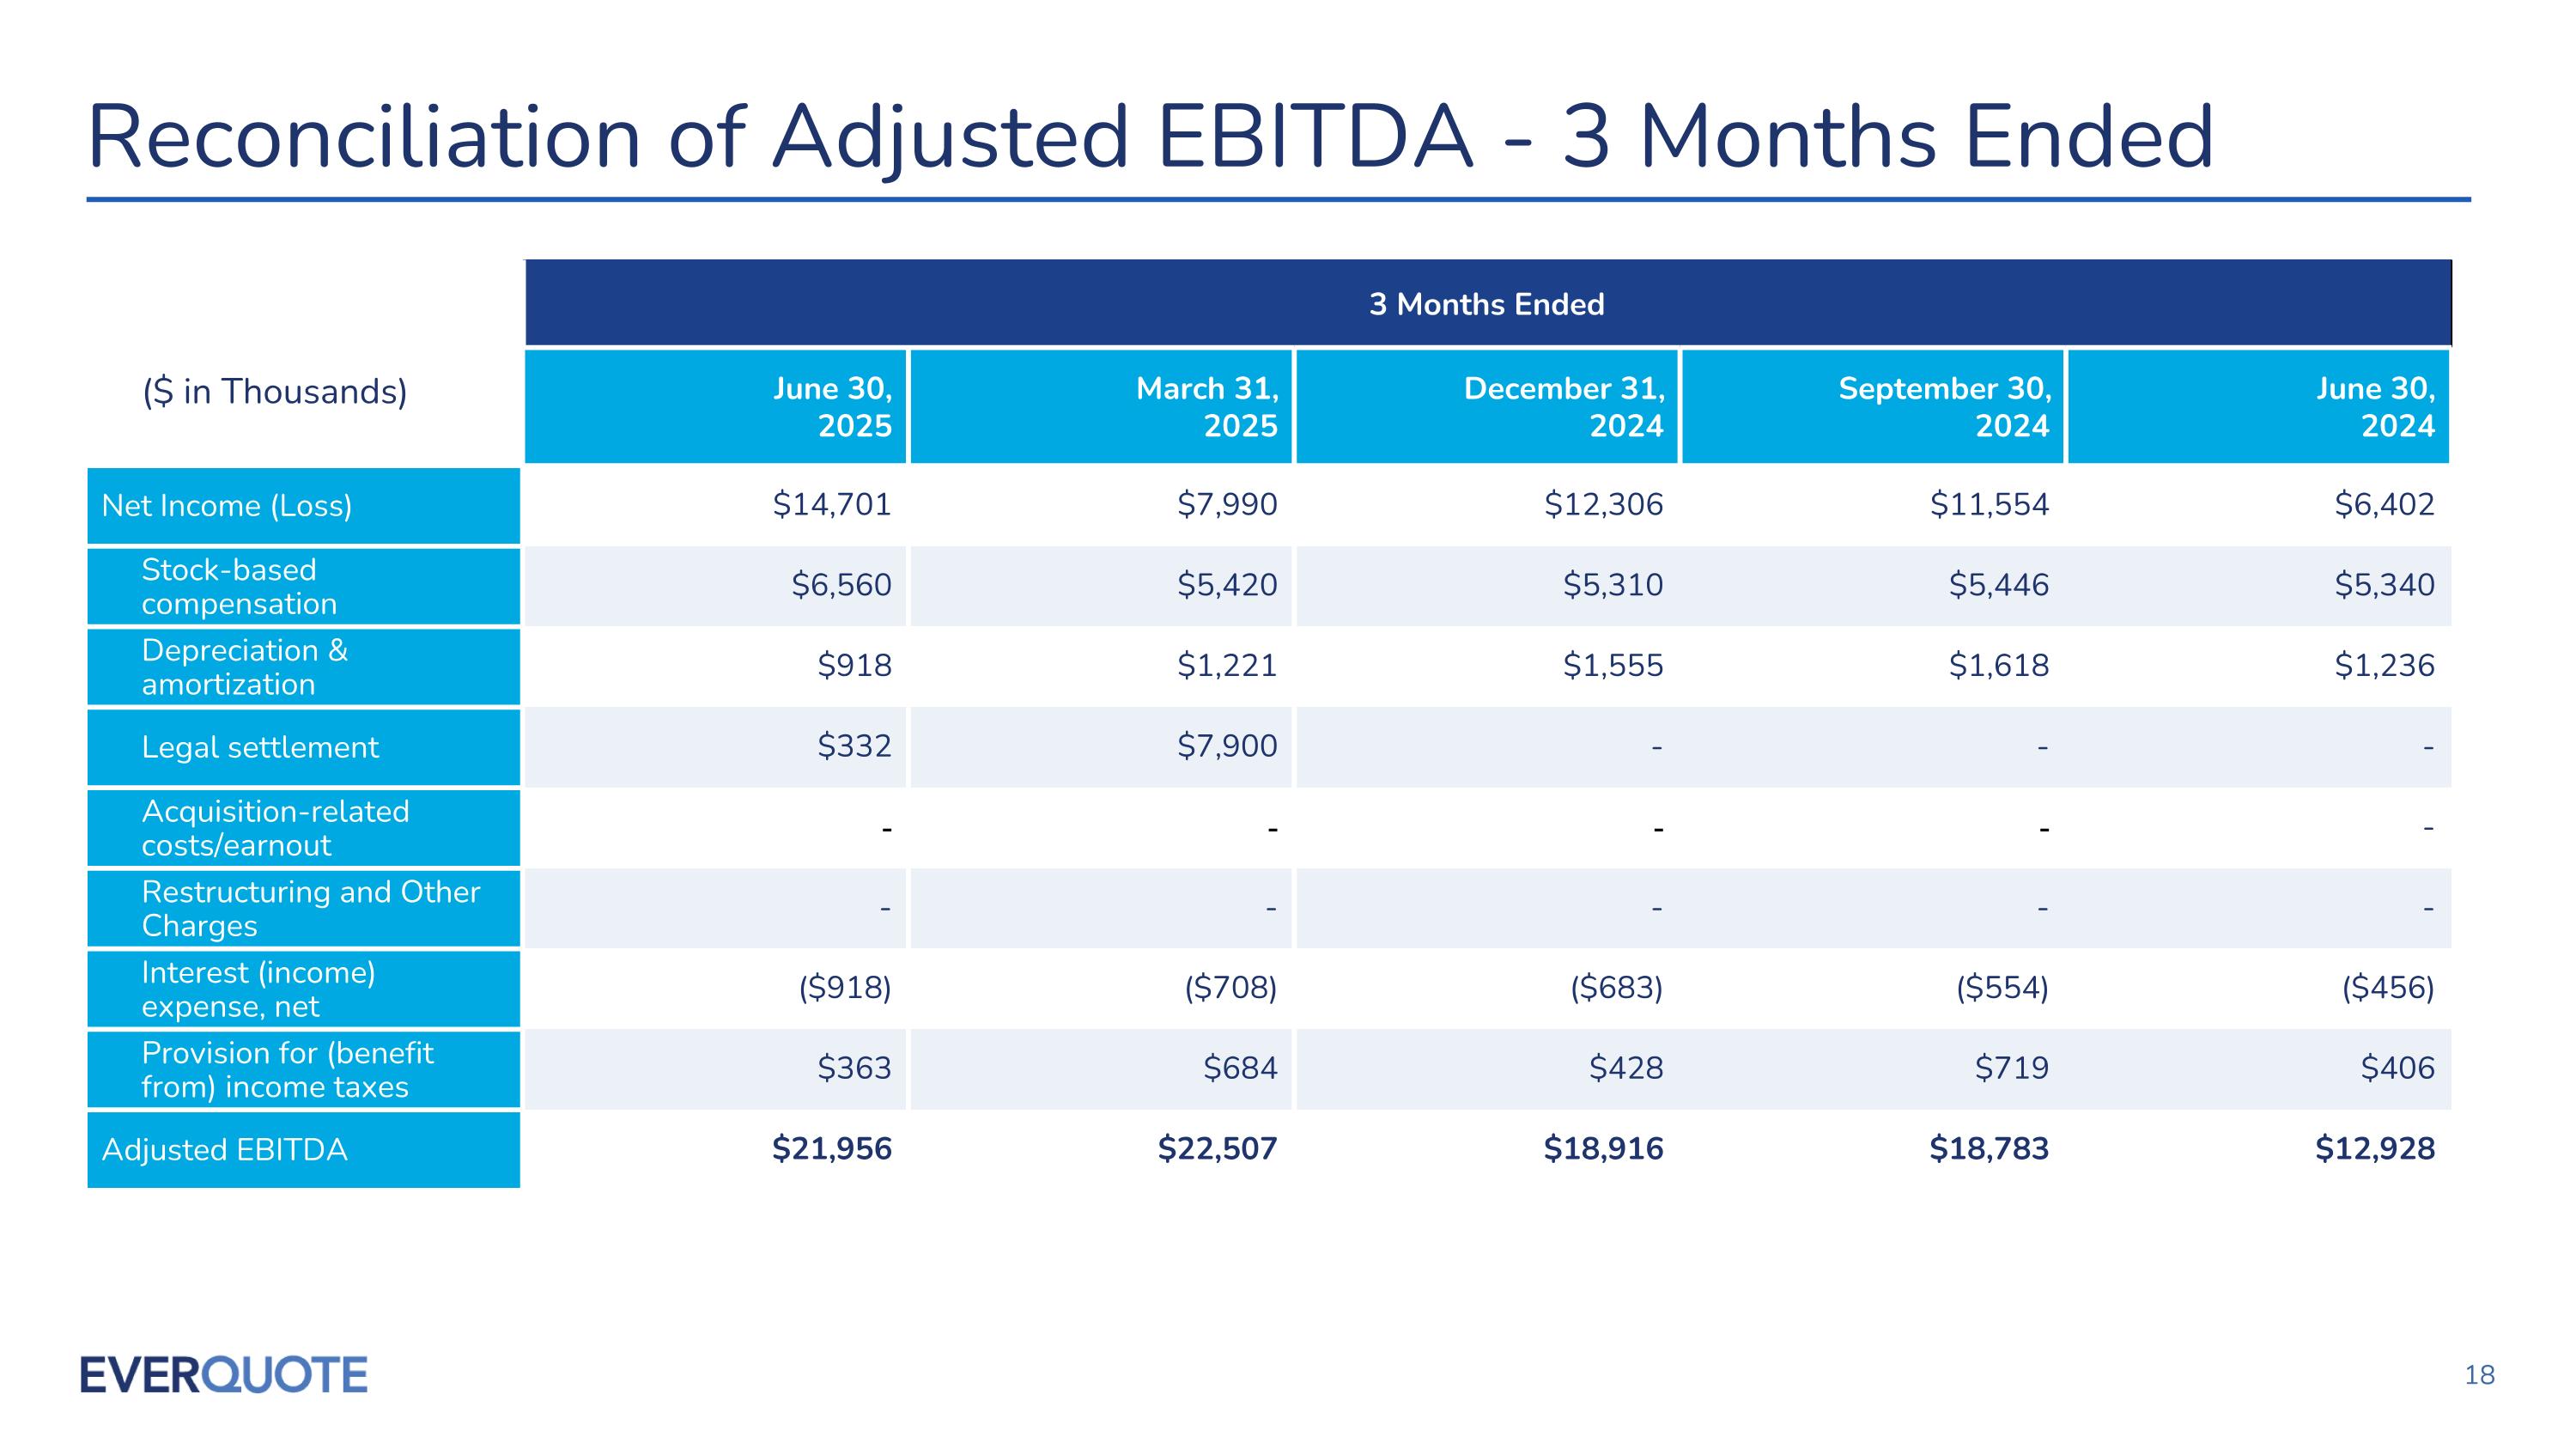
Reconciliation of Adjusted EBITDA - 3 Months Ended 3 Months Ended June 30, 2025 March 31, 2025 December 31, 2024 September 30, 2024 June 30, 2024 Net Income (Loss) $14,701 $7,990 $12,306 $11,554 $6,402 Stock-based compensation $6,560 $5,420 $5,310 $5,446 $5,340 Depreciation & amortization $918 $1,221 $1,555 $1,618 $1,236 Legal settlement $332 $7,900 - - - Acquisition-related costs/earnout - - - - - Restructuring and Other Charges - - - - - Interest (income) expense, net ($918) ($708) ($683) ($554) ($456) Provision for (benefit from) income taxes $363 $684 $428 $719 $406 Adjusted EBITDA $21,956 $22,507 $18,916 $18,783 $12,928 ($ in Thousands)