Exhibit 99.1

EVgo Inc. Reports 2021 Third Quarter Results
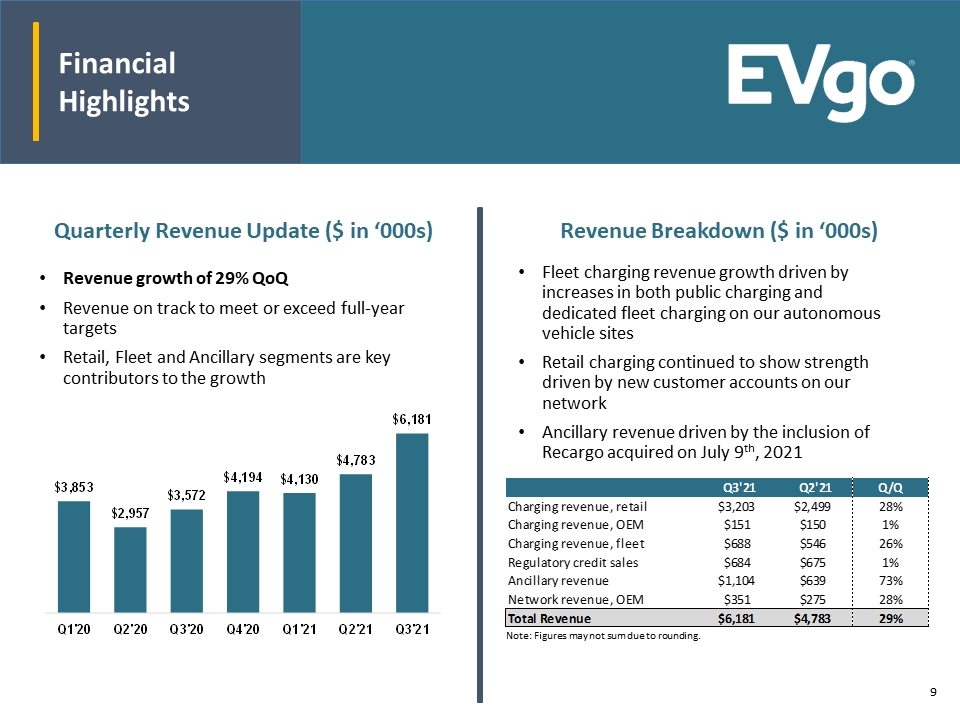
| · | Revenue increase of 29% quarter-over-quarter as retail and fleet segments realized solid activity increases over the second quarter of 2021 |
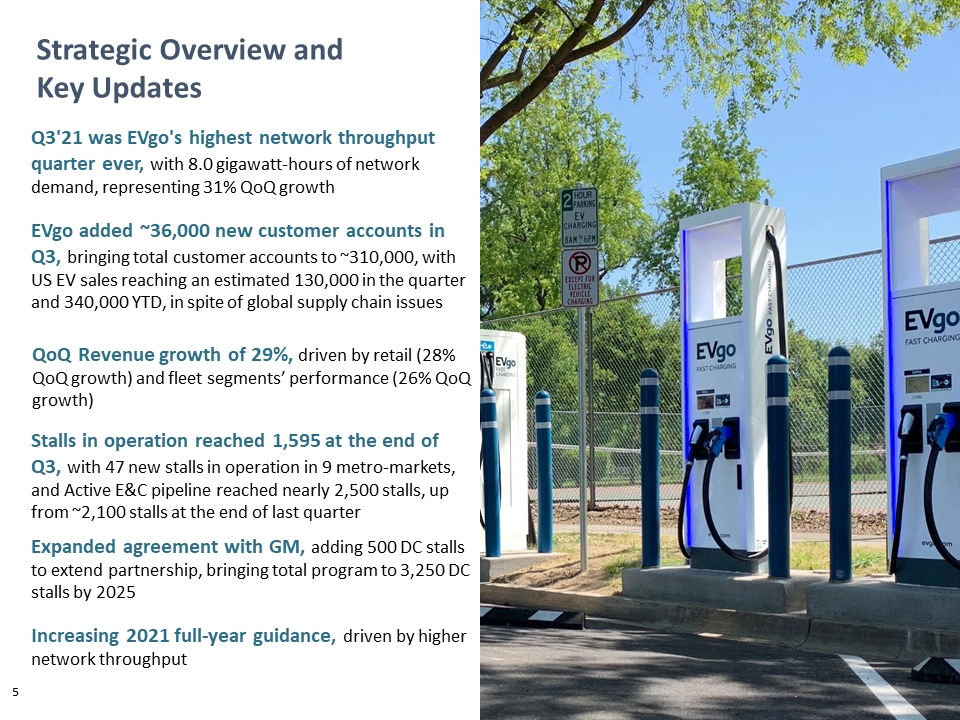
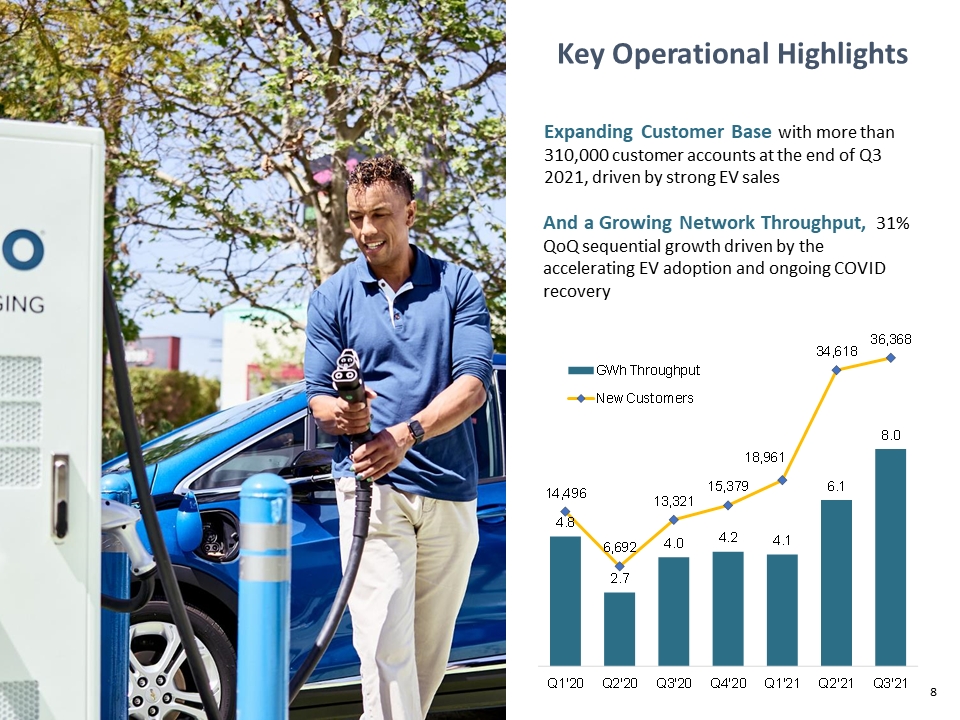
| · | Network throughput rose to an all-time high of 8.0 Gigawatt-hours (GWh), a 31% increase over the second quarter of 2021 |
| · | Gross loss of ($1.7) million, compared to ($1.7) million in the prior quarter, with gross margin of (27%) compared to (35%) in the prior quarter |
| · | Adjusted gross profit of $1.4 million, up from $1.0 million in the prior quarter with adjusted gross margin expanding to 22.2% from 21.4% in the prior quarter |
| · | Ended third quarter of 2021 with total cash and cash equivalents of $521 million |
| · | Customer accounts continue to increase, ending the quarter at approximately 310,000 |
| · | Active Engineering and Construction pipeline increased in the quarter to nearly 2,500 fast charging stalls |
| · | Revised and expanded agreement with General Motors (GM) to increase the size of the build-out program by 500 fast charging stalls, taking the total program to 3,250 stalls through 2025 |
| · | Introduction of new loyalty, pricing, and per transaction payment |
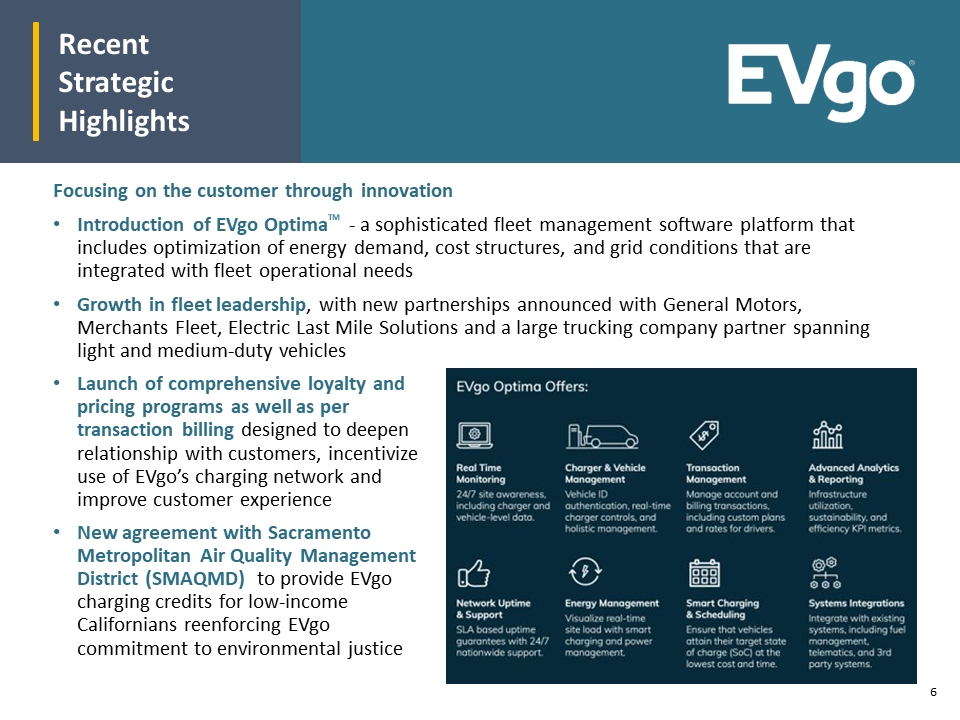
| · | Launch of EVgo OptimaTM, sophisticated fleet management software platform |
| · | Expanding fleet strategy including new fleet partnerships with General Motors, Merchants Fleet, Electric Last Mile Solutions and a large trucking company partner |
| · | Increasing full-year 2021 revenue guidance to $20-22 million and network throughput guidance to 24-26 GWh |
Los Angeles, CA, November 10, 2021 – EVgo Inc. (Nasdaq: EVGO) (“EVgo” or the “Company”) today announced results for the third quarter ending September 30, 2021. The Company generated continued growth in revenue, network throughput and customer accounts. EV adoption has accelerated with approximately 130,000 EVs sold in the US during the third quarter of 2021 proving the continued expansion of the EV sector and bringing more drivers on EVgo network.
Revenue increased to $6.2 million for the third quarter of 2021, compared to $4.8 million for the second quarter of 2021, exhibiting 29% quarter-over-quarter growth. Network throughput has reached 8.0 GWh with 31% quarter-over-quarter growth. Total customer accounts grew to more than 310,000 at the end of the third quarter of 2021.
“EVgo’s operations in the quarter demonstrated further progress toward an electrified transportation future, with more drivers using our DC fast charging services generating the highest network throughput EVgo has ever delivered to its EV-driving customer base,” said Cathy Zoi, CEO of EVgo. “With customer accounts exceeding 310,000, and both the fleet and retail segments realizing impressive revenue growth, EVgo’s commitment to creating the best located and highest-reliability fast-charging network is being validated and rewarded by EV drivers across the U.S.”
Business Highlights
| · | Station Development: The entirety of EVgo’s station development pipeline expanded during the third quarter of 2021, emblematic of the expansion of the overall EV sector. This includes agreements with new national and regional site hosts eager to participate in transportation electrification, dozens of local government authorities reviewing applications for fast charging stations within their localities, major utilities issuing new EV-friendly electricity rates, and government agencies launching new programs to provide financial support for charging infrastructure. In particular, EVgo’s Active Engineering and Construction (E&C) Pipeline grew to nearly 2,500 DCFC charging stalls. Additionally, EVgo placed 47 new stalls into service in 9 metro-markets, bringing total stalls in operation to 1,595 at the end of the third quarter of 2021. |
| · | General Motors Charger Deployment Program: After the quarter concluded, EVgo and GM expanded their relationship, with EVgo increasing the number of DC fast charging stalls it will deploy for GM by the end of 2025 by 500 stalls to a new total of 3,250. |
| · | EVgo OptimaTM: Anticipating the needs of electrification of the fleet segment, the Company introduced its EVgo OptimaTM software product suite during the third quarter of 2021. Optima is a sophisticated fleet management platform designed to deliver highly efficient charging performance. This package includes optimization of energy demand, cost structures, and grid conditions that are fully integrated with operational imperatives of the fleets it is servicing. |
| · | Fleet Partnerships: EVgo’s continued leadership on fleet electrification included new charging partnerships with General Motors, Merchants Fleet, Electric Last Mile Solutions and a large trucking company partner. These collaborations span light and medium-duty vehicles serving small, medium, and large businesses focused on the movement of goods and people over last mile, regional, and other applications. Fleets continue to play a critical role in EVgo’s strategy. |
| · | New Customer Programs: During the third quarter, EVgo launched a comprehensive customer loyalty scheme, new pricing programs, as well as per transaction billing. Coupled with EVgo’s existing reservations, coupon, and seamless parking garage access, these efforts are aimed at deepening relationships with customers, incentivizing charging at different times during the day, and creating a world-class customer experience.
|
| · | Community Partnerships & Environmental Alignment: EVgo entered into a new agreement in Sacramento in which the Sacramento Metropolitan Air Quality Management District (SMAQMD) will provide charging credits for use on EVgo’s network to low-income Californians who have purchased an EV through the California Air Resources Board’s Clean Cars 4 All program. This latest partnership builds on EVgo’s unwavering commitment to environmental justice through community partnerships. |
Financial & Operational Highlights
The below represent summary financial and operational figures for the third quarter ended September 30, 2021.
| · | Revenue of $6.2 million |
| · | Network throughput of 8.0 gigawatt-hours |
| · | Customer account additions of 36,368 accounts |
| · | Charger stalls in operation: EVgo placed 47 stalls into operation in Q3, bringing total stalls in operation to 1,595 |
| · | Gross profit/(loss) of ($1.7) million |
| · | Net income of $23.6 million |
| · | Adjusted gross profit of $1.4 million |
| · | Adjusted EBITDA of ($14.3) million |
| · | Cash Flow from Operations of ($16.4) million for the third quarter, and ($17.8) million for the nine months ended September 30, 2021 |
| · | Capital Expenditures of $16.3 million for the third quarter (excluding Recargo acquisition), and $39.7 million for the nine months ended September 30, 2021 |
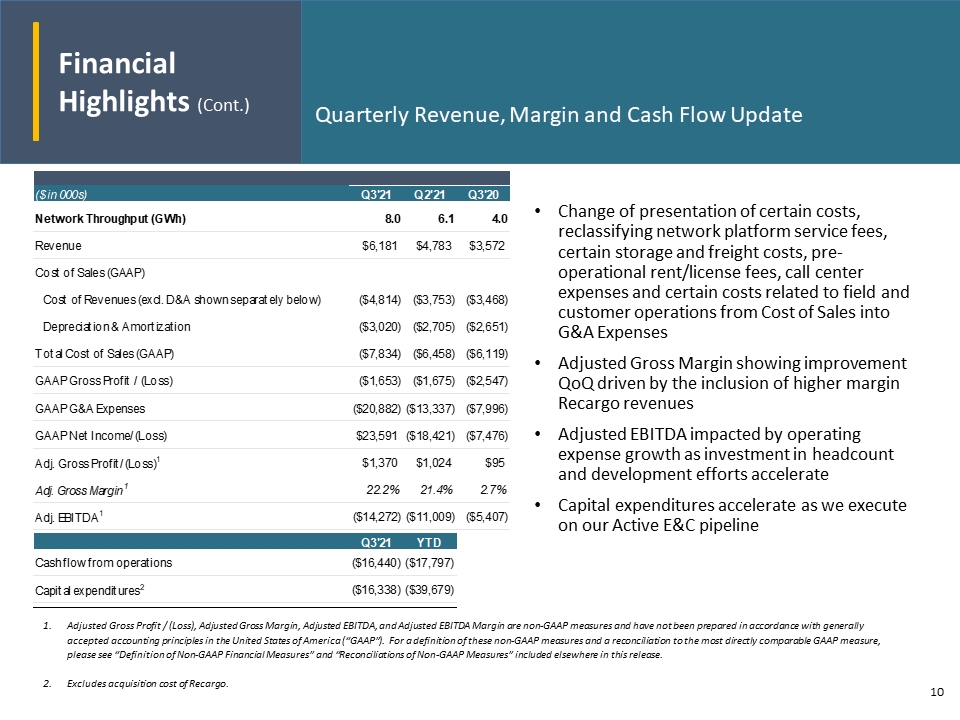
| ($ in 000s) | Q3'21 | Q2'21 | Q3'20 | |||||||||
| Network Throughput (GWh) | 8.0 | 6.1 | 4.0 | |||||||||
| Revenue | $ | 6,181 | $ | 4,783 | $ | 3,572 | ||||||
| Cost of Sales (GAAP) | ||||||||||||
| Cost of Revenues (excl. D&A shown separately below) | $ | (4,814 | ) | $ | (3,753 | ) | $ | (3,468 | ) | |||
| Depreciation & Amortization | $ | (3,020 | ) | $ | (2,705 | ) | $ | (2,651 | ) | |||
| Total Cost of Sales (GAAP) | $ | (7,834 | ) | $ | (6,458 | ) | $ | (6,119 | ) | |||
| GAAP Gross Profit / (Loss) | $ | (1,653 | ) | $ | (1,675 | ) | $ | (2,547 | ) | |||
| GAAP G&A Expenses | $ | (20,882 | ) | $ | (13,337 | ) | $ | (7,996 | ) | |||
| GAAP Net Income/(Loss) | $ | 23,591 | $ | (18,421 | ) | $ | (7,476 | ) | ||||
| Adj. Gross Profit/(Loss)1 | $ | 1,370 | $ | 1,024 | $ | 95 | ||||||
| Adj. Gross Margin1 | 22.2 | % | 21.4 | % | 2.7 | % | ||||||
| Adj. EBITDA1 | $ | (14,272 | ) | $ | (11,009 | ) | $ | (5,407 | ) | |||
| Q3'21 | YTD | |||||||||||
| Cash flow from operations | $ | (16,440 | ) | $ | (17,797 | ) | ||||||
| Capital expenditures2 | $ | (16,338 | ) | $ | (39,679 | ) |
‘1. Adjusted Gross Profit / (Loss), Adjusted Gross Margin, Adjusted EBITDA, and Adjusted EBITDA Margin are non-GAAP measures and have not been prepared in accordance with Generally Accepted Accounting Principles in the United States of America (“GAAP”). For a definition of these non-GAAP measures and a reconciliation to the most directly comparable GAAP measure, please see “Definition of non-GAAP Financial Measures” and “Reconciliation of non-GAAP Measures” included elsewhere in this release. COGS consists primarily of energy usage fees, depreciation and amortization expenses, site O&M expenses, customer service and network charges, warranty and repair services, and site lease and rental expense associated with charging equipment. Adjusted Gross Profit / (Loss) is defined as Gross Profit / (Loss) less: (i) depreciation and ARO accretion, (ii) stock option expense, and (iii) other non-recurring expenses.
2. Excludes acquisition cost of Recargo.
EVgo realized 31% quarter-over-quarter increase in kilowatt-hour network throughput during the third quarter of 2021, and 101% increase in throughput year-over-year.
Revenue realized similar growth trends, with 29% quarter-over-quarter growth, and a 73% year-over-year increase.
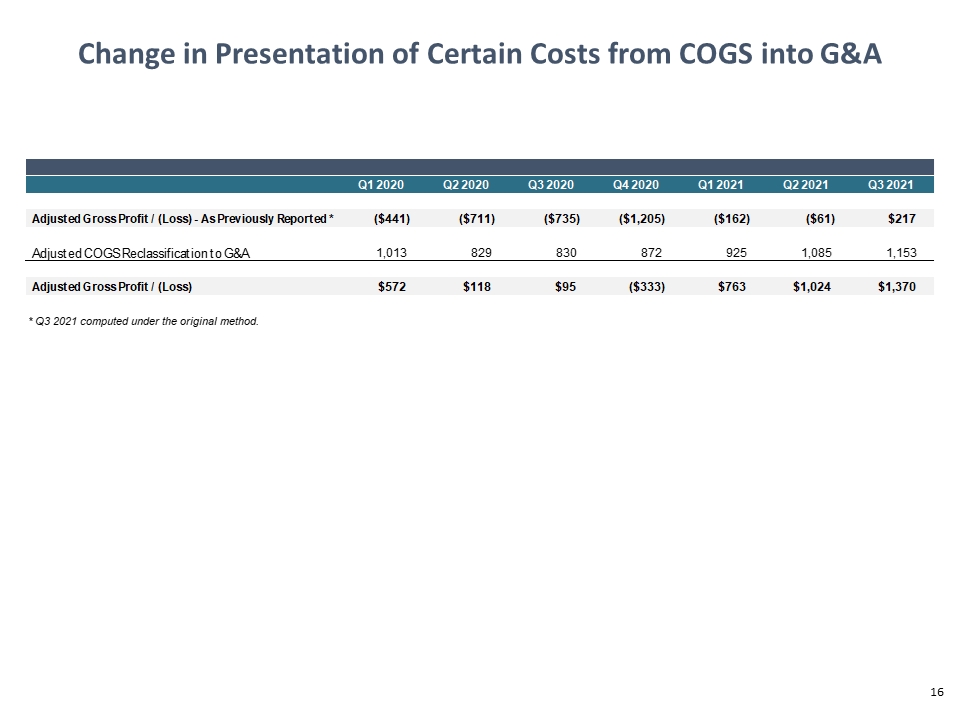
Change in Presentation of COGS and G&A
During the third quarter of 2021, the Company updated its presentation of certain costs, including network platform service fees, certain storage and freight costs, pre-operational rent/license fees, call center expenses and certain costs related to field and customer operations. In previous periods, these costs were included as a component of cost of sales. The Company now presents these costs as a component of general and administrative expenses. Management believes this presentation more appropriately reflects the nature of the costs, the financial performance of our business, enables better alignment between revenues and cost of sales and provides more clarity about the changes in cost of sales and general and administrative expenses, resulting in improved financial reporting and comparability and consistency of financial results.
All periods presented have been retrospectively revised to reflect the effects of the change to cost of sales and general and administrative expenses. There was no net impact to loss from operations, net income (loss) attributable to EVgo or net income (loss) per share for any periods presented. The condensed consolidated balance sheets, condensed consolidated statements of stockholders’/member’s equity (deficit), and the condensed consolidated statements of cash flows are not affected by these changes in presentation of certain costs. The effect of the change is presented at the end of this release.
Gross loss during the third quarter of 2021 of ($1.7) million was relatively unchanged sequentially, while Gross margin improved from negative 35% in the second quarter of 2021 to negative 27% in the third quarter of 2021.
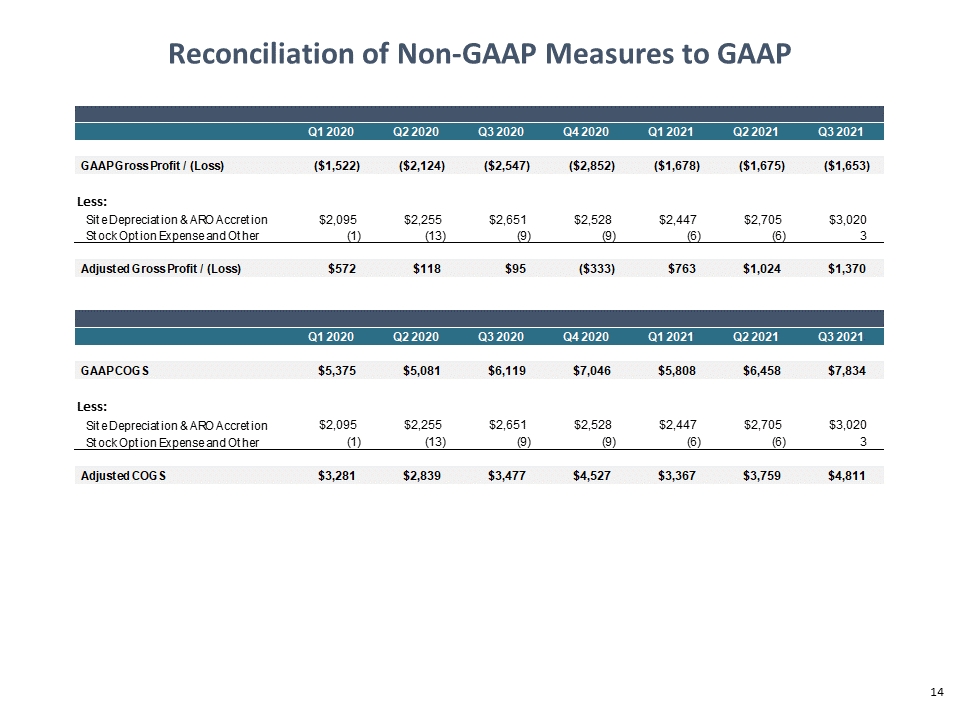
Adjusted gross profit and adjusted gross margin improved in the third quarter of 2021. Adjusted gross profit increased to $1.4 million in the third quarter of 2021, up from $1.0 million in the prior quarter. Adjusted gross margin in the third quarter of 2021 was 22.2%, representing an improvement of approximately 75 basis points over the second quarter of 2021.
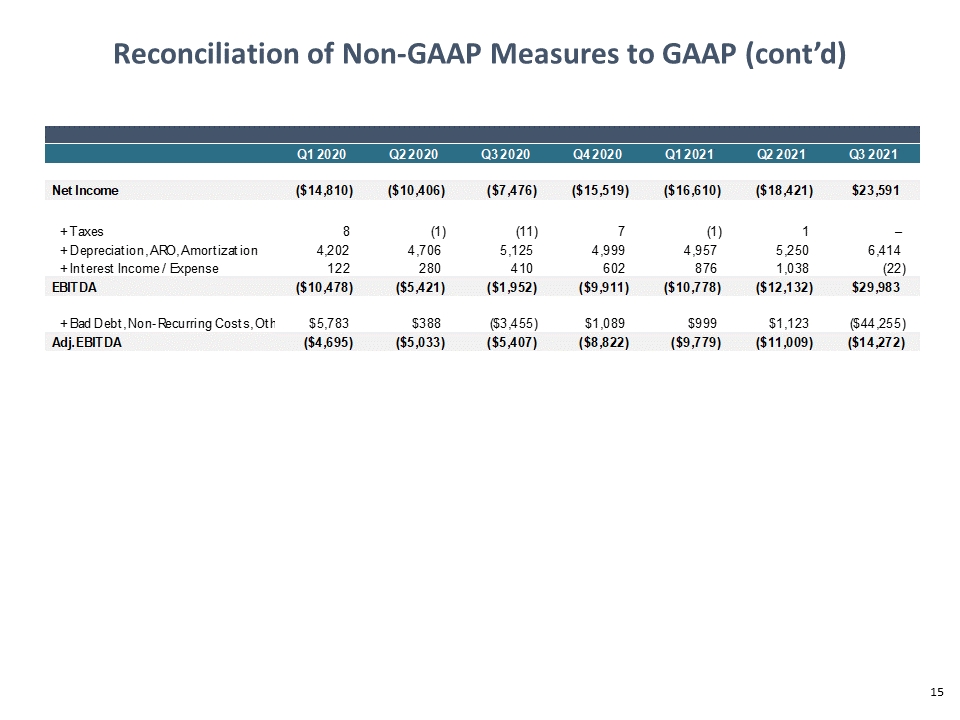
Adjusted EBITDA in the third quarter of 2021 was ($14.3) million, compared to ($11.0) million in the prior quarter, driven by increased G&A expenses results from continued operational and personnel investments to support EVgo’s network expansion.
Cash from Operations was ($16.4) million in the third quarter and ($17.8) million for the first nine months of 2021.
Capital expenditures in the third quarter was $16.3 million and $39.7 million for the first nine months of 2021, as stall development work accelerated.
Cash and cash equivalents at the end of the third quarter of 2021 were $521 million.
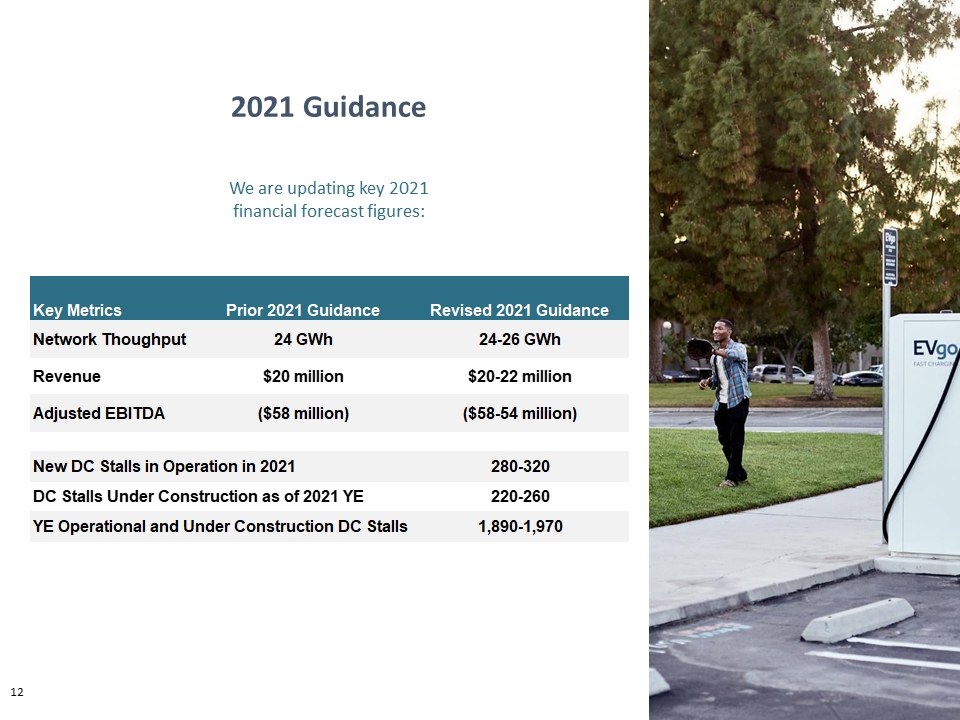
2021 Guidance
Following a strong year-to-date performance through September 30, 2021, EVgo is increasing its full-year 2021 guidance as follows:
| · | Total revenue of $20-22 million, up from $20 million previously |
| · | Network throughput of 24-26 GWh, up from 24 GWh previously |
| · | Adjusted EBITDA of ($54-58) million, up from ($58) million previously |
Additionally, EVgo is initiating operational stall target guidance. For the full-year 2021, EVgo expects to deliver 280-320 newly operational stalls. Additionally, EVgo anticipates that between 220-260 stalls will be under construction at the end of 2021, resulting in a forecasted total of between 1,890 and 1,970 operational or under construction stalls as of December 31.
Conference Call Information
A live audio webcast and conference call for our third quarter 2021 earnings release will be held at 11:00 AM ET / 8:00 AM PT on November 10, 2021. The webcast will be available at investors.evgo.com, and the dial-in information for those wishing to access via phone is:
Toll Free: 1-877-407-4018
Toll/International: 1-201-689-8471
Conference ID: 13724359
This press release, along with other investor materials, including a slide presentation and reconciliations of certain non-GAAP measures to their nearest GAAP measures, will also be available on that site.
About EVgo
EVgo (Nasdaq: EVGO) is the nation’s largest public fast charging network for electric vehicles, and the first to be powered by 100% renewable energy. With more than 800 fast charging locations, EVgo’s owned and operated charging network serves over 68 metropolitan areas across 35 states and more than 310,000 customers. Founded in 2010, EVgo leads the way on transportation electrification, partnering with automakers; fleet and rideshare operators; retail hosts such as hotels, shopping centers, gas stations and parking lot operators; and other stakeholders to deploy advanced charging technology to expand network availability and make it easier for drivers across the U.S. to enjoy the benefits of driving an EV. As a charging technology first mover, EVgo works closely with business and government leaders to accelerate the ubiquitous adoption of EVs by providing a reliable and convenient charging experience close to where drivers live, work and play, whether for a daily commute or a commercial fleet.
Forward-Looking Statements
This press release contains “forward-looking statements” within the meaning of the "safe harbor" provisions of the United States Private Securities Litigation Reform Act of 1995. Forward-looking statements may be identified by the use of words such as "estimate," "plan," "project," "forecast," "intend," "will," "expect," "anticipate," "believe," "seek," "target" or other similar expressions that predict or indicate future events or trends or that are not statements of historical matters. These forward-looking statements are based on management’s current expectations or beliefs and are subject to numerous assumptions, risks and uncertainties that could cause actual results to differ materially from those described in the forward-looking statements. These forward-looking statements include, but are not limited to, express or implied statements regarding EVgo’s future financial performance, revenues and capital expenditures, EVgo’s expectation of acceleration in our business due to factors including a re-opening economy and increased EV adoption; and the Company’s strong liquidity position enabling effective deployment of chargers. These statements are based on various assumptions, whether or not identified in this press release, and on the current expectations of EVgo’s management and are not predictions of actual performance. There are a significant number of factors that could cause actual results to differ materially from the statements made in this press release, including: changes or developments in the broader general market; ongoing impact from COVID-19 on our business, customers, and suppliers; macro political, economic, and business conditions; our limited operating history as a public company; our dependence on widespread adoption of EVs and increased installation of charging station; mechanisms surrounding energy and non-energy costs for our charging stations; the impact of governmental support and mandates that could reduce, modify, or eliminate financial incentives, rebates, and tax credits; supply chain interruptions; impediments to our expansion plans; the need to attract additional fleet operators as customers; potential adverse effects on our revenue and gross margins if customers increasingly claim clean energy credits and, as a result, they are no longer available to be claimed by us; the effects of competition; risks related to our dependence on our intellectual property; and risks that our technology could have undetected defects or errors. Additional risks and uncertainties that could affect our financial results are included under the captions “Risk Factors” and “Management’s Discussion and Analysis of Financial Condition and Results of Operations of EVgo” in EVgo’s registration statement on Form S-1 originally filed with the Securities and Exchange Commission (the “SEC”) on July 20, 2021, as well as its other filings with the SEC, copies of which are available on EVgo’s website at investors.evgo.com, and on the SEC’s website at www.sec.gov. All forward-looking statements in this press release are based on information available to us as of the date hereof, and we do not assume any obligation to update the forward-looking statements provided to reflect events that occur or circumstances that exist after the date on which they were made, except as required by applicable law.
Use of Non-GAAP Financial Measures
To supplement EVgo’s financial information, which is prepared and presented in accordance with GAAP, EVgo uses certain non-GAAP financial measures. The presentation of non-GAAP financial measures is not intended to be considered in isolation or as a substitute for, or superior to, the financial information prepared and presented in accordance with GAAP. EVgo uses these non-GAAP financial measures for financial and operational decision-making and as a means to evaluate period-to-period comparisons. EVgo believes that these non-GAAP financial measures provide meaningful supplemental information regarding the Company’s performance by excluding certain items that may not be indicative of EVgo’s recurring core business operating results.
EVgo believes that both management and investors benefit from referring to these non-GAAP financial measures in assessing EVgo’s performance. These non-GAAP financial measures also facilitate management’s internal comparisons to the Company’s historical performance. EVgo believes these non-GAAP financial measures are useful to investors both because (1) they allow for greater transparency with respect to key metrics used by management in its financial and operational decision-making and (2) they are used by EVgo’s institutional investors and the analyst community to help them analyze the health of EVgo’s business.
For more information on these non-GAAP financial measures, including reconciliations to the most comparable GAAP measures, please see the sections titled “Definitions of Non-GAAP Financial Measures” and “Reconciliations of Non-GAAP Measures” included at the end of this release.
Definitions of Non-GAAP Financial Measures
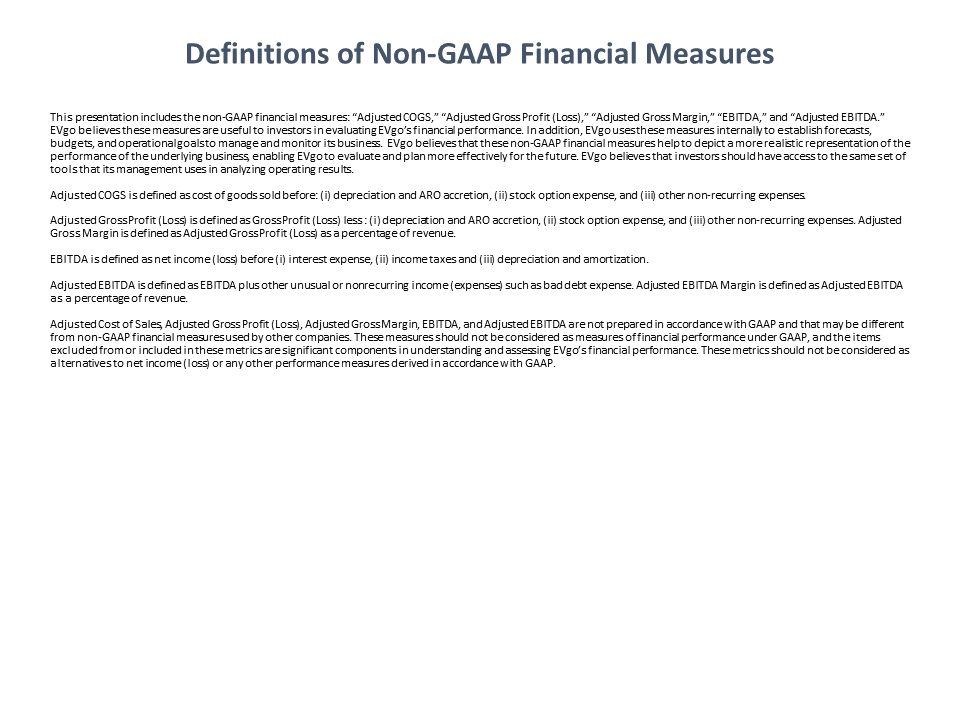
This press release includes the non-GAAP financial measures: “Adjusted COGS,” “Adjusted Gross Profit (Loss),” “Adjusted Gross Margin,” “EBITDA,” “Adjusted EBITDA.” EVgo believes these measures are useful to investors in evaluating EVgo’s financial performance. In addition, EVgo uses these measures internally to establish forecasts, budgets, and operational goals to manage and monitor its business. EVgo believes that these non-GAAP financial measures help to depict a more realistic representation of the performance of the underlying business, enabling EVgo to evaluate and plan more effectively for the future. EVgo believes that investors should have access to the same set of tools that its management uses in analyzing operating results.
Adjusted COGS is defined as cost of goods sold before: (i) depreciation and ARO accretion, (ii) stock option expense, and (iii) other non-recurring expenses. Adjusted Gross Profit (Loss) is defined as Gross Profit (Loss) less (i) depreciation and ARO accretion, (ii) stock option expense, an (iii) other non-recurring expenses. Adjusted Gross Margin is defined as Adjusted Gross Profit (Loss) as a percentage of revenue. EBITDA is defined as net income (loss) before (i) interest expense, (ii) income taxes and (iii) depreciation and amortization. Adjusted EBITDA is defined as EBITDA plus other unusual or nonrecurring income (expenses) such as bad debt expense. Adjusted EBITDA Margin is defined as Adjusted EBITDA as a percentage of revenue. Adjusted COGS, Adjusted Gross Profit (Loss), Adjusted Gross Margin, EBITDA, and Adjusted EBITDA are not prepared in accordance with GAAP and that may be different from non-GAAP financial measures used by other companies. These measures should not be considered as measures of financial performance under GAAP, and the items excluded from or included in these metrics are significant components in understanding and assessing EVgo’s financial performance. These metrics should not be considered as alternatives to net income (loss) or any other performance measures derived in accordance with GAAP.
Reconciliations of Non-GAAP Measures
| Q1 2020 | Q2 2020 | Q3 2020 | Q4 2020 | Q1 2021 | Q2 2021 | Q3 2021 | ||||||||||||||||||||||
| GAAP Gross Profit / (Loss) | $ | (1,522 | ) | $ | (2,124 | ) | $ | (2,547 | ) | $ | (2,852 | ) | $ | (1,678 | ) | $ | (1,675 | ) | $ | (1,653 | ) | |||||||
| Less: | ||||||||||||||||||||||||||||
| Site Depreciation & ARO Accretion | $ | 2,095 | $ | 2,255 | $ | 2,651 | $ | 2,528 | $ | 2,447 | $ | 2,705 | $ | 3,020 | ||||||||||||||
| Stock Option Expense and Other | (1 | ) | (13 | ) | (9 | ) | (9 | ) | (6 | ) | (6 | ) | 3 | |||||||||||||||
| Adjusted Gross Profit / (Loss) | $ | 572 | $ | 118 | $ | 95 | $ | (333 | ) | $ | 763 | $ | 1,024 | $ | 1,370 | |||||||||||||
| Q1 2020 | Q2 2020 | Q3 2020 | Q4 2020 | Q1 2021 | Q2 2021 | Q3 2021 | ||||||||||||||||||||||
| GAAP COGS | $ | 5,375 | $ | 5,081 | $ | 6,119 | $ | 7,046 | $ | 5,808 | $ | 6,458 | $ | 7,834 | ||||||||||||||
| Less: | ||||||||||||||||||||||||||||
| Site Depreciation & ARO Accretion | $ | 2,095 | $ | 2,255 | $ | 2,651 | $ | 2,528 | $ | 2,447 | $ | 2,705 | $ | 3,020 | ||||||||||||||
| Stock Option Expense and Other | (1 | ) | (13 | ) | (9 | ) | (9 | ) | (6 | ) | (6 | ) | 3 | |||||||||||||||
| Adjusted COGS | $ | 3,281 | $ | 2,839 | $ | 3,477 | $ | 4,527 | $ | 3,367 | $ | 3,759 | $ | 4,811 | ||||||||||||||
| Q1 2020 | Q2 2020 | Q3 2020 | Q4 2020 | Q1 2021 | Q2 2021 | Q3 2021 | ||||||||||||||||||||||
| Net Income | $ | (14,810 | ) | $ | (10,406 | ) | $ | (7,476 | ) | $ | (15,519 | ) | $ | (16,610 | ) | $ | (18,421 | ) | $ | 23,591 | ||||||||
| + Taxes | 8 | (1 | ) | (11 | ) | 7 | (1 | ) | 1 | – | ||||||||||||||||||
| + Depreciation, ARO, Amortization | 4,202 | 4,706 | 5,125 | 4,999 | 4,957 | 5,250 | 6,414 | |||||||||||||||||||||
| + Interest Income / Expense | 122 | 280 | 410 | 602 | 876 | 1,038 | (22 | ) | ||||||||||||||||||||
| EBITDA | $ | (10,478 | ) | $ | (5,421 | ) | $ | (1,952 | ) | $ | (9,911 | ) | $ | (10,778 | ) | $ | (12,132 | ) | $ | 29,983 | ||||||||
| + Bad Debt, Non-Recurring Costs, Other Adj. | $ | 5,783 | $ | 388 | $ | (3,455 | ) | $ | 1,089 | $ | 999 | $ | 1,123 | $ | (44,255 | ) | ||||||||||||
| Adj. EBITDA | $ | (4,695 | ) | $ | (5,033 | ) | $ | (5,407 | ) | $ | (8,822 | ) | $ | (9,779 | ) | $ | (11,009 | ) | $ | (14,272 | ) |
| Q1 2020 | Q2 2020 | Q3 2020 | Q4 2020 | Q1 2021 | Q2 2021 | Q3 2021 | ||||||||||||||||||||||
| Adjusted Gross Profit / (Loss) - As Previously Reported * | $ | (441 | ) | $ | (711 | ) | $ | (735 | ) | $ | (1,205 | ) | $ | (162 | ) | $ | (61 | ) | $ | 217 | ||||||||
| COGS Reclassification to G&A | 1,013 | 829 | 830 | 872 | 925 | 1,085 | 1,153 | |||||||||||||||||||||
| Adjusted Gross Profit / (Loss) | $ | 572 | $ | 118 | $ | 95 | $ | (333 | ) | $ | 763 | $ | 1,024 | $ | 1,370 | |||||||||||||
| * Q3 2021 computed under the original method. | ||||||||||||||||||||||||||||
Financial Statements
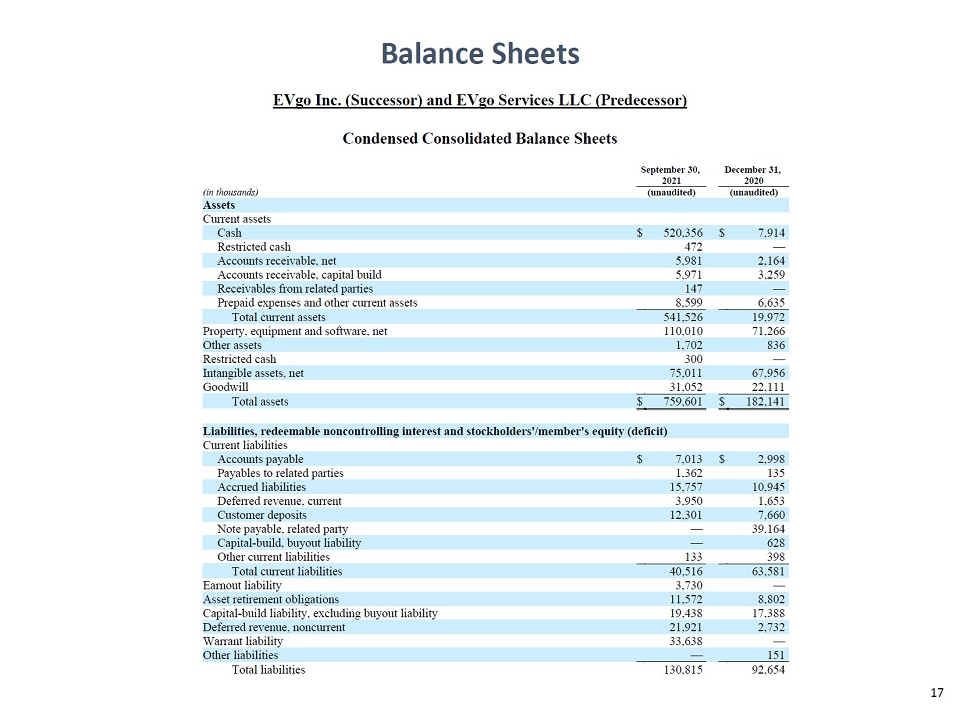
EVgo Inc. (Successor) and EVgo Services LLC (Predecessor)
Condensed Consolidated Balance Sheets
| September 30, | December 31, | |||||||
| 2021 | 2020 | |||||||
| (in thousands) | (unaudited) | (unaudited) | ||||||
| Assets | ||||||||
| Current assets | ||||||||
| Cash | $ | 520,356 | $ | 7,914 | ||||
| Restricted cash | 472 | — | ||||||
| Accounts receivable, net | 5,981 | 2,164 | ||||||
| Accounts receivable, capital build | 5,971 | 3,259 | ||||||
| Receivables from related parties | 147 | — | ||||||
| Prepaid expenses and other current assets | 8,599 | 6,635 | ||||||
| Total current assets | 541,526 | 19,972 | ||||||
| Property, equipment and software, net | 110,010 | 71,266 | ||||||
| Other assets | 1,702 | 836 | ||||||
| Restricted cash | 300 | — | ||||||
| Intangible assets, net | 75,011 | 67,956 | ||||||
| Goodwill | 31,052 | 22,111 | ||||||
| Total assets | $ | 759,601 | $ | 182,141 | ||||
| Liabilities, redeemable noncontrolling interest and stockholders'/member's equity (deficit) | ||||||||
| Current liabilities | ||||||||
| Accounts payable | $ | 7,013 | $ | 2,998 | ||||
| Payables to related parties | 1,362 | 135 | ||||||
| Accrued liabilities | 15,757 | 10,945 | ||||||
| Deferred revenue, current | 3,950 | 1,653 | ||||||
| Customer deposits | 12,301 | 7,660 | ||||||
| Note payable, related party | — | 39,164 | ||||||
| Capital-build, buyout liability | — | 628 | ||||||
| Other current liabilities | 133 | 398 | ||||||
| Total current liabilities | 40,516 | 63,581 | ||||||
| Earnout liability | 3,730 | — | ||||||
| Asset retirement obligations | 11,572 | 8,802 | ||||||
| Capital-build liability, excluding buyout liability | 19,438 | 17,388 | ||||||
| Deferred revenue, noncurrent | 21,921 | 2,732 | ||||||
| Warrant liability | 33,638 | — | ||||||
| Other liabilities | — | 151 | ||||||
| Total liabilities | 130,815 | 92,654 | ||||||
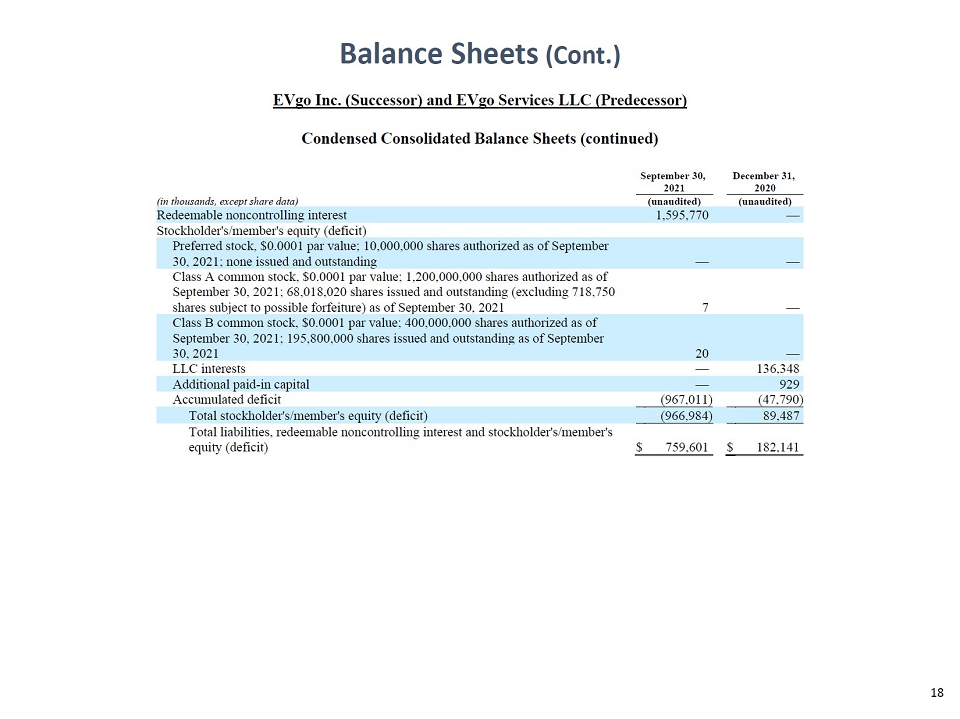
EVgo Inc. (Successor) and EVgo Services LLC (Predecessor)
Condensed Consolidated Balance Sheets (continued)
| September 30, | December 31, | |||||||
| 2021 | 2020 | |||||||
| (in thousands, except share data) | (unaudited) | (unaudited) | ||||||
| Redeemable noncontrolling interest | 1,595,770 | — | ||||||
| Stockholder's/member's equity (deficit) | ||||||||
| Preferred stock, $0.0001 par value; 10,000,000 shares authorized as of September 30, 2021; none issued and outstanding | — | — | ||||||
| Class A common stock, $0.0001 par value; 1,200,000,000 shares authorized as of September 30, 2021; 68,018,020 shares issued and outstanding (excluding 718,750 shares subject to possible forfeiture) as of September 30, 2021 | 7 | — | ||||||
| Class B common stock, $0.0001 par value; 400,000,000 shares authorized as of September 30, 2021; 195,800,000 shares issued and outstanding as of September 30, 2021 | 20 | — | ||||||
| LLC interests | — | 136,348 | ||||||
| Additional paid-in capital | — | 929 | ||||||
| Accumulated deficit | (967,011 | ) | (47,790 | ) | ||||
| Total stockholder's/member's equity (deficit) | (966,984 | ) | 89,487 | |||||
| Total liabilities, redeemable noncontrolling interest and stockholder's/member's equity (deficit) | $ | 759,601 | $ | 182,141 | ||||
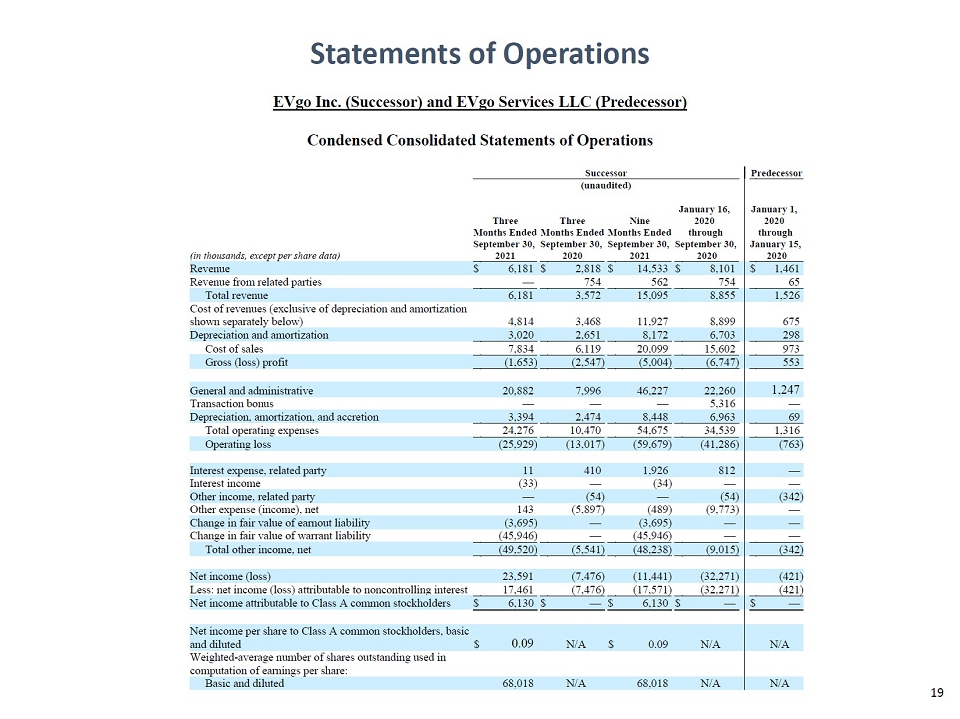
EVgo Inc. (Successor) and EVgo Services LLC (Predecessor)
Condensed Consolidated Statements of Operations
| Successor | Predecessor | |||||||||||||||||||
| (unaudited) | ||||||||||||||||||||
| January 16, | January 1, | |||||||||||||||||||
| Three | Three | Nine | 2020 | 2020 | ||||||||||||||||
| Months Ended | Months Ended | Months Ended | through | through | ||||||||||||||||
| September 30, | September 30, | September 30, | September 30, | January 15, | ||||||||||||||||
| (in thousands, except per share data) | 2021 | 2020 | 2021 | 2020 | 2020 | |||||||||||||||
| Revenue | $ | 6,181 | $ | 2,818 | $ | 14,533 | $ | 8,101 | $ | 1,461 | ||||||||||
| Revenue from related parties | — | 754 | 562 | 754 | 65 | |||||||||||||||
| Total revenue | 6,181 | 3,572 | 15,095 | 8,855 | 1,526 | |||||||||||||||
| Cost of revenues (exclusive of depreciation and amortization shown separately below) | 4,814 | 3,468 | 11,927 | 8,899 | 675 | |||||||||||||||
| Depreciation and amortization | 3,020 | 2,651 | 8,172 | 6,703 | 298 | |||||||||||||||
| Cost of sales | 7,834 | 6,119 | 20,099 | 15,602 | 973 | |||||||||||||||
| Gross (loss) profit | (1,653 | ) | (2,547 | ) | (5,004 | ) | (6,747 | ) | 553 | |||||||||||
| General and administrative | 20,882 | 7,996 | 46,227 | 22,260 | 1,247 | |||||||||||||||
| Transaction bonus | — | — | — | 5,316 | — | |||||||||||||||
| Depreciation, amortization, and accretion | 3,394 | 2,474 | 8,448 | 6,963 | 69 | |||||||||||||||
| Total operating expenses | 24,276 | 10,470 | 54,675 | 34,539 | 1,316 | |||||||||||||||
| Operating loss | (25,929 | ) | (13,017 | ) | (59,679 | ) | (41,286 | ) | (763 | ) | ||||||||||
| Interest expense, related party | 11 | 410 | 1,926 | 812 | — | |||||||||||||||
| Interest income | (33 | ) | — | (34 | ) | — | — | |||||||||||||
| Other income, related party | — | (54 | ) | — | (54 | ) | (342 | ) | ||||||||||||
| Other expense (income), net | 143 | (5,897 | ) | (489 | ) | (9,773 | ) | — | ||||||||||||
| Change in fair value of earnout liability | (3,695 | ) | — | (3,695 | ) | — | — | |||||||||||||
| Change in fair value of warrant liability | (45,946 | ) | — | (45,946 | ) | — | — | |||||||||||||
| Total other income, net | (49,520 | ) | (5,541 | ) | (48,238 | ) | (9,015 | ) | (342 | ) | ||||||||||
| Net income (loss) | 23,591 | (7,476 | ) | (11,441 | ) | (32,271 | ) | (421 | ) | |||||||||||
| Less: net income (loss) attributable to noncontrolling interest | 17,461 | (7,476 | ) | (17,571 | ) | (32,271 | ) | (421 | ) | |||||||||||
| Net income attributable to Class A common stockholders | $ | 6,130 | $ | — | $ | 6,130 | $ | — | $ | — | ||||||||||
| Net income per share to Class A common stockholders, basic and diluted | $ | 0.09 | N/A | $ | 0.09 | N/A | N/A | |||||||||||||
| Weighted-average shares used in computation of earnings per share: | ||||||||||||||||||||
| Basic and diluted | 68,018 | N/A | 68,018 | N/A | N/A | |||||||||||||||
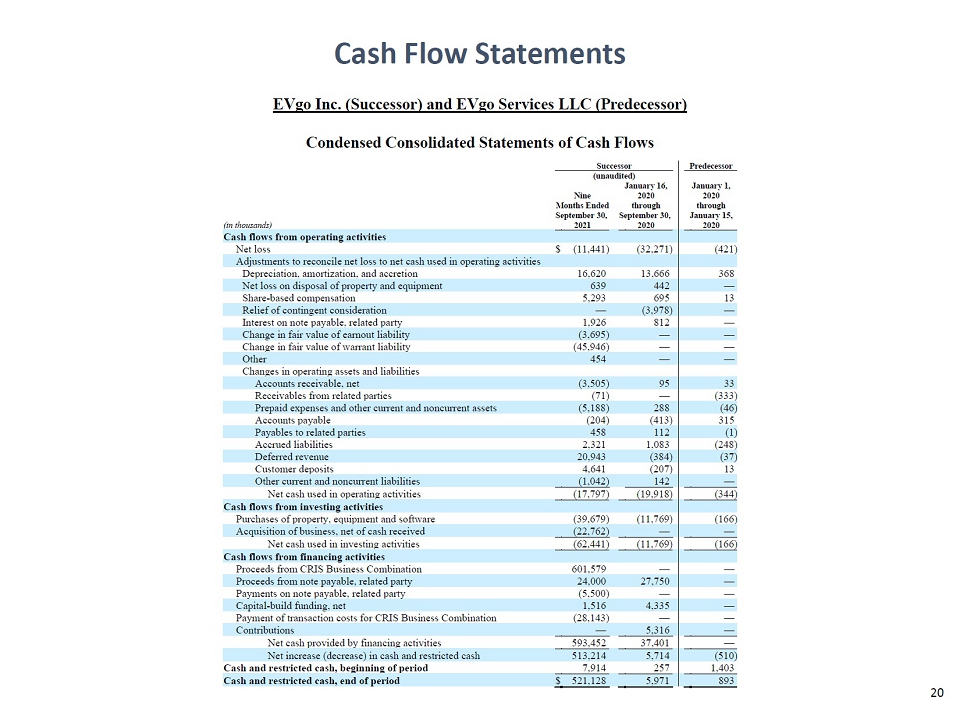
EVgo Inc. (Successor) and EVgo Services LLC (Predecessor)
Condensed Consolidated Statements of Cash Flows
| Successor | Predecessor | |||||||||||
| (unaudited) | ||||||||||||
| January 16, | January 1, | |||||||||||
| Nine | 2020 | 2020 | ||||||||||
| Months Ended | through | through | ||||||||||
| September 30, | September 30, | January 15, | ||||||||||
| (in thousands) | 2021 | 2020 | 2020 | |||||||||
| Cash flows from operating activities | ||||||||||||
| Net loss | $ | (11,441 | ) | (32,271 | ) | (421 | ) | |||||
| Adjustments to reconcile net loss to net cash used in operating activities | ||||||||||||
| Depreciation, amortization, and accretion | 16,620 | 13,666 | 368 | |||||||||
| Net loss on disposal of property and equipment | 639 | 442 | — | |||||||||
| Share-based compensation | 5,293 | 695 | 13 | |||||||||
| Relief of contingent consideration | — | (3,978 | ) | — | ||||||||
| Interest on note payable, related party | 1,926 | 812 | — | |||||||||
| Change in fair value of earnout liability | (3,695 | ) | — | — | ||||||||
| Change in fair value of warrant liability | (45,946 | ) | — | — | ||||||||
| Other | 454 | — | — | |||||||||
| Changes in operating assets and liabilities | ||||||||||||
| Accounts receivable, net | (3,505 | ) | 95 | 33 | ||||||||
| Receivables from related parties | (71 | ) | — | (333 | ) | |||||||
| Prepaid expenses and other current and noncurrent assets | (5,188 | ) | 288 | (46 | ) | |||||||
| Accounts payable | (204 | ) | (413 | ) | 315 | |||||||
| Payables to related parties | 458 | 112 | (1 | ) | ||||||||
| Accrued liabilities | 2,321 | 1,083 | (248 | ) | ||||||||
| Deferred revenue | 20,943 | (384 | ) | (37 | ) | |||||||
| Customer deposits | 4,641 | (207 | ) | 13 | ||||||||
| Other current and noncurrent liabilities | (1,042 | ) | 142 | — | ||||||||
| Net cash used in operating activities | (17,797 | ) | (19,918 | ) | (344 | ) | ||||||
| Cash flows from investing activities | ||||||||||||
| Purchases of property, equipment and software | (39,679 | ) | (11,769 | ) | (166 | ) | ||||||
| Acquisition of business, net of cash received | (22,762 | ) | — | — | ||||||||
| Net cash used in investing activities | (62,441 | ) | (11,769 | ) | (166 | ) | ||||||
| Cash flows from financing activities | ||||||||||||
| Proceeds from CRIS Business Combination | 601,579 | — | — | |||||||||
| Proceeds from note payable, related party | 24,000 | 27,750 | — | |||||||||
| Payments on note payable, related party | (5,500 | ) | — | — | ||||||||
| Capital-build funding, net | 1,516 | 4,335 | — | |||||||||
| Payment of transaction costs for CRIS Business Combination | (28,143 | ) | — | — | ||||||||
| Contributions | — | 5,316 | — | |||||||||
| Net cash provided by financing activities | 593,452 | 37,401 | — | |||||||||
| Net increase (decrease) in cash and restricted cash | 513,214 | 5,714 | (510 | ) | ||||||||
| Cash and restricted cash, beginning of period | 7,914 | 257 | 1,403 | |||||||||
| Cash and restricted cash, end of period | $ | 521,128 | 5,971 | 893 | ||||||||
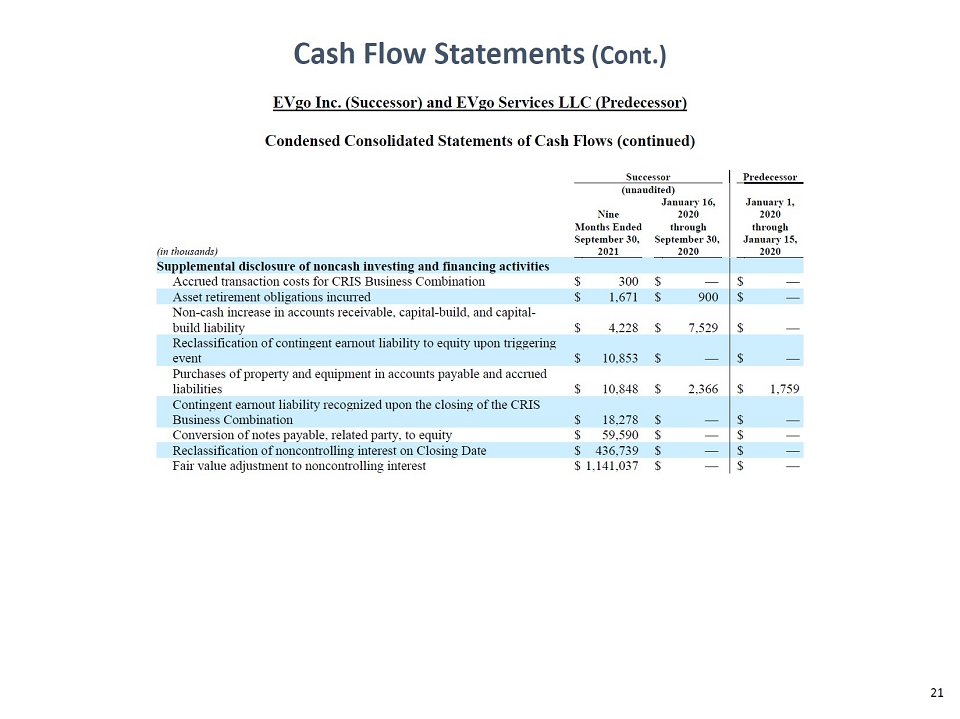
EVgo Inc. (Successor) and EVgo Services LLC (Predecessor)
Condensed Consolidated Statements of Cash Flows (continued)
| Successor | Predecessor | |||||||||||
| (unaudited) | ||||||||||||
| January 16, | January 1, | |||||||||||
| Nine | 2020 | 2020 | ||||||||||
| Months Ended | through | through | ||||||||||
| September 30, | September 30, | January 15, | ||||||||||
| (in thousands) | 2021 | 2020 | 2020 | |||||||||
| Supplemental disclosure of noncash investing and financing activities | ||||||||||||
| Accrued transaction costs for CRIS Business Combination | $ | 300 | $ | — | $ | — | ||||||
| Asset retirement obligations incurred | $ | 1,671 | $ | 900 | $ | — | ||||||
| Non-cash increase in accounts receivable, capital-build, and capital-build liability | $ | 4,228 | $ | 7,529 | $ | — | ||||||
| Reclassification of contingent earnout liability to equity upon triggering event | $ | 10,853 | $ | — | $ | — | ||||||
| Purchases of property and equipment in accounts payable and accrued liabilities | $ | 10,848 | $ | 2,366 | $ | 1,759 | ||||||
| Contingent earnout liability recognized upon the closing of the CRIS Business Combination | $ | 18,278 | $ | — | $ | — | ||||||
| Conversion of notes payable, related party, to equity | $ | 59,590 | $ | — | $ | — | ||||||
| Reclassification of noncontrolling interest on Closing Date | $ | 436,739 | $ | — | $ | — | ||||||
| Fair value adjustment to noncontrolling interest | $ | 1,141,037 | $ | — | $ | — | ||||||
EVgo
For investors:
Ted Brooks, VP of Investor Relations
investors.evgo.com
310-954-2943
For Media:
[email protected]
Source: EVgo Inc.