Exhibit 99.1

EVgo Inc. Reports Fourth Quarter and Full-Year 2021 Results
| ● | 2021 Revenue increased by 52% year-over-year |
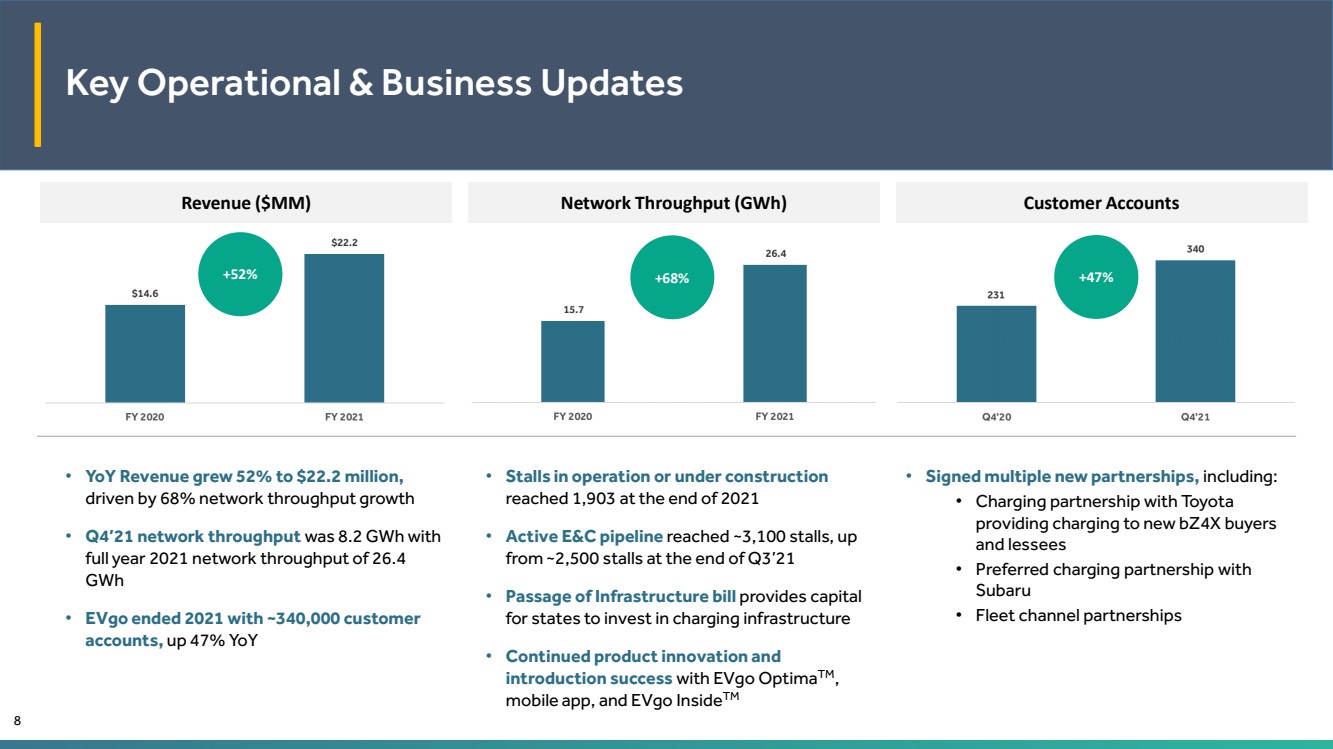
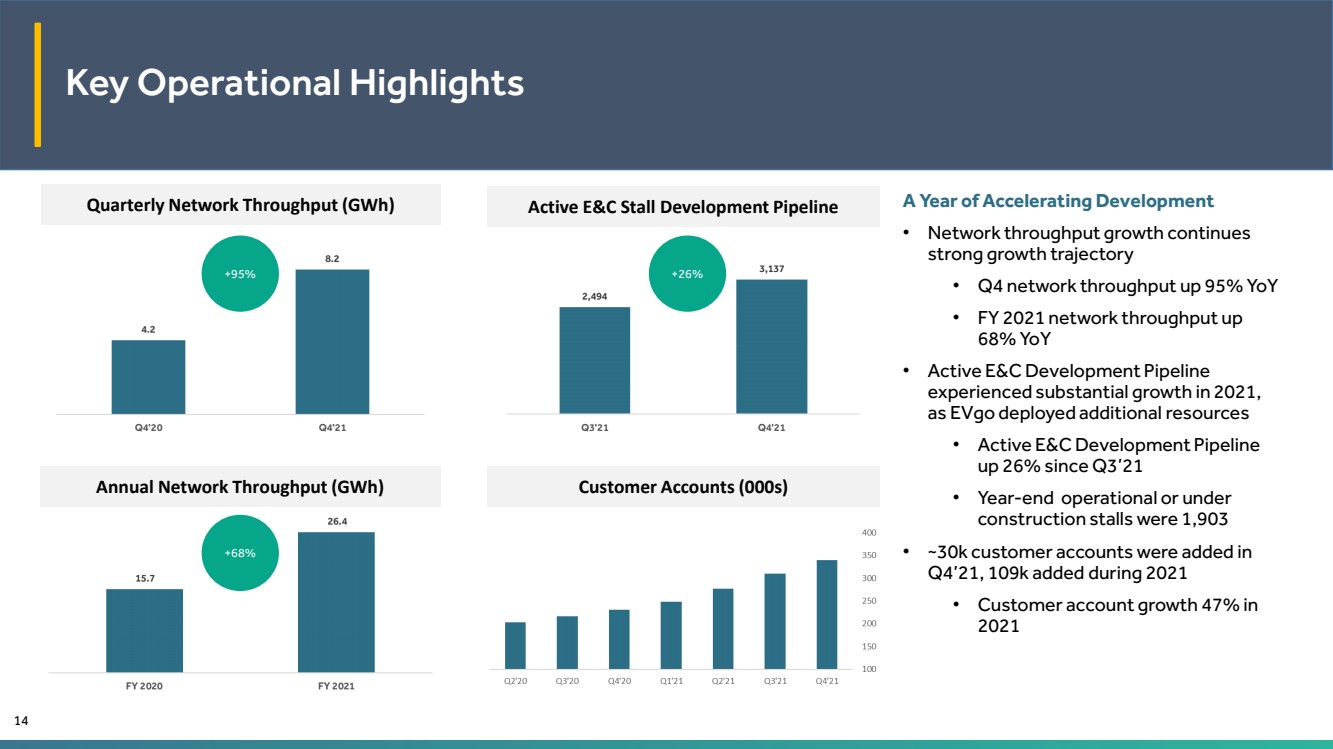
| ● | Network throughput in 2021 rose to 26.4 Gigawatt-hours (GWh), a 68% increase over prior year |
| ● | GAAP gross loss narrowed in 2021 to ($6.8) million from ($9.0) million in 2020 |
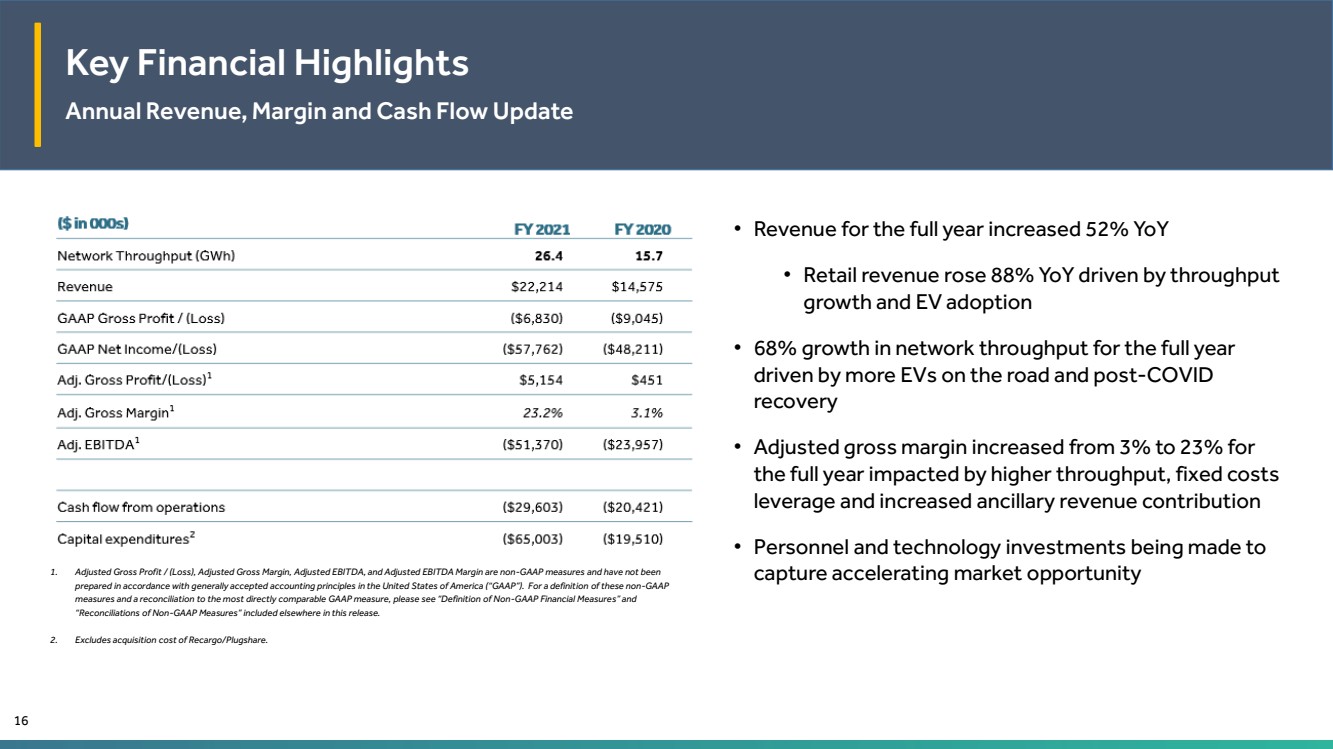
| ● | Adjusted gross profit grew to $5.2 million for full-year 2021 compared to $0.5 million in 2020, and adjusted gross margin grew from 3% in 2020 to 23% in 2021, demonstrating operating leverage in the model from increasing vehicles in operation and throughput |
| ● | Ended year with approximately 340,000 customer accounts, marking an approximate 109,000 year-over-year increase, equating to approximately 80% of non-Tesla US EV sales |
| ● | Active Engineering and Construction pipeline increased to more than 3,100 fast charging stalls as of year-end 2021 vs approximately 2,500 at the year-end of Q3 2021 |
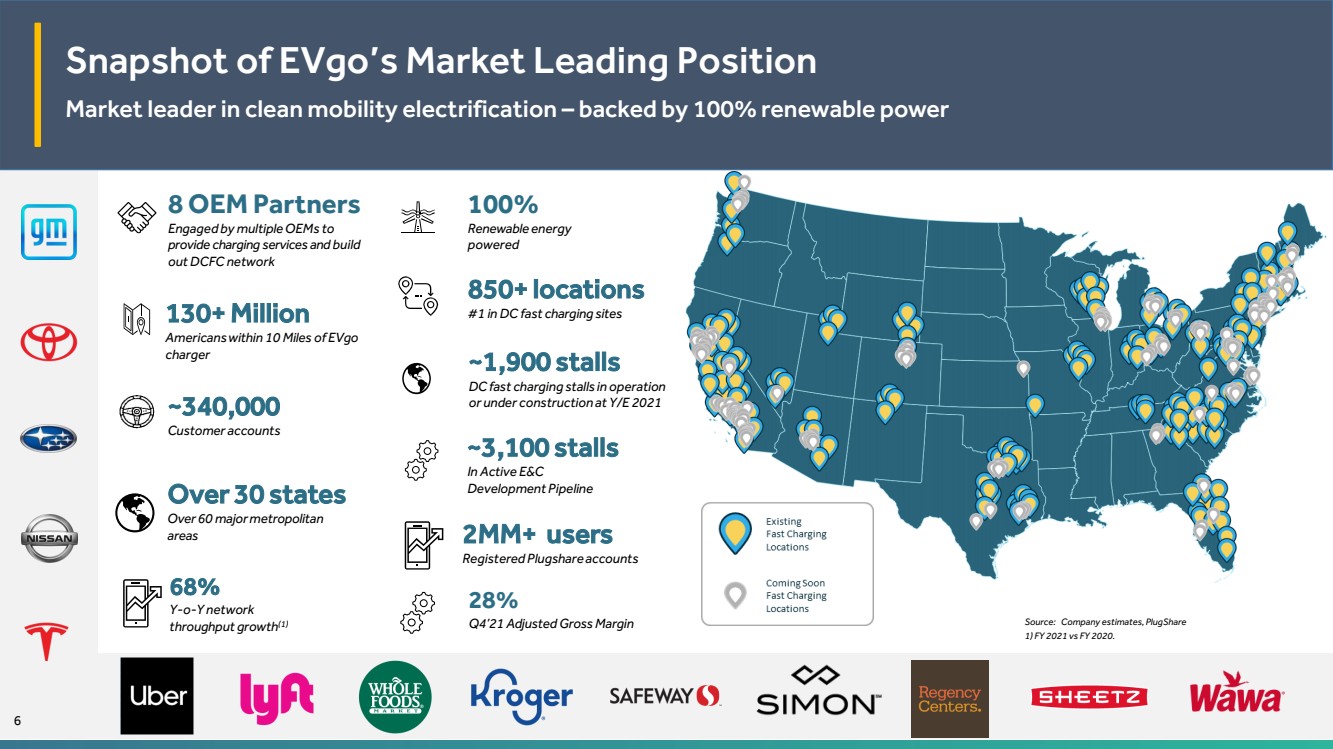
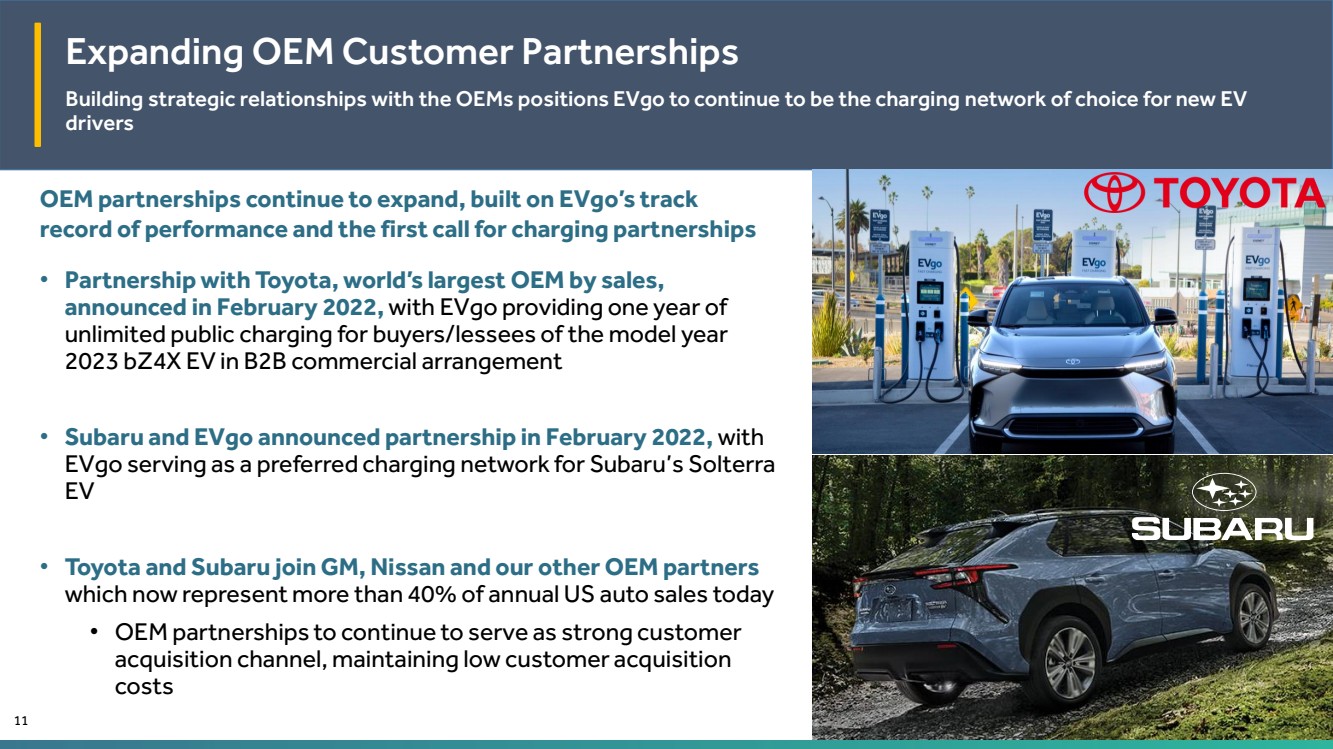
| ● | Recently announced new charging partnerships with Toyota and Subaru |
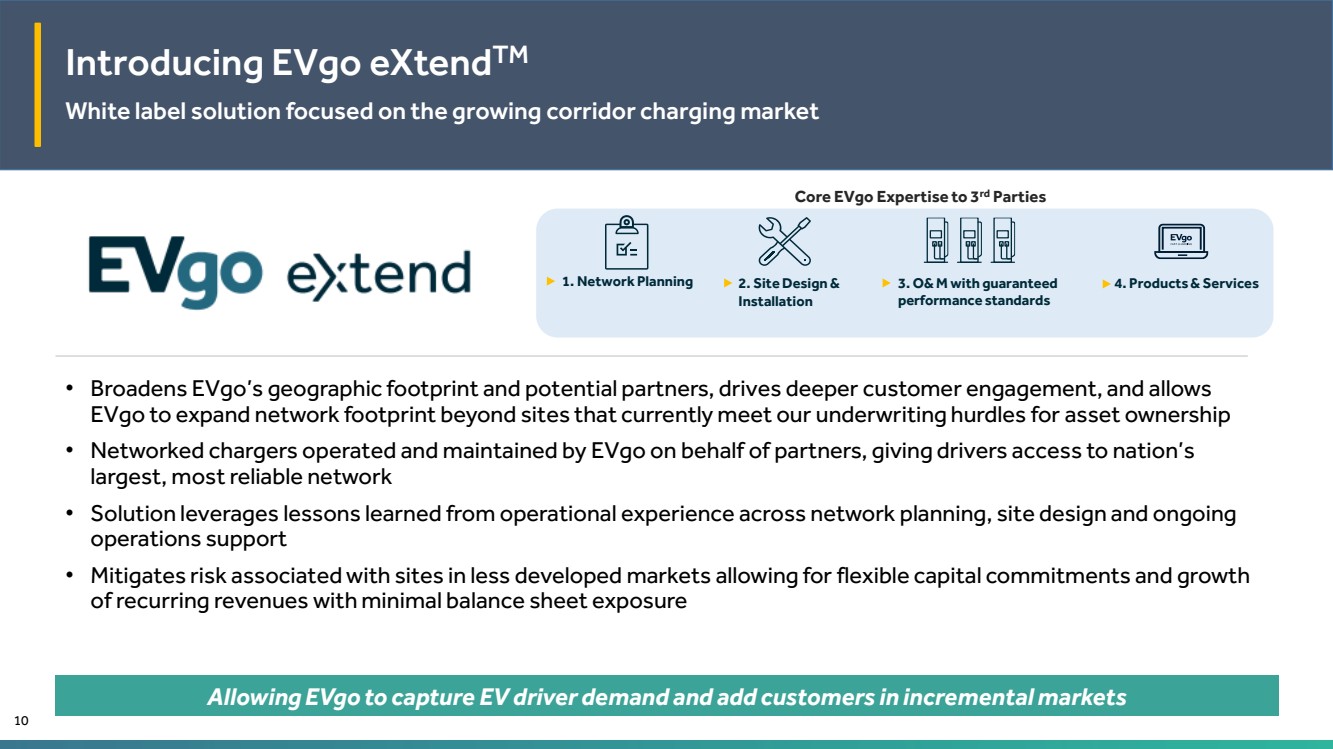
●Introduced EVgo eXtendTM business line to increase customer and geographic expansion
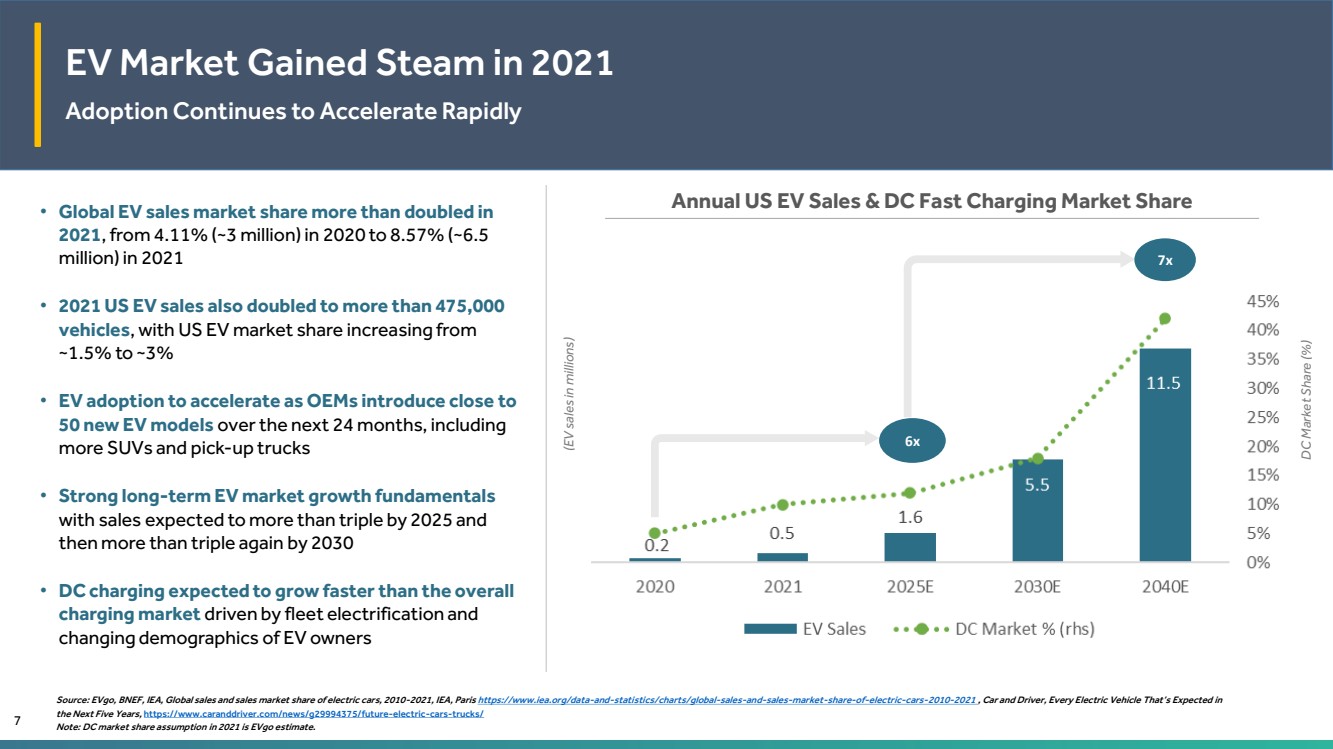
Los Angeles, CA, March 23, 2022 – EVgo Inc. (Nasdaq: EVGO) (“EVgo” or the “Company”) today announced results for the fourth quarter and full-year 2021 ending December 31, 2021. The Company generated continued growth in revenue, network throughput and customer accounts. EV adoption has accelerated with approximately 142,000 EVs sold in the U.S. during the fourth quarter of 2021 and were approximately 475,000 in full year 2021, illustrating the continued expansion of the EV sector and bringing more drivers onto the EVgo network.
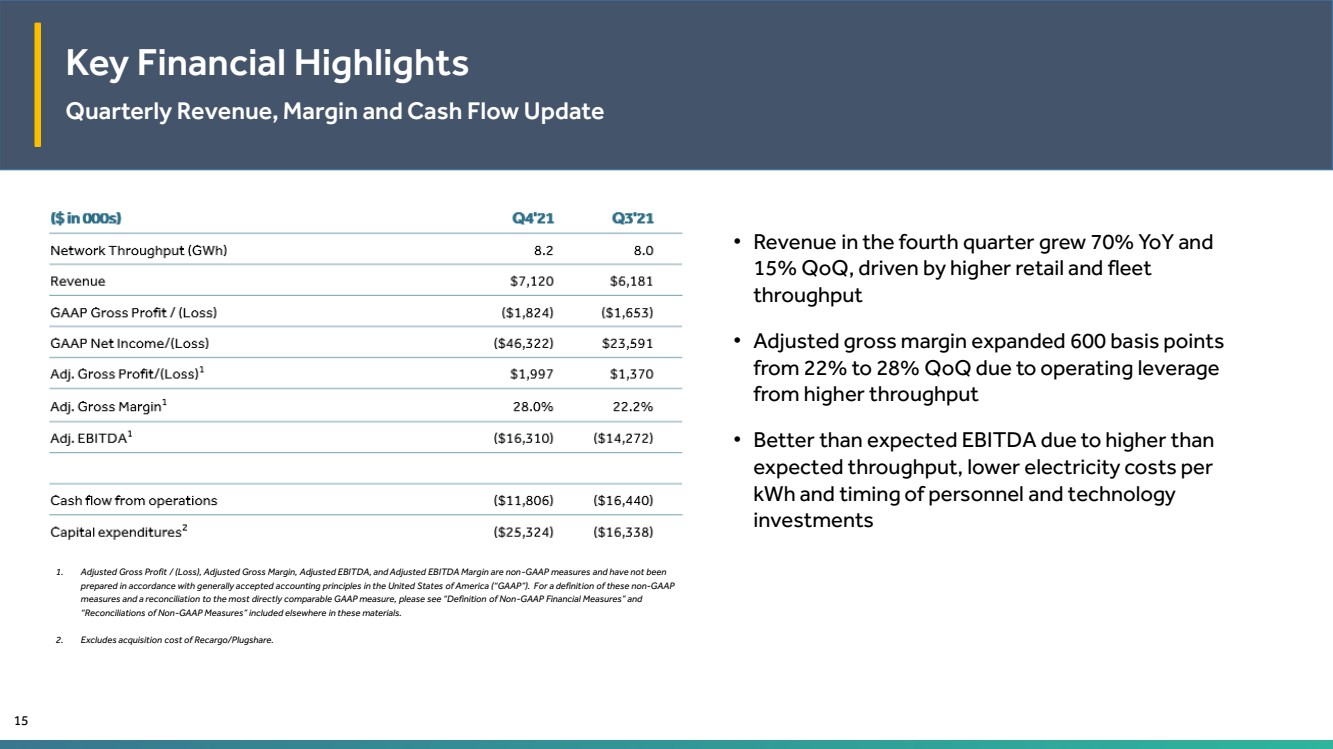
Revenue increased to $7.1 million for the fourth quarter of 2021, compared to $4.2 million in the fourth quarter of 2020, exhibiting 70% year-over-year growth, and compared to $6.2 million for the third quarter of 2021, exhibiting 15% quarter-over-quarter growth. For full-year 2021, revenue increased to $22.2 million, compared to $14.6 million for full-year 2020, reflecting an increase of 52% year-over-year.
Network throughput increased to 8.2 GWh for the fourth quarter of 2021, compared to 4.2 GWh in the fourth quarter of 2020, exhibiting 95% year-over-year growth. For full-year 2021, network throughput reached 26.4 GWh, reflecting growth of 68% year-over-year. Total customer accounts grew to approximately 340,000 as of December 31, 2021, an increase of 47% over the prior-year period.
“EVgo finished 2021 strong, with momentum in revenue growth, customer acquisition and station development,” Cathy Zoi, EVgo’s CEO, stated. “Our expanding suite of charging partnerships with blue chip partners demonstrates not only the acceleration toward an electrified transportation future, but also the strength and differentiation of EVgo’s model. Our 12-year history as a pioneer in the fast-charging space, our commitment to technology-enabled innovation to enhance the EV charging experience for EV drivers, automakers, fleets and retailers, and EVgo’s leadership in ESG are positioning EVgo to continue to deepen and expand our business into a plethora of lucrative opportunities in the rapidly growing space.”
1
Business Highlights
| ● | Toyota Charging Program: In February 2022, EVgo and Toyota, the world’s largest automaker, announced a charging credit relationship that will provide charging benefits at EVgo charging stalls for customers who buy or lease Toyota’s new EV, the bZ4X. Toyota expects the first bZ4X models to be available in 2022. |
| ● | Subaru Charging Program: In February 2022, EVgo and Subaru announced a preferred charging credit relationship that will provide EVgo charging credits for customers of Subaru’s new SUV EV, the Solterra. The Solterra is expected to be introduced in 2022. |
| ● | Introduced EVgo eXtend: White label charging solution to capture growing public charging demand in corridors and less urban areas currently underserved by the charging market while retaining attractive return potential |
| ● | PlugShare User Growth: PlugShare continues to grow as the world’s largest user-generated EV charging platform, surpassing 2 million registered users for the first time, with 1 million downloads in 2021. |
Financial & Operational Highlights
The below represent summary financial and operational figures for the fourth quarter of 2021.
| ● | Revenue of $7.1 million |
| ● | Network throughput of 8.2 gigawatt-hours |
| ● | Gross loss of $1.8 million |
| ● | Net loss of $46.3 million |
| ● | Adjusted gross profit of $2.0 million |
| ● | Adjusted EBITDA of ($16.3) million |
| ● | Cash Flow from Operations of ($11.8) million for the fourth quarter of 2021 |
| ● | Capital Expenditures of $25.3 million for the fourth quarter of 2021 |
The below represent summary financial and operational figures for full-year 2021.
| ● | Revenue of $22.2 million |
| ● | Network throughput of 26.4 gigawatt-hours |
| ● | Customer account additions of approximately 109,000 accounts |
| ● | Gross loss of $6.8 million |
| ● | Net loss of $57.8 million |
| ● | Adjusted gross profit of $5.2 million |
2
| ● | Adjusted EBITDA of ($51.4) million |
| ● | Cash Flow from Operations of ($29.6) million for full-year 2021 |
| ● | Capital Expenditures of $65.0 million for full-year 2021 |
| | | | |
($ in 000s) | Q4'21 | Q3'21 | FY 2021 | FY 2020 |
| | | | |
Network Throughput (GWh) | 8.2 | 8.0 | 26.4 | 15.7 |
Revenue | $7,120 | $6,181 | $22,214 | $14,575 |
GAAP Gross Profit / (Loss) | ($1,824) | ($1,653) | ($6,830) | ($9,045) |
GAAP Net Income/(Loss) | ($46,322) | $23,591 | ($57,762) | ($48,211) |
Adj. Gross Profit/(Loss)1 | $1,997 | $1,370 | $5,154 | $451 |
Adj. Gross Margin1 | 28.0% | 22.2% | 23.2% | 3.1% |
Adj. EBITDA1 | ($16,310) | ($14,272) | ($51,370) | ($23,957) |
| | | | |
| Q4'21 | Q3'21 | FY 2021 | FY 2020 |
Cash flow from operations | ($11,806) | ($16,440) | ($29,603) | ($20,421) |
Capital expenditures2 | ($25,324) | ($16,338) | ($65,003) | ($19,510) |
1. Adjusted Gross Profit / (Loss), Adjusted Gross Margin, Adjusted EBITDA, and Adjusted EBITDA Margin are non-GAAP measures and have not been prepared in accordance with Generally Accepted Accounting Principles in the United States of America (“GAAP”). For a definition of these non-GAAP measures and a reconciliation to the most directly comparable GAAP measure, please see “Definition of non-GAAP Financial Measures” and “Reconciliation of non-GAAP Measures” included elsewhere in this release.
2. Excludes acquisition cost of Recargo/PlugShare.
2022 Financial & Operating Guidance
EVgo is introducing full-year 2022 guidance as follows:
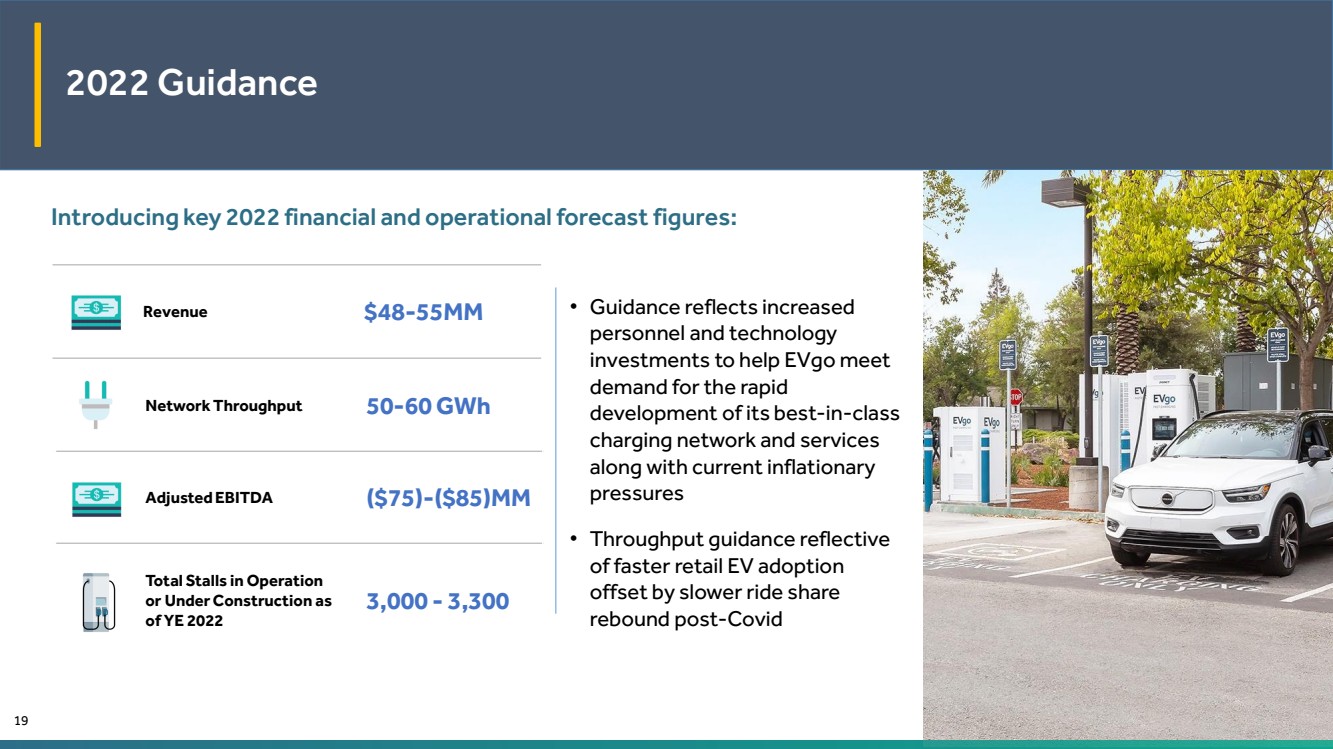
| ● | Total revenue of $48 – $55 million |
| ● | Network throughput of 50 – 60 GWh |
| ● | Adjusted EBITDA of ($75) – ($85) million |
Additionally, EVgo is initiating stall target guidance: at the year-end of 2022, EVgo expects to have a total of 3,000 – 3,300 DC fast charging stalls operational or under construction.
“As demonstrated by our recent partnership announcements, we continue to see substantial interest in EVgo’s market-leading solutions and are prioritizing the rapid expansion of our best-in-class charging network and services,” said Olga Shevorenkova, EVgo’s CFO. “Such a market opportunity necessitates the investments we are making both into SG&A and capex, with a continued focus on a prudent capital allocation practices and long-term value creation of the business. We believe the investments we are making will deliver substantial returns as EV adoption accelerates throughout the decade.”
3
Conference Call Information
A live audio webcast and conference call for our fourth quarter and year-end 2021 earnings release will be held at 11:00 AM ET / 8:00 AM PT on March 23, 2022. The webcast will be available at investors.evgo.com, and the dial-in information for those wishing to access via phone is:
Toll Free: 877-407-4018
Toll/International: 201-689-8471
Conference ID: 13726739
This press release, along with other investor materials, including a slide presentation and reconciliations of certain non-GAAP measures to their nearest GAAP measures, will also be available on that site.
About EVgo
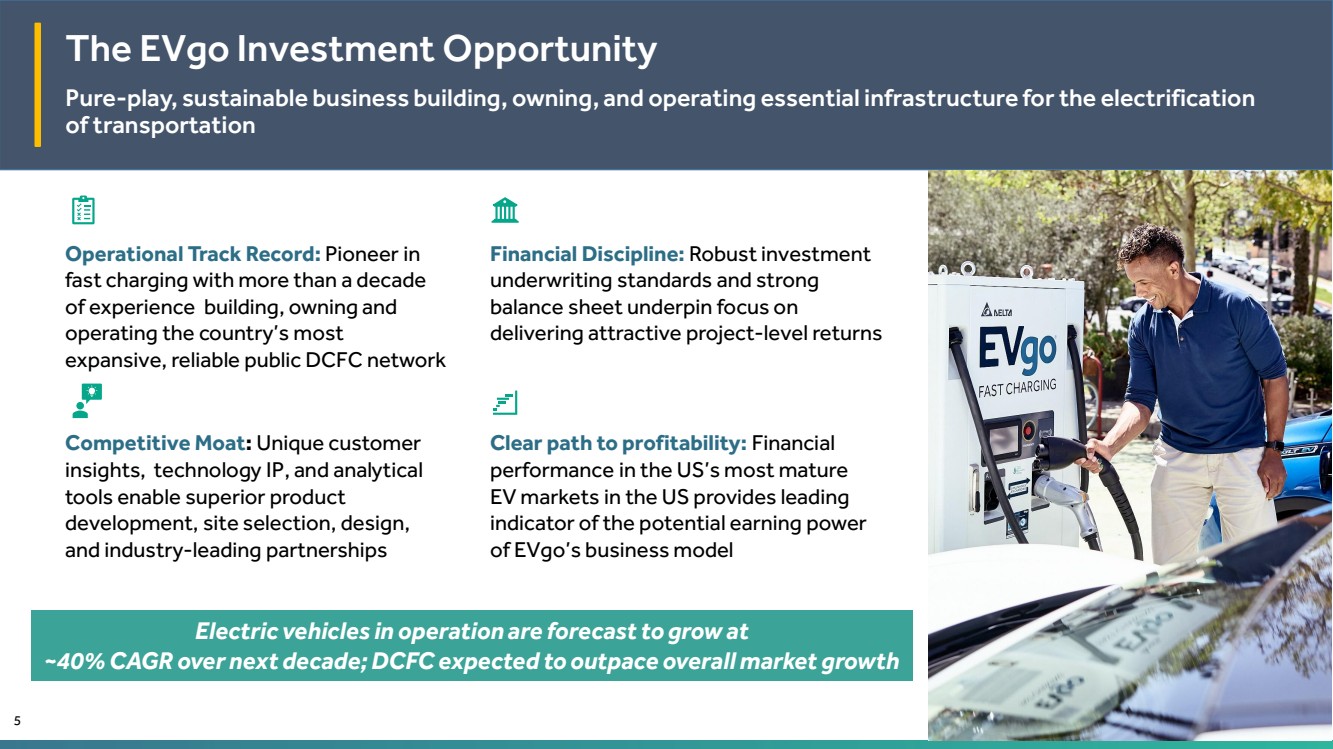
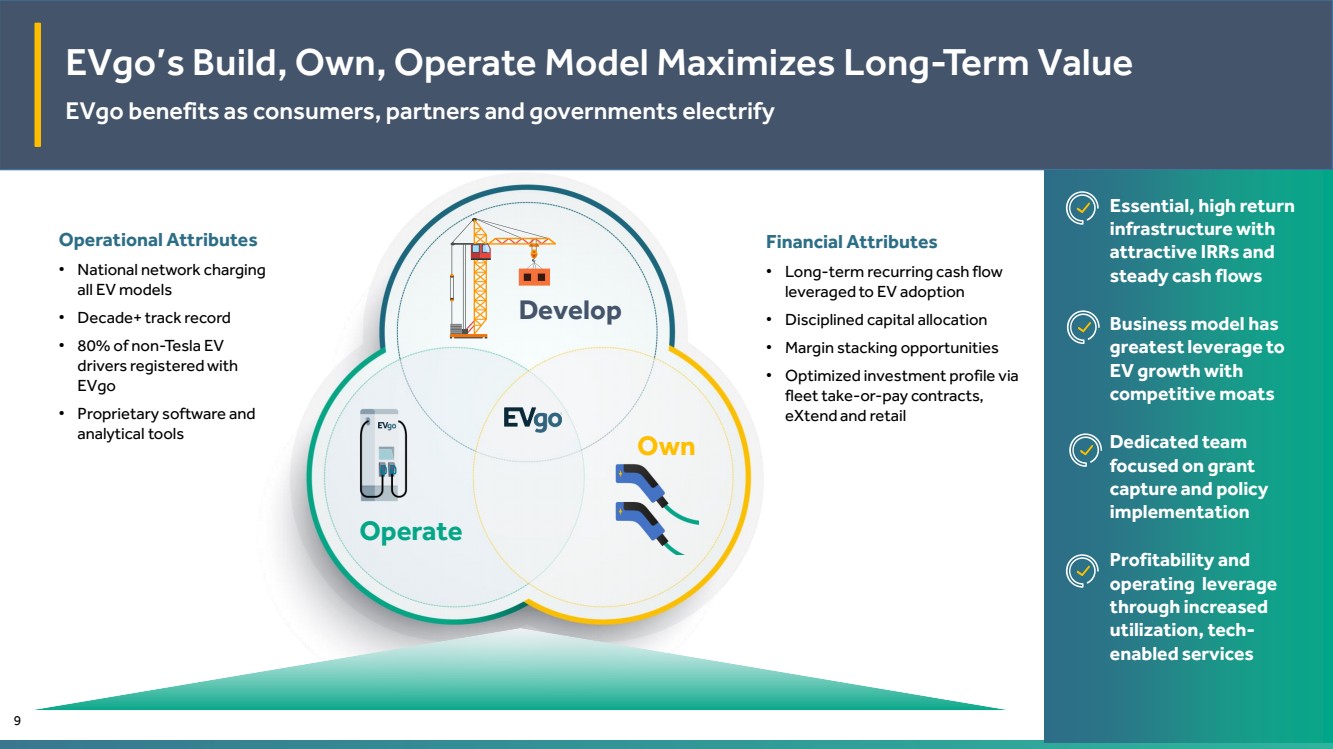
EVgo (Nasdaq: EVGO) is the nation’s largest public fast charging network for electric vehicles, and the first to be powered by 100% renewable energy. As of year-end 2021, with more than 850 charging locations, EVgo’s owned and operated charging network serves over 60 metropolitan areas across more than 30 states and approximately 340,000 customer accounts. Founded in 2010, EVgo leads the way on transportation electrification, partnering with automakers; fleet and rideshare operators; retail hosts such as hotels, shopping centers, gas stations and parking lot operators; and other stakeholders to deploy advanced charging technology to expand network availability and make it easier for drivers across the U.S. to enjoy the benefits of driving an EV. As a charging technology first mover, EVgo works closely with business and government leaders to accelerate the ubiquitous adoption of EVs by providing a reliable and convenient charging experience close to where drivers live, work and play, whether for a daily commute or a commercial fleet.
Forward-Looking Statements
This press release contains “forward-looking statements” within the meaning of the "safe harbor" provisions of the United States Private Securities Litigation Reform Act of 1995. Forward-looking statements may be identified by the use of words such as "estimate," "plan," "project," "forecast," "intend," "will," "expect," "anticipate," "believe," "seek," "target" or other similar expressions that predict or indicate future events or trends or that are not statements of historical matters. These forward-looking statements are based on management’s current expectations or beliefs and are subject to numerous assumptions, risks and uncertainties that could cause actual results to differ materially from those described in the forward-looking statements. These forward-looking statements include, but are not limited to, express or implied statements regarding EVgo’s future financial performance, revenues and capital expenditures, EVgo’s expectation of acceleration in our business due to factors including a re-opening economy and increased EV adoption; and the Company’s strong liquidity position enabling effective deployment of chargers. These statements are based on various assumptions, whether or not identified in this press release, and on the current expectations of EVgo’s management and are not predictions of actual performance. There are a significant number of factors that could cause actual results to differ materially from the statements made in this press release, including: changes or developments in the broader general market; ongoing impact from COVID-19 on our business, customers, and suppliers; macro political, economic, and business conditions; our limited operating history as a public company; our dependence on widespread adoption of EVs and increased installation of charging station; mechanisms surrounding energy and non-energy costs for our charging stations; the impact of governmental support and mandates that could reduce, modify, or eliminate financial incentives, rebates,
4
and tax credits; supply chain interruptions; impediments to our expansion plans; the need to attract additional fleet operators as customers; potential adverse effects on our revenue and gross margins if customers increasingly claim clean energy credits and, as a result, they are no longer available to be claimed by us; the effects of competition; risks related to our dependence on our intellectual property; and risks that our technology could have undetected defects or errors. Additional risks and uncertainties that could affect our financial results are included under the captions “Risk Factors” and “Management’s Discussion and Analysis of Financial Condition and Results of Operations of EVgo” in EVgo’s registration statement on Form S-1 originally filed with the Securities and Exchange Commission (the “SEC”) on July 20, 2021, as well as its other filings with the SEC, copies of which are available on EVgo’s website at investors.evgo.com, and on the SEC’s website at www.sec.gov. All forward-looking statements in this press release are based on information available to us as of the date hereof, and we do not assume any obligation to update the forward-looking statements provided to reflect events that occur or circumstances that exist after the date on which they were made, except as required by applicable law.
Use of Non-GAAP Financial Measures
To supplement EVgo’s financial information, which is prepared and presented in accordance with GAAP, EVgo uses certain non-GAAP financial measures. The presentation of non-GAAP financial measures is not intended to be considered in isolation or as a substitute for, or superior to, the financial information prepared and presented in accordance with GAAP. EVgo uses these non-GAAP financial measures for financial and operational decision-making and as a means to evaluate period-to-period comparisons. EVgo believes that these non-GAAP financial measures provide meaningful supplemental information regarding the Company’s performance by excluding certain items that may not be indicative of EVgo’s recurring core business operating results.
EVgo believes that both management and investors benefit from referring to these non-GAAP financial measures in assessing EVgo’s performance. These non-GAAP financial measures also facilitate management’s internal comparisons to the Company’s historical performance. EVgo believes these non-GAAP financial measures are useful to investors both because (1) they allow for greater transparency with respect to key metrics used by management in its financial and operational decision-making and (2) they are used by EVgo’s institutional investors and the analyst community to help them analyze the health of EVgo’s business.
For more information on these non-GAAP financial measures, including reconciliations to the most comparable GAAP measures, please see the sections titled “Definitions of Non-GAAP Financial Measures” and “Reconciliations of Non-GAAP Measures” included at the end of this release.
Definitions of Non-GAAP Financial Measures
This press release includes the non-GAAP financial measures: “Adjusted COGS,” “Adjusted Gross Profit (Loss),” “Adjusted Gross Margin,” “EBITDA,” “Adjusted EBITDA,” and “Adjusted EBITDA Margin.” EVgo believes these measures are useful to investors in evaluating EVgo’s financial performance. In addition, EVgo uses these measures internally to establish forecasts, budgets, and operational goals to manage and monitor its business. EVgo believes that these non-GAAP financial measures help to depict a more realistic representation of the performance of the underlying business, enabling EVgo to evaluate and plan more effectively for the future. EVgo believes that investors should have access to the same set of tools that its management uses in analyzing operating results.
5
Adjusted Cost of Sales, Adjusted Gross Profit (Loss), Adjusted Gross Margin, EBITDA and Adjusted EBITDA. EVgo defines Adjusted Cost of Sales as cost of sales before: (i) depreciation and amortization, (ii) share-based compensation, and (iii) O&M reimbursement. Adjusted Gross Profit (Loss) is defined as revenues less Adjusted Cost of Sales. Adjusted Gross Margin is defined as Adjusted Gross Profit (Loss) as a percentage of revenues. EVgo defines EBITDA as net income (loss) before (i) interest expense, (ii) income taxes and (iii) depreciation and amortization. EVgo defines Adjusted EBITDA as EBITDA plus (i) stock-based compensation expense, (ii) loss on disposal of assets and (iii) other unusual or nonrecurring income (expenses) such as bad debt expense. Adjusted EBITDA Margin is defined as Adjusted EBITDA as a percentage of revenue. Adjusted Cost of Sales, Adjusted Gross Profit (Loss), Adjusted Gross Margin, EBITDA, Adjusted EBITDA, and Adjusted EBITDA Margin are not prepared in accordance with GAAP and that may be different from non-GAAP financial measures used by other companies. These measures should not be considered as measures of financial performance under GAAP, and the items excluded from or included in these metrics are significant components in understanding and assessing EVgo’s financial performance. These metrics should not be considered as alternatives to net income (loss) or any other performance measures derived in accordance with GAAP.
6
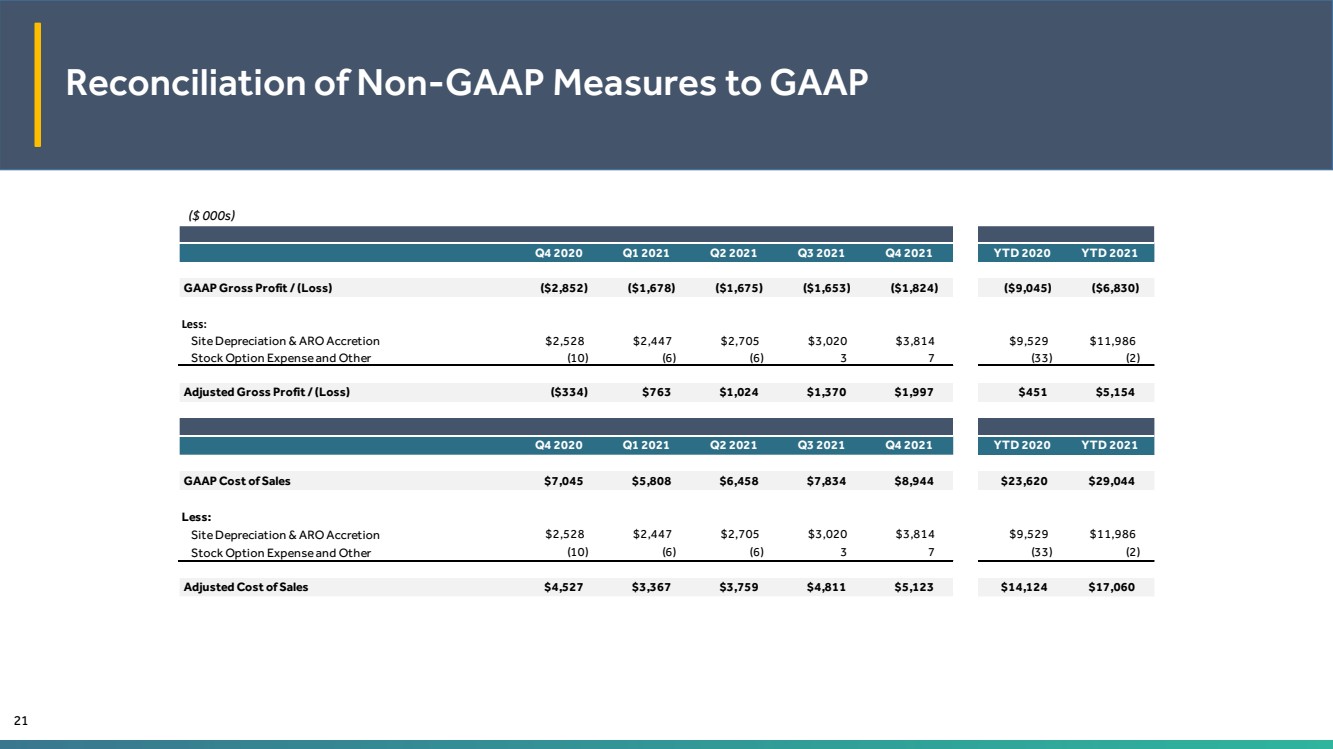
Reconciliations of Non-GAAP Measures ($ in 000s)
| | | | | | | | | |
| | Q4 2020 | Q1 2021 | Q2 2021 | Q3 2021 | Q4 2021 | | YTD 2020 | YTD 2021 |
| | | | | | | | | |
GAAP Gross Profit / (Loss) | | ($2,852) | ($1,678) | ($1,675) | ($1,653) | ($1,824) | | ($9,045) | ($6,830) |
| | | | | | | | | |
Less: | | | | | | | | | |
Site Depreciation & ARO Accretion | | $2,528 | $2,447 | $2,705 | $3,020 | $3,814 | | $9,529 | $11,986 |
Stock Option Expense and Other | | (10) | (6) | (6) | 3 | 7 | | (33) | (2) |
| | | | | | | | | |
Adjusted Gross Profit / (Loss) | | ($334) | $763 | $1,024 | $1,370 | $1,997 | | $451 | $5,154 |
| | | | | | | | | |
| | | | | | | | | |
| | Q4 2020 | Q1 2021 | Q2 2021 | Q3 2021 | Q4 2021 | | YTD 2020 | YTD 2021 |
| | | | | | | | | |
GAAP Cost of Sales | | $7,045 | $5,808 | $6,458 | $7,834 | $8,944 | | $23,620 | $29,044 |
| | | | | | | | | |
Less: | | | | | | | | | |
Site Depreciation & ARO Accretion | | $2,528 | $2,447 | $2,705 | $3,020 | $3,814 | | $9,529 | $11,986 |
Stock Option Expense and Other | | (10) | (6) | (6) | 3 | 7 | | (33) | (2) |
| | | | | | | | | |
Adjusted Cost of Sales | | $4,527 | $3,367 | $3,759 | $4,811 | $5,123 | | $14,124 | $17,060 |
| | | | | | | | | |
| | | | | | | | | |
| | Q4 2020 | Q1 2021 | Q2 2021 | Q3 2021 | Q4 2021 | | YTD 2020 | YTD 2021 |
| | | | | | | | | |
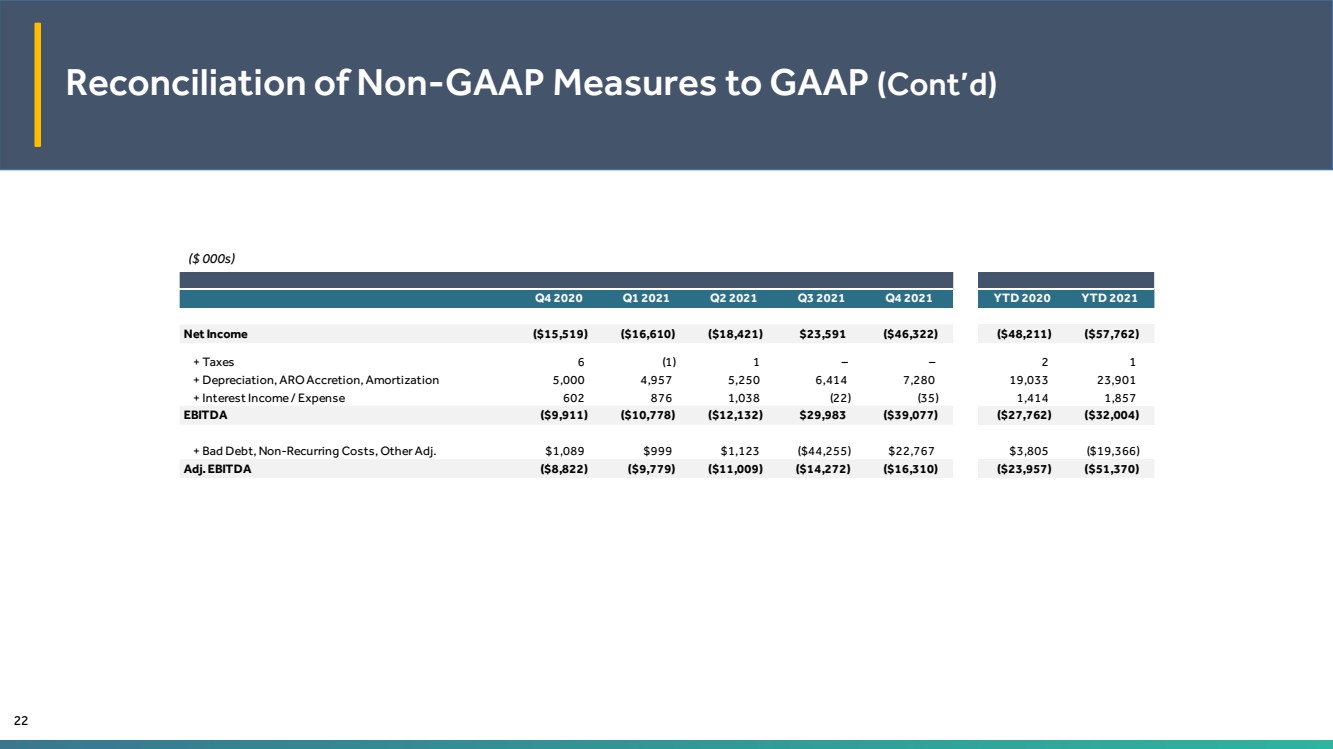
Net Income |
| ($15,519) | ($16,610) | ($18,421) | $23,591 | ($46,322) |
| ($48,211) | ($57,762) |
| | | | | | | | | |
+ Taxes | | 6 | (1) | 1 | – | – | | 2 | 1 |
+ Depreciation, ARO Accretion, Amortization | | 5,000 | 4,957 | 5,250 | 6,414 | 7,280 | | 19,033 | 23,901 |
+ Interest Income / Expense | | 602 | 876 | 1,038 | (22) | (35) | | 1,414 | 1,857 |
EBITDA | | ($9,911) | ($10,778) | ($12,132) | $29,983 | ($39,077) | | ($27,762) | ($32,004) |
| | | | | | | | | |
+ Bad Debt, Non-Recurring Costs, Other Adj. | | $1,089 | $999 | $1,123 | ($44,255) | $22,767 | | $3,805 | ($19,366) |
Adj. EBITDA | | ($8,822) | ($9,779) | ($11,009) | ($14,272) | ($16,310) | | ($23,957) | ($51,370) |
| | | | | | | | | |
| | | | | | | | | |
| | Q4 2020 | Q1 2021 | Q2 2021 | Q3 2021 | Q4 2021 | | YTD 2020 | YTD 2021 |
| | | | | | | | | |
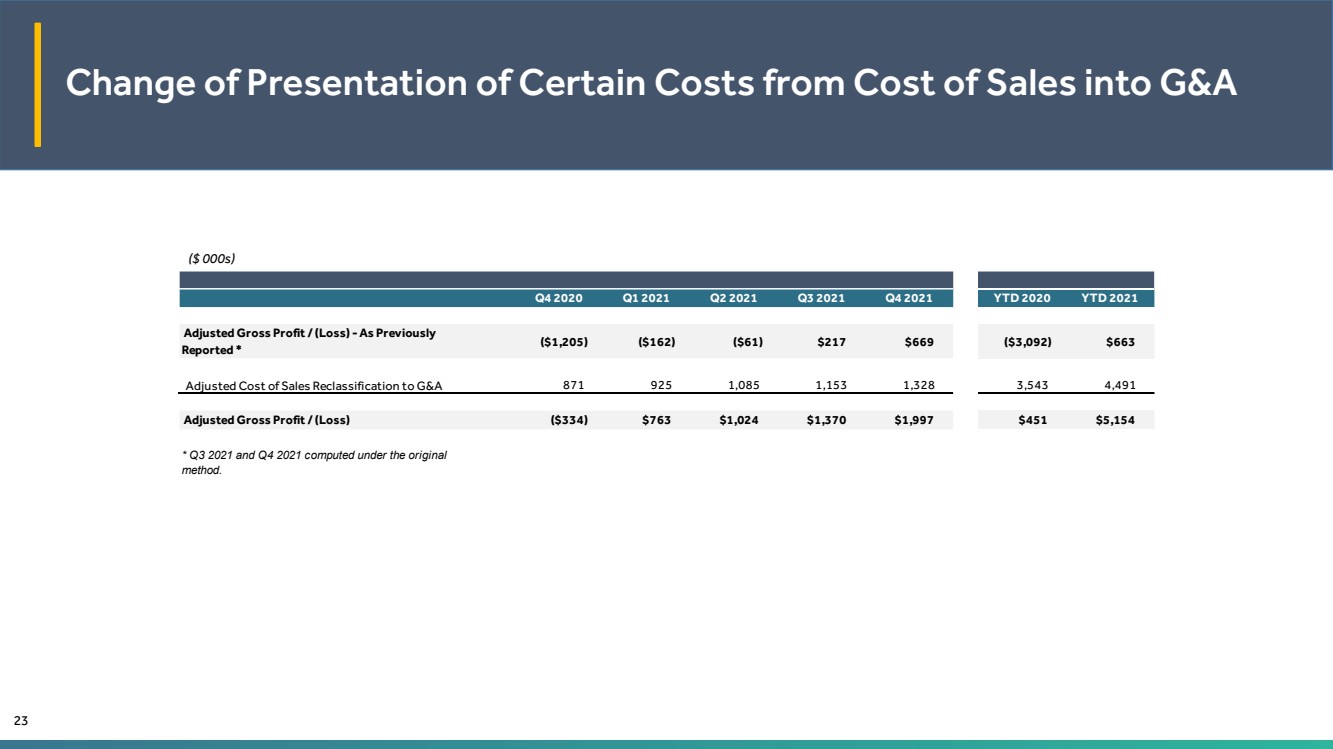
Adjusted Gross Profit / (Loss) - As Previously Reported * | | ($1,205) | ($162) | ($61) | $217 | $669 | | ($3,092) | $663 |
| | | | | | | | | |
Adjusted Cost of Sales Reclassification to G&A | | 871 | 925 | 1,085 | 1,153 | 1,328 | | 3,543 | 4,491 |
| | | | | | | | | |
Adjusted Gross Profit / (Loss) | | ($334) | $763 | $1,024 | $1,370 | $1,997 | | $451 | $5,154 |
| | | | | | | | | |
* Q3 2021 and Q4 2021 computed under the original method. | | | | | | | | | |
Note: Figures may not sum due to rounding.
7
Financial Statements
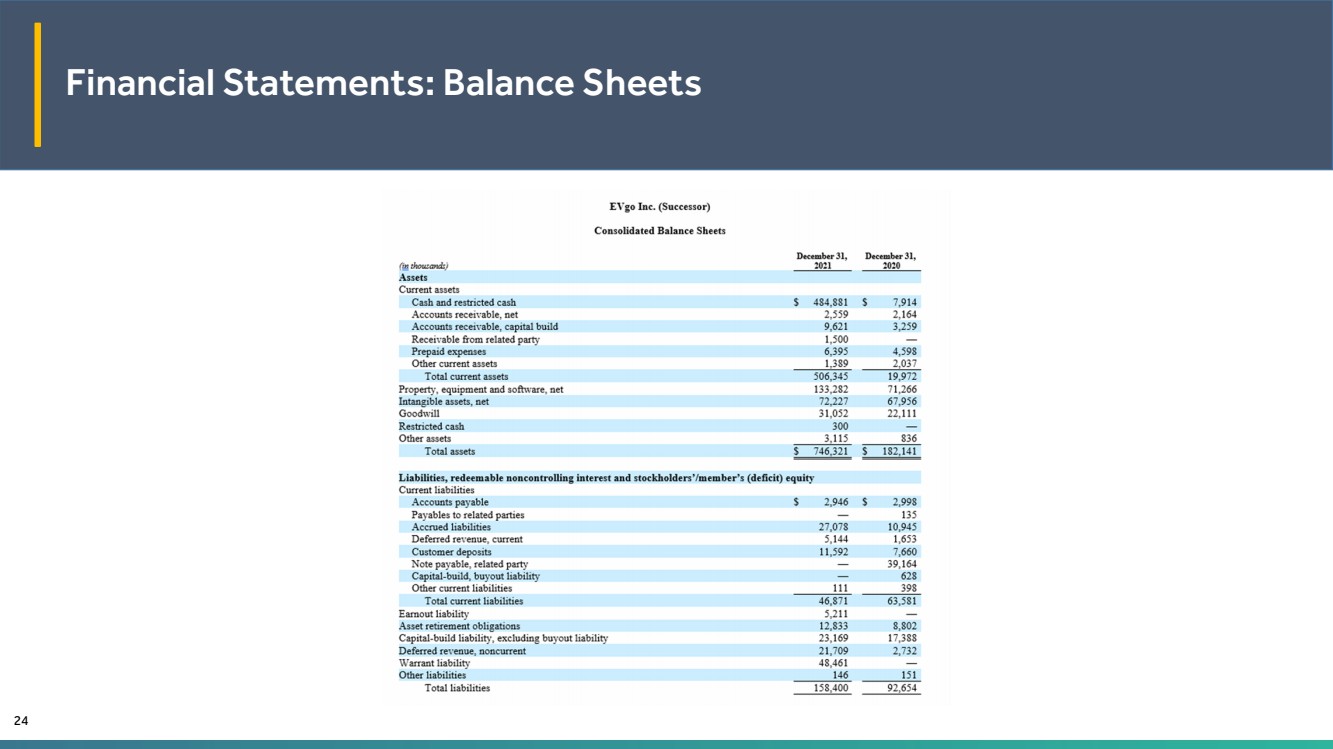
EVgo Inc. (Successor)
| | December 31, | | December 31, | ||
(in thousands) |
| 2021 |
| 2020 | ||
Assets |
| |
| | |
|
Current assets |
| |
| | |
|
Cash and restricted cash |
| $ | 484,881 | | $ | 7,914 |
Accounts receivable, net | |
| 2,559 | |
| 2,164 |
Accounts receivable, capital build | |
| 9,621 | |
| 3,259 |
Receivable from related party | |
| 1,500 | |
| — |
Prepaid expenses | | | 6,395 | | | 4,598 |
Other current assets | |
| 1,389 | |
| 2,037 |
Total current assets | |
| 506,345 | |
| 19,972 |
Property, equipment and software, net | |
| 133,282 | |
| 71,266 |
Intangible assets, net | |
| 72,227 | |
| 67,956 |
Goodwill | |
| 31,052 | |
| 22,111 |
Restricted cash | | | 300 | | | — |
Other assets | |
| 3,115 | |
| 836 |
Total assets | | $ | 746,321 | | $ | 182,141 |
| | | | | | |
Liabilities, redeemable noncontrolling interest and stockholders’/member’s (deficit) equity | ||||||
Current liabilities | |
|
| |
|
|
Accounts payable | | $ | 2,946 | | $ | 2,998 |
Payables to related parties | |
| — | |
| 135 |
Accrued liabilities | |
| 27,078 | |
| 10,945 |
Deferred revenue, current | |
| 5,144 | |
| 1,653 |
Customer deposits | |
| 11,592 | |
| 7,660 |
Note payable, related party | |
| — | |
| 39,164 |
Capital-build, buyout liability | |
| — | |
| 628 |
Other current liabilities | |
| 111 | |
| 398 |
Total current liabilities | |
| 46,871 | |
| 63,581 |
Earnout liability, at fair value | | | 5,211 | | | — |
Asset retirement obligations | |
| 12,833 | |
| 8,802 |
Capital-build liability, excluding buyout liability | |
| 23,169 | |
| 17,388 |
Deferred revenue, noncurrent | |
| 21,709 | |
| 2,732 |
Warrant liability, at fair value | | | 48,461 | | | — |
Other liabilities | |
| 146 | |
| 151 |
Total liabilities | |
| 158,400 | |
| 92,654 |
8
EVgo Inc. (Successor)
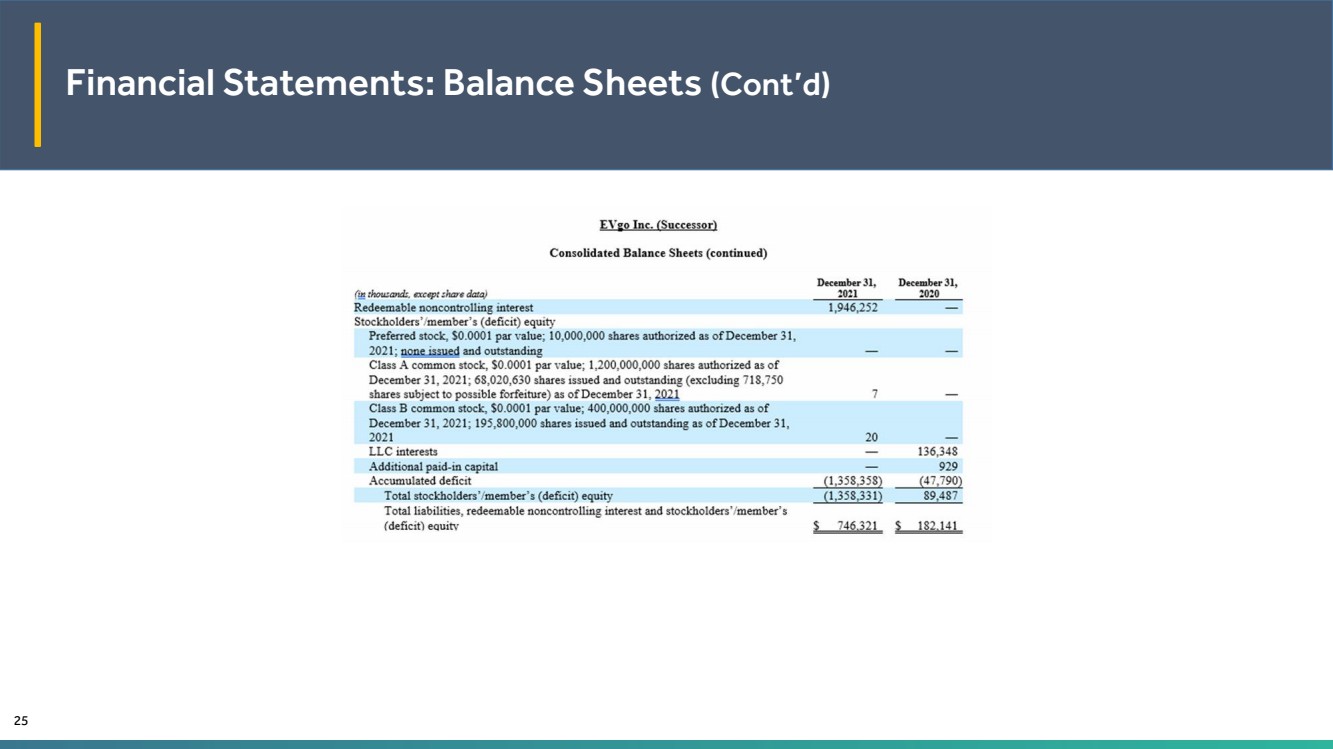
Consolidated Balance Sheets (continued)
| | December 31, | | December 31, | ||
(in thousands, except share data) | | 2021 |
| 2020 | ||
Redeemable noncontrolling interest | | | 1,946,252 | | | — |
Stockholders’/member’s (deficit) equity | | | | | | |
Preferred stock, $0.0001 par value; 10,000,000 shares authorized as of December 31, 2021; none issued and outstanding | | | — | | | — |
Class A common stock, $0.0001 par value; 1,200,000,000 shares authorized as of December 31, 2021; 68,020,630 shares issued and outstanding (excluding 718,750 shares subject to possible forfeiture) as of December 31, 2021 | | | 7 | | | — |
Class B common stock, $0.0001 par value; 400,000,000 shares authorized as of December 31, 2021; 195,800,000 shares issued and outstanding as of December 31, 2021 | | | 20 | | | — |
LLC interests | | | — | | | 136,348 |
Additional paid-in capital | | | — | | | 929 |
Accumulated deficit | | | (1,358,358) | | | (47,790) |
Total stockholders’/member’s (deficit) equity | |
| (1,358,331) | |
| 89,487 |
Total liabilities, redeemable noncontrolling interest and stockholders’/member’s (deficit) equity | | $ | 746,321 | | $ | 182,141 |
9
EVgo Inc. (Successor) and EVgo Services LLC (Predecessor)
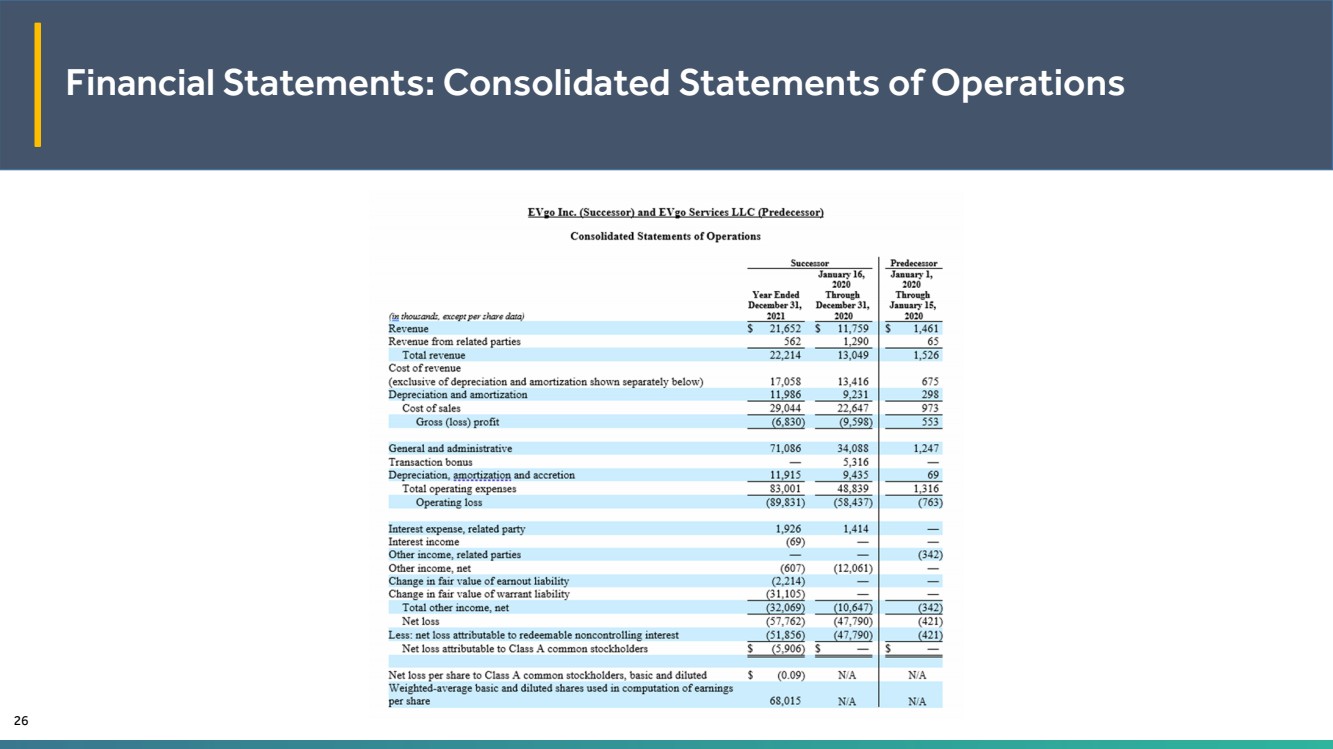
Consolidated Statements of Operations
| | Successor | | | Predecessor | |||||
| | | | January 16, | | | January 1, | |||
| | | | 2020 | | | 2020 | |||
| | Year Ended | | Through | | | Through | |||
| | December 31, | | December 31, | | | January 15, | |||
(in thousands, except per share data) | | 2021 | | 2020 |
|
| 2020 | |||
Revenue |
| $ | 21,652 |
| $ | 11,759 |
|
| $ | 1,461 |
Revenue from related parties | | | 562 | | | 1,290 | | | | 65 |
Total revenue | | | 22,214 | | | 13,049 | | | | 1,526 |
Cost of revenue | | | 17,058 | | | 13,416 | | | | 675 |
Depreciation and amortization | | | 11,986 | | | 9,231 | | | | 298 |
Cost of sales | | | 29,044 | | | 22,647 | | | | 973 |
Gross (loss) profit | | | (6,830) | | | (9,598) | | | | 553 |
| | | | | | | | | | |
General and administrative | | | 71,086 | | | 34,088 | | | | 1,247 |
Transaction bonus | | | — | | | 5,316 | | | | — |
Depreciation, amortization and accretion | | | 11,915 | | | 9,435 | | | | 69 |
Total operating expenses | | | 83,001 | | | 48,839 | | | | 1,316 |
Operating loss | | | (89,831) | | | (58,437) | | | | (763) |
| | | | | | | | | | |
Interest expense, related party | | | 1,926 | | | 1,414 | | | | — |
Interest income | | | (69) | | | — | | | | — |
Other income, related parties | | | — | | | — | | | | (342) |
Other income, net | | | (607) | | | (12,061) | | | | — |
Change in fair value of earnout liability | | | (2,214) | | | — | | | | — |
Change in fair value of warrant liability | | | (31,105) | | | — | | | | — |
Total other income, net | | | (32,069) | | | (10,647) | | | | (342) |
Net loss | | | (57,762) | | | (47,790) | | | | (421) |
Less: net loss attributable to redeemable noncontrolling interest | | | (51,856) | | | (47,790) | | | | (421) |
Net loss attributable to Class A common stockholders | | $ | (5,906) | | $ | — | | | $ | — |
| | | | | | | | | | |
Net loss per share to Class A common stockholders, basic and diluted | | $ | (0.09) | | | N/A | | | | N/A |
Weighted-average basic and diluted shares used in computation of earnings per share | | | 68,015 | | | N/A | | | | N/A |
10
EVgo Inc. (Successor) and EVgo Services LLC (Predecessor)
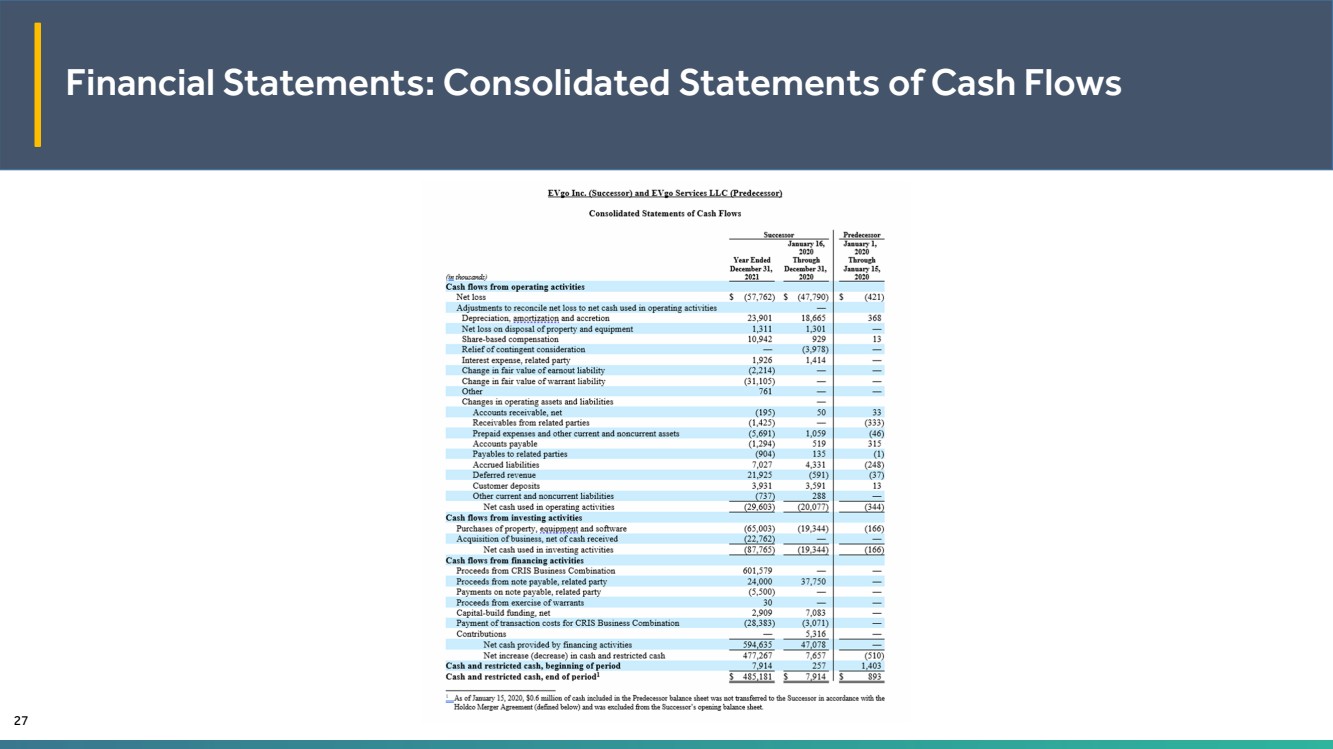
Consolidated Statements of Cash Flows
| | Successor | | | Predecessor | |||||
| | | | January 16, | | | January 1, | |||
| | | | 2020 | | | 2020 | |||
| | Year Ended | | Through | | | Through | |||
| | December 31, | | December 31, | | | January 15, | |||
(in thousands) | | 2021 | | 2020 |
|
| 2020 | |||
Cash flows from operating activities |
|
|
| | | | | | |
|
Net loss | | $ | (57,762) | | $ | (47,790) | | | $ | (421) |
Adjustments to reconcile net loss to net cash used in operating activities | |
| | | | — | | | | |
Depreciation, amortization and accretion | |
| 23,901 | | | 18,665 | | | | 368 |
Net loss on disposal of property and equipment | |
| 1,311 | | | 1,301 | | | | — |
Share-based compensation | |
| 10,942 | | | 929 | | | | 13 |
Relief of contingent consideration | |
| — | | | (3,978) | | | | — |
Interest expense, related party | | | 1,926 | | | 1,414 | | | | — |
Change in fair value of earnout liability | | | (2,214) | | | — | | | | — |
Change in fair value of warrant liability | | | (31,105) | | | — | | | | — |
Other | | | 761 | | | — | | | | — |
Changes in operating assets and liabilities | |
| | | | — | | | | |
Accounts receivable, net | |
| (195) | | | 50 | | | | 33 |
Receivables from related parties | |
| (1,425) | | | — | | | | (333) |
Prepaid expenses and other current and noncurrent assets | |
| (5,691) | | | 1,059 | | | | (46) |
Accounts payable | |
| (1,294) | | | 519 | | | | 315 |
Payables to related parties | |
| (904) | | | 135 | | | | (1) |
Accrued liabilities | |
| 7,027 | | | 4,331 | | | | (248) |
Deferred revenue | |
| 21,925 | | | (591) | | | | (37) |
Customer deposits | |
| 3,931 | | | 3,591 | | | | 13 |
Other current and noncurrent liabilities | |
| (737) | | | 288 | | | | — |
Net cash used in operating activities | |
| (29,603) | | | (20,077) | | | | (344) |
Cash flows from investing activities | |
| | | | | | | | |
Purchases of property, equipment and software | | | (65,003) | | | (19,344) | | | | (166) |
Acquisition of business, net of cash received | | | (22,762) | | | — | | | | — |
Net cash used in investing activities | |
| (87,765) | | | (19,344) | | | | (166) |
Cash flows from financing activities | |
| | | | | | | | |
Proceeds from CRIS Business Combination | | | 601,579 | | | — | | | | — |
Proceeds from note payable, related party | |
| 24,000 | | | 37,750 | | | | — |
Payments on note payable, related party | | | (5,500) | | | — | | | | — |
Proceeds from exercise of warrants | | | 30 | | | — | | | | — |
Capital-build funding, net | |
| 2,909 | | | 7,083 | | | | — |
Payment of transaction costs for CRIS Business Combination | | | (28,383) | | | (3,071) | | | | — |
Contributions | |
| — | | | 5,316 | | | | — |
Net cash provided by financing activities | |
| 594,635 | | | 47,078 | | | | — |
Net increase (decrease) in cash and restricted cash | |
| 477,267 | | | 7,657 | | | | (510) |
Cash and restricted cash, beginning of period | |
| 7,914 | | | 257 | | | | 1,403 |
Cash and restricted cash, end of period1 | | $ | 485,181 | | $ | 7,914 | | | $ | 893 |
1 | As of January 15, 2020, $0.6 million of cash included in the Predecessor’s balance sheet was not transferred to the Successor in accordance with the Holdco Merger Agreement (defined below) and was excluded from the Successor’s opening balance sheet. |
11
EVgo Inc. (Successor) and EVgo Services LLC (Predecessor)
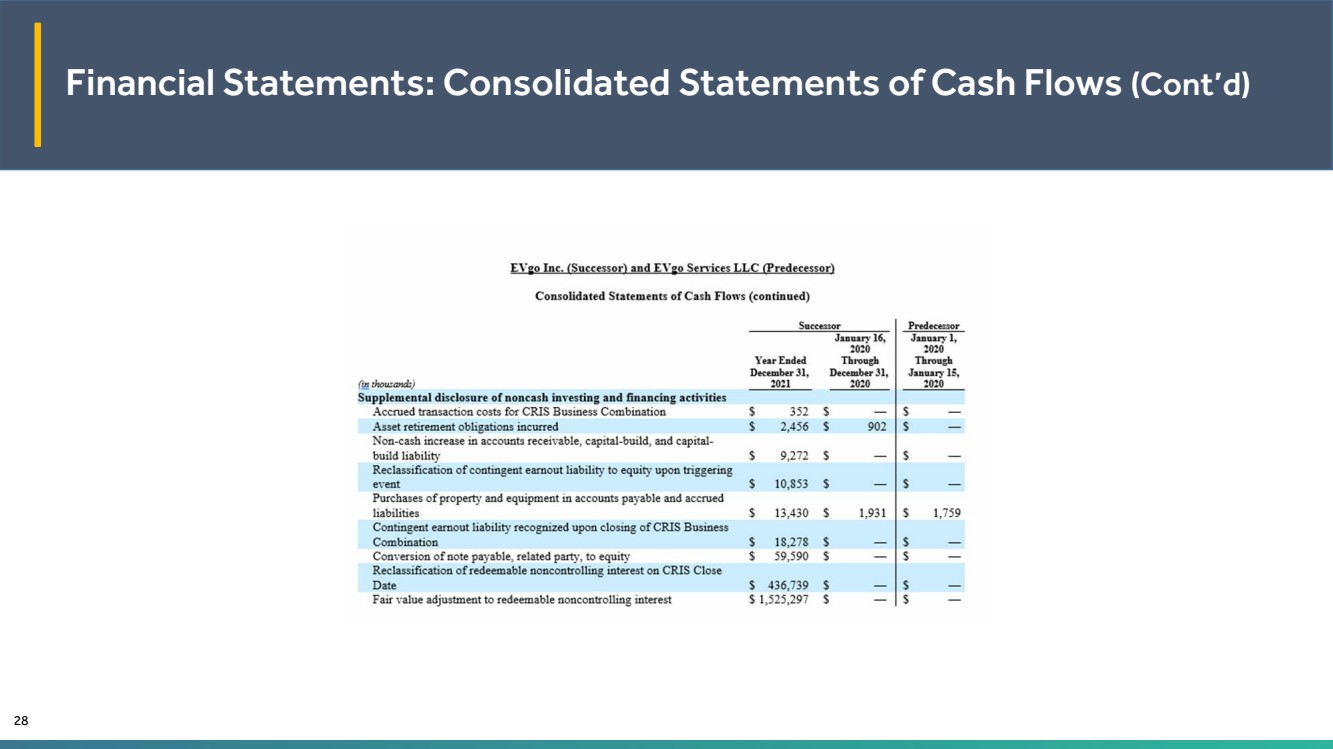
Consolidated Statements of Cash Flows (continued)
| | Successor | | | Predecessor | |||||
| | | | | January 16, | | | January 1, | ||
| | | | | 2020 | | | 2020 | ||
| | Year Ended | | | Through | | | Through | ||
| | December 31, | | | December 31, | | | January 15, | ||
(in thousands) | | 2021 | | | 2020 |
|
| 2020 | ||
Supplemental disclosure of noncash investing and financing activities | |
| | | | | | | | |
Accrued transaction costs for CRIS Business Combination | | $ | 352 | | $ | — | | | $ | — |
Asset retirement obligations incurred | | $ | 2,456 | | $ | 902 | | | $ | — |
Non-cash increase in accounts receivable, capital-build, and capital-build liability | | $ | 9,272 | | $ | — | | | $ | — |
Reclassification of contingent earnout liability to equity upon triggering event | | $ | 10,853 | | $ | — | | | $ | — |
Purchases of property and equipment in accounts payable and accrued liabilities | | $ | 14,485 | | $ | 1,931 | | | $ | 1,759 |
Contingent earnout liability recognized upon closing of CRIS Business Combination | | $ | 18,278 | | $ | — | | | $ | — |
Conversion of note payable, related party, to equity | | $ | 59,590 | | $ | — | | | $ | — |
Reclassification of redeemable noncontrolling interest on CRIS Close Date | | $ | 436,739 | | $ | — | | | $ | — |
Fair value adjustment to redeemable noncontrolling interest | | $ | 1,525,297 | | $ | — | | | $ | — |
EVgo
For investors:
Ted Brooks, VP of Investor Relations
investors.evgo.com
310-954-2943
For Media:
[email protected]
Source: EVgo Inc.
12