| Exhibit 99.1 | |||||
 | East West Bancorp, Inc. | ||||
| 135 N. Los Robles Ave., 7th Fl. | |||||
| Pasadena, CA 91101 | |||||
| Tel. 626.768.6000 | |||||
NEWS RELEASE | |||||||||||
| FOR INVESTOR INQUIRIES, CONTACT: | |||||
Irene Oh | Julianna Balicka | ||||
Chief Financial Officer | Director of Investor Relations and Corporate Finance | ||||
T: (626) 768-6360 | T: (626) 768-6985 | ||||
| E: [email protected] | E: [email protected] | ||||
EAST WEST BANCORP REPORTS NET INCOME FOR FIRST QUARTER 2022
OF $238 MILLION AND DILUTED EARNINGS PER SHARE OF $1.66;
RECORD LOANS AND DEPOSITS
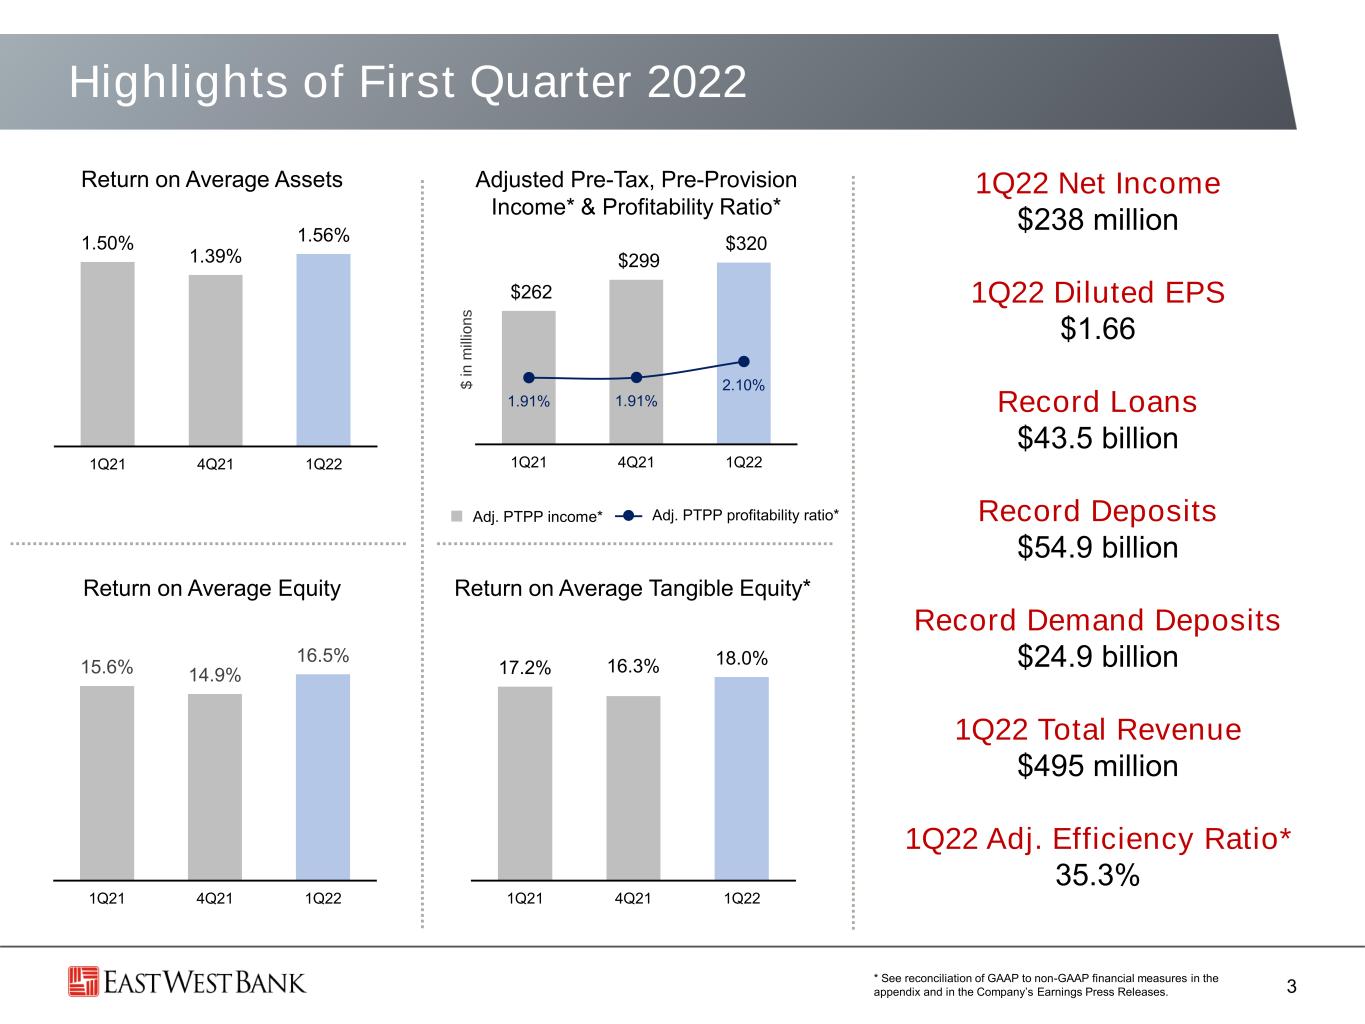
Pasadena, California – April 21, 2022 – East West Bancorp, Inc. (“East West” or the “Company”) (Nasdaq: EWBC), parent company of East West Bank, today reported its financial results for the first quarter of 2022. For the first quarter of 2022, net income was $237.7 million, or $1.66 per diluted share, up 37% linked quarter annualized and up 16% year-over-year.
“East West had an excellent start to the year. Financial results for the first quarter of 2022 were very strong, with an acceleration of loan and revenue growth, and a 14 basis point expansion in the net interest margin to 2.87%,” stated Dominic Ng, Chairman and Chief Executive Officer of East West. “Quarter-over-quarter, our adjusted pre-tax, pre-provision income1 of $320.3 million grew by 28% annualized. Our first quarter 2022 return on assets of 1.56% expanded by 17 basis points, and our return on equity of 16.5% expanded by 157 basis points sequentially.”
“Total loans reached a record $43.5 billion as of March 31, 2022. Excluding the impact of the Paycheck Protection Program loans, total loans grew by $2.0 billion, or 20% linked quarter annualized, led by commercial loan growth. Total deposits grew to a record $54.9 billion as of March 31, 2022, an increase of $1.6 billion or 12% linked quarter annualized, driven by strong growth in noninterest-bearing demand deposits. Demand deposits made up 45% of our deposits as of March 31, 2022, up from 38% a year ago,” continued Ng.
“The strength of East West’s business model and our ability to execute are reflected in our financial achievements for the first quarter. Our loan portfolio is well-diversified, our pipelines are robust, our asset quality continues to be strong, and our balance sheet is well-positioned for a rising interest rate environment. We are optimistic about our outlook and expect to continue to deliver strong growth and earnings in 2022 and beyond,” concluded Ng.
1 See reconciliation of GAAP to non-GAAP financial measures in Table 10. | |||||||||||
1
FINANCIAL HIGHLIGHTS
| Three Months Ended | Qtr-o-Qtr Change | Yr-oYr Change | |||||||||||||||||||||||||||||||||
| ($ in millions) | March 31, 2022 | $ | % Ann. | $ | % | ||||||||||||||||||||||||||||||
| Total Loans (incl. PPP) | $43,491 | $1,797 | 17% | $3,903 | 10% | ||||||||||||||||||||||||||||||
| Total Loans (excl. PPP) | 43,173 | 2,013 | 20 | 5,657 | 15 | ||||||||||||||||||||||||||||||
| Total Deposits | 54,938 | 1,588 | 12 | 5,391 | 11 | ||||||||||||||||||||||||||||||
| Total Revenue | $495 | $18 | 15% | $69 | 16% | ||||||||||||||||||||||||||||||
Adj. Pre-tax Pre-provision1 | 320 | 21 | 28 | 59 | 22 | ||||||||||||||||||||||||||||||
| Net Income | 328 | 20 | 37 | 33 | 16 | ||||||||||||||||||||||||||||||
1See reconciliation of GAAP to non-GAAP financial measures in Table 10.
BALANCE SHEET
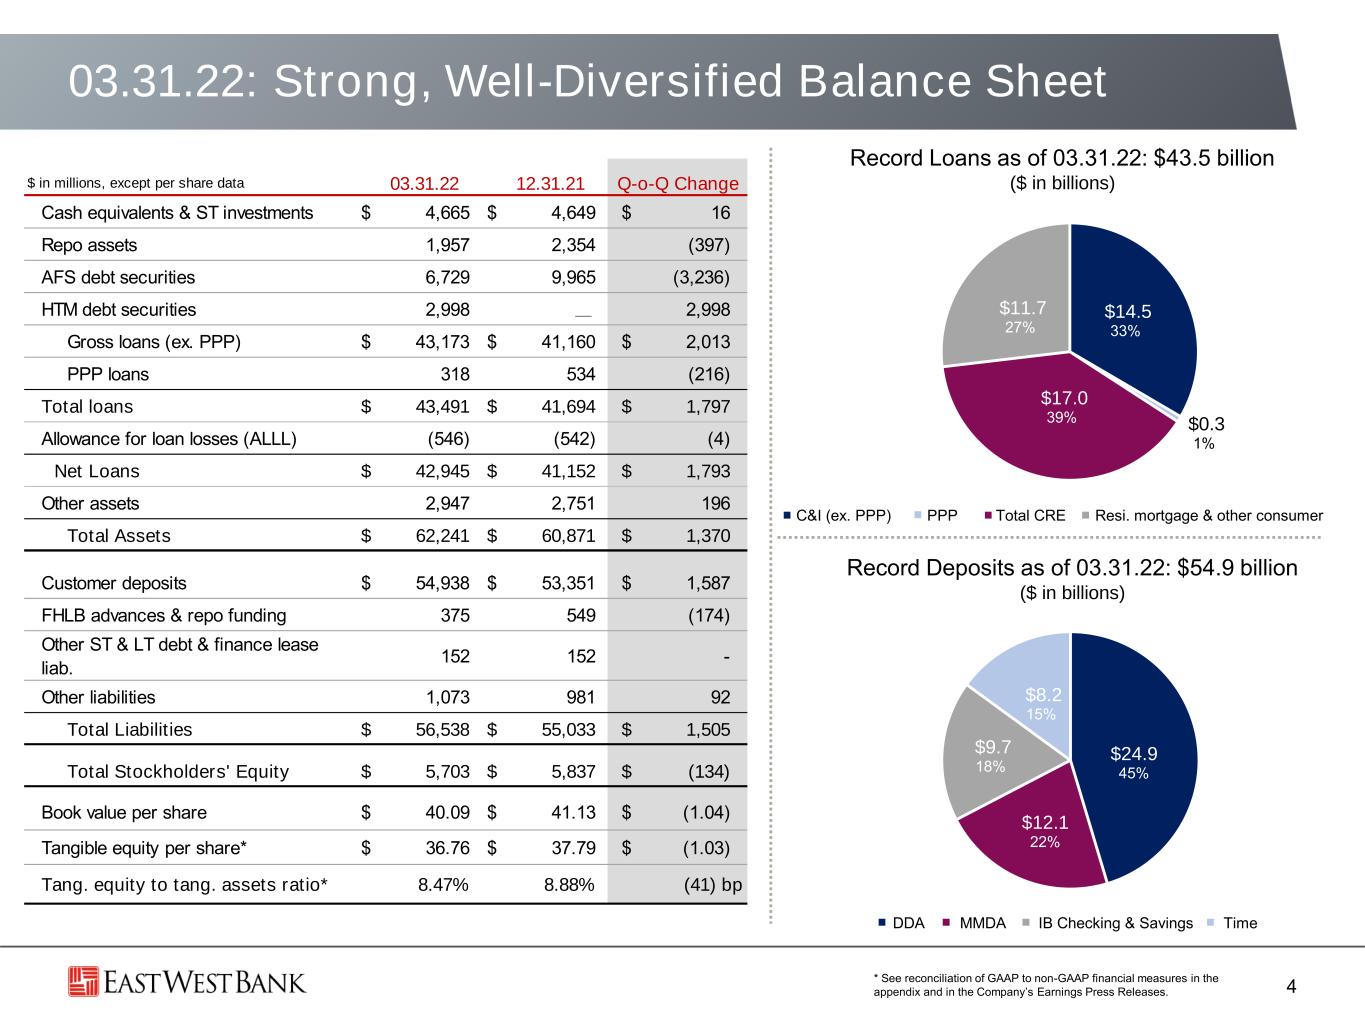
•Record Assets – Total assets reached $62.2 billion as of March 31, 2022, up by $1.4 billion, or 9% annualized, from $60.9 billion as of December 31, 2021, driven by growth in loans. Year-over-year, total assets grew 9% from $56.9 billion as of March 31, 2021.
First quarter 2022 average interest-earning assets of $58.7 billion declined by $251.7 million, or 2% linked quarter annualized, from $58.9 billion in the fourth quarter of 2021. The quarter-over-quarter decrease was driven by declines in average interest-bearing cash and deposits with banks of $1.6 billion and assets purchased under resale agreements of $342.6 million, which were largely offset by an increase in average loans of $1.6 billion. During the first quarter of 2022, the Company moved $3.0 billion of debt securities from available-for-sale (“AFS”) to held-to-maturity.
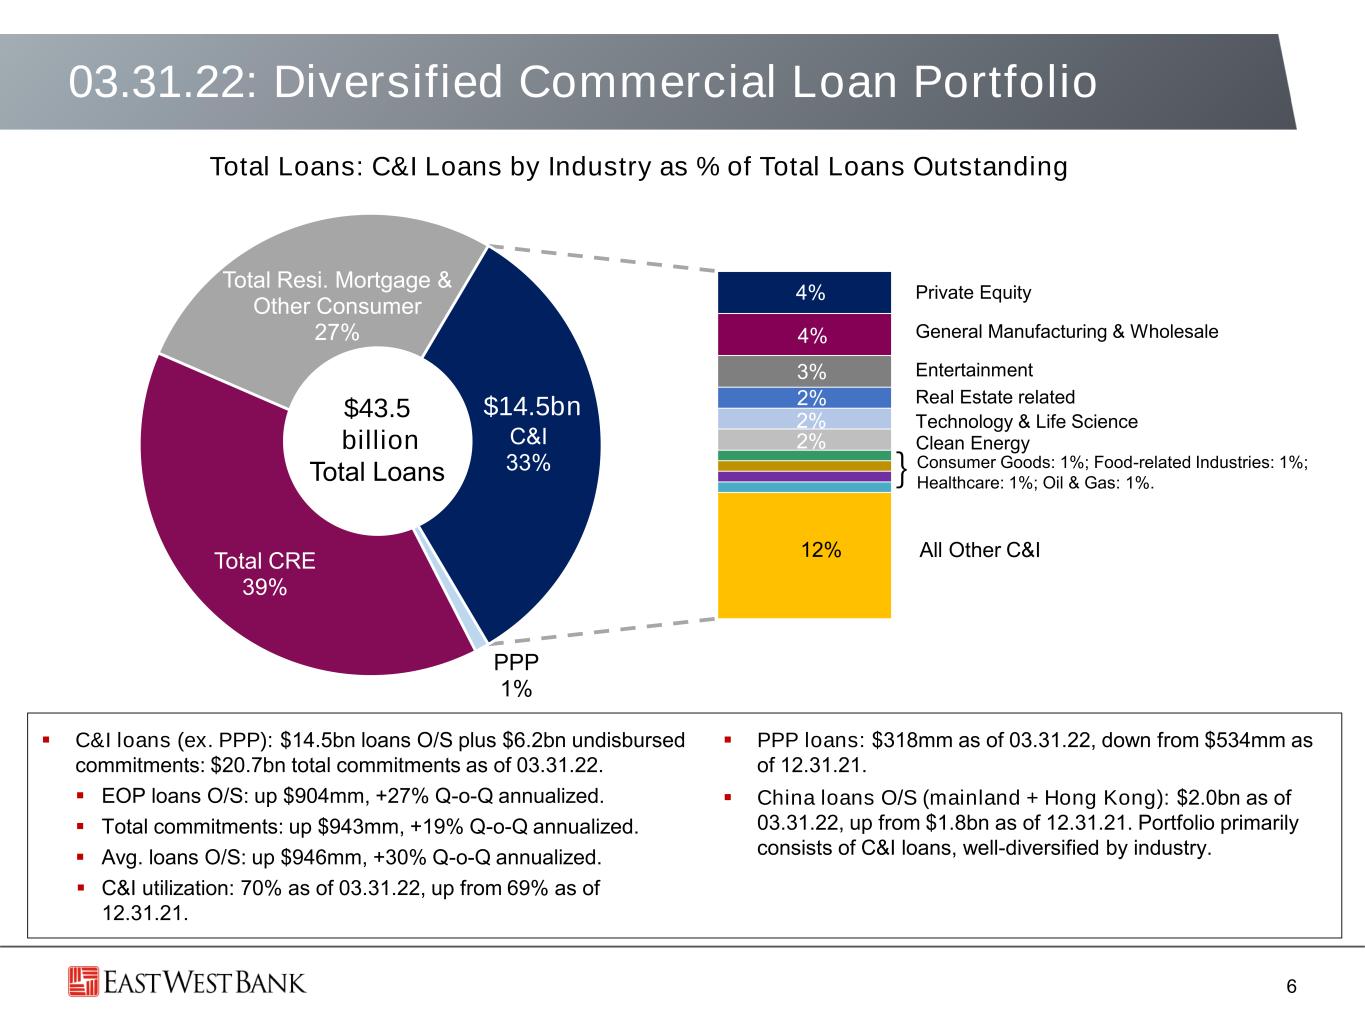
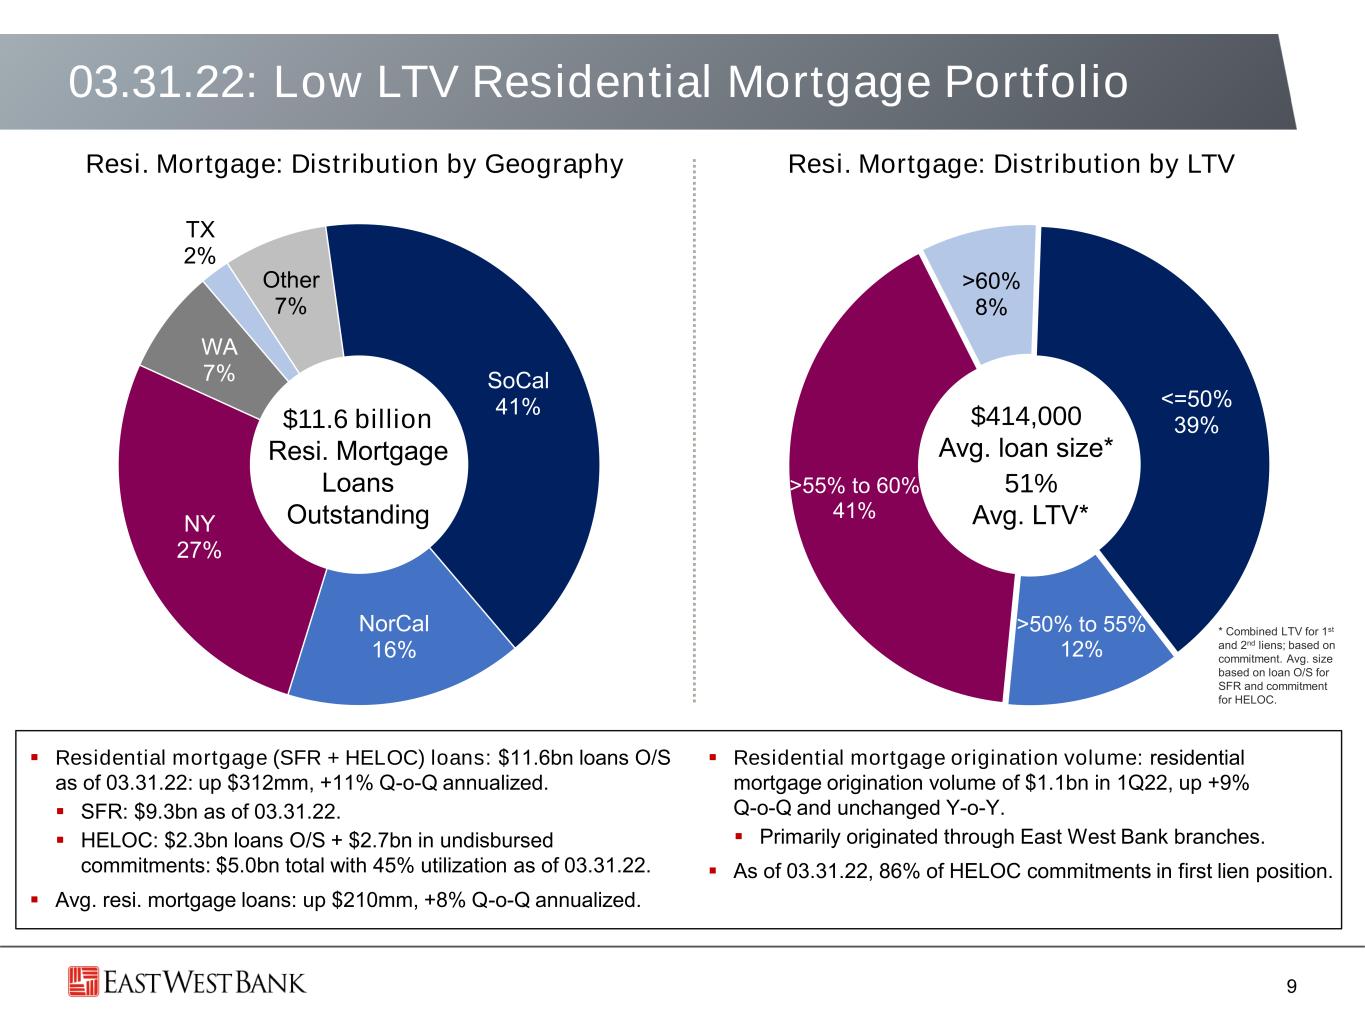
•Record Loans – Total loans reached $43.5 billion as of March 31, 2022, up by $1.8 billion, or 17% annualized, from $41.7 billion as of December 31, 2021. Excluding Paycheck Protection Program (“PPP”) loans of $318.1 million, total loans grew by $2.0 billion, or 20% linked quarter annualized, with solid growth in all major loan categories. Year-over-year, total loans grew 10% from $39.6 billion as of March 31, 2021. Excluding PPP loans, total loans grew $5.7 billion or 15% year-over-year.
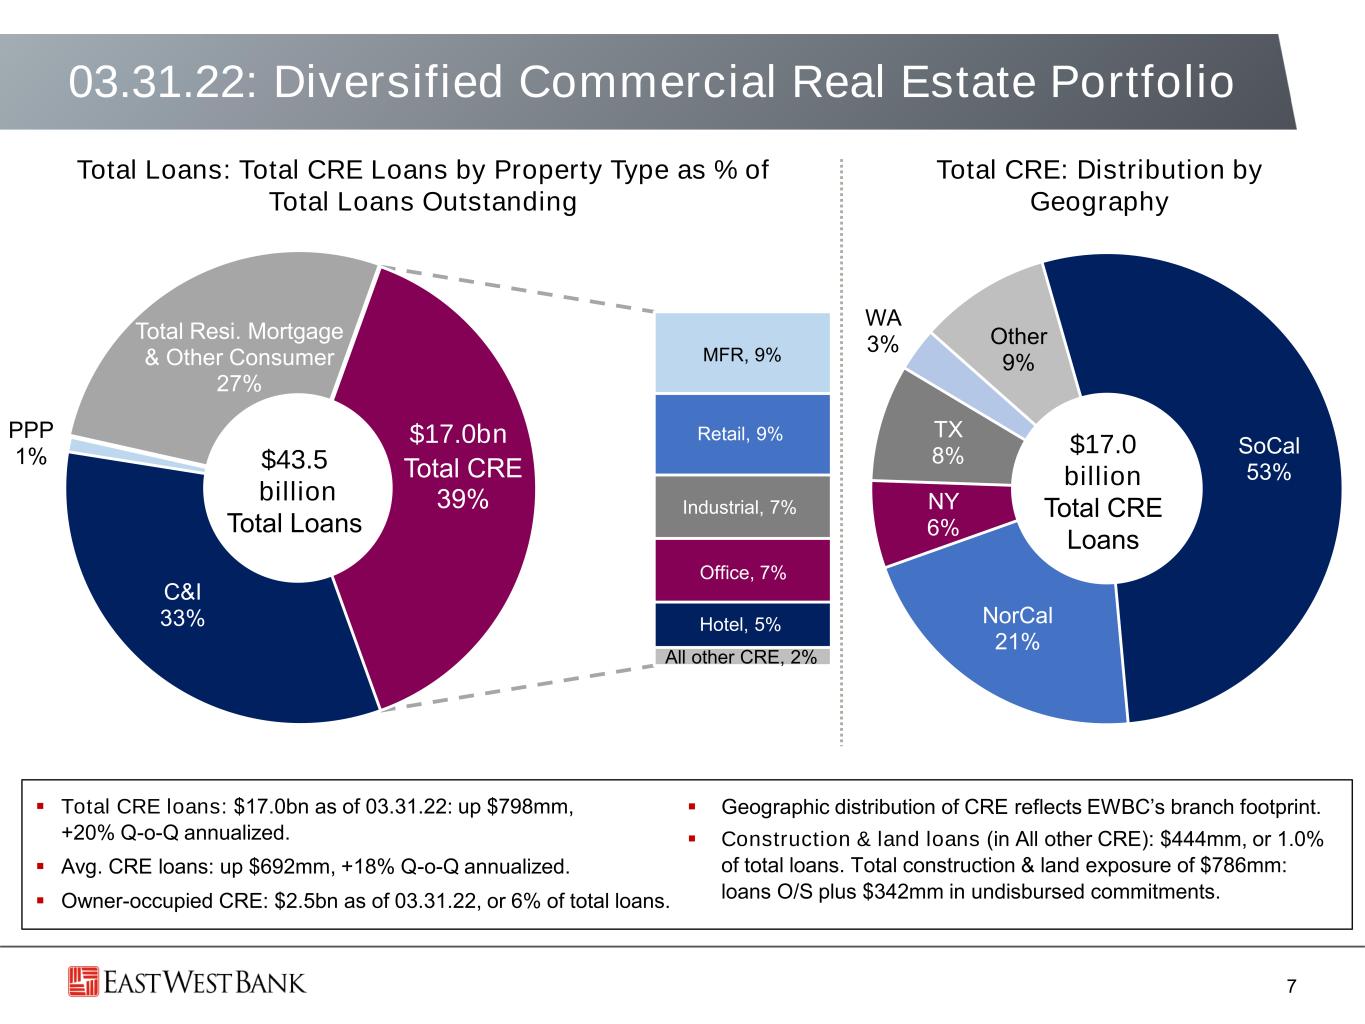
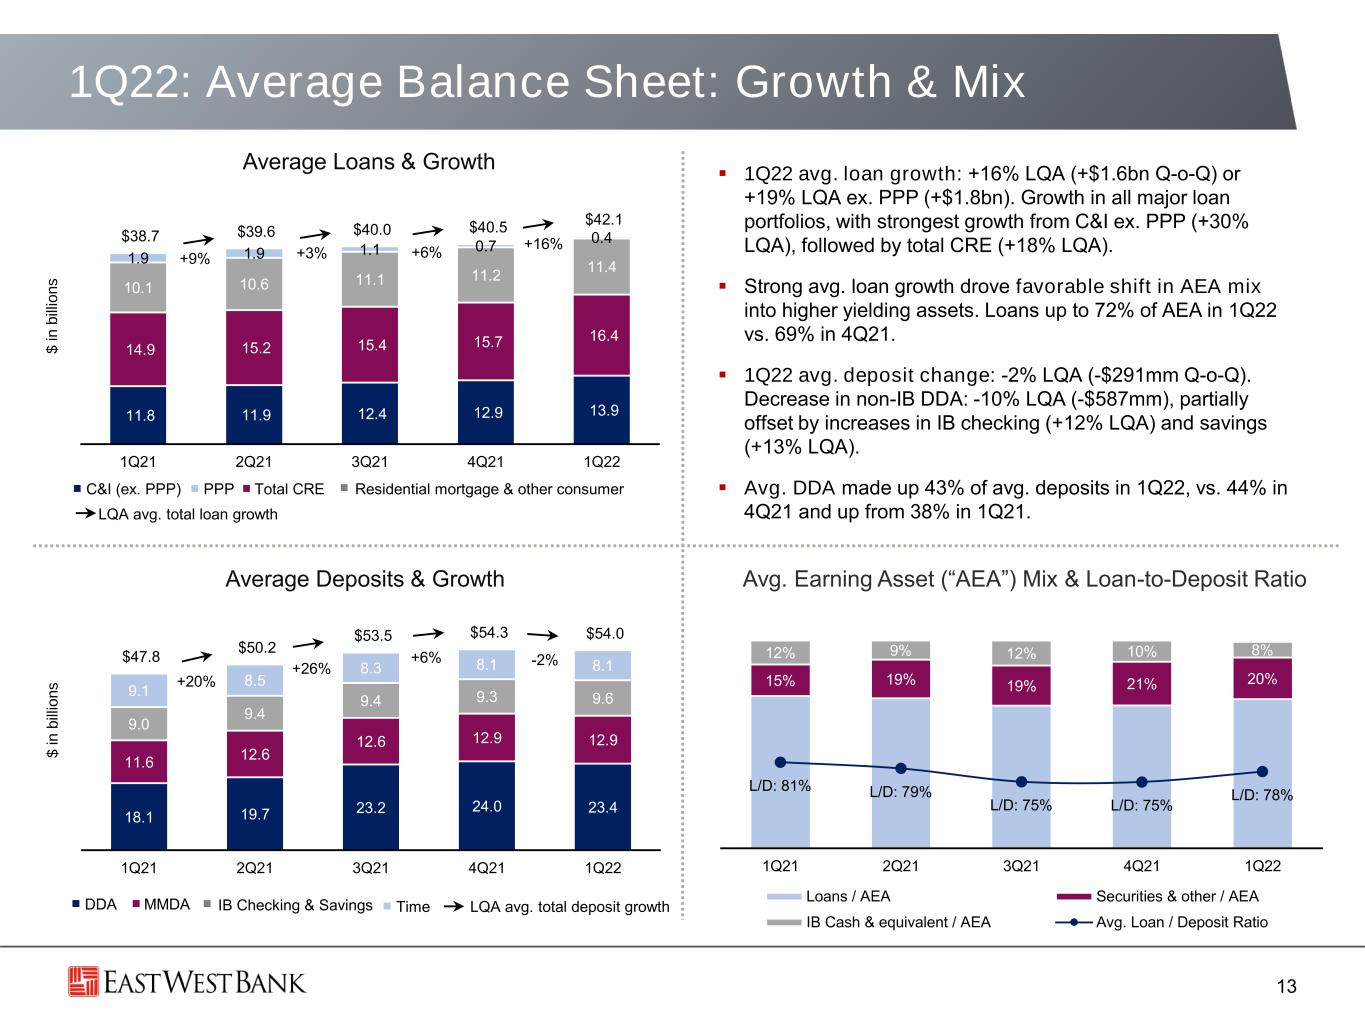
First quarter 2022 average loans of $42.1 billion grew by $1.6 billion, or 16% linked quarter annualized. Excluding PPP loans, average loans grew by $1.8 billion, or 19% annualized, from the fourth quarter of 2021. The strongest growth was from average commercial and industrial loans (excluding PPP), which increased 30% linked quarter annualized, followed by average total commercial real estate loans, which increased 18% linked quarter annualized. Average residential mortgage loans increased 8% linked quarter annualized.
•Record Deposits – Total deposits were $54.9 billion as of March 31, 2022, an increase of $1.6 billion, or 12% annualized, from $53.4 billion as of December 31, 2021, and up $5.4 billion or 11% from $49.5 billion as of March 31, 2021. Quarter-over-quarter, strong growth in noninterest-bearing demand deposits was partially offset by a decrease in money market accounts. Noninterest-bearing demand deposits totaled $24.9 billion as of March 31, 2022. Noninterest-bearing demand deposits made up 45% of total deposits as of March 31, 2022, up from 43% as of December 31, 2021, and from 38% as of March 31, 2021.
First quarter 2022 average deposits of $54.0 billion declined by $290.9 million, or 2% linked quarter annualized. This was primarily driven by a decrease in average noninterest-bearing demand deposits of $586.6 million, or 10% linked quarter annualized, partially offset by increases in average interest-bearing checking deposits of $185.6 million, or 12% linked quarter annualized, and in savings deposits of $89.0 million, or 13% linked quarter annualized.
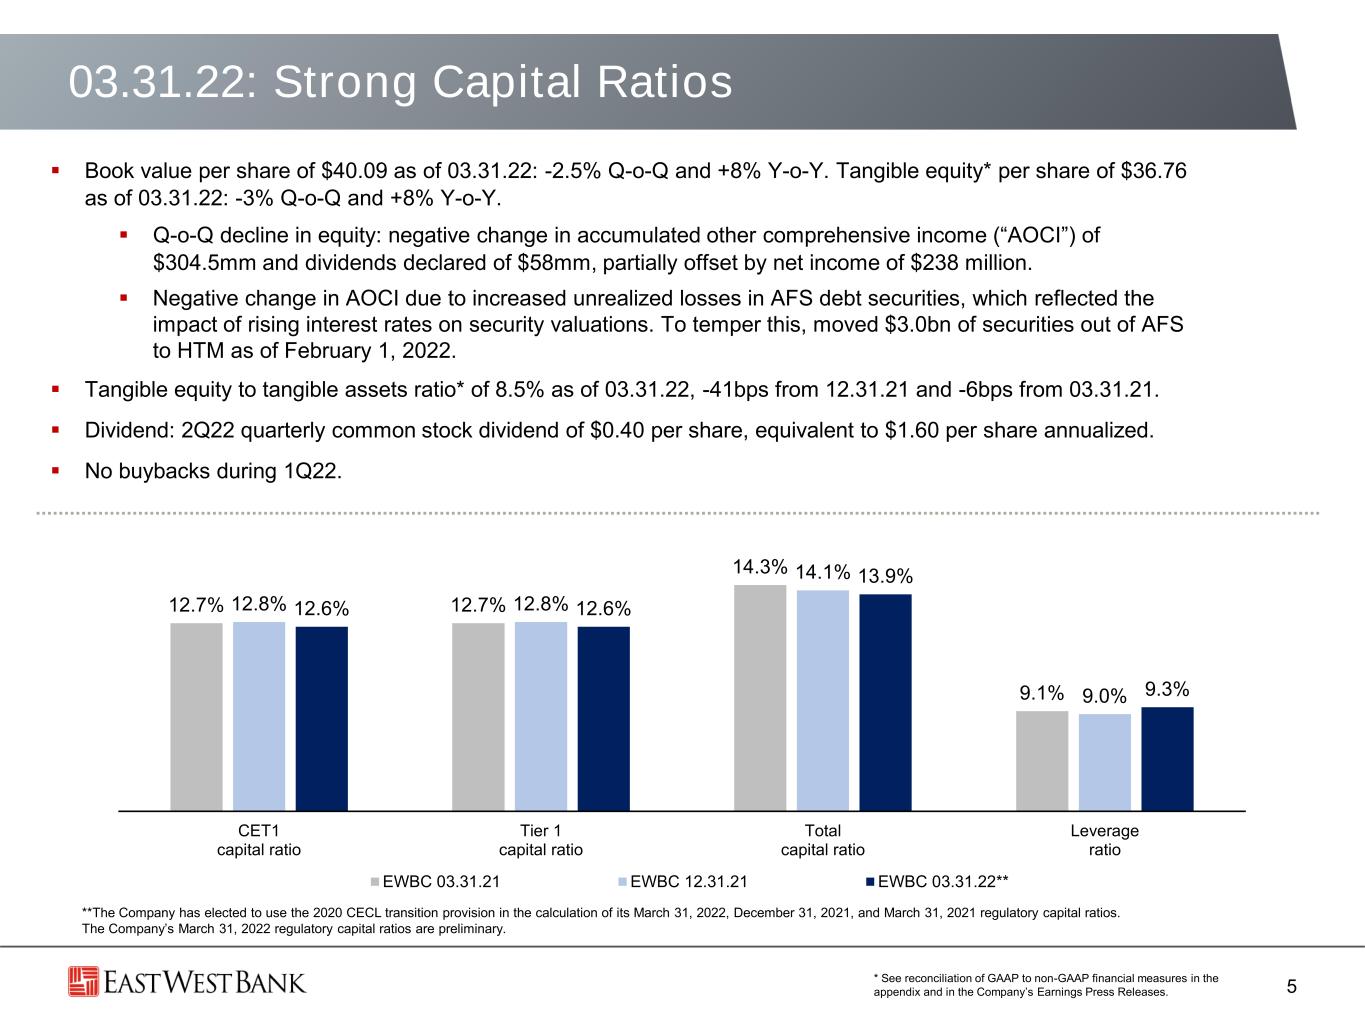
•Strong Capital Levels – As of March 31, 2022, stockholders’ equity was $5.7 billion, or $40.09 per common share, and tangible equity2 per common share was $36.76. As of March 31, 2022, the tangible equity to tangible assets ratio2 was 8.47%, the common equity tier 1 (“CET1”) capital ratio was 12.6%, and the total risk-based capital ratio was 13.9%. Quarter-over-quarter, stockholders’ equity declined by 2%, or $133.8 million, primarily reflecting a negative change in accumulated other comprehensive income (“AOCI”) of $304.5 million and $57.6 million in common dividends declared, partially offset by $237.7 million in net income. The negative change in AOCI was primarily due to increased unrealized losses in AFS debt securities.
2 See reconciliation of GAAP to non-GAAP financial measures in Table 11. | |||||||||||
2
OPERATING RESULTS
First Quarter Earnings – First quarter 2022 net income was $237.7 million, or $1.66 per diluted share, an increase of 9%, or 37% annualized, from $217.8 million, or $1.52 per diluted share, for the fourth quarter of 2021, and an increase of 16% from $205.0 million, or $1.44 per diluted share, for the first quarter of 2021.
First Quarter 2022 Compared to Fourth Quarter 2021
Net Interest Income and Net Interest Margin
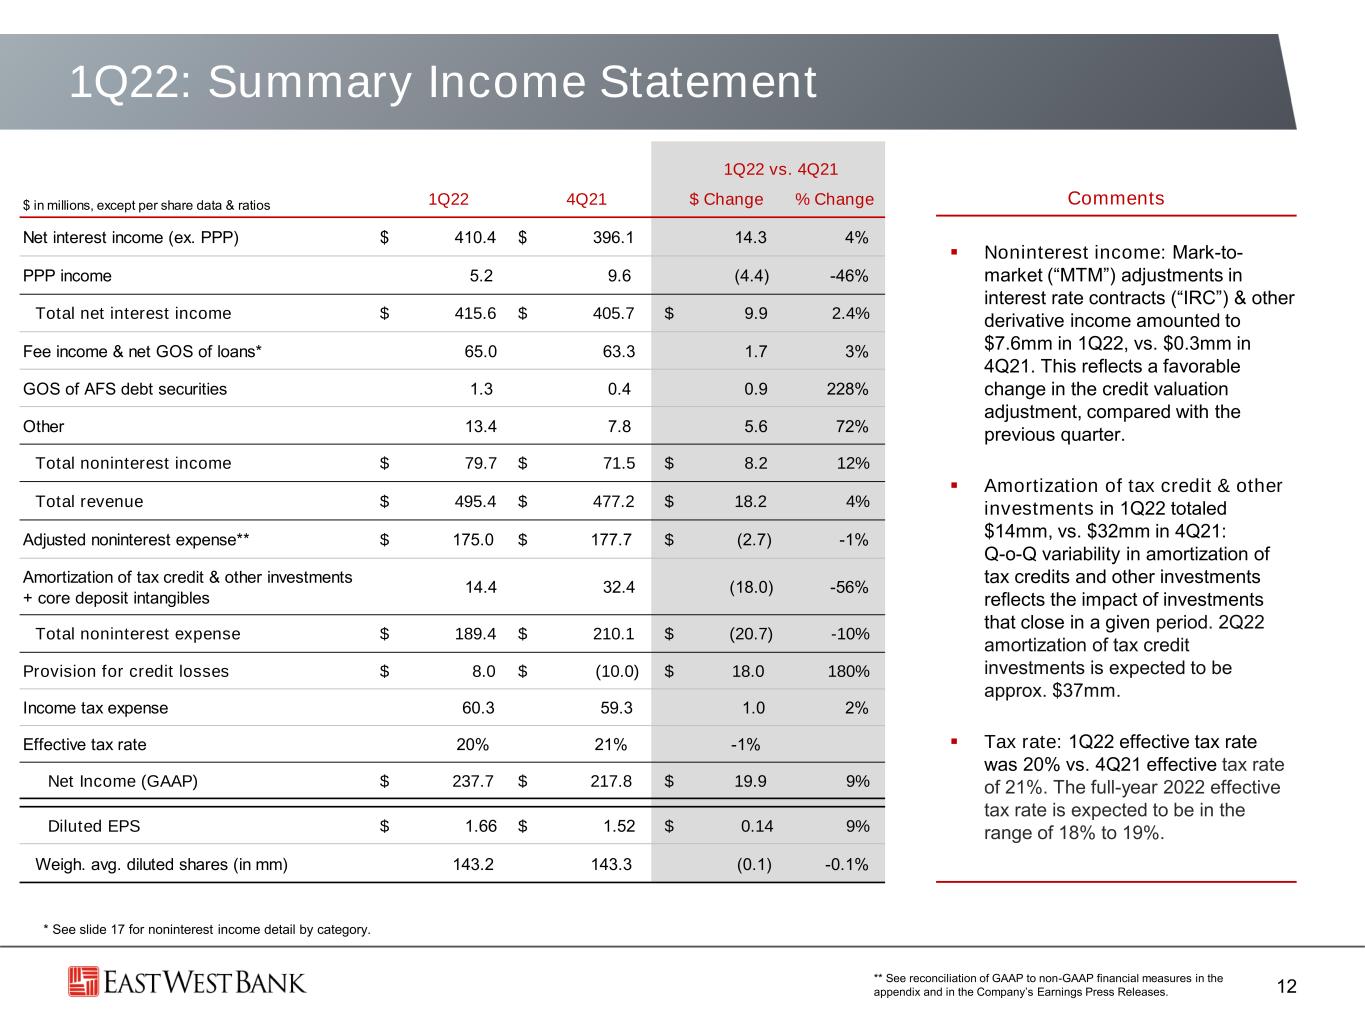
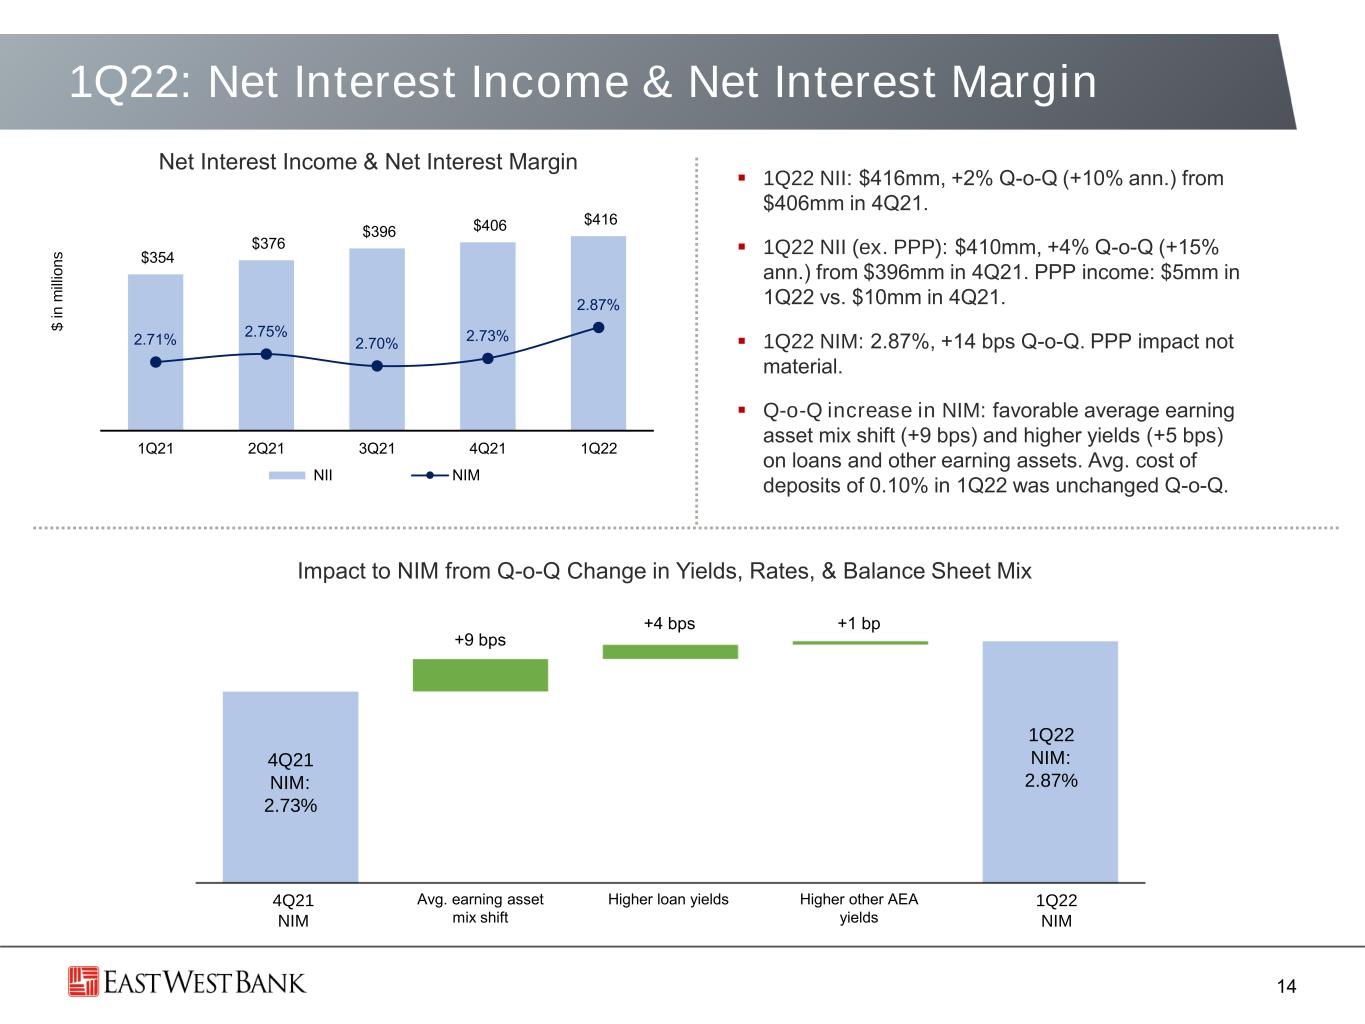
Net interest income (“NII”) totaled $415.6 million, an increase of 10% annualized from $405.7 million. Net interest margin (“NIM”) of 2.87% increased by 14 basis points from 2.73%.
•NII growth and NIM expansion were primarily driven by strong loan growth and higher loan yields. Average loan growth during the first quarter drove a favorable shift in the asset mix into higher interest earning assets. Average loans made up 72% of average interest-earning assets in the first quarter of 2022, compared with 69% in the fourth quarter of 2021.
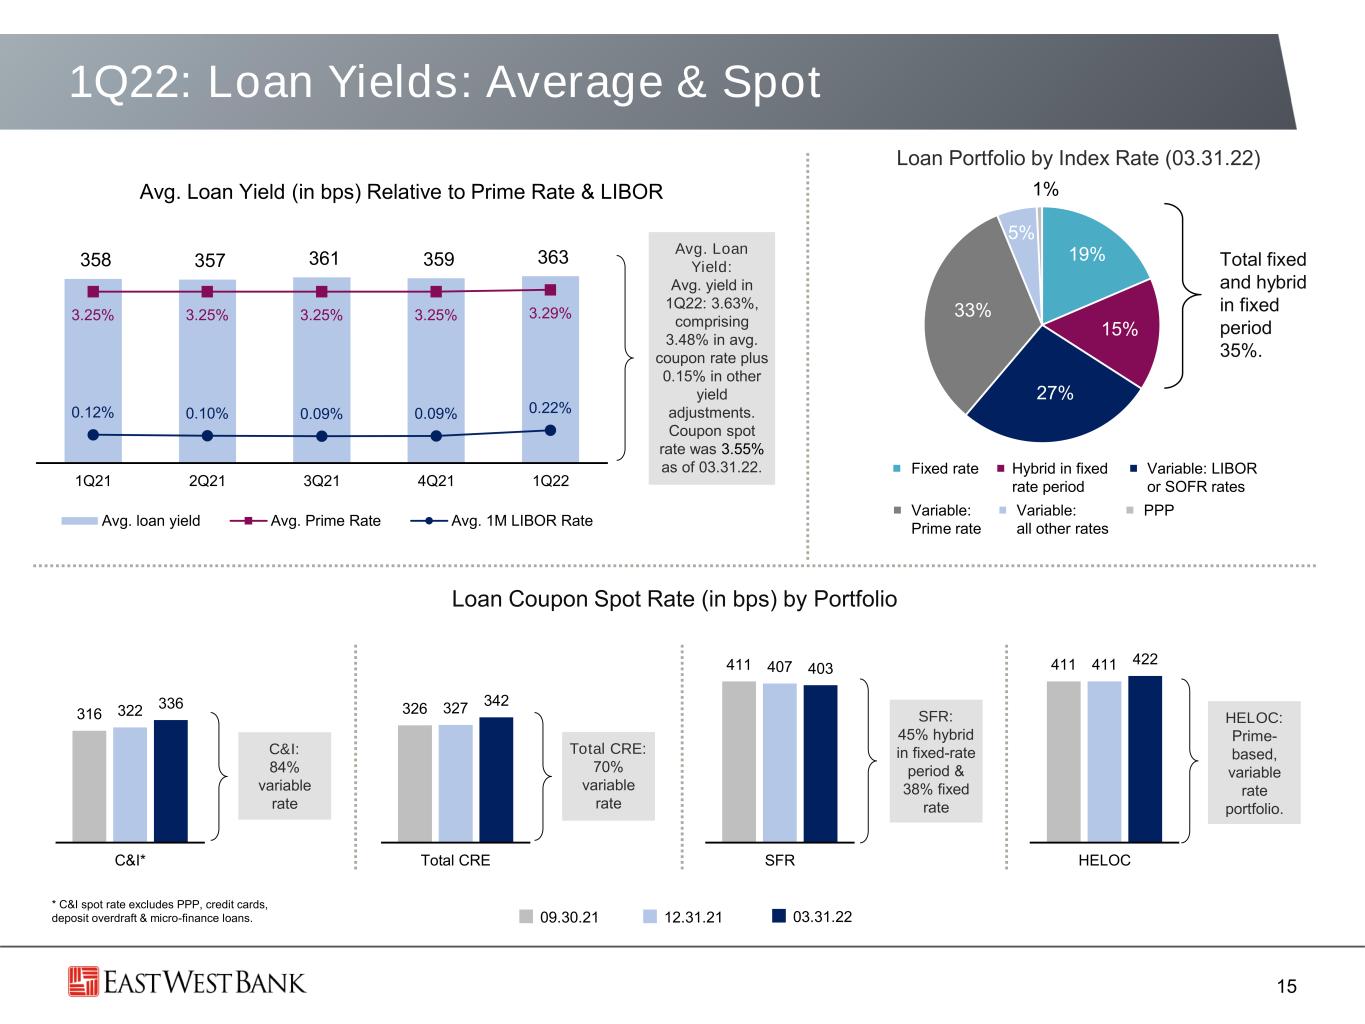
•The average loan yield was 3.63%, up four basis points from the fourth quarter.
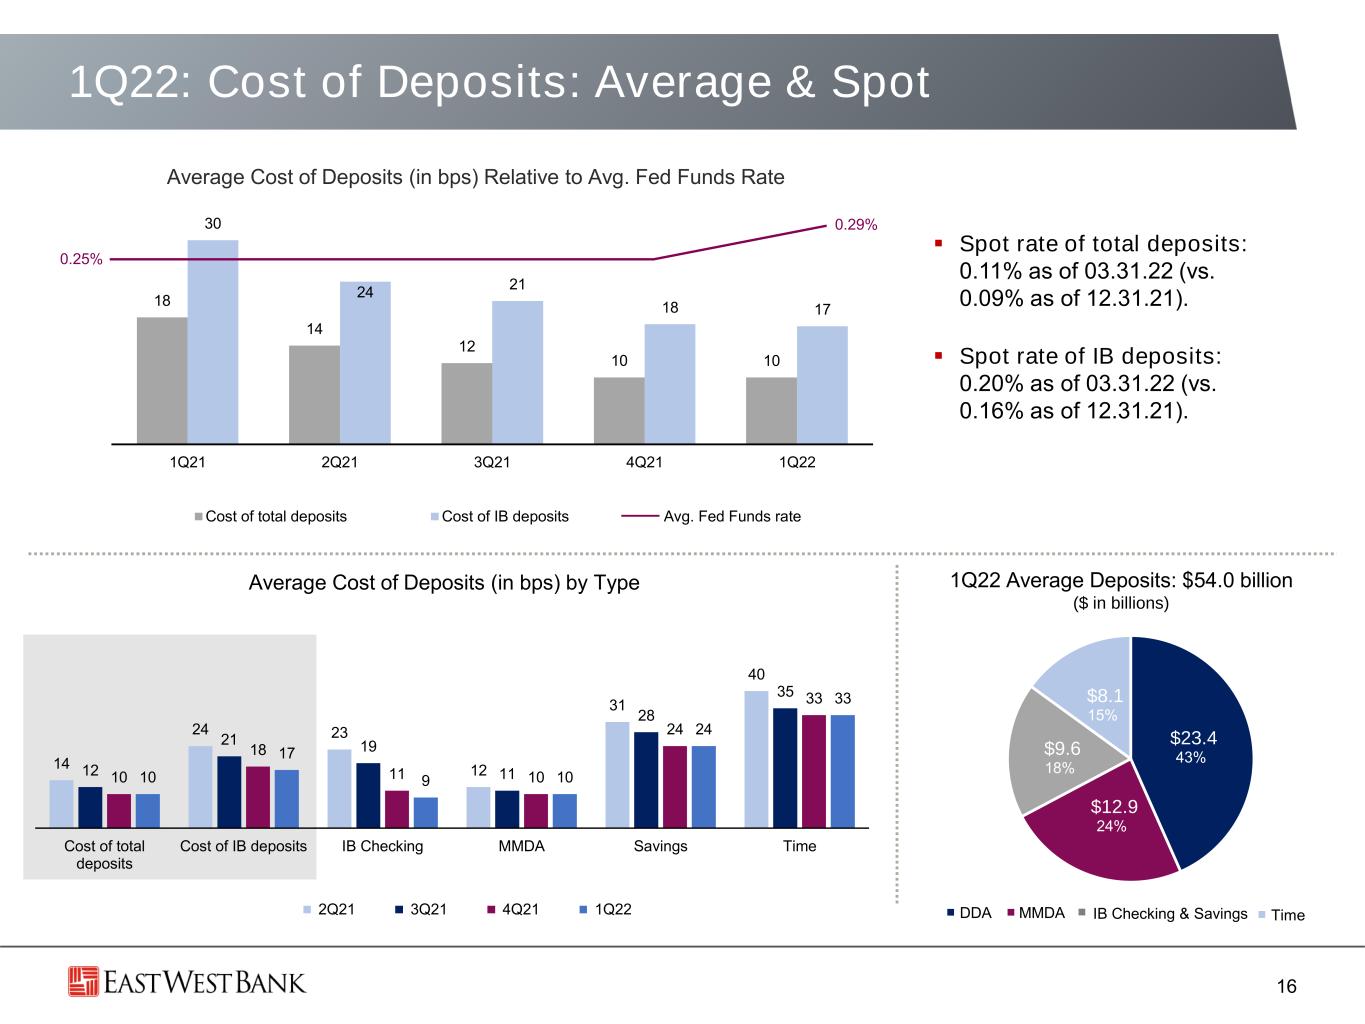
•The average cost of funds of 0.12% and the average cost of deposits of 0.10% both remained unchanged from the fourth quarter. The average cost of interest-bearing deposits of 0.17% decreased by one basis point from the fourth quarter.
Noninterest Income
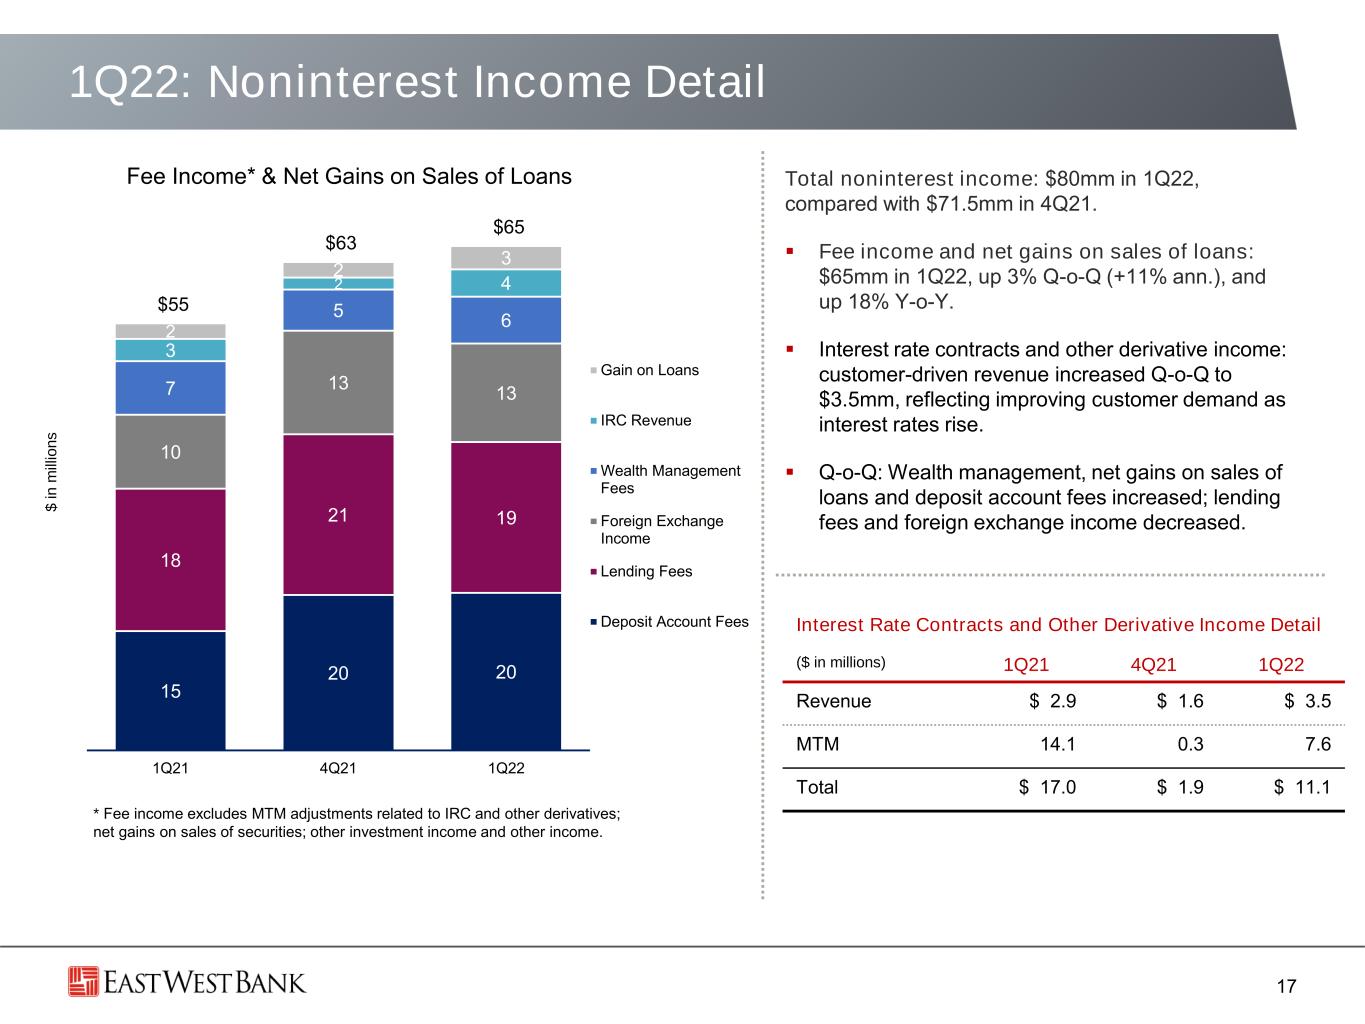
Noninterest income totaled $79.7 million in the first quarter, an increase of $8.3 million, or 12%, from $71.5 million in the fourth quarter. Customer-driven fee income and net gains on sales of loans were $65.0 million, an increase of 3% linked quarter, or 11% annualized, from $63.3 million in the fourth quarter.
Interest rate contracts (“IRC”) and other derivative income was $11.1 million in the first quarter, compared with $1.9 million in the fourth quarter. The $9.2 million quarter-over-quarter increase was largely due to a favorable change in the credit valuation adjustment, as well as higher customer-driven IRC revenue.
3
Noninterest Expense
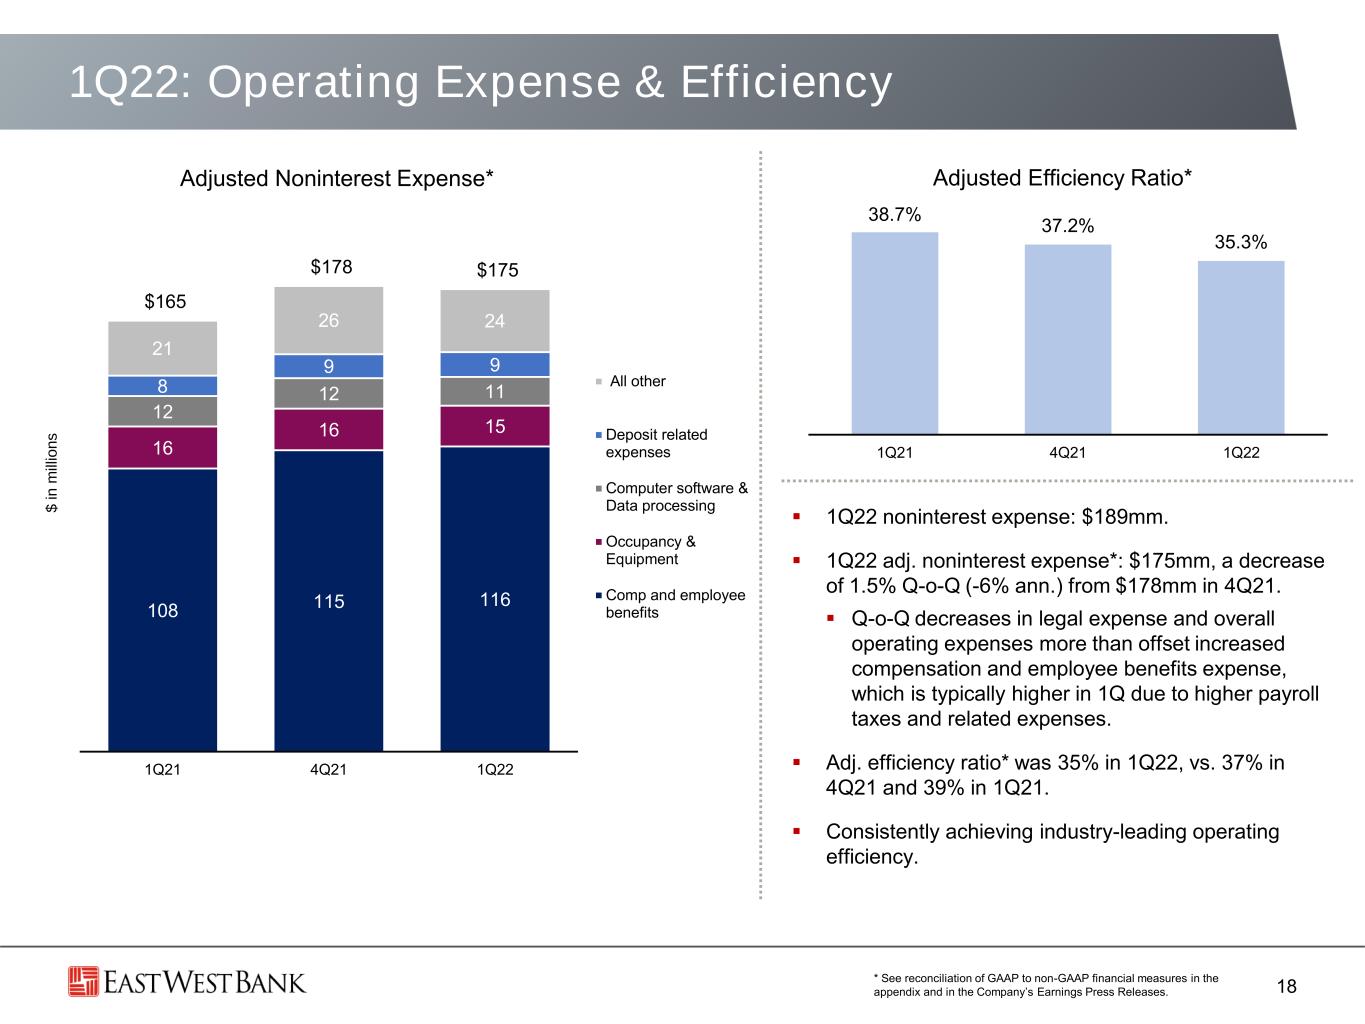
Noninterest expense totaled $189.5 million in the first quarter, compared with $210.1 million in the fourth quarter. First quarter noninterest expense consisted of $175.0 million of adjusted noninterest expense3, $13.9 million in amortization of tax credit and other investments, and $0.5 million in amortization of core deposit intangibles.
•Adjusted noninterest expense of $175.0 million decreased by 1.5%, or 6% annualized, from $177.7 million in the fourth quarter. Reductions in legal expense and overall operating expenses, including data processing, occupancy and equipment expense, and computer software expense, more than offset increased compensation and employee benefits expense, which is typically higher in the first quarter due to higher payroll taxes and related expenses.
•Amortization of tax credit and other investments totaled $13.9 million in the first quarter, compared with $31.8 million in the fourth quarter. Quarter-over-quarter variability in the amortization of tax credits and other investments partially reflects the impact of investments that close in a given period.
•The adjusted efficiency ratio3 was 35.3% in the first quarter, compared with 37.2% in the fourth quarter.
TAX RELATED ITEMS
First quarter 2022 income tax expense was $60.3 million and the effective tax rate was 20.2%, compared with income tax expense of $59.3 million and an effective tax rate of 21.4% for the fourth quarter of 2021.
ASSET QUALITY
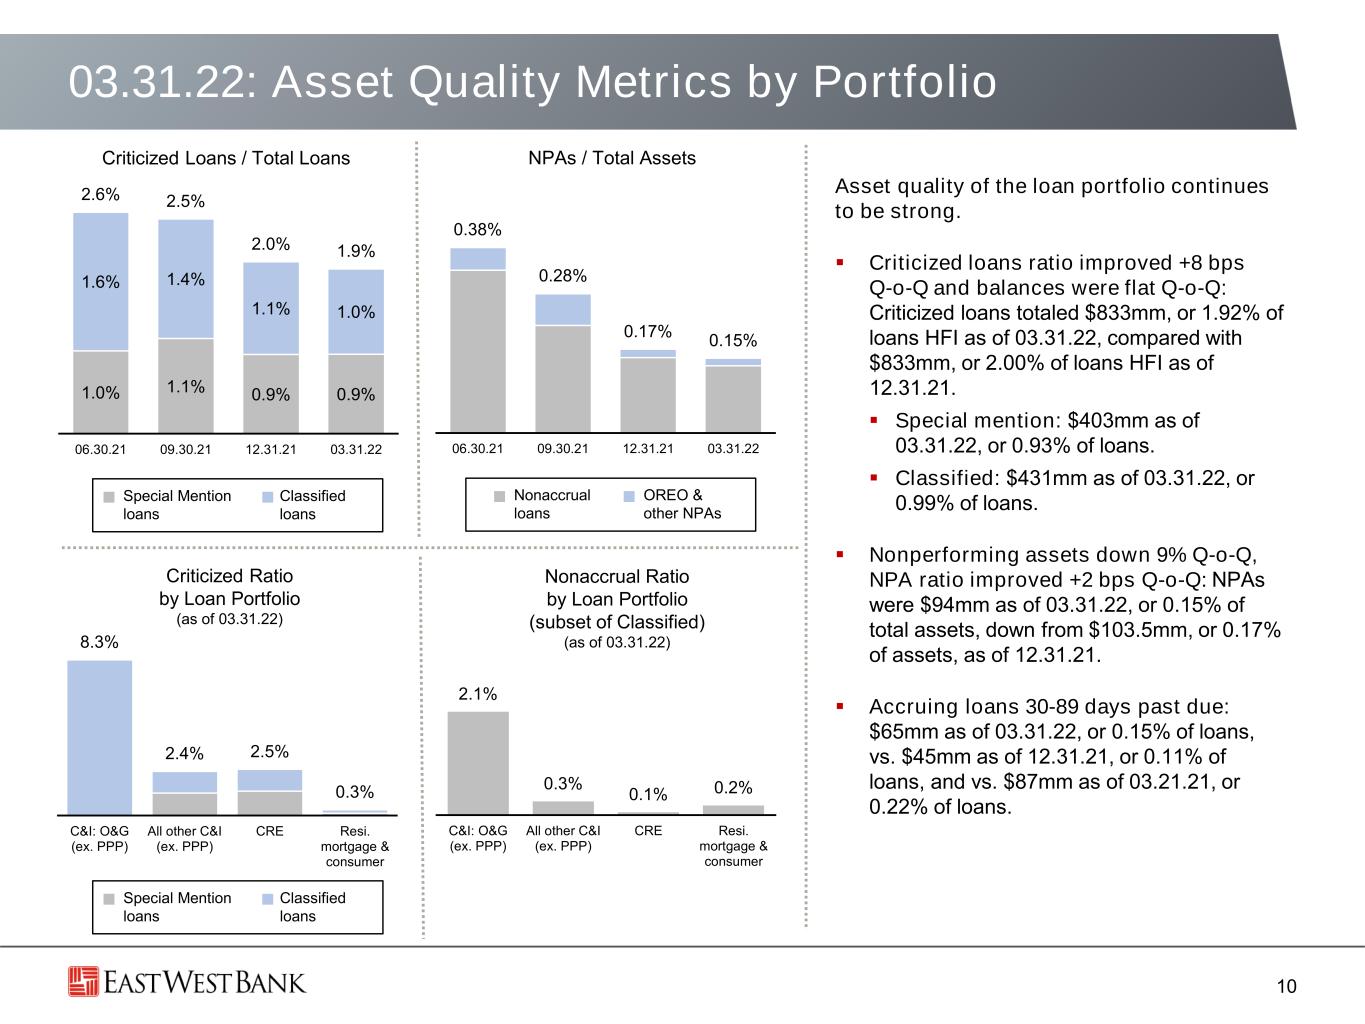
The asset quality of the loan portfolio continues to be strong.
•The nonperforming asset (“NPA”) ratio improved by two basis points quarter-over-quarter and NPAs decreased by 9%. As of March 31, 2022, NPAs were $94.4 million, or 0.15% of total assets, compared with $103.5 million, or 0.17% of total assets, as of December 31, 2021.
•The criticized loan ratio improved by eight basis points quarter-over-quarter. As of March 31, 2022, criticized loans totaled $833.3 million, or 1.92% of loans held-for-investment (“HFI”), compared with $833.1 million, or 2.00% of loans HFI, as of December 31, 2021.
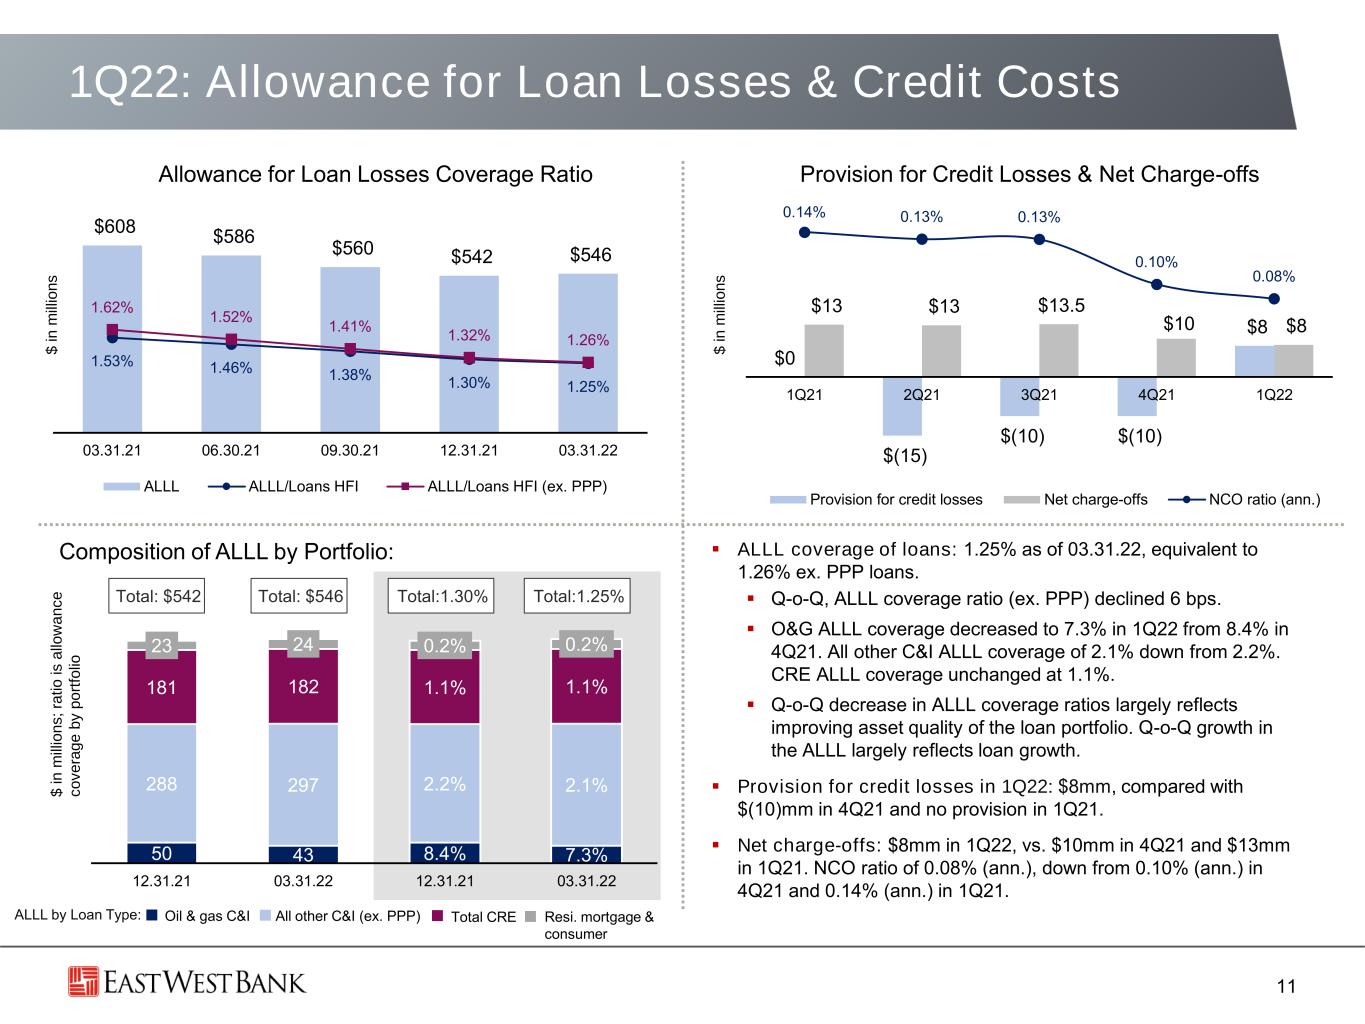
•First quarter 2022 net charge-offs were $8.3 million, or annualized 0.08% of average loans HFI, down from $9.8 million, or annualized 0.10% of average loans HFI, for the fourth quarter of 2021.
•The allowance for loan losses (“ALLL”) totaled $545.7 million, or 1.25% of loans HFI, as of March 31, 2022 compared with $541.6 million, or 1.30% of loans HFI, as of December 31, 2021. The provision for credit losses was $8.0 million for the first quarter of 2022, compared with a reversal of $10.0 million for the fourth quarter of 2021 and no provision for the first quarter of 2021. The quarter-over-quarter increase in the ALLL largely reflects loan growth. The quarter-over-quarter decrease in the ALLL coverage ratio reflects improving asset quality metrics in the loan portfolio.
3 See reconciliation of GAAP to non-GAAP financial measures in Table 10. | |||||||||||
4
CAPITAL STRENGTH
Capital levels for East West are strong. The following table presents the regulatory capital metrics as of March 31, 2022, December 31, 2021, and March 31, 2021.
| EWBC Risk-Based Capital Ratios | |||||||||||||||||||||||||||||
| ($ in millions) | March 31, 2022 (a) | December 31, 2021 (a) | March 31, 2021 (a) | ||||||||||||||||||||||||||
| CET1 capital ratio | 12.6% | 12.8% | 12.7% | ||||||||||||||||||||||||||
| Tier 1 capital ratio | 12.6% | 12.8% | 12.7% | ||||||||||||||||||||||||||
| Total capital ratio | 13.9% | 14.1% | 14.3% | ||||||||||||||||||||||||||
| Leverage ratio | 9.3% | 9.0% | 9.1% | ||||||||||||||||||||||||||
Risk-Weighted Assets (“RWA”) (b) | $45,405 | $43,585 | $39,572 | ||||||||||||||||||||||||||
(a)The Company has elected to use the 2020 CECL transition provision in the calculation of its March 31, 2022, December 31, 2021, and March 31, 2021 regulatory capital ratios. The Company’s March 31, 2022 regulatory capital ratios and RWA are preliminary.
(b)Under regulatory guidelines, on-balance sheet assets and credit equivalent amounts of derivatives and off-balance sheet items are assigned to one of several broad risk categories based on the nature of the obligor, or, if relevant, the guarantor or the nature of any collateral. The aggregate dollar value in each risk category is then multiplied by the risk weight associated with that category. The resulting weighted values from each of the risk categories are aggregated for determining total RWA.
DIVIDEND PAYOUT AND CAPITAL ACTIONS
East West’s Board of Directors has declared second quarter 2022 dividends for the Company’s common stock. The common stock cash dividend of $0.40 per share is payable on May 16, 2022 to stockholders of record on May 2, 2022.
On March 3, 2020, East West’s Board of Directors authorized the repurchase of up to $500 million of East West’s common stock, of which $354 million remains available. East West did not repurchase any shares during the first quarter of 2022, and has not repurchased any shares since the first quarter of 2020, under this authorization.
Conference Call
East West will host a conference call to discuss first quarter 2022 earnings with the public on Thursday, April 21, 2022, at 8:30 a.m. PT/11:30 a.m. ET. The public and investment community are invited to listen as management discusses first quarter 2022 results and operating developments.
•The following dial-in information is provided for participation in the conference call: calls within the U.S. – (877) 506-6399; calls within Canada – (855) 669-9657; international calls – (412) 902-6699.
•A presentation to accompany the earnings call will be available on the Investor Relations page of the Company’s website at www.eastwestbank.com/investors.
•A listen-only live broadcast of the call will also be available on the Investor Relations page of the Company’s website at www.eastwestbank.com/investors.
•A replay of the conference call will be available on April 21, 2022, at 11:30 a.m. PT through May 21, 2022. The replay numbers are: within the U.S. – (877) 344-7529; within Canada – (855) 669-9658; international calls – (412) 317-0088; and the replay access code is: 406752.
5
About East West
East West Bancorp, Inc. is a public company with total assets of $62.2 billion and is traded on the Nasdaq Global Select Market under the symbol “EWBC”. The Company’s wholly-owned subsidiary, East West Bank, is the largest independent bank headquartered in Southern California, operating over 120 locations in the United States and in China. The Company’s markets in the United States include California, Georgia, Illinois, Massachusetts, Nevada, New York, Texas and Washington. In China, East West’s presence includes full-service branches in Hong Kong, Shanghai, Shantou and Shenzhen, and representative offices in Beijing, Chongqing, Guangzhou, and Xiamen. For more information on East West, visit the Company’s website at www.eastwestbank.com.
.
Forward-Looking Statements
Certain matters set forth herein (including any exhibits hereto) contain forward-looking statements that are intended to be covered by the safe harbor for such statements provided by the Private Securities Litigation Reform Act of 1995. In addition, the Company may make forward-looking statements in other documents that it files with, or furnishes to, the U.S. Securities and Exchange Commission (“SEC”) and management may make forward-looking statements to analysts, investors, media members and others. Forward-looking statements are those that do not relate to historical facts, and that are based on current expectations, estimates and projections about the Company’s industry, management’s beliefs and certain assumptions made by management, many of which, by their nature, are inherently uncertain and beyond the Company’s control. These statements may relate to the Company’s financial condition, results of operations, plans, objectives, future performance and/or business and usually can be identified by the use of forward-looking language, such as “anticipates,” “assumes,” “believes,” “can,” “continues,” “could,” “estimates,” “expects,” “forecasts,” “goal,” “intends to,” “likely,” “may,” “might,” “objective,” “plans,” “potential,” “projects,” “remains,” “should,” “target,” “trend,” “will,” “would,” or similar expressions, and the negative thereof. You should not place undue reliance on these statements, as they are subject to risks and uncertainties, including, but not limited to, those described in the documents incorporated by reference. When considering these forward-looking statements, you should keep in mind these risks and uncertainties, as well as any cautionary statements the Company may make. Moreover, you should treat these statements as speaking only as of the date they are made and based only on information then actually known to the Company.
There are a number of important factors that could cause future results to differ materially from historical performance and these forward-looking statements. Factors that might cause such differences, include, but are not limited to: changes in the global economy, including an economic slowdown, or market disruption, level of inflation, interest rate environment, housing prices, employment levels, rate of growth and general business conditions; the impact of any future federal government shutdown and uncertainty regarding the federal government’s debt limit; changes in local, regional and global business, economic and political conditions and geopolitical events; the economic, financial, reputational and other impacts of the ongoing COVID-19 global pandemic including variants thereof and any other pandemic, epidemic or health-related crisis, as well as a deterioration of asset quality and an increase in credit losses due to the COVID-19 global pandemic; changes in laws or the regulatory environment including regulatory reform initiatives and policies of the U.S. Department of Treasury, the Federal Reserve, the Federal Deposit Insurance Corporation, the Office of the Comptroller of the Currency, the SEC, the Consumer Financial Protection Bureau, and the California Department of Financial Protection and Innovation; the changes and effects thereof in trade, monetary and fiscal policies and laws, including the ongoing economic and political disputes between the U.S. and the People’s Republic of China and the monetary policies of the Federal Reserve; changes in the commercial and consumer real estate markets; changes in consumer or commercial spending, savings and borrowing habits, and patterns and behaviors; fluctuations in the Company’s stock price; impact from potential changes to income tax laws and regulations, federal spending and economic stimulus programs; the Company’s ability to compete effectively against financial institutions in its banking markets and other entities, including as a result of emerging technologies; the soundness of other financial institutions; success and timing of the Company’s business strategies; the Company’s ability to retain key officers and employees; impact on the Company’s funding costs, net interest income and net interest margin from changes in key variable market interest rates, competition, regulatory requirements and the Company’s product mix; changes in the Company’s costs of operation, compliance and expansion; the Company’s ability to adopt and successfully integrate new technologies into its business in a strategic manner; impact of the benchmark interest rate reform in the U.S. including the transition away from USD London Interbank Offered Rate to alternative reference rates; impact of communications or technology disruption, failure in, or breach of, the Company’s operational or security systems or infrastructure, or those of third party vendors with which the Company does business, including as a result of cyber-attacks; and other similar matters which could result in, among other things, confidential and/or proprietary information being disclosed or misused and materially impact the Company’s ability to provide services to its clients; adequacy of the Company’s risk management framework, disclosure controls and procedures and internal control over financial reporting; future credit quality and performance, including the Company’s expectations regarding future credit losses and allowance levels; impact of adverse changes to the Company’s credit ratings from major credit rating agencies; impact of adverse judgments or settlements in litigation; impact on the Company’s operations due to political developments, pandemics, wars, civil unrest, terrorism or other hostilities that may disrupt or increase volatility in securities or otherwise affect business and economic conditions; heightened regulatory and governmental oversight and scrutiny of the Company’s business practices, including dealings with consumers; impact of reputational risk from negative publicity, fines, penalties and other negative consequences from regulatory violations, legal actions and the Company’s interactions with business partners, counterparties, service providers and other third parties; impact of regulatory enforcement actions; changes in accounting standards as may be required by the Financial Accounting Standards Board or other regulatory agencies and their impact on critical accounting policies and assumptions; the Company’s capital requirements and its ability to generate capital internally or raise capital on favorable terms; impact on the Company’s liquidity due to changes in the Company’s ability to receive dividends from its subsidiaries; any future strategic acquisitions or divestitures; changes in the equity and debt securities markets; fluctuations in foreign currency exchange rates; impact of increased focus on social, environmental and sustainability matters, which may affect the Company’s operations as well as those of its customers and the economy more broadly; significant turbulence or disruption in the capital or financial markets, which could result in, among other things, a reduction in the availability of funding or increases in funding costs, declines in asset values and/or recognition of allowance for credit losses on securities held in the Company’s debt securities portfolio; and impact of climate change, natural or man-made disasters or calamities, such as wildfires, droughts and earthquakes, all of which are particularly common in California, or other events that may directly or indirectly result in a negative impact on the Company’s financial performance.
For a more detailed discussion of some of the factors that might cause such differences, see the Company’s 2021 Form 10-K under the heading Item 1A. Risk Factors and the information set forth under Item 1A. Risk Factors in the Company’s Quarterly Reports on Form 10-Q. The Company does not undertake, and specifically disclaims any obligation to update or revise any forward-looking statements to reflect the occurrence of events or circumstances after the date of such statements except as required by law.
6
| EAST WEST BANCORP, INC. AND SUBSIDIARIES | |||||||||||||||||||||||||||||||||||||||||
| CONDENSED CONSOLIDATED BALANCE SHEET | |||||||||||||||||||||||||||||||||||||||||
| ($ and shares in thousands, except per share data) | |||||||||||||||||||||||||||||||||||||||||
| (unaudited) | |||||||||||||||||||||||||||||||||||||||||
| Table 1 | |||||||||||||||||||||||||||||||||||||||||
| March 31, 2022 % or Basis Point Change | |||||||||||||||||||||||||||||||||||||||||
| March 31, 2022 | December 31, 2021 | March 31, 2021 | Qtr-o-Qtr | Yr-o-Yr | |||||||||||||||||||||||||||||||||||||
| Assets | |||||||||||||||||||||||||||||||||||||||||
| Cash and due from banks | $ | 571,571 | $ | 527,317 | $ | 582,270 | 8.4 | % | (1.8) | % | |||||||||||||||||||||||||||||||
| Interest-bearing cash with banks | 3,277,129 | 3,385,618 | 4,036,863 | (3.2) | (18.8) | ||||||||||||||||||||||||||||||||||||
| Cash and cash equivalents | 3,848,700 | 3,912,935 | 4,619,133 | (1.6) | (16.7) | ||||||||||||||||||||||||||||||||||||
| Interest-bearing deposits with banks | 816,125 | 736,492 | 741,923 | 10.8 | 10.0 | ||||||||||||||||||||||||||||||||||||
| Assets purchased under resale agreements (“resale agreements”) | 1,956,822 | 2,353,503 | 2,160,038 | (16.9) | (9.4) | ||||||||||||||||||||||||||||||||||||
| Available-for-sale (“AFS”) debt securities (amortized cost of $7,091,581, $10,087,179 and $7,904,546) | 6,729,431 | 9,965,353 | 7,789,213 | (32.5) | (13.6) | ||||||||||||||||||||||||||||||||||||
| Held-to-maturity (“HTM”) debt securities, at amortized cost (fair value of $2,815,968 in 2022) | 2,997,702 | — | — | 100.0 | 100.0 | ||||||||||||||||||||||||||||||||||||
| Loans held-for-sale (“HFS”) | 631 | 635 | — | (0.6) | 100.0 | ||||||||||||||||||||||||||||||||||||
| Loans held-for-investment (''HFI'') (net of allowance for loan losses of $545,685, $541,579 and $607,506) | 42,944,997 | 41,152,202 | 38,981,242 | 4.4 | 10.2 | ||||||||||||||||||||||||||||||||||||
| Investments in qualified affordable housing partnerships, tax credit and other investments, net | 607,985 | 628,263 | 646,300 | (3.2) | (5.9) | ||||||||||||||||||||||||||||||||||||
| Goodwill | 465,697 | 465,697 | 465,697 | — | — | ||||||||||||||||||||||||||||||||||||
| Operating lease right-of-use assets | 102,491 | 98,632 | 94,483 | 3.9 | 8.5 | ||||||||||||||||||||||||||||||||||||
| Other assets | 1,770,875 | 1,556,989 | 1,376,117 | 13.7 | 28.7 | ||||||||||||||||||||||||||||||||||||
| Total assets | $ | 62,241,456 | $ | 60,870,701 | $ | 56,874,146 | 2.3 | % | 9.4 | % | |||||||||||||||||||||||||||||||
| Liabilities and Stockholders’ Equity | |||||||||||||||||||||||||||||||||||||||||
| Deposits | $ | 54,938,361 | $ | 53,350,532 | $ | 49,547,136 | 3.0 | % | 10.9 | % | |||||||||||||||||||||||||||||||
| FHLB advances | 74,619 | 249,331 | 653,035 | (70.1) | (88.6) | ||||||||||||||||||||||||||||||||||||
| Assets sold under repurchase agreements (“repurchase agreements”) | 300,000 | 300,000 | 300,000 | — | — | ||||||||||||||||||||||||||||||||||||
| Long-term debt and finance lease liabilities | 152,227 | 151,997 | 152,195 | 0.2 | 0.0 | ||||||||||||||||||||||||||||||||||||
| Operating lease liabilities | 109,656 | 105,534 | 101,828 | 3.9 | 7.7 | ||||||||||||||||||||||||||||||||||||
| Accrued expenses and other liabilities | 963,137 | 876,089 | 834,925 | 9.9 | 15.4 | ||||||||||||||||||||||||||||||||||||
| Total liabilities | 56,538,000 | 55,033,483 | 51,589,119 | 2.7 | 9.6 | ||||||||||||||||||||||||||||||||||||
| Stockholders’ equity | 5,703,456 | 5,837,218 | 5,285,027 | (2.3) | 7.9 | ||||||||||||||||||||||||||||||||||||
| Total liabilities and stockholders’ equity | $ | 62,241,456 | $ | 60,870,701 | $ | 56,874,146 | 2.3 | % | 9.4 | % | |||||||||||||||||||||||||||||||
| Book value per common share | $ | 40.09 | $ | 41.13 | $ | 37.26 | (2.5) | % | 7.6 | % | |||||||||||||||||||||||||||||||
Tangible equity (1) per common share | $ | 36.76 | $ | 37.79 | $ | 33.90 | (2.7) | 8.4 | |||||||||||||||||||||||||||||||||
| Number of common shares at period-end | 142,257 | 141,908 | 141,843 | 0.2 | 0.3 | ||||||||||||||||||||||||||||||||||||
Tangible equity to tangible assets ratio (1) | 8.47 | % | 8.88 | % | 8.53 | % | (41) | bps | (6) | bps | |||||||||||||||||||||||||||||||
(1)See reconciliation of GAAP to non-GAAP financial measures in Table 11.
7
| EAST WEST BANCORP, INC. AND SUBSIDIARIES | |||||||||||||||||||||||||||||||||||
| TOTAL LOANS AND DEPOSITS DETAIL | |||||||||||||||||||||||||||||||||||
| ($ in thousands) | |||||||||||||||||||||||||||||||||||
| (unaudited) | |||||||||||||||||||||||||||||||||||
| Table 2 | |||||||||||||||||||||||||||||||||||
| March 31, 2022 % Change | |||||||||||||||||||||||||||||||||||
| March 31, 2022 | December 31, 2021 | March 31, 2021 | Qtr-o-Qtr | Yr-o-Yr | |||||||||||||||||||||||||||||||
| Loans: | |||||||||||||||||||||||||||||||||||
Commercial: | |||||||||||||||||||||||||||||||||||
Commercial and industrial (“C&I”) (1) | $ | 14,838,134 | $ | 14,150,608 | $ | 14,081,110 | 4.9 | % | 5.4 | % | |||||||||||||||||||||||||
Commercial real estate (“CRE”): | |||||||||||||||||||||||||||||||||||
CRE | 12,636,787 | 12,155,047 | 11,563,034 | 4.0 | 9.3 | ||||||||||||||||||||||||||||||
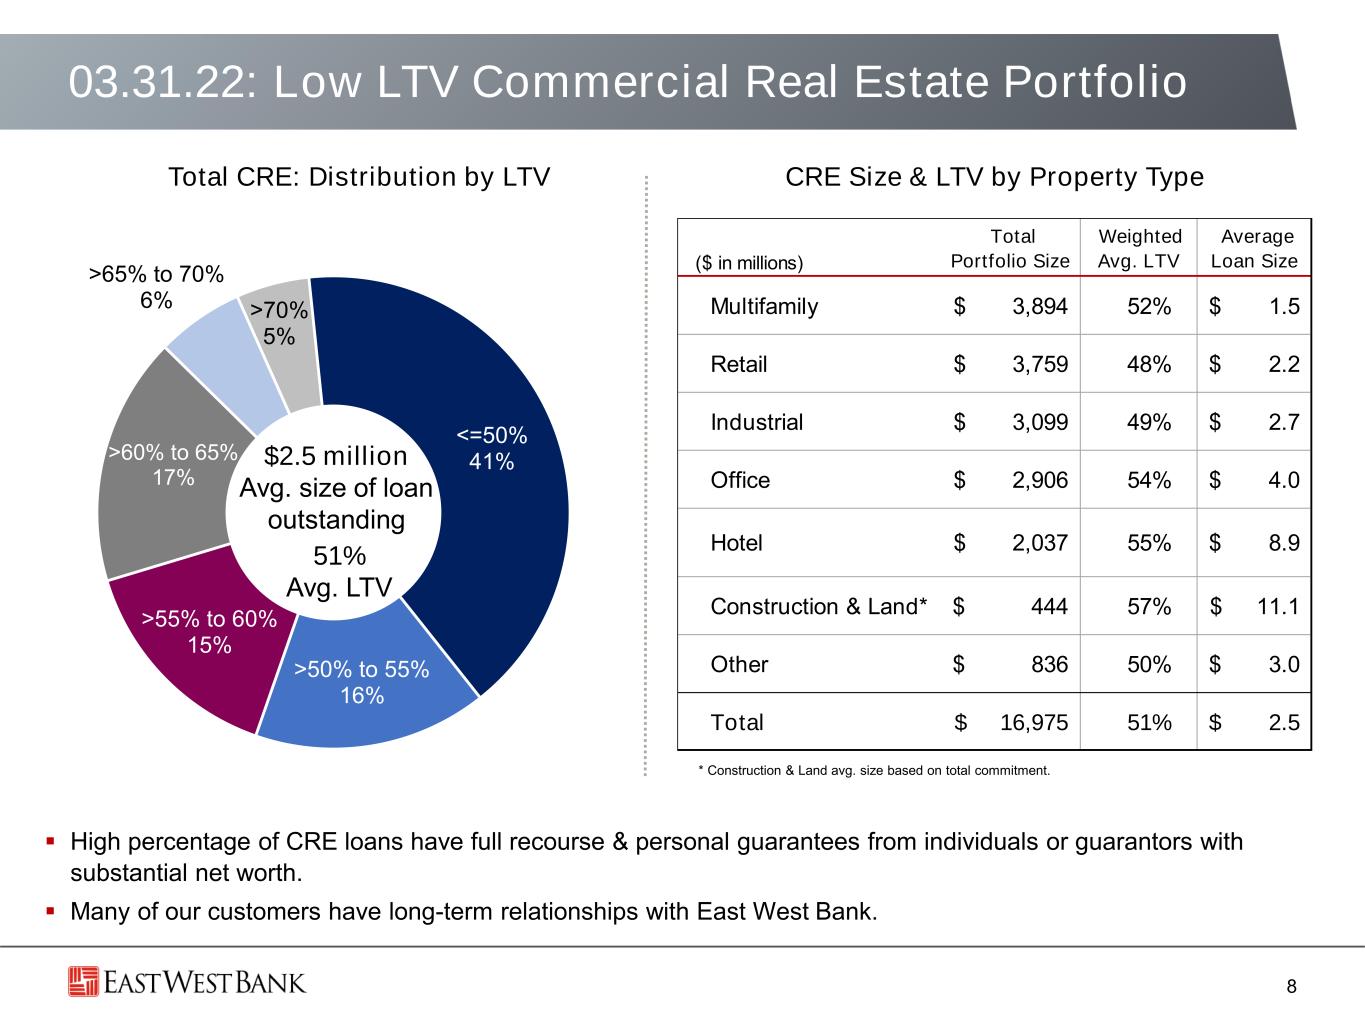
Multifamily residential | 3,894,463 | 3,675,605 | 3,066,515 | 6.0 | 27.0 | ||||||||||||||||||||||||||||||
Construction and land | 443,836 | 346,486 | 459,254 | 28.1 | (3.4) | ||||||||||||||||||||||||||||||
Total CRE | 16,975,086 | 16,177,138 | 15,088,803 | 4.9 | 12.5 | ||||||||||||||||||||||||||||||
Consumer: | |||||||||||||||||||||||||||||||||||
Residential mortgage: | |||||||||||||||||||||||||||||||||||
Single-family residential | 9,283,429 | 9,093,702 | 8,524,287 | 2.1 | 8.9 | ||||||||||||||||||||||||||||||
| Home equity lines of credit (“HELOCs”) | 2,266,634 | 2,144,821 | 1,749,172 | 5.7 | 29.6 | ||||||||||||||||||||||||||||||
Total residential mortgage | 11,550,063 | 11,238,523 | 10,273,459 | 2.8 | 12.4 | ||||||||||||||||||||||||||||||
Other consumer | 127,399 | 127,512 | 145,376 | (0.1) | (12.4) | ||||||||||||||||||||||||||||||
Total loans HFI (2) | 43,490,682 | 41,693,781 | 39,588,748 | 4.3 | 9.9 | ||||||||||||||||||||||||||||||
Loans HFS | 631 | 635 | — | (0.6) | 100.0 | ||||||||||||||||||||||||||||||
Total loans (1)(2) | 43,491,313 | 41,694,416 | 39,588,748 | 4.3 | 9.9 | ||||||||||||||||||||||||||||||
| Allowance for loan losses | (545,685) | (541,579) | (607,506) | 0.8 | (10.2) | ||||||||||||||||||||||||||||||
Net loans (2) | $ | 42,945,628 | $ | 41,152,837 | $ | 38,981,242 | 4.4 | 10.2 | |||||||||||||||||||||||||||
Deposits: | |||||||||||||||||||||||||||||||||||
Noninterest-bearing demand | $ | 24,927,768 | $ | 22,845,464 | $ | 18,919,298 | 9.1 | % | 31.8 | % | |||||||||||||||||||||||||
Interest-bearing checking | 6,774,826 | 6,524,721 | 7,005,693 | 3.8 | (3.3) | ||||||||||||||||||||||||||||||
Money market | 12,108,432 | 13,130,300 | 12,218,957 | (7.8) | (0.9) | ||||||||||||||||||||||||||||||
Savings | 2,897,248 | 2,888,065 | 2,604,355 | 0.3 | 11.2 | ||||||||||||||||||||||||||||||
Time deposits | 8,230,087 | 7,961,982 | 8,798,833 | 3.4 | (6.5) | ||||||||||||||||||||||||||||||
Total deposits | $ | 54,938,361 | $ | 53,350,532 | $ | 49,547,136 | 3.0 | % | 10.9 | % | |||||||||||||||||||||||||
(1)Includes $318.1 million, $534.2 million and $2.07 billion of Paycheck Protection Program (“PPP”) loans as of March 31, 2022, December 31, 2021 and March 31, 2021, respectively. Excluding PPP loans, total loans were $43.17 billion, $41.16 billion and $37.52 billion as of March 31, 2022, December 31, 2021 and March 31, 2021, respectively.
(2)Includes net deferred loan fees, unearned fees, unamortized premiums and unaccreted discounts of $(42.7) million, $(50.7) million and $(76.9) million as of March 31, 2022, December 31, 2021 and March 31, 2021, respectively.
8
| EAST WEST BANCORP, INC. AND SUBSIDIARIES | |||||||||||||||||||||||||||||||||||
| CONDENSED CONSOLIDATED STATEMENT OF INCOME | |||||||||||||||||||||||||||||||||||
| ($ and shares in thousands, except per share data) | |||||||||||||||||||||||||||||||||||
| (unaudited) | |||||||||||||||||||||||||||||||||||
| Table 3 | |||||||||||||||||||||||||||||||||||
| Three Months Ended | March 31, 2022 % Change | ||||||||||||||||||||||||||||||||||
| March 31, 2022 | December 31, 2021 | March 31, 2021 | Qtr-o-Qtr | Yr-o-Yr | |||||||||||||||||||||||||||||||
Interest and dividend income (1) | $ | 432,029 | $ | 422,708 | $ | 381,386 | 2.2 | % | 13.3 | % | |||||||||||||||||||||||||
Interest expense | 16,416 | 17,011 | 27,691 | (3.5) | (40.7) | ||||||||||||||||||||||||||||||
| Net interest income before provision for (reversal of) credit losses | 415,613 | 405,697 | 353,695 | 2.4 | 17.5 | ||||||||||||||||||||||||||||||
| Provision for (reversal of) credit losses | 8,000 | (10,000) | — | (180.0) | 100.0 | ||||||||||||||||||||||||||||||
| Net interest income after provision for (reversal of) credit losses | 407,613 | 415,697 | 353,695 | (1.9) | 15.2 | ||||||||||||||||||||||||||||||
| Noninterest income | 79,743 | 71,489 | 72,866 | 11.5 | 9.4 | ||||||||||||||||||||||||||||||
| Noninterest expense | 189,450 | 210,105 | 191,077 | (9.8) | (0.9) | ||||||||||||||||||||||||||||||
Income before income taxes | 297,906 | 277,081 | 235,484 | 7.5 | 26.5 | ||||||||||||||||||||||||||||||
Income tax expense | 60,254 | 59,285 | 30,490 | 1.6 | 97.6 | ||||||||||||||||||||||||||||||
Net income | $ | 237,652 | $ | 217,796 | $ | 204,994 | 9.1 | % | 15.9 | % | |||||||||||||||||||||||||
Earnings per share (“EPS”) | |||||||||||||||||||||||||||||||||||
- Basic | $ | 1.67 | $ | 1.53 | $ | 1.45 | 9.0 | % | 15.6 | % | |||||||||||||||||||||||||
- Diluted | $ | 1.66 | $ | 1.52 | $ | 1.44 | 9.2 | 15.6 | |||||||||||||||||||||||||||
Weighted-average number of shares outstanding | |||||||||||||||||||||||||||||||||||
- Basic | 142,025 | 141,907 | 141,646 | 0.1 | % | 0.3 | % | ||||||||||||||||||||||||||||
- Diluted | 143,223 | 143,323 | 142,844 | (0.1) | 0.3 | ||||||||||||||||||||||||||||||
| Three Months Ended | March 31, 2022 % Change | ||||||||||||||||||||||||||||||||||
| March 31, 2022 | December 31, 2021 | March 31, 2021 | Qtr-o-Qtr | Yr-o-Yr | |||||||||||||||||||||||||||||||
Noninterest income: | |||||||||||||||||||||||||||||||||||
Lending fees | $ | 19,438 | $ | 20,739 | $ | 18,357 | (6.3) | % | 5.9 | % | |||||||||||||||||||||||||
| Deposit account fees | 20,315 | 20,028 | 15,383 | 1.4 | 32.1 | ||||||||||||||||||||||||||||||
| Interest rate contracts and other derivative income | 11,133 | 1,932 | 16,997 | 476.2 | (34.5) | ||||||||||||||||||||||||||||||
Foreign exchange income | 12,699 | 13,343 | 9,526 | (4.8) | 33.3 | ||||||||||||||||||||||||||||||
Wealth management fees | 6,052 | 5,291 | 6,911 | 14.4 | (12.4) | ||||||||||||||||||||||||||||||
Net gains on sales of loans | 2,922 | 2,308 | 1,781 | 26.6 | 64.1 | ||||||||||||||||||||||||||||||
Gains on sales of AFS debt securities | 1,278 | 390 | 192 | 227.7 | 565.6 | ||||||||||||||||||||||||||||||
| Other investment income | 1,627 | 2,982 | 925 | (45.4) | 75.9 | ||||||||||||||||||||||||||||||
Other income | 4,279 | 4,476 | 2,794 | (4.4) | 53.1 | ||||||||||||||||||||||||||||||
| Total noninterest income | $ | 79,743 | $ | 71,489 | $ | 72,866 | 11.5 | % | 9.4 | % | |||||||||||||||||||||||||
Noninterest expense: | |||||||||||||||||||||||||||||||||||
Compensation and employee benefits | $ | 116,269 | $ | 114,743 | $ | 107,808 | 1.3 | % | 7.8 | % | |||||||||||||||||||||||||
Occupancy and equipment expense | 15,464 | 15,846 | 15,922 | (2.4) | (2.9) | ||||||||||||||||||||||||||||||
Deposit insurance premiums and regulatory assessments | 4,717 | 4,772 | 3,876 | (1.2) | 21.7 | ||||||||||||||||||||||||||||||
| Deposit account expense | 4,693 | 4,307 | 3,892 | 9.0 | 20.6 | ||||||||||||||||||||||||||||||
| Data processing | 3,665 | 4,175 | 4,478 | (12.2) | (18.2) | ||||||||||||||||||||||||||||||
| Computer software expense | 7,294 | 7,494 | 7,159 | (2.7) | 1.9 | ||||||||||||||||||||||||||||||
| Consulting expense | 1,833 | 1,539 | 1,475 | 19.1 | 24.3 | ||||||||||||||||||||||||||||||
Legal expense | 718 | 2,175 | 1,502 | (67.0) | (52.2) | ||||||||||||||||||||||||||||||
Other operating expense | 20,897 | 23,254 | 19,607 | (10.1) | 6.6 | ||||||||||||||||||||||||||||||
| Amortization of tax credit and other investments | 13,900 | 31,800 | 25,358 | (56.3) | (45.2) | ||||||||||||||||||||||||||||||
| Total noninterest expense | $ | 189,450 | $ | 210,105 | $ | 191,077 | (9.8) | % | (0.9) | % | |||||||||||||||||||||||||
(1)Includes $5.2 million, $9.6 million and $15.0 million of interest income related to PPP loans for the three months ended March 31, 2022, December 31, 2021 and March 31, 2021, respectively.
9
| EAST WEST BANCORP, INC. AND SUBSIDIARIES | |||||||||||||||||||||||||||||||||||
| SELECTED AVERAGE BALANCES | |||||||||||||||||||||||||||||||||||
| ($ in thousands) | |||||||||||||||||||||||||||||||||||
| (unaudited) | |||||||||||||||||||||||||||||||||||
| Table 4 | |||||||||||||||||||||||||||||||||||
| Three Months Ended | March 31, 2022 % Change | ||||||||||||||||||||||||||||||||||
| March 31, 2022 | December 31, 2021 | March 31, 2021 | Qtr-o-Qtr | Yr-o-Yr | |||||||||||||||||||||||||||||||
Loans: | |||||||||||||||||||||||||||||||||||
Commercial: | |||||||||||||||||||||||||||||||||||
C&I (1) | $ | 14,271,902 | $ | 13,592,203 | $ | 13,693,869 | 5.0% | 4.2% | |||||||||||||||||||||||||||
| CRE: | |||||||||||||||||||||||||||||||||||
CRE | 12,279,365 | 11,954,535 | 11,325,679 | 2.7 | 8.4 | ||||||||||||||||||||||||||||||
Multifamily residential | 3,749,571 | 3,434,274 | 3,042,079 | 9.2 | 23.3 | ||||||||||||||||||||||||||||||
Construction and land | 392,923 | 340,940 | 549,337 | 15.2 | (28.5) | ||||||||||||||||||||||||||||||
Total CRE | 16,421,859 | 15,729,749 | 14,917,095 | 4.4 | 10.1 | ||||||||||||||||||||||||||||||
Consumer: | |||||||||||||||||||||||||||||||||||
Residential mortgage: | |||||||||||||||||||||||||||||||||||
Single-family residential | 9,111,188 | 9,031,677 | 8,315,052 | 0.9 | 9.6 | ||||||||||||||||||||||||||||||
HELOCs | 2,183,080 | 2,052,383 | 1,666,233 | 6.4 | 31.0 | ||||||||||||||||||||||||||||||
Total residential mortgage | 11,294,268 | 11,084,060 | 9,981,285 | 1.9 | 13.2 | ||||||||||||||||||||||||||||||
Other consumer | 124,389 | 126,557 | 137,058 | (1.7) | (9.2) | ||||||||||||||||||||||||||||||
Total loans (2) | $ | 42,112,418 | $ | 40,532,569 | $ | 38,729,307 | 3.9% | 8.7% | |||||||||||||||||||||||||||
Interest-earning assets | $ | 58,692,366 | $ | 58,944,082 | $ | 52,852,045 | (0.4)% | 11.1% | |||||||||||||||||||||||||||
Total assets | $ | 61,758,048 | $ | 62,183,137 | $ | 55,594,283 | (0.7)% | 11.1% | |||||||||||||||||||||||||||
| Deposits: | |||||||||||||||||||||||||||||||||||
Noninterest-bearing demand | $ | 23,432,746 | $ | 24,019,333 | $ | 18,093,696 | (2.4)% | 29.5% | |||||||||||||||||||||||||||
Interest-bearing checking | 6,648,065 | 6,462,471 | 6,393,034 | 2.9 | 4.0 | ||||||||||||||||||||||||||||||
Money market | 12,913,336 | 12,920,174 | 11,573,847 | (0.1) | 11.6 | ||||||||||||||||||||||||||||||
Savings | 2,930,309 | 2,841,352 | 2,674,476 | 3.1 | 9.6 | ||||||||||||||||||||||||||||||
Time deposits | 8,100,890 | 8,072,917 | 9,112,662 | 0.3 | (11.1) | ||||||||||||||||||||||||||||||
Total deposits | $ | 54,025,346 | $ | 54,316,247 | $ | 47,847,715 | (0.5)% | 12.9% | |||||||||||||||||||||||||||
Interest-bearing liabilities | $ | 31,218,479 | $ | 31,011,536 | $ | 30,863,568 | 0.7% | 1.1% | |||||||||||||||||||||||||||
Stockholders’ equity | $ | 5,842,615 | $ | 5,786,237 | $ | 5,338,098 | 1.0% | 9.5% | |||||||||||||||||||||||||||
(1)Average balances of PPP loans were $410.6 million, $677.2 million and $1.93 billion for the three months ended March 31, 2022, December 31, 2021 and March 31, 2021, respectively.
(2)Includes loans HFS.
10
| EAST WEST BANCORP, INC. AND SUBSIDIARIES | |||||||||||||||||||||||||||||||||||||||||
| QUARTER-TO-DATE AVERAGE BALANCES, YIELDS AND RATES | |||||||||||||||||||||||||||||||||||||||||
| ($ in thousands) | |||||||||||||||||||||||||||||||||||||||||
| (unaudited) | |||||||||||||||||||||||||||||||||||||||||
| Table 5 | |||||||||||||||||||||||||||||||||||||||||
| Three Months Ended | |||||||||||||||||||||||||||||||||||||||||
| March 31, 2022 | December 31, 2021 | ||||||||||||||||||||||||||||||||||||||||
| Average | Average | Average | Average | ||||||||||||||||||||||||||||||||||||||
| Balance | Interest | Yield/Rate (1) | Balance | Interest | Yield/Rate (1) | ||||||||||||||||||||||||||||||||||||
Assets | |||||||||||||||||||||||||||||||||||||||||
Interest-earning assets: | |||||||||||||||||||||||||||||||||||||||||
Interest-bearing cash and deposits with banks | $ | 4,466,012 | $ | 3,260 | 0.30 | % | $ | 6,050,870 | $ | 3,750 | 0.25 | % | |||||||||||||||||||||||||||||
| Resale agreements | 2,097,998 | 8,383 | 1.62 | % | 2,440,636 | 9,162 | 1.49 | % | |||||||||||||||||||||||||||||||||
| AFS debt securities | 7,969,795 | 34,469 | 1.75 | % | 9,842,691 | 42,367 | 1.71 | % | |||||||||||||||||||||||||||||||||
| HTM debt securities | 1,968,568 | 8,198 | 1.69 | % | — | — | — | % | |||||||||||||||||||||||||||||||||
Loans (2) | 42,112,418 | 377,110 | 3.63 | % | 40,532,569 | 366,936 | 3.59 | % | |||||||||||||||||||||||||||||||||
FHLB and FRB stock | 77,575 | 609 | 3.18 | % | 77,316 | 493 | 2.53 | % | |||||||||||||||||||||||||||||||||
Total interest-earning assets | 58,692,366 | 432,029 | 2.99 | % | 58,944,082 | 422,708 | 2.85 | % | |||||||||||||||||||||||||||||||||
Noninterest-earning assets: | |||||||||||||||||||||||||||||||||||||||||
Cash and due from banks | 641,882 | 652,126 | |||||||||||||||||||||||||||||||||||||||
| Allowance for loan losses | (543,345) | (558,645) | |||||||||||||||||||||||||||||||||||||||
Other assets | 2,967,145 | 3,145,574 | |||||||||||||||||||||||||||||||||||||||
Total assets | $ | 61,758,048 | $ | 62,183,137 | |||||||||||||||||||||||||||||||||||||
Liabilities and Stockholders’ Equity | |||||||||||||||||||||||||||||||||||||||||
Interest-bearing liabilities: | |||||||||||||||||||||||||||||||||||||||||
Checking deposits | $ | 6,648,065 | $ | 1,402 | 0.09 | % | $ | 6,462,471 | $ | 1,846 | 0.11 | % | |||||||||||||||||||||||||||||
Money market deposits | 12,913,336 | 3,203 | 0.10 | % | 12,920,174 | 3,172 | 0.10 | % | |||||||||||||||||||||||||||||||||
Savings deposits | 2,930,309 | 1,704 | 0.24 | % | 2,841,352 | 1,734 | 0.24 | % | |||||||||||||||||||||||||||||||||
Time deposits | 8,100,890 | 6,680 | 0.33 | % | 8,072,917 | 6,617 | 0.33 | % | |||||||||||||||||||||||||||||||||
Federal funds purchased and other short-term borrowings | 1,866 | 9 | 1.96 | % | 730 | — | — | % | |||||||||||||||||||||||||||||||||
FHLB advances | 160,018 | 578 | 1.46 | % | 249,048 | 856 | 1.36 | % | |||||||||||||||||||||||||||||||||
| Repurchase agreements | 311,984 | 2,016 | 2.62 | % | 313,075 | 2,018 | 2.56 | % | |||||||||||||||||||||||||||||||||
Long-term debt and finance lease liabilities | 152,011 | 824 | 2.20 | % | 151,769 | 768 | 2.01 | % | |||||||||||||||||||||||||||||||||
Total interest-bearing liabilities | 31,218,479 | 16,416 | 0.21 | % | 31,011,536 | 17,011 | 0.22 | % | |||||||||||||||||||||||||||||||||
Noninterest-bearing liabilities and stockholders’ equity: | |||||||||||||||||||||||||||||||||||||||||
Demand deposits | 23,432,746 | 24,019,333 | |||||||||||||||||||||||||||||||||||||||
Accrued expenses and other liabilities | 1,264,208 | 1,366,031 | |||||||||||||||||||||||||||||||||||||||
Stockholders’ equity | 5,842,615 | 5,786,237 | |||||||||||||||||||||||||||||||||||||||
Total liabilities and stockholders’ equity | $ | 61,758,048 | $ | 62,183,137 | |||||||||||||||||||||||||||||||||||||
Interest rate spread | 2.78 | % | 2.63 | % | |||||||||||||||||||||||||||||||||||||
Net interest income and net interest margin | $ | 415,613 | 2.87 | % | $ | 405,697 | 2.73 | % | |||||||||||||||||||||||||||||||||
(1)Annualized.
(2)Includes loans HFS. Average balances of PPP loans were $410.6 million and $677.2 million for the three months ended March 31, 2022 and December 31, 2021, respectively.
11
| EAST WEST BANCORP, INC. AND SUBSIDIARIES | |||||||||||||||||||||||||||||||||||||||||
| QUARTER-TO-DATE AVERAGE BALANCES, YIELDS AND RATES | |||||||||||||||||||||||||||||||||||||||||
| ($ in thousands) | |||||||||||||||||||||||||||||||||||||||||
| (unaudited) | |||||||||||||||||||||||||||||||||||||||||
| Table 6 | |||||||||||||||||||||||||||||||||||||||||
| Three Months Ended | |||||||||||||||||||||||||||||||||||||||||
| March 31, 2022 | March 31, 2021 | ||||||||||||||||||||||||||||||||||||||||
| Average | Average | Average | Average | ||||||||||||||||||||||||||||||||||||||
| Balance | Interest | Yield/Rate (1) | Balance | Interest | Yield/Rate (1) | ||||||||||||||||||||||||||||||||||||
Assets | |||||||||||||||||||||||||||||||||||||||||
Interest-earning assets: | |||||||||||||||||||||||||||||||||||||||||
Interest-bearing cash and deposits with banks | $ | 4,466,012 | $ | 3,260 | 0.30 | % | $ | 6,117,799 | $ | 3,632 | 0.24 | % | |||||||||||||||||||||||||||||
| Resale agreements | 2,097,998 | 8,383 | 1.62 | % | 1,461,900 | 6,099 | 1.69 | % | |||||||||||||||||||||||||||||||||
| AFS debt securities | 7,969,795 | 34,469 | 1.75 | % | 6,459,875 | 29,100 | 1.83 | % | |||||||||||||||||||||||||||||||||
| HTM debt securities | 1,968,568 | 8,198 | 1.69 | % | — | — | — | % | |||||||||||||||||||||||||||||||||
Loans (2) | 42,112,418 | 377,110 | 3.63 | % | 38,729,307 | 342,008 | 3.58 | % | |||||||||||||||||||||||||||||||||
FHLB and FRB stock | 77,575 | 609 | 3.18 | % | 83,164 | 547 | 2.67 | % | |||||||||||||||||||||||||||||||||
Total interest-earning assets | 58,692,366 | 432,029 | 2.99 | % | 52,852,045 | 381,386 | 2.93 | % | |||||||||||||||||||||||||||||||||
Noninterest-earning assets: | |||||||||||||||||||||||||||||||||||||||||
Cash and due from banks | 641,882 | 580,277 | |||||||||||||||||||||||||||||||||||||||
| Allowance for loan losses | (543,345) | (618,589) | |||||||||||||||||||||||||||||||||||||||
Other assets | 2,967,145 | 2,780,550 | |||||||||||||||||||||||||||||||||||||||
Total assets | $ | 61,758,048 | $ | 55,594,283 | |||||||||||||||||||||||||||||||||||||
Liabilities and Stockholders’ Equity | |||||||||||||||||||||||||||||||||||||||||
Interest-bearing liabilities: | |||||||||||||||||||||||||||||||||||||||||
Checking deposits | $ | 6,648,065 | $ | 1,402 | 0.09 | % | $ | 6,393,034 | $ | 4,214 | 0.27 | % | |||||||||||||||||||||||||||||
Money market deposits | 12,913,336 | 3,203 | 0.10 | % | 11,573,847 | 4,711 | 0.17 | % | |||||||||||||||||||||||||||||||||
Savings deposits | 2,930,309 | 1,704 | 0.24 | % | 2,674,476 | 1,741 | 0.26 | % | |||||||||||||||||||||||||||||||||
Time deposits | 8,100,890 | 6,680 | 0.33 | % | 9,112,662 | 11,156 | 0.50 | % | |||||||||||||||||||||||||||||||||
Federal funds purchased and other short-term borrowings | 1,866 | 9 | 1.96 | % | 4,703 | 42 | 3.62 | % | |||||||||||||||||||||||||||||||||
FHLB advances | 160,018 | 578 | 1.46 | % | 652,758 | 3,069 | 1.91 | % | |||||||||||||||||||||||||||||||||
| Repurchase agreements | 311,984 | 2,016 | 2.62 | % | 300,000 | 1,978 | 2.67 | % | |||||||||||||||||||||||||||||||||
Long-term debt and finance lease liabilities | 152,011 | 824 | 2.20 | % | 152,088 | 780 | 2.08 | % | |||||||||||||||||||||||||||||||||
Total interest-bearing liabilities | 31,218,479 | 16,416 | 0.21 | % | 30,863,568 | 27,691 | 0.36 | % | |||||||||||||||||||||||||||||||||
Noninterest-bearing liabilities and stockholders’ equity: | |||||||||||||||||||||||||||||||||||||||||
Demand deposits | 23,432,746 | 18,093,696 | |||||||||||||||||||||||||||||||||||||||
Accrued expenses and other liabilities | 1,264,208 | 1,298,921 | |||||||||||||||||||||||||||||||||||||||
Stockholders’ equity | 5,842,615 | 5,338,098 | |||||||||||||||||||||||||||||||||||||||
Total liabilities and stockholders’ equity | $ | 61,758,048 | $ | 55,594,283 | |||||||||||||||||||||||||||||||||||||
Interest rate spread | 2.78 | % | 2.57 | % | |||||||||||||||||||||||||||||||||||||
Net interest income and net interest margin | $ | 415,613 | 2.87 | % | $ | 353,695 | 2.71 | % | |||||||||||||||||||||||||||||||||
(1)Annualized.
(2)Includes loans HFS. Average balances of PPP loans were $410.6 million and $1.93 billion for the three months ended March 31, 2022 and 2021, respectively.
12
| EAST WEST BANCORP, INC. AND SUBSIDIARIES | ||||||||||||||||||||||||||||||||||||||
| SELECTED RATIOS | ||||||||||||||||||||||||||||||||||||||
| (unaudited) | ||||||||||||||||||||||||||||||||||||||
| Table 7 | ||||||||||||||||||||||||||||||||||||||
Three Months Ended (1) | March 31, 2022 Basis Point Change | |||||||||||||||||||||||||||||||||||||
| March 31, 2022 | December 31, 2021 | March 31, 2021 | Qtr-o-Qtr | Yr-o-Yr | ||||||||||||||||||||||||||||||||||
Return on average assets | 1.56 | % | 1.39 | % | 1.50 | % | 17 | bps | 6 | bps | ||||||||||||||||||||||||||||
Return on average equity | 16.50 | % | 14.93 | % | 15.57 | % | 157 | 93 | ||||||||||||||||||||||||||||||
Return on average tangible equity (2) | 18.00 | % | 16.32 | % | 17.17 | % | 168 | 83 | ||||||||||||||||||||||||||||||
Interest rate spread | 2.78 | % | 2.63 | % | 2.57 | % | 15 | 21 | ||||||||||||||||||||||||||||||
Net interest margin | 2.87 | % | 2.73 | % | 2.71 | % | 14 | 16 | ||||||||||||||||||||||||||||||
Average loan yield | 3.63 | % | 3.59 | % | 3.58 | % | 4 | 5 | ||||||||||||||||||||||||||||||
Yield on average interest-earning assets | 2.99 | % | 2.85 | % | 2.93 | % | 14 | 6 | ||||||||||||||||||||||||||||||
Average cost of interest-bearing deposits | 0.17 | % | 0.18 | % | 0.30 | % | (1) | (13) | ||||||||||||||||||||||||||||||
Average cost of deposits | 0.10 | % | 0.10 | % | 0.18 | % | — | (8) | ||||||||||||||||||||||||||||||
Average cost of funds | 0.12 | % | 0.12 | % | 0.23 | % | — | (11) | ||||||||||||||||||||||||||||||
Adjusted pre-tax, pre-provision profitability ratio (3) | 2.10 | % | 1.91 | % | 1.91 | % | 19 | 19 | ||||||||||||||||||||||||||||||
Adjusted noninterest expense/average assets (3) | 1.15 | % | 1.13 | % | 1.20 | % | 2 | (5) | ||||||||||||||||||||||||||||||
Efficiency ratio | 38.25 | % | 44.03 | % | 44.79 | % | (578) | (654) | ||||||||||||||||||||||||||||||
Adjusted efficiency ratio (3) | 35.34 | % | 37.24 | % | 38.68 | % | (190) | bps | (334) | bps | ||||||||||||||||||||||||||||
(1)Annualized except for efficiency ratio.
(2)See reconciliation of GAAP to non-GAAP financial measures in Table 11.
(3)See reconciliation of GAAP to non-GAAP financial measures in Table 10.
13
| EAST WEST BANCORP, INC. AND SUBSIDIARIES | |||||||||||||||||||||||||||||||||||
| ALLOWANCE FOR LOAN LOSSES & OFF-BALANCE SHEET CREDIT EXPOSURES | |||||||||||||||||||||||||||||||||||
| ($ in thousands) | |||||||||||||||||||||||||||||||||||
| (unaudited) | |||||||||||||||||||||||||||||||||||
| Table 8 | |||||||||||||||||||||||||||||||||||
| Three Months Ended March 31, 2022 | |||||||||||||||||||||||||||||||||||
| Commercial | Consumer | ||||||||||||||||||||||||||||||||||
| C&I | Total CRE | Total Residential Mortgage | Other Consumer | Total | |||||||||||||||||||||||||||||||
| Allowance for loan losses, December 31, 2021 | $ | 338,252 | $ | 180,808 | $ | 20,595 | $ | 1,924 | $ | 541,579 | |||||||||||||||||||||||||
| Provision for credit losses on loans | (a) | 9,262 | 1,658 | 1,225 | 107 | 12,252 | |||||||||||||||||||||||||||||
| Gross charge-offs | (11,188) | (399) | — | (46) | (11,633) | ||||||||||||||||||||||||||||||
| Gross recoveries | 3,002 | 229 | 138 | — | 3,369 | ||||||||||||||||||||||||||||||
| Total net (charge-offs) recoveries | (8,186) | (170) | 138 | (46) | (8,264) | ||||||||||||||||||||||||||||||
| Foreign currency translation adjustment | 118 | — | — | — | 118 | ||||||||||||||||||||||||||||||
| Allowance for loan losses, March 31, 2022 | $ | 339,446 | $ | 182,296 | $ | 21,958 | $ | 1,985 | $ | 545,685 | |||||||||||||||||||||||||
| Three Months Ended December 31, 2021 | |||||||||||||||||||||||||||||||||||
| Commercial | Consumer | ||||||||||||||||||||||||||||||||||
| C&I | Total CRE | Total Residential Mortgage | Other Consumer | Total | |||||||||||||||||||||||||||||||
| Allowance for loan losses, September 30, 2021 | $ | 342,142 | $ | 192,260 | $ | 21,684 | $ | 4,318 | $ | 560,404 | |||||||||||||||||||||||||
| Provision for (reversal of) credit losses on loans | (a) | 2,397 | (9,416) | (1,519) | (940) | (9,478) | |||||||||||||||||||||||||||||
| Gross charge-offs | (12,328) | (2,872) | — | (1,454) | (16,654) | ||||||||||||||||||||||||||||||
| Gross recoveries | 5,605 | 836 | 430 | — | 6,871 | ||||||||||||||||||||||||||||||
| Total net (charge-offs) recoveries | (6,723) | (2,036) | 430 | (1,454) | (9,783) | ||||||||||||||||||||||||||||||
| Foreign currency translation adjustment | 436 | — | — | — | 436 | ||||||||||||||||||||||||||||||
| Allowance for loan losses, December 31, 2021 | $ | 338,252 | $ | 180,808 | $ | 20,595 | $ | 1,924 | $ | 541,579 | |||||||||||||||||||||||||
| Three Months Ended March 31, 2021 | |||||||||||||||||||||||||||||||||||
| Commercial | Consumer | ||||||||||||||||||||||||||||||||||
| C&I | Total CRE | Total Residential Mortgage | Other Consumer | Total | |||||||||||||||||||||||||||||||
| Allowance for loan losses, December 31, 2020 | $ | 398,040 | $ | 201,603 | $ | 18,210 | $ | 2,130 | $ | 619,983 | |||||||||||||||||||||||||
| Provision for (reversal of) credit losses on loans | (a) | 3,839 | (3,076) | 398 | (113) | 1,048 | |||||||||||||||||||||||||||||
| Gross charge-offs | (8,436) | (7,283) | (179) | (1) | (15,899) | ||||||||||||||||||||||||||||||
| Gross recoveries | 760 | 1,651 | 80 | 2 | 2,493 | ||||||||||||||||||||||||||||||
| Total net (charge-offs) recoveries | (7,676) | (5,632) | (99) | 1 | (13,406) | ||||||||||||||||||||||||||||||
| Foreign currency translation adjustment | (119) | — | — | — | (119) | ||||||||||||||||||||||||||||||
| Allowance for loan losses, March 31, 2021 | $ | 394,084 | $ | 192,895 | $ | 18,509 | $ | 2,018 | $ | 607,506 | |||||||||||||||||||||||||
14
| EAST WEST BANCORP, INC. AND SUBSIDIARIES | |||||||||||||||||||||||
| ALLOWANCE FOR LOAN LOSSES & OFF-BALANCE SHEET CREDIT EXPOSURES | |||||||||||||||||||||||
| ($ in thousands) | |||||||||||||||||||||||
| (unaudited) | |||||||||||||||||||||||
| Table 8 (continued) | |||||||||||||||||||||||
| Three Months Ended | |||||||||||||||||||||||
| March 31, 2022 | December 31, 2021 | March 31, 2021 | |||||||||||||||||||||
| Unfunded Credit Facilities | |||||||||||||||||||||||
Allowance for unfunded credit commitments, beginning of period (1) | $ | 27,514 | $ | 28,036 | $ | 33,577 | |||||||||||||||||
| Reversal of credit losses on unfunded credit commitments | (b) | (4,252) | (522) | (1,048) | |||||||||||||||||||
Allowance for unfunded credit commitments, end of period (1) | $ | 23,262 | $ | 27,514 | $ | 32,529 | |||||||||||||||||
| Provision for (reversal of) credit losses | (a)+(b) | $ | 8,000 | $ | (10,000) | $ | — | ||||||||||||||||
(1)Included in Accrued expenses and other liabilities on the Consolidated Balance Sheet.
15
| EAST WEST BANCORP, INC. AND SUBSIDIARIES | |||||||||||||||||||||||
| CRITICIZED LOANS, NONPERFORMING ASSETS AND CREDIT QUALITY RATIOS | |||||||||||||||||||||||
| ($ in thousands) | |||||||||||||||||||||||
| (unaudited) | |||||||||||||||||||||||
| Table 9 | |||||||||||||||||||||||
| Criticized Loans | March 31, 2022 | December 31, 2021 | March 31, 2021 | ||||||||||||||||||||
| Special mention loans | $ | 402,704 | $ | 384,694 | $ | 504,226 | |||||||||||||||||
| Classified loans | 430,633 | 448,362 | 712,693 | ||||||||||||||||||||
| Total criticized loans | $ | 833,337 | $ | 833,056 | $ | 1,216,919 | |||||||||||||||||
Nonperforming Assets | March 31, 2022 | December 31, 2021 | March 31, 2021 | ||||||||||||||||||||
| Nonaccrual loans: | |||||||||||||||||||||||
| Commercial: | |||||||||||||||||||||||
| C&I | $ | 51,773 | $ | 59,023 | $ | 125,536 | |||||||||||||||||
| Total CRE | 9,827 | 9,942 | 74,727 | ||||||||||||||||||||
| Consumer: | |||||||||||||||||||||||
| Total residential mortgage | 23,197 | 24,164 | 29,173 | ||||||||||||||||||||
| Other consumer | 37 | 52 | 2,526 | ||||||||||||||||||||
| Total nonaccrual loans | 84,834 | 93,181 | 231,962 | ||||||||||||||||||||
| Other real estate owned, net | — | 363 | 15,824 | ||||||||||||||||||||
| Other nonperforming assets | 9,548 | 9,938 | 10,360 | ||||||||||||||||||||
| Total nonperforming assets | $ | 94,382 | $ | 103,482 | $ | 258,146 | |||||||||||||||||
| Credit Quality Ratios | March 31, 2022 | December 31, 2021 | March 31, 2021 | ||||||||||||||||||||
Annualized quarterly net charge-offs to average loans HFI | 0.08 | % | 0.10 | % | 0.14 | % | |||||||||||||||||
| Special mention loans to loans HFI | 0.93 | % | 0.92 | % | 1.27 | % | |||||||||||||||||
| Classified loans to loans HFI | 0.99 | % | 1.08 | % | 1.80 | % | |||||||||||||||||
| Criticized loans to loans HFI | 1.92 | % | 2.00 | % | 3.07 | % | |||||||||||||||||
| Nonperforming assets to total assets | 0.15 | % | 0.17 | % | 0.45 | % | |||||||||||||||||
| Nonaccrual loans to loans HFI | 0.20 | % | 0.22 | % | 0.59 | % | |||||||||||||||||
| Allowance for loan losses to loans HFI | 1.25 | % | 1.30 | % | 1.53 | % | |||||||||||||||||
16
| EAST WEST BANCORP, INC. AND SUBSIDIARIES | ||||||||||||||||||||||||||
| GAAP TO NON-GAAP RECONCILIATION | ||||||||||||||||||||||||||
| ($ in thousands) | ||||||||||||||||||||||||||
| (unaudited) | ||||||||||||||||||||||||||
| Table 10 | ||||||||||||||||||||||||||
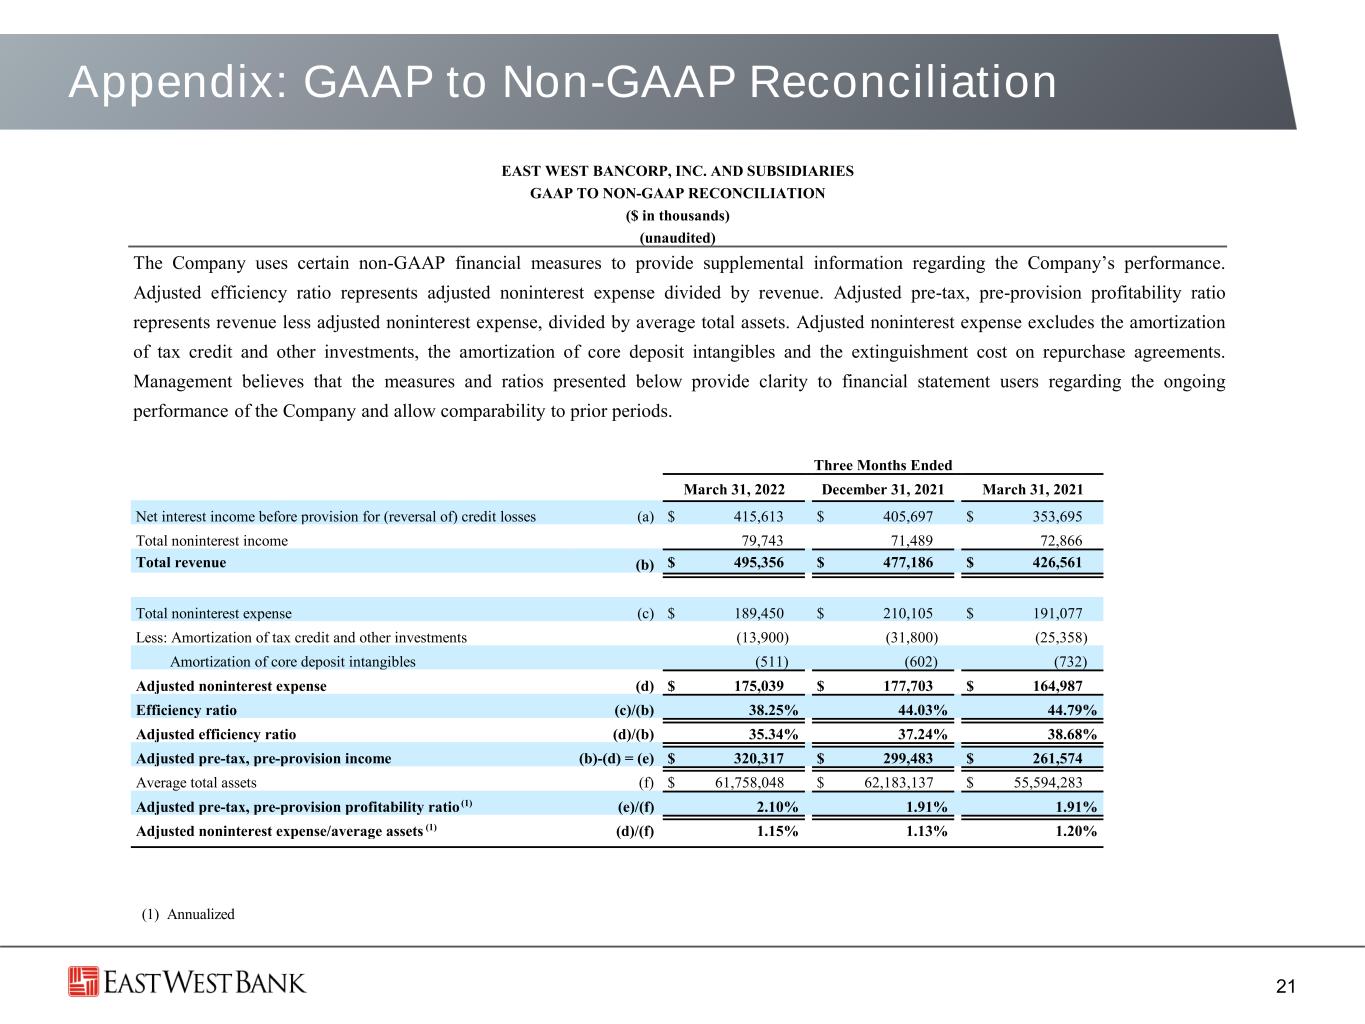
| The Company uses certain non-GAAP financial measures to provide supplemental information regarding the Company’s performance. Adjusted efficiency ratio represents adjusted noninterest expense divided by revenue. Adjusted pre-tax, pre-provision profitability ratio represents revenue less adjusted noninterest expense, divided by average total assets. Adjusted noninterest expense excludes the amortization of tax credit and other investments, the amortization of core deposit intangibles and the extinguishment cost on repurchase agreements. Management believes that the measures and ratios presented below provide clarity to financial statement users regarding the ongoing performance of the Company and allow comparability to prior periods. | ||||||||||||||||||||||||||
| Three Months Ended | ||||||||||||||||||||||||||
| March 31, 2022 | December 31, 2021 | March 31, 2021 | ||||||||||||||||||||||||
| Net interest income before provision for (reversal of) credit losses | (a) | $ | 415,613 | $ | 405,697 | $ | 353,695 | |||||||||||||||||||
| Total noninterest income | 79,743 | 71,489 | 72,866 | |||||||||||||||||||||||
| Total revenue | (b) | $ | 495,356 | $ | 477,186 | $ | 426,561 | |||||||||||||||||||
| Total noninterest expense | (c) | $ | 189,450 | $ | 210,105 | $ | 191,077 | |||||||||||||||||||
| Less: Amortization of tax credit and other investments | (13,900) | (31,800) | (25,358) | |||||||||||||||||||||||
| Amortization of core deposit intangibles | (511) | (602) | (732) | |||||||||||||||||||||||
| Adjusted noninterest expense | (d) | $ | 175,039 | $ | 177,703 | $ | 164,987 | |||||||||||||||||||
| Efficiency ratio | (c)/(b) | 38.25 | % | 44.03 | % | 44.79 | % | |||||||||||||||||||
| Adjusted efficiency ratio | (d)/(b) | 35.34 | % | 37.24 | % | 38.68 | % | |||||||||||||||||||
| Adjusted pre-tax, pre-provision income | (b)-(d) = (e) | $ | 320,317 | $ | 299,483 | $ | 261,574 | |||||||||||||||||||
| Average total assets | (f) | $ | 61,758,048 | $ | 62,183,137 | $ | 55,594,283 | |||||||||||||||||||
Adjusted pre-tax, pre-provision profitability ratio (1) | (e)/(f) | 2.10 | % | 1.91 | % | 1.91 | % | |||||||||||||||||||
Adjusted noninterest expense/average assets (1) | (d)/(f) | 1.15 | % | 1.13 | % | 1.20 | % | |||||||||||||||||||
(1)Annualized.
17
| EAST WEST BANCORP, INC. AND SUBSIDIARIES | ||||||||||||||||||||||||||
| GAAP TO NON-GAAP RECONCILIATION | ||||||||||||||||||||||||||
| ($ in thousands) | ||||||||||||||||||||||||||
| (unaudited) | ||||||||||||||||||||||||||
| Table 11 | ||||||||||||||||||||||||||
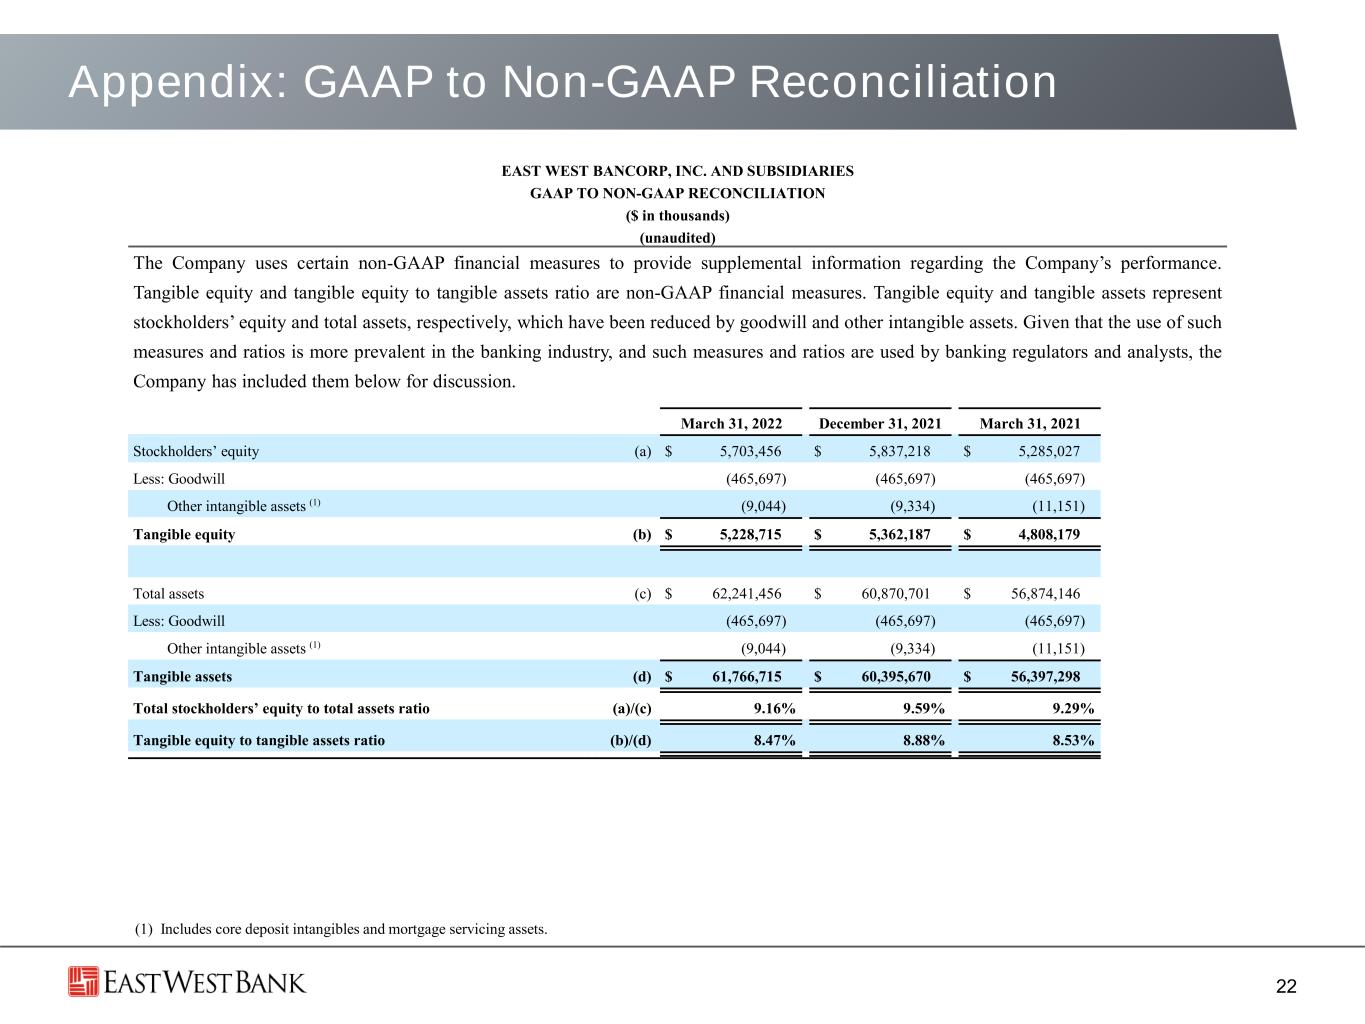
The Company uses certain non-GAAP financial measures to provide supplemental information regarding the Company’s performance. Tangible equity and tangible equity to tangible assets ratio are non-GAAP financial measures. Tangible equity and tangible assets represent stockholders’ equity and total assets, respectively, which have been reduced by goodwill and other intangible assets. Given that the use of such measures and ratios is more prevalent in the banking industry, and such measures and ratios are used by banking regulators and analysts, the Company has included them below for discussion. | ||||||||||||||||||||||||||
| March 31, 2022 | December 31, 2021 | March 31, 2021 | ||||||||||||||||||||||||
| Stockholders’ equity | (a) | $ | 5,703,456 | $ | 5,837,218 | $ | 5,285,027 | |||||||||||||||||||
| Less: Goodwill | (465,697) | (465,697) | (465,697) | |||||||||||||||||||||||
Other intangible assets (1) | (9,044) | (9,334) | (11,151) | |||||||||||||||||||||||
| Tangible equity | (b) | $ | 5,228,715 | $ | 5,362,187 | $ | 4,808,179 | |||||||||||||||||||
| Total assets | (c) | $ | 62,241,456 | $ | 60,870,701 | $ | 56,874,146 | |||||||||||||||||||
| Less: Goodwill | (465,697) | (465,697) | (465,697) | |||||||||||||||||||||||
Other intangible assets (1) | (9,044) | (9,334) | (11,151) | |||||||||||||||||||||||
| Tangible assets | (d) | $ | 61,766,715 | $ | 60,395,670 | $ | 56,397,298 | |||||||||||||||||||
| Total stockholders’ equity to total assets ratio | (a)/(c) | 9.16 | % | 9.59 | % | 9.29 | % | |||||||||||||||||||
| Tangible equity to tangible assets ratio | (b)/(d) | 8.47 | % | 8.88 | % | 8.53 | % | |||||||||||||||||||
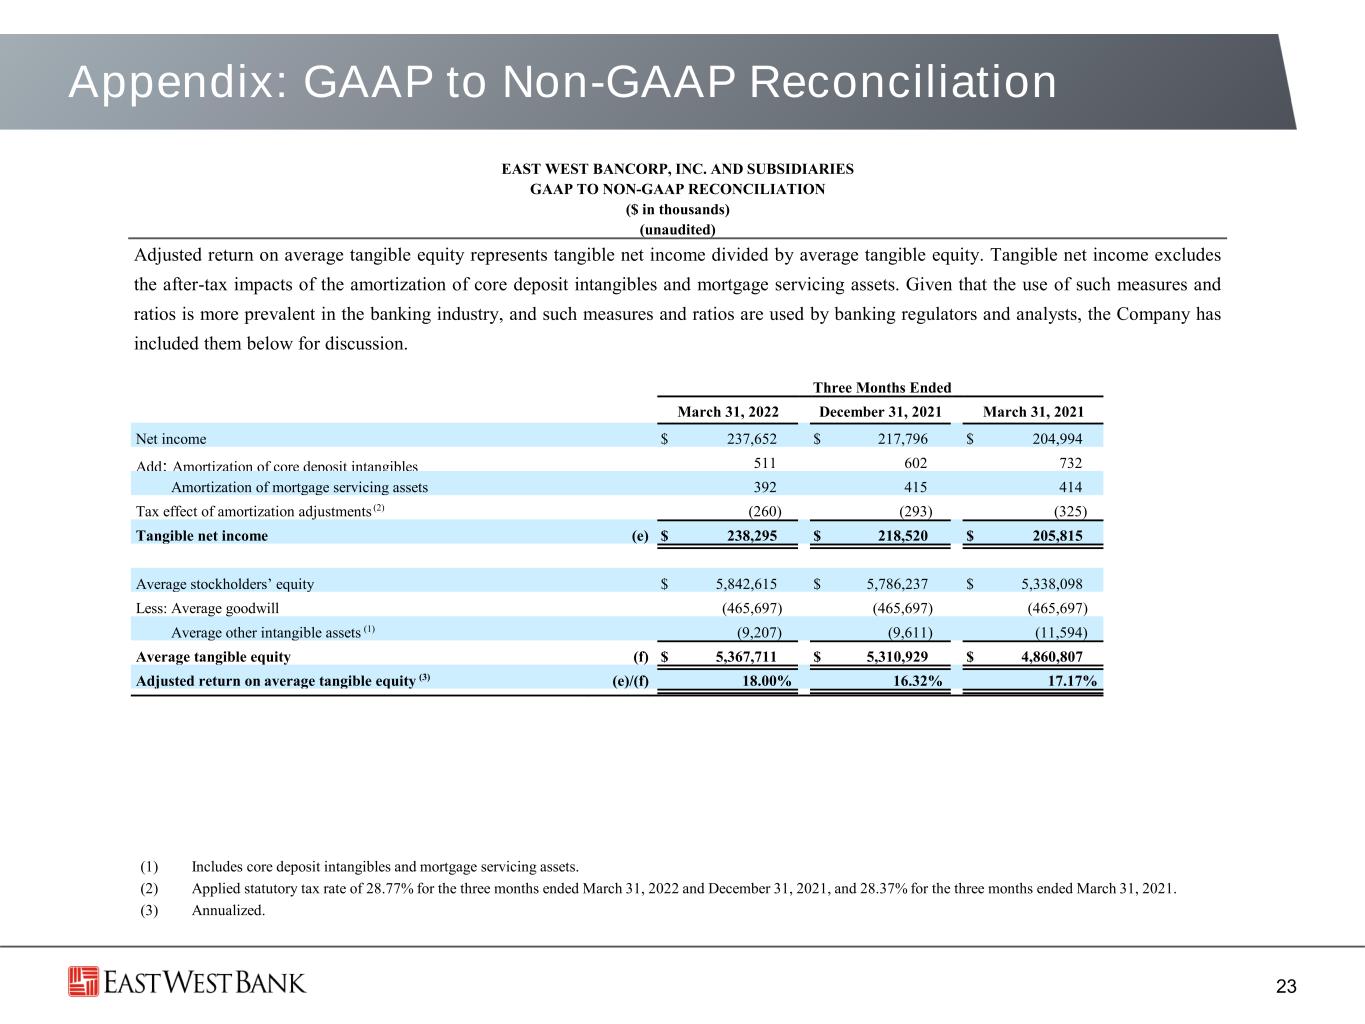
| Adjusted return on average tangible equity represents tangible net income divided by average tangible equity. Tangible net income excludes the after-tax impacts of the amortization of core deposit intangibles and mortgage servicing assets. Given that the use of such measures and ratios is more prevalent in the banking industry, and such measures and ratios are used by banking regulators and analysts, the Company has included them below for discussion. | ||||||||||||||||||||||||||
| Three Months Ended | ||||||||||||||||||||||||||
| March 31, 2022 | December 31, 2021 | March 31, 2021 | ||||||||||||||||||||||||
| Net income | $ | 237,652 | $ | 217,796 | $ | 204,994 | ||||||||||||||||||||
Add: Amortization of core deposit intangibles | 511 | 602 | 732 | |||||||||||||||||||||||
Amortization of mortgage servicing assets | 392 | 415 | 414 | |||||||||||||||||||||||
Tax effect of amortization adjustments (2) | (260) | (293) | (325) | |||||||||||||||||||||||
| Tangible net income | (e) | $ | 238,295 | $ | 218,520 | $ | 205,815 | |||||||||||||||||||
| Average stockholders’ equity | $ | 5,842,615 | $ | 5,786,237 | $ | 5,338,098 | ||||||||||||||||||||
| Less: Average goodwill | (465,697) | (465,697) | (465,697) | |||||||||||||||||||||||
Average other intangible assets (1) | (9,207) | (9,611) | (11,594) | |||||||||||||||||||||||
| Average tangible equity | (f) | $ | 5,367,711 | $ | 5,310,929 | $ | 4,860,807 | |||||||||||||||||||
Adjusted return on average tangible equity (3) | (e)/(f) | 18.00 | % | 16.32 | % | 17.17 | % | |||||||||||||||||||
(1)Includes core deposit intangibles and mortgage servicing assets.
(2)Applied statutory tax rate of 28.77% for the three months ended March 31, 2022 and December 31, 2021, and 28.37% for the three months ended March 31, 2021.
(3)Annualized.
18