fat-20220728
fat Brands Inc.0001705012FALSE00017050122022-07-282022-07-280001705012fat:ClassACommonStockMember2022-07-282022-07-280001705012fat:ClassBCommonStockMember2022-07-282022-07-280001705012fat:SeriesBCumulativePreferredStockMember2022-07-282022-07-280001705012fat:WarrantsToPurchaseCommonStockMember2022-07-282022-07-28

UNITED STATES
SECURITIES AND EXCHANGE COMMISSION
WASHINGTON, D.C. 20549
FORM 8-K
CURRENT REPORT
Pursuant to Section 13 or 15(d) of the Securities Exchange Act of 1934
Date of Report (Date of earliest event reported): July 28, 2022
FAT Brands Inc.
(Exact name of Registrant as Specified in Its Charter)
Delaware001-3825082-1302696
(State or Other Jurisdiction
of Incorporation)
(Commission
File Number)
(IRS Employer
Identification No.)
9720 Wilshire Blvd., Suite 500
Beverly Hills, CA
(Address of Principal Executive Offices)
90212
(Zip Code)
Registrant’s Telephone Number, Including Area Code: (310) 319-1850
Not Applicable
(Former Name or Former Address, if Changed Since Last Report)
Check the appropriate box below if the Form 8-K filing is intended to simultaneously satisfy the filing obligation of the registrant under any of the following provisions (see General Instructions A.2. below):
oWritten communications pursuant to Rule 425 under the Securities Act (17 CFR 230.425)
oSoliciting material pursuant to Rule 14a-12 under the Exchange Act (17 CFR 240.14a-12)
oPre-commencement communications pursuant to Rule 14d-2(b) under the Exchange Act (17 CFR 240.14d-2(b))
oPre-commencement communications pursuant to Rule 13e-4(c) under the Exchange Act (17 CFR 240.13e-4(c))
Securities registered pursuant to Section 12(b) of the Act:
Title of each classTrading Symbol(s)Name of each exchange on which registered
Class A Common Stock, par value $0.0001 per shareFATThe Nasdaq Stock Market LLC
Class B Common Stock, par value $0.0001 per shareFATBBThe Nasdaq Stock Market LLC
Series B Cumulative Preferred Stock, par value $0.0001 per shareFATBPThe Nasdaq Stock Market LLC
Warrants to purchase Class A Common StockFATBWThe Nasdaq Stock Market LLC
Indicate by check mark whether the registrant is an emerging growth company as defined in Rule 405 of the Securities Act of 1933 (§ 230.405 of this chapter) or Rule 12b-2 of the Securities Exchange Act of 1934 (§ 240.12b-2 of this chapter).
Emerging growth company


If an emerging growth company, indicate by check mark if the registrant has elected not to use the extended transition period for complying with any new or revised financial accounting standards provided pursuant to Section 13(a) of the Exchange Act.


Item 2.02 Results of Operations and Financial Condition.
On July 28, 2022, FAT Brands Inc. (the “Company”) issued a press release announcing its financial results for the thirteen- week and twenty-six week periods ended June 26, 2022. A copy of the press release is furnished as Exhibit 99.1 hereto and incorporated herein by reference.
The Company also hosted a conference call on July 28, 2022 in which the financial results were discussed. A replay is available until Thursday, August 4 and can be accessed by dialing 1-844-512-2921. The passcode is 13730875.
The webcast is available at www.fatbrands.com under the “Investors” section.
Item 7.01 Regulation FD Disclosure.
On July 28, 2022, the Company provided supplemental financial information to be used in its earnings presentation for the thirteen-week and twenty-six week periods ended June 26, 2022 on its website at https://ir.fatbrands.com/events-and-presentations/default.aspx. A copy of the earning supplement is furnished as Exhibit 99.2 hereto and is incorporated herein by reference.
In accordance with General Instruction B.2 of Form 8-K, the information in this Item 2.02 and 7.01, including Exhibit 99.1 and Exhibit 99.2, shall not be deemed “filed” for purposes of Section 18 of the Securities Exchange Act of 1934, as amended, or otherwise subject to the liabilities of that section. Such information may be incorporated by reference in another filing under the Securities and Exchange Act of 1934 or the Securities Act of 1933 only if, and to the extent that, such subsequent filing specifically references such information.
Item 9.01. Financial Statements and Exhibits.
(d) Exhibits
Exhibit
Number
Description
99.1
99.2
104Cover Page Interactive Data File (embedded within the Inline XBRL document)


SIGNATURES
Pursuant to the requirements of the Securities Exchange Act of 1934, the registrant has duly caused this report to be signed on its behalf by the undersigned hereunto duly authorized.
FAT Brands Inc.
Date: July 28, 2022/s/ Kenneth J. Kuick
Kenneth J. Kuick
Chief Financial Officer

Exhibit 99.1
image_0a.jpg
FAT BRANDS INC. REPORTS SECOND QUARTER 2022 FINANCIAL RESULTS
Conference call and webcast today at 5:00 p.m. ET
LOS ANGELES (July 28, 2022) – FAT (Fresh. Authentic. Tasty.) Brands Inc. (NASDAQ: FAT) (“FAT Brands” or the “Company”) today reported fiscal second quarter 2022 financial results for the 13-week period ending June 26, 2022.
Andy Wiederhorn, President and CEO of FAT Brands, commented, “The second quarter marked yet another strong performance for FAT Brands, characterized by robust unit development and profitable revenue growth. After a very active acquisition strategy in 2021, I am particularly pleased with the momentum of our organic growth strategy for the first half of this year.”

“Year to date, we have opened 62 restaurants, including 26 that opened in the second quarter, and remain on track to open 120 new restaurants in 2022, which represents a 5% unit expansion year over year. We are seeing strong new franchisee activity as well as continued demand from existing franchise partners to develop other brands within our portfolio, which is very encouraging as we look beyond our current unit development pipeline of over 900 locations representing 50% EBITDA growth over the next several years.”

“As we have stated, 2022 is a year to digest the acquisitions of 2021 and capitalize on the potential synergies they present. That being said, our acquisition strategy is one of the core pillars of FAT Brands, and we will continue to evaluate and capitalize on potential candidates as we see fit. In May 2022, we saw great value in acquiring the Nestlé® Toll House® Café by Chip® Franchise Business, which will be rebranded as Great American Cookies. This tuck-in acquisition not only increases our foothold in the dessert category, but also allows us to continue to grow our manufacturing business. We anticipate the first store conversion to be completed in September 2022 and we look forward to increasing the profitability of the franchisees that have joined us through this acquisition via our increased scale and the cost savings generated from our manufacturing facility.”

Fiscal Second Quarter 2022 Highlights
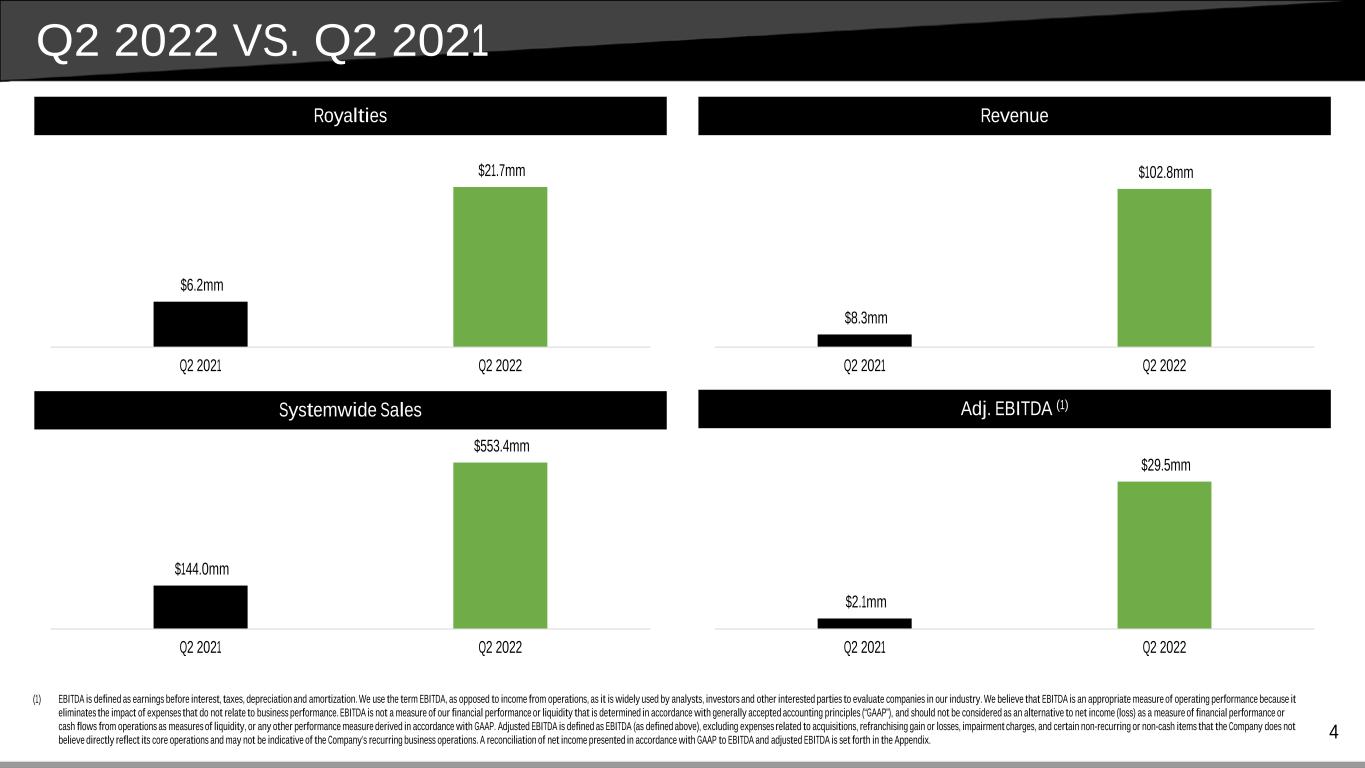
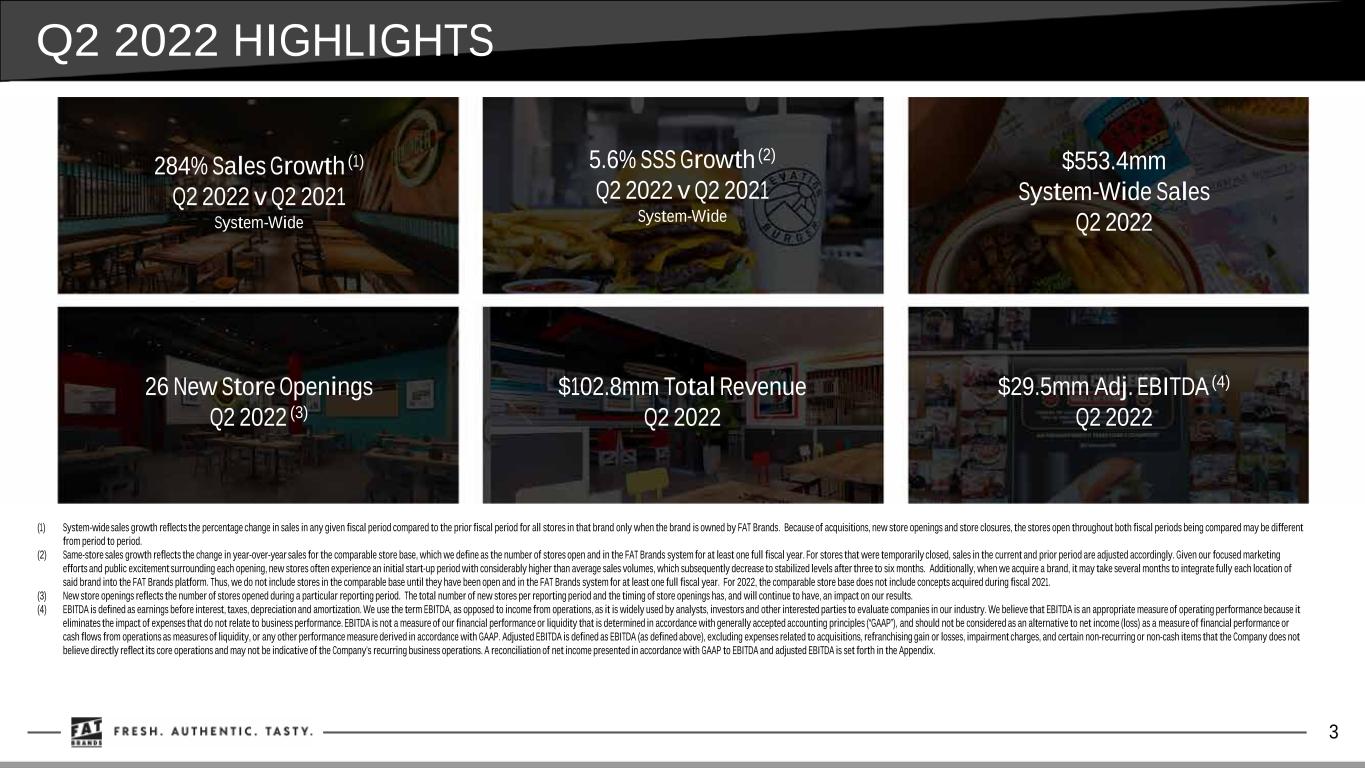
Total revenue improved 1,141% to $102.8 million compared to $8.3 million in the second quarter of 2021
System-wide sales growth of 284% in the second quarter of 2022 compared to the prior year quarter
System-wide same-store sales growth of 5.6% in the second quarter of 2022 compared to the prior year quarter
26 new store openings during the second quarter of 2022 bringing our system-wide store count to 2,354 as of June 26, 2022
Net loss of $8.2 million or $0.50 per diluted share compared to $5.9 million or $0.48 per diluted share in the second quarter of 2021
Adjusted EBITDA(1) of $29.5 million compared to $2.1 million in the second quarter of 2021
Adjusted net loss(1) of $3.1 million, or $0.19 per diluted share, compared to $1.1 million, or $0.09 per diluted share in the second quarter of 2021
(1)EBITDA, Adjusted EBITDA and adjusted net loss are non-GAAP measures defined below, under “Non-GAAP Measures”. Reconciliation of GAAP net income to EBITDA, adjusted EBITDA and adjusted net loss are included in the accompanying financial tables.


Summary of Second Quarter 2022 Financial Results
Total revenue was $102.8 million in the second quarter of 2022 compared to $8.3 million in the second quarter of 2021, reflecting revenue from the acquisition of Global Franchise Group in July 2021, the acquisition of Twin Peaks in October 2021, the acquisition of Fazoli's and Native Grill & Wings in December 2021 (collectively, the "2021 Acquisitions") and the continuing recovery from the negative effects of the COVID-19 pandemic on royalties from restaurant sales.
Costs and expenses increased to $89.6 million in the second quarter of 2022 compared to $7.2 million in the second quarter of 2021.

General and administrative expenses increased $15.7 million to $20.8 million in the second quarter compared to $5.1 million in the prior year, primarily due to the 2021 Acquisitions and increased compensation costs, professional fees and travel, reflecting the significant expansion of the organization.
Cost of restaurant and factory revenues totaled $49.8 million in the second quarter of 2022 and were exclusively related to the 2021 Acquisitions. These costs relate to the operations of company owned restaurant locations and the dough factory operated by Global Franchise Group, which currently sells products exclusively to our brands.

Depreciation and amortization increased $6.3 million to $6.7 million in the second quarter of 2022 compared to the same period in the prior year, primarily due to depreciation of company-owned restaurant property and equipment and amortizing intangible assets related to the 2021 Acquisitions.
Advertising expenses increased $10.2 million to $11.6 million in the second quarter of 2022 compared to the prior year period. These expenses vary in relation to the advertising revenue and reflect advertising expenses related to the 2021 Acquisitions and the increase in customer activity as the recovery from COVID continues.
Other expense for the second quarter of 2022 and 2021 was $21.6 million and $9.1 million, respectively, primarily comprised of net interest expense of $23.7 million and $2.7 million, respectively. Other expense for the second quarter of 2021 also consisted of a $6.4 million net loss on the extinguishment of debt.
Adjusted net loss was $3.1 million, or $0.19 per diluted share, in the second quarter of 2022 compared to $1.1 million, or $0.09 per diluted share, in the second quarter of 2021.
Key Financial Definitions
New store openings - The number of new store openings reflects the number of stores opened during a particular reporting period. The total number of new stores per reporting period and the timing of stores openings has, and will continue to have, an impact on our results.
Same-store sales growth - Same-store sales growth reflects the change in year-over-year sales for the comparable store base, which we define as the number of stores open and in the FAT Brands system for at least one full fiscal year. For stores that were temporarily closed, sales in the current and prior period are adjusted accordingly. Given our focused marketing efforts and public excitement surrounding each opening, new stores often experience an initial start-up period with considerably higher than average sales volumes, which subsequently decrease to stabilized levels after three to six months. Additionally, when we acquire a brand, it may take several months to integrate fully each location of said brand into the FAT Brands platform. Thus, we do not include stores in the comparable base until they have been open and in the FAT Brands system for at least one full fiscal year. For 2022, the comparable store base does not include concepts acquired during fiscal 2021.
System-wide sales growth - System wide sales growth reflects the percentage change in sales in any given fiscal period compared to the prior fiscal period for all stores in that brand only when the brand is owned by FAT Brands. Because of acquisitions, new store openings and store closures, the stores open throughout both fiscal periods being compared may be different from period to period.
Conference Call and Webcast
FAT Brands will host a conference call and webcast to discuss its fiscal second quarter 2022 financial results today at 5:00 PM ET. Hosting the conference call and webcast will be Andy Wiederhorn, President and Chief Executive Officer, and Ken Kuick, Chief Financial Officer.


The conference call can be accessed live over the phone by dialing 1-877-704-4453. A replay will be available after the call until Thursday, August 4, 2022, and can be accessed by dialing 1-844-512-2921. The passcode is 13730875. The webcast will be available at www.fatbrands.com under the “Investors” section and will be archived on the site shortly after the call has concluded.
About FAT (Fresh. Authentic. Tasty.) Brands
FAT Brands (NASDAQ: FAT) is a leading global franchising company that strategically acquires, markets, and develops fast casual, quick-service, casual dining, and polished casual dining concepts around the world. The Company currently owns 17 restaurant brands: Round Table Pizza, Fatburger, Marble Slab Creamery, Johnny Rockets, Fazoli’s, Twin Peaks, Great American Cookies, Hot Dog on a Stick, Buffalo’s Cafe & Express, Hurricane Grill & Wings, Pretzelmaker, Elevation Burger, Native Grill & Wings, Yalla Mediterranean and Ponderosa and Bonanza Steakhouses and franchises and owns over 2,300 units worldwide. For more information, please visit www.fatbrands.com.
Forward Looking Statements
This press release contains forward-looking statements within the meaning of the Private Securities Litigation Reform Act of 1995, including statements relating to the future financial and operating results of the Company, including estimates of annual EBITDA, our ability to conduct future accretive acquisitions, our pipeline of new store locations, and the recovery of our business from the current novel coronavirus pandemic (“COVID-19”), including our revenue performance and reopening of special venues. Forward-looking statements generally use words such as “expect,” “foresee,” “anticipate,” “believe,” “project,” “should,” “estimate,” “will,” “plans,” “forecast,” and similar expressions, and reflect our expectations concerning the future. It is possible that our future performance may differ materially from current expectations expressed in these forward-looking statements. Forward-looking statements are subject to significant business, economic and competitive risks, uncertainties and contingencies including, but not limited to, uncertainties surrounding the severity, duration and effects of the COVID-19 pandemic and the effects of the Delta variant of COVID-19, many of which are difficult to predict and beyond our control, which could cause our actual results to differ materially from the results expressed or implied in such forward-looking statements. We refer you to the documents we file from time to time with the Securities and Exchange Commission, such as our reports on Form 10-K, Form 10-Q and Form 8-K, for a discussion of these and other risks and uncertainties that could cause our actual results to differ materially from our current expectations and from the forward-looking statements contained in this press release. We undertake no obligation to update any forward-looking statements to reflect events or circumstances occurring after the date of this press release.
Non-GAAP Measures (Unaudited)
This press release includes the non-GAAP financial measure of EBITDA and Adjusted EBITDA.
EBITDA is defined as earnings before interest, taxes, depreciation and amortization. We use the term EBITDA, as opposed to income from operations, as it is widely used by analysts, investors and other interested parties to evaluate companies in our industry. We believe that EBITDA is an appropriate measure of operating performance because it eliminates the impact of expenses that do not relate to business performance. EBITDA is not a measure of our financial performance or liquidity that is determined in accordance with generally accepted accounting principles (“GAAP”), and should not be considered as an alternative to net income (loss) as a measure of financial performance or cash flows from operations as measures of liquidity, or any other performance measure derived in accordance with GAAP.
Adjusted EBITDA is defined as EBITDA (as defined above), excluding expenses related to acquisitions, refranchising gain or losses, impairment charges, and certain non-recurring or non-cash items that the Company does not believe directly reflect its core operations and may not be indicative of the Company’s recurring business operations.
Adjusted net loss is a supplemental measure of financial performance that is not required by or presented in accordance with GAAP. Adjusted net loss is defined as net loss plus the impact of adjustments and the tax effects of such adjustments. Adjusted net loss is presented because we believe it helps convey supplemental information to investors regarding our performance, excluding the impact of special items that affect the comparability of results in past quarters to expected results in future quarters. Adjusted net loss as presented may not be comparable to other similarly titled measures of other companies, and our presentation of adjusted net loss should not be construed as an inference that our future results will be unaffected by excluded or unusual items. Our management uses this non-GAAP financial measure to analyze changes in our underlying business from quarter to quarter based on comparable financial results.
Reconciliations of net loss attributable to FAT Brands Inc. presented in accordance with GAAP to EBITDA, adjusted EBITDA and adjusted net loss are set forth in the tables below.


Investor Relations:
ICR
Michelle Michalski
[email protected]
646-277-1224
Media Relations:
Erin Mandzik
[email protected]
860-212-6509
###

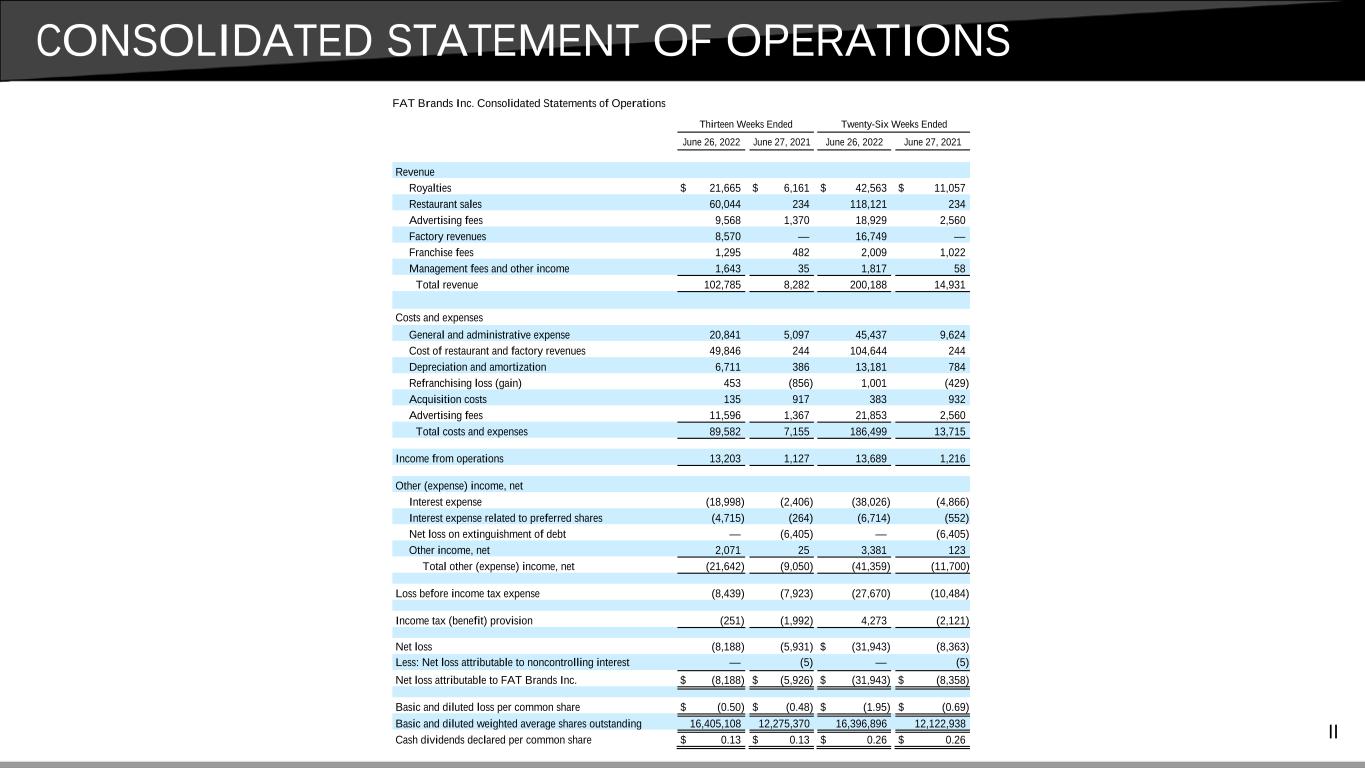
FAT Brands Inc. Consolidated Statements of Operations

Thirteen Weeks EndedTwenty-Six Weeks Ended
June 26, 2022June 27, 2021June 26, 2022June 27, 2021
Revenue
Royalties$21,665 $6,161 $42,563 $11,057 
Restaurant sales60,044 234 118,121 234 
Advertising fees9,568 1,370 18,929 2,560 
Factory revenues8,570 — 16,749 — 
Franchise fees1,295 482 2,009 1,022 
Management fees and other income1,643 35 1,817 58 
Total revenue102,785 8,282 200,188 14,931 
Costs and expenses
General and administrative expense20,841 5,097 45,437 9,624 
Cost of restaurant and factory revenues49,846 244 104,644 244 
Depreciation and amortization6,711 386 13,181 784 
Refranchising loss (gain)453 (856)1,001 (429)
Acquisition costs135 917 383 932 
Advertising fees11,596 1,367 21,853 2,560 
Total costs and expenses89,582 7,155 186,499 13,715 
Income from operations13,203 1,127 13,689 1,216 
Other (expense) income, net
Interest expense(18,998)(2,406)(38,026)(4,866)
Interest expense related to preferred shares(4,715)(264)(6,714)(552)
Net loss on extinguishment of debt— (6,405)— (6,405)
Other income, net2,071 25 3,381 123 
Total other (expense) income, net(21,642)(9,050)(41,359)(11,700)
Loss before income tax expense(8,439)(7,923)(27,670)(10,484)
Income tax (benefit) provision(251)(1,992)4,273 (2,121)
Net loss(8,188)(5,931)$(31,943)(8,363)
Less: Net loss attributable to noncontrolling interest— (5)— (5)
Net loss attributable to FAT Brands Inc.$(8,188)$(5,926)$(31,943)$(8,358)
Basic and diluted loss per common share$(0.50)$(0.48)$(1.95)$(0.69)
Basic and diluted weighted average shares outstanding16,405,108 12,275,370 16,396,896 12,122,938 
Cash dividends declared per common share$0.13 $0.13 $0.26 $0.26 


FAT Brands Inc. Consolidated EBITDA and Adjusted EBITDA Reconciliation
Thirteen Weeks EndedTwenty-Six Weeks Ended
(in thousands)June 26, 2022June 27, 2021June 26, 2022June 27, 2021
Net loss$(8,188)$(5,926)$(31,943)$(8,358)
Interest expense, net23,713 2,670 44,740 5,418 
Income tax (benefit) provision(251)(1,992)4,273 (2,121)
Depreciation and amortization expense6,711 386 13,181 784 
EBITDA21,985 (4,862)30,251 (4,277)
Provision for bad debts239 23 423 23 
Share-based compensation expenses1,934 193 4,046 230 
Non-cash lease expenses457 271 741 312 
Acquisition costs134 917 383 932 
Refranchising loss453 (856)1,001 (429)
Litigation costs4,308 — 7,264 — 
Severance— — 526 — 
Net loss on extinguishment of debt— 6,405 — 6,405 
Net loss related to advertising fund deficit— — 10 — 
Adjusted EBITDA$29,510 $2,091 $44,645 $3,196 


FAT Brands Inc. Adjusted Net Loss Reconciliation
Thirteen Weeks EndedTwenty-Six Weeks Ended
(in thousands, except share and per share data)June 26, 2022June 27, 2021June 26, 2022June 27, 2021
Net loss$(8,188)$(5,926)$(31,943)$(8,358)
Refranchising loss453 (856)1,001 (429)
Acquisition costs134 917 383 932 
Litigation costs4,308 — 7,264 — 
Severance— — 526 — 
Net loss on extinguishment of debt— 6,405 — 6,405 
Tax adjustments, net146 (1,626)(1,417)(1,398)
Adjusted net loss$(3,147)$(1,086)$(24,186)$(2,848)
Loss per basic and diluted share$(0.50)$(0.48)$(1.95)$(0.69)
Adjusted loss per basic and diluted share$(0.19)$(0.09)$(1.48)$(0.23)
Weighted average basic and diluted shares outstanding16,405,108 12,275,370 16,396,896 12,122,938 
(1)Reflects the tax impact of the adjustments using the effective tax rate for the respective periods
Q2 2022 EARNINGS SUPPLEMENT JULY 28, 2022


LEGAL DISCLAIMER This Earnings Supplement contains forward-looking statements within the meaning of the Private Securities Litigation Reform Act of 1995, including statements relating to the future financial performance and growth of the Company, the Company’s ability to open stores in the development pipeline, and the Company’s ability to conduct future accretive and successful acquisitions and integrate acquired brands. Forward-looking statements reflect the Company’s expectations concerning the future and are subject to significant business, economic and competitive risks, uncertainties and contingencies including, but not limited to, uncertainties surrounding the severity, duration and effects of the COVID-19 pandemic. These risks, uncertainties and contingencies are difficult to predict and beyond our control, and could cause our actual results to differ materially from those expressed or implied in such forward-looking statements. We refer you to the documents that we file from time to time with the Securities and Exchange Commission, including our reports on Form 10-K, Form 10-Q and Form 8-K, for a discussion of these and other risks and uncertainties that could cause our actual results to differ materially from our current expectations and from the forward-looking statements contained in this Earnings Supplement. We undertake no obligation to update any forward-looking statement to reflect events or circumstances occurring after the date of this Earnings Supplement. 2


Q2 2022 HIGHLIGHTS 3 284% Sales Growth (1) Q2 2022 v Q2 2021 System-Wide 5.6% SSS Growth (2) Q2 2022 v Q2 2021 System-Wide 26 New Store Openings Q2 2022 (3) $102.8mm Total Revenue Q2 2022 $29.5mm Adj. EBITDA (4) Q2 2022 $553.4mm System-Wide Sales Q2 2022 (1) System-wide sales growth reflects the percentage change in sales in any given fiscal period compared to the prior fiscal period for all stores in that brand only when the brand is owned by FAT Brands. Because of acquisitions, new store openings and store closures, the stores open throughout both fiscal periods being compared may be different from period to period. (2) Same-store sales growth reflects the change in year-over-year sales for the comparable store base, which we define as the number of stores open and in the FAT Brands system for at least one full fiscal year. For stores that were temporarily closed, sales in the current and prior period are adjusted accordingly. Given our focused marketing efforts and public excitement surrounding each opening, new stores often experience an initial start-up period with considerably higher than average sales volumes, which subsequently decrease to stabilized levels after three to six months. Additionally, when we acquire a brand, it may take several months to integrate fully each location of said brand into the FAT Brands platform. Thus, we do not include stores in the comparable base until they have been open and in the FAT Brands system for at least one full fiscal year. For 2022, the comparable store base does not include concepts acquired during fiscal 2021. (3) New store openings reflects the number of stores opened during a particular reporting period. The total number of new stores per reporting period and the timing of store openings has, and will continue to have, an impact on our results. (4) EBITDA is defined as earnings before interest, taxes, depreciation and amortization. We use the term EBITDA, as opposed to income from operations, as it is widely used by analysts, investors and other interested parties to evaluate companies in our industry. We believe that EBITDA is an appropriate measure of operating performance because it eliminates the impact of expenses that do not relate to business performance. EBITDA is not a measure of our financial performance or liquidity that is determined in accordance with generally accepted accounting principles (“GAAP”), and should not be considered as an alternative to net income (loss) as a measure of financial performance or cash flows from operations as measures of liquidity, or any other performance measure derived in accordance with GAAP. Adjusted EBITDA is defined as EBITDA (as defined above), excluding expenses related to acquisitions, refranchising gain or losses, impairment charges, and certain non-recurring or non-cash items that the Company does not believe directly reflect its core operations and may not be indicative of the Company’s recurring business operations. A reconciliation of net income presented in accordance with GAAP to EBITDA and adjusted EBITDA is set forth in the Appendix.


Q2 2022 VS. Q2 2021 4 (1) EBITDA is defined as earnings before interest, taxes, depreciation and amortization. We use the term EBITDA, as opposed to income from operations, as it is widely used by analysts, investors and other interested parties to evaluate companies in our industry. We believe that EBITDA is an appropriate measure of operating performance because it eliminates the impact of expenses that do not relate to business performance. EBITDA is not a measure of our financial performance or liquidity that is determined in accordance with generally accepted accounting principles (“GAAP”), and should not be considered as an alternative to net income (loss) as a measure of financial performance or cash flows from operations as measures of liquidity, or any other performance measure derived in accordance with GAAP. Adjusted EBITDA is defined as EBITDA (as defined above), excluding expenses related to acquisitions, refranchising gain or losses, impairment charges, and certain non-recurring or non-cash items that the Company does not believe directly reflect its core operations and may not be indicative of the Company’s recurring business operations. A reconciliation of net income presented in accordance with GAAP to EBITDA and adjusted EBITDA is set forth in the Appendix. Royalties $6.2mm $21.7mm Q2 2021 Q2 2022 Systemwide Sales Revenue $8.3mm $102.8mm Q2 2021 Q2 2022 Adj. EBITDA (1) $2.1mm $29.5mm Q2 2021 Q2 2022 $144.0mm $553.4mm Q2 2021 Q2 2022


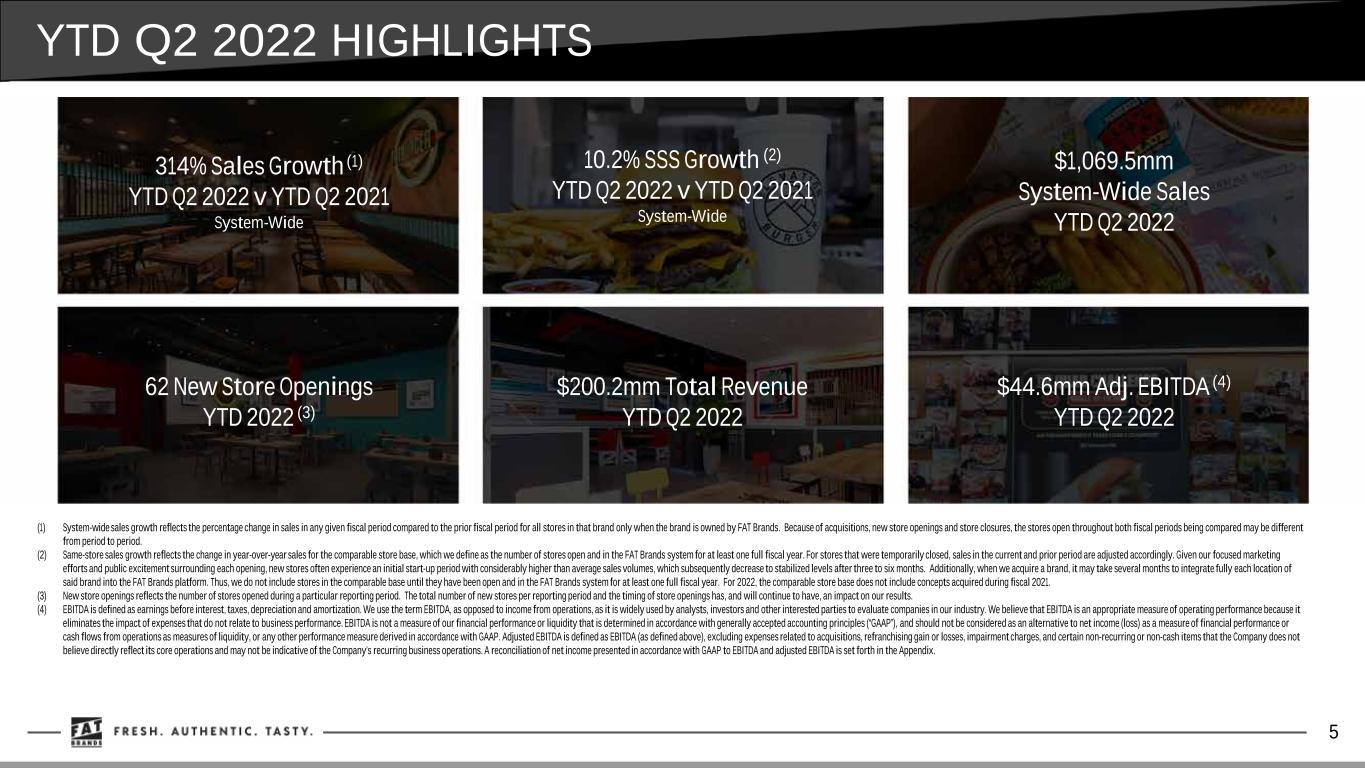
YTD Q2 2022 HIGHLIGHTS 5 314% Sales Growth (1) YTD Q2 2022 v YTD Q2 2021 System-Wide 10.2% SSS Growth (2) YTD Q2 2022 v YTD Q2 2021 System-Wide 62 New Store Openings YTD 2022 (3) $200.2mm Total Revenue YTD Q2 2022 $44.6mm Adj. EBITDA (4) YTD Q2 2022 $1,069.5mm System-Wide Sales YTD Q2 2022 (1) System-wide sales growth reflects the percentage change in sales in any given fiscal period compared to the prior fiscal period for all stores in that brand only when the brand is owned by FAT Brands. Because of acquisitions, new store openings and store closures, the stores open throughout both fiscal periods being compared may be different from period to period. (2) Same-store sales growth reflects the change in year-over-year sales for the comparable store base, which we define as the number of stores open and in the FAT Brands system for at least one full fiscal year. For stores that were temporarily closed, sales in the current and prior period are adjusted accordingly. Given our focused marketing efforts and public excitement surrounding each opening, new stores often experience an initial start-up period with considerably higher than average sales volumes, which subsequently decrease to stabilized levels after three to six months. Additionally, when we acquire a brand, it may take several months to integrate fully each location of said brand into the FAT Brands platform. Thus, we do not include stores in the comparable base until they have been open and in the FAT Brands system for at least one full fiscal year. For 2022, the comparable store base does not include concepts acquired during fiscal 2021. (3) New store openings reflects the number of stores opened during a particular reporting period. The total number of new stores per reporting period and the timing of store openings has, and will continue to have, an impact on our results. (4) EBITDA is defined as earnings before interest, taxes, depreciation and amortization. We use the term EBITDA, as opposed to income from operations, as it is widely used by analysts, investors and other interested parties to evaluate companies in our industry. We believe that EBITDA is an appropriate measure of operating performance because it eliminates the impact of expenses that do not relate to business performance. EBITDA is not a measure of our financial performance or liquidity that is determined in accordance with generally accepted accounting principles (“GAAP”), and should not be considered as an alternative to net income (loss) as a measure of financial performance or cash flows from operations as measures of liquidity, or any other performance measure derived in accordance with GAAP. Adjusted EBITDA is defined as EBITDA (as defined above), excluding expenses related to acquisitions, refranchising gain or losses, impairment charges, and certain non-recurring or non-cash items that the Company does not believe directly reflect its core operations and may not be indicative of the Company’s recurring business operations. A reconciliation of net income presented in accordance with GAAP to EBITDA and adjusted EBITDA is set forth in the Appendix.


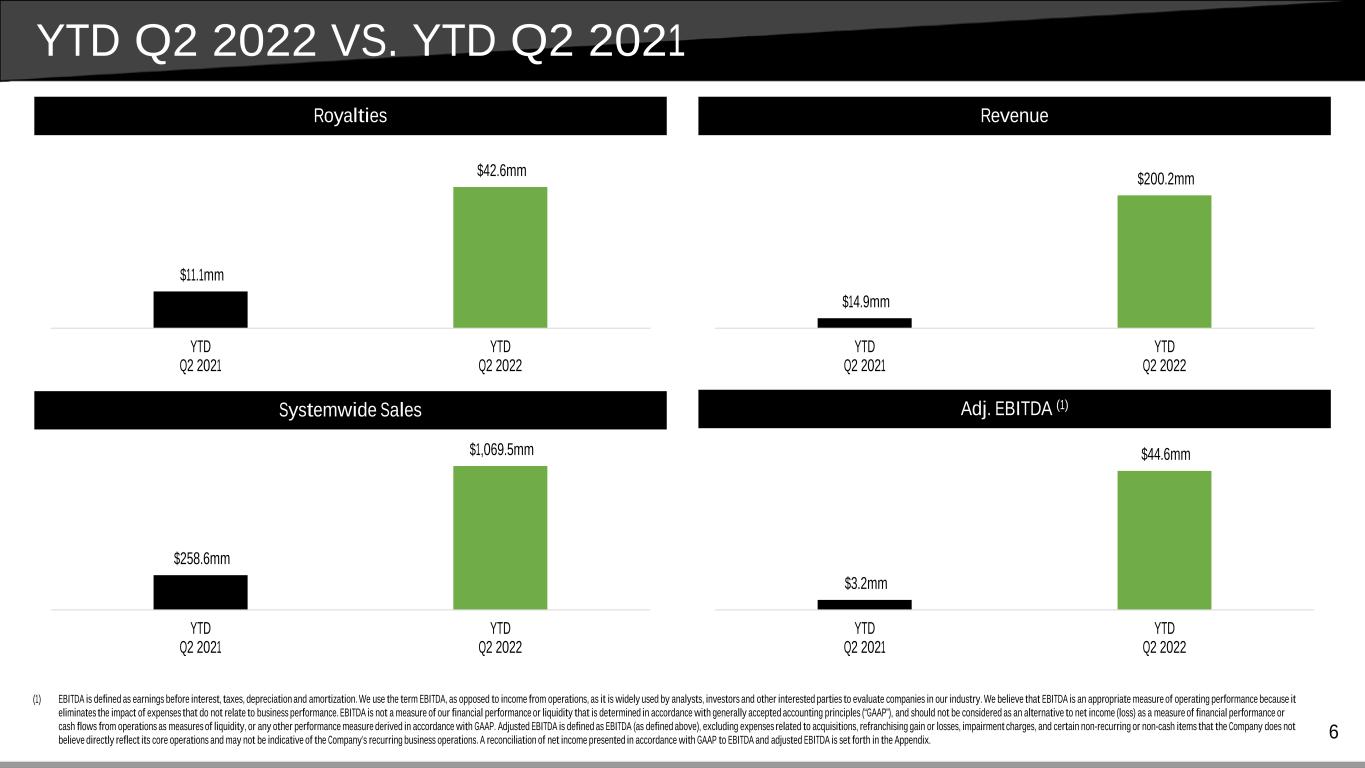
YTD Q2 2022 VS. YTD Q2 2021 6 (1) EBITDA is defined as earnings before interest, taxes, depreciation and amortization. We use the term EBITDA, as opposed to income from operations, as it is widely used by analysts, investors and other interested parties to evaluate companies in our industry. We believe that EBITDA is an appropriate measure of operating performance because it eliminates the impact of expenses that do not relate to business performance. EBITDA is not a measure of our financial performance or liquidity that is determined in accordance with generally accepted accounting principles (“GAAP”), and should not be considered as an alternative to net income (loss) as a measure of financial performance or cash flows from operations as measures of liquidity, or any other performance measure derived in accordance with GAAP. Adjusted EBITDA is defined as EBITDA (as defined above), excluding expenses related to acquisitions, refranchising gain or losses, impairment charges, and certain non-recurring or non-cash items that the Company does not believe directly reflect its core operations and may not be indicative of the Company’s recurring business operations. A reconciliation of net income presented in accordance with GAAP to EBITDA and adjusted EBITDA is set forth in the Appendix. Royalties $11.1mm $42.6mm YTD Q2 2021 YTD Q2 2022 Systemwide Sales Revenue $14.9mm $200.2mm YTD Q2 2021 YTD Q2 2022 Adj. EBITDA (1) $3.2mm $44.6mm YTD Q2 2021 YTD Q2 2022 $258.6mm $1,069.5mm YTD Q2 2021 YTD Q2 2022


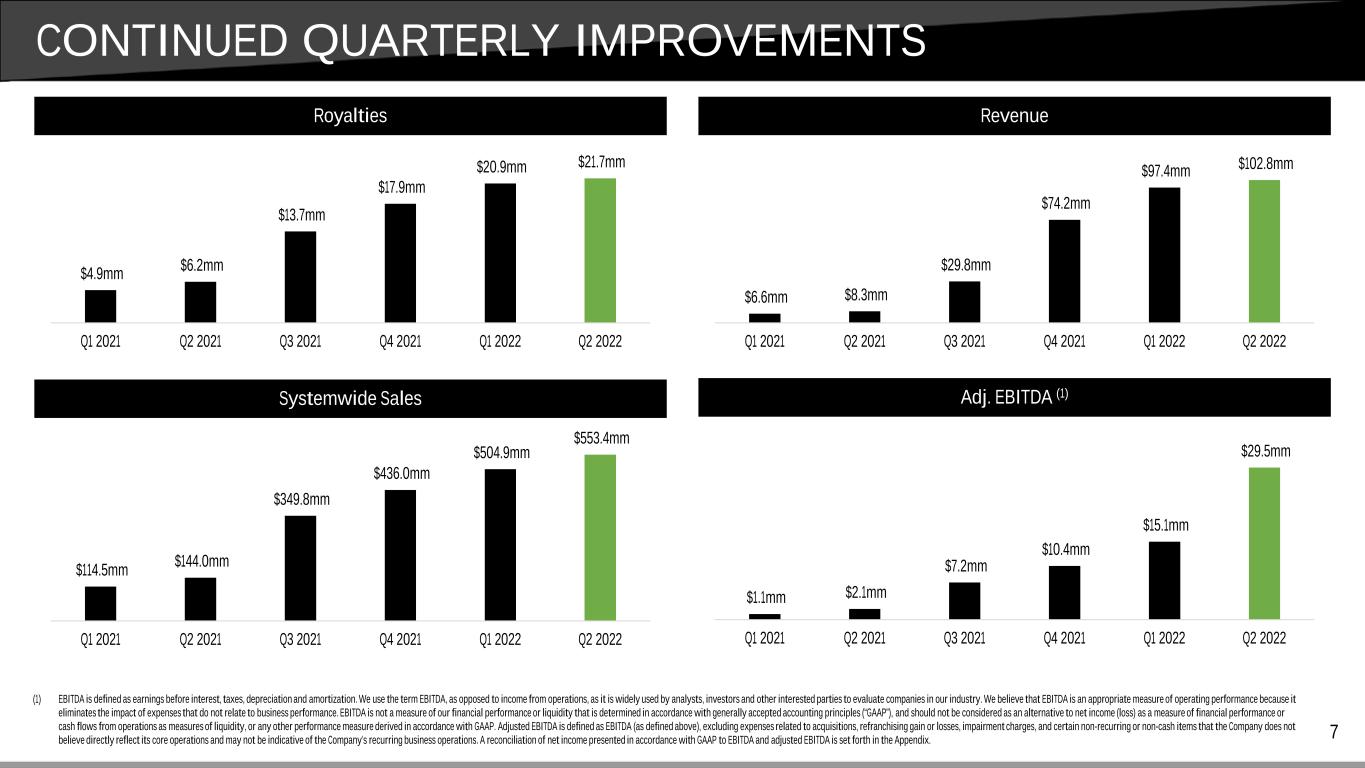
CONTINUED QUARTERLY IMPROVEMENTS 7 Royalties $4.9mm $6.2mm $13.7mm $17.9mm $20.9mm $21.7mm Q1 2021 Q2 2021 Q3 2021 Q4 2021 Q1 2022 Q2 2022 Systemwide Sales $114.5mm $144.0mm $349.8mm $436.0mm $504.9mm $553.4mm Q1 2021 Q2 2021 Q3 2021 Q4 2021 Q1 2022 Q2 2022 Revenue $6.6mm $8.3mm $29.8mm $74.2mm $97.4mm $102.8mm Q1 2021 Q2 2021 Q3 2021 Q4 2021 Q1 2022 Q2 2022 Adj. EBITDA (1) $1.1mm $2.1mm $7.2mm $10.4mm $15.1mm $29.5mm Q1 2021 Q2 2021 Q3 2021 Q4 2021 Q1 2022 Q2 2022 (1) EBITDA is defined as earnings before interest, taxes, depreciation and amortization. We use the term EBITDA, as opposed to income from operations, as it is widely used by analysts, investors and other interested parties to evaluate companies in our industry. We believe that EBITDA is an appropriate measure of operating performance because it eliminates the impact of expenses that do not relate to business performance. EBITDA is not a measure of our financial performance or liquidity that is determined in accordance with generally accepted accounting principles (“GAAP”), and should not be considered as an alternative to net income (loss) as a measure of financial performance or cash flows from operations as measures of liquidity, or any other performance measure derived in accordance with GAAP. Adjusted EBITDA is defined as EBITDA (as defined above), excluding expenses related to acquisitions, refranchising gain or losses, impairment charges, and certain non-recurring or non-cash items that the Company does not believe directly reflect its core operations and may not be indicative of the Company’s recurring business operations. A reconciliation of net income presented in accordance with GAAP to EBITDA and adjusted EBITDA is set forth in the Appendix.


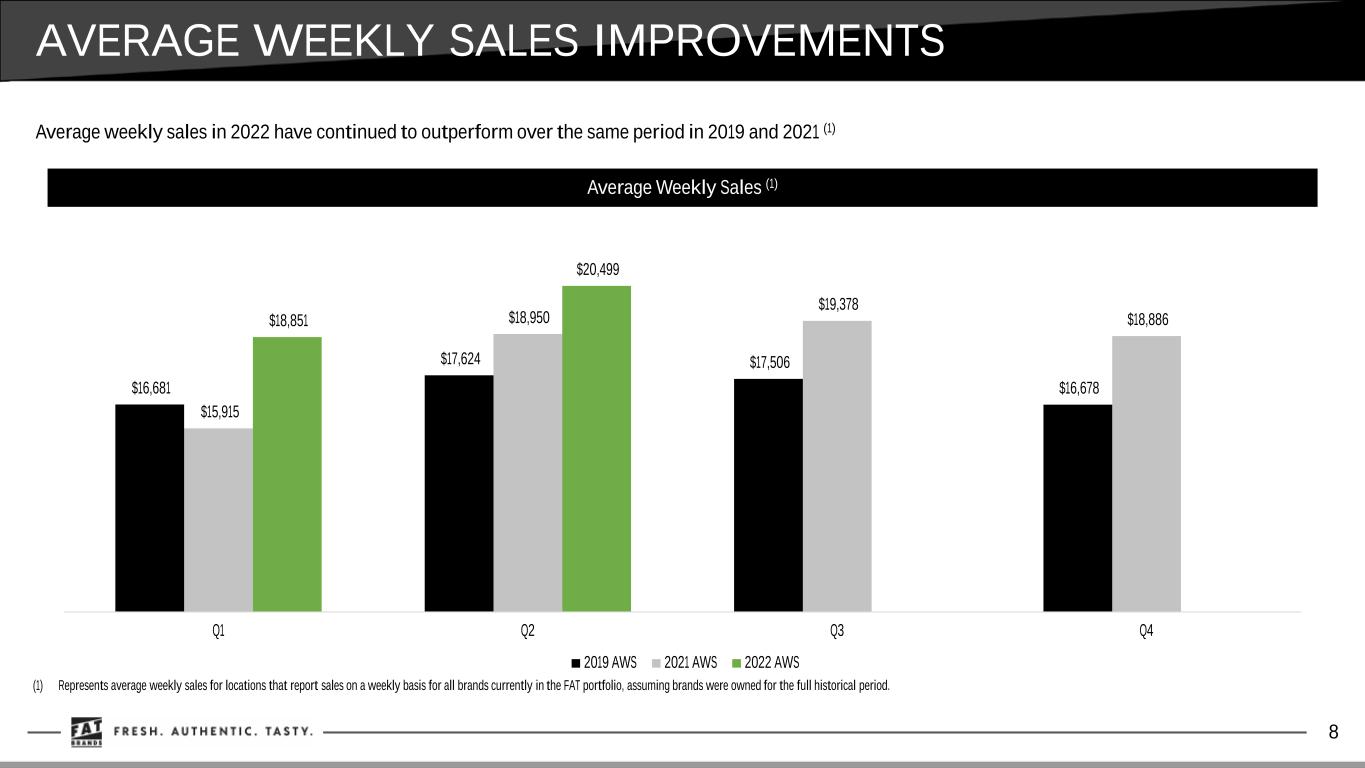
$16,681 $17,624 $17,506 $16,678 $15,915 $18,950 $19,378 $18,886 $18,851 $20,499 Q1 Q2 Q3 Q4 2019 AWS 2021 AWS 2022 AWS AVERAGE WEEKLY SALES IMPROVEMENTS Average weekly sales in 2022 have continued to outperform over the same period in 2019 and 2021 (1) 8 (1) Represents average weekly sales for locations that report sales on a weekly basis for all brands currently in the FAT portfolio, assuming brands were owned for the full historical period. Average Weekly Sales (1)


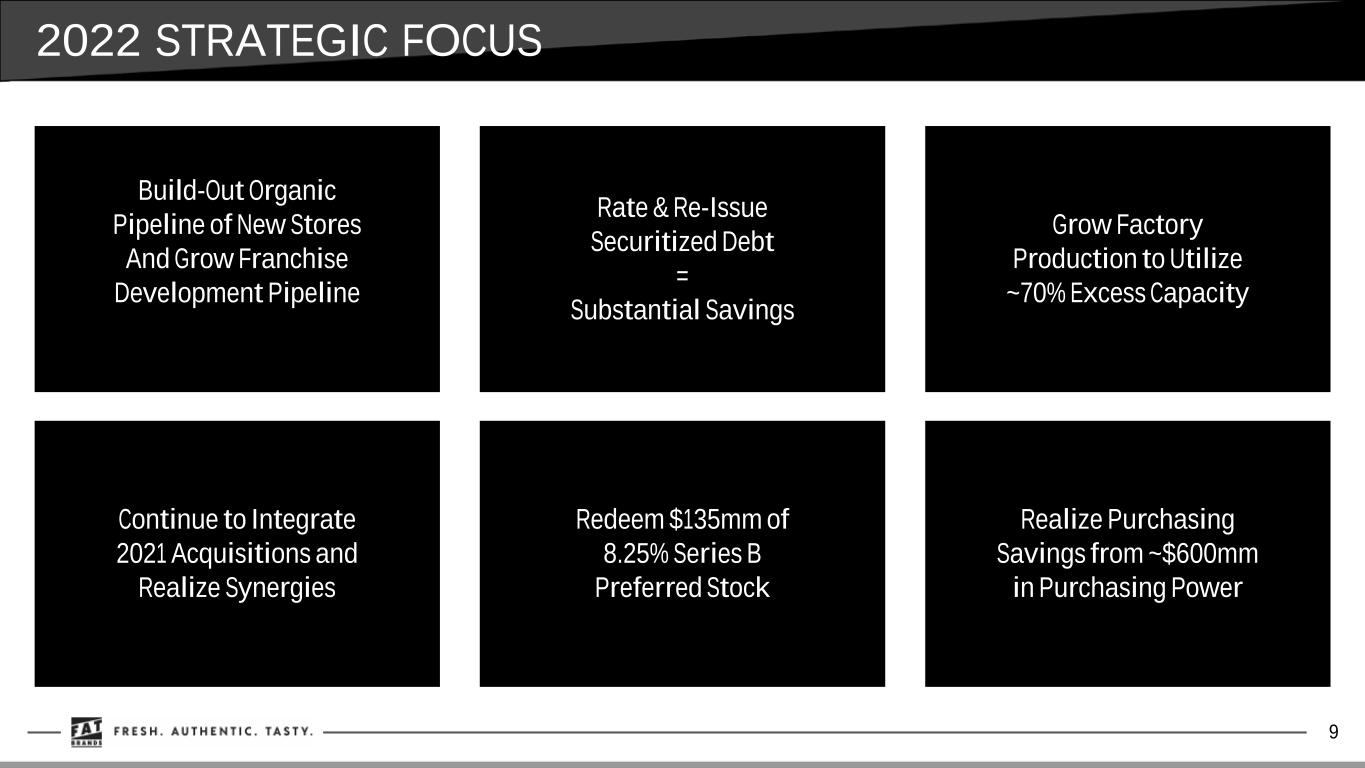
2022 STRATEGIC FOCUS 9 Build-Out Organic Pipeline of New Stores And Grow Franchise Development Pipeline Continue to Integrate 2021 Acquisitions and Realize Synergies Rate & Re-Issue Securitized Debt = Substantial Savings Redeem $135mm of 8.25% Series B Preferred Stock Grow Factory Production to Utilize ~70% Excess Capacity Realize Purchasing Savings from ~$600mm in Purchasing Power


APPENDIX


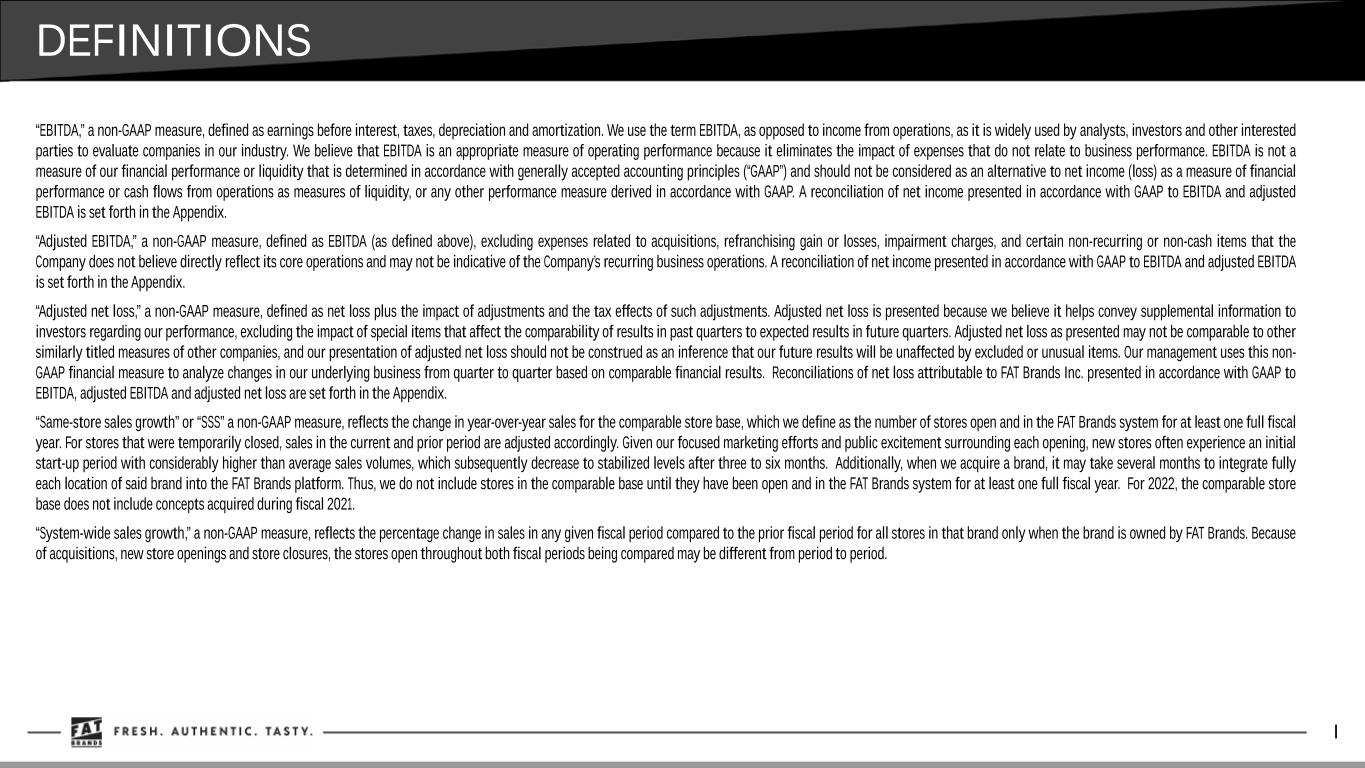
DEFINITIONS “EBITDA,” a non-GAAP measure, defined as earnings before interest, taxes, depreciation and amortization. We use the term EBITDA, as opposed to income from operations, as it is widely used by analysts, investors and other interested parties to evaluate companies in our industry. We believe that EBITDA is an appropriate measure of operating performance because it eliminates the impact of expenses that do not relate to business performance. EBITDA is not a measure of our financial performance or liquidity that is determined in accordance with generally accepted accounting principles (“GAAP”) and should not be considered as an alternative to net income (loss) as a measure of financial performance or cash flows from operations as measures of liquidity, or any other performance measure derived in accordance with GAAP. A reconciliation of net income presented in accordance with GAAP to EBITDA and adjusted EBITDA is set forth in the Appendix. “Adjusted EBITDA,” a non-GAAP measure, defined as EBITDA (as defined above), excluding expenses related to acquisitions, refranchising gain or losses, impairment charges, and certain non-recurring or non-cash items that the Company does not believe directly reflect its core operations and may not be indicative of the Company’s recurring business operations. A reconciliation of net income presented in accordance with GAAP to EBITDA and adjusted EBITDA is set forth in the Appendix. “Adjusted net loss,” a non-GAAP measure, defined as net loss plus the impact of adjustments and the tax effects of such adjustments. Adjusted net loss is presented because we believe it helps convey supplemental information to investors regarding our performance, excluding the impact of special items that affect the comparability of results in past quarters to expected results in future quarters. Adjusted net loss as presented may not be comparable to other similarly titled measures of other companies, and our presentation of adjusted net loss should not be construed as an inference that our future results will be unaffected by excluded or unusual items. Our management uses this non- GAAP financial measure to analyze changes in our underlying business from quarter to quarter based on comparable financial results. Reconciliations of net loss attributable to FAT Brands Inc. presented in accordance with GAAP to EBITDA, adjusted EBITDA and adjusted net loss are set forth in the Appendix. “Same-store sales growth” or “SSS” a non-GAAP measure, reflects the change in year-over-year sales for the comparable store base, which we define as the number of stores open and in the FAT Brands system for at least one full fiscal year. For stores that were temporarily closed, sales in the current and prior period are adjusted accordingly. Given our focused marketing efforts and public excitement surrounding each opening, new stores often experience an initial start-up period with considerably higher than average sales volumes, which subsequently decrease to stabilized levels after three to six months. Additionally, when we acquire a brand, it may take several months to integrate fully each location of said brand into the FAT Brands platform. Thus, we do not include stores in the comparable base until they have been open and in the FAT Brands system for at least one full fiscal year. For 2022, the comparable store base does not include concepts acquired during fiscal 2021. “System-wide sales growth,” a non-GAAP measure, reflects the percentage change in sales in any given fiscal period compared to the prior fiscal period for all stores in that brand only when the brand is owned by FAT Brands. Because of acquisitions, new store openings and store closures, the stores open throughout both fiscal periods being compared may be different from period to period. I


CONSOLIDATED STATEMENT OF OPERATIONS II FAT Brands Inc. Consolidated Statements of Operations Thirteen Weeks Ended Twenty-Six Weeks Ended June 26, 2022 June 27, 2021 June 26, 2022 June 27, 2021 Revenue Royalties $ 21,665 $ 6,161 $ 42,563 $ 11,057 Restaurant sales 60,044 234 118,121 234 Advertising fees 9,568 1,370 18,929 2,560 Factory revenues 8,570 — 16,749 — Franchise fees 1,295 482 2,009 1,022 Management fees and other income 1,643 35 1,817 58 Total revenue 102,785 8,282 200,188 14,931 Costs and expenses General and administrative expense 20,841 5,097 45,437 9,624 Cost of restaurant and factory revenues 49,846 244 104,644 244 Depreciation and amortization 6,711 386 13,181 784 Refranchising loss (gain) 453 (856) 1,001 (429) Acquisition costs 135 917 383 932 Advertising fees 11,596 1,367 21,853 2,560 Total costs and expenses 89,582 7,155 186,499 13,715 Income from operations 13,203 1,127 13,689 1,216 Other (expense) income, net Interest expense (18,998) (2,406) (38,026) (4,866) Interest expense related to preferred shares (4,715) (264) (6,714) (552) Net loss on extinguishment of debt — (6,405) — (6,405) Other income, net 2,071 25 3,381 123 Total other (expense) income, net (21,642) (9,050) (41,359) (11,700) Loss before income tax expense (8,439) (7,923) (27,670) (10,484) Income tax (benefit) provision (251) (1,992) 4,273 (2,121) Net loss (8,188) (5,931) $ (31,943) (8,363) Less: Net loss attributable to noncontrolling interest — (5) — (5) Net loss attributable to FAT Brands Inc. $ (8,188) $ (5,926) $ (31,943) $ (8,358) Basic and diluted loss per common share $ (0.50) $ (0.48) $ (1.95) $ (0.69) Basic and diluted weighted average shares outstanding 16,405,108 12,275,370 16,396,896 12,122,938 Cash dividends declared per common share $ 0.13 $ 0.13 $ 0.26 $ 0.26


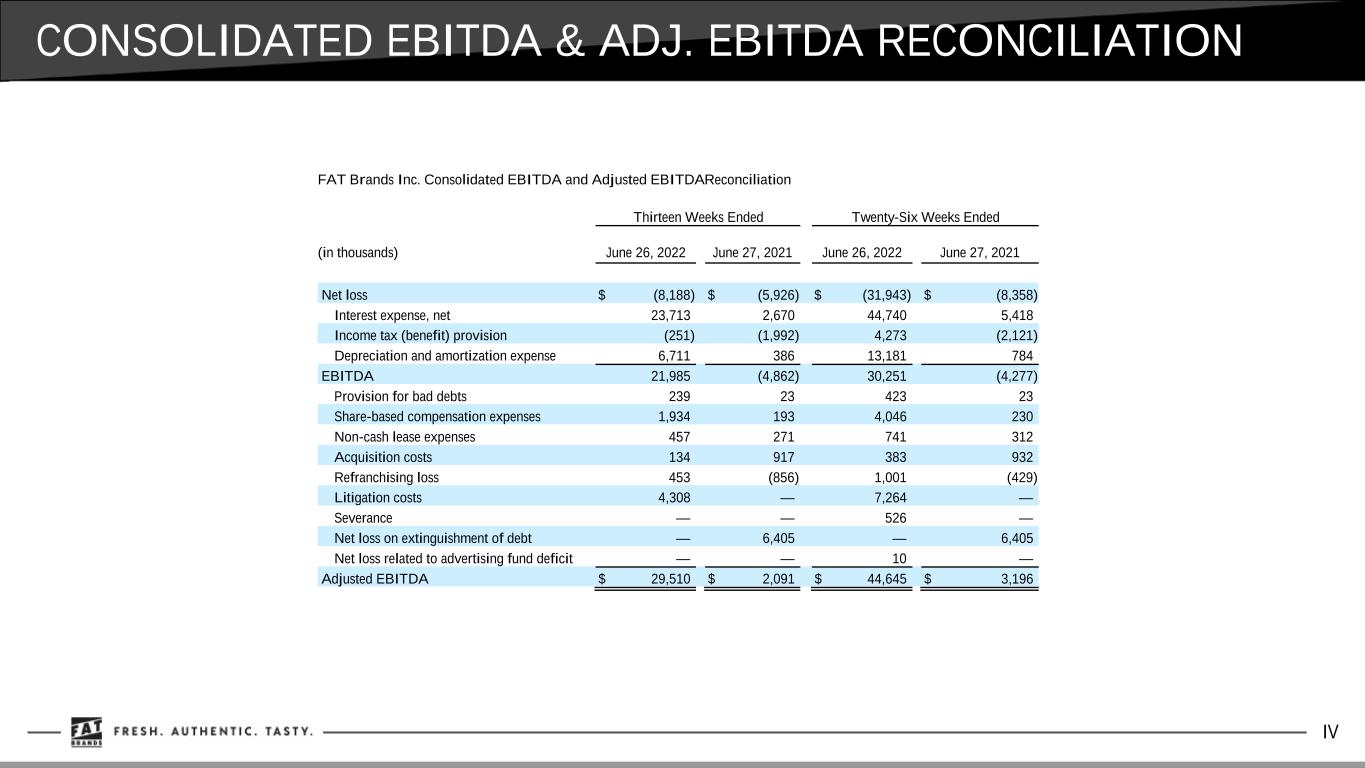
CONSOLIDATED EBITDA & ADJ. EBITDA RECONCILIATION IV FAT Brands Inc. Consolidated EBITDA and Adjusted EBITDA Reconciliation Thirteen Weeks Ended Twenty-Six Weeks Ended (in thousands) June 26, 2022 June 27, 2021 June 26, 2022 June 27, 2021 Net loss $ (8,188) $ (5,926) $ (31,943) $ (8,358) Interest expense, net 23,713 2,670 44,740 5,418 Income tax (benefit) provision (251) (1,992) 4,273 (2,121) Depreciation and amortization expense 6,711 386 13,181 784 EBITDA 21,985 (4,862) 30,251 (4,277) Provision for bad debts 239 23 423 23 Share-based compensation expenses 1,934 193 4,046 230 Non-cash lease expenses 457 271 741 312 Acquisition costs 134 917 383 932 Refranchising loss 453 (856) 1,001 (429) Litigation costs 4,308 — 7,264 — Severance — — 526 — Net loss on extinguishment of debt — 6,405 — 6,405 Net loss related to advertising fund deficit — — 10 — Adjusted EBITDA $ 29,510 $ 2,091 $ 44,645 $ 3,196


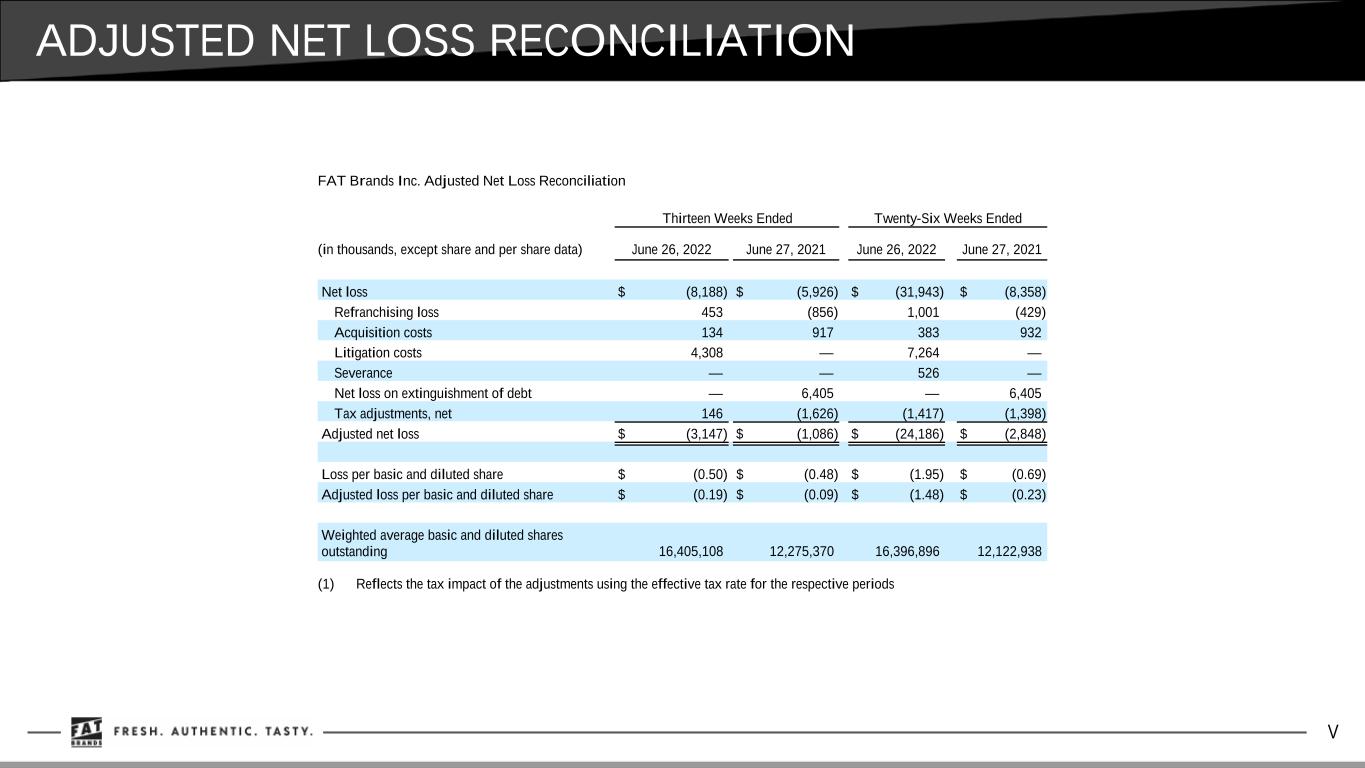
ADJUSTED NET LOSS RECONCILIATION V FAT Brands Inc. Adjusted Net Loss Reconciliation Thirteen Weeks Ended Twenty-Six Weeks Ended (in thousands, except share and per share data) June 26, 2022 June 27, 2021 June 26, 2022 June 27, 2021 Net loss $ (8,188) $ (5,926) $ (31,943) $ (8,358) Refranchising loss 453 (856) 1,001 (429) Acquisition costs 134 917 383 932 Litigation costs 4,308 — 7,264 — Severance — — 526 — Net loss on extinguishment of debt — 6,405 — 6,405 Tax adjustments, net 146 (1,626) (1,417) (1,398) Adjusted net loss $ (3,147) $ (1,086) $ (24,186) $ (2,848) Loss per basic and diluted share $ (0.50) $ (0.48) $ (1.95) $ (0.69) Adjusted loss per basic and diluted share $ (0.19) $ (0.09) $ (1.48) $ (0.23) Weighted average basic and diluted shares outstanding 16,405,108 12,275,370 16,396,896 12,122,938 (1) Reflects the tax impact of the adjustments using the effective tax rate for the respective periods


 
CONTACT INVESTOR RELATIONS: MEDIA RELATIONS: ICR MICHELLE MICHALSKI [email protected] 646-277-1224 FAT BRANDS ERIN MANDZIK [email protected] 860-212-6509