Exhibit 99.1
| |

FuelCell Energy Reports Third Fiscal Quarter 2026 Results;
Executes First Data Center Power Agreement, Increases Annualized Production Rate & Focuses on Capacity Expansion
DANBURY, Conn., September 2, 2026 (GLOBE NEWSWIRE) — FuelCell Energy, Inc. (“FuelCell Energy” or the “Company”) (NASDAQ: FCEL) today reported financial results for its third quarter ended July 31, 2026.
Third Fiscal Quarter 2026 Operational and Financial Highlights
(All comparisons are year-over-year unless otherwise noted)
| ● | Committed Backlog of $1.3 billion as of July 31, 2026, compared to $1.24 billion as of July 31, 2025, an increase of approximately 4.1% which includes the commitment by Fit Energy USA LP (“Fit Energy”) to purchase fuel cell systems representing generation capacity of 30 MW |
| ● | Added $2.4 billion to Awarded Capacity Backlog related to Fit Energy’s option to purchase additional fuel cell systems representing generation capacity of up to 350 MW |
| ● | Subsequent to the third quarter, signed the Company’s first Capacity Reservation Agreement with a major data center operator for a planned 75 MW project in Texas, supported by an upfront reservation payment |
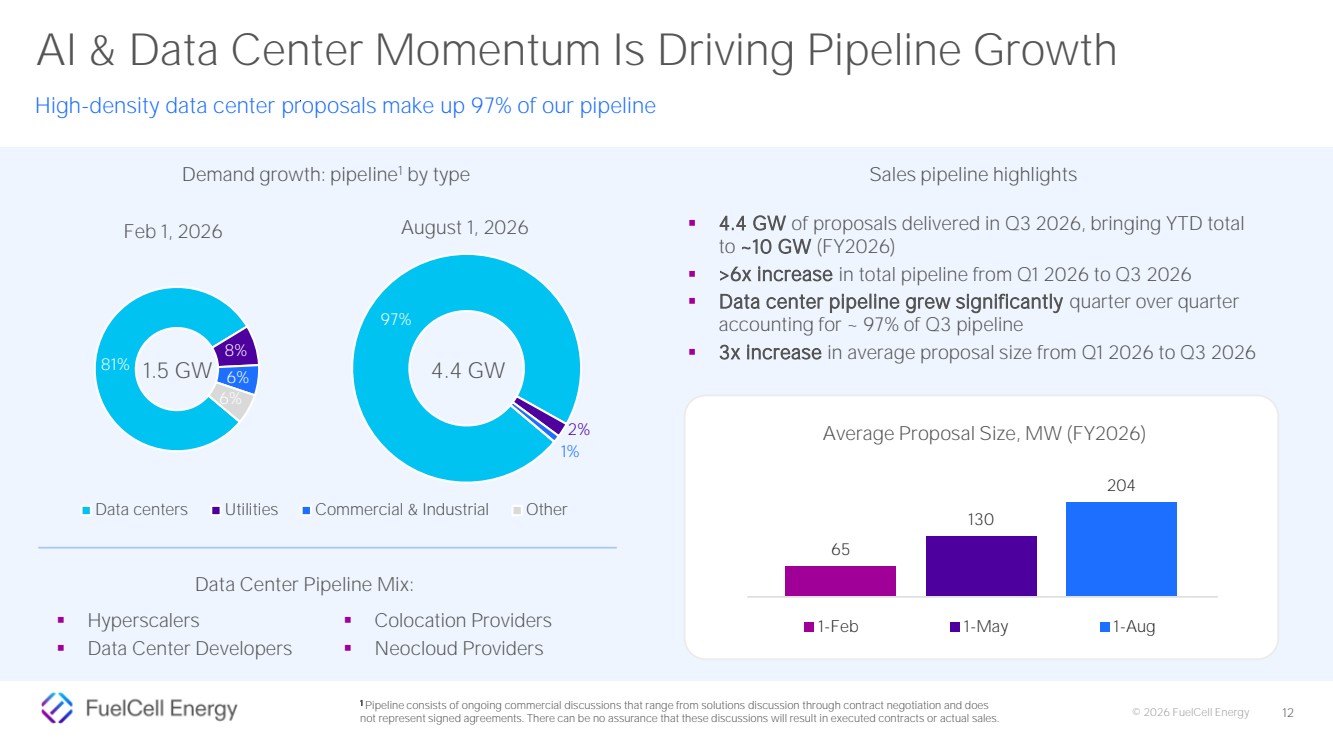
| ● | Sales pipeline1 in Q3 2026 increased to a total of approximately 10 gigawatts (“GW”) for fiscal year 2026 |
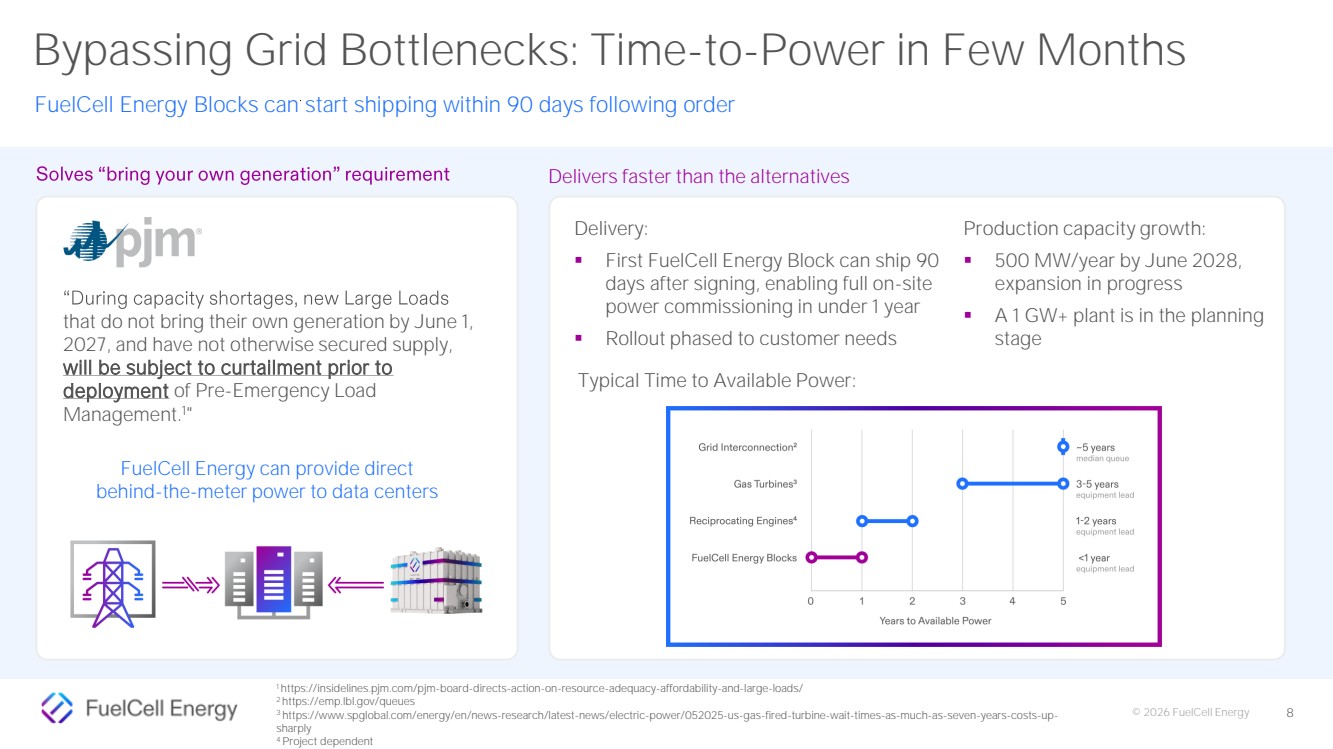
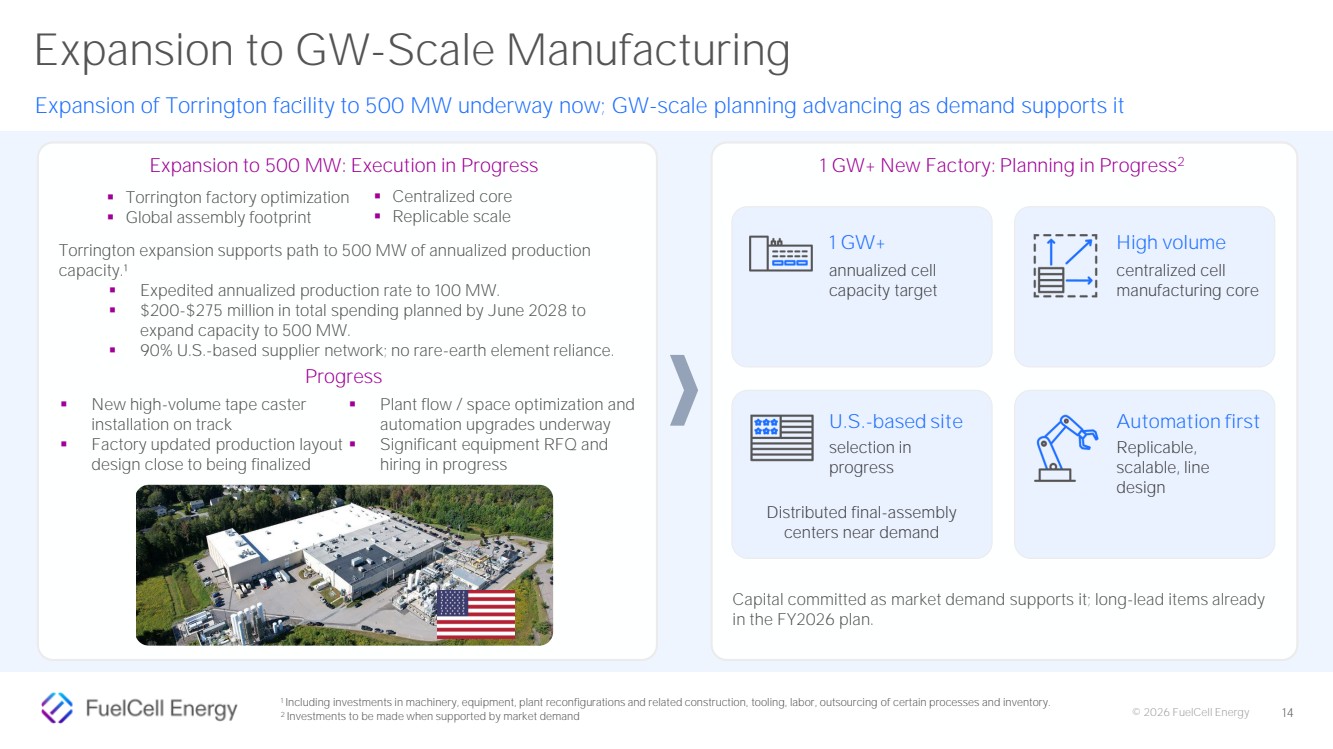
| ● | Continued work on expansion of Torrington, CT fuel cell manufacturing facility to 500 MW of total annualized production capacity; completion expected by June 2028 |
| ● | Signed an MOU with Siemens with the goal of supporting faster, lower-cost deployment of 100+ MW commercial projects |
| ● | Delivered first two carbon capture modules to ExxonMobil Technology and Engineering Company in Rotterdam, The Netherlands in connection with the companies’ carbon capture collaboration |
| ● | Revenue of $33.0 million, compared to $46.7 million, a decrease of approximately 29% |
| ● | Gross loss of $(24.5) million, compared to $(5.1) million, an increase of approximately 377% |
| ● | Loss from operations of $(46.7) million, compared with $(95.4) million, a decrease of approximately 51% |
| ● | Net loss per share attributable to common stockholders was $(0.64), compared with $(3.78) |
| ● | Cash, cash equivalents, restricted cash and restricted cash equivalents totaled $737.3 million |
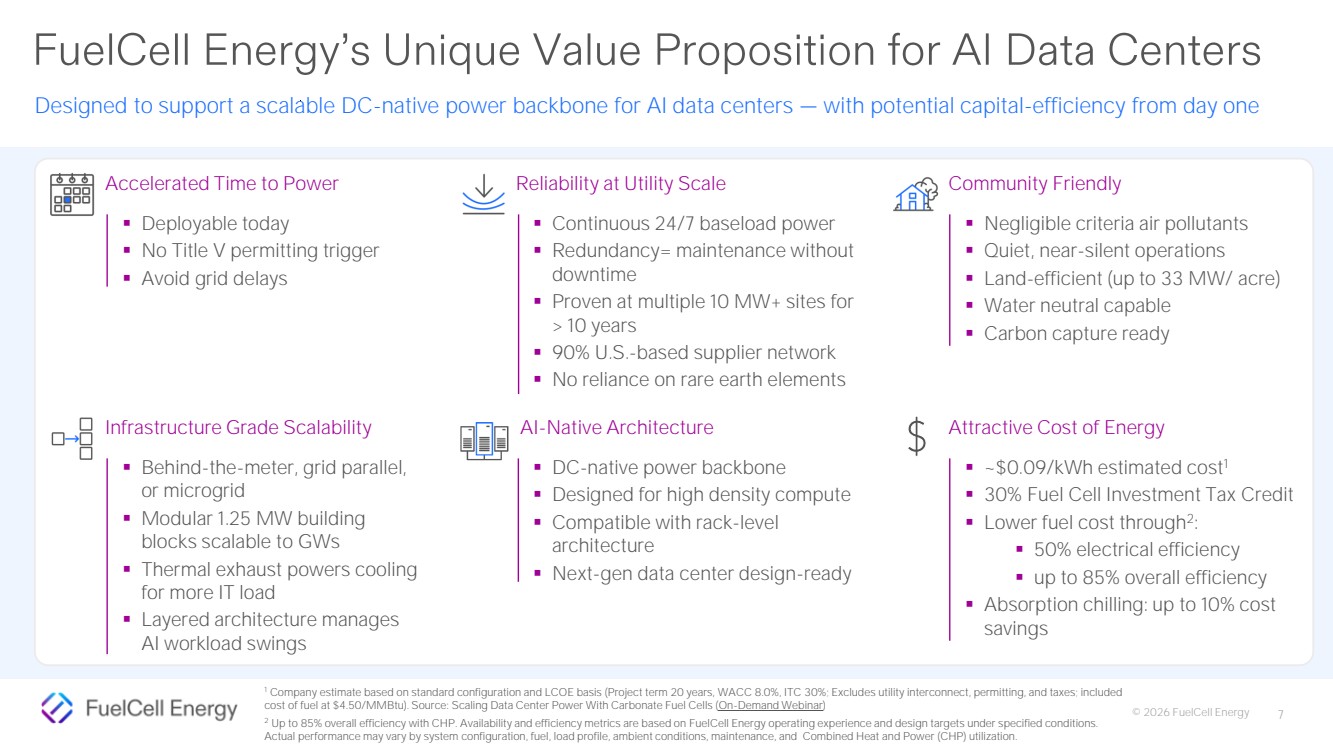
"During the third quarter, FuelCell Energy accelerated the commercial execution of our data center strategy while continuing to expand the manufacturing capacity we believe is required to support long-term growth," said Jason Few, President and CEO of FuelCell Energy. "Our capital equipment purchase agreement with Fit Energy for a total aggregate generation capacity of up to 380 MW across four potential phases, intended to supply baseload power for data center applications, represents an important commercial milestone and validates FuelCell Energy’s ability to help meet the growing demand for utility-scale, behind-the-meter power solutions that accelerate time-to-power.
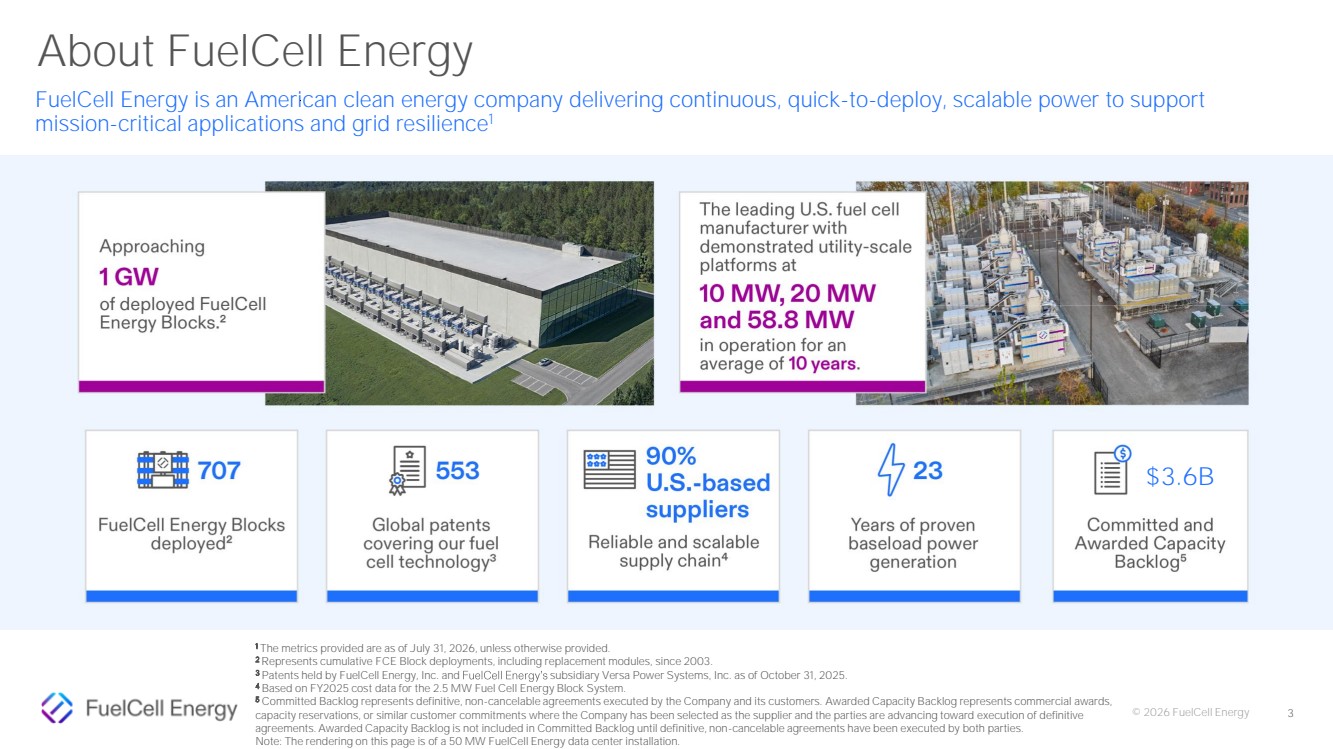
“The expansion of our Committed and Awarded Capacity Backlog to $3.6 billion reflects increasing customer demand for reliable, scalable infrastructure that reduces dependence on constrained transmission systems, simplifies permitting, and enables AI driven compute to be deployed faster.
“Along with the increasing interest in FuelCell Energy’s power solutions, we are investing with discipline to scale our manufacturing capabilities. The expansion of our Torrington facility to accommodate an annualized production
1 Pipeline consists of ongoing commercial discussions that range from solutions discussion through contract negotiation and does not represent signed agreements. There can be no assurance that these discussions will result in executed contracts or actual sales.
rate of 500 MW is underway and will strengthen our ability to convert commercial momentum into revenue while supporting growth.
“Demand for electricity is accelerating, driven by AI, data centers, and the broader electrification of the economy. With a growing commercial pipeline, expanding manufacturing capacity, and differentiated technology, we believe FuelCell Energy is well positioned to capitalize on these long-term market tailwinds."
Business Updates
During the third quarter, FuelCell Energy and Fit Energy entered into a capital equipment purchase agreement, pursuant to which FuelCell Energy agreed to manufacture, sell, and deliver to Fit Energy carbonate fuel cell block systems with a total aggregate generation capacity of up to 380 MW across four potential phases. The fuel cell systems are intended to supply baseload electricity for data center applications. We expect to begin delivery of the initial phase (Phase 0) consisting of 30 MW of generation capacity in the fourth quarter of fiscal year 2026. Fit Energy has the ability to elect, at its sole option, to proceed with the remaining phases for generation capacity of 100 MW in Phase 1, generation capacity of 125 MW in Phase 2 and generation capacity of an additional 125 MW in Phase 3, in each case, with a milestone-based payment obligation with an initial deposit due at election of each phase, upon delivery by Fit of timely election notices.
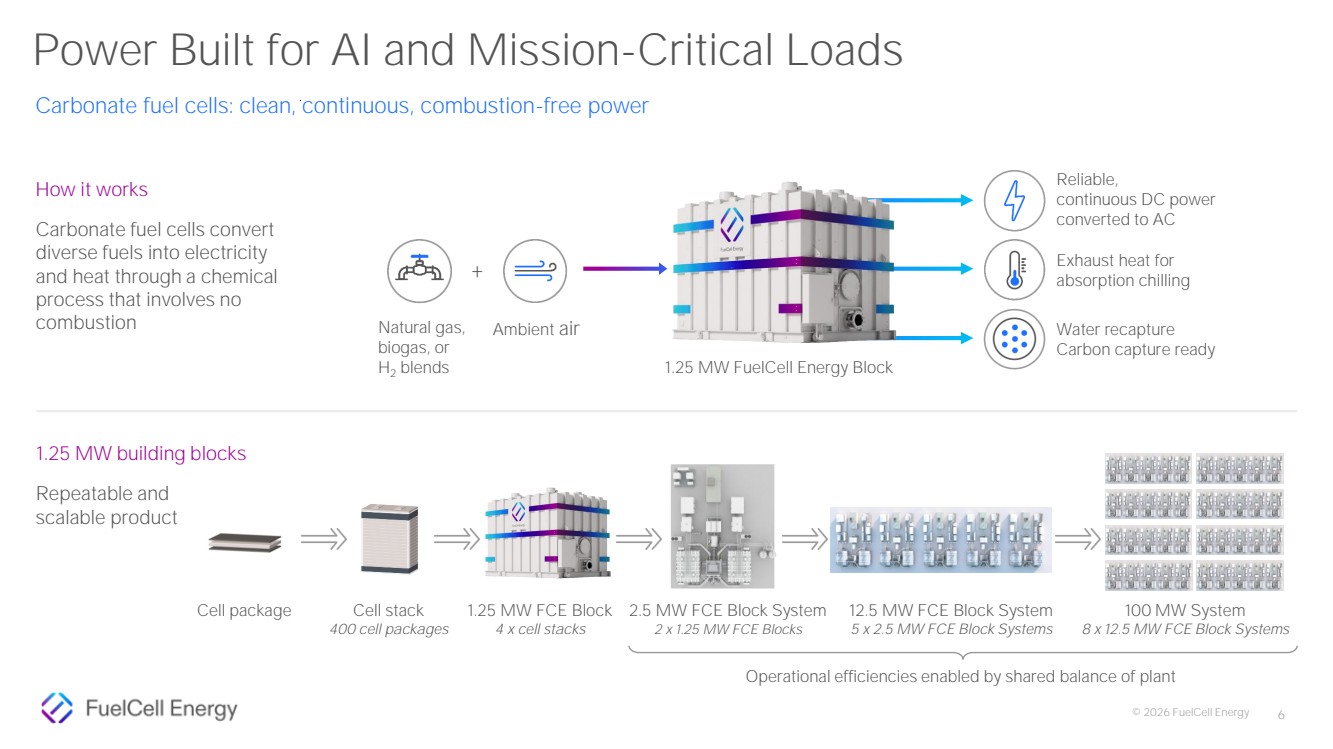
Subsequent to the end of the third quarter, FuelCell Energy signed its first Capacity Reservation Agreement with a major data center operator for a planned 75 MW project in Texas. The agreement includes an upfront reservation payment that provides the operator with priority access to FuelCell Energy’s manufacturing capacity while the parties finalize definitive project agreements. The planned deployment is expected to consist of six 12.5 MW FuelCell Energy Block systems, providing a modular, scalable power architecture designed to support the planned data center’s power requirements. Under the agreement, FuelCell Energy will reserve manufacturing capacity and initiate procurement of long-lead components to support the planned deployment. Financial terms were not disclosed.
In addition, during the third quarter, the Company advanced its production execution at, and progressed its expansion of, the Torrington, CT fuel cell manufacturing facility on two important fronts:
| ● | The Company continued to increase its annualized production rate, with the goal of achieving its targeted annualized production rate of 100 MW in October 2026. Based on this planned increase in annualized production rate, the Company is now targeting achieving positive Adjusted EBITDA results in the fourth quarter of fiscal 2027, subject to the conversion of Awarded Capacity Backlog into Committed Backlog, customer delivery schedules and continued execution of the Company’s cost reduction initiatives. |
| ● | In parallel, the Company made significant progress in resolving constraints to the annualized production capacity increase to 500 MW at the Torrington manufacturing facility, including tape caster installation, factory design engineering, and significant purchase commitments for equipment. The expansion to 500 MW of annualized manufacturing capacity is scheduled for completion by June 2028. |
During the quarter, FuelCell Energy also announced a collaboration with Siemens intended to accelerate the growth of fuel cell-based power generation. Formalized in a memorandum of understanding, Siemens will design and supply electrical balance of plant (EBOP) systems for FuelCell Energy installations, supporting faster, lower-cost deployment of fuel cells to 100+ MW commercial projects. The two companies plan to jointly develop integrated distributed energy systems incorporating fuel cells, battery energy storage, microgrid controls, and medium-voltage electrical equipment.
During the third quarter, the Company completed the repowering of the Gyeonggi Green Energy ("GGE") fuel cell park in the Hwaseong Baran Industrial Complex in South Korea, one of the largest fuel cell parks in the world. With the delivery of six fuel cell modules during the quarter, FuelCell Energy has now delivered all 42 of the fuel cell modules committed to GGE since 2024, generating $18 million of product revenue in the quarter, which was in line with prior targets. This project is supported by multi-million-dollar loans from the Export-Import Bank of the United States (EXIM), underscoring the role of U.S. export financing in advancing the Company's international deployments.
Also during the third quarter, the Company reached a pivotal milestone in its multi-year joint development agreement with ExxonMobil Technology and Engineering Company ("EMTEC"), delivering and installing the first two carbonate fuel cell carbon capture modules at Esso Nederland B.V.'s Rotterdam Manufacturing Complex in The Netherlands. This marks the first industrial-scale demonstration of the companies' jointly developed carbon capture technology, advancing it from years of joint research and development into real-world operation. Unlike conventional carbon capture, FuelCell Energy's carbonate fuel cells are capable of capturing CO₂ directly from industrial sources while simultaneously generating power and hydrogen — co-products that can reduce the overall cost of carbon capture. The demonstration is intended to evaluate performance under industrial operating conditions and inform future development of the jointly developed technology.
Committed and Awarded Capacity Backlog
| As of July 31, | | | ||
(Amounts in thousands) | 2026 | | 2025 | | Change |
Committed Backlog | | | | | |
Product | $ 108,865 | | $ 96,183 | | $ 12,682 |
Service | 263,648 | | 169,384 | | 94,264 |
Generation | 915,725 | | 955,033 | | (39,308) |
Advanced Technologies | 7,772 | | 24,254 | | (16,482) |
Total Committed Backlog | $ 1,296,010 | | $ 1,244,854 | | $ 51,156 |
Awarded Capacity Backlog | | | | | |
Product | $ 1,058,750 | | - | | $ 1,058,750 |
Service | 1,291,500 | | - | | 1,291,500 |
Total Awarded Capacity Backlog | $ 2,350,250 | | - | | $ 2,350,250 |
| | | | | |
Total Committed and Awarded Capacity Backlog | $ 3,646,260 | | $ 1,244,854 | | $ 2,401,406 |
Overall, Committed Backlog increased by approximately 4.1% to $1.3 billion as of July 31, 2026, compared to $1.24 billion as of July 31, 2025, primarily as a result of the Capital Equipment Purchase Agreement (“CEPA”) with Fit Energy, partially offset by revenue recognition over the period.
As of July 31, 2026, Awarded Capacity Backlog consisted of the estimated product and service value associated with 350 MW under Phases 1, 2 and 3 of the CEPA with Fit Energy. Fit Energy may elect to proceed with those Phases 1, 2 and 3 at its sole option. No payment obligation for Phases 1, 2 and 3 arises until Fit makes the applicable election, at which time an initial deposit becomes due. Site identification and customer development, permitting, financing, ownership and construction activities may also remain outstanding. As sites are identified, the parties to the CEPA are required to enter into prescribed project-specific commissioning agreements and long-term service agreements at pricing set forth in the CEPA. Awarded Capacity Backlog is not contracted backlog, firm order backlog or a guarantee of future revenue. Amounts may not convert to Committed Backlog or revenue, in whole or in part, and the timing and amount of any conversion may differ materially from current estimates.
Committed Backlog represents definitive, non-cancelable agreements executed by the Company and its customers. Awarded Capacity Backlog represents commercial awards, capacity reservations, or similar customer commitments where the Company has been selected as the supplier and the parties are advancing toward execution of definitive agreements. Awarded Capacity Backlog is not included in Committed Backlog until definitive, non-cancelable agreements have been executed by both parties.
Together, the service and generation portions of Committed Backlog had a weighted average term of approximately 15 years as of July 31, 2026, with weighting based on the dollar amount of backlog and utility service contracts of up to 20 years in duration at inception.
Consolidated Financial Metrics
Three Months Ended July 31, | | |||||
(Amounts in thousands, except per share data) | 2026 | 2025 | Change | | ||
Total revenues | $33,001 | $46,743 | (29%) | |||
Gross loss | (24,503) | (5,134) | 377% | |||
Loss from operations | (46,660) | (95,364) | (51%) | |||
Net loss | (45,283) | | (91,896) | | (51%) | |
Net loss attributable to common stockholders | (45,267) | (92,456) | (51%) | |||
Net loss per basic and diluted share attributable to common stockholders | $ (0.64) | $ (3.78) | | (83%) | ||
| ||||||
EBITDA * | $ (37,273) | | $ (85,618) | | (56%) | |
Adjusted EBITDA * | $ (36,738) | $ (16,380) | 124% | |||
Adjusted net loss per basic and diluted share attributable to common stockholders * | $ (0.64) | | $ (0.95) | | (33%) | |
* Reconciliations of non-GAAP measures EBITDA, Adjusted EBITDA and Adjusted net loss per basic and diluted share attributable to common stockholders are contained in the appendix to this press release.
Third Fiscal Quarter 2026 Financial Results
(All comparisons are between third quarter of fiscal 2026 and third quarter of fiscal 2025 unless otherwise noted)
Third quarter revenue of $33.0 million represents a decrease of 29% from the comparable prior year
quarter. This was primarily due to lower product revenue resulting from fewer module deliveries to customers in Korea compared to the comparable prior year quarter and lower generation revenue due to lower operating output from plants in our generation portfolio, including the 7.4 MW Groton Project at the U.S. Navy’s submarine base in Groton, CT, which was not operating pending an equipment upgrade during the quarter.
Net loss was $(45.3) million in the third quarter of fiscal 2026, compared to net loss of $(91.9) million in the third quarter of fiscal 2025. Decreased net loss in the third quarter of fiscal 2026 was primarily due to the lack of impairment and restructuring expenses which impacted net loss in the prior year period, partially offset by a higher gross loss than the prior year period. The gross loss from product revenues for the three months ended July 31, 2026 reflects product costs and manufacturing overhead that currently exceed the contractual pricing established under the CEPA with Fit Energy. Our per-unit product costs, and the fixed manufacturing overhead absorbed into those costs, reflect the annualized production rate of approximately 37.1 MW at which we operated during the quarter, which remains below the production volume at which we expect our cost structure to align with market-based pricing for orders of this scale. Charges totaling $17.0 million were recorded during the three months ended July 31, 2026 and reflect the impact of contractual pricing provisions associated with specific inventory and firm purchase commitments arising as a result of Phase 0 of the CEPA as of July 31, 2026. The charges are expected to be limited to identified inventory and purchase commitments for Phase 0 of the CEPA with Fit Energy, and do not reflect management’s expectations regarding the overall economic value of the CEPA. As production volumes
increase, we expect improved absorption of fixed manufacturing overhead, greater purchasing scale and continued execution of our cost reduction initiatives to result in product and overhead costs per unit below our current cost profile.
Net loss attributable to common stockholders was $(45.3) million in the third quarter of fiscal 2026, compared to net loss attributable to common stockholders of $(92.5) million in the third quarter of fiscal 2025. The decrease in net loss attributable to common stockholders was primarily due to the decrease in loss from operations for the three months ended July 31, 2026, which was primarily due to the lack of impairment and restructuring expenses that impacted loss from operations for the three months ended July 31, 2025.
Adjusted EBITDA totaled $(36.7) million in the third quarter of fiscal 2026, compared to Adjusted EBITDA of $(16.4) million in the third quarter of fiscal 2025. The negative impact on Adjusted EBITDA is primarily due to the inventory valuation charges described above. Please see the discussion of non-GAAP financial measures, including Adjusted EBITDA, in the appendix at the end of this release.
The net loss per share attributable to common stockholders in the third quarter of fiscal 2026 was $(0.64), compared to $(3.78) in the third quarter of fiscal 2025. The decrease in net loss per share attributable to common stockholders is primarily due to the higher number of weighted average shares outstanding due to share issuances since July 31, 2025.
Cash and Restricted Cash
Cash and cash equivalents and restricted cash and cash equivalents totaled $737.3 million as of July 31, 2026, compared to $341.8 million as of October 31, 2025. Of the $737.3 million as of July 31, 2026, unrestricted cash and cash equivalents totaled $658.1 million and restricted cash and cash equivalents totaled $79.2 million. Of the $341.8 million total as of October 31, 2025, unrestricted cash and cash equivalents totaled $278.1 million and restricted cash and cash equivalents totaled $63.7 million.
Sales of Common Stock
On July 9, 2026, the Company completed the underwritten public offering of 12,321,429 shares of the Company’s common stock (including the full exercise of the underwriters’ option to purchase additional shares) at a price to the public of $21.00 per share. Net proceeds to the Company were approximately $245.5 million after deducting underwriting discounts and commissions of approximately $12.9 million and other offering expenses payable by the Company of approximately $0.4 million. The Company currently intends to use the net proceeds from this offering for capital expenditures related to expansion of manufacturing capacity to support growth, working capital and general corporate purposes.
During the three months ended July 31, 2026, approximately 4.1 million shares of the Company’s common stock were sold under the Company’s Open Market Sale Agreement, as amended, at an average sale price of $13.31 per share, resulting in net proceeds to the Company of approximately $52.9 million after deducting sales commissions totaling approximately $1.1 million. Following these sales, approximately $0.5 million of shares remained available for sale under the Open Market Sale Agreement, as amended.
For further information, please refer to the Company’s Quarterly Report on Form 10-Q for the quarter ended July 31, 2026, which includes the Company’s unaudited interim consolidated financial statements, related notes thereto and management’s discussion and analysis, and is available on the Company's website at www.fuelcellenergy.com and under its profile at www.sec.gov.
Conference Call Information
FuelCell Energy will host a conference call today, September 2, 2026 beginning at 10:00 a.m. ET to discuss third quarter 2026 results as well as key business highlights. Participants can access the live call via webcast on the Company’s website or by telephone as follows:
| ● | Alternatively, participants can dial 888-330-3181 and state FuelCell Energy or the conference ID number 1099808. |
The replay of the conference call will be available via webcast on the Company’s Investors’ page at www.fuelcellenergy.com approximately two hours after the conclusion of the call.
Cautionary Language
This news release contains forward-looking statements within the meaning of the safe harbor provisions of the Private Securities Litigation Reform Act of 1995 regarding future events or our future financial performance that involve certain contingencies and uncertainties. The forward-looking statements include, without limitation, statements with respect to the Company’s anticipated financial results and statements regarding the Company’s plans and expectations regarding the continuing development, commercialization and financing of its current and future fuel cell technologies, the Company’s business plans and strategies, the Company’s plan to reduce operating costs, the capabilities of the Company’s products, the Company's plans and ability to achieve positive Adjusted EBITDA, the Company’s potential sales pipeline, opportunities, and partners, and the markets in which the Company expects to operate. Projected and estimated numbers contained herein are not forecasts and may not reflect actual results. These forward-looking statements are not guarantees of future performance, and all forward-looking statements are subject to risks and uncertainties, known and unknown, that could cause actual results and future events to differ materially from those projected. Factors that could cause such a difference include, without limitation: general risks associated with product development and manufacturing; general economic conditions; changes in interest rates, which may impact project financing; supply chain disruptions; changes in the utility regulatory environment; changes in the utility industry and the markets for distributed generation, distributed hydrogen, and fuel cell power plants configured for carbon capture or carbon separation; potential volatility of commodity prices that may adversely affect our projects; availability of government subsidies and economic incentives for alternative energy technologies; our ability to remain in compliance with U.S. federal and state and foreign government laws and regulations; our ability to maintain compliance with the listing rules of The Nasdaq Stock Market; rapid technological change; competition; the risk that our bid awards (or other non-binding commitments) will not convert to contracts or that our contracts will not convert to revenue; market acceptance of our products; changes in accounting policies or practices adopted voluntarily or as required by accounting principles generally accepted in the United States; factors affecting our liquidity position and financial condition; government appropriations; the ability of the government and third parties to terminate their development contracts at any time; the ability of the government to exercise “march-in” rights with respect to certain of our patents; our ability to successfully market and sell our products internationally; delays in our timeline for bringing commercially viable products to market; our ability to develop additional commercially viable products in the future; our ability to implement our strategy; our ability to reduce our levelized cost of energy and deliver on our cost reduction strategy generally; our ability to protect our intellectual property; litigation and other proceedings; the risk that commercialization of our new products will not occur when anticipated or, if it does, that we will not have adequate capacity to satisfy demand; our need for and the availability of additional financing; our ability to generate positive cash flow from operations; our ability to service our long-term debt; our ability to increase the output and longevity of our platforms and to meet the performance requirements of our contracts; our ability to expand our customer base and maintain relationships with our largest customers and strategic business allies; our ability to reduce operating costs; and our ability to achieve positive Adjusted EBITDA in the
future, as well as other risks set forth in the Company’s filings with the Securities and Exchange Commission, including the Company’s Annual Report on Form 10-K for the fiscal year ended October 31, 2025. The forward-looking statements contained herein speak only as of the date of this press release. The Company expressly disclaims any obligation or undertaking to release publicly any updates or revisions to any such statement contained herein to reflect any change in the Company’s expectations or any change in events, conditions or circumstances on which any such statement is based.
About FuelCell Energy
FuelCell Energy, Inc. (Nasdaq: FCEL) is an American clean energy technology company delivering continuous, scalable baseload power for mission-critical applications globally. The Company’s fuel cell systems generate electricity directly at the point of use, enabling reliable, low-emissions power for data centers, industrial facilities, utilities, and distributed generation customers. FuelCell Energy delivers commercially proven, modular, utility-scale systems—backed by global fuel cell deployments. Learn more at www.fuelcellenergy.com.
Contact
Media Relations:
Kathleen Blomquist
[email protected]
203.546.5844
Investor Relations:
FUELCELL ENERGY, INC.
Consolidated Balance Sheets
(Unaudited)
(Amounts in thousands, except share and per share amounts)
| | | | ||
| | July 31, 2026 | | | October 31, 2025 |
ASSETS | | | | | |
Current assets: | | | | | |
Cash and cash equivalents, unrestricted | $ | 658,082 | | $ | 278,099 |
Restricted cash and cash equivalents – short-term | | 24,911 | | | 16,601 |
Accounts receivable, net | | 7,172 | | | 3,999 |
Unbilled receivables | | 39,875 | | | 49,008 |
Inventories | | 86,376 | | | 86,196 |
Other current assets | | 16,885 | | | 15,907 |
Total current assets | | 833,301 | | | 449,810 |
| | | | ||
Restricted cash and cash equivalents – long-term | | 54,327 | | | 47,092 |
Inventories – long-term | | - | | | 3,216 |
Project assets, net | | 166,588 | | | 216,847 |
Property, plant and equipment, net | | 94,561 | | | 96,436 |
Operating lease right-of-use assets, net | | 10,871 | | | 11,232 |
Intangible assets, net | | 2,918 | | | 3,891 |
Other assets | | 148,596 | | | 103,622 |
Total assets (1) | $ | 1,311,162 | | $ | 932,146 |
LIABILITIES AND STOCKHOLDERS’ EQUITY | | | | | |
Current liabilities: | | | | | |
Current portion of long-term debt | $ | 18,801 | | $ | 15,847 |
Current portion of operating lease liabilities | | 1,007 | | | 932 |
Accounts payable | 16,329 | | 17,009 | ||
Accrued liabilities | | 40,531 | | | 31,318 |
Deferred revenue | 19,416 | | 2,733 | ||
Total current liabilities | | 96,084 | | | 67,839 |
Long-term deferred revenue | | 14,009 | | | 5,985 |
Long-term operating lease liabilities | | 11,638 | | | 11,954 |
Long-term debt and other liabilities | | 146,676 | | | 115,227 |
Total liabilities (1) | | 268,407 | | | 201,005 |
| | | | | |
Redeemable Series B preferred stock (liquidation preference of $64,020 as of July 31, 2026 and October 31, 2025) | | 59,857 | | | 59,857 |
Total equity: | | | | | |
Stockholders’ equity: | | 8 | | | 5 |
Additional paid-in capital | | 2,951,531 | | | 2,493,318 |
Accumulated deficit | | (1,974,683) | | | (1,829,449) |
Accumulated other comprehensive loss | | (1,746) | | | (1,695) |
Treasury stock, Common, at cost (61,488 and 44,913 shares as of July 31, 2026 and October 31, 2025, respectively) | | (1,577) | | | (1,406) |
Deferred compensation | | 1,577 | | | 1,406 |
Total stockholders’ equity | | 975,110 | | | 662,179 |
Noncontrolling interests | | 7,788 | | | 9,105 |
Total equity | | 982,898 | | | 671,284 |
Total liabilities, redeemable Series B preferred stock and total equity | $ | 1,311,162 | | $ | 932,146 |
| (1) | As of July 31, 2026 and October 31, 2025, the combined assets of the variable interest entities (“VIEs”) were $290,034 and $325,661, respectively, that can only be used to settle obligations of the VIEs. These assets include cash of $2,708, accounts receivable of $643, unbilled accounts receivable of $2,979, operating lease right of use assets of $1,626, other current assets of $174,355, restricted cash and cash equivalents of $1,081, project assets of $92,587, derivative assets of $2,764 and other assets of $11,291 as of July 31, 2026, and cash of $2,490, accounts receivable of $722, unbilled accounts receivable of $12,865, operating lease right of use assets of $1,643, other current assets of $162,005, restricted cash and cash equivalents of $731, project assets of $141,414, derivative assets of $2,047 and other assets of $1,743 as of October 31, 2025. The combined liabilities of the VIEs as of July 31, 2026 include short-term operating lease liabilities of $208, accounts payable of $168,622, accrued liabilities of $2,413, long-term operating lease liability of $2,103 and other non-current liabilities of $369 and, as of October 31, 2025, include short-term operating lease liabilities of $204, accounts payable of $198,736, accrued liabilities of $1,222, derivative liabilities of $21, long-term operating lease liability of $2,123 and other non-current liabilities of $307. |
Consolidated Statements of Operations and Comprehensive Loss
(Unaudited)
(Amounts in thousands, except share and per share amounts)
| | | | | | | | |
| | Three Months Ended July 31, | ||||||
| | 2026 | | | 2025 | |||
Revenues: | | | | | | |||
Product | | $ | 18,000 | | | $ | 26,000 | |
Service | | | 2,422 | | | | 3,130 | |
Generation | | | 8,801 | | | | 12,355 | |
Advanced Technologies | | | 3,778 | | | | 5,258 | |
Total revenues | | | 33,001 | | | | 46,743 | |
| | | | | | | | |
Costs of revenues: | | | | | | | | |
Product | | | 37,102 | | | | 29,083 | |
Service | | | 3,776 | | | | 3,642 | |
Generation | | | 14,353 | | | | 15,330 | |
Advanced Technologies | | | 2,273 | | | | 3,822 | |
Total costs of revenues | | | 57,504 | | | | 51,877 | |
| | | | | | | | |
Gross loss | | | (24,503) | | | | (5,134) | |
| | | | | | | | |
Operating expenses: | | | | | | | | |
Administrative and selling expenses | | | 13,648 | | | | 14,066 | |
Research and development expenses | | | 8,509 | | | | 7,646 | |
Restructuring expense | | | - | | | | 4,051 | |
Impairment expense | | | - | | | | 64,467 | |
Total costs and expenses | | | 22,157 | | | | 90,230 | |
| | | | | | | | |
Loss from operations | | | (46,660) | | | | (95,364) | |
| | | | | | | | |
Interest expense | | | (2,903) | | | | (2,548) | |
Interest income | | | 3,573 | | | | 2,144 | |
Other income, net | | | 707 | | | | 3,912 | |
| | | | | | | | |
Loss before provision for income taxes | | | (45,283) | | | | (91,856) | |
Provision for income taxes | | | - | | | | (40) | |
| | | | | | | | |
Net loss | | | (45,283) | | | | (91,896) | |
Net loss attributable to noncontrolling interest | | | (816) | | | | (240) | |
Net loss attributable to FuelCell Energy, Inc. | | | (44,467) | | | | (91,656) | |
Series B preferred stock dividends | | | (800) | | | | (800) | |
| | | | | | | | |
Net loss attributable to common stockholders | | $ | (45,267) | | | $ | (92,456) | |
| | | | | | | | |
Loss per share basic and diluted: | | | | | | | | |
Net loss per share attributable to common stockholders | | $ | (0.64) | | | $ | (3.78) | |
Basic and diluted weighted average shares outstanding | | | 70,405,692 | | | | 24,441,294 | |
FUELCELL ENERGY, INC.
Consolidated Statements of Operations and Comprehensive Loss
(Unaudited)
(Amounts in thousands, except share and per share amounts)
| | Nine Months Ended July 31, | | |||||
| | 2026 | | | 2025 | | ||
Revenues: | | | | | | | | |
Product | | $ | 48,060 | | | $ | 39,099 | |
Service | | | 9,786 | | | | 13,122 | |
Generation | | | 28,470 | | | | 35,825 | |
Advanced Technologies | | | 12,805 | | | | 15,100 | |
Total revenues | | | 99,121 | | | | 103,146 | |
Costs of revenues: | | | | | | | | |
Product | | | 73,779 | | | | 48,380 | |
Service | | | 10,087 | | | | 14,377 | |
Generation | | | 50,500 | | | | 49,035 | |
Advanced Technologies | | | 8,044 | | | | 11,130 | |
Total costs of revenues | | | 142,410 | | | | 122,922 | |
Gross loss | | | (43,289) | | | | (19,776) | |
Operating expenses: | | | | | | | | |
Administrative and selling expenses | | | 41,826 | | | | 45,566 | |
Research and development expenses | | | 23,181 | | | | 28,623 | |
Restructuring expense | | | - | | | | 5,593 | |
Impairment expense | | | 42,567 | | | | 64,467 | |
Total costs and expenses | | | 107,574 | | | | 144,249 | |
Loss from operations | | | (150,863) | | | | (164,025) | |
Interest expense | | | (8,520) | | | | (7,703) | |
Interest income | | | 8,588 | | | | 6,357 | |
Other income, net | | | 1,782 | | | | 3,464 | |
Loss before (provision for) income taxes | | | (149,013) | | | | (161,907) | |
Benefit from (provision for) income taxes | | | 50 | | | | (124) | |
Net loss | | | (148,963) | | | | (162,031) | |
Net loss attributable to noncontrolling interest | | | (3,729) | | | | (4,000) | |
Net loss attributable to FuelCell Energy, Inc. | | | (145,234) | | | | (158,031) | |
Series B preferred stock dividends | | | (2,400) | | | | (2,400) | |
Net loss attributable to common stockholders | | $ | (147,634) | | | $ | (160,431) | |
Loss per share basic and diluted: | | | | | | | | |
Net loss per share attributable to common stockholders | | $ | (2.56) | | | $ | (7.22) | |
Basic and diluted weighted average shares outstanding | | | 57,649,267 | | | | 22,233,074 | |
Appendix
Non-GAAP Financial Measures
Financial results are presented in accordance with accounting principles generally accepted in the United States (“GAAP”). Management also uses non-GAAP measures to analyze and make operating decisions on the business. Earnings before interest, taxes, depreciation and amortization (“EBITDA”), Adjusted EBITDA, Adjusted net loss attributable to common stockholders and Adjusted net loss per share attributable to common stockholders are non-GAAP measures of operations and operating performance by the Company.
These supplemental non-GAAP measures are provided to assist readers in assessing operating performance. Management believes EBITDA, Adjusted EBITDA, Adjusted net loss attributable to common stockholders and Adjusted net loss per share attributable to common stockholders are useful in assessing performance and highlighting trends on an overall basis. Management also believes these measures are used by companies in the fuel cell sector and by securities analysts and investors when comparing the results of the Company with those of other companies. EBITDA differs from the most comparable GAAP measure, net loss attributable to the Company, primarily because it does not include finance expense, income taxes and depreciation of property, plant and equipment and project assets. Adjusted EBITDA adjusts EBITDA for stock-based compensation, impairment and restructuring expenses, unrealized non-cash gain on natural gas derivative contracts and other unusual items, which are considered either non-cash or non-recurring. Adjusted net loss attributable to common stockholders and Adjusted net loss per share attributable to common stockholders differ from the most comparable GAAP measures, Net loss attributable to common stockholders and Net loss per share attributable to common stockholders, primarily because they do not include stock-based compensation, impairment and restructuring expenses, unrealized non-cash gain on natural gas derivative contracts and other unusual items, which are considered either non-cash or non-recurring.
While management believes that these non-GAAP financial measures provide useful supplemental information to investors, there are limitations associated with the use of these measures. The measures are not prepared in accordance with GAAP and may not be directly comparable to similarly titled measures of other companies due to differences in the exact method of calculation. The Company’s non-GAAP financial measures are not meant to be considered in isolation or as a substitute for comparable GAAP financial measures and should be read only in conjunction with the Company’s consolidated financial statements prepared in accordance with GAAP.
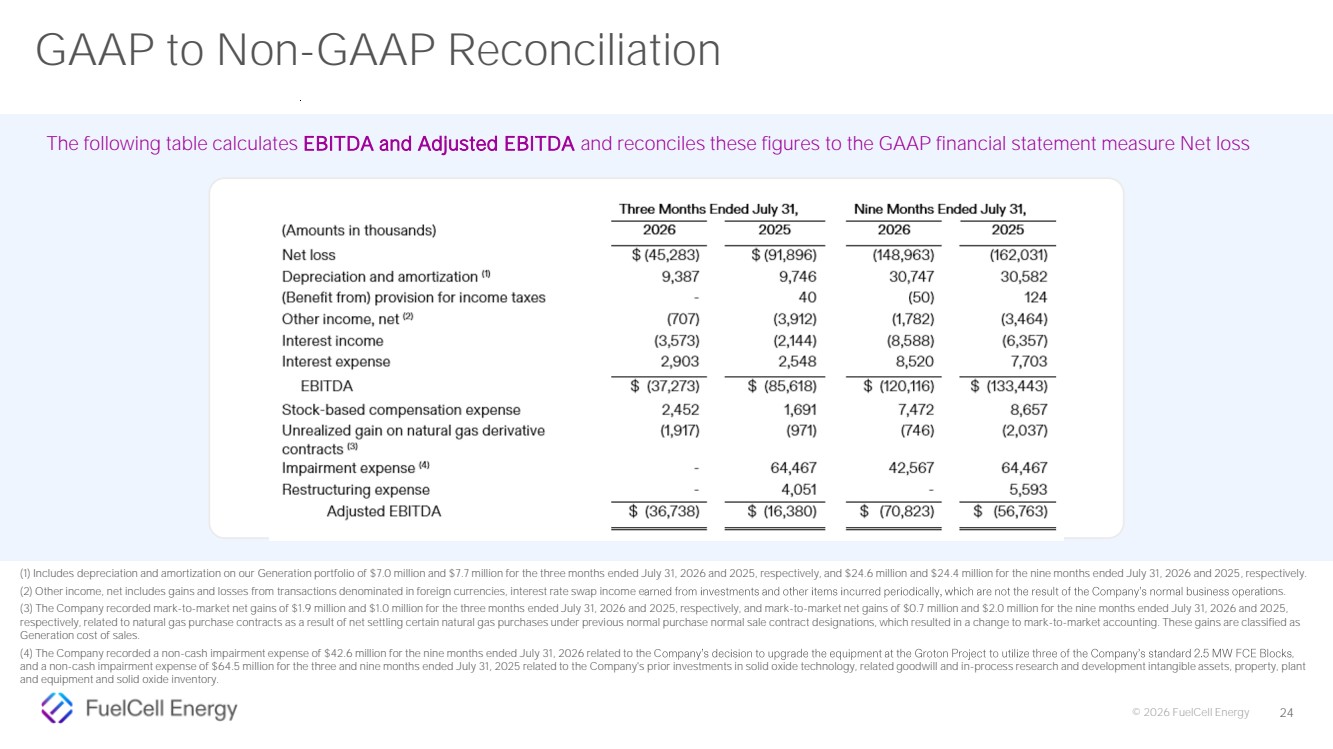
The following table calculates EBITDA and Adjusted EBITDA and reconciles these figures to the GAAP financial statement measure Net loss.
Three Months Ended July 31, | Nine Months Ended July 31, | |||||||
(Amounts in thousands) | 2026 | 2025 | 2026 | 2025 | ||||
Net loss | $ (45,283) | $ (91,896) | (148,963) | (162,031) | ||||
Depreciation and amortization (1) | 9,387 | 9,746 | 30,747 | 30,582 | ||||
(Benefit from) provision for income taxes | - | 40 | (50) | 124 | ||||
Other income, net (2) | (707) | (3,912) | (1,782) | (3,464) | ||||
Interest income | (3,573) | | (2,144) | | (8,588) | | (6,357) | |
Interest expense | 2,903 | 2,548 | 8,520 | 7,703 | ||||
EBITDA | $ (37,273) | $ (85,618) | $ (120,116) | $ (133,443) | ||||
Stock-based compensation expense | 2,452 | 1,691 | 7,472 | 8,657 | ||||
Unrealized gain on natural gas derivative contracts (3) | (1,917) | | (971) | | (746) | | (2,037) | |
Impairment expense (4) | - | | 64,467 | | 42,567 | | 64,467 | |
Restructuring expense | - | | 4,051 | | - | | 5,593 | |
Adjusted EBITDA | $ (36,738) | $ (16,380) | $ (70,823) | $ (56,763) | ||||
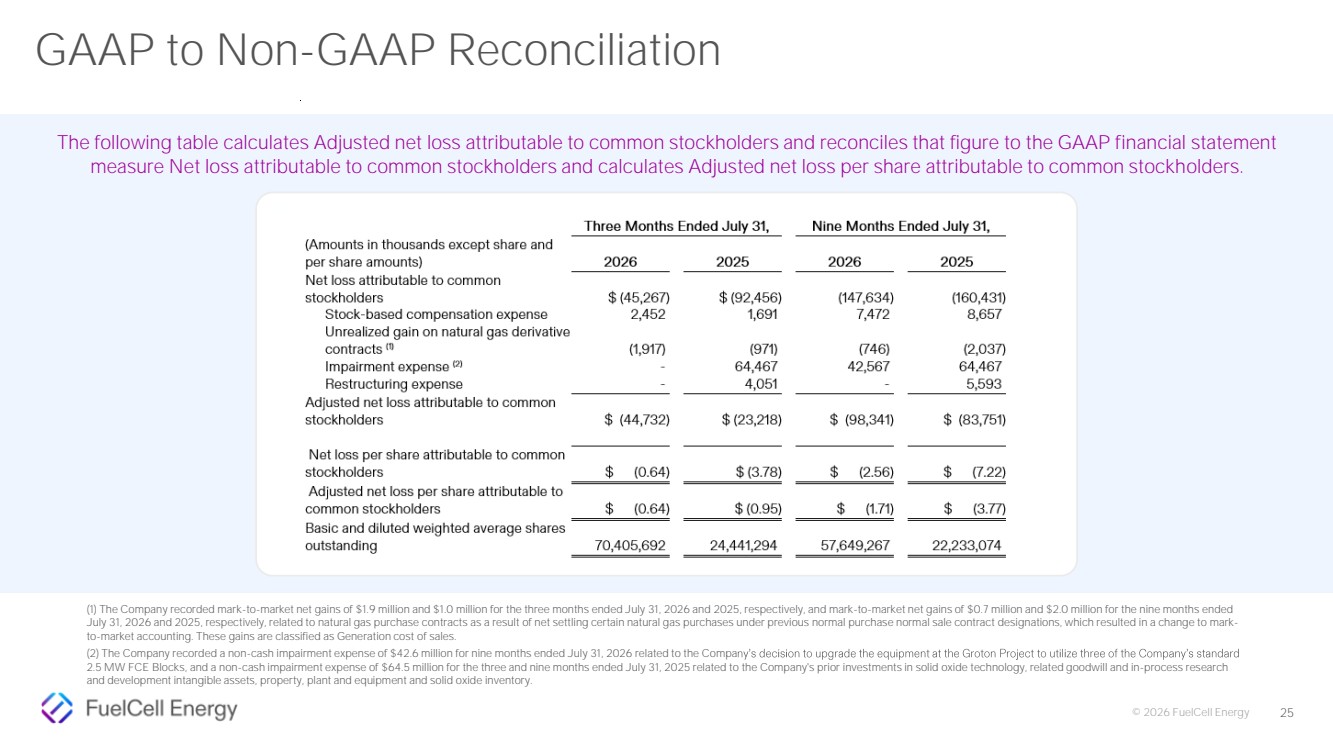
The following table calculates Adjusted net loss attributable to common stockholders and reconciles that figure to the GAAP financial statement measure Net loss attributable to common stockholders and calculates Adjusted net loss per share attributable to common stockholders.
Three Months Ended July 31, | Nine Months Ended July 31, | ||||||
(Amounts in thousands except share and per share amounts) | 2026 | 2025 | 2026 | 2025 | |||
Net loss attributable to common stockholders | $ (45,267) | $ (92,456) | (147,634) | (160,431) | |||
Stock-based compensation expense | 2,452 | 1,691 | 7,472 | 8,657 | |||
Unrealized gain on natural gas derivative contracts (3) | (1,917) | (971) | (746) | (2,037) | |||
Impairment expense (4) | - | 64,467 | 42,567 | 64,467 | |||
Restructuring expense | - | | 4,051 | | - | | 5,593 |
Adjusted net loss attributable to common stockholders | $ (44,732) | $ (23,218) | $ (98,341) | $ (83,751) | |||
| | | | | | | |
Net loss per share attributable to common stockholders | $ (0.64) | | $ (3.78) | | $ (2.56) | | $ (7.22) |
Adjusted net loss per share attributable to common stockholders | $ (0.64) | | $ (0.95) | | $ (1.71) | | $ (3.77) |
Basic and diluted weighted average shares outstanding | 70,405,692 | 24,441,294 | 57,649,267 | 22,233,074 | |||
| (1) | Includes depreciation and amortization on our Generation portfolio of $7.0 million and $7.7 million for the three months ended July 31, 2026 and 2025, respectively, and $24.6 million and $24.4 million for the nine months ended July 31, 2026 and 2025, respectively. |
| (2) | Other income, net includes gains and losses from transactions denominated in foreign currencies, interest rate swap income earned from investments and other items incurred periodically, which are not the result of the Company’s normal business operations. |
| (3) | The Company recorded mark-to-market net gains of $1.9 million and $1.0 million for the three months ended July 31, 2026 and 2025, respectively, and mark-to-market net gains of $0.7 million and $2.0 million for the nine months ended July 31, 2026 and 2025, respectively, related to natural gas purchase contracts as a result of net settling certain natural gas purchases under previous normal purchase normal sale contract designations, which resulted in a change to mark-to-market accounting. These gains are classified as Generation cost of sales. |
| (4) | The Company recorded a non-cash impairment expense of $42.6 million for the nine months ended July 31, 2026 related to the Company’s decision to upgrade the equipment at the Groton Project to utilize three of the Company’s standard 2.5 MW FCE Blocks, and a non-cash impairment expense of $64.5 million for the three and nine months ended July 31, 2025 related to the Company's prior investments in solid oxide technology, including related goodwill and in-process research and development intangible assets, property, plant and equipment and solid oxide inventory. |