fcnca-20211027
October 27, 20210000798941falseFirst Citizens BancShares Inc /DE/00007989412021-10-272021-10-270000798941us-gaap:CommonClassAMember2021-10-272021-10-270000798941us-gaap:SeriesAPreferredStockMember2021-10-272021-10-27

UNITED STATES
SECURITIES AND EXCHANGE COMMISSION
Washington, D.C. 20549
FORM 8-K
CURRENT REPORT
Pursuant to Section 13 or 15(d) of
The Securities Exchange Act of 1934
Date of Report (Date of earliest event reported): October 27, 2021
_________________________________________________________________
First Citizens BancShares, Inc.
(Exact name of registrant as specified in its charter)
Delaware001-1671556-1528994
(State or other jurisdiction
of incorporation)
(Commission File Number)(IRS Employer Identification No.)
4300 Six Forks RoadRaleighNorth Carolina27609
(Address of principal executive offices)(Zip Code)
Registrant’s telephone number, including area code: (919) 716-7000
________________________________________________________________________________
(Former name or former address, if changed since last report)
Check the appropriate box below if the Form 8-K filing is intended to simultaneously satisfy the filing obligation of the registrant under any of the following provisions:
Written communications pursuant to Rule 425 under the Securities Act (17 CFR 230.425)
Soliciting material pursuant to Rule 14a-12 under the Exchange Act (17 CFR 240.14a-12)
Pre-commencement communications pursuant to Rule 14d-2(b) under the Exchange Act (17 CFR 240.14d-2(b))
Pre-commencement communications pursuant to Rule 13e-4(c) under the Exchange Act (17 CFR 240.13e-4(c))
Securities Registered Pursuant to Section 12(b) of the Securities Exchange Act of 1934:
Title of each classTrading SymbolName of each exchange on which registered
Class A Common Stock, Par Value $1FCNCANasdaq Global Select Market
Depositary Shares, Each Representing a 1/40th Interest in a Share of 5.375% Non-Cumulative Perpetual Preferred Stock, Series AFCNCPNasdaq Global Select Market
Indicate by check mark whether the registrant is an emerging growth company as defined in Rule 405 of the Securities Act of 1933 (§230.405 of this chapter) or Rule 12b-2 of the Securities Exchange Act of 1934 (§240.12b-2 of this chapter).
    Emerging growth company  
If an emerging growth company, indicate by check mark if the registrant has elected not to use the extended transition period for complying with any new or revised financial accounting standards provided pursuant to Section 13(a) of the Exchange Act.


Item 2.02. Results of Operations and Financial Condition.
On October 27, 2021, Registrant announced its results of operations for the quarter ended September 30, 2021. A copy of Registrant’s press release containing this information is attached as Exhibit 99.1 to this Report and is incorporated herein by reference. The press release is available on the Registrant’s Internet site at http://www.firstcitizens.com.
Item 7.01. Regulation FD Disclosure.
On October 27, 2021 at 9:00 am Eastern Time, the Registrant intends to hold a conference call to discuss the Registrant’s financial results for the quarter ended September 30, 2021, including the press release. Additional investor presentation materials related to such call are furnished hereto as Exhibit 99.2 and are, along with the press release and financial statements, incorporated herein by reference.
In accordance with the General Instruction B.2 of Form 8-K, the information presented herein pursuant to Item 2.02, “Results of Operations,” and Item 7.01, “Regulation FD,” including Exhibit 99.1 and 99.2, shall not be deemed “filed” for purposes of Section 18 of the Securities Exchange Act of 1934, as amended, nor shall the information be deemed incorporated by reference in any filing under the Exchange Act or the Securities Act of 1933, as amended, except as expressly set forth by specific reference in such filing.
Item 9.01. Financial Statements and Exhibits
    (d) Exhibits. The following exhibits accompany this Report.
Exhibit No.Description
99.1
99.2
104Cover Page Interactive Data File (embedded within the Inline XBRL document)
Disclosures About Forward-Looking Statements
This Current Report on Form 8-K (this “Report”) contains “forward-looking statements” within the meaning of the Private Securities Litigation Reform Act of 1995 regarding the financial condition, results of operations, business plans and future performance of First Citizens BancShares, Inc. (“BancShares”). Words such as “anticipates,” “believes,” “estimates,” “expects,” “predicts,” “forecasts,” “intends,” “plans,” “projects,” “targets,” “designed,” “could,” “may,” “should,” “will,” “potential,” “continue” or other similar words and expressions are intended to identify these forward-looking statements. These forward-looking statements are based on BancShares’ current expectations and assumptions regarding BancShares’ business, the economy, and other future conditions.
Because forward-looking statements relate to future results and occurrences, they are subject to inherent risks, uncertainties, changes in circumstances and other risk factors that are difficult to predict. Many possible events or factors could affect BancShares’ future financial results and performance and could cause the actual results, performance or achievements of BancShares to differ materially from any anticipated results expressed or implied by such forward-looking statements. Such risks and uncertainties include, among others, the impacts of the global COVID-19 pandemic on BancShares’ business and customers, the financial success or changing conditions or strategies of BancShares’ customers or vendors, fluctuations in interest rates, actions of government regulators, the availability of capital and personnel, the delay in closing (or failure to close) one or more of BancShares’ previously announced acquisition transaction(s), the failure to realize the anticipated benefits of BancShares’ previously announced acquisition transaction(s), and general competitive, economic, political, and market conditions, as well as risks related to the proposed transaction with CIT Group Inc (“CIT”) including, in addition to those described above and among others, (1) the risk that the cost savings, any revenue synergies and other anticipated benefits of the proposed transaction may not be realized or may take longer than anticipated to be realized, including as a result of the impact of, or problems arising from, the integration of the two companies or as a result of the condition of the economy and competitive factors in areas where BancShares and CIT do business, (2) disruption to BancShares’ and CIT’s businesses as a result of the pendency of the proposed transaction and diversion of management’s attention from ongoing business operations and opportunities, (3) the occurrence of any event, change or other circumstances that could give rise to the right of one or both of the parties to terminate the definitive merger agreement, (4) the risk that the integration of BancShares’ and CIT’s operations will be materially delayed or will be more costly or difficult than expected or that BancShares and CIT are otherwise unable to successfully integrate their businesses, (5) the outcome of any legal proceedings that may be or have been instituted against BancShares and/or CIT, (6) the failure to obtain remaining governmental approvals (and the risk that such approvals may result in the imposition of conditions that could adversely affect the combined company or the expected benefits of the proposed transaction), (7) reputational risk and potential adverse reactions of BancShares’ and/or CIT’s customers, suppliers, employees


or other business partners, including those resulting from the completion of the proposed transaction, (8) the failure of any of the closing conditions in the definitive merger agreement to be satisfied on a timely basis or at all, (9) delays in closing the proposed transaction, (10) the possibility that the proposed transaction may be more expensive to complete than anticipated, including as a result of unexpected factors or events, (11) the dilution caused by BancShares’ issuance of additional shares of its capital stock in connection with the proposed transaction, (12) other factors that may affect future results of BancShares and CIT including changes in asset quality and credit risk, the inability to sustain revenue and earnings growth, changes in interest rates and capital markets, inflation, customer borrowing, repayment, investment and deposit practices, the impact, extent and timing of technological changes, capital management activities, and other actions of the Federal Reserve Board and legislative and regulatory actions and reforms, and (13) the impact of the global COVID-19 pandemic on CIT’s business, the parties’ ability to complete the proposed transaction and/or any of the other foregoing risks.
Except to the extent required by applicable laws or regulations, BancShares disclaims any obligation to update forward-looking statements or to publicly announce the results of any revisions to any of the forward-looking statements included herein to reflect future events or developments. Further information regarding BancShares and factors which could affect the forward-looking statements contained herein can be found in BancShares’ Annual Report on Form 10-K for the fiscal year ended December 31, 2020 and its other filings with the Securities and Exchange Commission.

SIGNATURE
Pursuant to the requirements of the Securities Exchange Act of 1934, as amended, the Registrant has duly caused this report to be signed on its behalf by the undersigned hereunto duly authorized.
First Citizens BancShares, Inc.
(Registrant)
Date:October 27, 2021By: /s/ Craig L. Nix
Craig L. Nix
Chief Financial Officer

Exhibit 99.1
fcbslogo2014a01a01a13a.jpg
NEWS RELEASE
For Immediate ReleaseContact:Barbara ThompsonDeanna Hart
October 27, 2021Corporate CommunicationsInvestor Relations
919-716-2716919-716-2137

FIRST CITIZENS BANCSHARES REPORTS EARNINGS FOR THIRD QUARTER 2021
RALEIGH, N.C. -- First Citizens BancShares, Inc. (“BancShares”) (Nasdaq: FCNCA) reported earnings for the third quarter of 2021. Key results for the quarter ended September 30, 2021, are presented below:
THIRD QUARTER RESULTS
Q3 2021Q3 2020Q3 2021Q3 2020Q3 2021Q3 2020Q3 2021Q3 2020Q3 2021Q3 2020
Net income (in millions)Net income per shareNet interest marginReturn on average assets Return on average equity
$124.1$142.7$12.17$14.032.61%3.06%0.88%1.18%11.29%14.93%
YEAR-TO-DATE (“YTD”) RESULTS
2021202020212020202120202021202020212020
Net income (in millions)Net income per shareNet interest marginReturn on average assets Return on average equity
$424.2$353.6$41.79$33.962.69%3.23%1.05%1.05%13.50%12.59%
THIRD QUARTER HIGHLIGHTS
Net income
Net income was $124.1 million for the third quarter of 2021, a decrease of $18.6 million, or by 13.0% compared to the same quarter in 2020. Net income per common share was $12.17 for the third quarter of 2021, compared to $14.03 per share for the same quarter in 2020.
Return on average assets and equity
Return on average assets for the third quarter of 2021 was 0.88%, down from 1.18% for the comparable quarter in 2020. Return on average equity for the third quarter of 2021 was 11.29%, down from 14.93% for the comparable quarter in 2020.
Net interest income and net interest margin
Net interest income was $346.9 million for the third quarter of 2021, a decrease of $6.8 million, or by 1.9% compared to the same quarter in 2020 but was relatively stable compared to the second quarter of 2021. The taxable-equivalent net interest margin (“NIM”) was 2.61% for the third quarter of 2021, down 45 basis points from 3.06% for the comparable quarter in 2020 and down 7 basis points from 2.68% in the second quarter of 2021.
Provision for credit losses
The provision for credit losses was a net benefit of $1.1 million during the third quarter of 2021, compared to a $4.0 million expense during the same quarter in 2020. The allowance for credit losses (“ACL”) was $183.2 million at September 30, 2021, compared to $224.3 million at December 31, 2020, representing 0.56% and 0.68% of loans, respectively.
Operating performance
Noninterest income was $122.9 million for the third quarter of 2021, an increase of $2.4 million, or by 2.0% compared to the same quarter in 2020. Noninterest expense was $312.8 million for the third quarter of 2021, an increase of $21.2 million, or by 7.3% compared to the same quarter in 2020.
Loans and credit quality
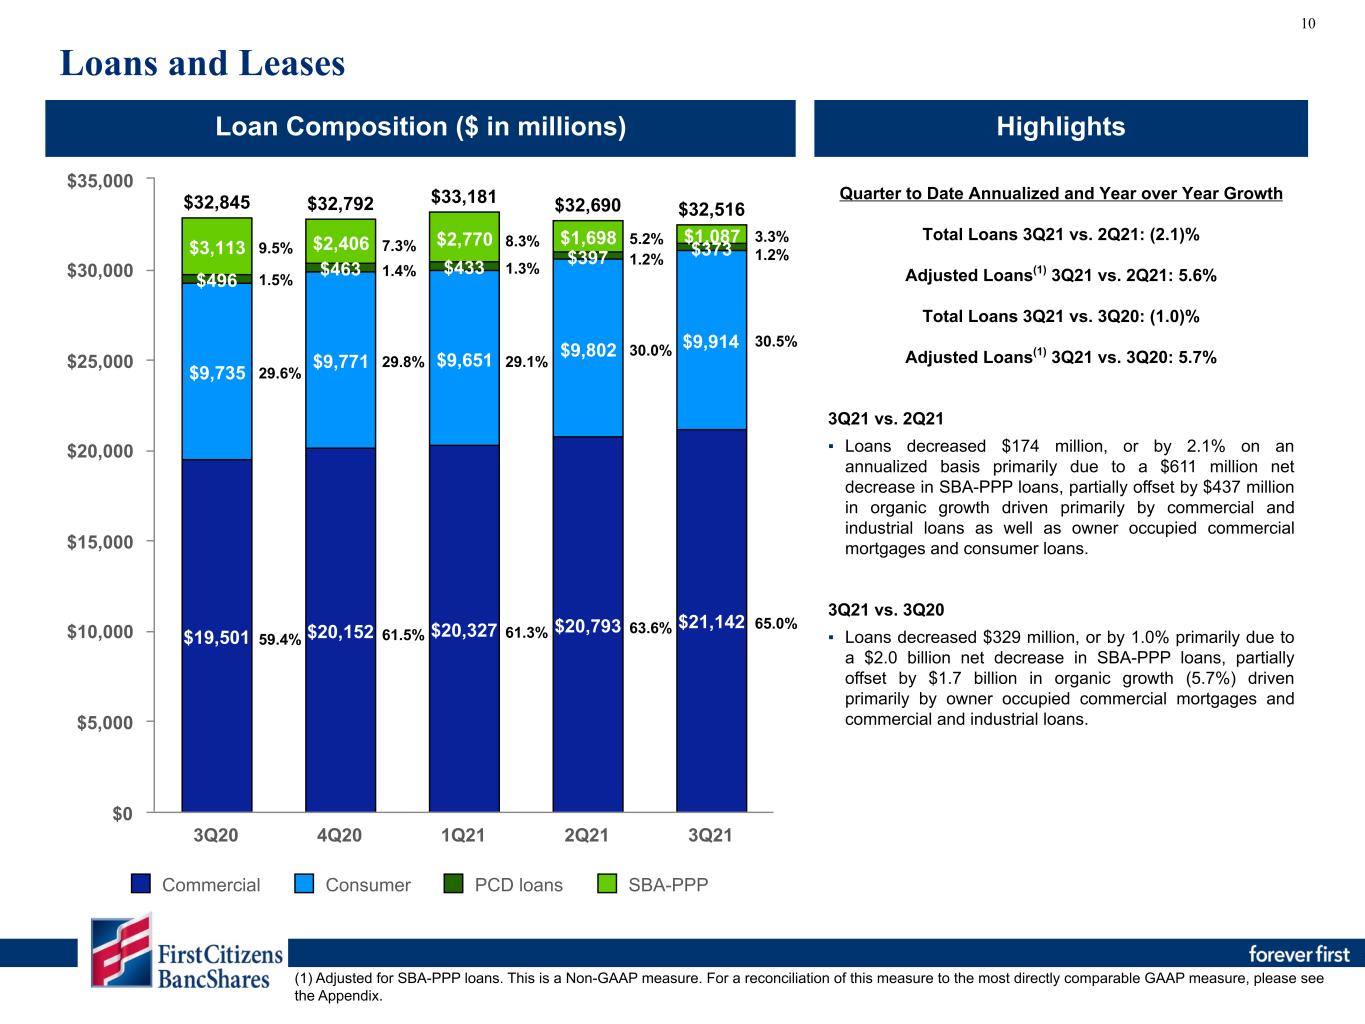
Total loans were $32.5 billion, a decrease of $275.8 million, or by 1.1% on an annualized basis since December 31, 2020. Excluding loans originated under the Small Business Administration Paycheck Protection Program (“SBA-PPP”), total loans increased $1.0 billion, or by 4.6% on an annualized basis since December 31, 2020. Total loans decreased $173.5 million, or by 2.1% on an annualized basis compared to June 30, 2021. Excluding SBA-PPP loans, total loans increased $437.4 million, or by 5.6% in the third quarter of 2021. The net charge-off ratio was 0.06% for the third quarter of 2021 compared to 0.03% for the same quarter in 2020.
Deposits
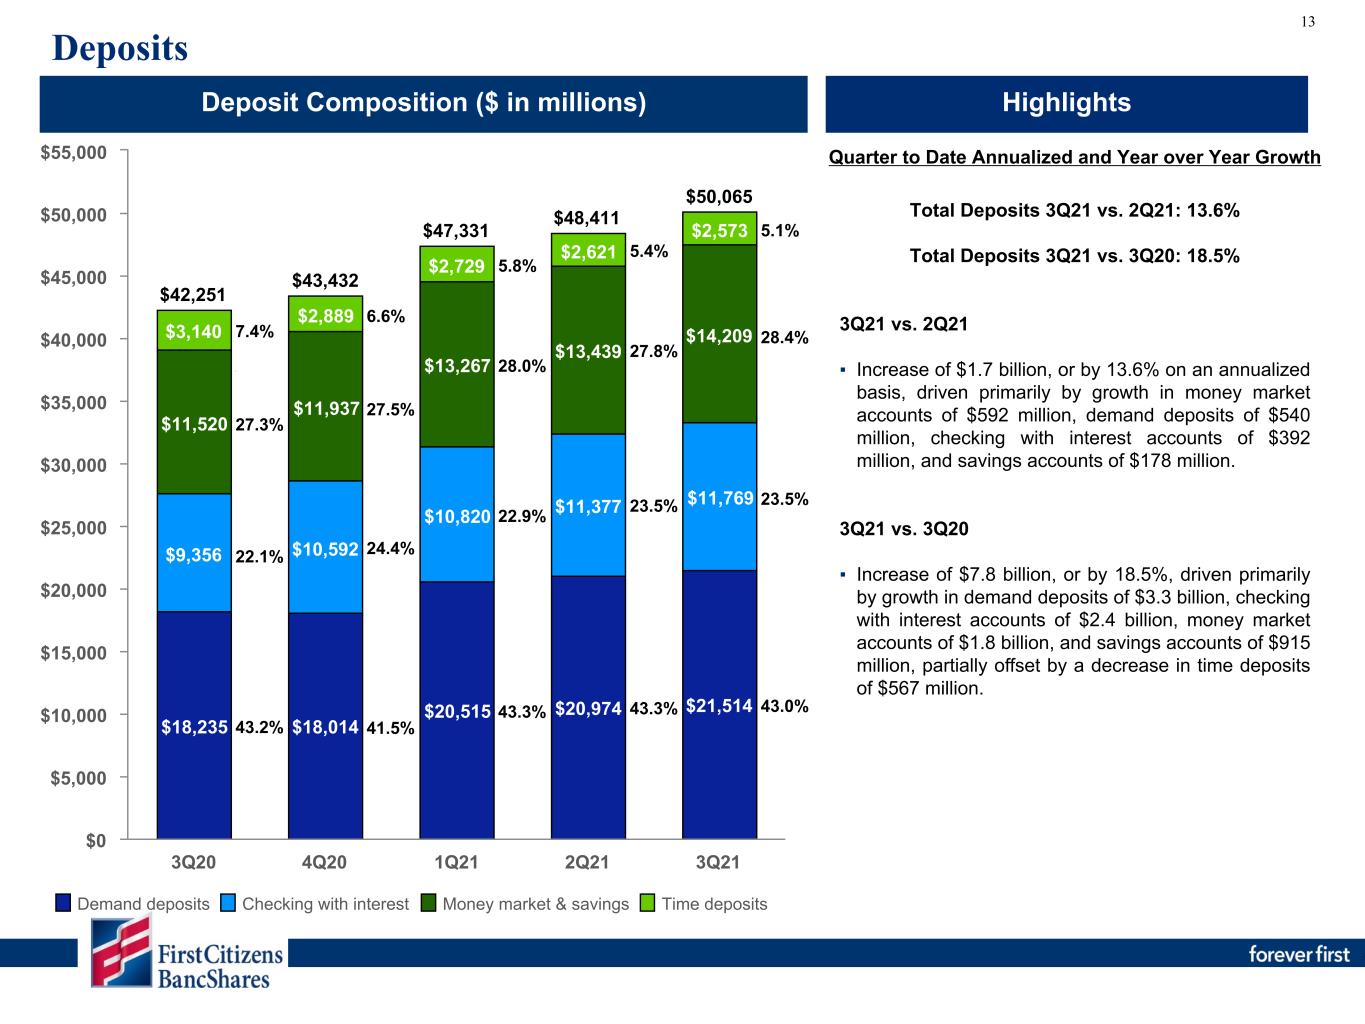
Total deposits grew to $50.1 billion, an increase of $6.6 billion, or by 20.4% on an annualized basis since December 31, 2020, driven by organic growth. Deposits increased $1.7 billion, or by 13.6% on an annualized basis compared to June 30, 2021.
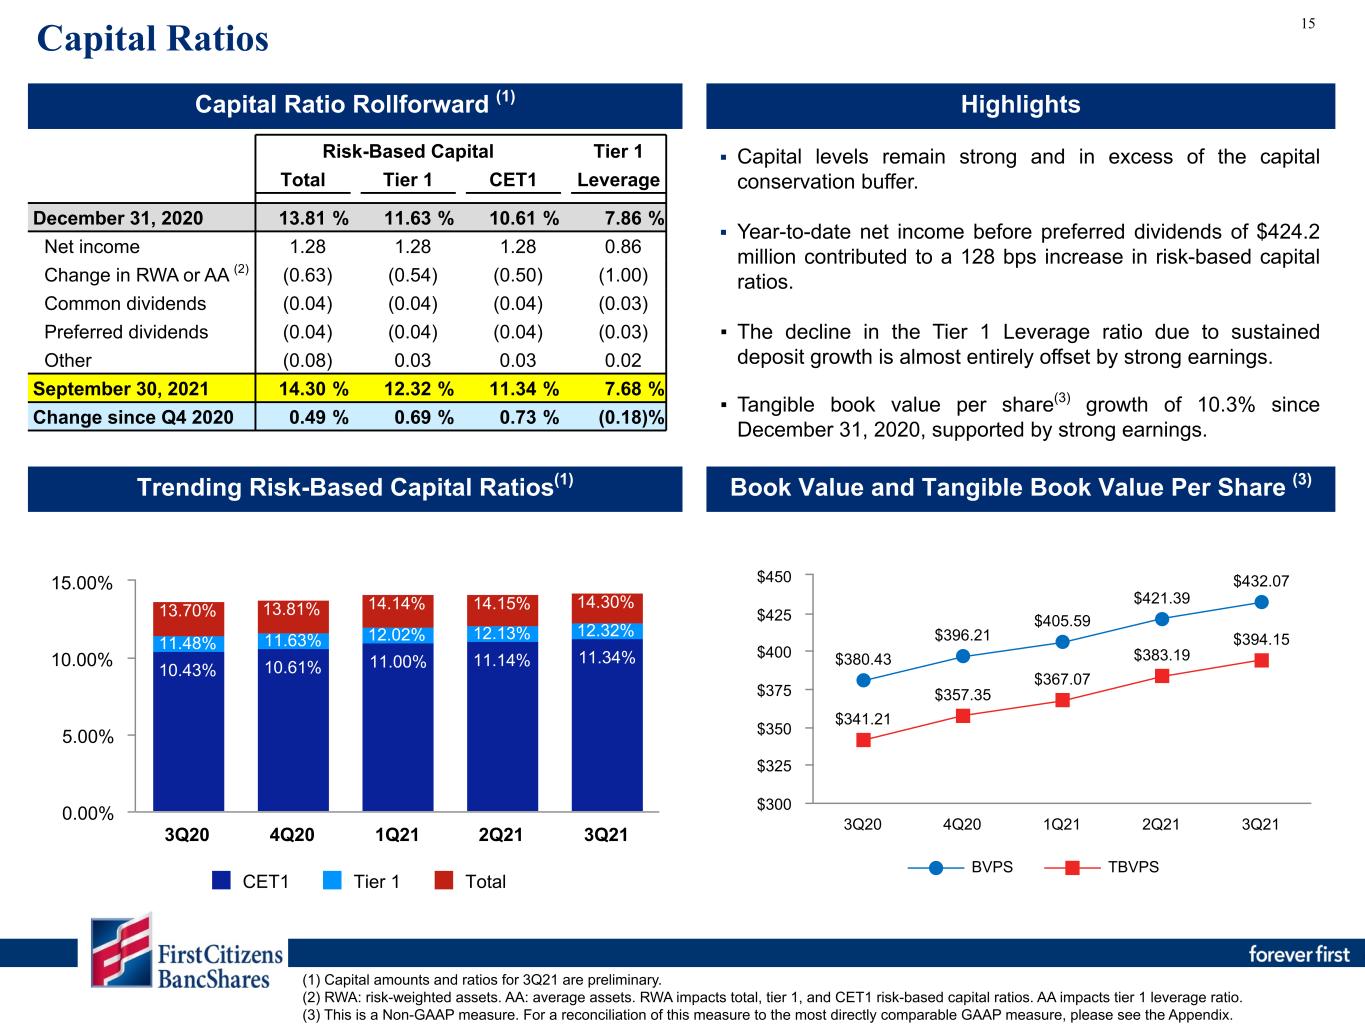
Capital BancShares remained well-capitalized with a total risk-based capital ratio of 14.3%, a Tier 1 risk-based capital ratio of 12.3%, a Common Equity Tier 1 ratio of 11.3% and a Tier 1 leverage ratio of 7.7%.


MERGER WITH CIT GROUP INC.
On October 15, 2020, BancShares entered into a definitive merger agreement with CIT Group Inc. (“CIT”) through which the companies plan to combine in an all-stock merger. The transaction has been approved by the shareholders of both companies and has received regulatory approval from the North Carolina Commissioner of Banks and the Federal Deposit Insurance Corporation (“FDIC”).
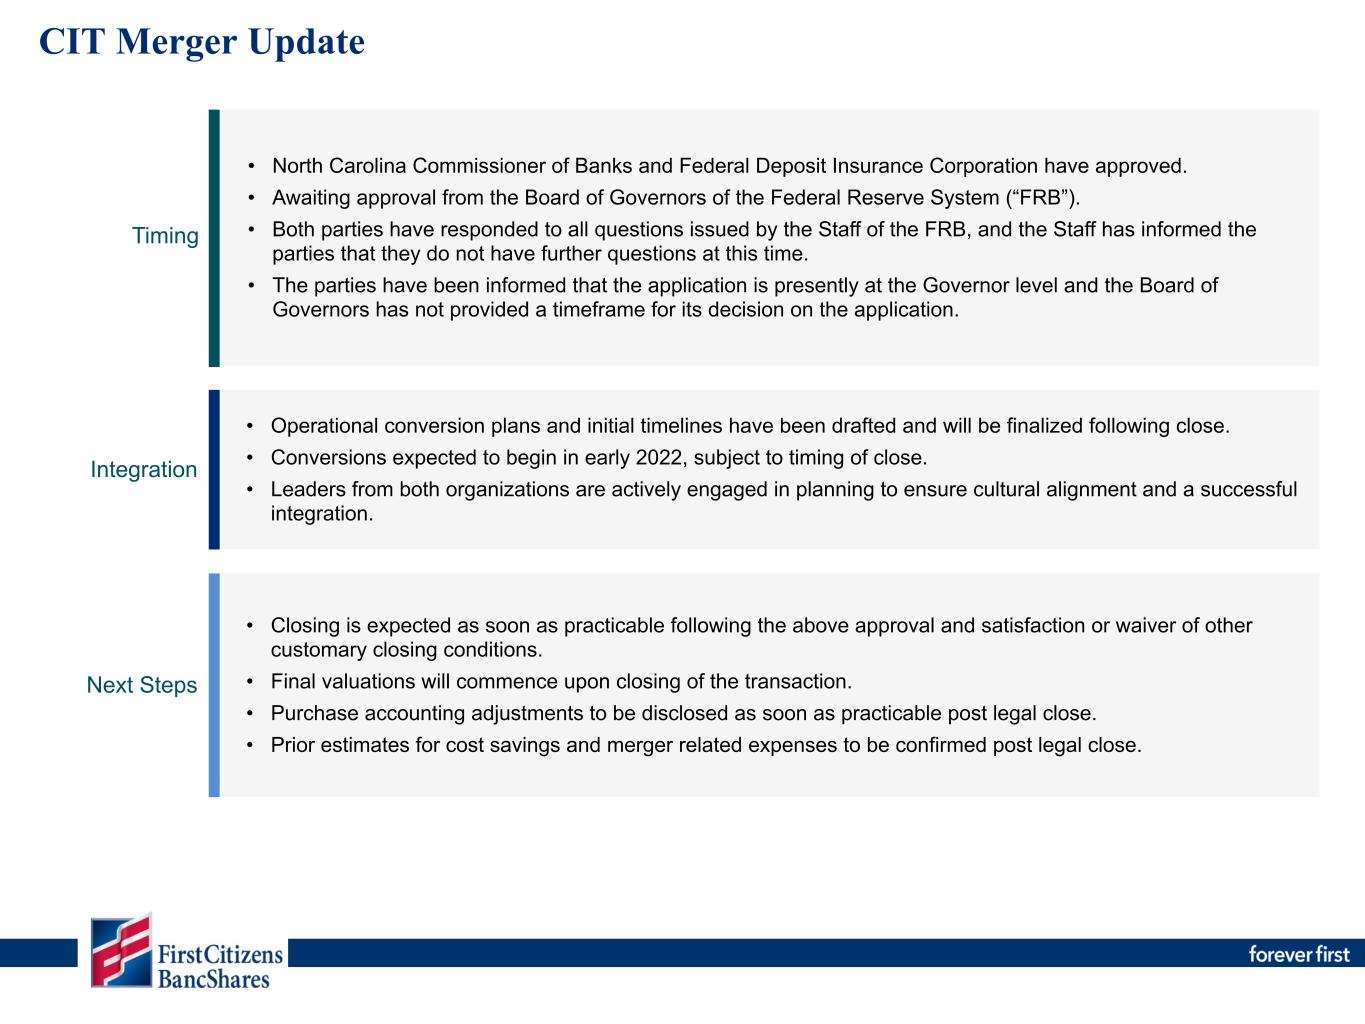
On September 30, 2021, the parties entered into an amendment to the merger agreement pursuant to which the parties mutually agreed to extend until March 1, 2022, the date after which either party may elect to terminate the merger agreement if the merger has not yet been completed. Completion of the proposed merger remains subject to approval from the Board of Governors of the Federal Reserve System and both parties are committed to continuing to seek such approval. The parties have responded to all questions issued by the Staff of the Federal Reserve Board. The parties have been informed that the application is presently at the Governor level, but the Board of Governors has not provided a time frame for its decision on the application. Closing is expected to occur as soon as practicable following receipt of such approval and the satisfaction or waiver of other customary closing conditions.
NET INTEREST INCOME & NET INTEREST MARGIN
Net interest income was $346.9 million for the third quarter of 2021, a decrease of $6.8 million, or by 1.9% compared to the same quarter in 2020. This was primarily due to a decline in the yield on interest-earning assets and a decrease in interest and fee income on SBA-PPP loans, partially offset by organic loan growth, higher investment balances, and lower rates on interest-bearing deposits. SBA-PPP loans contributed $20.0 million in interest and fee income for the third quarter of 2021 compared to $28.9 million for the same quarter in 2020. Net interest income increased $0.5 million compared to the linked quarter due primarily to higher investment and overnight yields and balances, organic loan growth and lower interest expense on deposits. This increase was largely offset by a decline in SBA-PPP interest and fee income and lower loan yields. SBA-PPP loans contributed $27.2 million in the second quarter of 2021.
The taxable-equivalent NIM was 2.61% during the third quarter of 2021, a decrease of 45 basis points from 3.06% for the comparable quarter in 2020. The margin decline was primarily due to changes in earning asset mix driven by excess liquidity and higher balances in overnight investments, and a decline in the yield on loans, partially offset by lower rates paid on interest-bearing deposits and increased income on SBA-PPP loans. The taxable-equivalent NIM declined 7 basis points from 2.68% for the linked quarter primarily due to changes in earning asset mix partially offset by higher investment yields and lower rates paid on interest-bearing deposits.
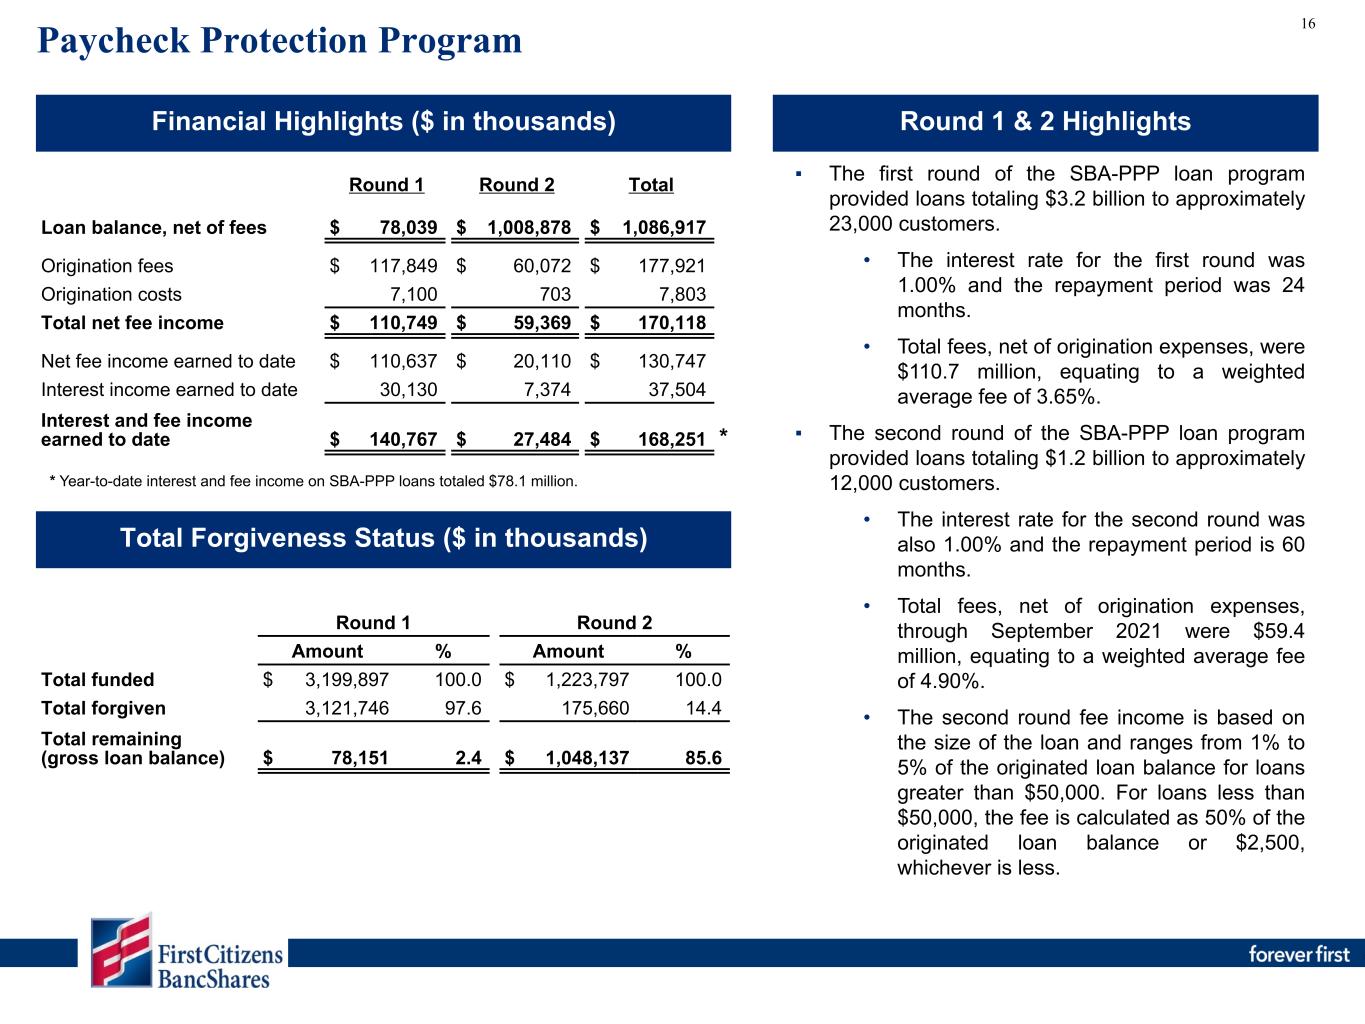
Net interest income was $1.03 billion for the nine months ended September 30, 2021, an increase of $3.5 million, or by 0.3% compared to the same period in 2020. This increase was primarily due to organic loan growth, an increase in interest and fee income on SBA-PPP loans and lower rates paid on interest-bearing deposits. These increases were largely offset by a decline in the yield on interest-earning assets. SBA-PPP loans contributed $78.1 million in interest and fee income for the nine months ended September 30, 2021, compared to $47.9 million for the same period in 2020.
The taxable-equivalent NIM was 2.69% for the nine months ended September 30, 2021, a decrease of 54 basis points from 3.23% for the comparable period in 2020. The margin decline was primarily due to changes in earning asset mix and a decline in the yield on interest-earning assets, partially offset by lower rates paid on interest-bearing deposits and increased income from SBA-PPP loans.


PROVISION FOR CREDIT LOSSES
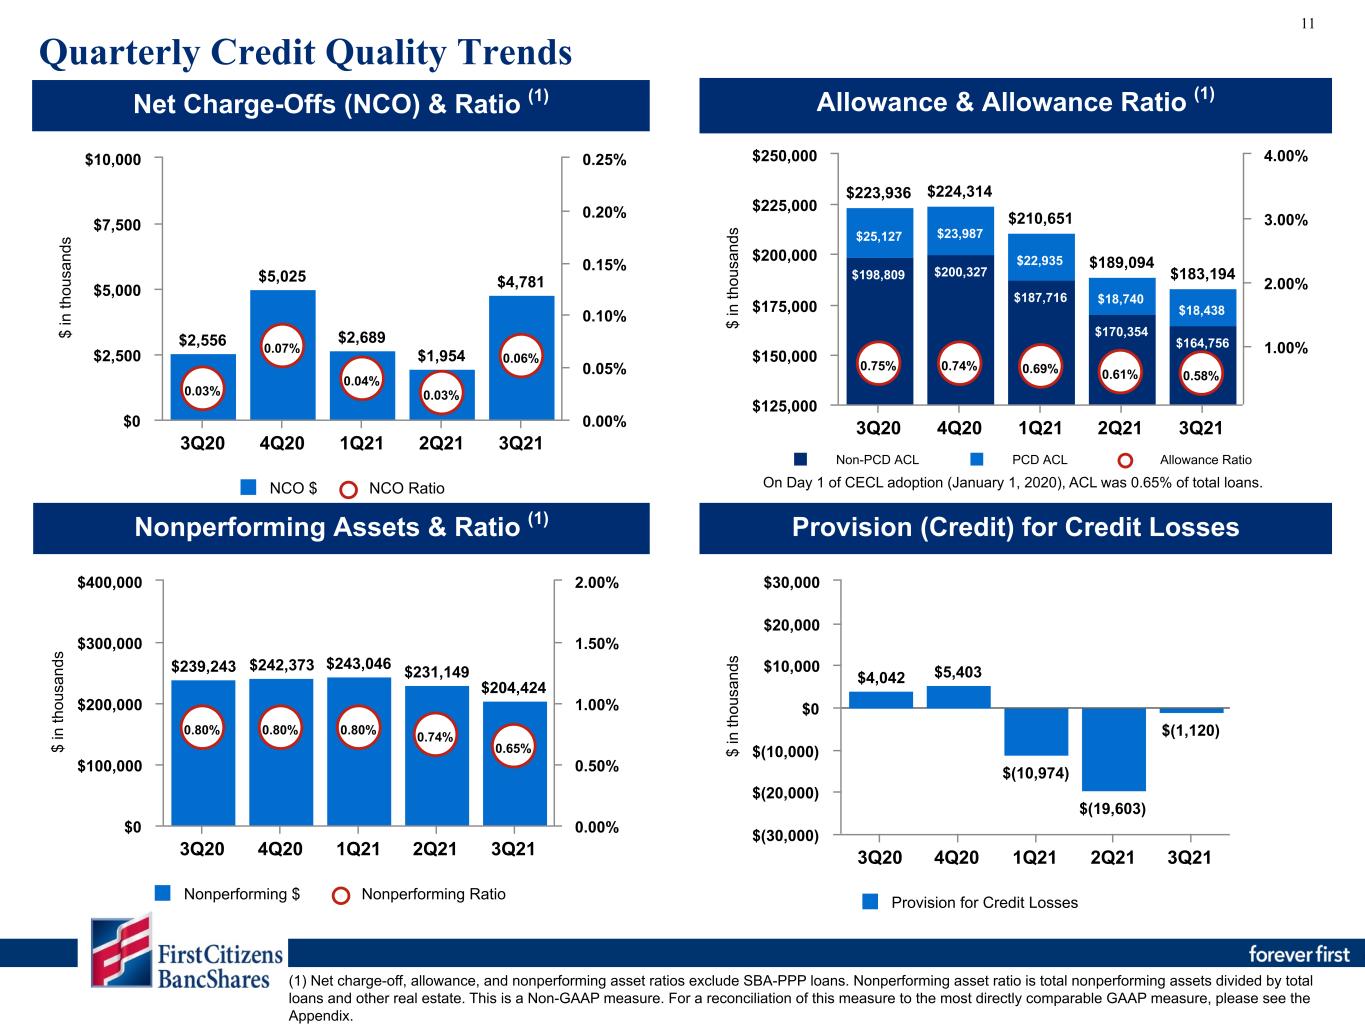
Provision for credit losses was a net benefit of $1.1 million for the third quarter of 2021 compared to $4.0 million in expense for the same quarter in 2020. The third quarter of 2021 was favorably impacted by a $5.9 million reserve release driven primarily by continued strong credit performance, low net charge-offs and improvement in macroeconomic factors. The comparable quarter in 2020 included a $1.5 million reserve build due to continued uncertainties surrounding COVID-19 and net loan growth. Total net charge-offs for the third quarter of 2021 were $4.8 million, an increase from $2.6 million for the comparable quarter in 2020 due to a higher volume of charge-offs and lower recoveries. The net charge-off ratio was 0.06% for the third quarter of 2021 compared to 0.03% for the same quarter in 2020. The impact of SBA-PPP loans on average loan balances did not affect the net charge-off ratio in either three-month period.
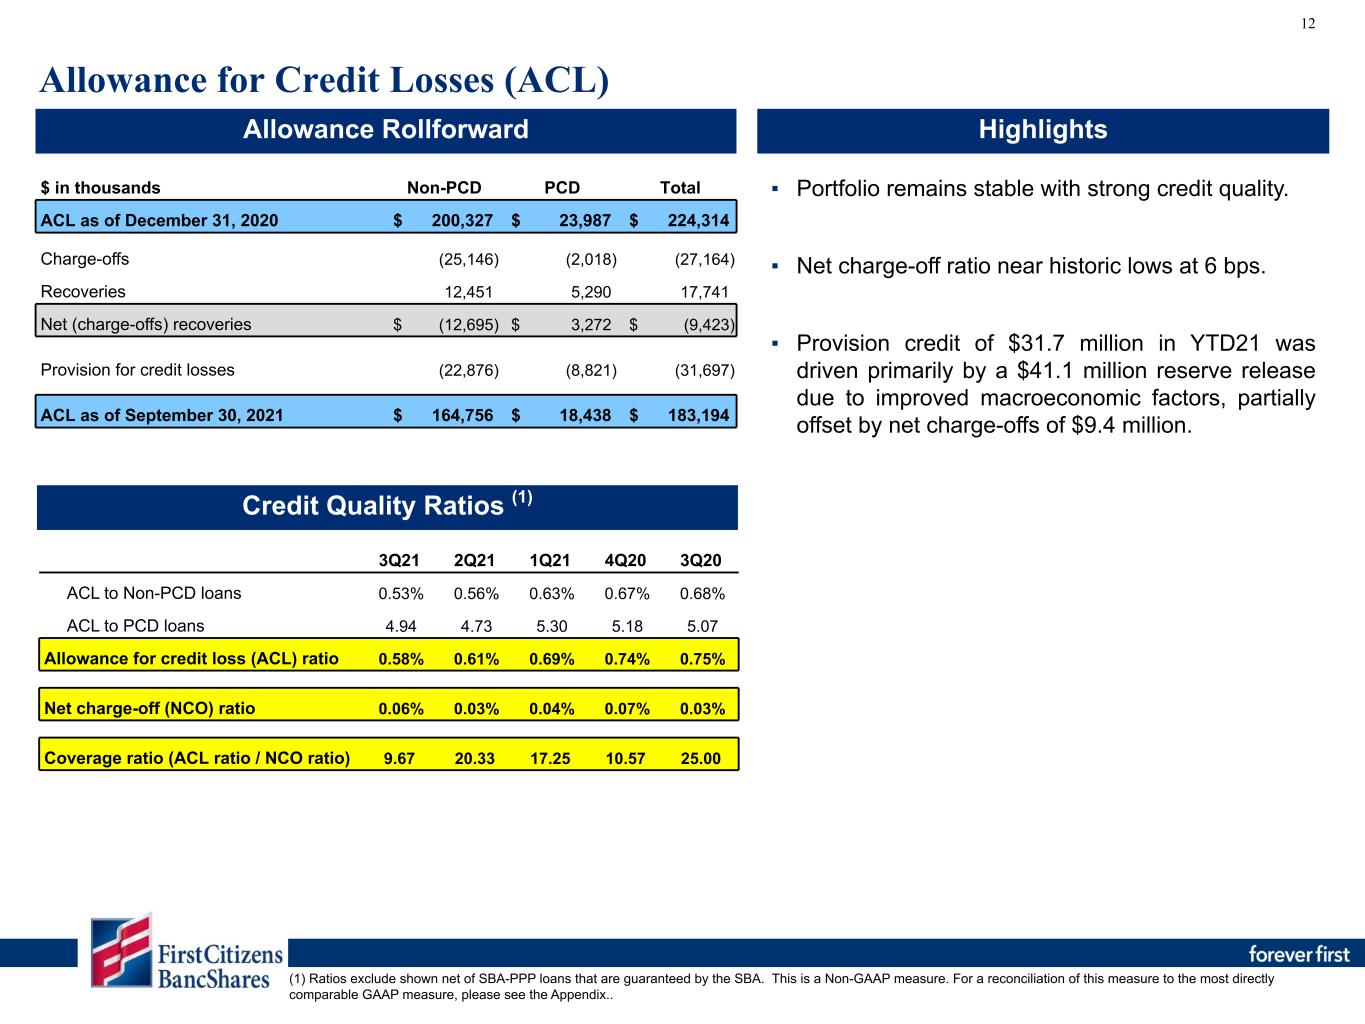
Provision for credit losses was a benefit of $31.7 million for the nine months ended September 30, 2021, compared to $52.9 million in expense for the same period in 2020. Provision for credit losses for the nine months ended September 30, 2021 was favorably impacted by a $41.1 million reserve release driven primarily by continued strong credit performance, low net charge-offs and improvement in macroeconomic factors. The comparable period in 2020 included a $36.1 million reserve build related to uncertainties surrounding COVID-19. Net charge-offs for the nine months ended September 30, 2021 were $9.4 million, a decrease from $17.4 million for the comparable period in 2020 due to a lower volume of charge-offs and stable recoveries. The net charge-off ratio was 0.04% for the nine months ended September 30, 2021 compared to 0.07% for the same period in 2020. The impact of SBA-PPP loans on average loan balances did not have an impact on the net charge-off ratio for the nine months ended September 30, 2021. Excluding the impact of SBA-PPP loans on average loan balances, the net charge-off ratio was 0.08% for the nine months ended September 30, 2020.
NONINTEREST INCOME
Noninterest income was $122.9 million for the third quarter of 2021, an increase of $2.4 million, or by 2.0% compared to $120.6 million for the same quarter in 2020. Contributing to the increase was a $6.1 million favorable change in fair market value adjustments on marketable equity securities. Other primary drivers of the increase included a $5.6 million increase in wealth management services due to growth in assets under management resulting in higher advisory and transaction fees, a $4.0 million increase in service charges on deposit accounts, a $3.1 million increase in cardholder services income, net, and a $1.6 million increase in merchant services income, net. These increases were partially offset by a $13.3 million reduction in realized gains on available for sale securities as well as a $7.0 million decline in mortgage income due to reductions in gain on sale margins and production volume driven by higher mortgage rates and increased competition. Excluding fair market value adjustments on marketable equity securities and realized gains on available for sale securities, noninterest income was $111.5 million for the third quarter of 2021, an increase of $9.7 million, or by 9.5% compared to $101.8 million for the same quarter in 2020.
Noninterest income was $393.7 million for the nine months ended September 30, 2021, an increase of $43.8 million, or by 12.5% compared to $350.0 million for the same period in 2020. The primary drivers of the increase were a $20.7 million increase in wealth management services due to due to growth in assets under management resulting in higher advisory and transaction fees, a $20.6 million favorable change in fair market value adjustments on marketable equity securities, a $9.8 million increase in cardholder services income, net, and a $7.8 million increase in merchant services income, net. These increases were partially offset by a $21.9 million reduction in realized gains on available for sale securities. Excluding fair market value adjustments on marketable equity securities and realized gains on available for sale securities, noninterest income was $329.6 million for the nine months ended September 30, 2021, an increase of $45.0 million, or by 15.8% compared to $284.6 million for the same period in 2020.


NONINTEREST EXPENSE
Noninterest expense was $312.8 million for the third quarter of 2021, an increase of $21.2 million, or by 7.3% compared to the same quarter in 2020. The primary driver of the increase was a $13.7 million increase in salaries and wages driven by annual merit increases, increases in revenue-driven incentives, and an increase in temporary personnel costs. Additionally contributing to the increase was a $3.7 million increase in third-party service fees driven by our continued investments in digital and technology to support revenue-generating businesses and improve internal processes, as well as a $3.5 million increase in merger expense associated with the pending merger with CIT.
Noninterest expense was $910.3 million for the nine months ended September 30, 2021, an increase of $27.0 million, or by 3.1% compared to the same period in 2020. The most significant driver of the increase was a $23.2 million increase in salaries and wages due primarily to annual merit increases, increases in revenue-driven incentives, and an increase in temporary personnel costs. Also contributing to the increase was an $11.2 million increase in processing fees paid to third parties driven by our continued investments in digital and technology to support revenue-generating businesses and improve internal processes, and a $7.5 million increase in merger-related expense associated with the pending merger with CIT. These increases were partially offset by a $16.5 million decrease in other expense due to a decrease in other pension expense and a release in the reserve for unfunded commitments, as well as a $7.0 million decrease in collection and foreclosure-related expenses.
INCOME TAXES
Income tax expense totaled $34.1 million and $35.8 million for the third quarter of 2021 and 2020, respectively, representing effective tax rates of 21.5% and 20.1% for the respective periods.
Income tax expense totaled $123.9 million and $89.5 million for the first nine months of 2021 and 2020, respectively, representing effective tax rates of 22.6% and 20.2% for the respective periods.
The effective tax rates during 2020 were favorably impacted by BancShares’ decision to utilize an allowable alternative for computing its federal income tax liability. The allowable alternative provided BancShares the ability to use the federal income tax rate for certain current year deductible amounts related to prior year FDIC-assisted acquisitions that was applicable when these amounts were originally subjected to tax. Without this alternative, the effective tax rate is materially unchanged for the third quarter and first nine months of 2021 and the effective tax rate for the third quarter and first nine months of 2020 would have been approximately 22.0% and 22.6%, respectively.
LOANS AND DEPOSITS
At September 30, 2021, loans totaled $32.5 billion, a decrease of $275.8 million, or by 1.1% on an annualized basis since December 31, 2020. SBA-PPP loans totaled $1.0 billion as of September 30, 2021 compared to $2.4 billion as of December 31, 2021. Excluding SBA-PPP loans, total loans increased $1.0 billion, or by 4.6% on an annualized basis since December 31, 2020. Total loans decreased $173.5 million, or by 2.1% on an annualized basis compared to June 30, 2021. Excluding SBA-PPP loans, total loans increased $437.4 million, or by 5.6% in the third quarter of 2021.
At September 30, 2021, deposits totaled $50.1 billion, an increase of $6.6 billion, or by 20.4% on an annualized basis since December 31, 2020, driven by organic growth. Deposits increased $1.7 billion, or by 13.6% on an annualized basis compared to June 30, 2021.
ALLOWANCE FOR CREDIT LOSSES (ACL)
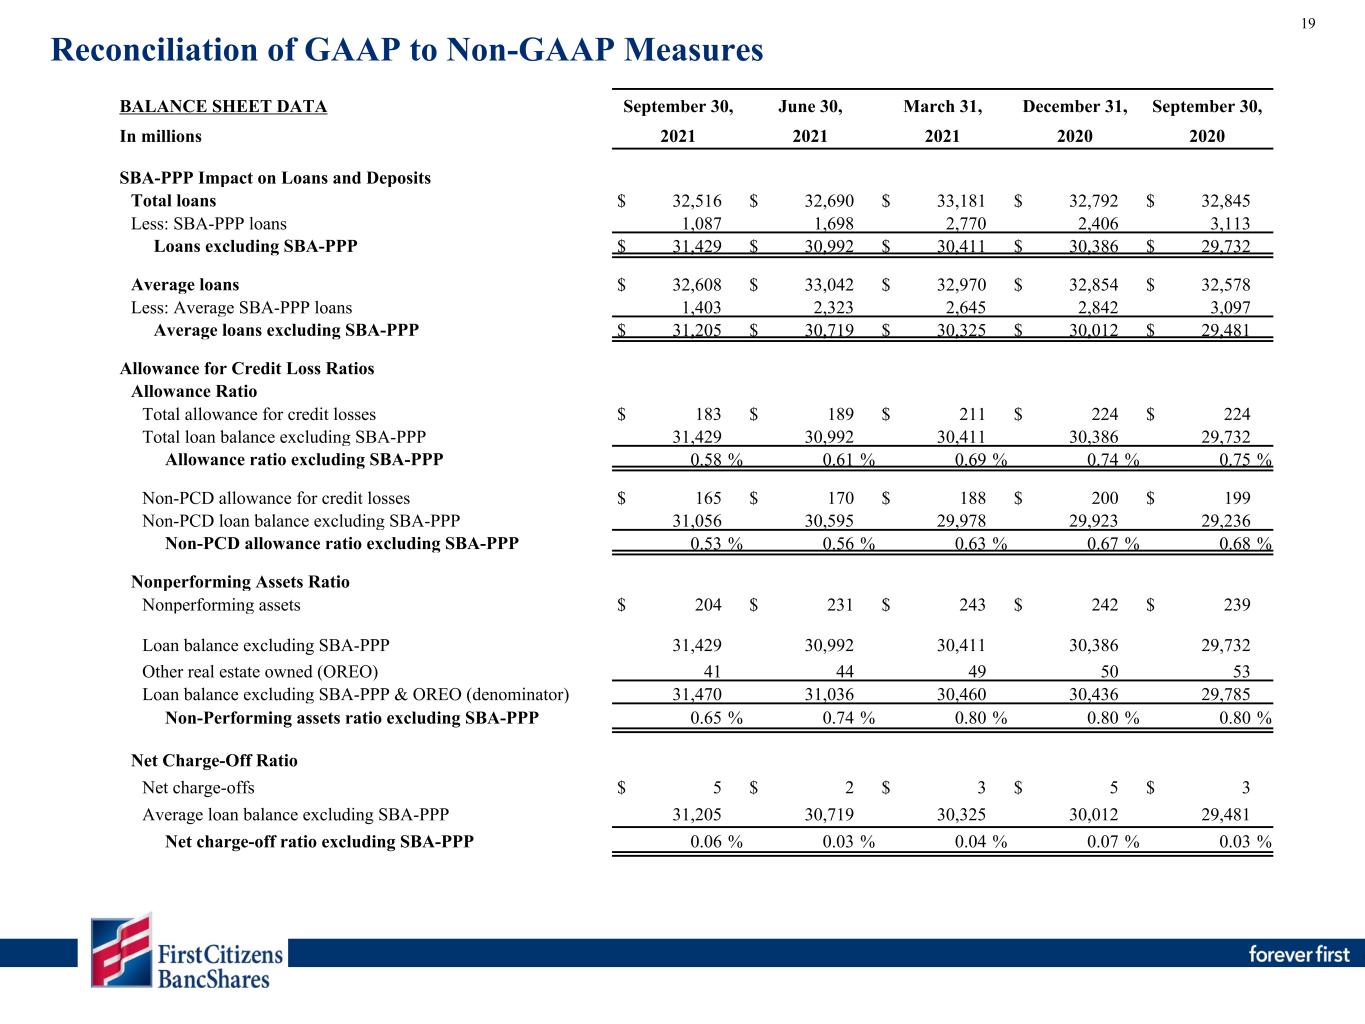
The ACL was $183.2 million at September 30, 2021, compared to $224.3 million at December 31, 2020, a decrease of $41.1 million. The ACL as a percentage of total loans and leases was 0.56% at September 30, 2021, compared to 0.68% at December 31, 2020. The reduction was primarily due to a $41.1 million reserve release for the nine months ended September 30, 2021, driven primarily by continued strong credit performance, low net charge-offs, and improvement in macroeconomic factors. Excluding SBA-PPP loans, which have no associated ACL, the ACL as a percentage of total loans was 0.58% at September 30, 2021, compared to 0.74% at December 31, 2020.


NONPERFORMING ASSETS
Nonperforming assets, including nonaccrual loans and other real estate owned, were $204.4 million, or 0.63% of total loans and other real estate owned at September 30, 2021, compared to $242.4 million or 0.74% at December 31, 2020. Excluding the impact of SBA-PPP loans on loan balances, the ratio of total nonperforming assets to total loans, leases and other real estate owned was 0.65% as of September 30, 2021, compared to 0.80% at December 31, 2020.
CAPITAL TRANSACTIONS
During the third quarter of 2021, BancShares did not repurchase any shares of Class A common stock compared to repurchases of 117,700 shares of Class A common stock for $47.1 million at an average cost per share of $399.83 for the comparable quarter in 2020. For the nine months ended September 30, 2021, BancShares did not repurchase any shares of Class A common stock compared to repurchases of 813,090 shares of Class A common stock for $333.8 million at an average cost per share of $410.48 for the comparable period in 2020. All Class A common stock repurchases completed in 2020 were consummated under previously approved authorizations. Following the expiration of our latest share repurchase authorization on July 31, 2020, share repurchase activity was suspended.
EARNINGS CALL DETAILS
First Citizens BancShares, Inc. will host a conference call to discuss the company's financial results on October 27, 2021, at 9 a.m. Eastern time.
To access this call, dial:
Domestic: 833-654-8257
International: 602-585-9869
Conference ID: 3942569

The third quarter 2021 earnings presentation and news release are available on the company’s website at www.firstcitizens.com/investor-relations.
After the conference call, you may access a replay of the call through November 10, 2021, by dialing 855-859-2056 (domestic) or 404-537-3406 (international) with conference ID 3942569.
For investor inquiries, contact Deanna Hart, Investor Relations, at 919-716-2137.
ABOUT FIRST CITIZENS BANCSHARES
BancShares is the financial holding company for Raleigh, North Carolina-headquartered First Citizens Bank & Trust Company (“First Citizens Bank”). First Citizens Bank provides a broad range of financial services to individuals, businesses, professionals and the medical community through branch offices in 19 states, including digital banking, mobile banking, ATMs and telephone banking. As of September 30, 2021, BancShares had total assets of $56.9 billion.
For more information, visit First Citizens’ website at firstcitizens.com. First Citizens Bank. Forever First®.
FORWARD-LOOKING STATEMENTS
This communication contains “forward-looking statements” within the meaning of the Private Securities Litigation Reform Act of 1995 regarding the financial condition, results of operations, business plans and future performance of BancShares. Words such as “anticipates,” “believes,” “estimates,” “expects,” “predicts,” “forecasts,” “intends,” “plans,” “projects,” “targets,” “designed,” “could,” “may,” “should,” “will,” “potential,” “continue” or other similar words and expressions are intended to identify these forward-looking statements. These forward-looking statements are based on BancShares’ current expectations and assumptions regarding BancShares’ business, the economy, and other future conditions.


Because forward-looking statements relate to future results and occurrences, they are subject to inherent risks, uncertainties, changes in circumstances and other risk factors that are difficult to predict. Many possible events or factors could affect BancShares’ future financial results and performance and could cause the actual results, performance or achievements of BancShares to differ materially from any anticipated results expressed or implied by such forward-looking statements. Such risks and uncertainties include, among others, the impacts of the global COVID-19 pandemic on BancShares’ business and customers, the financial success or changing conditions or strategies of BancShares’ customers or vendors, fluctuations in interest rates, actions of government regulators, the availability of capital and personnel, the delay in closing (or failure to close) one or more of BancShares’ previously announced acquisition transaction(s), the failure to realize the anticipated benefits of BancShares’ previously announced acquisition transaction(s), and general competitive, economic, political, and market conditions, as well as risks related to the proposed transaction with CIT Group Inc (“CIT”) including, in addition to those described above and among others, (1) the risk that the cost savings, any revenue synergies and other anticipated benefits of the proposed transaction may not be realized or may take longer than anticipated to be realized, including as a result of the impact of, or problems arising from, the integration of the two companies or as a result of the condition of the economy and competitive factors in areas where BancShares and CIT do business, (2) disruption to BancShares’ and CIT’s businesses as a result of the pendency of the proposed transaction and diversion of management’s attention from ongoing business operations and opportunities, (3) the occurrence of any event, change or other circumstances that could give rise to the right of one or both of the parties to terminate the definitive merger agreement, (4) the risk that the integration of BancShares’ and CIT’s operations will be materially delayed or will be more costly or difficult than expected or that BancShares and CIT are otherwise unable to successfully integrate their businesses, (5) the outcome of any legal proceedings that may be or have been instituted against BancShares and/or CIT, (6) the failure to obtain remaining governmental approvals (and the risk that such approvals may result in the imposition of conditions that could adversely affect the combined company or the expected benefits of the proposed transaction), (7) reputational risk and potential adverse reactions of BancShares’ and/or CIT’s customers, suppliers, employees or other business partners, including those resulting from the completion of the proposed transaction, (8) the failure of any of the closing conditions in the definitive merger agreement to be satisfied on a timely basis or at all, (9) delays in closing the proposed transaction, (10) the possibility that the proposed transaction may be more expensive to complete than anticipated, including as a result of unexpected factors or events, (11) the dilution caused by BancShares’ issuance of additional shares of its capital stock in connection with the proposed transaction, (12) other factors that may affect future results of BancShares and CIT including changes in asset quality and credit risk, the inability to sustain revenue and earnings growth, changes in interest rates and capital markets, inflation, customer borrowing, repayment, investment and deposit practices, the impact, extent and timing of technological changes, capital management activities, and other actions of the Federal Reserve Board and legislative and regulatory actions and reforms, and (13) the impact of the global COVID-19 pandemic on CIT’s business, the parties’ ability to complete the proposed transaction and/or any of the other foregoing risks.
Except to the extent required by applicable laws or regulations, BancShares disclaims any obligation to update forward-looking statements or to publicly announce the results of any revisions to any of the forward-looking statements included herein to reflect future events or developments. Further information regarding BancShares and factors which could affect the forward-looking statements contained herein can be found in BancShares’ Annual Report on Form 10-K for the fiscal year ended December 31, 2020 and its other filings with the Securities and Exchange Commission.


###


CONSOLIDATED BALANCE SHEETS

(Dollars in thousands, unaudited)September 30, 2021December 31, 2020
Assets
Cash and due from banks$337,450 $362,048 
Overnight investments9,875,063 4,347,336 
Investment in marketable equity securities (cost of $85,554 at September 30, 2021 and $84,837 at December 31, 2020)123,147 91,680 
Investment securities available for sale (cost of $7,345,143 at September 30, 2021 and $6,911,965 at December 31, 2020)7,371,129 7,014,243 
Investment securities held to maturity (fair value of $3,353,078 at September 30, 2021 and $2,838,499 at December 31, 2020)3,381,078 2,816,982 
Loans held for sale98,451 124,837 
Loans and leases32,516,189 32,791,975 
Allowance for credit losses(183,194)(224,314)
Net loans and leases32,332,995 32,567,661 
Premises and equipment1,230,572 1,251,283 
Other real estate owned40,649 50,890 
Income earned not collected132,911 145,694 
Goodwill350,298 350,298 
Other intangible assets44,142 50,775 
Other assets1,584,092 783,953 
Total assets$56,901,977 $49,957,680 
Liabilities
Deposits:
Noninterest-bearing$21,514,407 $18,014,029 
Interest-bearing28,551,355 25,417,580 
Total deposits50,065,762 43,431,609 
Securities sold under customer repurchase agreements663,575 641,487 
Federal Home Loan Bank borrowings645,663 655,175 
Subordinated debt497,427 504,518 
Other borrowings76,139 88,470 
FDIC shared-loss payable— 15,601 
Other liabilities372,116 391,552 
Total liabilities52,320,682 45,728,412 
Shareholders’ equity
Common stock:
Class A - $1 par value (16,000,000 shares authorized; 8,811,220 shares issued and outstanding at September 30, 2021 and December 31, 2020)8,811 8,811 
Class B - $1 par value (2,000,000 shares authorized; 1,005,185 shares issued and outstanding at September 30, 2021 and December 31, 2020)1,005 1,005 
Preferred stock - $0.01 par value (10,000,000 shares authorized; 345,000 shares issued and outstanding at September 30, 2021 and December 31, 2020; $1,000 per share liquidity preference)339,937 339,937 
Retained earnings4,263,679 3,867,252 
Accumulated other comprehensive (loss) income(32,137)12,263 
Total shareholders’ equity4,581,295 4,229,268 
Total liabilities and shareholders’ equity$56,901,977 $49,957,680 


CONSOLIDATED STATEMENTS OF INCOME

Three months endedNine months ended
September 30,June 30,September 30,September 30,September 30,
(Dollars in thousands, except per share data, unaudited)20212021202020212020
Interest income
Loans and leases$319,214 $324,288 $336,382 $966,525 $988,029 
Investment securities interest and dividend income39,246 35,432 37,195 105,530 113,293 
Overnight investments3,395 2,105 757 6,948 5,828 
Total interest income361,855 361,825 374,334 1,079,003 1,107,150 
Interest expense
Deposits8,073 8,542 13,468 25,408 55,578 
Securities sold under customer repurchase agreements358 356 395 1,052 1,236 
Federal Home Loan Bank borrowings2,114 2,099 2,156 6,300 7,612 
Subordinated debt4,174 4,181 4,351 12,543 11,783 
Other borrowings249 254 305 768 1,488 
Total interest expense14,968 15,432 20,675 46,071 77,697 
Net interest income346,887 346,393 353,659 1,032,932 1,029,453 
Provision (credit) for credit losses(1,120)(19,603)4,042 (31,697)52,949 
Net interest income after provision for credit losses348,007 365,996 349,617 1,064,629 976,504 
Noninterest income
Wealth management services31,935 31,753 26,369 95,886 75,152 
Service charges on deposit accounts24,858 21,883 20,841 68,277 64,776 
Cardholder services, net22,879 22,471 19,756 65,310 55,503 
Other service charges and fees9,205 8,959 7,892 26,653 22,829 
Merchant services, net8,409 8,532 6,763 25,858 18,014 
Mortgage income6,106 5,929 13,106 25,026 28,141 
Insurance commissions4,000 3,704 3,576 11,702 10,453 
ATM income1,481 1,571 1,537 4,534 4,354 
Realized gains on investment securities available for sale, net8,082 15,830 21,425 33,119 54,972 
Marketable equity securities gains (losses), net3,350 11,654 (2,701)31,015 10,461 
Other2,639 1,864 2,008 6,363 5,330 
Total noninterest income122,944 134,150 120,572 393,743 349,985 
Noninterest expense
Salaries and wages160,947 153,643 147,297 462,420 439,185 
Employee benefits32,146 35,298 31,788 103,169 100,663 
Occupancy expense29,101 28,439 27,990 87,283 85,026 
Equipment expense30,229 28,902 29,430 88,934 86,054 
Processing fees paid to third parties15,602 14,427 11,927 43,702 32,485 
FDIC insurance expense3,661 3,382 2,167 10,261 9,364 
Collection and foreclosure-related expenses836 173 2,168 3,207 10,171 
Merger-related expenses7,013 5,769 3,507 19,601 12,108 
Other 33,283 31,545 35,388 91,745 108,256 
Total noninterest expense312,818 301,578 291,662 910,322 883,312 
Income before income taxes158,133 198,568 178,527 548,050 443,177 
Income taxes34,060 45,780 35,843 123,873 89,538 
Net income$124,073 $152,788 $142,684 $424,177 $353,639 
Preferred stock dividends4,636 4,636 4,636 13,908 9,426 
Net income available to common shareholders$119,437 $148,152 $138,048 $410,269 $344,213 
Weighted average common shares outstanding9,816,405 9,816,405 9,836,629 9,816,405 10,137,321 
Earnings per common share$12.17 $15.09 $14.03 $41.79 $33.96 
Dividends declared per common share0.47 0.47 0.40 1.41 1.20 


SELECTED QUARTERLY RATIOS

Three months ended
September 30, 2021June 30, 2021September 30, 2020
SELECTED RATIOS (1)
Book value per share at period-end$432.07 $421.39 $380.43 
Annualized return on average assets0.88 %1.13 %1.18 %
Annualized return on average equity11.29 14.64 14.93 
Total risk-based capital ratio14.3 14.2 13.7 
Tier 1 risk-based capital ratio12.3 12.1 11.5 
Common equity Tier 1 ratio11.3 11.1 10.4 
Tier 1 leverage capital ratio7.7 7.7 7.8 
(1) Capital ratios are preliminary
.
ALLOWANCE FOR CREDIT LOSSES AND ASSET QUALITY DISCLOSURES

Three months ended
(Dollars in thousands, unaudited)September 30, 2021June 30, 2021September 30, 2020
ALLOWANCE FOR CREDIT LOSSES (1)
ACL at beginning of period$189,094 $210,651 $222,450 
Provision for credit losses(1,120)(19,603)4,042 
Net charge-offs of loans and leases:
Charge-offs(11,073)(7,528)(8,932)
Recoveries6,293 5,574 6,376 
Net charge-offs of loans and leases(4,780)(1,954)(2,556)
ACL at end of period$183,194 $189,094 $223,936 
ACL at end of period allocated to:
PCD$18,438 $18,740 $25,127 
Non-PCD164,756 170,354 198,809 
ACL at end of period$183,194 $189,094 $223,936 
Reserve for unfunded commitments$11,472 $11,103 $13,971 
SELECTED LOAN DATA
Average loans and leases:
PCD$384,673 $414,183 $512,559 
Non-PCD32,222,960 32,628,109 32,065,084 
Loans and leases at period-end:
PCD373,255 396,506 495,878 
Non-PCD32,142,934 32,293,146 32,349,266 
RISK ELEMENTS
Nonaccrual loans and leases$163,775 $187,464 $186,454 
Other real estate owned40,649 43,685 52,789 
Total nonperforming assets$204,424 $231,149 $239,243 
Accruing loans and leases 90 days or more past due$5,614 $3,776 $3,587 
RATIOS
Net charge-offs (annualized) to average loans and leases0.06 %0.02 %0.03 %
ACL to total loans and leases(2):
PCD4.94 4.73 5.07 
Non-PCD0.51 0.53 0.61 
Total0.56 0.58 0.68 
Ratio of total nonperforming assets to total loans, leases and other real estate owned0.63 0.71 0.73 
(1) BancShares recorded no ACL on investment securities as of September 30, 2021, June 30, 2021, or September 30, 2020.
(2) Loans originated in relation to the SBA-PPP do not have a recorded ACL. As of September 30, 2021, the ratio of ACL to total Non-PCD loans excluding SBA-PPP loans was 0.53% while the ratio of ACL to total loans excluding SBA-PPP loans was 0.58%. As of December 31, 2020, the ratio of ACL to total Non-PCD loans excluding SBA-PPP loans was 0.67% while the ratio of ACL to total loans excluding SBA-PPP loans was 0.74%.


AVERAGE BALANCE SHEETS AND NET INTEREST MARGIN

Three months ended
September 30, 2021June 30, 2021September 30, 2020
Average Yield/Average Yield/AverageYield/
(Dollars in thousands, unaudited)BalanceInterest
 Rate (2)
BalanceInterest
 Rate (2)
BalanceInterest
Rate (2)
INTEREST-EARNING ASSETS
Loans and leases (1)
$32,707,591 $319,738 3.85 %$33,166,049 $324,891 3.89 %$32,694,996 $336,934 4.06 %
Investment securities:
U.S. Treasury— — — — — — 695,419 497 0.28 
Government agency824,499 2,076 1.01 839,614 1,966 0.94 587,377 1,335 0.91 
Mortgage-backed securities9,164,180 29,056 1.27 8,968,779 25,273 1.13 8,047,247 28,236 1.40 
Corporate bonds597,386 7,610 5.10 612,516 7,806 5.10 489,602 6,433 5.26 
Other investments121,454 544 1.78 113,439 426 1.51 110,552 739 2.66 
Total investment securities10,707,519 39,286 1.47 10,534,348 35,471 1.35 9,930,197 37,240 1.50 
Overnight investments8,956,055 3,395 0.15 7,819,287 2,105 0.11 2,992,183 757 0.10 
Total interest-earning assets$52,371,165 $362,419 2.73 $51,519,684 $362,467 2.80 $45,617,376 $374,931 3.24 
Cash and due from banks364,593 364,303 349,079 
Premises and equipment1,239,111 1,242,700 1,261,864 
Allowance for credit losses(189,885)(211,913)(222,793)
Other real estate owned40,786 46,074 52,716 
Other assets2,096,588 1,438,483 1,203,913 
Total assets$55,922,358 $54,399,331 $48,262,155 
INTEREST-BEARING LIABILITIES
Interest-bearing deposits:
Checking with interest$11,323,503 $1,350 0.05 %$10,952,753 $1,504 0.06 %$9,239,838 $1,369 0.06 %
Savings3,979,389 342 0.03 3,796,686 326 0.03 3,070,619 314 0.04 
Money market accounts9,866,327 2,357 0.09 9,581,775 2,634 0.11 8,108,832 3,634 0.18 
Time deposits2,599,006 4,024 0.61 2,672,900 4,078 0.61 3,205,850 8,151 1.01 
Total interest-bearing deposits27,768,225 8,073 0.12 27,004,114 8,542 0.13 23,625,139 13,468 0.23 
Securities sold under customer repurchase agreements672,114 358 0.21 677,451 356 0.21 710,237 395 0.22 
Other short-term borrowings— — — — — — — — — 
Long-term borrowings1,222,452 6,537 2.09 1,227,755 6,534 2.12 1,256,331 6,812 2.15 
Total interest-bearing liabilities29,662,791 $14,968 0.20 28,909,320 $15,432 0.21 25,591,707 $20,675 0.32 
Demand deposits21,338,862 20,746,989 18,280,705 
Other liabilities384,113 344,849 370,668 
Shareholders' equity4,536,592 4,398,173 4,019,075 
Total liabilities and shareholders' equity$55,922,358 $54,399,331 $48,262,155 
Interest rate spread2.53 %2.59 %2.92 %
Net interest income and net yield on interest-earning assets$347,451 2.61 %$347,035 2.68 %$354,256 3.06 %
(1) Loans and leases include PCD and non-PCD loans, nonaccrual loans and loans held for sale.
(2) Yields related to loans, leases and securities exempt from both federal and state income taxes, federal income taxes only, or state income taxes only are stated on a taxable-equivalent basis assuming statutory federal income tax rates of 21.0% for all periods presented, as well as state income tax rates of 3.3% for the three months ended September 30, 2021 and June 30, 2021, and 3.4% for the three months ended September 30, 2020. The taxable-equivalent adjustment was $564 thousand, $642 thousand, and $597 thousand for the three months ended September 30, 2021, June 30, 2021, and September 30, 2020, respectively.

First Citizens BancShares Third Quarter 2021 Earnings Conference Call October 27, 2021


® 2 Important Notices Forward Looking Statements This communication contains “forward-looking statements” within the meaning of the Private Securities Litigation Reform Act of 1995 regarding the financial condition, results of operations, business plans and future performance of BancShares. Words such as “anticipates,” “believes,” “estimates,” “expects,” “predicts,” “forecasts,” “intends,” “plans,” “projects,” “targets,” “designed,” “could,” “may,” “should,” “will,” “potential,” “continue” or other similar words and expressions are intended to identify these forward-looking statements. These forward-looking statements are based on BancShares’ current expectations and assumptions regarding BancShares’ business, the economy, and other future conditions. Because forward-looking statements relate to future results and occurrences, they are subject to inherent risks, uncertainties, changes in circumstances and other risk factors that are difficult to predict. Many possible events or factors could affect BancShares’ future financial results and performance and could cause the actual results, performance or achievements of BancShares to differ materially from any anticipated results expressed or implied by such forward-looking statements. Such risks and uncertainties include, among others, the impacts of the global COVID-19 pandemic on BancShares’ business and customers, the financial success or changing conditions or strategies of BancShares’ customers or vendors, fluctuations in interest rates, actions of government regulators, the availability of capital and personnel, the delay in closing (or failure to close) one or more of BancShares’ previously announced acquisition transaction(s), the failure to realize the anticipated benefits of BancShares’ previously announced acquisition transaction(s), and general competitive, economic, political, and market conditions, as well as risks related to the proposed transaction with CIT Group Inc (“CIT”) including, in addition to those described above and among others, (1) the risk that the cost savings, any revenue synergies and other anticipated benefits of the proposed transaction may not be realized or may take longer than anticipated to be realized, including as a result of the impact of, or problems arising from, the integration of the two companies or as a result of the condition of the economy and competitive factors in areas where BancShares and CIT do business, (2) disruption to BancShares’ and CIT’s businesses as a result of the pendency of the proposed transaction and diversion of management’s attention from ongoing business operations and opportunities, (3) the occurrence of any event, change or other circumstances that could give rise to the right of one or both of the parties to terminate the definitive merger agreement, (4) the risk that the integration of BancShares’ and CIT’s operations will be materially delayed or will be more costly or difficult than expected or that BancShares and CIT are otherwise unable to successfully integrate their businesses, (5) the outcome of any legal proceedings that may be or have been instituted against BancShares and/or CIT, (6) the failure to obtain remaining governmental approvals (and the risk that such approvals may result in the imposition of conditions that could adversely affect the combined company or the expected benefits of the proposed transaction), (7) reputational risk and potential adverse reactions of BancShares’ and/or CIT’s customers, suppliers, employees or other business partners, including those resulting from the completion of the proposed transaction, (8) the failure of any of the closing conditions in the definitive merger agreement to be satisfied on a timely basis or at all, (9) delays in closing the proposed transaction, (10) the possibility that the proposed transaction may be more expensive to complete than anticipated, including as a result of unexpected factors or events, (11) the dilution caused by BancShares’ issuance of additional shares of its capital stock in connection with the proposed transaction, (12) other factors that may affect future results of BancShares and CIT including changes in asset quality and credit risk, the inability to sustain revenue and earnings growth, changes in interest rates and capital markets, inflation, customer borrowing, repayment, investment and deposit practices, the impact, extent and timing of technological changes, capital management activities, and other actions of the Federal Reserve Board and legislative and regulatory actions and reforms, and (13) the impact of the global COVID-19 pandemic on CIT’s business, the parties’ ability to complete the proposed transaction and/or any of the other foregoing risks. Except to the extent required by applicable laws or regulations, BancShares disclaims any obligation to update forward-looking statements or to publicly announce the results of any revisions to any of the forward-looking statements included herein to reflect future events or developments. Further information regarding BancShares and factors which could affect the forward-looking statements contained herein can be found in BancShares’ Annual Report on Form 10-K for the fiscal year ended December 31, 2020 and its other filings with the Securities and Exchange Commission. Non-GAAP Measures Certain measures included in this presentation are "non-GAAP," meaning they are not presented in accordance with generally accepted accounting principles in the U.S. and also are not codified in U.S. banking regulations currently applicable to BancShares. BancShares believes that non-GAAP financial measures, when reviewed in conjunction with GAAP financial information, can provide transparency about or an alternative means of assessing its operating results and financial position to its investors, analysts and management. The non-GAAP measures presented in this presentation are listed, and are reconciled to the most comparable GAAP measure, in the non-GAAP reconciliation table(s) appearing in the Appendix.


® Timing • North Carolina Commissioner of Banks and Federal Deposit Insurance Corporation have approved. • Awaiting approval from the Board of Governors of the Federal Reserve System (“FRB”). • Both parties have responded to all questions issued by the Staff of the FRB, and the Staff has informed the parties that they do not have further questions at this time. • The parties have been informed that the application is presently at the Governor level and the Board of Governors has not provided a timeframe for its decision on the application. Integration • Operational conversion plans and initial timelines have been drafted and will be finalized following close. • Conversions expected to begin in early 2022, subject to timing of close. • Leaders from both organizations are actively engaged in planning to ensure cultural alignment and a successful integration. • Closing is expected as soon as practicable following the above approval and satisfaction or waiver of other customary closing conditions. • Final valuations will commence upon closing of the transaction. • Purchase accounting adjustments to be disclosed as soon as practicable post legal close. • Prior estimates for cost savings and merger related expenses to be confirmed post legal close. Next Steps CIT Merger Update


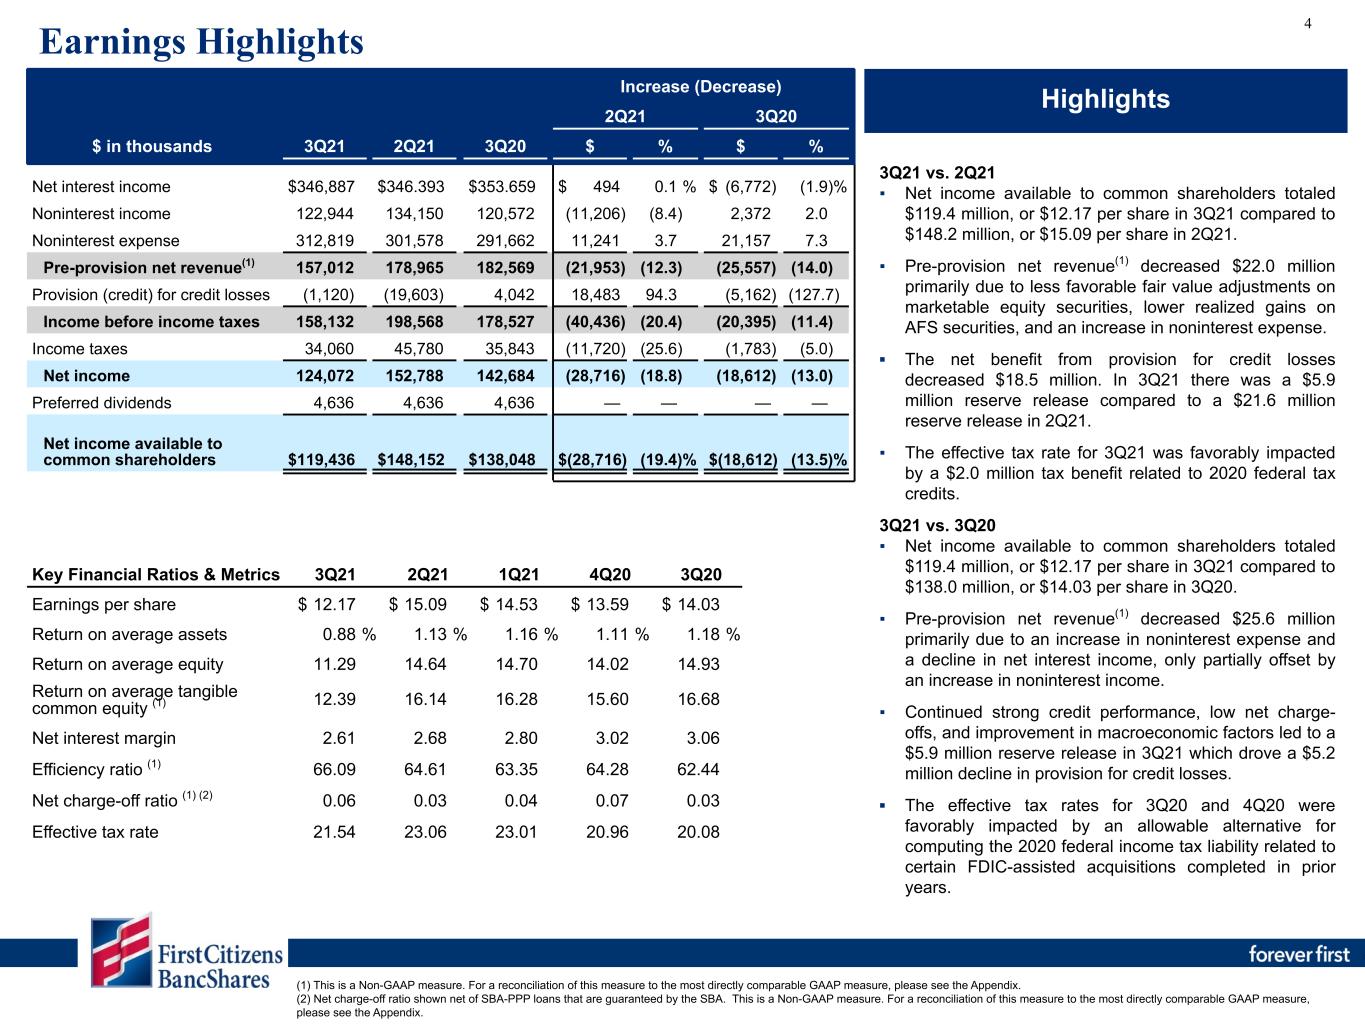
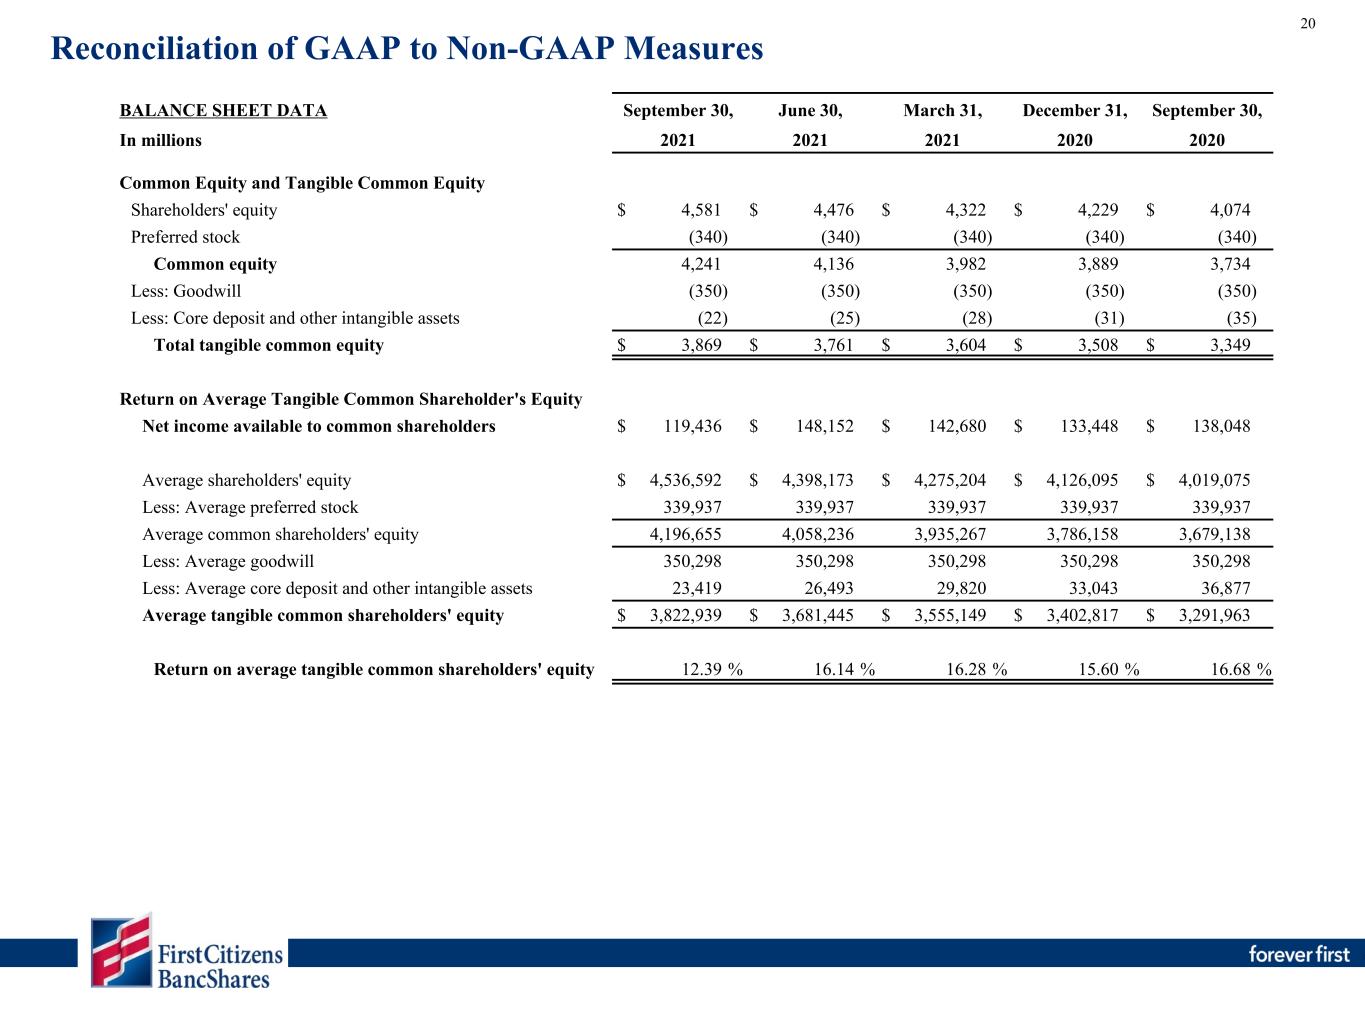
® 3Q21 vs. 2Q21 ▪ Net income available to common shareholders totaled $119.4 million, or $12.17 per share in 3Q21 compared to $148.2 million, or $15.09 per share in 2Q21. ▪ Pre-provision net revenue(1) decreased $22.0 million primarily due to less favorable fair value adjustments on marketable equity securities, lower realized gains on AFS securities, and an increase in noninterest expense. ▪ The net benefit from provision for credit losses decreased $18.5 million. In 3Q21 there was a $5.9 million reserve release compared to a $21.6 million reserve release in 2Q21. ▪ The effective tax rate for 3Q21 was favorably impacted by a $2.0 million tax benefit related to 2020 federal tax credits. 3Q21 vs. 3Q20 ▪ Net income available to common shareholders totaled $119.4 million, or $12.17 per share in 3Q21 compared to $138.0 million, or $14.03 per share in 3Q20. ▪ Pre-provision net revenue(1) decreased $25.6 million primarily due to an increase in noninterest expense and a decline in net interest income, only partially offset by an increase in noninterest income. ▪ Continued strong credit performance, low net charge- offs, and improvement in macroeconomic factors led to a $5.9 million reserve release in 3Q21 which drove a $5.2 million decline in provision for credit losses. ▪ The effective tax rates for 3Q20 and 4Q20 were favorably impacted by an allowable alternative for computing the 2020 federal income tax liability related to certain FDIC-assisted acquisitions completed in prior years. Increase (Decrease) 2Q21 3Q20 $ in thousands 3Q21 2Q21 3Q20 $ % $ % Net interest income $ 346,887 $ 346.393 $ 353.659 $ 494 0.1 % $ (6,772) (1.9) % Noninterest income 122,944 134,150 120,572 (11,206) (8.4) 2,372 2.0 Noninterest expense 312,819 301,578 291,662 11,241 3.7 21,157 7.3 Pre-provision net revenue(1) 157,012 178,965 182,569 (21,953) (12.3) (25,557) (14.0) Provision (credit) for credit losses (1,120) (19,603) 4,042 18,483 94.3 (5,162) (127.7) Income before income taxes 158,132 198,568 178,527 (40,436) (20.4) (20,395) (11.4) Income taxes 34,060 45,780 35,843 (11,720) (25.6) (1,783) (5.0) Net income 124,072 152,788 142,684 (28,716) (18.8) (18,612) (13.0) Preferred dividends 4,636 4,636 4,636 — — — — Net income available to common shareholders $ 119,436 $ 148,152 $ 138,048 $ (28,716) (19.4) % $ (18,612) (13.5) % 4 Highlights (1) Net charge-off ratio shown net of SBA-PPP loans that are guaranteed by the SBA. • Lower PCD interest income of $13.5 million. ◦ + $95.9 million wealth income ◦ +$11.7 million insurance commissions ◦ + $65.3 million cardholder services income ◦ -$25.9 million merchant services income ◦ -$4.5 million ATM income Earnings Highlights FOR BOARD DECK Key Financial Ratios & Metrics 3Q21 2Q21 3Q20 Earnings per share #N/A $ 15.09 $ 14.03 Return on average assets #N/A 1.13 % 1.18 % Return on average equity #N/A 14.64 14.93 Net interest margin #N/A 2.68 3.06 Efficiency ratio #N/A 64.61 62.44 Net charge-off ratio (1) #N/A 0.03 0.03 Effective tax rate #N/A 23.06 20.08 Key Financial Ratios & Metrics 3Q21 2Q21 1Q21 4Q20 3Q20 Earnings per share $ 12.17 $ 15.09 $ 14.53 $ 13.59 $ 14.03 Return on average assets 0.88 % 1.13 % 1.16 % 1.11 % 1.18 % Return on average equity 11.29 14.64 14.70 14.02 14.93 Return on average tangible common equity (1) 12.39 16.14 16.28 15.60 16.68 Net interest margin 2.61 2.68 2.80 3.02 3.06 Efficiency ratio (1) 66.09 64.61 63.35 64.28 62.44 Net charge-off ratio (1) (2) 0.06 0.03 0.04 0.07 0.03 Effective tax rate 21.54 23.06 23.01 20.96 20.08 (1) This is a Non-GAAP measure. For a reconciliation of this measure to the most directly comparable GAAP measure, please see the Appendix. (2) Net charge-off ratio shown net of SBA-PPP loans that are guaranteed by the SBA. This is a Non-GAAP measure. For a reconciliation of this measure to the most directly comparable GAAP measure, please see the Appendix. 3Q21 vs. 2Q21 ▪ Benefit from provision for credit losses decreased $18.5 million primarily due to a $21.6 million reserve release in 2Q21 driven by continued strong credit performance, low net charge-offs, and improved macroeconomic factors. ▪ Noninterest income decreased $11.2 million primarily due to an $8.3 million decrease in fair market value adjustments on marketable equity securities and a $7.7 million decrease in realized gains on AFS securities, partially offset by a $3.0 million increase in net service charges on deposits driven by volume. ▪ Noninterest expense increased $11.2 million primarily due to a $4.2 million increase in personnel expenses, a $2.1 million increase in impairment on non-marketable equity securities, a $1.2 million increase in merger costs, and a $1.2 million increase in third party service fees. ▪ Net interest income increased $0.5 million primarily due to lower rates paid on interest-bearing deposits. ▪ Earnings per share totaled $12.17 in 3Q21 compared to $15.09 in 2Q21. 3Q21 vs. 3Q20 ▪ Noninterest expense increased $21.2 million primarily due to a $14.0 million increase in personnel expenses, a $3.7 million increase in third party service fees, and a $3.5 million increase in merger costs. ▪ Net interest income decreased $6.8 million primarily due to a decline in yields on interest-earning assets, partially offset by lower rates paid on interest-bearing deposits. 3Q21 included $20.0 million in interest and fee income on SBA-PPP loans compared to $28.9 million in 3Q20. ▪ Continued strong credit performance, low net charge-offs, and improvement in macroeconomic factors led to a $5.2 million decline in provision for credit losses. ▪ Earnings per share totaled $12.17 in 3Q21 compared to $14.03 in 3Q20.


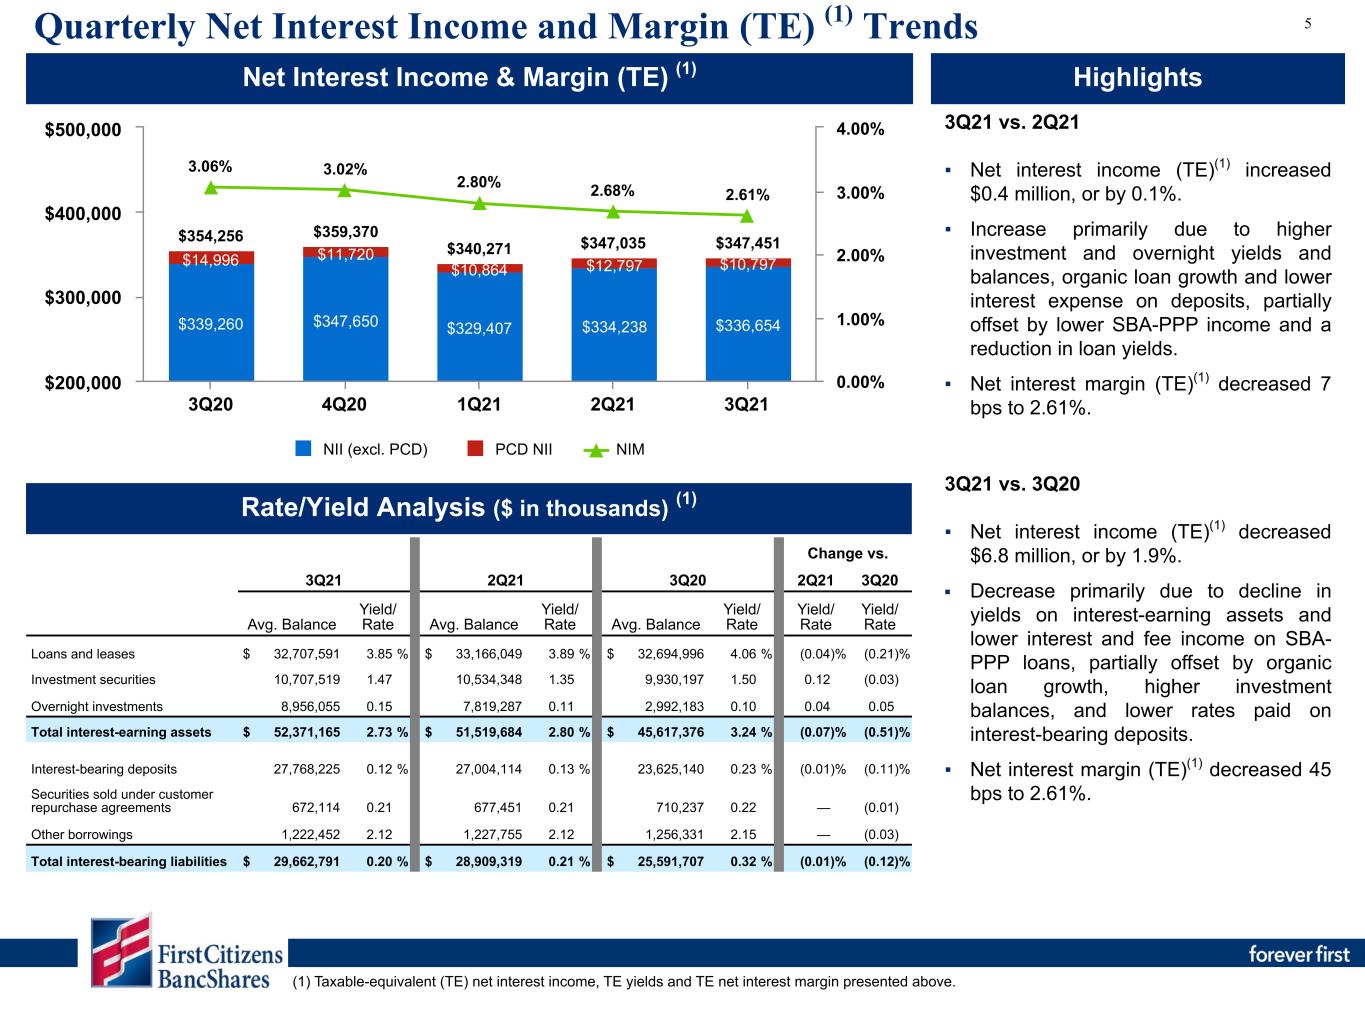
® 3Q21 vs. 2Q21 ▪ Net interest income (TE)(1) increased $0.4 million, or by 0.1%. ▪ Increase primarily due to higher investment and overnight yields and balances, organic loan growth and lower interest expense on deposits, partially offset by lower SBA-PPP income and a reduction in loan yields. ▪ Net interest margin (TE)(1) decreased 7 bps to 2.61%. 3Q21 vs. 3Q20 ▪ Net interest income (TE)(1) decreased $6.8 million, or by 1.9%. ▪ Decrease primarily due to decline in yields on interest-earning assets and lower interest and fee income on SBA- PPP loans, partially offset by organic loan growth, higher investment balances, and lower rates paid on interest-bearing deposits. ▪ Net interest margin (TE)(1) decreased 45 bps to 2.61%. Quarterly Net Interest Income and Margin (TE) (1) Trends Change vs. 3Q21 2Q21 3Q20 2Q21 3Q20 Avg. Balance Yield/ Rate Avg. Balance Yield/ Rate Avg. Balance Yield/ Rate Yield/ Rate Yield/ Rate Loans and leases $ 32,707,591 3.85 % $ 33,166,049 3.89 % $ 32,694,996 4.06 % (0.04) % (0.21) % Investment securities 10,707,519 1.47 10,534,348 1.35 9,930,197 1.50 0.12 (0.03) Overnight investments 8,956,055 0.15 7,819,287 0.11 2,992,183 0.10 0.04 0.05 Total interest-earning assets $ 52,371,165 2.73 % $ 51,519,684 2.80 % $ 45,617,376 3.24 % (0.07) % (0.51) % Interest-bearing deposits 27,768,225 0.12 % 27,004,114 0.13 % 23,625,140 0.23 % (0.01) % (0.11) % Securities sold under customer repurchase agreements 672,114 0.21 677,451 0.21 710,237 0.22 — (0.01) Other borrowings 1,222,452 2.12 1,227,755 2.12 1,256,331 2.15 — (0.03) Total interest-bearing liabilities $ 29,662,791 0.20 % $ 28,909,319 0.21 % $ 25,591,707 0.32 % (0.01) % (0.12) % 5 ▪ Net interest margin decreased 6 bps from 2.67% to 2.61%. Core net interest margin decreased 3 bps from 2.48% to 2.45%. The largest impacts were lower yields on interest earning assets and increased debt volume, partially offset by increased PCD portfolio income. ▪ Yield on Non-PCD loans and leases decreased 2 bps from 3.78% to 3.76% primarily due to lower yields on commercial and business loans (-7 bps), residential (-7 bps), equity lines (-4 bps), leases (-2 bps), and the remaining loan categories (-4 bps), partially offset by yields on acquired* loans and leases (+19 bps). ▪ Yield on investments increased 12 bps from 1.35% to 1.47%. ▪ Yield on interest earning assets decreased 7 bp from 2.80% to 2.73%. ▪ Rate on interest bearing liabilities decreased (1) bps from 0.21% to 0.20% primarily due to deposits from acquired* banks (+6 bps) and borrowings (+4 bps), partially offset by time deposit rate decreases (-5 bps) and money market rate decreases (-1 bps). Rate/Yield Analysis ($ in thousands) (1) Highlights $354,256 $359,370 $340,271 $347,035 $347,451 $339,260 $347,650 $329,407 $334,238 $336,654 $14,996 $11,720 $10,864 $12,797 $10,797 3.06% 3.02% 2.80% 2.68% 2.61% NII (excl. PCD) PCD NII NIM 3Q20 4Q20 1Q21 2Q21 3Q21 $200,000 $300,000 $400,000 $500,000 0.00% 1.00% 2.00% 3.00% 4.00% Net Interest Income & Margin (TE) (1) 2Q21 NIM 3Q20 NIM 2.67 % 3.06 % Core: Loan yield (0.03) % (0.22) % Investment yield 0.02 % (0.06) % Overnight investment yield 0.01 % — % Debt volume — % 0.02 % Deposit costs 0.01 % 0.11 % Earning asset mix (0.13) % PCD/Other: PCD portfolio income 0.03 % 0.02 % SBA-PPP yield (0.02) % 0.07 % 3Q21 NIM 2.61 % 2.61 % (1) Taxable-equivalent (TE) net interest income, TE yields and TE net interest margin presented above.


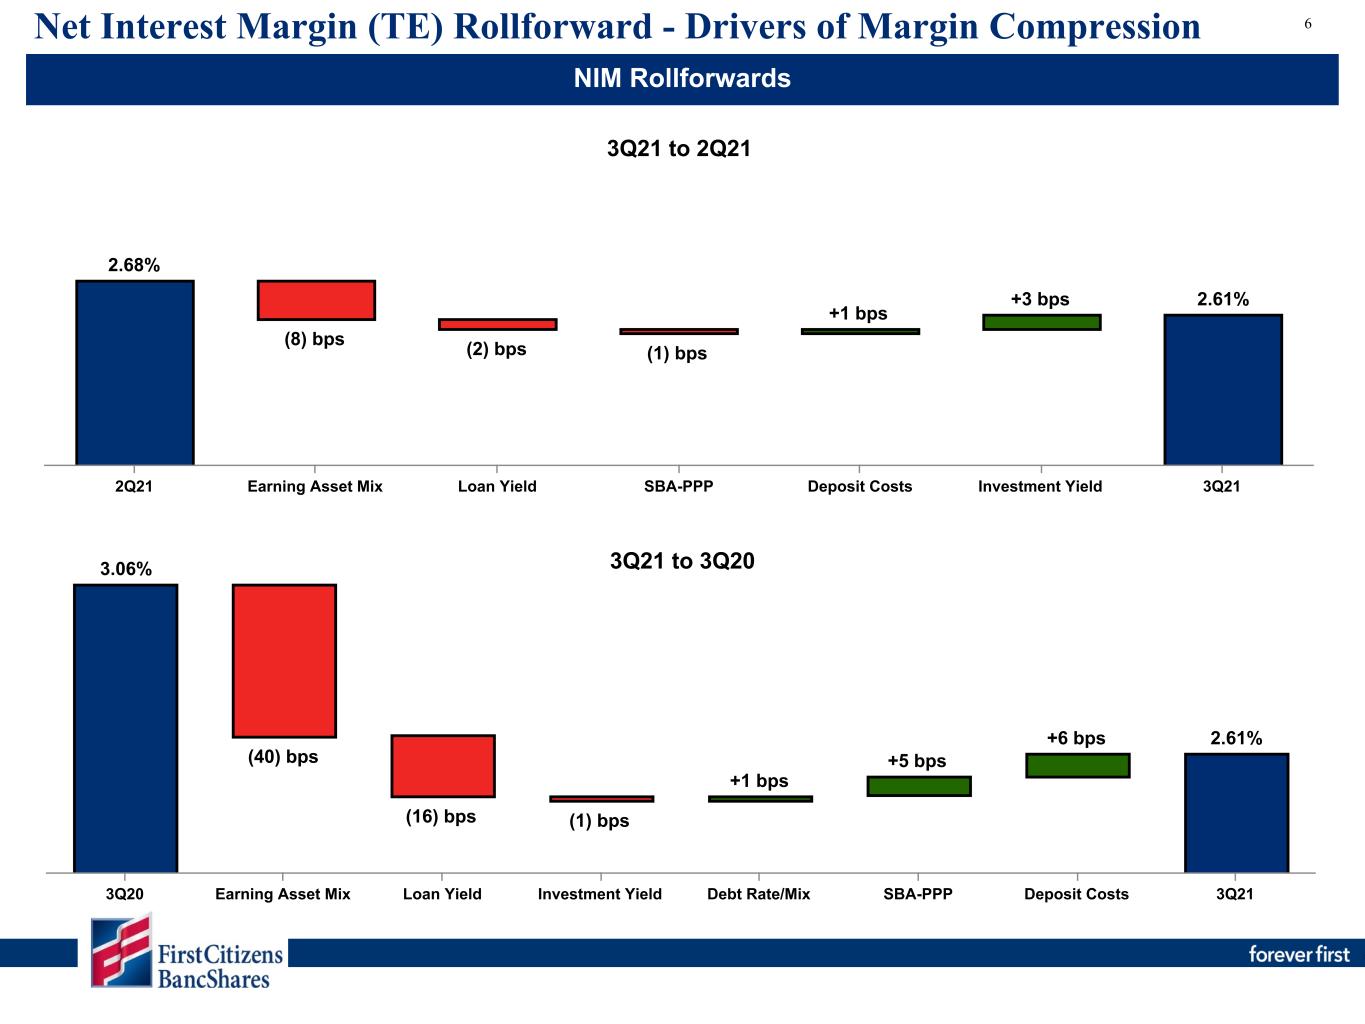
® Net Interest Margin (TE) Rollforward - Drivers of Margin Compression 6 ▪ Net interest margin decreased 6 bps from 2.67% to 2.61%. Core net interest margin decreased 3 bps from 2.48% to 2.45%. The largest impacts were lower yields on interest earning assets and increased debt volume, partially offset by increased PCD portfolio income. ▪ Yield on Non-PCD loans and leases decreased 2 bps from 3.78% to 3.76% primarily due to lower yields on commercial and business loans (-7 bps), residential (-7 bps), equity lines (-4 bps), leases (-2 bps), and the remaining loan categories (-4 bps), partially offset by yields on acquired* loans and leases (+19 bps). ▪ Yield on investments increased 12 bps from 1.35% to 1.47%. ▪ Yield on interest earning assets decreased 7 bp from 2.80% to 2.73%. ▪ Rate on interest bearing liabilities decreased (1) bps from 0.21% to 0.20% primarily due to deposits from acquired* banks (+6 bps) and borrowings (+4 bps), partially offset by time deposit rate decreases (-5 bps) and money market rate decreases (-1 bps). Highlights 2Q21 NIM 3Q20 NIM 2.67 % 3.06 % Core: Loan yield (0.03) % (0.22) % Investment yield 0.02 % (0.06) % Overnight investment yield 0.01 % — % Debt volume — % 0.02 % Deposit costs 0.01 % 0.11 % Earning asset mix (0.13) % PCD/Other: PCD portfolio income 0.03 % 0.02 % SBA-PPP yield (0.02) % 0.07 % 3Q21 NIM 2.61 % 2.61 % 2.68% (8) bps (2) bps (1) bps +1 bps +3 bps 2.61% 2Q21 Earning Asset Mix Loan Yield SBA-PPP Deposit Costs Investment Yield 3Q21 3.06% (40) bps (16) bps (1) bps +1 bps +5 bps +6 bps 2.61% 3Q20 Earning Asset Mix Loan Yield Investment Yield Debt Rate/Mix SBA-PPP Deposit Costs 3Q21 3Q21 vs. 2Q21 ▪ 12 bps decline comprised of: ▪ ~ (13) bps related to earning asset mix; ▪ ~ (2) bps related to SBA-PPP; partially offset by: ▪ ~ 1 bps related to lower deposit cost; ▪ ~ 2 bps related to investment yield. 3Q21 vs. 3Q20 ▪ 46 bps decline comprised of: ▪ ~ (40) bps related to earning asset mix; ▪ ~ (20) bps related to loan yield; ▪ ~ (6) bps related to investment yield; partially offset by: ▪ ~ 2 bps related to the debt rate/mix; ▪ ~ 7 bps related to SBA-PPP; ▪ ~ 11 bps related to lower deposit cost. NIM Rollforwards 3Q21 to 2Q21 3Q21 to 3Q20


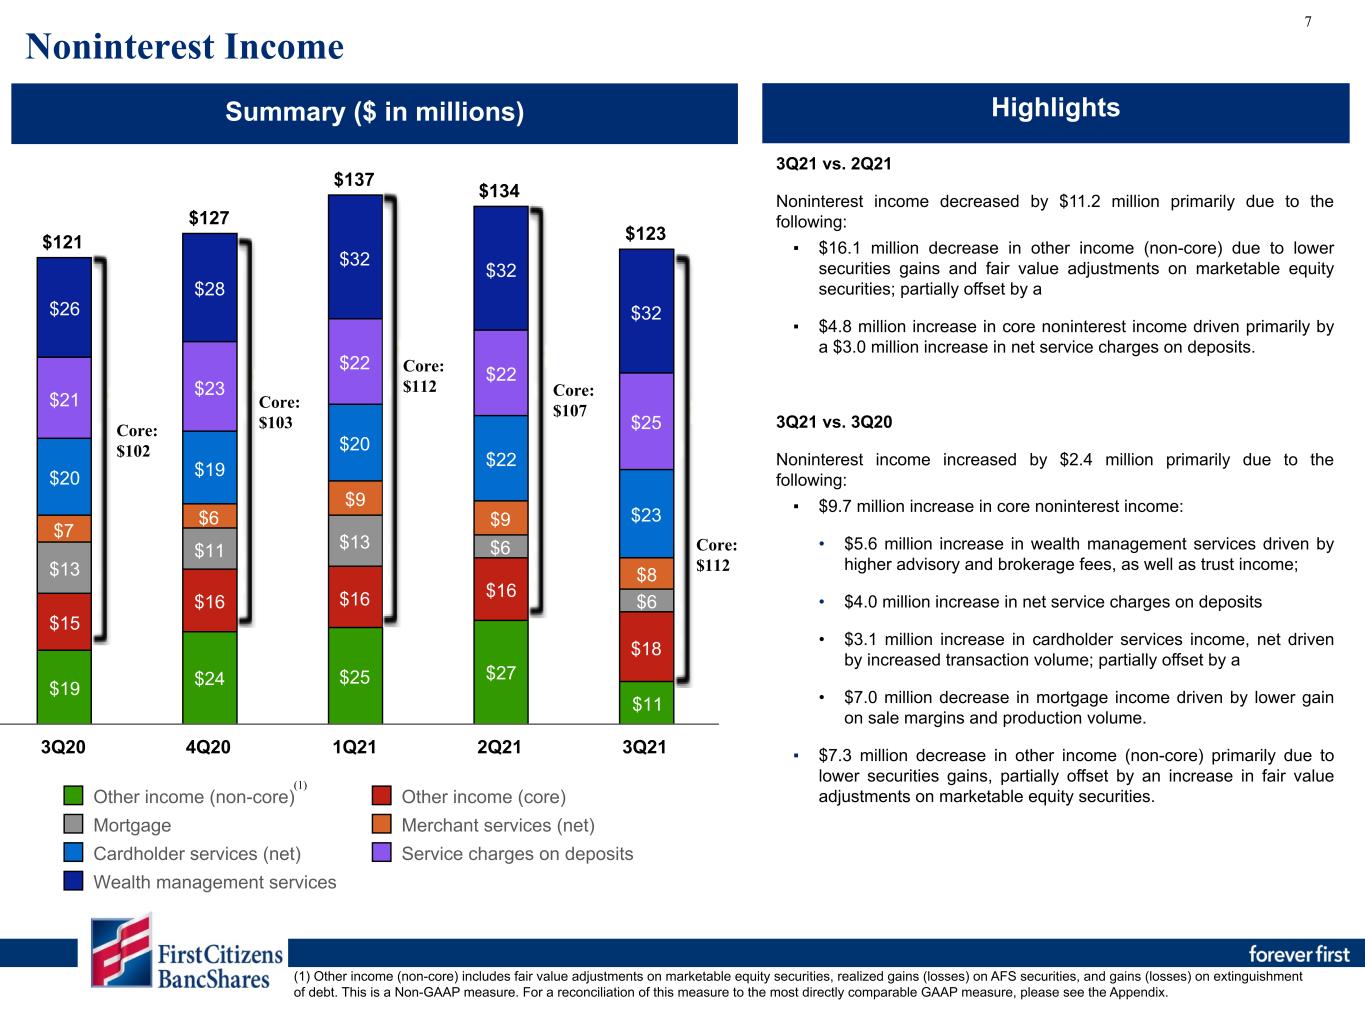
® 3Q21 vs. 2Q21 Noninterest income decreased by $11.2 million primarily due to the following: ▪ $16.1 million decrease in other income (non-core) due to lower securities gains and fair value adjustments on marketable equity securities; partially offset by a ▪ $4.8 million increase in core noninterest income driven primarily by a $3.0 million increase in net service charges on deposits. 3Q21 vs. 3Q20 Noninterest income increased by $2.4 million primarily due to the following: ▪ $9.7 million increase in core noninterest income: • $5.6 million increase in wealth management services driven by higher advisory and brokerage fees, as well as trust income; • $4.0 million increase in net service charges on deposits • $3.1 million increase in cardholder services income, net driven by increased transaction volume; partially offset by a • $7.0 million decrease in mortgage income driven by lower gain on sale margins and production volume. ▪ $7.3 million decrease in other income (non-core) primarily due to lower securities gains, partially offset by an increase in fair value adjustments on marketable equity securities. Noninterest Income Trends Excluding Non-Core Activity(1) ($ in 000) Noninterest Income Summary ($ in millions) Highlights 7 $121 $127 $137 $134 $123 $19 $24 $25 $27 $11 $15 $16 $16 $16 $18 $13 $11 $13 $6 $6 $7 $6 $9 $9 $8 $20 $19 $20 $22 $23 $21 $23 $22 $22 $25 $26 $28 $32 $32 $32 Other income (non-core) Other income (core) Mortgage Merchant services (net) Cardholder services (net) Service charges on deposits Wealth management services 3Q20 4Q20 1Q21 2Q21 3Q21 Core: $102 Core: $103 Core: $112 Core: $107 Core: $112 (1) (1) Other income (non-core) includes fair value adjustments on marketable equity securities, realized gains (losses) on AFS securities, and gains (losses) on extinguishment of debt. This is a Non-GAAP measure. For a reconciliation of this measure to the most directly comparable GAAP measure, please see the Appendix. Noninterest income category totals might not foot due to rounding. (1) Other income (non-core) includes fair value adjustments on marketable equity securities, realized gains (losses) on AFS securities, and gains (losses) on extinguishment of debt.


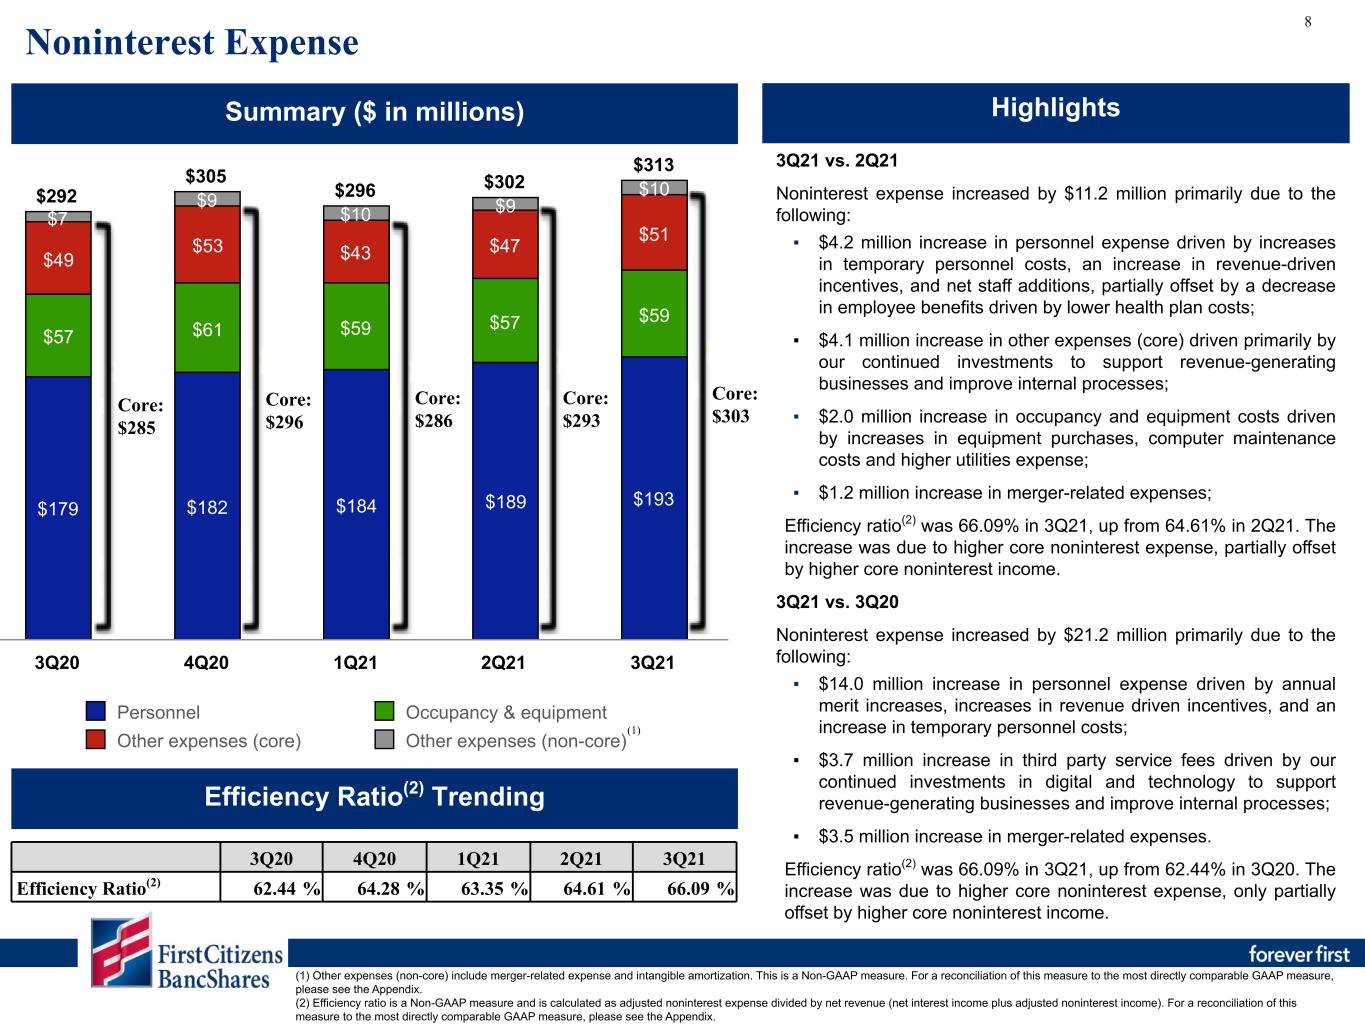
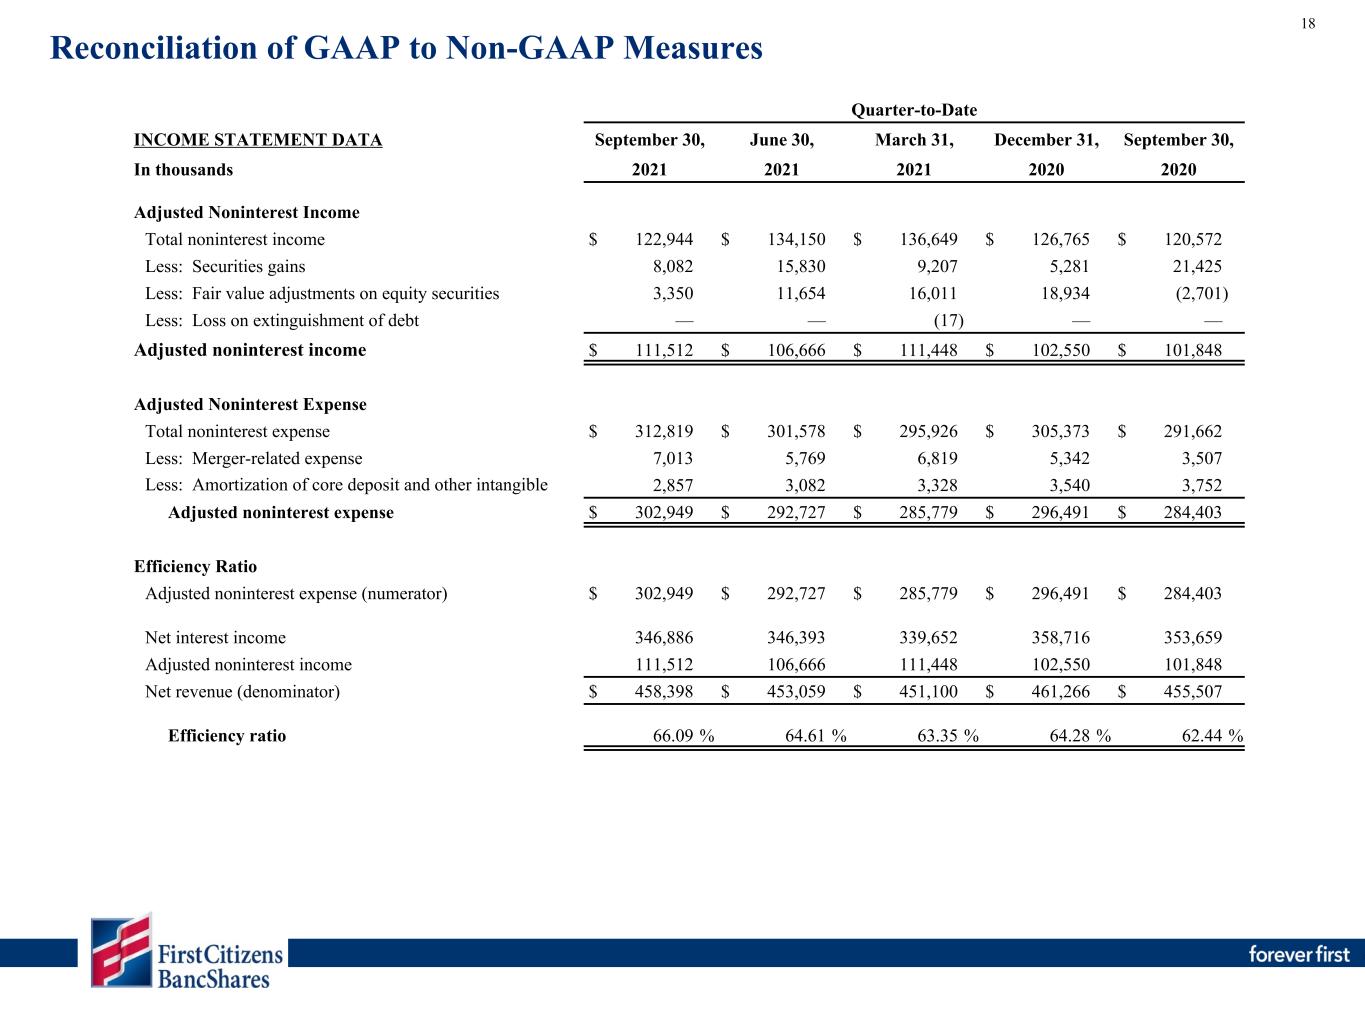
® Noninterest Income Trends Excluding Non-Core Activity(1) ($ in 000) Noninterest Expense Summary ($ in millions) Highlights 8 $292 $305 $296 $302 $313 $179 $182 $184 $189 $193 $57 $61 $59 $57 $59 $49 $53 $43 $47 $51 $7 $9 $10 $9 $10 Personnel Occupancy & equipment Other expenses (core) Other expenses (non-core) 3Q20 4Q20 1Q21 2Q21 3Q21 Core: $285 Core: $296 Core: $286 Core: $293 Core: $303 3Q20 4Q20 1Q21 2Q21 3Q21 Efficiency Ratio(2) 62.44 % 64.28 % 63.35 % 64.61 % 66.09 % Efficiency Ratio(2) Trending (1) 3Q21 vs. 2Q21 Noninterest expense increased by $11.2 million primarily due to the following: ▪ $4.2 million increase in personnel expense driven by increases in temporary personnel costs, an increase in revenue-driven incentives, and net staff additions, partially offset by a decrease in employee benefits driven by lower health plan costs; ▪ $4.1 million increase in other expenses (core) driven primarily by our continued investments to support revenue-generating businesses and improve internal processes; ▪ $2.0 million increase in occupancy and equipment costs driven by increases in equipment purchases, computer maintenance costs and higher utilities expense; ▪ $1.2 million increase in merger-related expenses; Efficiency ratio(2) was 66.09% in 3Q21, up from 64.61% in 2Q21. The increase was due to higher core noninterest expense, partially offset by higher core noninterest income. 3Q21 vs. 3Q20 Noninterest expense increased by $21.2 million primarily due to the following: ▪ $14.0 million increase in personnel expense driven by annual merit increases, increases in revenue driven incentives, and an increase in temporary personnel costs; ▪ $3.7 million increase in third party service fees driven by our continued investments in digital and technology to support revenue-generating businesses and improve internal processes; ▪ $3.5 million increase in merger-related expenses. Efficiency ratio(2) was 66.09% in 3Q21, up from 62.44% in 3Q20. The increase was due to higher core noninterest expense, only partially offset by higher core noninterest income. Noninterest expense category totals might not foot due to rounding. (1) Other expenses (non-core) include merger-related expenses and intangible amortization. (1) Other expenses (non-core) include merger-related expense and intangible amortization. This is a Non-GAAP measure. For a reconciliation of this measure to the most directly comparable GAAP measure, please see the Appendix. (2) Efficiency ratio is a Non-GAAP measure and is calculated as adjusted noninterest expense divided by net revenue (net interest income plus adjusted noninterest income). For a reconciliation of this measure to the most directly comparable GAAP measure, please see the Appendix.


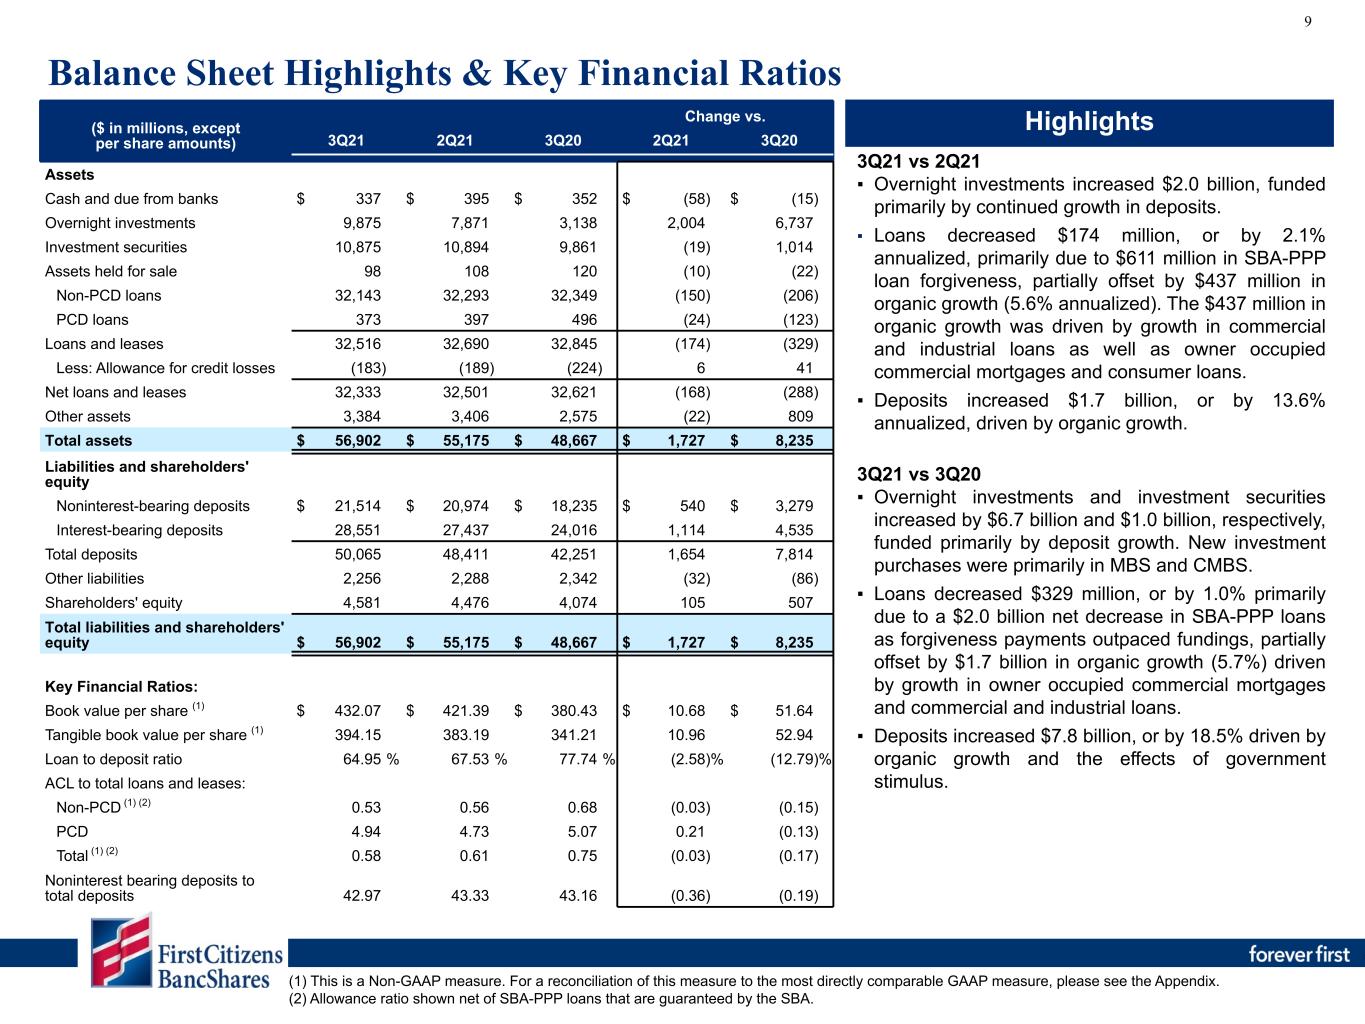
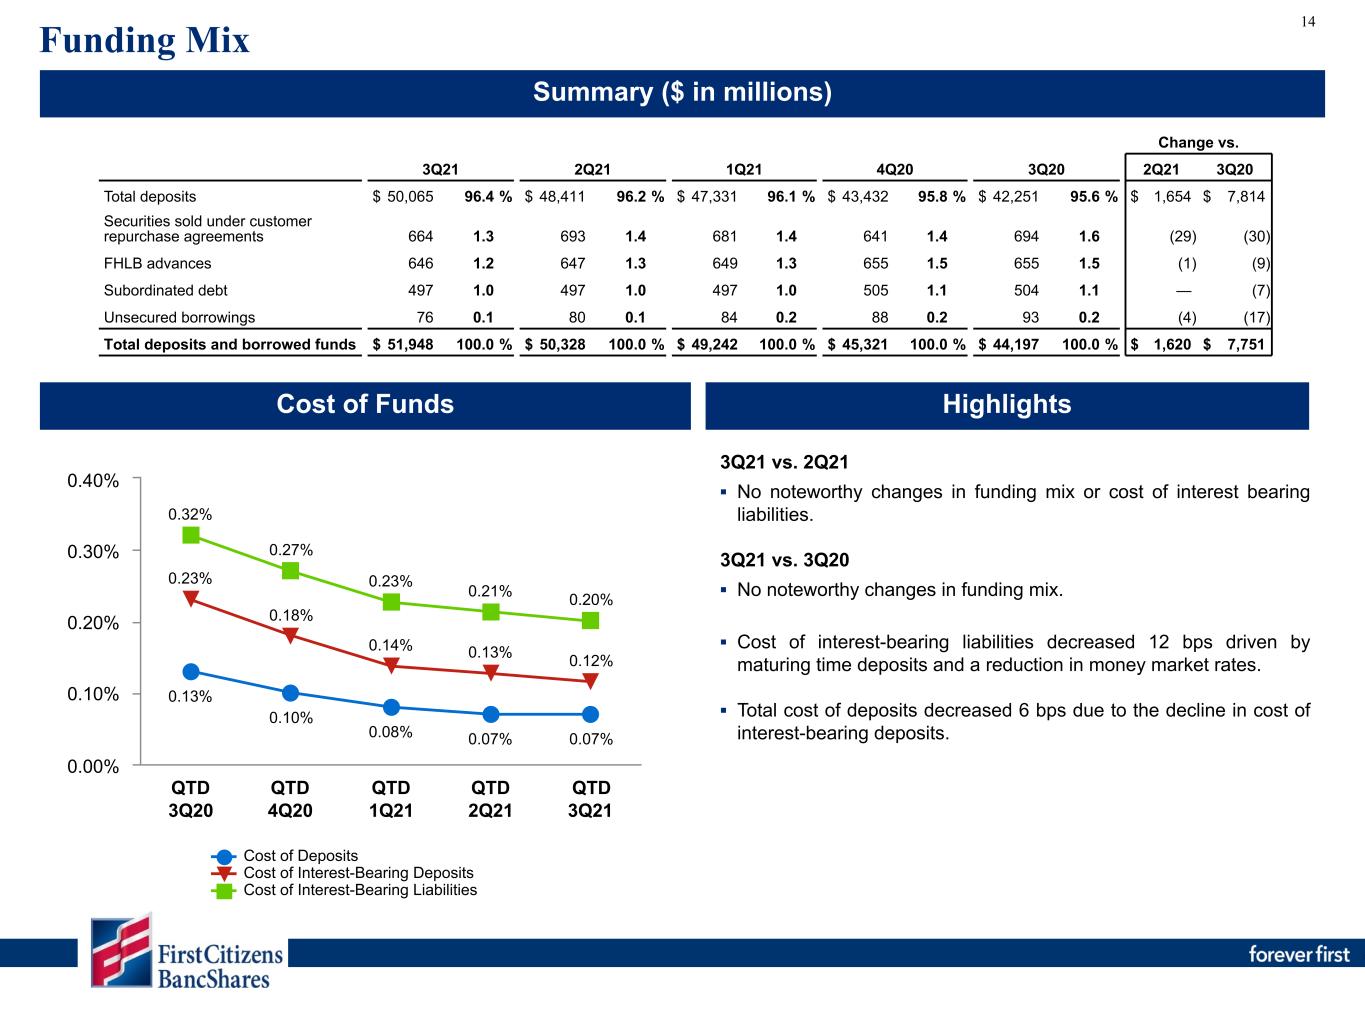
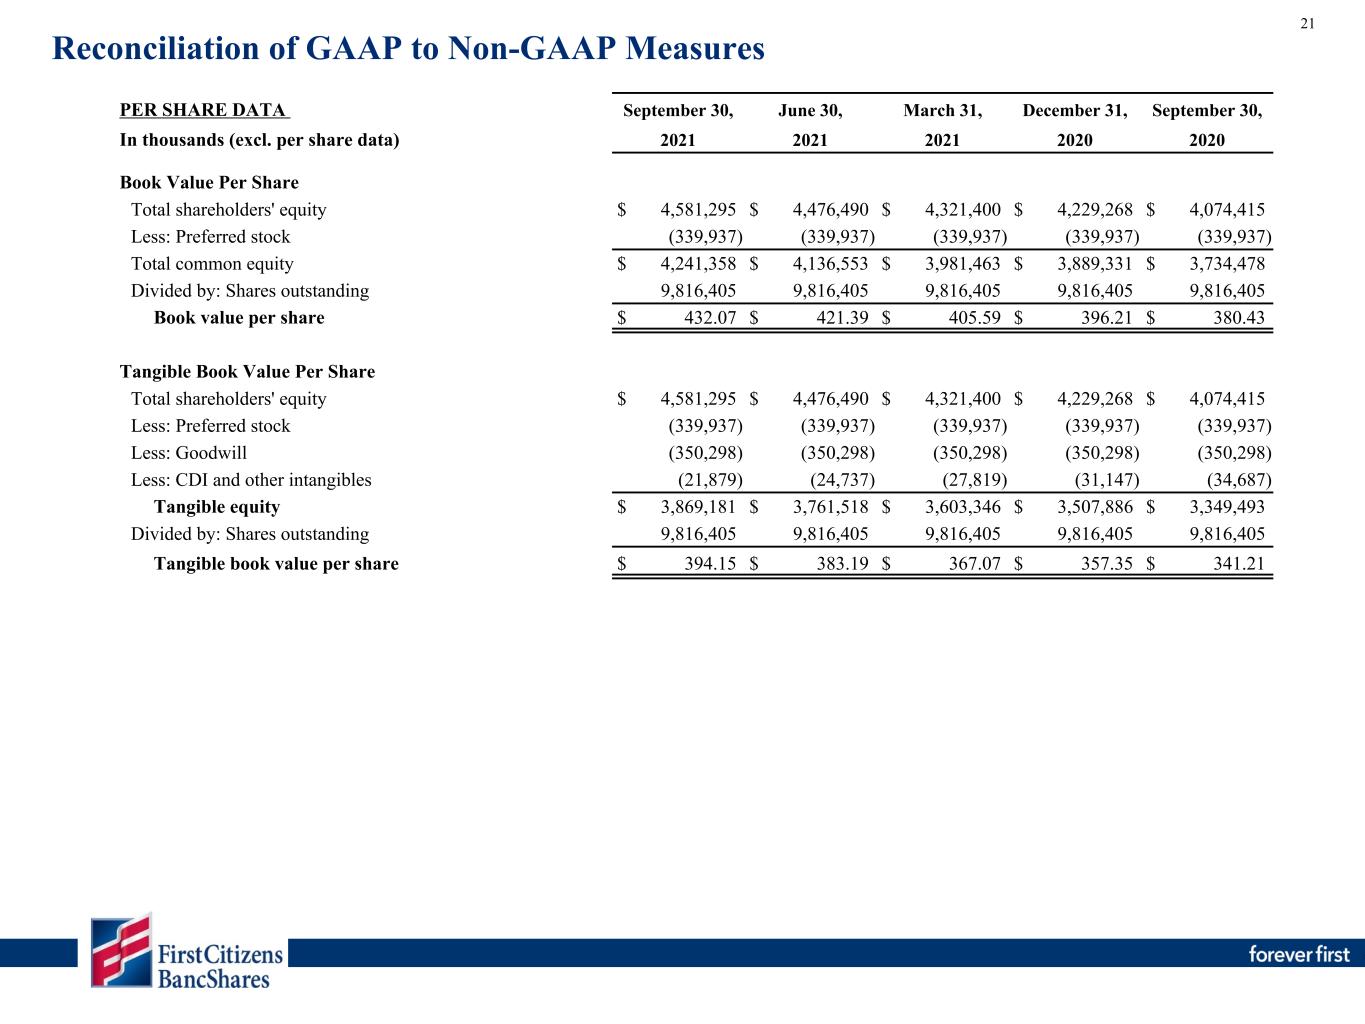
® Highlights 9 Balance Sheet Highlights & Key Financial Ratios ($ in millions, except per share amounts) Change vs. 3Q21 2Q21 3Q20 2Q21 3Q20 Assets Cash and due from banks $ 337 $ 395 $ 352 $ (58) $ (15) Overnight investments 9,875 7,871 3,138 2,004 6,737 Investment securities 10,875 10,894 9,861 (19) 1,014 Assets held for sale 98 108 120 (10) (22) Non-PCD loans 32,143 32,293 32,349 (150) (206) PCD loans 373 397 496 (24) (123) Loans and leases 32,516 32,690 32,845 (174) (329) Less: Allowance for credit losses (183) (189) (224) 6 41 Net loans and leases 32,333 32,501 32,621 (168) (288) Other assets 3,384 3,406 2,575 (22) 809 Total assets $ 56,902 $ 55,175 $ 48,667 $ 1,727 $ 8,235 Liabilities and shareholders' equity Noninterest-bearing deposits $ 21,514 $ 20,974 $ 18,235 $ 540 $ 3,279 Interest-bearing deposits 28,551 27,437 24,016 1,114 4,535 Total deposits 50,065 48,411 42,251 1,654 7,814 Other liabilities 2,256 2,288 2,342 (32) (86) Shareholders' equity 4,581 4,476 4,074 105 507 Total liabilities and shareholders' equity $ 56,902 $ 55,175 $ 48,667 $ 1,727 $ 8,235 Key Financial Ratios: Book value per share (1) $ 432.07 $ 421.39 $ 380.43 $ 10.68 $ 51.64 Tangible book value per share (1) 394.15 383.19 341.21 10.96 52.94 Loan to deposit ratio 64.95 % 67.53 % 77.74 % (2.58) % (12.79) % ACL to total loans and leases: Non-PCD (1) (2) 0.53 0.56 0.68 (0.03) (0.15) PCD 4.94 4.73 5.07 0.21 (0.13) Total (1) (2) 0.58 0.61 0.75 (0.03) (0.17) Noninterest bearing deposits to total deposits 42.97 43.33 43.16 (0.36) (0.19) (1) Allowance ratio excludes SBA-PPP loans in the denominator. 3Q21 vs 2Q21 ▪ Overnight investments increased $2.0 billion, funded primarily by continued growth in deposits. ▪ Loans decreased $174 million, or by 2.1% annualized, primarily due to $611 million in SBA-PPP loan forgiveness, partially offset by $437 million in organic growth (5.6% annualized). The $437 million in organic growth was driven by growth in commercial and industrial loans as well as owner occupied commercial mortgages and consumer loans. ▪ Deposits increased $1.7 billion, or by 13.6% annualized, driven by organic growth. 3Q21 vs 3Q20 ▪ Overnight investments and investment securities increased by $6.7 billion and $1.0 billion, respectively, funded primarily by deposit growth. New investment purchases were primarily in MBS and CMBS. ▪ Loans decreased $329 million, or by 1.0% primarily due to a $2.0 billion net decrease in SBA-PPP loans as forgiveness payments outpaced fundings, partially offset by $1.7 billion in organic growth (5.7%) driven by growth in owner occupied commercial mortgages and commercial and industrial loans. ▪ Deposits increased $7.8 billion, or by 18.5% driven by organic growth and the effects of government stimulus. • $6.5 billion in organic growth primarily driven by increases of $2.0 billion in demand deposits, $2.4 billion in checking with interest accounts, $1.8 billion in money market accounts and $0.9 billion in savings accounts, partially offset by a decrease of $567 million in time deposits. ▪ Other liabilities decreased $86 million primarily due to unsettled investment purchases that resulted in an outstanding payable of $662 million in February 2020, a decrease in FHLB borrowings of $10 million, and a decrease in the FDIC clawback liability of $15 million, partially offset by net proceeds from subordinated debentures issued in March 2020 of $346 million and growth in customer repurchase agreements of $(30) million.-3 for intra quarter months: 3Q21 vs 2Q21 ▪ Overnight investments and investment securities increased by $2.0 billion, respectively, funded primarily by deposit growth. New investment purchases were primarily in MBS and CMO investments. ▪ Loans decreased $174 million, or by 0.7% on an annualized basis primarily due to a $0.6 billion net decrease in SBA-PPP loans as forgiveness payments outpaced fundings, partially offset by $437 million in organic growth (1.8% annualized growth). ▪ Deposits increased $1.7 billion, or by 20.4% on an annualized basis driven primarily by organic growth. (1) Loan to deposit ratio excluding PPP loans and deposit balances would be 64.45%. for quarter end months: 3Q21 vs 2Q21 ▪ Overnight investments increased $2,004 million, funded primarily by growth in demand deposits. ▪ Loans decreased $174 million, or by 2.1% annualized, primarily due to $611 million in SBA-PPP loan forgiveness, partially offset by $437 million in organic growth (5.6% annualized). The $437 million in organic growth was driven by growth in owner-occupied commercial real estate loans. ▪ Deposits increased $1.7 billion, or by 13.6% annualized, driven by growth in checking with interest accounts of $0.4 billion. (1) Loan to deposit ratio excluding SBA-PPP loans and deposit balances would be 64.45% and 72.60% for 4Q20 and 3Q20, respectively. (1) This is a Non-GAAP measure. For a reconciliation of this measure to the most directly comparable GAAP measure, please see the Appendix. (2) Allowance ratio shown net of SBA-PPP loans that are guaranteed by the SBA.


® $32,845 $32,792 $33,181 $32,690 $32,516 $19,501 $20,152 $20,327 $20,793 $21,142 $9,735 $9,771 $9,651 $9,802 $9,914 $496 $463 $433 $397 $373$3,113 $2,406 $2,770 $1,698 $1,087 Commercial Consumer PCD loans SBA-PPP 3Q20 4Q20 1Q21 2Q21 3Q21 $0 $5,000 $10,000 $15,000 $20,000 $25,000 $30,000 $35,000 Loan Composition ($ in millions) Loans and Leases 10 7.3% 1.4% 29.8% 61.5% 8.3% 1.3% 29.1% 61.3% 5.2% 1.2% 30.0% 63.6% 3.3% 1.2% 30.5% 65.0% Highlights Quarter to Date Annualized and Year over Year Growth Total Loans 3Q21 vs. 2Q21: (2.1)% Adjusted Loans(1) 3Q21 vs. 2Q21: 5.6% Total Loans 3Q21 vs. 3Q20: (1.0)% Adjusted Loans(1) 3Q21 vs. 3Q20: 5.7% 3Q21 vs. 2Q21 ▪ Loans decreased $174 million, or by 2.1% on an annualized basis primarily due to a $611 million net decrease in SBA-PPP loans, partially offset by $437 million in organic growth driven primarily by commercial and industrial loans as well as owner occupied commercial mortgages and consumer loans. 3Q21 vs. 3Q20 ▪ Loans decreased $329 million, or by 1.0% primarily due to a $2.0 billion net decrease in SBA-PPP loans, partially offset by $1.7 billion in organic growth (5.7%) driven primarily by owner occupied commercial mortgages and commercial and industrial loans. Year to Date Annualized and Year over Year Growth Total Loans 3Q21 vs. 2Q21: (0.7)% Adjusted Loans(1) 3Q21 vs. 2Q21: 1.8% Total Loans 3Q21 vs. 3Q20: (1.0)% Adjusted Loans(1) 3Q21 vs. 3Q20: 5.7% 3Q21 vs. 2Q21 ▪ Loans decreased $174 million, or by 0.7% on an annualized basis primarily due to a $0.6 billion net decrease in SBA-PPP loans, partially offset by $437 million in organic growth driven primarily by owner occupied commercial mortgage loans. 9.5% 1.5% 29.6% 59.4% Quarter to Date Annualized and Year over Year Growth Total Loans 3Q21 vs. 2Q21: (2.1)% Adjusted Loans(1) 3Q21 vs. 2Q21: 5.6% Total Loans 3Q21 vs. 3Q20: (1.0)% Adjusted Loans(1) 3Q21 vs. 3Q20: 5.7% 3Q21 vs. 2Q21 ▪ Loans decreased $174 million, or by 0.6% on an annualized basis, primarily due to $611 million in SBA-PPP loan forgiveness, partially offset by $437 million in organic growth. ▪ Commercial loan growth was driven primarily by owner-occupied commercial real estate loans. Loan category totals might not foot due to rounding. (1) Adjusted for SBA-PPP. (2) Acquired banks include Gwinnett. 1.5% 29.6% 59.4% 1Q20 (1) Adjusted for SBA-PPP loans. This is a Non-GAAP measure. For a reconciliation of this measure to the most directly comparable GAAP measure, please see the Appendix.


® 11 ▪ Net interest margin decreased 6 bps from 2.67% to 2.61%. Core net interest margin decreased 3 bps from 2.48% to 2.45%. The largest impacts were lower yields on interest earning assets and increased debt volume, partially offset by increased PCD portfolio income. ▪ Yield on Non-PCD loans and leases decreased 2 bps from 3.78% to 3.76% primarily due to lower yields on commercial and business loans (-7 bps), residential (-7 bps), equity lines (-4 bps), leases (-2 bps), and the remaining loan categories (-4 bps), partially offset by yields on acquired* loans and leases (+19 bps). ▪ Yield on investments increased 12 bps from 1.35% to 1.47%. ▪ Yield on interest earning assets decreased 7 bp from 2.80% to 2.73%. ▪ Rate on interest bearing liabilities decreased (1) bps from 0.21% to 0.20% primarily due to deposits from acquired* banks (+6 bps) and borrowings (+4 bps), partially offset by time deposit rate decreases (-5 bps) and money market rate decreases (-1 bps). Nonperforming Assets & Ratio (1) Provision (Credit) for Credit Losses $ in th ou sa nd s $2,556 $5,025 $2,689 $1,954 $4,781 0.03% 0.07% 0.04% 0.03% 0.06% NCO $ NCO Ratio 3Q20 4Q20 1Q21 2Q21 3Q21 $0 $2,500 $5,000 $7,500 $10,000 0.00% 0.05% 0.10% 0.15% 0.20% 0.25% Net Charge-Offs (NCO) & Ratio (1) $ in th ou sa nd s $239,243 $242,373 $243,046 $231,149 $204,424 0.80% 0.80% 0.80% 0.74% 0.65% Nonperforming $ Nonperforming Ratio 3Q20 4Q20 1Q21 2Q21 3Q21 $0 $100,000 $200,000 $300,000 $400,000 0.00% 0.50% 1.00% 1.50% 2.00% Quarterly Credit Quality Trends $ in th ou sa nd s $223,936 $224,314 $210,651 $189,094 $183,194$198,809 $200,327 $187,716 $170,354 $164,756 $25,127 $23,987 $22,935 $18,740 $18,438 0.75% 0.74% 0.69% 0.61% 0.58% Non-PCD ACL PCD ACL Allowance Ratio 3Q20 4Q20 1Q21 2Q21 3Q21 $125,000 $150,000 $175,000 $200,000 $225,000 $250,000 1.00% 2.00% 3.00% 4.00% Allowance & Allowance Ratio (1) ▪ Quarterly net charge-offs remain low and decreased from the previous quarter. ▪ Provision for 1Q21 was favorably impacted by improving macroeconomic outlooks and continued low net charge-offs. ▪ Nonperforming assets remain stable. $4,042 $5,403 $(10,974 ) $(19,603 ) $(1,120)Provision Expense/(Credit) (1) Net charge-off, allowance, and nonperforming asset ratios exclude SBA-PPP loans. (1) Net charge-off, allowance, and nonperforming asset ratios exclude SBA-PPP loans. For a reconciliation of this measure to the most directly comparable GAAP measure, please see appendix. $ in th ou sa nd s $4,042 $5,403 $(10,974) $(19,603) $(1,120) Provision for Credit Losses 3Q20 4Q20 1Q21 2Q21 3Q21 $(30,000) $(20,000) $(10,000) $0 $10,000 $20,000 $30,000 On Day 1 of CECL adoption (January 1, 2020), ACL was 0.65% of total loans. (1) Net charge-off, allowance, and nonperforming asset ratios exclude SBA-PPP loans. Nonperforming asset ratio is total nonperforming assets divided by total loans and other real estate. This is a Non-GAAP measure. For a reconciliation of this measure to the most directly comparable GAAP measure, please see the Appendix.


® $ in thousands Non-PCD PCD Total ACL as of December 31, 2020 $ 200,327 $ 23,987 $ 224,314 Charge-offs (25,146) (2,018) (27,164) Recoveries 12,451 5,290 17,741 Net (charge-offs) recoveries $ (12,695) $ 3,272 $ (9,423) Provision for credit losses (22,876) (8,821) (31,697) ACL as of September 30, 2021 $ 164,756 $ 18,438 $ 183,194 12 Highlights (1) Ratios exclude SBA-PPP loans. Allowance for Credit Losses (ACL) 3Q21 2Q21 1Q21 4Q20 3Q20 ACL to Non-PCD loans 0.53% 0.56% 0.63% 0.67% 0.68% ACL to PCD loans 4.94 4.73 5.30 5.18 5.07 Allowance for credit loss (ACL) ratio 0.58% 0.61% 0.69% 0.74% 0.75% Net charge-off (NCO) ratio 0.06% 0.03% 0.04% 0.07% 0.03% Coverage ratio (ACL ratio / NCO ratio) 9.67 20.33 17.25 10.57 25.00 Allowance Rollforward 4Q20 1Q21 2Q21 3Q21 4Q21 GDP (Real GDP) 18,721 18,886 19,044 19,198 19,361 GDP (Change % Y/Y) -2.77 % -0.65 % 10.06 % 3.31 % 3.42 % Unemployment 7.01 % 7.24 % 6.58 % 6.64 % 6.16 % Credit Quality Ratios (1) ▪ Portfolio remains stable with strong credit quality. ▪ Net charge-off ratio near historic lows at 6 bps. ▪ Provision credit of $31.7 million in YTD21 was driven primarily by a $41.1 million reserve release due to improved macroeconomic factors, partially offset by net charge-offs of $9.4 million. (1) Ratios exclude SBA-PPP loans. For a reconciliation of this measure to the most directly comparable GAAP measure, please see appendix. (1) Ratios exclude shown net of SBA-PPP loans that are guaranteed by the SBA. This is a Non-GAAP measure. For a reconciliation of this measure to the most directly comparable GAAP measure, please see the Appendix..


® Quarter to Date Annualized and Year over Year Growth Total Deposits 3Q21 vs. 2Q21: 13.6% Total Deposits 3Q21 vs. 3Q20: 18.5% 3Q21 vs. 2Q21 ▪ Increase of $1.7 billion, or by 13.6% on an annualized basis, driven primarily by growth in money market accounts of $592 million, demand deposits of $540 million, checking with interest accounts of $392 million, and savings accounts of $178 million. 3Q21 vs. 3Q20 ▪ Increase of $7.8 billion, or by 18.5%, driven primarily by growth in demand deposits of $3.3 billion, checking with interest accounts of $2.4 billion, money market accounts of $1.8 billion, and savings accounts of $915 million, partially offset by a decrease in time deposits of $567 million. Deposits Deposit Composition ($ in millions) Highlights 13 $42,251 $43,432 $47,331 $48,411 $50,065 $18,235 $18,014 $20,515 $20,974 $21,514 $9,356 $10,592 $10,820 $11,377 $11,769 $11,520 $11,937 $13,267 $13,439 $14,209$3,140 $2,889 $2,729 $2,621 $2,573 Demand deposits Checking with interest Money market & savings Time deposits 3Q20 4Q20 1Q21 2Q21 3Q21 $0 $5,000 $10,000 $15,000 $20,000 $25,000 $30,000 $35,000 $40,000 $45,000 $50,000 $55,000 5.1% 28.4% 23.5% 43.0% 5.4% 27.8% 23.5% 43.3% 5.8% 28.0% 22.9% 43.3% 6.6% 27.5% 24.4% 41.5% Year to Date Annualized and Year over Year Growth Total Deposits 3Q21 vs. 3Q20: 7.7% Adjusted Deposits(1) 3Q21 vs. 3Q20: 7.6% Total Deposits 3Q21 vs. 3Q20: 18.5% Adjusted Deposits(1) 3Q21 vs. 3Q20: 15.4% 3Q21 vs. 3Q20 ▪ Increase of $2.7 billion, or by 7.7% on an annualized basis, driven by a $1.0 billion or 6.5% annualized increase in demand deposits. ▪ Excluding the net impact of estimated SBA-PPP deposits totaling $— billion, deposits acquired from Gwinnett of , and deposits sold as part of the Entegra branch divestiture of , total deposits grew by $2.7 billion, or by 7.6% on an annualized basis. Year to Date Annualized and Year over Year Growth Total Deposits 3Q21 vs. 2Q21: 13.6% Total Deposits 3Q21 vs. 2Q21: 7.7% Total Deposits 3Q21 vs. 3Q20: 18.5% Adjusted Deposits(1) 3Q21 vs. 3Q20: 15.4% 3Q21 vs. 2Q21 ▪ Deposits increased $1.7 billion, or by 20.4% on an annualized basis driven primarily by growth in demand deposits of $3.5 billion, money market accounts of $1.5 billion, checking with interest accounts of $1.2 billion, and savings accounts of $759 million, partially offset by a decrease in time deposits of $316 million. 7.4% \ 27.3% 22.1% 43.2% (1) Adjusted for SBA-PPP. (2) Acquired banks include Gwinnett. 7.4% 27.3% 22.1% 43.2% for mar20 ▪ Increase of $1,654 million, or by 7.7% on an annualized basis, driven primarily by a $392 million increase in checking with interest accounts and a $555 million increase in money market accounts. Quarter to Date Annualized and Year over Year Growth Total Deposits 3Q21 vs. 2Q21: 13.6% Total Deposits 3Q21 vs. 2Q21: 7.7% Total Deposits 3Q21 vs. 3Q20: 18.5% Adjusted Deposits(1) 3Q21 vs. 3Q20: 15.4% 3Q21 vs. 2Q21 ▪ Increase of $1.7 billion, or by 13.6% on an annualized basis, driven primarily by a $0.4 billion increase in checking with interest accounts. ▪ Since 2Q21, we have deposited approximately $1.2 billion for SBA-PPP loan fundings and $1.1 billion for stimulus checks into our customers accounts ▪ Increase was driven by increases in demand deposits of $1.0 billion, money market accounts of $555 million, checking with interest accounts of $949 million, and savings accounts of $387 million, partially offset by a decrease in time deposits of $156 million.


® Highlights 14 Funding Mix Change vs. 3Q21 2Q21 1Q21 4Q20 3Q20 2Q21 3Q20 Total deposits $ 50,065 96.4 % $ 48,411 96.2 % $ 47,331 96.1 % $ 43,432 95.8 % $ 42,251 95.6 % $ 1,654 $ 7,814 Securities sold under customer repurchase agreements 664 1.3 693 1.4 681 1.4 641 1.4 694 1.6 (29) (30) FHLB advances 646 1.2 647 1.3 649 1.3 655 1.5 655 1.5 (1) (9) Subordinated debt 497 1.0 497 1.0 497 1.0 505 1.1 504 1.1 — (7) Unsecured borrowings 76 0.1 80 0.1 84 0.2 88 0.2 93 0.2 (4) (17) Total deposits and borrowed funds $ 51,948 100.0 % $ 50,328 100.0 % $ 49,242 100.0 % $ 45,321 100.0 % $ 44,197 100.0 % $ 1,620 $ 7,751 0.13% 0.10% 0.08% 0.07% 0.07% 0.23% 0.18% 0.14% 0.13% 0.12% 0.32% 0.27% 0.23% 0.21% 0.20% Cost of Deposits Cost of Interest-Bearing Deposits Cost of Interest-Bearing Liabilities QTD 3Q20 QTD 4Q20 QTD 1Q21 QTD 2Q21 QTD 3Q21 0.00% 0.10% 0.20% 0.30% 0.40% 3Q21 vs. 2Q21 ▪ No noteworthy changes in funding mix or cost of interest bearing liabilities. 3Q21 vs. 3Q20 ▪ No noteworthy changes in funding mix. ▪ Cost of interest-bearing liabilities decreased 12 bps driven by maturing time deposits and a reduction in money market rates. ▪ Total cost of deposits decreased 6 bps due to the decline in cost of interest-bearing deposits. Summary ($ in millions) Cost of Funds


® Capital Ratios ▪ Capital levels remain strong and in excess of the capital conservation buffer. ▪ Year-to-date net income before preferred dividends of $424.2 million contributed to a 128 bps increase in risk-based capital ratios. ▪ The decline in the Tier 1 Leverage ratio due to sustained deposit growth is almost entirely offset by strong earnings. ▪ Tangible book value per share(3) growth of 10.3% since December 31, 2020, supported by strong earnings. Risk-Based Capital Tier 1 Total Tier 1 CET1 Leverage December 31, 2020 13.81 % 11.63 % 10.61 % 7.86 % Net income 1.28 1.28 1.28 0.86 Change in RWA or AA (2) (0.63) (0.54) (0.50) (1.00) Common dividends (0.04) (0.04) (0.04) (0.03) Preferred dividends (0.04) (0.04) (0.04) (0.03) Other (0.08) 0.03 0.03 0.02 September 30, 2021 14.30 % 12.32 % 11.34 % 7.68 % Change since Q4 2020 0.49 % 0.69 % 0.73 % (0.18) % 15 Highlights (1) Capital amounts and ratios for 3Q21 are preliminary. (2) RWA: risk-weighted assets. AA: average assets. RWA impacts total, tier 1, and CET1 risk-based capital ratios. AA impacts tier 1 leverage ratio. (3) This is a Non-GAAP measure. For a reconciliation of this measure to the most directly comparable GAAP measure, please see the Appendix. 10.43% 10.61% 11.00% 11.14% 11.34% 13.70% 13.81% 14.14% 14.15% 14.30% 11.48% 11.63% 12.02% 12.13% 12.32% CET1 Tier 1 Total 3Q20 4Q20 1Q21 2Q21 3Q21 0.00% 5.00% 10.00% 15.00% Trending Risk-Based Capital Ratios(1) Capital Ratio Rollforward (1) $380.43 $396.21 $405.59 $421.39 $432.07 $341.21 $357.35 $367.07 $383.19 $394.15 BVPS TBVPS 3Q20 4Q20 1Q21 2Q21 3Q21 $300 $325 $350 $375 $400 $425 $450 Book Value and Tangible Book Value Per Share (3)


® ▪ The first round of the SBA-PPP loan program provided loans totaling $3.2 billion to approximately 23,000 customers. • The interest rate for the first round was 1.00% and the repayment period was 24 months. • Total fees, net of origination expenses, were $110.7 million, equating to a weighted average fee of 3.65%. ▪ The second round of the SBA-PPP loan program provided loans totaling $1.2 billion to approximately 12,000 customers. • The interest rate for the second round was also 1.00% and the repayment period is 60 months. • Total fees, net of origination expenses, through September 2021 were $59.4 million, equating to a weighted average fee of 4.90%. • The second round fee income is based on the size of the loan and ranges from 1% to 5% of the originated loan balance for loans greater than $50,000. For loans less than $50,000, the fee is calculated as 50% of the originated loan balance or $2,500, whichever is less. Highlights Paycheck Protection Program 16 ▪ The first round of the SBA-PPP loan program provided loans totaling $3.2 billion to approximately 23,000 customers. The second round of the SBA-PPP loan program began in January 2021 and has provided loans totaling $1.1 billion to approximately 9,600 customers as of March 2021. ▪ The interest rate for both rounds was/is 1.00%, while the repayment period was 24 months for Round 1 loans and is 60 months for Round 2. ▪ Round 1 total fees, net of origination expenses, were $110.1 million, with a weighted average fee of 3.65% (fees on loans ranged from 1% - 5% depending on size). This fee is being recognized as part of interest income using the effective yield method over the contractual loan lives. ▪ Round 2 total fees, net of origination expenses, through March 2021 were $49.9 million, with a weighted average fee of 4.71%. Fee income is based on the size of the loan and ranges from 1% to 5% of the originated loan balance for loans greater than $500,000. For loans less than $500,000, the fee is calculated as 50% of the originated loan balance or $2,500, whichever is less. Financial Highlights ($ in thousands) Round 1 Round 2 Total Loan balance, net of fees $ 78,039 $ 1,008,878 $ 1,086,917 Origination fees $ 117,849 $ 60,072 $ 177,921 Origination costs 7,100 703 7,803 Total net fee income $ 110,749 $ 59,369 $ 170,118 Net fee income earned to date $ 110,637 $ 20,110 $ 130,747 Interest income earned to date 30,130 7,374 37,504 Interest and fee income earned to date $ 140,767 $ 27,484 $ 168,251 * Round 1 Round 2 Amount % Amount % Total funded $ 3,199,897 100.0 $ 1,223,797 100.0 Total forgiven 3,121,746 97.6 175,660 14.4 Total remaining (gross loan balance) $ 78,151 2.4 $ 1,048,137 85.6 Total Forgiveness Status ($ in thousands) * Year-to-date interest and fee income on SBA-PPP loans totaled $78.1 million. Round 1 & 2 Highlights


® Quarter-to-Date INCOME STATEMENT DATA September 30, June 30, March 31, December 31, September 30, In thousands 2021 2021 2021 2020 2020 Pre-Provision Net Revenue Income before income taxes $ 158,132 $ 198,568 $ 191,349 $ 174,705 $ 178,527 Less: Provision (credit) for credit losses (1,120) (19,603) (10,974) 5,403 4,042 Pre-provision net revenue $ 157,012 $ 178,965 $ 180,375 $ 180,108 $ 182,569 Other Income (non-core) Securities gains $ 8,082 $ 15,830 $ 9,207 $ 5,281 $ 21,425 Fair value adjustments on equity securities 3,350 11,654 16,011 18,934 (2,701) Loss on extinguishment of debt — — (17) — — Other income (non-core) $ 11,432 $ 27,484 $ 25,201 $ 24,215 $ 18,724 Other Expenses (non-core) Merger-related expense $ 7,013 $ 5,769 $ 6,819 $ 5,342 $ 3,507 Amortization of core deposit and other intangible assets 2,857 3,082 3,328 3,540 3,752 Other expenses (non-core) $ 9,870 $ 8,851 $ 10,147 $ 8,882 $ 7,259 Reconciliation of GAAP to Non-GAAP Measures 17


® Quarter-to-Date INCOME STATEMENT DATA September 30, June 30, March 31, December 31, September 30, In thousands 2021 2021 2021 2020 2020 Adjusted Noninterest Income Total noninterest income $ 122,944 $ 134,150 $ 136,649 $ 126,765 $ 120,572 Less: Securities gains 8,082 15,830 9,207 5,281 21,425 Less: Fair value adjustments on equity securities 3,350 11,654 16,011 18,934 (2,701) Less: Loss on extinguishment of debt — — (17) — — Adjusted noninterest income $ 111,512 $ 106,666 $ 111,448 $ 102,550 $ 101,848 Adjusted Noninterest Expense Total noninterest expense $ 312,819 $ 301,578 $ 295,926 $ 305,373 $ 291,662 Less: Merger-related expense 7,013 5,769 6,819 5,342 3,507 Less: Amortization of core deposit and other intangible assets 2,857 3,082 3,328 3,540 3,752 Adjusted noninterest expense $ 302,949 $ 292,727 $ 285,779 $ 296,491 $ 284,403 Efficiency Ratio Adjusted noninterest expense (numerator) $ 302,949 $ 292,727 $ 285,779 $ 296,491 $ 284,403 Net interest income 346,886 346,393 339,652 358,716 353,659 Adjusted noninterest income 111,512 106,666 111,448 102,550 101,848 Net revenue (denominator) $ 458,398 $ 453,059 $ 451,100 $ 461,266 $ 455,507 Efficiency ratio 66.09 % 64.61 % 63.35 % 64.28 % 62.44 % Reconciliation of GAAP to Non-GAAP Measures 18


® BALANCE SHEET DATA September 30, June 30, March 31, December 31, September 30, In millions 2021 2021 2021 2020 2020 SBA-PPP Impact on Loans and Deposits Total loans $ 32,516 $ 32,690 $ 33,181 $ 32,792 $ 32,845 Less: SBA-PPP loans 1,087 1,698 2,770 2,406 3,113 Loans excluding SBA-PPP $ 31,429 $ 30,992 $ 30,411 $ 30,386 $ 29,732 Average loans $ 32,608 $ 33,042 $ 32,970 $ 32,854 $ 32,578 Less: Average SBA-PPP loans 1,403 2,323 2,645 2,842 3,097 Average loans excluding SBA-PPP $ 31,205 $ 30,719 $ 30,325 $ 30,012 $ 29,481 Allowance for Credit Loss Ratios Allowance Ratio Total allowance for credit losses $ 183 $ 189 $ 211 $ 224 $ 224 Total loan balance excluding SBA-PPP 31,429 30,992 30,411 30,386 29,732 Allowance ratio excluding SBA-PPP 0.58 % 0.61 % 0.69 % 0.74 % 0.75 % Non-PCD allowance for credit losses $ 165 $ 170 $ 188 $ 200 $ 199 Non-PCD loan balance excluding SBA-PPP 31,056 30,595 29,978 29,923 29,236 Non-PCD allowance ratio excluding SBA-PPP 0.53 % 0.56 % 0.63 % 0.67 % 0.68 % Nonperforming Assets Ratio Nonperforming assets $ 204 $ 231 $ 243 $ 242 $ 239 Loan balance excluding SBA-PPP 31,429 30,992 30,411 30,386 29,732 Other real estate owned (OREO) 41 44 49 50 53 Loan balance excluding SBA-PPP & OREO (denominator) 31,470 31,036 30,460 30,436 29,785 Non-Performing assets ratio excluding SBA-PPP 0.65 % 0.74 % 0.80 % 0.80 % 0.80 % Net Charge-Off Ratio Net charge-offs $ 5 $ 2 $ 3 $ 5 $ 3 Average loan balance excluding SBA-PPP 31,205 30,719 30,325 30,012 29,481 Net charge-off ratio excluding SBA-PPP 0.06 % 0.03 % 0.04 % 0.07 % 0.03 % Reconciliation of GAAP to Non-GAAP Measures 19


® BALANCE SHEET DATA September 30, June 30, March 31, December 31, September 30, In millions 2021 2021 2021 2020 2020 Common Equity and Tangible Common Equity Shareholders' equity $ 4,581 $ 4,476 $ 4,322 $ 4,229 $ 4,074 Preferred stock (340) (340) (340) (340) (340) Common equity 4,241 4,136 3,982 3,889 3,734 Less: Goodwill (350) (350) (350) (350) (350) Less: Core deposit and other intangible assets (22) (25) (28) (31) (35) Total tangible common equity $ 3,869 $ 3,761 $ 3,604 $ 3,508 $ 3,349 Return on Average Tangible Common Shareholder's Equity Net income available to common shareholders $ 119,436 $ 148,152 $ 142,680 $ 133,448 $ 138,048 Average shareholders' equity $ 4,536,592 $ 4,398,173 $ 4,275,204 $ 4,126,095 $ 4,019,075 Less: Average preferred stock 339,937 339,937 339,937 339,937 339,937 Average common shareholders' equity 4,196,655 4,058,236 3,935,267 3,786,158 3,679,138 Less: Average goodwill 350,298 350,298 350,298 350,298 350,298 Less: Average core deposit and other intangible assets 23,419 26,493 29,820 33,043 36,877 Average tangible common shareholders' equity $ 3,822,939 $ 3,681,445 $ 3,555,149 $ 3,402,817 $ 3,291,963 Return on average tangible common shareholders' equity 12.39 % 16.14 % 16.28 % 15.60 % 16.68 % Reconciliation of GAAP to Non-GAAP Measures 20


® PER SHARE DATA September 30, June 30, March 31, December 31, September 30, In thousands (excl. per share data) 2021 2021 2021 2020 2020 Book Value Per Share Total shareholders' equity $ 4,581,295 $ 4,476,490 $ 4,321,400 $ 4,229,268 $ 4,074,415 Less: Preferred stock (339,937) (339,937) (339,937) (339,937) (339,937) Total common equity $ 4,241,358 $ 4,136,553 $ 3,981,463 $ 3,889,331 $ 3,734,478 Divided by: Shares outstanding 9,816,405 9,816,405 9,816,405 9,816,405 9,816,405 Book value per share $ 432.07 $ 421.39 $ 405.59 $ 396.21 $ 380.43 Tangible Book Value Per Share Total shareholders' equity $ 4,581,295 $ 4,476,490 $ 4,321,400 $ 4,229,268 $ 4,074,415 Less: Preferred stock (339,937) (339,937) (339,937) (339,937) (339,937) Less: Goodwill (350,298) (350,298) (350,298) (350,298) (350,298) Less: CDI and other intangibles (21,879) (24,737) (27,819) (31,147) (34,687) Tangible equity $ 3,869,181 $ 3,761,518 $ 3,603,346 $ 3,507,886 $ 3,349,493 Divided by: Shares outstanding 9,816,405 9,816,405 9,816,405 9,816,405 9,816,405 Tangible book value per share $ 394.15 $ 383.19 $ 367.07 $ 357.35 $ 341.21 Reconciliation of GAAP to Non-GAAP Measures 21