Freeport-McMoRan
Reports Second-Quarter and Six-Month 2021 Results
•Strong financial results and cash flow generation
•Ramp-up of Grasberg underground mines advancing on schedule
•Favorable operational and market outlook
•Achieved balance sheet targets - positioned for increasing cash returns to shareholders and advancement of long-term organic growth in accordance with previously announced financial policy
▪Net income attributable to common stock in second-quarter 2021 totaled $1.08 billion, $0.73 per share, and adjusted net income attributable to common stock totaled $1.14 billion, or $0.77 per share, after adjusting for net charges totaling $56 million, $0.04 per share.
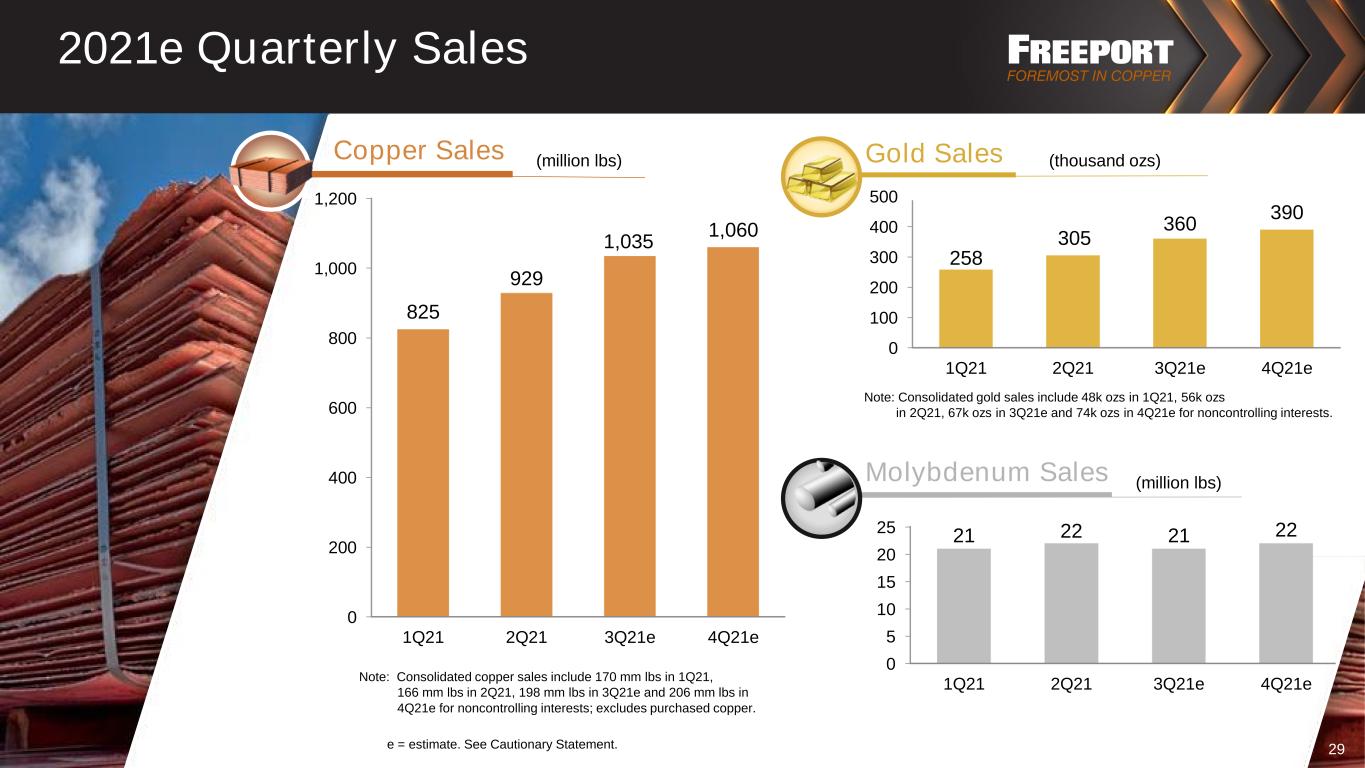
▪Consolidated sales totaled 929 million pounds of copper, 305 thousand ounces of gold and 22 million pounds of molybdenum in second-quarter 2021. Consolidated sales for the year 2021 are expected to approximate 3.85 billion pounds of copper, 1.3 million ounces of gold and 86 million pounds of molybdenum, including 1.035 billion pounds of copper, 360 thousand ounces of gold and 21 million pounds of molybdenum in third-quarter 2021.
▪Average realized prices in second-quarter 2021 were $4.34 per pound for copper, $1,794 per ounce for gold and $13.11 per pound for molybdenum.
▪Average unit net cash costs in second-quarter 2021 were $1.48 per pound of copper (including nonrecurring labor-related charges at Cerro Verde of $0.07 per pound of copper) and are expected to average $1.35 per pound of copper for the year 2021.
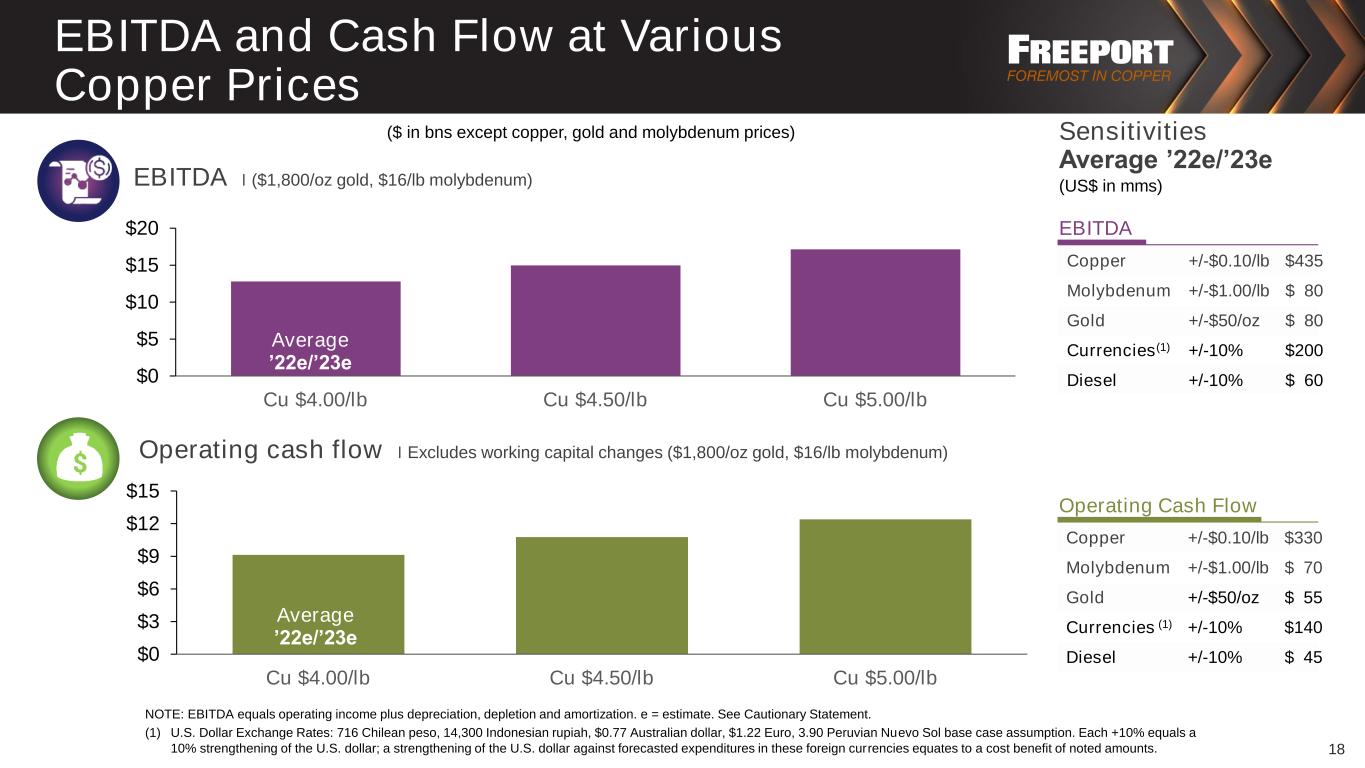
▪Operating cash flows totaled $2.4 billion (including $0.5 billion of working capital and other sources) in second-quarter 2021 and $3.5 billion (including $0.2 billion of working capital and other sources) for the first six months of 2021. Based on current sales volume and cost estimates, and assuming average prices of $4.25 per pound for copper, $1,800 per ounce for gold and $16.00 per pound for molybdenum for the second half of 2021, operating cash flows are expected to approximate $7.5 billion (including $0.4 billion of working capital and other sources) for the year 2021.
▪Capital expenditures totaled $0.4 billion (including approximately $0.3 billion for major projects) in second-quarter 2021 and $0.8 billion (including approximately $0.6 billion for major projects) for the first six months of 2021. Capital expenditures for the year 2021, excluding Indonesia smelter expenditures, are expected to approximate $2.2 billion, including $1.4 billion for major projects primarily associated with underground development activities in the Grasberg minerals district in Indonesia.
▪At June 30, 2021, consolidated debt totaled $9.7 billion and consolidated cash and cash equivalents totaled $6.3 billion, resulting in net debt of $3.4 billion (refer to the supplemental schedule, "Net Debt," on page IX). FCX had no borrowings and $3.5 billion available under its revolving credit facility at June 30, 2021.
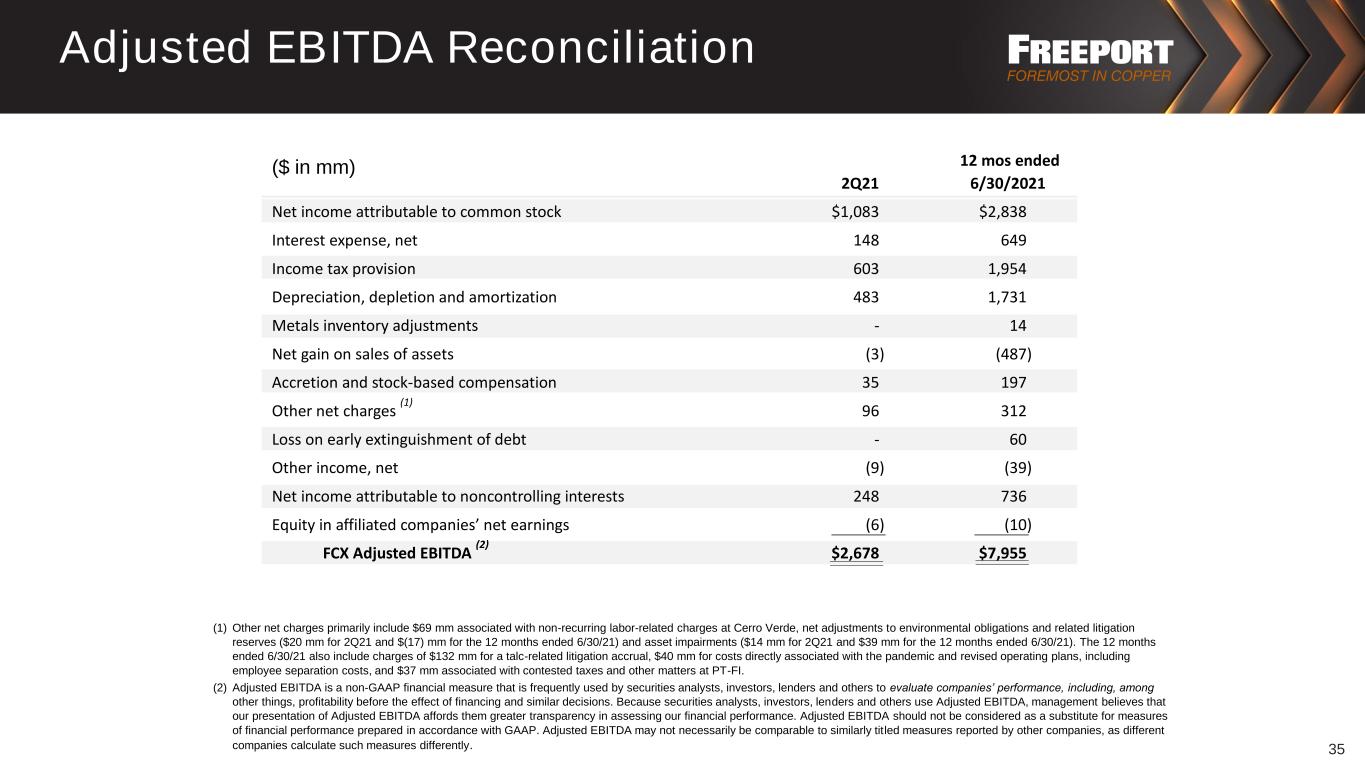
PHOENIX, AZ, July 22, 2021 - Freeport-McMoRan Inc. (NYSE: FCX) reported second-quarter 2021 net income attributable to common stock of $1.08 billion, $0.73 per share, and adjusted net income attributable to common stock of $1.14 billion, $0.77 per share, after adjusting for net charges totaling $56 million, $0.04 per share, primarily associated with nonrecurring labor-related charges at Cerro Verde and for historical contested taxes and other matters at PT Freeport Indonesia (PT-FI). For additional information, refer to the supplemental schedule, "Adjusted Net Income (Loss)," on page VII.
Richard C. Adkerson, Chairman and Chief Executive Officer, said, "Our global team continues to execute our operating plans safely, efficiently and responsibly, providing strong cash flows and a solid foundation for future profitability and growth. During the first half of 2021, we reduced our net debt by $2.7 billion and achieved our targeted net debt level, positioning us for increasing cash returns to shareholders and investments in future growth in accordance with our financial policy. As a leading responsible producer of copper, we are optimistic about the prospects for our business and our role in supporting a growing global economy and the transition to clean energy. We remain focused on building value for all stakeholders through solid management of our long-lived and high-quality portfolio of copper assets."
SUMMARY FINANCIAL DATA
| | | | | | | | | | | | | | | | | | | | | | | | | | |
| Three Months Ended June 30, | | Six Months Ended
June 30, | |
| 2021 | | 2020 | | 2021 | | 2020 | |
| (in millions, except per share amounts) | |
Revenuesa,b | $ | 5,748 | | | $ | 3,054 | | | $ | 10,598 | | | $ | 5,852 | | |
Operating income (loss)a | $ | 2,067 | | | $ | 321 | | | $ | 3,599 | | | $ | (152) | | |
| | | | | | | | |
| | | | | | | | |
Net income (loss) attributable to common stockc,d | $ | 1,083 | | | $ | 53 | | | $ | 1,801 | | | $ | (438) | | |
Diluted net income (loss) per share of common stock | $ | 0.73 | | | $ | 0.03 | | | $ | 1.21 | | | $ | (0.30) | | |
|
Diluted weighted-average common shares outstanding | 1,483 | | | 1,458 | | | 1,480 | | | 1,453 | | |
Operating cash flowse | $ | 2,395 | | | $ | 491 | | | $ | 3,470 | | | $ | 453 | | |
| Capital expenditures | $ | 433 | | | $ | 527 | | | $ | 803 | | | $ | 1,137 | | |
| At June 30: | | | | | | | | |
Cash and cash equivalents | $ | 6,313 | | | $ | 1,465 | | | $ | 6,313 | | | $ | 1,465 | | |
| Total debt, including current portion | $ | 9,695 | | | $ | 9,914 | | | $ | 9,695 | | | $ | 9,914 | | |
| | | | | | | | |
| | | | | | | | |
| | | | | | | | |
| | | | | | | | |
| | | | | | | | |
| | | | | | | | |
| | | | | | | | |
| | | | | | | | |
| | | | | | | | |
| | | | | | | | |
| | | | | | | | |
| | | | | | | | |
| | | | | | | | |
| | | | | | | | |
| | | | | | | | |
| | | | | | | | |
| | | | | | | | |
a.For segment financial results, refer to the supplemental schedules, "Business Segments," beginning on page X.
b.Includes favorable (unfavorable) adjustments to prior period provisionally priced concentrate and cathode copper sales totaling $173 million ($66 million to net income attributable to common stock or $0.05 per share) in second-quarter 2021, $55 million ($19 million to net income attributable to common stock or $0.01 per share) in second-quarter 2020, $169 million ($65 million to net income attributable to common stock or $0.04 per share) for the first six months of 2021 and $(102) million ($(43) million to net loss attributable to common stock or $(0.03) per share) for the first six months of 2020. For further discussion, refer to the supplemental schedule, "Derivative Instruments," on page IX.
c.Includes net (charges) credits totaling $(56) million ($(0.04) per share) in second-quarter 2021, $9 million ($0.01 per share) in second-quarter 2020, $(94) million ($(0.06) per share) for the first six months of 2021 and $(247) million ($(0.17) per share) for the first six months of 2020 that are described in the supplemental schedule, "Adjusted Net Income (Loss)," on page VII.
d.FCX defers recognizing profits on intercompany sales until final sales to third parties occur. For a summary of net impacts from changes in these deferrals, refer to the supplemental schedule, "Deferred Profits," on page X.
e.Working capital and other sources totaled $523 million in second-quarter 2021, $22 million in second-quarter 2020, $187 million for the first six months of 2021 and $141 million for the first six months of 2020.
SUMMARY OPERATING DATA
| | | | | | | | | | | | | | | | | | | | | | | | | | | | | |
| | Three Months Ended June 30, | | Six Months Ended
June 30, | |
| | 2021 | | 2020 | | 2021 | | 2020 | |
Copper (millions of recoverable pounds) | | | | | | | | | |
| Production | | 913 | | | 767 | | | 1,823 | | | 1,498 | | |
| Sales, excluding purchases | | 929 | | | 759 | | | 1,754 | | | 1,488 | | |
| Average realized price per pound | | $ | 4.34 | | | $ | 2.55 | | a | $ | 4.25 | | | $ | 2.53 | | a |
Site production and delivery costs per poundb | | $ | 2.02 | | c | $ | 1.82 | | d | $ | 1.94 | | c | $ | 2.00 | | d |
Unit net cash costs per poundb | | $ | 1.48 | | | $ | 1.47 | | | $ | 1.44 | | | $ | 1.68 | | |
Gold (thousands of recoverable ounces) | | | | | | | | | |
| Production | | 305 | | | 191 | | | 602 | | | 347 | | |
| Sales | | 305 | | | 184 | | | 563 | | | 328 | | |
| Average realized price per ounce | | $ | 1,794 | | | $ | 1,749 | | | $ | 1,785 | | | $ | 1,709 | | |
Molybdenum (millions of recoverable pounds) | | | | | | | | | |
| Production | | 20 | | | 19 | | | 40 | | | 38 | | |
| Sales, excluding purchases | | 22 | | | 18 | | | 43 | | | 39 | | |
| Average realized price per pound | | $ | 13.11 | | | $ | 10.53 | | | $ | 12.38 | | | $ | 10.84 | | |
a.Includes reductions to average realized prices of $0.03 per pound of copper in second-quarter 2020 and $0.02 per pound of copper for the first six months of 2020 related to forward sales contracts covering 150 million pounds of copper sales for May and June 2020 at a fixed price of $2.34 per pound. There are no remaining forward sales contracts.
b.Reflects per pound weighted-average production and delivery costs and unit net cash costs (net of by-product credits) for all copper mines, before net noncash and other costs. For reconciliations of per pound unit costs by operating division to production and delivery costs applicable to sales reported in FCX's consolidated financial statements, refer to the supplemental schedules, "Product Revenues and Production Costs," beginning on page XIII.
c.Includes $0.07 per pound of copper in second-quarter 2021 and $0.04 per pound of copper for the first six months of 2021 associated with nonrecurring labor-related charges at Cerro Verde for agreements reached with 57 percent of its hourly employees. Refer to the supplemental schedule, "Adjusted Net Income (Loss)," on page VII.
d.Excludes charges totaling $0.20 per pound of copper in second-quarter 2020 and $0.12 per pound of copper for the first six months of 2020, primarily associated with idle facility and contract cancellations costs related to the COVID-19 pandemic and employee separation costs associated with the April 2020 revised operating plans. Refer to the supplemental schedule, "Adjusted Net Income (Loss)," on page VII.
Responsible Production
2020 Annual Report on Sustainability. In April 2021, FCX published its 2020 Annual Report on Sustainability, which is available on FCX's website at fcx.com. FCX has a long history of environmental, social and governance (ESG) programs and is continuously striving to improve and respond to evolving stakeholder expectations. This report marked FCX’s 20th year of reporting on its sustainability progress and FCX’s first year reporting in alignment with the Sustainability Accounting Standards Board Metals & Mining framework. FCX is committed to building upon its achievements in sustainability and seeks to contribute positively to society by supplying the world with responsibly produced copper.
The Copper Mark. In June 2021, FCX commenced the Copper Mark assessment process at five additional operating sites, including Bagdad, Chino, Tyrone, Safford and Sierrita. Each of these sites will complete an external assurance process to assess conformance with the Copper Mark’s 32 ESG requirements, with a goal of being awarded the Copper Mark. The Copper Mark is a robust assurance framework that demonstrates the copper industry's responsible production practices and contribution to the United Nations Sustainable Development Goals. To date, FCX has six sites that have achieved the Copper Mark (the Morenci operations, Miami smelter and mine, and El Paso refinery in North America; Cerro Verde and El Abra mines in South America; and Atlantic Copper smelter and refinery in Spain). FCX has future plans to validate all of its copper producing sites with the Copper Mark requirements.
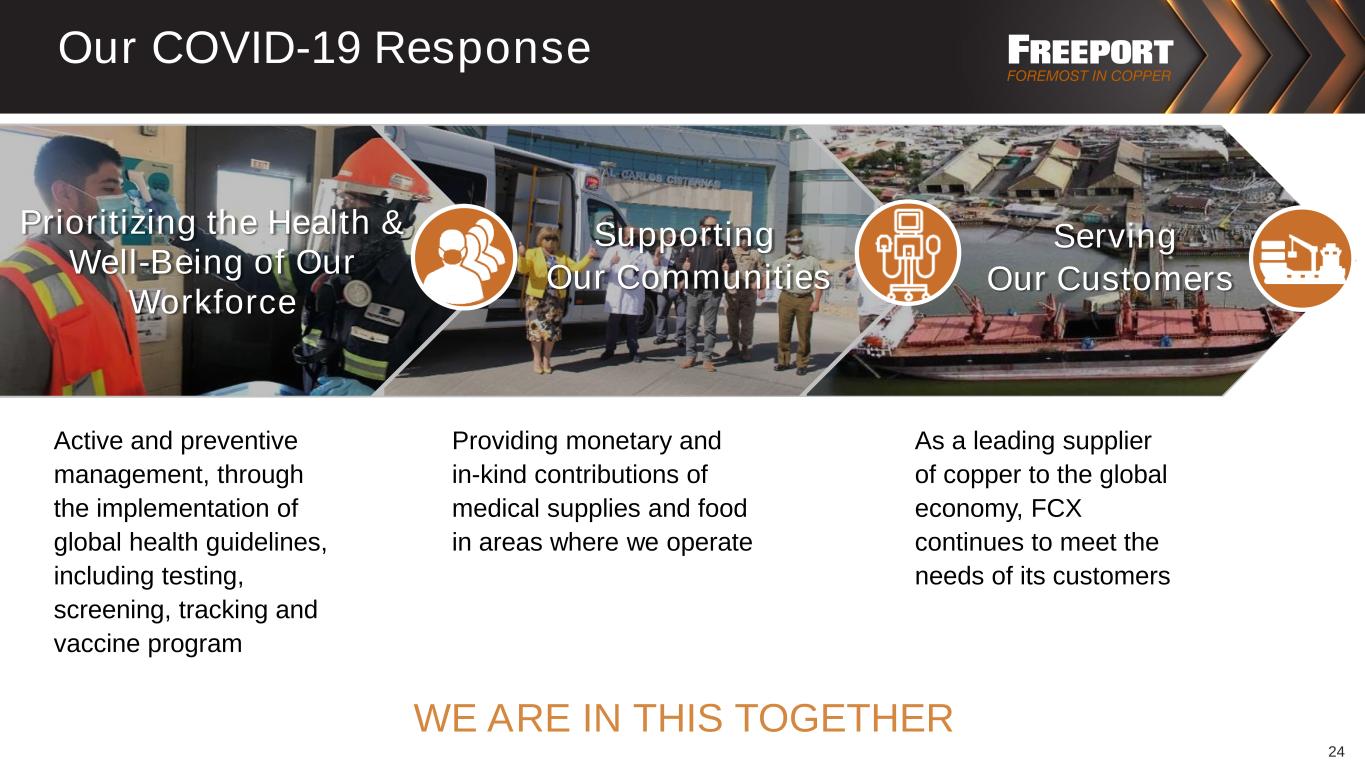
Ongoing COVID-19 Management. FCX continues its vigilant operating protocols at each of its operating sites to contain and mitigate the risk of spread of COVID-19. FCX’s protocols have been effective in mitigating and preventing a major outbreak of COVID-19 at its operating sites. FCX is continuing to monitor, assess and update its COVID-19 related response and is providing assistance to employees in obtaining vaccinations.
Consolidated Sales Volumes
Second-quarter 2021 copper sales of 929 million pounds and gold sales of 305 thousand ounces were approximately 5 percent and 8 percent lower, respectively, than the April 2021 estimates of 975 million pounds of copper and 330 thousand ounces of gold, primarily reflecting the timing of shipments from Indonesia.
Second-quarter 2021 copper sales were 22 percent higher and gold sales were 66 percent higher than second-quarter 2020 sales of 759 million pounds of copper and 184 thousand ounces of gold, primarily reflecting continued progress of the ramp-up of underground mining at PT-FI and increased operating rates at Cerro Verde.
Second-quarter 2021 molybdenum sales of 22 million pounds approximated the April 2021 estimate. Second-quarter 2021 molybdenum sales were higher than second-quarter 2020 sales of 18 million pounds of molybdenum, primarily reflecting increased demand and timing of shipments.
Consolidated sales volumes for the year 2021 are expected to approximate 3.85 billion pounds of copper, 1.3 million ounces of gold and 86 million pounds of molybdenum, including 1.035 billion pounds of copper, 360 thousand ounces of gold and 21 million pounds of molybdenum in third-quarter 2021. Projected sales volumes are dependent on operational performance, continued progress of the ramp-up of underground mining at PT-FI, impacts and duration of the COVID-19 pandemic, weather-related conditions, timing of shipments, and other factors.
Consolidated Unit Net Cash Costs
Consolidated average unit net cash costs (net of by-product credits) for FCX's copper mines of $1.48 per pound of copper in second-quarter 2021, were higher than the April 2021 estimate of $1.42 per pound, primarily because of nonrecurring labor-related charges at Cerro Verde ($0.07 per pound of copper) for agreements reached with 57 percent of its hourly employees (including early agreement of a new four-year collective labor agreement (CLA) with one of its three unions). Consolidated average unit net cash costs in second-quarter 2021 approximated the second-quarter 2020 average of $1.47 per pound.
Assuming average prices of $1,800 per ounce of gold and $16.00 per pound of molybdenum for the second half of 2021 and achievement of current sales volume and cost estimates, consolidated unit net cash costs (net of by-product credits) for FCX's copper mines are expected to average $1.35 per pound of copper for the year 2021. The impact of price changes during the second half of 2021 on consolidated unit net cash costs for the year 2021 would approximate $0.02 per pound of copper for each $100 per ounce change in the average price of gold and $0.01 per pound of copper for each $2 per pound change in the average price of molybdenum. Quarterly unit net cash costs vary with fluctuations in sales volumes and realized prices, primarily for gold and molybdenum.
MINING OPERATIONS
North America Copper Mines. FCX operates seven open-pit copper mines in North America - Morenci, Bagdad, Safford (including Lone Star), Sierrita and Miami in Arizona, and Chino and Tyrone in New Mexico. In addition to copper, certain of these mines produce molybdenum concentrate, gold and silver. All of the North America mining operations are wholly owned, except for Morenci. FCX records its 72 percent undivided joint venture interest in Morenci using the proportionate consolidation method.
Operating and Development Activities. FCX’s North America operating sites continue to achieve strong execution of operating plans. FCX successfully completed the initial development of the Lone Star copper leach project in the second half of 2020 and achieved design capacity approximating 200 million pounds annually. Current operations are exceeding the initial design. FCX continues to advance opportunities to increase Lone Star operating rates and is evaluating a potential additional incremental oxide expansion to increase volumes to over 300 million pounds of copper per year. The oxide project advances the opportunity for development of the large-scale sulfide resources at Lone Star.
FCX has substantial resources in the United States (U.S.), primarily associated with existing mining operations. Evaluation of project options for future growth are under way. In addition to Lone Star, FCX is actively advancing studies to add new capacity at its long-lived Bagdad operation in northwest Arizona.
Operating Data. Following is summary consolidated operating data for the North America copper mines:
| | | | | | | | | | | | | | | | | | | | | | | | | | | | | |
| | Three Months Ended June 30, | | Six Months Ended
June 30, | |
| | 2021 | | 2020 | | 2021 | | 2020 | |
Copper (millions of recoverable pounds) | | | | | | | | | |
Production | | 360 | | | 368 | | | 713 | | | 714 | | |
Sales, excluding purchases | | 389 | | | 368 | | | 697 | | | 723 | | |
Average realized price per pound | | $ | 4.42 | |
| $ | 2.42 | | a | $ | 4.19 | | | $ | 2.50 | | a |
| | | | | | | | | |
Molybdenum (millions of recoverable pounds) | | | | | | | | | |
Productionb | | 9 | | | 9 | | | 17 | | | 17 | | |
| | | | | | | | | |
Unit net cash costs per pound of copperc | | | | | | | | | |
Site production and delivery, excluding adjustments | | $ | 2.14 | | | $ | 1.85 | | d | $ | 2.09 | | | $ | 2.00 | | d |
By-product credits | | (0.25) | | | (0.17) | | | (0.27) | | | (0.19) | | |
Treatment charges | | 0.08 | | | 0.10 | | | 0.09 | | | 0.10 | | |
Unit net cash costs | | $ | 1.97 | | | $ | 1.78 | | | $ | 1.91 | | | $ | 1.91 | | |
| | | | | | | | | |
a.Includes reductions to average realized prices of $0.06 per pound of copper in second-quarter 2020 and $0.03 per pound of copper for the first six months of 2020 related to forward sales contracts covering 150 million pounds of copper sales for May and June 2020 at a fixed price of $2.34 per pound. There are no remaining forward sales contracts.
b.Refer to summary operating data on page 3 for FCX's consolidated molybdenum sales, which includes sales of molybdenum produced at the North America copper mines.
c.For a reconciliation of unit net cash costs per pound to production and delivery costs applicable to sales reported in FCX's consolidated financial statements, refer to the supplemental schedules, "Product Revenues and Production Costs," beginning on page XIII.
d.Excludes charges totaling $0.06 per pound of copper in second-quarter 2020 and $0.03 per pound of copper for the first six months of 2020, primarily associated with idle facility and contract cancellations costs related to the COVID-19 pandemic and employee separation costs associated with the April 2020 revised operating plans.
FCX's consolidated copper sales volumes from North America of 389 million pounds in second-quarter 2021 were higher than second-quarter 2020 copper sales volumes of 368 million pounds, primarily reflecting timing of shipments. North America copper sales are estimated to approximate 1.47 billion pounds for the year 2021, compared with 1.4 billion pounds for the year 2020.
Average unit net cash costs (net of by-product credits) for the North America copper mines of $1.97 per pound of copper in second-quarter 2021 were higher than second-quarter 2020 unit net cash costs of $1.78 per pound, primarily reflecting costs associated with higher mining and milling rates and higher maintenance and input costs, partly offset by higher by-product credits.
Average unit net cash costs (net of by-product credits) for the North America copper mines are expected to approximate $1.91 per pound of copper for the year 2021, based on achievement of current sales volume and cost estimates and assuming an average molybdenum price of $16.00 per pound for the second half of 2021. North America's average unit net cash costs for the year 2021 would change by approximately $0.02 per pound for each $2 per pound change in the average price of molybdenum for the second half of 2021.
South America Mining. FCX operates two copper mines in South America - Cerro Verde in Peru (in which FCX owns a 53.56 percent interest) and El Abra in Chile (in which FCX owns a 51 percent interest). These operations are consolidated in FCX's financial statements. In addition to copper, the Cerro Verde mine produces molybdenum concentrate and silver.
Operating and Development Activities. During second-quarter 2021, milling rates at Cerro Verde's concentrator facilities were slightly above forecast and averaged 374,100 metric tons of ore per day. Cerro Verde expects milling rates to return to pre-COVID-19 pandemic levels of approximately 400,000 metric tons of ore per day in 2022.
El Abra is implementing plans to increase operating rates to pre-COVID-19 pandemic levels, subject to ongoing monitoring of public health conditions in Chile. Stacking rates at El Abra averaged 94,200 metric tons per
day in second-quarter 2021, approximately 25 percent higher than second-quarter 2020. Increased stacking rates are expected to result in incremental annual production of approximately 70 million pounds of copper beginning in mid-2022, compared with 2020 levels. A new leach pad is under construction to accommodate planned stacking rates for the next several years.
FCX continues to evaluate a large-scale expansion at El Abra to process additional sulfide material and to achieve higher copper recoveries. El Abra's large sulfide resource could potentially support a major mill project similar to facilities constructed at Cerro Verde in 2015. Technical and economic studies continue to be evaluated to determine the optimal scope and timing for the sulfide project. FCX is monitoring potential changes in government fiscal matters in Chile and will defer major investment decisions pending clarity on these matters.
Operating Data. Following is summary consolidated operating data for South America mining:
| | | | | | | | | | | | | | | | | | | | | | | | | | | | | |
| | Three Months Ended | | Six Months Ended | |
| | Three Months Ended June 30, | | Six Months Ended
June 30, | |
| | 2021 | | 2020 | | 2021 | | 2020 | |
Copper (millions of recoverable pounds) | | | | | | | | | |
Production | | 245 | | | 218 | | | 504 | | | 463 | | |
Sales | | 230 | | | 219 | | | 489 | | | 466 | | |
Average realized price per pound | | $ | 4.31 | | | $ | 2.67 | | | $ | 4.28 | | | $ | 2.57 | | |
| | | | | | | | | |
| | | | | | | | | |
| | | | | | | | | |
| | | | | | | | | |
| | | | | | | | | |
| | | | | | | | | |
Molybdenum (millions of recoverable pounds) | | | | | | | | | |
Productiona | | 4 | | | 4 | | | 9 | | | 8 | | |
| | | | | | | | | |
Unit net cash costs per pound of copperb | | | | | | | | | |
Site production and delivery, excluding adjustments | | $ | 2.48 | | c | $ | 1.64 | | d | $ | 2.23 | | c | $ | 1.84 | | d |
By-product credits | | (0.31) | | | (0.11) | | | (0.26) | | | (0.14) | | |
Treatment charges | | 0.13 | | | 0.15 | | | 0.13 | | | 0.15 | | |
Royalty on metals | | 0.01 | | | — | | | 0.01 | | | — | | |
Unit net cash costs | | $ | 2.31 | | | $ | 1.68 | | | $ | 2.11 | | | $ | 1.85 | | |
| | | | | | | | | |
a.Refer to summary operating data on page 3 for FCX's consolidated molybdenum sales, which includes sales of molybdenum produced at Cerro Verde.
b.For a reconciliation of unit net cash costs per pound to production and delivery costs applicable to sales reported in FCX's consolidated financial statements, refer to the supplemental schedules, "Product Revenues and Production Costs," beginning on page XIII.
c.Includes $0.30 per pound of copper in second-quarter 2021 and $0.14 per pound of copper for the first six months of 2021 associated with nonrecurring labor-related charges at Cerro Verde for agreements reached with 57 percent of its hourly employees. Refer to the supplemental schedule, "Adjusted Net Income (Loss)," on page VII.
d.Excludes charges totaling $0.30 per pound of copper in second-quarter 2020 and $0.18 per pound of copper for the first six months of 2020, primarily associated with idle facility (Cerro Verde) and contract cancellation costs related to the COVID-19 pandemic, and employee separation costs associated with the April 2020 revised operating plans.
FCX's consolidated copper sales volumes from South America of 230 million pounds in second-quarter 2021 were higher than second-quarter 2020 copper sales volumes of 219 million pounds, primarily reflecting higher milling rates at Cerro Verde, partly offset by timing of shipments.
Copper sales from South America mining are expected to approximate 1.05 billion pounds for the year 2021, slightly higher than the year 2020.
Average unit net cash costs (net of by-product credits) for South America mining of $2.31 per pound of copper in second-quarter 2021 were higher than second-quarter 2020 unit net cash costs of $1.68 per pound, primarily reflecting increased mining and milling activities at Cerro Verde, partly offset by higher volumes. Second-quarter 2021 also includes nonrecurring labor-related charges at Cerro Verde ($0.30 per pound of copper) for agreements reached with 57 percent of its hourly employees (including early agreement of a new four-year CLA with one of its three unions). Negotiations for new CLAs for Cerro Verde's remaining hourly employees are still ongoing. The current CLA is scheduled to expire on August 31, 2021.
Average unit net cash costs (net of by-product credits) for South America mining are expected to approximate $2.02 per pound of copper for the year 2021, based on current sales volume and cost estimates and assuming an average price of $16.00 per pound of molybdenum for the second half of 2021.
Indonesia Mining. PT-FI operates one of the world’s largest copper and gold mines at the Grasberg minerals district in Papua, Indonesia. PT-FI produces copper concentrate that contains significant quantities of gold and silver. FCX has a 48.76 percent ownership interest in PT-FI and manages its mining operations. Under the terms of the shareholders agreement, FCX’s economic interest in PT-FI approximates 81 percent through 2022. PT-FI's results are consolidated in FCX's financial statements.
PT-FI continues to operate with protocols designed to protect the health and safety of its workforce during the COVID-19 pandemic. During second-quarter 2021, PT-FI began to administer vaccines to its workforce and expects this program to accelerate through the second half of 2021. Following an increase in COVID-19 cases in Indonesia, PT-FI has recently reinstituted heightened protocols and travel restrictions to protect the health of its workforce and the surrounding community.
Operating and Development Activities. The ramp-up of underground production at the Grasberg minerals district in Indonesia continues to advance on schedule. Second-quarter 2021 highlights include:
•Production approximated 78 percent of the projected ultimate annualized level and is expected to reach 100 percent by year-end 2021.
•A total of 41 new drawbells were constructed at the Grasberg Block Cave and Deep Mill Level Zone (DMLZ) underground mines, bringing cumulative open drawbells to over 460.
•Combined average production from the Grasberg Block Cave and DMLZ underground mines approximated 118,300 metric tons of ore per day. During second-quarter 2021, Grasberg Block Cave achieved a daily record of 107,000 metric tons of ore per day.
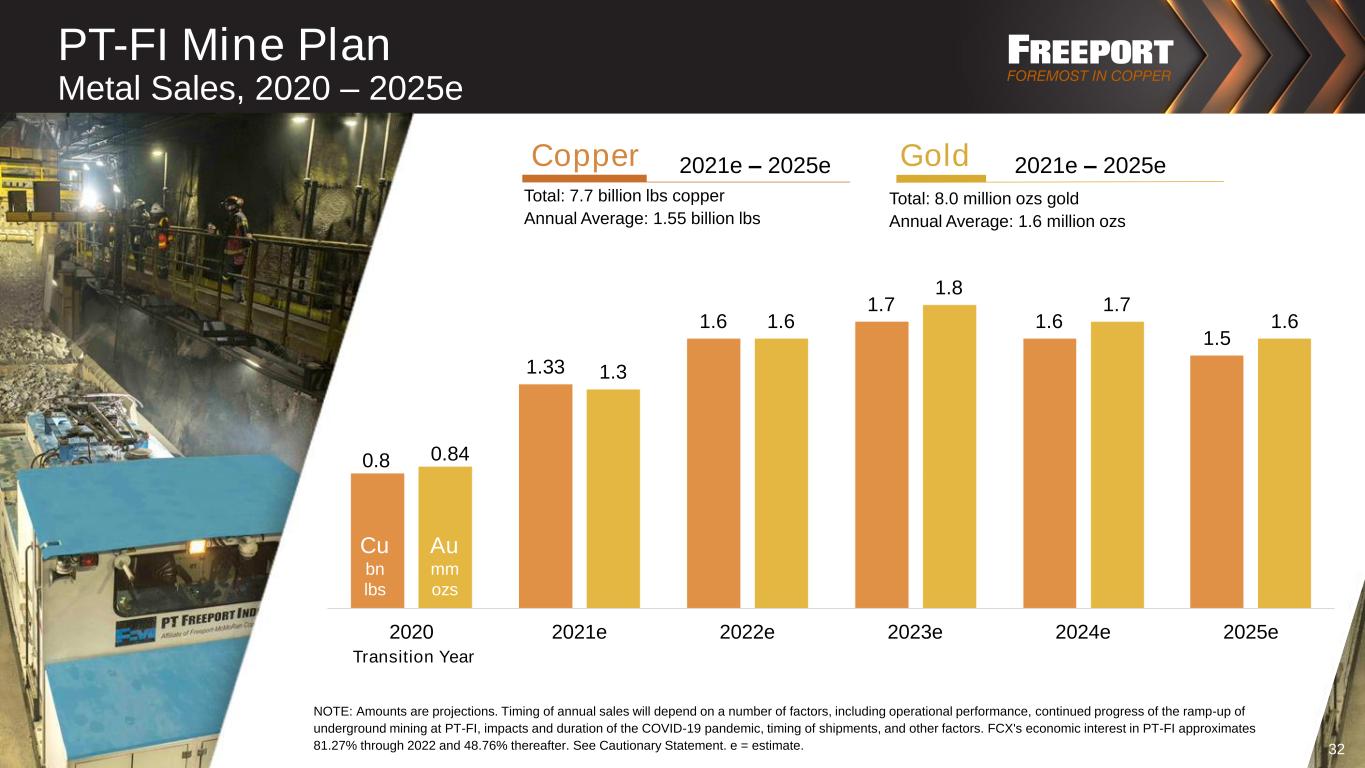
The successful completion of this ramp up is expected to enable PT-FI to generate average annual production of 1.55 billion pounds of copper and 1.6 million ounces of gold for the next several years at an attractive unit net cash cost, providing significant margins and cash flows. PT-FI expects production for the year 2021 to approximate 1.3 billion pounds of copper and 1.3 million ounces of gold, nearly double 2020 levels.
PT-FI's estimated annual capital spending on underground mine development projects is expected to average approximately $0.9 billion per year for 2021 and 2022, net of scheduled contributions from PT Indonesia Asahan Aluminium (Persero) (PT Inalum, also known as MIND ID). In accordance with applicable accounting guidance, aggregate costs (before scheduled contributions from PT Inalum), which are expected to average $1.1 billion per year for 2021 and 2022, will be reflected as an investing activity in FCX's cash flow statement, and contributions from PT Inalum will be reflected as a financing activity.
Indonesia Smelter. In connection with PT-FI’s 2018 agreement with the Indonesia government associated with the extension of its long-term mining rights, PT-FI committed to construct new domestic smelting capacity totaling 2 million metric tons of concentrate per year by December 2023. Prior to the COVID-19 pandemic, PT-FI selected a site for a greenfield smelter in East Java and initiated ground preparation and commenced engineering and commercial negotiations.
During 2020, PT-FI notified the Indonesia government of schedule delays resulting from the COVID-19 pandemic and continues to review with the government a revised schedule for the project.
To fulfill its obligation for new domestic smelter capacity in Indonesia, PT-FI is planning the following:
•Expansion of annual capacity at PT Smelting (PT-FI's 39.5-percent owned copper smelter and refinery in Gresik, Indonesia) by 300,000 metric tons of concentrate, a 30 percent increase. PT-FI is advancing agreements with the majority owner of PT Smelting to implement the expansion plans with a target completion date of year-end 2023. PT-FI would fund the cost of the expansion, estimated to approximate $250 million, and increase its ownership in PT Smelting to a majority ownership interest.
•Construction of a new greenfield smelter in Gresik, Indonesia with a capacity to process approximately 1.7 million metric tons of concentrate per year. In July 2021, PT-FI awarded a construction contract to Chiyoda with an estimated cost of $2.8 billion. The smelter construction is expected to be completed as soon as feasible in 2024, which is dependent on no further pandemic-related disruptions.
•Construction of a precious metals refinery to process gold and silver from PT Smelting and the new greenfield smelter in Gresik, at an estimated cost of $250 million.
PT-FI has recently entered into a $1 billion, five-year, unsecured bank credit facility to advance these projects. Additional debt financing is being planned to fund the projects with the cost of all such debt shared 49 percent by FCX and 51 percent by PT Inalum.
Construction of the new smelter capacity would result in the elimination of export duties, providing an offset to the economic cost associated with the smelter development.
Operating Data. Following is summary consolidated operating data for Indonesia mining:
| | | | | | | | | | | | | | | | | | | | | | | | | | | | | |
| | | | | |
| | Three Months Ended June 30, | | Six Months Ended
June 30, | |
| | 2021 | | 2020 | | 2021 | | 2020 | |
Copper (millions of recoverable pounds) | | | | | | | | | |
Production | | 308 | | | 181 | | | 606 | | | 321 | | |
Sales | | 310 | | | 172 | | | 568 | | | 299 | | |
Average realized price per pound | | $ | 4.27 | | | $ | 2.67 | | | $ | 4.29 | | | $ | 2.54 | | |
| | | | | | | | | |
Gold (thousands of recoverable ounces) | | | | | | | | | |
Production | | 303 | | | 189 | | | 597 | | | 341 | | |
Sales | | 302 | | | 180 | | | 558 | | | 319 | | |
Average realized price per ounce | | $ | 1,795 | | | $ | 1,748 | | | $ | 1,785 | | | $ | 1,709 | | |
| | | | | | | | | |
Unit net cash costs per pound of coppera | | | | | | | | | |
Site production and delivery, excluding adjustments | | $ | 1.54 | | | $ | 2.00 | | b | $ | 1.51 | | | $ | 2.29 | | b |
Gold and silver credits | | (1.93) | | | (1.95) | | | (1.86) | | | (1.91) | | |
Treatment charges | | 0.24 | | | 0.27 | | | 0.24 | | | 0.28 | | |
Export duties | | 0.14 | | | 0.09 | | | 0.13 | | | 0.07 | | |
Royalty on metals | | 0.26 | | | 0.15 | | | 0.25 | | | 0.15 | | |
Unit net cash costs | | $ | 0.25 | | | $ | 0.56 | | | $ | 0.27 | | | $ | 0.88 | | |
| | | | | | | | | |
a.For a reconciliation of unit net cash costs per pound to production and delivery costs applicable to sales reported in FCX's consolidated financial statements, refer to the supplemental schedules, "Product Revenues and Production Costs," beginning on page XIII.
b.Excludes COVID-19 related costs of $0.03 per pound of copper in second-quarter 2020 and $0.01 per pound of copper for the first six months of 2020.
PT-FI's consolidated sales of 310 million pounds of copper and 302 thousand ounces of gold in second-quarter 2021 were higher than second-quarter 2020 consolidated sales of 172 million pounds of copper and 180 thousand ounces of gold, primarily reflecting the ramp-up of underground mining at PT-FI. Consolidated sales volumes from PT-FI are expected to approximate 1.33 billion pounds of copper and 1.3 million ounces of gold for the year 2021, compared with 0.8 billion pounds of copper and 0.8 million ounces of gold for the year 2020.
Because of the fixed nature of a large portion of PT-FI's costs, unit net cash costs can vary significantly from quarter to quarter depending on copper and gold volumes. PT-FI's unit net cash costs (including gold and silver credits) of $0.25 per pound of copper in second-quarter 2021, were lower than unit net cash costs of $0.56 per pound in second-quarter 2020, primarily reflecting higher sales volumes.
Assuming an average gold price of $1,800 per ounce for the second half of 2021 and achievement of current sales volume and cost estimates, unit net cash costs (including gold and silver credits) for PT-FI are expected to approximate $0.19 per pound of copper for the year 2021. PT-FI's average unit net cash costs for the year 2021 would change by approximately $0.06 per pound for each $100 per ounce change in the average price of gold for the second half of 2021.
Molybdenum Mines. FCX operates two wholly owned molybdenum mines in Colorado - the Henderson underground mine and the Climax open-pit mine. The Henderson and Climax mines produce high-purity, chemical-grade molybdenum concentrate, which is typically further processed into value-added molybdenum chemical
products. The majority of the molybdenum concentrate produced at the Henderson and Climax mines, as well as from FCX's North America and South America copper mines, is processed at FCX's conversion facilities.
Operating and Development Activities. Production from the molybdenum mines of 7 million pounds of molybdenum in second-quarter 2021 was slightly higher than production of 6 million pounds of molybdenum in second-quarter 2020. Refer to summary operating data on page 3 for FCX's consolidated molybdenum sales and average realized prices, which includes sales of molybdenum produced at the Molybdenum mines and from FCX's North America and South America copper mines.
Average unit net cash costs for the Molybdenum mines of $8.14 per pound of molybdenum in second-quarter 2021 were lower than average unit net cash costs of $8.97 per pound in second-quarter 2020, primarily reflecting higher volumes. Based on current sales volume and cost estimates, average unit net cash costs for the Molybdenum mines are expected to approximate $9.65 per pound of molybdenum for the year 2021.
For a reconciliation of unit net cash costs per pound to production and delivery costs applicable to sales reported in FCX's consolidated financial statements, refer to the supplemental schedules, "Product Revenues and Production Costs," beginning on page XIII.
EXPLORATION
FCX's mining exploration activities are generally associated with its existing mines, focusing on opportunities to expand reserves and resources to support development of additional future production capacity. Exploration results continue to indicate opportunities for significant future potential reserve additions in North America and South America. Exploration expenditures for the year 2021 are expected to approximate $60 million. FCX has long-lived reserves and a significant resource position in its existing portfolio.
CASH FLOWS, CASH AND DEBT
Operating Cash Flows. FCX generated operating cash flows of $2.4 billion (including $0.5 billion of working capital and other sources) in second-quarter 2021 and $3.5 billion (including $0.2 billion of working capital and other sources) for the first six months of 2021.
Based on current sales volume and cost estimates, and assuming average prices of $4.25 per pound of copper, $1,800 per ounce of gold and $16.00 per pound of molybdenum for the second half of 2021, FCX's consolidated operating cash flows are estimated to approximate $7.5 billion (including $0.4 billion of working capital and other sources) for the year 2021. The impact of price changes for the second half of 2021 on operating cash flows would approximate $200 million for each $0.10 per pound change in the average price of copper, $50 million for each $100 per ounce change in the average price of gold and $55 million for each $2 per pound change in the average price of molybdenum.
Capital Expenditures. Capital expenditures totaled $0.4 billion in second-quarter 2021 (including approximately $0.3 billion for major projects) and $0.8 billion for the first six months of 2021 (including approximately $0.6 billion for major projects). Capital expenditures are expected to approximate $2.2 billion for the year 2021, including $1.4 billion for major projects primarily associated with underground development activities in the Grasberg minerals district and exclude Indonesia smelter expenditures, which are currently expected to approximate $0.3 billion during the second half of 2021 and will be funded through PT-FI's $1 billion unsecured bank credit facility.
Cash. Following is a summary of the U.S. and international components of consolidated cash and cash equivalents available to the parent company, net of noncontrolling interests' share, taxes and other costs at June 30, 2021 (in billions):
| | | | | | | | |
| Cash at domestic companies | $ | 4.1 | | |
| Cash at international operations | 2.2 | | |
| Total consolidated cash and cash equivalents | 6.3 | | |
| Noncontrolling interests' share | (0.8) | | |
Cash, net of noncontrolling interests' share | $ | 5.5 | | |
| Withholding taxes | (0.1) | | |
| Net cash available | $ | 5.4 | | |
| | |
Debt. Following is a summary of total debt and the weighted-average interest rates at June 30, 2021 (in millions, except percentages):
| | | | | | | | | | | |
| | | Weighted-
Average
Interest Rate |
| Senior Notes | $ | 9,143 | | | 4.8% |
| Cerro Verde Term Loan | 524 | | | 2.0% |
| Other | 28 | | | 2.4% |
| Total debt | $ | 9,695 | | | 4.6% |
| | | |
| | | |
| | | |
| | | |
| | | |
At June 30, 2021, FCX had no borrowings, $8 million in letters of credit issued and $3.5 billion available under its revolving credit facility. FCX's 3.55% Senior Notes are due March 2022 ($524 million principal amount), the Cerro Verde Term Loan matures in June 2022, and FCX has no other senior note maturities until March 2023.
On July 19, 2021, PT-FI entered into $1 billion, five-year, unsecured bank credit facility (consisting of a $667 million term loan and a $333 million revolving credit facility). Amounts may be drawn under the term loan within the first three years. The loans mature in July 2026 and bear interest at the London Interbank Offered Rate plus a margin of 1.875% or 2.125%, as defined in the agreement.
FINANCIAL POLICY
In February 2021, FCX's Board of Directors (Board) adopted a new financial policy for the allocation of cash flows aligned with FCX’s strategic objectives of maintaining a strong balance sheet, increasing cash returns to shareholders and advancing opportunities for future growth. The policy includes a base dividend of $0.30 per share per year and a performance-based payout framework to be implemented following achievement of a net debt target in the range of $3 billion to $4 billion, excluding project debt for additional smelting capacity in Indonesia. Under the performance-based payout framework, up to 50 percent of available cash flows generated after planned capital spending and distributions to noncontrolling interests would be allocated to shareholder returns and the balance to debt reduction and investments in value enhancing growth projects.
Available cash flows for performance-based payout distributions in excess of the base dividend will be assessed by the Board at least annually. With the recent achievement of FCX's net debt target, FCX expects the Board to consider the amount of additional cash returns to shareholders following its 2021 annual results.
On June 23, 2021, FCX declared a quarterly cash dividend of $0.075 per share on its common stock, which will be paid on August 2, 2021, to shareholders of record as of July 15, 2021. The declaration of dividends is at the discretion of the Board and will depend upon FCX's financial results, cash requirements, future prospects and other factors deemed relevant by the Board.
WEBCAST INFORMATION
A conference call with securities analysts to discuss FCX's second-quarter 2021 results is scheduled for today at 10:00 a.m. Eastern Time. The conference call will be broadcast on the Internet along with slides. Interested parties may listen to the conference call live and view the slides by accessing “fcx.com.” A replay of the webcast will be available through Friday, August 20, 2021.
-----------------------------------------------------------------------------------------------------------
FREEPORT: Foremost in Copper
FCX is a leading international mining company with headquarters in Phoenix, Arizona. FCX operates large, long-lived, geographically diverse assets with significant proven and probable reserves of copper, gold and molybdenum. FCX is one of the world’s largest publicly traded copper producers.
FCX’s portfolio of assets includes the Grasberg minerals district in Indonesia, one of the world’s largest copper and gold deposits; and significant mining operations in North America and South America, including the large-scale Morenci minerals district in Arizona and the Cerro Verde operation in Peru.
By supplying responsibly produced copper, FCX is proud to be a positive contributor to the world well beyond its operational boundaries. Additional information about FCX is available on FCX's website at fcx.com.
Cautionary Statement and Regulation G Disclosure: This press release contains forward-looking statements in which FCX discusses its potential future performance. Forward-looking statements are all statements other than statements of historical facts, such as plans, projections, or expectations relating to ore grades and milling rates; business outlook; production and sales volumes; unit net cash costs; cash flows; capital expenditures; liquidity; operating costs; operating plans; FCX's financial policy; FCX's expectations regarding PT-FI's ramp-up of underground mining activities and future cash flows through 2022; PT-FI's development, financing, construction and completion of new domestic smelting capacity in Indonesia totaling 2 million metric tons of concentrate per year by December 2023; expectations regarding negotiations with hourly employees at Cerro Verde including completion of new CLAs; FCX’s commitments to deliver responsibly produced copper, including plans to implement and validate all of its operating sites under specific frameworks; improvements in operating procedures and technology; exploration efforts and results; development and production activities, rates and costs; tax rates; export quotas and duties; the impact of copper, gold and molybdenum price changes; the impact of deferred intercompany profits on earnings; mineralization and reserve estimates; execution of the settlement agreements associated with the Louisiana coastal erosion cases and talc-related litigation; descriptions of our objectives, strategies, plans, goals or targets, including our net debt target; and future returns to shareholders, including dividend payments, share purchases and sales. The words “anticipates,” “may,” “can,” “plans,” “believes,” “estimates,” “expects,” “projects,” "targets," “intends,” “likely,” “will,” “should,” “could,” “to be,” ”potential," “assumptions,” “guidance,” “future” and any similar expressions are intended to identify those assertions as forward-looking statements. The declaration of future dividends is at the discretion of the Board and will depend on FCX's financial results, cash requirements, future prospects, global economic conditions, and other factors deemed relevant by the Board.
FCX cautions readers that forward-looking statements are not guarantees of future performance and actual results may differ materially from those anticipated, expected, projected or assumed in the forward-looking statements. Important factors that can cause FCX's actual results to differ materially from those anticipated in the forward-looking statements include, but are not limited to, changes in the credit ratings of FCX; changes in FCX's cash requirements, financial position, financing plans or investment plans; changes in general market, economic, tax, regulatory or industry conditions; the duration and scope of and uncertainties associated with the COVID-19 pandemic, and the impact thereof on commodity prices, FCX’s business and the global economy and any related actions taken by governments and businesses; FCX’s ability to contain and mitigate the risk of spread or major outbreak of COVID-19 at its operating sites, including at PT-FI’s remote operating site in Papua; supply of and demand for, and prices of, copper, gold and molybdenum; mine sequencing; changes in mine plans or operational modifications, delays, deferrals or cancellations; production rates; timing of shipments; results of feasibility studies; potential inventory adjustments; potential impairment of long-lived mining assets; the potential effects of violence in Indonesia generally and in the province of Papua; the Indonesia government's extension of PT-FI's export license after March 15, 2022; risks associated with underground mining; satisfaction of requirements in accordance with PT-FI's special mining license to extend mining rights from 2031 through 2041; the Indonesia government's approval of a deferred schedule for completion of new domestic smelting capacity in Indonesia; expected results from improvements in operating procedures and technology, including innovation initiatives; industry risks; regulatory changes; political and social risks; labor relations, including labor-related work stoppages and costs; weather- and climate-related risks; environmental risks; litigation results; cybersecurity incidents; changes in general market, economic and industry conditions; financial condition of FCX’s customers, suppliers, vendors, partners and affiliates, particularly during weak economic conditions and extended periods of volatile commodity prices; reductions in liquidity and access to capital; FCX’s ability to comply with its responsible production commitments under specific frameworks and any changes to such frameworks; and other factors described in more detail under the heading “Risk Factors” in FCX's Annual Report on Form 10-K for the year ended December 31, 2020, filed with the U.S. Securities and Exchange Commission (SEC).
Investors are cautioned that many of the assumptions upon which FCX's forward-looking statements are based are likely to change after the date the forward-looking statements are made, including for example commodity prices, which FCX cannot control, and production volumes and costs, some aspects of which FCX may not be able to control. Further, FCX may make changes to its business plans that could affect its results. FCX cautions investors that it undertakes no obligation to update any forward-looking statements, which speak only as of the date made, notwithstanding any changes in its assumptions, changes in business plans, actual experience or other changes.
This press release also contains financial measures such as net debt, adjusted net income (loss) and unit net cash costs per pound of copper and molybdenum, which are not recognized under U.S. generally accepted accounting principles. As required by SEC Regulation G, reconciliations of these measures to amounts reported in FCX's consolidated financial statements are in the supplemental schedules of this press release.
| | | | | | | | | | | | | | | | | | | | | | | | | | |
| Freeport-McMoRan Inc. |
| SELECTED OPERATING DATA |
| | | | | | | | |
| Three Months Ended June 30, | |
| 2021 | | 2020 | | 2021 | | 2020 | |
| MINING OPERATIONS: | Production | | Sales | |
COPPER (millions of recoverable pounds) | | | | |
| (FCX's net interest in %) | | | | |
| North America | | | | | | | | |
Morenci (72%)a | 156 | | | 185 | | | 172 | | | 185 | | |
| Bagdad (100%) | 39 | | | 59 | | | 47 | | | 56 | | |
| Safford (100%) | 64 | | | 42 | | | 67 | | | 38 | | |
| Sierrita (100%) | 53 | | | 48 | | | 55 | | | 46 | | |
| Miami (100%) | 3 | | | 4 | | | 4 | | | 4 | | |
| Chino (100%) | 33 | | | 18 | | | 31 | | | 27 | | |
| Tyrone (100%) | 12 | | | 11 | | | 13 | | | 12 | | |
| Other (100%) | — | | | 1 | | | — | | | — | | |
| Total North America | 360 | | | 368 | | | 389 | | | 368 | | |
| | | | | | | | |
| South America | | | | | | | | |
| Cerro Verde (53.56%) | 206 | | | 178 | | | 189 | | | 179 | | |
| El Abra (51%) | 39 | | | 40 | | | 41 | | | 40 | | |
| | | | | | | | |
| Total South America | 245 | | | 218 | | | 230 | | | 219 | | |
| | | | | | | | |
| Indonesia | | | | | | | | |
Grasberg (48.76%)b | 308 | | | 181 | | | 310 | | | 172 | | |
| | | | | | | | |
| | | | | | | | |
| Total | 913 | | | 767 | | | 929 | | c | 759 | | c |
| Less noncontrolling interests | 173 | | | 136 | | | 166 | | | 135 | | |
| Net | 740 | | | 631 | | | 763 | | | 624 | | |
| | | | | | | | |
| | | | | | | | |
| | | | | | | | |
| | | | | | | | |
| | | | | | | | |
| Average realized price per pound | | | | | $ | 4.34 | |
| $ | 2.55 | | d |
| | | | | | | | |
| | | | | | | | |
GOLD (thousands of recoverable ounces) | | | | | | | | |
| (FCX's net interest in %) | | | | | | | | |
| North America (100%) | 2 | | | 2 | | | 3 | | | 4 | | |
| | | | | | | | |
Indonesia (48.76%)b | 303 | | | 189 | | | 302 | | | 180 | | |
| Consolidated | 305 | | | 191 | | | 305 | | | 184 | | |
| Less noncontrolling interests | 56 | | | 35 | | | 56 | | | 34 | | |
| Net | 249 | | | 156 | | | 249 | | | 150 | | |
| | | | | | | | |
| | | | | | | | |
| | | | | | | | |
| | | | | | | | |
| Average realized price per ounce | | | | | $ | 1,794 | | | $ | 1,749 | | |
| | | | | | | | |
MOLYBDENUM (millions of recoverable pounds) | | | | | | | | |
| (FCX's net interest in %) | | | | | | | | |
| Henderson (100%) | 2 | | | 3 | | | N/A | | N/A | |
| Climax (100%) | 5 | | | 3 | | | N/A | | N/A | |
North America copper mines (100%)a | 9 | | | 9 | | | N/A | | N/A | |
| Cerro Verde (53.56%) | 4 | | | 4 | | | N/A | | N/A | |
| Consolidated | 20 | | | 19 | | | 22 | | | 18 | | |
| Less noncontrolling interests | 2 | | | 2 | | | 2 | | | 2 | | |
| Net | 18 | | | 17 | | | 20 | | | 16 | | |
| | | | | | | | |
| | | | | | | | |
| | | | | | | | |
| | | | | | | | |
| | | | | | | | |
| Average realized price per pound | | | | | $ | 13.11 | | | $ | 10.53 | | |
| | | | | | | | |
| | | | | | | | |
| | | | | | | | |
| | | | | | | | |
| | | | | | | | |
| | | | | | | | |
| | | | | | | | |
| | | | |
| | | | | | | | |
| | | | | | | | |
| | | | | | | | |
| | | | | | | | |
| | | | | | | | |
| | | | | | | | |
| | | | | | | | |
a. Amounts are net of Morenci's joint venture partners' undivided interests. |
| | | | | | | | |
| b. FCX’s economic interest in PT Freeport Indonesia (PT-FI) approximates 81 percent through 2022 and 48.76 percent thereafter. |
| | | | | | | | |
c. Consolidated sales volumes exclude purchased copper of 68 million pounds in second-quarter 2021 and 71 million pounds in second-quarter 2020. |
| | | | | | | | |
| d. Includes a reduction to the average realize price of $0.03 per pound of copper related to forward sales contracts covering 150 million pounds of copper sales for May and June 2020 at a fixed price of $2.34 per pound. There are no remaining forward sales contracts. |
| | | | | | | | |
| | | | | | | | | | | | | | | | | | | | | | | | | | |
| Freeport-McMoRan Inc. |
| SELECTED OPERATING DATA |
| | | | | | | | |
| Six Months Ended June 30, | |
| 2021 | | 2020 | | 2021 | | 2020 | |
| MINING OPERATIONS: | Production | | Sales | |
COPPER (millions of recoverable pounds) | | | | |
| (FCX's net interest in %) | | | | |
| North America | | | | | | | | |
Morenci (72%)a | 310 | | | 358 | | | 312 | | | 363 | | |
| Bagdad (100%) | 83 | | | 105 | | | 89 | | | 104 | | |
| Safford (100%) | 128 | | | 71 | | | 118 | | | 66 | | |
| Sierrita (100%) | 102 | | | 89 | | | 97 | | | 87 | | |
| Miami (100%) | 7 | | | 8 | | | 7 | | | 8 | | |
| Chino (100%) | 58 | | | 60 | | | 50 | | | 71 | | |
| Tyrone (100%) | 25 | | | 22 | | | 24 | | | 23 | | |
| Other (100%) | — | | | 1 | | | — | | | 1 | | |
| Total North America | 713 | | | 714 | | | 697 | | | 723 | | |
| | | | | | | | |
| South America | | | | | | | | |
| Cerro Verde (53.56%) | 423 | | | 381 | | | 404 | | | 385 | | |
| El Abra (51%) | 81 | | | 82 | | | 85 | | | 81 | | |
| | | | | | | | |
| Total South America | 504 | | | 463 | | | 489 | | | 466 | | |
| | | | | | | | |
| Indonesia | | | | | | | | |
Grasberg (48.76%)b | 606 | | | 321 | | | 568 | | | 299 | | |
| | | | | | | | |
| | | | | | | | |
| Total | 1,823 | | | 1,498 | | | 1,754 | | c | 1,488 | | c |
| Less noncontrolling interests | 350 | | | 277 | | | 336 | | | 275 | | |
| Net | 1,473 | | | 1,221 | | | 1,418 | | | 1,213 | | |
| | | | | | | | |
| | | | | | | | |
| | | | | | | | |
| | | | | | | | |
| | | | | | | | |
| Average realized price per pound | | | | | $ | 4.25 | |
| $ | 2.53 | | d |
| | | | | | | | |
| | | | | | | | |
GOLD (thousands of recoverable ounces) | | | | | | | | |
| (FCX's net interest in %) | | | | | | | | |
| North America (100%) | 5 | | | 6 | | | 5 | | | 9 | | |
| | | | | | | | |
Indonesia (48.76%)b | 597 | | | 341 | | | 558 | | | 319 | | |
| Consolidated | 602 | | | 347 | | | 563 | | | 328 | | |
| Less noncontrolling interests | 111 | | | 64 | | | 104 | | | 60 | | |
| Net | 491 | | | 283 | | | 459 | | | 268 | | |
| | | | | | | | |
| | | | | | | | |
| | | | | | | | |
| | | | | | | | |
| Average realized price per ounce | | | | | $ | 1,785 | | | $ | 1,709 | | |
| | | | | | | | |
MOLYBDENUM (millions of recoverable pounds) | | | | | | | | |
| (FCX's net interest in %) | | | | | | | | |
| Henderson (100%) | 5 | | | 5 | | | N/A | | N/A | |
| Climax (100%) | 9 | | | 8 | | | N/A | | N/A | |
North America copper mines (100%)a | 17 | | | 17 | | | N/A | | N/A | |
| Cerro Verde (53.56%) | 9 | | | 8 | | | N/A | | N/A | |
| Consolidated | 40 | | | 38 | | | 43 | | | 39 | | |
| Less noncontrolling interests | 4 | | | 4 | | | 5 | | | 5 | | |
| Net | 36 | | | 34 | | | 38 | | | 34 | | |
| | | | | | | | |
| | | | | | | | |
| | | | | | | | |
| | | | | | | | |
| | | | | | | | |
| Average realized price per pound | | | | | $ | 12.38 | | | $ | 10.84 | | |
| | | | | | | | |
| | | | | | | | |
| | | | | | | | |
| | | | | | | | |
| | | | | | | | |
| | | | | | | | |
| | | | | | | | |
| | | | |
| | | | | | | | |
| | | | | | | | |
| | | | | | | | |
| | | | | | | | |
| | | | | | | | |
| | | | | | | | |
| | | | | | | | |
a. Amounts are net of Morenci's joint venture partners' undivided interests. |
| | | | | | | | |
| b. FCX’s economic interest in PT-FI approximates 81 percent through 2022 and 48.76 percent thereafter. |
| | | | | | | | |
c. Consolidated sales volumes exclude purchased copper of 121 million pounds for the first six months of 2021 and 159 million pounds for the first six months of 2020. |
| | | | | | | | |
| d. Includes a reduction to the average realize price of $0.02 per pound of copper related to forward sales contracts covering 150 million pounds of copper sales for May and June 2020 at a fixed price of $2.34 per pound. There are no remaining forward sales contracts. |
|
| | | | | | | | | | | | | | | | | | | | | | | | | | |
| Freeport-McMoRan Inc. | |
| SELECTED OPERATING DATA (continued) | |
| | | | | | | | |
| Three Months Ended June 30, | | Six months ended June 30, | |
| 2021 | | 2020 | | 2021 | | 2020 | |
| 100% North America Copper Mines | | | | | | | | |
| Leach Operations | | | | | | | | |
Leach ore placed in stockpiles (metric tons per day) | 688,000 | | | 744,000 | | | 696,500 | | | 736,100 | | |
Average copper ore grade (percent) | 0.30 | | | 0.28 | | | 0.29 | | | 0.28 | | |
Copper production (millions of recoverable pounds) | 265 | | | 265 | | | 527 | | | 500 | | |
| | | | | | | | |
| Mill Operations | | | | | | | | |
Ore milled (metric tons per day) | 264,700 | | | 286,200 | | | 266,300 | | | 309,800 | | |
Average ore grades (percent): | | | | | | | | |
Copper | 0.36 | | | 0.37 | | | 0.37 | | | 0.34 | | |
Molybdenum | 0.03 | | | 0.02 | | | 0.03 | | | 0.02 | | |
Copper recovery rate (percent) | 82.4 | | | 84.6 | | | 80.5 | | | 85.8 | | |
Production (millions of recoverable pounds): | | | | | | | | |
Copper | 155 | | | 176 | | | 306 | | | 354 | | |
Molybdenum | 9 | | | 9 | | | 17 | | | 17 | | |
| | | | | | | | |
| 100% South America Mining | | | | | | | | |
| Leach Operations | | | | | | | | |
Leach ore placed in stockpiles (metric tons per day) | 190,200 | | | 141,900 | | | 172,100 | | | 162,200 | | |
Average copper ore grade (percent) | 0.33 | | | 0.33 | | | 0.34 | | | 0.35 | | |
Copper production (millions of recoverable pounds) | 65 | | | 62 | | | 126 | | | 125 | | |
| | | | | | | | |
| Mill Operations | | | | | | | | |
Ore milled (metric tons per day) | 374,100 | | | 251,800 | | a | 382,100 | | | 300,700 | | a |
Average ore grades (percent): | | | | | | | | |
Copper | 0.29 | | | 0.39 | | | 0.30 | | | 0.36 | | |
Molybdenum | 0.01 | | | 0.01 | | | 0.01 | | | 0.01 | | |
Copper recovery rate (percent) | 85.2 | | | 83.9 | | | 86.4 | | | 80.8 | | |
Production (millions of recoverable pounds): | | | | | | | | |
Copper | 179 | | | 156 | | | 377 | | | 338 | | |
Molybdenum | 4 | | | 4 | | | 9 | | | 8 | | |
| | | | | | | | |
| 100% Indonesia Mining | | | | | | | | |
Ore extracted and milled (metric tons per day): | | | | | | | | |
Grasberg Block Cave underground mineb | 64,400 | | | 27,200 | | | 58,100 | | | 23,100 | | |
Deep Mill Level Zone underground mineb | 53,900 | | | 27,600 | | | 50,300 | | | 23,100 | | |
| Deep Ore Zone underground mine | 10,800 | | | 21,600 | | | 14,700 | | | 20,900 | | |
| Big Gossan underground mine | 8,200 | | | 5,900 | | | 7,500 | | | 6,300 | | |
| Grasberg open pit | — | | | — | | | — | | | 3,600 | | c |
| Other | 5,700 | | | (400) | | | 3,000 | | | — | | |
Total | 143,000 | | | 81,900 | | | 133,600 | | | 77,000 | | |
Average ore grades: | | | | | | | | |
Copper (percent) | 1.28 | | | 1.27 | | | 1.34 | | | 1.21 | | |
Gold (grams per metric ton) | 1.00 | | | 1.04 | | | 1.03 | | | 1.02 | | |
Recovery rates (percent): | | | | | | | | |
Copper | 88.8 | | | 91.7 | | | 90.0 | | | 91.7 | | |
Gold | 75.9 | | | 78.3 | | | 77.4 | | | 77.6 | | |
Production (recoverable): | | | | | | | | |
Copper (millions of pounds) | 308 | | | 181 | | | 606 | | | 321 | | |
Gold (thousands of ounces) | 303 | | | 189 | | | 597 | | | 341 | | |
| | | | | | | | |
| | | | | | | | |
| | | | | | | | |
| | | | | | | | |
| | | | | | | | |
| | | | | | | | |
| | | | | | | | |
| | | | | | | | |
| | | | | | | | |
| | | | | | | | |
| | | | | | | | |
| 100% Molybdenum Mines | | | | | | | | |
Ore milled (metric tons per day) | 22,200 | | | 23,500 | | | 20,500 | | | 25,200 | | |
Average molybdenum ore grade (percent) | 0.19 | | | 0.16 | | | 0.19 | | | 0.16 | | |
Molybdenum production (millions of recoverable pounds) | 7 | | | 6 | | | 14 | | | 13 | | |
| | | | | | | | |
| a. Cerro Verde mill operations were negatively impacted by COVID-19 restrictions. | |
| | | | | | | | |
| b. Includes ore from development activities that result in metal production. | |
| | | | | | | | |
| c. Represents ore from the Grasberg open-pit stockpiles. | |
| |
| |
| | | | | | | | | | | | | | | | | | | | | | | | | | |
| Freeport-McMoRan Inc. |
| CONSOLIDATED STATEMENTS OF OPERATIONS (Unaudited) |
| | | | | | | | |
| Three Months Ended | | Six Months Ended | |
| June 30, | | June 30, | |
| 2021 | | 2020 | | 2021 | | 2020 | |
| (In Millions, Except Per Share Amounts) |
Revenuesa | $ | 5,748 | | | $ | 3,054 | | | $ | 10,598 | |
| $ | 5,852 | |
|
| Cost of sales: | | | | | | | | |
Production and deliveryb | 3,067 | | c | 2,394 | | d,e | 5,853 | | c | 4,939 | | d,e |
| Depreciation, depletion and amortization | 483 | |
| 358 | | d | 902 | | | 699 | | d |
| Metals inventory adjustments | — | | | (139) | | | 1 | | | 83 | | |
| | | | | | | | |
| Total cost of sales | 3,550 | | | 2,613 | | | 6,756 | | | 5,721 | | |
| Selling, general and administrative expenses | 87 | | | 91 | | e | 187 | | | 201 | | e |
| Mining exploration and research expenses | 14 | | | 18 | | e | 21 | | | 34 | | e |
| Environmental obligations and shutdown costs | 33 | | | 11 | | | 38 | | | 37 | | |
| | | | | | | | |
| Net (gain) loss on sales of assets | (3) | | | — | | | (3) | | | 11 | | |
| | | | | | | | |
| Total costs and expenses | 3,681 | | | 2,733 | | | 6,999 | | | 6,004 | | |
| Operating income (loss) | 2,067 | | | 321 | | | 3,599 | | | (152) | | |
Interest expense, netb,f | (148) | | | (115) | | | (293) | | | (242) | | |
| | | | | | | | |
| Net loss on early extinguishment of debt | — | | | (9) | | | — | | | (41) | | |
| | | | | | | | |
Other income, netb | 9 | | | 20 | | | 20 | | | 40 | | |
| Income (loss) before income taxes and equity in affiliated companies' net earnings | 1,928 | | | 217 | | | 3,326 | | | (395) | | |
Provision for income taxesg | (603) | | | (96) | | | (1,046) | | | (36) | | |
| Equity in affiliated companies' net earnings | 6 | | | 3 | | | 4 | | | 6 | | |
| | | | | | | | |
| | | | | | | | |
| Net income (loss) | 1,331 | | | 124 | | | 2,284 | | | (425) | | |
| | | | | | | | |
| Net income attributable to noncontrolling interests | (248) | | | (71) | | | (483) | | | (13) | | |
| | | | | | | | |
| | | | | | | | |
Net income (loss) attributable to common stockholdersh | $ | 1,083 | | | $ | 53 | | | $ | 1,801 | | | $ | (438) | | |
| | | | | | | | |
| | | | | | | | |
| | | | | | | | |
| | | | | | | | |
| | | | | | | | |
| | | | | | | | |
| Diluted net income (loss) per share attributable to common stock | $ | 0.73 | | | $ | 0.03 | | | $ | 1.21 | | | $ | (0.30) | | |
| | | | | | | | |
| | | | | | | | |
| | | | | | | | |
| | | | | | | | |
| | | | | | | | |
| | | | | | | | |
| Diluted weighted-average common shares outstanding | 1,483 | | | 1,458 | | | 1,480 | | | 1,453 | | |
| | | | | | | | |
| Dividends declared per share of common stock | $ | 0.075 | | | $ | — | | | $ | 0.15 | | | $ | — | | |
| | | | | | | | |
a.Includes adjustments to provisionally priced concentrate and cathode sales. For a summary of adjustments to provisionally priced copper sales, refer to the supplemental schedule, "Derivative Instruments," on page IX.
b.Includes PT-FI charges and other net (charges) credits totaling $(22) million in second-quarter 2021, $16 million in second-quarter 2020, $(67) million for the first six months of 2021 and less than $1 million for the first six months of 2020, which are summarized in the supplemental schedule, "Adjusted Net Income (Loss)," on page VII.
c.Includes nonrecurring labor-related charges totaling $69 million at Cerro Verde for agreements reached with 57 percent of its hourly employees.
d.Includes COVID-19 related charges totaling $114 million in second-quarter 2020 and $142 million for the first six months of 2020, primarily associated with idle facility, contract cancellation and other charges, which are summarized in the supplemental schedule, "Adjusted Net Income (Loss)," on page VII.
e.Includes charges totaling $82 million associated with an employee separation program, which are summarized in the supplemental schedule, "Adjusted Net Income (Loss)," on page VII.
f.Consolidated interest costs (before capitalization) totaled $165 million in second-quarter 2021, $159 million in second-quarter 2020, $325 million for the first six months of 2021 and $330 million for the first six months of 2020.
g.For a summary of FCX's income taxes, refer to the supplemental schedule, "Income Taxes," on page VIII.
h.FCX defers recognizing profits on intercompany sales until final sales to third parties occur. For a summary of net impacts from changes in these deferrals, refer to the supplemental schedule, "Deferred Profits," on page X.
| | | | | | | | | | | | | | |
| Freeport-McMoRan Inc. |
| CONSOLIDATED BALANCE SHEETS (Unaudited) |
| | | | |
| June 30, | | December 31, | |
| 2021 | | 2020 | |
| (In Millions) | |
| ASSETS | | | | |
| Current assets: | | | | |
Cash and cash equivalents | $ | 6,313 | | | $ | 3,657 | | |
Trade accounts receivable | 1,100 | | | 892 | | |
Income and other tax receivables | 578 | | | 520 | | |
| | | | |
Inventories: | | | | |
Materials and supplies, net | 1,616 | | | 1,594 | | |
Mill and leach stockpiles | 1,006 | | | 1,014 | | |
Product | 1,596 | | | 1,285 | | |
Other current assets | 390 | | | 341 | | |
| | | | |
Total current assets | 12,599 | | | 9,303 | | |
| Property, plant, equipment and mine development costs, net | 29,836 | | | 29,818 | | |
| | | | |
| | | | |
| Long-term mill and leach stockpiles | 1,473 | | | 1,463 | | |
| | | | |
| | | | |
| Other assets | 1,528 | | | 1,560 | | |
| | | | |
| Total assets | $ | 45,436 | | | $ | 42,144 | | |
| | | | |
| LIABILITIES AND EQUITY | | | | |
| Current liabilities: | | | | |
Accounts payable and accrued liabilities | $ | 3,106 | | | $ | 2,708 | | |
Current portion of debt | 1,057 | | | 34 | | |
Accrued income taxes | 919 | | | 324 | | |
Current portion of environmental and asset retirement obligations | 334 | | | 351 | | |
Dividends payable | 111 | | | — | | |
| | | | |
Total current liabilities | 5,527 | | | 3,417 | | |
| Long-term debt, less current portion | 8,638 | | | 9,677 | | |
| Deferred income taxes | 4,486 | | | 4,408 | | |
| Environmental and asset retirement obligations, less current portion | 3,721 | | | 3,705 | | |
| Other liabilities | 2,129 | | | 2,269 | | |
| | | | |
Total liabilities | 24,501 | | | 23,476 | | |
| | | | |
| | | | |
| | | | |
| Equity: | | | | |
Stockholders' equity: | | | | |
Common stock | 160 | | | 159 | | |
Capital in excess of par value | 26,084 | | | 26,037 | | |
Accumulated deficit | (9,880) | | | (11,681) | | |
Accumulated other comprehensive loss | (576) | | | (583) | | |
Common stock held in treasury | (3,777) | | | (3,758) | | |
Total stockholders' equity | 12,011 | | | 10,174 | | |
Noncontrolling interestsa | 8,924 | | | 8,494 | | |
Total equity | 20,935 | | | 18,668 | | |
| Total liabilities and equity | $ | 45,436 | | | $ | 42,144 | | |
| | | | |
a.Includes $4.6 billion associated with the December 2018 PT-FI transaction, including $4.1 billion associated with the PT Indonesia Asahan Aluminium (Persero) acquisition of Rio Tinto's joint venture interest.
| | | | | | | | | | | | | | | | | | | | | |
| Freeport-McMoRan Inc. |
| CONSOLIDATED STATEMENTS OF CASH FLOWS (Unaudited) |
| | | | | | | |
| | | | Six Months Ended | |
| | | | June 30, | |
| | | | | | 2021 | | 2020 | |
| | | | | | (In Millions) | |
| Cash flow from operating activities: | | | | | | | | | |
| Net income (loss) | | | | | | $ | 2,284 | | | $ | (425) | | |
| Adjustments to reconcile net income (loss) to net cash provided by operating activities: | | | | | | | | | |
Depreciation, depletion and amortization | | | | | | 902 | | | 699 | | |
| | | | | | | | | |
Metals inventory adjustments | | | | | | 1 | | | 83 | | |
| | | | | | | | | |
| Net (gain) loss on sales of assets | | | | | | (3) | | | 11 | | |
Stock-based compensation | | | | | | 56 | | | 43 | | |
| | | | | | | | | |
Net charges for environmental and asset retirement obligations, including accretion | | | | | | 94 | | | 112 | | |
Payments for environmental and asset retirement obligations | | | | | | (110) | | | (119) | | |
| | | | | | | | | |
Net charges for defined pension and postretirement plans | | | | | | 1 | | | 45 | | |
Pension plan contributions | | | | | | (42) | | | (29) | | |
Net loss on early extinguishment of debt | | | | | | — | | | 41 | | |
Deferred income taxes | | | | | | 79 | | | (28) | | |
| | | | | | | | | |
| | | | | | | | | |
| | | | | | | | | |
| | | | | | | | | |
| | | | | | | | | |
| | | | | | | | | |
Charges for Cerro Verde royalty dispute | | | | | | 9 | | | 15 | | |
Payments for Cerro Verde royalty dispute | | | | | | (65) | | | (90) | | |
| | | | | | | | | |
Other, net | | | | | | 77 | | | (46) | | |
Changes in working capital and other: | | | | | | | | | |
Accounts receivable | | | | | | (279) | | | 83 | | |
Inventories | | | | | | (299) | | | 168 | | |
Other current assets | | | | | | (12) | | | (4) | | |
Accounts payable and accrued liabilities | | | | | | 272 | | | (73) | | |
Accrued income taxes and timing of other tax payments | | | | | | 505 | | | (33) | | |
| Net cash provided by operating activities | | | | | | 3,470 | | | 453 | | |
| | | | | | | | | |
| Cash flow from investing activities: | | | | | | | | | |
Capital expenditures: | | | | | | | | | |
North America copper mines | | | | | | (95) | | | (332) | | |
South America | | | | | | (47) | | | (125) | | |
Indonesia | | | | | | (624) | | | (634) | | |
Molybdenum mines | | | | | | (3) | | | (11) | | |
Other | | | | | | (34) | | | (35) | | |
| | | | | | | | | |
| | | | | | | | | |
| | | | | | | | | |
| | | | | | | | | |
| | | | | | | | | |
| Proceeds from sales of assets | | | | | | 16 | | | 116 | | a |
| Acquisition of minority interest in PT Smelting | | | | | | (33) | | | — | | |
Other, net | | | | | | (13) | | | (5) | | |
Net cash used in investing activities | | | | | | (833) | | | (1,026) | | |
| | | | | | | | | |
| Cash flow from financing activities: | | | | | | | | | |
Proceeds from debt | | | | | | 160 | | | 1,585 | | |
Repayments of debt | | | | | | (179) | | | (1,527) | | |
| | | | | | | | | |
| | | | | | | | | |
| | | | | | | | | |
Cash dividends and distributions paid: | | | | | | | | | |
| Common stock | | | | | | (111) | | | (73) | | |
Noncontrolling interests | | | | | | (93) | | | — | | |
Contributions from noncontrolling interests | | | | | | 88 | | | 74 | | |
| Proceeds from exercised stock options | | | | | | 184 | | | 1 | | |
| Payments for withholding of employee taxes related to stock-based awards | | | | | | (19) | | | (5) | | |
Debt financing costs and other, net | | | | | | (1) | | | (31) | | |
| | | | | | | | | |
| Net cash provided by financing activities | | | | | | 29 | | | 24 | | |
| | | | | | | | | |
| Net increase (decrease) in cash, cash equivalents, restricted cash and restricted cash equivalents | | | | | | 2,666 | | | (549) | | |
| | | | | | | | | |
Cash, cash equivalents, restricted cash and restricted cash equivalents at beginning of year | | | | | | 3,903 | | | 2,278 | | |
Cash, cash equivalents, restricted cash and restricted cash equivalents at end of periodb | | | | | | $ | 6,569 | | | $ | 1,729 | | |
| | | | | | | | | |
a.Includes $60 million in contingent consideration associated with the 2016 sale of TF Holdings Limited because the average cobalt price exceeded $20 per pound during the 24-month period ending December 31, 2019. Also includes the collection of $45 million related to the sale of the Timok exploration assets in Serbia that were sold in late 2019.
b.Includes restricted cash and restricted cash equivalents of $256 million at June 30, 2021, and $264 million at June 30, 2020.
Freeport-McMoRan Inc.
ADJUSTED NET INCOME (LOSS)
Adjusted net income (loss) is intended to provide investors and others with information about FCX's recurring operating performance. This information differs from net income (loss) attributable to common stock determined in accordance with U.S. generally accepted accounting principles (GAAP) and should not be considered in isolation or as a substitute for measures of performance determined in accordance with U.S. GAAP. FCX's adjusted net income (loss) follows, which may not be comparable to similarly titled measures reported by other companies (in millions, except per share amounts).
| | | | | | | | | | | | | | | | | | | | | | | | | | | | | | | | | | | | | | |
| Three Months Ended June 30, | |
| 2021 | | 2020 | |
| Pre-tax | | After-taxa | | Per Share | | Pre-tax | | After-taxa | | Per Share | |
| Net income attributable to common stock | N/A | | $ | 1,083 | | | $ | 0.73 | | | N/A | | $ | 53 | | | $ | 0.03 | | |
| | | | | | | | | | | | |
| | | | | | | | | | | | |
| | | | | | | | | | | | |
| | | | | | | | | | | | |
| | | | | | | | | | | | |
| | | | | | | | | | | | |
| | | | | | | | | | | | |
| Cerro Verde labor agreement | $ | (69) | | | $ | (22) | | | $ | (0.01) | | | $ | — | | | $ | — | | | $ | — | | |
| PT-FI charges | (32) | | b | (28) | | | (0.02) | | | — | | | — | | | — | | |
Metals inventory adjustments | — | | | — | | | — | | | 139 | | | 101 | | | 0.07 | | |
| COVID-19 related costs | — | | | — | | | — | | | (114) | | c | (71) | | | (0.05) | | |
| Employee separation program | — | | | — | | | — | | | (82) | | d | (73) | | | (0.05) | | |
| Other net credits | 10 | | e | 10 | | | 0.01 | | | 16 | | f | 10 | | | 0.01 | | |
| | | | | | | | | | | | |
Net adjustments to environmental obligations and related litigation reserves | (20) | | | (20) | | | (0.01) | | | (1) | | | (1) | | | — | | |
| Net gain on sales of assets | 3 | | | 3 | | | — | | | — | | | — | | | — | | |
Net loss on early extinguishment of debt | — | | | — | | | — | | | (9) | | | (9) | | | (0.01) | | |
Net tax creditsg | N/A | | — | | | — | | | N/A | | 53 | | | 0.04 | | |
| | | | | | | | | | | | |
| $ | (107) | | h | $ | (56) | | h | $ | (0.04) | | h | $ | (52) | | h | $ | 9 | | h | $ | 0.01 | | |
| | | | | | | | | | | | |
| Adjusted net income attributable to common stock | N/A | | $ | 1,139 | | | $ | 0.77 | | | N/A | | $ | 44 | | | $ | 0.03 | | h |
| | | | | | | | | | | | | | | | | | | | | | | | | | | | | | | | | | | | | | |
| Six Months Ended June 30, | |
| 2021 | | 2020 | |
| Pre-tax | | After-taxa | | Per Share | | Pre-tax | | After-taxa | | Per Share | |
| Net income (loss) attributable to common stock | N/A | | $ | 1,801 | | | $ | 1.21 | | | N/A | | $ | (438) | | | $ | (0.30) | | |
| | | | | | | | | | | | |
| | | | | | | | | | | | |
| | | | | | | | | | | | |
| | | | | | | | | | | | |
| | | | | | | | | | | | |
| | | | | | | | | | | | |
| | | | | | | | | | | | |
| Cerro Verde labor agreement | $ | (69) | | | $ | (22) | | | $ | (0.01) | | | $ | — | | | $ | — | | | $ | — | | |
| PT-FI charges | (54) | | b | (48) | | | (0.03) | | | — | | | — | | | — | | |
Metals inventory adjustments | (1) | | | (1) | | | — | | | (83) | | | (81) | | | (0.06) | | |
| COVID-19 related costs | — | | | — | | | — | | | (142) | | c | (80) | | | (0.06) | | |
| Employee separation program | — | | | — | | | — | | | (82) | | d | (73) | | | (0.05) | | |
| Other net (charges) credits | (13) | | e | (10) | | | (0.01) | | | — | | | 2 | | | — | | |
| | | | | | | | | | | | |
Net adjustments to environmental obligations and related litigation reserves | (17) | | | (17) | | | (0.01) | | | (15) | | | (15) | | | (0.01) | | |
| Net gain (loss) on sales of assets | 3 | | | 3 | | | — | | | (11) | | | (11) | | | (0.01) | | |
Net loss on early extinguishment of debt | — | | | — | | | — | | | (41) | | | (41) | | | (0.03) | | |
Net tax creditsg | N/A | | — | | | — | | | N/A | | 52 | | | 0.04 | | |
| | | | | | | | | | | | |
| $ | (151) | | | $ | (94) | | h | $ | (0.06) | | | $ | (375) | | h | $ | (247) | | | $ | (0.17) | | h |
| | | | | | | | | | | | |
| Adjusted net income (loss) attributable to common stock | N/A | | $ | 1,895 | | | $ | 1.28 | | h | N/A | | $ | (191) | | | $ | (0.13) | | |
a.Reflects impact to FCX net income (loss) attributable to common stock (i.e., net of any taxes and noncontrolling interests).
b.Reflects charges associated with contested matters at PT-FI (including historical tax audits and an administrative fine levied by the Indonesia government) and asset impairments, which were recorded to production and delivery ($17 million in second-quarter 2021 and $30 million for the first six months of 2021), interest expense, net ($4 million in second-quarter 2021 and $8 million for the first six months of 2021) and other income, net ($11 million in second-quarter 2021 and $16 million for the first six months of 2021).
c.Includes charges recorded to production and delivery ($93 million in second-quarter 2020 and $113 million for the first six months of 2020) and to depreciation, depletion and amortization ($21 million in second-quarter 2020 and $29 million for the first six months of 2020) associated with idle facility costs, contract cancellation and other charges directly related to the COVID-19 pandemic.
d.The second quarter and first six months of 2020 include employee separation costs recorded to production and delivery ($60 million), selling, general and administrative ($15 million), and mining exploration and research ($7 million).
e.Second-quarter 2021 includes credits recorded to production and delivery ($10 million) associated with asset retirement obligation adjustments. The first six months of 2021 also include other net charges recorded to production and delivery ($23 million), primarily associated with employee separation charges, international tax matters and asset retirement obligation adjustments.
f.Includes other net credits totaling $1 million to production and delivery, $1 million to interest expense, net and $14 million to other income, net.
g.Refer to "Income Taxes" below for further discussion of net tax credits.
h.Does not foot because of rounding.
Freeport-McMoRan Inc.
INCOME TAXES
Following is a summary of the approximate amounts used in the calculation of FCX's consolidated income tax provision (in millions, except percentages):
| | | | | | | | | | | | | | | | | | | | | | | | | | | | | | | | | | | | | | |
| Three Months Ended June 30, | |
| 2021 | | 2020 | |
| | | | | Income Tax | | | | | | Income Tax | |
| Income | | Effective | | (Provision) | | Income | | Effective | | (Provision) | |
| (Loss)a | | Tax Rate | | Benefit | | (Loss)a | | Tax Rate | | Benefit | |
U.S.b | $ | 558 | | | 1% | | $ | (3) | | c | $ | (130) | | | 42% | | $ | 54 | | d |
| South America | 430 | | | 38% | | (162) | | | 145 | | | 31% | | (45) | | |
| Indonesia | 1,002 | | | 40% | | (404) | |
| 188 | | | 42% | | (79) | |
|
| | | | | | | | | | | | |
| | | | | | | | | | | | |
| | | | | | | | | | | | |
| | | | | | | | | | | | |
| | | | | | | | | | | | |
| | | | | | | | | | | | |
| Eliminations and other | (62) | | | N/A | | 1 | | | 14 | | | N/A | | (5) | | |
Rate adjustmente | — | | | N/A | | (35) | | | — | | | N/A | | (21) | | |
| Continuing operations | $ | 1,928 | | | 31% | f | $ | (603) | | | $ | 217 | | | 44% | f,h | $ | (96) | | |
| | | | | | | | | | | | |
| | | | | | | | | | | | |
| | | | | | | | | | | | | | | | | | | | | | | | | | | | | | | | | | | | | | |
| Six Months Ended June 30, | |
| 2021 | | 2020 | |
| | | | | Income Tax | | | | | | Income Tax | |
| Income | | Effective | | (Provision) | | Income | | Effective | | (Provision) | |
| (Loss)a | | Tax Rate | | Benefit | | (Loss)a | | Tax Rate | | Benefit | |
U.S.b | $ | 743 | | | —% | | $ | (3) | | c | $ | (581) | | | 10% | | $ | 58 | | d |
| South America | 923 | | | 39% | | (356) | | | (57) | | | 58% | | 33 | | |
| Indonesia | 1,759 | | | 41% | | (719) | |
| 169 | | | 54% | | (91) | | g |
| | | | | | | | | | | | |
| | | | | | | | | | | | |
| | | | | | | | | | | | |
| | | | | | | | | | | | |
| | | | | | | | | | | | |
| | | | | | | | | | | | |
| Eliminations and other | (99) | | | N/A | | 5 | | | 74 | | | N/A | | (16) | | |
Rate adjustmente | — | | | N/A | | 27 | | | — | | | N/A | | (20) | | |
| Continuing operations | $ | 3,326 | | | 31% | f | $ | (1,046) | | | $ | (395) | | | (9)% | f,h | $ | (36) | | |
a.Represents income (loss) before income taxes and equity in affiliated companies' net earnings.
b.In addition to FCX's North America mining operations, the U.S. jurisdiction reflects corporate-level expenses, which include interest expense associated with senior notes, general and administrative expenses, and environmental obligations and shutdown costs.
c.Includes valuation allowance release on prior year unbenefited net operating losses.
d.The second quarter and first six months of 2020 include a tax credit of $53 million associated with the reversal of a year-end 2019 tax charge related to the sale of FCX's interest in the lower zone of the Timok exploration project in Serbia. The first six months of 2020 also includes a tax credit of $6 million associated with the removal of a valuation allowance on deferred tax assets.
e.In accordance with applicable accounting rules, FCX adjusts its interim provision for income taxes equal to its consolidated tax rate.
f.FCX's consolidated effective income tax rate is a function of the combined effective tax rates for the jurisdictions in which it operates.
g.Includes a tax charge of $8 million ($7 million net of noncontrolling interest) associated with an unfavorable 2012 Indonesia Supreme Court ruling.
h.FCX's U.S. jurisdiction generated net losses for the 2020 periods that did not result in a realized tax benefit; applicable accounting rules required FCX to adjust its estimated annual effective tax rate to exclude the impact of U.S. net losses.
Assuming achievement of current sales volume and cost estimates and average prices of $4.25 per pound for copper, $1,800 per ounce for gold and $16.00 per pound for molybdenum for the second half of 2021, FCX estimates its consolidated effective tax rate for the year 2021 would approximate 31 percent. Changes in projected sales volumes and average prices during 2021 would incur tax impacts at estimated effective rates of 40 percent for Peru, 38 percent for Indonesia and 0 percent for the U.S.
Freeport-McMoRan Inc.
NET DEBT
Net debt, which FCX defines as consolidated debt less consolidated cash and cash equivalents, is intended to provide investors with information related to the performance-based payout framework in FCX’s financial policy, which requires achievement of a net debt target in the range of $3 billion to $4 billion (excluding project debt for additional smelting capacity in Indonesia). This information differs from consolidated debt determined in accordance with U.S. GAAP and should not be considered in isolation or as a substitute for consolidated debt determined in accordance with U.S. GAAP. FCX's net debt follows, which may not be comparable to similarly titled measures
reported by other companies (in millions):
| | | | | | | | | | | | | | |
| As of June 30, 2021 | | As of December 31, 2020 | |
| Current portion of debt | $ | 1,057 | | | $ | 34 | | |
| Long-term debt, less current portion | 8,638 | | | 9,677 | | |
| Consolidated debt | 9,695 | | | 9,711 | | |
| Less: consolidated cash and cash equivalents | 6,313 | | | 3,657 | | |
| Net debt | $ | 3,382 | | | $ | 6,054 | | |
DERIVATIVE INSTRUMENTS
For the six months ended June 30, 2021, FCX's mined copper was sold 59 percent in concentrate, 21 percent as cathode and 20 percent as rod from North America operations. Substantially all of FCX's copper concentrate and cathode sales contracts provide final copper pricing in a specified future month (generally one to four months from the shipment date) based primarily on quoted London Metal Exchange (LME) monthly average copper prices. FCX records revenues and invoices customers at the time of shipment based on then-current LME prices, which results in an embedded derivative on provisionally priced concentrate and cathode sales that is adjusted to fair value through earnings each period, using the period-end forward prices, until final pricing on the date of settlement. LME copper settlement prices averaged $4.40 per pound during second-quarter 2021 and settled at $4.26 per pound on June 30, 2021. Because a significant portion of FCX's copper concentrate and cathode sales in any quarterly period usually remain subject to final pricing, the quarter-end forward price is a major determinant of the average recorded copper price for the period. FCX's average realized copper price was $4.34 per pound in second-quarter 2021.
Following is a summary of the adjustments to prior period and current period provisionally priced copper sales (in millions, except per share amounts):
| | | | | | | | | | | | | | | | | | | | | | | | | | | | | | | | | | | |
| Three Months Ended June 30, |
| 2021 | | 2020 |
| Prior Perioda | | Current Periodb | | Total | | Prior Perioda | | Current Periodb | | Total |
Revenues | $ | 173 | | | $ | (55) | | | $ | 118 | | | $ | 55 | | | $ | 107 | | | $ | 162 | |
| Net income attributable to common stock | $ | 66 | | | $ | (25) | | | $ | 41 | | | $ | 19 | | | $ | 43 | | | $ | 62 | |
| Net income per share of common stock | $ | 0.05 | | | $ | (0.02) | | | $ | 0.03 | | | $ | 0.01 | | | $ | 0.03 | | | $ | 0.04 | |
a.Reflects adjustments to provisionally priced copper sales at March 31, 2021 and 2020.
b.Reflects adjustments to provisionally priced copper sales during the second quarters 2021 and 2020.
| | | | | | | | | | | | | | | | | | | | | | | | | | | | | | | | | | | |
| Six Months Ended June 30, |
| 2021 | | 2020 |
| Prior Perioda | | Current Periodb | | Total | | Prior Perioda | | Current Periodb | | Total |
Revenues | $ | 169 | | | $ | 156 | | | $ | 325 | | | $ | (102) | | | $ | 26 | | | $ | (76) | |
| Net income attributable to common stock | $ | 65 | | | $ | 55 | | | $ | 120 | | | $ | (43) | | | $ | 6 | | | $ | (37) | |
| Net income per share of common stock | $ | 0.04 | | | $ | 0.04 | | | $ | 0.08 | | | $ | (0.03) | | | $ | — | | | $ | (0.03) | |
a.Reflects adjustments to provisionally priced copper sales at December 31, 2021 and 2020.
b.Reflects adjustments to provisionally priced copper sales for the first six months of 2021 and 2020.
At June 30, 2021, FCX had provisionally priced copper sales at its copper mining operations totaling 368 million pounds of copper (net of intercompany sales and noncontrolling interests) recorded at an average price of $4.25 per pound, subject to final pricing over the next several months. FCX estimates that each $0.05 change in the price realized from the quarter-end provisional price would have an approximate $12 million effect on 2021 net income attributable to common stock. The LME copper price settled at $4.21 per pound on July 21, 2021.
DEFERRED PROFITS
FCX defers recognizing profits on sales from its mining operations to Atlantic Copper and on 39.5 percent of PT-FI's sales to PT Smelting (PT-FI's 39.5 percent-owned Indonesia smelting unit) until final sales to third parties occur. Changes in these deferrals attributable to variability in intercompany volumes resulted in net (reductions) additions to operating income (loss) totaling $(99) million ($(81) million to net income attributable to common stock) in second-quarter 2021 and $(17) million ($(6) million to net income attributable to common stock) in second-quarter 2020, $(185) million ($(145) million to net income attributable to common stock) for the first six months of 2021 and $(6) million ($1 million to net loss attributable to common stock) for the first six months of 2020. FCX's net deferred profits on its inventories at Atlantic Copper and PT Smelting to be recognized in future periods' net income attributable to common stock totaled $207 million at June 30, 2021. Quarterly variations in ore grades, the timing of intercompany shipments and changes in product prices will result in variability in FCX's net deferred profits and quarterly earnings. FCX currently estimates that approximately 40 percent of the net deferred profit balance will be recognized as income in the second half of 2021.
BUSINESS SEGMENTS
FCX has organized its mining operations into four primary divisions – North America copper mines, South America mining, Indonesia mining and Molybdenum mines, and operating segments that meet certain thresholds are reportable segments. Separately disclosed in the following tables are FCX's reportable segments, which include the Morenci, Cerro Verde and Grasberg (Indonesia Mining) copper mines, the Rod & Refining operations and Atlantic Copper Smelting & Refining.
Intersegment sales between FCX’s business segments are based on terms similar to arms-length transactions with third parties at the time of the sale. Intersegment sales may not be reflective of the actual prices ultimately realized because of a variety of factors, including additional processing, the timing of sales to unaffiliated customers and transportation premiums.
FCX allocates certain operating costs, expenses and capital expenditures to its operating divisions and individual segments. However, not all costs and expenses applicable to an operation are allocated. U.S. federal and state income taxes are recorded and managed at the corporate level (included in Corporate, Other & Eliminations), whereas foreign income taxes are recorded and managed at the applicable country level. In addition, most mining exploration and research activities are managed on a consolidated basis, and those costs along with some selling, general and administrative costs, are not allocated to the operating divisions or individual segments. Accordingly, the following segment information reflects management determinations that may not be indicative of what the actual financial performance of each operating division or segment would be if it was an independent entity.
Freeport-McMoRan Inc.
BUSINESS SEGMENTS (continued)
| | | | | | | | | | | | | | | | | | | | | | | | | | | | | | | | | | | | | | | | | | | | | | | | | | | | | | | | | | | | | | | | | | | | | | | | | | | | | | | | | |
| (In millions) | | | | | | | | | | | | | | | | | | | | | |
| | | | | | | | | | | | | | | | | | | | | | | | | Atlantic | | Corporate, | | | | | | |
| North America Copper Mines | | South America Mining | | | | | | | | | | Copper | | Other | | | | | | |
| | | | | | | | | Cerro | | | | | | | | Indonesia | | | | Molybdenum | | Rod & | | Smelting | | & Elimi- | | FCX | | | | |
| Morenci | | | | Other | | Total | | Verde | | | | Other | | Total | | Mining | | | | Mines | | Refining | | & Refining | | nations | | Total | | | | |
| Three Months Ended June 30, 2021 | | | | | | | | | | | | | | | | | | | | | | | | | | | | | | | |
| Revenues: | | | | | | | | | | | | | | | | | | | | | | | | | | | | | | | | | |
| Unaffiliated customers | $ | 57 | | | | | $ | 55 | | | $ | 112 | | | $ | 825 | | | | | $ | 188 | | | $ | 1,013 | | | $ | 1,753 | | a | | | $ | — | | | $ | 1,689 | | | $ | 794 | | | $ | 387 | | b | $ | 5,748 | | | | | |
| Intersegment | 721 | | | | | 1,021 | | | 1,742 | | | 120 | | | | | — | | | 120 | | | 56 | | | | | 89 | | | 6 | | | — | | | (2,013) | | | — | | | | | |
| Production and delivery | 351 | | | | | 574 | | | 925 | | | 494 | | c | | | 106 | | | 600 | | | 528 | | | | | 56 | | | 1,691 | | | 775 | | | (1,508) | | d | 3,067 | | | | | |
| Depreciation, depletion and amortization | 40 | | | | | 61 | | | 101 | | | 82 | | | | | 12 | | | 94 | | | 247 | | | | | 17 | | | 1 | | | 8 | | | 15 | | | 483 | | | | | |
| | | | | | | | | | | | | | | | | | | | | | | | | | | | | | | | | |
| Selling, general and administrative expenses | 1 | | | | | — | | | 1 | | | 2 | | | | | — | | | 2 | | | 27 | | | | | — | | | — | | | 5 | | | 52 | | | 87 | | | | | |
| Mining exploration and research expenses | — | | | | | — | | | — | | | — | | | | | — | | | — | | | — | | | | | — | | | — | | | — | | | 14 | | | 14 | | | | | |
| Environmental obligations and shutdown costs | 1 | | | | | — | | | 1 | | | — | | | | | — | | | — | | | — | | | | | — | | | — | | | — | | | 32 | | | 33 | | | | | |
| | | | | | | | | | | | | | | | | | | | | | | | | | | | | | | | | |
| Net gain on sales of assets | — | | | | | — | | | — | | | — | | | | | — | | | — | | | — | | | | | — | | | — | | | — | | | (3) | | | (3) | | | | | |
| Operating income (loss) | 385 | | | | | 441 | | | 826 | | | 367 | | | | | 70 | | | 437 | | | 1,007 | | | | | 16 | | | 3 | | | 6 | | | (228) | | | 2,067 | | | | | |
| | | | | | | | | | | | | | | | | | | | | | | | | | | | | | | | | |
| Interest expense, net | — | | | | | — | | | — | | | 12 | | | | | — | | | 12 | | | 6 | | | | | — | | | — | | | 2 | | | 128 | | | 148 | | | | | |
| Provision for income taxes | — | | | | | — | | | — | | | 145 | | | | | 17 | | | 162 | | | 404 | | | | | — | | | — | | | — | | | 37 | | | 603 | | | | | |
| Total assets at June 30, 2021 | 2,635 | | | | | 5,288 | | | 7,923 | | | 8,795 | | | | | 1,795 | | | 10,590 | | | 18,461 | | | | | 1,740 | | | 271 | | | 1,117 | | | 5,334 | | | 45,436 | | | | | |
| Capital expenditures | 22 | | | | | 47 | | | 69 | | | 23 | | | | | 3 | | | 26 | | | 314 | | | | | 2 | | | — | | | 7 | | | 15 | | | 433 | | | | | |
| | | | | | | | | | | | | | | | | | | | | | | | | | | | | | | | | |
| Three Months Ended June 30, 2020 | | | | | | | | | | | | | | | | | | | | | | | | | | | | | | | |
| Revenues: | | | | | | | | | | | | | | | | | | | | | | | | | | | | | | | | | |
| Unaffiliated customers | $ | 20 | | | | | $ | 16 | | | $ | 36 | | | $ | 471 | | | | | $ | 106 | | | $ | 577 | | | $ | 683 | | a | | | $ | — | | | $ | 1,106 | | | $ | 464 | | | $ | 188 | | b | $ | 3,054 | | | | | |
| Intersegment | 447 | | | | | 505 | | | 952 | | e | 52 | | | | | — | | | 52 | | | 35 | | | | | 58 | | | 8 | | | 2 | | | (1,107) | | | — | | | | | |
| Production and delivery | 348 | | | | | 439 | | | 787 | | | 334 | | | | | 104 | | | 438 | | | 378 | | | | | 61 | | | 1,138 | | | 446 | | | (854) | | | 2,394 | | | | | |
| Depreciation, depletion and amortization | 43 | | | | | 46 | | | 89 | | | 88 | | | | | 14 | | | 102 | | | 124 | | | | | 15 | | | 6 | | | 7 | | | 15 | | | 358 | | | | | |
| | | | | | | | | | | | | | | | | | | | | | | | | | | | | | | | | |
| Metals inventory adjustments | — | | | | | (89) | | | (89) | | | — | | | | | (57) | | | (57) | | | — | | | | | 1 | | | 1 | | | — | | | 5 | | | (139) | | | | | |
| Selling, general and administrative expenses | — | | | | | 1 | | | 1 | | | 1 | | | | | — | | | 1 | | | 28 | | | | | — | | | — | | | 5 | | | 56 | | | 91 | | | | | |
| Mining exploration and research expenses | — | | | | | 1 | | | 1 | | | — | | | | | — | | | — | | | — | | | | | — | | | — | | | — | | | 17 | | | 18 | | | | | |
| Environmental obligations and shutdown costs | — | | | | | — | | | — | | | — | | | | | — | | | — | | | — | | | | | — | | | — | | | — | | | 11 | | | 11 | | | | | |
| | | | | | | | | | | | | | | | | | | | | | | | | | | | | | | | | |
| | | | | | | | | | | | | | | | | | | | | | | | | | | | | | | | | |
| Operating income (loss) | 76 | | | | | 123 | | | 199 | | | 100 | | | | | 45 | | | 145 | | | 188 | | | | | (19) | | | (31) | | | 8 | | | (169) | | | 321 | | | | | |
| | | | | | | | | | | | | | | | | | | | | | | | | | | | | | | | | |
| Interest expense, net | 1 | | | | | — | | | 1 | | | 20 | | | | | — | | | 20 | | | 1 | | | | | — | | | — | | | 1 | | | 92 | | | 115 | | | | | |
| Provision for (benefit from) income taxes | — | | | | | — | | | — | | | 29 | | | | | 16 | | | 45 | | | 78 | | | | | — | | | — | | | 1 | | | (28) | | | 96 | | | | | |
| Total assets at June 30, 2020 | 2,697 | | | | | 5,198 | | | 7,895 | | | 8,515 | | | | | 1,631 | | | 10,146 | | | 16,848 | | | | | 1,777 | | | 259 | | | 726 | | | 2,579 | | | 40,230 | | | | | |
| Capital expenditures | 27 | | | | | 121 | | | 148 | | | 31 | | | | | 20 | | | 51 | | | 308 | | | | | 4 | | | 2 | | | 5 | | | 9 | | | 527 | | | | | |
a.Includes PT-FI's sales to PT Smelting totaling $756 million in second-quarter 2021 and $433 million in second-quarter 2020.
b.Includes revenues from FCX's molybdenum sales company, which includes sales of molybdenum produced by the Molybdenum mines and by certain of the North America and South America copper mines.
c.Includes nonrecurring charges totaling $69 million associated with labor-related charges at Cerro Verde for agreements reached with 57 percent of its hourly employees.
d.Includes charges associated with the major maintenance turnaround at the Miami smelter totaling $19 million.
e.Includes hedging losses totaling $24 million related to forward sales contracts covering 150 million pounds of copper sales for May and June 2020 at a fixed price of $2.34 per pound.
Freeport-McMoRan Inc.
BUSINESS SEGMENTS (continued)
| | | | | | | | | | | | | | | | | | | | | | | | | | | | | | | | | | | | | | | | | | | | | | | | | | | | | | | | | | | | | | | | | | | | | | | | | | | | | | | | | | | | | | | |
| (In millions) | | | | | | | | | | | | | | | | | | | | | | | |
| | | | | | | | | | | | | | | | | | | | | | | | | Atlantic | | Corporate, | | | | | | | | |
| North America Copper Mines | | South America Mining | | | | | | | | | | Copper | | Other | | | | | | | | |
| | | | | | | | | Cerro | | | | | | | | Indonesia | | | | Molybdenum | | Rod & | | Smelting | | & Elimi- | | FCX | | | | | | |
| Morenci | | | | Other | | Total | | Verde | | | | Other | | Total | | Mining | | | | Mines | | Refining | | & Refining | | nations | | Total | | | | | | |
| Six months ended June 30, 2021 | | | | | | | | | | | | | | | | | | | | | | | | | | | | | | | | | |
| Revenues: | | | | | | | | | | | | | | | | | | | | | | | | | | | | | | | | | | | |
| Unaffiliated customers | $ | 61 | | | | | $ | 83 | | | $ | 144 | | | $ | 1,742 | | | | | $ | 363 | | | $ | 2,105 | | | $ | 3,136 | | a | | | $ | — | | | $ | 2,998 | | | $ | 1,481 | | | $ | 734 | | b | $ | 10,598 | | | | | | | |
| Intersegment | 1,285 | | | | | 1,763 | | | 3,048 | | | 165 | | | | | — | | | 165 | | | 108 | | | | | 159 | | | 13 | | | — | | | (3,493) | | | — | | | | | | | |
| Production and delivery | 620 | | | | | 1,054 | | | 1,674 | | | 930 | | c | | | 209 | | | 1,139 | | | 983 | | | | | 113 | | | 3,007 | | | 1,448 | | | (2,511) | | d | 5,853 | | | | | | | |
| Depreciation, depletion and amortization | 74 | | | | | 107 | | | 181 | | | 171 | | | | | 24 | | | 195 | | | 446 | | | | | 32 | | | 2 | | | 15 | | | 31 | | | 902 | | | | | | | |
| Metals inventory adjustments | — | | | | | — | | | — | | | — | | | | | — | | | — | | | — | | | | | 1 | | | — | | | — | | | — | | | 1 | | | | | | | |
| Selling, general and administrative expenses | 1 | | | | | 1 | | | 2 | | | 4 | | | | | — | | | 4 | | | 53 | | | | | — | | | — | | | 12 | | | 116 | | | 187 | | | | | | | |
| Mining exploration and research expenses | — | | | | | — | | | — | | | — | | | | | — | | | — | | | — | | | | | — | | | — | | | — | | | 21 | | | 21 | | | | | | | |
| Environmental obligations and shutdown costs | 1 | | | | | — | | | 1 | | | — | | | | | — | | | — | | | — | | | | | — | | | — | | | — | | | 37 | | | 38 | | | | | | | |
| | | | | | | | | | | | | | | | | | | | | | | | | | | | | | | | | | | |
| Net gain on sales of assets | — | | | | | — | | | — | | | — | | | | | — | | | — | | | — | | | | | — | | | — | | | — | | | (3) | | | (3) | | | | | | | |
| Operating income (loss) | 650 | | | | | 684 | | | 1,334 | | | 802 | | | | | 130 | | | 932 | | | 1,762 | | | | | 13 | | | 2 | | | 6 | | | (450) | | | 3,599 | | | | | | | |
| | | | | | | | | | | | | | | | | | | | | | | | | | | | | | | | | | | |
| Interest expense, net | — | | | | | — | | | — | | | 25 | | | | | — | | | 25 | | | 7 | | | | | — | | | — | | | 3 | | | 258 | | | 293 | | | | | | | |
| Provision for (benefit from) income taxes | — | | | | | — | | | — | | | 318 | | | | | 38 | | | 356 | | | 719 | | | | | — | | | — | | | — | | | (29) | | | 1,046 | | | | | | | |
| | | | | | | | | | | | | | | | | | | | | | | | | | | | | | | | | | | |
| Capital expenditures | 32 | | | | | 63 | | | 95 | | | 43 | | | | | 4 | | | 47 | | | 624 | | | | | 3 | | | 1 | | | 13 | | | 20 | | | 803 | | | | | | | |
| | | | | | | | | | | | | | | | | | | | | | | | | | | | | | | | | | | |
| Six months ended June 30, 2020 | | | | | | | | | | | | | | | | | | | | | | | | | | | | | | | | | |
| Revenues: | | | | | | | | | | | | | | | | | | | | | | | | | | | | | | | | | | | |
| Unaffiliated customers | $ | 22 | | | | | $ | 23 | | | $ | 45 | | | $ | 847 | | | | | $ | 204 | | | $ | 1,051 | | | $ | 1,128 | | a | | | $ | — | | | $ | 2,221 | | | $ | 893 | | | $ | 514 | | b | $ | 5,852 | | | | | | | |
| Intersegment | 889 | | | | | 1,039 | | | 1,928 | | e | 90 | | | | | — | | | 90 | | | 35 | | | | | 129 | | | 16 | | | 13 | | | (2,211) | | | — | | | | | | | |
| Production and delivery | 697 | | | | | 950 | | | 1,647 | | | 758 | | | | | 214 | | | 972 | | | 721 | | | | | 127 | | | 2,257 | | | 857 | | | (1,642) | | | 4,939 | | | | | | | |
| Depreciation, depletion and amortization | 87 | | | | | 94 | | | 181 | | | 181 | | | | | 29 | | | 210 | | | 225 | | | | | 31 | | | 8 | | | 14 | | | 30 | | | 699 | | | | | | | |
| | | | | | | | | | | | | | | | | | | | | | | | | | | | | | | | | | | |
| Metals inventory adjustments | 4 | | | | | 52 | | | 56 | | | — | | | | | 3 | | | 3 | | | — | | | | | 5 | | | 1 | | | — | | | 18 | | | 83 | | | | | | | |
| Selling, general and administrative expenses | 1 | | | | | 1 | | | 2 | | | 3 | | | | | — | | | 3 | | | 56 | | | | | — | | | — | | | 10 | | | 130 | | | 201 | | | | | | | |
| Mining exploration and research expenses | — | | | | | 2 | | | 2 | | | — | | | | | — | | | — | | | — | | | | | — | | | — | | | — | | | 32 | | | 34 | | | | | | | |
| Environmental obligations and shutdown costs | — | | | | | — | | | — | | | — | | | | | — | | | — | | | — | | | | | — | | | 1 | | | — | | | 36 | | | 37 | | | | | | | |
| | | | | | | | | | | | | | | | | | | | | | | | | | | | | | | | | | | |
| Net loss on sales of assets | — | | | | | — | | | — | | | — | | | | | — | | | — | | | — | | | | | — | | | — | | | — | | | 11 | | | 11 | | | | | | | |
| Operating income (loss) | 122 | | | | | (37) | | | 85 | | | (5) | | | | | (42) | | | (47) | | | 161 | | | | | (34) | | | (30) | | | 25 | | | (312) | | | (152) | | | | | | | |
| | | | | | | | | | | | | | | | | | | | | | | | | | | | | | | | | | | |
| Interest expense, net | 2 | | | | | — | | | 2 | | | 48 | | | | | — | | | 48 | | | 2 | | | | | — | | | — | | | 4 | | | 186 | | | 242 | | | | | | | |
| (Benefit from) provision for income taxes | — | | | | | — | | | — | | | (23) | | | | | (10) | | | (33) | | | 90 | | | | | — | | | — | | | 1 | | | (22) | | | 36 | | | | | | | |
| | | | | | | | | | | | | | | | | | | | | | | | | | | | | | | | | | | |
| Capital expenditures | 71 | | | | | 261 | | | 332 | | | 90 | | | | | 35 | | | 125 | | | 634 | | | | | 11 | | | 4 | | | 11 | | | 20 | | | 1,137 | | | | | | | |
a.Includes PT-FI's sales to PT Smelting totaling $1.5 billion for the first six months of 2021 and $813 million for the first six months of 2020.
b.Includes revenues from FCX's molybdenum sales company, which includes sales of molybdenum produced by the Molybdenum mines and by certain of the North America and South America copper mines.
c.Includes nonrecurring charges totaling $69 million associated with labor-related charges at Cerro Verde for agreements reached with 57 percent of its hourly employees.
d.Includes charges associated with the major maintenance turnaround at the Miami Smelter totaling $87 million.
e.Includes hedging losses totaling $24 million related to forward sales contracts covering 150 million pounds of copper sales for May and June 2020 at a fixed price of $2.34 per pound.
Freeport-McMoRan Inc.
PRODUCT REVENUES AND PRODUCTION COSTS
Unit net cash costs per pound of copper and molybdenum are measures intended to provide investors with information about the cash-generating capacity of FCX's mining operations expressed on a basis relating to the primary metal product for the respective operations. FCX uses this measure for the same purpose and for monitoring operating performance by its mining operations. This information differs from measures of performance determined in accordance with U.S. GAAP and should not be considered in isolation or as a substitute for measures of performance determined in accordance with U.S. GAAP. These measures are presented by other metals mining companies, although FCX's measures may not be comparable to similarly titled measures reported by other companies.
FCX presents gross profit (loss) per pound of copper in the following tables using both a “by-product” method and a “co-product” method. FCX uses the by-product method in its presentation of gross profit (loss) per pound of copper because (i) the majority of its revenues are copper revenues, (ii) it mines ore, which contains copper, gold, molybdenum and other metals, (iii) it is not possible to specifically assign all of FCX's costs to revenues from the copper, gold, molybdenum and other metals it produces and (iv) it is the method used by FCX's management and Board of Directors to monitor FCX's mining operations and to compare mining operations in certain industry publications. In the co-product method presentations, shared costs are allocated to the different products based on their relative revenue values, which will vary to the extent FCX's metals sales volumes and realized prices change.
FCX shows revenue adjustments for prior period open sales as a separate line item. Because these adjustments do not result from current period sales, these amounts have been reflected separately from revenues on current period sales. Noncash and other costs, which are removed from site production and delivery costs in the calculation of unit net cash costs, consist of items such as stock-based compensation costs, long-lived asset impairments, idle facility costs, restructuring and/or unusual charges. As discussed above, gold, molybdenum and other metal revenues at copper mines are reflected as credits against site production and delivery costs in the by-product method. The following schedules are presentations under both the by-product and co-product methods together with reconciliations to amounts reported in FCX's consolidated financial statements.
| | | | | | | | | | | | | | | | | | | | | | | | | | | | | | | | | | | |
| Freeport-McMoRan Inc. |
| PRODUCT REVENUES AND PRODUCTION COSTS (continued) |
|
| North America Copper Mines Product Revenues, Production Costs and Unit Net Cash Costs |
| | | | | |
| Three Months Ended June 30, 2021 | | | | | |
| (In millions) | | By-Product | | Co-Product Method | |
| | Method | | Copper | | Molybdenuma | | Otherb | | Total | |
| Revenues, excluding adjustments | | $ | 1,717 | | | $ | 1,717 | | | $ | 97 | | | $ | 32 | | | $ | 1,846 | | |
Site production and delivery, before net noncash
and other costs shown below | | 833 | | | 789 | | | 56 | | | 18 | | | 863 | | |
| By-product credits | | (99) | | | — | | | — | | | — | | | — | | |
| Treatment charges | | 31 | | | 29 | | | — | | | 2 | | | 31 | | |
| Net cash costs | | 765 | | | 818 | | | 56 | | | 20 | | | 894 | | |
| Depreciation, depletion and amortization (DD&A) | | 102 | | | 95 | | | 5 | | | 2 | | | 102 | | |
| | | | | | | | | | | |
| Noncash and other costs, net | | 31 | | | 30 | | | 1 | | | — | | | 31 | | |
| Total costs | | 898 | | | 943 | | | 62 | | | 22 | | | 1,027 | | |
Other revenue adjustments, primarily for pricing
on prior period open sales | | 8 | | | 8 | | | — | | | — | | | 8 | | |
| Gross profit | | $ | 827 | | | $ | 782 | | | $ | 35 | | | $ | 10 | | | $ | 827 | | |
| | | | | | | | | | | |
| Copper sales (millions of recoverable pounds) | | 389 | | | 389 | | | | | | | | |
Molybdenum sales (millions of recoverable pounds)a | | | | | | 9 | | | | | | |
| | | | | | | | | | | |
| Gross profit per pound of copper/molybdenum: | | | | | | | |
| | | | | | | | | | | |
| Revenues, excluding adjustments | | $ | 4.42 | | | $ | 4.42 | | | $ | 11.75 | | | | | | |
Site production and delivery, before net noncash
and other costs shown below | | 2.14 | | | 2.03 | | | 6.86 | | | | | | |
| By-product credits | | (0.25) | | | — | | | — | | | | | | |
| Treatment charges | | 0.08 | | | 0.07 | | | — | | | | | | |
| Unit net cash costs | | 1.97 | | | 2.10 | | | 6.86 | | | | | | |
| DD&A | | 0.26 | | | 0.25 | | | 0.55 | | | | | | |
| | | | | | | | | | | |
| Noncash and other costs, net | | 0.08 | | | 0.08 | | | 0.06 | | | | | | |
| Total unit costs | | 2.31 | | | 2.43 | | | 7.47 | | | | | | |
Other revenue adjustments, primarily for pricing
on prior period open sales | | 0.02 | | | 0.02 | | | — | | | | | | |
| Gross profit per pound | | $ | 2.13 | | | $ | 2.01 | | | $ | 4.28 | | | | | | |
| | | | | | | | | | | |
| Reconciliation to Amounts Reported | | | | | | | | | |
| | | | | | | | | | | |
| | | | Production | | | | | | | |
| | Revenues | | and Delivery | | DD&A | | | | | |
| Totals presented above | | $ | 1,846 | | | $ | 863 | | | $ | 102 | | | | | | |
| Treatment charges | | (12) | | | 19 | | | — | | | | | | |
| Noncash and other costs, net | | — | | | 31 | | | — | | | | | | |
Other revenue adjustments, primarily for pricing
on prior period open sales | | 8 | | | — | | | — | | | | | | |
| Eliminations and other | | 12 | | | 12 | | | (1) | | | | | | |
| North America copper mines | | 1,854 | | | 925 | | | 101 | | | | | | |
Other miningc | | 5,520 | | | 3,650 | | | 367 | | | | | | |
| | | | | | | | | | | |
| | | | | | | | | | | |
| Corporate, other & eliminations | | (1,626) | | | (1,508) | | | 15 | | | | | | |
| As reported in FCX's consolidated financial statements | | $ | 5,748 | | | $ | 3,067 | | | $ | 483 | | | | | | |
| | | | | | | | | | | |
a.Reflects sales of molybdenum produced by certain of the North America copper mines to FCX's molybdenum sales company at market-based pricing.
b.Includes gold and silver product revenues and production costs.
c.Represents the combined total for FCX's other mining operations as presented in the supplemental schedule, "Business Segments," beginning on page X.
| | | | | | | | | | | | | | | | | | | | | | | | | | | | | | | | | | | |
| Freeport-McMoRan Inc. |
| PRODUCT REVENUES AND PRODUCTION COSTS (continued) |
|
| North America Copper Mines Product Revenues, Production Costs and Unit Net Cash Costs |
| | | | | |
| Three Months Ended June 30, 2020 | | | | | |
| (In millions) | | By-Product | | Co-Product Method | |
| | Method | | Copper | | Molybdenuma | | Otherb | | Total | |
| Revenues, excluding adjustments | | $ | 888 | | c | $ | 888 | | | $ | 71 | | | $ | 18 | | | $ | 977 | | |
Site production and delivery, before net noncash
and other costs shown below | | 678 | | | 636 | | | 57 | | | 10 | | | 703 | | |
| By-product credits | | (64) | | | — | | | — | | | — | | | — | | |
| Treatment charges | | 37 | | | 36 | | | — | | | 1 | | | 37 | | |
Net cash costs | | 651 | | | 672 | | | 57 | | | 11 | | | 740 | | |
| DD&A | | 88 | | | 82 | | | 5 | | | 1 | | | 88 | | |
| Metals inventory adjustments | | (89) | | | (89) | | | — | | | — | | | (89) | | |
| Noncash and other costs, net | | 36 | | d | 34 | | | 1 | | | 1 | | | 36 | | |
Total costs | | 686 | | | 699 | | | 63 | | | 13 | | | 775 | | |
Other revenue adjustments, primarily for pricing
on prior period open sales | | 6 | | | 6 | | | — | | | — | | | 6 | | |
| Gross profit | | $ | 208 | | | $ | 195 | | | $ | 8 | | | $ | 5 | | | $ | 208 | | |
| | | | | | | | | | | |
| Copper sales (millions of recoverable pounds) | | 368 | | | 368 | | | | | | | | |
Molybdenum sales (millions of recoverable pounds)a | | | | | 9 | | | | | | |
| | | | | | | | | | | |
| Gross profit per pound of copper/molybdenum: | | | | | | | |
| | | | | | | | | | | |
| Revenues, excluding adjustments | | $ | 2.42 | | c | $ | 2.42 | | | $ | 8.33 | | | | | | |
Site production and delivery, before net noncash
and other costs shown below | | 1.85 | | | 1.73 | | | 6.76 | | | | | | |
| By-product credits | | (0.17) | | | — | | | — | | | | | | |
| Treatment charges | | 0.10 | | | 0.10 | | | — | | | | | | |
Unit net cash costs | | 1.78 | | | 1.83 | | | 6.76 | | | | | | |
| DD&A | | 0.24 | | | 0.22 | | | 0.55 | | | | | | |
| Metals inventory adjustments | | (0.24) | | | (0.24) | | | — | | | | | | |
| Noncash and other costs, net | | 0.09 | | d | 0.09 | | | 0.08 | | | | | | |
Total unit costs | | 1.87 | | | 1.90 | | | 7.39 | | | | | | |
Other revenue adjustments, primarily for pricing
on prior period open sales | | 0.02 | | | 0.02 | | | — | | | | | | |
| Gross profit per pound | | $ | 0.57 | | | $ | 0.54 | | | $ | 0.94 | | | | | | |
| | | | | | | | | | | |
| Reconciliation to Amounts Reported | | | | | | | | | | | |
| | | | | | | | Metals | | | |
| | | | Production | | | | Inventory | | | |
| | Revenues | | and Delivery | | DD&A | | Adjustments | | | |
| Totals presented above | | $ | 977 | | | $ | 703 | | | $ | 88 | | | $ | (89) | | | | |
| Treatment charges | | (2) | | | 35 | | | — | | | — | | | | |
| Noncash and other costs, net | | — | | | 36 | | | — | | | — | | | | |
Other revenue adjustments, primarily for pricing
on prior period open sales | | 6 | | | — | | | — | | | — | | | | |
| Eliminations and other | | 7 | | | 13 | | | 1 | | | — | | | | |
| North America copper mines | | 988 | | | 787 | | | 89 | | | (89) | | | | |
Other mininge | | 2,985 | | | 2,461 | | | 254 | | | (55) | | | | |
| | | | | | | | | | | |
| | | | | | | | | | | |
| Corporate, other & eliminations | | (919) | | | (854) | | | 15 | | | 5 | | | | |
| As reported in FCX's consolidated financial statements | | $ | 3,054 | | | $ | 2,394 | | | $ | 358 | | | $ | (139) | | | | |
| | | | | | | | | | | |
a.Reflects sales of molybdenum produced by certain of the North America copper mines to FCX's molybdenum sales company at market-based pricing.
b.Includes gold and silver product revenues and production costs.
c.Includes reductions to revenues and average realized prices totaling $24 million ($0.06 per pound of copper) related to forward sales contracts covering 150 million pounds of copper sales for May and June 2020 at a fixed price of $2.34 per pound.
d.Includes charges totaling $22 million ($0.06 per pound of copper) primarily associated with the April 2020 revised operating plans (including employee separation costs) and the COVID-19 pandemic.
e.Represents the combined total for FCX's other mining operations as presented in the supplemental schedule, "Business Segments," beginning on page X.
| | | | | | | | | | | | | | | | | | | | | | | | | | | | | | | | | | | |
| Freeport-McMoRan Inc. |
| PRODUCT REVENUES AND PRODUCTION COSTS (continued) |
|
| North America Copper Mines Product Revenues, Production Costs and Unit Net Cash Costs |
| | | | | |
| Six months ended June 30, 2021 | | | | | |
| (In millions) | | By-Product | | Co-Product Method | |
| | Method | | Copper | | Molybdenuma | | Otherb | | Total | |
| Revenues, excluding adjustments | | $ | 2,919 | | | $ | 2,919 | | | 185 | | | 67 | | | 3,171 | | |
Site production and delivery, before net noncash
and other costs shown below | | 1,459 | | | 1,369 | | | 113 | | | 40 | | | 1,522 | | |
| By-product credits | | (189) | | | — | | | — | | | — | | | — | | |
| Treatment charges | | 63 | | | 60 | | | — | | | 3 | | | 63 | | |
| Net cash costs | | 1,333 | | | 1,429 | | | 113 | | | 43 | | | 1,585 | | |
| DD&A | | 181 | | | 169 | | | 8 | | | 4 | | | 181 | | |
| | | | | | | | | | | |
| Noncash and other costs, net | | 73 | | | 71 | | | 1 | | | 1 | | | 73 | | |
| Total costs | | 1,587 | | | 1,669 | | | 122 | | | 48 | | | 1,839 | | |
Other revenue adjustments, primarily for pricing
on prior period open sales | | 7 | | | 7 | | | — | | | — | | | 7 | | |
| Gross profit | | $ | 1,339 | | | $ | 1,257 | | | $ | 63 | | | $ | 19 | | | $ | 1,339 | | |
| | | | | | | | | | | |
| Copper sales (millions of recoverable pounds) | | 697 | | | 697 | | | | | | | | |
Molybdenum sales (millions of recoverable pounds)a | | | | | | 17 | | | | | | |
| | | | | | | | | | | |
| Gross profit per pound of copper/molybdenum: | | | | | | | |
| | | | | | | | | | | |
| Revenues, excluding adjustments | | $ | 4.19 | | | $ | 4.19 | | | $ | 11.12 | | | | | | |
Site production and delivery, before net noncash
and other costs shown below | | 2.09 | | | 1.96 | | | 6.76 | | | | | | |
| By-product credits | | (0.27) | | | — | | | — | | | | | | |
| Treatment charges | | 0.09 | | | 0.09 | | | — | | | | | | |
| Unit net cash costs | | 1.91 | | | 2.05 | | | 6.76 | | | | | | |
| DD&A | | 0.26 | | | 0.24 | | | 0.51 | | | | | | |
| | | | | | | | | | | |
| Noncash and other costs, net | | 0.11 | | | 0.11 | | | 0.06 | | | | | | |
| Total unit costs | | 2.28 | | | 2.40 | | | 7.33 | | | | | | |
Other revenue adjustments, primarily for pricing
on prior period open sales | | 0.01 | | | 0.01 | | | — | | | | | | |
| Gross profit per pound | | $ | 1.92 | | | $ | 1.80 | | | $ | 3.79 | | | | | | |
| | | | | | | | | | | |
| Reconciliation to Amounts Reported | | | | | | | | | |
| | | | | | | | | | | |
| | | | Production | | | | | | | |
| | Revenues | | and Delivery | | DD&A | | | | | |
| Totals presented above | | $ | 3,171 | | | $ | 1,522 | | | $ | 181 | | | | | | |
| Treatment charges | | (17) | | | 46 | | | — | | | | | | |
| Noncash and other costs, net | | — | | | 73 | | | — | | | | | | |
Other revenue adjustments, primarily for pricing
on prior period open sales | | 7 | | | — | | | — | | | | | | |
| Eliminations and other | | 31 | | | 33 | | | — | | | | | | |
| North America copper mines | | 3,192 | | | 1,674 | | | 181 | | | | | | |
Other miningc | | 10,165 | | | 6,690 | | | 690 | | | | | | |
| | | | | | | | | | | |
| | | | | | | | | | | |
| Corporate, other & eliminations | | (2,759) | | | (2,511) | | | 31 | | | | | | |
| As reported in FCX's consolidated financial statements | | $ | 10,598 | | | $ | 5,853 | | | $ | 902 | | | | | | |
| | | | | | | | | | | |
a.Reflects sales of molybdenum produced by certain of the North America copper mines to FCX's molybdenum sales company at market-based pricing.
b.Includes gold and silver product revenues and production costs.
c.Represents the combined total for FCX's other mining operations as presented in the supplemental schedule, "Business Segments," beginning on page X.
| | | | | | | | | | | | | | | | | | | | | | | | | | | | | | | | | | | |
| Freeport-McMoRan Inc. |
| PRODUCT REVENUES AND PRODUCTION COSTS (continued) |
|
| North America Copper Mines Product Revenues, Production Costs and Unit Net Cash Costs |
| | | | | |
| Six months ended June 30, 2020 | | | | | |
| (In millions) | | By-Product | | Co-Product Method | |
| | Method | | Copper | | Molybdenuma | | Otherb | | Total | |
| Revenues, excluding adjustments | | $ | 1,799 | | c | $ | 1,799 | | | 147 | | | 44 | | | 1,990 | | |
Site production and delivery, before net noncash
and other costs shown below | | 1,439 | | | 1,333 | | | 128 | | | 28 | | | 1,489 | | |
| By-product credits | | (141) | | | — | | | — | | | — | | | — | | |
| Treatment charges | | 76 | | | 73 | | | — | | | 3 | | | 76 | | |
| Net cash costs | | 1,374 | | | 1,406 | | | 128 | | | 31 | | | 1,565 | | |
| DD&A | | 180 | | | 166 | | | 10 | | | 4 | | | 180 | | |
| Metals inventory adjustments | | 56 | | | 54 | | | — | | | 2 | | | 56 | | |
| Noncash and other costs, net | | 69 | | d | 65 | | | 2 | | | 2 | | | 69 | | |
| Total costs | | 1,679 | | | 1,691 | | | 140 | | | 39 | | | 1,870 | | |
Other revenue adjustments, primarily for pricing
on prior period open sales | | (22) | | | (22) | | | — | | | — | | | (22) | | |
| Gross profit | | $ | 98 | | | $ | 86 | | | $ | 7 | | | $ | 5 | | | $ | 98 | | |
| | | | | | | | | | | |
| Copper sales (millions of recoverable pounds) | | 722 | | | 722 | | | | | | | | |
Molybdenum sales (millions of recoverable pounds)a | | | | | | 17 | | | | | | |
| | | | | | | | | | | |
| Gross profit per pound of copper/molybdenum: | | | | | | | |
| | | | | | | | | | | |
| Revenues, excluding adjustments | | $ | 2.50 | | c | $ | 2.50 | | | $ | 8.99 | | | | | | |
Site production and delivery, before net noncash
and other costs shown below | | 2.00 | | | 1.85 | | | 7.81 | | | | | | |
| By-product credits | | (0.19) | | | — | | | — | | | | | | |
| Treatment charges | | 0.10 | | | 0.10 | | | — | | | | | | |
| Unit net cash costs | | 1.91 | | | 1.95 | | | 7.81 | | | | | | |
| DD&A | | 0.25 | | | 0.23 | | | 0.64 | | | | | | |
| Metals inventory adjustments | | 0.08 | | | 0.07 | | | — | | | | | | |
| Noncash and other costs, net | | 0.09 | | d | 0.09 | | | 0.15 | | | | | | |
| Total unit costs | | 2.33 | | | 2.34 | | | 8.60 | | | | | | |
Other revenue adjustments, primarily for pricing
on prior period open sales | | (0.03) | | | (0.03) | | | — | | | | | | |
| Gross profit per pound | | $ | 0.14 | | | $ | 0.13 | | | $ | 0.39 | | | | | | |
| | | | | | | | | | | |
| Reconciliation to Amounts Reported | | | | | | | | | |
| | | | | | | | Metals | | | |
| | | | Production | | | | Inventory | | | |
| | Revenues | | and Delivery | | DD&A | | Adjustments | | | |
| Totals presented above | | $ | 1,990 | | | $ | 1,489 | | | $ | 180 | | | $ | 56 | | | | |
| Treatment charges | | (10) | | | 66 | | | — | | | — | | | | |
| Noncash and other costs, net | | — | | | 69 | | | — | | | — | | | | |
Other revenue adjustments, primarily for pricing
on prior period open sales | | (22) | | | — | | | — | | | — | | | | |
| Eliminations and other | | 15 | | | 23 | | | 1 | | | — | | | | |
| North America copper mines | | 1,973 | | | 1,647 | | | 181 | | | 56 | | | | |
Other mininge | | 5,576 | | | 4,934 | | | 488 | | | 9 | | | | |
| | | | | | | | | | | |
| | | | | | | | | | | |
| Corporate, other & eliminations | | (1,697) | | | (1,642) | | | 30 | | | 18 | | | | |
| As reported in FCX's consolidated financial statements | | $ | 5,852 | | | $ | 4,939 | | | $ | 699 | | | $ | 83 | | | | |
| | | | | | | | | | | |
a.Reflects sales of molybdenum produced by certain of the North America copper mines to FCX's molybdenum sales company at market-based pricing.
b.Includes gold and silver product revenues and production costs.
c.Includes reductions to revenues and average realized prices totaling $24 million ($0.03 per pound of copper) related to forward sales contracts covering 150 million pounds of copper sales for May and June 2020 at a fixed price of $2.34 per pound.
d.Includes charges totaling $22 million ($0.03 per pound of copper) primarily associated with the April 2020 revised operating plans (including employee separation costs) and the COVID-19 pandemic.
e.Represents the combined total for FCX's other mining operations as presented in the supplemental schedule, "Business Segments," beginning on page X.
| | | | | | | | | | | | | | | | | | | | | | | | | | |
| Freeport-McMoRan Inc. |
| PRODUCT REVENUES AND PRODUCTION COSTS (continued) |
|
| South America Mining Product Revenues, Production Costs and Unit Net Cash Costs |
| | | | |
| Three Months Ended June 30, 2021 | | | | |
| (In millions) | | By-Product | | Co-Product Method |
| | Method | | Copper | | Othera | | Total |
| Revenues, excluding adjustments | | $ | 995 | | | $ | 995 | | | $ | 82 | | | $ | 1,077 | |
Site production and delivery, before net noncash
and other costs shown below | | 573 | | b | 531 | | | 52 | | | 583 | |
| By-product credits | | (72) | | | — | | | — | | | — | |
| Treatment charges | | 29 | | | 29 | | | — | | | 29 | |
| Royalty on metals | | 2 | | | 2 | | | — | | | 2 | |
| Net cash costs | | 532 | | | 562 | | | 52 | | | 614 | |
| DD&A | | 94 | | | 86 | | | 8 | | | 94 | |
| | | | | | | | |
| Noncash and other costs, net | | 18 | | | 17 | | | 1 | | | 18 | |
| Total costs | | 644 | | | 665 | | | 61 | | | 726 | |
Other revenue adjustments, primarily for pricing
on prior period open sales | | 88 | | | 88 | | | — | | | 88 | |
| Gross profit | | $ | 439 | | | $ | 418 | | | $ | 21 | | | $ | 439 | |
| | | | | | | | |
| Copper sales (millions of recoverable pounds) | | 230 | | | 230 | | | | | |
| | | | | | | | |
| Gross profit per pound of copper: | | | | |
| | | | | | | | |
| Revenues, excluding adjustments | | $ | 4.31 | | | $ | 4.31 | | | | | |
Site production and delivery, before net noncash
and other costs shown below | | 2.48 | | b | 2.30 | | | | | |
| By-product credits | | (0.31) | | | — | | | | | |
| Treatment charges | | 0.13 | | | 0.13 | | | | | |
| Royalty on metals | | 0.01 | | | 0.01 | | | | | |
| Unit net cash costs | | 2.31 | | | 2.44 | | | | | |
| DD&A | | 0.40 | | | 0.37 | | | | | |
| | | | | | | | |
| Noncash and other costs, net | | 0.08 | | | 0.07 | | | | | |
| Total unit costs | | 2.79 | | | 2.88 | | | | | |
Other revenue adjustments, primarily for pricing
on prior period open sales | | 0.38 | | | 0.38 | | | | | |
| Gross profit per pound | | $ | 1.90 | | | $ | 1.81 | | | | | |
| | | | | | | | |
| Reconciliation to Amounts Reported | | | | | | | | |
| | | | | | | | |
| | | | Production | | | | |
| | Revenues | | and Delivery | | DD&A | | |
| Totals presented above | | $ | 1,077 | | | $ | 583 | | | $ | 94 | | | |
| Treatment charges | | (29) | | | — | | | — | | | |
| Royalty on metals | | (2) | | | — | | | — | | | |
| Noncash and other costs, net | | — | | | 18 | | | — | | | |
Other revenue adjustments, primarily for pricing
on prior period open sales | | 88 | | | — | | | — | | | |
| Eliminations and other | | (1) | | | (1) | | | — | | | |
| South America mining | | 1,133 | | | 600 | | | 94 | | | |
Other miningc | | 6,241 | | | 3,975 | | | 374 | | | |
| | | | | | | | |
| | | | | | | | |
| Corporate, other & eliminations | | (1,626) | | | (1,508) | | | 15 | | | |
| As reported in FCX's consolidated financial statements | | $ | 5,748 | | | $ | 3,067 | | | $ | 483 | | | |
| | | | | | | | |
a.Includes silver sales of 0.8 million ounces ($27.33 per ounce average realized price). Also reflects sales of molybdenum produced by Cerro Verde to FCX's molybdenum sales company at market-based pricing.
b.Includes nonrecurring charges totaling $69 million ($0.30 per pound of copper) associated with labor related charges at Cerro Verde for agreements reached with 57 percent of its hourly employees.
c.Represents the combined total for FCX's other mining operations as presented in the supplemental schedule, "Business Segments," beginning on page X.
| | | | | | | | | | | | | | | | | | | | | | | | | | | | | |
| Freeport-McMoRan Inc. |
| PRODUCT REVENUES AND PRODUCTION COSTS (continued) |
|
| South America Mining Product Revenues, Production Costs and Unit Net Cash Costs |
| | | | | |
| Three Months Ended June 30, 2020 | | | | | |
| (In millions) | | By-Product | | Co-Product Method | |
| | Method | | Copper | | Othera | | Total | |
| Revenues, excluding adjustments | | $ | 586 | | | $ | 586 | | | $ | 32 | | | $ | 618 | | |
Site production and delivery, before net noncash
and other costs shown below | | 360 | | | 343 | | | 24 | | | 367 | | |
| By-product credits | | (25) | | | — | | | — | | | — | | |
| Treatment charges | | 32 | | | 32 | | | — | | | 32 | | |
| Royalty on metals | | 1 | | | 1 | | | — | | | 1 | | |
| Net cash costs | | 368 | | | 376 | | | 24 | | | 400 | | |
| DD&A | | 103 | | | 98 | | | 5 | | | 103 | | |
| Metals inventory adjustments | | (57) | | | (57) | | | — | | | (57) | | |
| Noncash and other costs, net | | 71 | | b | 67 | | | 4 | | | 71 | | |
| Total costs | | 485 | | | 484 | | | 33 | | | 517 | | |
Other revenue adjustments, primarily for pricing
on prior period open sales | | 44 | | | 44 | | | — | | | 44 | | |
| Gross profit (loss) | | $ | 145 | | | $ | 146 | | | $ | (1) | | | $ | 145 | | |
| | | | | | | | | |
| Copper sales (millions of recoverable pounds) | | 219 | | | 219 | | | | | | |
| | | | | | | | | |
| Gross profit per pound of copper: | | | | | |
| | | | | | | | | |
| Revenues, excluding adjustments | | $ | 2.67 | | | $ | 2.67 | | | | | | |
Site production and delivery, before net noncash
and other costs shown below | | 1.64 | | | 1.57 | | | | | | |
| By-product credits | | (0.11) | | | — | | | | | | |
| Treatment charges | | 0.15 | | | 0.15 | | | | | | |
| Royalty on metals | | — | | | — | | | | | | |
| Unit net cash costs | | 1.68 | | | 1.72 | | | | | | |
| DD&A | | 0.47 | | | 0.44 | | | | | | |
| Metals inventory adjustments | | (0.26) | | | (0.26) | | | | | | |
| Noncash and other costs, net | | 0.32 | | b | 0.30 | | | | | | |
| Total unit costs | | 2.21 | | | 2.20 | | | | | | |
Other revenue adjustments, primarily for pricing
on prior period open sales | | 0.20 | | | 0.20 | | | | | | |
| Gross profit per pound | | $ | 0.66 | | | $ | 0.67 | | | | | | |
| | | | | | | | | |
| Reconciliation to Amounts Reported | | | | | | | | | |
| | | | | | | | Metals | |
| | | | Production | | | | Inventory | |
| | Revenues | | and Delivery | | DD&A | | Adjustments | |
| Totals presented above | | $ | 618 | | | $ | 367 | | | $ | 103 | | | $ | (57) | | |
| Treatment charges | | (32) | | | — | | | — | | | — | | |
| Royalty on metals | | (1) | | | — | | | — | | | — | | |
| Noncash and other costs, net | | — | | | 71 | | | — | | | — | | |
Other revenue adjustments, primarily for pricing
on prior period open sales | | 44 | | | — | | | — | | | — | | |
| Eliminations and other | | — | | | — | | | (1) | | | — | | |
| South America mining | | 629 | | | 438 | | | 102 | | | (57) | | |
Other miningc | | 3,344 | | | 2,810 | | | 241 | | | (87) | | |
| | | | | | | | | |
| | | | | | | | | |
| Corporate, other & eliminations | | (919) | | | (854) | | | 15 | | | 5 | | |
| As reported in FCX's consolidated financial statements | | $ | 3,054 | | | $ | 2,394 | | | $ | 358 | | | $ | (139) | | |
| | | | | | | | | |
a.Includes silver sales of 0.6 million ounces ($14.55 per ounce average realized price). Also reflects sales of molybdenum produced by Cerro Verde to FCX's molybdenum sales company at market-based pricing.
b.Includes charges totaling $66 million ($0.30 per pound of copper), primarily associated with idle facility (Cerro Verde) and contract cancellation costs related to the COVID-19 pandemic, and employee separation costs associated with the April 2020 revised operating plans.
c.Represents the combined total for FCX's other mining operations as presented in the supplemental schedule, "Business Segments," beginning on page X.
| | | | | | | | | | | | | | | | | | | | | | | | | | | | | |
| Freeport-McMoRan Inc. |
| PRODUCT REVENUES AND PRODUCTION COSTS (continued) |
| |
| South America Mining Product Revenues, Production Costs and Unit Net Cash Costs |
| | | | | |
| Six months ended June 30, 2021 | | | | | |
| (In millions) | | By-Product | | Co-Product Method | |
| | Method | | Copper | | Othera | | Total | |
| Revenues, excluding adjustments | | $ | 2,093 | | | $ | 2,093 | | | $ | 147 | | | $ | 2,240 | | |
Site production and delivery, before net noncash
and other costs shown below | | 1,092 | | b | 1,022 | | | 91 | | | 1,113 | | |
| By-product credits | | (126) | | | — | | | — | | | — | | |
| Treatment charges | | 64 | | | 64 | | | — | | | 64 | | |
| Royalty on metals | | 4 | | | 4 | | | — | | | 4 | | |
| Net cash costs | | 1,034 | | | 1,090 | | | 91 | | | 1,181 | | |
| DD&A | | 195 | | | 181 | | | 14 | | | 195 | | |
| | | | | | | | | |
| Noncash and other costs, net | | 28 | | | 26 | | | 2 | | | 28 | | |
| Total costs | | 1,257 | | | 1,297 | | | 107 | | | 1,404 | | |
Other revenue adjustments, primarily for pricing
on prior period open sales | | 99 | | | 99 | | | — | | | 99 | | |
| Gross profit | | $ | 935 | | | $ | 895 | | | $ | 40 | | | $ | 935 | | |
| | | | | | | | | |
| Copper sales (millions of recoverable pounds) | | 489 | | | 489 | | | | | | |
| | | | | | | | | |
| Gross profit per pound of copper: | | | | | |
| | | | | | | | | |
| Revenues, excluding adjustments | | $ | 4.28 | | | $ | 4.28 | | | | | | |
Site production and delivery, before net noncash
and other costs shown below | | 2.23 | | b | 2.09 | | | | | | |
| By-product credits | | (0.26) | | | — | | | | | | |
| Treatment charges | | 0.13 | | | 0.13 | | | | | | |
| Royalty on metals | | 0.01 | | | 0.01 | | | | | | |
| Unit net cash costs | | 2.11 | | | 2.23 | | | | | | |
| DD&A | | 0.40 | | | 0.37 | | | | | | |
| | | | | | | | | |
| Noncash and other costs, net | | 0.06 | | | 0.05 | | | | | | |
| Total unit costs | | 2.57 | | | 2.65 | | | | | | |
Other revenue adjustments, primarily for pricing
on prior period open sales | | 0.20 | | | 0.20 | | | | | | |
| Gross profit per pound | | $ | 1.91 | | | $ | 1.83 | | | | | | |
| | | | | | | | | |
| Reconciliation to Amounts Reported | | | | | | | | | |
| | | | | | | | | |
| | | | Production | | | | | |
| | Revenues | | and Delivery | | DD&A | | | |
| Totals presented above | | $ | 2,240 | | | $ | 1,113 | | | $ | 195 | | | | |
| Treatment charges | | (64) | | | — | | | — | | | | |
| Royalty on metals | | (4) | | | — | | | — | | | | |
| Noncash and other costs, net | | — | | | 28 | | | — | | | | |
Other revenue adjustments, primarily for pricing
on prior period open sales | | 99 | | | — | | | — | | | | |
| Eliminations and other | | (1) | | | (2) | | | — | | | | |
| South America mining | | 2,270 | | | 1,139 | | | 195 | | | | |
Other miningc | | 11,087 | | | 7,225 | | | 676 | | | | |
| | | | | | | | | |
| | | | | | | | | |
| Corporate, other & eliminations | | (2,759) | | | (2,511) | | | 31 | | | | |
| As reported in FCX's consolidated financial statements | | $ | 10,598 | | | $ | 5,853 | | | $ | 902 | | | | |
| | | | | | | | | |
a.Includes silver sales of 1.7 million ounces ($26.67 per ounce average realized price). Also reflects sales of molybdenum produced by Cerro Verde to FCX's molybdenum sales company at market-based pricing.
b.Includes nonrecurring charges totaling $69 million ($0.14 per pound of copper) associated with labor related charges at Cerro Verde for agreements reached with 57 percent of its hourly employees.
c.Represents the combined total for FCX's other mining operations as presented in the supplemental schedule, "Business Segments," beginning on page X.
| | | | | | | | | | | | | | | | | | | | | | | | | | | | | |
| Freeport-McMoRan Inc. |
| PRODUCT REVENUES AND PRODUCTION COSTS (continued) |
|
| South America Mining Product Revenues, Production Costs and Unit Net Cash Costs |
| | | | | |
| Six months ended June 30, 2020 | | | | | |
| (In millions) | | By-Product | | Co-Product Method | |
| | Method | | Copper | | Othera | | Total | |
| Revenues, excluding adjustments | | $ | 1,199 | | | $ | 1,199 | | | $ | 86 | | | $ | 1,285 | | |
Site production and delivery, before net noncash
and other costs shown below | | 853 | | | 800 | | | 73 | | | 873 | | |
| By-product credits | | (66) | | | — | | | — | | | — | | |
| Treatment charges | | 72 | | | 72 | | | — | | | 72 | | |
| Royalty on metals | | 2 | | | 2 | | | — | | | 2 | | |
| Net cash costs | | 861 | | | 874 | | | 73 | | | 947 | | |
| DD&A | | 210 | | | 195 | | | 15 | | | 210 | | |
| Metals inventory adjustments | | 3 | | | 3 | | | — | | | 3 | | |
| Noncash and other costs, net | | 100 | | b | 95 | | | 5 | | | 100 | | |
| Total costs | | 1,174 | | | 1,167 | | | 93 | | | 1,260 | | |
Other revenue adjustments, primarily for pricing
on prior period open sales | | (70) | | | (70) | | | — | | | (70) | | |
| Gross loss | | $ | (45) | | | $ | (38) | | | $ | (7) | | | $ | (45) | | |
| | | | | | | | | |
| Copper sales (millions of recoverable pounds) | | 466 | | | 466 | | | | | | |
| | | | | | | | | |
| Gross loss per pound of copper: | | | | | |
| | | | | | | | | |
| Revenues, excluding adjustments | | $ | 2.57 | | | $ | 2.57 | | | | | | |
Site production and delivery, before net noncash
and other costs shown below | | 1.84 | | | 1.72 | | | | | | |
| By-product credits | | (0.14) | | | — | | | | | | |
| Treatment charges | | 0.15 | | | 0.15 | | | | | | |
| Royalty on metals | | — | | | — | | | | | | |
| Unit net cash costs | | 1.85 | | | 1.87 | | | | | | |
| DD&A | | 0.45 | | | 0.42 | | | | | | |
| Metals inventory adjustments | | 0.01 | | | 0.01 | | | | | | |
| Noncash and other costs, net | | 0.21 | | b | 0.20 | | | | | | |
| Total unit costs | | 2.52 | | | 2.50 | | | | | | |
Other revenue adjustments, primarily for pricing
on prior period open sales | | (0.15) | | | (0.15) | | | | | | |
| Gross loss per pound | | $ | (0.10) | | | $ | (0.08) | | | | | | |
| | | | | | | | | |
| Reconciliation to Amounts Reported | | | | | | | | | |
| | | | | | | | Metals | |
| | | | Production | | | | Inventory | |
| | Revenues | | and Delivery | | DD&A | | Adjustments | |
| Totals presented above | | $ | 1,285 | | | $ | 873 | | | $ | 210 | | | $ | 3 | | |
| Treatment charges | | (72) | | | — | | | — | | | — | | |
| Royalty on metals | | (2) | | | — | | | — | | | — | | |
| Noncash and other costs, net | | — | | | 100 | | | — | | | — | | |
Other revenue adjustments, primarily for pricing
on prior period open sales | | (70) | | | — | | | — | | | — | | |
| Eliminations and other | | — | | | (1) | | | — | | | — | | |
| South America mining | | 1,141 | | | 972 | | | 210 | | | 3 | | |
Other miningc | | 6,408 | | | 5,609 | | | 459 | | | 62 | | |
| | | | | | | | | |
| | | | | | | | | |
| Corporate, other & eliminations | | (1,697) | | | (1,642) | | | 30 | | | 18 | | |
| As reported in FCX's consolidated financial statements | | $ | 5,852 | | | $ | 4,939 | | | $ | 699 | | | $ | 83 | | |
| | | | | | | | | |
a.Includes silver sales of 1.5 million ounces ($16.37 per ounce average realized price). Also reflects sales of molybdenum produced by Cerro Verde to FCX's molybdenum sales company at market-based pricing.
b.Includes charges totaling $86 million ($0.18 per pound of copper) primarily associated with idle facility (Cerro Verde) and contract cancellation costs related to the COVID-19 pandemic, and employee separation costs associated with the April 2020 revised operating plans.
c.Represents the combined total for FCX's other mining operations as presented in the supplemental schedule, "Business Segments," beginning on page X.
| | | | | | | | | | | | | | | | | | | | | | | | | | | | | | | | |
| Freeport-McMoRan Inc. |
| PRODUCT REVENUES AND PRODUCTION COSTS (continued) |
|
| Indonesia Mining Product Revenues, Production Costs and Unit Net Cash Costs |
| | | | |
| Three Months Ended June 30, 2021 | | | | |
| (In millions) | | By-Product | | Co-Product Method |
| | Method | | Copper | | Gold | | Silvera | | Total |
| Revenues, excluding adjustments | | $ | 1,323 | | | $ | 1,323 | | | $ | 543 | | | $ | 37 | | | $ | 1,903 | |
Site production and delivery, before net noncash
and other credits shown below | | 476 | | | 331 | | | 136 | | | 9 | | | 476 | |
| Gold and silver credits | | (597) | | | — | | | — | | | — | | | — | |
| Treatment charges | | 74 | | | 52 | | | 21 | | | 2 | | | 75 | |
| Export duties | | 44 | | | 30 | | | 13 | | | 1 | | | 44 | |
| Royalty on metals | | 80 | | | 59 | | | 20 | | | 1 | | | 80 | |
| Net cash costs | | 77 | | | 472 | | | 190 | | | 13 | | | 675 | |
| DD&A | | 247 | | | 172 | | | 70 | | | 5 | | | 247 | |
| | | | | | | | | | |
| Noncash and other costs, net | | 11 | | | 8 | | | 3 | | | — | | | 11 | |
| Total costs | | 335 | | | 652 | | | 263 | | | 18 | | | 933 | |
Other revenue adjustments, primarily for pricing
on prior period open sales | | 87 | | | 87 | | | 16 | | | 2 | | | 105 | |
| PT Smelting intercompany loss | | (41) | | | (28) | | | (12) | | | (1) | | | (41) | |
| Gross profit | | $ | 1,034 | | | $ | 730 | | | $ | 284 | | | $ | 20 | | | $ | 1,034 | |
| | | | | | | | | | |
| Copper sales (millions of recoverable pounds) | | 310 | | | 310 | | | | | | | |
| Gold sales (thousands of recoverable ounces) | | | | | | 302 | | | | | |
| | | | | | | | | | |
| Gross profit per pound of copper/per ounce of gold: | | | | | | |
| | | | | | | | | | |
| Revenues, excluding adjustments | | $ | 4.27 | | | $ | 4.27 | | | $ | 1,795 | | | | | |
Site production and delivery, before net noncash
and other credits shown below | | 1.54 | | | 1.07 | | | 449 | | | | | |
| Gold and silver credits | | (1.93) | | | — | | | — | | | | | |
| Treatment charges | | 0.24 | | | 0.16 | | | 70 | | | | | |
| Export duties | | 0.14 | | | 0.10 | | | 42 | | | | | |
| Royalty on metals | | 0.26 | | | 0.19 | | | 66 | | | | | |
| Unit net cash costs | | 0.25 | | | 1.52 | | | 627 | | | | | |
| DD&A | | 0.79 | | | 0.55 | | | 232 | | | | | |
| | | | | | | | | | |
| Noncash and other costs, net | | 0.04 | | | 0.03 | | | 11 | | | | | |
| Total unit costs | | 1.08 | | | 2.10 | | | 870 | | | | | |
Other revenue adjustments, primarily for pricing
on prior period open sales | | 0.28 | | | 0.28 | | | 53 | | | | | |
| PT Smelting intercompany loss | | (0.13) | | | (0.09) | | | (39) | | | | | |
| Gross profit per pound/ounce | | $ | 3.34 | | | $ | 2.36 | | | $ | 939 | | | | | |
| | | | | | | | | | |
| Reconciliation to Amounts Reported | | | | | | | | | | |
| | | | Production | | | | | | |
| | Revenues | | and Delivery | | DD&A | | | | |
| Totals presented above | | $ | 1,903 | | | $ | 476 | | | $ | 247 | | | | | |
| Treatment charges | | (75) | | | — | | | — | | | | | |
| Export duties | | (44) | | | — | | | — | | | | | |
| Royalty on metals | | (80) | | | — | | | — | | | | | |
| Noncash and other costs, net | | — | | | 11 | | | — | | | | | |
Other revenue adjustments, primarily for pricing
on prior period open sales | | 105 | | | — | | | — | | | | | |
| PT Smelting intercompany loss | | — | | | 41 | | | — | | | | | |
| Indonesia mining | | 1,809 | | | 528 | | | 247 | | | | | |
Other miningb | | 5,565 | | | 4,047 | | | 221 | | | | | |
| | | | | | | | | | |
| | | | | | | | | | |
| Corporate, other & eliminations | | (1,626) | | | (1,508) | | | 15 | | | | | |
| As reported in FCX's consolidated financial statements | | $ | 5,748 | | | $ | 3,067 | | | $ | 483 | | | | | |
| | | | | | | | | | |
a.Includes silver sales of 1.4 million ounces ($26.08 per ounce average realized price).
b.Represents the combined total for FCX's other mining operations as presented in the supplemental schedule, "Business Segments," beginning on page X.
| | | | | | | | | | | | | | | | | | | | | | | | | | | | | | | | | | | |
| Freeport-McMoRan Inc. |
| PRODUCT REVENUES AND PRODUCTION COSTS (continued) |
|
| Indonesia Mining Product Revenues, Production Costs and Unit Net Cash Costs | |
| | | | | |
| Three Months Ended June 30, 2020 | | | | | |
| (In millions) | | By-Product | | Co-Product Method | |
| | Method | | Copper | | Gold | | Silvera | | Total | |
| Revenues, excluding adjustments | | $ | 458 | | | $ | 458 | | | $ | 315 | | | $ | 13 | | | $ | 786 | | |
Site production and delivery, before net noncash
and other costs shown below | | 345 | | | 201 | | | 138 | | | 6 | | | 345 | | |
| Gold and silver credits | | (336) | | | — | | | — | | | — | | | — | | |
| Treatment charges | | 47 | | | 27 | | | 19 | | | 1 | | | 47 | | |
| Export duties | | 16 | | | 10 | | | 6 | | | — | | | 16 | | |
| Royalty on metals | | 25 | | | 13 | | | 12 | | | — | | | 25 | | |
| Net cash costs | | 97 | | | 251 | | | 175 | | | 7 | | | 433 | | |
| DD&A | | 124 | | | 72 | | | 50 | | | 2 | | | 124 | | |
| | | | | | | | | | | |
| Noncash and other costs, net | | 8 | | b | 5 | | | 3 | | | — | | | 8 | | |
| Total costs | | 229 | | | 328 | | | 228 | | | 9 | | | 565 | | |
Other revenue adjustments, primarily for pricing
on prior period open sales | | 12 | | | 12 | | | 7 | | | 1 | | | 20 | | |
| PT Smelting intercompany loss | | (25) | | | (15) | | | (10) | | | — | | | (25) | | |
| Gross profit | | $ | 216 | | | $ | 127 | | | $ | 84 | | | $ | 5 | | | $ | 216 | | |
| | | | | | | | | | | |
| Copper sales (millions of recoverable pounds) | | 172 | | | 172 | | | | | | | | |
| Gold sales (thousands of recoverable ounces) | | | | | | 180 | | | | | | |
| | | | | | | | | | | |
| Gross profit per pound of copper/per ounce of gold: | | | | | | | |
| | | | | | | | | | | |
| Revenues, excluding adjustments | | $ | 2.67 | | | $ | 2.67 | | | $ | 1,748 | | | | | | |
Site production and delivery, before net noncash
and other costs shown below | | 2.00 | | | 1.17 | | | 766 | | | | | | |
| Gold and silver credits | | (1.95) | | | — | | | — | | | | | | |
| Treatment charges | | 0.27 | | | 0.16 | | | 105 | | | | | | |
| Export duties | | 0.09 | | | 0.05 | | | 35 | | | | | | |
| Royalty on metals | | 0.15 | | | 0.08 | | | 65 | | | | | | |
| Unit net cash costs | | 0.56 | | | 1.46 | | | 971 | | | | | | |
| DD&A | | 0.72 | | | 0.42 | | | 276 | | | | | | |
| | | | | | | | | | | |
| Noncash and other costs, net | | 0.05 | | b | 0.03 | | | 17 | | | | | | |
| Total unit costs | | 1.33 | | | 1.91 | | | 1,264 | | | | | | |
Other revenue adjustments, primarily for pricing
on prior period open sales | | 0.07 | | | 0.07 | | | 41 | | | | | | |
| PT Smelting intercompany loss | | (0.15) | | | (0.09) | | | (57) | | | | | | |
| Gross profit per pound/ounce | | $ | 1.26 | | | $ | 0.74 | | | $ | 468 | | | | | | |
| | | | | | | | | | | |
| Reconciliation to Amounts Reported | | | | | | | | | | | |
| | | | Production | | | | | | | |
| | Revenues | | and Delivery | | DD&A | | | | | |
| Totals presented above | | $ | 786 | | | $ | 345 | | | $ | 124 | | | | | | |
| Treatment charges | | (47) | | | — | | | — | | | | | | |
| Export duties | | (16) | | | — | | | — | | | | | | |
| Royalty on metals | | (25) | | | — | | | — | | | | | | |
| Noncash and other costs, net | | — | | | 8 | | | — | | | | | | |
Other revenue adjustments, primarily for pricing
on prior period open sales | | 20 | | | — | | | — | | | | | | |
| PT Smelting intercompany loss | | — | | | 25 | | | — | | | | | | |
| Indonesia mining | | 718 | | | 378 | | | 124 | | | | | | |
Other miningc | | 3,255 | | | 2,870 | | | 219 | | | | | | |
| | | | | | | | | | | |
| | | | | | | | | | | |
| Corporate, other & eliminations | | (919) | | | (854) | | | 15 | | | | | | |
| As reported in FCX's consolidated financial statements | | $ | 3,054 | | | $ | 2,394 | | | $ | 358 | | | | | | |
| | | | | | | | | | | |
a.Includes silver sales of 0.8 million ounces ($17.09 per ounce average realized price).
b.Includes COVID-19 related costs totaling $4 million ($0.03 per pound of copper).
c.Represents the combined total for FCX's other mining operations as presented in the supplemental schedule, "Business Segments," beginning on page X.
| | | | | | | | | | | | | | | | | | | | | | | | | | | | | | | | |
| Freeport-McMoRan Inc. |
| PRODUCT REVENUES AND PRODUCTION COSTS (continued) |
|
| Indonesia Mining Product Revenues, Production Costs and Unit Net Cash Costs |
| | | | |
| Six months ended June 30, 2021 | | | | |
| (In millions) | | By-Product | | Co-Product Method |
| | Method | | Copper | | Gold | | Silvera | | Total |
| Revenues, excluding adjustments | | $ | 2,435 | | | $ | 2,435 | | | $ | 995 | | | $ | 68 | | | $ | 3,498 | |
Site production and delivery, before net noncash
and other credits shown below | | 859 | | | 598 | | | 244 | | | 17 | | | 859 | |
| Gold and silver credits | | (1,059) | | | — | | | — | | | — | | | — | |
| Treatment charges | | 140 | | | 97 | | | 40 | | | 3 | | | 140 | |
| Export duties | | 73 | | | 51 | | | 21 | | | 1 | | | 73 | |
| Royalty on metals | | 140 | | | 100 | | | 38 | | | 2 | | | 140 | |
| Net cash costs | | 153 | | | 846 | | | 343 | | | 23 | | | 1,212 | |
| DD&A | | 446 | | | 310 | | | 127 | | | 9 | | | 446 | |
| | | | | | | | | | |
| Noncash and other costs, net | | 3 | | b | 2 | | | 1 | | | — | | | 3 | |
| Total costs | | 602 | | | 1,158 | | | 471 | | | 32 | | | 1,661 | |
Other revenue adjustments, primarily for pricing
on prior period open sales | | 72 | | | 72 | | | (4) | | | — | | | 68 | |
| PT Smelting intercompany loss | | (90) | | | (63) | | | (25) | | | (2) | | | (90) | |
| Gross profit | | $ | 1,815 | | | $ | 1,286 | | | $ | 495 | | | $ | 34 | | | $ | 1,815 | |
| | | | | | | | | | |
| Copper sales (millions of recoverable pounds) | | 568 | | | 568 | | | | | | | |
| Gold sales (thousands of recoverable ounces) | | | | | | 558 | | | | | |
| | | | | | | | | | |
| Gross profit per pound of copper/per ounce of gold: | | | | | | |
| | | | | | | | | | |
| Revenues, excluding adjustments | | $ | 4.29 | | | $ | 4.29 | | | $ | 1,785 | | | | | |
Site production and delivery, before net noncash
and other credits shown below | | 1.51 | | | 1.05 | | | 439 | | | | | |
| Gold and silver credits | | (1.86) | | | — | | | — | | | | | |
| Treatment charges | | 0.24 | | | 0.17 | | | 71 | | | | | |
| Export duties | | 0.13 | | | 0.09 | | | 37 | | | | | |
| Royalty on metals | | 0.25 | | | 0.18 | | | 68 | | | | | |
| Unit net cash costs | | 0.27 | | | 1.49 | | | 615 | | | | | |
| DD&A | | 0.78 | | | 0.55 | | | 228 | | | | | |
| | | | | | | | | | |
| Noncash and other costs, net | | 0.01 | | b | — | | | 1 | | | | | |
| Total unit costs | | 1.06 | | | 2.04 | | | 844 | | | | | |
Other revenue adjustments, primarily for pricing
on prior period open sales | | 0.12 | | | 0.12 | | | (8) | | | | | |
| PT Smelting intercompany loss | | (0.16) | | | (0.11) | | | (46) | | | | | |
| Gross profit per pound/ounce | | $ | 3.19 | | | $ | 2.26 | | | $ | 887 | | | | | |
| | | | | | | | | | |
| Reconciliation to Amounts Reported | | | | | | | | | | |
| | | | Production | | | | | | |
| | Revenues | | and Delivery | | DD&A | | | | |
| Totals presented above | | $ | 3,498 | | | $ | 859 | | | $ | 446 | | | | | |
| Treatment charges | | (140) | | | — | | | — | | | | | |
| Export duties | | (73) | | | — | | | — | | | | | |
| Royalty on metals | | (140) | | | — | | | — | | | | | |
| Noncash and other costs, net | | 31 | | | 34 | | | — | | | | | |
Other revenue adjustments, primarily for pricing
on prior period open sales | | 68 | | | — | | | — | | | | | |
| PT Smelting intercompany loss | | — | | | 90 | | | — | | | | | |
| Indonesia mining | | 3,244 | | | 983 | | | 446 | | | | | |
Other miningc | | 10,113 | | | 7,381 | | | 425 | | | | | |
| | | | | | | | | | |
| | | | | | | | | | |
| Corporate, other & eliminations | | (2,759) | | | (2,511) | | | 31 | | | | | |
| As reported in FCX's consolidated financial statements | | $ | 10,598 | | | $ | 5,853 | | | $ | 902 | | | | | |
| | | | | | | | | | |
a.Includes silver sales of 2.6 million ounces ($26.05 per ounce average realized price).
b.Includes credits of $31 million ($0.05 per pound of copper) associated with adjustments to prior year treatment and refining charges and charges of $16 million ($0.03 per pound of copper) associated with a potential settlement of an administrative fine levied by the Indonesia government.
c.Represents the combined total for FCX's other mining operations as presented in the supplemental schedule, "Business Segments," beginning on page X.
| | | | | | | | | | | | | | | | | | | | | | | | | | | | | | | | | | | |
| Freeport-McMoRan Inc. |
| PRODUCT REVENUES AND PRODUCTION COSTS (continued) |
|
| Indonesia Mining Product Revenues, Production Costs and Unit Net Cash Costs | |
| | | | | |
| Six months ended June 30, 2020 | | | | | |
| (In millions) | | By-Product | | Co-Product Method | |
| | Method | | Copper | | Gold | | Silvera | | Total | |
| Revenues, excluding adjustments | | $ | 760 | | | $ | 760 | | | $ | 545 | | | $ | 22 | | | $ | 1,327 | | |
Site production and delivery, before net noncash
and other costs shown below | | 686 | | | 393 | | | 282 | | | 11 | | | 686 | | |
| Gold and silver credits | | (572) | | | — | | | — | | | — | | | — | | |
| Treatment charges | | 85 | | | 49 | | | 35 | | | 1 | | | 85 | | |
| Export duties | | 20 | | | 11 | | | 8 | | | 1 | | | 20 | | |
| Royalty on metals | | 44 | | | 25 | | | 19 | | | — | | | 44 | | |
| Net cash costs | | 263 | | | 478 | | | 344 | | | 13 | | | 835 | | |
| DD&A | | 225 | | | 129 | | | 92 | | | 4 | | | 225 | | |
| | | | | | | | | | | |
| Noncash and other costs, net | | 35 | | b | 20 | | | 14 | | | 1 | | | 35 | | |
| Total costs | | 523 | | | 627 | | | 450 | | | 18 | | | 1,095 | | |
Other revenue adjustments, primarily for pricing
on prior period open sales | | (20) | | | (20) | | | 5 | | | — | | | (15) | | |
| | | | | | | | | | | |
| Gross profit | | $ | 217 | | | $ | 113 | | | $ | 100 | | | $ | 4 | | | $ | 217 | | |
| | | | | | | | | | | |
| Copper sales (millions of recoverable pounds) | | 299 | | | 299 | | | | | | | | |
| Gold sales (thousands of recoverable ounces) | | | | | | 319 | | | | | | |
| | | | | | | | | | | |
| Gross profit per pound of copper/per ounce of gold: | | | | | | | |
| | | | | | | | | | | |
| Revenues, excluding adjustments | | $ | 2.54 | | | $ | 2.54 | | | $ | 1,709 | | | | | | |
Site production and delivery, before net noncash
and other costs shown below | | 2.29 | | | 1.31 | | | 884 | | | | | | |
| Gold and silver credits | | (1.91) | | | — | | | — | | | | | | |
| Treatment charges | | 0.28 | | | 0.17 | | | 110 | | | | | | |
| Export duties | | 0.07 | | | 0.04 | | | 25 | | | | | | |
| Royalty on metals | | 0.15 | | | 0.08 | | | 58 | | | | | | |
| Unit net cash costs | | 0.88 | | | 1.60 | | | 1,077 | | | | | | |
| DD&A | | 0.75 | | | 0.43 | | | 289 | | | | | | |
| | | | | | | | | | | |
| Noncash and other costs, net | | 0.12 | | b | 0.06 | | | 45 | | | | | | |
| Total unit costs | | 1.75 | | | 2.09 | | | 1,411 | | | | | | |
Other revenue adjustments, primarily for pricing
on prior period open sales | | (0.07) | | | (0.07) | | | 14 | | | | | | |
| | | | | | | | | | | |
| Gross profit per pound/ounce | | $ | 0.72 | | | $ | 0.38 | | | $ | 312 | | | | | | |
| | | | | | | | | | | |
| Reconciliation to Amounts Reported | | | | | | | | | | | |
| | | | Production | | | | | | | |
| | Revenues | | and Delivery | | DD&A | | | | | |
| Totals presented above | | $ | 1,327 | | | $ | 686 | | | $ | 225 | | | | | | |
| Treatment charges | | (85) | | | — | | | — | | | | | | |
| Export duties | | (20) | | | — | | | — | | | | | | |
| Royalty on metals | | (44) | | | — | | | — | | | | | | |
| Noncash and other costs, net | | — | | | 35 | | | — | | | | | | |
Other revenue adjustments, primarily for pricing
on prior period open sales | | (15) | | | — | | | — | | | | | | |
| | | | | | | | | | | |
| Indonesia mining | | 1,163 | | | 721 | | | 225 | | | | | | |
Other miningc | | 6,386 | | | 5,860 | | | 444 | | | | | | |
| | | | | | | | | | | |
| | | | | | | | | | | |
| Corporate, other & eliminations | | (1,697) | | | (1,642) | | | 30 | | | | | | |
| As reported in FCX's consolidated financial statements | | $ | 5,852 | | | $ | 4,939 | | | $ | 699 | | | | | | |
| | | | | | | | | | | |
a.Includes silver sales of 1.3 million ounces ($16.30 per ounce average realized price).
b.Includes COVID-19 related costs totaling $4 million ($0.01 per pound of copper).
c.Represents the combined total for FCX's other mining operations as presented in the supplemental schedule, "Business Segments," beginning on page X.
| | | | | | | | | | | | | | | | | | | | | | | | | | |
| Freeport-McMoRan Inc. |
| PRODUCT REVENUES AND PRODUCTION COSTS (continued) |
|
| Molybdenum Mines Product Revenues, Production Costs and Unit Net Cash Costs |
| | | | | | | | |
| | Three Months Ended June 30, | | |
| (In millions) | | 2021 | | 2020 | | | | |
| | | | | | | | |
Revenues, excluding adjustmentsa | | $ | 95 | | | $ | 63 | | | | | |
Site production and delivery, before net noncash
and other costs shown below | | 54 | | | 53 | | | | | |
| Treatment charges and other | | 6 | | | 5 | | | | | |
| Net cash costs | | 60 | | | 58 | | | | | |
| DD&A | | 17 | | | 15 | | | | | |
| Metals inventory adjustments | | — | | | 1 | | | | | |
| Noncash and other costs, net | | 2 | | | 8 | | b | | | |
| Total costs | | 79 | | | 82 | | | | | |
| Gross profit (loss) | | $ | 16 | | | $ | (19) | | | | | |
| | | | | | | | |
Molybdenum sales (millions of recoverable pounds)a | | 7 | | | 6 | | | | | |
| | | | | | | | |
| Gross profit (loss) per pound of molybdenum: | | |
| | | | | | | | |
Revenues, excluding adjustmentsa | | $ | 12.77 | | | $ | 9.69 | | | | | |
Site production and delivery, before net noncash
and other costs shown below | | 7.29 | | | 8.12 | | | | | |
| Treatment charges and other | | 0.85 | | | 0.85 | | | | | |
| Unit net cash costs | | 8.14 | | | 8.97 | | | | | |
| DD&A | | 2.29 | | | 2.29 | | | | | |
| Metals inventory adjustments | | — | | | 0.16 | | | | | |
| Noncash and other costs, net | | 0.30 | | | 1.34 | | b | | | |
| Total unit costs | | 10.73 | | | 12.76 | | | | | |
| Gross profit (loss) per pound | | $ | 2.04 | | | $ | (3.07) | | | | | |
| | | | | | | | |
| Reconciliation to Amounts Reported | | | | | | | | |
| | | | | | | | Metals |
| | | | Production | | | | Inventory |
| Three Months Ended June 30, 2021 | | Revenues | | and Delivery | | DD&A | | Adjustments |
| Totals presented above | | $ | 95 | | | $ | 54 | | | $ | 17 | | | $ | — | |
| Treatment charges and other | | (6) | | | — | | | — | | | — | |
| Noncash and other costs, net | | — | | | 2 | | | — | | | — | |
| Molybdenum mines | | 89 | | | 56 | | | 17 | | | — | |
Other miningc | | 7,285 | | | 4,519 | | | 451 | | | — | |
| | | | | | | | |
| | | | | | | | |
| Corporate, other & eliminations | | (1,626) | | | (1,508) | | | 15 | | | — | |
| As reported in FCX's consolidated financial statements | | $ | 5,748 | | | $ | 3,067 | | | $ | 483 | | | $ | — | |
| | | | | | | | |
| Three Months Ended June 30, 2020 | | | | | | | | |
| Totals presented above | | $ | 63 | | | $ | 53 | | | $ | 15 | | | $ | 1 | |
| Treatment charges and other | | (5) | | | — | | | — | | | — | |
| Noncash and other costs, net | | — | | | 8 | | | — | | | — | |
| | | | | | | | |
| | | | | | | | |
| Molybdenum mines | | 58 | | | 61 | | | 15 | | | 1 | |
Other miningc | | 3,915 | | | 3,187 | | | 328 | | | (145) | |
| | | | | | | | |
| | | | | | | | |
| Corporate, other & eliminations | | (919) | | | (854) | | | 15 | | | 5 | |
| As reported in FCX's consolidated financial statements | | $ | 3,054 | | | $ | 2,394 | | | $ | 358 | | | $ | (139) | |
| | | | | | | | |
a.Reflects sales of the Molybdenum mines' production to FCX's molybdenum sales company at market-based pricing. On a consolidated basis, realizations are based on the actual contract terms for sales to third parties; as a result, FCX's consolidated average realized price per pound of molybdenum will differ from the amounts reported in this table.
b.Includes charges totaling $6 million ($1.00 per pound of molybdenum) primarily associated with the April 2020 revised operating plans (including employee separation costs) and contract cancellation costs related to the COVID-19 pandemic.
c.Represents the combined total for FCX's other mining operations as presented in the supplemental schedule, "Business Segments," beginning on page X. Also includes amounts associated with FCX's molybdenum sales company, which includes sales of molybdenum produced by the Molybdenum mines and by certain of the North America and South America copper mines.
| | | | | | | | | | | | | | | | | | | | | | | | | | |
| Freeport-McMoRan Inc. |
| PRODUCT REVENUES AND PRODUCTION COSTS (continued) |
|
| Molybdenum Mines Product Revenues, Production Costs and Unit Net Cash Costs |
| | | | | | | | |
| | Six months ended June 30, | | |
| (In millions) | | 2021 | | 2020 | | | | |
| | | | | | | | |
Revenues, excluding adjustmentsa | | $ | 171 | | | $ | 140 | | | | | |
Site production and delivery, before net noncash
and other costs shown below | | 108 | | | 117 | | | | | |
| Treatment charges and other | | 12 | | | 11 | | | | | |
| Net cash costs | | 120 | | | 128 | | | | | |
| DD&A | | 32 | | | 31 | | | | | |
| Metals inventory adjustments | | 1 | | | 5 | | | | | |
| Noncash and other costs, net | | 5 | | | 10 | | b | | | |
| Total costs | | 158 | | | 174 | | | | | |
| Gross profit (loss) | | $ | 13 | | | $ | (34) | | | | | |
| | | | | | | | |
Molybdenum sales (millions of recoverable pounds)a | | 14 | | | 13 | | | | | |
| | | | | | | | |
| Gross profit (loss) per pound of molybdenum: | | |
| | | | | | | | |
Revenues, excluding adjustmentsa | | $ | 12.12 | | | $ | 10.36 | | | | | |
Site production and delivery, before net noncash
and other costs shown below | | 7.68 | | | 8.67 | | | | | |
| Treatment charges and other | | 0.85 | | | 0.85 | | | | | |
| Unit net cash costs | | 8.53 | | | 9.52 | | | | | |
| DD&A | | 2.27 | | | 2.29 | | | | | |
| Metals inventory adjustments | | 0.06 | | | 0.35 | | | | | |
| Noncash and other costs, net | | 0.36 | | | 0.79 | | b | | | |
| Total unit costs | | 11.22 | | | 12.95 | | | | | |
| Gross profit (loss) per pound | | $ | 0.90 | | | $ | (2.59) | | | | | |
| | | | | | | | |
| Reconciliation to Amounts Reported | | | | | | | | |
| | | | | | | | Metals |
| | | | Production | | | | Inventory |
| Six months ended June 30, 2021 | | Revenues | | and Delivery | | DD&A | | Adjustments |
| Totals presented above | | $ | 171 | | | $ | 108 | | | $ | 32 | | | $ | 1 | |
| Treatment charges and other | | (12) | | | — | | | — | | | — | |
| Noncash and other costs, net | | — | | | 5 | | | — | | | — | |
| Molybdenum mines | | 159 | | | 113 | | | 32 | | | 1 | |
Other miningc | | 13,198 | | | 8,251 | | | 839 | | | — | |
| | | | | | | | |
| | | | | | | | |
| Corporate, other & eliminations | | (2,759) | | | (2,511) | | | 31 | | | — | |
| As reported in FCX's consolidated financial statements | | $ | 10,598 | | | $ | 5,853 | | | $ | 902 | | | $ | 1 | |
| | | | | | | | |
| Six months ended June 30, 2020 | | | | | | | | |
| Totals presented above | | $ | 140 | | | $ | 117 | | | $ | 31 | | | $ | 5 | |
| Treatment charges and other | | (11) | | | — | | | — | | | — | |
| Noncash and other costs, net | | — | | | 10 | | | — | | | — | |
| | | | | | | | |
| | | | | | | | |
| Molybdenum mines | | 129 | | | 127 | | | 31 | | | 5 | |
Other miningc | | 7,420 | | | 6,454 | | | 638 | | | 60 | |
| | | | | | | | |
| | | | | | | | |
| Corporate, other & eliminations | | (1,697) | | | (1,642) | | | 30 | | | 18 | |
| As reported in FCX's consolidated financial statements | | $ | 5,852 | | | $ | 4,939 | | | $ | 699 | | | $ | 83 | |
| | | | | | | | |
a.Reflects sales of the Molybdenum mines' production to FCX's molybdenum sales company at market-based pricing. On a consolidated basis, realizations are based on the actual contract terms for sales to third parties; as a result, FCX's consolidated average realized price per pound of molybdenum will differ from the amounts reported in this table.
b.Includes charges totaling $6 million ($0.48 per pound of molybdenum) primarily associated with the April 2020 revised operating plans (including employee separation costs) and contract cancellation costs related to the COVID-19 pandemic.
c.Represents the combined total for FCX's other mining operations as presented in the supplemental schedule, "Business Segments," beginning on page X. Also includes amounts associated with FCX's molybdenum sales company, which includes sales of molybdenum produced by the Molybdenum mines and by certain of the North America and South America copper mines.