Form 8-K
False 0000700565 0000700565 2025-10-30 2025-10-30 iso4217:USD xbrli:shares iso4217:USD xbrli:shares
 

UNITED STATES

SECURITIES AND EXCHANGE COMMISSION

Washington, D.C. 20549

_________________

FORM 8-K

_________________

CURRENT REPORT

Pursuant to Section 13 or 15(d)
of the Securities Exchange Act of 1934

Date of Report (Date of earliest event reported):  October 30, 2025

_______________________________

FIRST MID BANCSHARES, INC.

(Exact name of registrant as specified in its charter)

_______________________________

Delaware 001-36434 37-1103704
(State or Other Jurisdiction of Incorporation) (Commission File Number) (I.R.S. Employer Identification No.)

1421 Charleston Avenue

Mattoon, Illinois 61938

(Address of Principal Executive Offices) (Zip Code)

(217) 234-7454

(Registrant's telephone number, including area code)


(Former name or former address, if changed since last report)

_______________________________

Check the appropriate box below if the Form 8-K filing is intended to simultaneously satisfy the filing obligation of the registrant under any of the following provisions:

Written communications pursuant to Rule 425 under the Securities Act (17 CFR 230.425)
Soliciting material pursuant to Rule 14a-12 under the Exchange Act (17 CFR 240.14a-12)
Pre-commencement communications pursuant to Rule 14d-2(b) under the Exchange Act (17 CFR 240.14d-2(b))
Pre-commencement communications pursuant to Rule 13e-4(c) under the Exchange Act (17 CFR 240.13e-4(c))

Securities registered pursuant to Section 12(b) of the Act:

Title of each class Trading Symbol(s) Name of each exchange on which registered
Common Stock FMBH Nasdaq Global Market

Indicate by check mark whether the registrant is an emerging growth company as defined in Rule 405 of the Securities Act of 1933 (§230.405 of this chapter) or Rule 12b-2 of the Securities Exchange Act of 1934 (§240.12b-2 of this chapter).

Emerging growth company

If an emerging growth company, indicate by check mark if the registrant has elected not to use the extended transition period for complying with any new or revised financial accounting standards provided pursuant to Section 13(a) of the Exchange Act. ☐


Item 2.02. Results of Operations and Financial Condition.


On October 30, 2025, the Company issued a press release to report its results of operations and financial condition as of and for the quarter ended September 30, 2025. A copy of this press release is included in Exhibit 99.1 to this Form 8-K and incorporated into this item 2.02 by reference. A copy of the investor presentation for the quarter ended September 30, 2025 is included in Exhibit 99.2 to this Form 8-K and incorporated into this item 2.02 by reference.


The information furnished pursuant to this Item 2.02 and the related exhibits shall not be deemed "filed" by First Mid for purposes of Section 18 of the Securities Exchange Act of 1934, as amended (the "Exchange Act") or incorporated by reference in any filing under the Securities Act of 1933, as amended (the “Securities Act”), or the Exchange Act, except as may be expressly set forth by specific reference in such filing.


Forward Looking Statements

This document may contain certain forward-looking statements about First Mid and Two Rivers, such as discussions of First Mid’s and Two Rivers’ pricing and fee trends, credit quality and outlook, liquidity, new business results, expansion plans, anticipated expenses and planned schedules. First Mid and Two Rivers intend such forward-looking statements to be covered by the safe harbor provisions for forward-looking statements contained in the Private Securities Litigation Reform Act of 1995. Forward-looking statements, which are based on certain assumptions and describe future plans, strategies and expectations of First Mid and Two Rivers are identified by use of the words “believe,” “expect,” “intend,” “anticipate,” “estimate,” “project,” or similar expressions. Actual results could differ materially from the results indicated by these statements because the realization of those results is subject to many risks and uncertainties, including, among other things, the possibility that any of the anticipated benefits of the proposed transactions between First Mid and Two Rivers will not be realized within the expected time period; the risk that integration of the operations of Two Rivers with First Mid will be materially delayed or will be more costly or difficult than expected; the inability to complete the proposed transactions due to the failure to satisfy conditions to completion of the proposed transactions, including failure to obtain the required regulatory, shareholder and other approvals; the failure of the proposed transactions to close for any other reason; the effect of the announcement of the proposed transactions on customer relationships and operating results; the possibility that the proposed transactions may be more expensive to complete than anticipated, including as a result of unexpected factors or events; changes in interest rates; general economic conditions and those in the market areas of First Mid and Two Rivers; legislative and/or regulatory changes; monetary and fiscal policies of the U.S. Government, including policies of the U.S. Treasury and the Federal Reserve Board; the quality or composition of First Mid’s and Two Rivers’ loan or investment portfolios and the valuation of those investment portfolios; demand for loan products; deposit flows; competition, demand for financial services in the market areas of First Mid and Two Rivers; accounting principles, policies and guidelines; and the ability to complete the proposed transactions or any of the other foregoing risks. Additional information concerning First Mid, including additional factors and risks that could materially affect First Mid’s financial results, are included in First Mid’s filings with the SEC, including its Annual Reports on Form 10-K and Quarterly Reports on Form 10-Q. Forward-looking statements speak only as of the date they are made. Except as required under the federal securities laws or the rules and regulations of the SEC, First Mid and Two Rivers do not undertake any obligation to update or review any forward-looking information, whether as a result of new information, future events or otherwise.


Important Information about the Merger and Additional Information

First Mid will file a registration statement on Form S-4 with the SEC in connection with the proposed transaction. The registration statement will include a proxy statement of Two Rivers that also constitutes a prospectus of First Mid, which will be sent to the shareholders of Two Rivers. Two Rivers shareholders are urged to read the proxy statement/prospectus when it becomes available, which will contain important information about First Mid, Two Rivers and the proposed transaction, including detailed risk factors. The proxy statement/prospectus and other documents which will be filed by First Mid with the SEC will be available free of charge at the SEC’s website, www.sec.gov. These documents also can be obtained free of charge by accessing First Mid’s website at www.firstmid.com under the tab “Investor Relations” and then under “SEC Filings.” Alternatively, when available, these documents can be obtained free of charge from First Mid upon written request to First Mid Bancshares, PO Box 499, Mattoon, IL 61938, Attention: Investor Relations; or from Two Rivers upon written request to Two Rivers Financial Group, Inc., 222 North Main St., Burlington, IA 52601-5214, Attention: Andrea Gerst, CFO. A final proxy statement/prospectus will be mailed to the shareholders of Two Rivers.


Participants in the Solicitation

First Mid and Two Rivers, and certain of their respective directors, executive officers, and other members of management and employees, are participants in the solicitation of proxies in connection with the proposed transactions. Information about the directors and executive officers of First Mid is set forth in the proxy statement for its 2025 annual meeting of stockholders, which was filed with the SEC on March 18, 2025. These documents can be obtained free of charge from the sources provided above. Investors may obtain additional information regarding the interests of such participants in the proposed transactions by reading the proxy statement/prospectus for such proposed transactions when it becomes available.


No Offer or Solicitation

This communication shall not constitute an offer to sell or the solicitation of an offer to buy securities, nor shall there by any sale of securities in any jurisdiction in which such offer, solicitation or sale would be unlawful prior to registration or qualification under the securities laws of such jurisdiction.


Item 9.01. Financial Statements and Exhibits.


(d)       Exhibits.


Exhibit Index


Exhibit No. Description
   
99.1 Press Release, dated October 30, 2025.
99.2 Investor presentation dated October 30, 2025
104 Cover Page Interactive Data File (embedded within the Inline XBRL document)


SIGNATURE


Pursuant to the requirements of the Securities Exchange Act of 1934, the registrant has duly caused this report to be signed on its behalf by the undersigned hereunto duly authorized.


  FIRST MID BANCSHARES, INC.
     
   
Date: October 30, 2025 By:  /s/ Joseph R. Dively        
    Joseph R. Dively
    Chairman and Chief Executive Officer


EXHIBIT 99.1

First Mid Bancshares, Inc. Announces Third Quarter 2025 Results

MATTOON, Ill., Oct. 30, 2025 (GLOBE NEWSWIRE) -- First Mid Bancshares, Inc. (NASDAQ: FMBH) (the “Company”) today announced its financial results for the quarter ended September 30, 2025.

Highlights

“The third quarter reflected solid financial and operating performance led by further expansion of our net interest margin while delivering growth in both loans and deposits. We executed on our strategic plan to drive greater efficiency by completing the conversion of our core operating system in late October and closing 8 full-service branches across our footprint during the quarter. The branch closures align with the continued migration in customer preferences to a more digital first mindset. The core system conversion will not only provide cost savings, but will also provide process efficiencies that will set us up well for future growth” said Matthew Smith, President.

“I am excited to announce the pending acquisition of Two Rivers Financial Group, Inc. as we continue to diversify our footprint and enter the state of Iowa. We are honored to have been chosen as their strategic partner. Two Rivers has a long history of providing value to their customers through their banking, trust, and wealth management services. We completed extensive due diligence and solidified our view that our cultures are closely aligned with a focus on community banking” said Joseph Dively, Chairman and CEO.

Net Interest Income
Net interest income for the third quarter of 2025 was $66.4 million, an increase of $2.5 million, or 3.9% compared to the second quarter of 2025. The increase was primarily the result of higher yields on earning assets while maintaining funding costs. Accretion income for the third quarter was $3.2 million, a decrease of $0.2 million compared to the prior quarter.

In comparison to the third quarter of 2024, net interest income increased $8.8 million, or 15.3%.   Interest income was higher by $5.0 million, inclusive of a decrease in accretion income of $0.5 million compared to the third quarter last year. Interest expense was lower by $3.9 million compared to the third quarter of last year.

Net Interest Margin
Net interest margin, on a tax equivalent basis*, was 3.80% for the third quarter of 2025 representing an increase of 8 basis points over the prior quarter, driven by an increase to earning asset yields and maintaining funding costs.

Loan Portfolio
Total loans ended the quarter at $5.82 billion, representing an increase of $57.0 million, or 1.0%, from the prior quarter. The increase was well diversified and included construction and land development, commercial real estate, agriculture operating lines, and commercial and industrial loans. Farm real estate, multi-family residential properties, and consumer loans saw modest declines in the quarter.

In comparison to the third quarter of last year, loan balances increased $209.4 million, or 3.7%. The largest increases were in construction and land development, agriculture operating lines, and commercial and industrial loans.

Asset Quality
Asset quality remained strong for the quarter. The allowance for credit losses (“ACL”) ended the period at $72.9 million and the ACL to total loans ratio was 1.25%. In addition to the ACL, an unearned discount of $26.0 million remains at quarter end. Provision expense was recorded in the amount of $3.4 million during the quarter with growth in the loan portfolio and net charge-offs of $1.6 million. At the end of the third quarter, the ratio of non-performing loans to total loans was 0.38%, which was in line with the prior quarter. The ACL to non-performing loans ratio was 328.5%, a slight increase from 325.0% in the second quarter. The ratio of nonperforming assets to total assets decreased from 0.31% in the prior quarter to 0.30%.   The loan portfolio had some migration from special mention to substandard with nonperforming assets remaining stable. Special mention loans decreased by $20.6 million to $61.2 million and substandard loans increased $36.3 million to $75.3 million, driven primarily by downgrades of three relationships in varying industries and geographies.

Deposits
Total deposits ended the quarter at $6.29 billion, which represented an increase of $99.3 million, or 1.6%, from the prior quarter. Non-interest-bearing demand deposits grew $128.8 million or 9.7% from the second quarter due to seasonal cash flow fluctuations from a few large depositors as well as continued business development efforts. Time deposits also saw an increase during the quarter with decreases in interest bearing demand deposits, savings deposits, and money market accounts.

Non-Interest Income
Non-interest income for the third quarter of 2025 was $22.9 million compared to $23.6 million in the prior quarter. Gains on the sale of real estate from our branch optimization efforts totaled $1.3 million, net of losses realized from leasehold improvement charge-offs associated with leased locations. The sale of low yielding bonds produced a loss of $1.9 million. The bonds sold provided proceeds of $35.7 million that was redeployed at higher rates.   In comparison to the third quarter of 2024, non-interest income decreased $0.1 million, primarily driven by the loss on the sale of securities offset by an increase of insurance commissions.

Wealth management revenues for the quarter were $5.1 million, which was a decrease of $0.2 million from the prior quarter and $0.7 million from the third quarter of 2024. This was primarily driven by lower commodity prices. Overall Ag Services revenue was $1.8 million in the period compared to $2.3 million in the prior quarter and $1.8 million in the third quarter of 2024. First Mid Ag Services has entered into an agreement to acquire Ray Farm Management Services, Inc., based in Princeton Illinois. The transaction is expected to close in the fourth quarter of 2025 and add approximately 9,000 acres under management.

Insurance commissions for the quarter were $7.1 million, which was a decrease of $0.8 million compared to the second quarter due to seasonality. Insurance commissions increased $1.1 million compared to the third quarter of 2024 from both organic growth and strategic acquisitions.  

Non-Interest Expenses 
Non-interest expense for the third quarter of 2025 totaled $57.1 million compared to $54.8 million in the prior quarter.   Total pre-tax, one-time costs for the quarter were $2.5 million. Net of one-time gains, pre-tax, one-time costs for the quarter totaled $1.1 million. Debit card expenses were higher due to the service provider incentive recognized in the second quarter.   Occupancy and equipment expenses also increased primarily from one-time costs associated with branch closures and technology enhancements.

In comparison to the third quarter of 2024, non-interest expenses increased $3.2 million. Salaries and benefits expenses increased $2.0 million due to annual compensation increases along with incentive for over performance compared to plan in 2025.

The Company’s efficiency ratio*, as adjusted in the non-GAAP reconciliation table herein, for the third quarter of 2025 was 58.75% compared to 58.09% in the prior quarter and 61.33% for the same period last year.

Capital Levels and Dividend
The Company’s capital levels remained strong and above the “well capitalized” levels. Capital levels ended the period as follows:

Total capital to risk-weighted assets15.99%
Tier 1 capital to risk-weighted assets13.53%
Common equity tier 1 capital to risk-weighted assets13.13%
Leverage ratio10.92%
  

Tangible book value per share* increased $1.59, or 6.0% during the third quarter of 2025. The increase was driven by both earnings and a decrease of $20.7 million related to the unrealized loss position in the Company’s investment portfolio.

The Company’s Board of Directors approved its regular quarterly dividend of $0.25 payable on Monday December 1st, 2025 to the shareholders of record as of Friday November 14th, 2025.

About First Mid: First Mid Bancshares, Inc. (“First Mid”) is the parent company of First Mid Bank & Trust, N.A., First Mid Insurance Group, Inc., and First Mid Wealth Management Co. First Mid is a $7.8 billion community-focused organization that provides a full-suite of financial services including banking, wealth management, brokerage, Ag services, and insurance through a sizeable network of locations throughout Illinois, Missouri, Texas, and Wisconsin and a loan production office in the greater Indianapolis area. Together, our First Mid team takes great pride in providing solutions and services to the customers and communities and has done so over the last 160 years. More information about the Company is available on our website at www.firstmid.com.

*Non-GAAP Measures: In addition to reports presented in accordance with generally accepted accounting principles (“GAAP”), this release contains certain non-GAAP financial measures. The Company believes that such non-GAAP financial measures provide investors with information useful in understanding the Company’s financial performance. Readers of this release, however, are urged to review these non-GAAP financial measures in conjunction with the GAAP results as reported. These non-GAAP financial measures are detailed as supplemental tables and include “Adjusted Net Earnings,” “Adjusted Diluted EPS,” “Efficiency Ratio,” “Net Interest Margin, tax equivalent,” “Tangible Book Value per Common Share,” “Adjusted Tangible Book Value per Common Share,” “Adjusted Return on Assets,” and “Adjusted Return on Average Common Equity”. Refer to non-GAAP reconciliation tables herein for reconciliation to comparable GAAP measures. While the Company believes these non-GAAP financial measures provide investors with a broader understanding of the capital adequacy, funding profile and financial trends of the Company, this information should be considered as supplemental in nature and not as a substitute to the related financial information prepared in accordance with GAAP. These non-GAAP financial measures may also differ from the similar measures presented by other companies.

Forward Looking Statements
This document may contain certain forward-looking statements about First Mid and Two Rivers, such as discussions of First Mid’s and Two Rivers’ pricing and fee trends, credit quality and outlook, liquidity, new business results, expansion plans, anticipated expenses and planned schedules. First Mid and Two Rivers intend such forward-looking statements to be covered by the safe harbor provisions for forward-looking statements contained in the Private Securities Litigation Reform Act of 1995. Forward-looking statements, which are based on certain assumptions and describe future plans, strategies and expectations of First Mid and Two Rivers are identified by use of the words “believe,” “expect,” “intend,” “anticipate,” “estimate,” “project,” or similar expressions. Actual results could differ materially from the results indicated by these statements because the realization of those results is subject to many risks and uncertainties, including, among other things, the possibility that any of the anticipated benefits of the proposed transactions between First Mid and Two Rivers will not be realized within the expected time period; the risk that integration of the operations of Two Rivers with First Mid will be materially delayed or will be more costly or difficult than expected; the inability to complete the proposed transactions due to the failure to satisfy conditions to completion of the proposed transactions, including failure to obtain the required regulatory, shareholder and other approvals; the failure of the proposed transactions to close for any other reason; the effect of the announcement of the proposed transactions on customer relationships and operating results; the possibility that the proposed transactions may be more expensive to complete than anticipated, including as a result of unexpected factors or events; changes in interest rates; general economic conditions and those in the market areas of First Mid and Two Rivers; legislative and/or regulatory changes; monetary and fiscal policies of the U.S. Government, including policies of the U.S. Treasury and the Federal Reserve Board; the quality or composition of First Mid’s and Two Rivers’ loan or investment portfolios and the valuation of those investment portfolios; demand for loan products; deposit flows; competition, demand for financial services in the market areas of First Mid and Two Rivers; accounting principles, policies and guidelines; and the ability to complete the proposed transactions or any of the other foregoing risks. Additional information concerning First Mid, including additional factors and risks that could materially affect First Mid’s financial results, are included in First Mid’s filings with the SEC, including its Annual Reports on Form 10-K and Quarterly Reports on Form 10-Q. Forward-looking statements speak only as of the date they are made. Except as required under the federal securities laws or the rules and regulations of the SEC, First Mid and Two Rivers do not undertake any obligation to update or review any forward-looking information, whether as a result of new information, future events or otherwise.

Important Information about the Merger and Additional Information
First Mid will file a registration statement on Form S-4 with the SEC in connection with the proposed transaction. The registration statement will include a proxy statement of Two Rivers that also constitutes a prospectus of First Mid, which will be sent to the shareholders of Two Rivers. Two Rivers shareholders are urged to read the proxy statement/prospectus when it becomes available, which will contain important information about First Mid, Two Rivers and the proposed transaction, including detailed risk factors. The proxy statement/prospectus and other documents which will be filed by First Mid with the SEC will be available free of charge at the SEC’s website, www.sec.gov. These documents also can be obtained free of charge by accessing First Mid’s website at www.firstmid.com under the tab “Investor Relations” and then under “SEC Filings.” Alternatively, when available, these documents can be obtained free of charge from First Mid upon written request to First Mid Bancshares, PO Box 499, Mattoon, IL 61938, Attention: Investor Relations; or from Two Rivers upon written request to Two Rivers Financial Group, Inc., 222 North Main St., Burlington, IA 52601-5214, Attention: Andrea Gerst, CFO. A final proxy statement/prospectus will be mailed to the shareholders of Two Rivers.

Participants in the Solicitation
First Mid and Two Rivers, and certain of their respective directors, executive officers, and other members of management and employees, are participants in the solicitation of proxies in connection with the proposed transactions. Information about the directors and executive officers of First Mid is set forth in the proxy statement for its 2025 annual meeting of stockholders, which was filed with the SEC on March 18, 2025. These documents can be obtained free of charge from the sources provided above. Investors may obtain additional information regarding the interests of such participants in the proposed transactions by reading the proxy statement/prospectus for such proposed transactions when it becomes available.

No Offer or Solicitation
This communication shall not constitute an offer to sell or the solicitation of an offer to buy securities, nor shall there by any sale of securities in any jurisdiction in which such offer, solicitation or sale would be unlawful prior to registration or qualification under the securities laws of such jurisdiction.

Investor Contact:
Austin Frank
SVP, Shareholder Relations
217-258-5522
[email protected]

Jordan Read
Chief Financial and Risk Officer
217-258-3528
[email protected]

– Tables Follow –

       
FIRST MID BANCSHARES, INC.
Condensed Consolidated Balance Sheets
(In thousands, unaudited)
  As of
  
  September 30, December 31, September 30,
   2025   2024   2024 
       
Assets      
Cash and cash equivalents $277,087  $121,216  $164,191 
Investment securities  1,098,093   1,073,510   1,125,774 
Loans (including loans held for sale) 5,824,038   5,672,462   5,614,591 
Less allowance for credit losses  (72,925)  (70,182)  (68,774)
Net loans  5,751,113   5,602,280   5,545,817 
Premises and equipment, net  94,673   100,234   101,464 
Goodwill and intangibles, net  255,217   261,906   265,139 
Bank Owned Life Insurance  173,588   170,854   169,635 
Other assets  180,597   189,734   190,469 
Total assets $7,830,368  $7,519,734  $7,562,489 
       
Liabilities and Stockholders' Equity     
Deposits:      
Non-interest bearing $1,450,244  $1,329,155  $1,387,290 
Interest bearing  4,839,299   4,727,941   4,701,544 
Total deposits  6,289,543   6,057,096   6,088,834 
Repurchase agreements with customers 200,506   204,122   204,343 
Other borrowings  245,000   242,520   238,712 
Junior subordinated debentures 24,419   24,280   24,224 
Subordinated debt  79,645   87,472   87,373 
Other liabilities  59,076   57,853   60,506 
Total liabilities  6,898,189   6,673,343   6,703,992 
       
Total stockholders' equity  932,179   846,391   858,497 
Total liabilities and stockholders' equity$7,830,368  $7,519,734  $7,562,489 


FIRST MID BANCSHARES, INC.
Condensed Consolidated Statements of Income
(In thousands, except per share data, unaudited)
          
   Three Months Ended Nine Months Ended
   September 30, September 30,
    2025   2024   2025   2024 
Interest income:         
Interest and fees on loans $87,020  $81,775  $251,722  $239,158 
Interest on investment securities  7,659   7,036   21,331   21,846 
Interest on federal funds sold & other deposits 1,456   2,371   4,042   6,533 
Total interest income   96,135   91,182   277,095   267,537 
Interest expense:         
Interest on deposits   25,179   28,341   73,865   80,775 
Interest on securities sold under agreements to repurchase   1,105   1,444   3,503   5,115 
Interest on other borrowings  2,186   2,195   6,060   6,757 
Interest on jr. subordinated debentures  452   567   1,384   1,646 
Interest on subordinated debt  850   1,092   2,648   3,466 
Total interest expense   29,772   33,639   87,460   97,759 
Net interest income   66,363   57,543   189,635   169,778 
Provision for credit losses  3,353   1,266   7,572   1,992 
Net interest income after provision for credit losses 63,010   56,277   182,063   167,786 
Non-interest income:         
Wealth management revenues  5,145   5,816   16,350   16,543 
Insurance commissions   7,089   6,003   24,854   21,747 
Service charges   3,240   3,121   9,136   9,304 
Net securities losses   (1,930)  (277)  (2,111)  (433)
Mortgage banking revenues  1,255   1,109   3,036   2,853 
ATM/debit card revenue  4,182   4,267   12,464   12,603 
Other   3,928   2,984   7,637   7,306 
Total non-interest income  22,909   23,023   71,366   69,923 
Non-interest expense:         
Salaries and employee benefits  33,570   31,565   98,941   92,177 
Net occupancy and equipment expense  9,196   8,055   25,544   23,122 
Net other real estate owned expense  217   107   393   171 
FDIC insurance   874   829   2,596   2,600 
Amortization of intangible assets  3,128   3,405   9,480   10,242 
Stationery and supplies   411   482   1,209   1,243 
Legal and professional expense  2,454   2,573   8,287   7,558 
ATM/debit card expense  2,052   1,869   5,027   4,341 
Marketing and donations  959   836   2,588   2,512 
Other   4,285   4,212   12,315   14,720 
Total non-interest expense  57,146   53,933   166,380   158,686 
Income before income taxes  28,773   25,367   87,049   79,023 
Income taxes   6,311   5,885   18,978   19,293 
Net income  $22,462  $19,482  $68,071  $59,730 
          
Per Share Information         
Basic earnings per common share $0.94  $0.81  $2.85  $2.50 
Diluted earnings per common share  0.94   0.81   2.84   2.49 
          
Weighted average shares outstanding  23,876,020   23,905,099   23,867,537   23,891,430 
Diluted weighted average shares outstanding 23,997,198   24,006,647   23,981,938   23,988,478 


FIRST MID BANCSHARES, INC.
Condensed Consolidated Statements of Income
(In thousands, except per share data, unaudited)
             
  For the Quarter Ended
  September 30, June 30,
 March 31, December 31,
 September 30,
   2025   2025   2025   2024   2024 
Interest income:            
Interest and fees on loans $87,020  $84,784  $79,918  $81,288  $81,775 
Interest on investment securities  7,659   6,895   6,777   6,990   7,036 
Interest on federal funds sold & other deposits  1,456   1,722   864   1,564   2,371 
Total interest income  96,135   93,401   87,559   89,842   91,182 
Interest expense:            
Interest on deposits  25,179   24,964   23,722   26,144   28,341 
Interest on securities sold under agreements to repurchase  1,105   1,218   1,180   1,333   1,444 
Interest on other borrowings  2,186   2,043   1,831   1,917   2,195 
Interest on jr. subordinated debentures  452   464   468   510   567 
Interest on subordinated debt  850   849   949   988   1,092 
Total interest expense  29,772   29,538   28,150   30,892   33,639 
Net interest income  66,363   63,863   59,409   58,950   57,543 
Provision for credit losses  3,353   2,567   1,652   3,643   1,266 
Net interest income after provision for credit losses  63,010   61,296   57,757   55,307   56,277 
Non-interest income:            
Wealth management revenues  5,145   5,394   5,800   6,275   5,816 
Insurance commissions  7,089   7,840   9,925   6,805   6,003 
Service charges  3,240   2,995   2,901   3,058   3,121 
Net securities losses  (1,930)  0   (181)  0   (277)
Mortgage banking revenues  1,255   1,070   711   1,104   1,109 
ATM/debit card revenue  4,182   4,636   3,646   4,204   4,267 
Other  3,928   1,658   2,062   4,917   2,984 
Total non-interest income  22,909   23,593   24,864   26,363   23,023 
Non-interest expense:            
Salaries and employee benefits  33,570   33,623   31,748   31,957   31,565 
Net occupancy and equipment expense  9,196   7,869   8,479   7,285   8,055 
Net other real estate owned expense  217   75   101   240   107 
FDIC insurance  874   873   849   863   829 
Amortization of intangible assets  3,128   3,121   3,231   3,314   3,405 
Stationary and supplies  411   367   431   642   482 
Legal and professional expense  2,454   2,757   3,076   5,386   2,573 
ATM/debit card expense  2,052   1,144   1,831   2,043   1,869 
Marketing and donations  959   777   852   906   836 
Other  4,285   4,156   3,874   3,661   4,212 
Total non-interest expense  57,146   54,762   54,472   56,297   53,933 
Income before income taxes  28,773   30,127   28,149   25,373   25,367 
Income taxes  6,311   6,689   5,978   6,205   5,885 
Net income $22,462  $23,438  $22,171  $19,168  $19,482 
             
Per Share Information            
Basic earnings per common share $0.94  $0.98  $0.93  $0.80  $0.81 
Diluted earnings per common share  0.94   0.98   0.93   0.80   0.81 
             
Weighted average shares outstanding  23,876,020   23,867,592   23,858,817   23,818,806   23,905,099 
Diluted weighted average shares outstanding  23,997,198   23,988,974   23,959,228   23,908,340   24,006,647 


FIRST MID BANCSHARES, INC.
Consolidated Financial Highlights and Ratios
(Dollars in thousands, except per share data)
(Unaudited)
  As of and for the Quarter Ended
  September 30, June 30, March 31, December 31, September 30,
   2025   2025   2025   2024   2024 
           
Loan Portfolio          
Construction and land development $336,795  $298,812  $269,148  $236,093  $190,857 
Farm real estate loans  367,473   381,517   373,413   390,760   384,620 
1-4 Family residential properties  495,537   495,787   488,139   496,597   505,342 
Multifamily residential properties  330,549   360,604   356,858   332,644   338,167 
Commercial real estate  2,432,180   2,393,640   2,397,985   2,417,585   2,440,120 
Loans secured by real estate  3,962,534   3,930,360   3,885,543   3,873,679   3,859,106 
Agricultural operating loans  311,594   306,374   296,811   239,671   233,414 
Commercial and industrial loans  1,349,863   1,324,653   1,303,712   1,335,920   1,283,631 
Consumer loans  36,317   41,604   47,220   53,960   63,222 
All other loans  163,730   164,008   165,572   169,232   175,218 
Total loans  5,824,038   5,766,999   5,698,858   5,672,462   5,614,591 
           
Deposit Portfolio          
Non-interest bearing demand deposits $1,450,244  $1,321,446  $1,394,590  $1,329,155  $1,387,290 
Interest bearing demand deposits  1,901,516   1,947,744   1,814,427   1,907,733   1,834,123 
Savings deposits  617,311   632,925   643,289   636,427   648,582 
Money Market  1,184,964   1,206,140   1,215,420   1,196,537   1,183,594 
Time deposits  1,135,508   1,081,944   1,062,654   987,244   1,035,245 
Total deposits  6,289,543   6,190,199   6,130,380   6,057,096   6,088,834 
           
Asset Quality          
Non-performing loans $22,199  $21,895  $26,598  $29,835  $18,242 
Non-performing assets  23,670   23,572   28,703   32,030   20,076 
Net charge-offs (recoveries)  1,588   1,458   1,783   2,235   804 
Allowance for credit losses to non-performing loans  328.51%   325.00%   263.36%   235.23%   377.01% 
Allowance for credit losses to total loans outstanding  1.25%   1.23%   1.23%   1.24%   1.22% 
Nonperforming loans to total loans  0.38%   0.38%   0.47%   0.53%   0.32% 
Nonperforming assets to total assets  0.30%   0.31%   0.38%   0.43%   0.27% 
Special Mention loans  61,195   81,815   74,019   57,848   38,151 
Substandard and Doubtful loans  75,309   39,031   33,884   35,516   29,037 
           
Common Share Data          
Common shares outstanding  23,996,833   23,988,845   23,981,916   23,895,807   23,904,051 
Book value per common share $38.85  $37.27  $36.32  $35.42  $35.91 
Tangible book value per common share(1)  28.21   26.62   25.53   24.46   24.82 
Tangible book value per common share excluding other comprehensive income at period end(1)  32.79   32.07   31.21   30.42   29.70 
Market price of stock  37.88   37.49   34.90   36.82   38.91 
           
Key Performance Ratios and Metrics          
End of period earning assets $7,101,811  $6,924,934  $6,844,096  $6,775,075  $6,786,458 
Average earning assets  7,014,675   6,975,783   6,769,858   6,884,303   6,857,070 
Average rate on average earning assets (tax equivalent)  5.48%   5.41%   5.29%   5.24%   5.35% 
Average rate on cost of funds  1.75%   1.75%   1.74%   1.83%   2.00% 
Net interest margin (tax equivalent)(1)(2)  3.80%   3.72%   3.60%   3.41%   3.35% 
Return on average assets  1.17%   1.20%   1.19%   1.01%   1.03% 
Adjusted return on average assets(1)  1.21%   1.23%   1.23%   1.10%   1.05% 
Return on average common equity  9.95%   10.52%   10.35%   9.04%   9.40% 
Adjusted return on average common equity(1)  10.34%   10.80%   10.78%   9.80%   9.58% 
Efficiency ratio (tax equivalent)(1)  58.75%   58.09%   58.88%   58.76%   61.33% 
Full-time equivalent employees  1,178   1,190   1,194   1,198   1,207 
           
1Non-GAAP financial measure. Refer to reconciliation to the comparable GAAP measure.
2During the first quarter 2025, the Company changed the methodology utilized for the calculation of net interest margin to be more consistent with what is typically used by peer banks and research analysts. The calculation now is the annualized net interest income on a tax equivalent basis divided by average interest earning assets.


FIRST MID BANCSHARES, INC.
Net Interest Margin
                     (In thousands, unaudited)
  For the Quarter Ended September 30, 2025
  QTD Average    Average
  Balance Interest
 Rate
INTEREST EARNING ASSETS       
Interest bearing deposits $123,271  $1,432  4.61%
Federal funds sold  76   1  5.22%
Certificates of deposit investments  2,009   23  4.54%
Investment Securities  1,130,674   8,146  2.88%
Loans (net of unearned income)  5,758,645   87,311  6.02%
        
Total interest earning assets  7,014,675   96,913  5.48%
        
NONEARNING ASSETS       
Other nonearning assets  769,758      
Allowance for loan losses  (72,065)     
        
Total assets $7,712,368      
        
INTEREST BEARING LIABILITIES       
Demand deposits $3,203,911  $15,983  1.98%
Savings deposits  625,166   180  0.11%
Time deposits  1,077,433   9,014  3.32%
Total interest bearing deposits  4,906,510   25,177  2.04%
Repurchase agreements  192,187   1,105  2.28%
FHLB advances  233,043   2,181  3.71%
Federal funds purchased  46   5  0.00%
Subordinated debt  79,609   850  4.24%
Jr. subordinated debentures  24,400   452  7.35%
Other debt  -   -  0.00%
Total borrowings  529,285   4,593  3.44%
Total interest bearing liabilities  5,435,795   29,770  2.17%
        
NONINTEREST BEARING LIABILITIES       
Demand deposits  1,331,638  Avg Cost of Funds1.75%
Other liabilities  41,524      
Stockholders' equity  903,411      
        
Total liabilities & stockholders' equity $7,712,368      
        
Net Interest Earnings / Spread   $67,143  3.31%
        
Tax effected yield on interest earning assets    3.80%
        
Tax equivalent net interest margin is a non-GAAP financial measure. Refer to reconciliation to the comparable GAAP measure. 


FIRST MID BANCSHARES, INC.
Reconciliation of Non-GAAP Financial Measures
(In thousands, unaudited)
           
  As of and for the Quarter Ended
  September 30,June 30, March 31, December 31, September 30,
   2025   2025   2025   2024   2024 
           
Net interest income as reported $66,363  $63,863  $59,409  $58,950  $57,543 
Net interest income, (tax equivalent)  67,143   64,634   60,162   59,717   58,627 
Average earning assets  7,014,675   6,975,783   6,769,858   6,884,303   6,857,070 
Net interest margin (tax equivalent)  3.80%   3.72%   3.60%   3.41%   3.35% 
           
           
Common stockholder's equity $932,179  $894,140  $870,949  $846,391  $858,497 
Goodwill and intangibles, net  255,217   255,547   258,671   261,906   265,139 
Common shares outstanding  23,997   23,989   23,982   23,896   23,904 
Tangible Book Value per common share $28.21  $26.62  $25.53  $24.46  $24.82 
Accumulated other comprehensive loss (AOCI) (110,012)  (130,710)  (136,097)  (142,383)  (116,692)
Adjusted tangible book value per common share$32.79  $32.07  $31.21  $30.42  $29.70 


FIRST MID BANCSHARES, INC.
Reconciliation of Non-GAAP Financial Measures
(In thousands, except per share data, unaudited)
           
  As of and for the Quarter Ended
  September 30,
 June 30, March 31, December 31, September 30,
   2025   2025   2025   2024   2024 
Adjusted earnings Reconciliation          
Net Income - GAAP $22,462  $23,438  $22,171  $19,168  $19,482 
Adjustments (post-tax):(1)          
Nonrecurring technology project expenses  360   246   728   1,710   - 
Net (gain)/loss on securities sales  1,525   -   143   -   219 
Net (gain)/loss on real estate sales  (1,033)  -   -   -   - 
Nonrecurring severance expense  15   -   -   -   - 
Integration and acquisition expenses  13   3   41   -   137 
Total non-recurring adjustments (non-GAAP)$880  $249  $912  $1,710  $356 
           
Adjusted earnings - non-GAAP $23,342  $23,687  $23,083  $20,878  $19,838 
Adjusted diluted earnings per share (non-GAAP)$0.97  $0.99  $0.96  $0.87  $0.83 
Adjusted return on average assets (non-GAAP) 1.21%   1.23%   1.23%   1.10%   1.05% 
Adjusted return on average common equity (non-GAAP) 10.34%   10.80%   10.78%   9.80%   9.58% 
           
           
Efficiency Ratio Reconciliation          
Noninterest expense - GAAP $57,146  $54,762  $54,472  $56,297  $53,933 
Other real estate owned property income (expense) (217)  (75)  (101)  (240)  (107)
Amortization of intangibles  (3,128)  (3,121)  (3,231)  (3,314)  (3,405)
Loss on real estate sales  (95)  -   -   -   - 
Nonrecurring severance expense  (19)  -   -   -   - 
Nonrecurring technology project expense  (456)  (311)  (921)  (2,164)  - 
Integration and acquisition expenses  (17)  (4)  (52)  -   (174)
Adjusted noninterest expense (non-GAAP) $53,214  $51,251  $50,167  $50,579  $50,247 
           
Net interest income -GAAP $66,363  $63,863  $59,409  $58,950  $57,543 
Effect of tax-exempt income(1)  780   771   753   767   1,084 
Adjusted net interest income (non-GAAP) $67,143  $64,634  $60,162  $59,717  $58,627 
           
Noninterest income - GAAP $22,909  $23,593  $24,864  $26,363  $23,023 
Gain on real estate sales  (1,403) $-  $-  $-  $- 
Net (gain)/loss on securities sales  1,930   0   181   0   277 
Adjusted noninterest income (non-GAAP) $23,436  $23,593  $25,045  $26,363  $23,300 
           
Adjusted total revenue (non-GAAP) $90,579  $88,227  $85,207  $86,080  $81,927 
           
Efficiency ratio (non-GAAP)  58.75%   58.09%   58.88%   58.76%   61.33% 
           
(1) Nonrecurring items (post-tax) and tax-exempt income are calculated using an estimated effective tax rate of 21%.

Exhibit 99.2


First Mid Bancshares, Inc. Q3 2025 Investor Presentation Investor Contacts: Austin Frank Director of Investor Relations 217 - 258 - 5522 [email protected] Jordan Read Chief Financial Officer Chief Risk Officer 636 - 626 - 2265 [email protected] NASDAQ: FMBH firstmid.com


Disclosures Forward Looking Statements This document may contain certain forward - looking statements about First Mid and Two Rivers, such as discussions of First Mid’s and Two Rivers’ pricing and fee trends, credit quality and outlook, liquidity, new business results, expansion plans, anticipated expenses and planned schedules. First Mid and Two Rivers intend such forward - looking statements to be covered by the safe harbor provisions for forward - looking statements contained in the Private Securities Litigation Reform Act of 1995. Forward - looking statements, which are based on certain assumptions and describe future plans, strategies and expectations of First Mid and Two Rivers are identified by use of the words “believe,” “expect,” “intend,” “anticipate,” “estimate,” “project,” or similar expressions. Actual results could differ materially from the results indicated by these statements because the realization of those results is subject to many risks and uncertainties, including, among other things, the possibility that any of the anticipated benefits of the proposed transactions between First Mid and Two Rivers will not be realized within the expected time period; the risk that integration of the operations of Two Rivers with First Mid will be materially delayed or will be more costly or difficult than expected; the inability to complete the proposed transactions due to the failure to satisfy conditions to completion of the proposed transactions, including failure to obtain the required regulatory, shareholder and other approvals; the failure of the proposed transactions to close for any other reason; the effect of the announcement of the proposed transactions on customer relationships and operating results; the possibility that the proposed transactions may be more expensive to complete than anticipated, including as a result of unexpected factors or events; changes in interest rates; general economic conditions and those in the market areas of First Mid and Two Rivers; legislative and/or regulatory changes; monetary and fiscal policies of the U.S. Government, including policies of the U.S. Treasury and the Federal Reserve Board; the quality or composition of First Mid’s and Two Rivers’ loan or investment portfolios and the valuation of those investment portfolios; demand for loan products; deposit flows; competition, demand for financial services in the market areas of First Mid and Two Rivers; accounting principles, policies and guidelines; and the ability to complete the proposed transactions or any of the other foregoing risks. Additional information concerning First Mid, including additional factors and risks that could materially affect First Mid’s financial results, are included in First Mid’s filings with the SEC, including its Annual Reports on Form 10 - K and Quarterly Reports on Form 10 - Q. Forward - looking statements speak only as of the date they are made. Except as required under the federal securities laws or the rules and regulations of the SEC, First Mid and Two Rivers do not undertake any obligation to update or review any forward - looking information, whether as a result of new information, future events or otherwise. Non - GAAP Financial Measures: In addition to reports presented in accordance with generally accepted accounting principles (“GAAP”), this release contains certain non - GAAP financial measures. The Company believes that such non - GAAP financial measures provide investors with information useful in understanding the Company’s financial performance. Readers of this release, however, are urged to review these non - GAAP financial measures in conjunction with the GAAP results as reported. These non - GAAP financial measures are detailed as supplemental tables and include “Adjusted Net Earnings,” “Adjusted Diluted EPS,” “Efficiency Ratio,” “Net Interest Margin, tax equivalent,” “Tangible Book Value per Common Share,” “Adjusted Tangible Book Value per Common Share,” “Adjusted Return on Assets,” and “Adjusted Return on Average Common Equity”. While the Company believes these non - GAAP financial measures provide investors with a broader understanding of the capital adequacy, funding profile and financial trends of the Company, this information should be considered as supplemental in nature and not as a substitute to the related financial information prepared in accordance with GAAP. These non - GAAP financial measures may also differ from the similar measures presented by other companies. 2


Disclosures 3 Important Information about the Merger and Additional Information First Mid will file a registration statement on Form S - 4 with the SEC in connection with the proposed transaction. The registration statement will include a proxy statement of Two Rivers that also constitutes a prospectus of First Mid, which will be sent to the shareholders of Two Rivers. Two Rivers shareholders are urged to read the proxy statement/prospectus when it becomes available, which will contain important information about First Mid, Two Rivers and the proposed transaction, including detailed risk factors. The proxy statement/prospectus and other documents which will be filed by First Mid with the SEC will be available free of charge at the SEC’s website, www.sec.gov . These documents also can be obtained free of charge by accessing First Mid’s website at www.firstmid.com under the tab “Investor Relations” and then under “SEC Filings.” Alternatively, when available, these documents can be obtained free of charge from First Mid upon written request to First Mid Bancshares, PO Box 499, Mattoon, IL 61938, Attention: Investor Relations; or from Two Rivers upon written request to Two Rivers Financial Group, Inc., 222 North Main St., Burlington, IA 52601 - 5214, Attention: Andrea Gerst, CFO. A final proxy statement/prospectus will be mailed to the shareholders of Two Rivers. Participants in the Solicitation First Mid and Two Rivers, and certain of their respective directors, executive officers, and other members of management and employees, are participants in the solicitation of proxies in connection with the proposed transactions. Information about the directors and executive officers of First Mid is set forth in the proxy statement for its 2025 annual meeting of stockholders, which was filed with the SEC on March 18, 2025. These documents can be obtained free of charge from the sources provided above. Investors may obtain additional information regarding the interests of such participants in the proposed transactions by reading the proxy statement/prospectus for such proposed transactions when it becomes available. No Offer or Solicitation This communication shall not constitute an offer to sell or the solicitation of an offer to buy securities, nor shall there by any sale of securities in any jurisdiction in which such offer, solicitation or sale would be unlawful prior to registration or qualification under the securities laws of such jurisdiction.


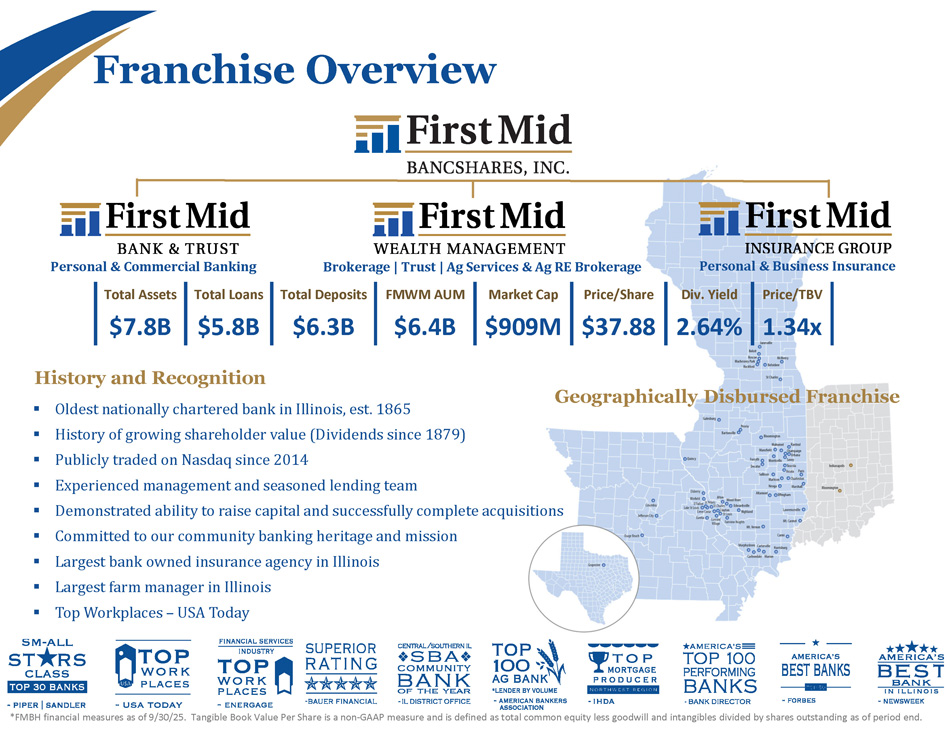
Franchise Overview Geographically Disbursed Franchise History and Recognition ▪ Oldest nationally chartered bank in Illinois, est. 1865 ▪ History of growing shareholder value (Dividends since 1879) ▪ Publicly traded on Nasdaq since 2014 ▪ Experienced management and seasoned lending team ▪ Demonstrated ability to raise capital and successfully complete acquisitions ▪ Committed to our community banking heritage and mission ▪ Largest bank owned insurance agency in Illinois ▪ Largest farm manager in Illinois ▪ Top Workplaces – USA Today *FMBH financial measures as of 9/30/25. Tangible Book Value Per Share is a non - GAAP measure and is defined as total common equity less goodwill and intangibles divided by shares outstanding as of period end. Price/TBV Div. Yield Price/Share Market Cap FMWM AUM Total Deposits Total Loans Total Assets 1.34x 2.64% $37.88 $909M $6.4B $6.3B $5.8B $7.8B Personal & Commercial Banking Brokerage | Trust | Ag Services & Ag RE Brokerage Personal & Business Insurance


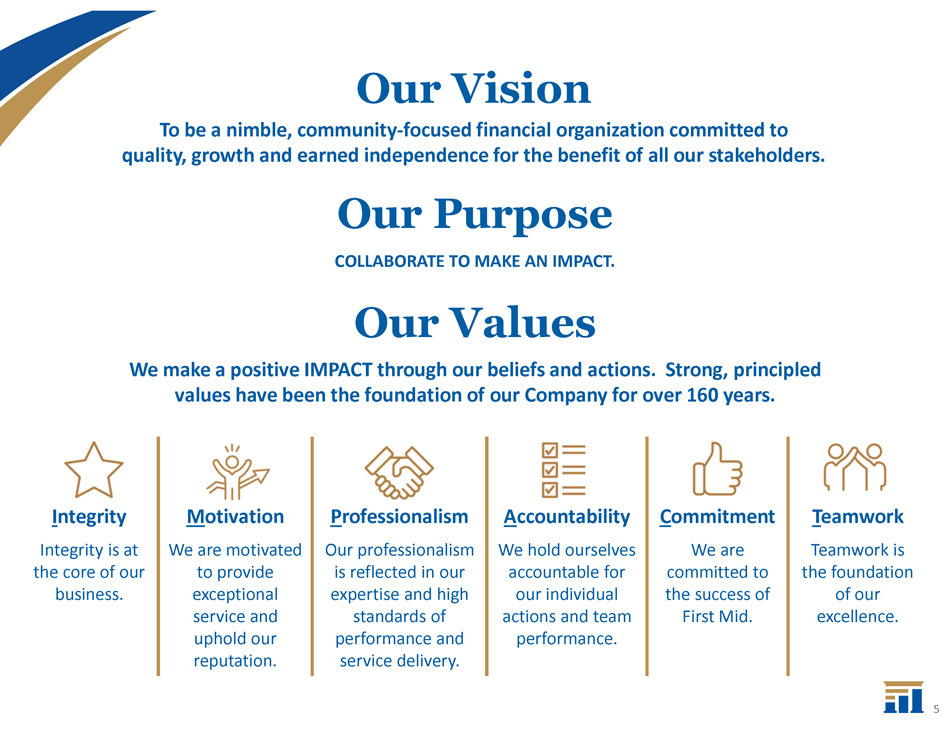
To be a nimble, community - focused financial organization committed to quality, growth and earned independence for the benefit of all our stakeholders. Our Purpose COLLABORATE TO MAKE AN IMPACT. Our Values We make a positive IMPACT through our beliefs and actions. Strong, principled values have been the foundation of our Company for over 160 years. Our Vision T eamwork Teamwork is the foundation of our excellence. C ommitment We are committed to the success of First Mid. A ccountability We hold ourselves accountable for our individual actions and team performance. P rofessionalism Our professionalism is reflected in our expertise and high standards of performance and service delivery. M otivation We are motivated to provide exceptional service and uphold our reputation. I ntegrity Integrity is at the core of our business. 5


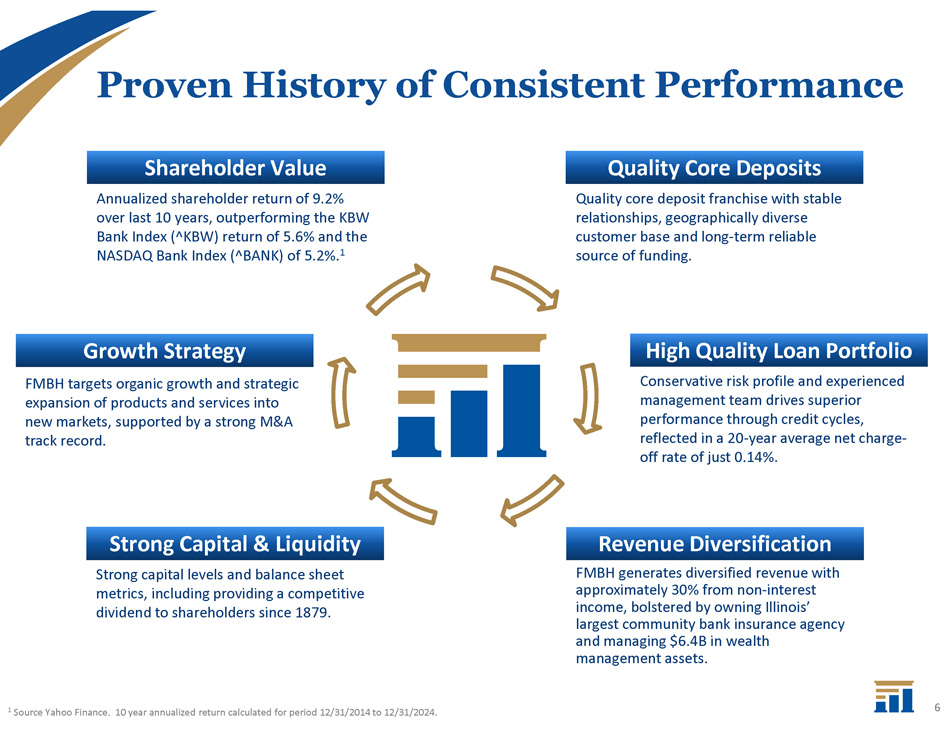
Proven History of Consistent Performance Revenue Diversification Revenue Diversification FMBH generates diversified revenue with approximately 30% from non - interest income, bolstered by owning Illinois’ largest community bank insurance agency and managing $6.4B in wealth management assets. Quality Core Deposits Quality Core Deposits Quality core deposit franchise with stable relationships, geographically diverse customer base and long - term reliable source of funding. High Quality Loan Portfolio High Quality Loan Portfolio Conservative risk profile and experienced management team drives superior performance through credit cycles, reflected in a 20 - year average net charge - off rate of just 0.14%. Shareholder Value Shareholder Value Annualized shareholder return of 9.2% over last 10 years, outperforming the KBW Bank Index (^KBW) return of 5.6% and the NASDAQ Bank Index (^BANK) of 5.2%. 1 Strong Capital & Liquidity Strong Capital & Liquidity Strong capital levels and balance sheet metrics, including providing a competitive dividend to shareholders since 1879. Growth Strategy Growth Strategy FMBH targets organic growth and strategic expansion of products and services into new markets, supported by a strong M&A track record. 1 Source Yahoo Finance. 10 year annualized return calculated for period 12/31/2014 to 12/31/2024. 6


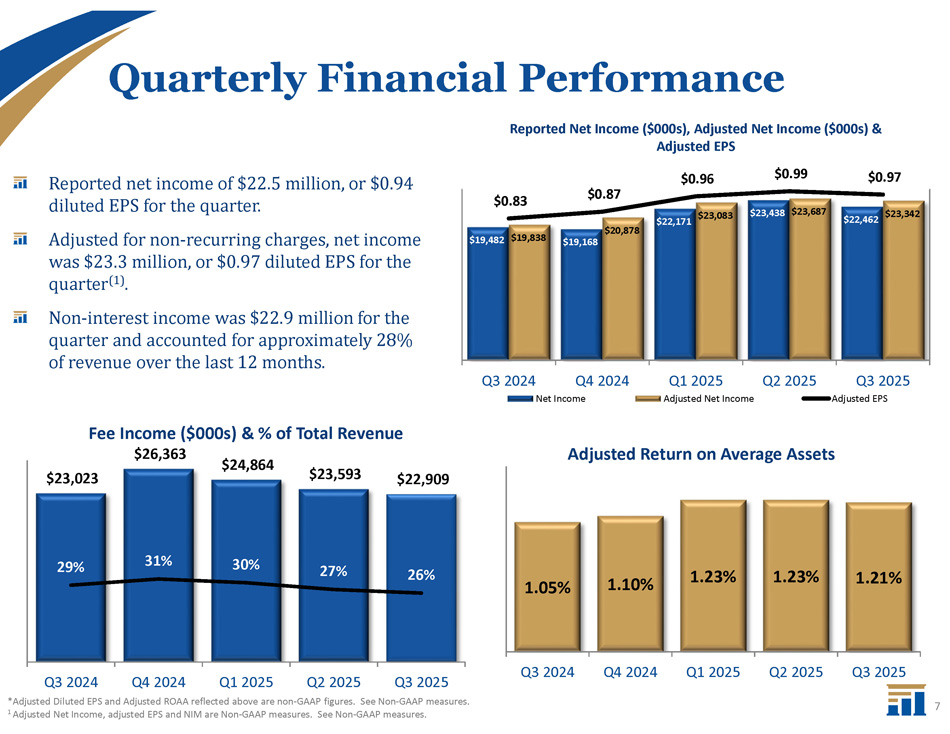
$19,168 $19,482 $19,838 $20,878 $22,171 $23,083 $23,438 $23,687 $22,462 $23,342 $0.83 $0.87 $0.96 $0.99 $0.97 Q3 2024 Q4 2024 Q1 2025 Adjusted Net Income Q2 2025 Q3 2025 Adjusted EPS Reported Net Income ($000s), Adjusted Net Income ($000s) & Adjusted EPS Net Income Quarterly Financial Performance 7 $24,864 $23,593 $23,023 $22,909 29% 31% 30% 27% 26% Fee Income ($000s) & % of Total Revenue $26,363 Q3 2024 Q4 2024 Q1 2025 Q2 2025 Q3 2025 *Adjusted Diluted EPS and Adjusted ROAA reflected above are non - GAAP figures. See Non - GAAP measures. 1 Adjusted Net Income, adjusted EPS and NIM are Non - GAAP measures. See Non - GAAP measures. 1.05% 1.10% 1.23% 1.23% 1.21% Q3 2024 Q4 2024 Q1 2025 Q2 2025 Q3 2025 Adjusted Return on Average Assets Reported net income of $22.5 million, or $0.94 diluted EPS for the quarter. Adjusted for non - recurring charges, net income was $23.3 million, or $0.97 diluted EPS for the quarter (1) . Non - interest income was $ 22 . 9 million for the quarter and accounted for approximately 28 % of revenue over the last 12 months .


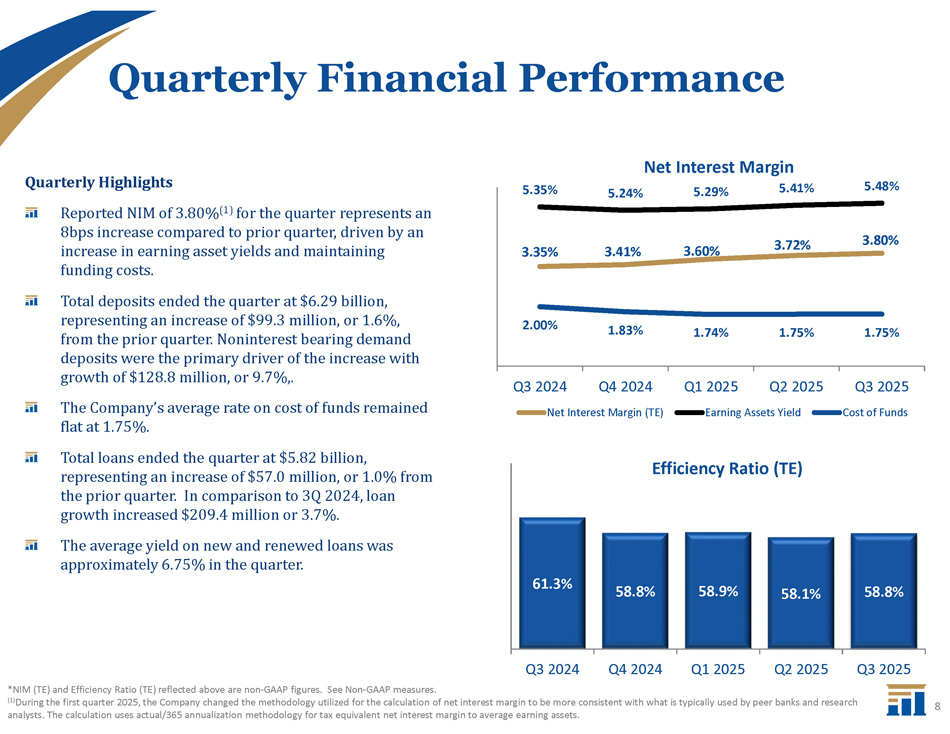
Quarterly Financial Performance 8 61.3% 58.8% 58.9% 58.1% 58.8% Efficiency Ratio (TE) Q3 2024 Q4 2024 Q1 2025 Q2 2025 Q3 2025 *NIM (TE) and Efficiency Ratio (TE) reflected above are non - GAAP figures. See Non - GAAP measures. (1) During the first quarter 2025, the Company changed the methodology utilized for the calculation of net interest margin to be more consistent with what is typically used by peer banks and research analysts. The calculation uses actual/365 annualization methodology for tax equivalent net interest margin to average earning assets. 3.35% 3.41% 3.60% 3.72% 3.80% 5.35% 5.24% 5.29% 5.41% 5.48% 2.00% 1.83% 1.74% 1.75% 1.75% Q3 2025 Cost of Funds % % % % % % Net Interest Margin Q3 2024 Q4 2024 Net Interest Margin (TE) Q1 2025 Q2 2025 Earning Assets Yield Quarterly Highlights Reported NIM of 3.80% (1) for the quarter represents an 8bps increase compared to prior quarter, driven by an increase in earning asset yields and maintaining funding costs. Total deposits ended the quarter at $6.29 billion, representing an increase of $99.3 million, or 1.6%, from the prior quarter. Noninterest bearing demand deposits were the primary driver of the increase with growth of $128.8 million, or 9.7%,. The Company’s average rate on cost of funds remained flat at 1.75%. Total loans ended the quarter at $5.82 billion, representing an increase of $57.0 million, or 1.0% from the prior quarter. In comparison to 3Q 2024, loan growth increased $209.4 million or 3.7%. The average yield on new and renewed loans was approximately 6.75% in the quarter.


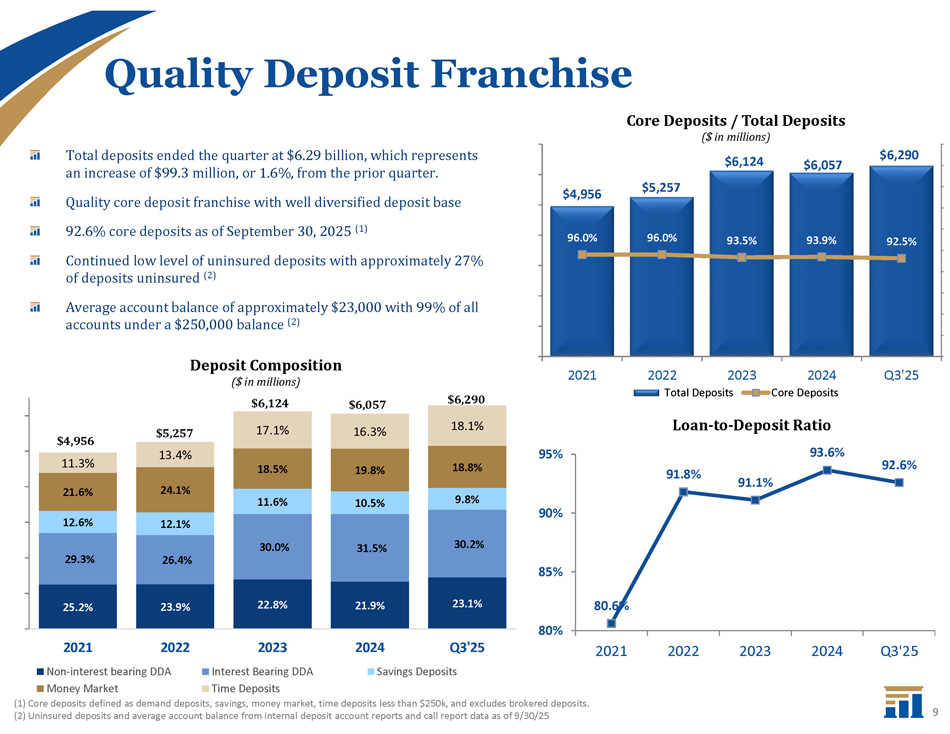
Quality Deposit Franchise 9 $4,956 $5,257 $6,124 $6,057 $6,290 96.0% 96.0% 93.5% 93.9% 92.5% 2021 2024 Core Deposits Q3'25 2022 2023 Total Deposits Core Deposits / Total Deposits ($ in millions) 80.6% 91.8% 91.1% 92.6% Loan - to - Deposit Ratio 93.6% 80% 85% 90% 95% 2021 2022 2023 2024 Q3'25 Total deposits ended the quarter at $6.29 billion, which represents an increase of $99.3 million, or 1.6%, from the prior quarter. Quality core deposit franchise with well diversified deposit base 92.6% core deposits as of September 30, 2025 (1) Continued low level of uninsured deposits with approximately 27% of deposits uninsured (2) Average account balance of approximately $23,000 with 99% of all accounts under a $250,000 balance (2) (1) Core deposits defined as demand deposits, savings, money market, time deposits less than $250k, and excludes brokered deposits. (2) Uninsured deposits and average account balance from internal deposit account reports and call report data as of 9/30/25 23.1% 21.9% 22.8% 23.9% 25.2% 30.2% 31.5% 30.0% 26.4% 29.3% 9.8% 10.5% 11.6% 12.1% 12.6% 18.8% 19.8% 18.5% 24.1% 21.6% 18.1% 16.3% 17.1% 13.4% 11.3% 2024 Q3'25 Savings Deposits 2021 2022 Non - interest bearing DDA Money Market 2023 Interest Bearing DDA Time Deposits $4,956 $5,257 Deposit Composition ($ in millions) $6,124 $6,057 $6,290


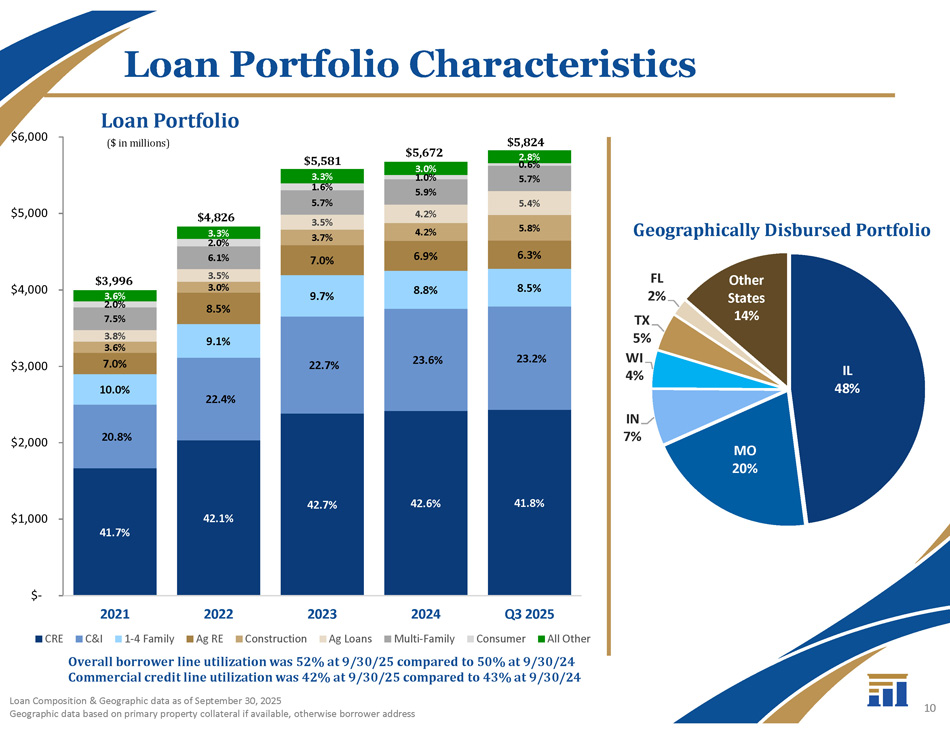
IL 48% MO 20% IN 7% FL 2% TX 5% WI 4% Other States 14 % 41.8% 42.6% 42.7% 42.1% 41.7% 23.2% 23.6% 22.7% 22.4% 20.8% 8.5% 8.8% 9.7% 9.1% 10.0% 6.3% 6.9% 7.0% 8.5% 7.0% 5.8% 4.2% 3.7% 3.0% 3.6% 5.4% 4.2% 3.5% 3.5% 3.8% 5.7% 5.9% 5.7% 6.1% 7.5% 1.6% 2.8% 0.6% 3.0% 1.0% 3.3% 3.3% 2.0% 3.6% 2.0% $ - $1,000 $2,000 $3,000 $4,000 $5,000 $6,000 2021 CRE C&I 1 - 4 Family 2022 Ag RE Construction 2023 Ag Loans 2024 Q3 2025 Multi - Family Consumer All Other Loan Portfolio Characteristics 10 Overall borrower line utilization was 52% at 9/30/25 compared to 50% at 9/30/24 Commercial credit line utilization was 42% at 9/30/25 compared to 43% at 9/30/24 Loan Composition & Geographic data as of September 30, 2025 Geographic data based on primary property collateral if available, otherwise borrower address Geographically Disbursed Portfolio $5,672 $5,824 $3,996 $5,581 $4,826 Loan Portfolio ($ in millions)


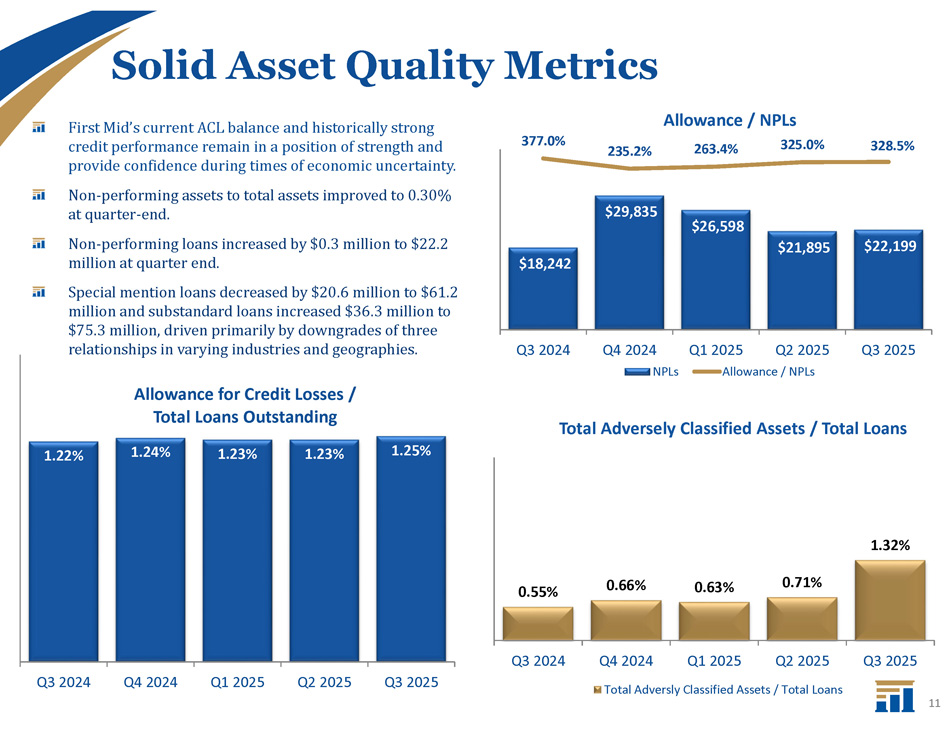
1.22% 1.24% 1.23% 1.23% 1.25% Q3 2024 Q4 2024 Q1 2025 Q2 2025 Q3 2025 Allowance for Credit Losses / Total Loans Outstanding Solid Asset Quality Metrics 11 0.55% 0.66% 0.63% 0.71% 1.32% Q3 2024 Q3 2025 Total Adversely Classified Assets / Total Loans Q4 2024 Q1 2025 Q2 2025 Total Adversly Classified Assets / Total Loans $18,242 $29,835 $26,598 $21,895 $22,199 377.0% 235.2% 263.4% 325.0% 328.5% Q3 2024 Q3 2025 Allowance / NPLs Q4 2024 NPLs Q1 2025 Q2 2025 Allowance / NPLs First Mid’s current ACL balance and historically strong credit performance remain in a position of strength and provide confidence during times of economic uncertainty. Non - performing assets to total assets improved to 0.30% at quarter - end. Non - performing loans increased by $0.3 million to $22.2 million at quarter end. Special mention loans decreased by $20.6 million to $61.2 million and substandard loans increased $36.3 million to $75.3 million, driven primarily by downgrades of three relationships in varying industries and geographies.


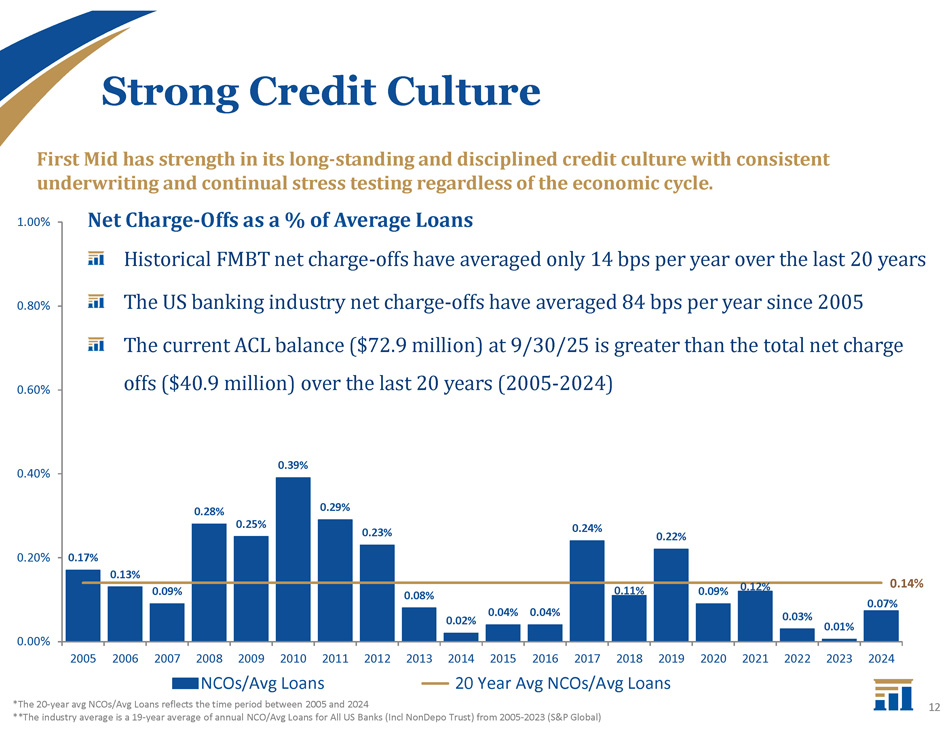
Strong Credit Culture 12 0.17% 0.13% 0.09% 0.28% 0.25% 0.39% 0.29% 0.23% 0.08% 0.02% 0.04% 0.04% 0.24% 0.11% 0.22% 0.09% 0.12% 0.03% 0.01% 0.07% 0.14% 0.00% 0.20% 0.40% 0.60% 0.80% 1.00% NCOs/Avg Loans 2005 2006 2007 2008 2009 2010 2011 2012 2013 2014 2015 2016 2017 2018 2019 2020 2021 2022 2023 2024 20 Year Avg NCOs/Avg Loans First Mid has strength in its long - standing and disciplined credit culture with consistent underwriting and continual stress testing regardless of the economic cycle. Net Charge - Offs as a % of Average Loans Historical FMBT net charge - offs have averaged only 14 bps per year over the last 20 years The US banking industry net charge - offs have averaged 84 bps per year since 2005 The current ACL balance ($72.9 million) at 9/30/25 is greater than the total net charge offs ($40.9 million) over the last 20 years (2005 - 2024) *The 20 - year avg NCOs/Avg Loans reflects the time period between 2005 and 2024 **The industry average is a 19 - year average of annual NCO/Avg Loans for All US Banks (Incl NonDepo Trust) from 2005 - 2023 (S&P Global)


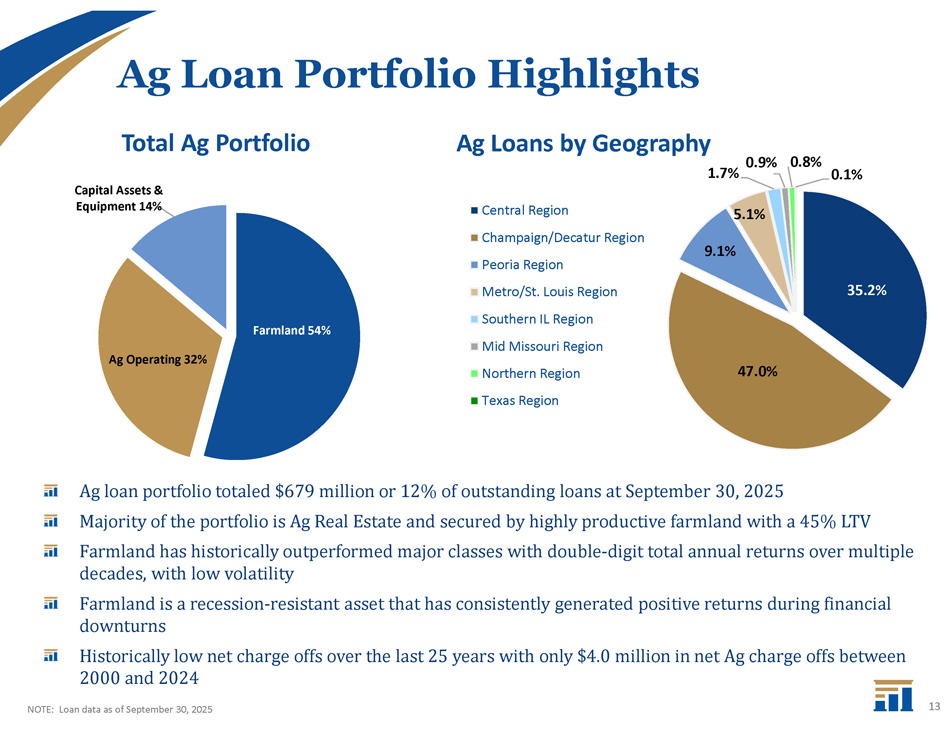
Farmland 54% Ag Operating 32% Capital Assets & Equipment 14% Total Ag Portfolio 35.2% 47.0% 9.1% 5.1% 0.9% 0.8% 0.1% Ag Loans by Geography 1.7% Central Region Champaign/Decatur Region Peoria Region Metro/St. Louis Region Southern IL Region Mid Missouri Region Northern Region Texas Region Ag Loan Portfolio Highlights 13 Ag loan portfolio totaled $679 million or 12% of outstanding loans at September 30, 2025 Majority of the portfolio is Ag Real Estate and secured by highly productive farmland with a 45% LTV Farmland has historically outperformed major classes with double - digit total annual returns over multiple decades, with low volatility Farmland is a recession - resistant asset that has consistently generated positive returns during financial downturns Historically low net charge offs over the last 25 years with only $4.0 million in net Ag charge offs between 2000 and 2024 NOTE: Loan data as of September 30, 2025


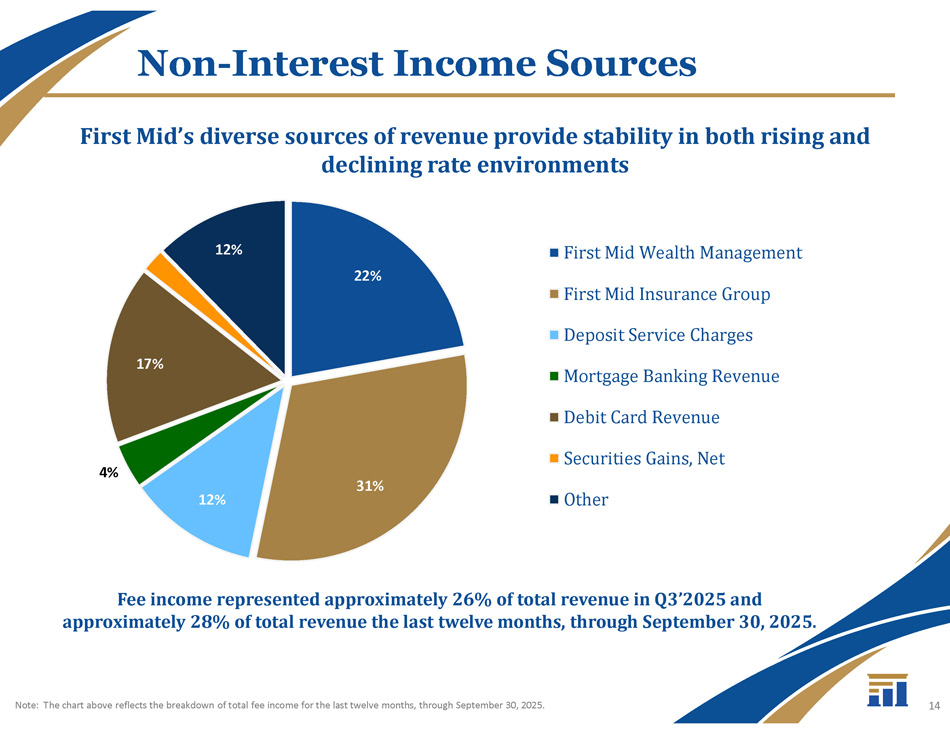
Non - Interest Income Sources First Mid’s diverse sources of revenue provide stability in both rising and declining rate environments 14 22% 31% 12% 4% 17% 12% First Mid Wealth Management First Mid Insurance Group Deposit Service Charges Mortgage Banking Revenue Debit Card Revenue Securities Gains, Net Other Note: The chart above reflects the breakdown of total fee income for the last twelve months, through September 30, 2025. Fee income represented approximately 26% of total revenue in Q3’2025 and approximately 28% of total revenue the last twelve months, through September 30, 2025.


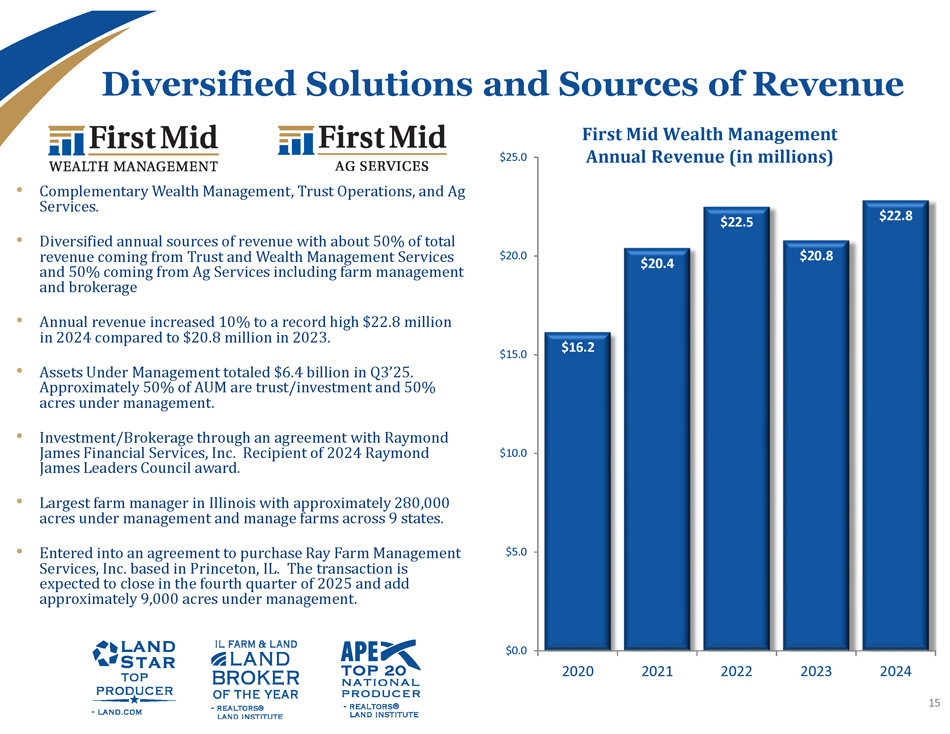
• Complementary Wealth Management, Trust Operations, and Ag Services. • Diversified annual sources of revenue with about 50% of total revenue coming from Trust and Wealth Management Services and 50% coming from Ag Services including farm management and brokerage • Annual revenue increased 10% to a record high $22.8 million in 2024 compared to $20.8 million in 2023. • Assets Under Management totaled $6.4 billion in Q3’25. Approximately 50% of AUM are trust/investment and 50% acres under management. • Investment/Brokerage through an agreement with Raymond James Financial Services, Inc. Recipient of 2024 Raymond James Leaders Council award. • Largest farm manager in Illinois with approximately 280,000 acres under management and manage farms across 9 states. • Entered into an agreement to purchase Ray Farm Management Services, Inc. based in Princeton, IL. The transaction is expected to close in the fourth quarter of 2025 and add approximately 9,000 acres under management. Diversified Solutions and Sources of Revenue 15 $16.2 $20.4 $22.5 $20.8 $22.8 $0.0 $5.0 $10.0 $15.0 $20.0 $25.0 2020 2021 2022 2023 2024 First Mid Wealth Management Annual Revenue (in millions)


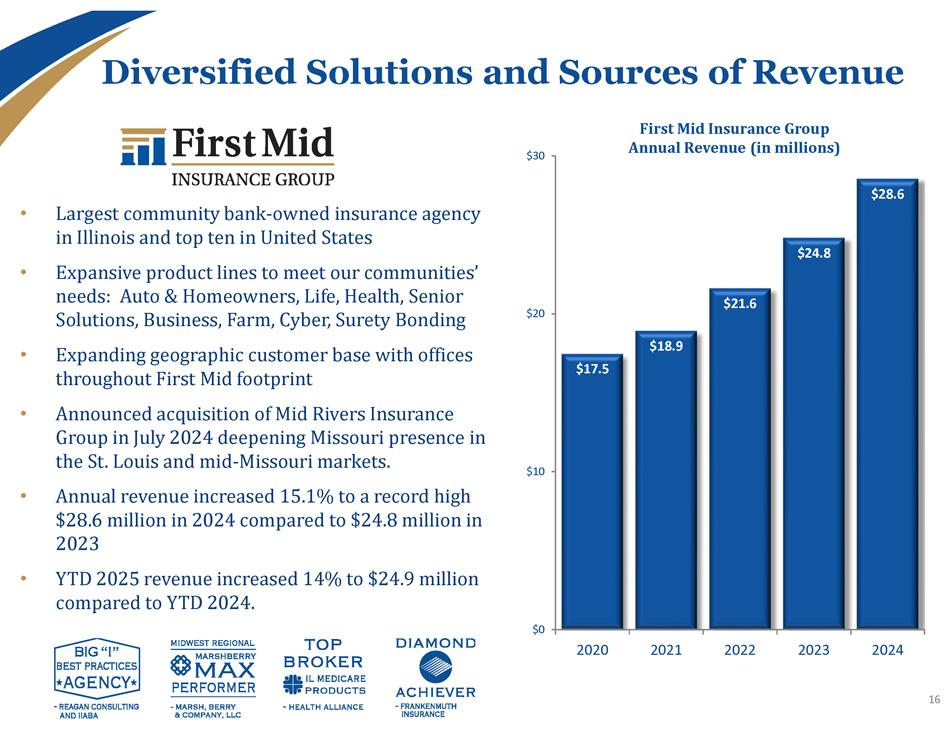
$17.5 $18.9 $21.6 $24.8 $28.6 $0 $10 $20 $30 2020 2021 2022 2023 2024 First Mid Insurance Group Annual Revenue (in millions) Diversified Solutions and Sources of Revenue 16 • Largest community bank - owned insurance agency in Illinois and top ten in United States • Expansive product lines to meet our communities’ needs: Auto & Homeowners, Life, Health, Senior Solutions, Business, Farm, Cyber, Surety Bonding • Expanding geographic customer base with offices throughout First Mid footprint • Announced acquisition of Mid Rivers Insurance Group in July 2024 deepening Missouri presence in the St. Louis and mid - Missouri markets. • Annual revenue increased 15.1% to a record high $28.6 million in 2024 compared to $24.8 million in 2023 • YTD 2025 revenue increased 14% to $24.9 million compared to YTD 2024.


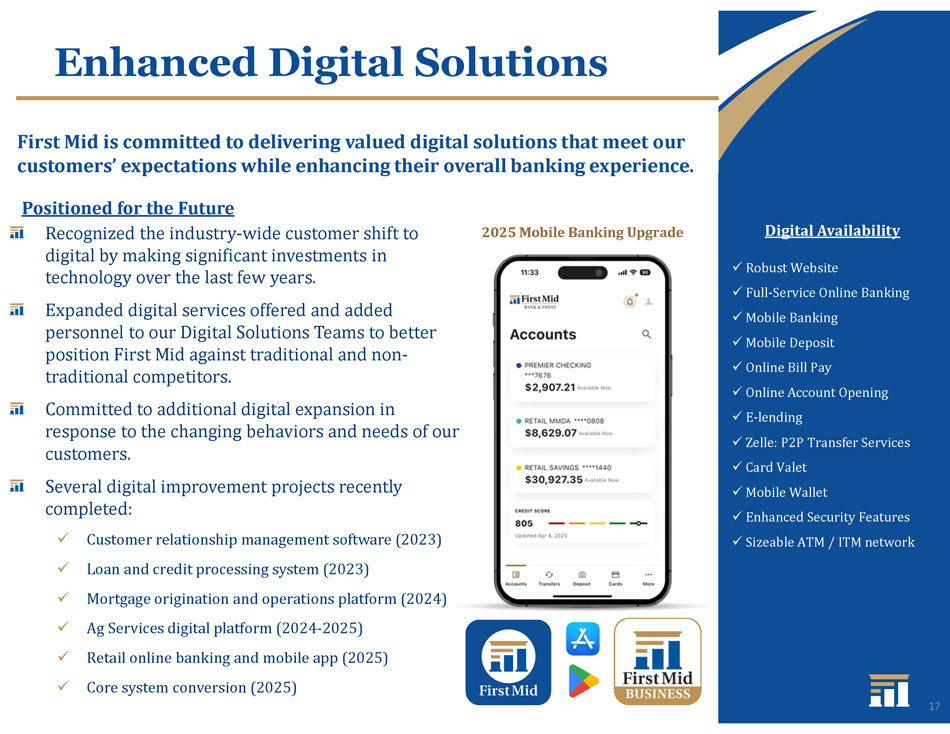
First Mid is committed to delivering valued digital solutions that meet our customers’ expectations while enhancing their overall banking experience. Enhanced Digital Solutions 17 x Customer relationship management software (2023) x Loan and credit processing system (2023) x Mortgage origination and operations platform (2024) x Ag Services digital platform (2024 - 2025) x Retail online banking and mobile app (2025) x Core system conversion (2025) Positioned for the Future Recognized the industry - wide customer shift to digital by making significant investments in technology over the last few years. Expanded digital services offered and added personnel to our Digital Solutions Teams to better position First Mid against traditional and non - traditional competitors. Committed to additional digital expansion in response to the changing behaviors and needs of our customers. Several digital improvement projects recently completed: x Robust Website x Full - Service Online Banking x Mobile Banking x Mobile Deposit x Online Bill Pay x Online Account Opening x E - lending x Zelle: P2P Transfer Services x Card Valet x Mobile Wallet x Enhanced Security Features x Sizeable ATM / ITM network Digital Availability 2025 Mobile Banking Upgrade


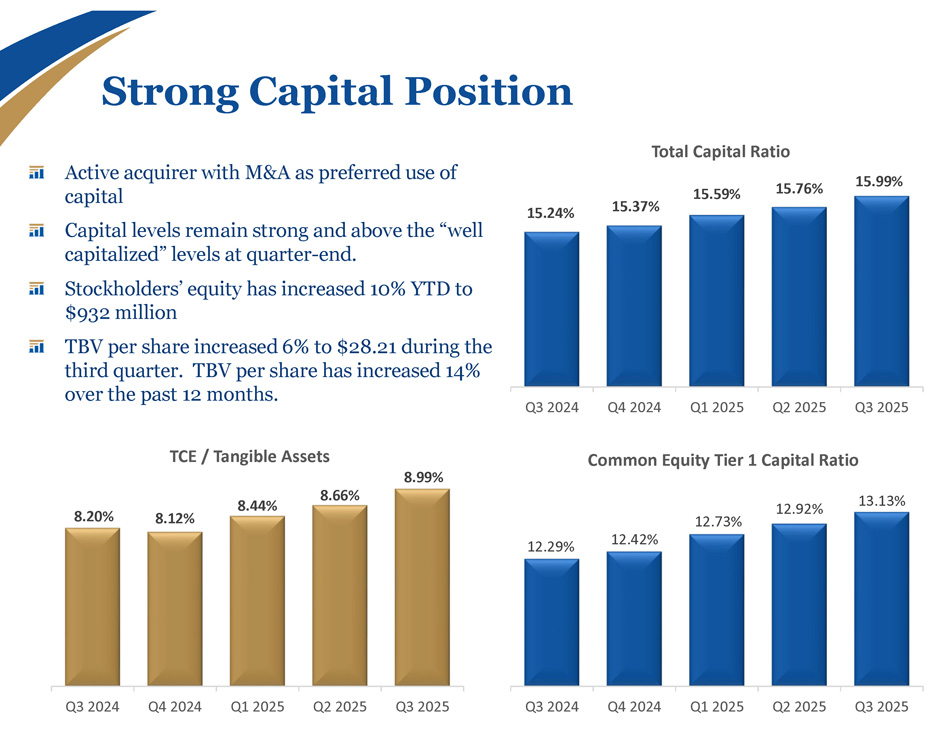
Strong Capital Position 12.29% 12.42% 12.73% 12.92% 13.13% Q3 2024 Q4 2024 Q1 2025 Q2 2025 Q3 2025 Common Equity Tier 1 Capital Ratio 15.24% 15.37% 15.59% 15.76% 15.99% Q3 2024 Q4 2024 Q1 2025 Q2 2025 Q3 2025 Total Capital Ratio 8.20% 8.12% 8.44% 8.66% 8.99% Q3 2024 Q4 2024 Q1 2025 Q2 2025 Q3 2025 TCE / Tangible Assets Active acquirer with M&A as preferred use of capital Capital levels remain strong and above the “well capitalized” levels at quarter - end. Stockholders’ equity has increased 10% YTD to $932 million TBV per share increased 6% to $28.21 during the third quarter. TBV per share has increased 14% over the past 12 months.


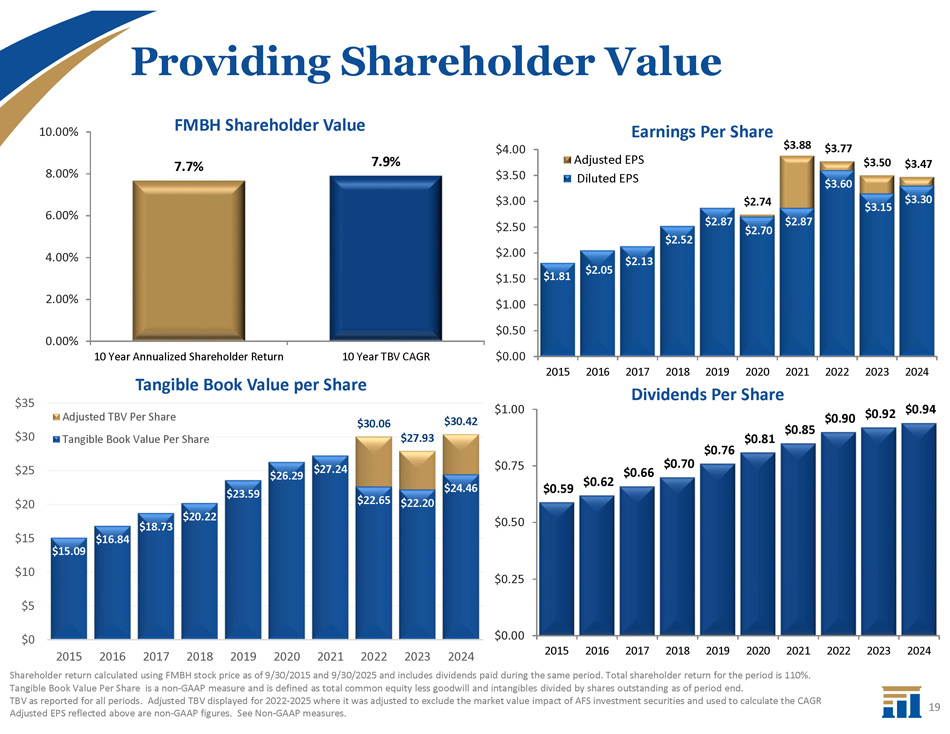
Providing Shareholder Value $3.88 $3.77 $3.50 $3.47 $1.81 $2.87 $3.60 $3.15 $3.30 $0.00 $0.50 $1.00 $1.50 $2.00 $2.50 $3.00 $3.50 $4.00 Earnings Per Share Adjusted EPS Diluted EPS $2.74 $2.87 $2.70 $2.52 $2.13 $2.05 $0.59 $0.62 $0.66 $0.70 $0.76 $0.81 $0.85 $0.90 $0.92 $0.94 2015 2016 2017 2018 2019 2020 2021 2022 2023 2024 Dividends Per Share $0.00 $0.25 $0.50 $0.75 $1.00 2015 2016 2017 2018 2019 2020 2021 2022 2023 2024 19 $30.06 $27.93 $30.42 $15.09 $16.84 $18.73 $20.22 $23.59 $26.29 $27.24 $22.65 $22.20 $24.46 $0 $5 $10 $15 $20 $25 $30 $35 2015 2016 2017 2018 2019 2020 2021 2022 2023 2024 Adjusted TBV Per Share Tangible Book Value Per Share Shareholder return calculated using FMBH stock price as of 9/30/2015 and 9/30/2025 and includes dividends paid during the same period. Total shareholder return for the period is 110%. Tangible Book Value Per Share is a non - GAAP measure and is defined as total common equity less goodwill and intangibles divided by shares outstanding as of period end. TBV as reported for all periods. Adjusted TBV displayed for 2022 - 2025 where it was adjusted to exclude the market value impact of AFS investment securities and used to calculate the CAGR Adjusted EPS reflected above are non - GAAP figures. See Non - GAAP measures. 7.7% 7.9% 0.00% 2.00% 4.00% 6.00% 8.00% 10.00% 10 Year Annualized Shareholder Return 10 Year TBV CAGR Tangible Book Value per Share FMBH Shareholder Value


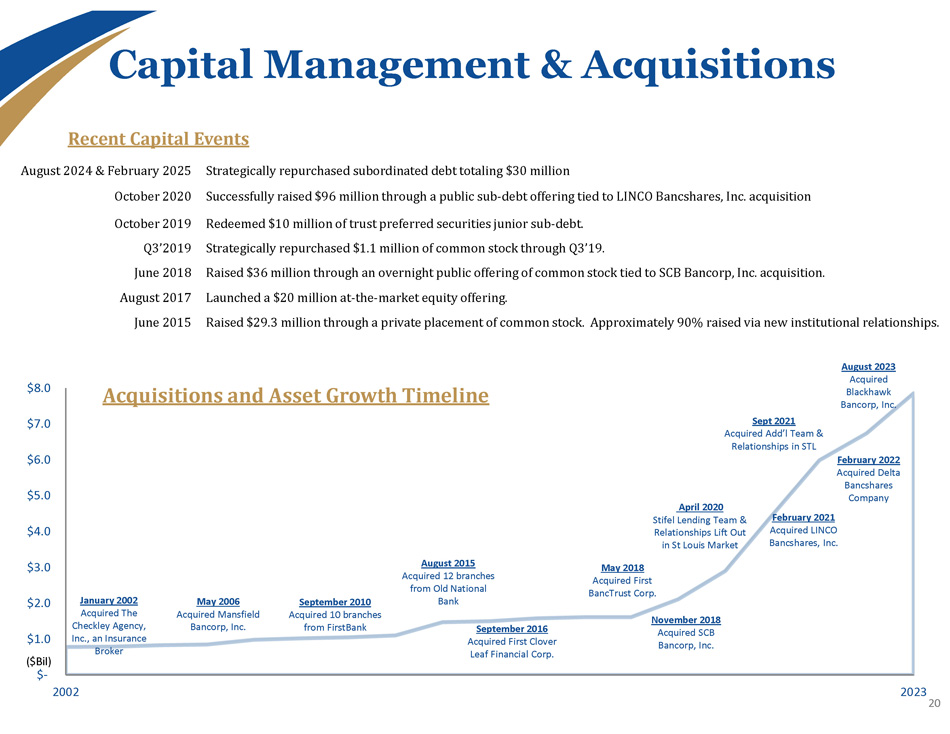
Recent Capital Events Strategically repurchased subordinated debt totaling $30 million Successfully raised $96 million through a public sub - debt offering tied to LINCO Bancshares, Inc. acquisition Redeemed $10 million of trust preferred securities junior sub - debt. Strategically repurchased $1.1 million of common stock through Q3’19. Raised $36 million through an overnight public offering of common stock tied to SCB Bancorp, Inc. acquisition. Launched a $20 million at - the - market equity offering. Raised $29.3 million through a private placement of common stock. Approximately 90% raised via new institutional relationships. August 2024 & February 2025 October 2020 October 2019 Q3’2019 June 2018 August 2017 June 2015 Capital Management & Acquisitions 20 $2.0 $3.0 $4.0 $5.0 $6.0 $7.0 $8.0 2002 $1.0 ($Bil) $ - 2023 Acquisitions and Asset Growth Timeline January 2002 Acquired The Checkley Agency, Inc., an Insurance Broker May 2006 Acquired Mansfield Bancorp, Inc. September 2010 Acquired 10 branches from FirstBank August 2015 Acquired 12 branches from Old National Bank September 2016 Acquired First Clover Leaf Financial Corp. May 2018 Acquired First BancTrust Corp. November 2018 Acquired SCB Bancorp, Inc. April 2020 Stifel Lending Team & Relationships Lift Out in St Louis Market February 2021 Acquired LINCO Bancshares, Inc . Sept 2021 Acquired Add’l Team & Relationships in STL February 2022 Acquired Delta Bancshares Company August 2023 Acquired Blackhawk Bancorp, Inc.


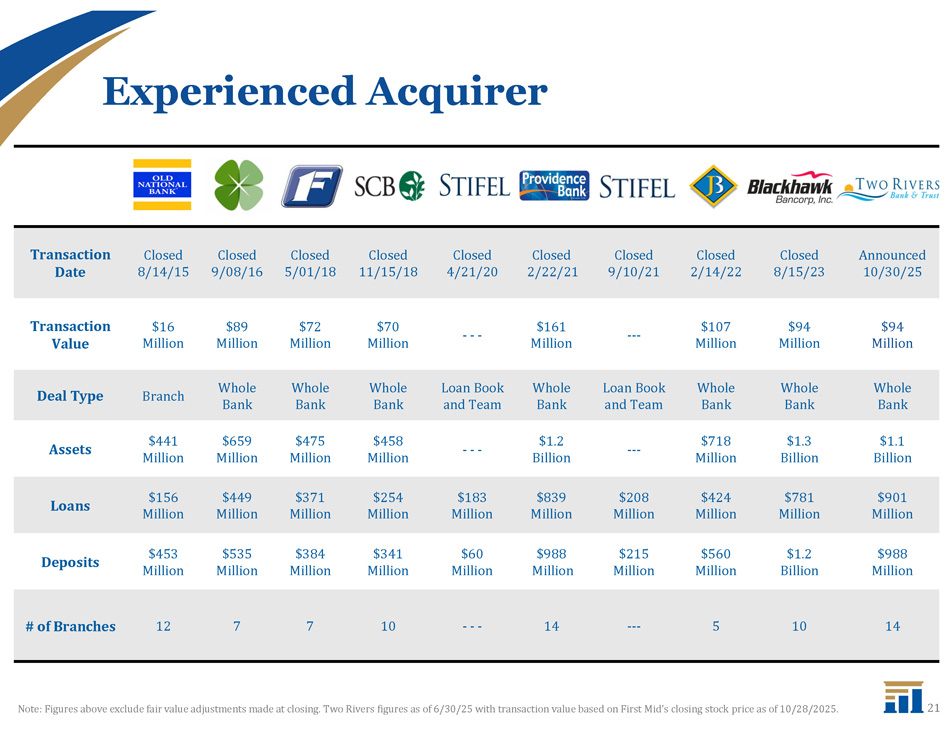
Announced 10/30/25 Closed 8/15/23 Closed 2/14/22 Closed 9/10/21 Closed 2/22/21 Closed 4/21/20 Closed 11/15/18 Closed 5/01/18 Closed 9/08/16 Closed 8/14/15 Transaction Date $94 Million $94 Million $107 Million -- - $161 Million - - - $70 Million $72 Million $89 Million $16 Million Transaction Value Whole Bank Whole Bank Whole Bank Loan Book and Team Whole Bank Loan Book and Team Whole Bank Whole Bank Whole Bank Branch Deal Type $1.1 Billion $1.3 Billion $718 Million -- - $1.2 Billion - - - $458 Million $475 Million $659 Million $441 Million Assets $901 Million $781 Million $424 Million $208 Million $839 Million $183 Million $254 Million $371 Million $449 Million $156 Million Loans $988 Million $1.2 Billion $560 Million $215 Million $988 Million $60 Million $341 Million $384 Million $535 Million $453 Million Deposits 14 10 5 -- - 14 - - - 10 7 7 12 # of Branches Experienced Acquirer 21 Note: Figures above exclude fair value adjustments made at closing. Two Rivers figures as of 6/30/25 with transaction value based on First Mid’s closing stock price as of 10/28/2025.


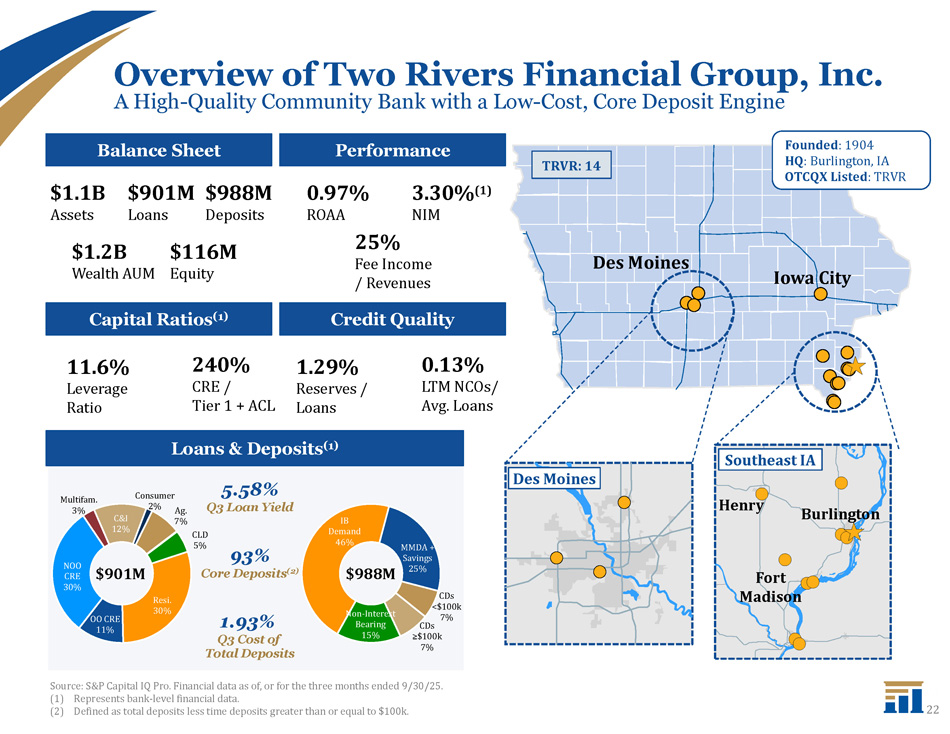
Overview of Two Rivers Financial Group, Inc. A High - Quality Community Bank with a Low - Cost, Core Deposit Engine 22 Source: S&P Capital IQ Pro. Financial data as of, or for the three months ended 9/30/25. (1) Represents bank - level financial data. (2) Defined as total deposits less time deposits greater than or equal to $100k. Loans & Deposits (1) 1.93% Q3 Cost of Total Deposits 5.58% Q3 Loan Yield 93% Core Deposits (2) TRVR: 14 Update as described Update as described Des Moines Des Moines Iowa City Burlington Fort Madison Southeast IA Non - Interest Bearing 15% IB Demand 46% MMDA + Savings 25% CDs <$100k 7% CDs ≥$100k 7% CLD 5% Resi. 30% OO CRE 11% Multifam. 3% C&I 12% Consumer 2% Ag. 7% NOO CRE $901M 30% $988M Henry Loans $901M $988M $1.1B Assets $1.2B Wealth AUM Deposits $116M Equity Balance Sheet Performance 0.97% ROAA 25% Fee Income / Revenues 3.30% (1) NIM Credit Quality Capital Ratios (1) 11.6% Leverage Ratio 240% CRE / Tier 1 + ACL 1.29% Reserves / Loans 0.13% LTM NCOs/ Avg. Loans Founded : 1904 HQ : Burlington, IA OTCQX Listed : TRVR


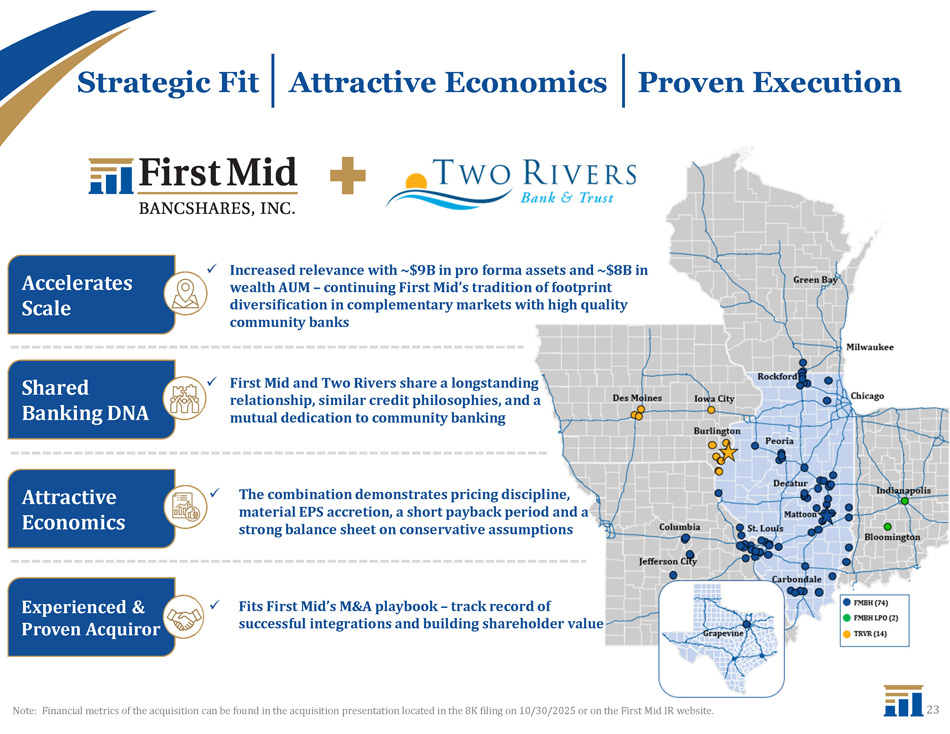
Strategic Fit Attractive Economics Proven Execution x Increased relevance with ~$9B in pro forma assets and ~$8B in wealth AUM – continuing First Mid’s tradition of footprint diversification in complementary markets with high quality community banks x First Mid and Two Rivers share a longstanding relationship, similar credit philosophies, and a mutual dedication to community banking x The combination demonstrates pricing discipline, material EPS accretion, a short payback period and a strong balance sheet on conservative assumptions x Fits First Mid’s M&A playbook – track record of successful integrations and building shareholder value Accelerates Scale Shared Banking DNA Attractive Economics Experienced & Proven Acquiror 23 Note: Financial metrics of the acquisition can be found in the acquisition presentation located in the 8K filing on 10/30/2025 or on the First Mid IR website.


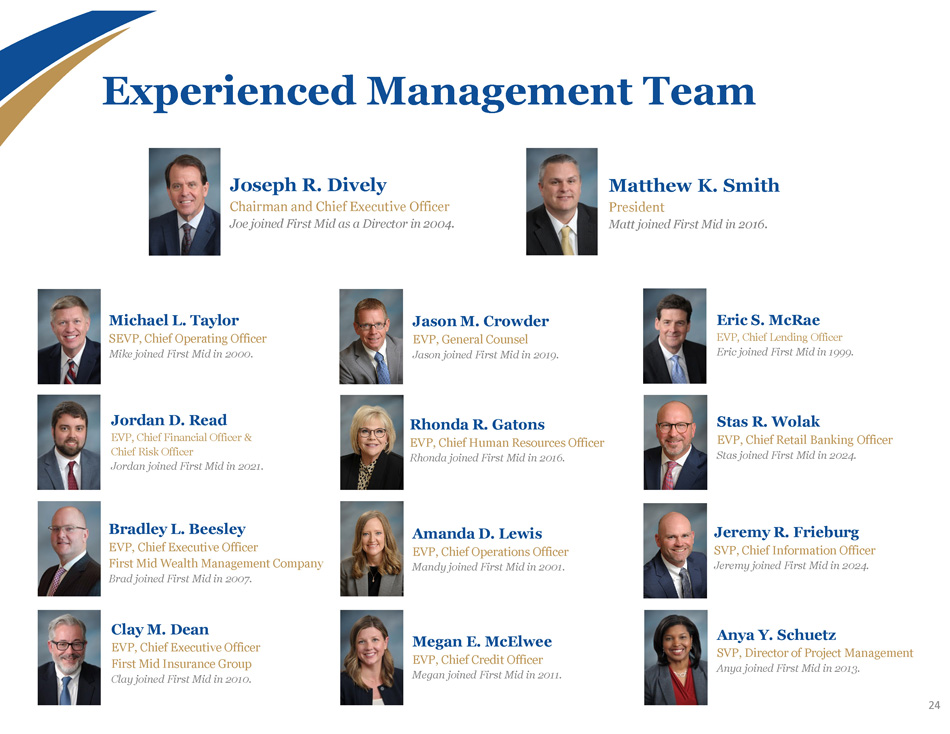
Experienced Management Team 24 Joseph R. Dively Chairman and Chief Executive Officer Joe joined First Mid as a Director in 2004. Michael L. Taylor SEVP, Chief Operating Officer Mike joined First Mid in 2000. Matthew K. Smith President Matt joined First Mid in 2016. Bradley L. Beesley EVP, Chief Executive Officer First Mid Wealth Management Company Brad joined First Mid in 2007. Clay M. Dean EVP, Chief Executive Officer First Mid Insurance Group Clay joined First Mid in 2010. Amanda D. Lewis EVP, Chief Operations Officer Mandy joined First Mid in 2001. Eric S. McRae EVP, Chief Lending Officer Eric joined First Mid in 1999. Jason M. Crowder EVP, General Counsel Jason joined First Mid in 2019. Rhonda R. Gatons EVP, Chief Human Resources Officer Rhonda joined First Mid in 2016. Megan E. McElwee EVP, Chief Credit Officer Megan joined First Mid in 2011. Jordan D. Read EVP, Chief Financial Officer & Chief Risk Officer Jordan joined First Mid in 2021. Anya Y. Schuetz SVP, Director of Project Management Anya joined First Mid in 2013. Jeremy R. Frieburg SVP, Chief Information Officer Jeremy joined First Mid in 2024. Stas R. Wolak EVP, Chief Retail Banking Officer Stas joined First Mid in 2024.


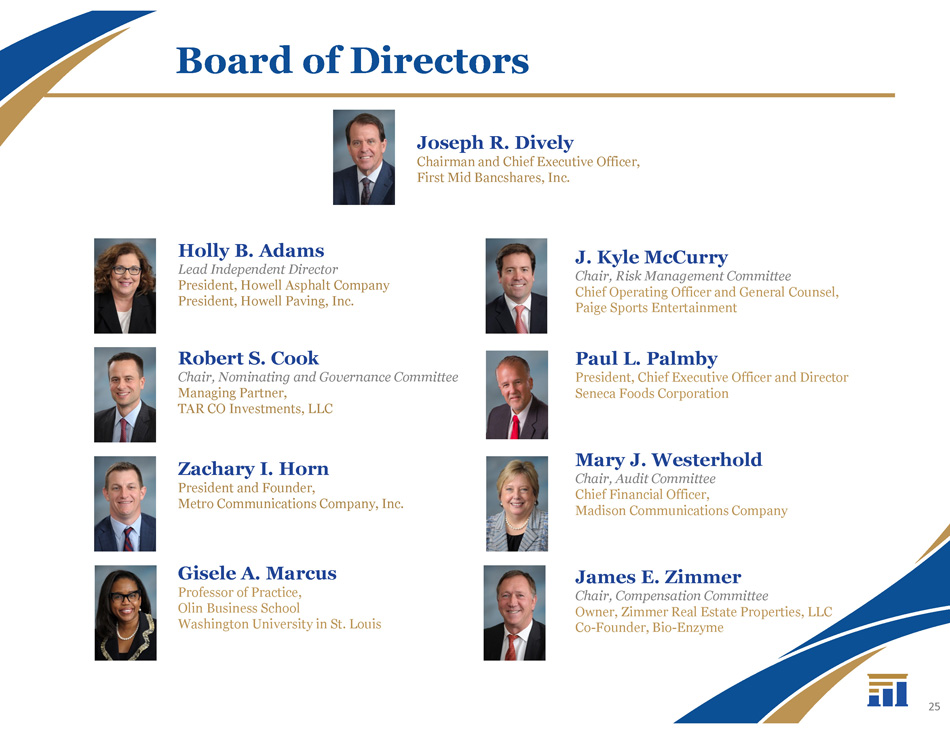
Board of Directors Holly B. Adams Lead Independent Director President, Howell Asphalt Company President, Howell Paving, Inc. Robert S. Cook Chair, Nominating and Governance Committee Managing Partner, TAR CO Investments, LLC Zachary I. Horn President and Founder, Metro Communications Company, Inc. Gisele A. Marcus Professor of Practice, Olin Business School Washington University in St. Louis J. Kyle McCurry Chair, Risk Management Committee Chief Operating Officer and General Counsel, Paige Sports Entertainment Paul L. Palmby President, Chief Executive Officer and Director Seneca Foods Corporation Mary J. Westerhold Chair, Audit Committee Chief Financial Officer, Madison Communications Company James E. Zimmer Chair, Compensation Committee Owner, Zimmer Real Estate Properties, LLC Co - Founder, Bio - Enzyme 25 Joseph R. Dively Chairman and Chief Executive Officer, First Mid Bancshares, Inc.


Key Financial Metrics


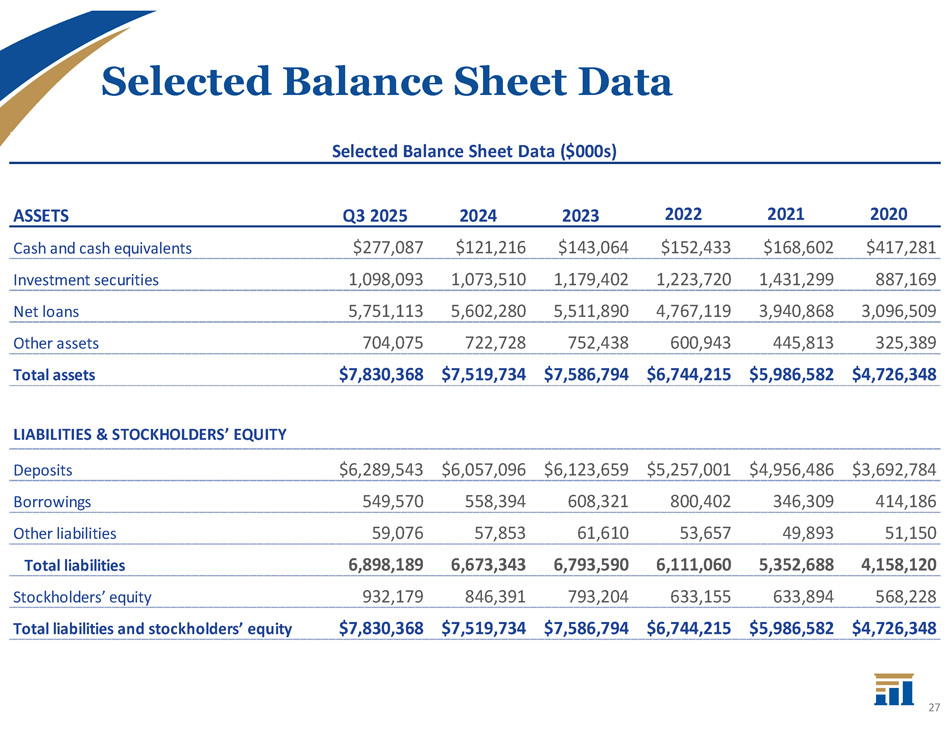
Selected Balance Sheet Data Selected Balance Sheet Data ($000s) 2020 2021 2022 2023 2024 Q3 2025 ASSETS $417,281 $168,602 $152,433 $143,064 $121,216 $277,087 Cash and cash equivalents 887,169 1,431,299 1,223,720 1,179,402 1,073,510 1,098,093 Investment securities 3,096,509 3,940,868 4,767,119 5,511,890 5,602,280 5,751,113 Net loans 325,389 445,813 600,943 752,438 722,728 704,075 Other assets $4,726,348 $5,986,582 $6,744,215 $7,586,794 $7,519,734 $7,830,368 Total assets LIABILITIES & STOCKHOLDERS’ EQUITY $3,692,784 $4,956,486 $5,257,001 $6,123,659 $6,057,096 $6,289,543 Deposits 414,186 346,309 800,402 608,321 558,394 549,570 Borrowings 51,150 49,893 53,657 61,610 57,853 59,076 Other liabilities 4,158,120 5,352,688 6,111,060 6,793,590 6,673,343 6,898,189 Total liabilities 568,228 633,894 633,155 793,204 846,391 932,179 Stockholders’ equity $4,726,348 $5,986,582 $6,744,215 $7,586,794 $7,519,734 $7,830,368 Total liabilities and stockholders’ equity 27


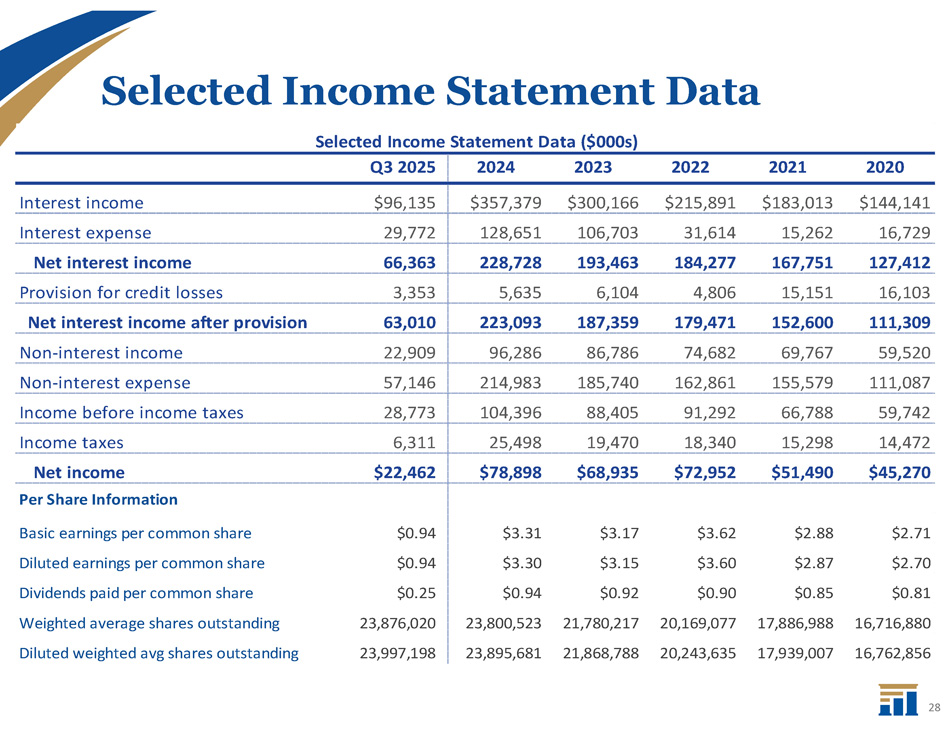
Selected Income Statement Data 2020 2021 2022 2023 2024 Q3 2025 $144,141 $183,013 $215,891 $300,166 $357,379 $96,135 Interest income 16,729 15,262 31,614 106,703 128,651 29,772 Interest expense 127,412 167,751 184,277 193,463 228,728 66,363 Net interest income 16,103 15,151 4,806 6,104 5,635 3,353 Provision for credit losses 111,309 152,600 179,471 187,359 223,093 63,010 Net interest income after provision 59,520 69,767 74,682 86,786 96,286 22,909 Non - interest income 111,087 155,579 162,861 185,740 214,983 57,146 Non - interest expense 59,742 66,788 91,292 88,405 104,396 28,773 Income before income taxes 14,472 15,298 18,340 19,470 25,498 6,311 Income taxes $45,270 $51,490 $72,952 $68,935 $78,898 $22,462 Net income Per Share Information $2.71 $2.88 $3.62 $3.17 $3.31 $0.94 Basic earnings per common share $2.70 $2.87 $3.60 $3.15 $3.30 $0.94 Diluted earnings per common share $0.81 $0.85 $0.90 $0.92 $0.94 $0.25 Dividends paid per common share 16,716,880 17,886,988 20,169,077 21,780,217 23,800,523 23,876,020 Weighted average shares outstanding 16,762,856 17,939,007 20,243,635 21,868,788 23,895,681 23,997,198 Diluted weighted avg shares outstanding Selected Income Statement Data ($000s) 28


Non - GAAP Measures


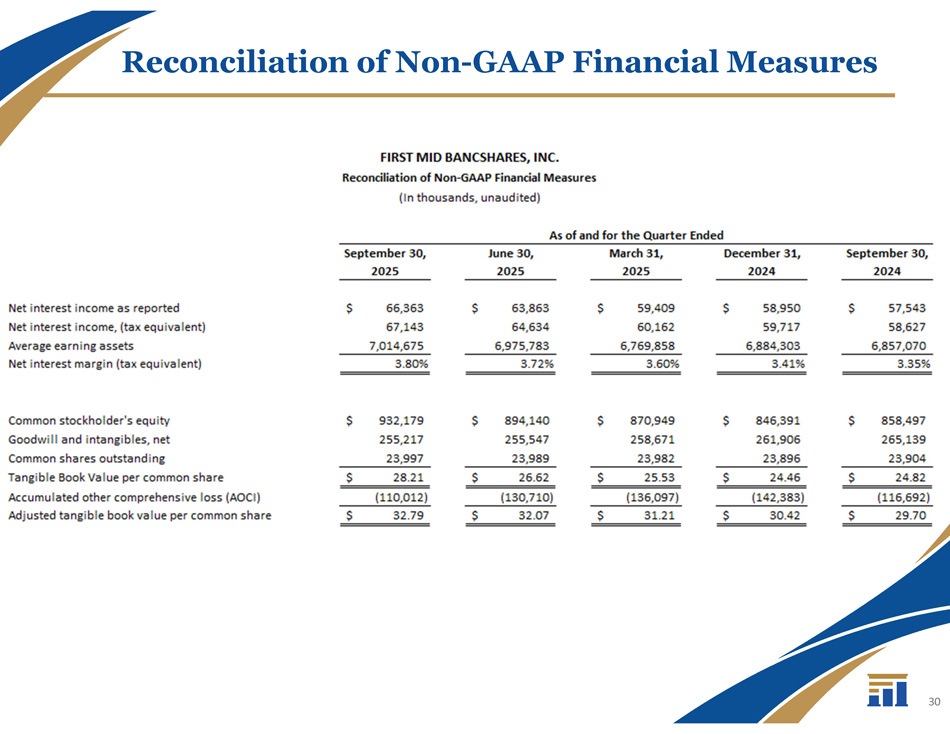
30 Reconciliation of Non - GAAP Financial Measures


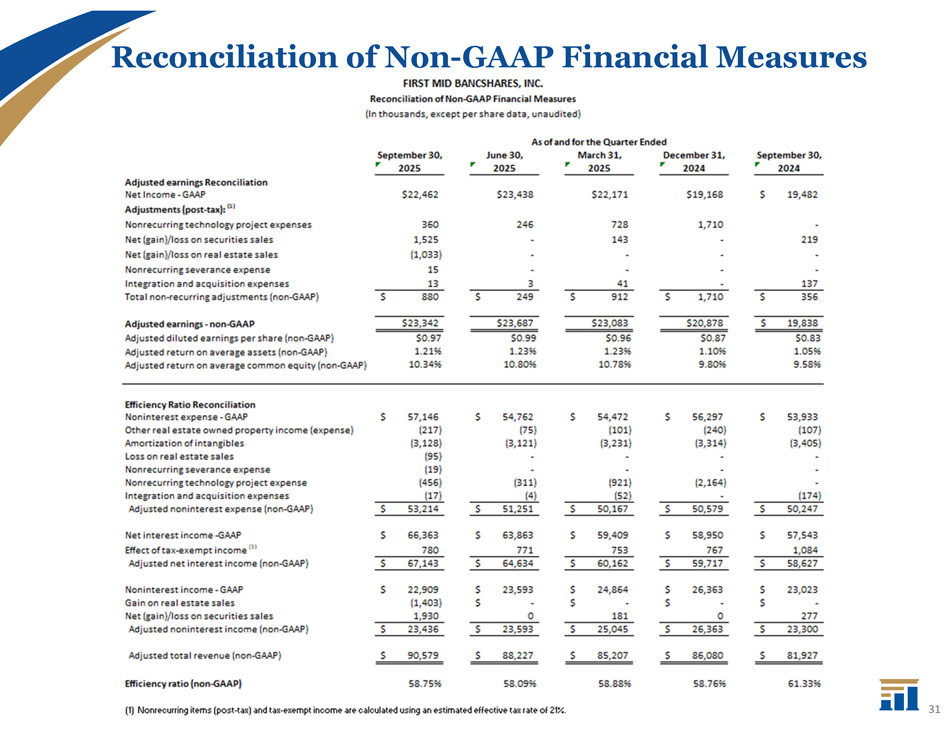
Reconciliation of Non - GAAP Financial Measures 31