 |  | |
Exhibit 99.1
Freddie Mac Reports Net Income of $1.8 Billion and
Comprehensive Income of $1.9 Billion for Second Quarter 2020
The Company Delivered Solid Financial Results While Continuing to Support the Housing Market During the Pandemic
“We earned a solid $1.9 billion of comprehensive income while expanding our efforts to support homeowners, renters, multifamily borrowers and lenders affected by the pandemic. During the period, we reached a key milestone toward exiting conservatorship by hiring a top-tier financial advisor to provide strategic counsel.” |
David M. Brickman Chief Executive Officer |
Second Quarter 2020 Financial Results
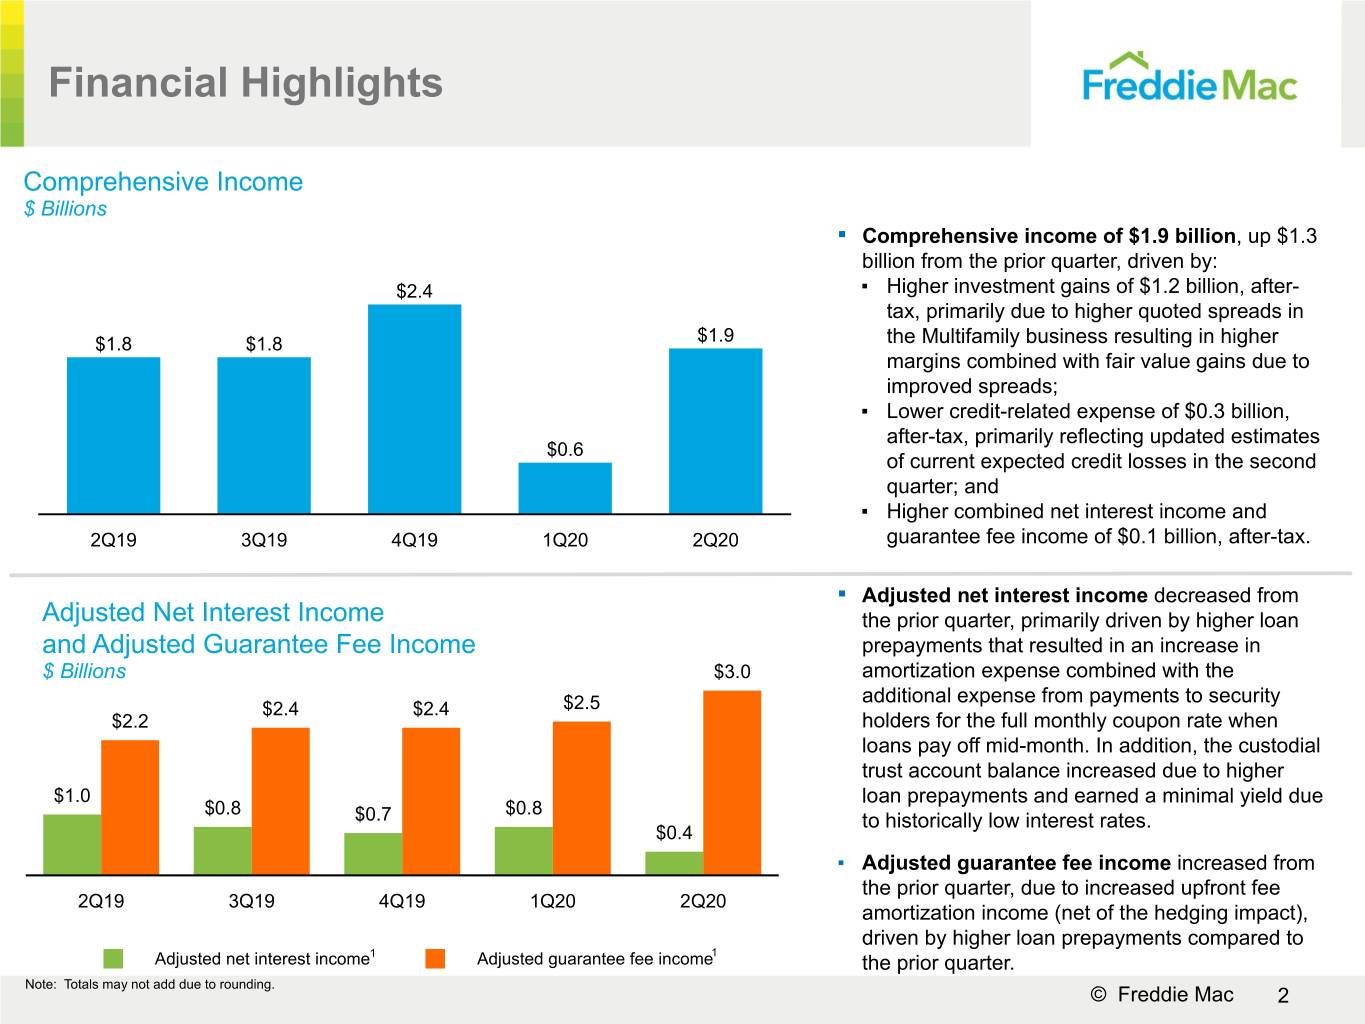
• | Comprehensive income of $1.9 billion, up $1.3 billion from the prior quarter, driven by: |
▪ | Higher investment gains of $1.2 billion, after-tax, primarily due to higher quoted spreads in the Multifamily business resulting in higher margins combined with fair value gains due to improved spreads; |
▪ | Lower credit-related expense of $0.3 billion, after-tax, primarily reflecting updated estimates of current expected credit losses in the second quarter; and |
▪ | Higher combined net interest income and guarantee fee income of $0.1 billion, after-tax. |
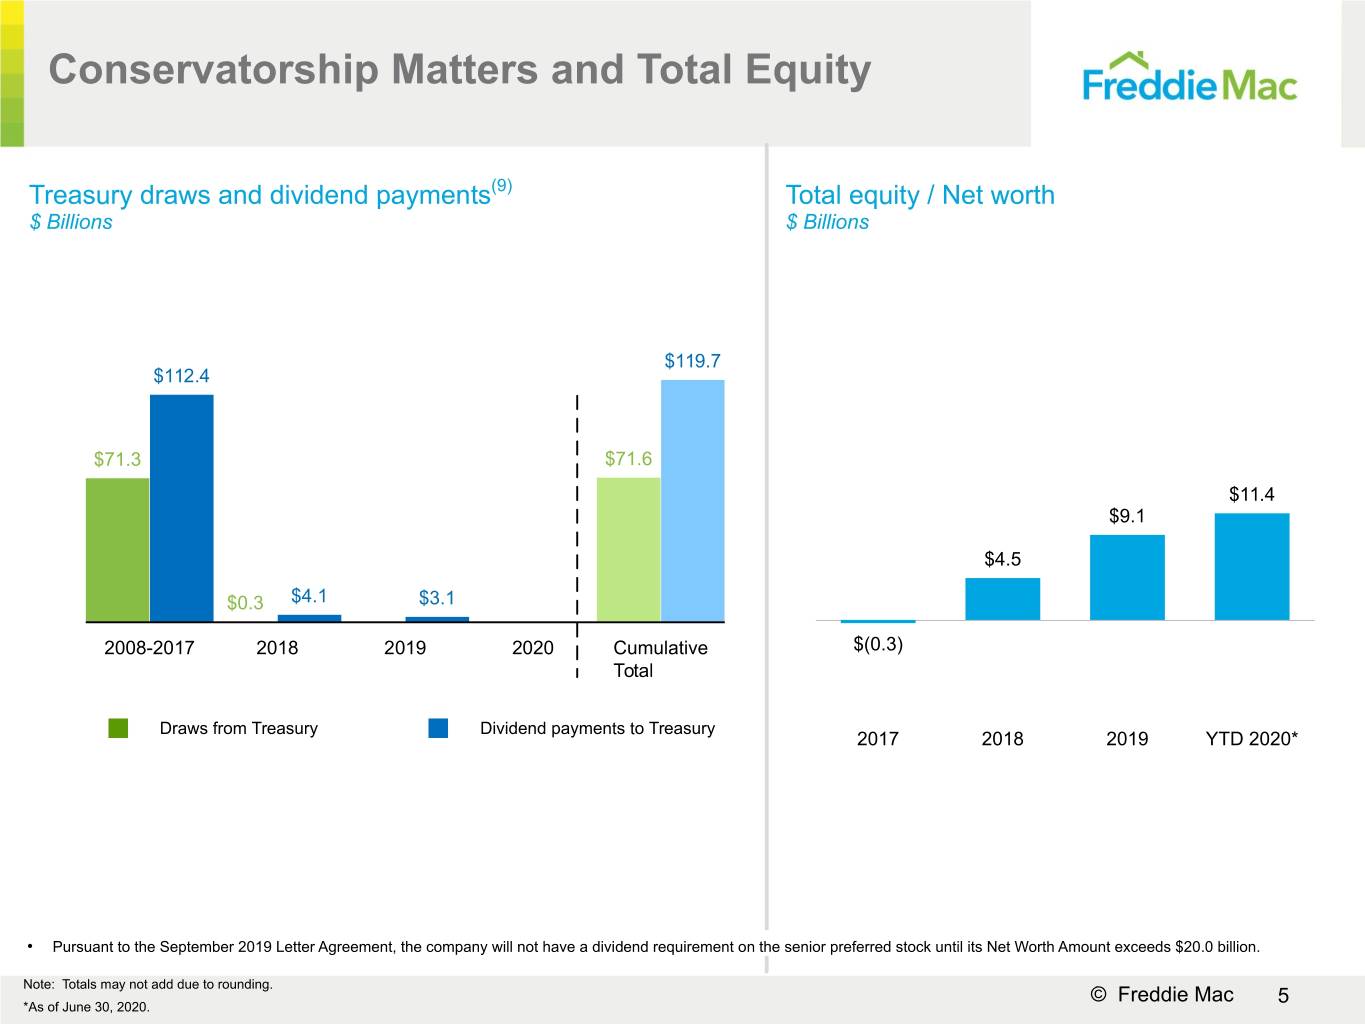
• | Total equity/net worth(1) increased to $11.4 billion, from $9.5 billion on March 31, 2020. |
Providing Stability to the Housing Market(2)
• | Extended moratorium on foreclosures and evictions until at least August 31, 2020, providing essential relief to families. |
• | Extended flexibilities to homeowners, sellers and appraisers to expedite loan closings during the pandemic. |
Executing on Business Fundamentals
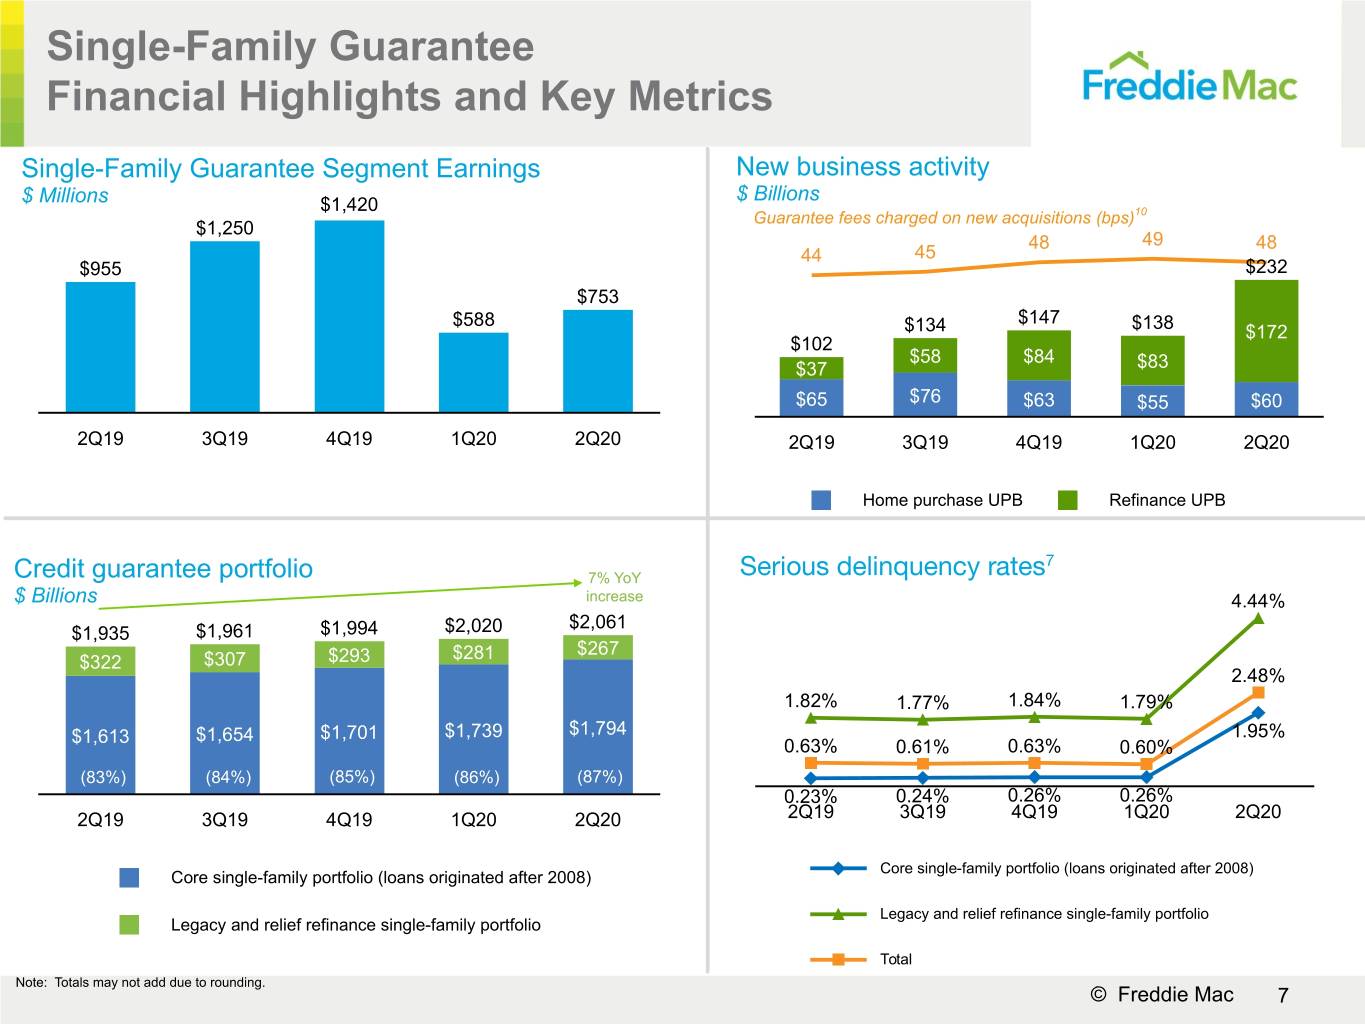
• | New Single-Family business activity was $232 billion, the highest since 2003; new Multifamily business activity was $20 billion. |
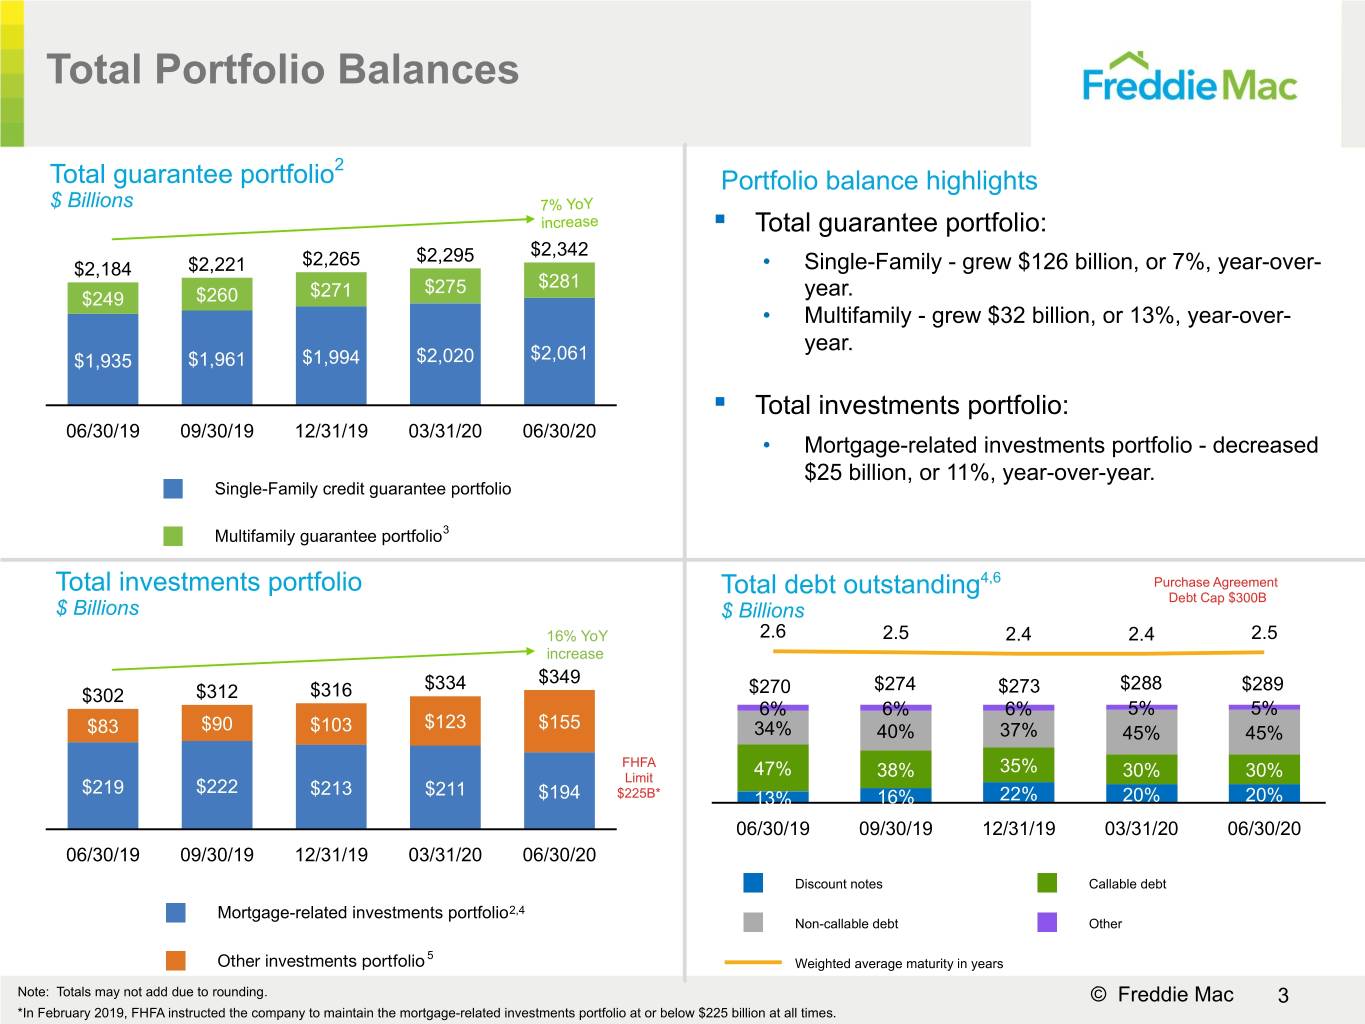
▪ | The Single-Family and Multifamily guarantee portfolios grew 7% and 13%, respectively, year over year. |
• | Serious delinquency rate for Single-Family increased to 2.48%, from 0.60% in the prior quarter driven by an increase in loans in forbearance due to the pandemic. |
Managing Risk
• | Completed nearly 111,000 single-family loan workouts, including 104,000 forbearance agreements, versus 11,000 workouts in the prior quarter. |
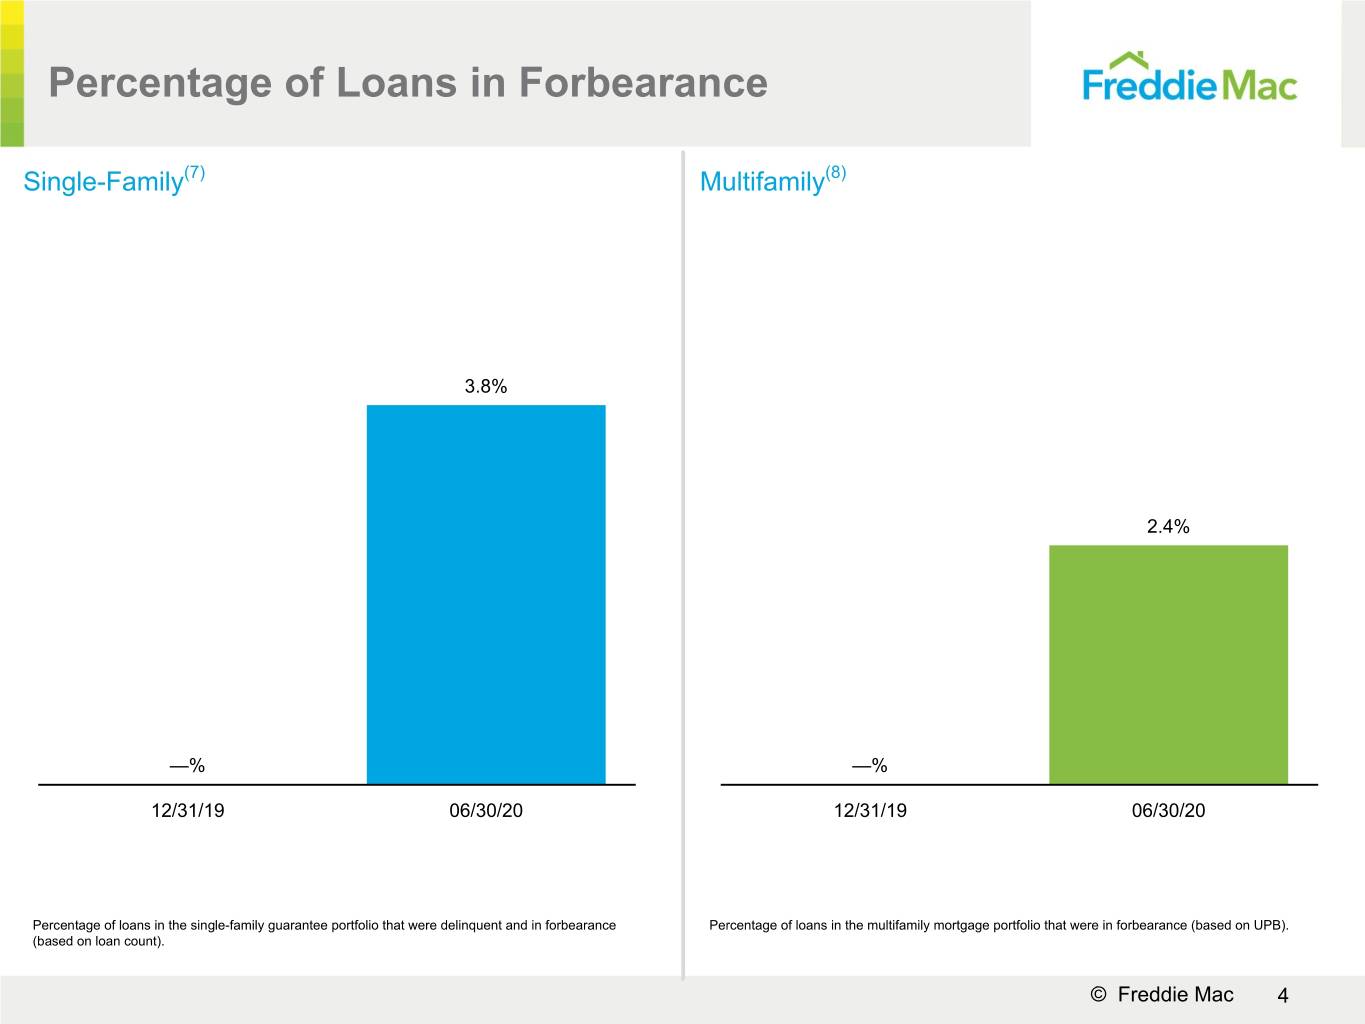
• | Loans in forbearance were 3.8% and 2.4% of the Single-Family guarantee portfolio and the Multifamily mortgage portfolio, respectively. |
• | Credit enhancement coverage on the Single-Family guarantee portfolio and Multifamily mortgage portfolio was 54% and 87%, respectively. |
(1) See page 12 for additional information about the company's net worth and the September 2019 Letter Agreement.
(2) See the company's Quarterly Reports on Form 10-Q for the quarters ended March 31, 2020 and June 30, 2020, for additional information on its response efforts related to the COVID-19 pandemic and its outlook for 2020.
Freddie Mac Second Quarter 2020 Financial Results
July 30, 2020
Page 2
McLean, VA — Freddie Mac (OTCQB: FMCC) today reported net income of $1.8 billion for the second quarter of 2020, compared to net income of $0.2 billion for the first quarter of 2020. The company also reported comprehensive income of $1.9 billion for the second quarter of 2020, compared to comprehensive income of $0.6 billion for the first quarter of 2020.
• | Comprehensive income increased $1.3 billion from the prior quarter, mainly due to: |
▪ | Higher investment gains of $1.2 billion, after-tax, primarily driven by higher quoted spreads in the Multifamily business resulting in higher margins on new loan commitments combined with fair value gains due to improved spreads; |
▪ | Lower credit-related expense of $0.3 billion, after-tax, primarily reflecting updated estimates of current expected credit losses in the second quarter, partially offset by a lower increase in expected recoveries from certain credit enhancements, such as STACR and ACIS transactions, on the corresponding covered loans; and |
▪ | Higher combined net interest income and guarantee fee income of $0.1 billion, after-tax. |
Summary of Consolidated Statements of Comprehensive Income (Loss)
(Dollars in millions) | 2Q 2020 | 1Q 2020 | Change | 2Q 2019 | Change | |||||||
Net interest income | $2,876 | $2,785 | $91 | $2,927 | $(51) | |||||||
Guarantee fee income | 469 | 377 | 92 | 280 | 189 | |||||||
Investment gains (losses), net | 670 | (835 | ) | 1,505 | (138 | ) | 808 | |||||
Other income (loss) | 134 | 95 | 39 | 143 | (9) | |||||||
Net revenues | 4,149 | 2,422 | 1,727 | 3,212 | 937 | |||||||
Benefit (provision) for credit losses | (705) | (1,233 | ) | 528 | 160 | (865) | ||||||
Credit enhancement expense | (233) | (231 | ) | (2) | (177 | ) | (56) | |||||
Expected credit enhancement recoveries | 221 | 467 | (246) | 38 | 183 | |||||||
Real estate owned (REO) operations expense | (14) | (85 | ) | 71 | (81 | ) | 67 | |||||
Credit-related expense | (731) | (1,082 | ) | 351 | (60 | ) | (671) | |||||
Administrative expense | (601) | (587 | ) | (14) | (619 | ) | 18 | |||||
Temporary Payroll Tax Cut Continuation Act of 2011 expense | (442) | (432 | ) | (10) | (399 | ) | (43) | |||||
Other expense | (140) | (103 | ) | (37) | (236 | ) | 96 | |||||
Operating expense | (1,183) | (1,122 | ) | (61) | (1,254 | ) | 71 | |||||
Income (loss) before income tax (expense) benefit | 2,235 | 218 | 2,017 | 1,898 | 337 | |||||||
Income tax (expense) benefit | (458) | (45 | ) | (413) | (392 | ) | (66) | |||||
Net income (loss) | 1,777 | 173 | 1,604 | 1,506 | 271 | |||||||
Total other comprehensive income (loss), net of taxes and reclassification adjustments | 161 | 449 | (288) | 320 | (159) | |||||||
Comprehensive income (loss) | $1,938 | $622 | $1,316 | $1,826 | $112 | |||||||
Freddie Mac Second Quarter 2020 Financial Results
July 30, 2020
Page 3
Selected Financial Measures
Net Interest Income and Net Interest Yield
(Dollars in billions)
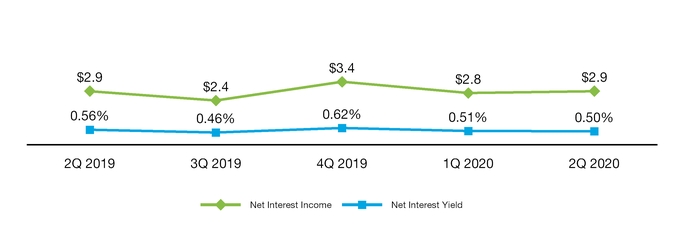
• | Net interest income increased slightly from the prior quarter, primarily due to the declining interest rate environment which led to an increase in loan prepayments, resulting in an increase in income from upfront fee amortization, partially offset by an increase in amortization expense due to the timing difference between debt of consolidated trusts and the underlying loans, combined with higher amortization expense from hedge accounting. |
Guarantee Fee Income(1) and
Multifamily Guarantee Portfolio
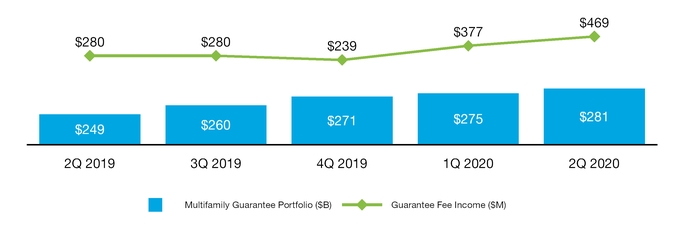
(1) Guarantee fee income on a GAAP basis is primarily from the company’s multifamily business.
• | Guarantee fee income increased from the prior quarter, due to lower fair value losses on the Multifamily guarantee asset combined with continued growth in the Multifamily guarantee portfolio. |
Freddie Mac Second Quarter 2020 Financial Results
July 30, 2020
Page 4
Credit-Related Expense
(Dollars in billions)
Amounts may not add due to rounding.
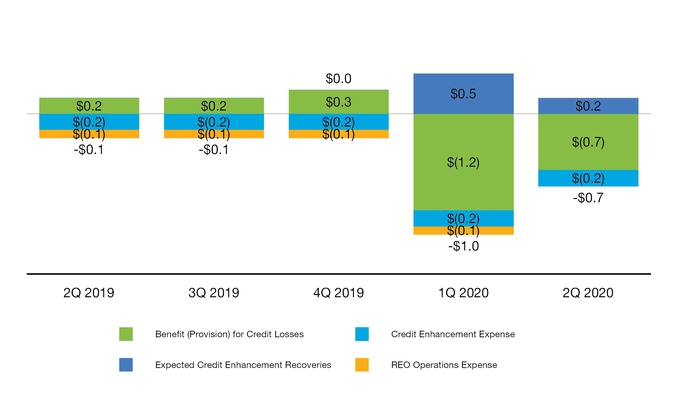
• | Credit-related expense decreased from the prior quarter, primarily driven by: |
▪ | Lower additional provision for credit losses as the majority of current expected credit losses were recorded in the first quarter of 2020, with additional reserves recorded in the second quarter to reflect updated expectations of credit losses; partially offset by |
▪ | Lower increase in expected recoveries from certain credit enhancements, such as STACR and ACIS transactions, on the corresponding covered loans. |
• | Interest expense related to single-family CRT debt, which is included in net interest income, was $0.2 billion in both the first and second quarters of 2020 and $0.3 billion in the second quarter of 2019. |
Freddie Mac Second Quarter 2020 Financial Results
July 30, 2020
Page 5
Non-GAAP Financial Measure Highlights
In addition to analyzing the company’s results on a GAAP basis, management reviews net interest income and guarantee fee income on an “adjusted,” or non-GAAP basis. These adjusted financial measures are calculated by reclassifying certain credit guarantee-related activities and investment-related activities between various line items on the company’s GAAP consolidated statements of comprehensive income. The company also presents one additional non-GAAP financial measure, adjusted net interest yield, that is calculated based on adjusted net interest income. Management believes that this non-GAAP financial measure is useful because it more clearly reflects the company’s sources of revenue and return.
For additional information about the company's non-GAAP financial measures and reconciliations to the comparable amounts under GAAP, see pages 16 - 17 of this press release.
Adjusted Net Interest Income(1), Adjusted Net Interest Yield(1), and
Investments Portfolio
(Dollars in billions)
(1) | Non-GAAP financial measure. For reconciliations to the comparable amounts under GAAP, see page 16 of this press release. |
Amounts may not add due to rounding.
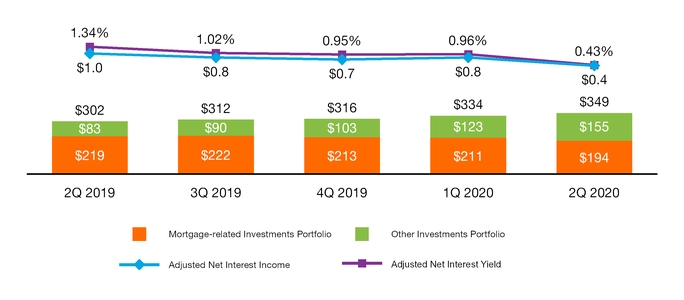
• | Adjusted net interest income and adjusted net interest yield decreased from the prior quarter, primarily driven by higher loan prepayments that resulted in an increase in amortization expense combined with the additional expense from payments to security holders for the full monthly coupon rate when loans pay off mid-month. In addition, the custodial trust account balance increased due to higher loan prepayments and earned a minimal yield due to historically low interest rates. |
• | The mortgage-related investments portfolio was $194 billion, down more than $17 billion, or 8%, from the prior quarter and $25 billion, or 11%, from the prior year. In February 2019, FHFA instructed the company to maintain the mortgage-related investments portfolio at or below $225 billion at all times. |
Freddie Mac Second Quarter 2020 Financial Results
July 30, 2020
Page 6
Adjusted Guarantee Fee Income(1) and
Total Guarantee Portfolio
(Dollars in billions)
(1) | Non-GAAP financial measure. For reconciliations to the comparable amounts under GAAP, see page 16 of this press release. |
Amounts may not add due to rounding.
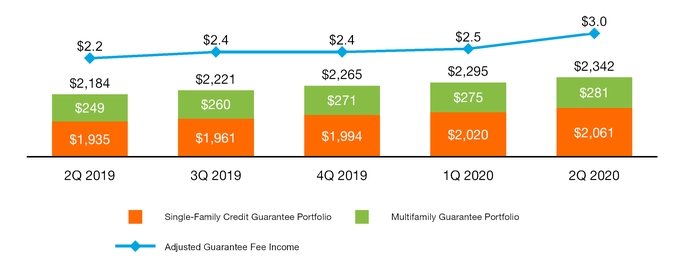
• | Adjusted guarantee fee income increased from the prior quarter, due to increased upfront fee amortization income (net of the hedging impact), driven by higher loan prepayments compared to the prior quarter. |
• | The total guarantee portfolio grew $47 billion, or 2%, from the prior quarter and $158 billion, or 7%, from the prior year, driven by increases in both the Single-Family and Multifamily guarantee portfolios. |
Return on Conservatorship Capital (ROCC)
In May 2020, FHFA released its re-proposed Enterprise Capital Rule for comment. The re-proposed capital rule, if adopted, would significantly increase the company's capital requirements and, as a result, would significantly lower its returns on capital. It also could affect the company's business strategies, perhaps significantly.
Until FHFA issues a final Enterprise Capital Rule, Freddie Mac will continue to use the Conservatorship Capital Framework (CCF) to evaluate business decisions and ensure the company makes such decisions prudently when pricing transactions and managing its business. The CCF has been and may be further revised by FHFA from time to time, including in connection with FHFA’s consideration and adoption of a final Enterprise Capital Rule, which could possibly result in material changes in the company's conservatorship capital and, thus, its returns on conservatorship capital.
The table below provides the ROCC, calculated as (1) annualized comprehensive income for the period divided by (2) average conservatorship capital during the period.
ROCC is not based on the company's total equity and does not reflect actual returns on total equity. The company does not believe that returns on total equity are meaningful because of the net worth limit imposed since 2012 under the Purchase Agreement. In addition, the company believes that returns post-conservatorship would most likely be lower than the levels calculated below, assuming the same portfolio of risk assets, as it expects that it would hold capital above the minimum required regulatory capital levels and that it would likely be required to pay fees for federal government support, thereby reducing its total comprehensive income.
Freddie Mac Second Quarter 2020 Financial Results
July 30, 2020
Page 7
Return on Conservatorship Capital
(Dollars in billions) | 2Q 2020 | 1Q 2020 | Change | 2Q 2019 | Change | ||||||||||
Comprehensive income | $1.9 | $0.6 | $1.3 | $1.8 | $0.1 | ||||||||||
Conservatorship capital (average during the period)(1)(2) | $49.8 | $50.2 | $(0.4) | $51.7 | $(1.9) | ||||||||||
ROCC, based on comprehensive income | 15.6 | % | 5.0 | % | 10.6 | % | 14.1 | % | 1.5 | % | |||||
(1) Average conservatorship capital and ROCC for 2Q 2020 are preliminary and subject to change until official submission to FHFA. Prior period preliminary numbers have been updated, as needed, to reflect final data submitted to FHFA.
(2) Average conservatorship capital for each period is based on the CCF in effect during that period. The CCF in effect as of June 30, 2020 was largely unchanged from the CCF as of March 30, 2020 and June 30, 2019.
Amounts may not add due to rounding.
ROCC increased compared to the prior quarter, primarily driven by the increase in comprehensive income in the second quarter of 2020.
For additional information on the CCF and ROCC, see the company’s Quarterly Report on Form 10-Q for the quarter ended June 30, 2020.
Segment Financial Results and Business Highlights
Freddie Mac’s operations consist of three reportable segments, which are based on the types of business activities they perform – Single-Family Guarantee, Multifamily, and Capital Markets. The company presents Segment Earnings for each reportable segment by reclassifying certain credit guarantee-related activities and investment-related activities between various line items on its GAAP consolidated statements of comprehensive income and allocating certain revenues and expenses, including funding costs and administrative expenses, to its three reportable segments.
For more information about Segment Earnings, see Note 13 to the financial statements included in the company’s Quarterly Report on Form 10-Q for the quarter ended June 30, 2020.
Single-Family Guarantee Segment
Providing liquidity to the market while transforming U.S. housing finance
Financial Results(1)
(Dollars in millions) | 2Q 2020 | 1Q 2020 | Change | 2Q 2019 | Change | ||||||
Guarantee fee income | $2,528 | $2,093 | $435 | $1,875 | $653 | ||||||
Investment gains (losses), net | 21 | 437 | (416) | 256 | (235) | ||||||
Other income (loss) | (83) | 15 | (98) | 58 | (141) | ||||||
Net revenues | 2,466 | 2,545 | (79) | 2,189 | 277 | ||||||
Benefit (provision) for credit losses | (752) | (1,222) | 470 | 88 | (840) | ||||||
Credit enhancement expense | (399) | (411) | 12 | (349) | (50) | ||||||
Expected credit enhancement recoveries | 219 | 439 | (220) | 38 | 181 | ||||||
REO operations expense | (14) | (87) | 73 | (86) | 72 | ||||||
Credit-related expense | (946) | (1,281) | 335 | (309) | (637) | ||||||
Administrative expense | (379) | (372) | (7) | (400) | 21 | ||||||
Other expense | (195) | (151) | (44) | (277) | 82 | ||||||
Operating expense | (574) | (523) | (51) | (677) | 103 | ||||||
Segment Earnings (Losses) before income tax (expense) benefit | 946 | 741 | 205 | 1,203 | (257) | ||||||
Income tax (expense) benefit | (193) | (153) | (40) | (248) | 55 | ||||||
Segment Earnings (Losses), net of taxes | 753 | 588 | 165 | 955 | (202) | ||||||
Total other comprehensive income (loss), net of tax | (2) | (2) | 0 | (2) | — | ||||||
Total comprehensive income (loss) | $751 | $586 | $165 | $953 | $(202) | ||||||
(1) | The financial performance of the company’s Single-Family Guarantee segment is measured based on its contribution to GAAP net income (loss). |
Freddie Mac Second Quarter 2020 Financial Results
July 30, 2020
Page 8
Key Drivers
Comprehensive income increased from the prior quarter, primarily driven by:
• | Higher guarantee fee income primarily due to increased upfront fee amortization income (net of the hedging impact), driven by higher loan prepayments compared to the prior quarter; |
• | Lower credit-related expense primarily driven by lower additional provision for credit losses as the majority of current expected credit losses were recorded in the first quarter of 2020, with additional reserves recorded in the second quarter to reflect updated expectations of credit losses, partially offset by a lower increase in expected recoveries from certain credit enhancements, such as STACR and ACIS transactions, on the corresponding covered loans; partially offset by |
• | Lower investment gains due to higher fair value losses on certain CRT transactions driven by spread changes resulting from pandemic-related market volatility and lower gains on dispositions of reperforming and nonperforming loans in the second quarter of 2020, partially offset by a shift to valuation gains on single-family loans held in inventory. |
Business Highlights
• | New business activity was $232 billion, an increase of $94 billion, or 68%, from the prior quarter, primarily due to higher refinance activity resulting from declining average mortgage interest rates in recent quarters. |
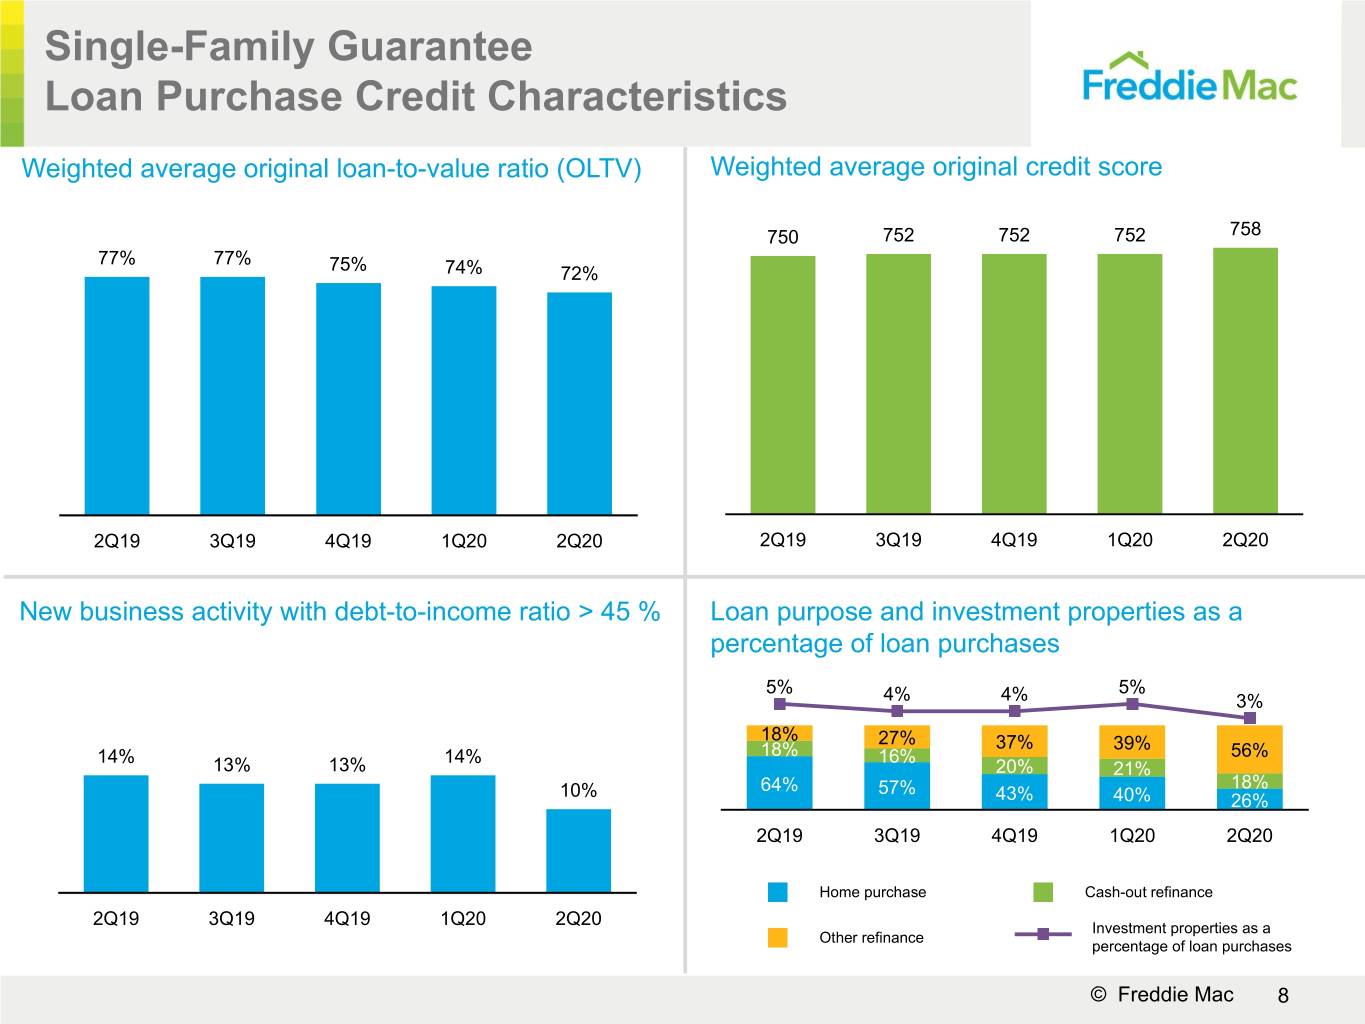
▪ | The weighted average original loan-to-value (LTV) ratio of new business activity improved to 72% for the second quarter of 2020, from 74% for the prior quarter, while the weighted average original credit score was 758, up from 752 in the prior quarter. |
▪ | The average guarantee fee rate charged on new acquisitions was 48 basis points, down slightly from 49 basis points for the prior quarter. |
▪ | First-time homebuyers represented 48% of new single-family purchase loans in the second quarter of 2020. |
▪ | The company provided funding for 827,000 single-family homes, nearly 609,000 of which were refinance loans. |
• | The Single-Family guarantee portfolio increased 7% from June 30, 2019, to $2,061 billion at June 30, 2020, driven by an increase in U.S. single-family mortgage debt outstanding and a higher GSE share of the total market. |
▪ | The average guarantee fee rate on the Single-Family guarantee portfolio was 50 basis points, up from 42 basis points for the prior quarter. |
◦ | The rate increased in the second quarter of 2020 due to an increase in the amortization of upfront fees (net of the hedging impact), driven by a higher prepayment rate and an increase in contractual guarantee fees as older vintages were replaced by acquisitions of new loans with higher contractual guarantee fees. |
• | The Single-Family serious delinquency rate increased to 2.48%, from 0.60% at the end of the first quarter of 2020, driven by an increase in loans in forbearance due to the pandemic. |
▪ | Single-family loans in forbearance are reported as delinquent during the forbearance period to the extent that payments are past due based upon the loans' original contractual terms. |
• | Single-family loan workout activity increased to 111,000, from 11,000 in the prior quarter, driven by 104,000 completed forbearance agreements primarily related to the pandemic. |
• | As of June 30, 2020, 3.8% of loans in the single-family guarantee portfolio, based on loan count, were delinquent and in forbearance, as reported by servicers. |
• | Credit enhancement coverage of the Single-Family guarantee portfolio decreased to 54% from 58% in the prior quarter driven by lower CRT issuance amounts due to market volatility resulting from the pandemic. |
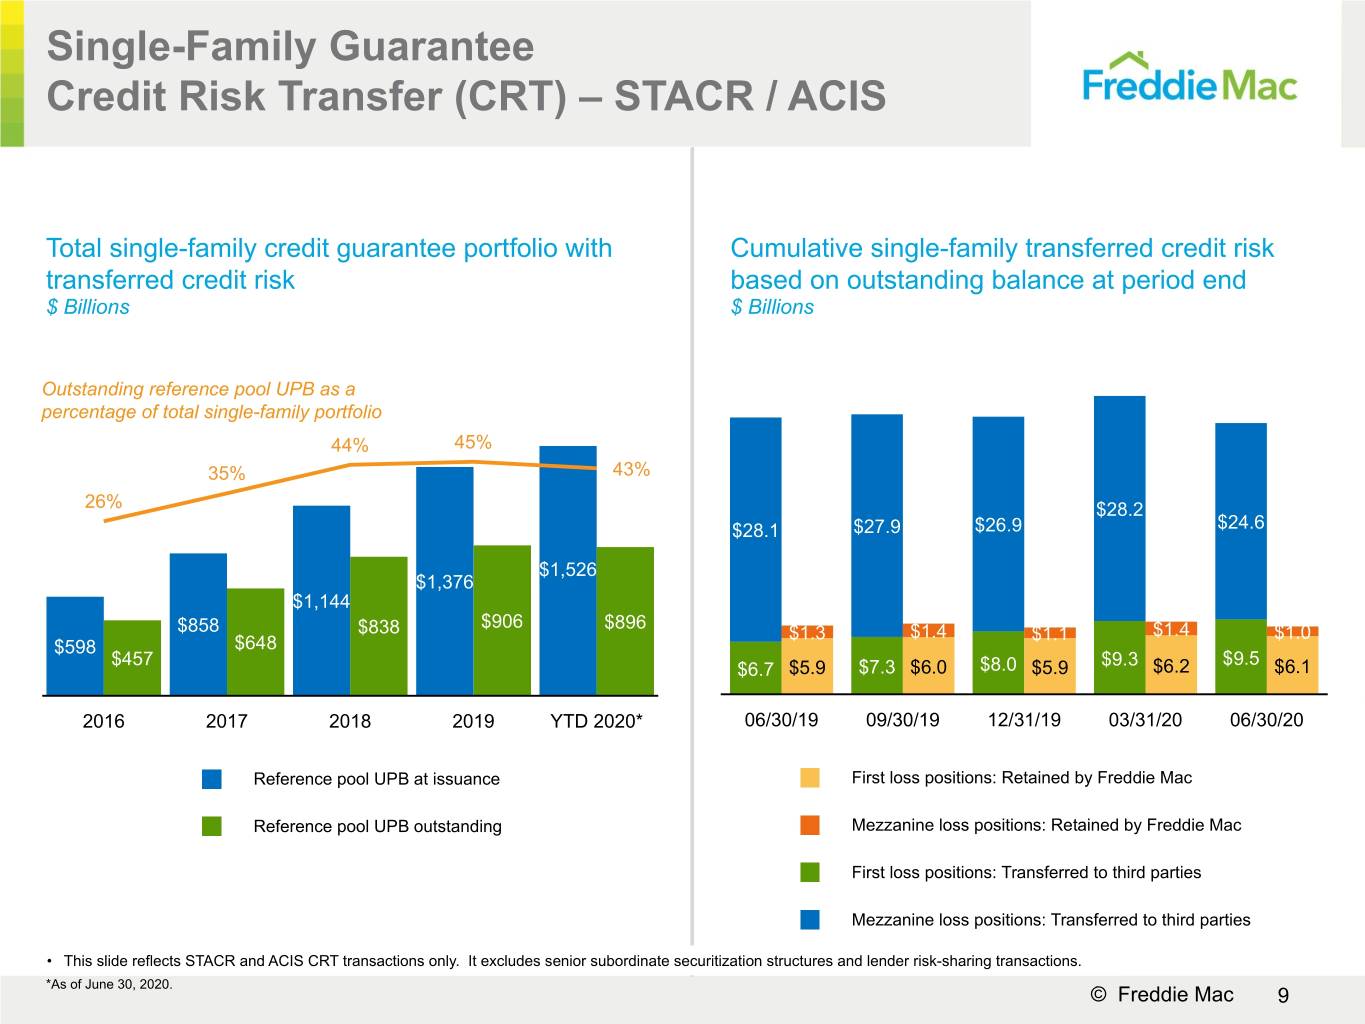
• | As of June 30, 2020, 44% of the Single-Family guarantee portfolio was covered by certain CRT transactions (including STACR, ACIS, certain senior subordination securitization structures, and certain lender risk-sharing transactions), and conservatorship capital needed for credit risk on this population was reduced by approximately 77% through these CRT transactions based on prescribed CCF guidelines. |
Freddie Mac Second Quarter 2020 Financial Results
July 30, 2020
Page 9
Multifamily Segment
Leading through innovation
Financial Results(1)
(Dollars in millions) | 2Q 2020 | 1Q 2020 | Change | 2Q 2019 | Change | ||||||
Net interest income | $228 | $269 | $(41) | $266 | $(38) | ||||||
Guarantee fee income | 442 | 413 | 29 | 293 | 149 | ||||||
Investment gains (losses), net | 761 | (851) | 1,612 | 27 | 734 | ||||||
Other income (loss) | 51 | 37 | 14 | 28 | 23 | ||||||
Net revenues | 1,482 | (132) | 1,614 | 614 | 868 | ||||||
Credit-related expense | (84) | (43) | (41) | (4 | ) | (80) | |||||
Administrative expense | (124) | (120) | (4) | (120 | ) | (4) | |||||
Other expense | (9) | (5) | (4) | (7 | ) | (2) | |||||
Operating expense | (133) | (125) | (8) | (127 | ) | (6) | |||||
Segment Earnings (Losses) before income tax (expense) benefit | 1,265 | (300) | 1,565 | 483 | 782 | ||||||
Income tax (expense) benefit | (260) | 62 | (322) | (100 | ) | (160) | |||||
Segment Earnings (Losses), net of taxes | 1,005 | (238) | 1,243 | 383 | 622 | ||||||
Total other comprehensive income (loss), net of tax | 58 | 64 | (6) | 57 | 1 | ||||||
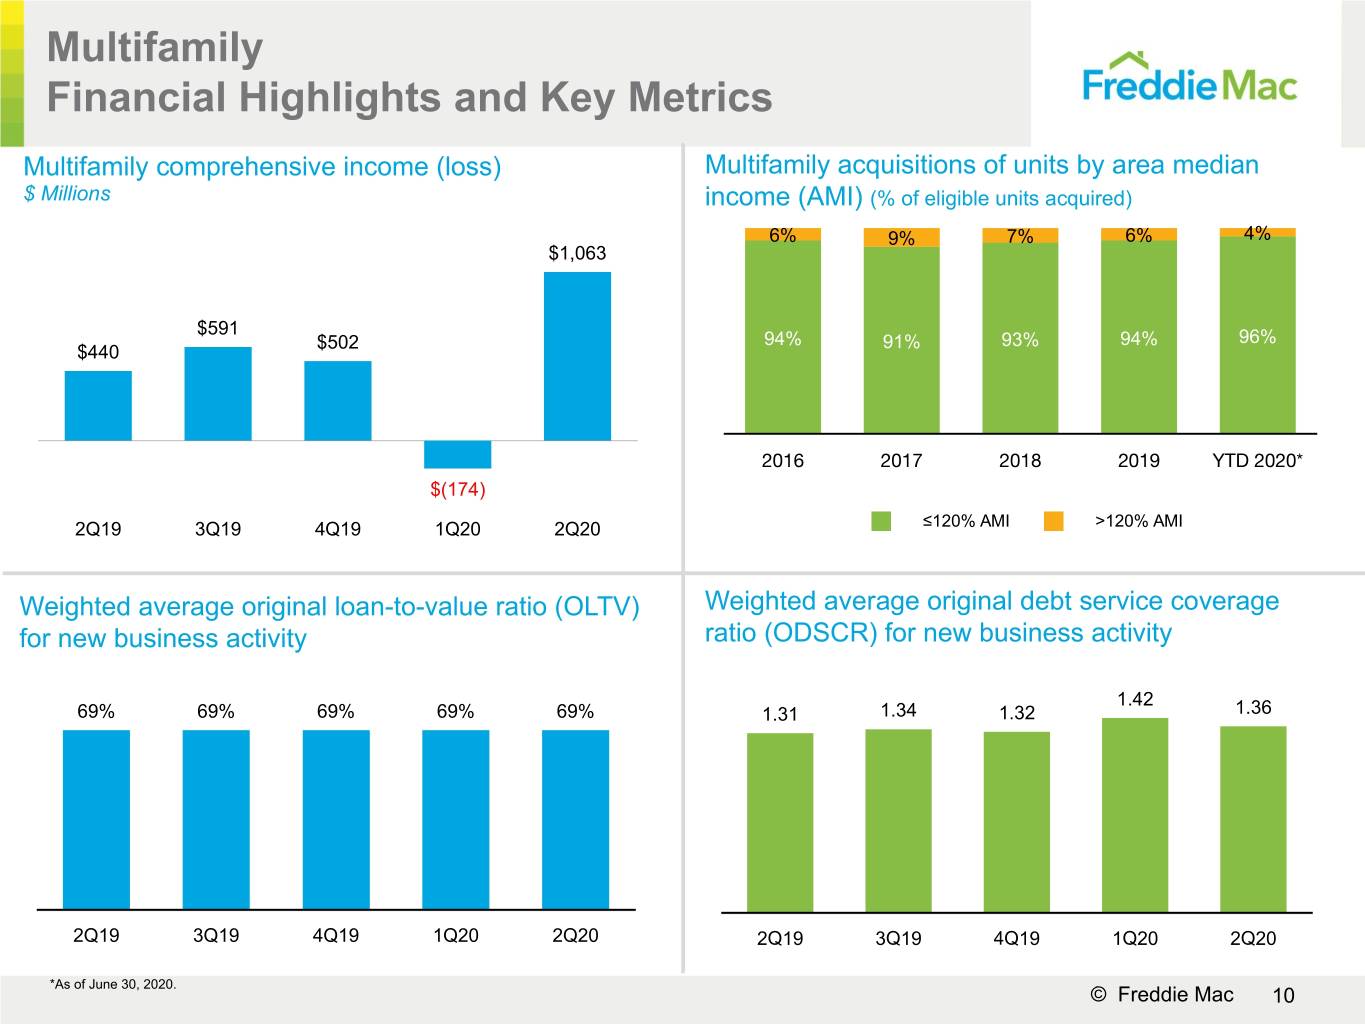
Total comprehensive income (loss) | $1,063 | $(174) | $1,237 | $440 | $623 | ||||||
(1) | The financial performance of the company’s Multifamily segment is measured based on its contribution to GAAP comprehensive income (loss). |
Key Drivers
Comprehensive income increased from the prior quarter, mainly driven by:
• | Investment gains (net of other comprehensive income), primarily due to higher quoted spreads resulting in higher margins on new loan commitments and fair value gains due to improved spreads. |
Business Highlights
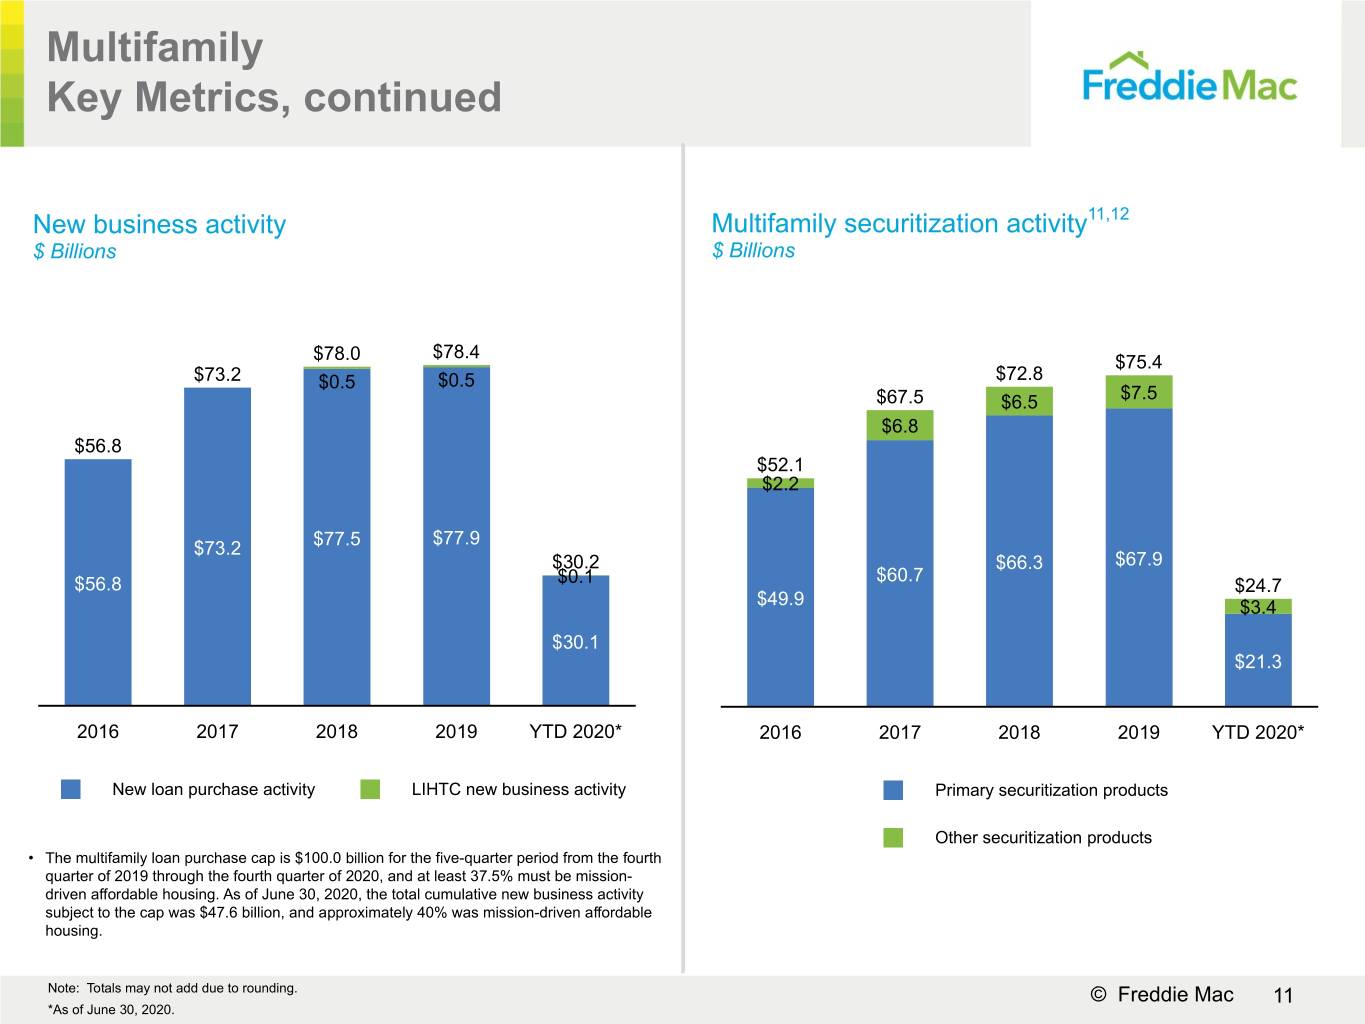
• | New business activity was $20 billion, a 103% increase from the prior quarter, primarily reflecting strong demand for multifamily loan products due to the low interest-rate environment. |
▪ | In September 2019, FHFA announced a revised loan purchase cap structure for the multifamily business. The loan purchase cap is $100.0 billion for the five-quarter period from the fourth quarter of 2019 through the fourth quarter of 2020 and at least 37.5% of the new multifamily business must be mission-driven, affordable housing over the same five-quarter period. |
◦ | As of June 30, 2020, the total cumulative new business activity subject to the cap was $47.6 billion. Approximately 40% of this activity was mission-driven, affordable housing. |
▪ | The weighted average original LTV ratio of new business activity was 69% for the second quarter of 2020, unchanged from the prior quarter. |
▪ | The company provided financing for nearly 202,000 rental units. |
▪ | 95% of the eligible multifamily rental units financed in the second quarter of 2020 were affordable to families earning at or below 120% of area median income. |
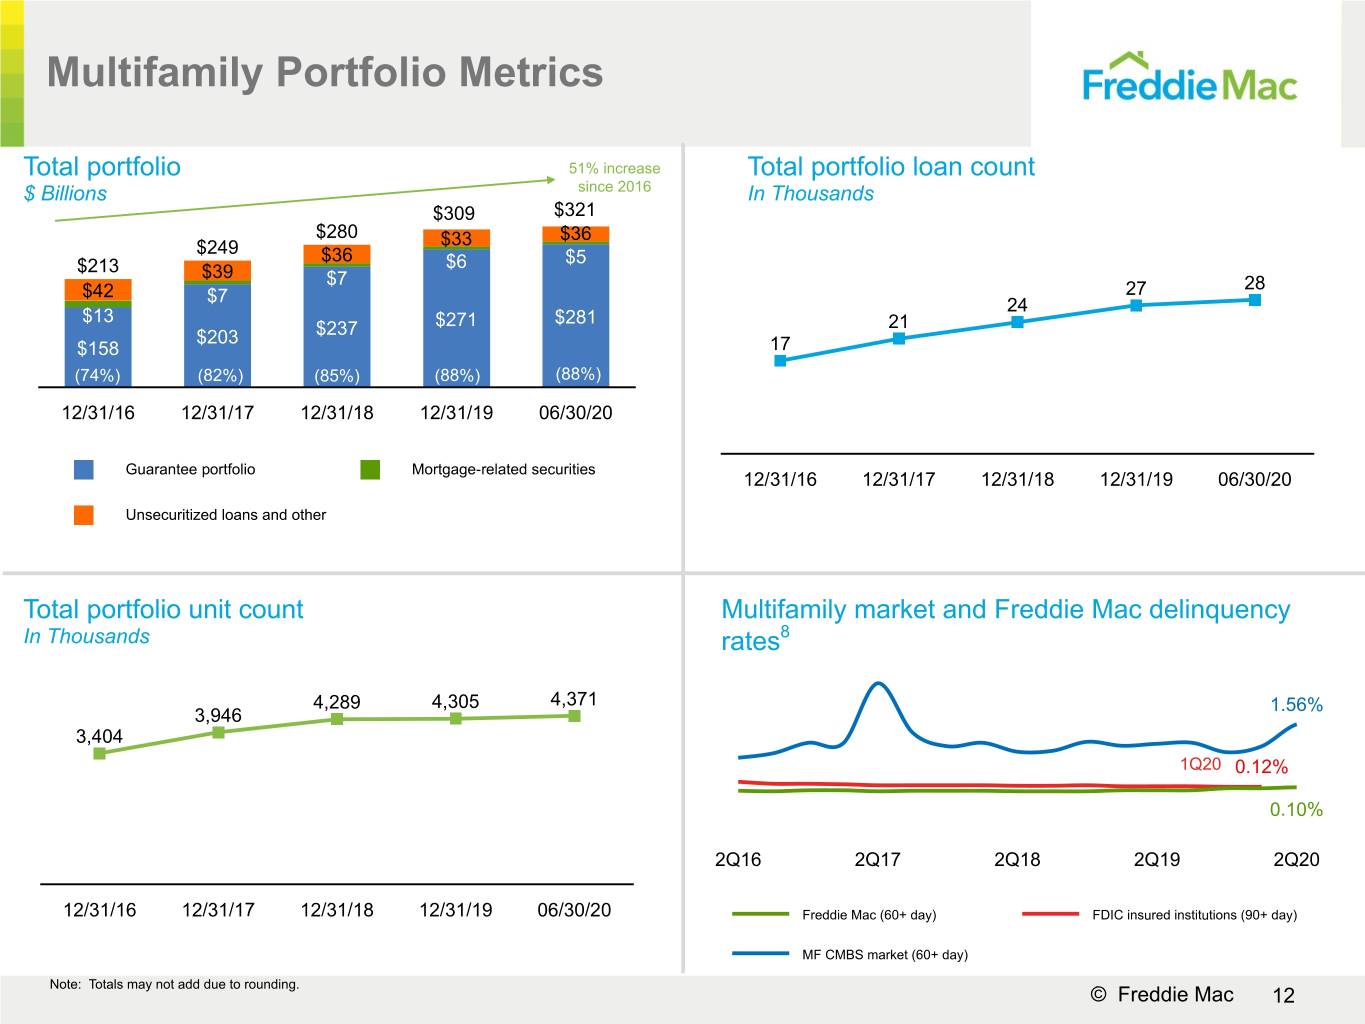
• | The Multifamily guarantee portfolio increased 13% from June 30, 2019, to $281 billion, driven by new securitization activity. |
• | The Multifamily delinquency rate increased to 0.10% from 0.08% in the prior quarter. |
▪ | Multifamily loans in forbearance are reported as current as long as the borrower is in compliance with the forbearance agreement, including the agreed upon repayment plan. Loans in forbearance are therefore not included in the multifamily delinquency rates, if the borrower is in compliance with the forbearance agreement. |
• | As of June 30, 2020, 2.4% of the loans in the multifamily mortgage portfolio, based on UPB, were in forbearance, approximately 83.5% of which are included in securitizations with credit enhancement provided by subordination. |
Freddie Mac Second Quarter 2020 Financial Results
July 30, 2020
Page 10
• | While credit enhancement coverage of the Multifamily mortgage portfolio decreased to 87% from 89% in the prior quarter, the company continued to successfully transfer multifamily credit risk throughout the second quarter of 2020. |
• | As of June 30, 2020, the company had cumulatively transferred the large majority of expected and stress credit risk on the Multifamily guarantee portfolio, primarily through subordination in its securitizations. |
▪ | In addition, nearly all of the company's securitization activities shifted substantially all the interest-rate and liquidity risk associated with the underlying collateral away from Freddie Mac to third-party investors. |
Capital Markets Segment
Innovating the distribution of loans and securities into the mortgage market and actively reducing risk for taxpayers
Financial Results(1)
(Dollars in millions) | 2Q 2020 | 1Q 2020 | Change | 2Q 2019 | Change | |||||
Net interest income | $152 | $509 | $(357) | $747 | $(595) | |||||
Investment gains (losses), net | 206 | (427) | 633 | (259) | 465 | |||||
Other income (loss) | (234) | (201) | (33) | (172) | (62) | |||||
Net revenues | 124 | (119) | 243 | 316 | (192) | |||||
Administrative expense | (98) | (95) | (3) | (99) | 1 | |||||
Other expense | (2) | (9) | 7 | (5) | 3 | |||||
Operating expense | (100) | (104) | 4 | (104) | 4 | |||||
Segment Earnings (Losses) before income tax (expense) benefit | 24 | (223) | 247 | 212 | (188) | |||||
Income tax (expense) benefit | (5) | 46 | (51) | (44) | 39 | |||||
Segment Earnings (Losses), net of taxes | 19 | (177) | 196 | 168 | (149) | |||||
Total other comprehensive income (loss), net of tax | 105 | 387 | (282) | 265 | (160) | |||||
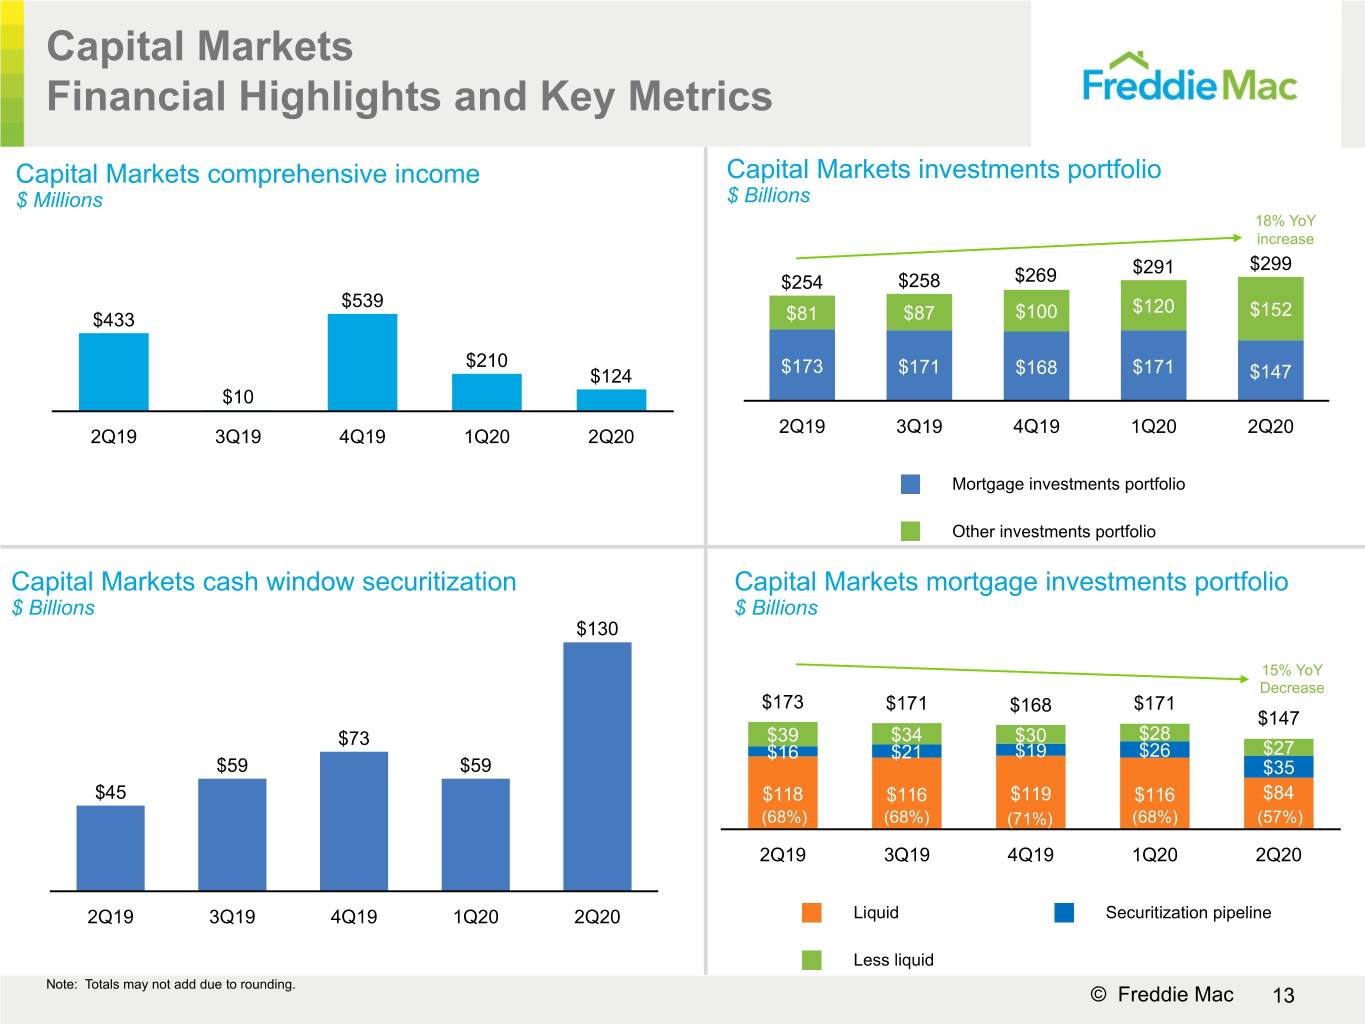
Total comprehensive income (loss) | $124 | $210 | $(86) | $433 | $(309) | |||||
(1) | The financial performance of the company’s Capital Markets segment is measured based on its contribution to GAAP comprehensive income (loss). |
Key Drivers
Comprehensive income decreased from the prior quarter, primarily due to:
• | Lower net interest income primarily driven by higher loan prepayments that resulted in an increase in amortization expense combined with the additional expense from payments to security holders for the full monthly coupon rate when loans pay off mid-month. In addition, the custodial trust account balance increased due to higher loan prepayments and earned a minimal yield due to historically low interest rates; partially offset by |
• | Higher fair value gains on investments (some of which are recorded in other comprehensive income) primarily due to gains from spread tightening on the mortgage-related investment portfolio, partially offset by lower gains on sales of reperforming loans. |
Business Highlights
• | Freddie Mac continued to maintain a presence in the agency mortgage-related securities market to strategically support the guarantee business. |
• | FHFA has instructed the company to maintain loans in COVID-19 payment forbearance plans in mortgage-backed security pools for at least the duration of the forbearance plan. The company's less liquid assets are likely to increase in future periods as it will likely purchase a higher amount of delinquent and modified loans from securities after borrowers exit forbearance plans. |
Freddie Mac Second Quarter 2020 Financial Results
July 30, 2020
Page 11
Housing Market Support
Freddie Mac supports the U.S. housing market by executing its Charter Mission to ensure credit availability for new and refinanced single-family mortgages as well as for rental housing, and by helping struggling homeowners avoid foreclosure. Despite the significant challenges presented by the pandemic, the company continues to provide funding and stability to the housing market.
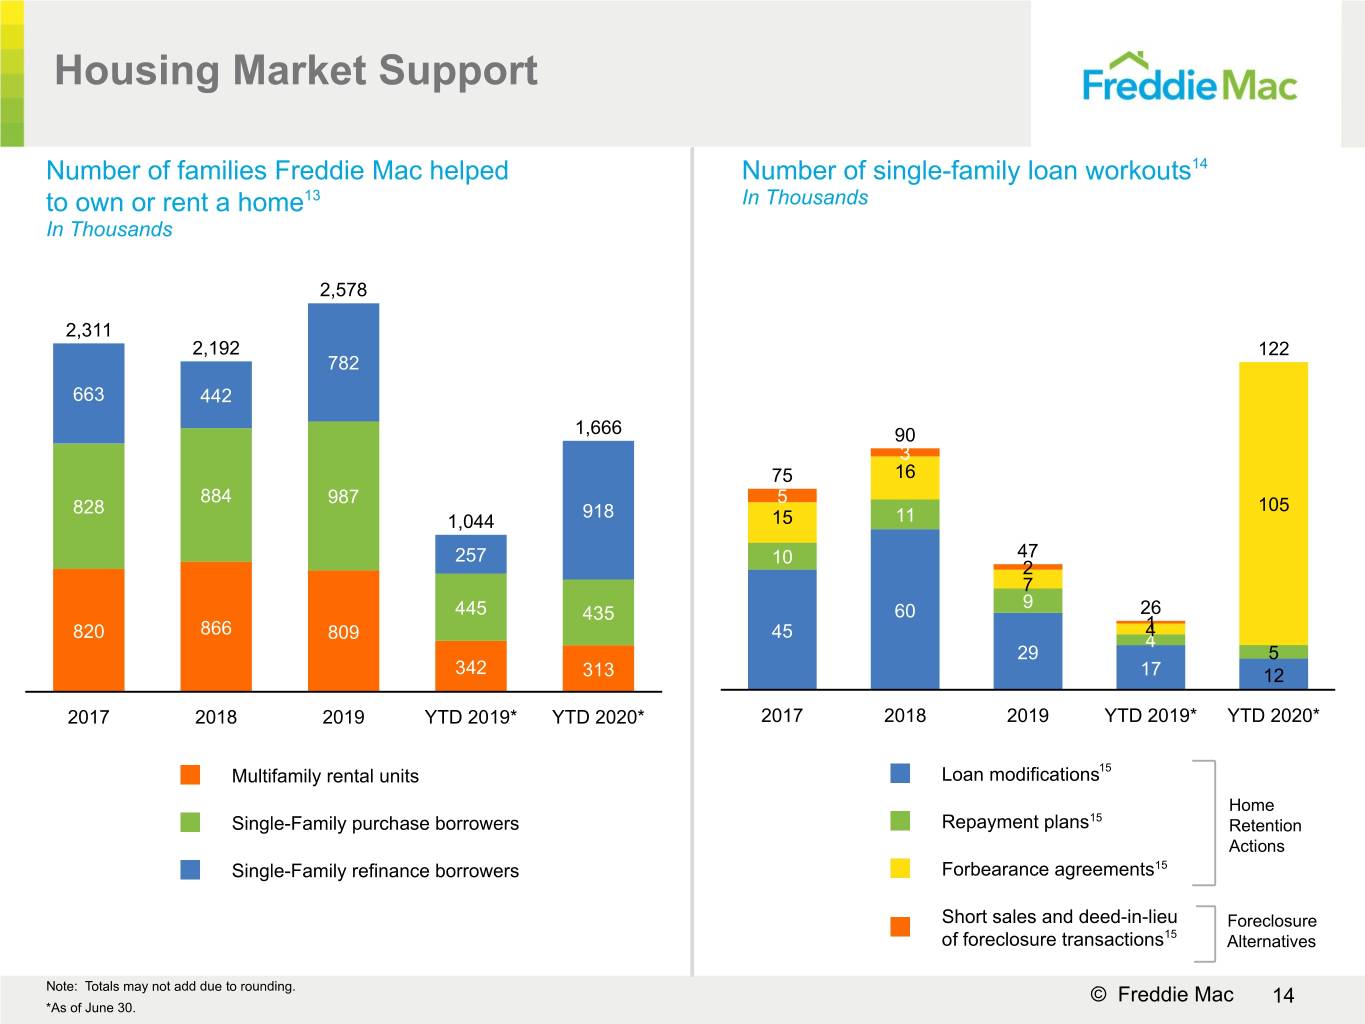
Mortgage Funding – Freddie Mac provided approximately $406 billion in liquidity to the market in the six months ended June 30, 2020, funding:
• | More than 1,353,000 single-family homes, approximately 918,000 of which were refinance loans; and |
• | More than 313,000 multifamily rental units. |
Number of Families Helped to Own or Rent a Home
(In thousands)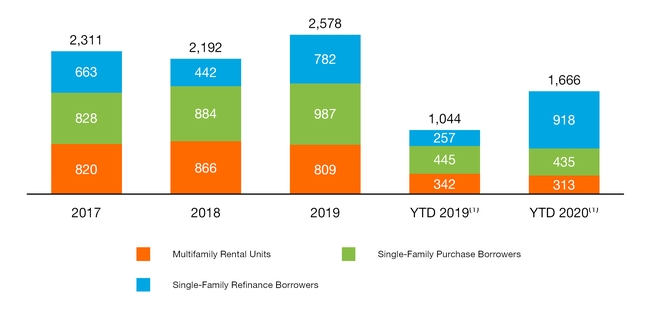
(1) As of June 30.
Amounts may not add due to rounding.
Preventing Foreclosures – Freddie Mac continued to help struggling borrowers retain their homes or otherwise
avoid foreclosure, completing nearly 122,000 single-family loan workouts in the six months ended June 30, 2020 compared to approximately 26,000 in the six months ended June 30, 2019.
Freddie Mac Second Quarter 2020 Financial Results
July 30, 2020
Page 12
About Freddie Mac’s Conservatorship
Since September 2008, Freddie Mac has been operating under conservatorship with FHFA as Conservator. The support provided by Treasury pursuant to the Purchase Agreement enables the company to maintain access to the debt markets and have adequate liquidity to conduct its normal business operations.
Treasury Draws and Dividend Payments(1)
(Dollars in billions)
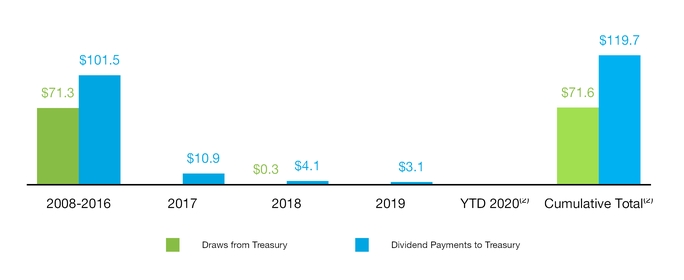
(1) Excludes the initial $1 billion liquidation preference of the senior preferred stock issued to Treasury in September 2008 and the $9.5 billion increase to-date in the aggregate liquidation preference of the senior preferred stock pursuant to the Letter Agreements.
(2) As of June 30, 2020.
Amounts may not add due to rounding.
• | As a result of the increase in the Capital Reserve Amount pursuant to the September 2019 Letter Agreement, the company did not have a dividend requirement to Treasury on the senior preferred stock in June 2020, and it will not be required to pay a dividend on the senior preferred stock to Treasury until its Net Worth Amount exceeds $20.0 billion. |
▪ | Pursuant to the September 2019 Letter Agreement, the liquidation preference of the senior preferred stock increased from $81.8 billion to $82.2 billion on June 30, 2020 based on the $0.4 billion increase in the Net Worth Amount during the first quarter of 2020. |
◦ | The liquidation preference will increase to $84.1 billion on September 30, 2020 based on the $1.9 billion increase in the Net Worth Amount during the second quarter of 2020. |
• | The amount of funding available to Freddie Mac under the Purchase Agreement remained $140.2 billion at June 30, 2020. |
Freddie Mac Second Quarter 2020 Financial Results
July 30, 2020
Page 13
Additional Information
For more information, including information related to Freddie Mac’s financial results, conservatorship, and related matters, see the company’s Quarterly Report on Form 10-Q for the quarter ended June 30, 2020 and the company’s Financial Results Supplement. These documents are available on the Investor Relations page of the company’s website at www.FreddieMac.com/investors.
Additional information about Freddie Mac and its business is also set forth in the company’s other filings with the SEC, which are available on the Investor Relations page of the company’s website at www.FreddieMac.com/investors and the SEC’s website at www.sec.gov. Freddie Mac encourages all investors and interested members of the public to review these materials for a more complete understanding of the company’s financial results and related disclosures.
Webcast Announcement
Management will host a conference call at 9 a.m. Eastern Time on July 30, 2020 to discuss the company’s results with the media. The conference call will be concurrently webcast. To access the live audio webcast, use the following link: https://edge.media-server.com/mmc/p/d7tspm27. The replay will be available on the company’s website at www.FreddieMac.com/investors for approximately 30 days. All materials related to the call will be available on the Investor Relations page of the company’s website at www.FreddieMac.com/investors.
Media Contact: Frederick Solomon (703) 903-3861 | Investor Contact: Laurie Garthune (571) 382-4732 |
* * * *
This press release contains forward-looking statements, which may include statements pertaining to the conservatorship, the company’s current expectations and objectives for its Single-Family Guarantee, Multifamily, and Capital Markets segments, its efforts to assist the housing market, liquidity and capital management, economic and market conditions and trends, the effects of the COVID-19 pandemic and actions taken in response thereto on its business, financial condition, and liquidity, its market share, the effect of legislative and regulatory developments and new accounting guidance, credit quality of loans the company owns or guarantees, the costs and benefits of the company’s CRT transactions, and results of operations and financial condition on a GAAP, Segment Earnings, non-GAAP, and fair value basis. Forward-looking statements involve known and unknown risks and uncertainties, some of which are beyond the company’s control. Management’s expectations for the company’s future necessarily involve a number of assumptions, judgments, and estimates, and various factors, including changes in market conditions, liquidity, mortgage spreads, credit outlook, uncertainty about the duration and severity, and effects of, the COVID-19 pandemic and actions taken in response thereto, actions by the U.S. government (including FHFA, Treasury, Congress, and state and local governments), and the impacts of legislation or regulations and new or amended accounting guidance, could cause actual results to differ materially from these expectations. These assumptions, judgments, estimates, and factors are discussed in the company’s Quarterly Reports on Form 10-Q for the quarters ended March 31, 2020, and June 30, 2020, which are available on the Investor Relations page of the company’s website at www.FreddieMac.com/investors and the SEC’s website at www.sec.gov. The company undertakes no obligation to update forward-looking statements it makes to reflect events or circumstances occurring after the date of this press release.
Freddie Mac makes home possible for millions of families and individuals by providing mortgage capital to lenders. Since its creation by Congress in 1970, the company has made housing more accessible and affordable for homebuyers and renters in communities nationwide. The company is building a better housing finance system for homebuyers, renters, lenders, and taxpayers. Learn more at FreddieMac.com, Twitter @FreddieMac and Freddie Mac’s blog FreddieMac.com/blog.
Freddie Mac Second Quarter 2020 Financial Results
July 30, 2020
Page 14
FREDDIE MAC
Condensed Consolidated Statements of Comprehensive Income (Loss) (Unaudited)
(In millions, except share-related amounts) | 2Q 2020 | 1Q 2020 | 2Q 2019 | ||||||
Interest income | |||||||||
Mortgage loans | $15,026 | $16,632 | $17,358 | ||||||
Investment securities | 637 | 652 | 684 | ||||||
Other | 53 | 308 | 420 | ||||||
Total interest income | 15,716 | 17,592 | 18,462 | ||||||
Interest expense | (12,840 | ) | (14,807 | ) | (15,535 | ) | |||
Net interest income | 2,876 | 2,785 | 2,927 | ||||||
Non-interest income (loss) | |||||||||
Guarantee fee income | 469 | 377 | 280 | ||||||
Investment gains (losses), net | 670 | (835 | ) | (138 | ) | ||||
Other income (loss) | 134 | 95 | 143 | ||||||
Non-interest income (loss) | 1,273 | (363 | ) | 285 | |||||
Net revenues | 4,149 | 2,422 | 3,212 | ||||||
Benefit (provision) for credit losses | (705 | ) | (1,233 | ) | 160 | ||||
Non-interest expense | |||||||||
Salaries and employee benefits | (327 | ) | (341 | ) | (328 | ) | |||
Professional services | (88 | ) | (76 | ) | (122 | ) | |||
Other administrative expense | (186 | ) | (170 | ) | (169 | ) | |||
Total administrative expense | (601 | ) | (587 | ) | (619 | ) | |||
Credit enhancement expense | (233 | ) | (231 | ) | (177 | ) | |||
Expected credit enhancement recoveries | 221 | 467 | 38 | ||||||
REO operations expense | (14 | ) | (85 | ) | (81 | ) | |||
Temporary Payroll Tax Cut Continuation Act of 2011 expense | (442 | ) | (432 | ) | (399 | ) | |||
Other expense | (140 | ) | (103 | ) | (236 | ) | |||
Non-interest expense | (1,209 | ) | (971 | ) | (1,474 | ) | |||
Income (loss) before income tax (expense) benefit | 2,235 | 218 | 1,898 | ||||||
Income tax (expense) benefit | (458 | ) | (45 | ) | (392 | ) | |||
Net income (loss) | 1,777 | 173 | 1,506 | ||||||
Other comprehensive income (loss), net of taxes and reclassification adjustments | |||||||||
Changes in unrealized gains (losses) related to available-for-sale securities | 154 | 438 | 304 | ||||||
Changes in unrealized gains (losses) related to cash flow hedge relationships | 11 | 13 | 20 | ||||||
Changes in defined benefit plans | (4 | ) | (2 | ) | (4 | ) | |||
Total other comprehensive income (loss), net of taxes and reclassification adjustments | 161 | 449 | 320 | ||||||
Comprehensive income (loss) | $1,938 | $622 | $1,826 | ||||||
Net income (loss) | $1,777 | $173 | $1,506 | ||||||
Undistributed net worth sweep, senior preferred stock dividends, or future increase in senior preferred stock liquidation preference | (1,938) | (382) | (1,826) | ||||||
Net income (loss) attributable to common stockholders | $(161) | $(209) | $(320) | ||||||
Net income (loss) per common share — basic and diluted | $(0.05) | $(0.06) | $(0.10) | ||||||
Weighted average common shares outstanding (in millions) — basic and diluted | 3,234 | 3,234 | 3,234 | ||||||
Freddie Mac Second Quarter 2020 Financial Results
July 30, 2020
Page 15
FREDDIE MAC
Condensed Consolidated Balance Sheets (Unaudited)
June 30, | December 31, | |||||
(In millions, except share-related amounts) | 2020 | 2019 | ||||
Assets | ||||||
Cash and cash equivalents (includes $908 and $991 of restricted cash and cash equivalents) | $7,605 | $5,189 | ||||
Securities purchased under agreements to resell | 100,525 | 56,271 | ||||
Investment securities, at fair value | 77,902 | 75,711 | ||||
Mortgage loans held-for-sale (includes $17,526 and $15,035 at fair value) | 38,887 | 35,288 | ||||
Mortgage loans held-for-investment (net of allowance for credit losses of $6,606 and $4,234) | 2,061,753 | 1,984,912 | ||||
Accrued interest receivable (net of allowance of $57 and $0) | 7,132 | 6,848 | ||||
Derivative assets, net | 1,402 | 844 | ||||
Deferred tax assets, net | 5,698 | 5,918 | ||||
Other assets (includes $5,141 and $4,627 at fair value) | 34,751 | 22,799 | ||||
Total assets | $2,335,655 | $2,193,780 | ||||
Liabilities and equity | ||||||
Liabilities | ||||||
Accrued interest payable | $6,246 | $6,559 | ||||
Debt (includes $3,086 and $3,938 at fair value) | 2,308,301 | 2,169,685 | ||||
Derivative liabilities, net | 839 | 372 | ||||
Other liabilities | 8,827 | 8,042 | ||||
Total liabilities | 2,324,213 | 2,184,658 | ||||
Commitments and contingencies | ||||||
Equity | ||||||
Senior preferred stock (liquidation preference of $82,152 and $79,322) | 72,648 | 72,648 | ||||
Preferred stock, at redemption value | 14,109 | 14,109 | ||||
Common stock, $0.00 par value, 4,000,000,000 shares authorized, 725,863,886 shares issued and 650,059,292 shares and 650,059,033 shares outstanding | — | — | ||||
Additional paid-in capital | — | — | ||||
Retained earnings (accumulated deficit) | (72,478 | ) | (74,188 | ) | ||
AOCI, net of taxes, related to: | ||||||
Available-for-sale securities | 1,210 | 618 | ||||
Cash flow hedge relationships | (220 | ) | (244 | ) | ||
Defined benefit plans | 58 | 64 | ||||
Total AOCI, net of taxes | 1,048 | 438 | ||||
Treasury stock, at cost, 75,804,594 shares and 75,804,853 shares | (3,885 | ) | (3,885 | ) | ||
Total equity | 11,442 | 9,122 | ||||
Total liabilities and equity | $2,335,655 | $2,193,780 | ||||
The table below presents the carrying value and classification of the assets and liabilities of consolidated variable interest entities (VIEs) on the company's condensed consolidated balance sheets. | ||||||
June 30, | December 31, | |||||
(In millions) | 2020 | 2019 | ||||
Condensed Consolidated Balance Sheet Line Item | ||||||
Assets: | ||||||
Mortgage loans held-for-investment | $2,000,649 | $1,940,523 | ||||
All other assets | 74,186 | 40,598 | ||||
Total assets of consolidated VIEs | $2,074,835 | $1,981,121 | ||||
Liabilities: | ||||||
Debt | $2,020,866 | $1,898,355 | ||||
All other liabilities | 5,617 | 5,537 | ||||
Total liabilities of consolidated VIEs | $2,026,483 | $1,903,892 | ||||
Freddie Mac Second Quarter 2020 Financial Results
July 30, 2020
Page 16
FREDDIE MAC
Non-GAAP Reconciliations
The company’s GAAP net interest income includes the spread earned on its investment activities plus the guarantee fees earned by its single-family business. Adjusted net interest income is the net spread earned on the company’s investment activities, including the cost of funds associated with using derivatives. Net interest yield, GAAP and adjusted, is calculated as annualized quarterly GAAP or adjusted net interest income divided by the average balance of the underlying assets and liabilities. | ||||||||||||||||
Reconciliation of GAAP Net Interest Income to Adjusted Net Interest Income (pre-tax) | ||||||||||||||||
(Dollars in millions) | 2Q 2019 | 3Q 2019 | 4Q 2019 | 1Q 2020 | 2Q 2020 | |||||||||||
GAAP net interest income | $2,927 | $2,410 | $3,358 | $2,785 | $2,876 | |||||||||||
Reclassifications: | ||||||||||||||||
Guarantee fee income reclassified to adjusted guarantee fee income (1)(2) | (2,287 | ) | (2,486 | ) | (2,607 | ) | (2,561 | ) | (2,943 | ) | ||||||
Accrual of periodic cash settlements reclassified from derivative gain (loss) (3) | (42 | ) | (47 | ) | (129 | ) | (176 | ) | (329 | ) | ||||||
Hedge accounting impact (4) | 13 | 517 | (11 | ) | 350 | 475 | ||||||||||
Other reclassifications (5) | 402 | 395 | 137 | 380 | 301 | |||||||||||
Total reclassifications | (1,914 | ) | (1,621 | ) | (2,610 | ) | (2,007 | ) | (2,496 | ) | ||||||
Adjusted net interest income | $1,013 | $789 | $748 | $778 | $380 | |||||||||||
Average balance of assets and liabilities, GAAP (in billions) | $2,089 | $2,120 | $2,162 | $2,205 | $2,274 | |||||||||||
Average balance of assets and liabilities, adjusted (in billions) | $302 | $310 | $319 | $324 | $352 | |||||||||||
The company's GAAP guarantee fees are primarily those generated by the company's multifamily business. Adjusted guarantee fee income consists of the revenues from guarantee fees from both the single-family and multifamily businesses, net of the 10 basis point guarantee fee remitted to Treasury as part of the Temporary Payroll Tax Cut Continuation Act of 2011. | ||||||||||||||||
Reconciliation of GAAP Guarantee Fee Income to Adjusted Guarantee Fee Income (pre-tax) | ||||||||||||||||
(Dollars in millions) | 2Q 2019 | 3Q 2019 | 4Q 2019 | 1Q 2020 | 2Q 2020 | |||||||||||
GAAP guarantee fee income | $280 | $280 | $239 | $377 | $469 | |||||||||||
Reclassifications: | ||||||||||||||||
Guarantee fee income reclassified from net interest income (1)(2) | 2,287 | 2,486 | 2,607 | 2,561 | 2,943 | |||||||||||
Temporary Payroll Tax Cut Continuation Act of 2011 expense reclassified from other non-interest expense (6) | (399 | ) | (408 | ) | (420 | ) | (432 | ) | (442 | ) | ||||||
Total reclassifications | 1,888 | 2,078 | 2,187 | 2,129 | 2,501 | |||||||||||
Adjusted guarantee fee income | $2,168 | $2,358 | $2,426 | $2,506 | $2,970 | |||||||||||
Columns may not add due to rounding.
For notes on reclassifications, see page 17 of this press release.
Freddie Mac Second Quarter 2020 Financial Results
July 30, 2020
Page 17
Notes on Significant Reclassifications
(1) Net guarantee fees, including upfront fees and related hedge amortization and implied guarantee fee income related to unsecuritized loans held in the mortgage-related investments portfolio, are reclassified from GAAP net interest income to adjusted guarantee fee income.
(2) Short-term returns on cash received related to certain upfront fees on single-family loans are reclassified from GAAP net interest income to adjusted guarantee fee income.
(3) The accrual of periodic cash settlements of derivatives is reclassified from GAAP investment gains (losses) to adjusted net interest income to fully reflect the periodic cost associated with the protection provided by these contracts.
(4) Hedge accounting impact consists of removing the effects of hedge accounting including deferred gains and losses on closed cash flow hedges related to forecasted debt issuances.
(5) Other reclassifications primarily relate to items reclassified out of GAAP net interest income, including the amortization related to derivative commitment basis adjustments associated with mortgage-related and non-mortgage-related securities, amortization related to accretion of other-than-temporary impairments on available-for-sale securities, amortization of discounts on loans purchased with deteriorated credit quality that are on accrual status, amortization related to premiums and discounts, including non-cash premiums and discounts, on single-family loans in trusts and on the associated consolidated securities, amortization related to premiums and discounts associated with securities issued by consolidated trusts that were previously held and subsequently transferred to third parties, costs associated with STACR debt note expenses, and internally allocated costs associated with the refinancing of debt related to Multifamily segment held-for-investment loans which were securitized.
(6) The expense related to the Temporary Payroll Tax Cut Continuation Act of 2011 is reclassified from GAAP other non-interest expense to adjusted guarantee fee income. As a result of the reclassification, the revenue and expense related to the legislated 10 basis point increase are netted within adjusted guarantee fee income.