8-K
FARMERS NATIONAL BANC CORP /OH/ false 0000709337 0000709337 2023-04-26 2023-04-26


UNITED STATES

SECURITIES AND EXCHANGE COMMISSION

WASHINGTON, D.C. 20549


FORM 8-K


CURRENT REPORT

PURSUANT TO SECTION 13 OR 15(d)

OF THE SECURITIES EXCHANGE ACT OF 1934

Date of Report (Date of earliest event reported): April 26, 2023


Farmers National Banc Corp.

(Exact name of registrant as specified in its charter)


Ohio   001-35296   34-1371693

(State or other jurisdiction

of incorporation)


(Commission

File Number)


(IRS Employer

Identification No.)


20 South Broad Street, P.O. Box 555, Canfield, Ohio   44406-0555
(Address of principal executive offices)   (Zip Code)

(330) 533-3341

(Registrant’s telephone number, including area code)

(Former name or former address, if changed since last report)


Check the appropriate box below if the Form 8-K filing is intended to simultaneously satisfy the filing obligation of the registrant under any of the following provisions:


Written communication pursuant to Rule 425 under the Securities Act (17 CFR 230.425)


Soliciting material pursuant to Rule 14a-12 under the Exchange Act (17 CFR 240.14a-12)


Pre-commencement communication pursuant to Rule 14d-2(b) under the Exchange Act (17 CFR 240.14d-2(b))


Pre-commencement communication pursuant to Rule 13e-4(c) under the Exchange Act (17 CFR 240.13e-4(c))

Securities registered pursuant to Section 12(b) of the Act:


Title of each class


Trading
Symbol


Name of each exchange on

which registered

Common Stock, No Par Value   FMNB   The NASDAQ Stock Market

Indicate by check mark whether the registrant is an emerging growth company as defined in Rule 405 of the Securities Act of 1933 (§230.405 of this chapter) or Rule 12b-2 of the Securities Exchange Act of 1934 (§240.12b-2 of this chapter).

Emerging growth company  

If an emerging growth company, indicate by check mark if the registrant has elected not to use the extended transition period for complying with any new or revised financial accounting standards provided pursuant to Section 13(a) of the Exchange Act.  ☐


Item 2.02

Results of Operations and Financial Condition.

On April 26, 2023, Farmers National Banc Corp. (the “Company”) announced earnings for the quarter ended March 31, 2023. A copy of the press release and certain financial information for that period is attached as Exhibit 99.1 hereto and incorporated by reference herein.

Also on April 26, 2023, the Company first provided shareholders with a supplemental presentation regarding first quarter earnings and other current financial information, attached as Exhibit 99.2 hereto and incorporated by reference herein.

Pursuant to General Instruction B.2 of Current Report on Form 8-K, the information in this Item 2.02 and Exhibits 99.1 and 99.2 is being furnished and shall not be deemed to be “filed” for purposes of Section 18 of the Securities Exchange Act of 1934, as amended (the “Exchange Act”), or otherwise subject to the liability of that section. Furthermore, the information in this Item 2.02 and Exhibits 99.1 and 99.2 shall not be deemed to be incorporated by reference into the filings of the Company under the Securities Act of 1933, as amended (the “Securities Act”) except as may be expressly set forth by specific reference in such filing.


Item 7.01

Regulation FD Disclosure.

On April 26, 2023, the Company first provided shareholders with a supplemental presentation regarding first quarter earnings and other current financial information, attached as Exhibit 99.2 hereto and incorporated by reference herein.

The presentation is furnished herein, as part of this Item 7.01, as Exhibit 99.2. Pursuant to General Instruction B.2 of Current Report on Form 8-K, the information in this Item 7.01 and Exhibit 99.2 shall not be deemed to be “filed” for purposes of Section 18 of the Exchange Act, or otherwise subject to the liability of that section. Furthermore, the information in this Item 7.01 and Exhibit 99.2 shall not be deemed to be incorporated by reference into the filings of the Company under the Securities Act, except as may be expressly set forth by specific reference in such filing.


Item 9.01

Financial Statements and Exhibits.


  (d)

Exhibits.


Exhibit
Number


Description

99.1    Press Release, dated April 26, 2023
99.2    Shareholder Presentation, dated April 26, 2023
104    Cover Page Interactive Data File (embedded within the Inline XBRL document)


SIGNATURES

Pursuant to the requirements of the Securities Exchange Act of 1934, the registrant has duly caused this report to be signed on its behalf by the undersigned hereunto duly authorized.


Farmers National Banc Corp.
By:  

/s/ Kevin J. Helmick

  Kevin J. Helmick
  President and Chief Executive Officer

Date: April 26, 2023

Exhibit 99.1

April 26, 2023

Press Release


  Source:

          Farmers National Banc Corp.

Kevin J. Helmick, President and CEO

20 South Broad Street, P.O. Box 555

Canfield, OH 44406

330.533.3341

Email: [email protected]

FARMERS NATIONAL BANC CORP. ANNOUNCES

EARNINGS FOR FIRST QUARTER OF 2023


Earnings per diluted share of $0.19 ($0.44 excluding certain items, non-GAAP) for the first quarter of 2023


Completed the acquisition and systems integration of Emclaire Financial Corp.


161 consecutive quarters of profitability


Repurchased 850,799 shares of FMNB common stock during the quarter, or 2.2% of shares outstanding


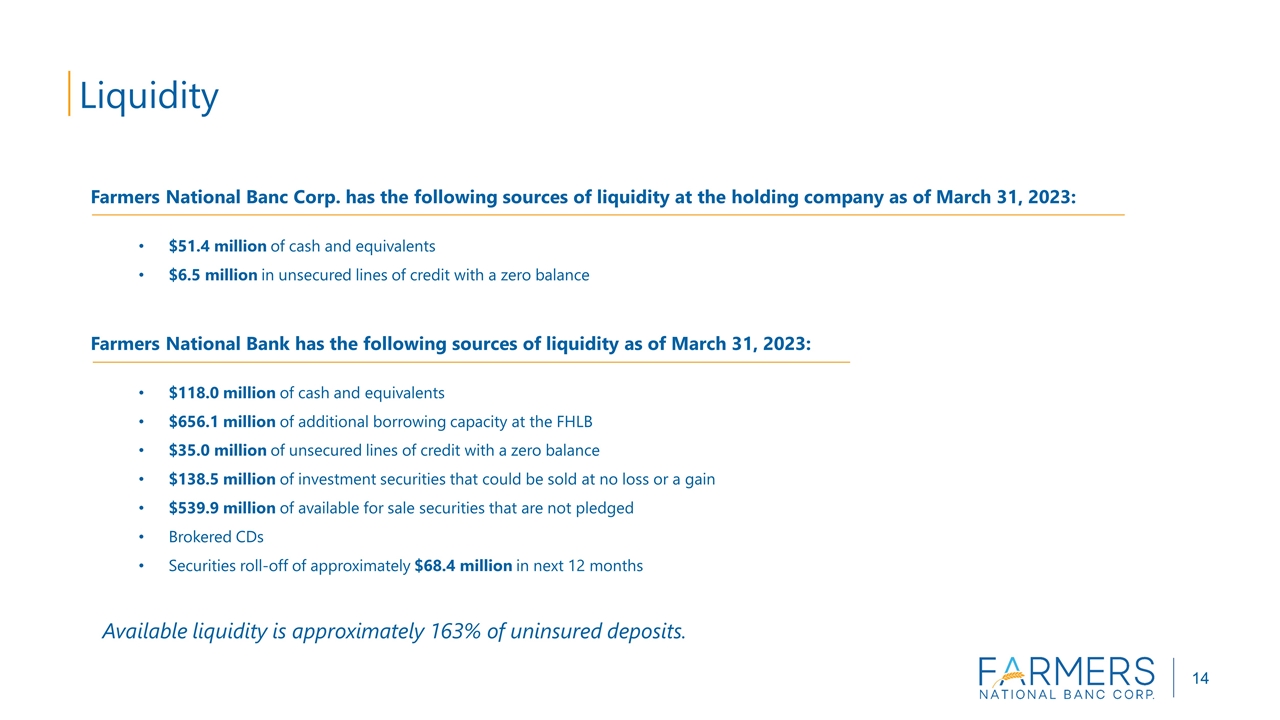
Additional FHLB borrowing capacity of $656.1 million as of March 31, 2023


Uninsured deposits are approximately 19.2% of customer deposit base


Available for sale securities not pledged totaled $539.9 million at March 31, 2023


Efficiency ratio, (excluding certain items, non-GAAP), of 53.5% for the first quarter of 2023


Return on average assets, (excluding certain items, non-GAAP), was 1.30% for the first quarter of 2023


ROAE and ROATE (excluding certain items, non-GAAP) 18.0% and 38.1%, respectively, for first quarter of 2023

CANFIELD, Ohio (April 26, 2023) – Farmers National Banc Corp. (“Farmers” or the “Company”) (NASDAQ: FMNB) today announced net income of $7.1 million for the three months ended March 31, 2023 compared to $15.8 million for the three months ended March 31, 2022. Diluted earnings per share were $0.19 for the first quarter of 2023 compared to $0.47 for the first quarter of 2022. The results for the first quarter of 2023 included pretax items for acquisition related provision for credit loss expense of $7.7 million, $4.3 million for acquisition related costs and combined net gains of $91,000 on the sale of securities and the sale of other assets. Excluding these items (non-GAAP), net income for the first quarter of 2023 would have been $16.5 million, or $0.44 per diluted share.

Kevin J. Helmick, President and CEO, commented, “For over 136 years, Farmers has been dedicated to serving its local communities, while adhering to safe and sound banking principals. This has driven our legacy of financial success, allowing us to continually support our customers during both good and bad economic periods. As volatility within the macro-economic environment has increased, we have remained focused on serving our retail, commercial and wealth customers, controlling expenses, and managing capital levels. In addition, we continue to allocate capital to support our dividend policy and share repurchase program.”

“We remain well positioned to navigate the current challenges in the banking industry and interest rate environment, as a result of our experienced leadership team, diverse revenue streams, enhanced scale, and legendary customer service. I am proud of our team’s performance during the first quarter, and encouraged by the direction Farmers is headed,” concluded Mr. Helmick.

As previously announced, Farmers entered into an agreement and plan of merger with Emclaire Financial Corp. (formerly NASDAQ: EMCF), a Pennsylvania corporation (“Emclaire”), and the parent company of The Farmers National Bank of Emlenton (“Emlenton”) on March 23, 2022, the transaction was approved by Emclaire’s shareholders on July 20, 2022, received final regulatory approvals on December 2, 2022, and closed on January 1, 2023.

At the closing of the merger, Farmers issued 4.2 million shares of its common stock along with cash of $33.4 million, which represents a transaction value of approximately $92.6 million based on Farmers closing price of $14.12 on December 31, 2022. The transaction value has been allocated to assets acquired and liabilities assumed, including $741.7 million in gross loans, $216.2 million in other tangible assets, $875.8 million in deposits, $75.0 million in FHLB advances, $7.1 million in other liabilities and $92.6 million in goodwill and other intangible assets. Prior to closing, Emlenton incurred $4.6 million of merger-related costs.

Balance Sheet

The Company’s total assets increased to $5.11 billion at March 31, 2023 compared to $4.08 billion at December 31, 2022. The increase was primarily due to the acquisition of Emlenton which added $1.05 billion in assets to the balance sheet. Gross loans (excluding loans held for sale) increased by $747.6 million in the first quarter of 2023. This figure included $741.7 million in gross loans added from Emlenton and $5.9 million in organic loan growth.


Securities available for sale increased to $1.36 billion at March 31, 2023 from $1.27 billion at December 31, 2022.    This increase was due to the addition of $127.0 million in available for sale securities from Emlenton and a reduction in the gross amount of unrealized losses which totaled $266.5 million at December 31, 2022 compared to a gross unrealized loss of $223.7 million at March 31, 2023.    Offsetting these increases, the Company also had sales and runoff from the portfolio that totaled approximately $82.4 million in the first three months of 2023. The Company will continue to look to opportunistically shrink the size of the securities portfolio to increase liquidity and optimize profitability. The volatility in the bond market, however, is expected to continue in 2023, which may result in increased volatility in the fair value of the Company’s available for sale securities.

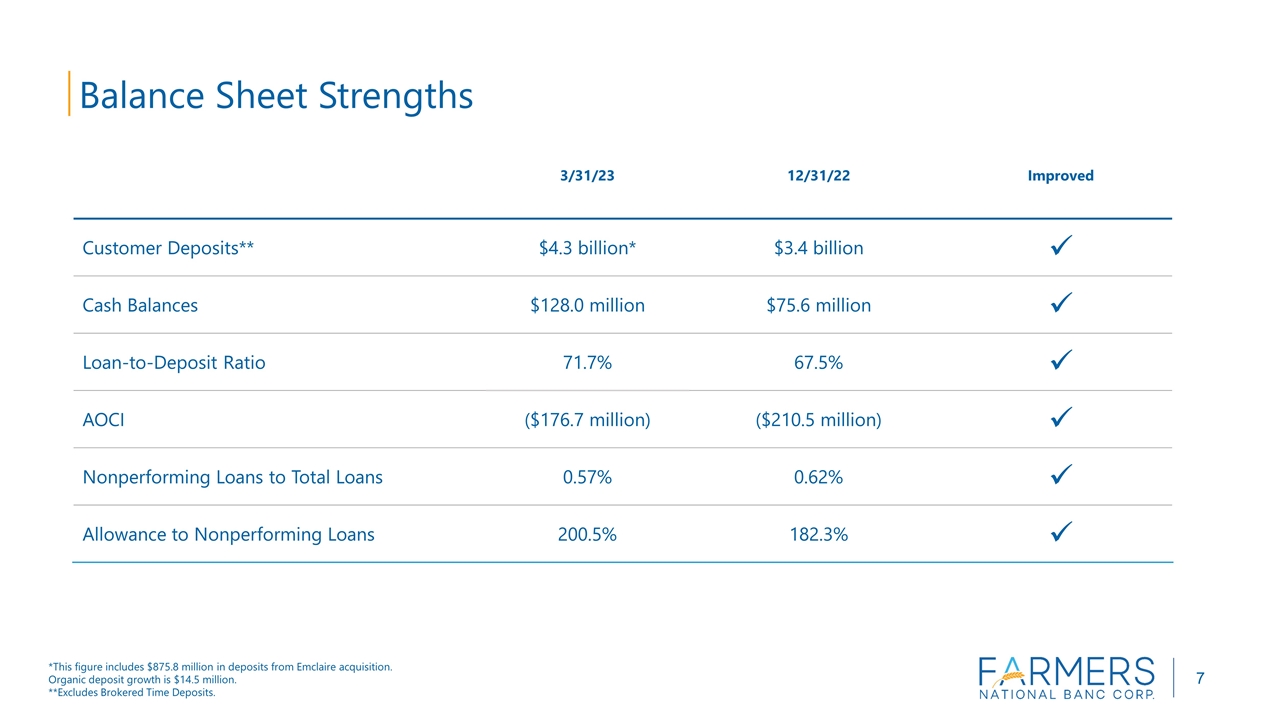
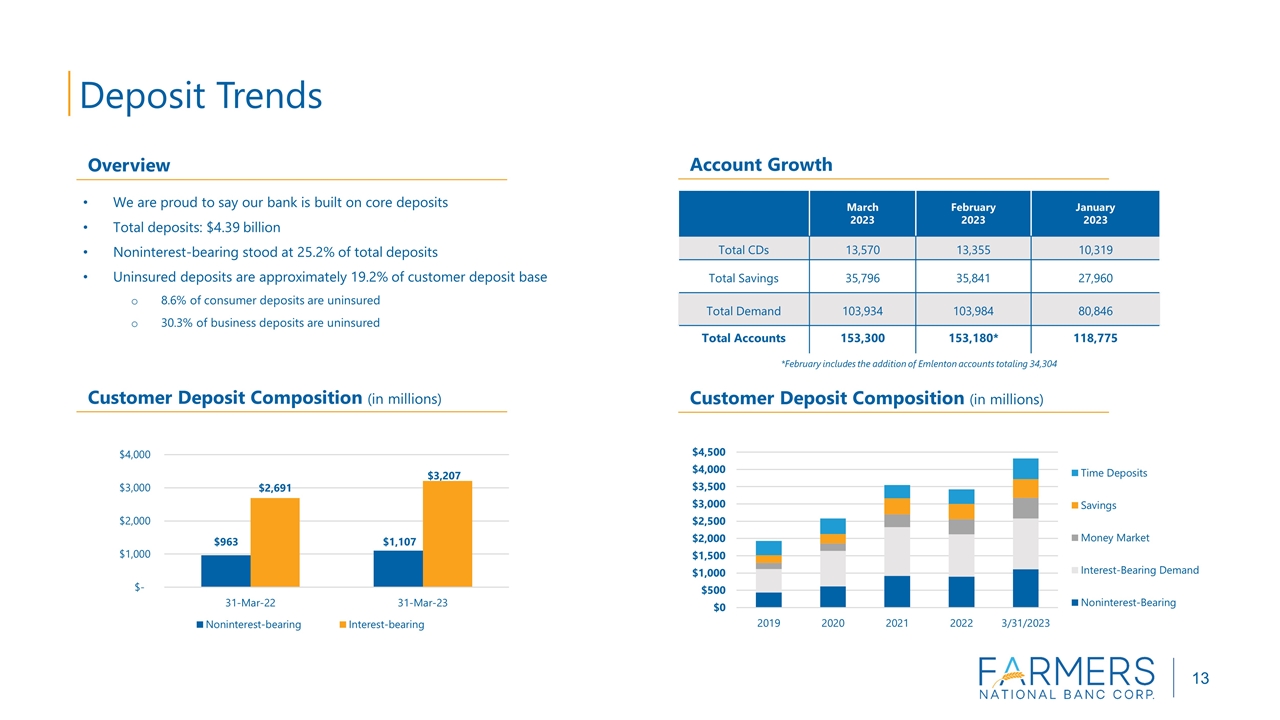
During the first quarter of 2023, total customer deposits (excluding brokered time deposits) increased to $4.31 billion from $3.42 billion at December 31, 2022. The increase was driven by the $875.8 million in deposits assumed in the acquisition of Emlenton along with $14.5 million in organic growth during the quarter. The Company continues to experience heightened competition from other banks, money market funds and the treasury market itself. In addition, it appears that some customers are utilizing deposit balances to counter the higher cost of living or running a business brought on by the higher inflationary environment. The Company expects competition for deposits to remain highly elevated for the foreseeable future which will continue to place pressure on funding costs.    

Total stockholders’ equity increased from $292.3 million at December 31, 2022 to $374.6 million at March 31, 2023. The increase was primarily driven by the acquisition of Emlenton along with a decrease in the loss from accumulated other comprehensive income offset by increased treasury stock activity. The Company repurchased 850,799 shares of its common stock during the quarter. The accumulated other comprehensive loss declined $33.8 million between December 31, 2022 and March 31, 2023 as rates on U.S. treasury securities declined during the first quarter of 2023 and pricing on available for sale securities improved. The Company’s tangible book value per share (non-GAAP) was $4.84 at March 31, 2023 compared to $5.60 at December 31, 2022.

Liquidity

With the turmoil that the banking industry experienced in the first quarter of 2023, the Company has continued to monitor its deposit base and balance sheet composition as well as its access to other sources of liquidity. The Company continues to run a modest loan to customer deposit ratio of approximately 73.1% and the Company’s average deposit balance per account is only $28,918. In addition, the Company’s ratio of uninsured deposits is approximately 19.2% which is low compared to the banking institutions that experienced difficulty in the first quarter.

The Company also has access to an additional $656.1 million of FHLB borrowing capacity at March 31, 2023 along with $539.9 million of available for sale securities that are not pledged. With a deep and diverse deposit base and access to a large amount of additional funding capacity, the Company is well positioned to handle any future liquidity stress.    

Credit Quality

During the first quarter of 2023, the Company recorded a provision for credit losses and unfunded commitments of $8.6 million. Of this figure, $7.7 million was due to the Emlenton acquisition. In connection with the acquisition, the Company recorded a provision for credit losses related to non-purchased credit deteriorated loans of $7.5 million along with a provision for unfunded commitments of $235,000. The Company also experienced net charge-offs of $271,000 during the first quarter of 2023. Net charge-offs as a percentage of average loans was 3 basis points for the quarter ended March 31, 2023.

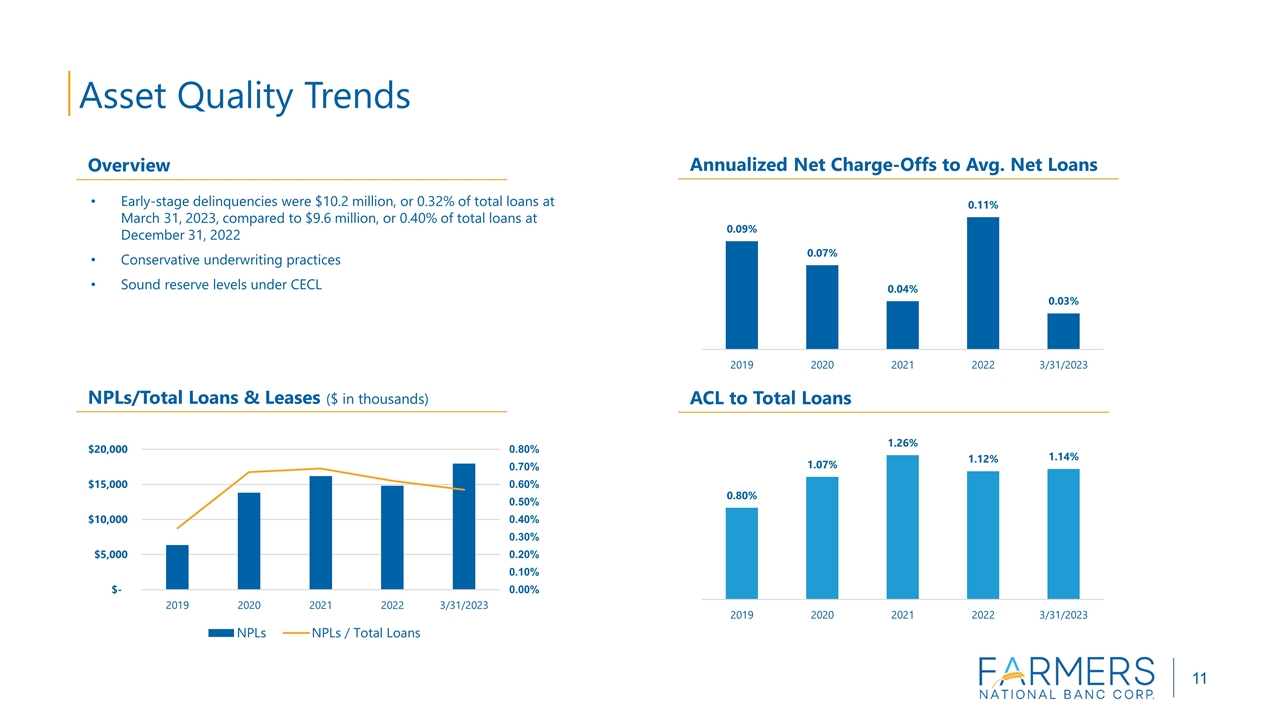
The allowance for credit losses to total loans increased to 1.14% at March 31, 2023 compared to 1.12% at December 31, 2022. The Company recorded $1.0 million in the allowance for credit losses for Emlenton’s purchase credit deteriorated loans.

Non-performing loans (NPLs) were $18.0 million at March 31, 2023 compared to $14.8 million at December 31, 2022. This increase was primarily due to the addition of Emlenton. The NPL to loans ratio was 0.57% at March 31, 2023 compared to 0.62% at December 31, 2022. Non-performing assets to assets was 0.35% at March 31, 2023, down slightly from 0.36% at December 31, 2022. Early stage delinquencies, defined as 30-89 days delinquent, were $10.2 million, or 0.32% at March 31, 2023, compared to $9.6 million, or 0.40% of total loans, at December 31, 2022.

Net Interest Income

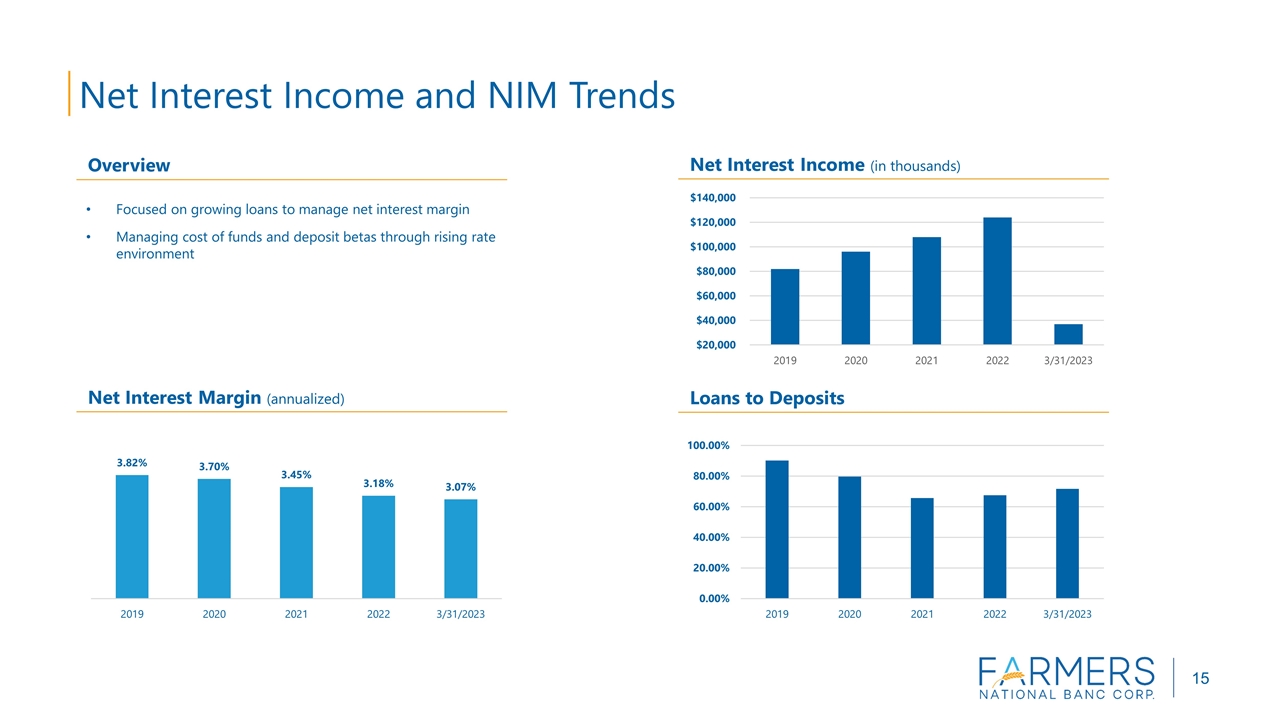
Net interest income totaled $36.6 million in the first quarter of 2023 compared to $31.2 million for the first quarter of 2022. A larger earning asset base due to the acquisition of Emlenton was the primary driver of this increase offset by a 20 basis point decline in the net interest margin. The net interest margin was 3.07% in the first quarter of 2023 compared to 2.99% in the fourth quarter of 2022 and 3.27% for the first quarter of 2022. The increase in net interest margin during the first quarter of 2023 compared to the prior quarter was due to the acquisition of Emlenton. The decline in net interest margin between the first quarter of 2023 and the first quarter of 2022 was due to increases in funding costs outstripping the increase in yields on earning assets. This increase in funding costs has been due to the rapid increase in deposit rates due to intense competition for deposits, the continued Federal Reserve rate hiking cycle and runoff of deposit balances which are being replaced by much costlier wholesale funding. Excluding the impact of acquisition marks and related accretion and PPP interest and fees, the net interest margin (non-GAAP) for the first quarter of 2023 was 2.86% compared to 2.97% for the fourth quarter of 2022 and 3.12% for the first quarter of 2022.


Noninterest Income

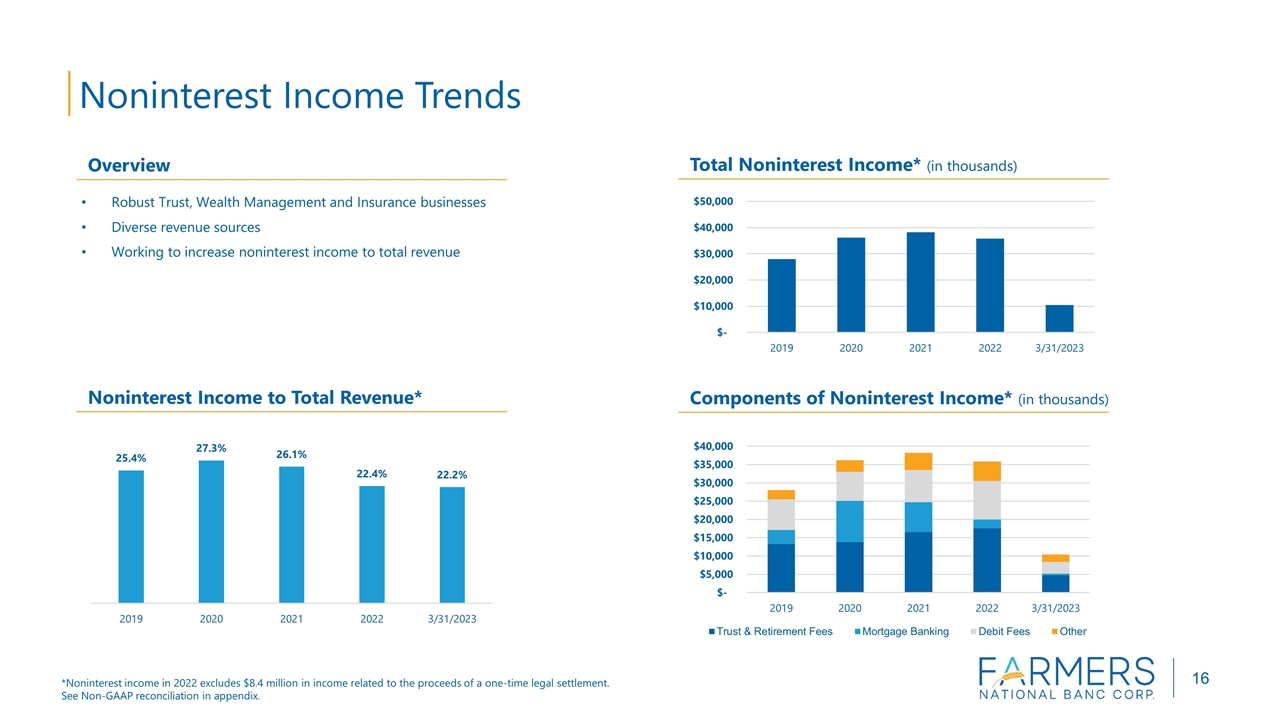
For the three months ended March 31, 2023, noninterest income totaled $10.4 million compared to $17.7 million for the first quarter of 2022. The primary reason for the decrease in 2023 was the recognition of $8.4 million in income in 2022 for a legal settlement. Several categories of noninterest income increased year over year due to growth including trust fees and insurance commissions while other categories grew due to growth and the acquisition of Emlenton. Categories that increased year over year due to both reasons included service charges on deposit accounts, bank owned life insurance income, debit card income and other noninterest income. Net gains on the sale of loans dropped from $1.1 million in the first quarter of 2022 to $310,000 for the first quarter of 2023. This drop was caused by lower mortgage production compared to the prior year due to the dramatic increase in interest rates in the last year. The Company also recognized $121,000 in gains on the sale of securities for the first three months of 2023 compared to a loss on the sale of securities of $11,000 for the first quarter of 2022.    

Noninterest Expense

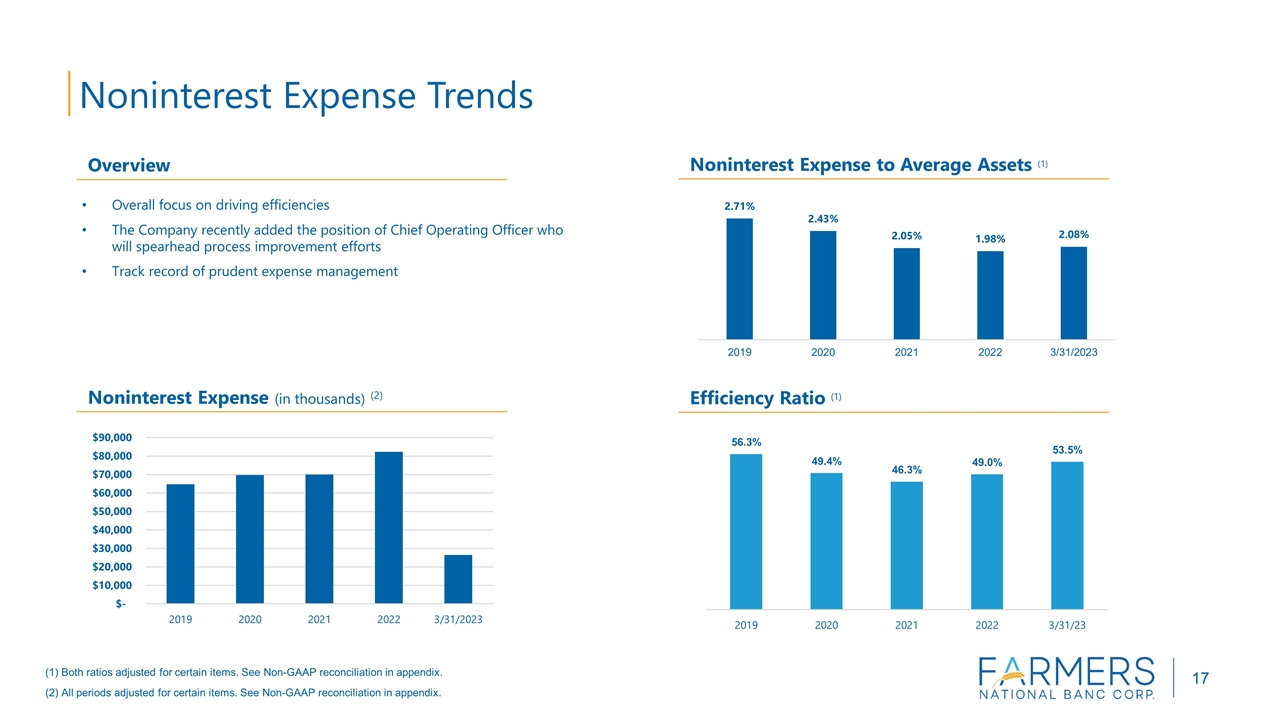
Noninterest expense increased from $30.5 million during the three months ended March 31, 2022, to $30.7 million for the same period in 2023. During the first quarter of 2022, the Company made a charitable contribution of $6.0 million to the Farmers Charitable Foundation and incurred $2.1 million in legal costs associated with the legal settlement discussed above. Excluding these two items in 2022, noninterest expense increased $8.3 million in the first quarter of 2023 compared to the first quarter of 2022.

Salaries and employee benefits increased $2.8 million to $14.7 million in the first quarter of 2023 compared to the same period in 2022. The acquisition of Emlenton along with normal raise activity was the primary reason for the increase. Occupancy and equipment, FDIC and state and local taxes, intangible amortization and core processing charges all saw increases year over year primarily as a result of the Emlenton acquisition. Merger related costs were $4.3 million in the first quarter of 2023 compared to $1.9 million in the first quarter of 2022. Professional fees were $2.0 million lower in the first quarter of 2023 compared to the first quarter of 2022 due to the legal costs discussed previously while other noninterest expense was down $5.3 million for the first three months of 2023 due primarily to the charitable contribution.

About Farmers National Banc Corp.

Founded in 1887, Farmers National Banc Corp. is a diversified financial services company headquartered in Canfield, Ohio, with $5.1 billion in banking assets. Farmers National Banc Corp.’s wholly-owned subsidiaries are comprised of The Farmers National Bank of Canfield, a full-service national bank engaged in commercial and retail banking with 65 banking locations in Mahoning, Trumbull, Columbiana, Portage, Stark, Wayne, Medina, Geauga and Cuyahoga Counties in Ohio and Beaver, Butler, Allegheny, Jefferson, Clarion, Venango, Clearfield, Mercer, Elk and Crawford Counties in Pennsylvania, and Farmers Trust Company, which operates five trust offices and offers services in the same geographic markets. Total wealth management assets under care at March 31, 2023 are $3.1 billion. Farmers National Insurance, LLC, a wholly-owned subsidiary of The Farmers National Bank of Canfield, offers a variety of insurance products.

Non-GAAP Disclosure

This press release includes disclosures of Farmers’ tangible common equity ratio, return on average tangible assets, return on average tangible equity, net income excluding costs related to acquisition activities and certain items, return on average assets excluding merger costs and certain items, return on average equity excluding merger costs and certain items, net interest margin excluding acquisition marks and related accretion and PPP interest and fees, efficiency ratio less one-time expenses, and allowance for credit losses to gross loans, excluding PPP loans and acquired loans, which are financial measures not prepared in accordance with generally accepted accounting principles in the United States (GAAP). A non-GAAP financial measure is a numerical measure of historical or future financial performance, financial position or cash flows that excludes or includes amounts that are required to be disclosed by GAAP. Farmers believes that these non-GAAP financial measures provide both management and investors a more complete understanding of the underlying operational results and trends and Farmers’ marketplace performance. The presentation of this additional information is not meant to be considered in isolation or as a substitute for the numbers prepared in accordance with GAAP. The reconciliations of non-GAAP financial measures to their GAAP equivalents are included in the tables following Consolidated Financial Highlights below.


Cautionary Statements Regarding Forward-Looking Statements

We make statements in this news release and our related investor conference call, and we may from time to time make other statements, that are forward-looking statements within the meaning of the Private Securities Litigation Reform Act of 1995, including statements about Farmers’ financial condition, results of operations, asset quality trends and profitability. Forward-looking statements are not historical facts but instead represent only management’s current expectations and forecasts regarding future events, many of which, by their nature, are inherently uncertain and outside of Farmers’ control. Forward-looking statements are preceded by terms such as “expects,” “believes,” “anticipates,” “intends” and similar expressions, as well as any statements related to future expectations of performance or conditional verbs, such as “will,” “would,” “should,” “could” or “may.” Farmers’ actual results and financial condition may differ, possibly materially, from the anticipated results and financial condition indicated in these forward-looking statements. Factors that could cause Farmers’ actual results to differ materially from those described in certain forward-looking statements include significant changes in near-term local, regional, and U.S. economic conditions including those resulting from continued high rates of inflation, tightening monetary policy of the Board of Governors of the Federal Reserve, and possibility of a recession; Farmers’ failure to integrate Emclaire and Emlenton with Farmers in accordance with expectations; deviations from performance expectations related to Emclaire and Emlenton; continuing impacts from the length and extent of the economic impacts of the COVID-19 pandemic; and the other factors contained in Farmers’ Annual Report on Form 10-K for the year ended December 31, 2022 and subsequent Quarterly Reports on Form 10-Q filed with the Securities and Exchange Commission (SEC) and available on Farmers’ website (www.farmersbankgroup.com) and on the SEC’s website (www.sec.gov). Forward-looking statements are not guarantees of future performance and should not be relied upon as representing management’s views as of any subsequent date. Farmers does not undertake any obligation to update the forward-looking statements to reflect the impact of circumstances or events that may arise after the date of the forward-looking statements.


Farmers National Banc Corp. and Subsidiaries

Consolidated Financial Highlights

(Amounts in thousands, except per share results) Unaudited


Consolidated Statements of Income    For the Three Months Ended  
     March 31,     Dec. 31,     Sept. 30,     June 30,     March 31,  
     2023     2022     2022     2022     2022  

Total interest income

   $ 51,233     $ 38,111     $ 36,410     $ 34,286     $ 33,279  

Total interest expense

     14,623       8,679       4,629       2,575       2,037  


Net interest income

     36,610       29,432       31,781       31,711       31,242  

Provision (credit) for credit losses

     8,599       416       448       616       (358

Noninterest income

     10,425       8,200       8,827       9,477       17,698  

Acquisition related costs

     4,313       584       872       674       1,940  

Other expense

     26,409       20,511       20,527       20,787       28,516  


Income before income taxes

     7,714       16,121       18,761       19,111       18,842  

Income taxes

     639       2,765       3,315       3,160       2,998  


Net income

   $ 7,075     $ 13,356     $ 15,446     $ 15,951     $ 15,844  


Average diluted shares outstanding

     37,933       33,962       33,932       33,923       33,937  

Basic earnings per share

     0.19       0.39       0.46       0.47       0.47  

Diluted earnings per share

     0.19       0.39       0.46       0.47       0.47  

Cash dividends per share

     0.17       0.17       0.16       0.16       0.16  

Performance Ratios


Net Interest Margin (Annualized)

     3.07     2.99     3.21     3.25     3.27

Efficiency Ratio (Tax equivalent basis)

     62.53     52.59     50.55     49.95     61.36

Return on Average Assets (Annualized)

     0.56     1.31     1.48     1.54     1.52

Return on Average Equity (Annualized)

     7.71     20.16     18.71     17.97     13.89

Dividends to Net Income

     90.50     43.10     35.06     33.95     34.18

Other Performance Ratios (Non-GAAP)


Return on Average Tangible Assets

     0.58     1.34     1.52     1.57     1.55

Return on Average Tangible Equity

     16.31     32.81     27.06     25.23     17.92

Consolidated Statements of Financial Condition    


     March 31,      Dec. 31,      Sept. 30,      June 30,      March 31,  
     2023      2022      2022      2022      2022  

Assets


Cash and cash equivalents

   $ 128,001      $ 75,551      $ 79,981      $ 65,458      $ 137,627  

Securities available for sale

     1,355,449        1,268,025        1,295,133        1,361,682        1,463,626  

Other investments

     39,670        33,444        34,399        34,451        34,019  

Loans held for sale

     1,703        858        2,142        2,714        1,904  

Loans

     3,152,339        2,404,750        2,399,981        2,374,485        2,304,971  

Less allowance for credit losses

     36,011        26,978        27,282        27,454        27,015  


Net Loans

     3,116,328        2,377,772        2,372,699        2,347,031        2,277,956  


Other assets

     468,735        326,550        335,668        303,028        290,723  


Total Assets

   $ 5,109,886      $ 4,082,200      $ 4,120,022      $ 4,114,364      $ 4,205,855  


Liabilities and Stockholders’ Equity


Deposits


Noninterest-bearing

   $ 1,106,870      $ 896,957      $ 934,638      $ 983,713      $ 963,143  

Interest-bearing

     3,207,121        2,526,760        2,590,054        2,586,829        2,690,668  

Brokered time deposits

     82,169        138,051        42,459        54,996        40,000  


Total deposits

     4,396,160        3,561,768        3,567,151        3,625,538        3,693,811  

Other interest-bearing liabilities

     292,324        183,211        243,098        137,985        87,872  

Other liabilities

     46,760        44,926        44,154        29,392        30,286  


Total liabilities

     4,735,244        3,789,905        3,854,403        3,792,915        3,811,969  

Stockholders’ Equity

     374,642        292,295        265,619        321,449        393,886  


Total Liabilities and Stockholders’ Equity

   $ 5,109,886      $ 4,082,200      $ 4,120,022      $ 4,114,364      $ 4,205,855  


Period-end shares outstanding

     37,439        34,055        34,060        34,032        34,008  

Book value per share

   $ 10.01      $ 8.58      $ 7.80      $ 9.45      $ 11.58  

Tangible book value per share (Non-GAAP)*

     4.84        5.60        4.79        6.46        8.58  


*

Tangible book value per share is calculated by dividing tangible common equity by outstanding shares    


Capital and Liquidity


Common Equity Tier 1 Capital Ratio (a)

     10.19     13.71     13.36     13.30     13.31

Total Risk Based Capital Ratio (a)

     13.80     17.79     17.44     17.46     17.59

Tier 1 Risk Based Capital Ratio (a)

     10.70     14.32     13.97     13.92     13.95

Tier 1 Leverage Ratio (a)

     7.38     9.84     10.24     9.56     9.56

Equity to Asset Ratio

     7.33     7.16     6.45     7.81     9.37

Tangible Common Equity Ratio (b)

     3.69     4.79     4.06     5.47     7.11

Net Loans to Assets

     60.99     58.25     57.59     57.04     54.16

Loans to Deposits

     71.71     67.52     67.28     65.49     62.40

Asset Quality


Non-performing loans

   $ 17,959     $ 14,803     $ 12,976     $ 14,107     $ 14,046  

Non-performing assets

     18,053       14,876       13,042       14,107       14,046  

Loans 30 - 89 days delinquent

     10,219       9,605       6,659       8,716       7,304  

Charged-off loans

     469       754       783       177       1,590  

Recoveries

     198       184       178       135       149  

Net Charge-offs

     271       570       605       42       1,441  

Annualized Net Charge-offs to Average Net Loans

     0.03     0.10     0.10     0.01     0.25

Allowance for Credit Losses to Total Loans

     1.14     1.12     1.14     1.16     1.17

Non-performing Loans to Total Loans

     0.57     0.62     0.54     0.59     0.61

Allowance to Non-performing Loans

     200.52     182.25     210.25     194.61     192.33

Non-performing Assets to Total Assets

     0.35     0.36     0.32     0.34     0.33


(a)

March 31, 2023 ratio is estimated

(b)

This is a non-GAAP financial measure. A reconciliation to GAAP is shown below


     For the Three Months Ended  
     March 31,      Dec. 31,      Sept. 30,      June 30,      March 31,  
End of Period Loan Balances    2023      2022      2022      2022      2022  

Commercial real estate

   $ 1,286,830      $ 1,028,050      $ 1,028,484      $ 1,040,243      $ 1,000,972  

Commercial

     361,845        293,643        296,932        285,981        298,903  

Residential real estate

     853,074        475,791        474,014        464,489        455,501  

HELOC

     137,319        132,179        132,267        129,392        128,221  

Consumer

     260,596        221,260        222,706        218,219        192,586  

Agricultural loans

     244,938        246,937        239,081        230,477        224,845  


Total, excluding net deferred loan costs

   $ 3,144,602      $ 2,397,860      $ 2,393,484      $ 2,368,801      $ 2,301,028  


     For the Three Months Ended  
     March 31,      Dec. 31,      Sept. 30,      June 30,      March 31,  
End of Period Customer Deposit Balances    2023      2022      2022      2022      2022  

Noninterest-bearing demand

   $ 1,106,870      $ 896,957      $ 934,638      $ 983,713      $ 963,143  

Interest-bearing demand

     1,473,001        1,224,884        1,399,227        1,416,129        1,476,092  

Money market

     599,037        435,369        393,005        372,723        389,375  

Savings

     535,321        441,978        460,709        455,555        455,353  

Certificate of deposit

     599,762        424,529        337,113        342,422        369,848  


Total customer deposits

   $ 4,313,991      $ 3,423,717      $ 3,524,692      $ 3,570,542      $ 3,653,811  


     For the Three Months Ended  
     March 31,      Dec. 31,     Sept. 30,     June 30,     March 31,  
Noninterest Income    2023      2022     2022     2022     2022  

Service charges on deposit accounts

   $ 1,432      $ 1,203     $ 1,229     $ 1,139     $ 1,145  

Bank owned life insurance income, including death benefits

     547        590       406       405       409  

Trust fees

     2,587        2,373       2,370       2,376       2,519  

Insurance agency commissions

     1,456        1,133       1,136       1,086       1,047  

Security gains (losses), including fair value changes for equity securities

     121        (366     (17     (60     (11

Retirement plan consulting fees

     307        337       332       323       397  

Investment commissions

     393        508       424       557       694  

Net gains on sale of loans

     310        242       326       365       1,129  

Other mortgage banking fee income (loss), net

     153        98       94       39       60  

Debit card and EFT fees

     1,789        1,407       1,463       1,528       1,416  

Other noninterest income

     1,330        675       1,064       1,719       8,893  


Total Noninterest Income

   $ 10,425      $ 8,200     $ 8,827     $ 9,477     $ 17,698  


     For the Three Months Ended  
     March 31,      Dec. 31,      Sept. 30,      June 30,      March 31,  
Noninterest Expense    2023      2022      2022      2022      2022  

Salaries and employee benefits

   $ 14,645      $ 11,385      $ 10,724      $ 11,073      $ 11,831  

Occupancy and equipment

     3,869        2,753        3,028        2,918        2,680  

FDIC insurance and state and local taxes

     1,222        1,010        1,017        979        945  

Professional fees

     1,114        938        985        1,056        3,135  

Merger related costs

     4,313        584        872        674        1,940  

Advertising

     409        472        596        487        392  

Intangible amortization

     909        702        432        419        420  

Core processing charges

     1,164        742        738        1,123        745  

Other noninterest expenses

     3,077        2,509        3,007        2,732        8,368  


Total Noninterest Expense

   $ 30,722      $ 21,095      $ 21,399      $ 21,461      $ 30,456  


Business Combination  

Consideration


Cash

   $ 33,440  

Stock

     59,202  


Fair value of total consideration transferred

   $ 92,642  


Fair value of assets acquired


Cash and cash equivalents

   $ 20,265  

Securities available for sale

     126,970  

Other investments

     7,795  

Loans, net

     740,659  

Premises and equipment

     16,103  

Bank owned life insurance

     22,485  

Core deposit intangible

     19,249  

Current and deferred taxes

     17,246  

Other assets

     6,387  


Total assets acquired

     977,159  

Fair value of liabilities assumed


Deposits

     875,813  

Short-term borrowings

     75,000  

Accrued interest payable and other liabilities

     7,104  


Total liabilities

     957,917  


Net assets acquired

   $ 19,242  

Goodwill created

     73,400  


Total net assets acquired

   $ 92,642  


Average Balance Sheets and Related Yields and Rates

(Dollar Amounts in Thousands)


     Three Months Ended     Three Months Ended  
     March 31, 2023     March 31, 2022  
     AVERAGE             YIELD/     AVERAGE             YIELD/  
     BALANCE      INTEREST (1)      RATE (1)     BALANCE      INTEREST (1)      RATE (1)  

EARNING ASSETS


Loans (2)

   $ 3,136,494      $ 40,942        5.22   $ 2,312,712      $ 25,646        4.44

Taxable securities

     1,171,596        6,550        2.24       1,007,963        4,587        1.82  

Tax-exempt securities (2)

     438,614        3,519        3.21       461,793        3,726        3.23  

Other investments

     36,564        376        4.11       31,122        130        1.67  

Federal funds sold and other

     82,995        610        2.94       117,916        48        0.16  


Total earning assets

     4,866,263        51,997        4.27       3,931,506        34,137        3.47  

Nonearning assets

     218,746             247,112        


Total assets

   $ 5,085,009           $ 4,178,618        


INTEREST-BEARING LIABILITIES


Time deposits

   $ 590,412      $ 3,339        2.26   $ 378,675      $ 643        0.68

Brokered time deposits

     231,040        2,321        4.02       15,555        15        0.39  

Savings deposits

     1,153,588        1,954        0.68       843,371        167        0.08  

Demand deposits - interest bearing

     1,417,955        5,093        1.44       1,412,291        418        0.12  

Short term borrowings

     80,589        921        4.57       2,222        1        0.18  

Long term borrowings

     88,269        995        4.51       87,798        793        3.61  


Total interest-bearing liabilities

   $ 3,561,853        14,623        1.64     $ 2,739,912        2,037        0.30  


NONINTEREST-BEARING LIABILITIES


AND STOCKHOLDERS’ EQUITY


Demand deposits - noninterest bearing

     1,107,422             956,499        

Other liabilities

     48,883             26,001        

Stockholders’ equity

     366,851             456,206        


TOTAL LIABILITIES AND


STOCKHOLDERS’ EQUITY

   $ 5,085,009           $ 4,178,618        


Net interest income and interest rate spread

      $ 37,374        2.63      $ 32,100        3.17


Net interest margin

           3.07           3.27


(1)

Interest and yields are calculated on a tax-equivalent basis where applicable.

(2)

For 2023, adjustments of $86 thousand and $678 thousand, respectively, were made to tax equate income on tax exempt loans and tax exempt securities. For 2022, adjustments of $84 thousand and $774 thousand, respectively, were made to tax equate income on tax exempt loans and tax exempt securities. These adjustments were based on a marginal federal income tax rate of 21%, less disallowances.


Reconciliation of Total Assets to Tangible Assets    


     For the Three Months Ended  
     March 31,      Dec. 31,      Sept. 30,      June 30,      March 31,  
     2023      2022      2022      2022      2022  

Total Assets

   $ 5,109,886      $ 4,082,200      $ 4,120,022      $ 4,114,364      $ 4,205,855  

Less Goodwill and other intangibles

     193,273        101,666        102,368        101,767        102,187  


Tangible Assets

   $ 4,916,613      $ 3,980,534      $ 4,017,654      $ 4,012,597      $ 4,103,668  


Average Assets

     5,085,009        4,080,497        4,164,855        4,155,719        4,178,618  

Less average Goodwill and other intangibles

     193,368        102,126        101,981        102,042        102,462  


Average Tangible Assets

   $ 4,891,641      $ 3,978,371      $ 4,062,874      $ 4,053,677      $ 4,076,156  


Reconciliation of Common Stockholders’ Equity to Tangible Common Equity    


     For the Three Months Ended  
     March 31,      Dec. 31,      Sept. 30,      June 30,      March 31,  
     2023      2022      2022      2022      2022  

Stockholders’ Equity

   $ 374,642      $ 292,295      $ 265,619      $ 321,449      $ 393,886  

Less Goodwill and other intangibles

     193,273        101,666        102,368        101,767        102,187  


Tangible Common Equity

   $ 181,369      $ 190,629      $ 163,251      $ 219,682      $ 291,699  


Average Stockholders’ Equity

     366,851        264,939        330,300        354,981        456,206  

Less average Goodwill and other intangibles

     193,368        102,126        101,981        102,042        102,462  


Average Tangible Common Equity

   $ 173,483      $ 162,813      $ 228,319      $ 252,939      $ 353,744  


Reconciliation of Net Income, Less Merger and Certain Items    


     For the Three Months Ended  
     March 31,     Dec. 31,     Sept. 30,     June 30,     March 31,  
     2023     2022     2022     2022     2022  

Net income

   $ 7,075     $ 13,356     $ 15,446     $ 15,951     $ 15,844  

Acquisition related costs - after tax

     3,449       475       711       564       1,540  

Acquisition related provision - after tax

     6,077       0       0       0       0  

Lawsuit settlement income - after tax

     0       0       0       0       (6,616

Lawsuit settlement contingent legal expense - after tax

     0       0       0       0       1,639  

Charitable donation - after tax

     0       0       0       0       4,740  

Net loss (gain) on asset/security sales - after tax

     (72     268       4       (25     97  


Net income - Adjusted

   $ 16,529     $ 14,099     $ 16,161     $ 16,490     $ 17,244  


Diluted EPS excluding merger and one-time items

   $ 0.44     $ 0.42     $ 0.48     $ 0.49     $ 0.51  


Return on Average Assets excluding merger and certain items (Annualized)

     1.30     1.36     1.55     1.59     1.65

Return on Average Equity excluding merger and certain items (Annualized)

     18.02     21.29     19.57     18.58     15.12

Return on Average Tangible Equity excluding acquisition costs and certain items (Annualized)

     38.11     34.64     28.31     26.08     19.50


Efficiency ratio excluding certain items    


     For the Three Months Ended  
     March 31,     Dec. 31,     Sept. 30,     June 30,     March 31,  
     2023     2022     2022     2022     2022  

Net interest income, tax equated

   $ 37,374     $ 30,212     $ 32,636     $ 32,583     $ 32,100  

Noninterest income

     10,425       8,200       8,827       9,477       17,698  

Legal settlement income

     0       0       0       0       (8,375

Net loss (gain) on asset/security sales

     (91     338       6       (32     123  

Net interest income and noninterest income adjusted

     47,708       38,750       41,469       42,028       41,546  

Noninterest expense less intangible amortization

     29,813       20,393       20,967       21,042       30,036  

Charitable donation

     0       0       0       0       6,000  

Contingent legal settlement expense

     0       0       0       0       2,075  

Acquisition related costs

     4,313       584       872       674       1,940  


Noninterest expense adjusted

     25,500       19,809       20,095       20,368       20,021  


Efficiency ratio excluding one-time items

     53.45     51.12     48.46     48.46     48.19


Net interest margin excluding acquisition marks and PPP interest and fees    


     For the Three Months Ended  
     March 31,     Dec. 31,     Sept. 30,     June 30,     March 31,  
     2023     2022     2022     2022     2022  

Net interest income, tax equated

   $ 37,374     $ 30,212     $ 32,636     $ 32,583     $ 32,100  

Acquisition marks

     2,597       174       215       349       926  

PPP interest and fees

     0       10       62       634       686  


Adjusted and annualized net interest income

     139,108       120,112       129,436       126,400       121,828  


Average earning assets

     4,866,263       4,047,343       4,065,085       4,015,385       3,931,506  


Less PPP average balances

     310       485       1,586       16,019       30,003  


Adjusted average earning assets

     4,865,953       4,046,858       4,063,499       3,999,366       3,901,503  


Net interest margin excluding marks and PPP interest and fees

     2.86     2.97     3.19     3.16     3.12


Slide 1

NASDAQ: FMNB Q1 2023 EARNINGS Exhibit 99.2

Slide 2

Disclosure Statement Forward-Looking Statements​ This presentation contains forward-looking statements within the meaning of the Private Securities Litigation Reform Act of 1995, including statements about the financial condition, results of operations, asset quality trends and profitability of Farmers National Banc Corp. (“Farmers”). Forward-looking statements are not historical facts but instead express only management’s current expectations and forecasts of future events or long-term-goals, many of which, by their nature, are inherently uncertain and outside of Farmers’ control. Forward-looking statements are preceded by terms such as “expects,” “believes,” “anticipates,” “intends” and similar expressions, as well as any statements related to future expectations of performance or conditional verbs, such as “will,” “would,” “should,” “could” or “may.” Farmers’ actual results and financial condition may differ, possibly materially, from those indicated in these forward-looking statements. Factors that could cause Farmers’ actual results to differ materially from those described in the forward-looking statements include significant changes in near-term local, regional, and U.S. economic conditions including those resulting from continued high rates of inflation, tightening monetary policy of the Board of Governors of the Federal Reserve, and possibility of a recession; Farmers’ failure to integrate Emclaire and Emlenton with Farmers in accordance with expectations; deviations from performance expectations related to Emclaire and Emlenton; continuing impacts from the length and extent of the economic impacts of the COVID-19 pandemic; and the other factors contained in Farmers’ periodic reports and registration statements filed with the Securities and Exchange Commission, including its Annual Report on Form 10-K for the year ended December 31, 2022, and Quarterly Report on Form 10-Q, which have been filed with the Securities and Exchange Commission and are available on Farmers’ website (www.farmersbankgroup.com) and on the Securities and Exchange Commission’s website (www.sec.gov). Forward-looking statements are not guarantees of future performance and should not be relied upon as representing management’s views as of any subsequent date. Farmers undertakes no obligation to update forward-looking statements, whether as a result of new information, future events or otherwise. ​ ​ Use of Non-GAAP Financial Measures ​ This presentation contains certain financial information determined by methods other than in accordance with accounting principles generally accepted in the United States (“GAAP”). These non-GAAP financial measures include “Core Deposits” and “Tangible Common Equity ratio.” Farmers believes that these non-GAAP financial measures provide both management and investors a more complete understanding of Farmers’ deposit profile and capital. These non-GAAP financial measures are supplemental and are not a substitute for any analysis based on GAAP financial measures. Because not all companies use the same calculation of “Core Deposits” and “Tangible Common Equity ratio,” this presentation may not be comparable to other similarly titled measures as calculated by other companies. 2

Slide 3

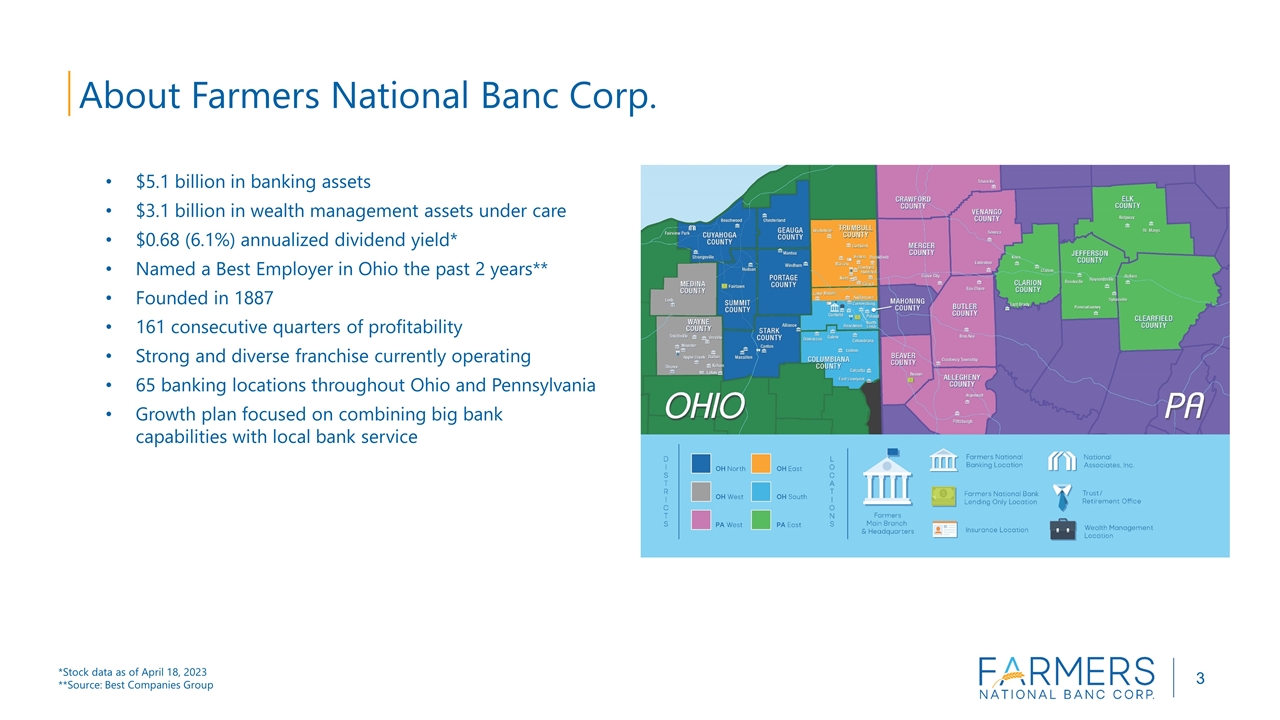
$5.1 billion in banking assets $3.1 billion in wealth management assets under care $0.68 (6.1%) annualized dividend yield* Named a Best Employer in Ohio the past 2 years** Founded in 1887 161 consecutive quarters of profitability Strong and diverse franchise currently operating 65 banking locations throughout Ohio and Pennsylvania Growth plan focused on combining big bank capabilities with local bank service *Stock data as of April 18, 2023 **Source: Best Companies Group About Farmers National Banc Corp. 3

Slide 4

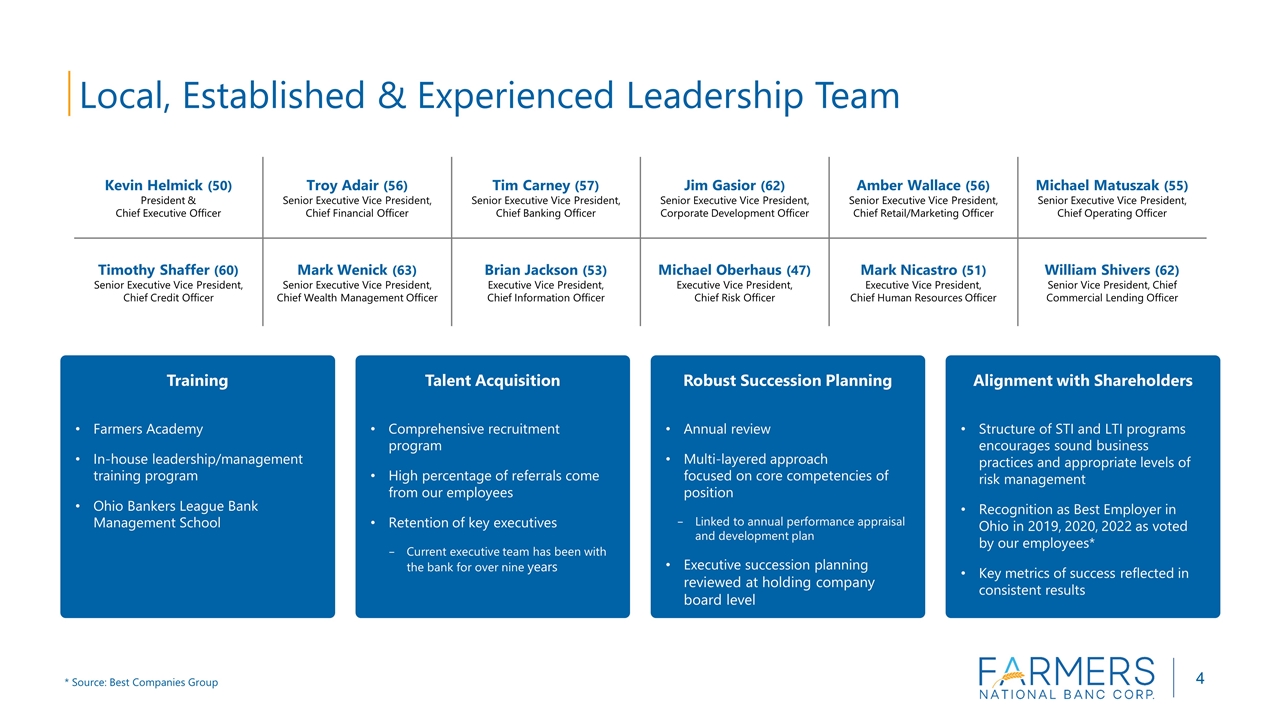
Kevin Helmick (50) President & Chief Executive Officer Troy Adair (56) Senior Executive Vice President, Chief Financial Officer Tim Carney (57) Senior Executive Vice President, Chief Banking Officer Jim Gasior (62) Senior Executive Vice President, Corporate Development Officer Amber Wallace (56) Senior Executive Vice President, Chief Retail/Marketing Officer Michael Matuszak (55) Senior Executive Vice President, Chief Operating Officer Timothy Shaffer (60) Senior Executive Vice President, Chief Credit Officer Mark Wenick (63) Senior Executive Vice President, Chief Wealth Management Officer Brian Jackson (53) Executive Vice President, Chief Information Officer Michael Oberhaus (47) Executive Vice President, Chief Risk Officer Mark Nicastro (51) Executive Vice President, Chief Human Resources Officer William Shivers (62) Senior Vice President, Chief Commercial Lending Officer Training Farmers Academy In-house leadership/management training program Ohio Bankers League Bank Management School Talent Acquisition Comprehensive recruitment program High percentage of referrals come from our employees Retention of key executives Current executive team has been with the bank for over nine years Robust Succession Planning Annual review Multi-layered approach focused on core competencies of position Linked to annual performance appraisal and development plan Executive succession planning reviewed at holding company board level Alignment with Shareholders Structure of STI and LTI programs encourages sound business practices and appropriate levels of risk management Recognition as Best Employer in Ohio in 2019, 2020, 2022 as voted by our employees* Key metrics of success reflected in consistent results * Source: Best Companies Group 4 Local, Established & Experienced Leadership Team


Slide 5

Leverage technology Drive efficiencies through Six Sigma operating framework Strive to be customer centric and provide exceptional experiences Assure Farmers is the best place to work Continued pursuit of organic and M&A opportunities Strive for performance metrics in top quartile ranking vs. peer group Focus on growing noninterest income Proactive capital management Maintain financial strength Prudent risk management and focus on asset quality Leveraging our History with Modern Banking Technologies to Support our Future Drive Financial Excellence 5 Farmers Strategic Vision Invest in our Franchise

Slide 6

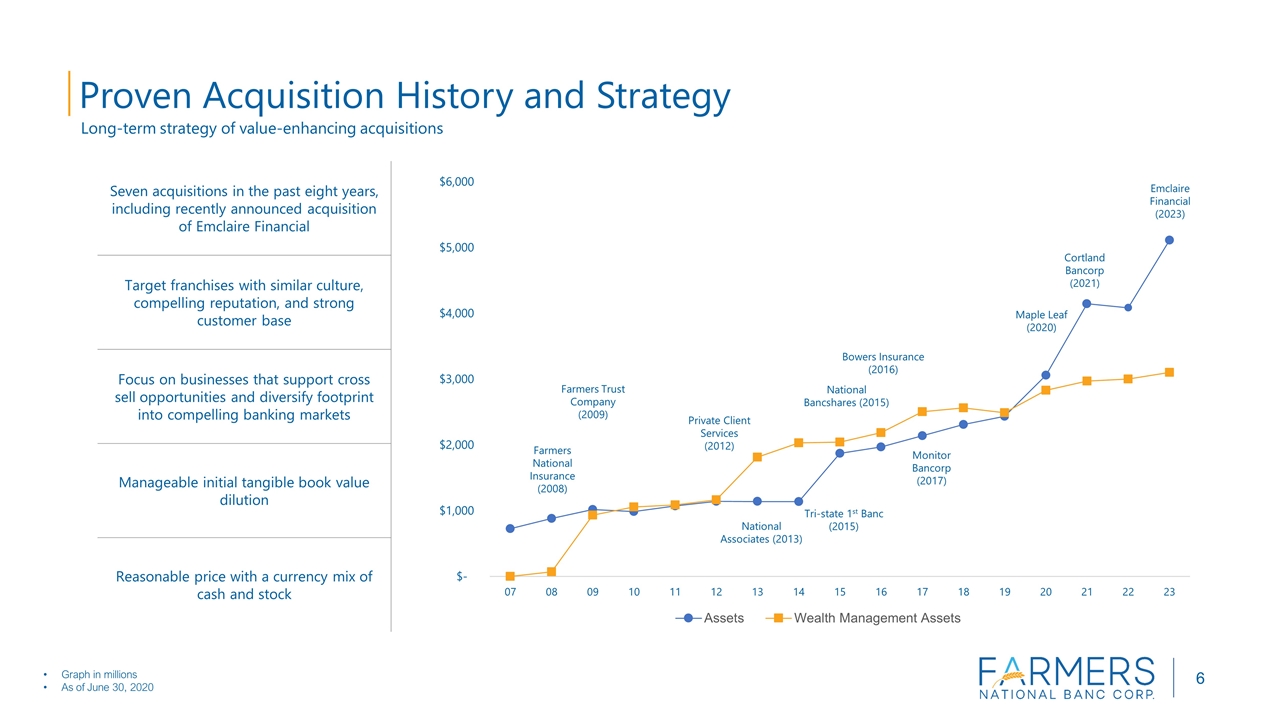
Graph in millions As of June 30, 2020 Farmers Trust Company (2009) Farmers National Insurance (2008) Private Client Services (2012) National Associates (2013) National Bancshares (2015) Bowers Insurance (2016) Tri-state 1st Banc (2015) Monitor Bancorp (2017) Maple Leaf (2020) Cortland Bancorp (2021) Seven acquisitions in the past eight years, including recently announced acquisition of Emclaire Financial Target franchises with similar culture, compelling reputation, and strong customer base Focus on businesses that support cross sell opportunities and diversify footprint into compelling banking markets Manageable initial tangible book value dilution Reasonable price with a currency mix of cash and stock Emclaire Financial (2023) 6 Proven Acquisition History and Strategy Long-term strategy of value-enhancing acquisitions

Slide 7

(1) (1) 3/31/23 12/31/22 Improved Customer Deposits** $4.3 billion* $3.4 billion ü Cash Balances $128.0 million $75.6 million ü Loan-to-Deposit Ratio 71.7% 67.5% ü AOCI ($176.7 million) ($210.5 million) ü Nonperforming Loans to Total Loans 0.57% 0.62% ü Allowance to Nonperforming Loans 200.5% 182.3% ü *This figure includes $875.8 million in deposits from Emclaire acquisition. Organic deposit growth is $14.5 million. **Excludes Brokered Time Deposits. 7 Balance Sheet Strengths

Slide 8

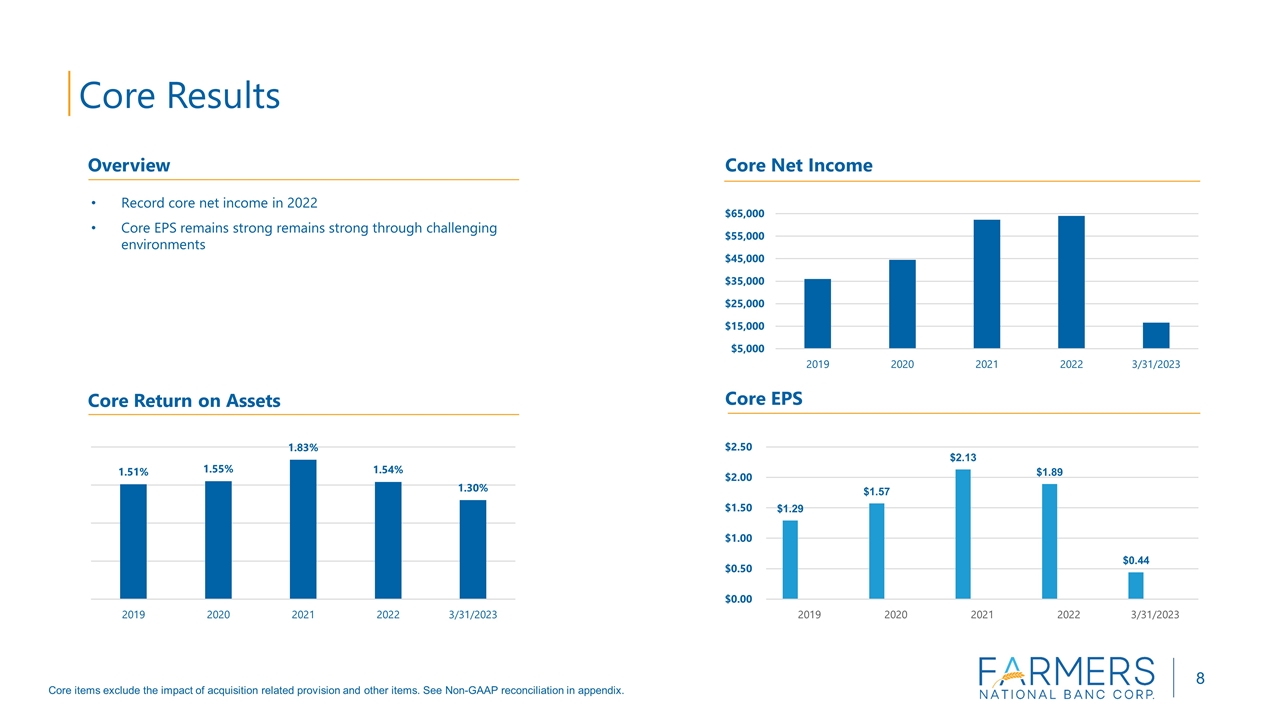
Record core net income in 2022 Core EPS remains strong remains strong through challenging environments Core items exclude the impact of acquisition related provision and other items. See Non-GAAP reconciliation in appendix. Core Results 8 Overview Core Net Income Core Return on Assets Core EPS

Slide 9

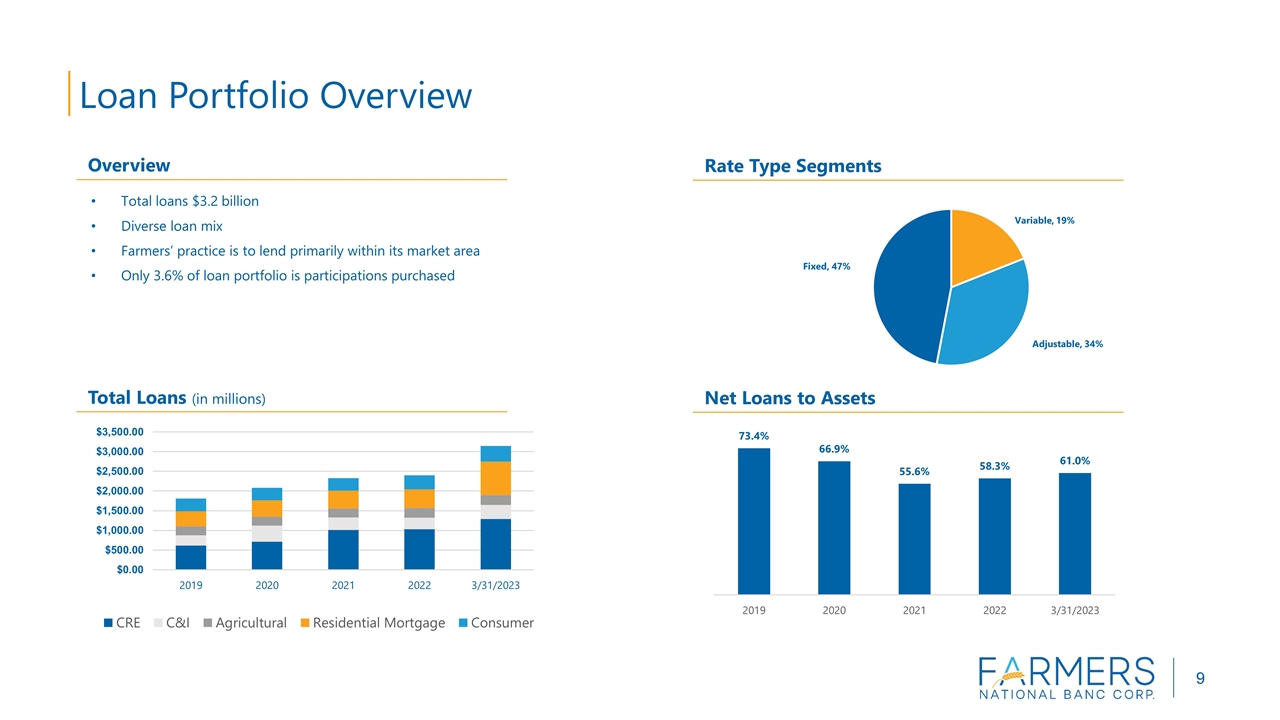
Total loans $3.2 billion Diverse loan mix Farmers’ practice is to lend primarily within its market area Only 3.6% of loan portfolio is participations purchased Loan Portfolio Overview Overview Rate Type Segments Net Loans to Assets Total Loans (in millions) 9

Slide 10

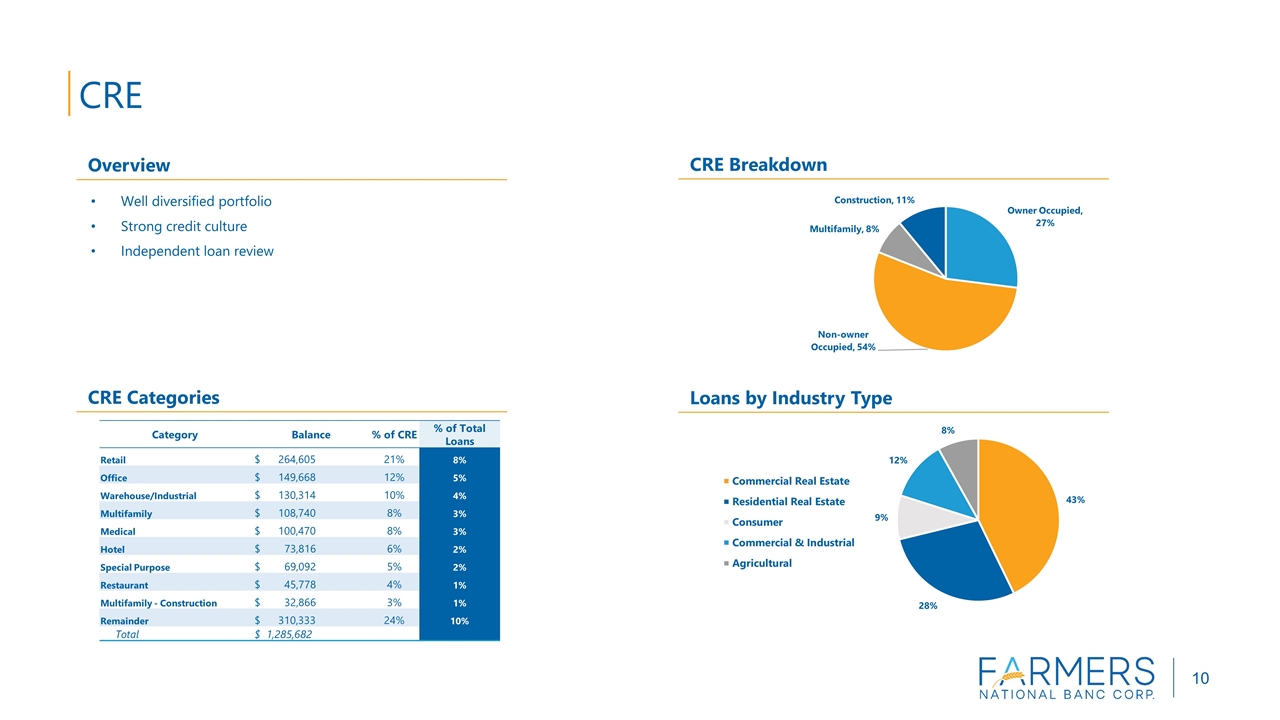
Category Balance % of CRE % of Total Loans Retail $ 264,605 21% 8% Office $ 149,668 12% 5% Warehouse/Industrial $ 130,314 10% 4% Multifamily $ 108,740 8% 3% Medical $ 100,470 8% 3% Hotel $ 73,816 6% 2% Special Purpose $ 69,092 5% 2% Restaurant $ 45,778 4% 1% Multifamily - Construction $ 32,866 3% 1% Remainder $ 310,333 24% 10% Total $ 1,285,682 Well diversified portfolio Strong credit culture Independent loan review CRE Breakdown Overview CRE 10 CRE Categories Loans by Industry Type

Slide 11

Early-stage delinquencies were $10.2 million, or 0.32% of total loans at March 31, 2023, compared to $9.6 million, or 0.40% of total loans at December 31, 2022 Conservative underwriting practices Sound reserve levels under CECL Asset Quality Trends Annualized Net Charge-Offs to Avg. Net Loans Overview NPLs/Total Loans & Leases ($ in thousands) ACL to Total Loans 11

Slide 12

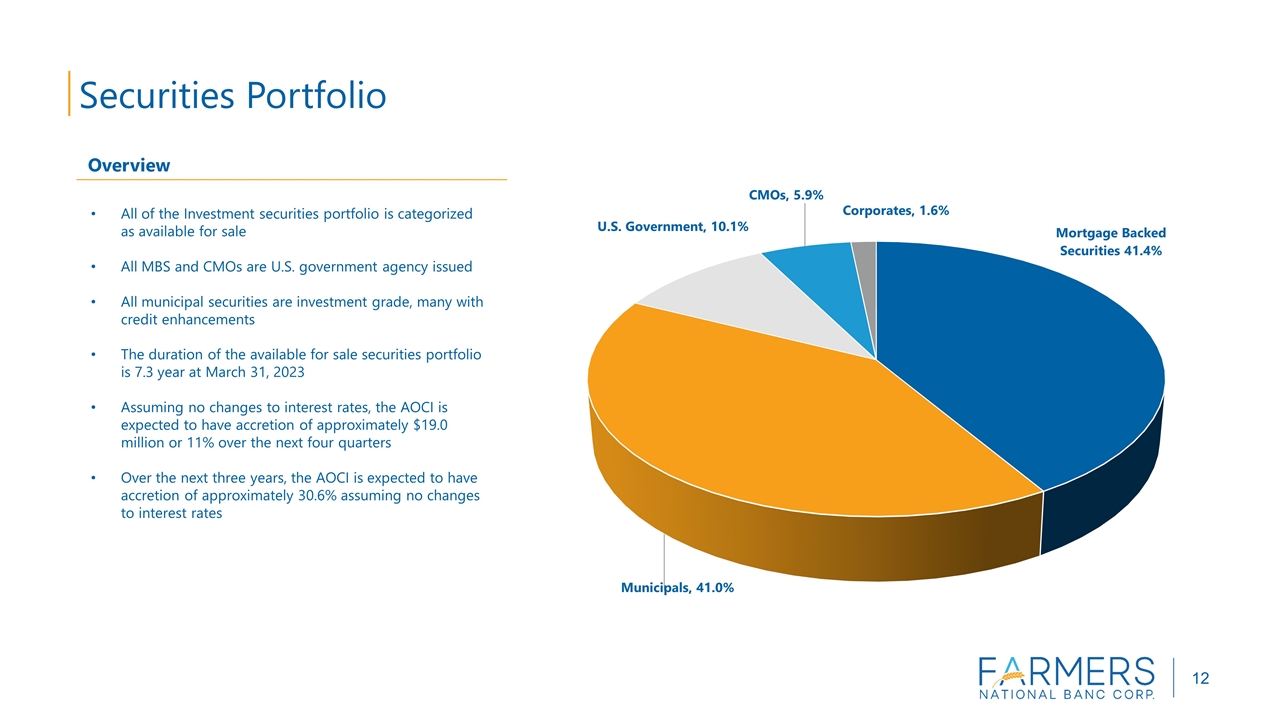
All of the Investment securities portfolio is categorized as available for sale All MBS and CMOs are U.S. government agency issued All municipal securities are investment grade, many with credit enhancements The duration of the available for sale securities portfolio is 7.3 year at March 31, 2023 Assuming no changes to interest rates, the AOCI is expected to have accretion of approximately $19.0 million or 11% over the next four quarters Over the next three years, the AOCI is expected to have accretion of approximately 30.6% assuming no changes to interest rates 12 Securities Portfolio Overview

Slide 13

We are proud to say our bank is built on core deposits Total deposits: $4.39 billion Noninterest-bearing stood at 25.2% of total deposits Uninsured deposits are approximately 19.2% of customer deposit base 8.6% of consumer deposits are uninsured 30.3% of business deposits are uninsured March 2023 February 2023 January 2023 Total CDs 13,570 13,355 10,319 Total Savings 35,796 35,841 27,960 Total Demand 103,934 103,984 80,846 Total Accounts 153,300 153,180* 118,775 *February includes the addition of Emlenton accounts totaling 34,304 Account Growth Overview Customer Deposit Composition (in millions) Customer Deposit Composition (in millions) 13 Deposit Trends

Slide 14

Farmers National Bank has the following sources of liquidity as of March 31, 2023: $118.0 million of cash and equivalents $656.1 million of additional borrowing capacity at the FHLB $35.0 million of unsecured lines of credit with a zero balance $138.5 million of investment securities that could be sold at no loss or a gain $539.9 million of available for sale securities that are not pledged Brokered CDs Securities roll-off of approximately $68.4 million in next 12 months Farmers National Banc Corp. has the following sources of liquidity at the holding company as of March 31, 2023: $51.4 million of cash and equivalents $6.5 million in unsecured lines of credit with a zero balance  14 Liquidity Available liquidity is approximately 163% of uninsured deposits.

Slide 15

Focused on growing loans to manage net interest margin Managing cost of funds and deposit betas through rising rate environment Net Interest Income (in thousands) Overview Net Interest Margin (annualized) Loans to Deposits 15 Net Interest Income and NIM Trends

Slide 16

Robust Trust, Wealth Management and Insurance businesses Diverse revenue sources Working to increase noninterest income to total revenue *Noninterest income in 2022 excludes $8.4 million in income related to the proceeds of a one-time legal settlement. See Non-GAAP reconciliation in appendix. Total Noninterest Income* (in thousands) Overview Noninterest Income to Total Revenue* Components of Noninterest Income* (in thousands) 16 Noninterest Income Trends

Slide 17

Overall focus on driving efficiencies The Company recently added the position of Chief Operating Officer who will spearhead process improvement efforts Track record of prudent expense management (1) Both ratios adjusted for certain items. See Non-GAAP reconciliation in appendix. 1) (2) All periods adjusted for certain items. See Non-GAAP reconciliation in appendix. Noninterest Expense to Average Assets (1) Overview Noninterest Expense (in thousands) (2) Efficiency Ratio (1) 17 Noninterest Expense Trends

Slide 18

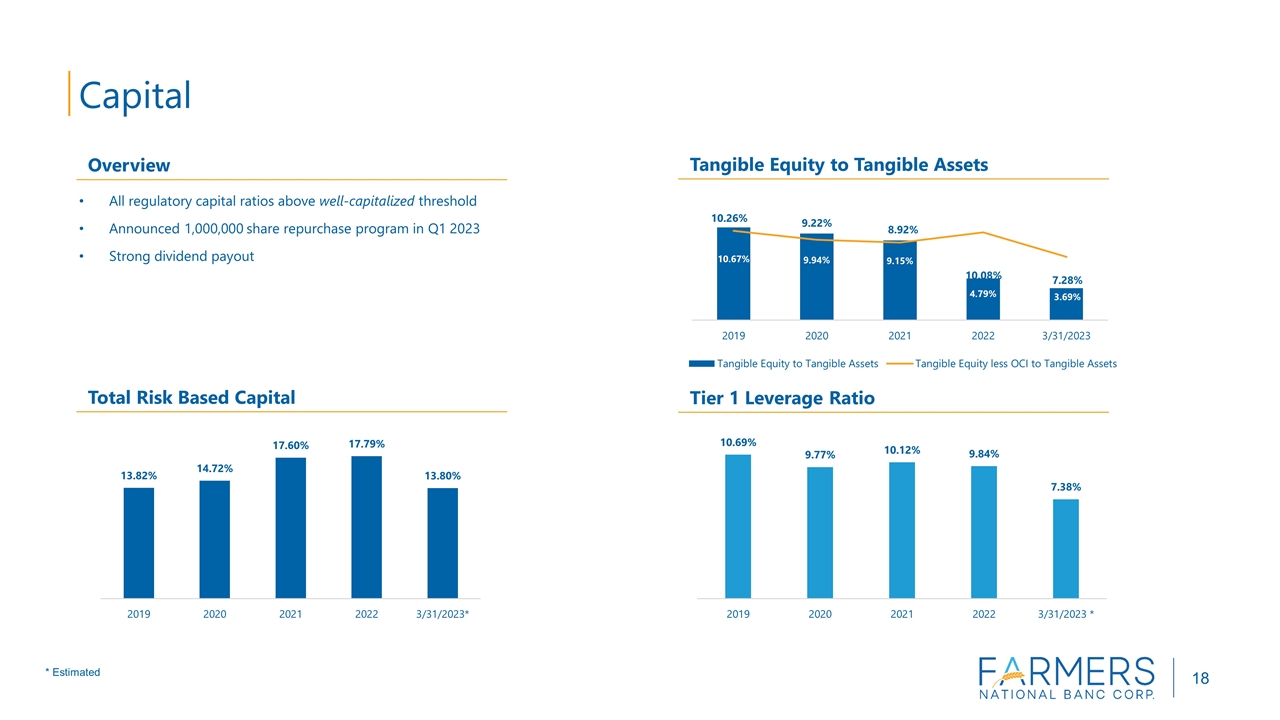
All regulatory capital ratios above well-capitalized threshold Announced 1,000,000 share repurchase program in Q1 2023 Strong dividend payout Tangible Equity to Tangible Assets Overview Total Risk Based Capital Tier 1 Leverage Ratio 18 Capital * Estimated

Slide 19

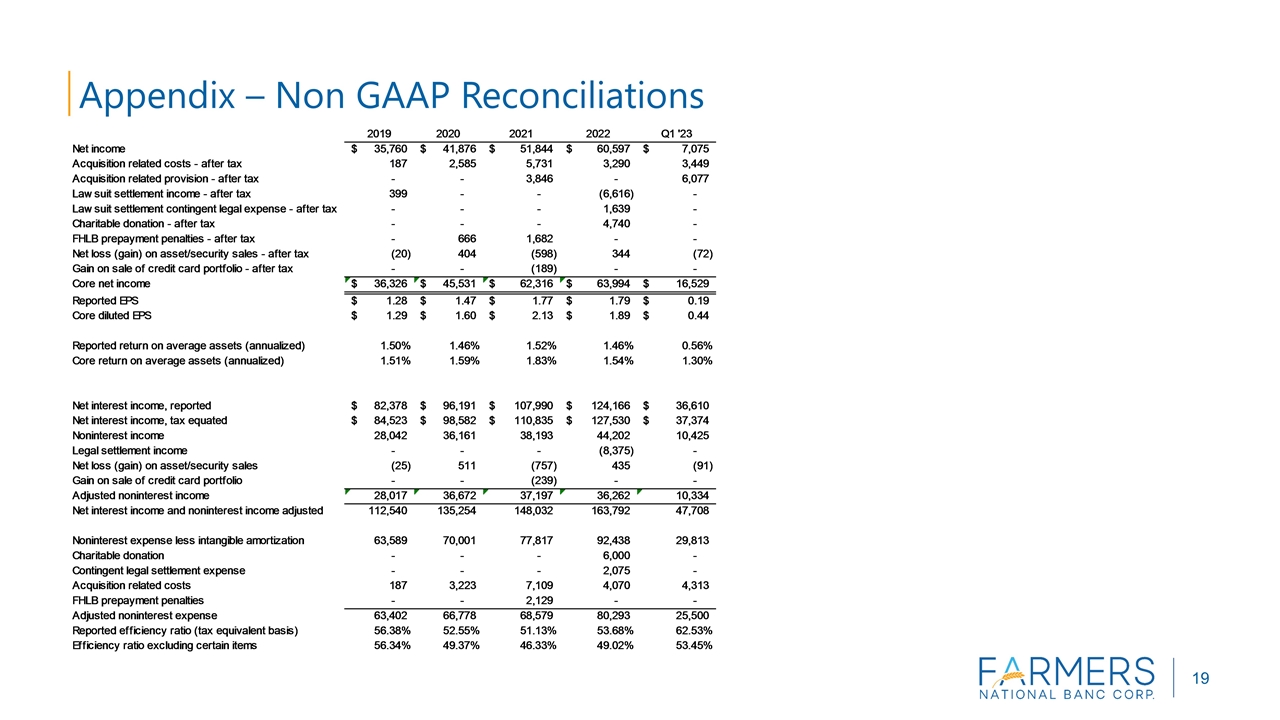
Appendix – Non GAAP Reconciliations 19

Slide 20

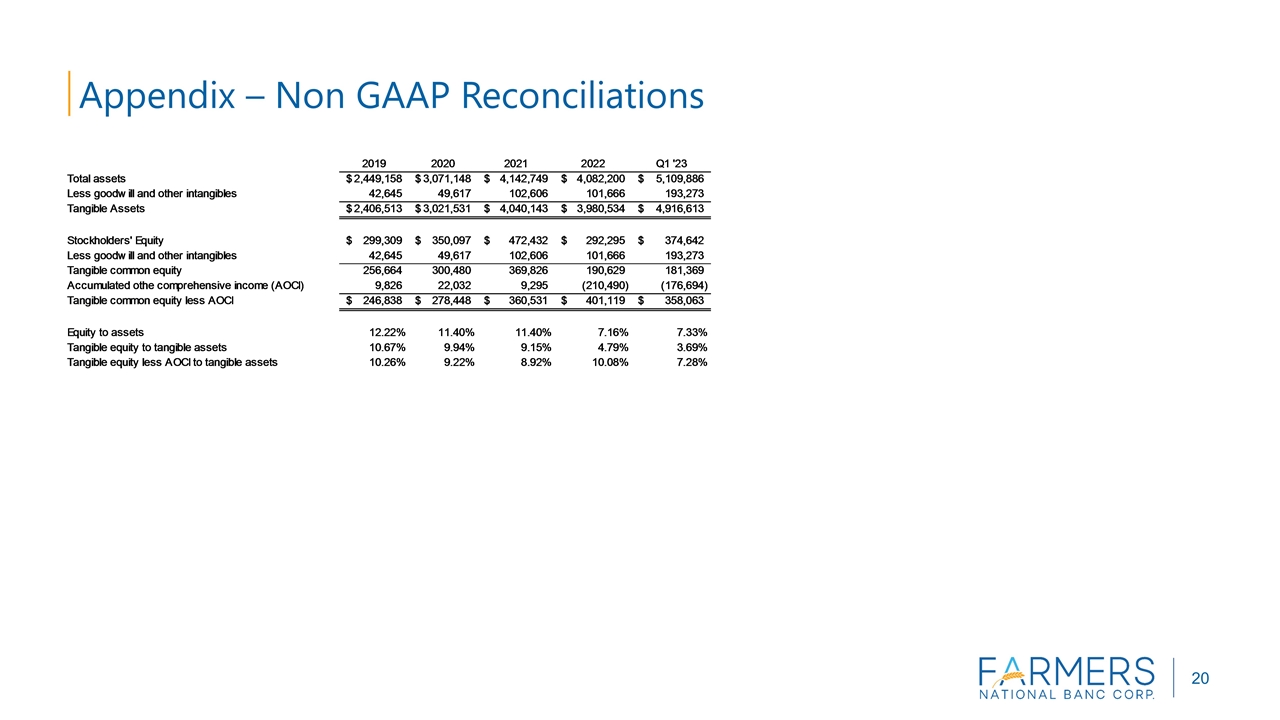
Appendix – Non GAAP Reconciliations 20