fnko-20211104
0001704711FALSE00017047112021-11-042021-11-04


UNITED STATES
SECURITIES AND EXCHANGE COMMISSION
WASHINGTON, D.C. 20549

 
FORM 8-K
 
CURRENT REPORT
Pursuant to Section 13 or 15(d) of the Securities Exchange Act of 1934
 
November 4, 2021
Date of Report (Date of earliest event reported) 


 FUNKO, INC.
(Exact Name of Registrant as Specified in its Charter)
 
Delaware 001-38274 
35-2593276
(State or Other Jurisdiction
of Incorporation)
 (Commission File Number) (IRS Employer
Identification No.)
 
2802 Wetmore Avenue
Everett, Washington 98201
(Address of Principal Executive Offices) (Zip Code)
 
(425) 783-3616
(Registrant’s telephone number, including area code)
  
(Former Name or Former Address, if Changed Since Last Report)

 
Check the appropriate box below if the Form 8-K filing is intended to simultaneously satisfy the filing obligation of the registrant under any of the following provisions (see General Instruction A.2. below):
 
  Written communications pursuant to Rule 425 under the Securities Act (17 CFR 230.425)
 
  Soliciting material pursuant to Rule 14a-12 under the Exchange Act (17 CFR 240.14a-12)
 
  Pre-commencement communications pursuant to Rule 14d-2(b) under the Exchange Act (17 CFR 240.14d-2(b))

  Pre-commencement communications pursuant to Rule 13e-4(c) under the Exchange Act (17 CFR 240.13e-4(c))
 
Securities registered pursuant to Section 12(b) of the Act:
Title of each classTrading Symbol(s)Name of each exchange on which registered
Class A Common Stock,
$0.0001 par value per share
FNKOThe Nasdaq Stock Market LLC
Indicate by check mark whether the registrant is an emerging growth company as defined in Rule 405 of the Securities Act of 1933 (§230.405 of this chapter) or Rule 12b-2 of the Securities Exchange Act of 1934 (§240.12b-2 of this chapter).
 
Emerging growth company  
 
If an emerging growth company, indicate by check mark if the registrant has elected not to use the extended transition period for complying with any new or revised financial accounting standards provided pursuant to Section 13(a) of the Exchange Act.  


Item 2.02. Results of Operations and Financial Condition.
On November 4, 2021, Funko, Inc. (the “Company”) announced its financial results for the three and nine months ended September 30, 2021. The full text of the press release (the “Press Release”) issued in connection with the announcement is furnished as Exhibit 99.1 to this report and is incorporated herein by reference. The information contained in the website cited in the Press Release is not incorporated herein.
Item 7.01. Regulation FD Disclosure.
The slides for the Company’s earnings presentation on November 4, 2021 for the three and nine months ended September 30, 2021 are furnished as Exhibit 99.2 to this report.
The information in Items 2.02 and 7.01 of this report (including Exhibit 99.1 and 99.2) shall not be deemed “filed” for purposes of Section 18 of the Securities Exchange Act of 1934, as amended (the “Exchange Act”), or otherwise subject to the liabilities of that section, nor shall it be deemed incorporated by reference in any filing under the Securities Act of 1933, as amended, or the Exchange Act, except as expressly set forth by specific reference in such a filing.
Item 9.01. Financial Statements and Exhibits.
(d)    Exhibits:


Exhibit No.

Description
99.1 
99.2
104
Cover Page Interactive Data File (embedded within the Inline XBRL document)


SIGNATURE
Pursuant to the requirements of the Securities Exchange Act of 1934, the Registrant has duly caused this report to be signed on its behalf by the undersigned hereunto duly authorized.
Date: November 4, 2021
FUNKO, INC.
By:/s/ Jennifer Fall Jung

Jennifer Fall Jung

Chief Financial Officer (Principal Financial Officer)


image_7.jpg        


Funko Reports Third Quarter 2021 Sales of $267.7 million, Up 40.0%

                                    
Record Quarter Results Driven by Broad-Based Strength Across Products, Channels, and Geographies

                                        
EVERETT, Wash. November 4, 2021-- Funko, Inc. ("Funko,” or the “Company”) (Nasdaq: FNKO), a leading pop culture consumer products company, today reported its consolidated financial results for the third quarter ended September 30, 2021.

Third Quarter 2021 Financial Highlights
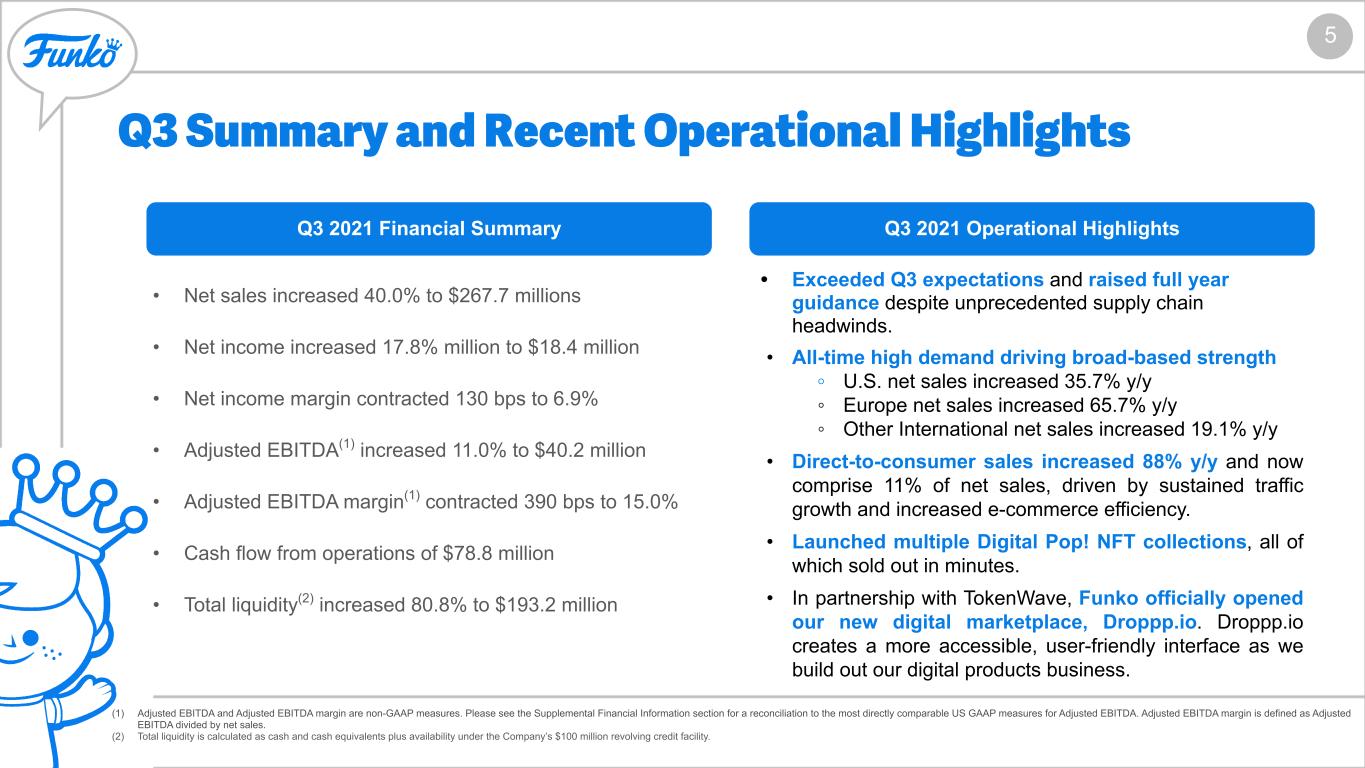
Net sales increased 40.0% y/y to $267.7 million
Net income increased 17.8% y/y to $18.4 million
Net income margin declined 130 basis points y/y to 6.9%
Adjusted EBITDA2 increased 11.0% y/y to $40.2 million
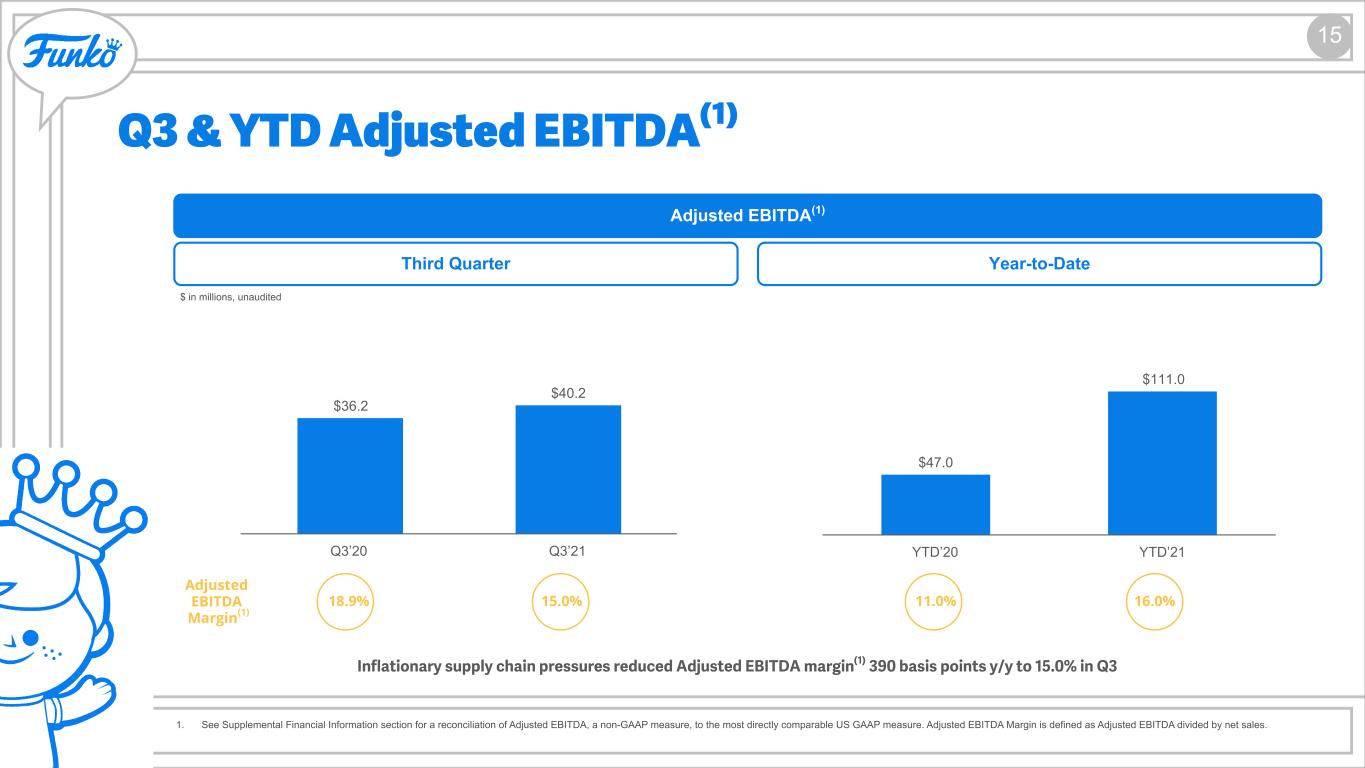
Adjusted EBITDA margin2 declined 390 basis points y/y to 15.0%
Cash flow from operations of $78.8 million for the nine months ended September 30, 2021
Total liquidity3 increased 80.8% y/y to $193.2 million

Third Quarter 2021 and Recent Operating Highlights
Exceeded Q3 expectations and raised full year guidance despite unprecedented supply chain headwinds.
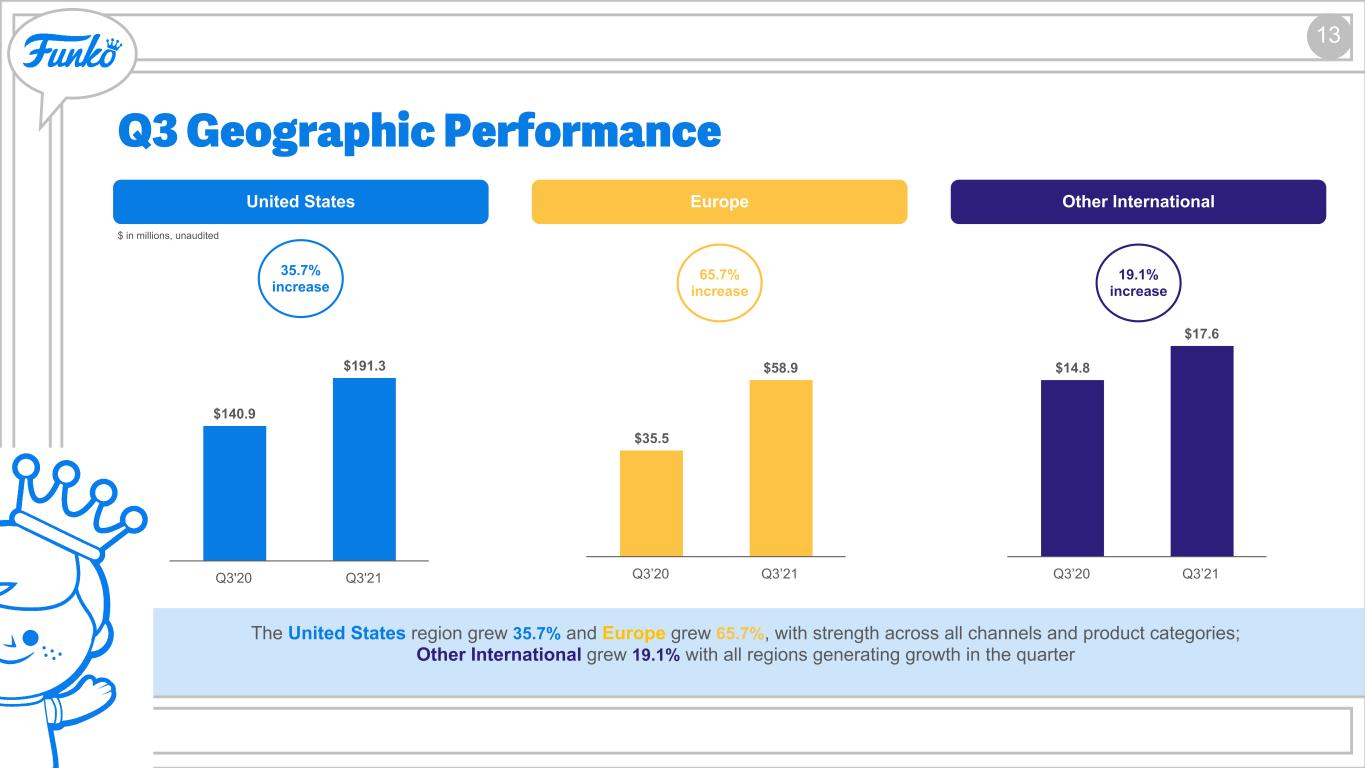
All-time high demand levels driving broad-based strength in all geographies - U.S. net sales increased 35.7% y/y to $191.3 million, Europe net sales increased 65.7% y/y to $58.9 million, and Other International net sales rose 19.1% y/y to $17.6 million.
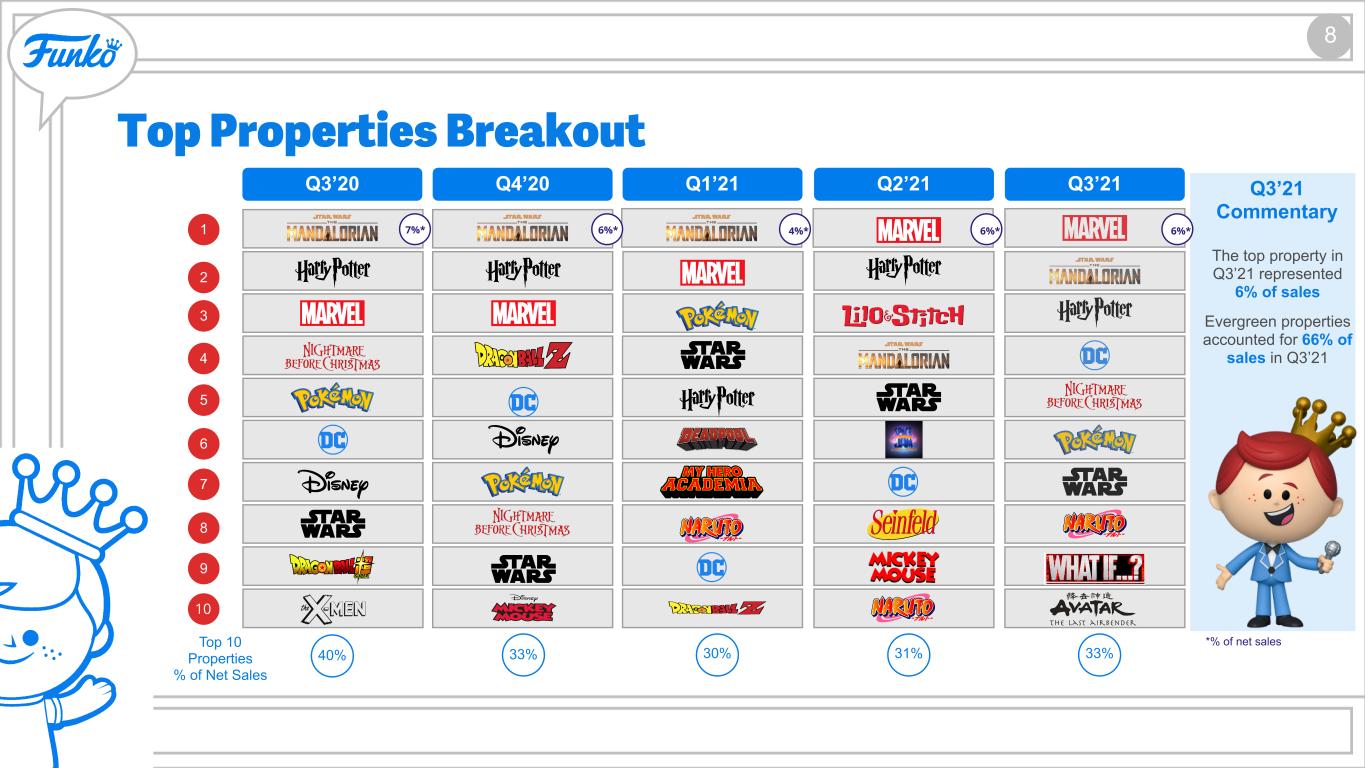
Pop! branded products grew 41.3% on strong evergreen product sales (evergreen properties comprised 66% of total net sales) and a robust calendar of new content.
Net sales of Other (non-figure) products increased 33.8%, led by Loungefly branded products which grew 36.3%.
Direct-to-consumer sales increased 88% y/y and now comprise 11% of net sales, driven by sustained traffic growth and increased e-commerce efficiency.
Developed three brand new events (Alice In Wonderland Black Light Event; FunKon; Batman Day), with record single-day direct-to-consumer net sales.
Launched multiple Digital Pop! NFT Collections, all of which sold out in minutes.
In partnership with TokenWave, Funko officially opened our new digital marketplace, Droppp.io. Droppp.io creates a more accessible, user-friendly interface as we build out our digital products business.


image_7.jpg        


"We are thrilled to report another exceptionally strong quarter, with broad-based strength across our product categories, geographies and channels," said Andrew Perlmutter, President. "This performance caps off a tremendous first nine months of the year for Funko and demonstrates our ability to proactively manage through challenging supply chain dynamics and inflation while driving profitable growth. It is also a reflection of our extremely loyal fan base."

Brian Mariotti, Chief Executive Officer added, "As we look to the balance of this fiscal year, we are confident in our ability to execute effectively against our core operating strategies to drive continued growth while continuing to adapt quickly to any ongoing supply chain challenges. As a credit to our brand, we are continuing to expand our product categories and fan base, increasing fan engagement and bringing innovative new products to market."


Third Quarter 2021 Financial Results
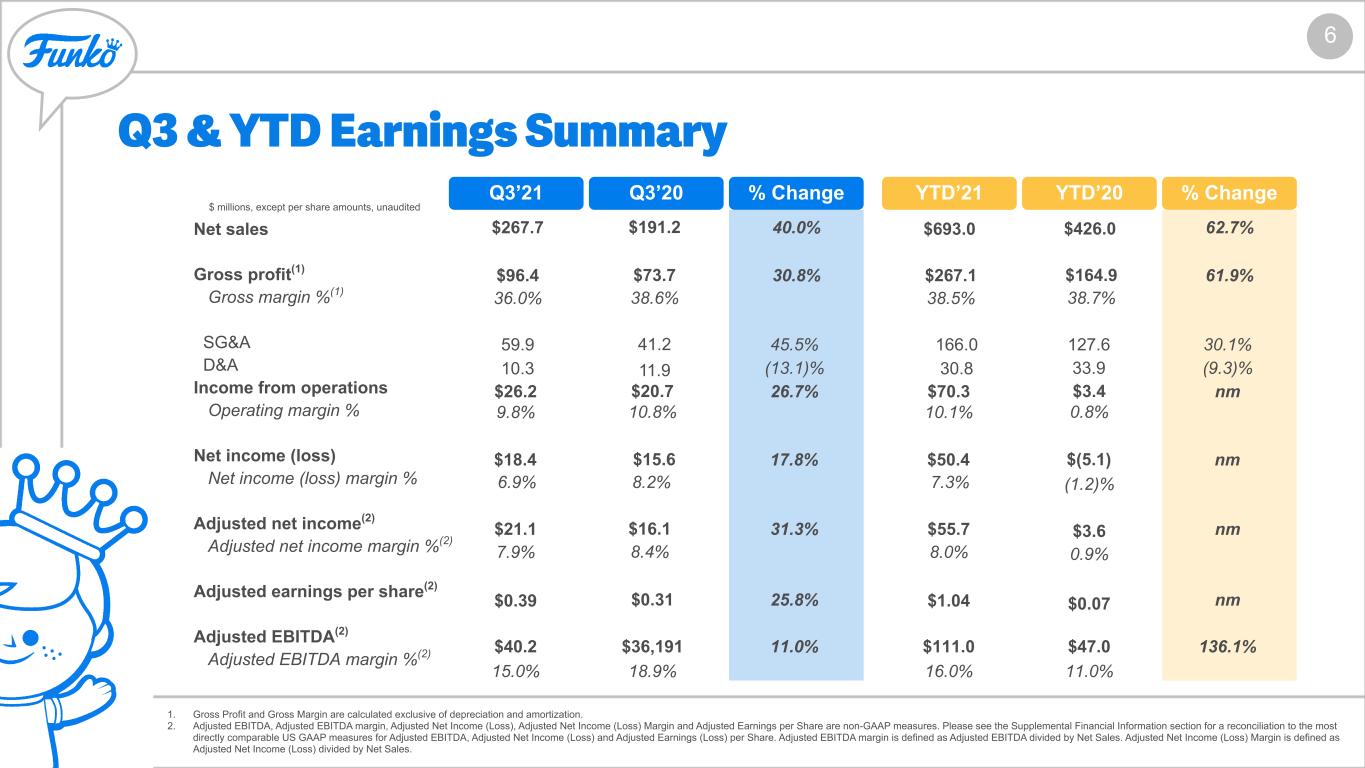
Net sales increased 40.0% to $267.7 million in the third quarter of 2021 compared to $191.2 million in the third quarter of 2020. The year-over-year increase reflects broad-based strength across geographies, products and channels.

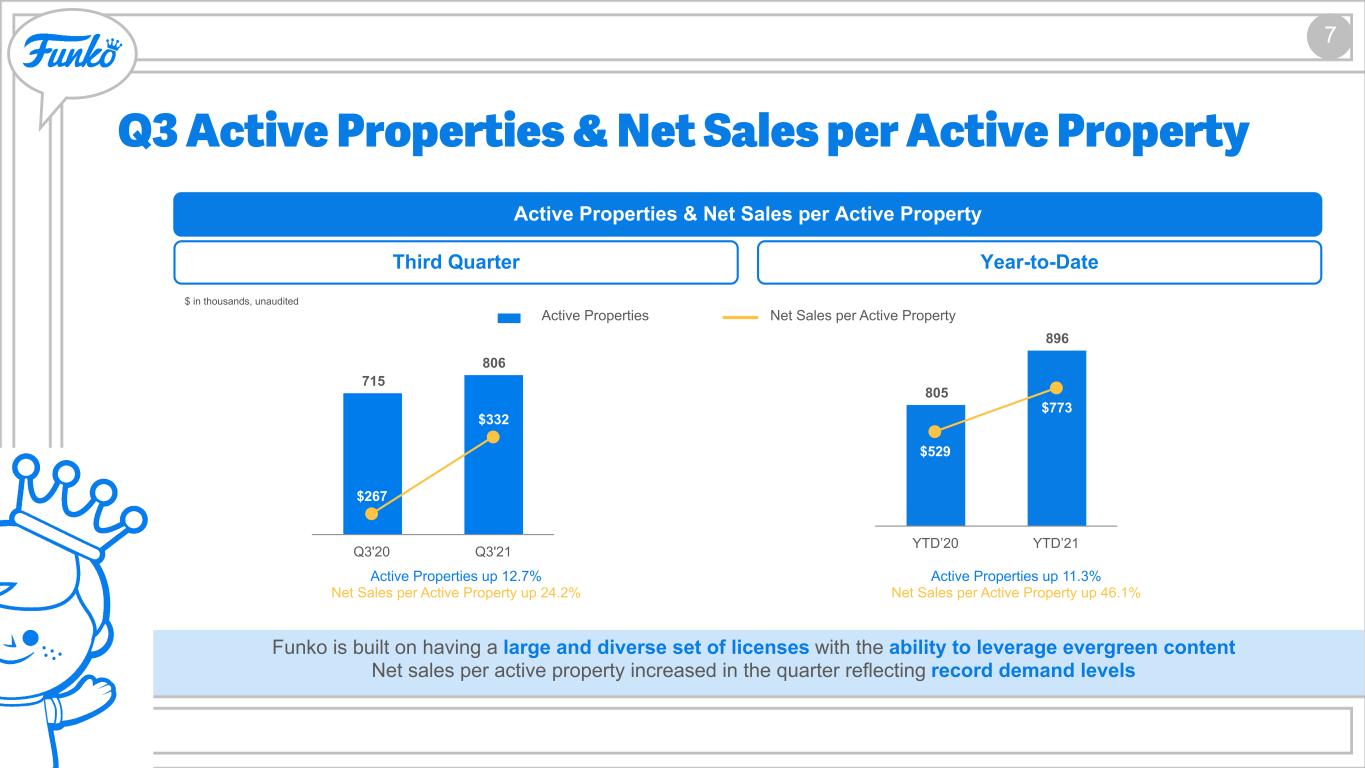
In the third quarter of 2021, the number of active properties increased 12.7% to 806 from 715 in the third quarter of 2020 and net sales per active property increased 24.2%.

On a geographical basis, net sales in the United States increased 35.7% to $191.3 million and net sales in Europe increased 65.7% to $58.9 million. Net sales in other international regions increased 19.1% to $17.6 million, with all geographies reporting growth.

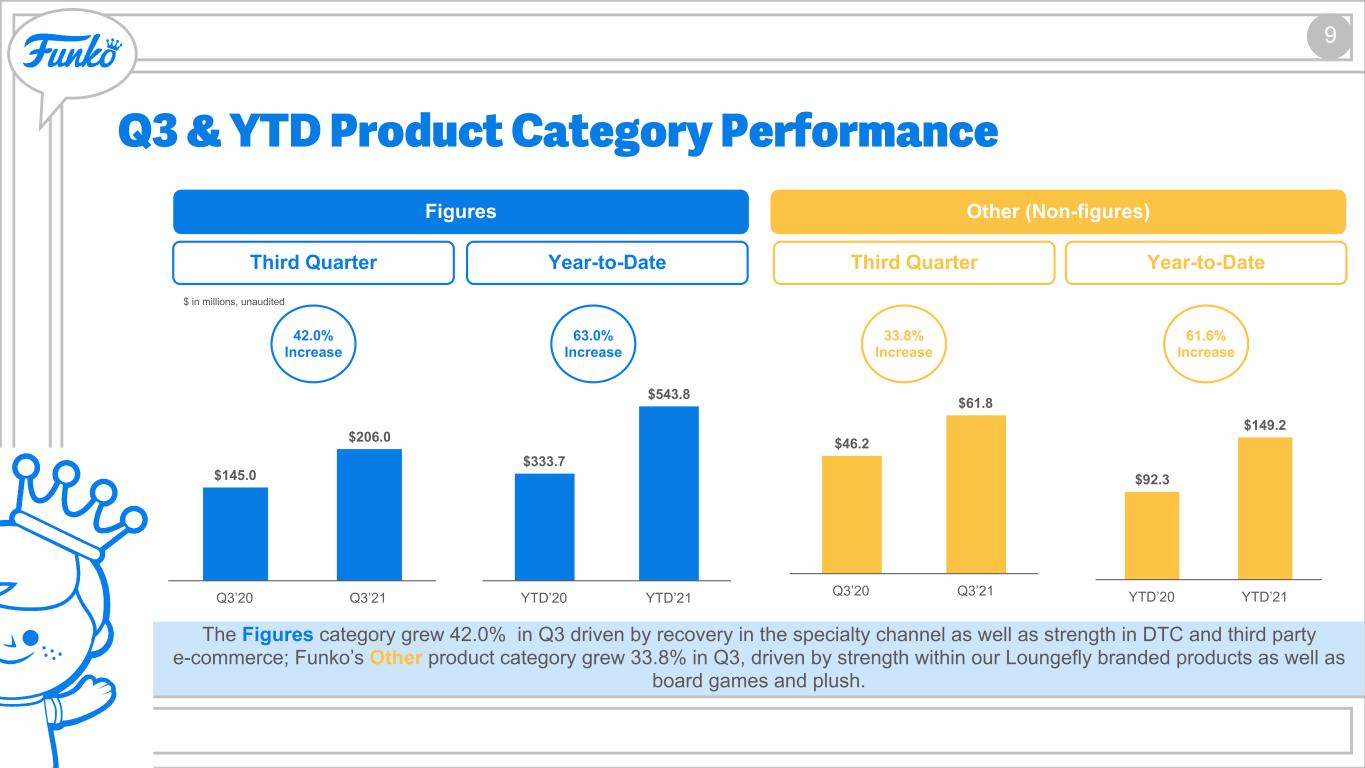
On a product category basis, net sales of Figures grew 42.0% to $206.0 million, reflecting strong recovery in the Specialty retailer channel as well as strength in DTC and third-party e-commerce. Net sales of Other (non-figure) products increased 33.8% to $61.8 million, reflecting strength in Loungefly branded products as well as games and plush.

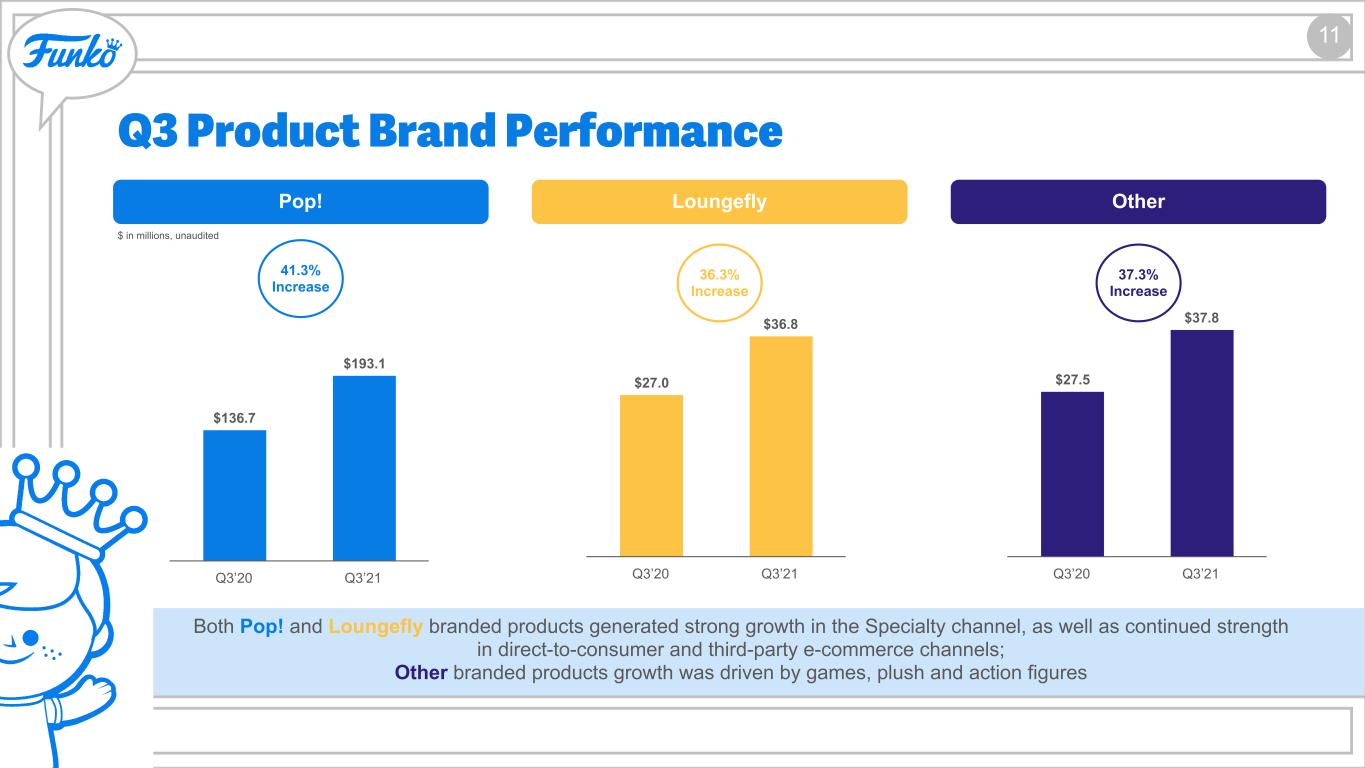
On a brand basis, Pop! branded products grew 41.3% to $193.1 million, reflecting strong growth in the U.S. and Europe. Loungefly branded products grew 36.3% to $36.8 million. Both brands generated strong growth in the Specialty retailer channel, as well as strength in DTC and third-party e-commerce. Net sales of other branded products increased 37.3% to $37.8 million driven by board games, plush and action figures.

The tables below show the breakdown of net sales on a geographical, product category and branded product basis (in thousands):

Three Months Ended September 30,Period Over Period Change
20212020DollarPercentage
Net sales by geography:
United States$191,289 $140,935 $50,354 35.7 %
Europe58,873 35,538 23,335 65.7 %
Other International17,571 14,756 2,815 19.1 %
Total net sales$267,733 $191,229 $76,504 40.0 %


image_7.jpg        
Three Months Ended September 30,Period Over Period Change
20212020DollarPercentage
Net sales by product:
Figures$205,963 145,049 $60,914 42.0 %
Other61,770 46,180 15,590 33.8 %
Total net sales$267,733 191,229 $76,504 40.0 %

Three Months Ended September 30,Period Over Period Change
Net sales by branded product:20212020DollarPercentage
Pop! Branded Products$193,112 $136,694 $56,418 41.3 %
Loungefly Branded Products36,794 26,990 9,804 36.3 %
Other37,827 27,545 10,282 37.3 %
Total net sales$267,733 $191,229 $76,504 40.0 %

Gross margin1 in the third quarter of 2021 decreased 260 basis points to 36.0% compared to 38.6% in the third quarter of 2020, reflecting higher freight expenses due to ongoing supply chain disruptions.

SG&A expenses increased 45.5% to $59.9 million or 22.4% of net sales in the third quarter of 2021 compared to $41.2 million or 21.5% of net sales in the third quarter of 2020 as we continued to invest in the long-term growth of the business. SG&A expenses for the third quarter of 2021 were lower than expected, as we proactively postponed some marketing spend to Q4 to align with product availability.

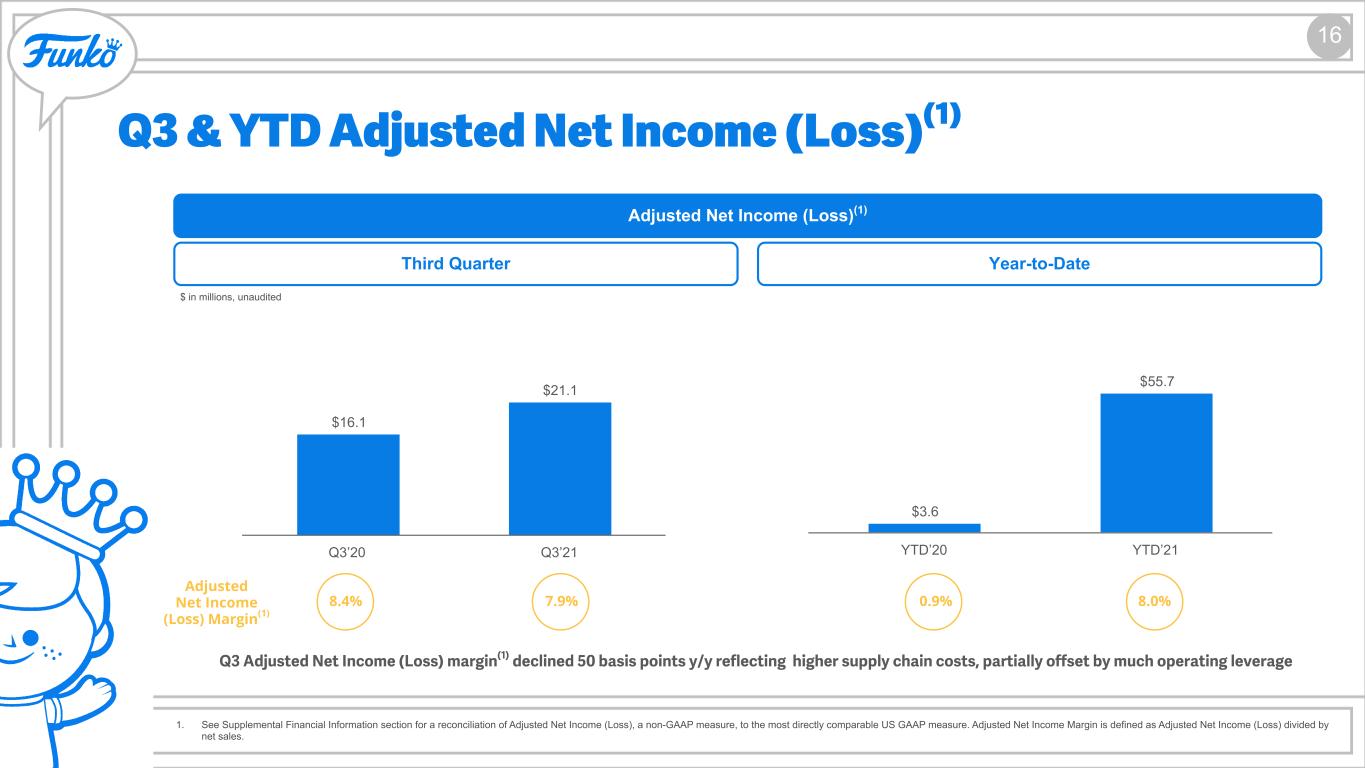
Net income in the third quarter of 2021 was $18.4 million and net income margin1 was 6.9%, compared to net income of $15.6 million and net income margin1 of 8.2% in the third quarter of 2020. Adjusted Net Income2 (non-GAAP) was $21.1 million in the third quarter of 2021 versus Adjusted Net Income2 of $16.1 million in the third quarter of 2020. Adjusted EBITDA2 in the third quarter of 2021 was $40.2 million and Adjusted EBITDA margin2 was 15.0%, compared to $36.2 million and 18.9%, respectively, in the third quarter of 2020. A reconciliation of these non-GAAP measures to GAAP is provided below.

Balance Sheet Highlights
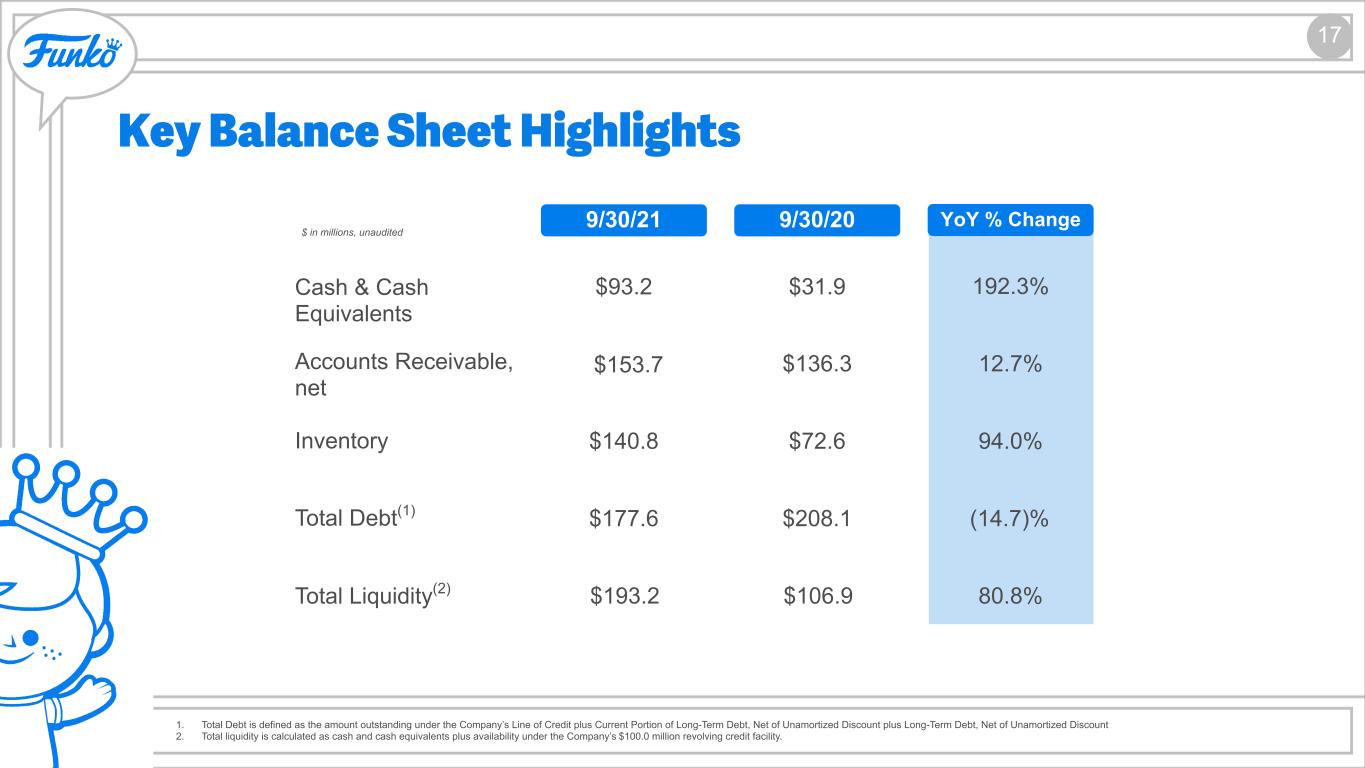
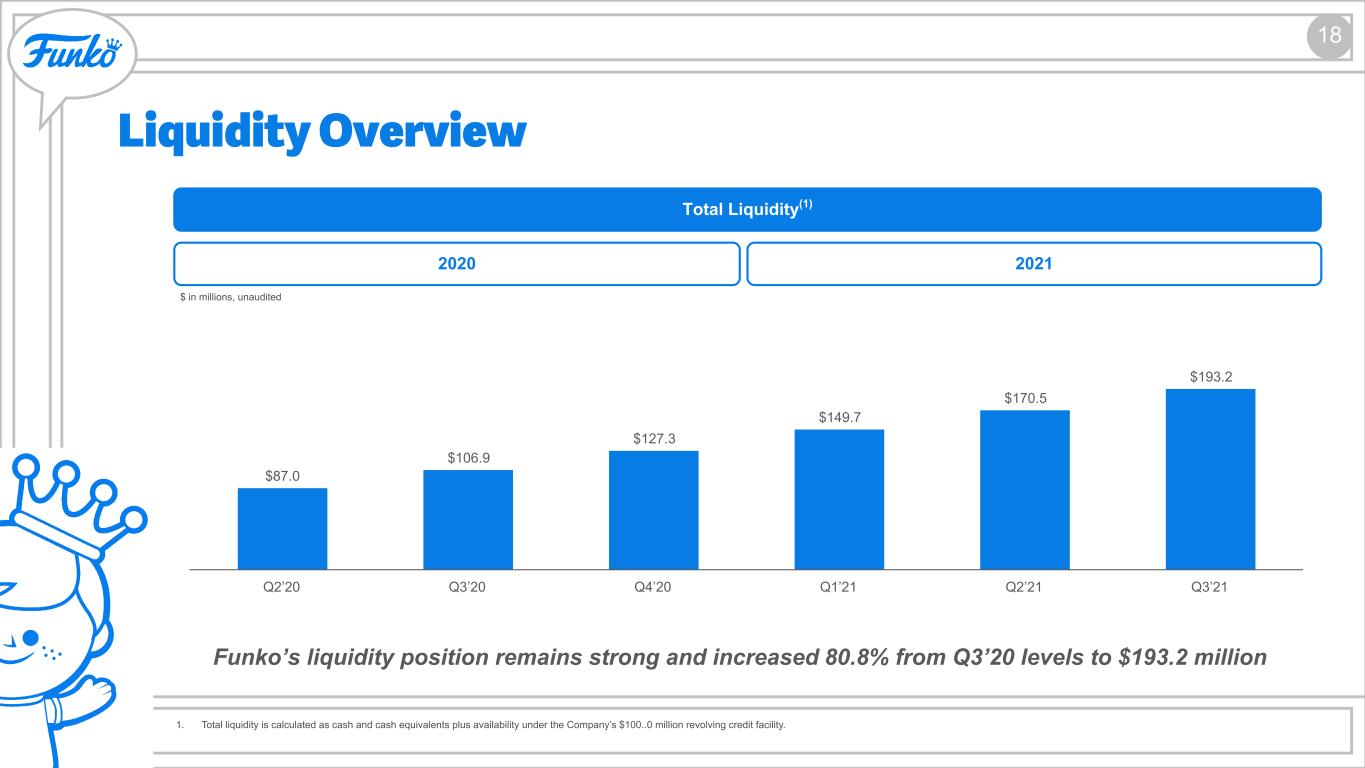
Total liquidity3 as of September 30, 2021 totaled $193.2 million, an increase of 80.8% compared to September 30, 2020. Total liquidity was comprised of cash and cash equivalents of $93.2 million and total revolver availability of $100.0 million.

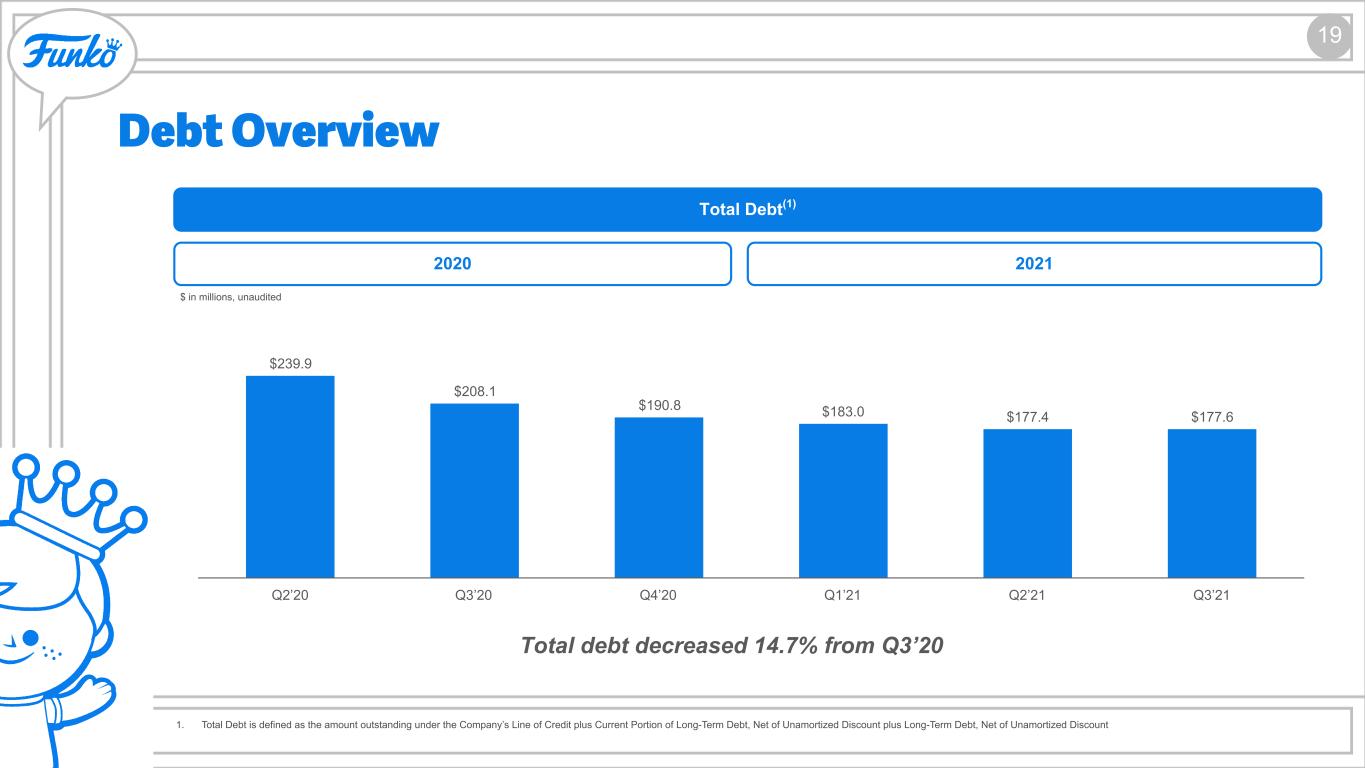
As of September 30, 2021, total debt was $177.6 million, a decrease of 14.7% compared to a year ago. Total debt includes the amount outstanding under the Company's term loan facility, net of unamortized discounts.

Inventories at the end of the third quarter of 2021 totaled $140.8 million, up 94.0% compared to a year ago as total transit times have increased significantly compared to pre-pandemic levels, resulting in a percent of inventory in-transit at quarter end of 61%.


image_7.jpg        


Outlook
In 2021, the Company expects the following full-year results:
Net sales of $950 million to $975 million;
Adjusted EBITDA margin2 of 14.0% to 14.5%;
Adjusted Net Income2 of $64.4 million to $70.4 million, based on a blended tax rate of 25%; and
Adjusted Earnings per Diluted Share2 of $1.20 to $1.31, based on estimated adjusted average diluted shares outstanding of 53.9 million for the full year.


1Gross margin is calculated as net sales less cost of sales (exclusive of depreciation and amortization) as a percentage of net sales. Net Income (Loss) margin is calculated as net income as a percentage of net sales.
2Adjusted Net Income (Loss), Adjusted Earnings (Loss) per Diluted Share, Adjusted EBITDA and Adjusted EBITDA margin are non-GAAP financial measures. For a reconciliation of historical Adjusted Net Income (Loss), Adjusted Earnings (Loss) per Diluted Share and Adjusted EBITDA to the most directly comparable U.S. GAAP financial measures, please refer to the “Non-GAAP Financial Measures” section of this press release. A reconciliation of Adjusted Net Income (Loss), Adjusted Earnings (Loss) per Diluted Share and Adjusted EBITDA margin outlook to the corresponding GAAP measure on a forward-looking basis cannot be provided without unreasonable efforts, as we are unable to provide reconciling information with respect to certain items. However, in 2021 the Company expects equity-based compensation of approximately $14 million, depreciation and amortization of approximately $42 million and interest expense of approximately $8 million, each of which is a reconciling item to Net Income. See "Non-GAAP Financial Measures" for more information.
3Total liquidity is calculated as cash and cash equivalents plus availability under the Company's $100 million revolving credit facility.

Conference Call and Webcast
The Company will host a conference call at 4:30 p.m. Eastern Time (1:30 p.m. Pacific Time) today, November 4, 2021, to further discuss its third quarter results and business outlook. A live webcast and replay of the event will be available on the Investor Relations section on the Company’s website at investor.funko.com. The replay of the webcast will be available for one year.

About Funko
Headquartered in Everett, Washington, Funko is a leading pop culture consumer products company. Funko designs, sources and distributes licensed pop culture products across multiple categories, including vinyl figures, action toys, plush, apparel, housewares and accessories for consumers who seek tangible ways to connect with their favorite pop culture brands and characters. Learn more at www.funko.com, and follow us on Twitter (@OriginalFunko) and Instagram (@OriginalFunko).


image_7.jpg        


Forward Looking Statements
This press release contains forward-looking statements within the meaning of the Private Securities Litigation Reform Act of 1995. All statements contained in this press release that do not relate to matters of historical fact should be considered forward-looking statements, including statements regarding our anticipated financial results, the underlying trends in our business, including supply chain constraints, inflation and other macroeconomic trends, marketing spend, our potential for growth, and our strategic growth priorities. These forward-looking statements are based on management’s current expectations. These statements are neither promises nor guarantees, but involve known and unknown risks, uncertainties and other important factors that may cause our actual results, performance or achievements to be materially different from any future results, performance or achievements expressed or implied by the forward-looking statements, including, but not limited to, the following: risks related to the impact of COVID-19 on our business, financial results and financial condition; our ability to execute our business strategy; our ability to maintain and realize the full value of our license agreements; changes in the retail industry and markets for our consumer products; our ability to maintain our relationships with retail customers and distributors; our ability to compete effectively; fluctuations in our gross margin; our dependence on content development and creation by third parties; the ongoing level of popularity of our products with consumers; our ability to manage our inventories; our ability to develop and introduce products in a timely and cost-effective manner; our ability to obtain, maintain and protect our intellectual property rights or those of our licensors; potential violations of the intellectual property rights of others; risks associated with counterfeit versions of our products; our ability to attract and retain qualified employees and maintain our corporate culture; our use of third-party manufacturing; risks associated with our international operations; changes in effective tax rates or tax law; foreign currency exchange rate exposure; the possibility or existence of global and regional economic downturns; our dependence on vendors and outsourcers; risks relating to government regulation; risks relating to litigation, including products liability claims and securities class action litigation; any failure to successfully integrate or realize the anticipated benefits of acquisitions or investments; reputational risk resulting from our e-commerce business and social media presence; risks relating to our indebtedness and our ability to secure additional financing; the potential for our electronic data or the electronic data of our customers to be compromised; the influence of our significant stockholder, ACON, and the possibility that ACON’s interests may conflict with the interests of our other stockholders; risks relating to our organizational structure; volatility in the price of our Class A common stock; and risks associated with our internal control over financial reporting. These and other important factors discussed under the caption “Risk Factors” in our quarterly report on Form 10-Q for the quarter ended September 30, 2021 and our other filings with the Securities and Exchange Commission could cause actual results to differ materially from those indicated by the forward-looking statements made in this press release. Any such forward-looking statements represent management’s estimates as of the date of this press release. While we may elect to update such forward-looking statements at some point in the future, we disclaim any obligation to do so, even if subsequent events cause our views to change. These forward-looking statements should not be relied upon as representing our views as of any date subsequent to the date of this press release.


Investor Relations:
[email protected]

Media:
[email protected]


image_7.jpg        
Funko, Inc. and Subsidiaries
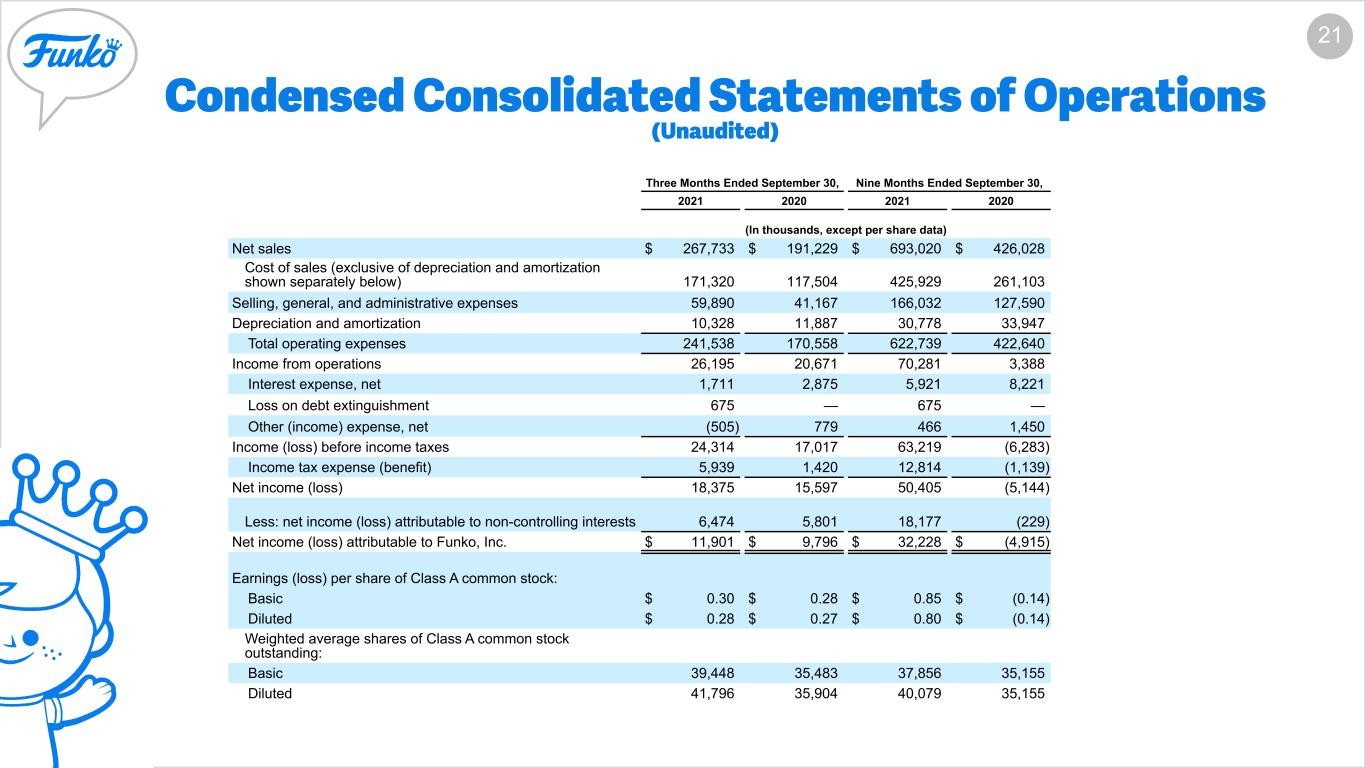
Condensed Consolidated Statements of Operations
(Unaudited)
Three Months Ended September 30,Nine Months Ended September 30,
2021202020212020
(In thousands, except per share data)
Net sales$267,733 $191,229 $693,020 $426,028 
Cost of sales (exclusive of depreciation and amortization shown separately below)171,320 117,504 425,929 261,103 
Selling, general, and administrative expenses59,890 41,167 166,032 127,590 
Depreciation and amortization10,328 11,887 30,778 33,947 
Total operating expenses241,538 170,558 622,739 422,640 
Income from operations26,195 20,671 70,281 3,388 
Interest expense, net1,711 2,875 5,921 8,221 
Loss on debt extinguishment675 — 675 — 
Other (income) expense, net(505)779 466 1,450 
Income (loss) before income taxes24,314 17,017 63,219 (6,283)
Income tax expense (benefit)5,939 1,420 12,814 (1,139)
Net income (loss)18,375 15,597 50,405 (5,144)
Less: net income (loss) attributable to non-controlling interests6,474 5,801 18,177 (229)
Net income (loss) attributable to Funko, Inc.$11,901 $9,796 $32,228 $(4,915)
Earnings (loss) per share of Class A common stock:
Basic$0.30 $0.28 $0.85 $(0.14)
Diluted$0.28 $0.27 $0.80 $(0.14)
Weighted average shares of Class A common stock outstanding:
Basic39,448 35,483 37,856 35,155 
Diluted41,796 35,904 40,079 35,155 


image_7.jpg        
Funko, Inc. and Subsidiaries
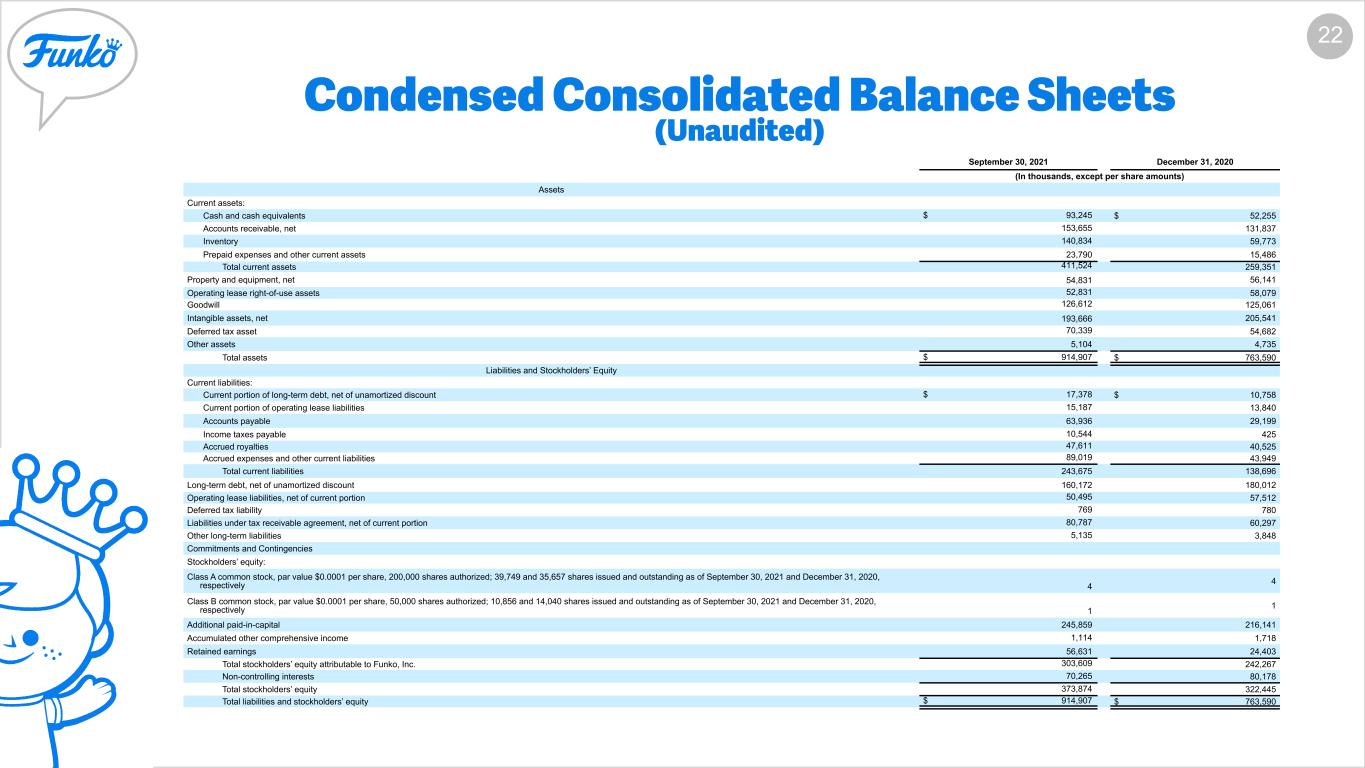
Condensed Consolidated Balance Sheets
(Unaudited)
September 30,
2021
December 31,
2020
(In thousands, except per share amounts)
Assets
Current assets:
Cash and cash equivalents$93,245 $52,255 
Accounts receivable, net153,655 131,837 
Inventory140,834 59,773 
Prepaid expenses and other current assets23,790 15,486 
Total current assets411,524 259,351 
Property and equipment, net54,831 56,141 
Operating lease right-of-use assets52,831 58,079 
Goodwill126,612 125,061 
Intangible assets, net193,666 205,541 
Deferred tax asset70,339 54,682 
Other assets5,104 4,735 
Total assets$914,907 $763,590 
Liabilities and Stockholders’ Equity
Current liabilities:
Current portion of long-term debt, net of unamortized discount$17,378 $10,758 
Current portion of operating lease liabilities15,187 13,840 
Accounts payable63,936 29,199 
Income taxes payable10,544 425 
Accrued royalties47,611 40,525 
Accrued expenses and other current liabilities89,019 43,949 
Total current liabilities243,675 138,696 
Long-term debt, net of unamortized discount160,172 180,012 
Operating lease liabilities, net of current portion50,495 57,512 
Deferred tax liability769 780 
Liabilities under tax receivable agreement, net of current portion80,787 60,297 
Other long-term liabilities5,135 3,848 
Commitments and Contingencies
Stockholders’ equity:
Class A common stock, par value $0.0001 per share, 200,000 shares authorized; 39,749 and 35,657 shares issued and outstanding as of September 30, 2021 and December 31, 2020, respectively
Class B common stock, par value $0.0001 per share, 50,000 shares authorized; 10,856 and 14,040 shares issued and outstanding as of September 30, 2021 and December 31, 2020, respectively
Additional paid-in-capital245,859 216,141 
Accumulated other comprehensive income1,114 1,718 
Retained earnings56,631 24,403 
Total stockholders’ equity attributable to Funko, Inc.303,609 242,267 
Non-controlling interests70,265 80,178 
Total stockholders’ equity373,874 322,445 
Total liabilities and stockholders’ equity$914,907 $763,590 


image_7.jpg        
Funko, Inc. and Subsidiaries
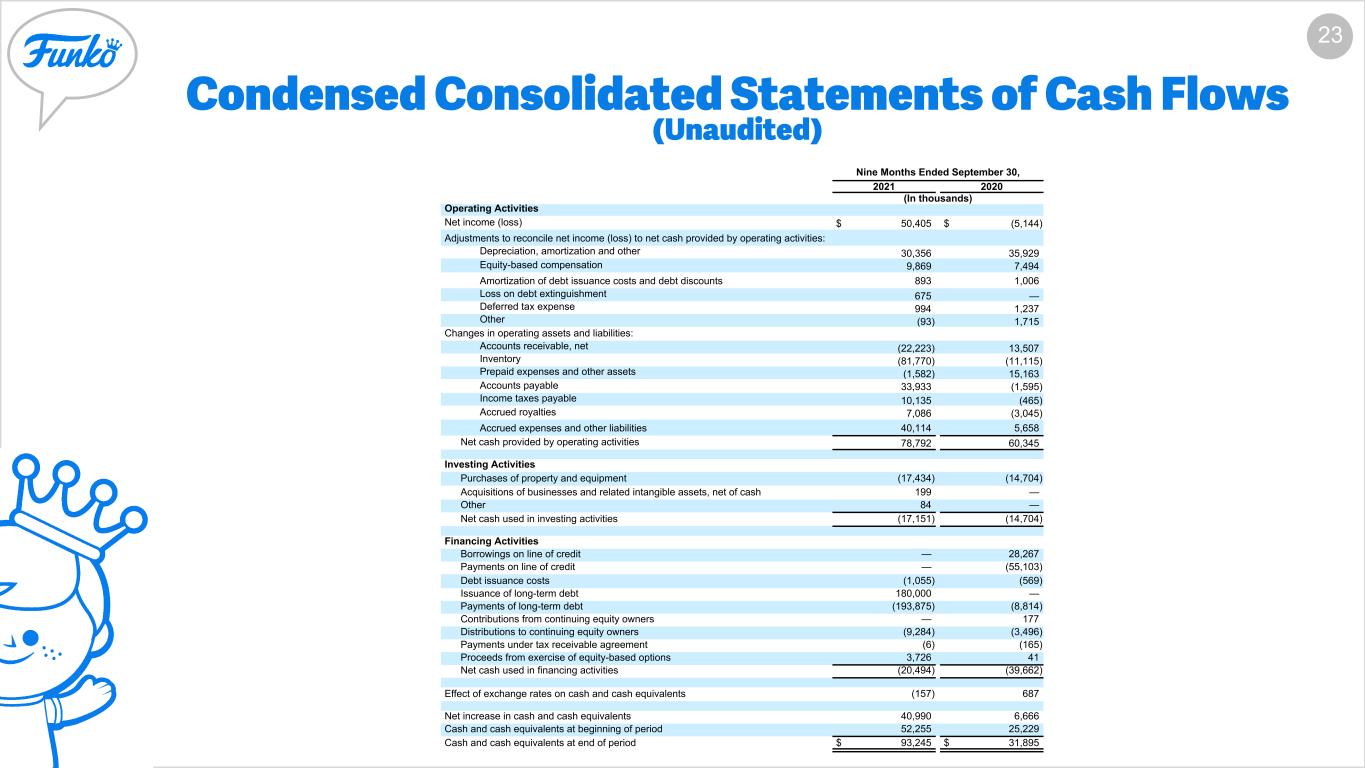
Condensed Consolidated Statements of Cash Flows
(Unaudited)
Nine Months Ended September 30,
20212020
(In thousands)
Operating Activities
Net income (loss)$50,405 $(5,144)
Adjustments to reconcile net income (loss) to net cash provided by operating activities:
Depreciation, amortization and other30,356 35,929 
Equity-based compensation9,869 7,494 
Amortization of debt issuance costs and debt discounts893 1,006 
Loss on debt extinguishment675 — 
Deferred tax expense 994 1,237 
Other(93)1,715 
Changes in operating assets and liabilities:
Accounts receivable, net(22,223)13,507 
Inventory(81,770)(11,115)
Prepaid expenses and other assets(1,582)15,163 
Accounts payable33,933 (1,595)
Income taxes payable10,135 (465)
Accrued royalties7,086 (3,045)
Accrued expenses and other liabilities40,114 5,658 
Net cash provided by operating activities78,792 60,345 
Investing Activities
Purchases of property and equipment(17,434)(14,704)
Acquisitions of businesses and related intangible assets, net of cash199 — 
Other84 — 
Net cash used in investing activities(17,151)(14,704)
Financing Activities
Borrowings on line of credit— 28,267 
Payments on line of credit— (55,103)
Debt issuance costs(1,055)(569)
Issuance of long-term debt180,000 — 
Payments of long-term debt(193,875)(8,814)
Contributions from continuing equity owners— 177 
Distributions to continuing equity owners(9,284)(3,496)
Payments under tax receivable agreement(6)(165)
Proceeds from exercise of equity-based options3,726 41 
Net cash used in financing activities(20,494)(39,662)
Effect of exchange rates on cash and cash equivalents(157)687 
Net increase in cash and cash equivalents40,990 6,666 
Cash and cash equivalents at beginning of period52,255 25,229 
Cash and cash equivalents at end of period$93,245 $31,895 


image_7.jpg        

Funko, Inc. and Subsidiaries
Non-GAAP Financial Measures
(Unaudited)

EBITDA, Adjusted EBITDA, Adjusted Net Income (Loss) and Adjusted Earnings (Loss) per Diluted Share (collectively the “Non-GAAP Financial Measures”) are supplemental measures of our performance that are not required by, or presented in accordance with, U.S. GAAP. The Non-GAAP Financial Measures are not measurements of our financial performance under U.S. GAAP and should not be considered as an alternative to net income (loss), earnings (loss) per share or any other performance measure derived in accordance with U.S. GAAP. We define EBITDA as net income (loss) before interest expense, net, income tax expense (benefit), depreciation and amortization. We define Adjusted EBITDA as EBITDA further adjusted for non-cash charges related to equity-based compensation programs, certain severance, relocation and related costs, loss on debt extinguishment, foreign currency transaction gains and losses and other unusual or one-time items. We define Adjusted Net Income (Loss) as net income (loss) attributable to Funko, Inc. adjusted for the reallocation of income (loss) attributable to non-controlling interests from the assumed exchange of all outstanding common units and options in FAH, LLC for newly issued-shares of Class A common stock of Funko, Inc. and further adjusted for the impact of certain non-cash charges and other items that we do not consider in our evaluation of ongoing operating performance. These items include, among other things, non-cash charges related to equity-based compensation programs, certain severance, relocation and related costs, loss on debt extinguishment, foreign currency transaction gains and losses and other unusual or one-time items, and the income tax (expense) benefit effect of these adjustments. We define Adjusted Earnings (Loss) per Diluted Share as Adjusted Net Income (Loss) divided by the weighted-average shares of Class A common stock outstanding, assuming (1) the full exchange of all outstanding common units and options in FAH, LLC for newly issued-shares of Class A common stock of Funko, Inc. and (2) the dilutive effect of stock options and unvested common units, if any. We caution investors that amounts presented in accordance with our definitions of the Non-GAAP Financial Measures may not be comparable to similar measures disclosed by our competitors, because not all companies and analysts calculate the Non-GAAP Financial Measures in the same manner. We present the Non-GAAP Financial Measures because we consider them to be important supplemental measures of our performance and believe they are frequently used by securities analysts, investors, and other interested parties in the evaluation of companies in our industry. Management believes that investors’ understanding of our performance is enhanced by including these Non-GAAP Financial Measures as a reasonable basis for comparing our ongoing results of operations.
Management uses the Non-GAAP Financial Measures:
as a measurement of operating performance because they assist us in comparing the operating performance of our business on a consistent basis, as they remove the impact of items not directly resulting from our core operations;
for planning purposes, including the preparation of our internal annual operating budget and financial projections;
as a consideration to assess incentive compensation for our employees;
to evaluate the performance and effectiveness of our operational strategies; and
to evaluate our capacity to expand our business.


image_7.jpg        


By providing these Non-GAAP Financial Measures, together with reconciliations, we believe we are enhancing investors’ understanding of our business and our results of operations, as well as assisting investors in evaluating how well we are executing our strategic initiatives. The Non-GAAP Financial Measures have limitations as analytical tools, and should not be considered in isolation, or as an alternative to, or a substitute for net income (loss) or other financial statement data presented in our unaudited condensed consolidated financial statements included elsewhere in this press release as indicators of financial performance. Some of the limitations are:
such measures do not reflect our cash expenditures, or future requirements for capital expenditures or contractual commitments;
such measures do not reflect changes in, or cash requirements for, our working capital needs;
such measures do not reflect the interest expense, or the cash requirements necessary to service interest or principal payments on our debt;
although depreciation and amortization are non-cash charges, the assets being depreciated and amortized will often have to be replaced in the future and such measures do not reflect any cash requirements for such replacements; and
other companies in our industry may calculate such measures differently than we do, limiting their usefulness as comparative measures.
Due to these limitations, Non-GAAP Financial Measures should not be considered as measures of discretionary cash available to us to invest in the growth of our business. We compensate for these limitations by relying primarily on our U.S. GAAP results and using these non-GAAP measures only supplementally. As noted in the table below, the Non-GAAP Financial Measures include adjustments for non-cash charges related to equity-based compensation programs, certain severance, relocation and related costs, loss on debt extinguishment, foreign currency transaction gains and losses and other unusual or one-time items. It is reasonable to expect that these items will occur in future periods. However, we believe these adjustments are appropriate because the amounts recognized can vary significantly from period to period, do not directly relate to the ongoing operations of our business and complicate comparisons of our internal operating results and operating results of other companies over time. Each of the normal recurring adjustments and other adjustments described herein and in the reconciliation table below help management with a measure of our core operating performance over time by removing items that are not related to day-to-day operations.


image_7.jpg        

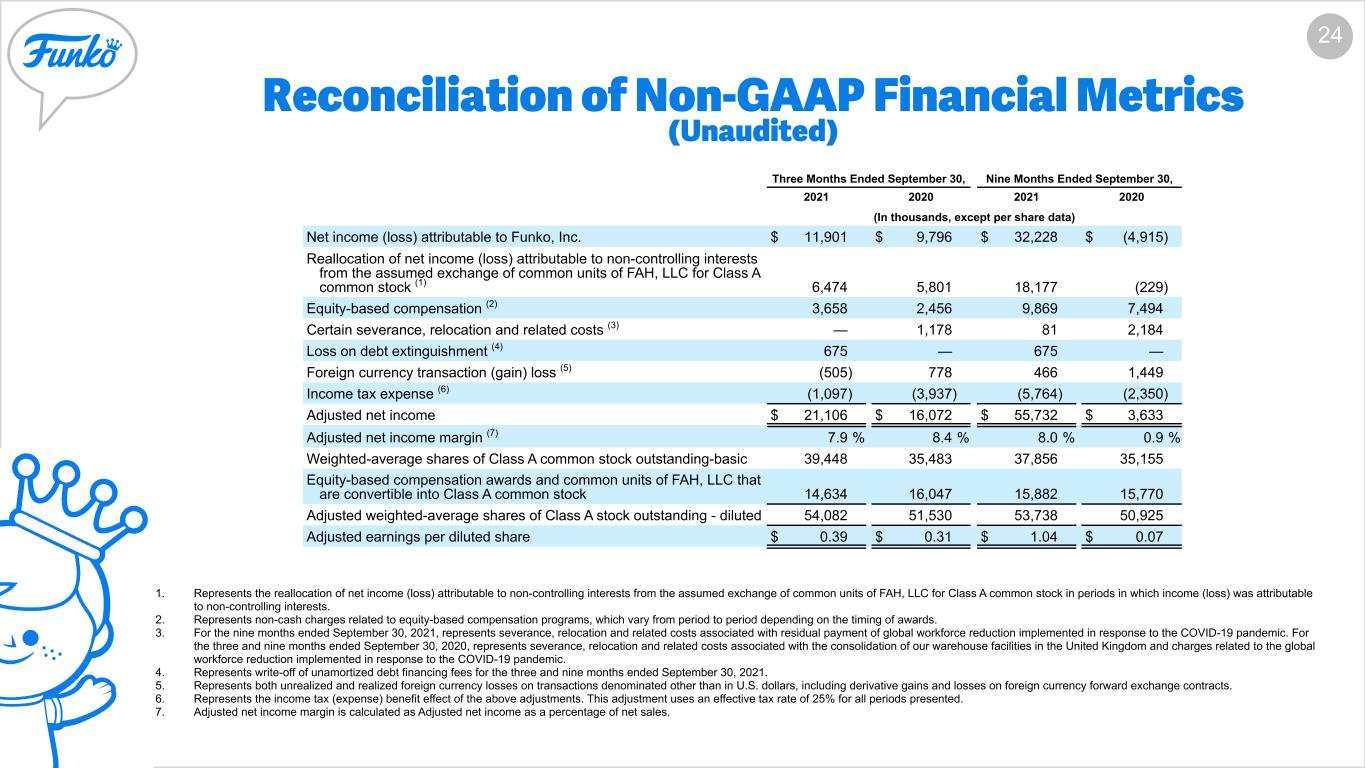
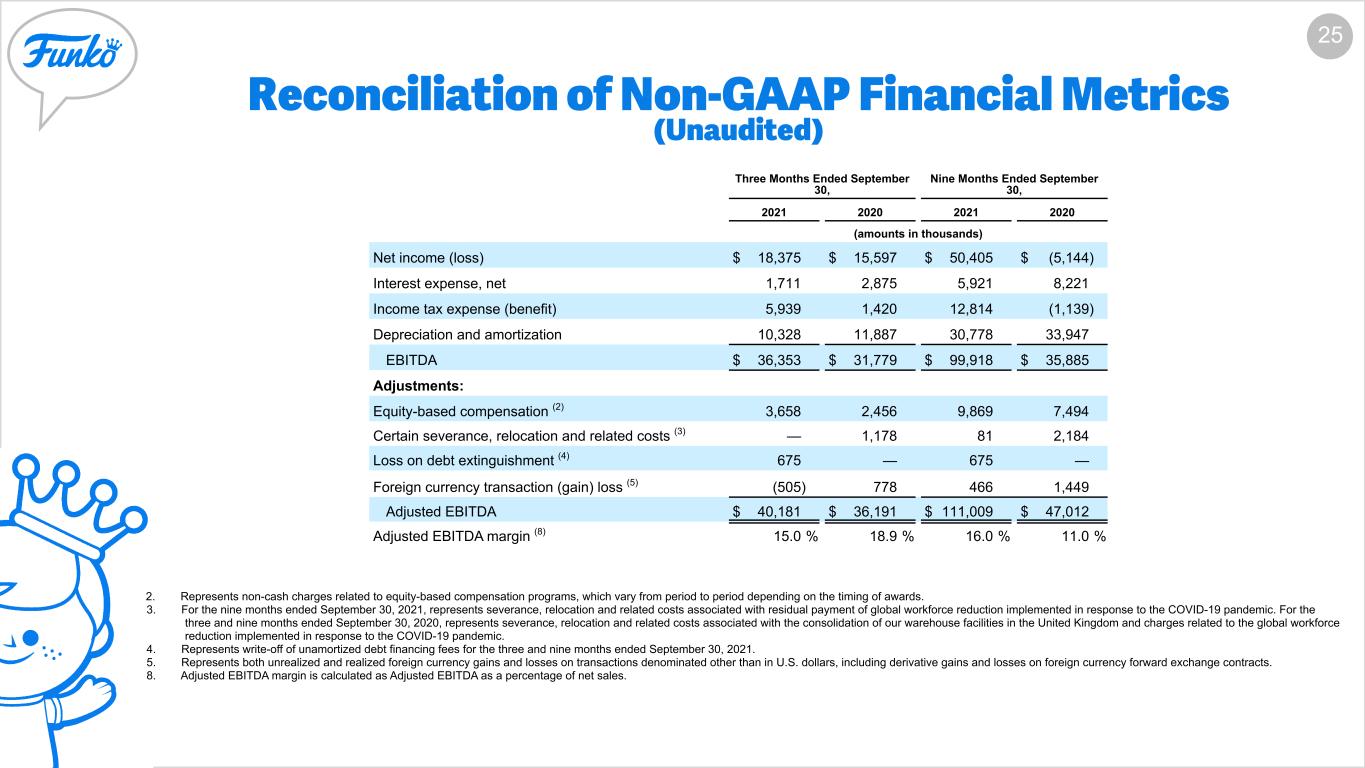
The following tables reconcile the Non-GAAP Financial Measures to the most directly comparable U.S. GAAP financial performance measure, which is net income (loss), for the periods presented:
Three Months Ended September 30,Nine Months Ended September 30,
2021202020212020
(In thousands, except per share data)
Net income (loss) attributable to Funko, Inc.$11,901 $9,796 $32,228 $(4,915)
Reallocation of net income (loss) attributable to non-controlling interests from the assumed exchange of common units of FAH, LLC for Class A common stock (1)
6,474 5,801 18,177 (229)
Equity-based compensation (2)
3,658 2,456 9,869 7,494 
Certain severance, relocation and related costs (3)
— 1,178 81 2,184 
Loss on debt extinguishment (4)
675 — 675 — 
Foreign currency transaction (gain) loss (5)
(505)778 466 1,449 
Income tax expense (6)
(1,097)(3,937)(5,764)(2,350)
Adjusted net income$21,106 $16,072 $55,732 $3,633 
Adjusted net income margin (7)
7.9 %8.4 %8.0 %0.9 %
Weighted-average shares of Class A common stock outstanding-basic
39,448 35,483 37,856 35,155 
Equity-based compensation awards and common units of FAH, LLC that are convertible into Class A common stock
14,634 16,047 15,882 15,770 
Adjusted weighted-average shares of Class A stock outstanding - diluted
54,082 51,530 53,738 50,925 
Adjusted earnings per diluted share$0.39 $0.31 $1.04 $0.07 
Three Months Ended September 30,Nine Months Ended September 30,
2021202020212020
(amounts in thousands)
Net income (loss)$18,375 $15,597 $50,405 $(5,144)
Interest expense, net1,711 2,875 5,921 8,221 
Income tax expense (benefit)5,939 1,420 12,814 (1,139)
Depreciation and amortization10,328 11,887 30,778 33,947 
EBITDA$36,353 $31,779 $99,918 $35,885 
Adjustments:
Equity-based compensation (2)
3,658 2,456 9,869 7,494 
Certain severance, relocation and related costs (3)
— 1,178 81 2,184 
Loss on debt extinguishment (4)
675 — 675 — 
Foreign currency transaction (gain) loss (5)
(505)778 466 1,449 
Adjusted EBITDA$40,181 $36,191 $111,009 $47,012 
Adjusted EBITDA margin (8)
15.0 %18.9 %16.0 %11.0 %


image_7.jpg        

(1)Represents the reallocation of net income (loss) attributable to non-controlling interests from the assumed exchange of common units of FAH, LLC for Class A common stock in periods in which income (loss) was attributable to non-controlling interests.
(2)Represents non-cash charges related to equity-based compensation programs, which vary from period to period depending on the timing of awards.
(3)For the nine months ended September 30, 2021, represents severance, relocation and related costs associated with residual payment of global workforce reduction implemented in response to the COVID-19 pandemic. For the three and nine months ended September 30, 2020, represents severance, relocation and related costs associated with the consolidation of our warehouse facilities in the United Kingdom and charges related to the global workforce reduction implemented in response to the COVID-19 pandemic.
(4)Represents write-off of unamortized debt financing fees for the three and nine months ended September 30, 2021.
(5) Represents both unrealized and realized foreign currency gains and losses on transactions denominated other than in U.S. dollars, including derivative gains and losses on foreign currency forward exchange contracts.
(6) Represents the income tax expense effect of the above adjustments. This adjustment uses an effective tax rate of 25% for all periods presented.
(7) Adjusted net income (loss) margin is calculated as Adjusted net income (loss) as a percentage of net sales.
(8) Adjusted EBITDA margin is calculated as Adjusted EBITDA as a percentage of net sales.
FUNKO 2019 BRAND COLORS FUNKO BLUE RGB 0,124, 236 CMYK 90, 45, 0, 0 #077CEC FUNKO GRAY RGB 242, 242, 242 CMYK 0, 0, 0, 15 #FEFEFE WHITE RGB 255, 255, 255 CMYK 0, 0, 0, 0 #FFFFFF YELLOW RGB 252, 195, 68 CMYK 0, 25, 80, 0 #FCC344 RED RGB 221, 44, 44 CMYK 10, 95, 95, 0 #DD2C2C PURPLE RGB 46, 30, 124 CMYK 95,100, 0, 5 #2E1E7C BLACK RGB 39, 39, 39 CMYK 0, 0, 0, 95 #272727 DARK GRAY RGB 76, 76, 76 CMYK 0, 0, 0, 85 #4C4C4C MEDIUM GRAY RGB 159, 159, 159 CMYK 0, 0, 0, 45 #9F9F9F LIGHT GRAY RGB 229, 229, 229 CMYK 0, 0, 0, 25 #E5E5E5 Third Quarter 2021 Earnings November 4, 2021


FUNKO 2019 BRAND COLORS FUNKO BLUE RGB 0,124, 236 CMYK 90, 45, 0, 0 #077CEC FUNKO GRAY RGB 242, 242, 242 CMYK 0, 0, 0, 15 #FEFEFE WHITE RGB 255, 255, 255 CMYK 0, 0, 0, 0 #FFFFFF YELLOW RGB 252, 195, 68 CMYK 0, 25, 80, 0 #FCC344 RED RGB 221, 44, 44 CMYK 10, 95, 95, 0 #DD2C2C PURPLE RGB 46, 30, 124 CMYK 95,100, 0, 5 #2E1E7C BLACK RGB 39, 39, 39 CMYK 0, 0, 0, 95 #272727 DARK GRAY RGB 76, 76, 76 CMYK 0, 0, 0, 85 #4C4C4C MEDIUM GRAY RGB 159, 159, 159 CMYK 0, 0, 0, 45 #9F9F9F LIGHT GRAY RGB 229, 229, 229 CMYK 0, 0, 0, 25 #E5E5E5 HOLLYWOOD UPDATE 2 Cautionary Notes This presentation contains forward-looking statements within the meaning of the Private Securities Litigation Reform Act of 1995. All statements other than statements of historical facts contained in this presentation, including statements regarding our future results of operations and financial position, industry dynamics, our mission, growth opportunities, business strategy and plans and our objectives for future operations, including expanding into new product categories, our e-commerce business, the underlying trends in our business, including supply chain constraints, inflation and other macroeconomic trends, and the ongoing impact of COVID-19 on our business and expected recovery are forward-looking statements. The words “may,” “will,” “should,” “expects,” “plans,” “anticipates,” “could,” “intends,” “targets,” “projects,” “contemplates,” “believes,” “estimates,” “predicts,” “potential” or “continue” or the negative of these terms and similar expressions are intended to identify forward-looking statements. The forward-looking statements in this presentation are only predictions. We have based these forward- looking statements largely on our current expectations and projections about future events and financial trends that we believe may affect our business, financial condition and results of operations. Forward-looking statements involve known and unknown risks, uncertainties and other important factors that may cause our actual results, performance or achievements to be materially different from any future results, performance or achievements expressed or implied by the forward-looking statements, including without limitation risks related to the impact of COVID-19 on our business, financial results and financial condition; our ability to execute our business strategy; our ability to maintain and realize the full value of our license agreements; changes in the retail industry and markets for our consumer products; our ability to maintain our relationships with retail customers and distributors; our ability to compete effectively; fluctuations in our gross margin; our dependence on content development and creation by third parties; the ongoing level of popularity of our products with consumers; our ability to manage our inventories; our ability to develop and introduce products in a timely and cost-effective manner; our ability to obtain, maintain and protect our intellectual property rights or those of our licensors; potential violations of the intellectual property rights of others; risks associated with counterfeit versions of our products; our ability to attract and retain qualified employees and maintain our corporate culture; our use of third-party manufacturing; risks associated with our international operations; changes in effective tax rates or tax law; foreign currency exchange rate exposure; the possibility or existence of global and regional economic downturns; our dependence on vendors and outsourcers; risks relating to government regulation; risks relating to litigation, including products liability claims and securities class action litigation; any failure to successfully integrate or realize the anticipated benefits of acquisitions or investments; reputational risk resulting from our e-commerce business and social media presence; risks relating to our indebtedness and our ability to secure additional financing; the potential for our electronic data or the electronic data of our customers to be compromised; the influence of our significant stockholder, ACON, and the possibility that ACON’s interests may conflict with the interests of our other stockholders; risks relating to our organizational structure; volatility in the price of our Class A common stock; risks associated with our internal control over financial reporting; and the important factors discussed under the caption “Risk Factors” in our Quarterly Report on Form 10-Q for the quarter ended September 30, 2021 and our other filings with the Securities and Exchange Commission. Because forward-looking statements are inherently subject to risks and uncertainties, some of which cannot be predicted or quantified, you should not rely on these forward-looking statements as predictions of future events. The events and circumstances reflected in our forward-looking statements may not be achieved or occur and actual results could differ materially from those projected in the forward-looking statements. In addition, statements that “we believe” and similar statements reflect our beliefs and opinions on the relevant subject. These statements are based upon information available to us as of the date hereof, and while we believe such information forms a reasonable basis for such statements, such information may be limited or incomplete, and our statements should not be read to indicate that we have conducted an exhaustive inquiry into, or review of, all potentially available relevant information. These statements are inherently uncertain and investors are cautioned not to unduly rely upon these statements. You should read this presentation with the understanding that our actual future results, levels of activity, performance and achievements may be materially different from what we expect. We qualify all of our forward-looking statements by these cautionary statements. These forward-looking statements speak only as of the date of this presentation, and except as otherwise required by law, we do not plan to publicly update or revise any forward-looking statements contained in this presentation, whether as a result of any new information, future events or otherwise. Unless otherwise indicated, information contained in this presentation concerning our industry, competitive position and the markets in which we operate is based on information from independent industry and research organizations, other third-party sources and management estimates. Management estimates are derived from publicly available information released by independent industry analysts and other third-party sources, as well as data from our internal research, and are based on assumptions made by us upon reviewing such data, and our experience in, and knowledge of, such industry and markets, which we believe to be reasonable. In addition, projections, assumptions and estimates of the future performance of the industry in which we operate and our future performance are necessarily subject to uncertainty and risk due to a variety of factors, including those described above. These and other factors could cause results to differ materially from those expressed in the estimates made by independent parties and by us.


3 FUNKO 2021 is built on the principle that everyone is a fan of something…


4 FUNKO 2021 … and Funko Has Something for Every Fan Movies TV Music Sports Anime Games Note: Represents a sampling of our current portfolio offerings as of September 30, 2021.


FUNKO 2019 BRAND COLORS FUNKO BLUE RGB 0,124, 236 CMYK 90, 45, 0, 0 #077CEC FUNKO GRAY RGB 242, 242, 242 CMYK 0, 0, 0, 15 #FEFEFE WHITE RGB 255, 255, 255 CMYK 0, 0, 0, 0 #FFFFFF YELLOW RGB 252, 195, 68 CMYK 0, 25, 80, 0 #FCC344 RED RGB 221, 44, 44 CMYK 10, 95, 95, 0 #DD2C2C PURPLE RGB 46, 30, 124 CMYK 95,100, 0, 5 #2E1E7C BLACK RGB 39, 39, 39 CMYK 0, 0, 0, 95 #272727 DARK GRAY RGB 76, 76, 76 CMYK 0, 0, 0, 85 #4C4C4C MEDIUM GRAY RGB 159, 159, 159 CMYK 0, 0, 0, 45 #9F9F9F LIGHT GRAY RGB 229, 229, 229 CMYK 0, 0, 0, 25 #E5E5E5 HOLLYWOOD UPDATE 5 Q3 Summary and Recent Operational Highlights Q3 2021 Financial Summary Q3 2021 Operational Highlights • Net sales increased 40.0% to $267.7 millions • Net income increased 17.8% million to $18.4 million • Net income margin contracted 130 bps to 6.9% • Adjusted EBITDA(1) increased 11.0% to $40.2 million • Adjusted EBITDA margin(1) contracted 390 bps to 15.0% • Cash flow from operations of $78.8 million • Total liquidity(2) increased 80.8% to $193.2 million • Exceeded Q3 expectations and raised full year guidance despite unprecedented supply chain headwinds. • All-time high demand driving broad-based strength ◦ U.S. net sales increased 35.7% y/y ◦ Europe net sales increased 65.7% y/y ◦ Other International net sales increased 19.1% y/y • Direct-to-consumer sales increased 88% y/y and now comprise 11% of net sales, driven by sustained traffic growth and increased e-commerce efficiency. • Launched multiple Digital Pop! NFT collections, all of which sold out in minutes. • In partnership with TokenWave, Funko officially opened our new digital marketplace, Droppp.io. Droppp.io creates a more accessible, user-friendly interface as we build out our digital products business. (1) Adjusted EBITDA and Adjusted EBITDA margin are non-GAAP measures. Please see the Supplemental Financial Information section for a reconciliation to the most directly comparable US GAAP measures for Adjusted EBITDA. Adjusted EBITDA margin is defined as Adjusted EBITDA divided by net sales. (2) Total liquidity is calculated as cash and cash equivalents plus availability under the Company’s $100 million revolving credit facility.


HOLLYWOOD UPDATE 6 Q3 & TD Earnings Summary Q3’21 Q3’20 % Change Net sales Gross profit(1) Gross margin %(1) SG&A D&A Income from operations Operating margin % Net income (loss) Net income (loss) margin % Adjusted net income(2) Adjusted net income margin %(2) Adjusted earnings per share(2) Adjusted EBITDA(2) Adjusted EBITDA margin %(2) $ millions, except per share amounts, unaudited $267.7 40.0% $96.4 30.8% 36.0% $26.2 26.7% 9.8% $0.39 25.8% $40.2 11.0% 15.0% $21.1 31.3% 7.9% $18.4 17.8% 1. Gross Profit and Gross Margin are calculated exclusive of depreciation and amortization. 2. Adjusted EBITDA, Adjusted EBITDA margin, Adjusted Net Income (Loss), Adjusted Net Income (Loss) Margin and Adjusted Earnings per Share are non-GAAP measures. Please see the Supplemental Financial Information section for a reconciliation to the most directly comparable US GAAP measures for Adjusted EBITDA, Adjusted Net Income (Loss) and Adjusted Earnings (Loss) per Share. Adjusted EBITDA margin is defined as Adjusted EBITDA divided by Net Sales. Adjusted Net Income (Loss) Margin is defined as Adjusted Net Income (Loss) divided by Net Sales. 59.9 10.3 (13.1)% 45.5% 6.9% YTD’21 YTD’20 % Change $693.0 62.7% $267.1 61.9% 38.5% $70.3 nm 10.1% $1.04 nm $111.0 136.1% 16.0% $55.7 nm 8.0% $50.4 nm (9.3)% 30.1%166.0 30.8 7.3% $191.2 $73.7 38.6% $20.7 10.8% $0.31 $36,191 18.9% $16.1 8.4% $15.6 41.2 11.9 8.2% $426.0 $164.9 38.7% $3.4 0.8% $0.07 $47.0 11.0% $3.6 0.9% $(5.1) 127.6 33.9 (1.2)%


FUNKO 2019 BRAND COLORS FUNKO BLUE RGB 0,124, 236 CMYK 90, 45, 0, 0 #077CEC FUNKO GRAY RGB 242, 242, 242 CMYK 0, 0, 0, 15 #FEFEFE WHITE RGB 255, 255, 255 CMYK 0, 0, 0, 0 #FFFFFF YELLOW RGB 252, 195, 68 CMYK 0, 25, 80, 0 #FCC344 RED RGB 221, 44, 44 CMYK 10, 95, 95, 0 #DD2C2C PURPLE RGB 46, 30, 124 CMYK 95,100, 0, 5 #2E1E7C BLACK RGB 39, 39, 39 CMYK 0, 0, 0, 95 #272727 DARK GRAY RGB 76, 76, 76 CMYK 0, 0, 0, 85 #4C4C4C MEDIUM GRAY RGB 159, 159, 159 CMYK 0, 0, 0, 45 #9F9F9F LIGHT GRAY RGB 229, 229, 229 CMYK 0, 0, 0, 25 #E5E5E5 HOLLYWOOD UPDATE 7 Q3 Active Properties & Net Sales per Active Property Third Quarter Active Properties up 12.7% Net Sales per Active Property up 24.2% Active Properties Net Sales per Active Property Funko is built on having a large and diverse set of licenses with the ability to leverage evergreen content Net sales per active property increased in the quarter reflecting record demand levels $ in thousands, unaudited Active Properties & Net Sales per Active Property Year-to-Date Active Properties up 11.3% Net Sales per Active Property up 46.1% 715 806 $267 $332 Q3'20 Q3'21 805 896 $529 $773 YTD’20 YTD’21


FUNKO 2019 BRAND COLORS FUNKO BLUE RGB 0,124, 236 CMYK 90, 45, 0, 0 #077CEC FUNKO GRAY RGB 242, 242, 242 CMYK 0, 0, 0, 15 #FEFEFE WHITE RGB 255, 255, 255 CMYK 0, 0, 0, 0 #FFFFFF YELLOW RGB 252, 195, 68 CMYK 0, 25, 80, 0 #FCC344 RED RGB 221, 44, 44 CMYK 10, 95, 95, 0 #DD2C2C PURPLE RGB 46, 30, 124 CMYK 95,100, 0, 5 #2E1E7C BLACK RGB 39, 39, 39 CMYK 0, 0, 0, 95 #272727 DARK GRAY RGB 76, 76, 76 CMYK 0, 0, 0, 85 #4C4C4C MEDIUM GRAY RGB 159, 159, 159 CMYK 0, 0, 0, 45 #9F9F9F LIGHT GRAY RGB 229, 229, 229 CMYK 0, 0, 0, 25 #E5E5E5 HOLLYWOOD UPDATE 8 Top Properties Breakout 1 2 3 5 7 4 6 8 9 10 Top 10 Properties % of Net Sales The top property in Q3’21 represented 6% of sales Evergreen properties accounted for 66% of sales in Q3’21 Q4’20 33% 6%* 40% Q1’21 30% 4%*7%* Q3’21 Commentary Q2’21 31% 6%* *% of net sales Q3’21 33% 6%* Q3’20


FUNKO 2019 BRAND COLORS FUNKO BLUE RGB 0,124, 236 CMYK 90, 45, 0, 0 #077CEC FUNKO GRAY RGB 242, 242, 242 CMYK 0, 0, 0, 15 #FEFEFE WHITE RGB 255, 255, 255 CMYK 0, 0, 0, 0 #FFFFFF YELLOW RGB 252, 195, 68 CMYK 0, 25, 80, 0 #FCC344 RED RGB 221, 44, 44 CMYK 10, 95, 95, 0 #DD2C2C PURPLE RGB 46, 30, 124 CMYK 95,100, 0, 5 #2E1E7C BLACK RGB 39, 39, 39 CMYK 0, 0, 0, 95 #272727 DARK GRAY RGB 76, 76, 76 CMYK 0, 0, 0, 85 #4C4C4C MEDIUM GRAY RGB 159, 159, 159 CMYK 0, 0, 0, 45 #9F9F9F LIGHT GRAY RGB 229, 229, 229 CMYK 0, 0, 0, 25 #E5E5E5 HOLLYWOOD UPDATE 9 Q3 & TD Product Category Performance 42.0% Increase 33.8% Increase The Figures category grew 42.0% in Q3 driven by recovery in the specialty channel as well as strength in DTC and third party e-commerce; Funko’s Other product category grew 33.8% in Q3, driven by strength within our Loungefly branded products as well as board games and plush. Figures Third Quarter Year-to-Date Other (Non-figures) Third Quarter Year-to-Date 63.0% Increase 61.6% Increase $ in millions, unaudited $145.0 $206.0 Q3’20 Q3’21 $333.7 $543.8 YTD’20 YTD’21 $46.2 $61.8 Q3’20 Q3’21 $92.3 $149.2 YTD’20 YTD’21


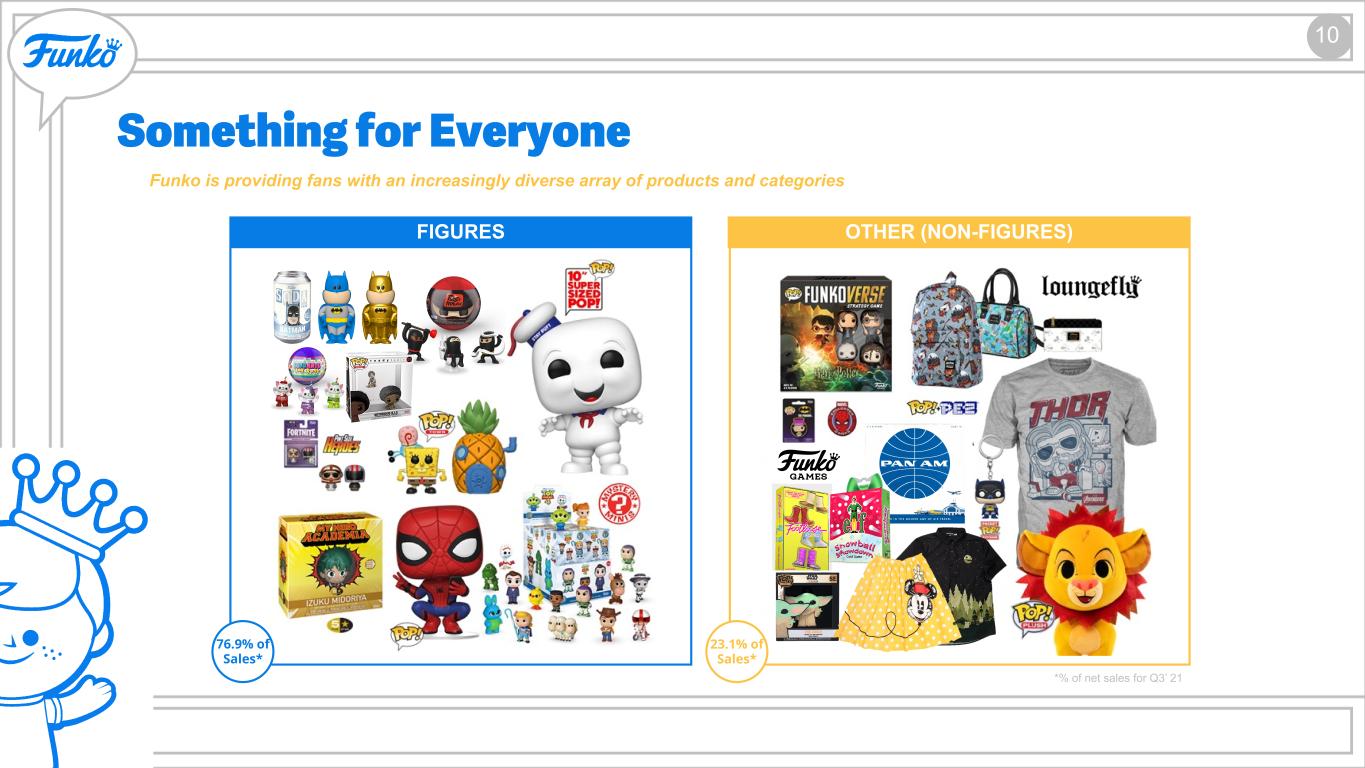
FUNKO 2019 BRAND COLORS FUNKO BLUE RGB 0,124, 236 CMYK 90, 45, 0, 0 #077CEC FUNKO GRAY RGB 242, 242, 242 CMYK 0, 0, 0, 15 #FEFEFE WHITE RGB 255, 255, 255 CMYK 0, 0, 0, 0 #FFFFFF YELLOW RGB 252, 195, 68 CMYK 0, 25, 80, 0 #FCC344 RED RGB 221, 44, 44 CMYK 10, 95, 95, 0 #DD2C2C PURPLE RGB 46, 30, 124 CMYK 95,100, 0, 5 #2E1E7C BLACK RGB 39, 39, 39 CMYK 0, 0, 0, 95 #272727 DARK GRAY RGB 76, 76, 76 CMYK 0, 0, 0, 85 #4C4C4C MEDIUM GRAY RGB 159, 159, 159 CMYK 0, 0, 0, 45 #9F9F9F LIGHT GRAY RGB 229, 229, 229 CMYK 0, 0, 0, 25 #E5E5E5 HOLLYWOOD UPDATE 10 Something for Everyone FIGURES OTHER (NON-FIGURES) *% of net sales for Q3’ 21 76.9% of Sales* 23.1% of Sales* Funko is providing fans with an increasingly diverse array of products and categories


FUNKO 2019 BRAND COLORS FUNKO BLUE RGB 0,124, 236 CMYK 90, 45, 0, 0 #077CEC FUNKO GRAY RGB 242, 242, 242 CMYK 0, 0, 0, 15 #FEFEFE WHITE RGB 255, 255, 255 CMYK 0, 0, 0, 0 #FFFFFF YELLOW RGB 252, 195, 68 CMYK 0, 25, 80, 0 #FCC344 RED RGB 221, 44, 44 CMYK 10, 95, 95, 0 #DD2C2C PURPLE RGB 46, 30, 124 CMYK 95,100, 0, 5 #2E1E7C BLACK RGB 39, 39, 39 CMYK 0, 0, 0, 95 #272727 DARK GRAY RGB 76, 76, 76 CMYK 0, 0, 0, 85 #4C4C4C MEDIUM GRAY RGB 159, 159, 159 CMYK 0, 0, 0, 45 #9F9F9F LIGHT GRAY RGB 229, 229, 229 CMYK 0, 0, 0, 25 #E5E5E5 HOLLYWOOD UPDATE 11 Q3 Product Brand Performance Pop! 41.3% Increase Both Pop! and Loungefly branded products generated strong growth in the Specialty channel, as well as continued strength in direct-to-consumer and third-party e-commerce channels; Other branded products growth was driven by games, plush and action figures Loungefly Other 36.3% Increase 37.3% Increase $ in millions, unaudited $136.7 $193.1 Q3’20 Q3’21 $27.0 $36.8 Q3’20 Q3’21 $27.5 $37.8 Q3’20 Q3’21


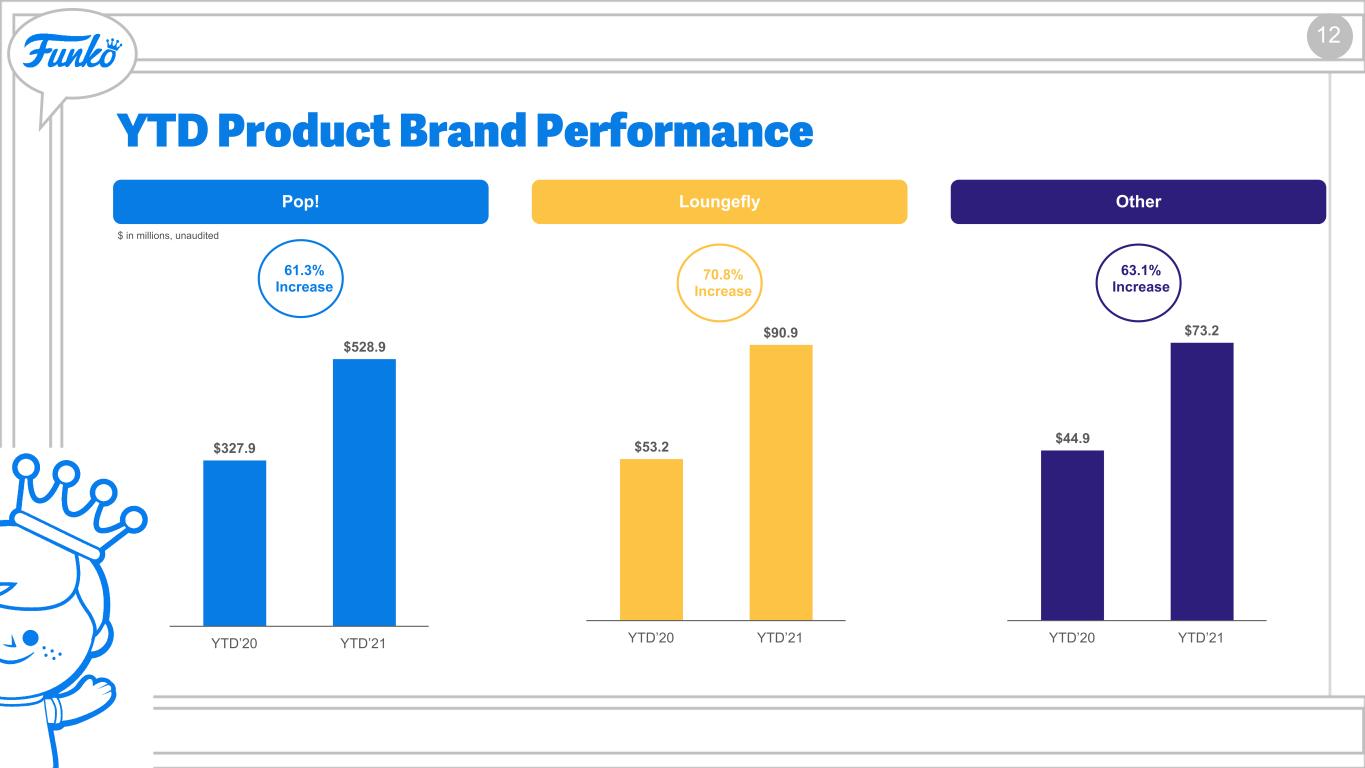
FUNKO 2019 BRAND COLORS FUNKO BLUE RGB 0,124, 236 CMYK 90, 45, 0, 0 #077CEC FUNKO GRAY RGB 242, 242, 242 CMYK 0, 0, 0, 15 #FEFEFE WHITE RGB 255, 255, 255 CMYK 0, 0, 0, 0 #FFFFFF YELLOW RGB 252, 195, 68 CMYK 0, 25, 80, 0 #FCC344 RED RGB 221, 44, 44 CMYK 10, 95, 95, 0 #DD2C2C PURPLE RGB 46, 30, 124 CMYK 95,100, 0, 5 #2E1E7C BLACK RGB 39, 39, 39 CMYK 0, 0, 0, 95 #272727 DARK GRAY RGB 76, 76, 76 CMYK 0, 0, 0, 85 #4C4C4C MEDIUM GRAY RGB 159, 159, 159 CMYK 0, 0, 0, 45 #9F9F9F LIGHT GRAY RGB 229, 229, 229 CMYK 0, 0, 0, 25 #E5E5E5 HOLLYWOOD UPDATE 12 YTD Product Brand Performance Pop! 61.3% Increase Loungefly Other 70.8% Increase 63.1% Increase $ in millions, unaudited $327.9 $528.9 YTD’20 YTD’21 $53.2 $90.9 YTD’20 YTD’21 $44.9 $73.2 YTD’20 YTD’21


FUNKO 2019 BRAND COLORS FUNKO BLUE RGB 0,124, 236 CMYK 90, 45, 0, 0 #077CEC FUNKO GRAY RGB 242, 242, 242 CMYK 0, 0, 0, 15 #FEFEFE WHITE RGB 255, 255, 255 CMYK 0, 0, 0, 0 #FFFFFF YELLOW RGB 252, 195, 68 CMYK 0, 25, 80, 0 #FCC344 RED RGB 221, 44, 44 CMYK 10, 95, 95, 0 #DD2C2C PURPLE RGB 46, 30, 124 CMYK 95,100, 0, 5 #2E1E7C BLACK RGB 39, 39, 39 CMYK 0, 0, 0, 95 #272727 DARK GRAY RGB 76, 76, 76 CMYK 0, 0, 0, 85 #4C4C4C MEDIUM GRAY RGB 159, 159, 159 CMYK 0, 0, 0, 45 #9F9F9F LIGHT GRAY RGB 229, 229, 229 CMYK 0, 0, 0, 25 #E5E5E5 HOLLYWOOD UPDATE 13 Q3 Geographic Performance United States 35.7% increase Europe Other International 65.7% increase 19.1% increase $ in millions, unaudited $140.9 $191.3 Q3'20 Q3'21 $35.5 $58.9 Q3’20 Q3’21 $14.8 $17.6 Q3’20 Q3’21 The United States region grew 35.7% and Europe grew 65.7%, with strength across all channels and product categories; Other International grew 19.1% with all regions generating growth in the quarter


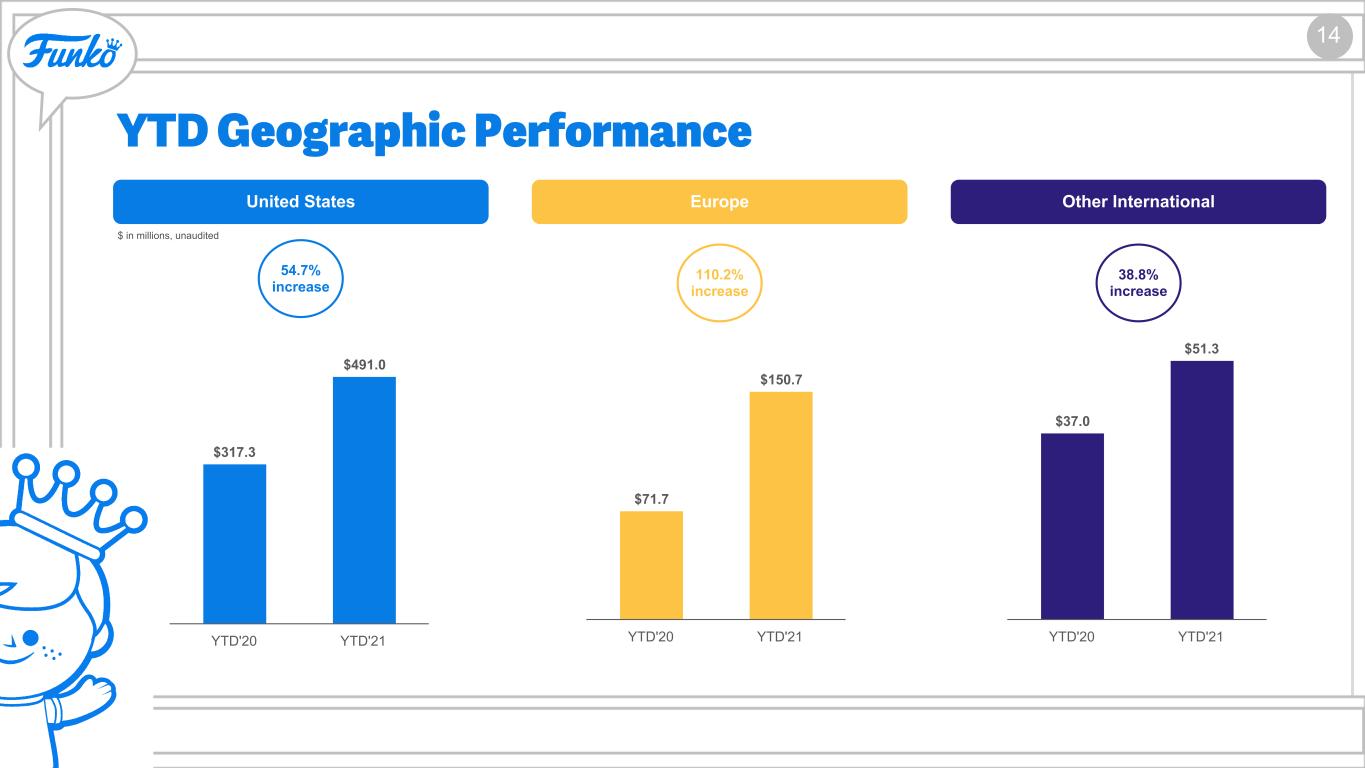
FUNKO 2019 BRAND COLORS FUNKO BLUE RGB 0,124, 236 CMYK 90, 45, 0, 0 #077CEC FUNKO GRAY RGB 242, 242, 242 CMYK 0, 0, 0, 15 #FEFEFE WHITE RGB 255, 255, 255 CMYK 0, 0, 0, 0 #FFFFFF YELLOW RGB 252, 195, 68 CMYK 0, 25, 80, 0 #FCC344 RED RGB 221, 44, 44 CMYK 10, 95, 95, 0 #DD2C2C PURPLE RGB 46, 30, 124 CMYK 95,100, 0, 5 #2E1E7C BLACK RGB 39, 39, 39 CMYK 0, 0, 0, 95 #272727 DARK GRAY RGB 76, 76, 76 CMYK 0, 0, 0, 85 #4C4C4C MEDIUM GRAY RGB 159, 159, 159 CMYK 0, 0, 0, 45 #9F9F9F LIGHT GRAY RGB 229, 229, 229 CMYK 0, 0, 0, 25 #E5E5E5 HOLLYWOOD UPDATE 14 YTD Geographic Performance United States 54.7% increase Europe Other International 110.2% increase 38.8% increase $ in millions, unaudited $317.3 $491.0 YTD'20 YTD'21 $71.7 $150.7 YTD'20 YTD'21 $37.0 $51.3 YTD'20 YTD'21


FUNKO 2019 BRAND COLORS FUNKO BLUE RGB 0,124, 236 CMYK 90, 45, 0, 0 #077CEC FUNKO GRAY RGB 242, 242, 242 CMYK 0, 0, 0, 15 #FEFEFE WHITE RGB 255, 255, 255 CMYK 0, 0, 0, 0 #FFFFFF YELLOW RGB 252, 195, 68 CMYK 0, 25, 80, 0 #FCC344 RED RGB 221, 44, 44 CMYK 10, 95, 95, 0 #DD2C2C PURPLE RGB 46, 30, 124 CMYK 95,100, 0, 5 #2E1E7C BLACK RGB 39, 39, 39 CMYK 0, 0, 0, 95 #272727 DARK GRAY RGB 76, 76, 76 CMYK 0, 0, 0, 85 #4C4C4C MEDIUM GRAY RGB 159, 159, 159 CMYK 0, 0, 0, 45 #9F9F9F LIGHT GRAY RGB 229, 229, 229 CMYK 0, 0, 0, 25 #E5E5E5 HOLLYWOOD UPDATE 15 Q3 & TD Adjusted EBITDA(1) Adjusted EBITDA(1) Third Quarter Year-to-Date Adjusted EBITDA Margin(1) 1. See Supplemental Financial Information section for a reconciliation of Adjusted EBITDA, a non-GAAP measure, to the most directly comparable US GAAP measure. Adjusted EBITDA Margin is defined as Adjusted EBITDA divided by net sales. 18.9% 15.0% 6.6%11.0% 16.0 Inflationary supply chain pressures reduced Adjusted EBITDA margin(1) 390 basis points y/y to 15.0% in Q3 $ in millions, unaudited $36.2 $40.2 Q3’20 Q3’21 $47.0 $111.0 YTD’20 YTD’21


FUNKO 2019 BRAND COLORS FUNKO BLUE RGB 0,124, 236 CMYK 90, 45, 0, 0 #077CEC FUNKO GRAY RGB 242, 242, 242 CMYK 0, 0, 0, 15 #FEFEFE WHITE RGB 255, 255, 255 CMYK 0, 0, 0, 0 #FFFFFF YELLOW RGB 252, 195, 68 CMYK 0, 25, 80, 0 #FCC344 RED RGB 221, 44, 44 CMYK 10, 95, 95, 0 #DD2C2C PURPLE RGB 46, 30, 124 CMYK 95,100, 0, 5 #2E1E7C BLACK RGB 39, 39, 39 CMYK 0, 0, 0, 95 #272727 DARK GRAY RGB 76, 76, 76 CMYK 0, 0, 0, 85 #4C4C4C MEDIUM GRAY RGB 159, 159, 159 CMYK 0, 0, 0, 45 #9F9F9F LIGHT GRAY RGB 229, 229, 229 CMYK 0, 0, 0, 25 #E5E5E5 HOLLYWOOD UPDATE 16 Q3 & TD Adjusted Net Income (Loss)(1) 1. See Supplemental Financial Information section for a reconciliation of Adjusted Net Income (Loss), a non-GAAP measure, to the most directly comparable US GAAP measure. Adjusted Net Income Margin is defined as Adjusted Net Income (Loss) divided by net sales. Adjusted Net Income (Loss)(1) Third Quarter Year-to-Date Adjusted Net Income (Loss) Margin(1) 8.4% 7.9% 6%0.9% 8.0 Q3 Adjusted Net Income (Loss) margin(1) declined 50 basis points y/y reflecting higher supply chain costs, partially offset by much operating leverage $ in millions, unaudited $16.1 $21.1 Q3’20 Q3’21 $3.6 $55.7 YTD’20 YTD’21


FUNKO 2019 BRAND COLORS FUNKO BLUE RGB 0,124, 236 CMYK 90, 45, 0, 0 #077CEC FUNKO GRAY RGB 242, 242, 242 CMYK 0, 0, 0, 15 #FEFEFE WHITE RGB 255, 255, 255 CMYK 0, 0, 0, 0 #FFFFFF YELLOW RGB 252, 195, 68 CMYK 0, 25, 80, 0 #FCC344 RED RGB 221, 44, 44 CMYK 10, 95, 95, 0 #DD2C2C PURPLE RGB 46, 30, 124 CMYK 95,100, 0, 5 #2E1E7C BLACK RGB 39, 39, 39 CMYK 0, 0, 0, 95 #272727 DARK GRAY RGB 76, 76, 76 CMYK 0, 0, 0, 85 #4C4C4C MEDIUM GRAY RGB 159, 159, 159 CMYK 0, 0, 0, 45 #9F9F9F LIGHT GRAY RGB 229, 229, 229 CMYK 0, 0, 0, 25 #E5E5E5 HOLLYWOOD UPDATE 17 Key Balance Sheet Highlights 1. Total Debt is defined as the amount outstanding under the Company’s Line of Credit plus Current Portion of Long-Term Debt, Net of Unamortized Discount plus Long-Term Debt, Net of Unamortized Discount 2. Total liquidity is calculated as cash and cash equivalents plus availability under the Company’s $100.0 million revolving credit facility. 9/30/20 YoY % Change Cash & Cash Equivalents Accounts Receivable, net Inventory Total Debt(1) $31.9 $136.3 $72.6 $208.1 $ in millions, unaudited 192.3% 12.7% 94.0% (14.7)% 9/30/21 $93.2 $153.7 $140.8 $177.6 Total Liquidity(2) $106.9 80.8%$193.2


FUNKO 2019 BRAND COLORS FUNKO BLUE RGB 0,124, 236 CMYK 90, 45, 0, 0 #077CEC FUNKO GRAY RGB 242, 242, 242 CMYK 0, 0, 0, 15 #FEFEFE WHITE RGB 255, 255, 255 CMYK 0, 0, 0, 0 #FFFFFF YELLOW RGB 252, 195, 68 CMYK 0, 25, 80, 0 #FCC344 RED RGB 221, 44, 44 CMYK 10, 95, 95, 0 #DD2C2C PURPLE RGB 46, 30, 124 CMYK 95,100, 0, 5 #2E1E7C BLACK RGB 39, 39, 39 CMYK 0, 0, 0, 95 #272727 DARK GRAY RGB 76, 76, 76 CMYK 0, 0, 0, 85 #4C4C4C MEDIUM GRAY RGB 159, 159, 159 CMYK 0, 0, 0, 45 #9F9F9F LIGHT GRAY RGB 229, 229, 229 CMYK 0, 0, 0, 25 #E5E5E5 HOLLYWOOD UPDATE 18 Liquidity Overview 1. Total liquidity is calculated as cash and cash equivalents plus availability under the Company’s $100..0 million revolving credit facility. Funko’s liquidity position remains strong and increased 80.8% from Q3’20 levels to $193.2 million Total Liquidity(1) 2020 2021 $ in millions, unaudited $87.0 $106.9 $127.3 $149.7 $170.5 $193.2 Q2’20 Q3’20 Q4’20 Q1’21 Q2’21 Q3’21


FUNKO 2019 BRAND COLORS FUNKO BLUE RGB 0,124, 236 CMYK 90, 45, 0, 0 #077CEC FUNKO GRAY RGB 242, 242, 242 CMYK 0, 0, 0, 15 #FEFEFE WHITE RGB 255, 255, 255 CMYK 0, 0, 0, 0 #FFFFFF YELLOW RGB 252, 195, 68 CMYK 0, 25, 80, 0 #FCC344 RED RGB 221, 44, 44 CMYK 10, 95, 95, 0 #DD2C2C PURPLE RGB 46, 30, 124 CMYK 95,100, 0, 5 #2E1E7C BLACK RGB 39, 39, 39 CMYK 0, 0, 0, 95 #272727 DARK GRAY RGB 76, 76, 76 CMYK 0, 0, 0, 85 #4C4C4C MEDIUM GRAY RGB 159, 159, 159 CMYK 0, 0, 0, 45 #9F9F9F LIGHT GRAY RGB 229, 229, 229 CMYK 0, 0, 0, 25 #E5E5E5 HOLLYWOOD UPDATE 19 Debt Overview 1. Total Debt is defined as the amount outstanding under the Company’s Line of Credit plus Current Portion of Long-Term Debt, Net of Unamortized Discount plus Long-Term Debt, Net of Unamortized Discount Total debt decreased 14.7% from Q3’20 Total Debt(1) $ in millions, unaudited 2020 2021 $239.9 $208.1 $190.8 $183.0 $177.4 $177.6 Q2’20 Q3’20 Q4’20 Q1’21 Q2’21 Q3’21


FUNKO 2019 BRAND COLORS FUNKO BLUE RGB 0,124, 236 CMYK 90, 45, 0, 0 #077CEC FUNKO GRAY RGB 242, 242, 242 CMYK 0, 0, 0, 15 #FEFEFE WHITE RGB 255, 255, 255 CMYK 0, 0, 0, 0 #FFFFFF YELLOW RGB 252, 195, 68 CMYK 0, 25, 80, 0 #FCC344 RED RGB 221, 44, 44 CMYK 10, 95, 95, 0 #DD2C2C PURPLE RGB 46, 30, 124 CMYK 95,100, 0, 5 #2E1E7C BLACK RGB 39, 39, 39 CMYK 0, 0, 0, 95 #272727 DARK GRAY RGB 76, 76, 76 CMYK 0, 0, 0, 85 #4C4C4C MEDIUM GRAY RGB 159, 159, 159 CMYK 0, 0, 0, 45 #9F9F9F LIGHT GRAY RGB 229, 229, 229 CMYK 0, 0, 0, 25 #E5E5E5 Supplemental Financial Information


FUNKO 2019 BRAND COLORS FUNKO BLUE RGB 0,124, 236 CMYK 90, 45, 0, 0 #077CEC FUNKO GRAY RGB 242, 242, 242 CMYK 0, 0, 0, 15 #FEFEFE WHITE RGB 255, 255, 255 CMYK 0, 0, 0, 0 #FFFFFF YELLOW RGB 252, 195, 68 CMYK 0, 25, 80, 0 #FCC344 RED RGB 221, 44, 44 CMYK 10, 95, 95, 0 #DD2C2C PURPLE RGB 46, 30, 124 CMYK 95,100, 0, 5 #2E1E7C BLACK RGB 39, 39, 39 CMYK 0, 0, 0, 95 #272727 DARK GRAY RGB 76, 76, 76 CMYK 0, 0, 0, 85 #4C4C4C MEDIUM GRAY RGB 159, 159, 159 CMYK 0, 0, 0, 45 #9F9F9F LIGHT GRAY RGB 229, 229, 229 CMYK 0, 0, 0, 25 #E5E5E5 HOLLYWOOD UPDATE 21 Condensed Consolidated Statements of Operations (Unaudited) Three Months Ended September 30, Nine Months Ended September 30, 2021 2020 2021 2020 (In thousands, except per share data) Net sales $ 267,733 $ 191,229 $ 693,020 $ 426,028 Cost of sales (exclusive of depreciation and amortization shown separately below) 171,320 117,504 425,929 261,103 Selling, general, and administrative expenses 59,890 41,167 166,032 127,590 Depreciation and amortization 10,328 11,887 30,778 33,947 Total operating expenses 241,538 170,558 622,739 422,640 Income from operations 26,195 20,671 70,281 3,388 Interest expense, net 1,711 2,875 5,921 8,221 Loss on debt extinguishment 675 — 675 — Other (income) expense, net (505) 779 466 1,450 Income (loss) before income taxes 24,314 17,017 63,219 (6,283) Income tax expense (benefit) 5,939 1,420 12,814 (1,139) Net income (loss) 18,375 15,597 50,405 (5,144) Less: net income (loss) attributable to non-controlling interests 6,474 5,801 18,177 (229) Net income (loss) attributable to Funko, Inc. $ 11,901 $ 9,796 $ 32,228 $ (4,915) Earnings (loss) per share of Class A common stock: Basic $ 0.30 $ 0.28 $ 0.85 $ (0.14) Diluted $ 0.28 $ 0.27 $ 0.80 $ (0.14) Weighted average shares of Class A common stock outstanding: Basic 39,448 35,483 37,856 35,155 Diluted 41,796 35,904 40,079 35,155


FUNKO 2019 BRAND COLORS FUNKO BLUE RGB 0,124, 236 CMYK 90, 45, 0, 0 #077CEC FUNKO GRAY RGB 242, 242, 242 CMYK 0, 0, 0, 15 #FEFEFE WHITE RGB 255, 255, 255 CMYK 0, 0, 0, 0 #FFFFFF YELLOW RGB 252, 195, 68 CMYK 0, 25, 80, 0 #FCC344 RED RGB 221, 44, 44 CMYK 10, 95, 95, 0 #DD2C2C PURPLE RGB 46, 30, 124 CMYK 95,100, 0, 5 #2E1E7C BLACK RGB 39, 39, 39 CMYK 0, 0, 0, 95 #272727 DARK GRAY RGB 76, 76, 76 CMYK 0, 0, 0, 85 #4C4C4C MEDIUM GRAY RGB 159, 159, 159 CMYK 0, 0, 0, 45 #9F9F9F LIGHT GRAY RGB 229, 229, 229 CMYK 0, 0, 0, 25 #E5E5E5 HOLLYWOOD UPDATE 22 Condensed Consolidated Balance Sheets (Unaudited) September 30, 2021 December 31, 2020 (In thousands, except per share amounts) Assets Current assets: Cash and cash equivalents $ 93,245 $ 52,255 Accounts receivable, net 153,655 131,837 Inventory 140,834 59,773 Prepaid expenses and other current assets 23,790 15,486 Total current assets 411,524 259,351 Property and equipment, net 54,831 56,141 Operating lease right-of-use assets 52,831 58,079 Goodwill 126,612 125,061 Intangible assets, net 193,666 205,541 Deferred tax asset 70,339 54,682 Other assets 5,104 4,735 Total assets $ 914,907 $ 763,590 Liabilities and Stockholders’ Equity Current liabilities: Current portion of long-term debt, net of unamortized discount $ 17,378 $ 10,758 Current portion of operating lease liabilities 15,187 13,840 Accounts payable 63,936 29,199 Income taxes payable 10,544 425 Accrued royalties 47,611 40,525 Accrued expenses and other current liabilities 89,019 43,949 Total current liabilities 243,675 138,696 Long-term debt, net of unamortized discount 160,172 180,012 Operating lease liabilities, net of current portion 50,495 57,512 Deferred tax liability 769 780 Liabilities under tax receivable agreement, net of current portion 80,787 60,297 Other long-term liabilities 5,135 3,848 Commitments and Contingencies Stockholders’ equity: Class A common stock, par value $0.0001 per share, 200,000 shares authorized; 39,749 and 35,657 shares issued and outstanding as of September 30, 2021 and December 31, 2020, respectively 4 4 Class B common stock, par value $0.0001 per share, 50,000 shares authorized; 10,856 and 14,040 shares issued and outstanding as of September 30, 2021 and December 31, 2020, respectively 1 1 Additional paid-in-capital 245,859 216,141 Accumulated other comprehensive income 1,114 1,718 Retained earnings 56,631 24,403 Total stockholders’ equity attributable to Funko, Inc. 303,609 242,267 Non-controlling interests 70,265 80,178 Total stockholders’ equity 373,874 322,445 Total liabilities and stockholders’ equity $ 914,907 $ 763,590


FUNKO 2019 BRAND COLORS FUNKO BLUE RGB 0,124, 236 CMYK 90, 45, 0, 0 #077CEC FUNKO GRAY RGB 242, 242, 242 CMYK 0, 0, 0, 15 #FEFEFE WHITE RGB 255, 255, 255 CMYK 0, 0, 0, 0 #FFFFFF YELLOW RGB 252, 195, 68 CMYK 0, 25, 80, 0 #FCC344 RED RGB 221, 44, 44 CMYK 10, 95, 95, 0 #DD2C2C PURPLE RGB 46, 30, 124 CMYK 95,100, 0, 5 #2E1E7C BLACK RGB 39, 39, 39 CMYK 0, 0, 0, 95 #272727 DARK GRAY RGB 76, 76, 76 CMYK 0, 0, 0, 85 #4C4C4C MEDIUM GRAY RGB 159, 159, 159 CMYK 0, 0, 0, 45 #9F9F9F LIGHT GRAY RGB 229, 229, 229 CMYK 0, 0, 0, 25 #E5E5E5 HOLLYWOOD UPDATE 23 Condensed Consolidated Statements of Cash Flows (Unaudited) Nine Months Ended September 30, 2021 2020 (In thousands) Operating Activities Net income (loss) $ 50,405 $ (5,144) Adjustments to reconcile net income (loss) to net cash provided by operating activities: Depreciation, amortization and other 30,356 35,929 Equity-based compensation 9,869 7,494 Amortization of debt issuance costs and debt discounts 893 1,006 Loss on debt extinguishment 675 — Deferred tax expense 994 1,237 Other (93) 1,715 Changes in operating assets and liabilities: Accounts receivable, net (22,223) 13,507 Inventory (81,770) (11,115) Prepaid expenses and other assets (1,582) 15,163 Accounts payable 33,933 (1,595) Income taxes payable 10,135 (465) Accrued royalties 7,086 (3,045) Accrued expenses and other liabilities 40,114 5,658 Net cash provided by operating activities 78,792 60,345 Investing Activities Purchases of property and equipment (17,434) (14,704) Acquisitions of businesses and related intangible assets, net of cash 199 — Other 84 — Net cash used in investing activities (17,151) (14,704) Financing Activities Borrowings on line of credit — 28,267 Payments on line of credit — (55,103) Debt issuance costs (1,055) (569) Issuance of long-term debt 180,000 — Payments of long-term debt (193,875) (8,814) Contributions from continuing equity owners — 177 Distributions to continuing equity owners (9,284) (3,496) Payments under tax receivable agreement (6) (165) Proceeds from exercise of equity-based options 3,726 41 Net cash used in financing activities (20,494) (39,662) Effect of exchange rates on cash and cash equivalents (157) 687 Net increase in cash and cash equivalents 40,990 6,666 Cash and cash equivalents at beginning of period 52,255 25,229 Cash and cash equivalents at end of period $ 93,245 $ 31,895


FUNKO 2019 BRAND COLORS FUNKO BLUE RGB 0,124, 236 CMYK 90, 45, 0, 0 #077CEC FUNKO GRAY RGB 242, 242, 242 CMYK 0, 0, 0, 15 #FEFEFE WHITE RGB 255, 255, 255 CMYK 0, 0, 0, 0 #FFFFFF YELLOW RGB 252, 195, 68 CMYK 0, 25, 80, 0 #FCC344 RED RGB 221, 44, 44 CMYK 10, 95, 95, 0 #DD2C2C PURPLE RGB 46, 30, 124 CMYK 95,100, 0, 5 #2E1E7C BLACK RGB 39, 39, 39 CMYK 0, 0, 0, 95 #272727 DARK GRAY RGB 76, 76, 76 CMYK 0, 0, 0, 85 #4C4C4C MEDIUM GRAY RGB 159, 159, 159 CMYK 0, 0, 0, 45 #9F9F9F LIGHT GRAY RGB 229, 229, 229 CMYK 0, 0, 0, 25 #E5E5E5 HOLLYWOOD UPDATE 24 Reconciliation of Non-GAAP Financial Metrics (Unaudited) 1. Represents the reallocation of net income (loss) attributable to non-controlling interests from the assumed exchange of common units of FAH, LLC for Class A common stock in periods in which income (loss) was attributable to non-controlling interests. 2. Represents non-cash charges related to equity-based compensation programs, which vary from period to period depending on the timing of awards. 3. For the nine months ended September 30, 2021, represents severance, relocation and related costs associated with residual payment of global workforce reduction implemented in response to the COVID-19 pandemic. For the three and nine months ended September 30, 2020, represents severance, relocation and related costs associated with the consolidation of our warehouse facilities in the United Kingdom and charges related to the global workforce reduction implemented in response to the COVID-19 pandemic. 4. Represents write-off of unamortized debt financing fees for the three and nine months ended September 30, 2021. 5. Represents both unrealized and realized foreign currency losses on transactions denominated other than in U.S. dollars, including derivative gains and losses on foreign currency forward exchange contracts. 6. Represents the income tax (expense) benefit effect of the above adjustments. This adjustment uses an effective tax rate of 25% for all periods presented. 7. Adjusted net income margin is calculated as Adjusted net income as a percentage of net sales. Three Months Ended September 30, Nine Months Ended September 30, 2021 2020 2021 2020 (In thousands, except per share data) Net income (loss) attributable to Funko, Inc. $ 11,901 $ 9,796 $ 32,228 $ (4,915) Reallocation of net income (loss) attributable to non-controlling interests from the assumed exchange of common units of FAH, LLC for Class A common stock (1) 6,474 5,801 18,177 (229) Equity-based compensation (2) 3,658 2,456 9,869 7,494 Certain severance, relocation and related costs (3) — 1,178 81 2,184 Loss on debt extinguishment (4) 675 — 675 — Foreign currency transaction (gain) loss (5) (505) 778 466 1,449 Income tax expense (6) (1,097) (3,937) (5,764) (2,350) Adjusted net income $ 21,106 $ 16,072 $ 55,732 $ 3,633 Adjusted net income margin (7) 7.9 % 8.4 % 8.0 % 0.9 % Weighted-average shares of Class A common stock outstanding-basic 39,448 35,483 37,856 35,155 Equity-based compensation awards and common units of FAH, LLC that are convertible into Class A common stock 14,634 16,047 15,882 15,770 Adjusted weighted-average shares of Class A stock outstanding - diluted 54,082 51,530 53,738 50,925 Adjusted earnings per diluted share $ 0.39 $ 0.31 $ 1.04 $ 0.07


FUNKO 2019 BRAND COLORS FUNKO BLUE RGB 0,124, 236 CMYK 90, 45, 0, 0 #077CEC FUNKO GRAY RGB 242, 242, 242 CMYK 0, 0, 0, 15 #FEFEFE WHITE RGB 255, 255, 255 CMYK 0, 0, 0, 0 #FFFFFF YELLOW RGB 252, 195, 68 CMYK 0, 25, 80, 0 #FCC344 RED RGB 221, 44, 44 CMYK 10, 95, 95, 0 #DD2C2C PURPLE RGB 46, 30, 124 CMYK 95,100, 0, 5 #2E1E7C BLACK RGB 39, 39, 39 CMYK 0, 0, 0, 95 #272727 DARK GRAY RGB 76, 76, 76 CMYK 0, 0, 0, 85 #4C4C4C MEDIUM GRAY RGB 159, 159, 159 CMYK 0, 0, 0, 45 #9F9F9F LIGHT GRAY RGB 229, 229, 229 CMYK 0, 0, 0, 25 #E5E5E5 25 Reconciliation of Non-GAAP Financial Metrics (Unaudited) 2. Represents non-cash charges related to equity-based compensation programs, which vary from period to period depending on the timing of awards. 3. For the nine months ended September 30, 2021, represents severance, relocation and related costs associated with residual payment of global workforce reduction implemented in response to the COVID-19 pandemic. For the three and nine months ended September 30, 2020, represents severance, relocation and related costs associated with the consolidation of our warehouse facilities in the United Kingdom and charges related to the global workforce reduction implemented in response to the COVID-19 pandemic. 4. Represents write-off of unamortized debt financing fees for the three and nine months ended September 30, 2021. 5. Represents both unrealized and realized foreign currency gains and losses on transactions denominated other than in U.S. dollars, including derivative gains and losses on foreign currency forward exchange contracts. 8. Adjusted EBITDA margin is calculated as Adjusted EBITDA as a percentage of net sales. Three Months Ended September 30, Nine Months Ended September 30, 2021 2020 2021 2020 (amounts in thousands) Net income (loss) $ 18,375 $ 15,597 $ 50,405 $ (5,144) Interest expense, net 1,711 2,875 5,921 8,221 Income tax expense (benefit) 5,939 1,420 12,814 (1,139) Depreciation and amortization 10,328 11,887 30,778 33,947 EBITDA $ 36,353 $ 31,779 $ 99,918 $ 35,885 Adjustments: Equity-based compensation (2) 3,658 2,456 9,869 7,494 Certain severance, relocation and related costs (3) — 1,178 81 2,184 Loss on debt extinguishment (4) 675 — 675 — Foreign currency transaction (gain) loss (5) (505) 778 466 1,449 Adjusted EBITDA $ 40,181 $ 36,191 $ 111,009 $ 47,012 Adjusted EBITDA margin (8) 15.0 % 18.9 % 16.0 % 11.0 %


 
FUNKO 2019 BRAND COLORS FUNKO BLUE RGB 0,124, 236 CMYK 90, 45, 0, 0 #077CEC FUNKO GRAY RGB 242, 242, 242 CMYK 0, 0, 0, 15 #FEFEFE WHITE RGB 255, 255, 255 CMYK 0, 0, 0, 0 #FFFFFF YELLOW RGB 252, 195, 68 CMYK 0, 25, 80, 0 #FCC344 RED RGB 221, 44, 44 CMYK 10, 95, 95, 0 #DD2C2C PURPLE RGB 46, 30, 124 CMYK 95,100, 0, 5 #2E1E7C BLACK RGB 39, 39, 39 CMYK 0, 0, 0, 95 #272727 DARK GRAY RGB 76, 76, 76 CMYK 0, 0, 0, 85 #4C4C4C MEDIUM GRAY RGB 159, 159, 159 CMYK 0, 0, 0, 45 #9F9F9F LIGHT GRAY RGB 229, 229, 229 CMYK 0, 0, 0, 25 #E5E5E5