Funko Reports Second Quarter 2020 Financial Results
Successfully Launched New Products Across Multiple Categories
EVERETT, Wash. August 6, 2020-- Funko, Inc. ("Funko,” or the “Company”) (Nasdaq: FNKO), a leading pop culture consumer products company, today reported its consolidated financial results for the second quarter ended June 30, 2020.
Second Quarter 2020 Financial Summary
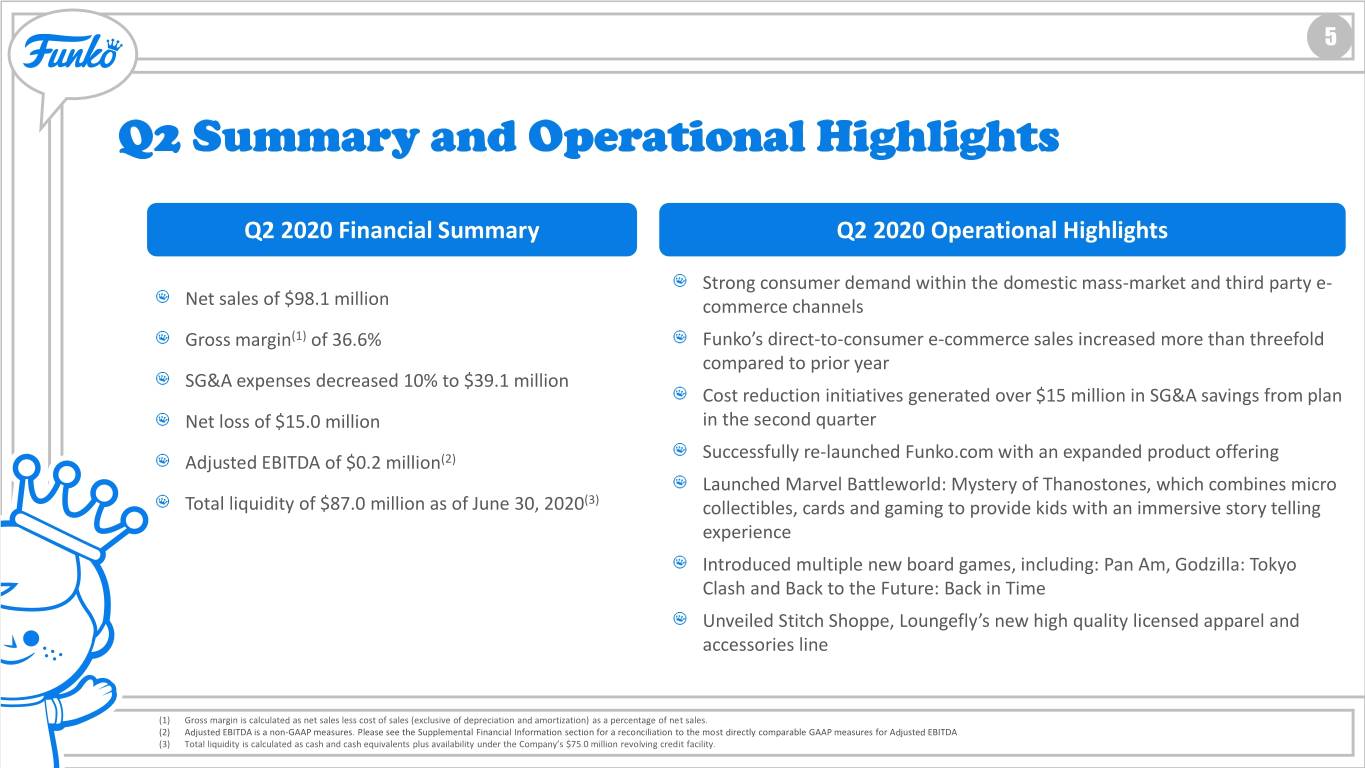
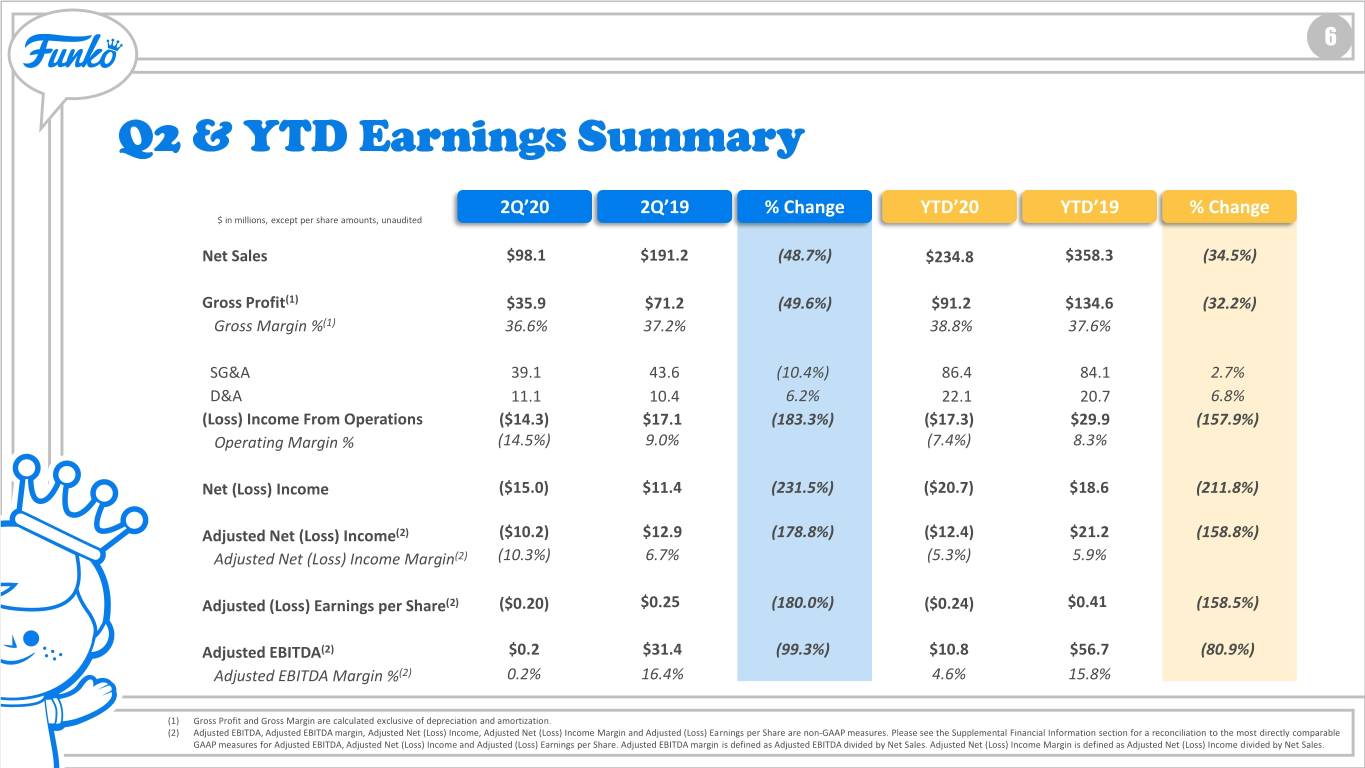
•Net sales of $98.1 million
•Gross margin1 of 36.6%
•SG&A expenses decreased 10% to $39.1 million
•Net loss of $15.0 million
•Adjusted EBITDA2 of $0.2 million
•Total liquidity3 of $87.0 million as of June 30, 2020
Second Quarter 2020 Operating Highlights
•Strong consumer demand within the domestic mass-market and third party e-commerce channels
•Funko’s direct-to-consumer e-commerce sales increased more than threefold compared to prior year
•Cost reduction initiatives generated over $15 million in SG&A savings from plan in the second quarter
•Successfully re-launched Funko.com with an expanded product offering
•Launched Marvel Battleworld: Mystery of Thanostones, which combines micro collectibles, cards and gaming to provide kids with an immersive story telling experience
•Introduced multiple new board games, including: Pan Am, Godzilla: Tokyo Clash and Back to the Future: Back in Time
•Unveiled Stitch Shoppe, Loungefly’s new high quality licensed apparel and accessory line
Brian Mariotti, Chief Executive Officer, stated, “Although our second quarter results were significantly impacted by store closures in both the U.S. and abroad, we were able to accelerate our connection and engagement with our fans through continued innovation and new product introductions as well as the expansion of our direct to consumer business. In Q2, we saw strong performance on our own e-commerce sites which delivered triple-digit sales growth.”
1 Gross margin is calculated as net sales less cost of sales (excluding depreciation and amortization) as a percentage of net sales.
2 Adjusted Net (Loss) Income, Adjusted (Loss) Earnings per Diluted Share, Adjusted EBITDA and Adjusted EBITDA margin are non-GAAP financial measures. For a reconciliation of Adjusted Net (Loss) Income, Adjusted (Loss) Earnings per Diluted Share and Adjusted EBITDA to the most directly comparable U.S. GAAP financial measures, please refer to the “Non-GAAP Financial Measures” section of this press release.
3 Total liquidity is calculated as cash and cash equivalents plus availability under the Company’s $75 million revolving credit facility.
|
“Looking at the second half of the year we are excited to have our most diverse product offering in the market come this holiday season. In the face of the highly dynamic environment, we are staying nimble and remain committed to our key growth strategies.”
Second Quarter 2020 Financial Results
Net sales decreased 49% to $98.1 million in the second quarter of 2020 compared to $191.2 million in the second quarter of 2019. The year-over-year decline was primarily attributable to impacts from COVID-19 during the quarter, including the prolonged closure of many of the Company’s retail partners.
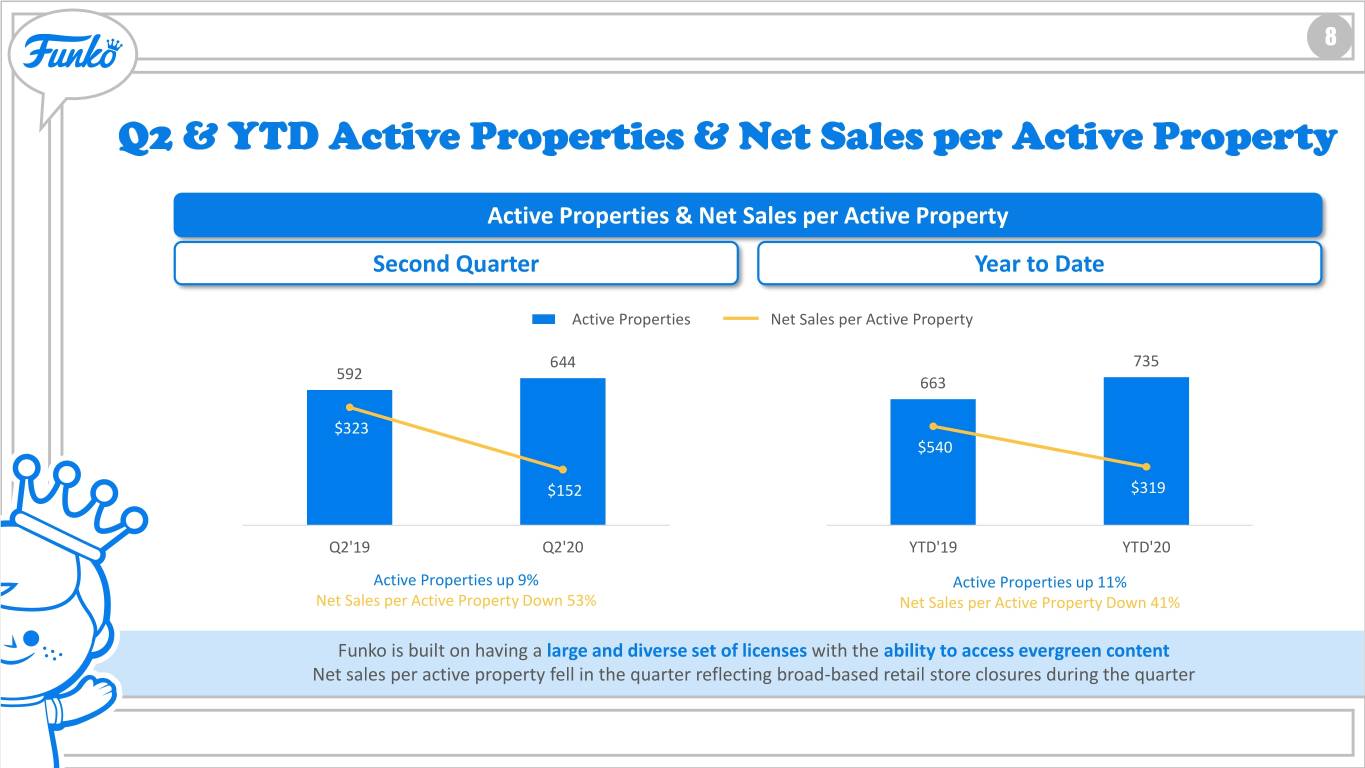
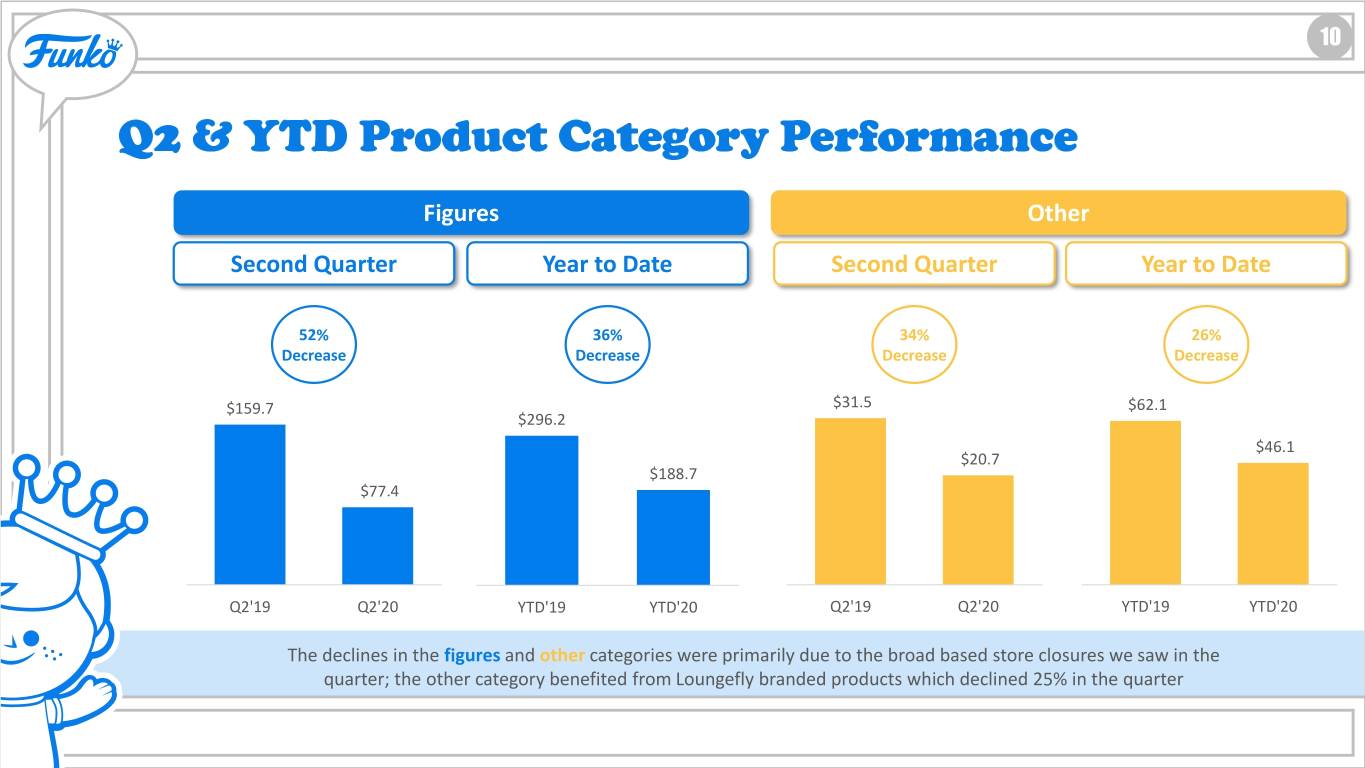
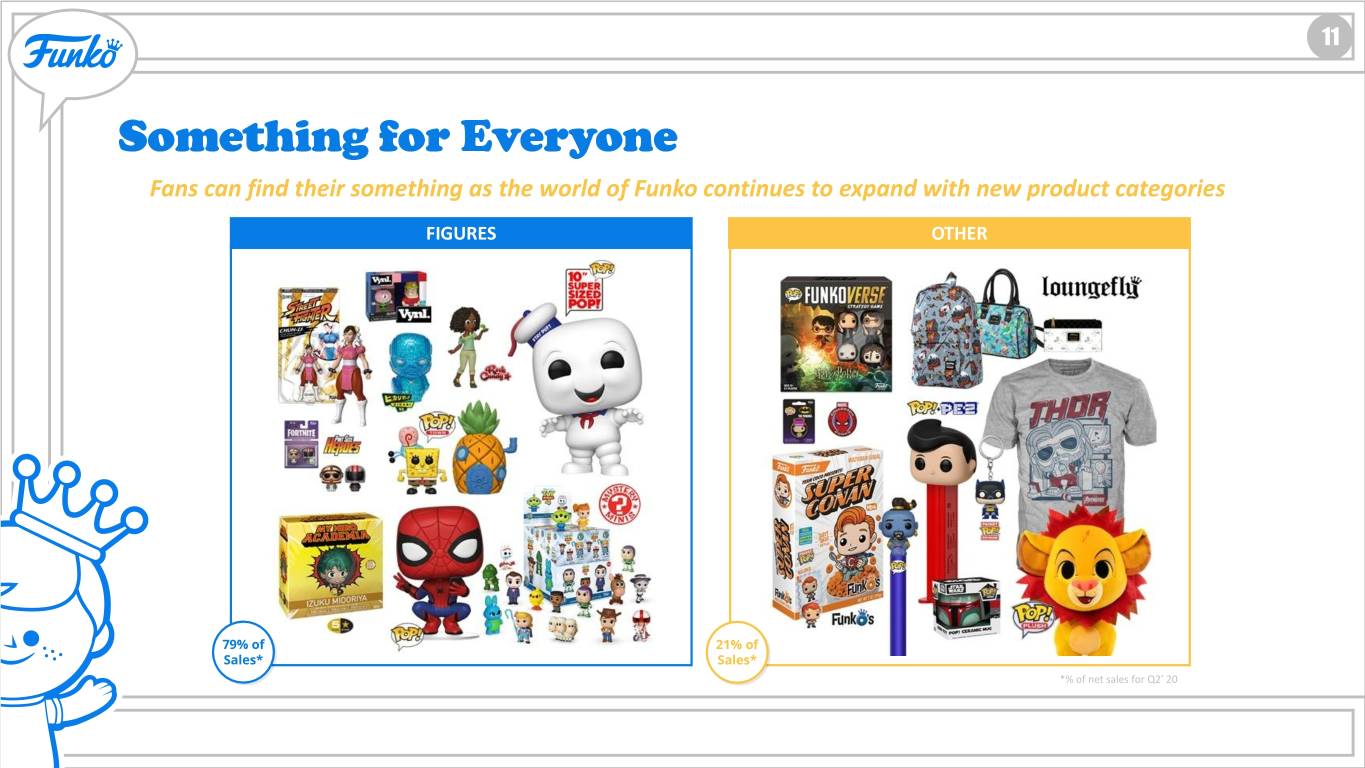
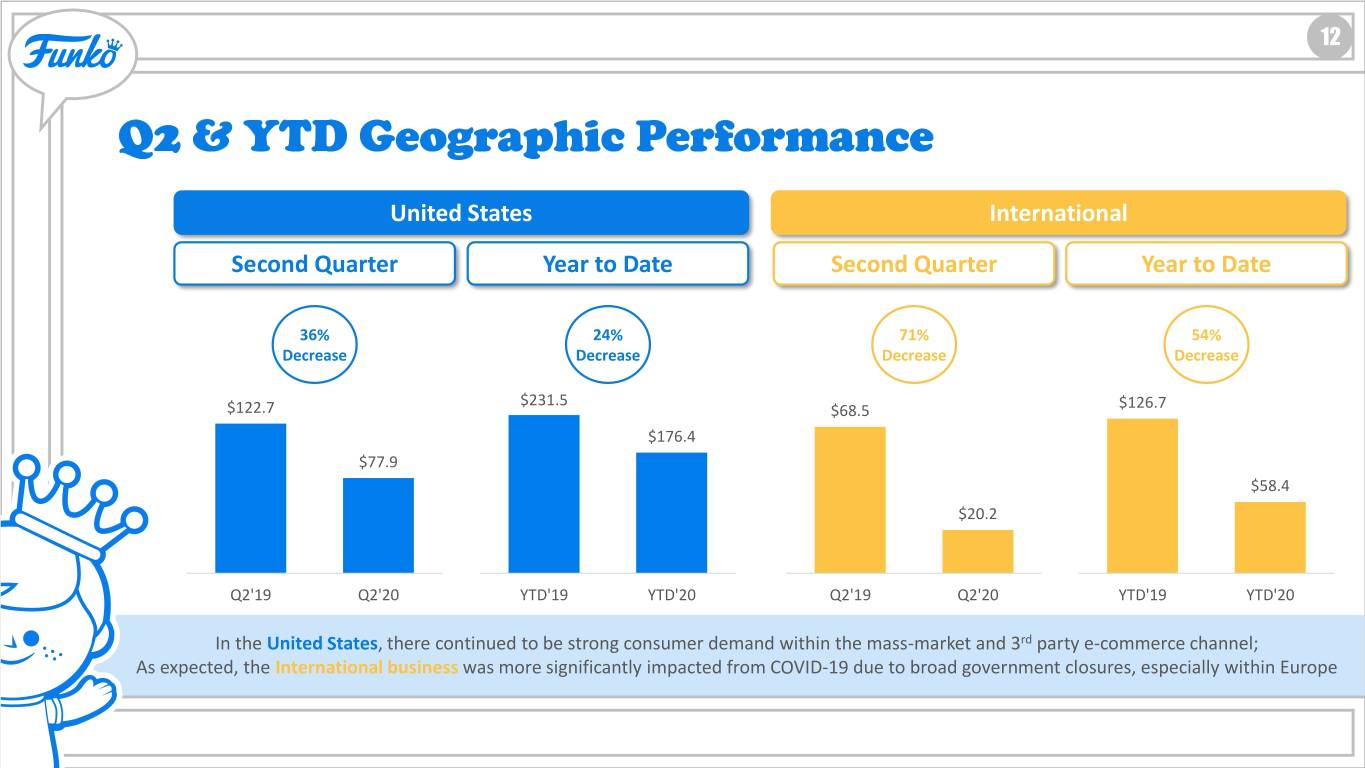
In the second quarter of 2020, the number of active properties was 644, which represents a 5% decline from the first quarter of 2020, and a 9% increase from the second quarter of 2019. On a geographical basis, net sales in the United States decreased 36% to $77.9 million. Net sales internationally decreased 71% to $20.2 million, reflecting more significant impacts from COVID-19. The European region was especially challenged in the quarter as Funko made the strategic decision to shift new products slated for the second quarter into the third quarter of 2020. On a product category basis, net sales of figures decreased 52% to $77.4 million. Net sales of other products decreased 34% to $20.7 million. Sales related to Loungefly branded products declined 25% compared to the prior year despite many of its retailers being closed, reflecting resiliency in the Loungefly brand during the quarter.
The tables below show the breakdown of net sales on a geographical and product category basis (in thousands):
| Three Months Ended June 30, | Period Over Period Change | |||||||||||||||||||||||||
| 2020 | 2019 | Dollar | Percentage | |||||||||||||||||||||||
| Net sales by geography: | ||||||||||||||||||||||||||
| United States | $ | 77,904 | $ | 122,673 | $ | (44,769) | (36.5) | % | ||||||||||||||||||
| International | 20,195 | 68,526 | (48,331) | (70.5) | % | |||||||||||||||||||||
| Total net sales | $ | 98,099 | $ | 191,199 | $ | (93,100) | (48.7) | % | ||||||||||||||||||
| Three Months Ended June 30, | Period Over Period Change | |||||||||||||||||||||||||
| 2020 | 2019 | Dollar | Percentage | |||||||||||||||||||||||
| Net sales by product: | ||||||||||||||||||||||||||
| Figures | $ | 77,396 | $ | 159,667 | $ | (82,271) | (51.5) | % | ||||||||||||||||||
| Other | 20,703 | 31,532 | (10,829) | (34.3) | % | |||||||||||||||||||||
| Total net sales | $ | 98,099 | $ | 191,199 | $ | (93,100) | (48.7) | % | ||||||||||||||||||
Gross margin1 in the second quarter of 2020 decreased 60 basis points to 36.6% compared to 37.2% in the second quarter of 2019. The decline primarily reflects higher shipping, freight and packaging costs as a percentage of sales due to decreased sales volume and a lower percentage of FOB shipments in the quarter, which were partially offset by improved product margins.
SG&A expenses decreased 10% to $39.1 million in the second quarter of 2020 compared to $43.6 million in the second quarter of 2019, primarily reflecting cost reduction initiatives put in place in the first quarter of 2020.
|
The year over year decline was primarily due to lower personnel and related expenses as well as a decrease in advertising and marketing costs.
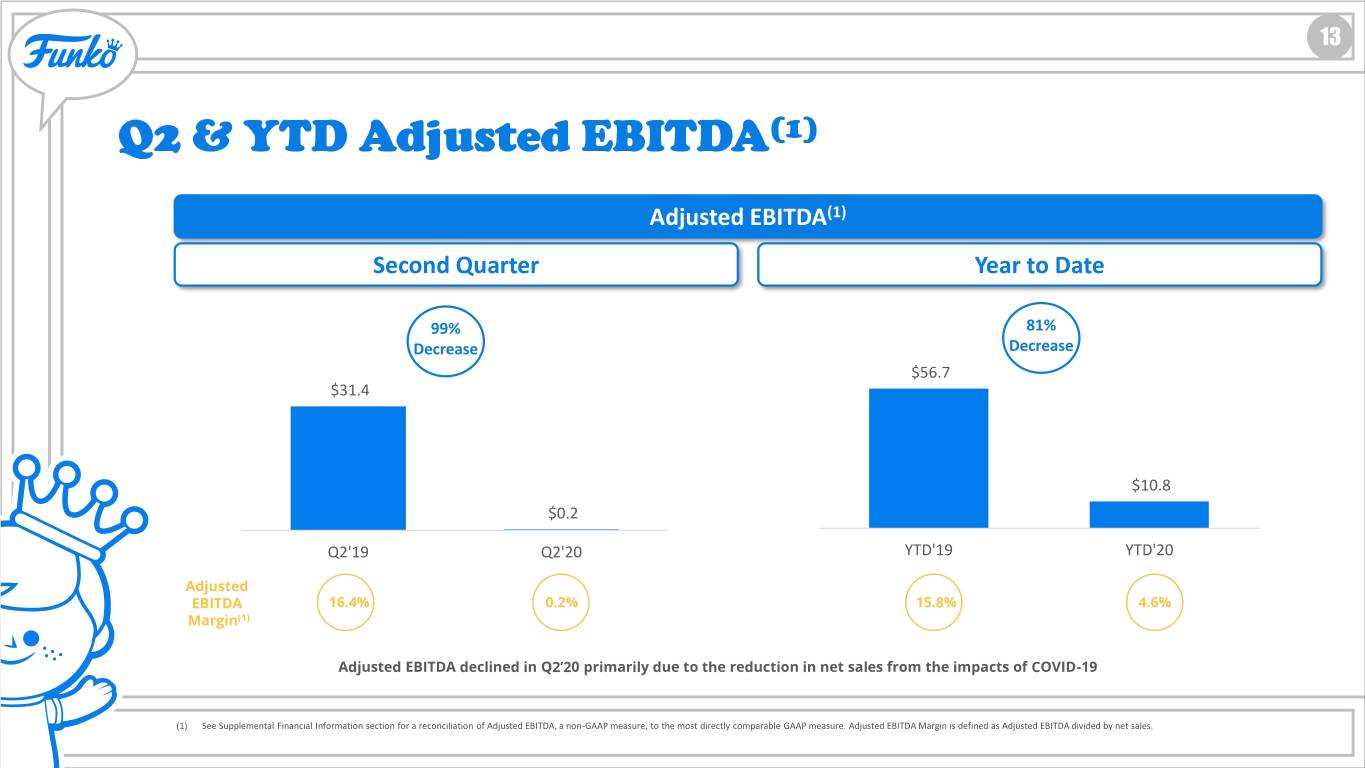
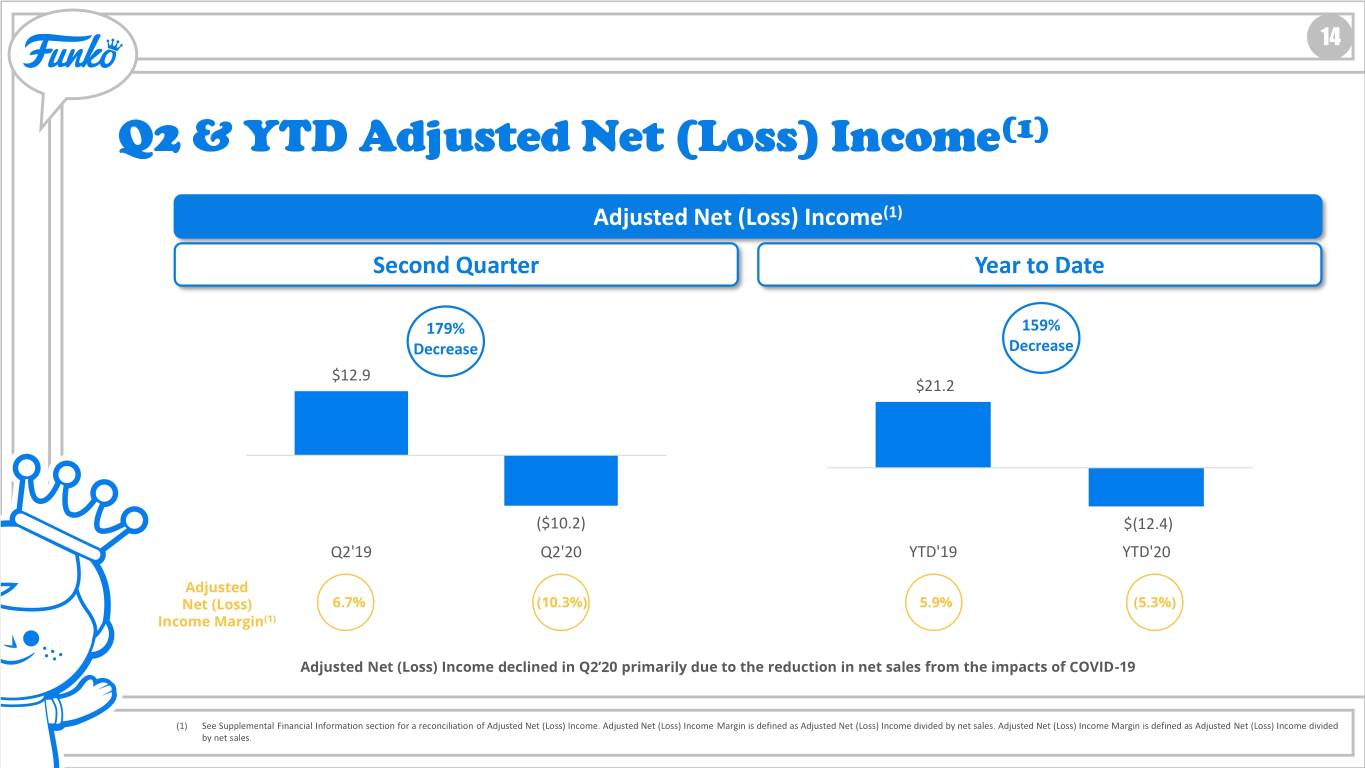
Net loss in the second quarter of 2020 was $15.0 million compared to net income of $11.4 million in the second quarter of 2019, and Adjusted Net Loss2 (non-GAAP) was $10.2 million in the second quarter of 2020 versus Adjusted Net Income2 of $12.9 million in the second quarter of 2019. Adjusted EBITDA2 in the second quarter of 2020 was $0.2 million, compared to $31.4 million in the second quarter of 2019. A reconciliation of these non-GAAP measures to its most directly related GAAP measure is provided below.
Balance Sheet Highlights
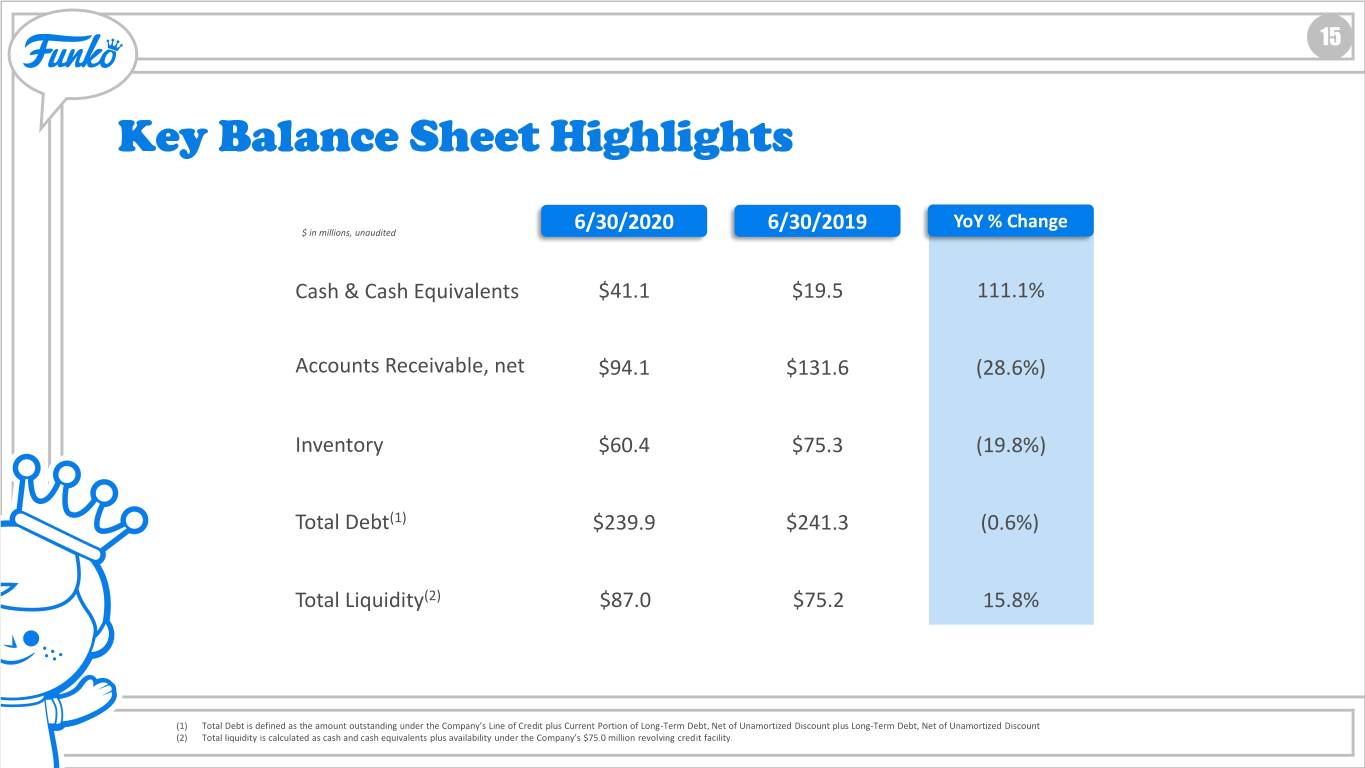
As of June 30, 2020, total debt was $239.9 million, comprised of $210.8 million outstanding under the Company’s term loan facility, net of unamortized discounts, and $29.1 million outstanding under its $75 million revolving credit facility.
Inventories at the end of the second quarter totaled $60.4 million, a decrease of 20% compared to a year ago, primarily reflecting a one-time inventory write-down in the fourth quarter of 2019 of $16.8 million.
Liquidity Update
As of June 30, 2020, the Company had total liquidity3 of $87.0 million, comprised of cash and cash equivalents of $41.1 million and total revolver availability of $45.9 million. The Company has implemented measures to preserve liquidity and cash on hand, which include:
•Reducing operating expenses across personnel, marketing, travel, professional fees and contract labor;
•Cutting non-product development capital expenditures, which is expected to reduce total planned capital expenditures by approximately one third for the year; and
•Proactively managing working capital by reducing incoming inventory to align with anticipated demand.
The Company believes the underlying strength of its business as well as its current liquidity position and financial flexibility will enable it to continue navigating the anticipated impacts of COVID-19.
2020 Outlook
Given the continued and uncertain duration of the impacts from COVID-19 on Funko’s business, the Company is not issuing updated fiscal year 2020 guidance at this time.
Conference Call and Webcast
The Company will host a conference call at 4:30 p.m. Eastern Time (1:30 p.m. Pacific Time) today, August 6, 2020, to further discuss its second quarter results. A live webcast and replay of the event will be available on the Investor Relations section on the Company’s website at https://investor.funko.com. The replay of the webcast will be available for one year.
|
About Funko
Headquartered in Everett, Washington, Funko is a leading pop culture consumer products company. Funko designs, sources and distributes licensed pop culture products across multiple categories, including vinyl figures, action toys, plush, apparel, housewares and accessories for consumers who seek tangible ways to connect with their favorite pop culture brands and characters. Learn more at https://funko.com/, and follow us on Twitter (@OriginalFunko) and Instagram (@OriginalFunko).
Forward Looking Statements
This press release contains forward-looking statements within the meaning of the Private Securities Litigation Reform Act of 1995. All statements contained in this press release that do not relate to matters of historical fact should be considered forward-looking statements, including statements regarding our anticipated financial results, the underlying trends in our business, the anticipated impact of COVID-19 on our business, our potential for growth, our strategic growth priorities, our expected liquidity and our strategy. These forward-looking statements are based on management’s current expectations. These statements are neither promises nor guarantees, but involve known and unknown risks, uncertainties and other important factors that may cause our actual results, performance or achievements to be materially different from any future results, performance or achievements expressed or implied by the forward-looking statements, including, but not limited to, the following: our ability to execute our business strategy; risks related to the impact of COVID-19 on our business, financial results and financial condition; our ability to maintain and realize the full value of our license agreements; the ongoing level of popularity of our products with consumers; changes in the retail industry and markets for our consumer products; our ability to maintain our relationships with retail customers and distributors; our ability to compete effectively; fluctuations in our gross margin; our dependence on content development and creation by third parties; our ability to manage our inventories; our ability to develop and introduce products in a timely and cost-effective manner; our ability to obtain, maintain and protect our intellectual property rights or those of our licensors; potential violations of the intellectual property rights of others; risks associated with counterfeit versions of our products; our ability to attract and retain qualified employees and maintain our corporate culture; our use of third-party manufacturing; risks associated with our international operations; changes in effective tax rates or tax law; foreign currency exchange rate exposure; the possibility or existence of global and regional economic downturns; our dependence on vendors and outsourcers; risks relating to government regulation; risks relating to litigation, including products liability claims and securities class action litigation; any failure to successfully integrate or realize the anticipated benefits of acquisitions or investments; reputational risk resulting from our e-commerce business and social media presence; risks relating to our indebtedness and our ability to secure additional financing; the potential for our electronic data or the electronic data of our customers to be compromised; the influence of our significant stockholder, ACON, and the possibility that ACON’s interests may conflict with the interests of our other stockholders; risks relating to our organizational structure; volatility in the price of our Class A common stock; and risks associated with our internal control over financial reporting. These and other important factors discussed under the caption “Risk Factors” in our quarterly report on Form 10-Q for the quarter ended June 30, 2020 and our other filings with the Securities and Exchange Commission could cause actual results to differ materially from those indicated by the forward-looking statements made in this press release. Any such forward-looking statements represent management’s estimates as of the date of this press release. While we may elect to update such forward-looking statements at some point in the future, we disclaim any obligation to do so, even if subsequent events cause our views to change. These forward-looking statements should not be relied upon as representing our views as of any date subsequent to the date of this press release.
|
Investor Contact:
Media Contact:
|
Funko, Inc. and Subsidiaries
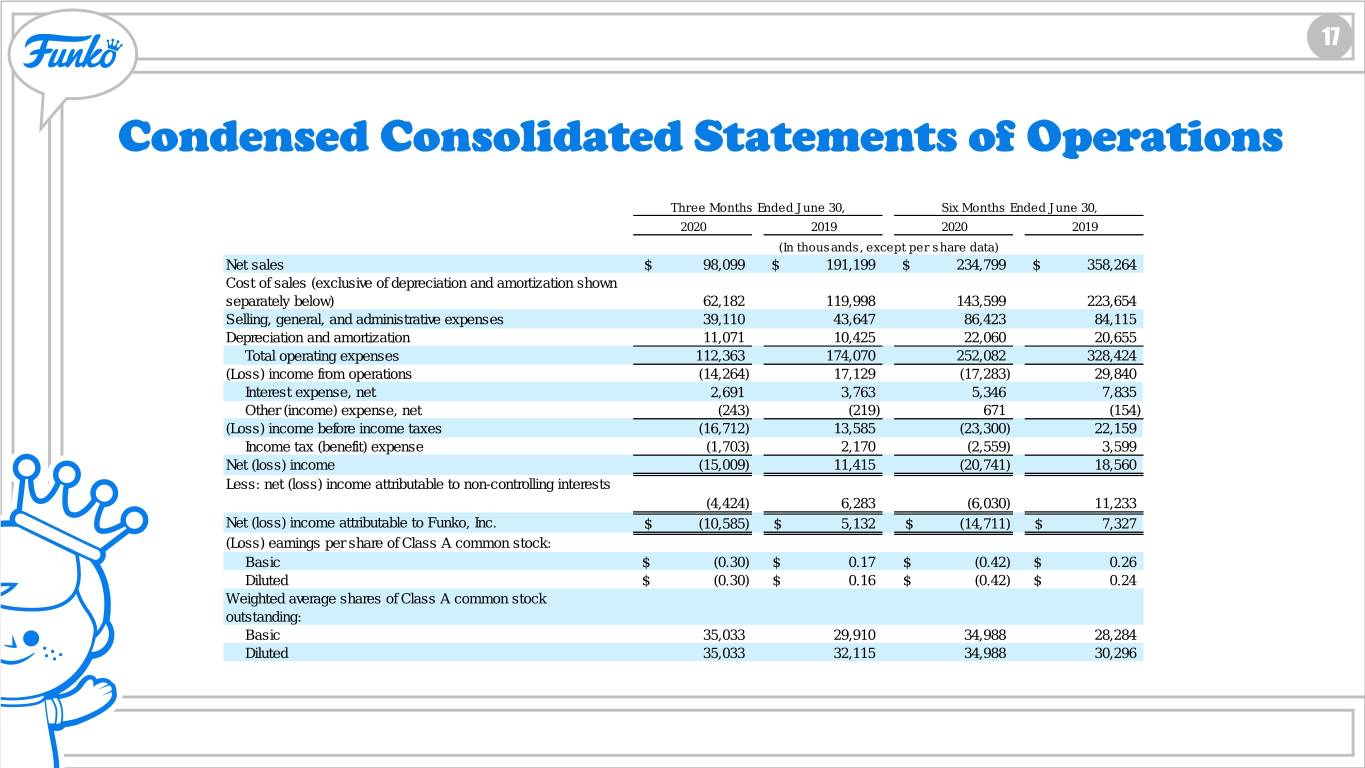
Condensed Consolidated Statements of Operations
(Unaudited)
| Three Months Ended June 30, | Six Months Ended June 30, | ||||||||||||||||||||||
| 2020 | 2019 | 2020 | 2019 | ||||||||||||||||||||
| (In thousands, except per share data) | |||||||||||||||||||||||
| Net sales | $ | 98,099 | $ | 191,199 | $ | 234,799 | $ | 358,264 | |||||||||||||||
Cost of sales (exclusive of depreciation and amortization shown separately below) | 62,182 | 119,998 | 143,599 | 223,654 | |||||||||||||||||||
| Selling, general, and administrative expenses | 39,110 | 43,647 | 86,423 | 84,115 | |||||||||||||||||||
| Depreciation and amortization | 11,071 | 10,425 | 22,060 | 20,655 | |||||||||||||||||||
| Total operating expenses | 112,363 | 174,070 | 252,082 | 328,424 | |||||||||||||||||||
| (Loss) income from operations | (14,264) | 17,129 | (17,283) | 29,840 | |||||||||||||||||||
| Interest expense, net | 2,691 | 3,763 | 5,346 | 7,835 | |||||||||||||||||||
| Other (income) expense, net | (243) | (219) | 671 | (154) | |||||||||||||||||||
| (Loss) income before income taxes | (16,712) | 13,585 | (23,300) | 22,159 | |||||||||||||||||||
| Income tax (benefit) expense | (1,703) | 2,170 | (2,559) | 3,599 | |||||||||||||||||||
| Net (loss) income | (15,009) | 11,415 | (20,741) | 18,560 | |||||||||||||||||||
Less: net (loss) income attributable to non-controlling interests | (4,424) | 6,283 | (6,030) | 11,233 | |||||||||||||||||||
| Net (loss) income attributable to Funko, Inc. | $ | (10,585) | $ | 5,132 | $ | (14,711) | $ | 7,327 | |||||||||||||||
| (Loss) earnings per share of Class A common stock: | |||||||||||||||||||||||
| Basic | $ | (0.30) | $ | 0.17 | $ | (0.42) | $ | 0.26 | |||||||||||||||
| Diluted | $ | (0.30) | $ | 0.16 | $ | (0.42) | $ | 0.24 | |||||||||||||||
Weighted average shares of Class A common stock outstanding: | |||||||||||||||||||||||
| Basic | 35,033 | 29,910 | 34,988 | 28,284 | |||||||||||||||||||
| Diluted | 35,033 | 32,115 | 34,988 | 30,296 | |||||||||||||||||||
|
Funko, Inc. and Subsidiaries
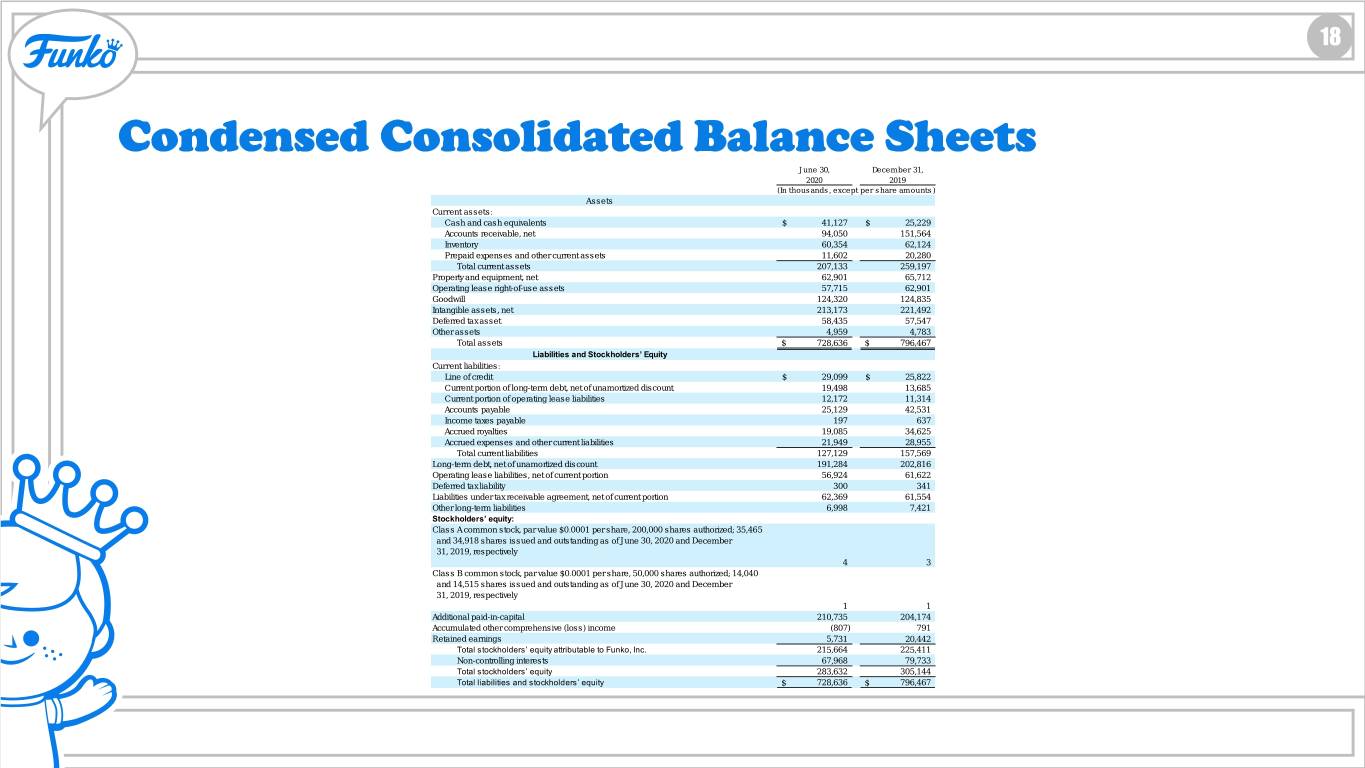
Condensed Consolidated Balance Sheets
(Unaudited)
| June 30, 2020 | December 31, 2019 | ||||||||||
| (In thousands, except per share amounts) | |||||||||||
| Assets | |||||||||||
| Current assets: | |||||||||||
| Cash and cash equivalents | $ | 41,127 | $ | 25,229 | |||||||
| Accounts receivable, net | 94,050 | 151,564 | |||||||||
| Inventory | 60,354 | 62,124 | |||||||||
| Prepaid expenses and other current assets | 11,602 | 20,280 | |||||||||
| Total current assets | 207,133 | 259,197 | |||||||||
| Property and equipment, net | 62,901 | 65,712 | |||||||||
| Operating lease right-of-use assets | 57,715 | 62,901 | |||||||||
| Goodwill | 124,320 | 124,835 | |||||||||
| Intangible assets, net | 213,173 | 221,492 | |||||||||
| Deferred tax asset | 58,435 | 57,547 | |||||||||
| Other assets | 4,959 | 4,783 | |||||||||
| Total assets | $ | 728,636 | $ | 796,467 | |||||||
| Liabilities and Stockholders’ Equity | |||||||||||
| Current liabilities: | |||||||||||
| Line of credit | $ | 29,099 | $ | 25,822 | |||||||
| Current portion of long-term debt, net of unamortized discount | 19,498 | 13,685 | |||||||||
| Current portion of operating lease liabilities | 12,172 | 11,314 | |||||||||
| Accounts payable | 25,129 | 42,531 | |||||||||
| Income taxes payable | 197 | 637 | |||||||||
| Accrued royalties | 19,085 | 34,625 | |||||||||
| Accrued expenses and other current liabilities | 21,949 | 28,955 | |||||||||
| Total current liabilities | 127,129 | 157,569 | |||||||||
| Long-term debt, net of unamortized discount | 191,284 | 202,816 | |||||||||
| Operating lease liabilities, net of current portion | 56,924 | 61,622 | |||||||||
| Deferred tax liability | 300 | 341 | |||||||||
| Liabilities under tax receivable agreement, net of current portion | 62,369 | 61,554 | |||||||||
| Other long-term liabilities | 6,998 | 7,421 | |||||||||
| Stockholders’ equity: | |||||||||||
Class A common stock, par value $0.0001 per share, 200,000 shares authorized; 35,465 and 34,918 shares issued and outstanding as of June 30, 2020 and December 31, 2019, respectively | 4 | 3 | |||||||||
Class B common stock, par value $0.0001 per share, 50,000 shares authorized; 14,040 and 14,515 shares issued and outstanding as of June 30, 2020 and December 31, 2019, respectively | 1 | 1 | |||||||||
| Additional paid-in-capital | 210,735 | 204,174 | |||||||||
| Accumulated other comprehensive (loss) income | (807) | 791 | |||||||||
| Retained earnings | 5,731 | 20,442 | |||||||||
| Total stockholders’ equity attributable to Funko, Inc. | 215,664 | 225,411 | |||||||||
| Non-controlling interests | 67,968 | 79,733 | |||||||||
| Total stockholders’ equity | 283,632 | 305,144 | |||||||||
| Total liabilities and stockholders’ equity | $ | 728,636 | $ | 796,467 | |||||||
|
Funko, Inc. and Subsidiaries
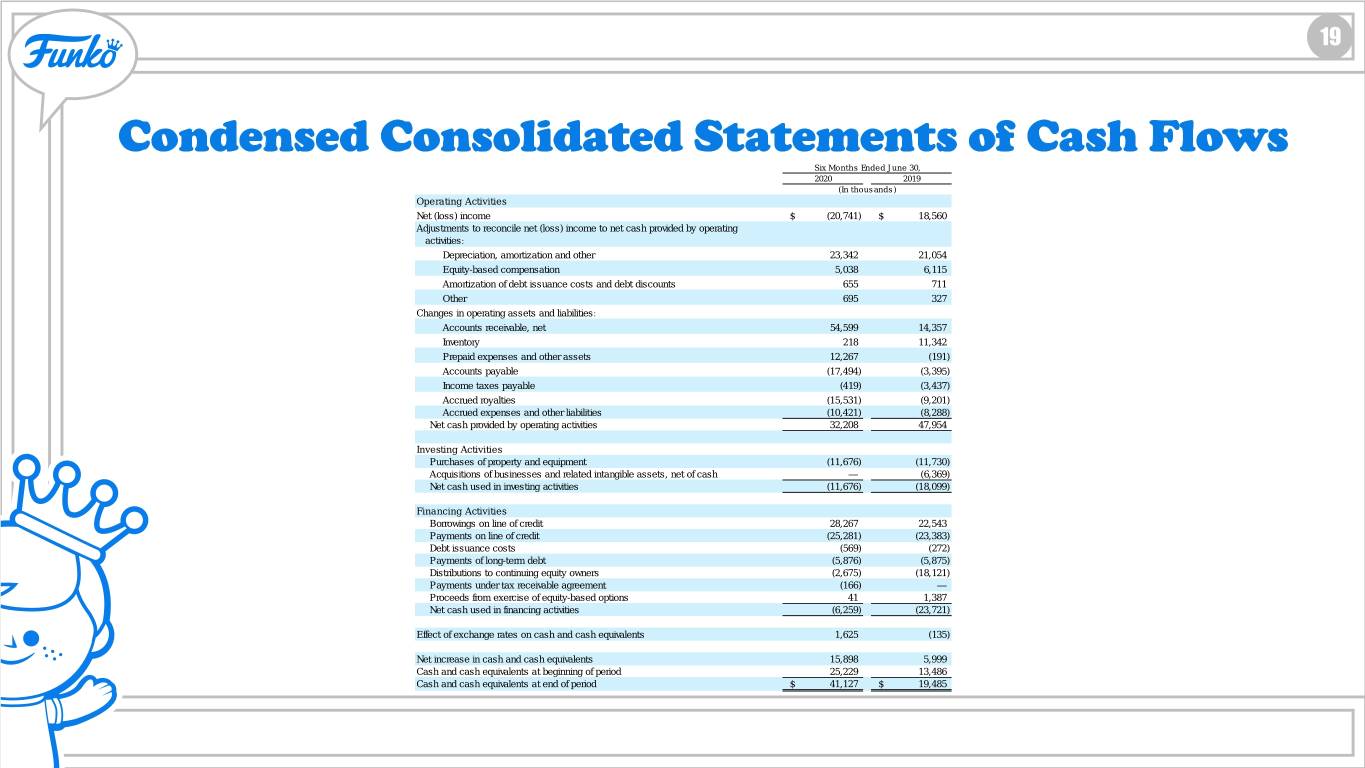
Condensed Consolidated Statements of Cash Flows
(Unaudited)
| Six Months Ended June 30, | |||||||||||
| 2020 | 2019 | ||||||||||
| (In thousands) | |||||||||||
| Operating Activities | |||||||||||
| Net (loss) income | $ | (20,741) | $ | 18,560 | |||||||
Adjustments to reconcile net (loss) income to net cash provided by operating activities: | |||||||||||
| Depreciation, amortization and other | 23,342 | 21,054 | |||||||||
| Equity-based compensation | 5,038 | 6,115 | |||||||||
| Amortization of debt issuance costs and debt discounts | 655 | 711 | |||||||||
| Other | 695 | 327 | |||||||||
| Changes in operating assets and liabilities: | |||||||||||
| Accounts receivable, net | 54,599 | 14,357 | |||||||||
| Inventory | 218 | 11,342 | |||||||||
| Prepaid expenses and other assets | 12,267 | (191) | |||||||||
| Accounts payable | (17,494) | (3,395) | |||||||||
| Income taxes payable | (419) | (3,437) | |||||||||
| Accrued royalties | (15,531) | (9,201) | |||||||||
| Accrued expenses and other liabilities | (10,421) | (8,288) | |||||||||
| Net cash provided by operating activities | 32,208 | 47,954 | |||||||||
| Investing Activities | |||||||||||
| Purchases of property and equipment | (11,676) | (11,730) | |||||||||
| Acquisitions of businesses and related intangible assets, net of cash | — | (6,369) | |||||||||
| Net cash used in investing activities | (11,676) | (18,099) | |||||||||
| Financing Activities | |||||||||||
| Borrowings on line of credit | 28,267 | 22,543 | |||||||||
| Payments on line of credit | (25,281) | (23,383) | |||||||||
| Debt issuance costs | (569) | (272) | |||||||||
| Payments of long-term debt | (5,876) | (5,875) | |||||||||
| Distributions to continuing equity owners | (2,675) | (18,121) | |||||||||
| Payments under tax receivable agreement | (166) | — | |||||||||
| Proceeds from exercise of equity-based options | 41 | 1,387 | |||||||||
| Net cash used in financing activities | (6,259) | (23,721) | |||||||||
| Effect of exchange rates on cash and cash equivalents | 1,625 | (135) | |||||||||
| Net increase in cash and cash equivalents | 15,898 | 5,999 | |||||||||
| Cash and cash equivalents at beginning of period | 25,229 | 13,486 | |||||||||
| Cash and cash equivalents at end of period | $ | 41,127 | $ | 19,485 | |||||||
|
Funko, Inc. and Subsidiaries
Non-GAAP Financial Measures
Adjusted Net (Loss) Income, Adjusted Net (Loss) Income margin, Adjusted (Loss) Earnings per Diluted Share, EBITDA, Adjusted EBITDA and Adjusted EBITDA margin are supplemental measures of our performance that are not required by, or presented in accordance with, U.S. GAAP. Adjusted Net (Loss) Income, Adjusted Net (Loss) Income margin, Adjusted (Loss) Earnings per Diluted Share, EBITDA, Adjusted EBITDA and Adjusted EBITDA margin are not measurements of our financial performance under U.S. GAAP and should not be considered as an alternative to net (loss) income, earnings per share or any other performance measure derived in accordance with U.S. GAAP. We define Adjusted Net (Loss) Income as net (loss) income attributable to Funko, Inc. adjusted for the reallocation of (loss) income attributable to non-controlling interests from the assumed exchange of all outstanding common units and options in FAH, LLC for newly issued-shares of Class A common stock of Funko, Inc. and further adjusted for the impact of certain non-cash charges and other items that we do not consider in our evaluation of ongoing operating performance. These items include, among other things, non-cash charges related to equity-based compensation programs, acquisition transaction costs and other expenses, certain severance, relocation and related costs, foreign currency transaction gains and losses, and other unusual or one-time items, and the income tax expense (benefit) effect of these adjustments. Adjusted Net (Loss) Income margin is calculated as Adjusted Net (Loss) Income as a percentage of net sales. We define Adjusted (Loss) Earnings per Diluted Share as Adjusted Net (Loss) Income divided by the weighted-average shares of Class A common stock outstanding, assuming (1) the full exchange of all outstanding common units and options in FAH, LLC for newly issued-shares of Class A common stock of Funko, Inc. and (2) the dilutive effect of stock options and unvested common units, if any. We define EBITDA as net (loss) income before interest expense, net, income tax expense (benefit), depreciation and amortization. We define Adjusted EBITDA as EBITDA further adjusted for non-cash charges related to equity-based compensation programs, acquisition transaction costs and other expenses, certain severance, relocation and related costs, foreign currency transaction gains and losses and other unusual or one-time items. Adjusted EBITDA margin is calculated as Adjusted EBITDA as a percentage of net sales We caution investors that amounts presented in accordance with our definitions of Adjusted Net (Loss) Income, Adjusted (Loss) Earnings per Diluted Share, EBITDA, Adjusted EBITDA and Adjusted EBITDA margin may not be comparable to similar measures disclosed by our competitors, because not all companies and analysts calculate these measures in the same manner. We present Adjusted Net (Loss) Income, Adjusted Net (Loss) Income margin, Adjusted (Loss) Earnings per Diluted Share, EBITDA, Adjusted EBITDA and Adjusted EBITDA margin because we consider them to be important supplemental measures of our performance and believe they are frequently used by securities analysts, investors, and other interested parties in the evaluation of companies in our industry. Management believes that investors’ understanding of our performance is enhanced by including these non-GAAP financial measures as a reasonable basis for comparing our ongoing results of operations. Management uses Adjusted Net (Loss) Income, Adjusted Net (Loss) Income margin, Adjusted (Loss) Earnings per Diluted Share, EBITDA, Adjusted EBITDA and Adjusted EBITDA margin as a measurement of operating performance because they assist us in comparing the operating performance of our business on a consistent basis, as they remove the impact of items not directly resulting from our core operations; for planning purposes, including the preparation of our internal annual operating budget and financial projections; as a consideration to assess incentive compensation for our employees; to evaluate the performance and effectiveness of our operational strategies; and to evaluate our capacity to expand our business.
By providing these non-GAAP financial measures, together with reconciliations, we believe we are enhancing investors’ understanding of our business and our results of operations, as well as assisting investors in evaluating how well we are executing our strategic initiatives. In addition, our senior secured credit facilities use Adjusted EBITDA to measure our compliance with covenants such as senior leverage ratio. Adjusted Net (Loss) Income, Adjusted Net (Loss) Income margin, Adjusted (Loss) Earnings per Diluted Share, EBITDA, Adjusted EBITDA and Adjusted EBITDA margin have limitations as analytical tools, and should not be
|
considered in isolation, or as an alternative to, or a substitute for net (loss) income or other financial statement data presented in this press release as indicators of financial performance. Some of the limitations are:
•such measures do not reflect our cash expenditures, or future requirements for capital expenditures or contractual commitments;
•such measures do not reflect changes in, or cash requirements for, our working capital needs;
•such measures do not reflect the interest expense, or the cash requirements necessary to service interest or principal payments on our debt;
•although depreciation and amortization are non-cash charges, the assets being depreciated and amortized will often have to be replaced in the future and such measures do not reflect any cash requirements for such replacements; and
•other companies in our industry may calculate such measures differently than we do, limiting their usefulness as comparative measures.
Due to these limitations, Adjusted Net (Loss) Income, Adjusted Net (Loss) Income margin, Adjusted (Loss) Earnings per Diluted Share, EBITDA, Adjusted EBITDA and Adjusted EBITDA margin should not be considered as measures of discretionary cash available to us to invest in the growth of our business. We compensate for these limitations by relying primarily on our GAAP results and using these non-GAAP measures only supplementally. As noted in the table below, Adjusted Net (Loss) Income, Adjusted Net (Loss) Income margin, Adjusted (Loss) Earnings per Diluted Share, Adjusted EBITDA and Adjusted EBITDA margin include adjustments for non-cash charges related to equity-based compensation programs, acquisition transaction costs and other expenses, certain severance, relocation and related costs, foreign currency transaction gains and losses and other unusual or one-time items. It is reasonable to expect that these items will occur in future periods. However, we believe these adjustments are appropriate because the amounts recognized can vary significantly from period to period, do not directly relate to the ongoing operations of our business and complicate comparisons of our internal operating results and operating results of other companies over time. Each of the normal recurring adjustments and other adjustments described herein and in the reconciliation table below help management with a measure of our core operating performance over time by removing items that are not related to day-to-day operations.
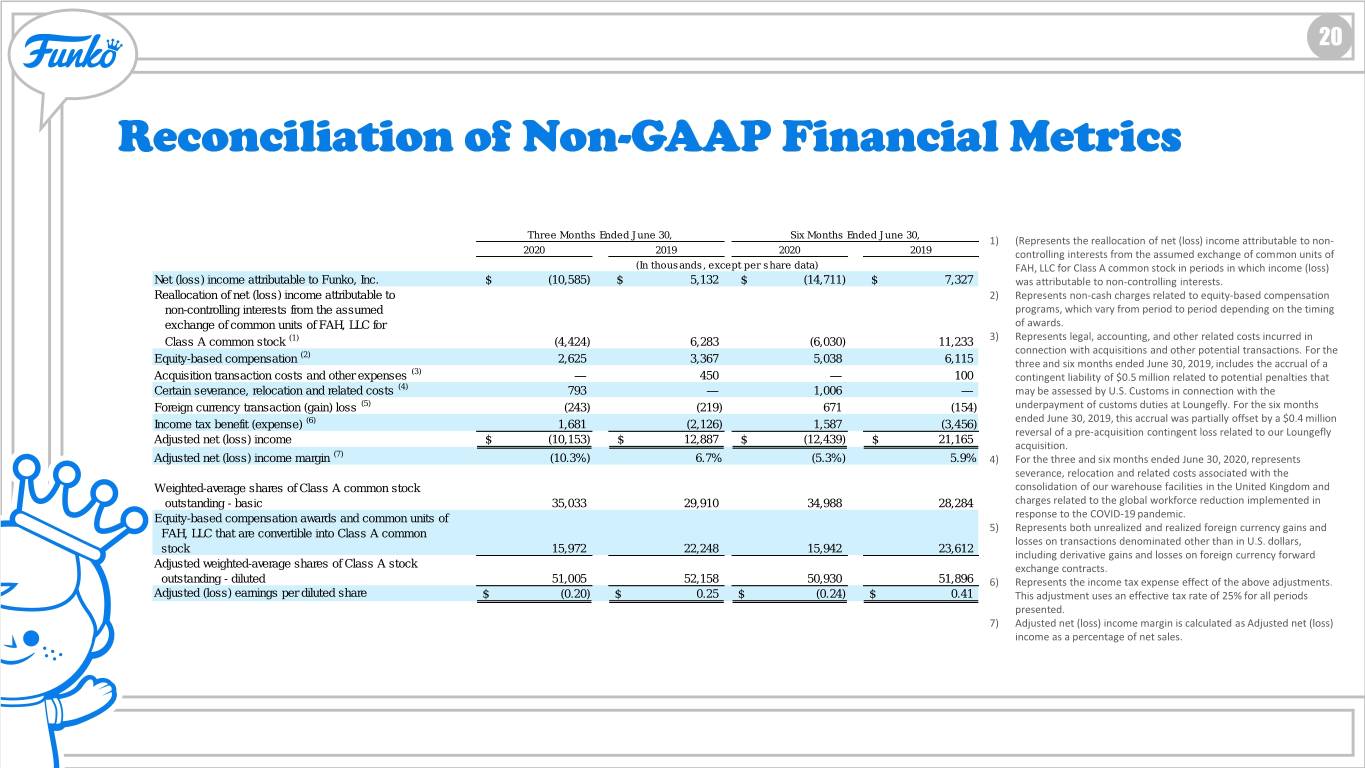
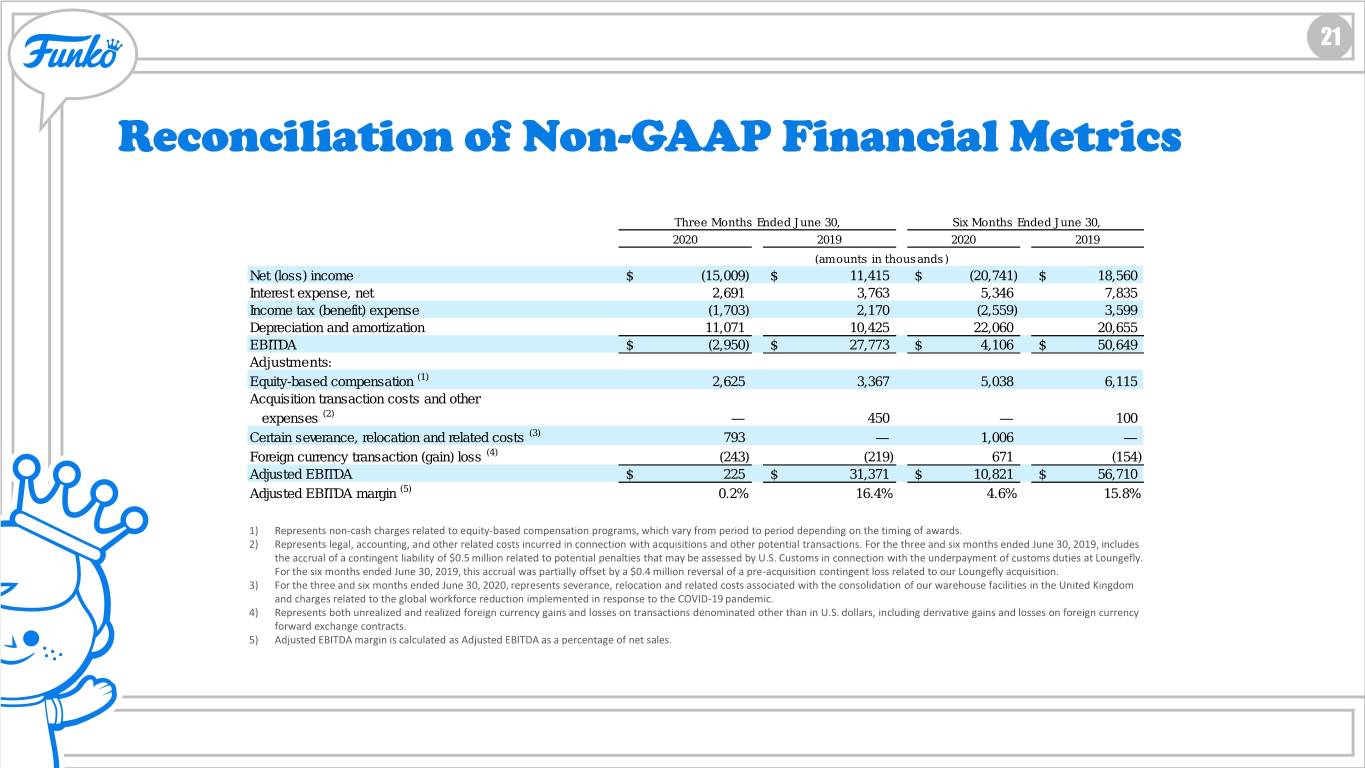
The following tables reconcile Adjusted Net (Loss) Income, Adjusted (Loss) Earnings per Diluted Share, EBITDA and Adjusted EBITDA to the most directly comparable U.S. GAAP financial performance measure:
|
| Three Months Ended June 30, | Six Months Ended June 30, | ||||||||||||||||||||||
| 2020 | 2019 | 2020 | 2019 | ||||||||||||||||||||
| (In thousands, except per share data) | |||||||||||||||||||||||
| Net (loss) income attributable to Funko, Inc. | $ | (10,585) | $ | 5,132 | $ | (14,711) | $ | 7,327 | |||||||||||||||
Reallocation of net (loss) income attributable to non-controlling interests from the assumed exchange of common units of FAH, LLC for Class A common stock (1) | (4,424) | 6,283 | (6,030) | 11,233 | |||||||||||||||||||
Equity-based compensation (2) | 2,625 | 3,367 | 5,038 | 6,115 | |||||||||||||||||||
Acquisition transaction costs and other expenses (3) | — | 450 | — | 100 | |||||||||||||||||||
Certain severance, relocation and related costs (4) | 793 | — | 1,006 | — | |||||||||||||||||||
Foreign currency transaction (gain) loss (5) | (243) | (219) | 671 | (154) | |||||||||||||||||||
Income tax benefit (expense) (6) | 1,681 | (2,126) | 1,587 | (3,456) | |||||||||||||||||||
Adjusted net (loss) income | $ | (10,153) | $ | 12,887 | $ | (12,439) | $ | 21,165 | |||||||||||||||
Adjusted net (loss) income margin (7) | (10.3) | % | 6.7 | % | (5.3) | % | 5.9 | % | |||||||||||||||
Weighted-average shares of Class A common stock outstanding-basic | 35,033 | 29,910 | 34,988 | 28,284 | |||||||||||||||||||
Equity-based compensation awards and common units of FAH, LLC that are convertible into Class A common stock | 15,972 | 22,248 | 15,942 | 23,612 | |||||||||||||||||||
Adjusted weighted-average shares of Class A stock outstanding - diluted | 51,005 | 52,158 | 50,930 | 51,896 | |||||||||||||||||||
Adjusted (loss) earnings per diluted share | $ | (0.20) | $ | 0.25 | $ | (0.24) | $ | 0.41 | |||||||||||||||
| Three Months Ended June 30, | Six Months Ended June 30, | ||||||||||||||||||||||
| 2020 | 2019 | 2020 | 2019 | ||||||||||||||||||||
| (amounts in thousands) | |||||||||||||||||||||||
| Net (loss) income | $ | (15,009) | $ | 11,415 | $ | (20,741) | $ | 18,560 | |||||||||||||||
| Interest expense, net | 2,691 | 3,763 | 5,346 | 7,835 | |||||||||||||||||||
| Income tax (benefit) expense | (1,703) | 2,170 | (2,559) | 3,599 | |||||||||||||||||||
| Depreciation and amortization | 11,071 | 10,425 | 22,060 | 20,655 | |||||||||||||||||||
EBITDA | $ | (2,950) | $ | 27,773 | $ | 4,106 | $ | 50,649 | |||||||||||||||
Adjustments: | |||||||||||||||||||||||
Equity-based compensation (2) | 2,625 | 3,367 | 5,038 | 6,115 | |||||||||||||||||||
Acquisition transaction costs and other expenses (3) | — | 450 | — | 100 | |||||||||||||||||||
Certain severance, relocation and related costs (4) | 793 | — | 1,006 | — | |||||||||||||||||||
Foreign currency transaction (gain) loss (5) | (243) | (219) | 671 | (154) | |||||||||||||||||||
Adjusted EBITDA | $ | 225 | $ | 31,371 | $ | 10,821 | $ | 56,710 | |||||||||||||||
Adjusted EBITDA margin (8) | 0.2 | % | 16.4 | % | 4.6 | % | 15.8 | % | |||||||||||||||
|
| (1) | Represents the reallocation of net (loss) income attributable to non-controlling interests from the assumed exchange of common units of FAH, LLC for Class A common stock in periods in which income (loss) was attributable to non-controlling interests. | ||||
| (2) | Represents non-cash charges related to equity-based compensation programs, which vary from period to period depending on the timing of awards. | ||||
(3) | Represents legal, accounting, and other related costs incurred in connection with acquisitions and other potential transactions. For the three and six months ended June 30, 2019, includes the accrual of a contingent liability of $0.5 million related to potential penalties that may be assessed by U.S. Customs in connection with the underpayment of customs duties at Loungefly. For the six months ended June 30, 2019, this accrual was partially offset by a $0.4 million reversal of a pre-acquisition contingent loss related to our Loungefly acquisition. | ||||
| (4) | For the three and six months ended June 30, 2020, represents severance, relocation and related costs associated with the consolidation of our warehouse facilities in the United Kingdom and charges related to the global workforce reduction implemented in response to the COVID-19 pandemic. | ||||
| (5) | Represents both unrealized and realized foreign currency gains and losses on transactions denominated other than in U.S. dollars, including derivative gains and losses on foreign currency forward exchange contracts. | ||||
| (6) | Represents the income tax expense effect of the above adjustments. This adjustment uses an effective tax rate of 25% for all periods presented. | ||||
| (7) | Adjusted net (loss) income margin is calculated as Adjusted net (loss) income as a percentage of net sales. | ||||
| (8) | Adjusted EBITDA margin is calculated as Adjusted EBITDA as a percentage of net sales. | ||||
|