0000883569
false
0000883569
2020-06-02
2020-06-03
iso4217:USD
xbrli:shares
iso4217:USD
xbrli:shares
UNITED STATES
SECURITIES AND
EXCHANGE COMMISSION
Washington, D.C.
20549
FORM 8-K
CURRENT REPORT
Pursuant to Section
13 or 15(d) of the Securities Exchange Act of 1934
Date of Report
(Date of earliest event reported): June 3, 2020
FOSSIL GROUP,
INC.
(Exact name of registrant as specified in its charter)
Delaware |
0-19848 |
75-2018505 |
(State or other jurisdiction of
incorporation or organization) |
(Commission File Number) |
(IRS Employer Identification No.) |
901 S. Central Expressway
Richardson, Texas
(Address of principal executive offices) |
75080
(Zip Code) |
Registrant’s telephone number, including area code: (972) 234-2525
(Former name or former address, if changed since last report)
Check the appropriate
box below if the Form 8-K filing is intended to simultaneously satisfy the filing obligation of the registrant under any of the
following provisions (see General Instruction A.2. below):
¨ Written
communications pursuant to Rule 425 under the Securities Act (17 CFR 230.425)
¨ Soliciting
material pursuant to Rule 14a-12 under the Exchange Act (17 CFR 240.14a-12)
¨ Pre-commencement
communications pursuant to Rule 14d-2(b) under the Exchange Act (17 CFR 240.14d-2(b))
¨ Pre-commencement
communications pursuant to Rule 13e-4(c) under the Exchange Act (17 CFR 240.13e-4(c))
| Title of each class |
|
Ticker Symbol |
|
Name of each exchange on which registered |
| Common Stock, par value $0.01 per share |
|
FOSL |
|
The Nasdaq Stock Market LLC |
Indicate by check mark
whether the registrant is an emerging growth company as defined in Rule 405 of the Securities Act of 1933 (§230.405 of this
chapter) or Rule 12b-2 of the Securities Exchange Act of 1934 (§240.12b-2 of this chapter).
¨
Emerging growth company
If
an emerging growth company, indicate by check mark if the registrant has elected not to use the extended transition period for complying
with any new or revised financial accounting standards provided pursuant to Section 13(a) of the Exchange Act. ¨
| Item 2.02 |
Results of Operations and Financial Condition. |
On June 3, 2020, the
Company issued a press release announcing financial results for the fiscal quarter ended April 4, 2020. A copy of the press release
is attached hereto as Exhibit 99.1.
The information in
Item 2.02 of this Current Report and the accompanying Exhibit 99.1 are being furnished and shall not be deemed “filed”
for purposes of Section 18 of the Securities and Exchange Act of 1934, as amended (the “Exchange Act”), and are not
incorporated by reference into any filing of the Company under the Securities Act of 1933, as amended, or the Exchange Act, whether
made before or after the date hereof, except as shall be expressly set forth by specific reference to this Current Report in such
a filing.
|
Item 7.01 |
Regulation FD Disclosure. |
The Company is currently (i) negotiating with the majority lender
under its Term Credit Agreement, dated as of September 26, 2019, by and among the Company, as borrower, JPMorgan Chase Bank, N.A.
as administrative agent and the lenders party thereto (as amended to date, the “Term Credit Agreement”) to amend certain
provisions contained therein (the “Proposed Amendment”) and (ii) seeking a waiver of a covenant to provide an interim
compliance certificate (the “Compliance Certificate”) under the Term Credit Agreement on June 5, 2020. The material
terms of the Proposed Amendment are set forth in Exhibit 99.2 attached hereto and incorporated by reference herein. The Company
expects to enter into the Proposed Amendment prior to filing its quarterly report on Form 10-Q for the quarter ended April 4, 2020
(the “First Quarter Form 10-Q”). However, there can be no assurance that the Company will be able to enter into the
Proposed Amendment prior to the filing of the First Quarter Form 10-Q. If the Company is unable to enter into the Proposed Amendment
prior to the filing of the First Quarter Form 10-Q or obtain a waiver of the covenant to provide the Compliance Certificate, the
Company would be default under the Term Credit Agreement, which would trigger a cross default under the Company’s revolving
credit facility.
In connection with
the negotiation of the Proposed Amendment, the Company entered into a confidentiality agreement with the majority lender under
the Term Credit Agreement. Pursuant to the confidentiality agreement, the Company provided the lender with certain confidential
information regarding the Company, which is furnished as Exhibit 99.3 attached hereto, and agreed to publicly disclose that information
(the “Cleansing Material”) upon the occurrence of certain events set forth in the confidentiality agreement.
The Cleansing Material
was prepared by the Company solely to facilitate negotiation of the Amendment and was not prepared with a view toward public disclosure
and should not be relied upon to make an investment decision with respect to the Company. The Cleansing Material should not be
regarded as an indication that the Company or any third party considers the Cleansing Material to be a reliable prediction of future
events, and the Cleansing Material should not be relied upon as such. Neither the Company nor any third party has made or makes
any representation to any person regarding the accuracy of any Cleansing Material or undertakes any obligation to publicly update
the Cleansing Material to reflect circumstances existing after the date when the Cleansing Material was prepared or conveyed or
to reflect the occurrence of future events, even in the event that any or all of the assumptions underlying the Cleansing Material
are shown to be in error.
The information in
Item 7.01 of this Current Report and the accompanying Exhibits 99.2 and 99.3 is being furnished and shall not be deemed “filed”
for purposes of Section 18 of the Exchange Act, and is not incorporated by reference into any filing of the Company under the Securities
Act of 1933, as amended, or the Exchange Act, whether made before or after the date hereof, except as shall be expressly set forth
by specific reference to this Current Report in such a filing.
Forward-Looking Statements
This Current Report on Form 8-K, including the exhibits hereto,
contains statements that are not historical facts, including multi-year New World Fossil expense reduction estimates, the completion
of the Proposed Amendment, the waiver of the Compliance Certificate, future financial estimates as well as estimated impacts from
COVID-19, tariffs, the Tax Cuts and Jobs Act, foreign currency translation, amortization expense, foreign tax credits, non-cash
impairments and restructuring charges, constitute “forward-looking statements” within the meaning of the Private Securities
Litigation Reform Act of 1995 and involve a number of risks and uncertainties. The actual results of the future events described
in such forward-looking statements could differ materially from those stated in such forward-looking statements. Among the factors
that could cause actual results to differ materially are: the effect of worldwide economic conditions; the impact of COVID-19;
the length and severity of COVID-19; the pace of recovery following COVID-19; the failure to negotiate and enter into the Proposed
Amendment or obtain a waiver of the Compliance Certificate; significant changes in consumer spending patterns or preferences; interruptions
or delays in the supply of key components; acts of war or acts of terrorism; changes in foreign currency valuations in relation
to the U.S. dollar; lower levels of consumer spending resulting from a general economic downturn or generally reduced shopping
activity caused by public safety or consumer confidence concerns; the performance of our products within the prevailing retail
environment; risks related to excess inventory, including older generation connected products; customer acceptance of both new
designs and newly-introduced product lines, including risks related to new generation connected products; financial difficulties
encountered by customers; the effects of vigorous competition in the markets in which we operate; compliance with debt covenants
and other contractual provisions; risks related to the success of our restructuring programs; the termination or non-renewal of
material licenses; risks related to foreign operations and manufacturing; changes in the costs of materials, labor and advertising;
government regulation and tariffs; our ability to secure and protect trademarks and other intellectual property rights; and the
outcome of current and possible future litigation, as well as the risks and uncertainties set forth in the Company’s most
recent Annual Report on Form 10-K filed with the Securities and Exchange Commission (the “SEC”). These forward-looking
statements are based on our current expectations and beliefs concerning future developments and their potential effect on us. While
management believes that these forward-looking statements are reasonable as and when made, there can be no assurance that future
developments affecting us will be those that we anticipate. Readers of this release should consider these factors in evaluating,
and are cautioned not to place undue reliance on, the forward-looking statements contained herein. The Company assumes no obligation
to publicly update or revise any forward-looking statements, whether as a result of new information, future events, or otherwise,
except as required by law.
| Item 9.01 |
Financial Statements and Exhibits. |
(d) Exhibits
| |
104 |
Cover Page Interactive Data File (embedded within the Inline XBRL document). |
SIGNATURES
Pursuant to the requirements
of the Securities Exchange Act of 1934, the registrant has duly caused this report to be signed on its behalf by the undersigned
hereunto duly authorized.
| |
FOSSIL GROUP, INC. |
| |
|
|
| Date: June 3, 2020 |
By: |
/s/
JEFFREY N. BOYER |
| |
Name: |
Jeffrey N. Boyer |
| |
Title: |
Chief Operating Officer,
Chief Financial Officer and Treasurer |
Exhibit 99.1

FOSSIL GROUP, INC. REPORTS
FIRST QUARTER 2020 FINANCIAL RESULTS
AND PROVIDES COVID-19 UPDATE
Reopening Stores in Phased Approach
Richardson, TX, JUNE 3, 2020 (GLOBE
NEWSWIRE) - Fossil Group, Inc. (NASDAQ: FOSL) today announced financial results for the first quarter ended April 4,
2020 and provided an update on the Company’s response to COVID-19.
First Quarter Summary
| • | Worldwide net sales of $391 million decreased 16% on a reported basis and 15% in constant currency. Sales in the quarter were
significantly impacted by COVID-19 on a global basis beginning in February in Asia. |
| • | The Company’s New World Fossil 2.0 - Transform to Grow Program ("NWF 2.0") was
expanded to address additional challenges posed by COVID-19. The Company’s actions to improve its cost structure are expected
to result in cost savings totaling $100 million in 2020 versus previously estimated cost savings of $50 million. |
| • | Operating loss of $134 million compared to $20 million a year ago, primarily due to COVID-19 impacts
on sales, gross margin and non-cash asset impairments. |
| • | Cash and cash equivalents of $245 million and net debt totaling $74 million as of April 4, 2020. |
Kosta Kartsotis, Chairman and CEO, stated,
“As people around the globe continue to face the many challenges presented by COVID-19, we are taking actions to mitigate
the headwinds and chart our path forward amid a new operating environment. We are proud of our teams who have prioritized the health
and safety of our communities while also moving quickly to protect our business, strengthen our financial position and accelerate
our strategic priorities for 2020 and beyond.”
COVID-19 Update
In response to the COVID-19 crisis, the
Company implemented measures to protect employee safety and well-being, including the previously announced store and office closings,
which largely remain in place today. The Company also cut costs across the organization and enhanced its financial position through
the following actions during the first quarter:
| · | Proactively drawing down $100 million of the Company’s $275 million credit facility; |
| · | Reducing operating expenses across payroll, marketing, travel, professional fees and contract labor; |
| · | Eliminating the majority of planned capital expenditures for 2020; and |
| · | Closely managing working capital by reducing incoming inventory. |
As of April 4, 2020, the Company had total liquidity of $278
million, comprised of $245 million of cash and cash equivalents and $33 million of availability under its revolving credit facility.
The Company expects to close the second quarter of 2020 with approximately $200 million of cash and cash equivalents and approximately
$30 million of availability under its revolving credit facility.
First Quarter 2020 Operating Results
Worldwide net sales totaled $390.7 million,
a decrease of 16% on a reported basis and 15% in constant currency compared to $465.3 million in the first quarter of fiscal 2019.
The year-over-year decline was primarily due to the impact of COVID-19, as stores and most of the Company's wholesale partners’
stores were closed beginning mid-March. Global retail comparable sales in constant currency decreased 14% on a 14-week calendar
basis and were trending up 1% prior to COVID-19 store closings. The following table provides a summary of net sales performance,
on both an as reported and constant currency basis, for the first quarter of 2020 compared to the 2019 first quarter (in millions,
except percentage data).
| | |
First
Quarter | | |
| | |
|
| | |
|
|
| | |
2020 | | |
2019 | | Growth
(Decline) |
|
| | |
Amounts
as Reported | | |
Amounts
as Reported | | |
Dollars
as Reported (1) | | |
Constant
Currency Dollars (2) |
Percentage
as Reported (1) | | |
Percentage
Constant Currency (2) |
|
| Americas | |
$ | 153 | | |
$ | 190 | | |
$ | (37 | ) | |
$ | (37 | ) | |
|
(20 | )% | |
(20 |
)% |
| Europe | |
| 128 | | |
| 153 | | |
| (25 | ) | |
| (22 | ) | |
|
(16 | ) | |
(14 |
) |
| Asia | |
| 106 | | |
| 117 | | |
| (11 | ) | |
| (8 | ) | |
|
(9 | ) | |
(7 |
) |
| Corporate | |
| 4 | | |
| 5 | | |
| (1 | ) | |
| (1 | ) | |
|
(28 | ) | |
(29 |
) |
| Total
net sales | |
$ | 391 | | |
$ | 465 | | |
$ | (74 | ) | |
$ | (68 | ) | |
|
(16 | )% | |
(15 |
)% |
| | |
| | | |
| | | |
| | | |
| | | |
|
| |
|
|
|
| Watches | |
$ | 310 | | |
$ | 366 | | |
$ | (56 | ) | |
$ | (51 | ) | |
|
(15 | )% | |
(14 |
)% |
| Leathers | |
| 47 | | |
| 54 | | |
| (7 | ) | |
| (6 | ) | |
|
(12 | ) | |
(11 |
) |
| Jewelry | |
| 23 | | |
| 31 | | |
| (8 | ) | |
| (7 | ) | |
|
(26 | ) | |
(24 |
) |
| Other | |
| 11 | | |
| 14 | | |
| (3 | ) | |
| (4 | ) | |
|
(26 | ) | |
(26 |
) |
| Total
net sales | |
$ | 391 | | |
$ | 465 | | |
$ | (74 | ) | |
$ | (68 | ) | |
|
(16 | )% | |
(15 |
)% |
(1) Reported GAAP amounts include impacts
from currency.
(2) Eliminates
the effect of currency changes in fiscal 2020 to give investors a better understanding of the underlying trends within the business.
See constant currency financial information at the end of this release for more information.
Gross profit totaled $140.4 million compared
to $248.0 million in the first quarter of 2019. Gross margin decreased to 35.9% from 53.3%, primarily reflecting liquidation and
increased inventory valuation adjustments of older generation connected products and minimum licensed product royalties resulting
from decreased sales due to the impact of COVID-19.
Operating expenses totaled $274.7 million
compared to $267.9 million a year ago. Operating expenses in the first quarter of 2020 included $9.4 million of restructuring costs,
primarily related to employee costs, professional services and store closures, approximately $20 million of non-cash charges related
to operating lease right-of-use and intangible asset impairment, and minimum marketing royalties. Operating expenses in the first
quarter of 2019 included $10.2 million of restructuring costs.
First quarter operating loss was $134.3
million compared to an operating loss of $19.9 million in the first quarter of 2019. Net loss totaled $85.6 million, or ($1.69)
per diluted share, compared to net loss of $12.2 million, or ($0.25) per diluted share, in the first quarter of 2019. Per
share data included restructuring charges of $0.15 per diluted share in the first quarter of 2020 and $0.16 per diluted share in
the first quarter of 2019. During the first quarter of fiscal 2020, currencies, including both the translation impact on operating
earnings and the impact of foreign currency hedging contracts, unfavorably affected loss per diluted share by approximately $0.12.
New World Fossil 2.0 - Transform to
Grow Initiative
During 2019, the Company initiated NWF
2.0, which is designed to deliver gross margin benefits and operating expense reductions totaling $200 million over the three-year
period from 2019 to 2021. As a result of the unprecedented impact of COVID-19, the Company is significantly expanding its NWF 2.0
transformation program to include additional organizational efficiencies and to accelerate digital initiatives, resulting in additional
cost savings of $50 million in 2020.
Balance Sheet Summary
As of April 4, 2020, the Company had cash
and cash equivalents of $245 million, long-term debt of $298 million and net debt of $74 million, including $190 million of borrowings
under its Term Credit Agreement. The Company is currently engaged in discussions with its lenders regarding amending certain covenants
under the Term Credit Agreement. Inventories at the end of first quarter 2020 totaled $440 million, an increase of 14% versus a
year ago, primarily reflecting reduced sales from COVID-19 during the first quarter of 2020.
2020 Outlook
Due to continued uncertainty related to
COVID-19, the Company is not providing financial guidance at this time. The Company anticipates that the COVID-19 pandemic will
continue to pressure sales throughout 2020, with the greatest impact in the second quarter. Due to closures for both FOSSIL stores
and our wholesale partners during the majority of the second quarter, worldwide net sales are expected to decline in the range
of 60%-70%, with contraction in retail and wholesale partly offset by strength in e-commerce channels. The Company has commenced
a phased reopening of its FOSSIL retail stores globally, which is expected to be completed by the end of June 2020, dependent upon
local regulations.
Kartsotis continued, “As we continue
to navigate the impacts of COVID-19, we are accelerating our focus on driving digital growth and capturing organizational efficiencies,
two of our key strategic priorities for 2020. Our investments in digital capabilities, including the recent completion of a new
global e-commerce platform, have allowed us to meet significantly increased demand and seamlessly serve our customers. As economies
begin to reopen around the globe, we are working closely with our wholesale partners and executing a phased reopening of our FOSSIL
stores.”
Safe Harbor
Certain statements contained herein that
are not historical facts, including multi-year NWF expense reduction estimates, the completion of any amendments to our Term Credit
Agreement, future financial estimates as well as estimated impacts from COVID-19, tariffs, the Tax Cuts and Jobs Act, foreign currency
translation, amortization expense, foreign tax credits, non-cash impairments and restructuring charges, constitute “forward-looking
statements” within the meaning of the Private Securities Litigation Reform Act of 1995 and involve a number of risks and
uncertainties. The actual results of the future events described in such forward-looking statements could differ materially
from those stated in such forward-looking statements. Among the factors that could cause actual results to differ materially
are: the effect of worldwide economic conditions; the impact of COVID-19; the length and severity of COVID-19; the pace of recovery
following COVID-19; the failure to negotiate and enter into an amendment to the Term Credit Agreement; significant changes in consumer
spending patterns or preferences; interruptions or delays in the supply of key components; acts of war or acts of terrorism; changes
in foreign currency valuations in relation to the U.S. dollar; lower levels of consumer spending resulting from a general economic
downturn or generally reduced shopping activity caused by public safety or consumer confidence concerns; the performance of our
products within the prevailing retail environment; risks related to excess inventory, including older generation connected products;
customer acceptance of both new designs and newly-introduced product lines, including risks related to new generation connected
products; financial difficulties encountered by customers; the effects of vigorous competition in the markets in which we operate;
compliance with debt covenants and other contractual provisions; risks related to the success of our restructuring programs; the
termination or non-renewal of material licenses; risks related to foreign operations and manufacturing; changes in the costs of
materials, labor and advertising; government regulation and tariffs; our ability to secure and protect trademarks and other intellectual
property rights; and the outcome of current and possible future litigation, as well as the risks and uncertainties set forth
in the Company’s most recent Annual Report on Form 10-K filed with the Securities and Exchange Commission (the “SEC”).
These forward-looking statements are based on our current expectations and beliefs concerning future developments and their potential
effect on us. While management believes that these forward-looking statements are reasonable as and when made, there can be no
assurance that future developments affecting us will be those that we anticipate. Readers of this release should consider
these factors in evaluating, and are cautioned not to place undue reliance on, the forward-looking statements contained herein.
The Company assumes no obligation to publicly update or revise any forward-looking statements, whether as a result of new information,
future events, or otherwise, except as required by law.
About Fossil Group, Inc.
Fossil Group, Inc. is a global design,
marketing, distribution and innovation company specializing in lifestyle accessories. Under a diverse portfolio of owned and licensed
brands, our offerings include fashion watches, jewelry, handbags, small leather goods and connected products. We are committed
to delivering the best in design and innovation across our owned brands, Fossil, Michele, Misfit, Relic, Skagen and Zodiac, and
licensed brands, Armani Exchange, BMW, Diesel, DKNY, Emporio Armani, kate spade new york, Michael Kors, PUMA and Tory Burch. We
bring each brand story to life through an extensive distribution network across numerous geographies, categories and channels.
Certain press release and SEC filing information concerning the Company is also available at www.fossilgroup.com.
| Investor Relations: |
Christine Greany |
| |
The Blueshirt Group |
| |
(858) 523-1732 |
| |
[email protected] |
| Consolidated Income Statement Data | |
For the 14
Weeks Ended | | |
For the 13
Weeks Ended | |
| ($ in millions, except per share data): | |
April 4, 2020 | | |
March 30, 2019 | |
| Net sales | |
$ | 390.7 | | |
$ | 465.3 | |
| Cost of sales | |
| 250.3 | | |
| 217.3 | |
| Gross profit | |
| 140.4 | | |
| 248.0 | |
| Gross margin | |
| 35.9 | % | |
| 53.3 | % |
| Operating expenses: | |
| | | |
| | |
| Selling, general and administrative expenses | |
| 262.8 | | |
| 257.7 | |
| Trade name impairment | |
| 2.5 | | |
| — | |
| Restructuring charges | |
| 9.4 | | |
| 10.2 | |
| Total operating expenses | |
$ | 274.7 | | |
$ | 267.9 | |
| Total operating expenses (% of net sales) | |
| 70.3 | % | |
| 57.6 | % |
| Operating income (loss) | |
| (134.3 | ) | |
| (19.9 | ) |
| Operating margin | |
| (34.4 | )% | |
| (4.3 | )% |
| Interest expense | |
| 7.5 | | |
| 8.1 | |
| Other income (expense) - net | |
| (7.3 | ) | |
| 25.8 | |
| Income (loss) before income taxes | |
| (149.1 | ) | |
| (2.2 | ) |
| Provision for income taxes | |
| (63.7 | ) | |
| 9.6 | |
| Less: Net income attributable to noncontrolling interest | |
| 0.2 | | |
| 0.4 | |
| Net income attributable to Fossil Group, Inc. | |
$ | (85.6 | ) | |
$ | (12.2 | ) |
| Earnings per share: | |
| | | |
| | |
| Basic | |
$ | (1.69 | ) | |
$ | (0.25 | ) |
| Diluted | |
$ | (1.69 | ) | |
$ | (0.25 | ) |
| Weighted average common shares outstanding: | |
| | | |
| | |
| Basic | |
| 50.6 | | |
| 49.6 | |
| Diluted | |
| 50.6 | | |
| 49.6 | |
| Consolidated Balance Sheet Data ($ in millions): | |
April 4, 2020 | | |
March 30, 2019 | |
| Assets: | |
| | | |
| | |
| Cash and cash equivalents | |
$ | 245.4 | | |
$ | 271.4 | |
| Accounts receivable - net | |
| 153.4 | | |
| 199.9 | |
| Inventories | |
| 439.7 | | |
| 384.1 | |
| Other current assets | |
| 128.6 | | |
| 133.1 | |
| Total current assets | |
$ | 967.1 | | |
$ | 988.5 | |
| Property, plant and equipment - net | |
$ | 138.7 | | |
$ | 172.7 | |
| Operating lease right-of-use assets | |
| 269.1 | | |
| 312.0 | |
| Intangible and other assets - net | |
| 157.7 | | |
| 116.7 | |
| Total long-term assets | |
$ | 565.5 | | |
$ | 601.4 | |
| Total assets | |
$ | 1,532.6 | | |
$ | 1,589.9 | |
| | |
| | | |
| | |
| Liabilities and stockholders’ equity: | |
| | | |
| | |
| Accounts payable, accrued expenses and other current liabilities | |
$ | 442.1 | | |
$ | 430.6 | |
| Short-term debt | |
| 21.1 | | |
| 65.9 | |
| Total current liabilities | |
$ | 463.2 | | |
$ | 496.5 | |
| Long-term debt | |
$ | 298.5 | | |
$ | 161.1 | |
| Long-term operating lease liabilities | |
| 281.1 | | |
| 311.6 | |
| Other long-term liabilities | |
| 73.4 | | |
| 71.4 | |
| Total long-term liabilities | |
$ | 653.0 | | |
$ | 544.1 | |
| Stockholders’ equity | |
$ | 416.4 | | |
$ | 549.3 | |
| Total liabilities and stockholders’ equity | |
$ | 1,532.6 | | |
$ | 1,589.9 | |
Constant Currency Financial
Information
The following table presents the
Company’s business segment and product net sales on a constant currency basis which are non-GAAP financial measures. To calculate
net sales on a constant currency basis, net sales for the current fiscal year period for entities reporting in currencies other
than the U.S. dollar are translated into U.S. dollars at the average rates during the comparable period of the prior fiscal year.
The Company presents constant currency information to provide investors with a basis to evaluate how its underlying business performed
excluding the effects of foreign currency exchange rate fluctuations. The constant currency financial information presented herein
should not be considered a substitute for, or superior to, the measures of financial performance prepared in accordance with GAAP.
| | |
Net Sales | |
| | |
For the 14/13 Weeks Ended | |
| | |
April 4, 2020 | | |
March 30, 2019 | |
| ($ in millions) | |
As Reported | | |
Impact of
Foreign
Currency
Exchange
Rates | | |
Constant
Currency | | |
As Reported | |
| Segment: | |
| | |
| | |
| | |
| |
| Americas | |
$ | 152.9 | | |
$ | 0.1 | | |
$ | 153.0 | | |
$ | 190.4 | |
| Europe | |
| 128.2 | | |
| 3.2 | | |
| 131.4 | | |
| 153.3 | |
| Asia | |
| 106.2 | | |
| 2.8 | | |
| 109.0 | | |
| 116.9 | |
| Corporate | |
| 3.4 | | |
| (0.1 | ) | |
| 3.3 | | |
| 4.7 | |
| Total net sales | |
$ | 390.7 | | |
$ | 6.0 | | |
$ | 396.7 | | |
$ | 465.3 | |
| | |
| | | |
| | | |
| | | |
| | |
| Product Categories: | |
| | | |
| | | |
| | | |
| | |
| Watches | |
$ | 309.9 | | |
$ | 5.1 | | |
$ | 315.0 | | |
$ | 366.2 | |
| Leathers | |
| 47.3 | | |
| 0.5 | | |
| 47.8 | | |
| 53.9 | |
| Jewelry | |
| 23.2 | | |
| 0.4 | | |
| 23.6 | | |
| 31.2 | |
| Other | |
| 10.3 | | |
| — | | |
| 10.3 | | |
| 14.0 | |
| Total net sales | |
$ | 390.7 | | |
$ | 6.0 | | |
$ | 396.7 | | |
$ | 465.3 | |
Adjusted EBITDA
Adjusted EBITDA is a non-GAAP financial measure. We define Adjusted
EBITDA as our net income (loss) before the impact of income tax expense (benefit), plus interest expense, amortization and depreciation,
impairment expense, other non-cash charges, stock-based compensation expense, and restructuring expense minus interest income.
We have included Adjusted EBITDA herein because it is widely used by investors for valuation and for comparing our financial performance
with the performance of our competitors. We also use Adjusted EBITDA to monitor and compare the financial performance of our operations.
Our presentation of Adjusted EBITDA may not be comparable to similarly titled measures other companies report. Adjusted EBITDA
is not intended to be used as an alternative to any measure of our performance in accordance with GAAP. The following table reconciles
Adjusted EBITDA to the most directly comparable GAAP financial measure, which is income (loss) before income taxes. Certain line
items presented in the tables below, when aggregated, may not foot due to rounding.
| | |
Fiscal 2019(1) | | |
Fiscal 2020 | | |
| |
| ($ in millions): | |
Q2 | | |
Q3 | | |
Q4 | | |
Q1 | | |
Total | |
| Income (loss) before income taxes | |
$ | (5.2 | ) | |
$ | (18.0 | ) | |
$ | (6.0 | ) | |
$ | (149.1 | ) | |
$ | (178.3 | ) |
| Plus: | |
| | | |
| | | |
| | | |
| | | |
| | |
| Interest expense | |
| 7.4 | | |
| 7.4 | | |
| 7.0 | | |
| 7.5 | | |
| 29.3 | |
| Amortization and depreciation | |
| 13.9 | | |
| 13.6 | | |
| 12.9 | | |
| 12.2 | | |
| 52.6 | |
| Impairment expense | |
| 1.7 | | |
| 18.0 | | |
| 4.7 | | |
| 19.6 | | |
| 44.0 | |
| Other non-cash charges | |
| 3.3 | | |
| 9.5 | | |
| 43.2 | | |
| 21.7 | | |
| 77.7 | |
| Stock-based compensation | |
| 5.2 | | |
| 4.3 | | |
| 1.9 | | |
| 3.1 | | |
| 14.5 | |
| Restructuring expense | |
| 7.3 | | |
| 7.0 | | |
| 5.2 | | |
| 9.4 | | |
| 28.9 | |
| Less: | |
| | | |
| | | |
| | | |
| | | |
| | |
| Interest Income | |
| 0.9 | | |
| 0.3 | | |
| 0.1 | | |
| — | | |
| 1.3 | |
| Adjusted EBITDA | |
$ | 32.7 | | |
$ | 41.5 | | |
$ | 68.8 | | |
$ | (75.6 | ) | |
$ | 67.4 | |
(1) Prior period amounts have been adjusted
to conform to the current period presentation.
Store Count Information
| | |
April 4, 2020 | | |
March 30, 2019 | |
| | |
Americas | | |
Europe | | |
Asia | | |
Total | | |
Americas | | |
Europe | | |
Asia | | |
Total | |
| Full price accessory | |
| 82 | | |
| 78 | | |
| 57 | | |
| 217 | | |
| 85 | | |
| 88 | | |
| 53 | | |
| 226 | |
| Outlets | |
| 114 | | |
| 74 | | |
| 35 | | |
| 223 | | |
| 116 | | |
| 74 | | |
| 38 | | |
| 228 | |
| Full priced multi-brand | |
| — | | |
| 4 | | |
| 3 | | |
| 7 | | |
| — | | |
| 4 | | |
| 3 | | |
| 7 | |
| Total stores | |
| 196 | | |
| 156 | | |
| 95 | | |
| 447 | | |
| 201 | | |
| 166 | | |
| 94 | | |
| 461 | |
END OF RELEASE
Exhibit 99.3

Amendment Discussion Materials May 2020 For Amendment Purposes Only 1
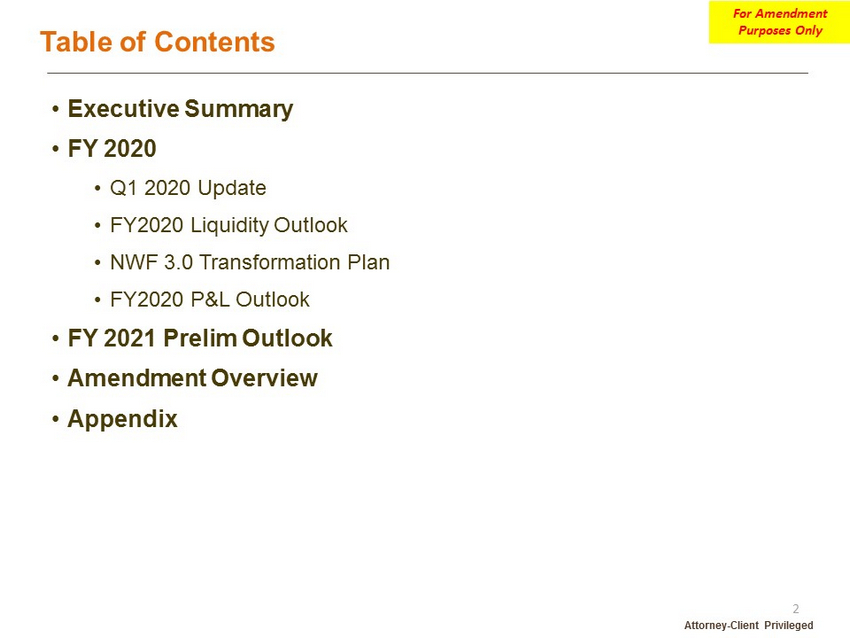
Table of Contents Attorney - Client Privileged • Executive Summary • FY 2020 • Q1 2020 Update • FY2020 Liquidity Outlook • NWF 3.0 Transformation Plan • FY2020 P&L Outlook • FY 2021 Prelim Outlook • Amendment Overview • Appendix For Amendment Purposes Only 2
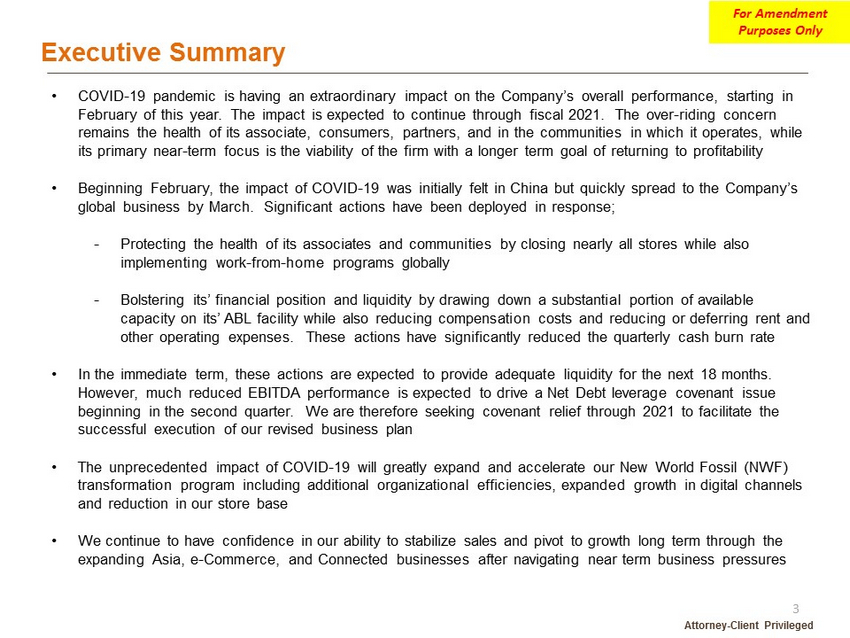
Executive Summary Attorney - Client Privileged • COVID - 19 pandemic is having an extraordinary impact on the Company’s overall performance, starting in February of this year. The impact is expected to continue through fiscal 2021. The over - riding concern remains the health of its associate, consumers, partners, and in the communities in which it operates, while its primary near - term focus is the viability of the firm with a longer term goal of returning to profitability • Beginning February, the impact of COVID - 19 was initially felt in China but quickly spread to the Company’s global business by March. Significant actions have been deployed in response; - Protecting the health of its associates and communities by closing nearly all stores while also implementing work - from - home programs globally - Bolstering its’ financial position and liquidity by drawing down a substantial portion of available capacity on its’ ABL facility while also reducing compensation costs and reducing or deferring rent and other operating expenses. These actions have significantly reduced the quarterly cash burn rate • In the immediate term, these actions are expected to provide adequate liquidity for the next 18 months. However, much reduced EBITDA performance is expected to drive a Net Debt leverage covenant issue beginning in the second quarter. We are therefore seeking covenant relief through 2021 to facilitate the successful execution of our revised business plan • The unprecedented impact of COVID - 19 will greatly expand and accelerate our New World Fossil (NWF) transformation program including additional organizational efficiencies, expanded growth in digital channels and reduction in our store base • We continue to have confidence in our ability to stabilize sales and pivot to growth long term through the expanding Asia, e - Commerce, and Connected businesses after navigating near term business pressures For Amendment Purposes Only 3
Q1 Performance Attorney - Client Privileged For Amendment Purposes Only 4
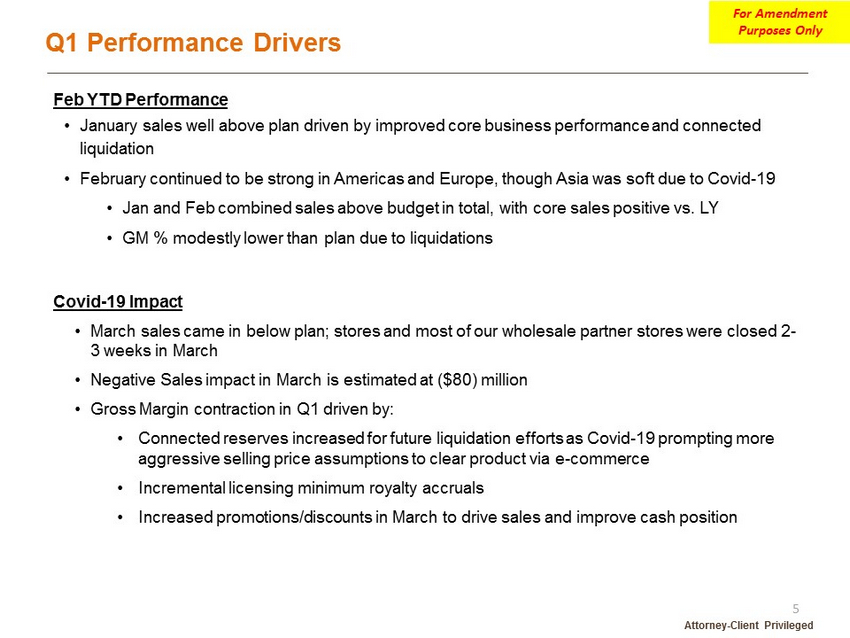
Q1 Performance Drivers Attorney - Client Privileged Feb YTD Performance • January sales well above plan driven by improved core business performance and connected liquidation • February continued to be strong in Americas and Europe, though Asia was soft due to Covid - 19 • Jan and Feb combined sales above budget in total, with core sales positive vs. LY • GM % modestly lower than plan due to liquidations Covid - 19 Impact • March sales came in below plan; stores and most of our wholesale partner stores were closed 2 - 3 weeks in March • Negative Sales impact in March is estimated at ($80) million • Gross Margin contraction in Q1 driven by: • Connected reserves increased for future liquidation efforts as Covid - 19 prompting more aggressive selling price assumptions to clear product via e - commerce • Incremental licensing minimum royalty accruals • Increased promotions/discounts in March to drive sales and improve cash position For Amendment Purposes Only 5
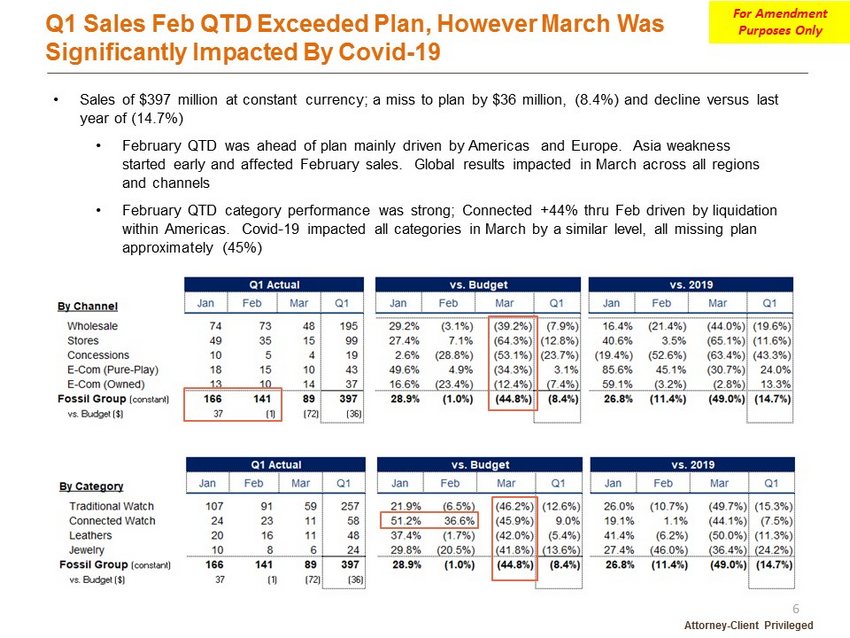
Attorney - Client Privileged • Sales of $397 million at constant currency; a miss to plan by $36 million, (8.4%) and decline versus last year of (14.7%) • February QTD was ahead of plan mainly driven by Americas and Europe. Asia weakness started early and affected February sales. Global results impacted in March across all regions and channels • February QTD category performance was strong; Connected +44% thru Feb driven by liquidation within Americas. Covid - 19 impacted all categories in March by a similar level, all missing plan approximately (45%) Q1 Sales Feb QTD Exceeded Plan, However March Was Significantly Impacted By Covid - 19 For Amendment Purposes Only 6
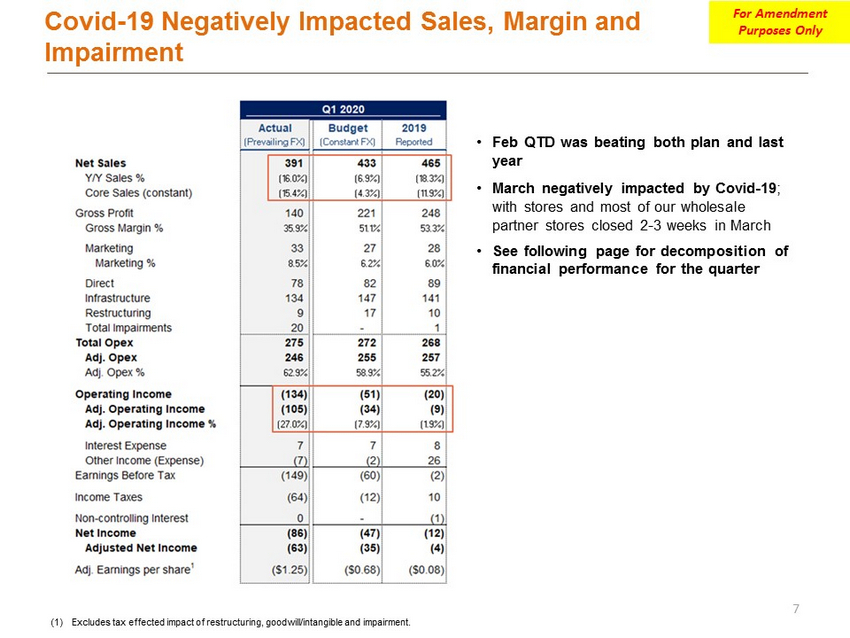
• Feb QTD was beating both plan and last year • March negatively impacted by Covid - 19 ; with stores and most of our wholesale partner stores closed 2 - 3 weeks in March • See following page for decomposition of financial performance for the quarter (1) Excludes tax effected impact of restructuring, goodwill/intangible and impairment. Covid - 19 Negatively Impacted Sales, Margin and Impairment For Amendment Purposes Only 7
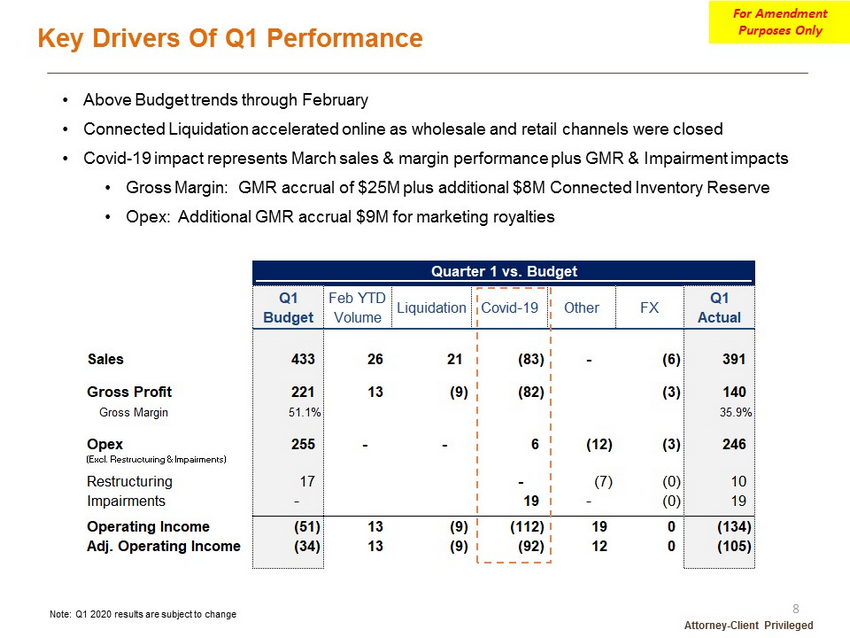
Attorney - Client Privileged Note: Q1 2020 results are subject to change Key Drivers Of Q1 Performance • Above Budget trends through February • Connected Liquidation accelerated online as wholesale and retail channels were closed • Covid - 19 impact represents March sales & margin performance plus GMR & Impairment impacts • Gross Margin: GMR accrual of $25M plus additional $ 8 M Connected Inventory Reserve • Opex: Additional GMR accrual $9M for marketing royalties For Amendment Purposes Only 8
Covid - 19 Response Attorney - Client Privileged For Amendment Purposes Only 9
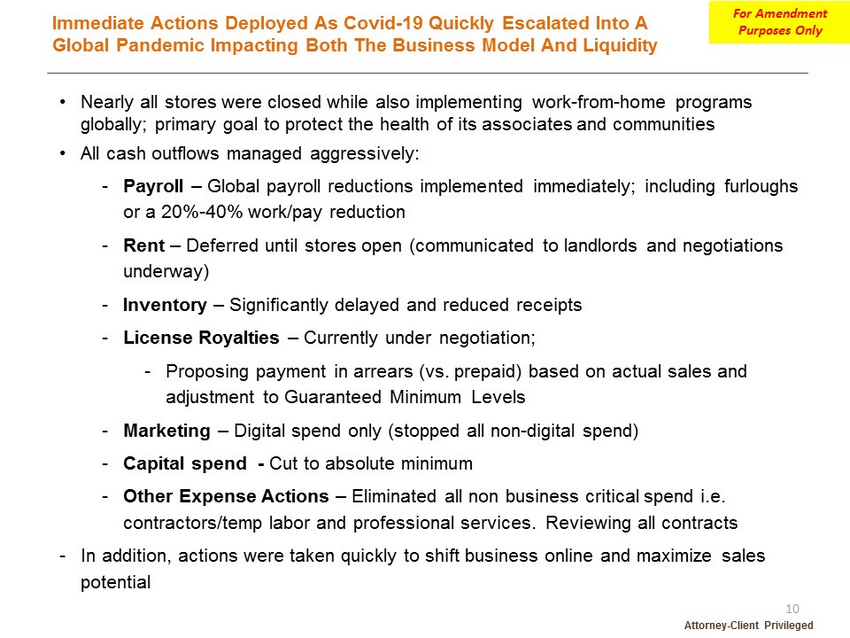
Immediate Actions Deployed As Covid - 19 Quickly Escalated Into A Global Pandemic Impacting Both The Business Model And Liquidity Attorney - Client Privileged • Nearly all stores were closed while also implementing work - from - home programs globally; primary goal to protect the health of its associates and communities • All cash outflows managed aggressively: - Payroll – Global payroll reductions implemented immediately; including furloughs or a 20% - 40% work/pay reduction - Rent – Deferred until stores open (communicated to landlords and negotiations underway) - Inventory – Significantly delayed and reduced receipts - License Royalties – Currently under negotiation; - Proposing payment in arrears (vs. prepaid) based on actual sales and adjustment to Guaranteed Minimum Levels - Marketing – Digital spend only (stopped all non - digital spend) - Capital spend - Cut to absolute minimum - Other Expense Actions – Eliminated all non business critical spend i.e. contractors/temp labor and professional services. Reviewing all contracts - In addition, actions were taken quickly to shift business online and maximize sales potential For Amendment Purposes Only 10
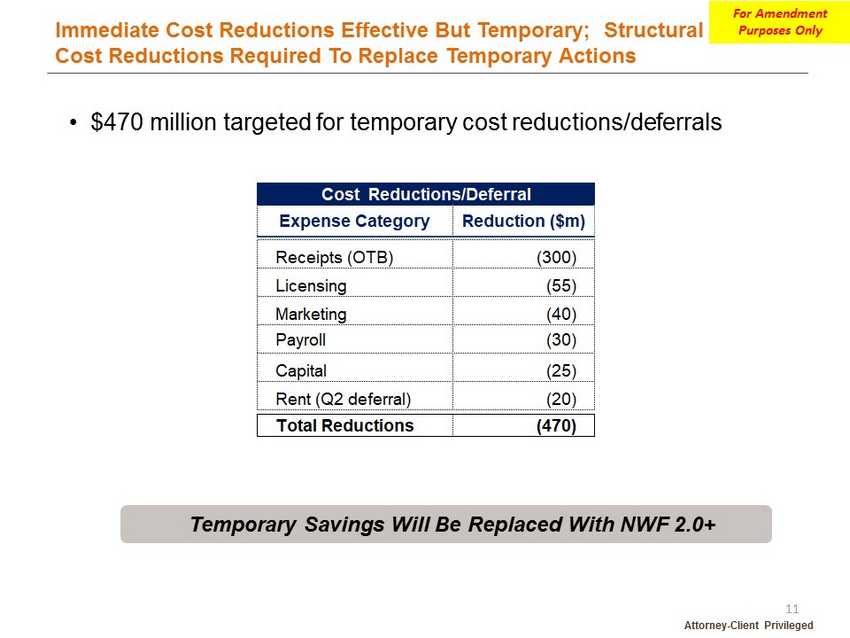
Immediate Cost Reductions Effective But Temporary; Structural Cost Reductions Required To Replace Temporary Actions Attorney - Client Privileged • $470 million targeted for temporary cost reductions/deferrals Temporary Savings Will Be Replaced With NWF 2.0+ For Amendment Purposes Only 11

Recent Business Trends Attorney - Client Privileged For Amendment Purposes Only 12
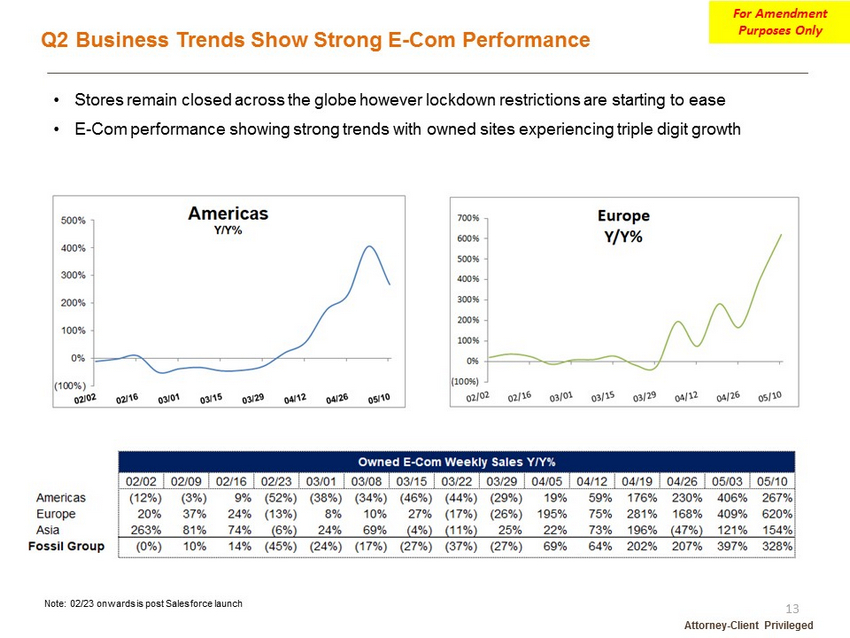
Q2 Business Trends Show Strong E - Com Performance Attorney - Client Privileged • Stores remain closed across the globe however lockdown restrictions are starting to ease • E - Com performance showing strong trends with owned sites experiencing triple digit growth Note: 02/23 onwards is post Salesforce launch For Amendment Purposes Only 13
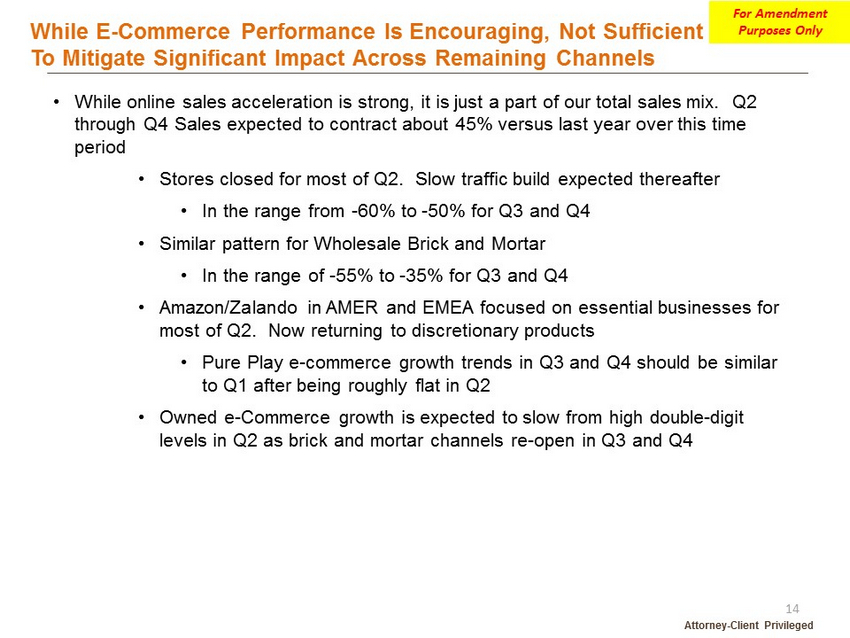
While E - Commerce Performance Is Encouraging, Not Sufficient To Mitigate Significant Impact Across Remaining Channels Attorney - Client Privileged • While online sales acceleration is strong, it is just a part of our total sales mix. Q2 through Q4 Sales expected to contract about 45 % versus last year over this time period • Stores closed for most of Q2. Slow traffic build expected thereafter • In the range from - 60% to - 50% for Q3 and Q4 • Similar pattern for Wholesale Brick and Mortar • In the range of - 55% to - 35% for Q3 and Q4 • Amazon/ Zalando in AMER and EMEA focused on essential businesses for most of Q2. Now returning to discretionary products • Pure Play e - commerce growth trends in Q3 and Q4 should be similar to Q1 after being roughly flat in Q2 • Owned e - Commerce growth is expected to slow from high double - digit levels in Q2 as brick and mortar channels re - open in Q3 and Q4 For Amendment Purposes Only 14
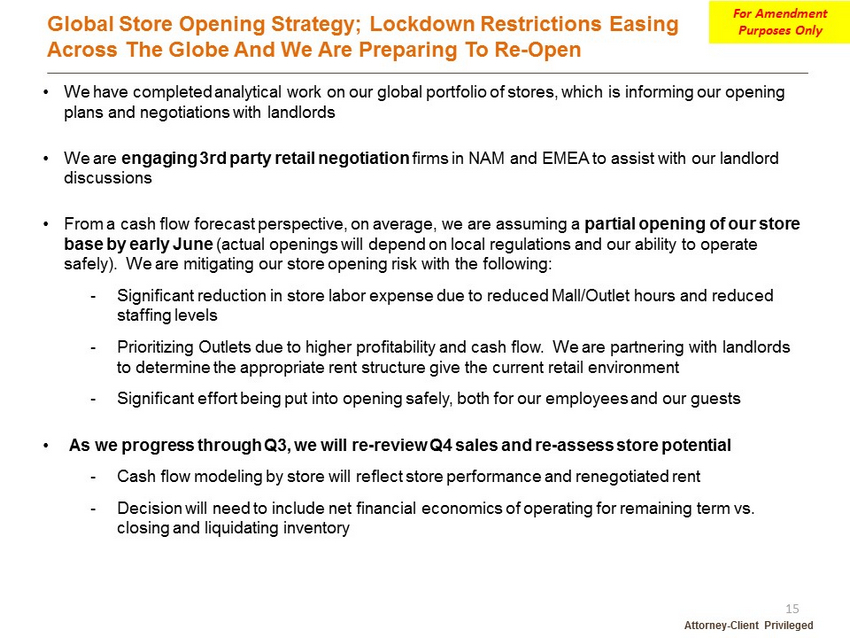
Global Store Opening Strategy; Lockdown Restrictions Easing Across The Globe And We Are Preparing To Re - Open Attorney - Client Privileged • We have completed analytical work on our global portfolio of stores, which is informing our opening plans and negotiations with landlords • We are engaging 3rd party retail negotiation firms in NAM and EMEA to assist with our landlord discussions • From a cash flow forecast perspective, on average, we are assuming a partial opening of our store base by early June (actual openings will depend on local regulations and our ability to operate safely). We are mitigating our store opening risk with the following: - Significant reduction in store labor expense due to reduced Mall/Outlet hours and reduced staffing levels - Prioritizing Outlets due to higher profitability and cash flow. We are partnering with landlords to determine the appropriate rent structure give the current retail environment - Significant effort being put into opening safely, both for our employees and our guests • As we progress through Q3, we will re - review Q4 sales and re - assess store potential - Cash flow modeling by store will reflect store performance and renegotiated rent - Decision will need to include net financial economics of operating for remaining term vs. closing and liquidating inventory For Amendment Purposes Only 15
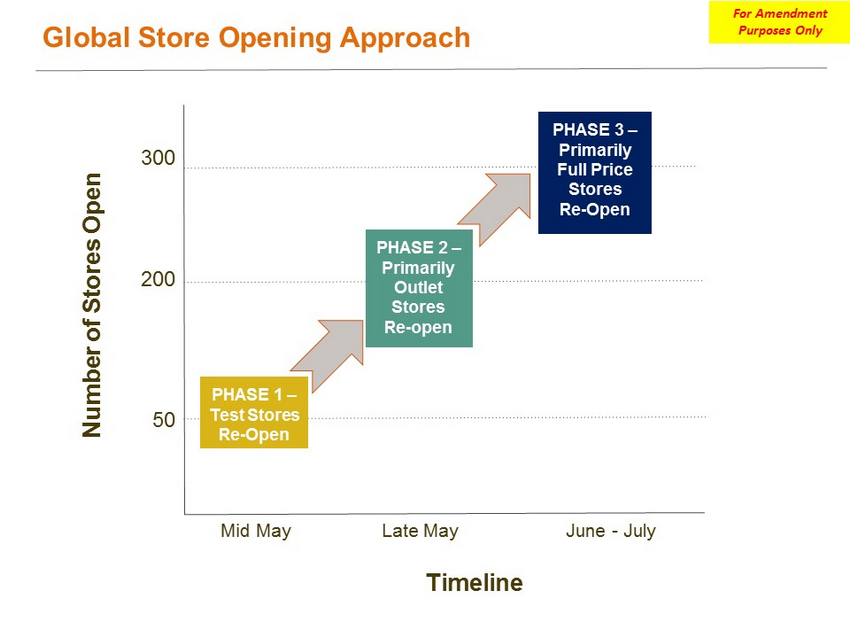
Global Store Opening Approach Number of Stores Open 50 200 300 Mid May Late May June - July PHASE 1 – Test Stores Re - Open PHASE 2 – Primarily Outlet Stores Re - open PHASE 3 – Primarily Full Price Stores Re - Open Timeline For Amendment Purposes Only
FY2020 Liquidity Attorney - Client Privileged For Amendment Purposes Only 17
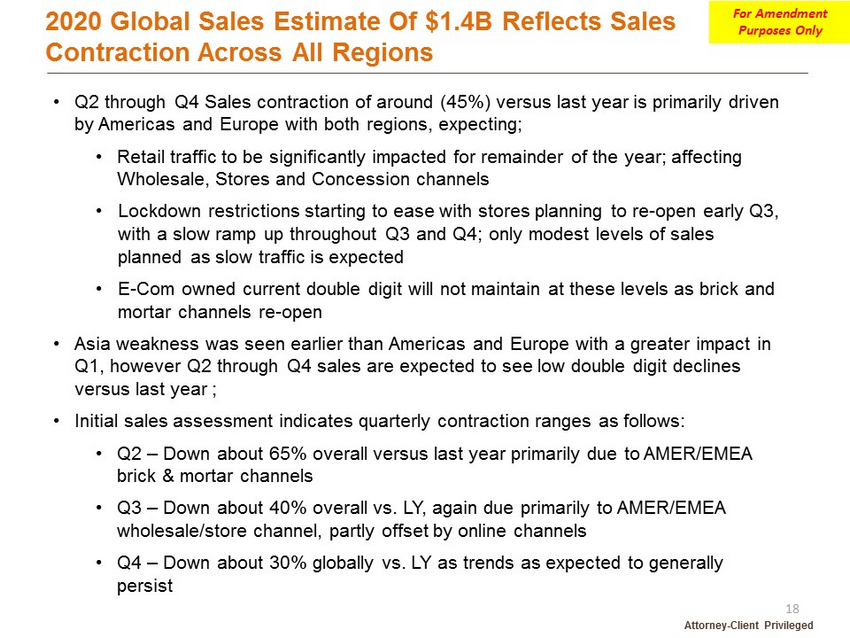
2020 Global Sales Estimate Of $1.4B Reflects Sales Contraction Across All Regions Attorney - Client Privileged • Q2 through Q4 Sales contraction of around (45%) versus last year is primarily driven by Americas and Europe with both regions, expecting; • Retail traffic to be significantly impacted for remainder of the year; affecting Wholesale, Stores and Concession channels • L ockdown restrictions starting to ease with stores planning to re - open early Q3, with a slow ramp up throughout Q3 and Q4; only modest levels of sales planned as slow traffic is expected • E - Com owned current double digit will not maintain at these levels as brick and mortar channels re - open • Asia weakness was seen earlier than Americas and Europe with a greater impact in Q1, however Q2 through Q4 sales are expected to see low double digit declines versus last year ; • Initial sales assessment indicates quarterly contraction ranges as follows: • Q2 – Down about 65% overall versus last year primarily due to AMER/EMEA brick & mortar channels • Q3 – Down about 40% overall vs. LY, again due primarily to AMER/EMEA wholesale/store channel, partly offset by online channels • Q4 – Down about 30% globally vs. LY as trends as expected to generally persist For Amendment Purposes Only 18
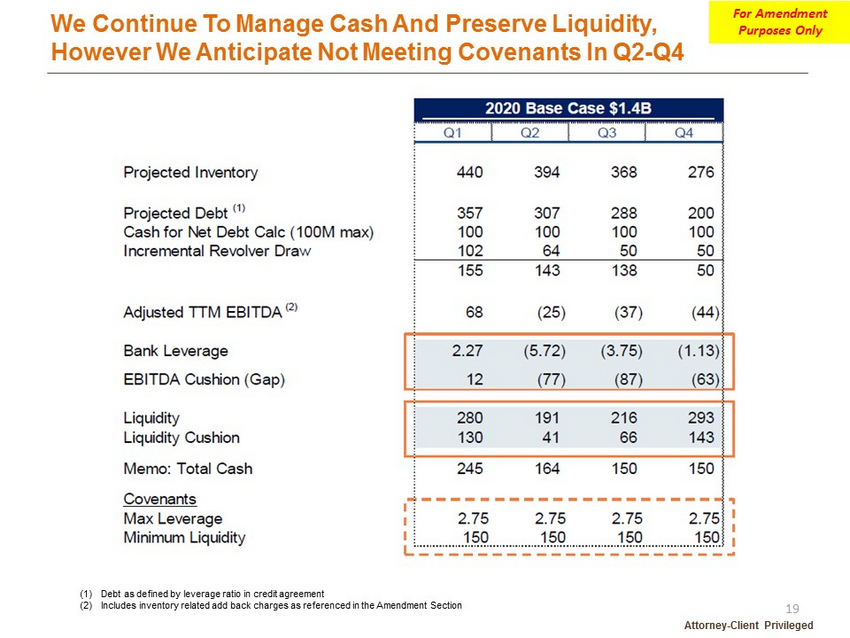
We Continue To Manage Cash And Preserve Liquidity, However We Anticipate Not Meeting Covenants In Q2 - Q4 Attorney - Client Privileged (1) Debt as defined by leverage ratio in credit agreement (2) Includes inventory related add back charges as referenced in the Amendment Section For Amendment Purposes Only 19

New World Fossil 2.0+ MVO Transformation Attorney - Client Privileged For Amendment Purposes Only 20
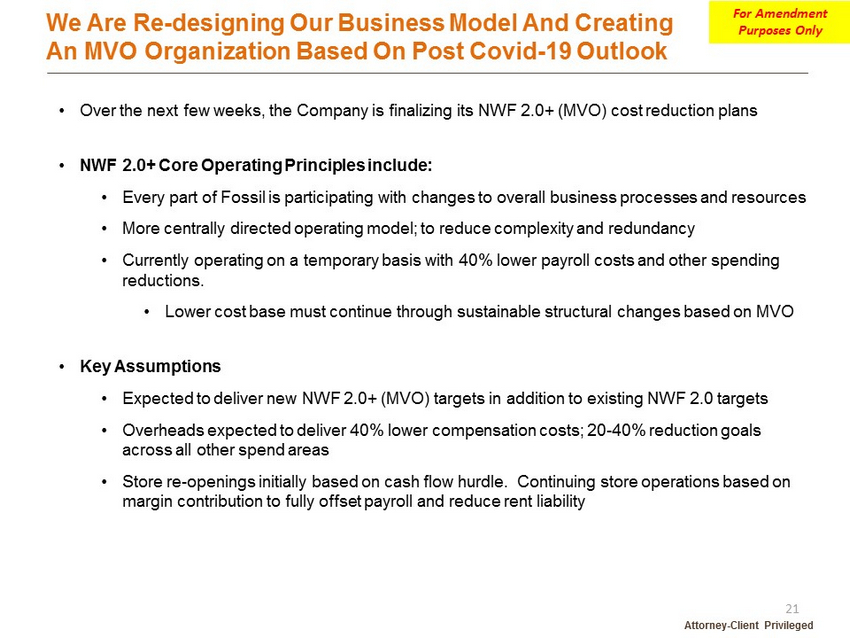
We Are Re - designing Our Business Model And Creating An MVO Organization Based On Post Covid - 19 Outlook Attorney - Client Privileged • Over the next few weeks, the Company is finalizing its NWF 2.0+ (MVO) cost reduction plans • NWF 2.0+ Core Operating Principles include: • Every part of Fossil is participating with changes to overall business processes and resources • More centrally directed operating model; to reduce complexity and redundancy • Currently operating on a temporary basis with 40% lower payroll costs and other spending reductions. • Lower cost base must continue through sustainable structural changes based on MVO • Key Assumptions • Expected to deliver new NWF 2.0+ (MVO) targets in addition to existing NWF 2.0 targets • Overheads expected to deliver 40% lower compensation costs; 20 - 40% reduction goals across all other spend areas • Store re - openings initially based on cash flow hurdle. Continuing store operations based on margin contribution to fully offset payroll and reduce rent liability For Amendment Purposes Only 21
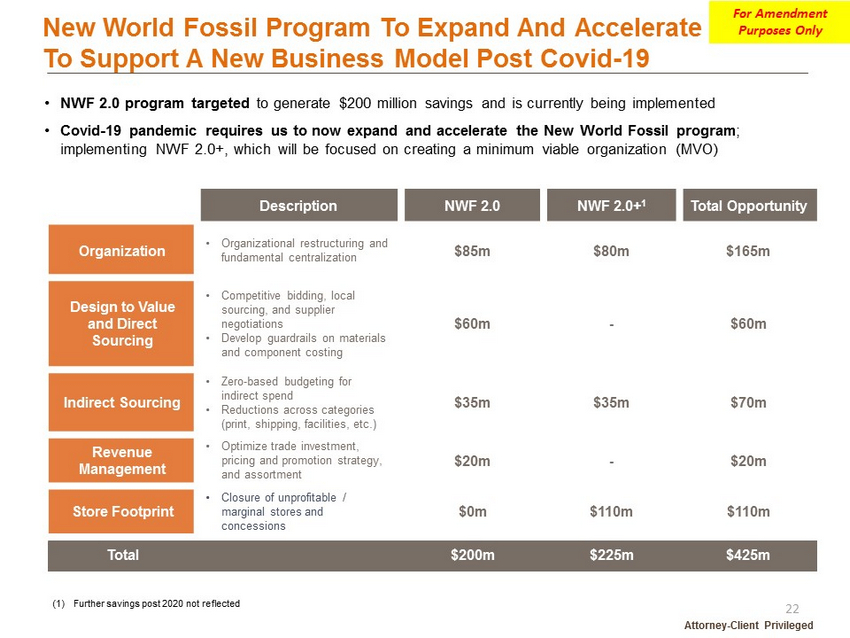
New World Fossil Program To Expand And Accelerate To Support A New Business Model Post Covid - 19 Attorney - Client Privileged • NWF 2.0 program targeted to generate $200 million savings and is currently being implemented • Covid - 19 pandemic requires us to now expand and accelerate the New World Fossil program ; implementing NWF 2.0+, which will be focused on creating a minimum viable organization (MVO) Description NWF 2.0 NWF 2.0+ 1 Total Opportunity Organization • Organizational restructuring and fundamental centralization $85m $80m $165m Design to Value and Direct Sourcing • Competitive bidding, local sourcing, and supplier negotiations • Develop guardrails on materials and component costing $60m - $60m Indirect Sourcing • Zero - based budgeting for indirect spend • Reductions across categories (print, shipping, facilities, etc.) $35m $35m $70m Revenue Management • Optimize trade investment, pricing and promotion strategy, and assortment $20m - $20m Store Footprint • Closure of unprofitable / marginal stores and concessions $0m $110m $110m Total $200m $225m $425m (1) Further savings post 2020 not reflected For Amendment Purposes Only 22
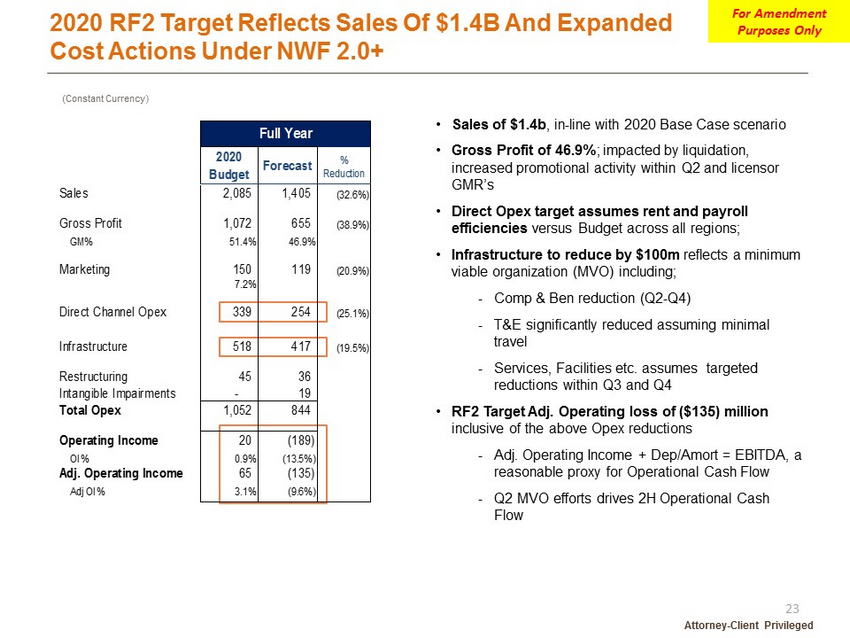
2020 RF2 Target Reflects Sales Of $1.4B And Expanded Cost Actions Under NWF 2.0+ Attorney - Client Privileged (Constant Currency) • Sales of $1.4b , in - line with 2020 Base Case scenario • Gross Profit of 46.9% ; impacted by liquidation, increased promotional activity within Q2 and licensor GMR’s • Direct Opex target assumes rent and payroll efficiencies versus Budget across all regions; • Infrastructure to reduce by $100m reflects a minimum viable organization (MVO) including; - Comp & Ben reduction (Q2 - Q4) - T&E significantly reduced assuming minimal travel - Services, Facilities etc. assumes targeted reductions within Q3 and Q4 • RF2 Target Adj. Operating loss of ($135) million inclusive of the above Opex reductions - Adj. Operating Income + Dep / Amort = EBITDA, a reasonable proxy for Operational Cash Flow - Q2 MVO efforts drives 2H Operational Cash Flow 2020 Budget Forecast % Reduction Sales 2,085 1,405 (32.6%) Gross Profit 1,072 655 (38.9%) GM% 51.4% 46.9% Marketing 150 119 (20.9%) 7.2% Direct Channel Opex 339 254 (25.1%) Infrastructure 518 417 (19.5%) Restructuring 45 36 Intangible Impairments - 19 Total Opex 1,052 844 Operating Income 20 (189) OI % 0.9% (13.5%) Adj. Operating Income 65 (135) Adj OI % 3.1% (9.6%) Full Year For Amendment Purposes Only 23
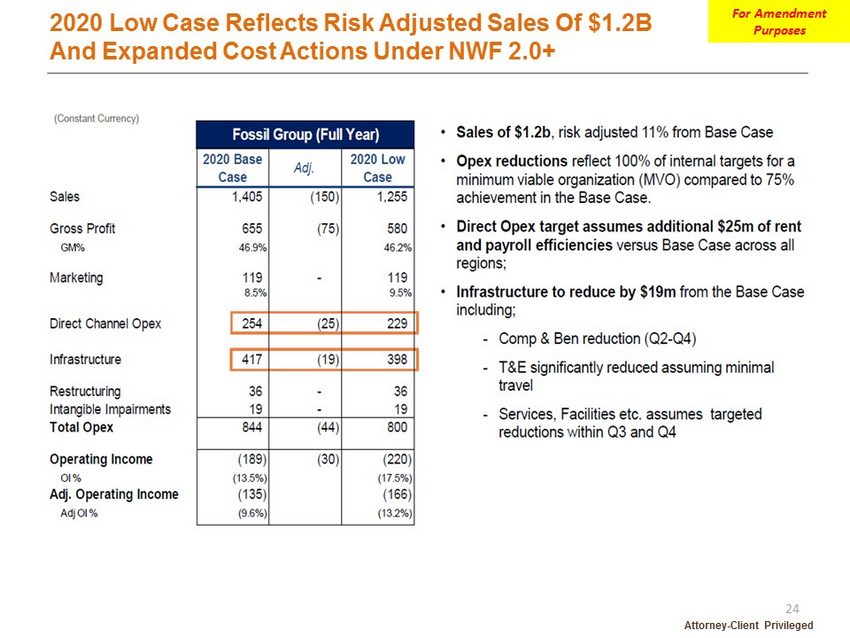
2020 Low Case Reflects Risk Adjusted Sales Of $ 1.2B And Expanded Cost Actions Under NWF 2.0+ Attorney - Client Privileged For Amendment Purposes 24
FY2021 Prelim Attorney - Client Privileged For Amendment Purposes Only 25
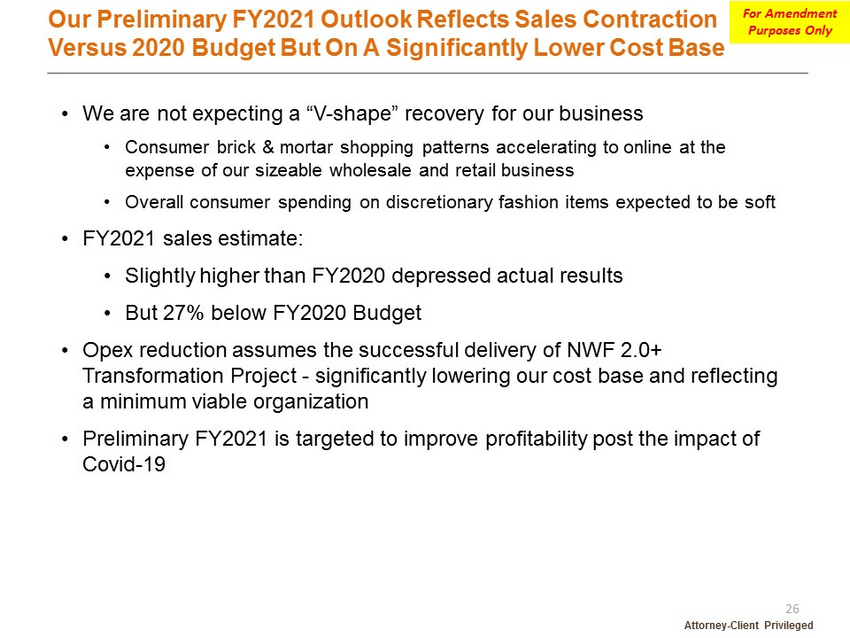
Our Preliminary FY2021 Outlook Reflects Sales Contraction Versus 2020 Budget But On A Significantly Lower Cost Base Attorney - Client Privileged • We are not expecting a “V - shape” recovery for our business • Consumer brick & mortar shopping patterns accelerating to online at the expense of our sizeable wholesale and retail business • Overall consumer spending on discretionary fashion items expected to be soft • FY2021 sales estimate: • Slightly higher than FY2020 depressed actual results • But 27% below FY2020 Budget • Opex reduction assumes the successful delivery of NWF 2.0+ Transformation Project - significantly lowering our cost base and reflecting a minimum viable organization • Preliminary FY2021 is targeted to improve profitability post the impact of Covid - 19 For Amendment Purposes Only 26
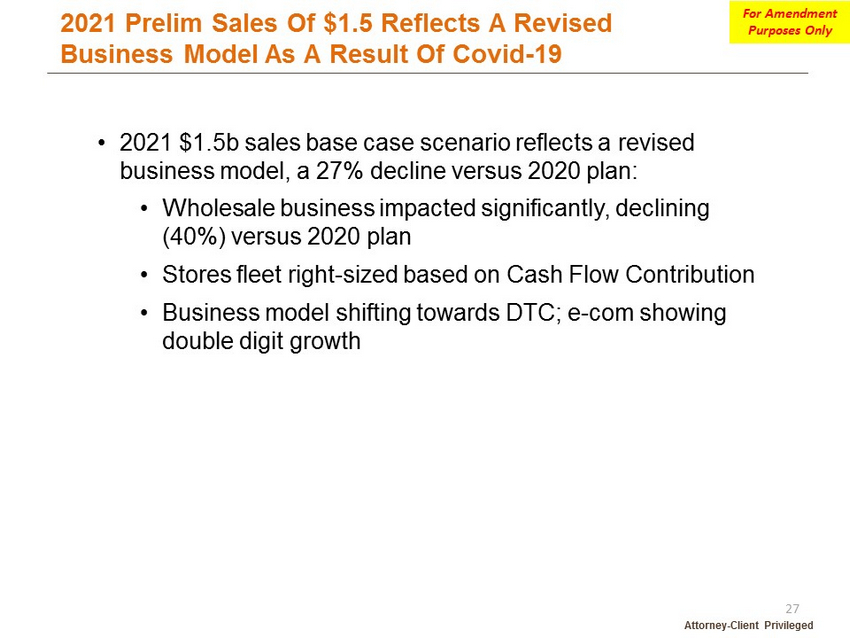
2021 Prelim Sales Of $1.5 Reflects A Revised Business Model As A Result Of Covid - 19 Attorney - Client Privileged • 2021 $1.5b sales base case scenario reflects a revised business model, a 27% decline versus 2020 plan: • Wholesale business impacted significantly, declining (40%) versus 2020 plan • Stores fleet right - sized based on Cash Flow Contribution • Business model shifting towards DTC; e - com showing double digit growth For Amendment Purposes Only 27
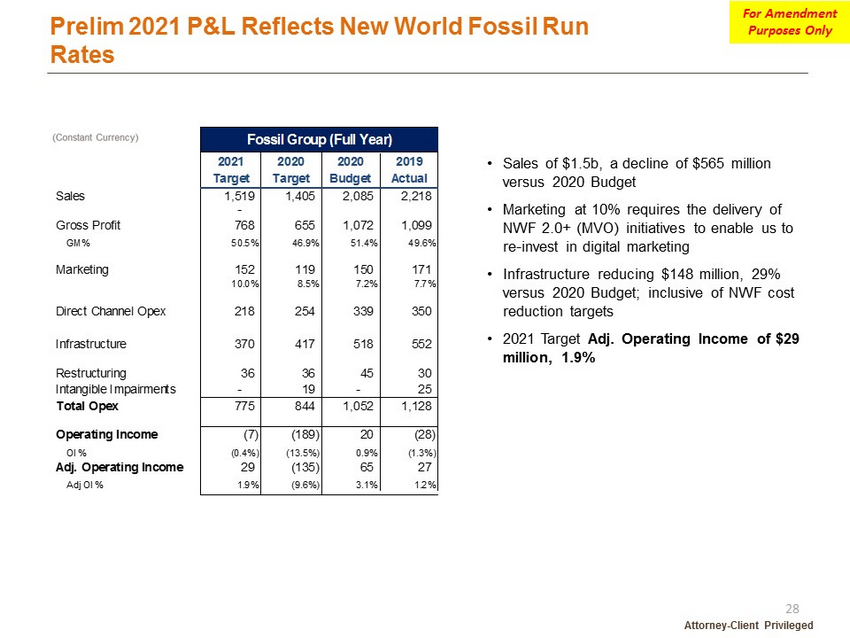
Prelim 2021 P&L Reflects New World Fossil Run Rates Attorney - Client Privileged • Sales of $1.5b, a decline of $565 million versus 2020 Budget • Marketing at 10% requires the delivery of NWF 2.0+ (MVO ) initiatives to enable us to re - invest in digital marketing • Infrastructure reducing $148 million, 29% versus 2020 Budget; inclusive of NWF cost reduction targets • 2021 Target Adj. Operating Income of $29 million, 1.9% 2021 Target 2020 Target 2020 Budget 2019 Actual Sales 1,519 1,405 2,085 2,218 - Gross Profit 768 655 1,072 1,099 GM% 50.5% 46.9% 51.4% 49.6% Marketing 152 119 150 171 10.0% 8.5% 7.2% 7.7% Direct Channel Opex 218 254 339 350 Infrastructure 370 417 518 552 Restructuring 36 36 45 30 Intangible Impairments - 19 - 25 Total Opex 775 844 1,052 1,128 Operating Income (7) (189) 20 (28) OI % (0.4%) (13.5%) 0.9% (1.3%) Adj. Operating Income 29 (135) 65 27 Adj OI % 1.9% (9.6%) 3.1% 1.2% Fossil Group (Full Year) For Amendment Purposes Only 28
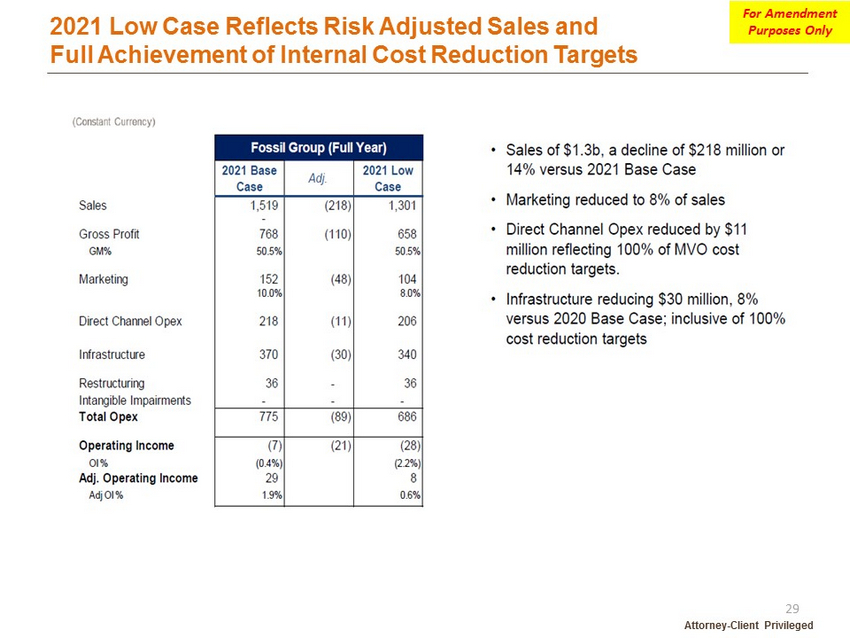
2021 Low Case Reflects Risk Adjusted Sales and Full Achievement of Internal Cost Reduction Targets Attorney - Client Privileged For Amendment Purposes Only 29
Overview of Amendment Attorney - Client Privileged For Amendment Purposes Only 30
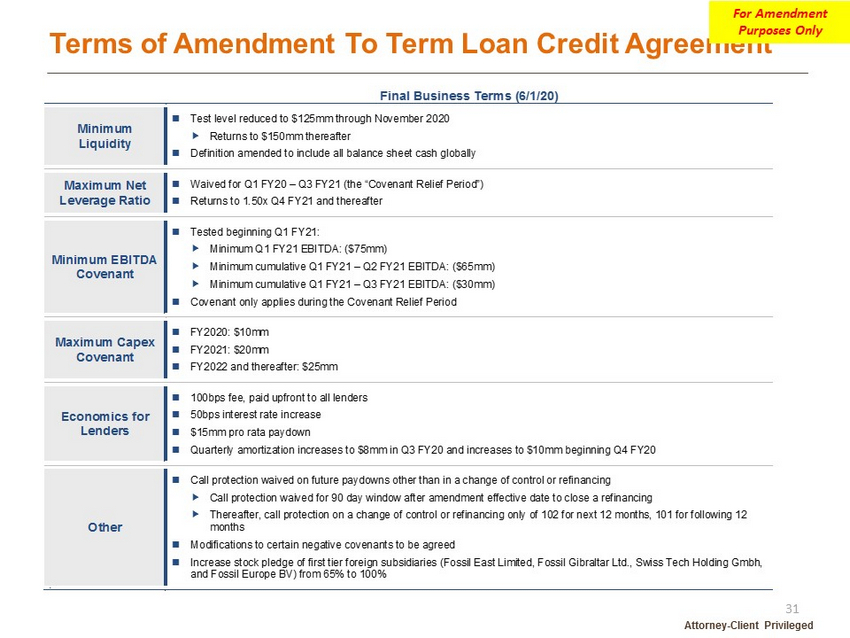
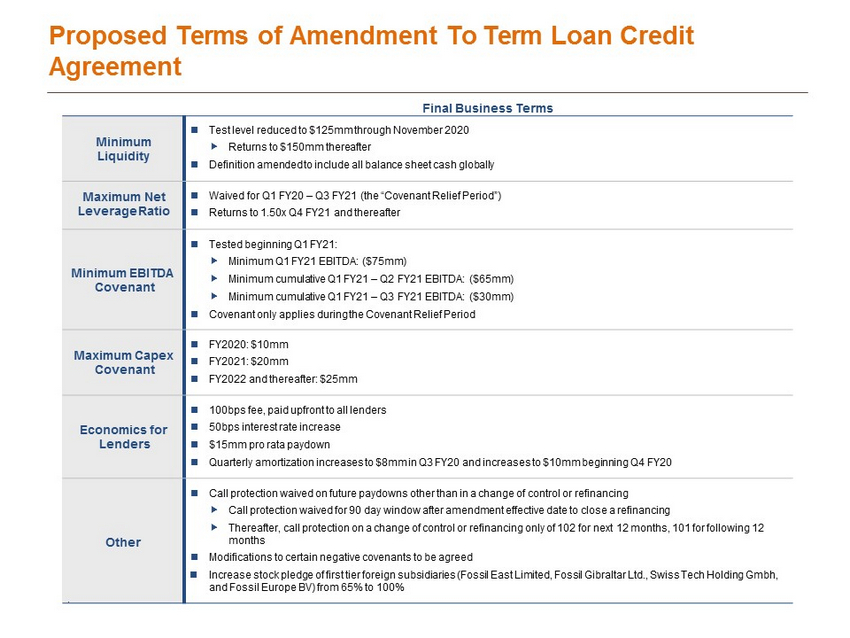
Terms of Amendment To Term Loan Credit Agreement Attorney - Client Privileged For Amendment Purposes Only 31 Final Business Terms (6/1/20) Minimum Liquidity Test level reduced to $125mm through November 2020 Returns to $150mm thereafter Definition amended to include all balance sheet cash globally Maximum Net Leverage Ratio Waived for Q1 FY20 – Q3 FY21 (the “Covenant Relief Period”) Returns to 1.50x Q4 FY21 and thereafter Minimum EBITDA Covenant Tested beginning Q1 FY21: Minimum Q1 FY21 EBITDA: ($75mm) Minimum cumulative Q1 FY21 – Q2 FY21 EBITDA: ($65mm) Minimum cumulative Q1 FY21 – Q3 FY21 EBITDA: ($30mm) Covenant only applies during the Covenant Relief Period Maximum Capex Covenant FY2020: $10mm FY2021: $20mm FY2022 and thereafter: $25mm Economics for Lenders 100bps fee, paid upfront to all lenders 50bps interest rate increase $15mm pro rata paydown Quarterly amortization increases to $8mm in Q3 FY20 and increases to $10mm beginning Q4 FY20 Other Call protection waived on future paydowns other than in a change of control or refinancing Call protection waived for 90 day window after amendment effective date to close a refinancing Thereafter, call protection on a change of control or refinancing only of 102 for next 12 months, 101 for following 12 months Modifications to certain negative covenants to be agreed Increase stock pledge of first tier foreign subsidiaries (Fossil East Limited, Fossil Gibraltar Ltd., Swiss Tech Holding Gmbh, and Fossil Europe BV) from 65% to 100% A
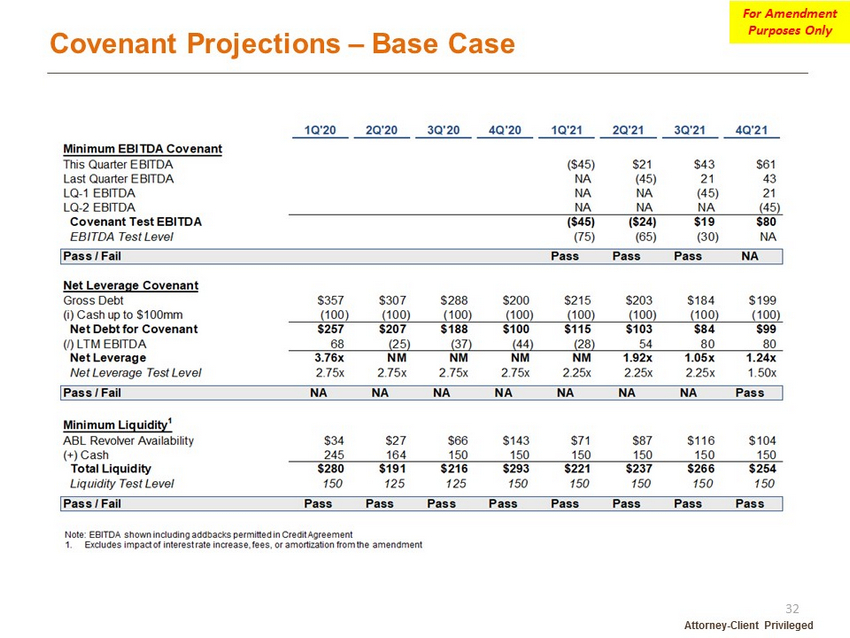
Covenant Projections – Base Case Attorney - Client Privileged For Amendment Purposes Only 32
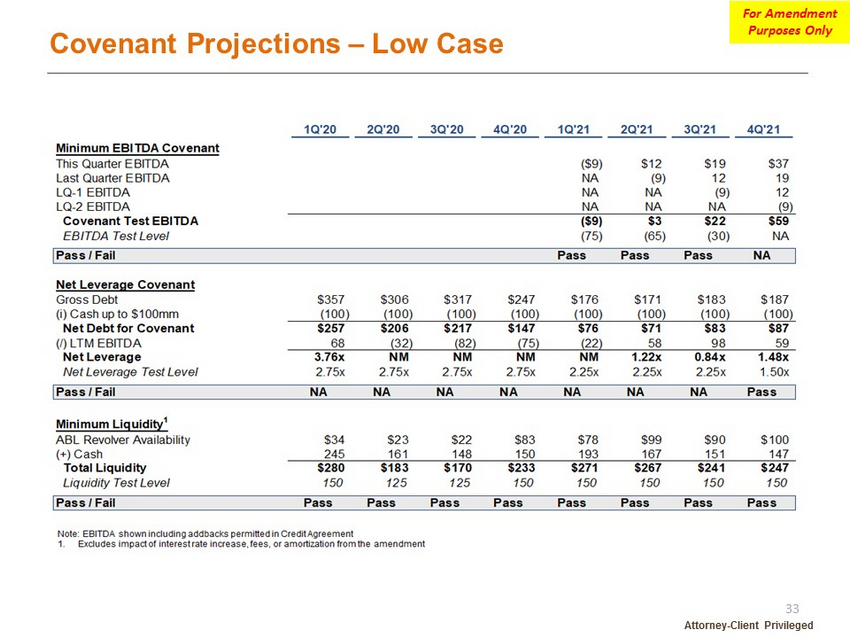
Covenant Projections – Low Case Attorney - Client Privileged For Amendment Purposes Only 33
Appendix Attorney - Client Privileged For Amendment Purposes Only 34
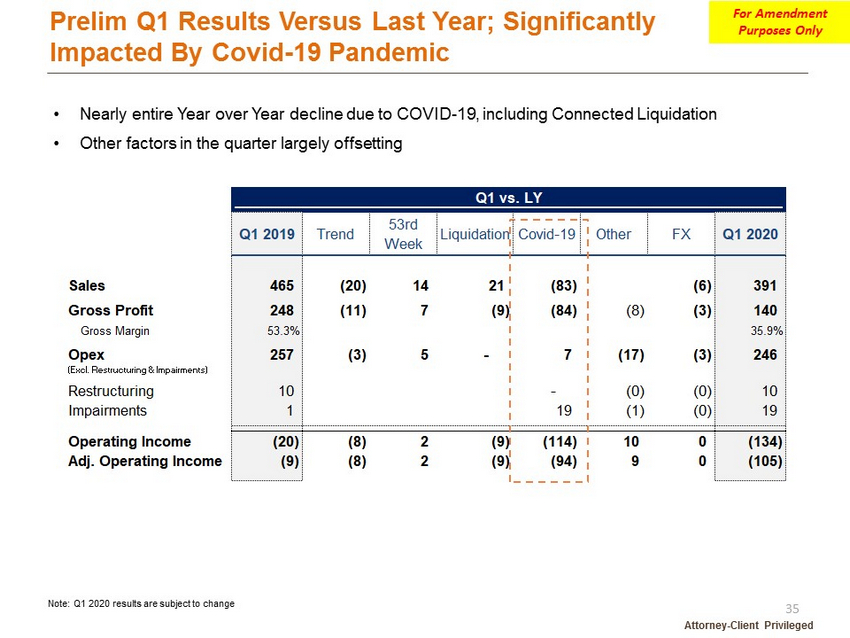
Attorney - Client Privileged Prelim Q1 Results Versus Last Year; Significantly Impacted By Covid - 19 Pandemic Note: Q1 2020 results are subject to change • Nearly entire Year over Year decline due to COVID - 19, including Connected Liquidation • Other factors in the quarter largely offsetting For Amendment Purposes Only 35
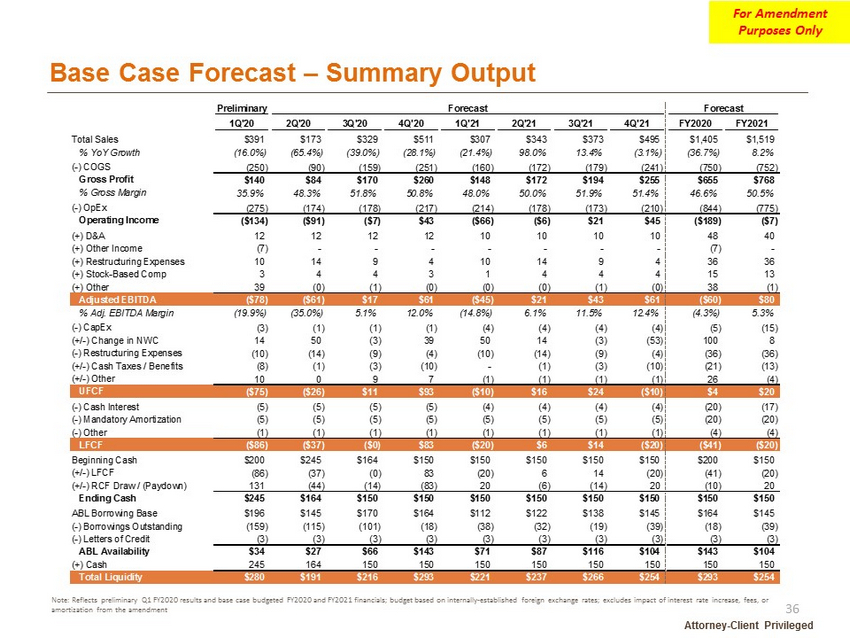
Base Case Forecast – Summary Output Attorney - Client Privileged Preliminary Forecast Forecast 1Q'20 2Q'20 3Q'20 4Q'20 1Q'21 2Q'21 3Q'21 4Q'21 FY2020 FY2021 Total Sales $391 $173 $329 $511 $307 $343 $373 $495 $1,405 $1,519 % YoY Growth (16.0%) (65.4%) (39.0%) (28.1%) (21.4%) 98.0% 13.4% (3.1%) (36.7%) 8.2% (-) COGS (250) (90) (159) (251) (160) (172) (179) (241) (750) (752) Gross Profit $140 $84 $170 $260 $148 $172 $194 $255 $655 $768 % Gross Margin 35.9% 48.3% 51.8% 50.8% 48.0% 50.0% 51.9% 51.4% 46.6% 50.5% (-) OpEx (275) (174) (178) (217) (214) (178) (173) (210) (844) (775) Operating Income ($134) ($91) ($7) $43 ($66) ($6) $21 $45 ($189) ($7) (+) D&A 12 12 12 12 10 10 10 10 48 40 (+) Other Income (7) - - - - - - - (7) - (+) Restructuring Expenses 10 14 9 4 10 14 9 4 36 36 (+) Stock-Based Comp 3 4 4 3 1 4 4 4 15 13 (+) Other 39 (0) (1) (0) (0) (0) (1) (0) 38 (1) Adjusted EBITDA ($78) ($61) $17 $61 ($45) $21 $43 $61 ($60) $80 % Adj. EBITDA Margin (19.9%) (35.0%) 5.1% 12.0% (14.8%) 6.1% 11.5% 12.4% (4.3%) 5.3% (-) CapEx (3) (1) (1) (1) (4) (4) (4) (4) (5) (15) (+/-) Change in NWC 14 50 (3) 39 50 14 (3) (53) 100 8 (-) Restructuring Expenses (10) (14) (9) (4) (10) (14) (9) (4) (36) (36) (+/-) Cash Taxes / Benefits (8) (1) (3) (10) - (1) (3) (10) (21) (13) (+/-) Other 10 0 9 7 (1) (1) (1) (1) 26 (4) UFCF ($75) ($26) $11 $93 ($10) $16 $24 ($10) $4 $20 (-) Cash Interest (5) (5) (5) (5) (4) (4) (4) (4) (20) (17) (-) Mandatory Amortization (5) (5) (5) (5) (5) (5) (5) (5) (20) (20) (-) Other (1) (1) (1) (1) (1) (1) (1) (1) (4) (4) LFCF ($86) ($37) ($0) $83 ($20) $6 $14 ($20) ($41) ($20) Beginning Cash $200 $245 $164 $150 $150 $150 $150 $150 $200 $150 (+/-) LFCF (86) (37) (0) 83 (20) 6 14 (20) (41) (20) (+/-) RCF Draw / (Paydown) 131 (44) (14) (83) 20 (6) (14) 20 (10) 20 Ending Cash $245 $164 $150 $150 $150 $150 $150 $150 $150 $150 ABL Borrowing Base $196 $145 $170 $164 $112 $122 $138 $145 $164 $145 (-) Borrowings Outstanding (159) (115) (101) (18) (38) (32) (19) (39) (18) (39) (-) Letters of Credit (3) (3) (3) (3) (3) (3) (3) (3) (3) (3) ABL Availability $34 $27 $66 $143 $71 $87 $116 $104 $143 $104 (+) Cash 245 164 150 150 150 150 150 150 150 150 Total Liquidity $280 $191 $216 $293 $221 $237 $266 $254 $293 $254 Note: Reflects preliminary Q1 FY2020 results and base case budgeted FY2020 and FY2021 financials; budget based on internally - est ablished foreign exchange rates; excludes impact of interest rate increase, fees, or amortization from the amendment For Amendment Purposes Only 36
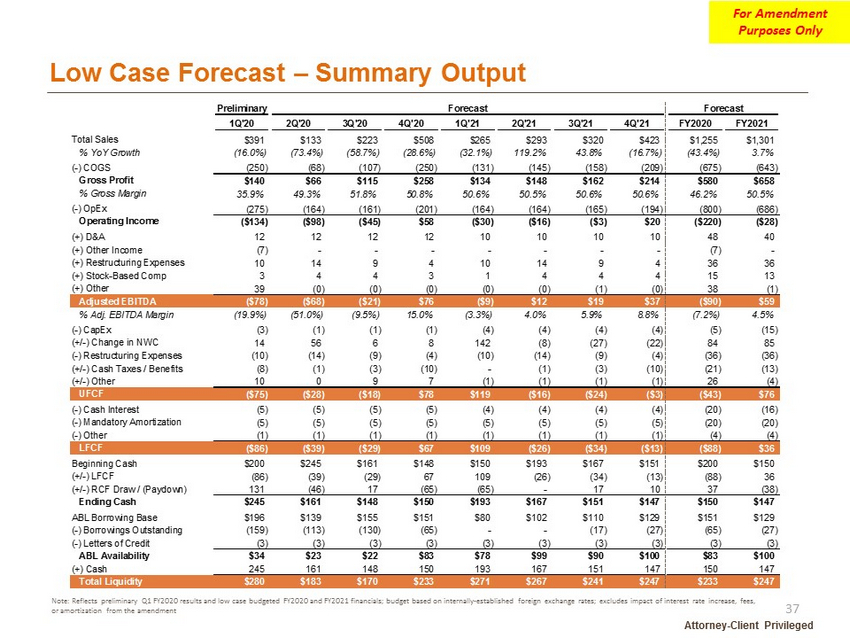
Low Case Forecast – Summary Output Attorney - Client Privileged Preliminary Forecast Forecast 1Q'20 2Q'20 3Q'20 4Q'20 1Q'21 2Q'21 3Q'21 4Q'21 FY2020 FY2021 Total Sales $391 $133 $223 $508 $265 $293 $320 $423 $1,255 $1,301 % YoY Growth (16.0%) (73.4%) (58.7%) (28.6%) (32.1%) 119.2% 43.8% (16.7%) (43.4%) 3.7% (-) COGS (250) (68) (107) (250) (131) (145) (158) (209) (675) (643) Gross Profit $140 $66 $115 $258 $134 $148 $162 $214 $580 $658 % Gross Margin 35.9% 49.3% 51.8% 50.8% 50.6% 50.5% 50.6% 50.6% 46.2% 50.5% (-) OpEx (275) (164) (161) (201) (164) (164) (165) (194) (800) (686) Operating Income ($134) ($98) ($45) $58 ($30) ($16) ($3) $20 ($220) ($28) (+) D&A 12 12 12 12 10 10 10 10 48 40 (+) Other Income (7) - - - - - - - (7) - (+) Restructuring Expenses 10 14 9 4 10 14 9 4 36 36 (+) Stock-Based Comp 3 4 4 3 1 4 4 4 15 13 (+) Other 39 (0) (0) (0) (0) (0) (1) (0) 38 (1) Adjusted EBITDA ($78) ($68) ($21) $76 ($9) $12 $19 $37 ($90) $59 % Adj. EBITDA Margin (19.9%) (51.0%) (9.5%) 15.0% (3.3%) 4.0% 5.9% 8.8% (7.2%) 4.5% (-) CapEx (3) (1) (1) (1) (4) (4) (4) (4) (5) (15) (+/-) Change in NWC 14 56 6 8 142 (8) (27) (22) 84 85 (-) Restructuring Expenses (10) (14) (9) (4) (10) (14) (9) (4) (36) (36) (+/-) Cash Taxes / Benefits (8) (1) (3) (10) - (1) (3) (10) (21) (13) (+/-) Other 10 0 9 7 (1) (1) (1) (1) 26 (4) UFCF ($75) ($28) ($18) $78 $119 ($16) ($24) ($3) ($43) $76 (-) Cash Interest (5) (5) (5) (5) (4) (4) (4) (4) (20) (16) (-) Mandatory Amortization (5) (5) (5) (5) (5) (5) (5) (5) (20) (20) (-) Other (1) (1) (1) (1) (1) (1) (1) (1) (4) (4) LFCF ($86) ($39) ($29) $67 $109 ($26) ($34) ($13) ($88) $36 Beginning Cash $200 $245 $161 $148 $150 $193 $167 $151 $200 $150 (+/-) LFCF (86) (39) (29) 67 109 (26) (34) (13) (88) 36 (+/-) RCF Draw / (Paydown) 131 (46) 17 (65) (65) - 17 10 37 (38) Ending Cash $245 $161 $148 $150 $193 $167 $151 $147 $150 $147 ABL Borrowing Base $196 $139 $155 $151 $80 $102 $110 $129 $151 $129 (-) Borrowings Outstanding (159) (113) (130) (65) - - (17) (27) (65) (27) (-) Letters of Credit (3) (3) (3) (3) (3) (3) (3) (3) (3) (3) ABL Availability $34 $23 $22 $83 $78 $99 $90 $100 $83 $100 (+) Cash 245 161 148 150 193 167 151 147 150 147 Total Liquidity $280 $183 $170 $233 $271 $267 $241 $247 $233 $247 Note: Reflects preliminary Q1 FY2020 results and low case budgeted FY2020 and FY2021 financials; budget based on internally - esta blished foreign exchange rates; excludes impact of interest rate increase, fees, or amortization from the amendment For Amendment Purposes Only 37