Exhibit 99.1

Primis Financial Corp. Reports Earnings per Share for the Fourth Quarter of 2025
Declares Quarterly Cash Dividend of $0.10 Per Share
For immediate release
Thursday, January 29, 2026
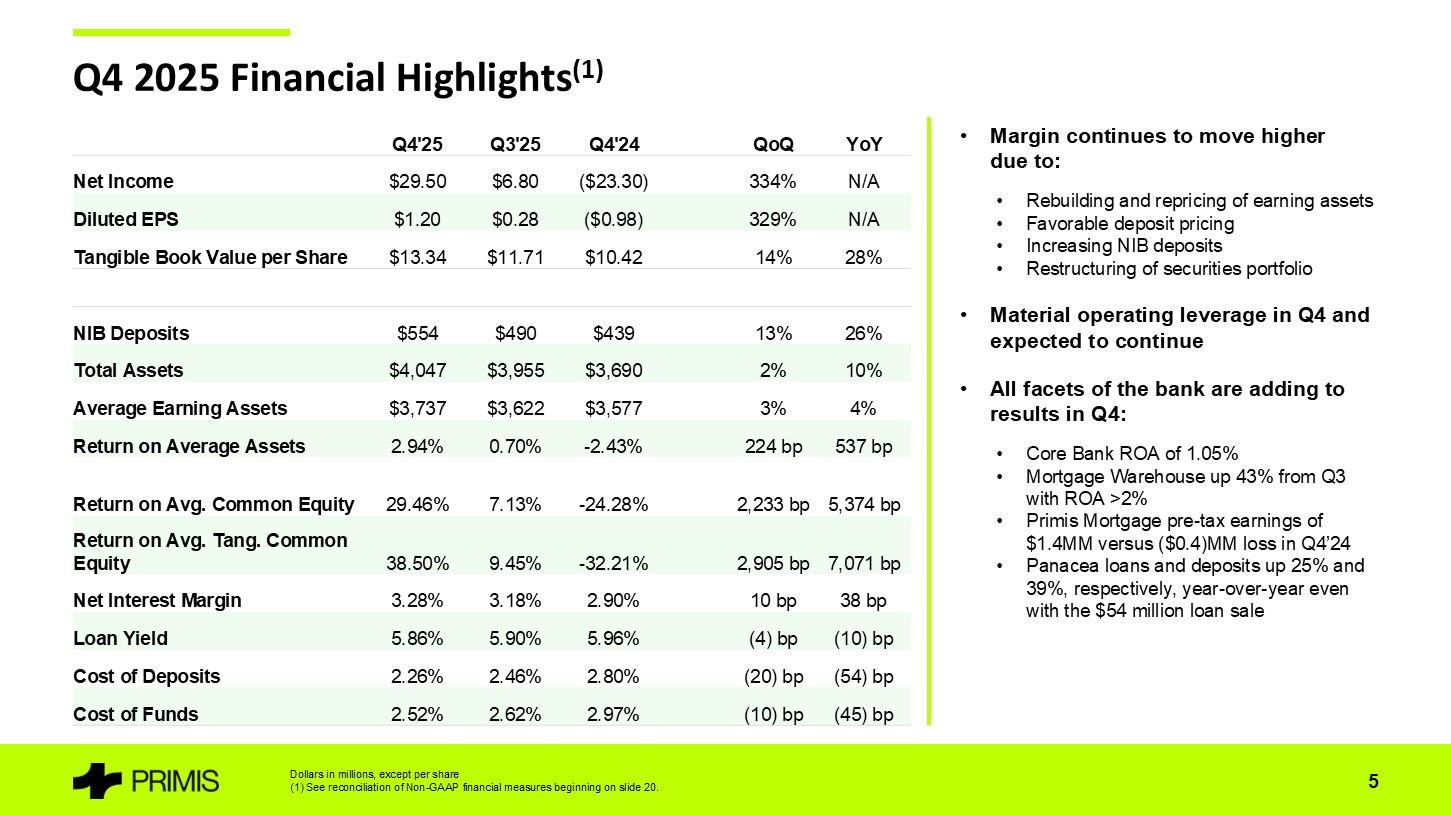
McLean, Virginia, January 29, 2026 – Primis Financial Corp. (NASDAQ: FRST) (“Primis” or the “Company”), and its wholly-owned subsidiary, Primis Bank (the “Bank”), today reported net income available to common shareholders of $30 million, or $1.20 per diluted share, for the three months ended December 31, 2025, compared to a net loss available to common shareholders of $23 million, or a loss of $0.94 per diluted share, for the three months ended December 31, 2024. For the twelve months ended December 31, 2025, the Company reported net income available to common shareholders of $61 million, or $2.49 per diluted share, compared to a net loss available to common shareholders of $16 million, or a loss of $0.66 per diluted share, for the same period in 2024.
2025 Accomplishments
The Company’s fundamentals showed significant improvement through the course of 2025 which we believe positions us for robust full-year profitability in 2026. Significant areas of improvement year-over-year are detailed in the chart below:
| As of or
for the Three Months Ended | ||||||||||||
| ($ in millions except per share) | 12/31/2025 | 12/31/2024 | Var. | |||||||||
| Total Assets | $ | 4,047 | $ | 3,690 | 10 | % | ||||||
| Gross Loans HFI | 3,284 | 2,887 | 14 | |||||||||
| Total Deposits | 3,396 | 3,171 | 7 | |||||||||
| Average Earning Assets | $ | 3.737 | $ | 3,577 | 5 | % | ||||||
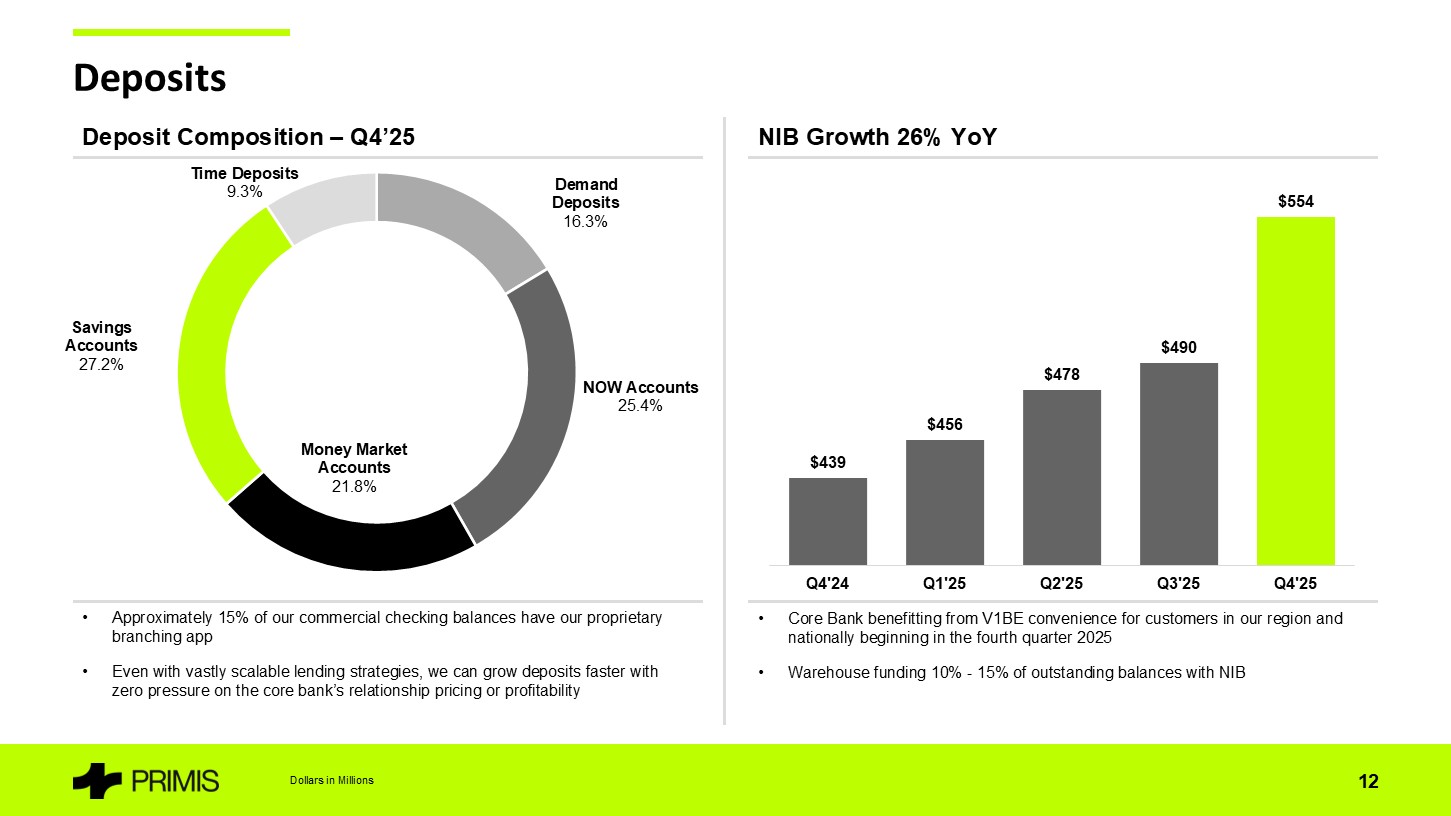
| Noninterest Bearing Deposits (“NIB”) | 554 | 439 | 26 | |||||||||
| NIB / Total Deposits | 16.3 | % | 14.4 | % | 190 | bps | ||||||
| TCE / TA | 8.33 | % | 7.16 | % | 117 | bps | ||||||
| Tangible Book Value per Share | $ | 13.34 | $ | 10.42 | 28 | % | ||||||
| Net Interest Income | $ | 30,852 | $ | 26,077 | 18 | % | ||||||
| Net Interest Margin | 3.28 | 2.90 | 38 | bps | ||||||||
| Retail Mortgage Volume | $ | 378 | $ | 205 | 84 | % | ||||||
Commenting on the results, Dennis J. Zember, Jr., President and Chief Executive Officer of the Company, stated, “We spent 2025 harvesting some of the embedded gains on our balance sheet and used those gains to reposition the Company for 2026 and beyond. We rebuilt capital levels and tangible book value and eliminated the noise and excess exposure to the consumer loan portfolio. But the year was more about offense than defense, which is reflected in a substantial increase in earning assets and the portion funded with non-interest bearing demand deposits. The core bank along with all of our divisions had the best year in the last decade and are prepared to continue that momentum into 2026.”
1
Division Updates
2025 saw strong results from the Company’s focus on its core Bank and lines of business that drive premium operating results. The fourth quarter of 2025 demonstrated progress in key areas that are expected to drive profitability in 2026. The following discussion highlights recent progress for each of these strategies:
Core Community Bank
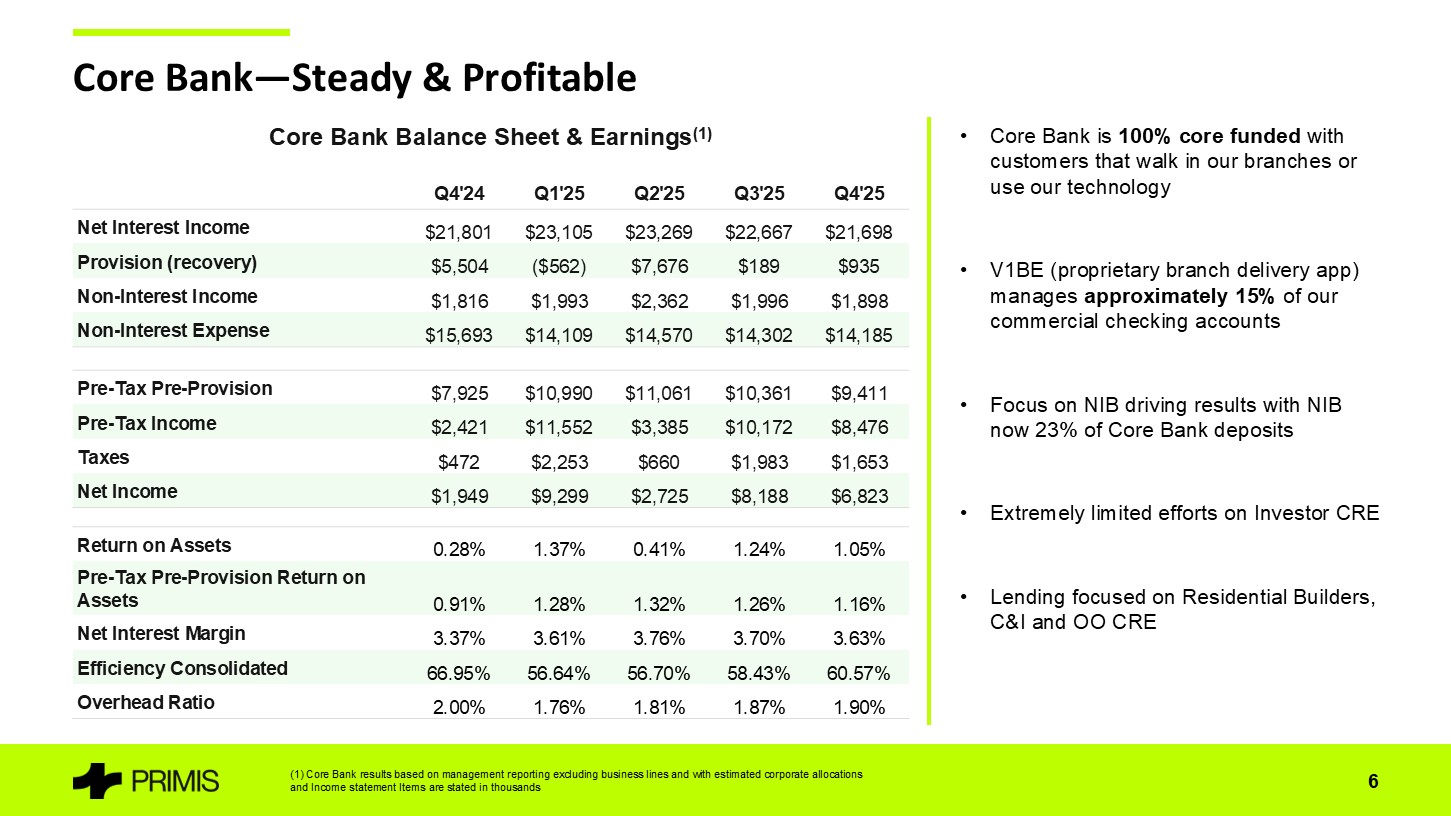
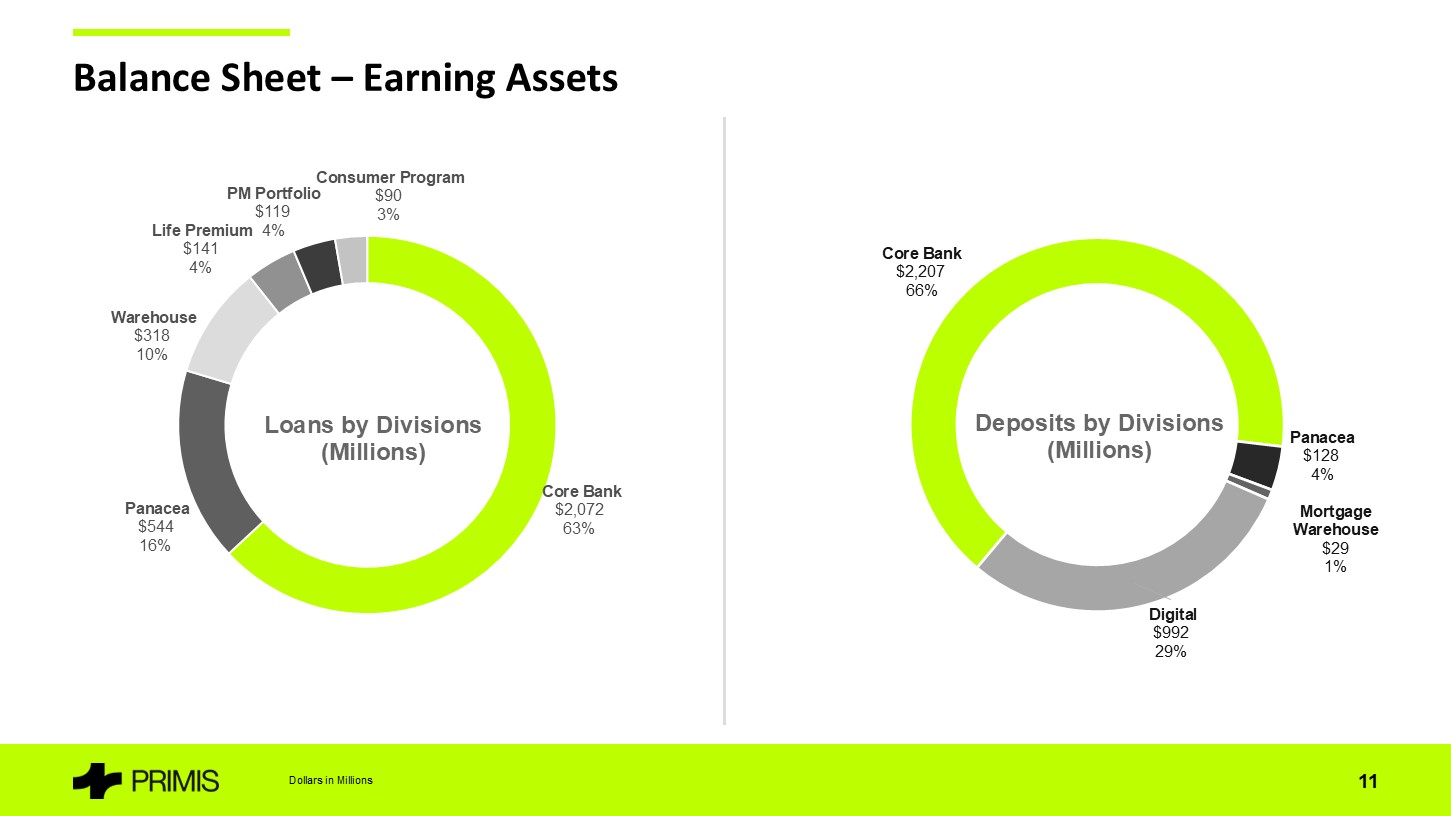
The core Bank’s 24 banking offices in Virginia and Maryland represent almost two-thirds of the Company’s total balance sheet. Management believes the core Bank drives significant value for the Company with a stable deposit base and strong core profitability:
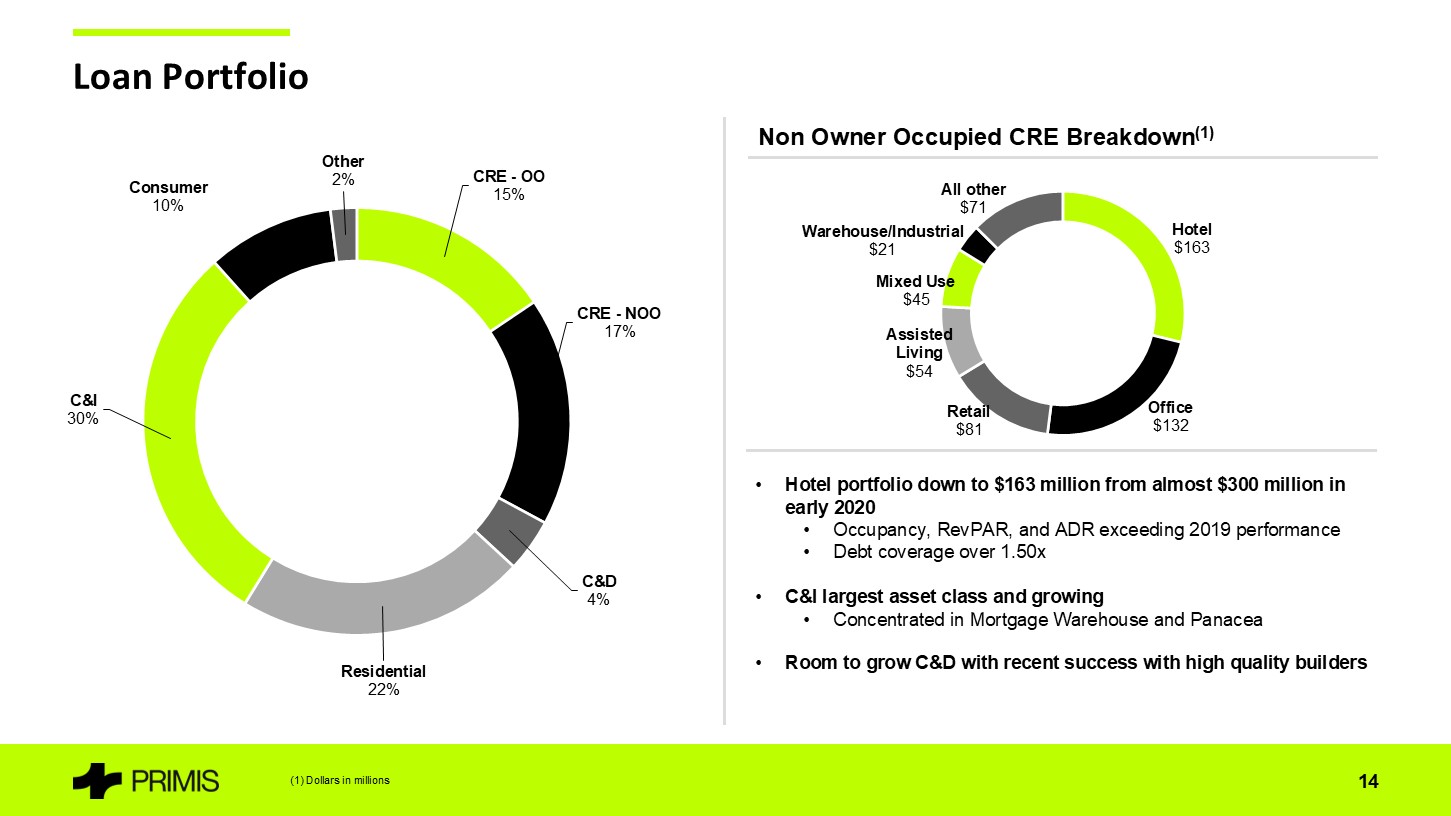
| · | The core Bank has low concentrations of investor CRE (26% of total loans and only 200% of regulatory capital) | |
| · | A robust pipeline of mostly new customers to the Bank with yields that are incremental to the Bank’s margin | |
| · | Cost of deposits of 1.59% in the fourth quarter of 2025 compared to 2.06% in the same quarter in 2024. | |
| · | Zero brokered deposits and low utilization of FHLB borrowings. | |
| · | A proprietary banking app for commercial depositors that drives new sales independent of lending efforts in and around the Company’s footprint. |
Approximately 23% of the core Bank’s deposit base are noninterest bearing deposits, supported with what management believes is the region’s best and most unique technology including the Bank’s proprietary V1BE service, which directly supports more than $200 million of mostly commercial clients in the Bank’s footprint. Approximately $30 million of checking accounts are associated with customers that use V1BE every week. The Company is frequently approached by other community banks looking to use this technology with their own customers. Primis is currently implementing enhancements to make V1BE easier to license to other banks and expects to have its first customer onboard in 2026.
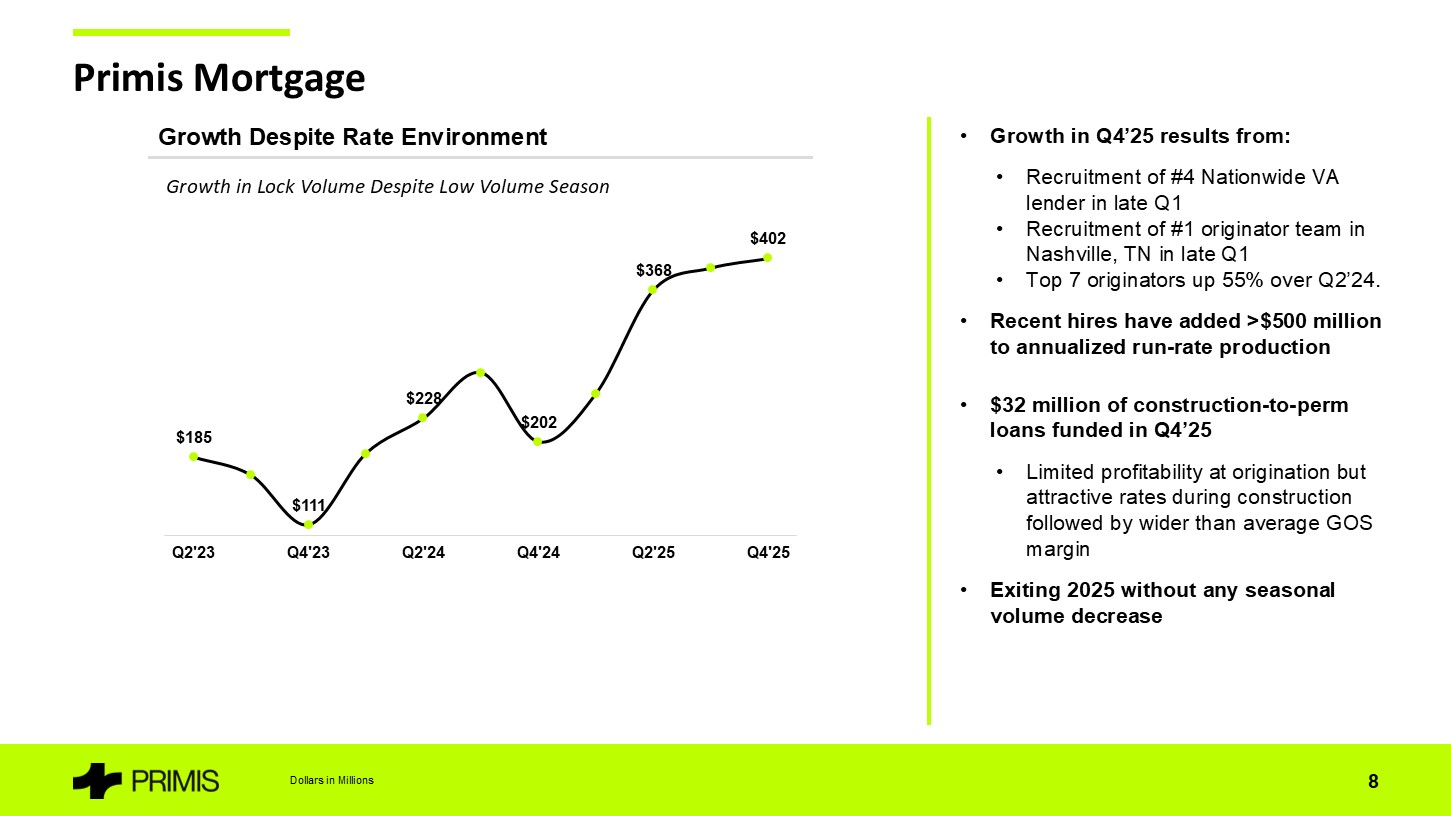
Primis Mortgage
Primis Mortgage had closed mortgage volume of $378 million in the fourth quarter of 2025, up 84% compared to the same quarter in 2024. Construction-to-permanent loan volume was $32 million in the fourth quarter of 2025 versus $2 million in the same period in 2024. Pre-tax earnings related to mortgage were approximately $1.4 million for the fourth quarter of 2025, up substantially from a loss of $0.4 million in the fourth quarter of 2024.
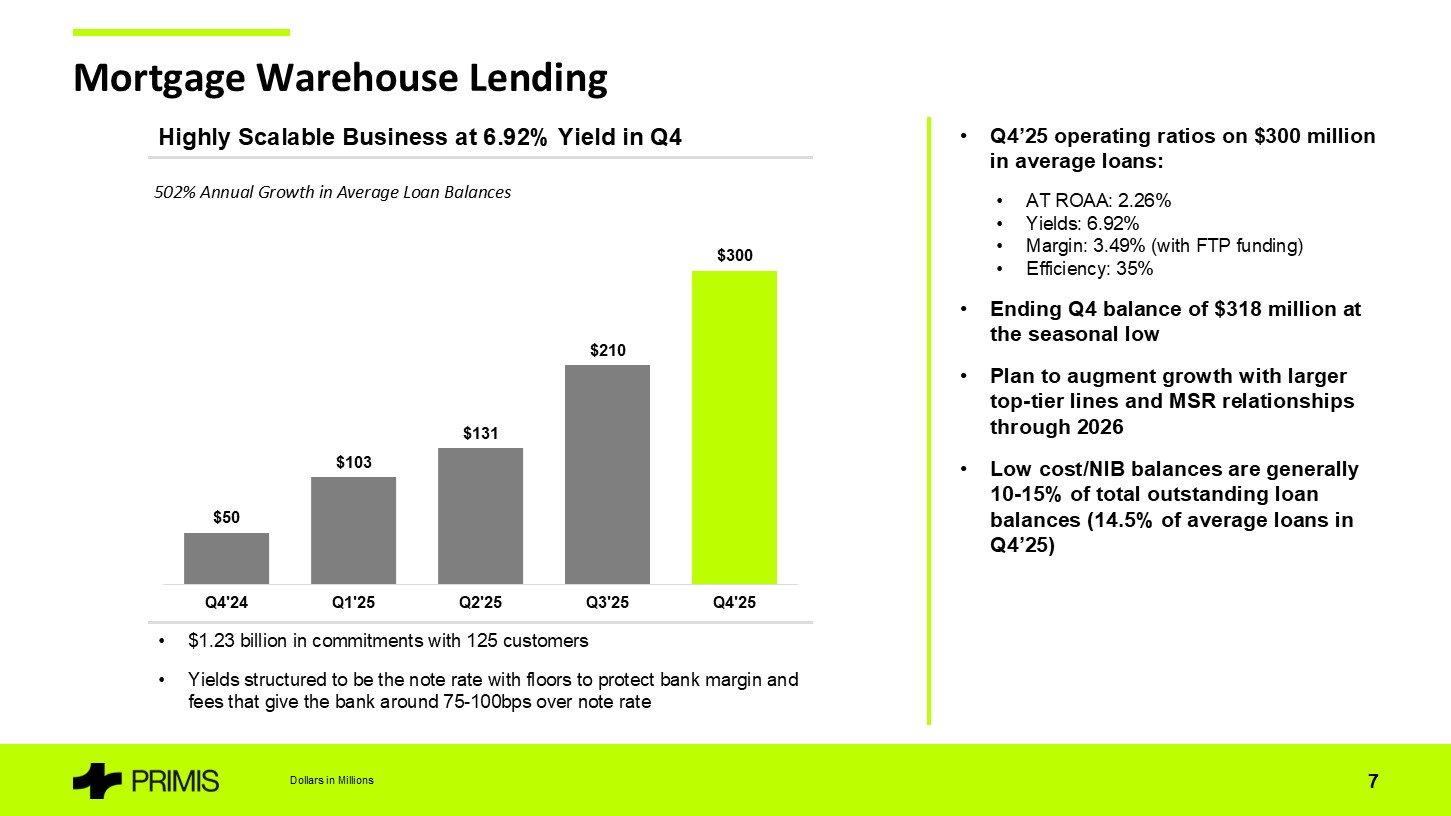
Mortgage Warehouse
Mortgage warehouse lending activity was significant in 2025 following the expansion of the team in the fall of 2024. Outstanding loan balances at December 31, 2025 were $318 million, up 398% from $64 million at December 31, 2024. Average loan balances were $300 million in the fourth quarter of 2025, up 43% from $210 million in the third quarter of 2025 and up 812% from $33 million in the fourth quarter of 2024. Mortgage warehouse also funded on average approximately 14% of its balance sheet with associated customer noninterest bearing deposit balances during the fourth quarter of 2025.
2
Panacea Financial
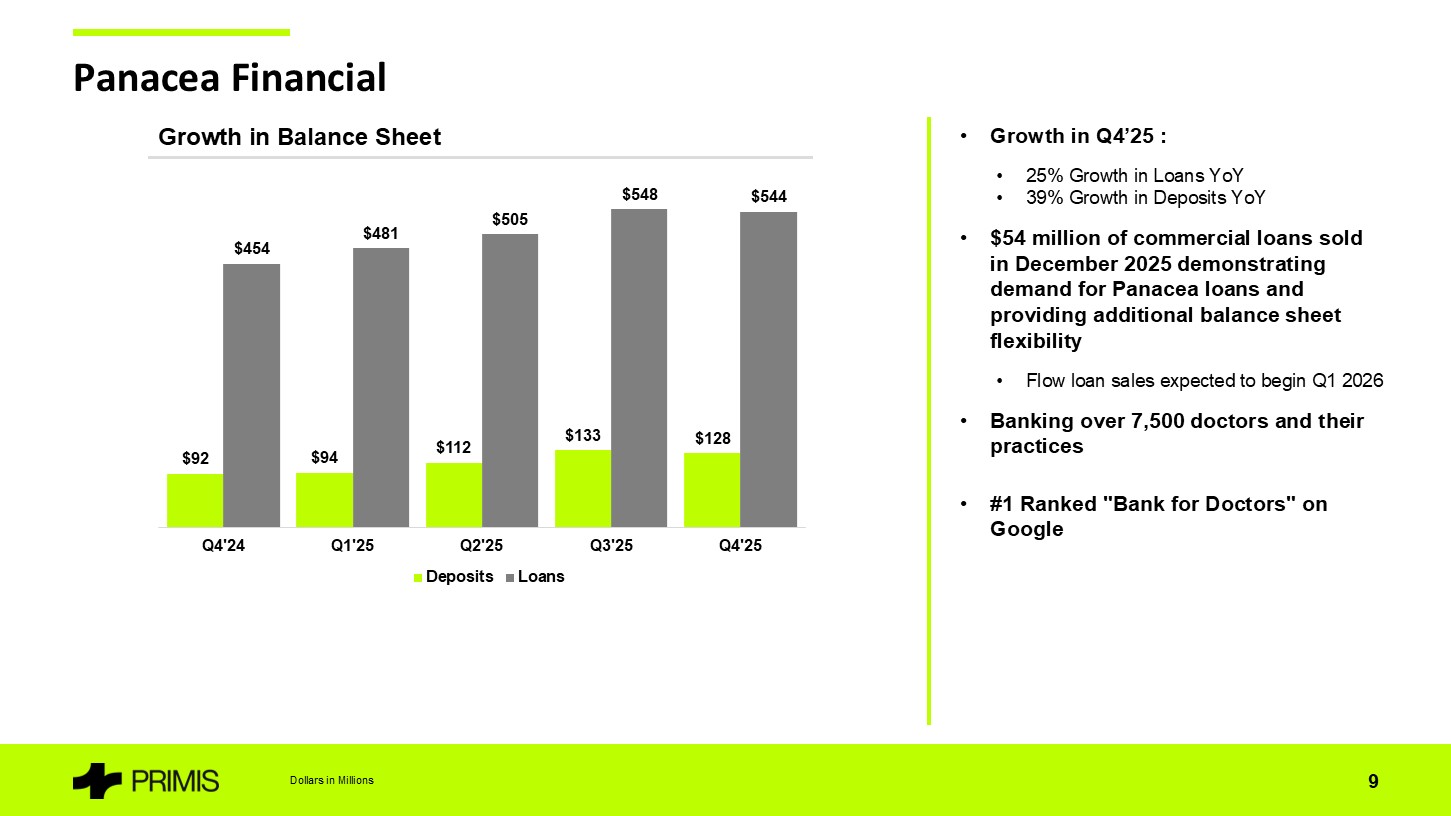
Panacea’s growth remained strong through the fourth quarter of 2025 with loans outstanding of $544 million, up 25% compared to the end of 2024 and after a $54 million loan sale in December 2025. At the end of the fourth quarter of 2025, Panacea customer deposits totaled $128 million, up 39% from December 31, 2024. Panacea continues to be the platform of choice for healthcare bankers with additional recruiting success in the fourth quarter of 2025. Flow loan sales will begin in the first quarter of 2026 on the heels of the fourth quarter 2025 loan sale allowing for continued high growth rates without straining the Company’s balance sheet. Panacea is the number one ranked “Bank for doctors” on Google and banks over 7,500 professionals and practices nationwide.
Digital Platform
Funding for the national strategies is provided exclusively by the Bank’s digital platform powered by what the Bank believes is one of the safest and most functional deposit accounts in the nation. Because of the scalability of the platform, there is significantly less pressure on the core Bank to provide this funding and risk the profitable, decades old relationships with core customers.
The platform ended the fourth quarter of 2025 with approximately $1.0 billion of deposits with a cost of deposits of 3.79% in the month of December 2025, compared to $1.0 billion at December 31, 2024 with a cost of 4.72%. The platform also successfully grew business accounts in 2025 with small business balances reaching $16 million at December 31, 2025, up substantially from $2 million at December 31, 2024. Over 1,200 of our digital accounts have come from referrals from another customer and approximately 82% of our consumer accounts have been with the Bank for over two years.
Net Interest Income
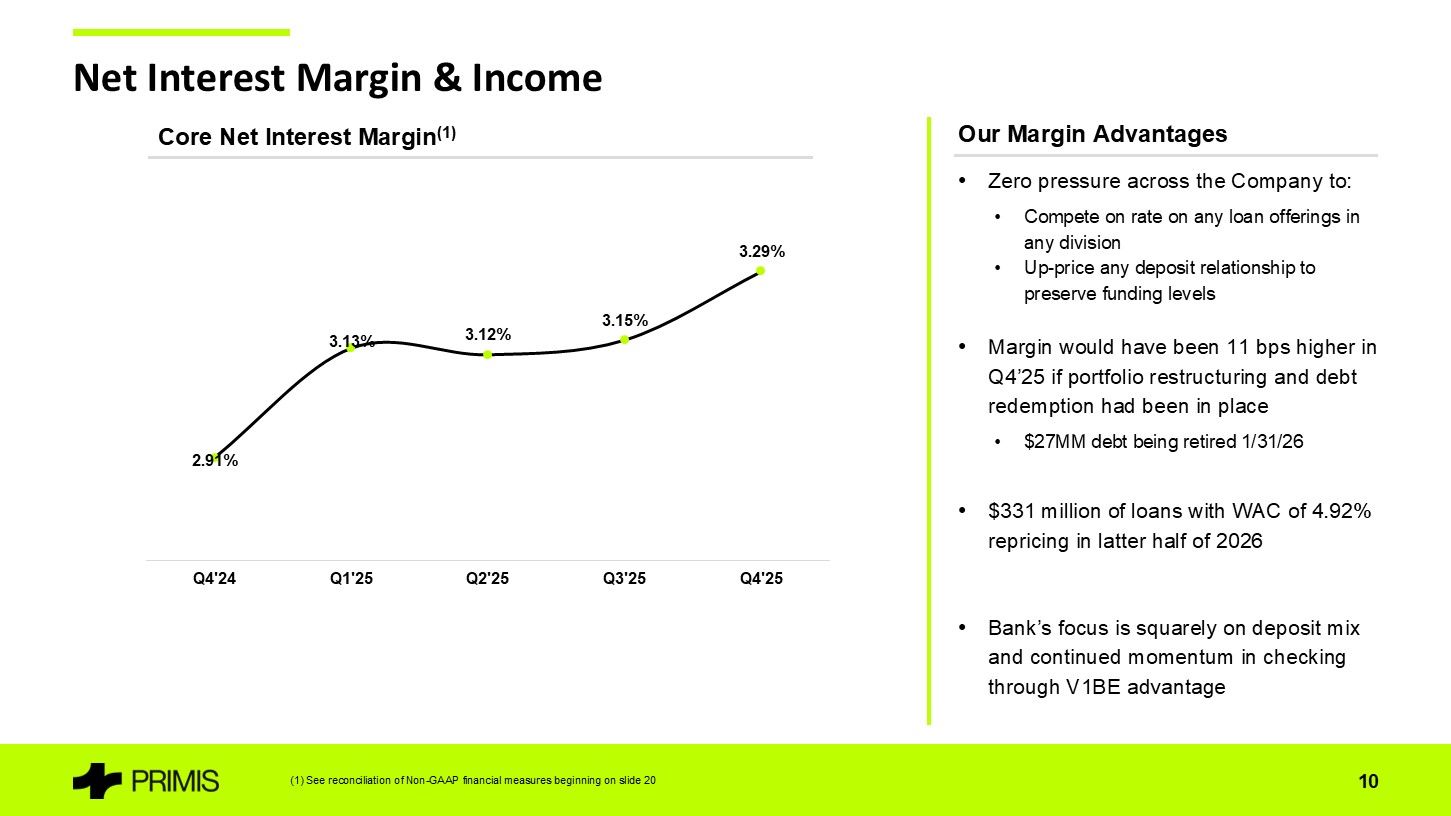
Net interest income in the fourth quarter of 2025 was $31 million, up 18% versus $26 million in the fourth quarter of 2024. As noted above, the Company’s net interest margin improved to 3.28% in the fourth quarter of 2025 compared to 2.90% in the same quarter of 2024 with the expansion driven by robust earning asset growth funded at attractive incremental margins.
Yield on earnings assets in the fourth quarter of 2025 declined one basis point and five basis points versus the third quarter of 2025 and fourth quarter of 2024, respectively. Yield on investments increased 33 basis points year-over-year largely due to the previously announced portfolio restructuring and offsetting declines in yield on loans and yield on other earning assets driven by recent rate cuts.
Cost of deposits in the Bank have benefitted from the focus on growing noninterest bearing deposit balances as well as the core Bank’s management of interest expense. In the fourth quarter of 2025, the Company reported cost of interest-bearing deposits of 2.66% compared to 3.25% in the same quarter in 2024. Cost of funds was 2.52% in the fourth quarter of 2025, down 45 basis points from 2.97% in the fourth quarter of 2024.
The portfolio restructuring described above occurred in the middle of December 2025 and the Company intends to redeem $27 million of subordinated debt on January 31, 2026. If both balance sheet changes had been in place for all of the fourth quarter of 2025, net interest margin would have been higher by 11 basis points.
Noninterest Income
Noninterest income was $50 million in the fourth quarter of 2025 versus $13 million in the fourth quarter of 2024 with a substantial portion of the increase driven by a $51 million gain from the Company’s previously announced sale leaseback transaction offset by a $15 million loss on investment portfolio restructuring. The fourth quarter of 2024 also benefited from a $5 million gain from the sale of the Life Premium Finance division. Excluding these items, noninterest income was $14 million in the fourth quarter of 2025 versus $8 million in the fourth quarter of 2024. Mortgage related income grew 100% to $10 million in the fourth quarter of 2025 compared to $5 million in the same quarter in 2024. Noninterest income for the fourth quarter of 2025 also included a $1.5 million gain from the sale of Panacea loans that had been moved to held-for-sale in the third quarter of 2025. As previously disclosed, the Company is currently in the process of restructuring its bank-owned life insurance portfolio which is anticipated to improve noninterest income by approximately $1.2 million annually beginning late in the second quarter of 2026.
3
Noninterest Expense
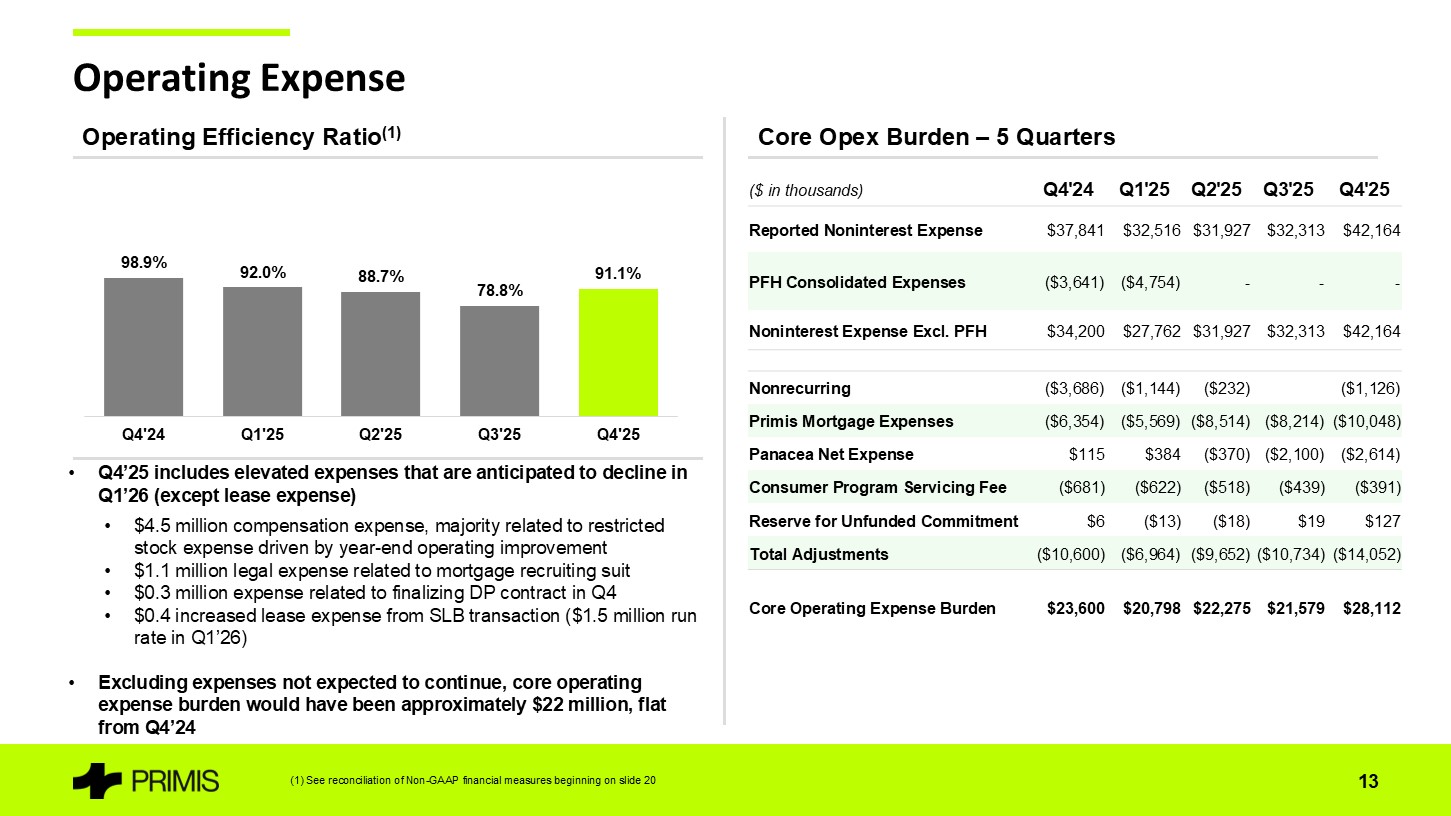
Noninterest expense was $42 million for the fourth quarter of 2025, compared to $38 million for the same quarter of 2024. The following table reflects the core operating expense burden at the Company, net of mortgage related and Panacea division impacts.
| ($ in thousands) | 4Q25 | 3Q25 | 2Q25 | 1Q25 | 4Q24 | |||||||||||||||
| Reported Noninterest Expense | $ | 42,164 | $ | 32,313 | $ | 31,942 | $ | 32,516 | $ | 37,841 | ||||||||||
| PFH Consolidated Expenses | - | - | - | (4,754 | ) | (3,641 | ) | |||||||||||||
| Noninterest Expense Excl. PFH | $ | 42,164 | $ | 32,313 | 31,942 | 27,762 | 34,200 | |||||||||||||
| Nonrecurring | (1,126 | ) | - | (232 | ) | (1,144 | ) | (3,686 | ) | |||||||||||
| Primis Mortgage Expenses | (10,048 | ) | (8,214 | ) | (8,514 | ) | (5,569 | ) | (6,354 | ) | ||||||||||
| Panacea Net Expense | (2,614 | ) | (2,100 | ) | (370 | ) | 384 | 115 | ||||||||||||
| Consumer Program Servicing Fee | (391 | ) | (439 | ) | (518 | ) | (622 | ) | (681 | ) | ||||||||||
| Reserve for Unfunded Commitment | 127 | 19 | (18 | ) | (13 | ) | 6 | |||||||||||||
| Total Adjustments | (14,052 | ) | (10,734 | ) | (9,652 | ) | (6,964 | ) | (10,600 | ) | ||||||||||
| Core Operating Expense Burden | $ | 28,112 | $ | 21,579 | $ | 22,290 | $ | 20,798 | $ | 23,600 | ||||||||||
Core operating expense burden, as defined above, was $28 million in the fourth quarter of 2025 versus $24 million in the fourth quarter of 2024. As described further below, certain items impacted the fourth quarter of 2025 that management does not consider part of run rate expenses. Adjusting for these expense, core operating expense burden would have been approximately $22 million in the fourth quarter of 2025, in line with core operating expense in the fourth quarter of 2024 after adjusting for certain items disclosed at that time.
A portion of the increased reported noninterest expense was due to the mortgage company driven by its growth in production and revenues. Nonrecurring expenses in the fourth quarter of 2025 were driven by transaction costs related to the Company’s previously announced sale leaseback transaction. Of the remaining increase in expense, the largest portion was approximately $4 million related to higher compensation expense in the fourth quarter of 2025 tied to the substantial improvement in operating results to finish the year and the majority of which was in the form of restricted stock expense. Expenses in the fourth quarter of 2025 also include $1.1 million in legal fees associated with a mortgage recruiting lawsuit that management expects to normalize in the first half of 2026. The fourth quarter of 2025 included $0.3 million of data processing expense related to the finalization of the Company’s contract renewal in the quarter. Lastly, lease expense increased $0.4 million due to a partial month of the sale leaseback transaction that was completed in early December 2025 with quarterly lease expense related to the transaction of approximately $1.5 million going forward.
These expenses, with the exception of lease expense, are not expected to add to core operating expense in 2026. Including increased lease expense, management believes quarterly core operating expense burden of $23 to $24 million in 2026 is achievable and will drive substantial operating leverage.
4
Loan Portfolio and Asset Quality
Loans held for investment increased to $3.3 billion at December 31, 2025 compared to $3.2 billion at September 30, 2025 and $2.9 billion at December 31, 2024. Important drivers in these levels are seen below:
| · | Core Bank loans totaled $2.1 billion at December 31, 2025 compared to $2.2 billion at December 31, 2024. | |
| · | Panacea Financial loans grew $111 million through the end of 2025, or 25% compared to the end of 2024, to $544 million, net of a $54 million loan sale in the fourth quarter of 2025. | |
| · | Mortgage warehouse outstandings increased significantly to $318 million at the end of the fourth quarter of 2025 compared to only $64 million at the same time in 2024. Approved lines ended 2025 at $1.2 billion across 125 customers. | |
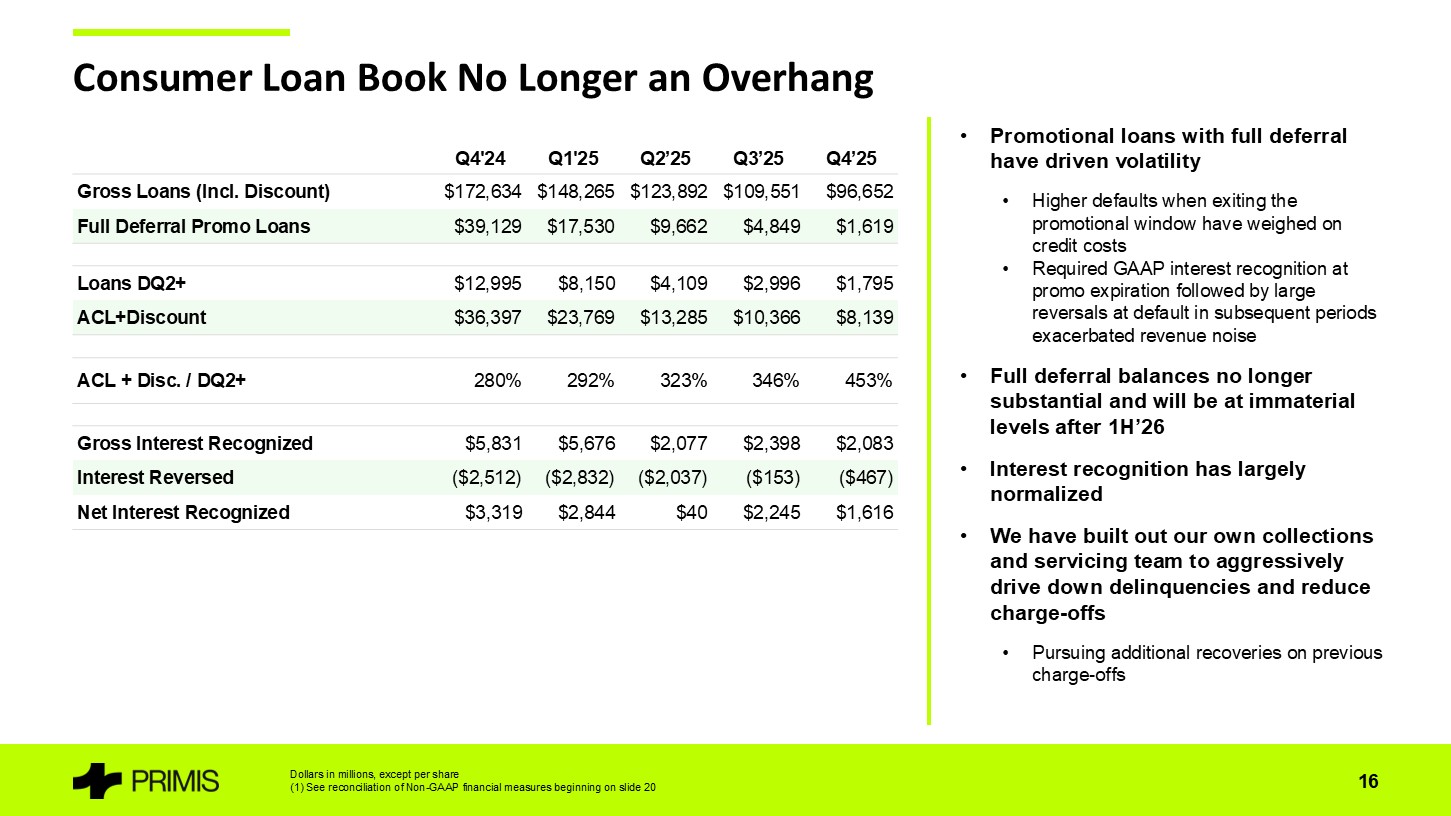
| · | Loan balances associated with the consumer loan program declined to $90 million at December 31, 2025, net of fair value discounts, compared to $148 million at December 31, 2024. Importantly, loans in promotional periods with full deferral were only $2 million at December 31, 2025 compared to $39 million or 23% of total consumer program loans as of December 31, 2024. |
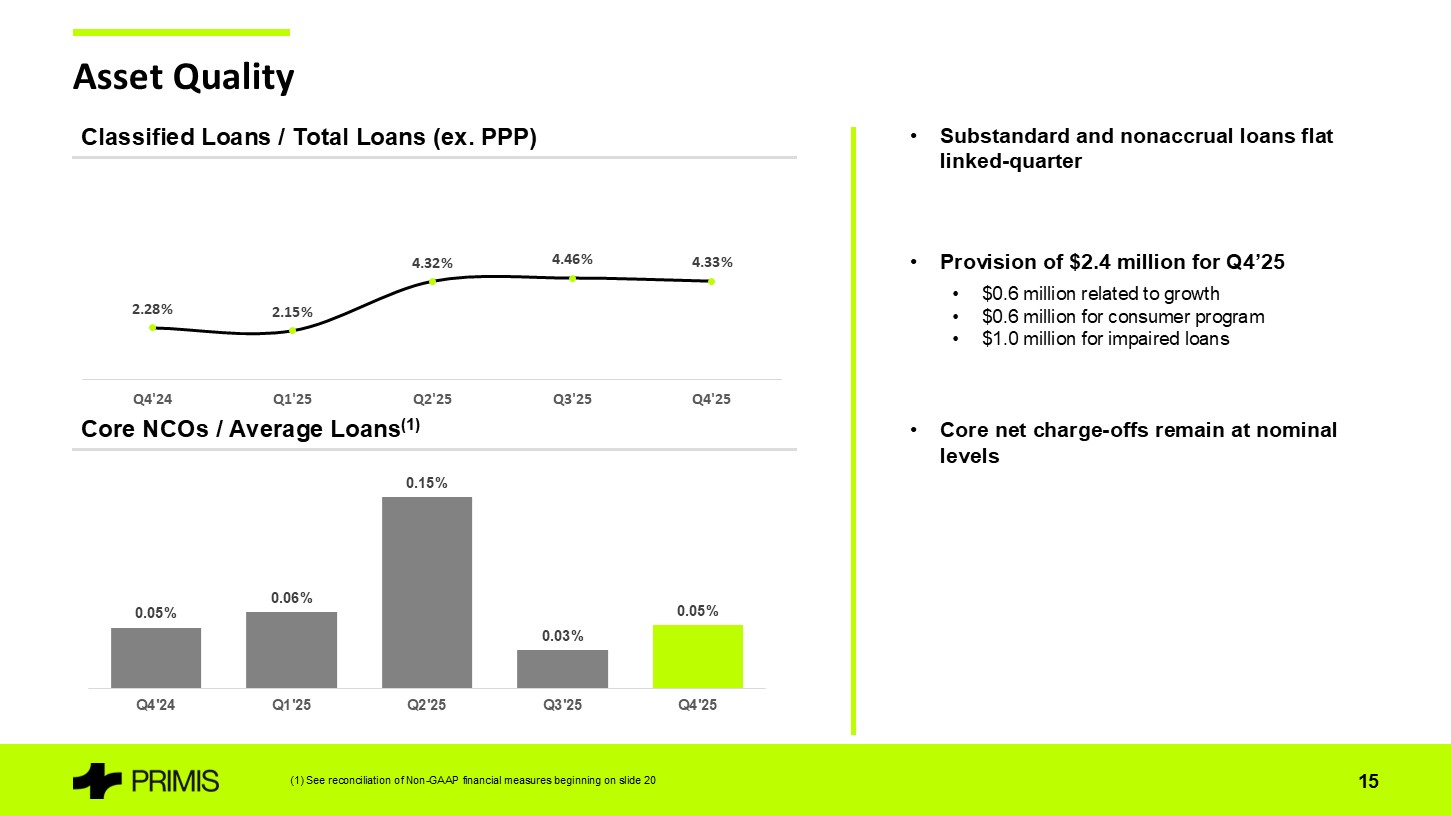
Nonperforming assets, excluding portions guaranteed by the SBA, were 2.03% of total assets at December 31, 2025 compared to 2.07% of total assets at September 30, 2025. Substandard and nonaccrual loans were essentially flat linked-quarter.
The Company recorded a provision for credit losses of $2.4 million for the fourth quarter of 2025 compared to a provision for credit losses of $33 million for the fourth quarter in 2024. Approximately $0.6 million of the fourth quarter 2025 provision was related to growth in the loan portfolio with another $0.6 million related to the Consumer Program portfolio. Lastly, changes in impairment amounts for individually evaluated loans contributed $1 million to the provision in the fourth quarter of 2025. Core net charge-offs as a percentage of average loans were 5 basis points, flat with the same period a year ago.
As a percentage of loans held for investment, the allowance for credit losses was 1.40% at the end of the fourth quarter of 2025 compared to 1.86% at the end of the fourth quarter of 2024. Total allowance and discounts on the consumer loan program portfolio totaled $8.1 million at December 31, 2025, which represents 8.4% of gross principal balance and 453% of loans more than one period delinquent as of that date.
Deposits and Funding
Total deposits at December 31, 2025 were $3.3 billion, up $0.1 billion when compared to the same period in 2024. Noninterest bearing demand deposits were $554 million at December 31, 2025, an increase of 26% compared to balances at December 31, 2024. The Company had FHLB advances totaling $25 million outstanding at December 31, 2025 down from $85 million at September 30, 2025 and versus no advances at December 31, 2024.
Shareholders’ Equity
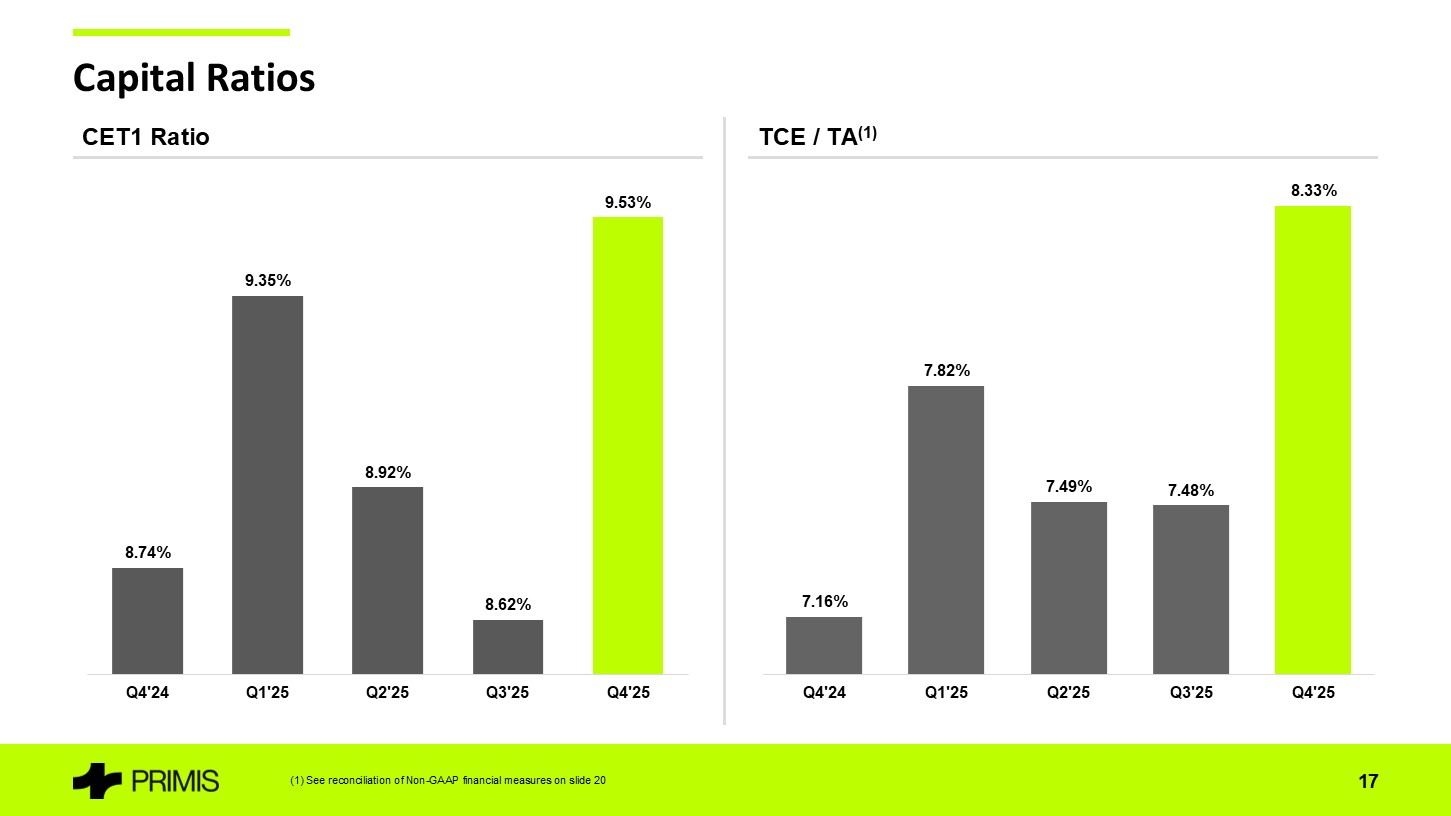
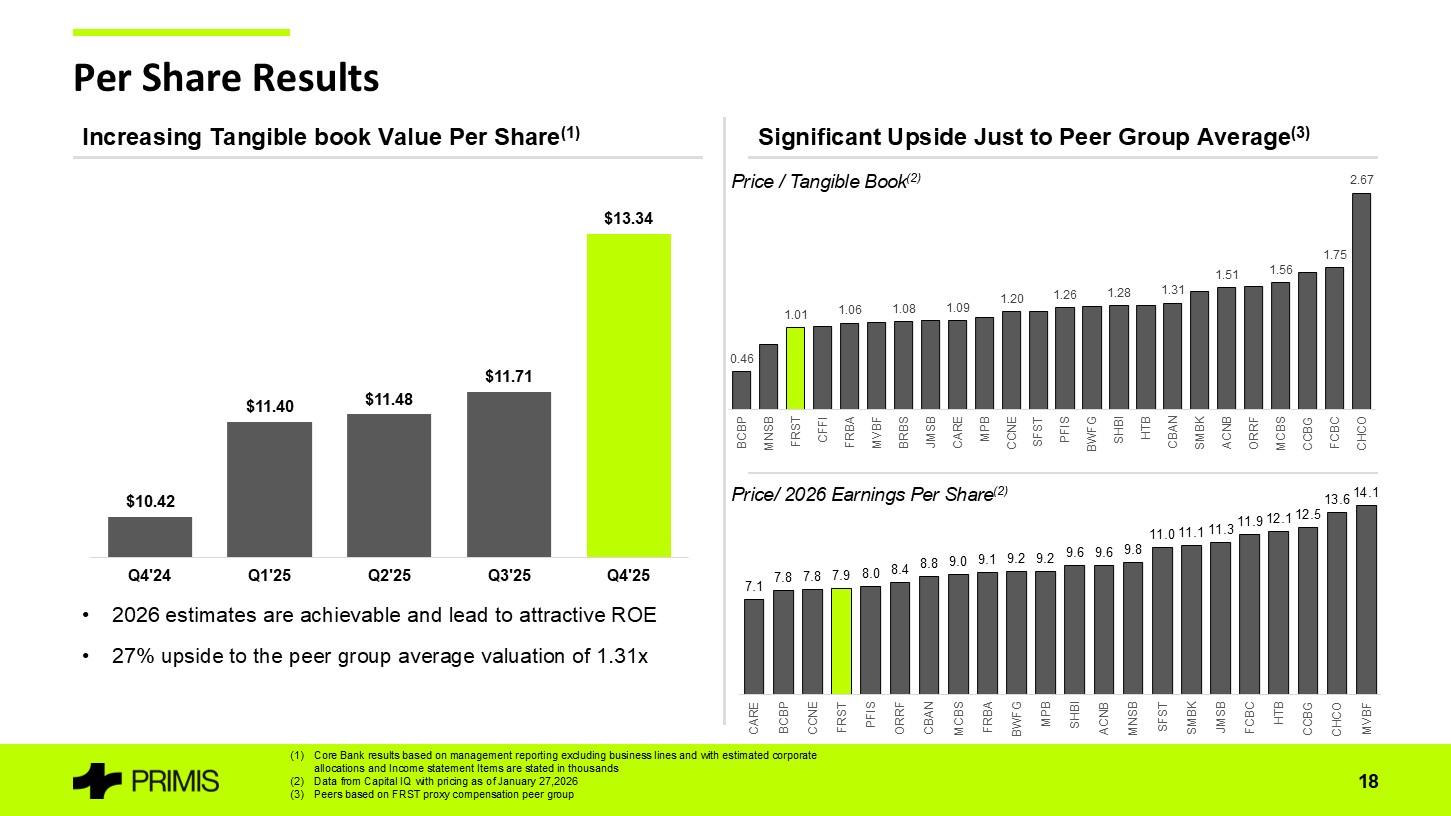
Tangible book value per common share(1) at the end of the fourth quarter of 2025 was $13.34, an increase of $2.92 or 28% from levels reported at December 31, 2024. Tangible common equity(1) ended the fourth quarter of 2025 at $329 million, or 8.33% of tangible assets(1).
The Board of Directors declared a dividend of $0.10 per share payable on February 27, 2026 to shareholders of record on February 13, 2026. This is Primis’ fifty-seventh consecutive quarterly dividend.
5
About Primis Financial Corp.
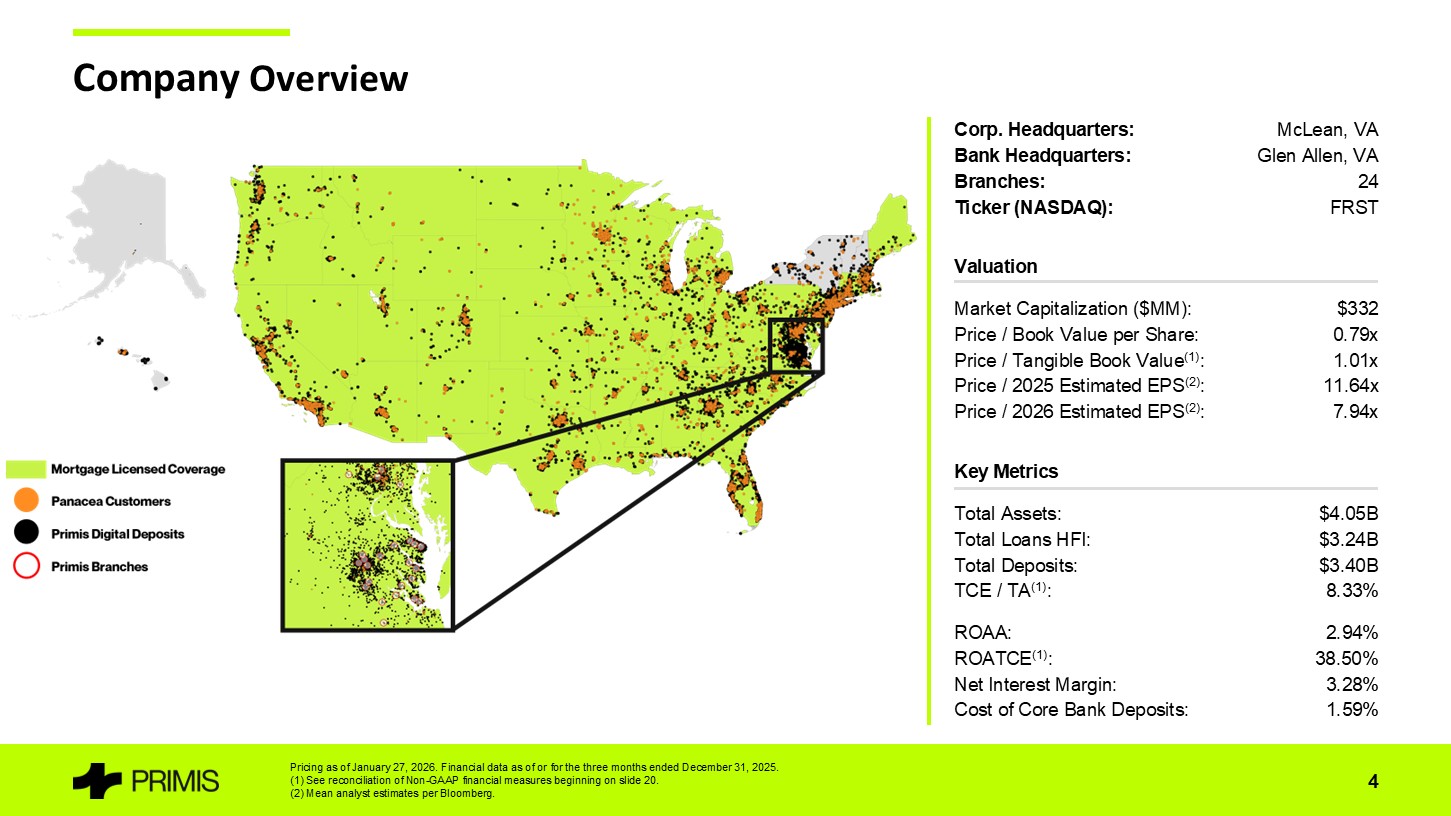
As of December 31, 2025, Primis had $4.0 billion in total assets, $3.2 billion in total loans held for investment and $3.3 billion in total deposits. Primis Bank provides a range of financial services to individuals and small- and medium-sized businesses through twenty-four full-service branches in Virginia and Maryland and provides services to customers through certain online and mobile applications.
| Contacts: | Address: |
| Dennis J. Zember, Jr., President and CEO | Primis Financial Corp. |
| Matthew A. Switzer, EVP and CFO | 1676 International Drive, Suite 900 |
| Phone: (703) 893-7400 | McLean, VA 22102 |
Primis Financial Corp., NASDAQ Symbol FRST
Website: www.primisbank.com
Conference Call
The Company’s management will host a conference call to discuss its fourth quarter results on Friday, January 30, 2026 at 10:00 a.m. (ET). A live Webcast of the conference call is available at the following website: https://events.q4inc.com/attendee/704458155. Participants may also call 1-888-330-3573 and ask for the Primis Financial Corp. call. A replay of the teleconference will be available for 7 days by calling 1-800-770-2030 and providing Replay Access Code 4440924.
Non-GAAP Measures
Statements included in this press release include non-GAAP financial measures and should be read along with the accompanying tables. Primis uses non-GAAP financial measures to analyze its performance. The measures entitled net income adjusted for nonrecurring income and expenses; pre-tax pre-provision operating earnings; operating return on average assets; pre-tax pre-provision operating return on average assets; operating return on average equity; operating return on average tangible equity; operating efficiency ratio; operating earnings per share – basic; operating earnings per share – diluted; tangible book value per share; tangible common equity; tangible common equity to tangible assets; and core net interest margin are not measures recognized under GAAP and therefore are considered non-GAAP financial measures. We use the term “operating” to describe a financial measure that excludes income or expense considered to be non-recurring in nature. Items identified as non-operating are those that, when excluded from a reported financial measure, provide management or the reader with a measure that may be more indicative of forward-looking trends in our business. A reconciliation of these non-GAAP financial measures to the most comparable GAAP measures is provided in the Reconciliation of Non-GAAP Items table.
Management believes that these non-GAAP financial measures provide additional useful information about Primis that allows management and investors to evaluate the ongoing operating results, financial strength and performance of Primis and provide meaningful comparison to its peers. Non-GAAP financial measures should not be considered as an alternative to any measure of performance or financial condition as promulgated under GAAP, and investors should consider Primis’ performance and financial condition as reported under GAAP and all other relevant information when assessing the performance or financial condition of Primis. Non-GAAP financial measures are not standardized and, therefore, it may not be possible to compare these measures with other companies that present measures having the same or similar names.
6
Non-GAAP financial measures have limitations as analytical tools, and investors should not consider them in isolation or as a substitute for analysis of the results or financial condition as reported under GAAP.
Forward-Looking Statements
This press release and certain of our other filings with the Securities and Exchange Commission contain statements that constitute “forward-looking statements” within the meaning of, and subject to the protections of, Section 27A of the Securities Act of 1933, as amended, and Section 21E of the Securities Exchange Act of 1934, as amended. All statements other than statements of historical fact are forward-looking statements. Such statements can generally be identified by such words as “may,” “plan,” “contemplate,” “anticipate,” “believe,” “intend,” “continue,” “expect,” “project,” “predict,” “estimate,” “could,” “should,” “would,” “will,” and other similar words or expressions of the future or otherwise regarding the outlook for the Company’s future business and financial performance and/or the performance of the banking industry and economy in general. These forward-looking statements include, but are not limited to, our expectations regarding our future operating and financial performance, including the preliminary estimated financial and operating information presented herein, which is subject to adjustment; our outlook and long-term goals for future growth and new offerings and services; our expectations regarding net interest margin; expectations on our growth strategy, expense management, capital management and future profitability; expectations on credit quality and performance; and the assumptions underlying our expectations.
Prospective investors are cautioned that any such forward-looking statements are not guarantees of future performance and involve known and unknown risks and uncertainties which may cause the actual results, performance or achievements of the Company to be materially different from the future results, performance or achievements expressed or implied by such forward-looking statements. Forward-looking statements are based on the information known to, and current beliefs and expectations of, the Company’s management and are subject to significant risks and uncertainties. Actual results may differ materially from those contemplated by such forward-looking statements. Factors that might cause such differences include, but are not limited to: instability in global economic conditions and geopolitical matters; the impact of current and future economic and market conditions generally (including seasonality) and in the financial services industry, nationally and within our primary market areas; adverse developments in borrower industries; changes in interest rates, inflation, loan demand, real estate values, or competition, as well as labor shortages and supply chain disruptions; the impact of tariffs, trade policies, and trade wars (including reduced consumer spending, lower economic growth or recession, reduced demand for U.S. exports, disruptions to supply chains, and decreased demand for other banking products and services); the Company’s ability to implement its various strategic and growth initiatives, including its recently established Panacea Financial Division, digital banking platform, V1BE fulfillment service, Mortgage Warehouse division and Primis Mortgage Company; competitive pressures among financial institutions increasing significantly (including as a result of technological changes and the use of artificial intelligence); changes in applicable laws, rules, or regulations, including changes to statutes, regulations or regulatory policies or practices; legislative, regulatory or supervisory actions related to so-called “de-banking,” including any new prohibitions, requirements or enforcement priorities that could affect customer relationships, compliance obligations, or operational practices; changes in management’s plans for the future; credit risk associated with our lending activities; changes in accounting principles, policies, or guidelines; adverse results from current or future litigation, regulatory examinations or other legal and/or regulatory actions; potential impacts of adverse developments in the banking industry, including impacts on customer confidence, deposit outflows, liquidity and the regulatory response thereto; potential increases in the provision for credit losses; our ability to identify and address increased cybersecurity risks, including those impacting vendors and other fourth parties; fraud or misconduct by internal or external actors, which we may not be able to prevent, detect or mitigate; acts of God or of war or other conflicts, civil unrest, acts of terrorism, pandemics or other catastrophic events that may affect general economic conditions; action or inaction by the federal government, including as a result of any prolonged government shutdown; and other general competitive, economic, political, and market factors, including those affecting our business, operations, pricing, products, or services.
7
Forward-looking statements speak only as of the date on which such statements are made. These forward-looking statements are based upon information presently known to the Company’s management and are inherently subjective, uncertain and subject to change due to any number of risks and uncertainties, including, without limitation, the risks and other factors set forth in the Company’s filings with the Securities and Exchange Commission, the Company’s Annual Report on Form 10-K for the year ended December 31, 2024, under the captions “Cautionary Note Regarding Forward-Looking Statements” and “Risk Factors,” and in the Company’s Quarterly Reports on Form 10-Q and Current Reports on Form 8-K. The Company undertakes no obligation to update any forward-looking statement to reflect events or circumstances after the date on which such statement is made, or to reflect the occurrence of unanticipated events. Readers are cautioned not to place undue reliance on these forward-looking statements.
(1) Non-GAAP financial measure. Please see “Reconciliation of Non-GAAP Items” in the financial tables for more information and for a reconciliation to GAAP.
8
Primis Financial Corp. Financial Highlights (unaudited) (Dollars in thousands, except per share data) | For Three Months Ended: | For Twelve Months Ended: | ||||||||||||||||||||||||||
| 4Q 2025 | 3Q 2025 | 2Q 2025 | 1Q 2025 | 4Q 2024 | 4Q 2025 | 4Q 2024 | ||||||||||||||||||||||
| Selected Performance Ratios: | ||||||||||||||||||||||||||||
| Return on average assets | 2.94 | % | 0.70 | % | 0.26 | % | 2.52 | % | (2.43 | )% | 1.61 | % | (0.42 | )% | ||||||||||||||
| Operating return on average assets(1) | 0.23 | % | 0.70 | % | (0.34 | )% | 0.40 | % | (2.51 | )% | 0.25 | % | (0.39 | )% | ||||||||||||||
| Pre-tax pre-provision return on average assets | 3.84 | % | 0.89 | % | 1.20 | % | 3.32 | % | 0.44 | % | 2.32 | % | 0.76 | % | ||||||||||||||
| Pre-tax pre-provision operating return on average assets(1) | 0.39 | % | 0.89 | % | 0.44 | % | 0.71 | % | 0.33 | % | 0.61 | % | 0.80 | % | ||||||||||||||
| Return on average common equity | 29.46 | % | 7.13 | % | 2.57 | % | 26.66 | % | (24.28 | )% | 16.35 | % | (4.34 | )% | ||||||||||||||
| Operating return on average common equity(1) | 2.36 | % | 7.13 | % | (3.40 | )% | 4.21 | % | (25.13 | )% | 2.54 | % | (3.97 | )% | ||||||||||||||
| Operating return on average tangible common equity(1) | 3.07 | % | 9.45 | % | (4.51 | )% | 5.78 | % | (33.33 | )% | 3.38 | % | (5.32 | )% | ||||||||||||||
| Cost of funds | 2.52 | % | 2.62 | % | 2.67 | % | 2.67 | % | 2.97 | % | 2.62 | % | 3.09 | % | ||||||||||||||
| Net interest margin | 3.28 | % | 3.18 | % | 2.86 | % | 3.15 | % | 2.90 | % | 3.12 | % | 2.86 | % | ||||||||||||||
| Core net interest margin(1) | 3.29 | % | 3.15 | % | 3.12 | % | 3.13 | % | 2.91 | % | 3.17 | % | 2.93 | % | ||||||||||||||
| Gross loans to deposits | 96.70 | % | 95.92 | % | 93.65 | % | 96.04 | % | 91.06 | % | 96.70 | % | 91.06 | % | ||||||||||||||
| Efficiency ratio | 52.14 | % | 78.81 | % | 73.92 | % | 55.39 | % | 96.41 | % | 62.09 | % | 85.26 | % | ||||||||||||||
| Operating efficiency ratio(1) | 91.05 | % | 78.81 | % | 88.67 | % | 91.97 | % | 98.92 | % | 87.48 | % | 83.51 | % | ||||||||||||||
| Per Common Share Data: | ||||||||||||||||||||||||||||
| Earnings per common share - Basic | $ | 1.20 | $ | 0.28 | $ | 0.10 | $ | 0.92 | $ | (0.94 | ) | $ | 2.49 | $ | (0.66 | ) | ||||||||||||
| Operating earnings per common share - Basic(1) | $ | 0.10 | $ | 0.28 | $ | (0.13 | ) | $ | 0.14 | $ | (0.98 | ) | $ | 0.39 | $ | (0.60 | ) | |||||||||||
| Earnings per common share - Diluted | $ | 1.20 | $ | 0.28 | $ | 0.10 | $ | 0.92 | $ | (0.94 | ) | $ | 2.49 | $ | (0.66 | ) | ||||||||||||
| Operating earnings per common share - Diluted(1) | $ | 0.10 | $ | 0.28 | $ | (0.13 | ) | $ | 0.14 | $ | (0.98 | ) | $ | 0.39 | $ | (0.60 | ) | |||||||||||
| Book value per common share | $ | 17.12 | $ | 15.51 | $ | 15.27 | $ | 15.19 | $ | 14.23 | $ | 17.12 | $ | 14.23 | ||||||||||||||
| Tangible book value per common share(1) | $ | 13.34 | $ | 11.71 | $ | 11.48 | $ | 11.40 | $ | 10.42 | $ | 13.34 | $ | 10.42 | ||||||||||||||
| Cash dividend per common share | $ | 0.10 | $ | 0.10 | $ | 0.10 | $ | 0.10 | $ | 0.10 | $ | 0.40 | $ | 0.40 | ||||||||||||||
| Weighted average shares outstanding - Basic | 24,634,544 | 24,632,202 | 24,701,319 | 24,706,593 | 24,701,260 | 24,668,367 | 24,688,006 | |||||||||||||||||||||
| Weighted average shares outstanding - Diluted | 24,654,037 | 24,643,889 | 24,714,229 | 24,722,734 | 24,701,260 | 24,683,425 | 24,688,006 | |||||||||||||||||||||
| Shares outstanding at end of period | 24,695,385 | 24,644,385 | 24,643,185 | 24,722,734 | 24,722,734 | 24,695,385 | 24,722,734 | |||||||||||||||||||||
| Asset Quality Ratios: | ||||||||||||||||||||||||||||
| Non-performing assets as a percent of total assets, excluding SBA guarantees | 2.03 | % | 2.07 | % | 1.90 | % | 0.28 | % | 0.29 | % | 2.03 | % | 0.29 | % | ||||||||||||||
| Net charge-offs (recoveries) as a percent of average loans (annualized) | 0.16 | % | 0.14 | % | 0.80 | % | 1.47 | % | 3.83 | % | 0.65 | % | 1.48 | % | ||||||||||||||
| Core net charge-offs (recoveries) as a percent of average loans (annualized)(1) | 0.05 | % | 0.03 | % | 0.15 | % | 0.06 | % | 0.05 | % | 0.07 | % | 0.05 | % | ||||||||||||||
| Allowance for credit losses to total loans | 1.40 | % | 1.40 | % | 1.47 | % | 1.45 | % | 1.86 | % | 1.40 | % | 1.86 | % | ||||||||||||||
| Capital Ratios: | ||||||||||||||||||||||||||||
| Common equity to assets | 10.45 | % | 9.66 | % | 9.72 | % | 10.16 | % | 9.53 | % | ||||||||||||||||||
| Tangible common equity to tangible assets(1) | 8.33 | % | 7.48 | % | 7.49 | % | 7.82 | % | 7.16 | % | ||||||||||||||||||
| Leverage ratio(2) | 8.79 | % | 8.32 | % | 8.34 | % | 8.71 | % | 7.76 | % | ||||||||||||||||||
| Common equity tier 1 capital ratio(2) | 9.53 | % | 8.62 | % | 8.92 | % | 9.35 | % | 8.74 | % | ||||||||||||||||||
| Tier 1 risk-based capital ratio(2) | 9.81 | % | 8.91 | % | 9.22 | % | 9.66 | % | 9.05 | % | ||||||||||||||||||
| Total risk-based capital ratio(2) | 12.60 | % | 12.02 | % | 12.43 | % | 12.96 | % | 12.53 | % | ||||||||||||||||||
(1) See Reconciliation of Non-GAAP financial measures.
(2) Ratios are estimated and may be subject to change pending the final filing of the FR Y-9C.
9
Primis Financial Corp. (Dollars in thousands) Condensed Consolidated Balance Sheets (unaudited) | For Three Months Ended: | |||||||||||||||||||
| 4Q 2025 | 3Q 2025 | 2Q 2025 | 1Q 2025 | 4Q 2024 | ||||||||||||||||
| Assets | ||||||||||||||||||||
| Cash and cash equivalents | $ | 143,607 | $ | 63,881 | $ | 94,074 | $ | 57,044 | $ | 64,505 | ||||||||||
| Investment securities-available for sale | 171,377 | 234,660 | 242,073 | 241,638 | 235,903 | |||||||||||||||
| Investment securities-held to maturity | 6,981 | 8,550 | 8,850 | 9,153 | 9,448 | |||||||||||||||
| Loans held for sale | 166,066 | 202,372 | 126,869 | 74,439 | 247,108 | |||||||||||||||
| Loans receivable, net of deferred fees | 3,283,683 | 3,200,234 | 3,130,521 | 3,043,348 | 2,887,447 | |||||||||||||||
| Allowance for credit losses | (45,883 | ) | (44,766 | ) | (45,985 | ) | (44,021 | ) | (53,724 | ) | ||||||||||
| Net loans | 3,237,800 | 3,155,468 | 3,084,536 | 2,999,327 | 2,833,723 | |||||||||||||||
| Stock in Federal Reserve Bank and Federal Home Loan Bank | 14,185 | 17,035 | 12,998 | 12,983 | 13,037 | |||||||||||||||
| Bank premises and equipment, net | 6,070 | 19,380 | 19,642 | 19,210 | 19,432 | |||||||||||||||
| Operating lease right-of-use assets | 65,596 | 9,427 | 9,927 | 10,352 | 10,279 | |||||||||||||||
| Goodwill and other intangible assets | 93,495 | 93,502 | 93,508 | 93,804 | 94,124 | |||||||||||||||
| Assets held for sale, net | 776 | 775 | 2,181 | 2,420 | 5,497 | |||||||||||||||
| Bank-owned life insurance | 68,969 | 68,504 | 68,048 | 67,609 | 67,184 | |||||||||||||||
| Deferred tax assets, net | 14,683 | 17,328 | 19,466 | 21,399 | 26,466 | |||||||||||||||
| Consumer Program derivative asset | 159 | 409 | 1,177 | 1,597 | 4,511 | |||||||||||||||
| Investment in Panacea Financial Holdings, Inc. common stock | 6,899 | 6,880 | 6,586 | 21,277 | - | |||||||||||||||
| Other assets | 50,725 | 56,678 | 81,791 | 65,058 | 58,898 | |||||||||||||||
| Total assets | $ | 4,047,388 | $ | 3,954,849 | $ | 3,871,726 | $ | 3,697,310 | $ | 3,690,115 | ||||||||||
| Liabilities and stockholders’ equity | ||||||||||||||||||||
| Demand deposits | $ | 554,442 | $ | 489,728 | $ | 477,705 | $ | 455,768 | $ | 438,917 | ||||||||||
| NOW accounts | 862,735 | 831,709 | 858,624 | 819,606 | 817,715 | |||||||||||||||
| Money market accounts | 740,886 | 737,634 | 744,321 | 785,552 | 798,506 | |||||||||||||||
| Savings accounts | 922,337 | 958,416 | 935,527 | 777,736 | 775,719 | |||||||||||||||
| Time deposits | 315,185 | 318,865 | 326,496 | 330,210 | 340,178 | |||||||||||||||
| Total deposits | 3,395,585 | 3,336,352 | 3,342,673 | 3,168,872 | 3,171,035 | |||||||||||||||
| Securities sold under agreements to repurchase - short term | 3,552 | 3,954 | 4,370 | 4,019 | 3,918 | |||||||||||||||
| Federal Home Loan Bank advances | 25,000 | 85,000 | - | - | - | |||||||||||||||
| Secured borrowings | 14,773 | 15,403 | 16,449 | 16,729 | 17,195 | |||||||||||||||
| Subordinated debt and notes | 96,162 | 96,091 | 96,020 | 95,949 | 95,878 | |||||||||||||||
| Operating lease liabilities | 61,340 | 10,682 | 11,195 | 11,639 | 11,566 | |||||||||||||||
| Other liabilities | 28,080 | 25,214 | 24,604 | 24,539 | 25,541 | |||||||||||||||
| Total liabilities | 3,624,492 | 3,572,696 | 3,495,311 | 3,321,747 | 3,325,133 | |||||||||||||||
| Total Primis common stockholders’ equity | 422,896 | 382,153 | 376,415 | 375,563 | 351,756 | |||||||||||||||
| Noncontrolling interest | - | - | - | - | 13,226 | |||||||||||||||
| Total stockholders’ equity | 422,896 | 382,153 | 376,415 | 375,563 | 364,982 | |||||||||||||||
| Total liabilities and stockholders’ equity | $ | 4,047,388 | $ | 3,954,849 | $ | 3,871,726 | $ | 3,697,310 | $ | 3,690,115 | ||||||||||
| Tangible common equity(1) | $ | 329,401 | $ | 288,651 | $ | 282,907 | $ | 281,759 | $ | 257,632 | ||||||||||
Primis Financial Corp. (Dollars in thousands) Condensed Consolidated Statement of Operations (unaudited) | For Three Months Ended: | For Twelve Months Ended: | ||||||||||||||||||||||||||
| 4Q 2025 | 3Q 2025 | 2Q 2025 | 1Q 2025 | 4Q 2024 | 4Q 2025 | 4Q 2024 | ||||||||||||||||||||||
| Interest and dividend income | $ | 53,326 | $ | 51,766 | $ | 47,627 | $ | 47,723 | $ | 51,338 | $ | 200,442 | $ | 210,969 | ||||||||||||||
| Interest expense | 22,474 | 22,734 | 22,447 | 21,359 | 25,261 | 89,014 | 106,747 | |||||||||||||||||||||
| Net interest income | 30,852 | 29,032 | 25,180 | 26,364 | 26,077 | 111,428 | 104,222 | |||||||||||||||||||||
| Provision for (recovery of) credit losses | 2,439 | (49 | ) | 8,303 | 1,596 | 33,483 | 12,289 | 50,621 | ||||||||||||||||||||
| Net interest income (loss) after provision for credit losses | 28,413 | 29,081 | 16,877 | 24,768 | (7,406 | ) | 99,139 | 53,601 | ||||||||||||||||||||
| Account maintenance and deposit service fees | 1,292 | 1,358 | 1,675 | 1,339 | 1,276 | 5,664 | 5,784 | |||||||||||||||||||||
| Income from bank-owned life insurance | 466 | 456 | 438 | 425 | 434 | 1,785 | 2,410 | |||||||||||||||||||||
| Mortgage banking income | 9,992 | 8,887 | 7,893 | 5,615 | 5,140 | 32,387 | 23,919 | |||||||||||||||||||||
| Gain (loss) on sale of loans | 1,470 | 249 | 210 | - | (4 | ) | 1,929 | 303 | ||||||||||||||||||||
| Gains on Panacea Financial Holdings investment | 20 | 294 | 7,450 | 24,578 | - | 32,342 | - | |||||||||||||||||||||
| Gain on sale of Life Premium Finance portfolio, net of broker fees | - | - | - | - | 4,723 | - | 4,723 | |||||||||||||||||||||
| Consumer Program derivative | 775 | 264 | 593 | (292 | ) | 928 | 1,340 | 4,320 | ||||||||||||||||||||
| Gain on sale-leaseback | 50,573 | - | - | - | - | 50,573 | - | |||||||||||||||||||||
| Loss on sales of investment securities | (14,777 | ) | - | - | - | - | (14,777 | ) | - | |||||||||||||||||||
| Gain (loss) on other investments | 33 | 381 | (308 | ) | 53 | 15 | 159 | 408 | ||||||||||||||||||||
| Other | 172 | 80 | 79 | 617 | 663 | 948 | 1,273 | |||||||||||||||||||||
| Noninterest income | 50,016 | 11,969 | 18,030 | 32,335 | 13,175 | 112,350 | 43,140 | |||||||||||||||||||||
| Employee compensation and benefits | 25,535 | 18,523 | 17,060 | 17,941 | 18,028 | 79,059 | 66,615 | |||||||||||||||||||||
| Occupancy and equipment expenses | 4,459 | 3,481 | 3,127 | 3,285 | 3,466 | 14,352 | 12,742 | |||||||||||||||||||||
| Amortization of intangible assets | - | - | 289 | 313 | 313 | 602 | 1,265 | |||||||||||||||||||||
| Virginia franchise tax expense | 577 | 576 | 577 | 577 | 631 | 2,307 | 2,525 | |||||||||||||||||||||
| FDIC Insurance assessment | 918 | 999 | 1,021 | 793 | 805 | 3,731 | 2,549 | |||||||||||||||||||||
| Data processing expense | 2,421 | 2,369 | 3,037 | 2,849 | 3,434 | 10,676 | 10,564 | |||||||||||||||||||||
| Marketing expense | 472 | 450 | 720 | 514 | 499 | 2,156 | 1,906 | |||||||||||||||||||||
| Telecommunication and communication expense | 352 | 309 | 324 | 287 | 295 | 1,272 | 1,312 | |||||||||||||||||||||
| Professional fees | 3,730 | 2,509 | 2,413 | 2,225 | 3,129 | 10,877 | 10,384 | |||||||||||||||||||||
| Miscellaneous lending expenses | 634 | 231 | 900 | 834 | 1,446 | 2,599 | 3,280 | |||||||||||||||||||||
| Loss (gain) on bank premises and equipment | - | 80 | 5 | 106 | 13 | 191 | (463 | ) | ||||||||||||||||||||
| Other expenses | 3,066 | 2,786 | 2,469 | 2,792 | 5,782 | 11,113 | 12,965 | |||||||||||||||||||||
| Noninterest expense | 42,164 | 32,313 | 31,942 | 32,516 | 37,841 | 138,935 | 125,644 | |||||||||||||||||||||
| Income (loss) before income taxes | 36,265 | 8,737 | 2,965 | 24,587 | (32,072 | ) | 72,554 | (28,903 | ) | |||||||||||||||||||
| Income tax expense (benefit) | 6,725 | 1,907 | 528 | 5,553 | (5,917 | ) | 14,713 | (4,238 | ) | |||||||||||||||||||
| Net Income (loss) | 29,540 | 6,830 | 2,437 | 19,034 | (26,155 | ) | 57,841 | (24,665 | ) | |||||||||||||||||||
| Noncontrolling interest | - | - | - | 3,602 | 2,820 | 3,602 | 8,460 | |||||||||||||||||||||
| Net income (loss) attributable to Primis’ common shareholders | $ | 29,540 | $ | 6,830 | $ | 2,437 | $ | 22,636 | $ | (23,335 | ) | $ | 61,443 | $ | (16,205 | ) | ||||||||||||
(1) See Reconciliation of Non-GAAP financial measures.
10
Primis Financial Corp. (Dollars in thousands) Loan Portfolio Composition | For Three Months Ended: | |||||||||||||||||||
| 4Q 2025 | 3Q 2025 | 2Q 2025 | 1Q 2025 | 4Q 2024 | ||||||||||||||||
| Loans held for sale | $ | 166,066 | $ | 202,372 | $ | 126,869 | $ | 74,439 | $ | 247,108 | ||||||||||
| Loans secured by real estate: | ||||||||||||||||||||
| Commercial real estate - owner occupied | 510,088 | 495,739 | 480,981 | 477,233 | 475,898 | |||||||||||||||
| Commercial real estate - non-owner occupied | 567,092 | 592,480 | 590,848 | 600,872 | 610,482 | |||||||||||||||
| Secured by farmland | 3,407 | 3,642 | 3,696 | 3,742 | 3,711 | |||||||||||||||
| Construction and land development | 131,757 | 102,227 | 106,443 | 104,301 | 101,243 | |||||||||||||||
| Residential 1-4 family | 576,866 | 564,087 | 571,206 | 576,837 | 588,859 | |||||||||||||||
| Multi-family residential | 140,261 | 137,804 | 157,097 | 157,443 | 158,426 | |||||||||||||||
| Home equity lines of credit | 61,738 | 62,458 | 62,103 | 60,321 | 62,954 | |||||||||||||||
| Total real estate loans | 1,991,209 | 1,958,437 | 1,972,374 | 1,980,749 | 2,001,573 | |||||||||||||||
| Commercial loans | 970,492 | 915,158 | 811,458 | 698,097 | 608,595 | |||||||||||||||
| Paycheck Protection Program loans | 1,719 | 1,723 | 1,729 | 1,738 | 1,927 | |||||||||||||||
| Consumer loans | 315,407 | 319,977 | 339,936 | 357,652 | 270,063 | |||||||||||||||
| Total Non-PCD loans | 3,278,827 | 3,195,295 | 3,125,497 | 3,038,236 | 2,882,158 | |||||||||||||||
| PCD loans | 4,856 | 4,939 | 5,024 | 5,112 | 5,289 | |||||||||||||||
| Total loans receivable, net of deferred fees | $ | 3,283,683 | $ | 3,200,234 | $ | 3,130,521 | $ | 3,043,348 | $ | 2,887,447 | ||||||||||
| Loans by Risk Grade: | ||||||||||||||||||||
| Pass Grade 1 - Highest Quality | 87 | 666 | 667 | 880 | 872 | |||||||||||||||
| Pass Grade 2 - Good Quality | 178,999 | 168,177 | 170,560 | 175,379 | 175,659 | |||||||||||||||
| Pass Grade 3 - Satisfactory Quality | 1,882,934 | 1,842,958 | 1,737,153 | 1,643,957 | 1,567,228 | |||||||||||||||
| Pass Grade 4 - Pass | 1,026,499 | 1,034,035 | 1,050,397 | 1,124,901 | 1,041,947 | |||||||||||||||
| Pass Grade 5 - Special Mention | 48,683 | 7,004 | 31,902 | 28,498 | 30,111 | |||||||||||||||
| Grade 6 - Substandard | 138,932 | 139,847 | 139,842 | 69,733 | 71,630 | |||||||||||||||
| Grade 7 - Doubtful | 7,549 | 7,547 | - | - | - | |||||||||||||||
| Grade 8 - Loss | - | - | - | - | - | |||||||||||||||
| Total loans | $ | 3,283,683 | $ | 3,200,234 | $ | 3,130,521 | $ | 3,043,348 | $ | 2,887,447 | ||||||||||
| Dollars in thousands) | For Three Months Ended: | |||||||||||||||||||
| Asset Quality Information | 4Q 2025 | 3Q 2025 | 2Q 2025 | 1Q 2025 | 4Q 2024 | |||||||||||||||
| Allowance for Credit Losses: | ||||||||||||||||||||
| Balance at beginning of period | $ | (44,766 | ) | $ | (45,985 | ) | $ | (44,021 | ) | $ | (53,724 | ) | $ | (51,132 | ) | |||||
| Recovery of (provision for) credit losses | (2,439 | ) | 49 | (8,303 | ) | (1,596 | ) | (33,483 | ) | |||||||||||
| Net charge-offs | 1,322 | 1,170 | 6,339 | 11,299 | 30,891 | |||||||||||||||
| Ending balance | $ | (45,883 | ) | $ | (44,766 | ) | $ | (45,985 | ) | $ | (44,021 | ) | $ | (53,724 | ) | |||||
| Reserve for Unfunded Commitments: | ||||||||||||||||||||
| Balance at beginning of period | $ | (1,133 | ) | $ | (1,152 | ) | $ | (1,134 | ) | $ | (1,121 | ) | $ | (1,127 | ) | |||||
| Recovery of (provision for) unfunded loan commitment reserve | 127 | 19 | (18 | ) | (13 | ) | 6 | |||||||||||||
| Total Reserve for Unfunded Commitments | $ | (1,006 | ) | $ | (1,133 | ) | $ | (1,152 | ) | $ | (1,134 | ) | $ | (1,121 | ) | |||||
| 4Q 2025 | 3Q 2025 | 2Q 2025 | 1Q 2025 | 4Q 2024 | ||||||||||||||||
| Non-Performing Assets: | ||||||||||||||||||||
| Nonaccrual loans | $ | 84,823 | $ | 84,973 | $ | 53,059 | $ | 12,956 | $ | 15,026 | ||||||||||
| Accruing loans delinquent 90 days or more | 1,713 | 1,713 | 25,188 | 1,713 | 1,713 | |||||||||||||||
| Total non-performing assets | $ | 86,536 | $ | 86,686 | $ | 78,247 | $ | 14,669 | $ | 16,739 | ||||||||||
| SBA guaranteed portion of non-performing loans | $ | 4,482 | $ | 4,682 | $ | 4,750 | $ | 4,307 | $ | 5,921 | ||||||||||
11
Primis Financial Corp. (Dollars in thousands) Average Balance Sheet | For Three Months Ended: | For Twelve Months Ended: | ||||||||||||||||||||||||||
| 4Q 2025 | 3Q 2025 | 2Q 2025 | 1Q 2025 | 4Q 2024 | 4Q 2025 | 4Q 2024 | ||||||||||||||||||||||
| Assets | ||||||||||||||||||||||||||||
| Loans held for sale | $ | 162,854 | $ | 130,061 | $ | 108,693 | $ | 170,509 | $ | 100,243 | $ | 142,973 | $ | 85,485 | ||||||||||||||
| Loans, net of deferred fees | 3,238,184 | 3,143,155 | 3,074,993 | 2,897,481 | 3,127,249 | 3,089,537 | 3,231,206 | |||||||||||||||||||||
| Investment securities | 220,343 | 247,008 | 249,485 | 245,216 | 253,120 | 240,463 | 245,323 | |||||||||||||||||||||
| Other earning assets | 115,908 | 101,278 | 98,369 | 86,479 | 96,697 | 100,591 | 82,757 | |||||||||||||||||||||
| Total earning assets | 3,737,289 | 3,621,502 | 3,531,540 | 3,399,685 | 3,577,309 | 3,573,564 | 3,644,771 | |||||||||||||||||||||
| Other assets | 244,183 | 232,636 | 272,910 | 241,912 | 237,704 | 245,381 | 242,544 | |||||||||||||||||||||
| Total assets | $ | 3,981,472 | $ | 3,854,138 | $ | 3,804,450 | $ | 3,641,597 | $ | 3,815,013 | $ | 3,818,945 | $ | 3,887,315 | ||||||||||||||
| Liabilities and equity | ||||||||||||||||||||||||||||
| Demand deposits | $ | 498,681 | $ | 481,697 | $ | 467,493 | $ | 446,404 | $ | 437,388 | $ | 473,734 | $ | 441,520 | ||||||||||||||
| Interest-bearing liabilities: | ||||||||||||||||||||||||||||
| NOW and other demand accounts | 837,231 | 834,839 | 821,893 | 805,522 | 787,884 | 824,985 | 772,099 | |||||||||||||||||||||
| Money market accounts | 740,915 | 756,361 | 759,107 | 788,067 | 819,803 | 760,971 | 829,331 | |||||||||||||||||||||
| Savings accounts | 934,092 | 922,048 | 882,227 | 754,304 | 767,342 | 873,794 | 825,129 | |||||||||||||||||||||
| Time deposits | 315,943 | 324,614 | 329,300 | 335,702 | 404,682 | 326,331 | 421,058 | |||||||||||||||||||||
| Total Deposits | 3,326,862 | 3,319,559 | 3,260,020 | 3,129,999 | 3,217,099 | 3,259,815 | 3,289,137 | |||||||||||||||||||||
| Borrowings | 205,767 | 117,697 | 117,701 | 116,955 | 160,886 | 139,714 | 169,912 | |||||||||||||||||||||
| Total Funding | 3,532,629 | 3,437,256 | 3,377,721 | 3,246,954 | 3,377,985 | 3,399,529 | 3,459,049 | |||||||||||||||||||||
| Other Liabilities | 50,978 | 36,720 | 36,649 | 38,280 | 39,566 | 40,681 | 36,422 | |||||||||||||||||||||
| Total liabilites | 3,583,607 | 3,473,976 | 3,414,370 | 3,285,234 | 3,417,551 | 3,440,210 | 3,495,471 | |||||||||||||||||||||
| Primis common stockholders’ equity | 397,865 | 380,162 | 380,080 | 344,381 | 382,370 | 375,740 | 373,613 | |||||||||||||||||||||
| Noncontrolling interest | — | — | — | 11,982 | 15,092 | 2,996 | 18,231 | |||||||||||||||||||||
| Total stockholders’ equity | 397,865 | 380,162 | 380,080 | 356,363 | 397,462 | 378,735 | 391,844 | |||||||||||||||||||||
| Total liabilities and stockholders’ equity | $ | 3,981,472 | $ | 3,854,138 | $ | 3,794,450 | $ | 3,641,597 | $ | 3,815,013 | $ | 3,818,945 | $ | 3,887,315 | ||||||||||||||
| Net Interest Income | ||||||||||||||||||||||||||||
| Loans held for sale | $ | 2,511 | $ | 2,085 | $ | 1,754 | $ | 2,564 | $ | 1,553 | $ | 7,406 | $ | 5,571 | ||||||||||||||
| Loans | 47,856 | 46,772 | 42,963 | 42,400 | 46,831 | 181,499 | 194,369 | |||||||||||||||||||||
| Investment securities | 1,841 | 1,894 | 1,928 | 1,906 | 1,894 | 7,569 | 7,213 | |||||||||||||||||||||
| Other earning assets | 1,118 | 1,015 | 982 | 853 | 1,060 | 3,968 | 3,816 | |||||||||||||||||||||
| Total Earning Assets Income | 53,326 | 51,766 | 47,627 | 47,723 | 51,338 | 200,442 | 210,969 | |||||||||||||||||||||
| Non-interest bearing DDA | - | - | - | - | - | - | - | |||||||||||||||||||||
| NOW and other interest-bearing demand accounts | 4,124 | 4,549 | 4,603 | 4,515 | 4,771 | 17,794 | 18,695 | |||||||||||||||||||||
| Money market accounts | 4,615 | 5,229 | 5,271 | 5,420 | 6,190 | 20,534 | 26,923 | |||||||||||||||||||||
| Savings accounts | 7,599 | 8,070 | 7,793 | 6,418 | 7,587 | 29,880 | 33,462 | |||||||||||||||||||||
| Time deposits | 2,639 | 2,723 | 2,830 | 3,039 | 4,127 | 11,229 | 16,582 | |||||||||||||||||||||
| Total Deposit Costs | 18,977 | 20,571 | 20,497 | 19,392 | 22,675 | 79,437 | 95,662 | |||||||||||||||||||||
| Borrowings | 3,497 | 2,163 | 1,950 | 1,967 | 2,586 | 9,577 | 11,085 | |||||||||||||||||||||
| Total Funding Costs | 22,474 | 22,734 | 22,447 | 21,359 | 25,261 | 89,014 | 106,747 | |||||||||||||||||||||
| Net Interest Income | $ | 30,852 | $ | 29,032 | $ | 25,180 | $ | 26,364 | $ | 26,077 | $ | 111,428 | $ | 104,222 | ||||||||||||||
| Net Interest Margin | ||||||||||||||||||||||||||||
| Loans held for sale | 6.12 | % | 6.36 | % | 6.47 | % | 6.10 | % | 6.16 | % | 5.18 | % | 6.52 | % | ||||||||||||||
| Loans | 5.86 | % | 5.90 | % | 5.60 | % | 5.93 | % | 5.96 | % | 5.87 | % | 6.02 | % | ||||||||||||||
| Investments | 3.31 | % | 3.04 | % | 3.10 | % | 3.15 | % | 2.98 | % | 3.15 | % | 2.94 | % | ||||||||||||||
| Other Earning Assets | 3.83 | % | 3.98 | % | 4.00 | % | 4.00 | % | 4.36 | % | 3.94 | % | 4.61 | % | ||||||||||||||
| Total Earning Assets | 5.66 | % | 5.67 | % | 5.41 | % | 5.69 | % | 5.71 | % | 5.61 | % | 5.79 | % | ||||||||||||||
| NOW | 1.95 | % | 2.16 | % | 2.25 | % | 2.27 | % | 2.41 | % | 2.16 | % | 2.42 | % | ||||||||||||||
| MMDA | 2.47 | % | 2.74 | % | 2.79 | % | 2.79 | % | 3.00 | % | 2.70 | % | 3.25 | % | ||||||||||||||
| Savings | 3.23 | % | 3.47 | % | 3.54 | % | 3.45 | % | 3.93 | % | 3.42 | % | 4.06 | % | ||||||||||||||
| CDs | 3.31 | % | 3.33 | % | 3.45 | % | 3.67 | % | 4.06 | % | 3.44 | % | 3.94 | % | ||||||||||||||
| Cost of Interest Bearing Deposits | 2.66 | % | 2.88 | % | 2.94 | % | 2.93 | % | 3.25 | % | 2.85 | % | 3.36 | % | ||||||||||||||
| Cost of Deposits | 2.26 | % | 2.46 | % | 2.52 | % | 2.52 | % | 2.80 | % | 2.44 | % | 2.91 | % | ||||||||||||||
| Other Funding | 6.74 | % | 7.29 | % | 6.65 | % | 6.82 | % | 6.39 | % | 6.85 | % | 6.52 | % | ||||||||||||||
| Total Cost of Funds | 2.52 | % | 2.62 | % | 2.67 | % | 2.67 | % | 2.97 | % | 2.62 | % | 3.09 | % | ||||||||||||||
| Net Interest Margin | 3.28 | % | 3.18 | % | 2.86 | % | 3.15 | % | 2.90 | % | 3.12 | % | 2.86 | % | ||||||||||||||
| Net Interest Spread | 2.72 | % | 2.62 | % | 2.32 | % | 2.60 | % | 2.30 | % | 2.57 | % | 2.25 | % | ||||||||||||||
12
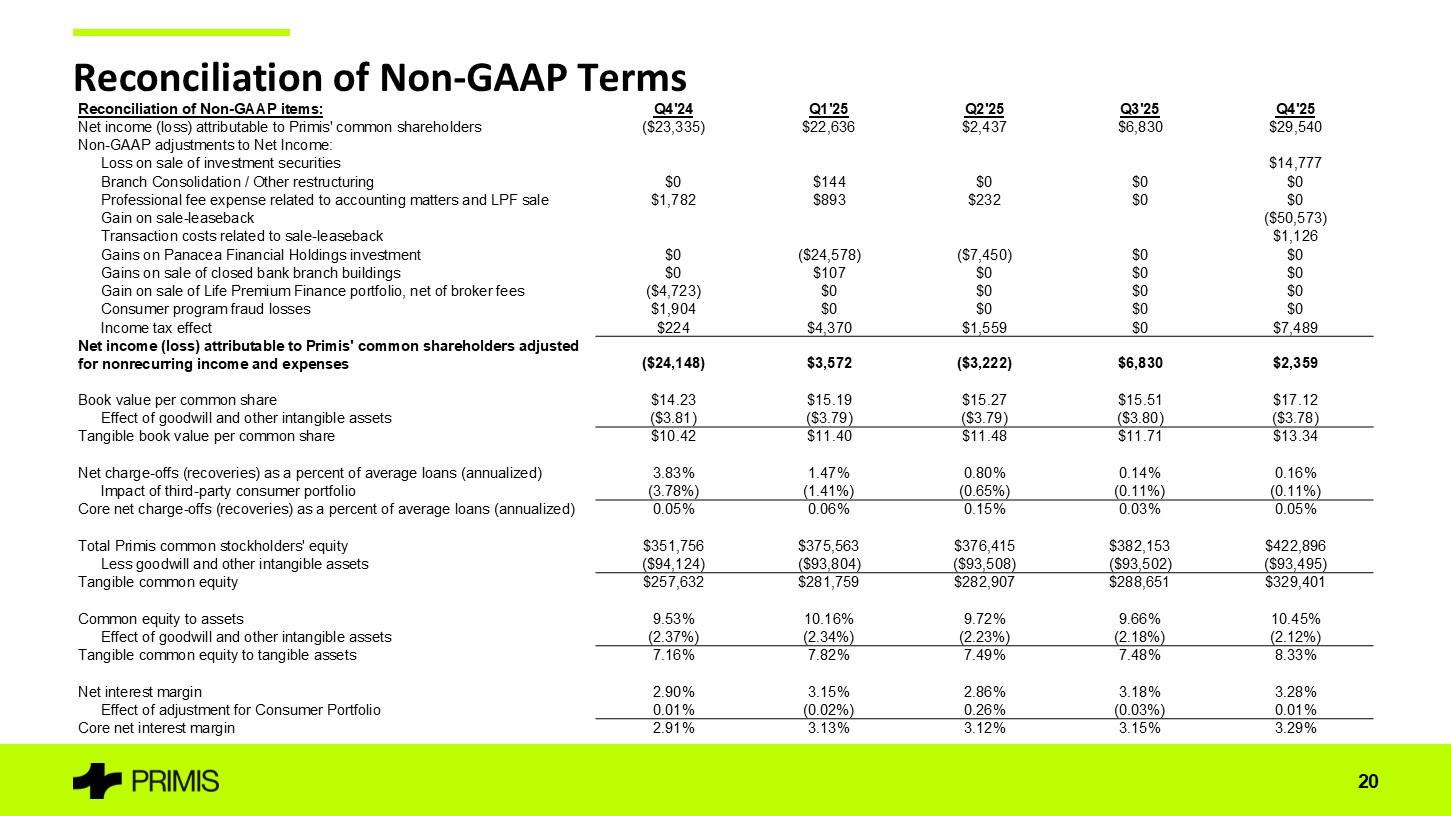
Primis Financial Corp. (Dollars in thousands, except per share data) | For Three Months Ended: | For Twelve Months Ended: | ||||||||||||||||||||||||||
| 4Q 2025 | 3Q 2025 | 2Q 2025 | 1Q 2025 | 4Q 2024 | 4Q 2025 | 4Q 2024 | ||||||||||||||||||||||
| Reconciliation of Non-GAAP items: | ||||||||||||||||||||||||||||
| Net income (loss) attributable to Primis’ common shareholders | $ | 29,540 | $ | 6,830 | $ | 2,437 | $ | 22,636 | $ | (23,335 | ) | $ | 61,443 | $ | (16,205 | ) | ||||||||||||
| Non-GAAP adjustments to Net Income: | ||||||||||||||||||||||||||||
| Loss on sale of investment securities | 14,777 | - | - | - | - | 14,777 | - | |||||||||||||||||||||
| Branch Consolidation / Other restructuring | - | - | - | 144 | - | 144 | - | |||||||||||||||||||||
| Professional fee expense related to accounting matters and LPF sale | - | - | 232 | 893 | 1,782 | 1,125 | 5,025 | |||||||||||||||||||||
| Gain on sale-leaseback | (50,573 | ) | - | - | - | - | (50,573 | ) | - | |||||||||||||||||||
| Transaction costs related to sale-leaseback | 1,126 | - | - | - | - | 1,126 | - | |||||||||||||||||||||
| Gains on Panacea Financial Holdings investment | - | - | (7,450 | ) | (24,578 | ) | - | (32,028 | ) | - | ||||||||||||||||||
| Loss (Gains) on sale of closed bank branch buildings | - | - | - | 107 | - | 107 | (476 | ) | ||||||||||||||||||||
| Gain on sale of Life Premium Finance portfolio, net of broker fees | - | - | - | - | (4,723 | ) | - | (4,723 | ) | |||||||||||||||||||
| Consumer program fraud losses | - | - | - | - | 1,904 | - | 1,904 | |||||||||||||||||||||
| Income tax effect | 7,489 | - | 1,559 | 4,370 | 224 | 13,418 | (374 | ) | ||||||||||||||||||||
| Net income (loss) attributable to Primis’ common shareholders adjusted for nonrecurring income and expenses | $ | 2,359 | $ | 6,830 | $ | (3,222 | ) | $ | 3,572 | $ | (24,148 | ) | $ | 9,539 | $ | (14,849 | ) | |||||||||||
| Net income (loss) attributable to Primis’ common shareholders | $ | 29,540 | $ | 6,830 | $ | 2,437 | $ | 22,636 | $ | (23,335 | ) | $ | 61,443 | $ | (16,205 | ) | ||||||||||||
| Income tax expense (benefit) | 6,725 | 1,907 | 528 | 5,553 | (5,917 | ) | 14,713 | (4,238 | ) | |||||||||||||||||||
| Provision (benefit) for credit losses (incl. unfunded commitment expense/benefit) | 2,312 | (68 | ) | 8,321 | 1,609 | 33,477 | 12,174 | 50,163 | ||||||||||||||||||||
| Pre-tax pre-provision earnings | $ | 38,577 | $ | 8,669 | $ | 11,286 | $ | 29,798 | $ | 4,225 | $ | 88,330 | $ | 29,720 | ||||||||||||||
| Effect of adjustment for nonrecurring income and expenses | (34,670 | ) | - | (7,218 | ) | (23,434 | ) | (1,037 | ) | (65,322 | ) | 1,730 | ||||||||||||||||
| Pre-tax pre-provision operating earnings | $ | 3,907 | $ | 8,669 | $ | 4,068 | $ | 6,364 | $ | 3,188 | $ | 23,008 | $ | 31,450 | ||||||||||||||
| Return on average assets | 2.94 | % | 0.70 | % | 0.26 | % | 2.52 | % | (2.43 | )% | 1.61 | % | (0.42 | )% | ||||||||||||||
| Effect of adjustment for nonrecurring income and expenses | (2.71 | )% | 0.00 | % | (0.60 | )% | (2.12 | )% | (0.08 | )% | (1.36 | )% | 0.03 | % | ||||||||||||||
| Operating return on average assets | 0.23 | % | 0.70 | % | (0.34 | )% | 0.40 | % | (2.51 | )% | 0.25 | % | (0.39 | )% | ||||||||||||||
| Return on average assets | 2.94 | % | 0.70 | % | 0.26 | % | 2.52 | % | (2.43 | )% | 1.61 | % | (0.42 | )% | ||||||||||||||
| Effect of tax expense | 0.67 | % | 0.20 | % | 0.06 | % | 0.62 | % | (0.62 | )% | 0.39 | % | (0.11 | )% | ||||||||||||||
| Effect of provision for credit losses (incl. unfunded commitment expense) | 0.23 | % | (0.01 | )% | 0.88 | % | 0.18 | % | 3.49 | % | 0.32 | % | 1.29 | % | ||||||||||||||
| Pre-tax pre-provision return on average assets | 3.84 | % | 0.89 | % | 1.20 | % | 3.32 | % | 0.44 | % | 2.32 | % | 0.76 | % | ||||||||||||||
| Effect of adjustment for nonrecurring income and expenses | (3.45 | )% | 0.00 | % | (0.76 | )% | (2.61 | )% | (0.11 | )% | (1.71 | )% | 0.04 | % | ||||||||||||||
| Pre-tax pre-provision operating return on average assets | 0.39 | % | 0.89 | % | 0.44 | % | 0.71 | % | 0.33 | % | 0.61 | % | 0.80 | % | ||||||||||||||
| Return on average common equity | 29.46 | % | 7.13 | % | 2.57 | % | 26.66 | % | (24.28 | )% | 16.35 | % | (4.34 | )% | ||||||||||||||
| Effect of adjustment for nonrecurring income and expenses | (27.10 | )% | 0.00 | % | (5.97 | )% | (22.45 | )% | (0.85 | )% | (13.81 | )% | 0.37 | % | ||||||||||||||
| Operating return on average common equity | 2.36 | % | 7.13 | % | (3.40 | )% | 4.21 | % | (25.13 | )% | 2.54 | % | (3.97 | )% | ||||||||||||||
| Effect of goodwill and other intangible assets | 0.71 | % | 2.32 | % | (1.11 | )% | 1.57 | % | (8.20 | )% | 0.84 | % | (1.35 | )% | ||||||||||||||
| Operating return on average tangible common equity | 3.07 | % | 9.45 | % | (4.51 | )% | 5.78 | % | (33.33 | )% | 3.38 | % | (5.32 | )% | ||||||||||||||
| Efficiency ratio | 52.14 | % | 78.81 | % | 73.92 | % | 55.39 | % | 96.36 | % | 62.09 | % | 85.26 | % | ||||||||||||||
| Effect of adjustment for nonrecurring income and expenses | 38.91 | % | 0.00 | % | 14.75 | % | 36.58 | % | 2.54 | % | 25.39 | % | (1.75 | )% | ||||||||||||||
| Operating efficiency ratio | 91.05 | % | 78.81 | % | 88.67 | % | 91.97 | % | 98.90 | % | 87.48 | % | 83.51 | % | ||||||||||||||
| Earnings per common share - Basic | $ | 1.20 | $ | 0.28 | $ | 0.10 | $ | 0.92 | $ | (0.94 | ) | $ | 2.49 | $ | (0.66 | ) | ||||||||||||
| Effect of adjustment for nonrecurring income and expenses | (1.10 | ) | - | (0.23 | ) | (0.78 | ) | (0.04 | ) | (2.10 | ) | 0.06 | ||||||||||||||||
| Operating earnings per common share - Basic | $ | 0.10 | $ | 0.28 | $ | (0.13 | ) | $ | 0.14 | $ | (0.98 | ) | $ | 0.39 | $ | (0.60 | ) | |||||||||||
| Earnings per common share - Diluted | $ | 1.20 | $ | 0.28 | $ | 0.10 | $ | 0.92 | $ | (0.94 | ) | $ | 2.49 | $ | (0.66 | ) | ||||||||||||
| Effect of adjustment for nonrecurring income and expenses | (1.10 | ) | - | (0.23 | ) | (0.78 | ) | (0.04 | ) | (2.10 | ) | 0.06 | ||||||||||||||||
| Operating earnings per common share - Diluted | $ | 0.10 | $ | 0.28 | $ | (0.13 | ) | $ | 0.14 | $ | (0.98 | ) | $ | 0.39 | $ | (0.60 | ) | |||||||||||
| Book value per common share | $ | 17.12 | $ | 15.51 | $ | 15.27 | $ | 15.19 | $ | 14.23 | $ | 17.12 | $ | 14.23 | ||||||||||||||
| Effect of goodwill and other intangible assets | (3.78 | ) | (3.80 | ) | (3.79 | ) | (3.79 | ) | (3.81 | ) | (3.78 | ) | (3.81 | ) | ||||||||||||||
| Tangible book value per common share | $ | 13.34 | $ | 11.71 | $ | 11.48 | $ | 11.40 | $ | 10.42 | $ | 13.34 | $ | 10.42 | ||||||||||||||
| Net charge-offs as a percent of average loans (annualized) | 0.16 | % | 0.14 | % | 0.80 | % | 1.47 | % | 3.83 | % | 0.65 | % | 1.48 | % | ||||||||||||||
| Impact of third-party consumer portfolio | (0.11 | )% | (0.11 | )% | (0.65 | )% | (1.41 | )% | (3.78 | )% | (0.58 | )% | (1.43 | )% | ||||||||||||||
| Core net charge-offs (recoveries) as a percent of average loans (annualized) | 0.05 | % | 0.03 | % | 0.15 | % | 0.06 | % | 0.05 | % | 0.07 | % | 0.05 | % | ||||||||||||||
| Total Primis common stockholders’ equity | $ | 422,896 | $ | 382,153 | $ | 376,415 | $ | 375,563 | $ | 351,756 | $ | 422,896 | $ | 351,756 | ||||||||||||||
| Less goodwill and other intangible assets | (93,495 | ) | (93,502 | ) | (93,508 | ) | (93,804 | ) | (94,124 | ) | (93,495 | ) | (94,124 | ) | ||||||||||||||
| Tangible common equity | $ | 329,401 | $ | 288,651 | $ | 282,907 | $ | 281,759 | $ | 257,632 | $ | 329,401 | $ | 257,632 | ||||||||||||||
| Common equity to assets | 10.45 | % | 9.66 | % | 9.72 | % | 10.16 | % | 9.53 | % | 10.45 | % | 9.53 | % | ||||||||||||||
| Effect of goodwill and other intangible assets | (2.12 | )% | (2.18 | )% | (2.23 | )% | (2.34 | )% | (2.37 | )% | (2.12 | )% | (2.37 | )% | ||||||||||||||
| Tangible common equity to tangible assets | 8.33 | % | 7.48 | % | 7.49 | % | 7.82 | % | 7.16 | % | 8.33 | % | 7.16 | % | ||||||||||||||
| Net interest margin | 3.28 | % | 3.18 | % | 2.86 | % | 3.15 | % | 2.90 | % | 3.12 | % | 2.86 | % | ||||||||||||||
| Effect of adjustment for Consumer Portfolio | 0.01 | % | (0.03 | )% | 0.26 | % | (0.02 | )% | 0.01 | % | 0.05 | % | 0.07 | % | ||||||||||||||
| Core net interest margin | 3.29 | % | 3.15 | % | 3.12 | % | 3.13 | % | 2.91 | % | 3.17 | % | 2.93 | % | ||||||||||||||
13