Exhibit 99.1

Q4 2019 Shareholder Letter
February 20, 2020 investors.fastly.com
Solid 2019 Results with Q4 Revenue up 44% Year-over-Year Strong Enterprise Customer Growth Across All Verticals
Q4 2019:
| • | Continued top-line growth with revenue of $59 million, up 44% year-over-year |
| • | GAAP gross margin of 56.7%, up from 56.6% year-over-year; non-GAAP gross margin, which excludes stock-based compensation, of 57.6% up from 56.8% year-over-year |
| • | GAAP operating loss of $14 million, compared to $7 million for Q4 2018; non-GAAP operating loss of $9 million¹, compared to $6 million for Q4 2018 |
| • | GAAP basic and diluted net loss per share of $0.15, compared to $0.29 for Q4 2018; non-GAAP basic and diluted net loss per share of $0.10¹, compared to $0.24 for Q4 2018 |
| • | Capital expenditures² of $6 million, or 10% of revenue |
Full Year 2019:
| • | Total revenue of over $200 million, up 39% year-over-year |
| • | GAAP gross margin of 55.9%, up from 54.7% in 2018; non-GAAP gross margin of 56.6%, up from 54.9% in 2018 |
| • | GAAP operating loss of $47 million, compared to $29 million for 2018; non-GAAP operating loss of $34 million¹, compared to $25 million for 2018 |
| • | GAAP basic and diluted net loss per share of $0.75, compared to $1.27; non-GAAP basic and diluted net loss per share of $0.52¹, compared to $1.08 for 2018 |
| • | Capital expenditures² of $19 million, or 10% of revenue |
Key Metrics:
| • | Strong enterprise customer growth and continued execution of land and expand strategy: |
| • | Dollar-Based Net Expansion Rate (DBNER) of 136%, up from 135% in Q3 2019 |
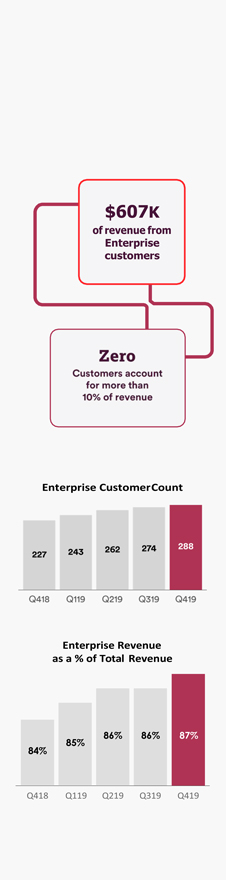
| • | Enterprise customer count of 288, up from 274 in Q3 2019 |
| • | Average enterprise customer spend of approximately $607,000, up from $575,000 in Q3 2019 |
| • | Enterprise customers generated 87% of our trailing twelve-month total revenue, up from 86% in Q3 2019³ |
| • | 2019 annual revenue retention rate increased to over 99% |

1 For a reconciliation of non-GAAP financial measures to their corresponding GAAP measures, please refer to the reconciliation table at the end of this letter.
2 Capital Expenditures are defined as cash used for purchases of property and equipment and capitalized internal-use software, as reflected in our statement of cash flows.
3 Calculated based on trailing twelve-months.

Artur Bergman
Chief Architect and Executive Chairperson |
To Our Shareholders,
2019 was a big year for Fastly. We celebrated some large public moments and equally important internal milestones — shipping deep technical improvements and innovations to our Developer’s Edge platform. We closed the year with solid fourth quarter results that reflect further adoption of our edge cloud platform and continued progress on the path towards profitability.
Heading into 2020, we are focused on delivering a feature-rich Compute@Edge offering at scale and investing in our edge security portfolio. We are executing on our promises to shareholders and customers alike as we innovate, iterate, and deliver the very best edge cloud platform technology. We’re proud of what we’ve accomplished so far and look forward to the opportunities ahead.
Fastly’s continued success is reflected in our fourth-quarter results. We generated $59 million in revenue, up 44% year-over-year. We increased our enterprise customer count to 288 from 274 in the previous quarter, and we continued to drive usage with existing customers resulting in a DBNER of 136%, up from 135% in the third quarter. We are confident that we will continue to see sustained growth in 2020 and the years to come.
Exciting Leadership Change
Before I further discuss our results, I want to share some exciting news that will position us for the next stage of Fastly’s growth. I have stepped into the full-time role of Chief Architect and Executive Chairperson of Fastly, in order to focus more of my attention on our customers and to work more with the product and technology part of our business to build out our edge cloud platform. Joshua Bixby, our President, is Fastly’s new CEO. Joshua intuitively understands the types of people, systems, and organization needed to grow with integrity and humanity. He cares deeply about our employees, partners, and customers. I believe that Joshua is the right person to lead Fastly into the future and will continue to work closely with him to help to oversee the long-term strategic direction of the Company.
In conjunction with this announcement, Joshua has joined the Board of Directors. Our current Board Member, David Hornik, has been appointed Lead Independent Director. |
| Behind the Screens — Enhancing Offerings to Improve Developer Experiences
Behind every email, post, like, purchase, pin, slack, and snap are the cables, servers, satellites, languages, code, and protocols that make these experiences possible. As a developer and technologist, it’s fascinating to see how the growth of our modern platform helps make room for new and evolving technologies.
One of the things I have learned from our customers is that Fastly’s deep technical work is highly valued by the developer community, and we are continuing to enhance our offerings to fuel tomorrow’s brilliant online experience. In the last several months:
• We advanced security, performance, and privacy with our new TLS solutions to create a more trustworthy web and lower the barrier to entry of encryption;
• For media brands, we offered Origin Connect, a private fiber connection that improves content delivery by plugging origin servers directly into our edge cloud network; and
• We launched Cloud Optimizer for our commerce and high-tech customers to lower origin costs and introduce greater control to multi-cloud and multi-CDN infrastructures
Beyond our new offerings, we also continued to build upon the successful launch of Compute@Edge. The world is just now beginning to appreciate the promise of edge computing, but at Fastly we’ve been thinking about its uses and applications since our inception. Since launching the beta in November, we’ve received great developer feedback. They’re telling us their future use cases, and we’re further iterating Compute@Edge to develop solutions for them. They’re digging into how the compiler and runtime work as well as changing the way they think about security. These help us improve the product and continue to drive the transformation at the edge. |
|
Compute@Edge will allow critical logic and data to live, be processed, and manipulated at the edge. With this architectural change, security will no longer consist of boxes in front of central clouds or data centers — it will also live at the edge. We believe that security should be integrated seamlessly into every layer of development: architecture, programming, and operations. Security is built into the fabric of our platform, providing Security in Depth without impacting our best-in-class performance.
With Compute@Edge, security is paramount. Security is multi- faceted, and requires significant effort from Fastly and our partners. We worked with Mozilla, Red Hat, and Intel to establish new software foundations with the Bytecode Alliance, improving security for WebAssembly with standards like WebAssembly System Interface (WASI) and projects like Lucet. With Compute@Edge, each request creates a new sandbox, our customer’s code is run, and then the sandbox is destroyed. This all happens within 35.4 microseconds, and is transparent to both the developer and end client. This removes an entire class of security vulnerabilities, and opens up a safer world of innovation for developers.
We look forward to providing more updates on both Compute@Edge and our security initiatives in the quarters to come. |
| Driving Growth by Winning New Enterprise Customers Across All Verticals
During the fourth quarter of 2019, our enterprise customer count increased to 288, up from 274 in the previous quarter. As customers develop more complex logic at the edge, they prefer Fastly because of our exceptional performance and security as well as our agility, control, and real-time visibility.
We’ve continued to attract and win new enterprise customers across all verticals, including FinTech, Commerce, and Travel. For example, we recently signed a new deal with JetBlue. Their team needed an edge platform that improved performance, moved application logic closer to their customers, and integrated into their workflows without requiring weekly professional services engagements. Leveraging Fastly’s self-service platform, they use our edge to balance multi- and hybrid-cloud infrastructures, and personalize content based on edge geo-detection. Another great example is our recent win with a leading global online payments company, which continues to transform its monolithic edge into a workflow designed for devops, automation, and scale. They chose Fastly because of the programmability and real-time visibility inherent to our platform, enabling them to extend their devops adoption to their edge configurations.
Not only are we expanding our enterprise customer base, but we are continuing to drive increased spend — our average enterprise customer now spends $607,000, up from $575,000 in the previous quarter. This is driven by increased usage on our platform and adoption of optimization and security products such as Media Shield, Cloud Optimizer, WAF, and our new TLS services. Enterprise customers continue to be our primary growth driver, generating 87% of our trailing twelve-month revenue for the calendar year, yet no enterprise customer represents more than 10% of revenue. |
|
| We aim to continue to drive enterprise customer growth by focusing our efforts on rapidly growing companies with edge computing use cases and the available budget to become enterprise customers (defined as customers that spend $100,000 or more in a twelve month period). These customers have continuously demonstrated the quickest usage expansion and the highest demand for ancillary products and features.
In Q4 2019, our total customer count also increased to 1,743, up from 1,684 in the previous quarter. We’ve continued to invest in our demand generation, sales, and marketing teams, and expect to see a return on those efforts in the quarters to come. |
| Continued Momentum with Existing Customers — DBNER increased to 136%
Our Dollar-Based Net Expansion (DBNER) increased to 136% from 135% in the previous quarter. DBNER is a meaningful indicator of the increased activity from our existing customer accounts and overall customer satisfaction. It measures the change in revenue from existing customers on our platform over a twelve-month period, excluding the effect of new and churned customers.
In Q4, customers such as Taboola and Shopify continued to expand their use of our platform to drive application logic to the edge, gain deeper insights through our real-time analytics and logging, and securely serve their global audiences at scale. Partners, including image and video management service providers, are building on top of Fastly, moving edge application logic, authentication and traffic management to our edge cloud. We are pleased to see developers leveraging our platform to create new edge computing use cases and solve complex problems to provide their end users with the best possible digital experiences. Additionally, we are seeing an increase in the value of our customer cohorts over time as they further appreciate our performance advantages and expand their usage of our platform and products.
Our annual revenue retention rate¹ also increased to 99.3% for the full year 2019, up from 98.9% in 2018. This demonstrates the stickiness of our platform as developers continue to build mission-critical solutions at the edge.
|


1 Annual revenue retention rate is calculated by multiplying the final full month of revenue from a customer that terminated its contract with us (a Churned Customer) by the number of months remaining in the same calendar year (Annual Revenue Churn). The quotient of the Annual Revenue Churn from all of our Churned Customers divided by our annual revenue of the same calendar year is then subtracted from 100% to determine our annual revenue retention rate.
| Continued Investment in Our Software-Defined Modern Network Platform
We are an edge computing platform — we built Fastly for the Internet of today, which is powered by a finite amount of strategically located Internet Gateways. Unlike legacy CDNs that deliver basic edge functions with a focus on the number of locations and servers deployed, we are focused on delivering highly complex personalized experiences with exceptional performance and instant purging. This requires concentrated hardware deployments, each with tremendous amounts of computing power and storage located at the key interconnection points of the Internet. We believe the architecture of our unique, software-defined network allows us to meet the compute and performance requirements of today’s data-rich applications and the demands of the agile developers who build them.
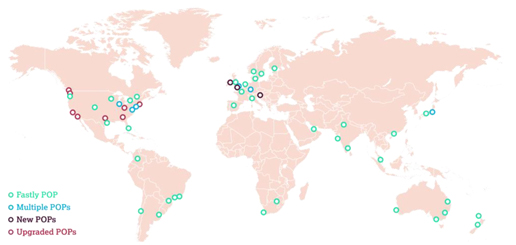
We are scaling our network efficiently and will continue to strategically expand, upgrade, and augment it based on the needs of enterprise customers. This quarter, we entered two new markets¹ by adding points of presence (POPs) in Dublin and Vienna, and added an additional POP in the U.K. We also upgraded eight existing POPs in various locations in the U.S. and Canada. In total, we are in 53 markets with 68 POPs online, providing access to 74 Tb/sec. of global network capacity.
1 Markets are defined as unique metropolitan areas where Fastly has one or more POPs. |
|
Driving Operating Leverage
In 2019, we improved operating leverage year over year, even with investments in building teams and bolstering systems in preparation for our IPO. We remain confident in our path towards profitability, which is driven by our ability to win new enterprise customers, drive usage on our network, and invest efficiently — all of which we expect to deliver upon as we scale. We expect that the primary drivers of our operating leverage will be incremental revenue from continuous edge cloud and security product releases, automation and system improvements, and increased efficiency in the network.
This quarter, we continued to realize the benefit of increased system efficiency through multiple software improvements to our edge software stack. These improvements lead to a reduction in computing requirements for common platform workloads, thereby maximizing revenue generation while reducing the need for incremental capital expenditures. With a single, global platform, we can immediately realize these improvements in every Fastly POP globally, and on every cache server. These enhancements provide more headroom in our systems, thereby generating additional leverage from existing investments and helping us increase the efficiency of future investments in our network. Looking ahead, we expect to see further benefits throughout the year.
In terms of operating expenses, we are committed to building upon our edge computing momentum and pioneering new edge computing as well as security technologies at a reasonable pace. We will continue to invest in our sales and marketing organizations to drive strong top-line growth, and we expect returns on these investments as these teams mature. In 2020, we are also automating and augmenting our systems and processes to ensure we are optimizing the effectiveness of our teams and capital expenditures. Given the rapid scaling of our support teams in preparation for the IPO in 2019, we do not expect to make the same level of incremental investments in 2020. |
|
Financial Discussion
Q419 and Full Year 2019 Performance
Revenue
Total revenue for Q4 2019 increased 44% year-over-year to $59 million, driven by further adoption of our modern edge platform and products by new and existing enterprise organizations across all geographies and verticals. Additionally, we successfully delivered multiple large live events and continue to develop ways to leverage our unique platform to deliver streaming traffic in a scalable and profitable manner. For the full year 2019, total revenue for 2019 exceeded $200 million, up 39% year-over-year.
Customer Count
As of Q4 2019, 288 of our 1,743 customers were enterprise customers. These enterprise customers drove the majority of our revenue growth and accounted for 87% of our trailing twelve-month total revenue.
Gross Margin
We are pleased with the progress we’re making as we continue to drive leverage in the business. GAAP gross margin was 56.7% for Q4 2019, compared to 56.6% in the same quarter a year ago. Excluding stock-based compensation, Non-GAAP gross margin was 57.6% for Q4 2019, compared to 56.8% in the same quarter a year ago. For the full-year 2019, GAAP gross margin was 55.9%, compared to 54.7% for 2018. Non-GAAP gross margin was 56.6% for 2019, compared to 54.9% for 2018.
As previously mentioned, our gross margin is impacted by the timing of personnel and infrastructure investments as well as the seasonal ramp of usage and requests by customers on our platform. Please note that Q4 2019 gross margin included revenue from multiple large, annual one-time live events that will not carry into Q1 2020. That being said, we remain confident in our ability to deliver incremental annual gross margin expansion. |
|
Expenses
Research and development expense was $13 million in Q4 2019, or 22% of revenue, up from $9 million, or 23% of revenue in Q4 2018. Full-year 2019 research and development expense was $46 million, or 23% of revenue, compared to $35 million, or 24% of revenue in 2018. The increase was primarily driven by investments in new products and features to produce next-generation edge computing solutions.
Sales and marketing expense was $22 million in Q4 2019, representing 37% of revenue compared to 33% of revenue in Q4 2018. The increase was primarily driven by augmenting our talent to drive future enterprise customer acquisition growth as well as encourage further use of our platform by existing customers. Full-year 2019 sales and marketing expense was $71 million, which remained consistent to 35% of revenue in 2018.
General and administrative expense was $13 million in Q4 2019, or 22% of revenue, up from $7 million, or 18% of revenue in Q4 2018. Full-year 2019 general and administrative expense was $41 million, or 21% of revenue, up from $23 million, or 16% of revenue in 2018. The higher expense was primarily driven by an increase in headcount, service providers and insurance required to support us as a public company.
In total, our operating expenses for Q4 2019 were $47 million, or 80% of revenue, compared to $30 million, or 74% of revenue in Q4 2018. Full-year 2019 operating expenses were $159 million, or 79% of revenue, compared to $108 million, or 75% of revenue in 2018.
We generated a GAAP operating loss for Q4 2019 of $14 million, or 24% of revenue, compared to GAAP operating loss of $7 million, or 17% of revenue in Q4 2018. Full-year 2019 GAAP operating loss was $47 million, or 23% of revenue, compared to GAAP operating loss of $29 million, or 20% of revenue in 2018.
Non-GAAP operating loss for Q4 2019 was $9 million, or 16% of revenue, compared to non-GAAP operating loss of $6 million, or 14% of revenue in Q4 2018. Non-GAAP operating loss for full-year 2019 was $34 million, or 17% of revenue, compared to non-GAAP operating loss of $25 million, or 17% of revenue in 2018. |
| Net Loss
Net loss for Q4 2019 was $14 million, or $0.15 loss per basic and diluted shares, compared to $7 million and $0.29 per basic and diluted in Q4 2018. Non-GAAP basic and diluted net loss per share for Q4 2019 was $0.10, compared to $0.24 in Q4 2018.
Full-year 2019 net loss was $52 million, or $0.75 loss per basic and diluted share, compared to $31 million, or $1.27 net loss per basic and diluted share in 2018. Non-GAAP basic and diluted net loss per share for full-year 2019 was $0.52, compared to $1.08 last year. For a reconciliation of non-GAAP financial measures to their corresponding GAAP measures, please refer to the reconciliation table at the end of this letter.
Balance Sheet, Capital Expenditures, and Cash Flow
We ended Q4 2019 with $201 million in cash, restricted cash, and investments. Cash used in operations was $3 million in the quarter. Capital expenditures, or cash used for purchases of property and equipment and capitalized internal-use software, were $6 million in Q4 2019, representing 10% of total revenue in Q4 2019. Free Cash Flow was ($9) million in Q4 2019.
Net cash used in operations was $31 million for the full year 2019, compared to $17 million last year. Capital expenditures, or cash used for purchases of property and equipment and capitalized internal- use software, in 2019 totaled $19 million, representing 10% of total revenue. For additional context, please refer to the free cash flow table at the end of this letter. |
| Q1 and Full-Year 2020 Business Outlook
We continue to see strong growth in our business. Our 2020 outlook reflects continued investment,
balanced
| ||||
| Q1 2020 | Full Year 2020 | |||
| Total Revenue |
$58 - $60 million | $255 - $265 million | ||
|
|
| |||
| Non-GAAP Operating Loss |
($13) - ($11) million | ($43) - ($33) million | ||
|
|
| |||
| Non-GAAP Net Loss Per Share 1,2 |
($0.13) - ($0.11) | ($0.43) - ($0.32) | ||
|
|
| |||
1 Assumes weighted average basic shares outstanding of 95.1 million in Q1 2020 and 96.7 million for the full year 2020.
2 Non-GAAP Net Loss per share calculation is full-year Non-GAAP Net Loss divided by weighted average basic shares for the full-year.
As previously mentioned, our gross margin is impacted by the timing of personnel and infrastructure investments as well the seasonal ramp of usage and requests by customers on our platform. Please note that Q4 2019 gross margin included revenue from multiple large, annual one-time live events that will not carry into Q1 2020. That being said, we remain confident in our ability to deliver incremental annual gross margin expansion.
Additionally, as we continue to invest in the business in 2020 through global network and office expansion, we expect capital expenditures as a percentage of revenue to be approximately 13% to 14% of revenue — similar to full-year 2018. Long-term, we expect capital expenditures to approach 10% of revenue on a calendar year basis.
A reconciliation of non-GAAP guidance measures to corresponding GAAP measures for our Q1 and Full Year 2020 Business Outlook is not available on a forward-looking basis without unreasonable effort due to the uncertainty regarding, and the potential variability of, many of these costs and expenses that may be incurred in the future. We have provided a reconciliation of GAAP to non-GAAP financial measures for Q4 2019 in the reconciliation table at the end of this letter.
| Quarterly Conference Call
We will host a live Q&A session at 2:00 p.m. PT / 5:00 p.m. ET on Thursday, February 20, 2020 to discuss these financial results. To participate in the live call, please dial (866) 211-4110 (U.S. / Canada) or (647) 689-6608 (international) and provide conference ID 9872879. A live webcast of the call will be available at https://investors.fastly. com and will be archived on our site following the call.
As we begin 2020, we are extremely encouraged by our results and the growth ahead, which will fuel our pursuit of a more trustworthy internet. We are inspired by the hard work and dedication of all our employees, and the continued support from our customers, partners, and shareholders. They are the backbone of Fastly, and with them we are building an ecosystem of which we can all be proud. As we continue to build a secure, programmable, and reliable edge cloud platform for tomorrow’s internet, Fastly is well-positioned to leverage new opportunities and deliver long-term value. We are excited to be on the journey together.
Thank you for taking the time to read our letter, and we look forward to your questions on our call this afternoon.
Sincerely,
Artur Bergman Chief Architect and Executive Chairperson |
Forward-Looking Statements
This letter to shareholders contains forward-looking statements within the meaning of Section 27A of the Securities Act of 1933, as amended (the “Securities Act”), and Section 21E of the Securities Exchange Act of 1934, as amended, about us and our industry that involve substantial risks and uncertainties. Forward-looking statements generally relate to future events or Fastly’s future financial or operating performance. In some cases, you can identify forward-looking statements because they contain words such as “may,” “will,” “should,” “expects,” “plans,” “anticipates,” “going to,” “could,” “intends,” “target,” “projects,” “contemplates,” “believes,” “estimates,” “predicts,” “potential,” or “continue,” or the negative of these words or other similar terms or expressions that concern Fastly’s expectations, strategy, priorities, plans, or intentions. Forward-looking statements in this letter to shareholders include, but are not limited to, statements regarding Fastly’s future financial and operating performance, including its outlook and guidance; Fastly’s strategies, product and business plans, including its ability to scale; statements regarding Fastly’s investments in revenue, marketing and demand generation, and the impact of such investments on its business; statements regarding the performance of Fastly’s platform; and Fastly’s expectations regarding the expansion of its customer base, including anticipated enterprise customer deals, and the growth and usage of its customers. Fastly’s expectations and beliefs regarding these matters may not materialize, and actual results in future periods are subject to risks and uncertainties that could cause actual results to differ materially from those projected. These risks include the possibility that: Fastly is unable to attract and retain customers; Fastly’s existing customers and partners do not maintain or increase usage of Fastly’s platform; Fastly’s platform and product features do not meet expectations, including due to interruptions, security breaches, delays in performance or other similar problems; Fastly is unable to adapt to meet evolving market and customer demands and rapid technological change; Fastly is unable to comply with modified or new industry standards, laws and regulations; Fastly is unable to generate sufficient revenues to achieve or sustain profitability; Fastly’s limited operating history makes it difficult to evaluate its prospects and future operating results; Fastly is unable to effectively manage its growth; and Fastly is unable to compete effectively. The forward-looking statements contained in this shareholder letter are also subject to other risks and uncertainties, including those more fully described in Fastly’s Quarterly Report on Form 10-Q for the quarter ended September 30, 2019. Additional information will also be set forth in Fastly’s Annual Report on Form 10-K for the year ended December 31, 2019 and other filings and reports that we may file from time to time with the SEC. The forward-looking statements in this letter to shareholders are based on information available to Fastly as of the date hereof, and Fastly disclaims any obligation to update any forward-looking statements, except as required by law.
Non-GAAP Financial Measures:
To supplement our condensed consolidated financial statements, which are prepared and presented in accordance with accounting principles generally accepted in the United States (“GAAP”), the Company uses the following non-GAAP measures of financial performance: non-GAAP gross profit, non-GAAP net loss, non-GAAP basic and diluted net loss per common share, non-GAAP research and development, non- GAAP sales and marketing, non-GAAP general and administrative, and adjusted EBITDA. The presentation of this additional financial information is not intended to be considered in isolation from, as a substitute for, or superior to, the financial information prepared and presented in accordance with GAAP. These non- GAAP measures have limitations in that they do not reflect all of the amounts associated with our results of operations as determined in accordance with GAAP. In addition, these non-GAAP financial measures may be different from the non-GAAP financial measures used by other companies. These non-GAAP measures should only be used to evaluate our results of operations in conjunction with the corresponding GAAP measures. Management compensates for these limitations by reconciling these non-GAAP financial measures to the most comparable GAAP financial measures within our earnings releases.
Non-GAAP gross profit, non-GAAP research and development, non-GAAP sales and marketing, and non- GAAP general and administrative differ from GAAP in that they exclude stock-based compensation expense. Non-GAAP net loss and non-GAAP basic and diluted net loss per common share differ from GAAP in that they exclude stock-based compensation expense, interest expense related to the acceleration of deferred debt issuance costs due to the early repayment of debt, and other expense related to the mark-to-market of our convertible preferred warrant liability immediately prior to our initial public offering (“IPO”).
Adjusted EBITDA: Adjusted EBITDA excludes stock-based compensation expense, depreciation and amortization expense, interest income, interest expense, other expense, net, and income taxes.
Capital Expenditures: cash used for purchases of property and equipment and capitalized internal-use software, as reflected in our statement of cash flow.
Depreciation and Amortization Expense: consists of non-cash charges that can be affected by the timing and magnitude of asset purchases. Depreciation and amortization expense is included in the following cost and expense line items of our GAAP presentation: cost of revenue, research and development, sales and marketing, and general and administrative. Management considers its operating results without amortization expense when evaluating its ongoing non-GAAP performance and without depreciation and amortization expense when evaluating its ongoing adjusted EBITDA performance because these charges are non-cash expenses that can be affected by the timing and magnitude of asset purchases and may not be reflective of our core business, ongoing operating results, or future outlook.
Free Cash Flow: calculated as net cash used in operating activities less capital expenditures.
Interest Expense: consists primarily of interest expense related to our debt instruments. Management considers its operating results without interest expense associated with the acceleration of deferred debt issuance costs associated with early repayment of debt when evaluating its ongoing non-GAAP performance and without total interest expense when evaluating its ongoing adjusted EBITDA performance because it is not believed by management to be reflective of our core business, ongoing operating results or future outlook.
Interest Income: consists primarily of interest income related to our marketable securities. Management considers its adjusted EBITDA results without this activity when evaluating its ongoing performance because it is not believed by management to be reflective of our core business, ongoing operating results or future outlook.
Income Taxes: consists of expense recognized related to state and foreign income taxes. Management considers its adjusted EBITDA results without these charges when evaluating its ongoing performance because it is not believed by management to be reflective of our core business, ongoing operating results or future outlook.
Non-GAAP Operating Loss: calculated as GAAP revenue less non-GAAP cost of revenue and non-GAAP operating expenses.
Other Expense, Net: consists primarily of other expense related to mark-to-market adjustments of our convertible preferred stock warrant liabilities. Upon the closing of the IPO, the warrants to purchase shares of preferred stock were converted into warrants to purchase shares of our common stock. As a result, the warrant liability was remeasured a final time immediately prior to the IPO and reclassified to additional paid in capital within stockholders’ deficit. Management considers its operating results without other expense associated with the mark-to-market adjustments included in other expense, net, when evaluating its ongoing non-GAAP performance and without total other expense, net when evaluating its ongoing adjusted EBITDA performance because it is not believed by management to be reflective of our core business, ongoing operating results or future outlook.
Stock-based Compensation Expense: consists of expenses for stock options, restricted stock units, and Employee Stock Purchase Plan (“ESPP”) under our equity incentive plans. Stock-based compensation is included in the following cost and expense line items of our GAAP presentation: cost of revenue, research and development, sales and marketing, and general and administrative.
Although stock-based compensation is an expense for the Company and is viewed as a form of compensation, management excludes stock-based compensation from our non-GAAP measures and adjusted EBITDA results for purposes of evaluating our continuing operating performance primarily because it is a non-cash expense not believed by management to be reflective of our core business, ongoing operating results, or future outlook. In addition, the value of stock-based instruments is determined using formulas that incorporate variables, such as market volatility, that are beyond our control.
Management believes these non-GAAP financial measures and adjusted EBITDA serve as useful metrics for our management and investors because they enable a better understanding of the long-term performance of our core business and facilitate comparisons of our operating results over multiple periods and to those of peer companies, and when taken together with the corresponding GAAP financial measures and our reconciliations, enhance investors’ overall understanding of our current financial performance.
In the financial tables below, the Company provides a reconciliation of the most comparable GAAP financial measure to the historical non-GAAP financial measures used in this shareholder letter.
Condensed Consolidated Statements of Operations
(in thousands, except per share amounts, unaudited)
| Three months ended | Year ended | |||||||||||||||
| December 31, | December 31, | |||||||||||||||
| 2019 | 2018 | 2019 | 2018 | |||||||||||||
| Revenue |
$ | 58,936 | $ | 40,797 | $ | 200,462 | $ | 144,563 | ||||||||
| Cost of revenue(1) |
25,528 | 17,709 | 88,322 | 65,499 | ||||||||||||
|
|
|
|
|
|
|
|
|
|||||||||
| Gross profit |
33,408 | 23,088 | 112,140 | 79,064 | ||||||||||||
|
|
|
|
|
|
|
|
|
|||||||||
| Operating expenses: |
||||||||||||||||
| Research and development(1) |
12,951 | 9,307 | 46,492 | 34,618 | ||||||||||||
| Sales and marketing(1) |
21,592 | 13,487 | 71,097 | 50,134 | ||||||||||||
| General and administrative(1) |
12,896 | 7,353 | 41,099 | 23,450 | ||||||||||||
|
|
|
|
|
|
|
|
|
|||||||||
| Total operating expenses |
47,439 | 30,147 | 158,688 | 108,202 | ||||||||||||
|
|
|
|
|
|
|
|
|
|||||||||
| Loss from operations |
(14,031 | ) | (7,059 | ) | (46,548 | ) | (29,138 | ) | ||||||||
| Interest income |
856 | 362 | 3,287 | 939 | ||||||||||||
| Interest expense |
(391 | ) | (591 | ) | (5,236 | ) | (1,810 | ) | ||||||||
| Other income (expense), net |
(198 | ) | 23 | (2,561 | ) | (741 | ) | |||||||||
|
|
|
|
|
|
|
|
|
|||||||||
| Loss before income taxes |
(13,764 | ) | (7,265 | ) | (51,058 | ) | (30,750 | ) | ||||||||
| Income taxes |
309 | 41 | 492 | 185 | ||||||||||||
|
|
|
|
|
|
|
|
|
|||||||||
| Net loss |
$ | (14,073 | ) | $ | (7,306 | ) | $ | (51,550 | ) | $ | (30,935 | ) | ||||
|
|
|
|
|
|
|
|
|
|||||||||
| Net loss per share attributable to common stockholders, basic and diluted |
$ | (0.15 | ) | $ | (0.29 | ) | $ | (0.75 | ) | $ | (1.27 | ) | ||||
|
|
|
|
|
|
|
|
|
|||||||||
| Weighted-average shares used in computing net loss per share attributable to common stockholders, basic and diluted |
94,045 | 24,784 | 68,350 | 24,376 | ||||||||||||
|
|
|
|
|
|
|
|
|
|||||||||
(1) Includes stock-based compensation expense as follows:
| Three months ended | Year ended | |||||||||||||||
| December 31, | December 31, | |||||||||||||||
| 2019 | 2018 | 2019 | 2018 | |||||||||||||
| Cost of revenue |
$ | 535 | $ | 87 | $ | 1,410 | $ | 265 | ||||||||
| Research and development |
806 | 425 | 2,920 | 1,332 | ||||||||||||
| Sales and marketing |
1,603 | 330 | 3,497 | 1,023 | ||||||||||||
| General and administrative |
1,651 | 438 | 4,318 | 1,459 | ||||||||||||
|
|
|
|
|
|
|
|
|
|||||||||
| Total |
$ | 4,595 | $ | 1,280 | $ | 12,145 | $ | 4,079 | ||||||||
|
|
|
|
|
|
|
|
|
|||||||||
Condensed Consolidated Balance Sheets
(in thousands, unaudited)
| As of December 31, |
As of December 31, |
|||||||
| 2019 | 2018 | |||||||
| Assets |
||||||||
| Current assets: |
||||||||
| Cash and cash equivalents |
$ | 16,142 | $ | 36,963 | ||||
| Marketable securities |
114,967 | 46,679 | ||||||
| Accounts receivable, net |
37,136 | 24,729 | ||||||
| Restricted cash |
70,087 | — | ||||||
| Prepaid expenses and other current assets |
13,503 | 8,896 | ||||||
|
|
|
|
|
|||||
| Total current assets |
251,835 | 117,267 | ||||||
| Property and equipment, net |
60,037 | 42,354 | ||||||
| Goodwill |
372 | 360 | ||||||
| Intangible assets, net |
1,125 | 610 | ||||||
| Other assets |
13,680 | 2,163 | ||||||
|
|
|
|
|
|||||
| Total assets |
$ | 327,049 | $ | 162,754 | ||||
|
|
|
|
|
|||||
| Liabilities, Convertible Preferred Stock and Stockholders’ Equity (Deficit) |
||||||||
| Current liabilities: |
||||||||
| Accounts payable |
$ | 4,602 | $ | 2,333 | ||||
| Accrued expenses |
19,878 | 15,535 | ||||||
| Current portion of long-term debt |
4,472 | 11,370 | ||||||
| Other current liabilities |
8,169 | 2,512 | ||||||
|
|
|
|
|
|||||
| Total current liabilities |
37,121 | 31,750 | ||||||
| Long-term debt, less current portion |
25,158 | 39,439 | ||||||
| Convertible preferred stock warrant liabilities |
— | 3,261 | ||||||
| Other long-term liabilities |
7,118 | 647 | ||||||
|
|
|
|
|
|||||
| Total liabilities |
69,397 | 75,097 | ||||||
| Convertible preferred stock |
— | 219,584 | ||||||
|
|
|
|
|
|||||
| Stockholders’ equity (deficit): |
||||||||
| Class A and Class B common stock |
2 | 1 | ||||||
| Additional paid-in capital |
449,463 | 16,403 | ||||||
| Treasury stock |
— | (2,109 | ) | |||||
| Accumulated other comprehensive income |
196 | (36 | ) | |||||
| Accumulated deficit |
(192,009 | ) | (146,186 | ) | ||||
|
|
|
|
|
|||||
| Total stockholders’ equity (deficit) |
257,652 | (131,927 | ) | |||||
|
|
|
|
|
|||||
| Total liabilities, convertible preferred stock and stockholders’ equity (deficit) |
$ | 327,049 | $ | 162,754 | ||||
|
|
|
|
|
|||||
Condensed Consolidated Statements of Cash Flows
(in thousands, unaudited)
| Year ended December 31, |
||||||||
| 2019 | 2018 | |||||||
| Cash flows from operating activities: |
||||||||
| Net loss |
$ | (51,550 | ) | $ | (30,935 | ) | ||
| Adjustments to reconcile net loss to net cash used in operating activities: |
||||||||
| Depreciation and amortization |
16,553 | 13,400 | ||||||
| Amortization of deferred rent |
5,369 | (340 | ) | |||||
| Amortization of debt issuance costs |
1,909 | — | ||||||
| Stock-based compensation |
12,145 | 4,079 | ||||||
| Provision for doubtful accounts |
360 | 599 | ||||||
| Change in fair value of preferred stock warrant liabilities |
2,404 | 606 | ||||||
| Interest paid on capital leases |
(364 | ) | (203 | ) | ||||
| Loss on disposal of property and equipment |
108 | — | ||||||
| Other adjustments |
(591 | ) | (354 | ) | ||||
| Changes in operating assets and liabilities: |
||||||||
| Accounts receivable |
(12,767 | ) | (6,234 | ) | ||||
| Prepaid expenses and other current assets |
(4,607 | ) | (2,325 | ) | ||||
| Other assets |
(5,790 | ) | 10 | |||||
| Accounts payable |
2,391 | (372 | ) | |||||
| Accrued expenses |
4,401 | 3,902 | ||||||
| Other liabilities |
(1,274 | ) | 1,182 | |||||
|
|
|
|
|
|||||
| Net cash used in operating activities |
(31,303 | ) | (16,985 | ) | ||||
|
|
|
|
|
|||||
| Cash flows from investing activities: |
||||||||
| Purchase of marketable securities |
(190,980 | ) | (62,660 | ) | ||||
| Sale of marketable securities |
52,589 | — | ||||||
| Maturities of marketable securities |
70,813 | 35,210 | ||||||
| Purchases of property and equipment |
(14,609 | ) | (16,702 | ) | ||||
| Capitalized internal-use software |
(4,856 | ) | (2,955 | ) | ||||
| Purchases of intangible assets |
(635 | ) | — | |||||
|
|
|
|
|
|||||
| Net cash used in investing activities |
(87,678 | ) | (47,107 | ) | ||||
|
|
|
|
|
|||||
| Cash flows from financing activities: |
||||||||
| Proceeds from initial public offering, net of underwriting discounts |
192,510 | — | ||||||
| Payments of costs related to initial public offering |
(5,469 | ) | — | |||||
| Proceeds from borrowings under notes payable |
20,300 | 29,411 | ||||||
| Payments of debt issuance costs |
(231 | ) | (257 | ) | ||||
| Repayments of notes payable |
(49,167 | ) | (833 | ) | ||||
| Repayments of capital leases |
(1,370 | ) | (1,215 | ) | ||||
| Proceeds from Series F financing |
— | 40,000 | ||||||
| Series Fissuance costs |
— | (121 | ) | |||||
| Proceeds from Employee Stock Purchase Plan |
5,402 | — | ||||||
| Proceeds from exercise of vested stock options |
5,579 | 1,561 | ||||||
| Proceeds from early exercise of stock options |
520 | 1,054 | ||||||
| Proceeds from payment of stockholder note |
74 | 50 | ||||||
| Repurchase of early exercised shares |
— | (13 | ) | |||||
|
|
|
|
|
|||||
| Net cash (used in) provided by financing activities |
168,148 | 69,637 | ||||||
|
|
|
|
|
|||||
| Effects of exchange rate changes on cash, cash equivalents, and restricted cash |
99 | 22 | ||||||
|
|
|
|
|
|||||
| Net increase in cash, cash equivalents, and restricted cash |
49,266 | 5,567 | ||||||
| Cash, cash equivalents, and restricted cash at beginning of period |
36,963 | 31,396 | ||||||
|
|
|
|
|
|||||
| Cash, cash equivalents, and restricted cash at end of period |
$ | 86,229 | $ | 36,963 | ||||
|
|
|
|
|
|||||
Condensed Consolidated Statements of Cash Flows—Continued
(in thousands, unaudited)
| Year ended December 31, |
||||||||
| 2019 | 2018 | |||||||
| Reconciliation of cash, cash equivalents, and restricted cash as shown in the statements of cash flows |
||||||||
| Cash and cash equivalents |
$ | 16,142 | $ | 36,963 | ||||
| Restricted cash included in prepaid and other current assets line item of Condensed Consolidated Balance Sheets |
70,087 | — | ||||||
|
|
|
|
|
|||||
| Total cash, cash equivalents, and restricted cash |
$ | 86,229 | $ | 36,963 | ||||
|
|
|
|
|
|||||
Free Cash Flow
(in thousands, unaudited)
| Quarter ended | Year ended 2018 |
Quarter ended | Year ended 2019 |
|||||||||||||||||||||||||||||||||||||
| Q1 | Q2 | Q3 | Q4 | Q1 | Q2 | Q3 | Q4 | |||||||||||||||||||||||||||||||||
| 2018 | 2018 | 2018 | 2018 | 2019 | 2019 | 2019 | 2019 | |||||||||||||||||||||||||||||||||
| Cash flow used in operations |
$ | (5,330 | ) | $ | (7,254 | ) | $ | (3,615 | ) | $ | (786 | ) | $ | (16,985 | ) | $ | (10,083 | ) | $ | (5,565 | ) | $ | (12,595 | ) | $ | (3,060 | ) | $ | (31,303 | ) | ||||||||||
| Capital (1) |
||||||||||||||||||||||||||||||||||||||||
| expenditures |
(4,845 | ) | (4,989 | ) | (2,494 | ) | (7,329 | ) | (19,657 | ) | (4,784 | ) | (4,445 | ) | (4,389 | ) | (5,847 | ) | (19,465 | ) | ||||||||||||||||||||
|
|
|
|
|
|
|
|
|
|
|
|
|
|
|
|
|
|
|
|
|
|||||||||||||||||||||
| Free Cash Flow |
$ | (10,175 | ) | $ | (12,243 | ) | $ | (6,109 | ) | $ | (8,115 | ) | $ | (36,642 | ) | $ | (14,867 | ) | $ | (10,010 | ) | $ | (16,984 | ) | $ | (8,907 | ) | $ | (50,768 | ) | ||||||||||
|
|
|
|
|
|
|
|
|
|
|
|
|
|
|
|
|
|
|
|
|
|||||||||||||||||||||
| (1) | Capital expenditures are defined as cash used for purchases of property and equipment and capitalized internal-use software, as reflected in our statements of cash flows. |
Reconciliation of GAAP to Non-GAAP Financial Measures
(in thousands, unaudited)
| Three months ended | Year ended | |||||||||||||||
| December 31, | December 31, | |||||||||||||||
| 2019 | 2018 | 2019 | 2018 | |||||||||||||
| Gross Profit |
||||||||||||||||
| GAAP gross Profit |
$ | 33,408 | $ | 23,088 | $ | 112,140 | $ | 79,064 | ||||||||
| Stock-based compensation—Cost of revenue |
535 | 87 | 1,410 | 265 | ||||||||||||
|
|
|
|
|
|
|
|
|
|
|
|
| |||||
| Non-GAAP gross profit |
$ | 33,943 | $ | 23,175 | $ | 113,550 | $ | 79,329 | ||||||||
|
|
|
|
|
|
|
|
|
|
|
|
| |||||
| Non-GAAP gross margin |
57.6 | % | 56.8 | % | 56.6 | % | 54.9 | % | ||||||||
| Research and development |
||||||||||||||||
| GAAP research and development |
$ | 12,951 | $ | 9,307 | $ | 46,492 | $ | 34,618 | ||||||||
| Stock-based compensation |
(806 | ) | (425 | ) | (2,920 | ) | (1,332 | ) | ||||||||
|
|
|
|
|
|
|
|
|
|
|
|
| |||||
| Non-GAAP research and development |
$ | 12,145 | $ | 8,882 | $ | 43,572 | $ | 33,286 | ||||||||
|
|
|
|
|
|
|
|
|
|
|
|
| |||||
| Sales and marketing |
||||||||||||||||
| GAAP sales and marketing |
$ | 21,592 | $ | 13,487 | $ | 71,097 | $ | 50,134 | ||||||||
| Stock-based compensation |
(1,603 | ) | (330 | ) | (3,497 | ) | (1,023 | ) | ||||||||
|
|
|
|
|
|
|
|
|
|
|
|
| |||||
| Non-GAAP sales and marketing |
$ | 19,989 | $ | 13,157 | $ | 67,600 | $ | 49,111 | ||||||||
|
|
|
|
|
|
|
|
|
|
|
|
| |||||
| General and administrative |
||||||||||||||||
| GAAP general and administrative |
$ | 12,896 | $ | 7,353 | $ | 41,099 | $ | 23,450 | ||||||||
| Stock-based compensation |
(1,651 | ) | (438 | ) | (4,318 | ) | (1,459 | ) | ||||||||
|
|
|
|
|
|
|
|
|
|
|
|
| |||||
| Non-GAAP general and administrative |
$ | 11,245 | $ | 6,915 | $ | 36,781 | $ | 21,991 | ||||||||
|
|
|
|
|
|
|
|
|
|
|
|
| |||||
| Operating loss |
||||||||||||||||
| GAAP operating loss |
$ | (14,031 | ) | $ | (7,059 | ) | $ | (46,548 | ) | $ | (29,138 | ) | ||||
| Stock-based compensation |
4,595 | 1,280 | 12,145 | 4,079 | ||||||||||||
|
|
|
|
|
|
|
|
|
|
|
|
| |||||
| Non-GAAP operating loss |
$ | (9,436 | ) | $ | (5,779 | ) | $ | (34,403 | ) | $ | (25,059 | ) | ||||
|
|
|
|
|
|
|
|
|
|
|
|
| |||||
| Net loss |
||||||||||||||||
| GAAP net loss |
$ | (14,073 | ) | $ | (7,306 | ) | $ | (51,550 | ) | $ | (30,935 | ) | ||||
| Stock-based compensation |
4,595 | 1,280 | 12,145 | 4,079 | ||||||||||||
| Interest expense—acceleration of deferred debt costs due to early repayment |
— | — | 1,785 | — | ||||||||||||
| Other expense—mark-to-market warrant liability |
— | 57 | 2,404 | 606 | ||||||||||||
|
|
|
|
|
|
|
|
|
|
|
|
| |||||
| Non-GAAP net loss |
$ | (9,478 | ) | $ | (5,969 | ) | $ | (35,216 | ) | $ | (26,250 | ) | ||||
|
|
|
|
|
|
|
|
|
|
|
|
| |||||
| Non-GAAP net loss per common share—basic and diluted |
$ | (0.10 | ) | $ | (0.24 | ) | $ | (0.52 | ) | $ | (1.08 | ) | ||||
| Weighted average basic and diluted common shares |
94,045 | 24,784 | 68,350 | 24,376 | ||||||||||||
| Adjusted EBITDA |
||||||||||||||||
| GAAP net loss |
$ | (14,073 | ) | $ | (7,306 | ) | $ | (51,550 | ) | $ | (30,935 | ) | ||||
| Stock-based compensation |
4,595 | 1,280 | 12,145 | 4,079 | ||||||||||||
| Depreciation and amortization |
4,860 | 3,682 | 16,553 | 13,400 | ||||||||||||
| Interest income |
(856 | ) | (362 | ) | (3,287 | ) | (939 | ) | ||||||||
| Interest expense |
391 | 591 | 5,236 | 1,810 | ||||||||||||
| Other (income) expense, net |
198 | (23 | ) | 2,561 | 741 | |||||||||||
| Income taxes |
309 | 41 | 492 | 185 | ||||||||||||
|
|
|
|
|
|
|
|
|
|
|
|
| |||||
| Adjusted EBITDA |
$ | (4,576 | ) | $ | (2,097 | ) | $ | (17,850 | ) | $ | (11,659 | ) | ||||
|
|
|
|
|
|
|
|
|
|
|
|
| |||||