Exihibit 99.1
Great Elm Group, Inc. Reports FISCAL 2021 THIRD quarter financial resulTs
Company to Host Conference Call at 4:30 PM ET Today
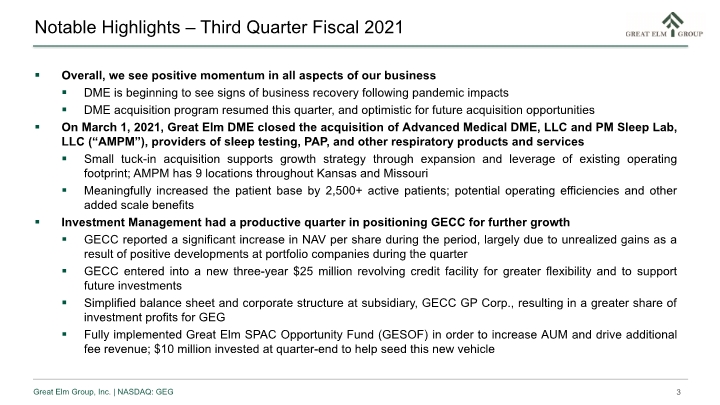
WALTHAM, Mass., May 14, 2021 -- Great Elm Group, Inc. (“we,” “us,” “our,” “GEG,” or “Great Elm”) (NASDAQ: GEG), a diversified holding company, today announced financial results for its fiscal 2021 third quarter ended March 31, 2021.
Fiscal 2021 Third Quarter Highlights
(all comparisons versus the prior-year period unless otherwise noted)
Consolidated:
|
|
• |
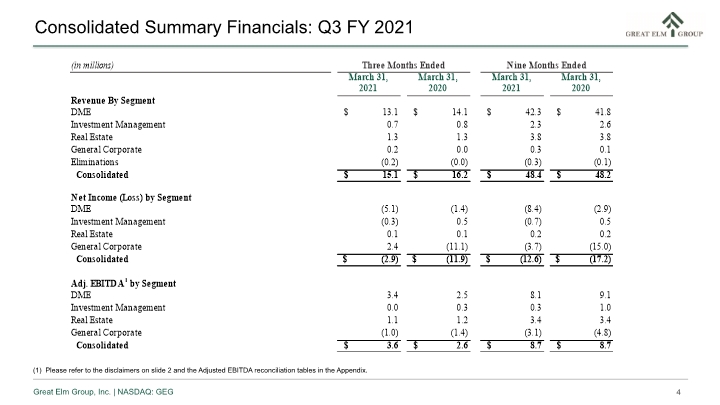
Consolidated revenue was $15.1 million, compared to $16.2 million |
|
|
• |
Consolidated net loss was $2.9 million, compared to net loss of $11.9 million |
|
|
• |
Consolidated Adjusted EBITDA was $3.6 million, compared to $2.6 million |
Operating Companies:
|
|
• |
DME reported total revenue of $13.1 million, compared to $14.1 million |
|
|
• |
DME reported net loss of $5.1 million, compared to net loss of $1.4 million |
|
|
• |
DME reported Adjusted EBITDA of $3.4 million, compared to $2.5 million |
|
|
• |
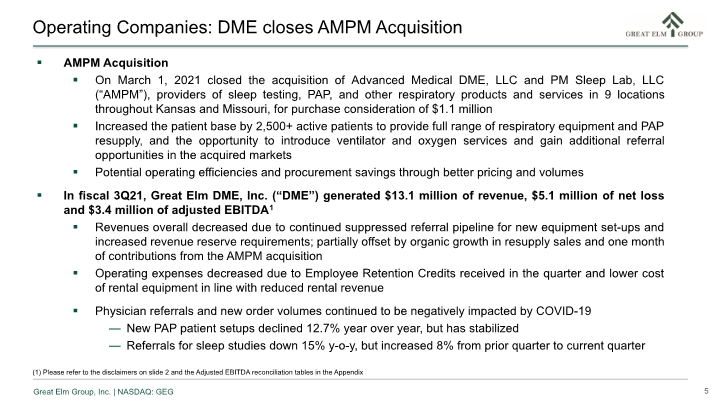
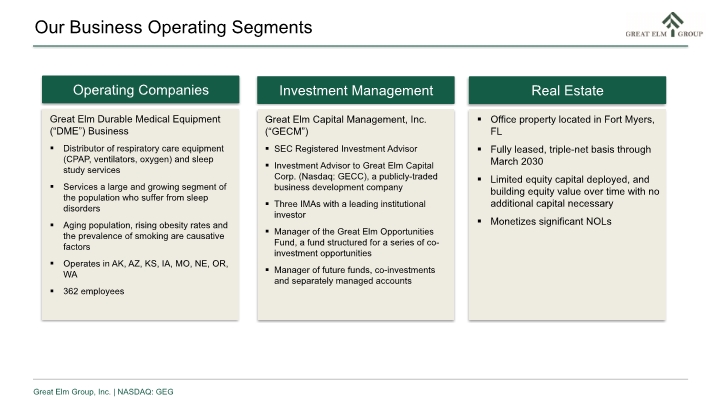
On March 1, 2021, the Company announced the acquisition of Advanced Medical DME, LLC and PM Sleep Lab, LLC (“AMPM”), providers of sleep testing, PAP, and other respiratory products and services in 9 locations throughout Kansas and Missouri. |
Investment Management (“IM”):
|
|
• |
IM reported revenue of $0.7 million, compared to $0.8 million |
|
|
• |
IM reported net loss of $0.3 million, compared to net income of $0.5 million |
|
|
• |
Increased ownership of GECC GP Corp, an investment management subsidiary, from 80.1% to approx. 98% |
|
|
• |
Subsequent to quarter-end, GECC entered into a three-year $25 million revolving credit facility to support its investment activities. |
Management Commentary
"Overall, we see positive momentum in all aspects of our business,” stated Peter A. Reed, Chief Executive Officer. “During the quarter, DME resumed its acquisition program and announced the AMPM acquisition, which strengthens DME’s presence in the Midwest and provides future organic growth potential through an expanded patient base and cross selling opportunities. We also anticipate the acquisition will drive margin improvement through operational efficiencies and other benefits of added scale. DME is beginning
to see signs of business recovery from the pandemic impacts as the country continues moving toward a full economic reopening. We are optimistic about the resumption of organic growth at DME and also the potential for future acquisitions.”
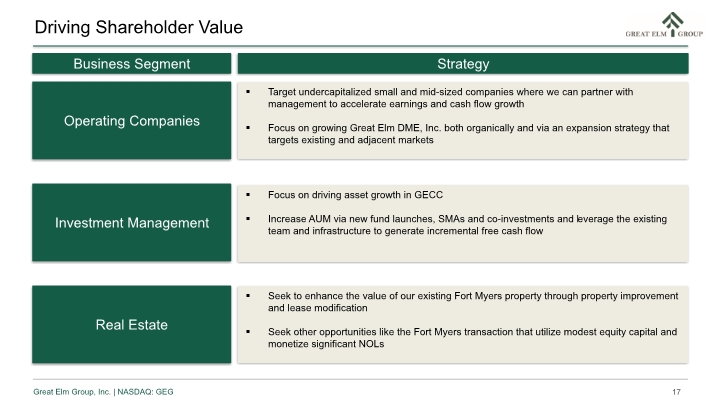
“Investment Management had a productive quarter in positioning GECC for further growth, and activity picked up mid-quarter with momentum accelerating through to quarter-end. We were pleased to simplify our balance sheet and corporate structure through previously announced transactions at one of our investment management subsidiaries, GECC GP Corp., resulting in a greater share of investment management profits for GEG. We anticipate further simplifying our balance sheet and corporate structure in the future. We are optimistic IM’s financial results will continue to improve and we see a robust pipeline of opportunities at GECC, particularly in the specialty finance sector. To that end, GECC recently entered into a $25 million revolving credit facility that will enhance its ability to participate in such opportunities.”
Alignment of Interest
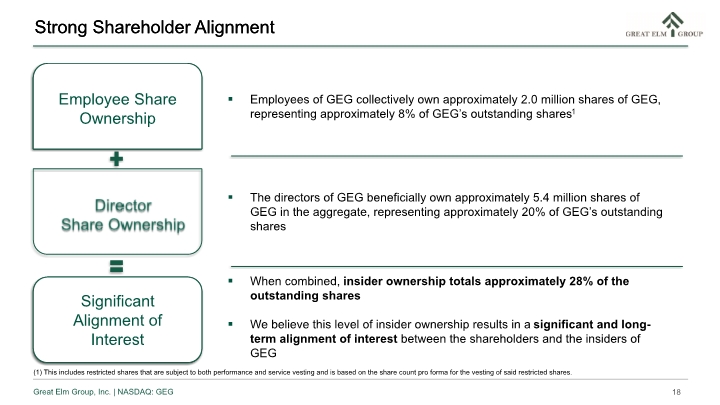
A distinct attribute of Great Elm is the particularly strong alignment of interest shared among shareholders and the employees, directors, and other insiders of Great Elm. As of March 31, 2021, employees and directors (including funds under their management) of Great Elm collectively own or manage 7.4 million shares, or approximately 28%, of Great Elm’s outstanding shares.
Discussion of Financial Results for the Quarter ended March 31, 2021
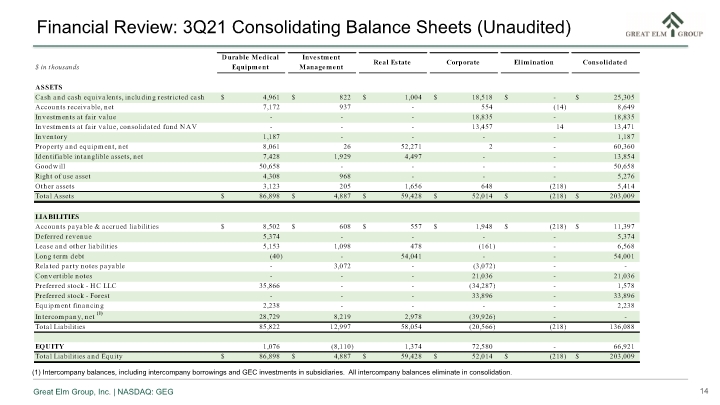
Great Elm has three operating segments: Durable Medical Equipment (DME), Investment Management (IM), Real Estate with general corporate representing unallocated costs and activity to arrive at consolidated operations.
Durable Medical Equipment
During the three months ended March 31, 2021, Great Elm’s DME operations recognized $13.1 million in total revenue, compared to $14.1 million during the same period last year. The decrease in revenues was due to the continued suppressed referral pipeline for new equipment set-ups and increased revenue reserve constraints, partially offset by organic growth in resupply sales and one month of contributions from the AMPM acquisition. The demand for sleep studies continues to be soft due to the ongoing impact from the COVID-19 pandemic, and referrals for new equipment set-ups declined as they are generally driven by in-house or external sleep studies.
Great Elm’s DME operations reported net loss of $5.1 million for the fiscal 2021 third quarter compared to net loss of $1.4 million in the prior-year period. Net loss was primarily impacted by a $4.8 million charge related to a fair value adjustment recorded in connection with the preferred stock issued to a subsidiary (Forest Investments, Inc.), with an offsetting impact to General Corporate and eliminated in consolidation.
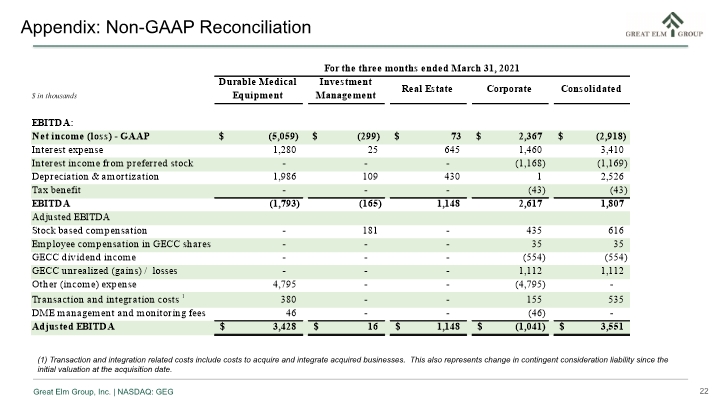
Adjusted EBITDA, a non-GAAP measure, was $3.4 million in the fiscal 2021 third quarter, compared to $2.5 million in the prior-year period. The increase is primarily related to $2.3 million in Employee Retention Credits claimed during the quarter under the enhanced CARES Act, significantly offsetting operating expenses.
-2-
Investment Management
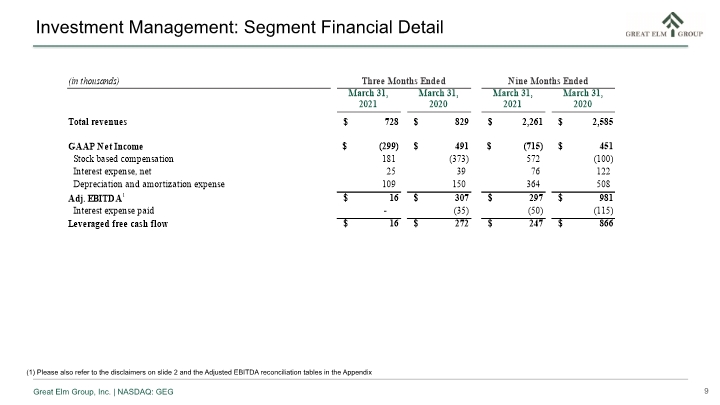
During the three months ended March 31, 2021, Great Elm’s Investment Management business recognized total investment management revenue of $0.7 million, compared to $0.8 million during the same period in the prior year. Revenue was slightly lower due to decreases in the average assets on which such fees are calculated as a result of the impact of COVID-19 on the portfolio.
Great Elm recognized a net loss of $0.3 million compared to net income of $0.5 million during the same period in the prior year. Adjusted EBITDA was $16 thousand in the fiscal 2021 third quarter, compared to $0.3 million during the same period in the prior year. Adjusted EBITDA was impacted primarily by an increase in allocated payroll costs and consulting fees. We invested $10 million in Great Elm SPAC Opportunity Fund (GESOF) to help seed this vehicle, which we hope will contribute to increased assets under management for the investment management business and help drive additional fee revenue.
Real Estate
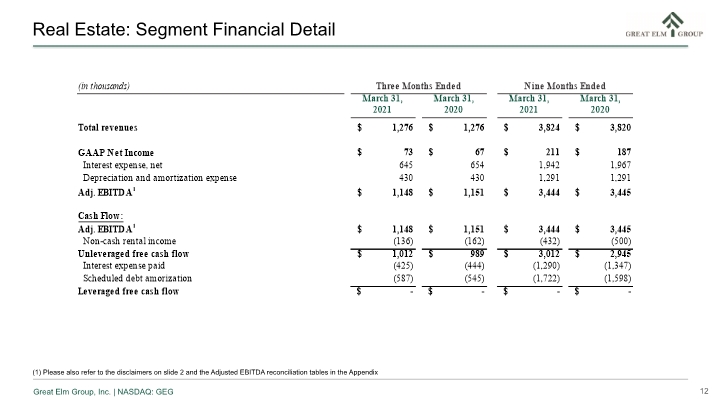
During the three months ended March 31, 2021, Great Elm’s real estate business recognized $1.3 million in rental revenue, $73 thousand in net income and Adjusted EBITDA of $1.1 million. During the same period last year, Great Elm recognized $1.3 million in rental revenue, $67 thousand in net income and Adjusted EBITDA of $1.2 million.
Our revenues, costs and expenses have generally remained consistent year over year, as real estate rental revenue consists of rents received from the two Class A office buildings in Fort Myers, Florida.
General Corporate
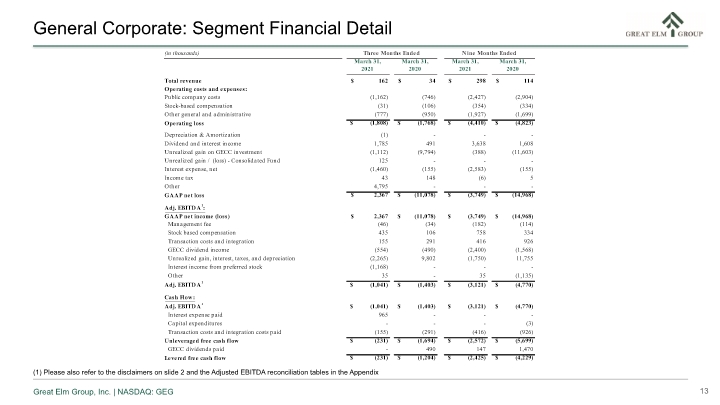
During the three months ended March 31, 2021, Great Elm’s general corporate segment recognized $0.2 million in revenue compared to $34 thousand in revenue during the same period in the prior year. Revenue increased slightly as a result of increased management fees earned from DME, along with management fees earned with Forest Investments, Inc.
Great Elm recognized $2.4 million in net income vs. net loss of $11.2 million during the same period in the prior year. The difference in net income was driven primarily by substantial net unrealized losses on Great Elm’s investment in GECC during the third quarter in 2020 compared to the net unrealized losses recognized during the third quarter in 2021. Dividend income was higher in the third quarter of 2021 due to a larger investment in GECC following stock distributions received and the Company’s participation in the GECC rights offering in October 2020. Additionally, General Corporate recognized a $4.8 million benefit related to a fair value adjustment recorded in connection with the preferred stock issued to a subsidiary (Forest Investments, Inc.), with an offsetting impact to DME and eliminated in consolidation.
Great Elm recognized $(1.0) million in Adjusted EBITDA compared to Adjusted EBITDA of $(1.4) million during the prior year period. Great Elm made significant progress on reducing its corporate overhead, driven by lower audit fees due to a change in auditors in the prior fiscal year. The Company also entered into a shared services arrangement with DME, which further reduced corporate overhead by $0.1 million. Great Elm intends to continue to focus on reducing its corporate overhead.
-3-
Fiscal 2021 Third Quarter Conference Call & Webcast Information
When:Friday, May 14, 2021, 4:30 p.m. Eastern Time (ET)
|
Call: |
All interested parties are invited to participate in the conference call by dialing +1 (844) 559-0750; international callers should dial +1 (647) 689-5386. Participants should enter the Conference ID 5634217 when asked. |
About Great Elm Group, Inc.
Great Elm Group, Inc. (NASDAQ: GEG) is a publicly-traded holding company that is building a business across two operating verticals: investment management and operating companies. Great Elm Group, Inc.’s website can be found at www.greatelmgroup.com.
Safe Harbor Statement under the Private Securities Litigation Reform Act of 1995
Statements in this press release that are “forward-looking” statements, including statements regarding revenue, Adjusted EBITDA, expected growth, profitability, acquisition opportunities and outlook involve risks and uncertainties that may individually or collectively impact the matters described herein. Investors are cautioned not to place undue reliance on any such forward-looking statements, which speak only as of the date they are made and represent Great Elm’s assumptions and expectations in light of currently available information. These statements involve risks, variables and uncertainties, and Great Elm’s actual performance results may differ from those projected, and any such differences may be material. For information on certain factors that could cause actual events or results to differ materially from Great Elm’s expectations, please see Great Elm’s filings with the SEC, including its most recent annual report on Form 10-K and subsequent reports on Forms 10-Q and 8-K. Additional information relating to Great Elm’s financial position and results of operations is also contained in Great Elm’s annual and quarterly reports filed with the SEC and available for download at its website www.greatelmgroup.com or at the SEC website www.sec.gov.
Non-GAAP Financial Measures
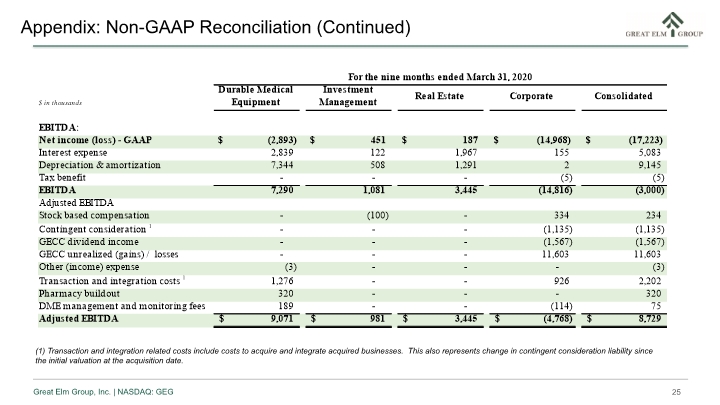
The SEC has adopted rules to regulate the use in filings with the SEC, and in public disclosures, of financial measures that are not in accordance with US GAAP, such as adjusted earnings before interest, taxes, depreciation and amortization (“Adjusted EBITDA”). Adjusted EBITDA is derived from methodologies other than in accordance with US GAAP. Great Elm believes that Adjusted EBITDA is an important measure for investors to use in evaluating Great Elm’s businesses. In addition, Great Elm’s management reviews Adjusted EBITDA as they evaluate acquisition opportunities.
Adjusted EBITDA has limitations as an analytical tool, and you should not consider it either in isolation from, or as a substitute for, analyzing Great Elm’s results as reported under US GAAP. Non-GAAP
-4-
financial measures reported by Great Elm may not be comparable to similarly titled amounts reported by other companies.
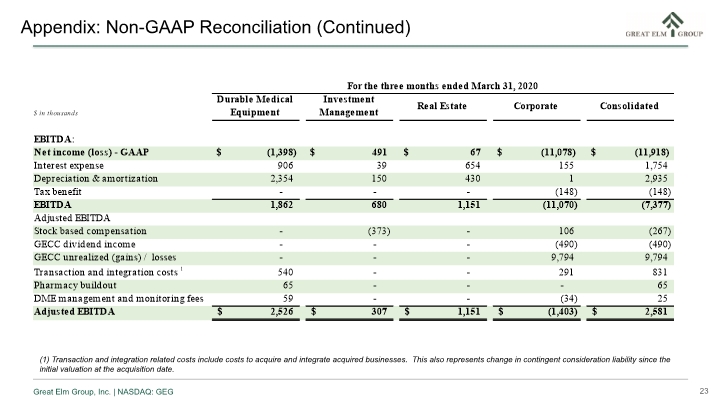
Set forth below is a reconciliation of Adjusted EBITDA to the most directly comparable US GAAP financial measure, net income.
Media & Investor Contact:
Investor Relations
+1 (617) 375-3006
Jeehae Linford
The Equity Group Inc.
+1 (212) 836-9615
-5-
Great Elm Group, Inc.
Condensed Consolidated Balance Sheets (Unaudited)
Dollar amounts in thousands (except per share data)
|
ASSETS |
|
March 31, 2021 |
|
|
June 30, 2020 |
|
||
|
Current assets: |
|
|
|
|
|
|
|
|
|
Cash and cash equivalents |
|
$ |
24,321 |
|
|
$ |
40,519 |
|
|
Restricted cash |
|
|
984 |
|
|
|
846 |
|
|
Accounts receivable |
|
|
7,172 |
|
|
|
7,991 |
|
|
Related party receivables |
|
|
1,477 |
|
|
|
1,059 |
|
|
Investments, at fair value (cost $41,100 and $30,279, respectively) |
|
|
18,835 |
|
|
|
8,705 |
|
|
Inventories |
|
|
1,187 |
|
|
|
1,470 |
|
|
Prepaid and other current assets |
|
|
3,589 |
|
|
|
738 |
|
|
|
|
|
|
|
|
|
|
|
|
Assets of consolidated funds |
|
|
|
|
|
|
|
|
|
Investments, at fair value (cost $25,661) |
|
|
25,625 |
|
|
|
- |
|
|
Prepaid expenses |
|
|
94 |
|
|
|
- |
|
|
Total current assets |
|
|
83,284 |
|
|
|
61,328 |
|
|
Real estate assets, net |
|
|
52,271 |
|
|
|
53,188 |
|
|
Property and equipment, net |
|
|
941 |
|
|
|
1,410 |
|
|
Equipment held for rental, net |
|
|
7,148 |
|
|
|
7,483 |
|
|
Identifiable intangible assets, net |
|
|
13,854 |
|
|
|
15,129 |
|
|
Goodwill |
|
|
50,658 |
|
|
|
50,010 |
|
|
Right of use assets |
|
|
5,276 |
|
|
|
5,392 |
|
|
Other assets |
|
|
1,825 |
|
|
|
1,505 |
|
|
Total assets |
|
$ |
215,257 |
|
|
$ |
195,445 |
|
|
LIABILITIES, NON-CONTROLLING INTEREST AND STOCKHOLDERS' EQUITY |
|
|
|
|
|
|
|
|
|
Current liabilities: |
|
|
|
|
|
|
|
|
|
Accounts payable |
|
$ |
5,779 |
|
|
$ |
5,007 |
|
|
Accrued expenses and other liabilities |
|
|
5,618 |
|
|
|
3,565 |
|
|
Deferred revenue |
|
|
5,374 |
|
|
|
5,652 |
|
|
Current portion of lease liabilities |
|
|
1,828 |
|
|
|
1,617 |
|
|
Current portion of long term debt |
|
|
2,460 |
|
|
|
6,221 |
|
|
Current portion of related party notes payable |
|
|
- |
|
|
|
1,418 |
|
|
Current portion of equipment financing debt |
|
|
2,155 |
|
|
|
2,034 |
|
|
Liabilities of consolidated funds |
|
|
|
|
|
|
|
|
|
Due to broker and other liabilities |
|
|
12,248 |
|
|
|
- |
|
|
Total current liabilities |
|
|
35,462 |
|
|
|
25,514 |
|
|
Lease liabilities, net of current portion |
|
|
3,720 |
|
|
|
4,060 |
|
|
Long term debt, net of current portion |
|
|
51,541 |
|
|
|
52,781 |
|
|
Related party notes payable, net of current portion |
|
|
- |
|
|
|
26,485 |
|
|
Convertible notes (face value $33,530 and $30,521, respectively, including $15,857 and $13,277, respectively, held by related parties) |
|
|
21,036 |
|
|
|
17,444 |
|
|
Equipment financing debt, net of current portion |
|
|
83 |
|
|
|
196 |
|
|
Redeemable preferred stock of subsidiaries (held by related parties, face value $37,018) |
|
|
35,474 |
|
|
|
- |
|
|
Other liabilities |
|
|
1,020 |
|
|
|
395 |
|
|
Total liabilities |
|
|
148,336 |
|
|
|
126,875 |
|
|
Commitments and Contingencies (Note 16) |
|
|
|
|
|
|
|
|
|
Contingently redeemable non-controlling interest |
|
|
2,156 |
|
|
|
3,890 |
|
|
Stockholders' equity |
|
|
|
|
|
|
|
|
|
Preferred stock, $0.001 par value; 5,000,000 authorized and zero outstanding |
|
|
- |
|
|
|
- |
|
|
Common stock, $0.001 par value; 350,000,000 shares authorized and 26,495,976 shares issued and 25,837,000 outstanding at March 31, 2021; and 26,217,380 shares issued and 25,529,534 outstanding at June 30, 2020 |
|
|
26 |
|
|
|
26 |
|
|
Additional paid-in-capital |
|
|
3,319,516 |
|
|
|
3,318,117 |
|
|
Accumulated deficit |
|
|
(3,264,212 |
) |
|
|
(3,257,349 |
) |
|
Total Great Elm Group, Inc. stockholders' equity |
|
|
55,330 |
|
|
|
60,794 |
|
|
Non-controlling interests |
|
|
9,435 |
|
|
|
3,886 |
|
|
Total stockholders' equity |
|
|
64,765 |
|
|
|
64,680 |
|
|
Total liabilities, non-controlling interest and stockholders' equity |
|
$ |
215,257 |
|
|
$ |
195,445 |
|
-6-
Great Elm Group, Inc.
Condensed Consolidated Statements of Operations (Unaudited)
Dollar amounts in thousands (except per share data)
|
|
|
For the three months ended March 31, |
|
|
For the nine months ended March 31, |
|
||||||||||
|
|
|
2021 |
|
|
2020 |
|
|
2021 |
|
|
2020 |
|
||||
|
Revenues: |
|
|
|
|
|
|
|
|
|
|
|
|
|
|
|
|
|
Durable medical equipment sales and services revenue |
|
$ |
8,606 |
|
|
$ |
8,933 |
|
|
$ |
27,363 |
|
|
$ |
25,725 |
|
|
Durable medical equipment rental income |
|
|
4,511 |
|
|
|
5,198 |
|
|
|
14,907 |
|
|
|
16,028 |
|
|
Investment management revenues |
|
|
728 |
|
|
|
829 |
|
|
|
2,261 |
|
|
|
2,585 |
|
|
Real estate rental income |
|
|
1,276 |
|
|
|
1,276 |
|
|
|
3,824 |
|
|
|
3,820 |
|
|
Total revenues |
|
|
15,121 |
|
|
|
16,236 |
|
|
|
48,355 |
|
|
|
48,158 |
|
|
|
|
|
|
|
|
|
|
|
|
|
|
|
|
|
|
|
|
Operating costs and expenses: |
|
|
|
|
|
|
|
|
|
|
|
|
|
|
|
|
|
Cost of durable medical equipment sold and services |
|
|
3,806 |
|
|
|
3,966 |
|
|
|
12,716 |
|
|
|
11,118 |
|
|
Cost of durable medical equipment rentals1 |
|
|
1,657 |
|
|
|
2,072 |
|
|
|
5,193 |
|
|
|
6,522 |
|
|
Durable medical equipment other operating expenses2 |
|
|
6,084 |
|
|
|
8,079 |
|
|
|
21,834 |
|
|
|
22,607 |
|
|
Investment management expenses |
|
|
904 |
|
|
|
149 |
|
|
|
2,546 |
|
|
|
1,504 |
|
|
Real estate expenses |
|
|
128 |
|
|
|
125 |
|
|
|
380 |
|
|
|
375 |
|
|
Depreciation and amortization |
|
|
1,048 |
|
|
|
1,053 |
|
|
|
3,090 |
|
|
|
3,250 |
|
|
Selling, general and administrative |
|
|
1,854 |
|
|
|
1,801 |
|
|
|
4,582 |
|
|
|
4,935 |
|
|
Expenses of consolidated funds |
|
|
19 |
|
|
|
- |
|
|
|
27 |
|
|
|
- |
|
|
Total operating costs and expenses |
|
|
15,500 |
|
|
|
17,245 |
|
|
|
50,368 |
|
|
|
50,311 |
|
|
Operating loss |
|
|
(379 |
) |
|
|
(1,009 |
) |
|
|
(2,013 |
) |
|
|
(2,153 |
) |
|
Dividends and interest income |
|
|
554 |
|
|
|
491 |
|
|
|
2,408 |
|
|
|
1,608 |
|
|
Unrealized loss on investment in GECC |
|
|
(1,112 |
) |
|
|
(9,794 |
) |
|
|
(454 |
) |
|
|
(11,603 |
) |
|
Net unrealized gain on investments of consolidated funds |
|
|
155 |
|
|
|
- |
|
|
|
221 |
|
|
|
- |
|
|
Interest expense |
|
|
(2,179 |
) |
|
|
(1,754 |
) |
|
|
(6,047 |
) |
|
|
(5,083 |
) |
|
Loss on extinguishment of debt |
|
|
- |
|
|
|
- |
|
|
|
(1,866 |
) |
|
|
- |
|
|
Other income, net |
|
|
- |
|
|
|
- |
|
|
|
30 |
|
|
|
3 |
|
|
Loss, before income taxes |
|
|
(2,961 |
) |
|
|
(12,066 |
) |
|
|
(7,721 |
) |
|
|
(17,228 |
) |
|
Income tax benefit (expense) |
|
|
43 |
|
|
|
148 |
|
|
|
(6 |
) |
|
|
5 |
|
|
Net loss |
|
$ |
(2,918 |
) |
|
$ |
(11,918 |
) |
|
$ |
(7,727 |
) |
|
$ |
(17,223 |
) |
|
Less: net loss attributable to non-controlling interest |
|
|
(160 |
) |
|
|
(301 |
) |
|
|
(864 |
) |
|
|
(676 |
) |
|
Net loss attributable to Great Elm Group, Inc. |
|
$ |
(2,758 |
) |
|
$ |
(11,617 |
) |
|
$ |
(6,863 |
) |
|
$ |
(16,547 |
) |
|
Net loss attributable to shareholders per share |
|
|
|
|
|
|
|
|
|
|
|
|
|
|
|
|
|
Basic |
|
$ |
(0.11 |
) |
|
$ |
(0.46 |
) |
|
$ |
(0.27 |
) |
|
$ |
(0.65 |
) |
|
Diluted |
|
|
(0.11 |
) |
|
|
(0.46 |
) |
|
|
(0.27 |
) |
|
|
(0.65 |
) |
|
Weighted average shares outstanding |
|
|
|
|
|
|
|
|
|
|
|
|
|
|
|
|
|
Basic |
|
|
25,757 |
|
|
|
25,430 |
|
|
|
25,669 |
|
|
|
25,401 |
|
|
Diluted |
|
|
25,757 |
|
|
|
25,430 |
|
|
|
25,669 |
|
|
|
25,401 |
|
|
|
|
|
|
|
|
|
|
|
|
|
|
|
|
|
|
|
|
1 Includes depreciation expense of: |
|
|
1,478 |
|
|
|
1,882 |
|
|
|
4,683 |
|
|
|
5,895 |
|
|
2 Net of CARES Act Stimulus of: |
|
|
2,275 |
|
|
|
- |
|
|
|
- |
|
|
|
- |
|
-7-
|
|
For the three months ended March 31, 2021 |
|
|||||||||||||||||
|
$ in thousands |
Durable Medical Equipment |
|
|
Investment Management |
|
|
Real Estate |
|
|
Corporate |
|
|
Consolidated |
|
|||||
|
|
|
|
|
|
|
|
|
|
|
|
|
|
|
|
|
|
|
|
|
|
EBITDA: |
|
|
|
|
|
|
|
|
|
|
|
|
|
|
|
|
|
|
|
|
Net income (loss) - GAAP |
$ |
(5,059 |
) |
|
$ |
(299 |
) |
|
$ |
73 |
|
|
$ |
2,367 |
|
|
$ |
(2,918 |
) |
|
Interest expense |
|
1,280 |
|
|
|
25 |
|
|
|
645 |
|
|
|
1,460 |
|
|
|
3,410 |
|
|
Interest income from preferred stock |
|
- |
|
|
|
- |
|
|
|
- |
|
|
|
(1,168 |
) |
|
|
(1,169 |
) |
|
Depreciation & amortization |
|
1,986 |
|
|
|
109 |
|
|
|
430 |
|
|
|
1 |
|
|
|
2,526 |
|
|
Tax benefit |
|
- |
|
|
|
- |
|
|
|
- |
|
|
|
(43 |
) |
|
|
(43 |
) |
|
EBITDA |
|
(1,793 |
) |
|
|
(165 |
) |
|
|
1,148 |
|
|
|
2,617 |
|
|
|
1,807 |
|
|
Adjusted EBITDA |
|
|
|
|
|
|
|
|
|
|
|
|
|
|
|
|
|
|
|
|
Stock based compensation |
|
- |
|
|
|
181 |
|
|
|
- |
|
|
|
435 |
|
|
|
616 |
|
|
Employee compensation in GECC shares |
|
- |
|
|
|
- |
|
|
|
- |
|
|
|
35 |
|
|
|
35 |
|
|
GECC dividend income |
|
- |
|
|
|
- |
|
|
|
- |
|
|
|
(554 |
) |
|
|
(554 |
) |
|
GECC unrealized (gains) / losses |
|
- |
|
|
|
- |
|
|
|
- |
|
|
|
1,112 |
|
|
|
1,112 |
|
|
Other (income) expense |
|
4,795 |
|
|
|
- |
|
|
|
- |
|
|
|
(4,795 |
) |
|
|
- |
|
|
Transaction and integration costs 1 |
|
380 |
|
|
|
- |
|
|
|
- |
|
|
|
155 |
|
|
|
535 |
|
|
DME management and monitoring fees |
|
46 |
|
|
|
- |
|
|
|
- |
|
|
|
(46 |
) |
|
|
- |
|
|
Adjusted EBITDA |
$ |
3,428 |
|
|
$ |
16 |
|
|
$ |
1,148 |
|
|
$ |
(1,041 |
) |
|
$ |
3,551 |
|
|
|
For the three months ended March 31, 2020 |
|
|||||||||||||||||
|
$ in thousands |
Durable Medical Equipment |
|
|
Investment Management |
|
|
Real Estate |
|
|
Corporate |
|
|
Consolidated |
|
|||||
|
|
|
|
|
|
|
|
|
|
|
|
|
|
|
|
|
|
|
|
|
|
EBITDA: |
|
|
|
|
|
|
|
|
|
|
|
|
|
|
|
|
|
|
|
|
Net income (loss) - GAAP |
$ |
(1,398 |
) |
|
$ |
491 |
|
|
$ |
67 |
|
|
$ |
(11,078 |
) |
|
$ |
(11,918 |
) |
|
Interest expense |
|
906 |
|
|
|
39 |
|
|
|
654 |
|
|
|
155 |
|
|
|
1,754 |
|
|
Depreciation & amortization |
|
2,354 |
|
|
|
150 |
|
|
|
430 |
|
|
|
1 |
|
|
|
2,935 |
|
|
Tax benefit |
|
- |
|
|
|
- |
|
|
|
- |
|
|
|
(148 |
) |
|
|
(148 |
) |
|
EBITDA |
|
1,862 |
|
|
|
680 |
|
|
|
1,151 |
|
|
|
(11,070 |
) |
|
|
(7,377 |
) |
|
Adjusted EBITDA |
|
|
|
|
|
|
|
|
|
|
|
|
|
|
|
|
|
|
|
|
Stock based compensation |
|
- |
|
|
|
(373 |
) |
|
|
- |
|
|
|
106 |
|
|
|
(267 |
) |
|
GECC dividend income |
|
- |
|
|
|
- |
|
|
|
- |
|
|
|
(490 |
) |
|
|
(490 |
) |
|
GECC unrealized (gains) / losses |
|
- |
|
|
|
- |
|
|
|
- |
|
|
|
9,794 |
|
|
|
9,794 |
|
|
Transaction and integration costs 1 |
|
540 |
|
|
|
- |
|
|
|
- |
|
|
|
291 |
|
|
|
831 |
|
|
Pharmacy buildout |
|
65 |
|
|
|
- |
|
|
|
- |
|
|
|
- |
|
|
|
65 |
|
|
DME management and monitoring fees |
|
59 |
|
|
|
- |
|
|
|
- |
|
|
|
(34 |
) |
|
|
25 |
|
|
Adjusted EBITDA |
$ |
2,526 |
|
|
$ |
307 |
|
|
$ |
1,151 |
|
|
$ |
(1,403 |
) |
|
$ |
2,581 |
|
|
|
(1) |
Transaction and integration related costs include costs to acquire and integrate acquired businesses. This also represents change in contingent consideration liability since the initial valuation at the acquisition date. |
-8-