Exhibit 99.1

Great Elm Group Reports FISCAL 2022 SECOND QUARTER
financial resulTs
Company to Host Conference Call at 9:00 a.m. ET on February 11, 2022
WALTHAM, Mass., February 10, 2022 -- Great Elm Group, Inc. (“we,” “us,” “our,” “GEG,” or “Great Elm”), (NASDAQ: GEG), a diversified holding company, today announced financial results for its fiscal second quarter ended December 31, 2021.
Fiscal 2022 Second Quarter Operating and Financial Highlights
(All comparisons versus the prior-year period unless otherwise noted)
|
|
• |
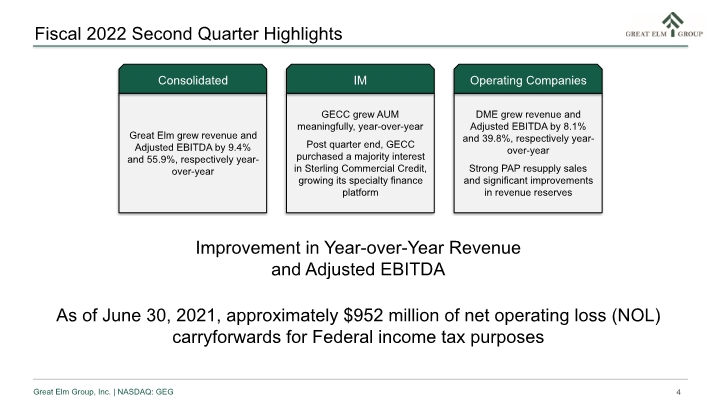
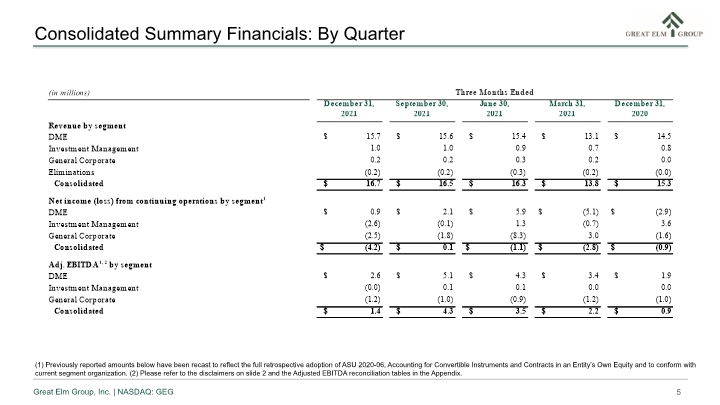
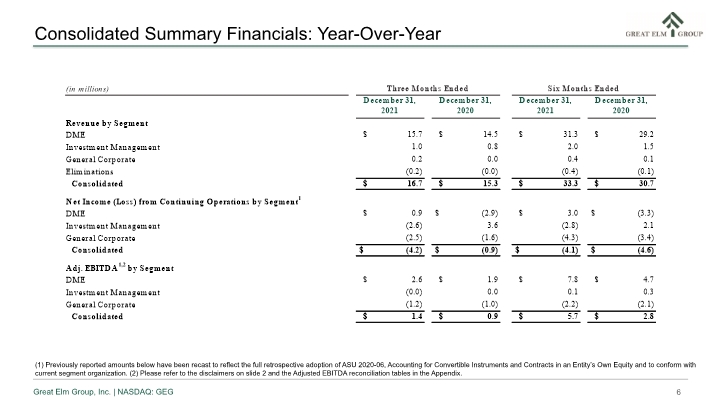
Consolidated revenue for the second quarter was $16.7 million, compared to $15.3 million. |
|
|
• |
Consolidated net loss from continuing operations for the second quarter was $4.2 million, compared to net loss from continuing operations of $0.9 million. |
|
|
• |
Consolidated Adjusted EBITDA for the second quarter was $1.4 million, compared to $0.9 million. |
|
|
• |
As of June 30, 2021, we had approximately $952 million of net operating loss (NOL) carryforwards for federal income tax purposes. |
Operating Companies:
|
|
• |
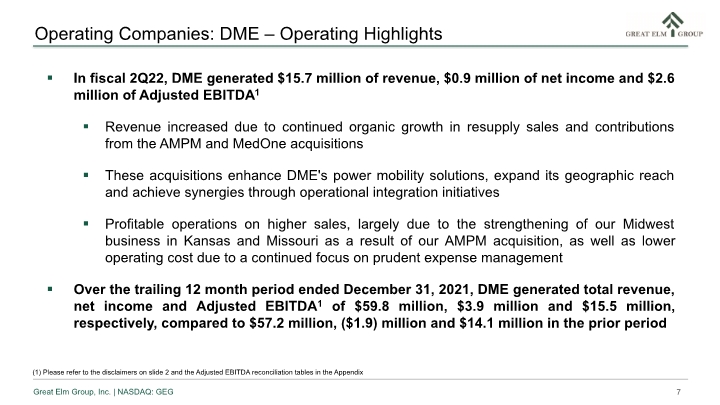
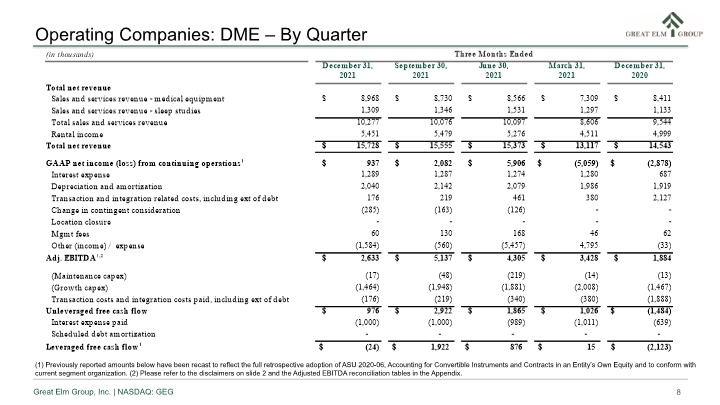
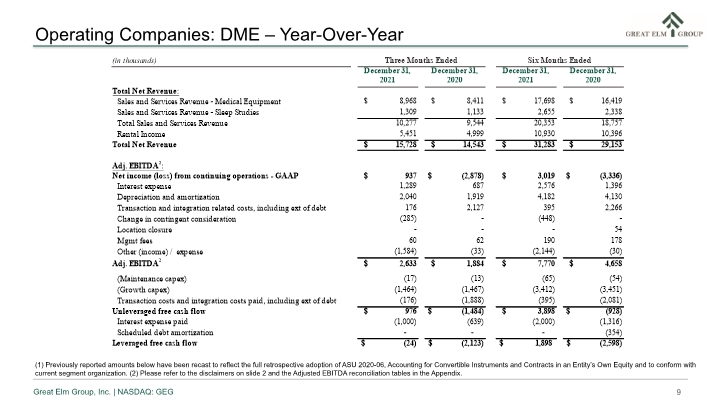
Durable Medical Equipment (DME) grew total revenue for the second quarter by 8.1% to $15.7 million, compared to $14.5 million, driven by strong resupply sales despite challenging pandemic-related conditions. |
|
|
• |
DME net income for the second quarter was $0.9 million, compared to a net loss of $2.9 million. |
|
|
• |
DME Adjusted EBITDA for the second quarter was $2.6 million, compared to $1.9 million. |
|
|
• |
DME total revenue, net income and Adjusted EBITDA for the trailing 12 month period ended December 31, 2021 were $59.8 million, $3.9 million and $15.5 million, respectively, compared to $57.2 million, ($1.9) million and $14.1 million. |
|
|
• |
DME continued to report strong PAP resupply sales and significant improvements in revenue reserves. |
Investment Management (IM):
|
|
• |
IM grew total revenue for the second quarter by 34.3% to $1.0 million, compared to $0.8 million. |
|
|
• |
IM net loss for the second quarter was $2.6 million, compared to net income of $3.6 million. |
|
|
• |
IM reported no Adjusted EBITDA for the second quarter, approximately unchanged from the prior-year period. |
|
|
• |
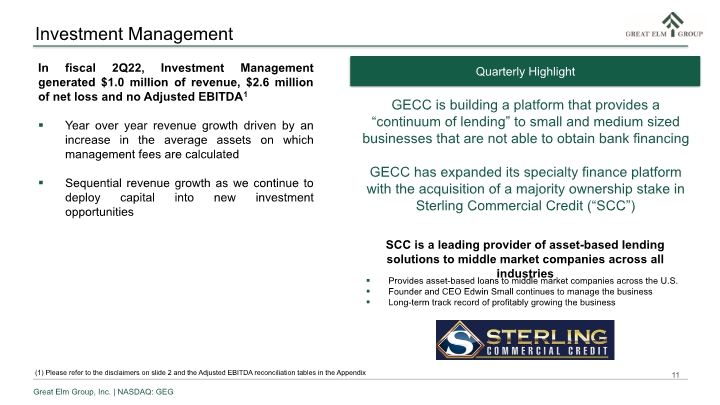
On February 3, 2022, Great Elm Capital Corp. (GECC) announced that it purchased a majority ownership interest in Sterling Commercial Credit (SCC), a provider of asset-based loans to middle market companies throughout the United States, for total consideration of approximately $7.5 million. |
|
|
• |
$7.5 million total consideration consists of $4.9 million of cash and $2.6 million of GECC common stock issued at net asset value. |
|
|
• |
In connection with the acquisition, GECC also provided subordinated debt to SCC to fund growth initiatives. |
Management Commentary
Peter A. Reed, Chief Executive Officer, stated, “In our IM segment, Great Elm Capital Corp. continues to make progress building its specialty finance platform. Its recent acquisition of Sterling Commercial Credit, coupled with portfolio
companies Prestige Capital and Lenders Funding, broadens GECC’s product offerings to its customers and provides a proprietary source of attractive, risk adjusted returns for its investors. GECC remains focused on growing its specialty finance platform organically as well as through acquisitions. In addition, our DME business grew revenue and expanded profitability despite challenging conditions from the pandemic and supply chain disruptions.”
Alignment of Interest
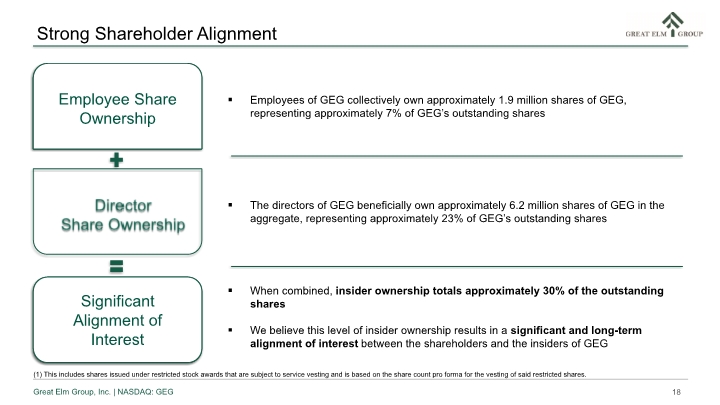
A distinct attribute of Great Elm is the particularly strong alignment of interest among shareholders and the employees, directors, and other insiders of Great Elm. As of December 31, 2021, Great Elm’s employees and directors (including funds under their management) collectively own or manage approximately 30% of GEG’s total outstanding shares.
Financial Review
Discussion of Financial Results by Segment for the Fiscal Quarter ended December 31, 2021
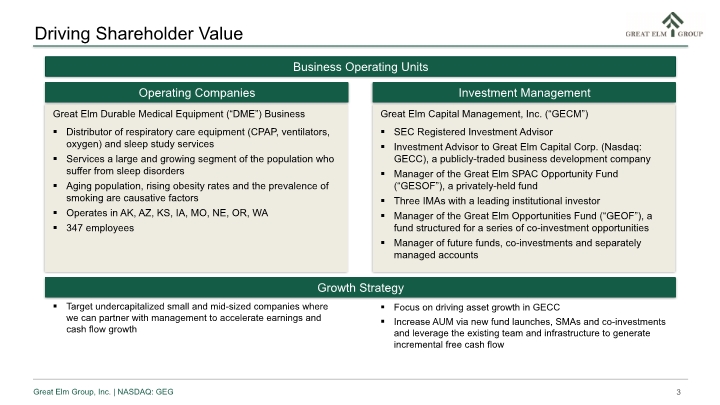
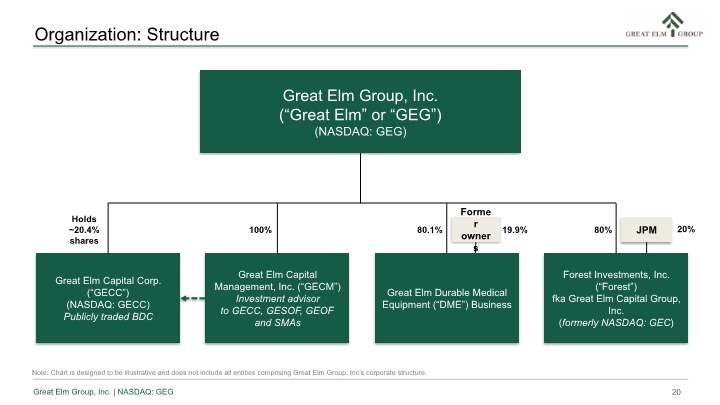
Great Elm is a holding company with two operating segments: Operating Companies and Investment Management, with General Corporate representing unallocated costs and activity to arrive at consolidated operations.
Operating Companies
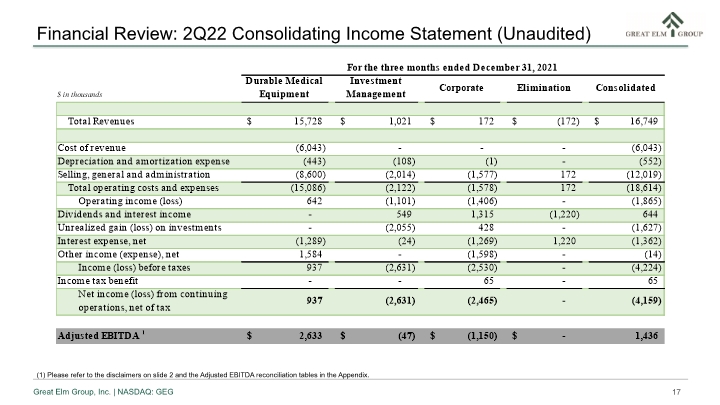
During the three months ended December 31, 2021, DME reported $15.7 million in total revenue, compared to $14.5 million during the same period in the prior year. The increase in revenue was due to organic growth in resupply sales, a significant reduction in bad debt expense and the impact of previously announced acquisitions.
During the three months ended December 31, 2021, DME reported net income of $0.9 million, compared to net loss of $2.9 million for the same period in the prior year. Net income increased largely due to revenue growth combined with expense management.
During the three months ended December 31, 2021, DME Adjusted EBITDA was $2.6 million, compared to $1.9 million in the prior-year period.
Investment Management
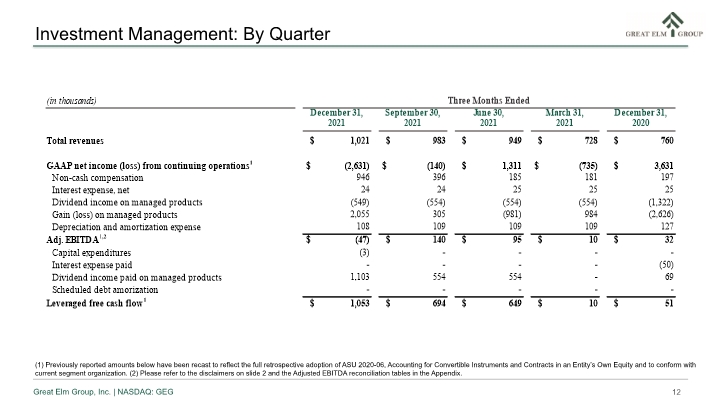
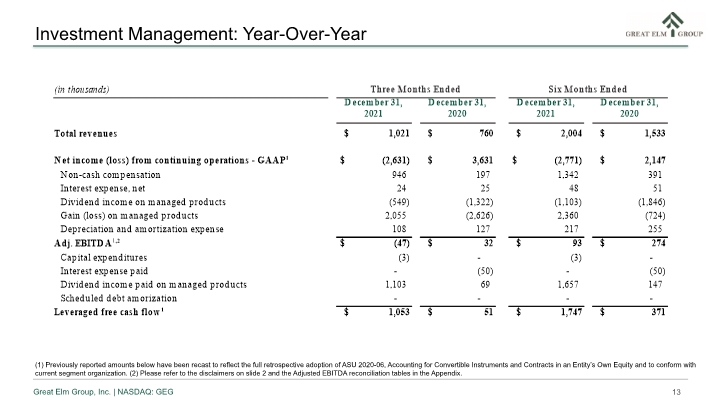
During the three months ended December 31, 2021, IM reported total revenue of $1.0 million, compared to $0.8 million during the same period in the prior year. Revenue for the quarter was higher due to an increase in the average assets on which such fees are calculated.
During the three months ended December 31, 2021, IM recognized a net loss of $2.6 million, compared to net income of $3.6 million during the same period in the prior year. Net income decreased primarily due to unrealized losses on our investment in GECC common shares during the period.
During the three months ended December 31, 2021, IM reported no Adjusted EBITDA, approximately unchanged from the same period in the prior year. Increased revenue was largely offset by increased compensation expenses due to additions to the investment team.
General Corporate
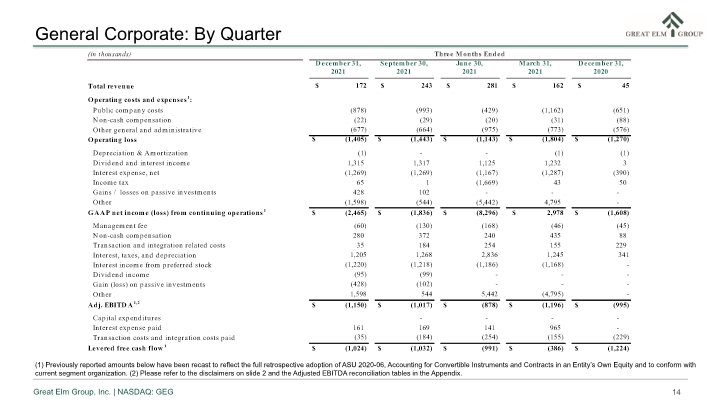
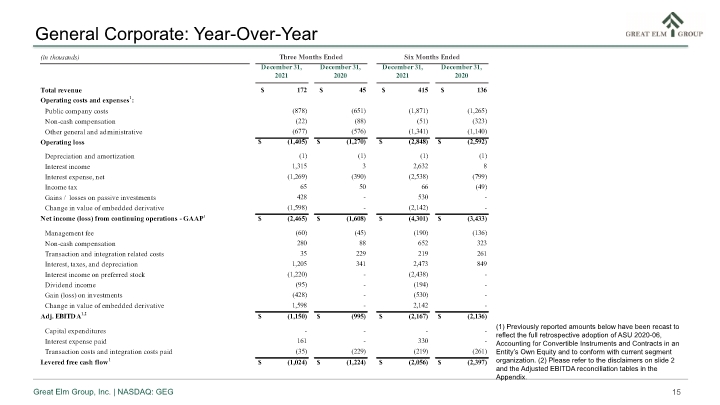
During the three months ended December 31, 2021, General Corporate recognized $0.2 million in revenue compared to no revenue during the same period in the prior year. Revenue increased slightly as a result of Forest management fees which commenced in December 2020 in connection with our holding company reorganization.
-2-
During the three months ended December 31, 2021, General Corporate recognized a net loss from continuing operations of $2.5 million, compared to a net loss from continuing operations of $1.6 million during the same period in the prior year.
During the three months ended December 31, 2021, General Corporate recognized ($1.2) million of Adjusted EBITDA, compared to Adjusted EBITDA of ($1.0) million during the same period in the prior year.
Fiscal 2022 Second Quarter Conference Call & Webcast Information
When:Friday, February 11, 2022, 9:00 a.m. Eastern Time (ET)
|
Call: |
All interested parties are invited to participate in the conference call by dialing +1 (888) 440-4537; international callers should dial +1 (646) 960-0669. Participants should enter the Conference ID 2595129 when asked. |
About Great Elm Group, Inc.
Great Elm Group, Inc. (NASDAQ: GEG) is a publicly-traded holding company that is building a business across two operating verticals: Operating Companies and Investment Management. Great Elm Group, Inc.’s website can be found at www.greatelmgroup.com.
Safe Harbor Statement under the Private Securities Litigation Reform Act of 1995
Statements in this press release that are “forward-looking” statements, including statements regarding revenue, Adjusted EBITDA, expected growth, profitability, acquisition opportunities and outlook involve risks and uncertainties that may individually or collectively impact the matters described herein. Investors are cautioned not to place undue reliance on any such forward-looking statements, which speak only as of the date they are made and represent Great Elm’s assumptions and expectations in light of currently available information. These statements involve risks, variables and uncertainties, and Great Elm’s actual performance results may differ from those projected, and any such differences may be material. For information on certain factors that could cause actual events or results to differ materially from Great Elm’s expectations, please see Great Elm’s filings with the SEC, including its most recent annual report on Form 10-K and subsequent reports on Forms 10-Q and 8-K. Additional information relating to Great Elm’s financial position and results of operations is also contained in Great Elm’s annual and quarterly reports filed with the SEC and available for download at its website www.greatelmgroup.com or at the SEC website www.sec.gov.
Please note that previously reported amounts below have been recast to 1) reflect the operations of our real estate business as discontinued operations; 2) reflect the full retrospective adoption of ASU 2020-06, Accounting for Convertible Instruments and Contracts in an Entity’s Own Equity; and 3) conform with current segment organization.
Non-GAAP Financial Measures
The SEC has adopted rules to regulate the use in filings with the SEC, and in public disclosures, of financial measures that are not in accordance with US GAAP, such as adjusted earnings before interest, taxes, depreciation and amortization (“Adjusted EBITDA”). Adjusted EBITDA is derived from methodologies other than in accordance with US GAAP. Great
-3-
Elm believes that Adjusted EBITDA is an important measure for investors to use in evaluating Great Elm’s businesses. In addition, Great Elm’s management reviews Adjusted EBITDA as they evaluate acquisition opportunities.
Adjusted EBITDA has limitations as an analytical tool, and you should not consider it either in isolation from, or as a substitute for, analyzing Great Elm’s results as reported under US GAAP. Non-GAAP financial measures reported by Great Elm may not be comparable to similarly titled amounts reported by other companies.
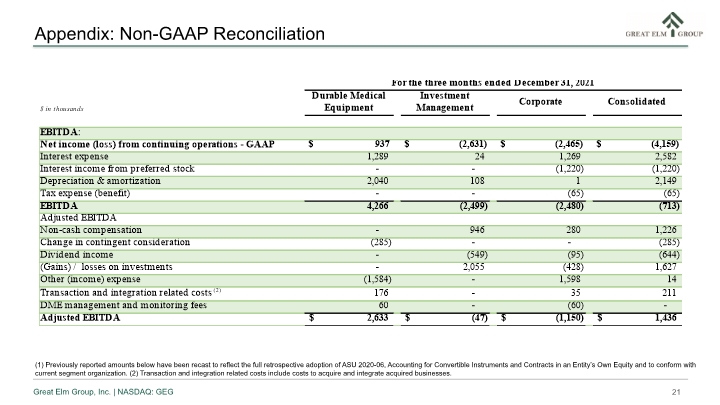
Included in the financial tables below is a reconciliation of Adjusted EBITDA to the most directly comparable US GAAP financial measure, net income.
Media & Investor Contact:
Investor Relations
(617) 375-3006
-4-
Great Elm Group, Inc.
Condensed Consolidated Balance Sheets (Unaudited)
Dollar amounts in thousands (except per share data)
|
ASSETS |
|
December 31, 2021 |
|
|
June 30, 2021 |
|
||
|
Current assets: |
|
|
|
|
|
|
|
|
|
Cash and cash equivalents |
|
$ |
24,956 |
|
|
$ |
24,382 |
|
|
Accounts receivable |
|
|
5,271 |
|
|
|
6,518 |
|
|
Related party receivables |
|
|
1,345 |
|
|
|
1,665 |
|
|
Investments, at fair value (cost $44,647 and $45,326, respectively) |
|
|
22,286 |
|
|
|
24,044 |
|
|
Inventories |
|
|
913 |
|
|
|
1,066 |
|
|
Prepaid and other current assets |
|
|
1,634 |
|
|
|
3,791 |
|
|
Assets of consolidated funds |
|
|
|
|
|
|
|
|
|
Investments, at fair value (cost $26,758 and $26,814, respectively) |
|
|
26,447 |
|
|
|
26,490 |
|
|
Prepaid expenses and other assets |
|
|
89 |
|
|
|
578 |
|
|
Total current assets |
|
|
82,941 |
|
|
|
88,534 |
|
|
Property and equipment, net |
|
|
738 |
|
|
|
981 |
|
|
Equipment held for rental, net |
|
|
6,893 |
|
|
|
7,391 |
|
|
Identifiable intangible assets, net |
|
|
8,110 |
|
|
|
8,928 |
|
|
Goodwill |
|
|
52,463 |
|
|
|
50,536 |
|
|
Right of use assets |
|
|
4,737 |
|
|
|
5,241 |
|
|
Other assets |
|
|
255 |
|
|
|
258 |
|
|
Total assets |
|
$ |
156,137 |
|
|
$ |
161,869 |
|
|
LIABILITIES, NON-CONTROLLING INTEREST AND STOCKHOLDERS' EQUITY |
|
|
|
|
|
|
|
|
|
Current liabilities: |
|
|
|
|
|
|
|
|
|
Accounts payable |
|
$ |
5,405 |
|
|
$ |
5,521 |
|
|
Accrued expenses and other liabilities |
|
|
5,841 |
|
|
|
6,955 |
|
|
Deferred revenue |
|
|
2,155 |
|
|
|
4,438 |
|
|
Current portion of lease liabilities |
|
|
1,986 |
|
|
|
1,920 |
|
|
Current portion of capitalized equipment financing |
|
|
2,571 |
|
|
|
1,974 |
|
|
Liabilities of consolidated funds- accrued expenses and other |
|
|
12,265 |
|
|
|
12,197 |
|
|
Total current liabilities |
|
|
30,223 |
|
|
|
33,005 |
|
|
Lease liabilities, net of current portion |
|
|
3,011 |
|
|
|
3,596 |
|
|
Convertible notes (face value $35,205 and $34,346, respectively, including $16,637 and $16,231, respectively, held by related parties) |
|
|
34,249 |
|
|
|
33,333 |
|
|
Equipment financing debt, net of current portion |
|
|
17 |
|
|
|
67 |
|
|
Redeemable preferred stock of subsidiaries (held by related parties, face value $37,018) |
|
|
35,639 |
|
|
|
35,529 |
|
|
Other liabilities |
|
|
348 |
|
|
|
915 |
|
|
Total liabilities |
|
|
103,487 |
|
|
|
106,445 |
|
|
Commitments and Contingencies (Note 18) |
|
|
|
|
|
|
|
|
|
Contingently redeemable non-controlling interest |
|
|
2,948 |
|
|
|
2,639 |
|
|
Stockholders' equity |
|
|
|
|
|
|
|
|
|
Preferred stock, $0.001 par value; 5,000,000 authorized and zero outstanding |
|
|
- |
|
|
|
- |
|
|
Common stock, $0.001 par value; 350,000,000 shares authorized and 26,968,632 shares issued and 26,815,181 outstanding at December 31, 2021; and 26,613,913 shares issued and 25,948,100 outstanding at June 30, 2021 |
|
|
27 |
|
|
|
26 |
|
|
Additional paid-in-capital |
|
|
3,309,325 |
|
|
|
3,307,613 |
|
|
Accumulated deficit |
|
|
(3,268,841 |
) |
|
|
(3,264,403 |
) |
|
Total Great Elm Group, Inc. stockholders' equity |
|
|
40,511 |
|
|
|
43,236 |
|
|
Non-controlling interests |
|
|
9,191 |
|
|
|
9,549 |
|
|
Total stockholders' equity |
|
|
49,702 |
|
|
|
52,785 |
|
|
Total liabilities, non-controlling interest and stockholders' equity |
|
$ |
156,137 |
|
|
$ |
161,869 |
|
-5-
Great Elm Group, Inc.
Condensed Consolidated Statements of Operations (Unaudited)
Dollar amounts in thousands (except per share data)
|
|
|
For the three months ended December 31, |
|
|
For the six months ended December 31, |
|
||||||||||
|
|
|
2021 |
|
|
2020 |
|
|
2021 |
|
|
2020 |
|
||||
|
Revenues: |
|
|
|
|
|
|
|
|
|
|
|
|
|
|
|
|
|
Durable medical equipment sales and services revenue |
|
$ |
10,277 |
|
|
$ |
9,544 |
|
|
$ |
20,353 |
|
|
$ |
18,757 |
|
|
Durable medical equipment rental income |
|
|
5,451 |
|
|
|
4,999 |
|
|
|
10,930 |
|
|
|
10,396 |
|
|
Investment management revenues |
|
|
1,021 |
|
|
|
760 |
|
|
|
2,004 |
|
|
|
1,533 |
|
|
Total revenues |
|
|
16,749 |
|
|
|
15,303 |
|
|
|
33,287 |
|
|
|
30,686 |
|
|
|
|
|
|
|
|
|
|
|
|
|
|
|
|
|
|
|
|
Operating costs and expenses: |
|
|
|
|
|
|
|
|
|
|
|
|
|
|
|
|
|
Cost of durable medical equipment sold and services |
|
|
4,309 |
|
|
|
4,703 |
|
|
|
8,369 |
|
|
|
8,910 |
|
|
Cost of durable medical equipment rentals(1) |
|
|
1,734 |
|
|
|
1,621 |
|
|
|
3,584 |
|
|
|
3,536 |
|
|
Durable medical equipment other operating expenses(2) |
|
|
8,540 |
|
|
|
8,070 |
|
|
|
14,793 |
|
|
|
15,750 |
|
|
Investment management expenses |
|
|
1,969 |
|
|
|
916 |
|
|
|
3,156 |
|
|
|
1,642 |
|
|
Depreciation and amortization |
|
|
552 |
|
|
|
591 |
|
|
|
1,114 |
|
|
|
1,181 |
|
|
Selling, general and administrative(3) |
|
|
1,465 |
|
|
|
1,315 |
|
|
|
3,038 |
|
|
|
2,728 |
|
|
Expenses of consolidated funds |
|
|
45 |
|
|
|
8 |
|
|
|
97 |
|
|
|
8 |
|
|
Total operating costs and expenses |
|
|
18,614 |
|
|
|
17,224 |
|
|
|
34,151 |
|
|
|
33,755 |
|
|
Operating loss |
|
|
(1,865 |
) |
|
|
(1,921 |
) |
|
|
(864 |
) |
|
|
(3,069 |
) |
|
Dividends and interest income |
|
|
644 |
|
|
|
1,325 |
|
|
|
1,297 |
|
|
|
1,854 |
|
|
Net realized and unrealized (loss) gain on investments |
|
|
(1,821 |
) |
|
|
2,560 |
|
|
|
(1,835 |
) |
|
|
658 |
|
|
Net realized and unrealized gain on investments of consolidated funds |
|
|
194 |
|
|
|
66 |
|
|
|
5 |
|
|
|
66 |
|
|
Interest expense |
|
|
(1,362 |
) |
|
|
(1,102 |
) |
|
|
(2,724 |
) |
|
|
(2,246 |
) |
|
Loss on extinguishment of debt |
|
|
- |
|
|
|
(1,866 |
) |
|
|
- |
|
|
|
(1,866 |
) |
|
Other income, net |
|
|
(14 |
) |
|
|
33 |
|
|
|
2 |
|
|
|
30 |
|
|
Loss from continuing operations, before income taxes |
|
|
(4,224 |
) |
|
|
(905 |
) |
|
|
(4,119 |
) |
|
|
(4,573 |
) |
|
Income tax benefit (expense) |
|
|
65 |
|
|
|
50 |
|
|
|
66 |
|
|
|
(49 |
) |
|
Loss from continuing operations |
|
|
(4,159 |
) |
|
|
(855 |
) |
|
|
(4,053 |
) |
|
|
(4,622 |
) |
|
Discontinued operations: |
|
|
|
|
|
|
|
|
|
|
|
|
|
|
|
|
|
Income from discontinued operations, net of tax |
|
|
- |
|
|
|
72 |
|
|
|
- |
|
|
|
138 |
|
|
Net loss |
|
$ |
(4,159 |
) |
|
$ |
(783 |
) |
|
$ |
(4,053 |
) |
|
$ |
(4,484 |
) |
|
Less: net income (loss) attributable to non-controlling interest, continuing operations |
|
|
79 |
|
|
|
(614 |
) |
|
|
385 |
|
|
|
(734 |
) |
|
Less: net income attributable to non-controlling interest, discontinued operations |
|
|
- |
|
|
|
17 |
|
|
|
- |
|
|
|
30 |
|
|
Net loss attributable to Great Elm Group, Inc. |
|
$ |
(4,238 |
) |
|
$ |
(186 |
) |
|
$ |
(4,438 |
) |
|
$ |
(3,780 |
) |
|
Basic and diluted income (loss) per share from: |
|
|
|
|
|
|
|
|
|
|
|
|
|
|
|
|
|
Continuing operations |
|
$ |
(0.16 |
) |
|
$ |
(0.01 |
) |
|
$ |
(0.17 |
) |
|
$ |
(0.15 |
) |
|
Discontinued operations |
|
|
- |
|
|
|
0.00 |
|
|
|
- |
|
|
|
0.00 |
|
|
Net loss |
|
$ |
(0.16 |
) |
|
$ |
(0.01 |
) |
|
$ |
(0.17 |
) |
|
$ |
(0.15 |
) |
|
Weighted average shares outstanding |
|
|
|
|
|
|
|
|
|
|
|
|
|
|
|
|
|
Basic |
|
|
26,462 |
|
|
|
25,678 |
|
|
|
26,222 |
|
|
|
25,626 |
|
|
Diluted |
|
|
26,462 |
|
|
|
25,678 |
|
|
|
26,222 |
|
|
|
25,626 |
|
|
(1) Includes depreciation expense of: |
|
|
1,597 |
|
|
|
1,457 |
|
|
|
3,285 |
|
|
|
3,205 |
|
|
(2) Net of CARES Act Stimulus of: |
|
|
- |
|
|
|
- |
|
|
|
2,321 |
|
|
|
- |
|
|
(3) Net of CARES Act Stimulus of: |
|
|
- |
|
|
|
- |
|
|
|
84 |
|
|
|
- |
|
-6-
Great Elm Group, Inc.
Reconciliation from EBITDA to Adjusted EBITDA - Quarterly
Dollar amounts in thousands (except per share data)
|
|
|
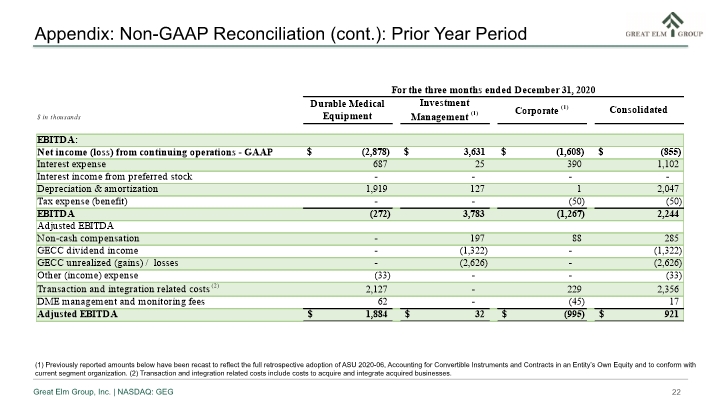
For the three months ended December 31, 2021 |
|
|||||||||||||
|
$ in thousands |
|
Durable Medical Equipment |
|
|
Investment Management |
|
|
General Corporate |
|
|
Consolidated |
|
||||
|
EBITDA: |
|
|
|
|
|
|
|
|
|
|
|
|
|
|
|
|
|
Net income (loss) from continuing operations - GAAP |
|
$ |
937 |
|
|
$ |
(2,631 |
) |
|
$ |
(2,465 |
) |
|
$ |
(4,159 |
) |
|
Interest expense |
|
|
1,289 |
|
|
|
24 |
|
|
|
1,269 |
|
|
|
2,582 |
|
|
Interest income from preferred stock |
|
|
- |
|
|
|
- |
|
|
|
(1,220 |
) |
|
|
(1,220 |
) |
|
Depreciation & amortization |
|
|
2,040 |
|
|
|
108 |
|
|
|
1 |
|
|
|
2,149 |
|
|
Tax expense (benefit) |
|
|
- |
|
|
|
- |
|
|
|
(65 |
) |
|
|
(65 |
) |
|
EBITDA |
|
|
4,266 |
|
|
|
(2,499 |
) |
|
|
(2,480 |
) |
|
|
(713 |
) |
|
Adjusted EBITDA |
|
|
|
|
|
|
|
|
|
|
|
|
|
|
|
|
|
Non-cash compensation |
|
|
- |
|
|
|
946 |
|
|
|
280 |
|
|
|
1,226 |
|
|
Change in contingent consideration |
|
|
(285 |
) |
|
|
- |
|
|
|
- |
|
|
|
(285 |
) |
|
Dividend income |
|
|
- |
|
|
|
(549 |
) |
|
|
(95 |
) |
|
|
(644 |
) |
|
(Gains) / losses on investments |
|
|
- |
|
|
|
2,055 |
|
|
|
(428 |
) |
|
|
1,627 |
|
|
Other (income) expense |
|
|
(1,584 |
) |
|
|
- |
|
|
|
1,598 |
|
|
|
14 |
|
|
Transaction and integration related costs (2) |
|
|
176 |
|
|
|
- |
|
|
|
35 |
|
|
|
211 |
|
|
DME management and monitoring fees |
|
|
60 |
|
|
|
- |
|
|
|
(60 |
) |
|
|
- |
|
|
Adjusted EBITDA |
|
$ |
2,633 |
|
|
$ |
(47 |
) |
|
$ |
(1,150 |
) |
|
$ |
1,436 |
|
|
|
|
For the three months ended December 31, 2020 |
|
|||||||||||||
|
$ in thousands |
|
Durable Medical Equipment |
|
|
Investment Management (1) |
|
|
General Corporate (1) |
|
|
Consolidated |
|
||||
|
EBITDA: |
|
|
|
|
|
|
|
|
|
|
|
|
|
|
|
|
|
Net income (loss) from continuing operations - GAAP |
|
$ |
(2,878 |
) |
|
$ |
3,631 |
|
|
$ |
(1,608 |
) |
|
$ |
(855 |
) |
|
Interest expense |
|
|
687 |
|
|
|
25 |
|
|
|
390 |
|
|
|
1,102 |
|
|
Interest income from preferred stock |
|
|
- |
|
|
|
- |
|
|
|
0 |
|
|
|
0 |
|
|
Depreciation & amortization |
|
|
1,919 |
|
|
|
127 |
|
|
|
1 |
|
|
|
2,047 |
|
|
Tax expense (benefit) |
|
|
- |
|
|
|
- |
|
|
|
(50 |
) |
|
|
(50 |
) |
|
EBITDA |
|
|
(272 |
) |
|
|
3,783 |
|
|
|
(1,267 |
) |
|
|
2,244 |
|
|
Adjusted EBITDA |
|
|
|
|
|
|
|
|
|
|
|
|
|
|
|
|
|
Non-cash compensation |
|
|
- |
|
|
|
197 |
|
|
|
88 |
|
|
|
285 |
|
|
GECC dividend income |
|
|
- |
|
|
|
(1,322 |
) |
|
|
- |
|
|
|
(1,322 |
) |
|
GECC unrealized (gains) / losses |
|
|
- |
|
|
|
(2,626 |
) |
|
|
- |
|
|
|
(2,626 |
) |
|
Other (income) expense |
|
|
(33 |
) |
|
|
- |
|
|
|
- |
|
|
|
(33 |
) |
|
Transaction and integration related costs (2) |
|
|
2,127 |
|
|
|
- |
|
|
|
229 |
|
|
|
2,356 |
|
|
DME management and monitoring fees |
|
|
62 |
|
|
|
- |
|
|
|
(45 |
) |
|
|
17 |
|
|
Adjusted EBITDA |
|
$ |
1,884 |
|
|
$ |
32 |
|
|
$ |
(995 |
) |
|
$ |
921 |
|
|
|
|
For the six months ended December 31, 2021 |
|
|||||||||||||
|
$ in thousands |
|
Durable Medical Equipment |
|
|
Investment Management |
|
|
General Corporate |
|
|
Consolidated |
|
||||
|
EBITDA: |
|
|
|
|
|
|
|
|
|
|
|
|
|
|
|
|
|
Net income (loss) from continuing operations - GAAP |
|
$ |
3,019 |
|
|
$ |
(2,771 |
) |
|
$ |
(4,301 |
) |
|
$ |
(4,053 |
) |
|
Interest expense |
|
|
2,576 |
|
|
|
48 |
|
|
|
2,538 |
|
|
|
5,162 |
|
|
Interest income on preferred stock |
|
|
- |
|
|
|
- |
|
|
|
(2,438 |
) |
|
|
(2,438 |
) |
|
Depreciation & amortization |
|
|
4,182 |
|
|
|
217 |
|
|
|
1 |
|
|
|
4,400 |
|
|
Tax expense (benefit) |
|
|
- |
|
|
|
- |
|
|
|
(66 |
) |
|
|
(66 |
) |
|
EBITDA |
|
$ |
9,777 |
|
|
$ |
(2,506 |
) |
|
$ |
(4,266 |
) |
|
$ |
3,005 |
|
|
Adjusted EBITDA |
|
|
|
|
|
|
|
|
|
|
|
|
|
|
|
|
|
Non-cash compensation |
|
|
- |
|
|
|
1,342 |
|
|
|
652 |
|
|
|
1,994 |
|
|
Change in contingent consideration |
|
|
(448 |
) |
|
|
- |
|
|
|
- |
|
|
|
(448 |
) |
|
Dividend income |
|
|
- |
|
|
|
(1,103 |
) |
|
|
(194 |
) |
|
|
(1,297 |
) |
|
(Gains) / Losses on investments |
|
|
- |
|
|
|
2,360 |
|
|
|
(530 |
) |
|
|
1,830 |
|
|
Other (income) expense |
|
|
(2,144 |
) |
|
|
- |
|
|
|
2,142 |
|
|
|
(2 |
) |
|
Transaction and integration costs (2) |
|
|
395 |
|
|
|
- |
|
|
|
219 |
|
|
|
614 |
|
|
DME management and monitoring fees |
|
|
190 |
|
|
|
- |
|
|
|
(190 |
) |
|
|
- |
|
|
Adjusted EBITDA |
|
$ |
7,770 |
|
|
$ |
93 |
|
|
$ |
(2,167 |
) |
|
$ |
5,696 |
|
-7-
|
|
|
For the six months ended December 31, 2020 |
|
|||||||||||||
|
$ in thousands |
|
Durable Medical Equipment |
|
|
Investment Management (1) |
|
|
General Corporate (1) |
|
|
Consolidated |
|
||||
|
EBITDA: |
|
|
|
|
|
|
|
|
|
|
|
|
|
|
|
|
|
Net income (loss) from continuing operations - GAAP |
|
$ |
(3,336 |
) |
|
$ |
2,147 |
|
|
$ |
(3,433 |
) |
|
$ |
(4,622 |
) |
|
Interest expense |
|
|
1,396 |
|
|
|
51 |
|
|
|
799 |
|
|
|
2,246 |
|
|
Interest income on preferred stock |
|
|
- |
|
|
|
- |
|
|
|
0 |
|
|
|
0 |
|
|
Depreciation & amortization |
|
|
4,130 |
|
|
|
255 |
|
|
|
1 |
|
|
|
4,386 |
|
|
Tax expense (benefit) |
|
|
- |
|
|
|
- |
|
|
|
49 |
|
|
|
49 |
|
|
EBITDA |
|
|
2,190 |
|
|
|
2,453 |
|
|
|
(2,584 |
) |
|
|
2,058 |
|
|
Adjusted EBITDA |
|
|
|
|
|
|
|
|
|
|
|
|
|
|
|
|
|
Non-cash compensation |
|
|
- |
|
|
|
391 |
|
|
|
323 |
|
|
|
714 |
|
|
Dividend income |
|
|
- |
|
|
|
(1,846 |
) |
|
|
- |
|
|
|
(1,846 |
) |
|
(Gains) / losses on investments |
|
|
- |
|
|
|
(724 |
) |
|
|
- |
|
|
|
(724 |
) |
|
Other (income) expense |
|
|
(30 |
) |
|
|
- |
|
|
|
- |
|
|
|
(30 |
) |
|
Transaction and integration related costs (2) |
|
|
2,266 |
|
|
|
- |
|
|
|
261 |
|
|
|
2,527 |
|
|
Location closure |
|
|
54 |
|
|
|
- |
|
|
|
|
|
|
|
54 |
|
|
DME management and monitoring fees |
|
|
178 |
|
|
|
- |
|
|
|
(136 |
) |
|
|
42 |
|
|
Adjusted EBITDA |
|
$ |
4,658 |
|
|
$ |
274 |
|
|
$ |
(2,136 |
) |
|
$ |
2,795 |
|
|
|
(1) |
Previously reported prior year amounts have been recast to reflect the full retrospective adoption of ASU 2020-06, Accounting for Convertible Instruments and Contracts in an Entity’s Own Equity; and to conform with current segment organization. |
|
|
(2) |
Transaction and integration related costs include costs to acquire and integrate acquired businesses. |
-8-