UNITED STATES
SECURITIES AND EXCHANGE COMMISSION
WASHINGTON, DC 20549
_______________________________________________________________________
FORM 8-K
__________________________________________________________________________
CURRENT REPORT PURSUANT
TO SECTION 13 OR 15(d) OF THE
SECURITIES EXCHANGE ACT OF 1934
Date of report (Date of earliest event reported): 10/27/2022
________________________________________________________________________
CURO GROUP HOLDINGS CORP
(Exact Name of Registrant as Specified in Its Charter)
________________________________________________________________________
| | | | | | | | |
| Delaware | 001-38315 | 90-0934597 |
| (State or other Jurisdiction of Incorporation) | (Commission File Number) | (IRS Employer Identification No.) |
| | |
3615 North Ridge Road, Wichita, Kansas | 67205 |
| (Address of Principal Executive Offices) | (Zip Code) |
(316) 772-3801
(Registrant’s Telephone Number, Including Area Code)
N/A
(Former Name or Former Address, if Changed Since Last Report)
________________________________________________________________________
Check the appropriate box below if the Form8-K filing is intended to simultaneously satisfy the filing obligation of the registrant under any of the following provisions:
| | | | | |
| ☐ | Written communications pursuant to Rule 425 under the Securities Act (17 CFR 230.425) |
| ☐ | Soliciting material pursuant to Rule 14a-12 under the Exchange Act (17 CFR 240.14a-12) |
| ☐ | Pre-commencement communications pursuant to Rule 14d-2(b) under the Exchange Act (17 CFR 240.14d-2(b)) |
| ☐ | Pre-commencement communications pursuant to Rule 13e-4(c) under the Exchange Act (17 CFR 240.13e-4(c)) |
Securities registered pursuant to Section 12(b) of the Act:
| | | | | | | | |
| Title of each class | Trading symbol(s) | Name of each exchange on which registered |
| Common stock | CURO | NYSE |
Indicate by check mark whether the registrant is an emerging growth company as defined in Rule 405 of the Securities Act of 1933 (§230.405 of this chapter) or Rule12b-2of the Securities Exchange Act of 1934(§240.12b-2of this chapter).
Emerging growth company ☐
If an emerging growth company, indicate by check mark if the registrant has elected not to use the extended transition period for complying with any new or revised financial accounting standards provided pursuant to Section 13(a) of the Exchange Act. ☐
ITEM 2.02 Results of Operations and Financial Condition
On November 2, 2022, CURO Group Holdings Corp. (the “Company”) issued a press release announcing its financial results for the three and nine months ended September 30, 2022. A copy of the press release and a supplemental presentation that will be used in conjunction with its earnings call with investors on November 2, 2022 is attached hereto as Exhibit 99.1 and Exhibit 99.2, respectively, and is incorporated herein by reference.
The information in this item, including Exhibit 99.1 and Exhibit 99.2, is being furnished, not filed. Accordingly, the information in this item will not be incorporated by reference into any registration statement unless specifically identified therein as being incorporated by reference therein.
ITEM 5.02 Departure of Directors or Certain Officers; Election of Directors; Appointment of Certain Officers; Compensatory Arrangements of Certain Officers.
On October 27, 2022, Roger Dean announced he will retire as the Company's Chief Financial Officer effective November 4, 2022. Mr. Dean will remain with the Company in an advisory capacity through a transition period.
Effective with Mr. Dean’s retirement, the Company's Board of Directors appointed Tamara Schulz as Interim Chief Financial Officer, to serve until the Company appoints a permanent Chief Financial Officer. Ms. Schulz, 47, has served as the Company’s Chief Accounting Officer since 2021, and will continue in this role. There are no family relationships between Ms. Schulz and any director or executive officer of the Company and she has no direct or indirect material interest in any transaction required to be disclosed pursuant to Item 404(a) of Regulation S-K.
ITEM 8.01 Other Events
Issac Vaughn, a director, has been appointed Chairman of the Nominating and Corporate Governance Committee (the “Governance Committee”) effective November 1, 2022. Chris Masto, Chairman of the Company’s Board of Directors, will remain as a member of the Governance Committee.
ITEM 9.01 Financial Statements and Exhibits
(d). Exhibits
| | | | | |
| Exhibit Number | Description |
| |
| 99.1 | |
| 99.2 | |
| 104 | Cover Page Interactive Data File (embedded within the Inline XBRL document) |
Signatures
Pursuant to the requirements of the Securities Exchange Act of 1934, the registrant has duly caused this report to be signed on its behalf by the undersigned hereunto duly authorized on this 2nd day of November, 2022.
CURO Group Holdings Corp.
By: /s/ Roger Dean______
Roger Dean
Executive Vice President and Chief Financial Officer
CURO Group Holdings Corp. Announces
Third Quarter 2022 Financial Results
Gross Loans Receivables Increased 115% year-over-year to $1.9 billion
Completed Divestiture of Legacy U.S. Business and Acquisition of First Heritage Credit
Completed $650 million of Non-recourse Warehouse Funding for U.S. Direct Lending
Upsized and Extended Flexiti Warehouse Funding
Wichita, Kansas--November 2, 2022-CURO Group Holdings Corp. (NYSE: CURO) (“CURO” or the “Company”), a tech-enabled, omni-channel consumer finance company serving a full spectrum of non-prime and prime consumers in the U.S. and Canada, today announced financial results for its third quarter ended September 30, 2022.
"With our strategic transformations completed, we are very pleased to end the third quarter with close to $1.9 billion of gross loans receivable across our three lines of business. These loans, which are more than double the same period last year, are longer duration, better credit quality and more resilient than our legacy portfolios," said Don Gayhardt, CURO's Chief Executive Officer. "Excluding the loans associated with our purchase of First Heritage and the sale of our legacy business, we grew our gross loans receivables by 10% sequentially in constant currency."
"Macroeconomic headwinds have continued to pressure our results on three fonts — benchmark interest rate increases, Canadian to U.S. dollar weakening and credit trends normalizing to pre-pandemic levels. We have begun taking actions — primarily to reduce ongoing operating expenses — that we expect will yield meaningful results beginning in the fourth quarter of 2022 and throughout 2023 to counterbalance these macroeconomic factors."
| | | | | | | | | | | | | | | | | | | | |
| Summarized Financial Information |
| (in thousands, unaudited) | | | | | |
| Revenue | Q3 2022 | Q3 2021 | | | Change $ | Change % |
Legacy U.S. Direct Lending (Divested) (1) | $10,581 | $126,990 | | | $(116,409) | (92)% |
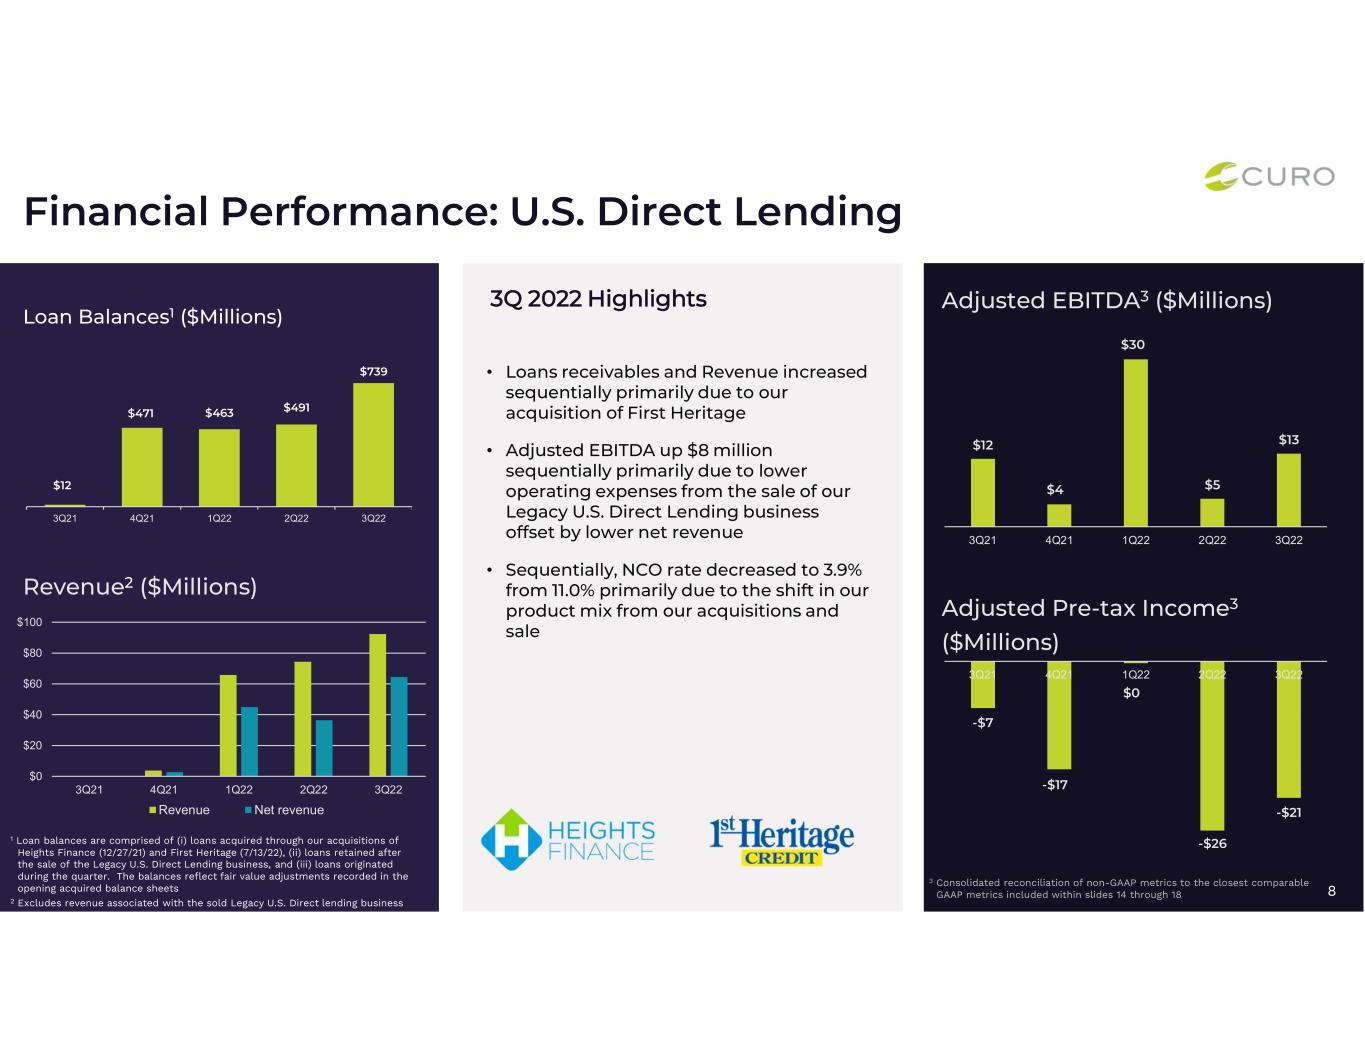
| US Direct Lending | 96,849 | 4,684 | | | 92,165 | 1968% |
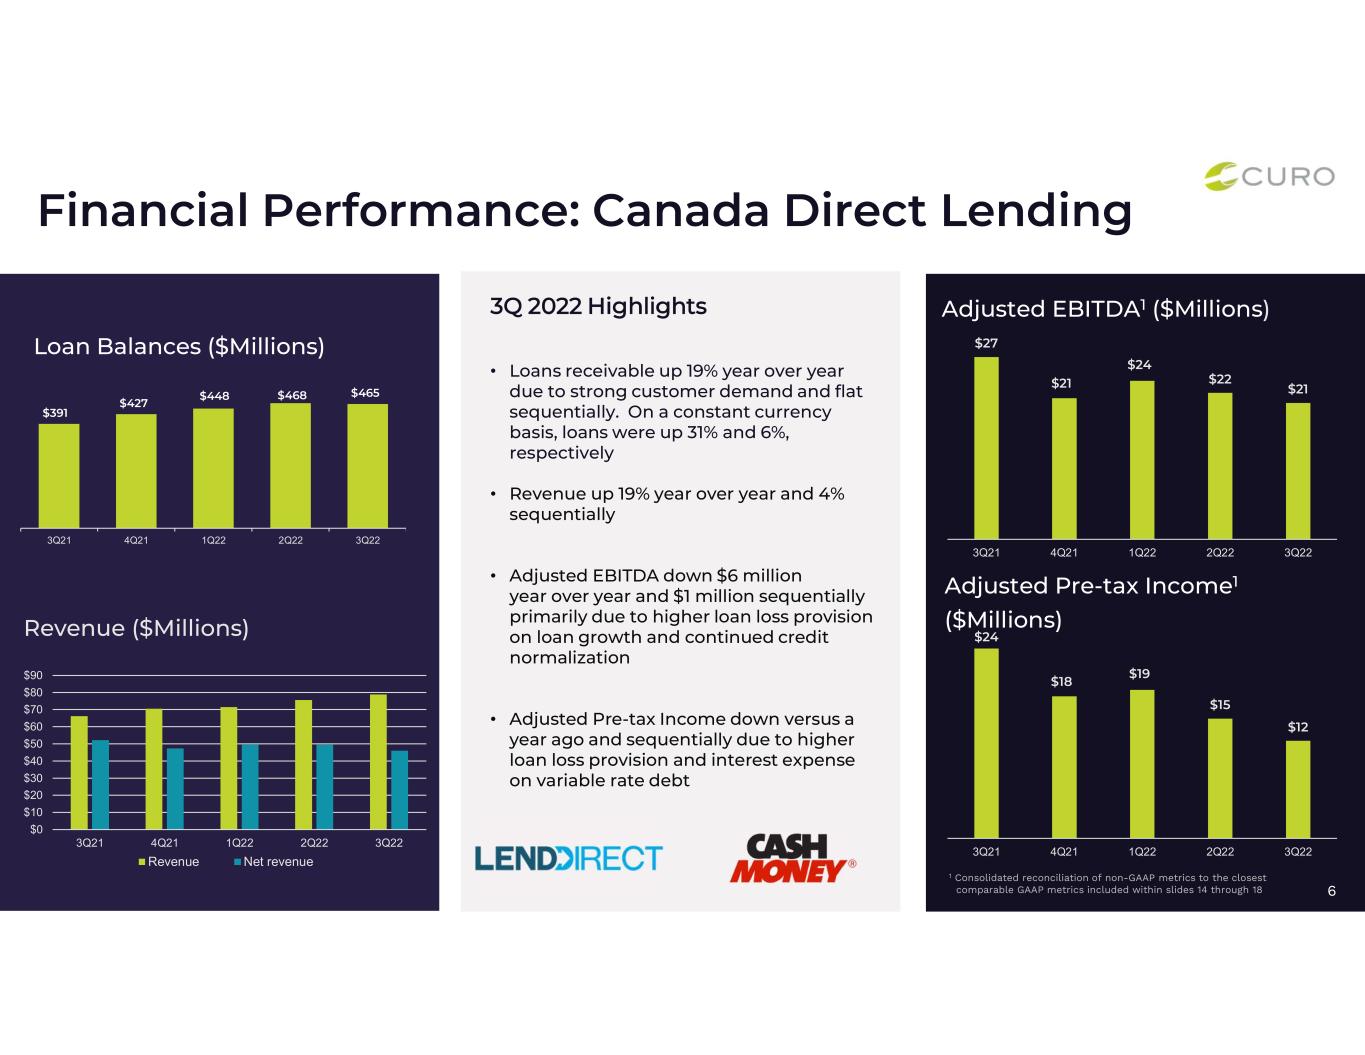
| Canada Direct Lending | 78,979 | 66,190 | | | 12,789 | 19% |
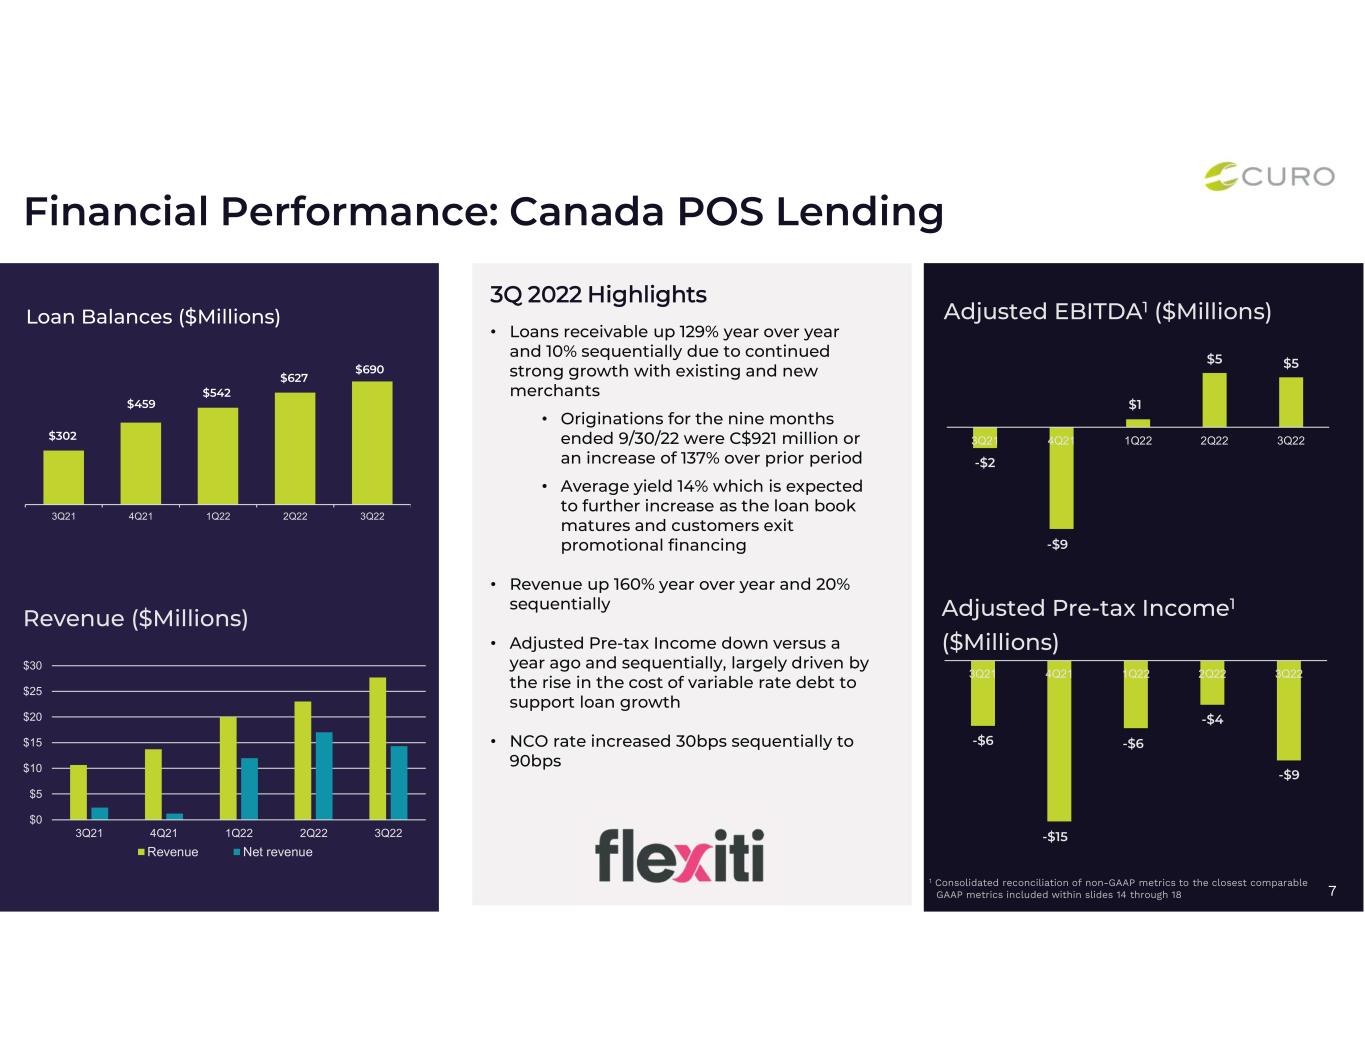
| Canada POS | 27,711 | 11,416 | | | 16,295 | 143% |
| Total Revenue | $214,120 | $209,280 | | | $4,840 | 2% |
| | | | | | |
| Loans Receivable | Q3 2022 | Q2 2022 | Q3 2021 | | Change $ | Change % |
Legacy U.S. Direct Lending (Divested) (1) | $— | $201,364 | $217,053 | | $(201,364) | (100)% |
| US Direct Lending | 739,100 | 527,998 | 11,539 | | 211,102 | 40% |
| Canada Direct Lending | 465,057 | 467,555 | 390,824 | | (2,498) | (1)% |
| Canada POS | 690,270 | 627,163 | 302,349 | | 63,107 | 10% |
| Total Loans Receivable | $1,894,427 | $1,824,080 | $921,765 | | $70,347 | 4% |
| | | | | | |
| NCO Rates | Q3 2022 | Q2 2022 | Q3 2021 | | | |
Legacy U.S. Direct Lending (Divested) (1) | 3.5% | 23.8% | 19.8% | | | |
| US Direct Lending | 3.9% | 5.0% | ** | | | |
| Canada Direct Lending | 5.9% | 5.0% | 3.3% | | | |
| Canada POS | 0.9% | 0.6% | 0.7% | | | |
| Consolidated NCO Rates | 3.3% | 6.0% | 7.3% | | | |
| | | | | | |
| (1) Loans receivable and NCO rates for Legacy U.S. Direct Lending (Divested) represents gross combined loans receivable for the Legacy U.S. Direct Lending business. Gross combined loans receivable is a non-GAAP metric which represents gross loans receivable plus loans originated by third-party lenders which are Guaranteed by the Company. Legacy U.S. Direct Lending (Divested) revenue represents revenue related to gross combined loans receivable. |
| ** Not meaningful | | | | | | |
Consolidated Summary Results
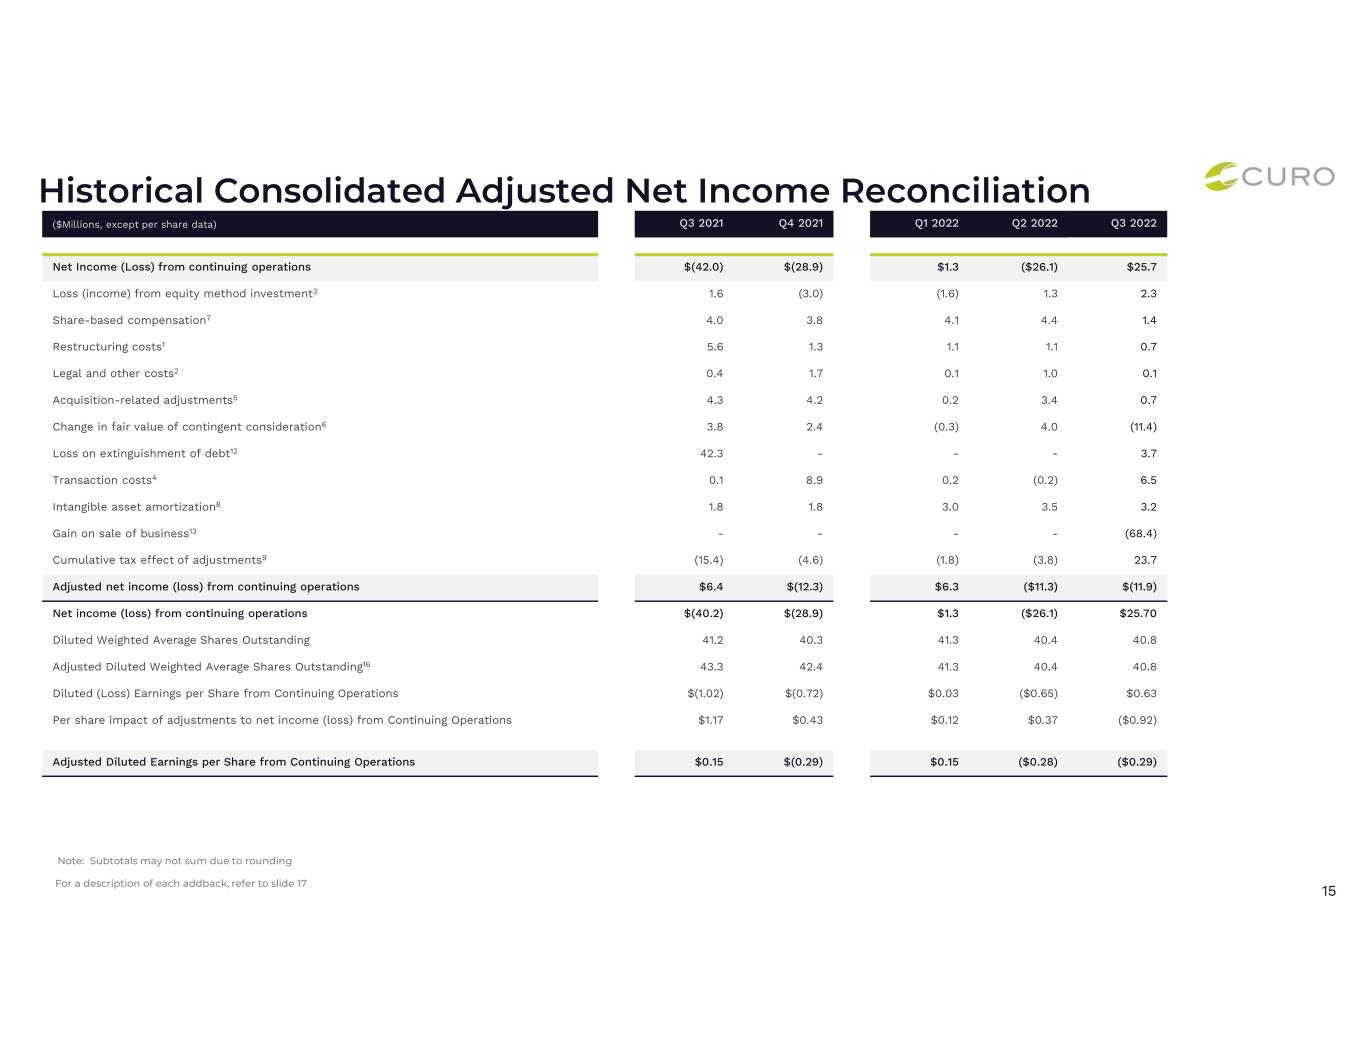
We reported Net income of $25.7 million ($0.63 earnings per share) and Adjusted net loss of $11.9 million ($0.29 adjusted loss per share) on total revenue of $214.1 million for the three months ended September 30, 2022, compared with Net loss of $42.0 million ($1.02 per share) and Adjusted net income of $6.4 million ($0.15 adjusted diluted earnings per share) on total revenue of $209.3 million for the three months ended September 30, 2021.
On July 8, 2022, the Company completed the sale of our Legacy U.S. Direct Lending business to Community Choice Financial for $345.0 million, resulting in a gain on sale of business of $68.4 million recorded in the third quarter of 2022. On July 13, 2022, we completed the acquisition of First Heritage Credit, LLC (“First Heritage”), a consumer lender that provides near-prime installment loans along with customary opt-in insurance and other financial products, for $140.0 million in cash. On December 27, 2021, we closed the acquisition of Heights Finance, a consumer finance company that provides Installment loans and offers customary opt-in insurance and other financial products or a total purchase price of $360.0 million ($335.0 million in cash plus $25.0 million in stock). The completion of these transactions completed our strategic transition into longer term, higher balance and lower rate credit products.
The improvement in Net income in the third quarter of 2022 compared to the same period in 2021 was primarily driven by (i) the $68.4 million Gain on sale of business recorded in the third quarter resulting from the completion of the divestiture of our Legacy U.S. Direct Lending business in July 2022, (ii) a $11.4 million adjustment to the fair value of contingent consideration recorded in connection with our acquisition of Flexiti, and (iii) in the third quarter of 2021, a $40.2 million loss on the extinguishment and refinancing of our former senior notes ("8.25% Senior Secured Notes"), partially offset by a year-over-year $24.3 million increase in interest expense in the third quarter of 2022. The increase in interest expense in the third quarter of 2022 compared to the same period in 2021 was driven by (i) an increase in benchmark rates on variable rate debt, (ii) Senior Notes issued to fund in part our Heights Finance acquisition, and (iii) increased non-recourse asset-backed lending (ABL) borrowing to support organic loan growth and acquired portfolios.
Below are additional highlights of our performance this year:
•Revenue and Net Revenue
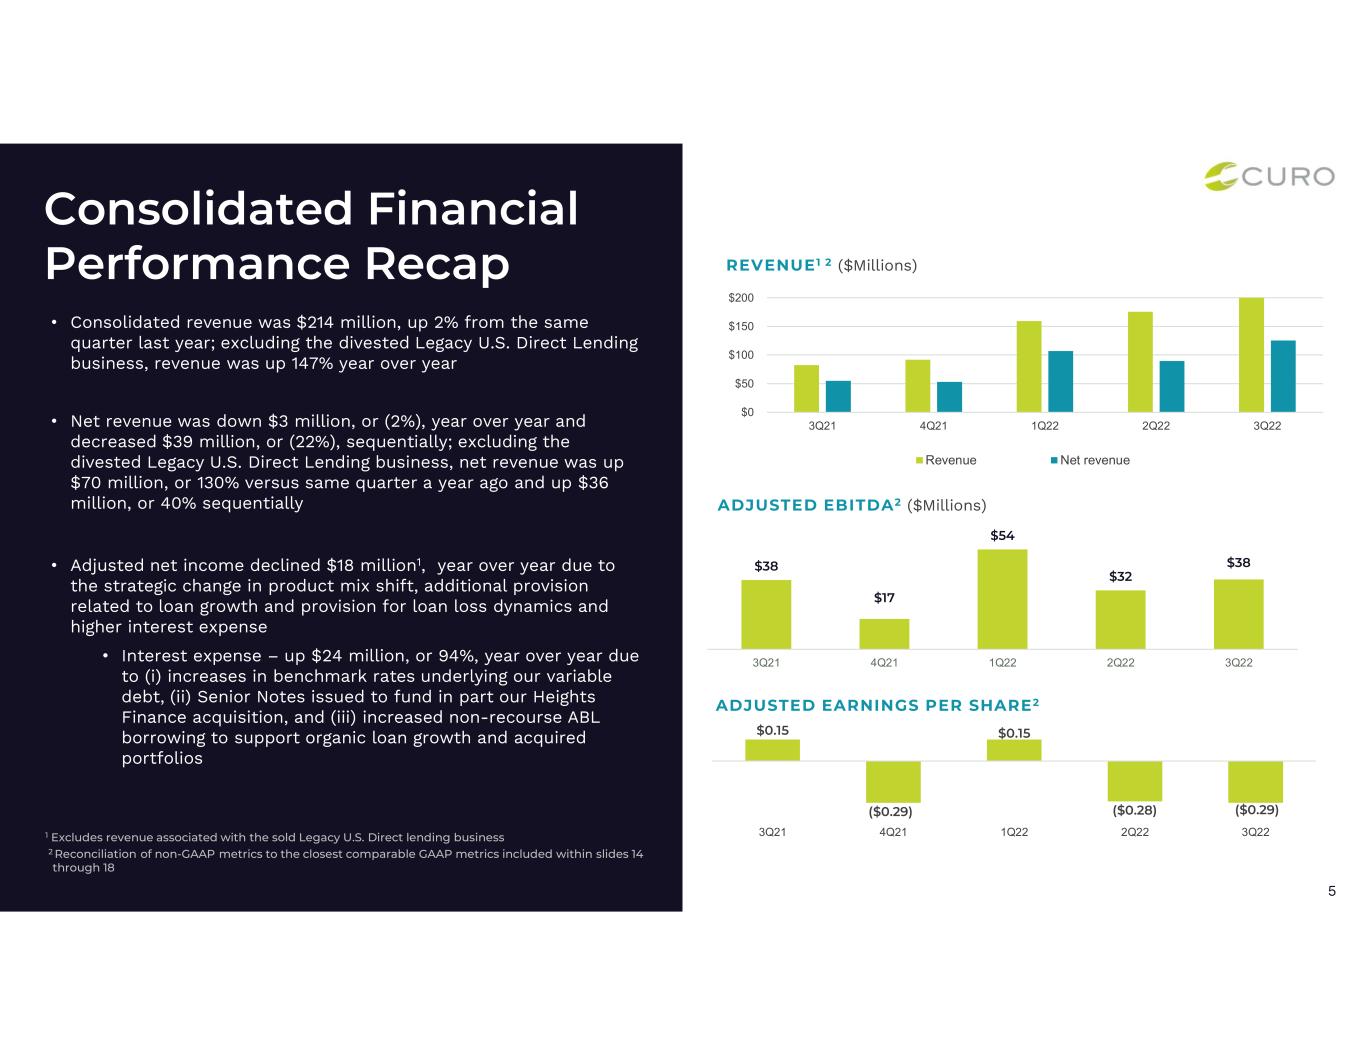
◦Revenue increased $4.8 million, or 2.3%, year over year, primarily driven by revenue growth in Canada POS Lending and Canada Direct Lending of 142.7% and 19.3%, respectively, and revenue related to the Heights Finance and First Heritage acquisitions. U.S. revenue declined 18.4% primarily as a result of the July 2022 divestiture of our Legacy U.S. Direct Lending business. The strategic mix shift from the divested Legacy U.S. Direct Lending business' high-cost, short-term lending to the longer-duration, lower risk consumer finance acquisitions, also affected the relationship between loan growth and revenue growth.
◦Sequentially, revenue decreased $90.3 million, or 29.7%, driven by the July 2022 divestiture of our Legacy U.S. Direct Lending business.
◦For the three months ended September 30, 2022, net revenue decreased $2.8 million, or 2.1%, year over year, and $39.1 million, or 22.4%, sequentially primarily driven by lower revenue attributable to our strategic change in product mix and the additional provision for loan losses driven by loan growth.
•Loans Receivable
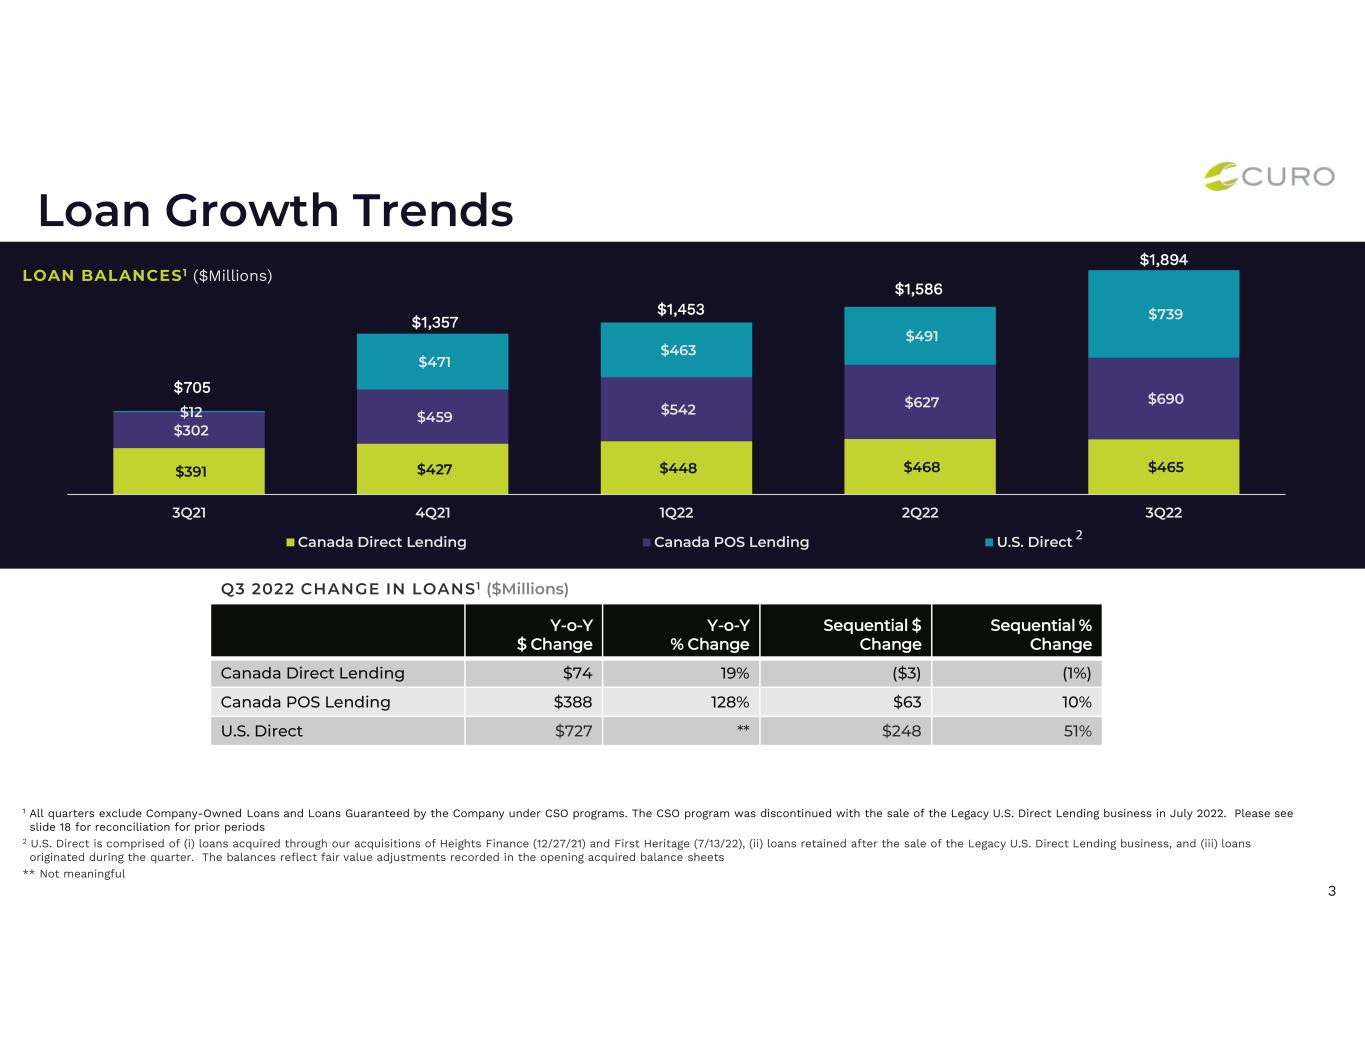
◦Year-over-year growth in Gross loans receivable of $1,012.1 million, or 114.7%, was primarily driven by an increase of $549.9 million due to the acquisitions of Heights Finance and First Heritage offset by the sale of the Legacy U.S. Direct Lending business, as well as increases of $387.9 million for Canada POS Lending and $74.2 million for Canada Direct Lending.
◦Sequential loan growth in Gross loans receivable of $113.6 million, or 6.4% was primarily due to growth in Canada POS Lending of $63.1 million, or 10.1%, and growth in U.S. Lending of $53.0 million, or 7.7%, primarily due to the acquisition of First Heritage offset by the sale of the Legacy U.S. Direct Lending business.
•NCOs and Delinquency Metrics
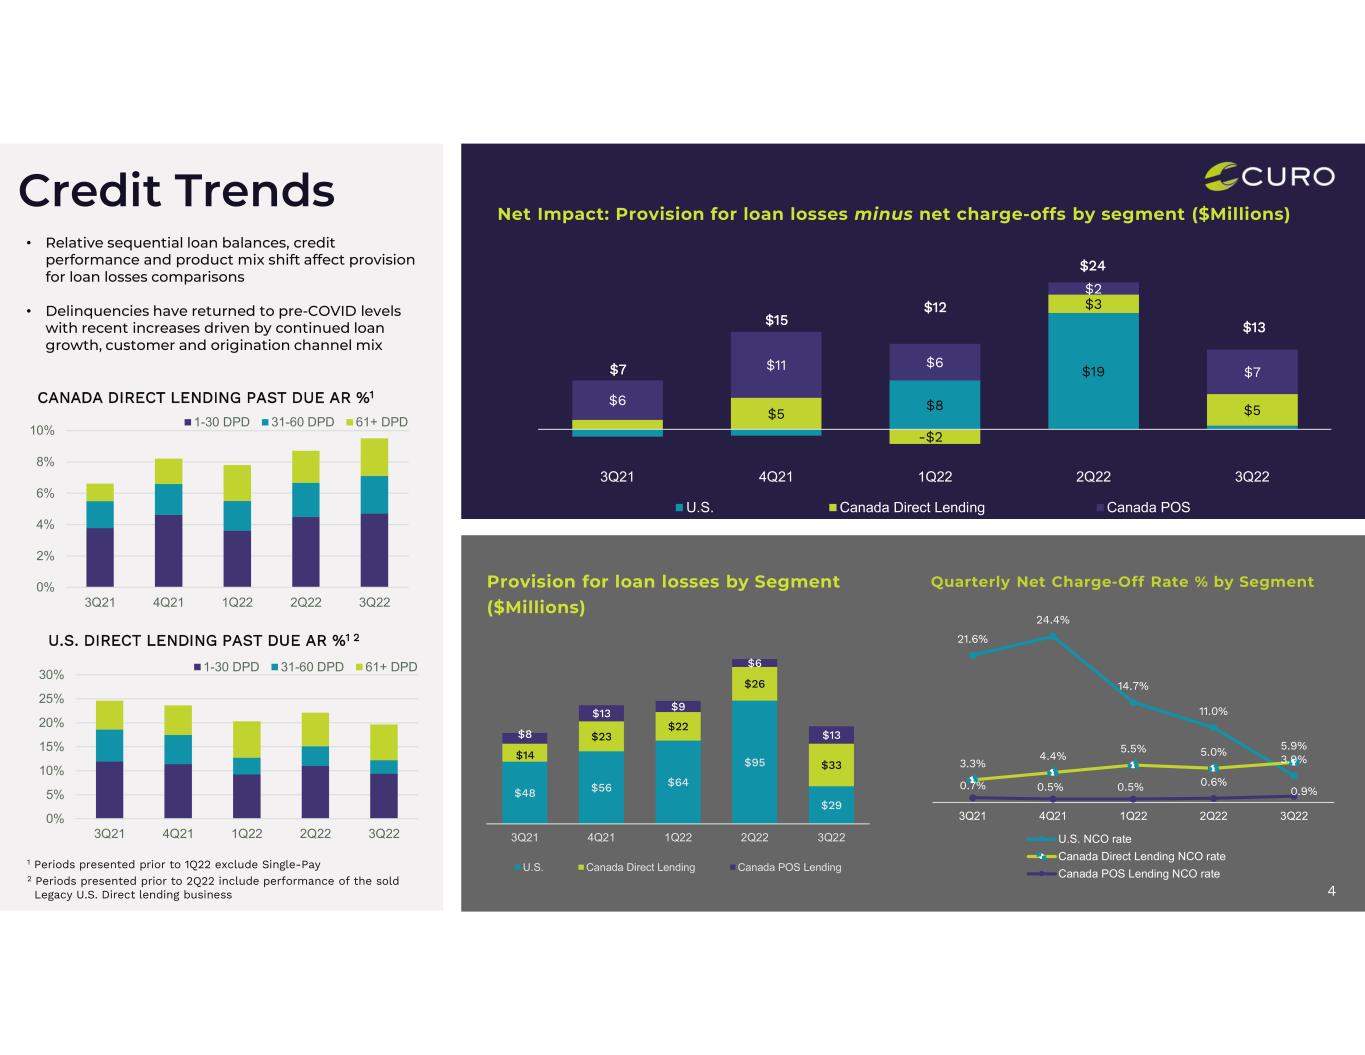
◦Consolidated quarterly NCO rates improved by 396 bps, and consolidated 31+ past due rates decreased 332 bps year over year, respectively, primarily attributable to mix shift from (i) the relative growth of Canada POS Lending, (ii) the acquisition of Heights Finance and First Heritage, and (iii) the sale of the Legacy U.S. Direct Lending business, all of which shifts our loan portfolio mix to lower loss-rate products.
◦Sequentially, consolidated quarterly NCO rates improved by 266 bps, and consolidated 31+ past-due rates decreased by 592 bps, respectively, largely driven by loan growth in (i) U.S. Direct Lending and Canada POS Lending, which have lower NCO rates, in addition to the sale of Legacy U.S. Direct Lending business, which was a higher expected loss-rate product.
•Other Highlights
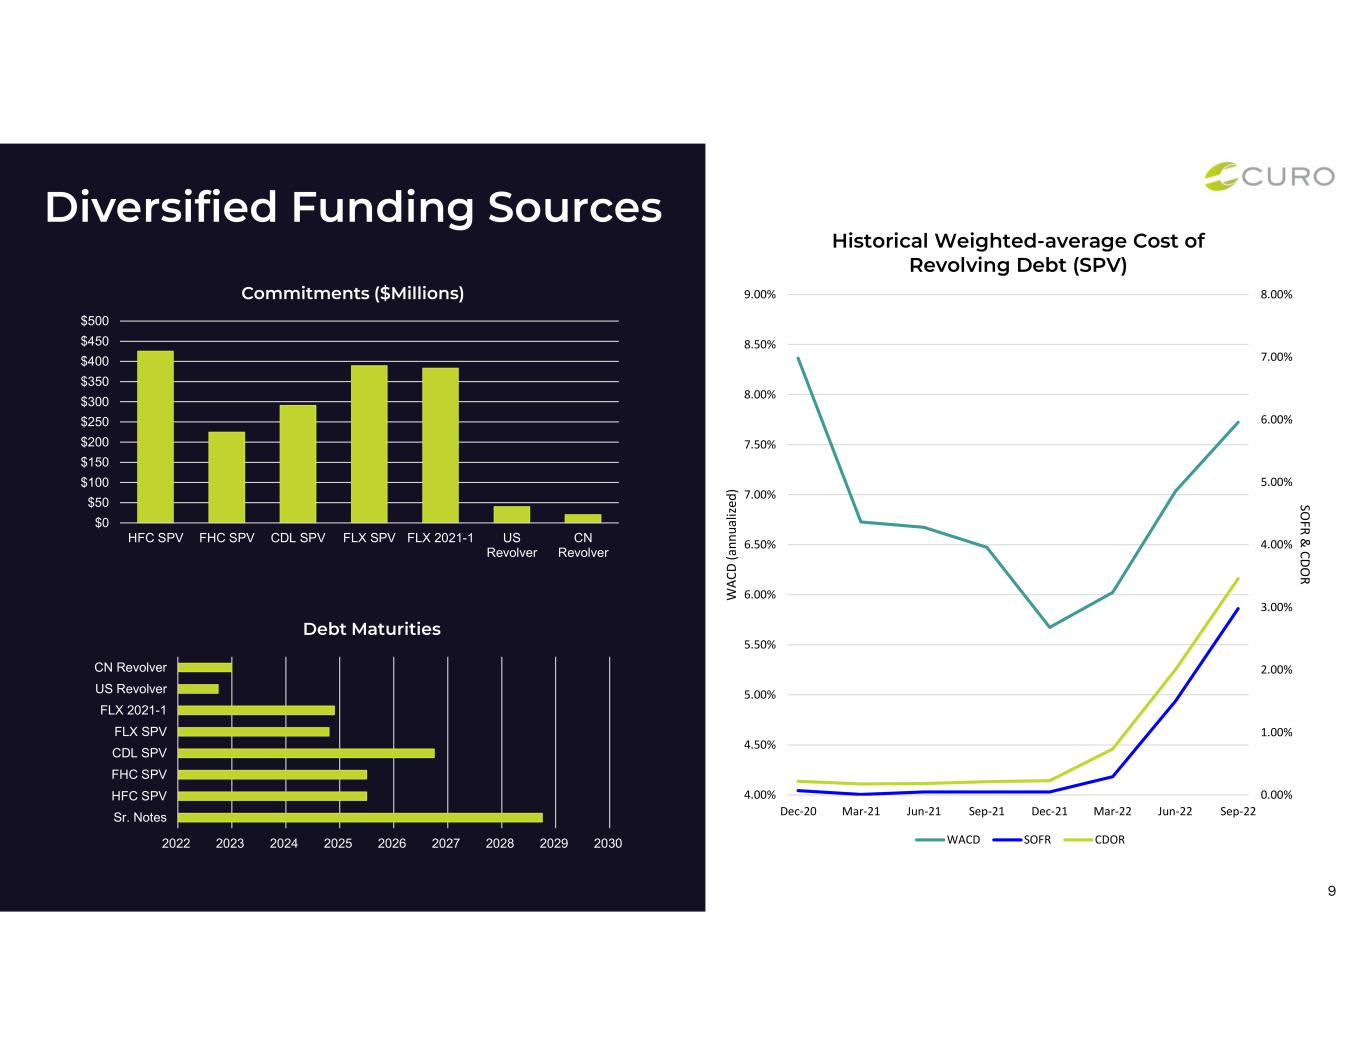
◦on July 13, 2022, concurrently with the closing of the First Heritage acquisition, we entered into a new $225.0 million non-recourse revolving warehouse facility to replace First Heritage's incumbent lender's facility and to finance future loans originated by First Heritage.
◦On July 15, 2022, we entered into a new $425.0 million non-recourse revolving warehouse facility to replace the incumbent lender's facility and finance future loans originated by Heights Finance.
◦On September 29, 2022, we amended the existing Flexiti credit facility to increase the borrowing capacity from C$500 million to C$535 million and extended its maturity to September 29, 2025.
Results of Consolidated Operations
Beginning January 1, 2022, we began reporting "Interest and fees revenue," "Insurance premiums and commissions" and "Other revenue" in place of our previously reported "Revenue" on our Statements of Operations. Prior period presentations have been revised to conform to the current period presentation.
Table 1 - Consolidated Statements of Operations
| | | | | | | | | | | | | | | | | | | | | | | | | | | | | | | | |
| (in thousands, unaudited) | | Three Months Ended September 30, | | Nine Months Ended September 30, |
| 2022 | 2021 | Change $ | Change % | | 2022 | 2021 | Change $ | Change % |
| Revenue | | | | | | | | | | |
| Interest and fees revenue | | $ | 180,515 | | $ | 190,629 | | $ | (10,114) | | (5.3) | % | | 723,802 | | 539,155 | | 184,647 | | 34.2 | % |
| Insurance premiums and commissions | | 24,746 | | 12,599 | | 12,147 | | 96.4 | % | | 61,659 | | 36,021 | | 25,638 | | 71.2 | % |
| Other revenue | | 8,859 | | 6,052 | | 2,807 | | 46.4 | % | | 23,259 | | 18,348 | | 4,911 | | 26.8 | % |
| Total revenue | | 214,120 | | 209,280 | | 4,840 | | 2.3 | % | | 808,720 | | 593,524 | | 215,196 | | 36.3 | % |
| Provision for losses | | 78,399 | | 70,718 | | 7,681 | | 10.9 | % | | 305,476 | | 152,028 | | 153,448 | | # |
| Net revenue | | 135,721 | | 138,562 | | (2,841) | | (2.1) | % | | 503,244 | | 441,496 | | 61,748 | | 14.0 | % |
| Operating Expenses | | | | | | | | | | |
| Salaries and benefits | | 53,413 | | 62,110 | | (8,697) | | (14.0) | % | | 215,569 | | 175,347 | | 40,222 | | 22.9 | % |
| Occupancy | | 12,827 | | 13,732 | | (905) | | (6.6) | % | | 47,371 | | 41,862 | | 5,509 | | 13.2 | % |
| Advertising | | 5,244 | | 9,697 | | (4,453) | | (45.9) | % | | 28,451 | | 24,824 | | 3,627 | | 14.6 | % |
| Direct operations | | 11,729 | | 14,883 | | (3,154) | | (21.2) | % | | 52,296 | | 40,552 | | 11,744 | | 29.0 | % |
| Depreciation and amortization | | 9,499 | | 7,285 | | 2,214 | | 30.4 | % | | 27,985 | | 19,685 | | 8,300 | | 42.2 | % |
| Other operating expense | | 23,646 | | 14,851 | | 8,795 | | 59.2 | % | | 58,809 | | 45,020 | | 13,789 | | 30.6 | % |
| Total operating expenses | | 116,358 | | 122,558 | | (6,200) | | (5.1) | % | | 430,481 | | 347,290 | | 83,191 | | 24.0 | % |
| Other expense (income) | | | | | | | | | | |
| Interest expense | | 50,149 | | 25,805 | | 24,344 | | 94.3 | % | | 130,683 | | 68,784 | | 61,899 | | 90.0 | % |
| Loss (income) from equity method investment | | 2,309 | | 1,582 | | 727 | | 46.0 | % | | 2,053 | | (676) | | 2,729 | | # |
| Gain from equity method investment | | — | | — | | — | | # | | — | | (135,387) | | 135,387 | | # |
| Loss on extinguishment of debt | | 3,702 | | 40,206 | | (36,504) | | (90.8) | % | | 3,702 | | 40,206 | | (36,504) | | (90.8) | % |
| (Gain) loss on change in fair value of contingent consideration | | (11,355) | | 3,825 | | (15,180) | | # | | (7,605) | | 3,825 | | (11,430) | | # |
| Gain on sale of business | | (68,443) | | — | | (68,443) | | # | | (68,443) | | — | | (68,443) | | # |
| Total other (income) expense | | (23,638) | | 71,418 | | (95,056) | | # | | 60,390 | | (23,248) | | 83,638 | | # |
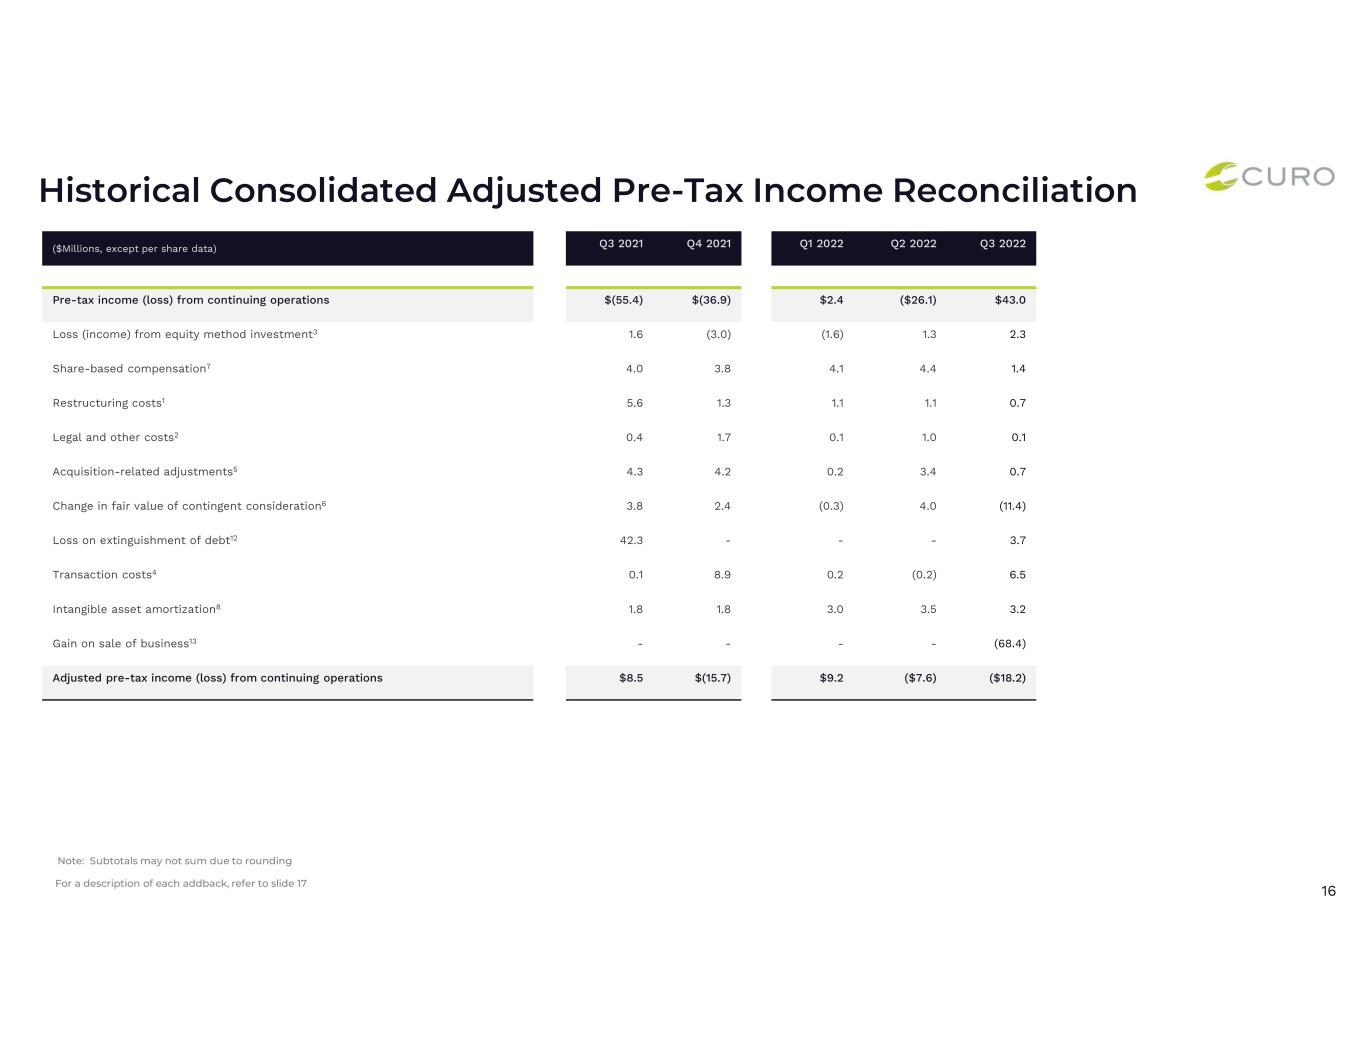
| Income (loss) before income taxes | | 43,001 | | (55,414) | | 98,415 | | # | | 12,373 | | 117,454 | | (105,081) | | (89.5) | % |
| Provision (benefit) for income taxes | | 17,348 | | (13,375) | | 30,723 | | # | | 11,464 | | 29,241 | | (17,777) | | (60.8) | % |
| Net income (loss) | | $ | 25,653 | | $ | (42,039) | | $ | 67,692 | | # | | $ | 909 | | $ | 88,213 | | $ | (87,304) | | (99.0) | % |
| # - Variance greater than 100% or not meaningful |
Table 2 - Consolidated Balance Sheets
(in thousands)
| | | | | | | | | | | |
| September 30, 2022 (unaudited) | | December 31, 2021 |
| ASSETS |
| Cash and cash equivalents | $ | 45,683 | | | $ | 63,179 | |
| Restricted cash | 144,020 | | | 98,896 | |
| Gross loans receivable | 1,894,427 | | | 1,548,318 | |
| Less: Allowance for loan losses | (102,743) | | | (87,560) | |
| Loans receivable, net | 1,791,684 | | | 1,460,758 | |
| Income taxes receivable | 13,469 | | | 31,774 | |
| Prepaid expenses and other | 65,167 | | | 42,038 | |
| Property and equipment, net | 37,402 | | | 54,635 | |
| Investment in Katapult | 25,848 | | | 27,900 | |
| Right of use asset - operating leases | 64,683 | | | 116,300 | |
| Deferred tax assets | 31,986 | | | 15,639 | |
| Goodwill | 424,292 | | | 429,792 | |
| Intangibles, net | 120,345 | | | 109,930 | |
| Other assets | 12,774 | | | 9,755 | |
| Total Assets | $ | 2,777,353 | | | $ | 2,460,596 | |
| LIABILITIES AND STOCKHOLDERS' EQUITY |
| Liabilities | | | |
| Accounts payable and accrued liabilities | $ | 66,723 | | | $ | 121,434 | |
| Deferred revenue | 25,111 | | | 21,649 | |
| Lease liability - operating leases | 66,370 | | | 122,431 | |
| Contingent consideration related to acquisition | 15,770 | | | 26,508 | |
| Income taxes payable | — | | | 680 | |
| Accrued interest | 18,048 | | | 34,974 | |
| Liability for losses on CSO lender-owned consumer loans | — | | | 6,908 | |
| Debt | 2,449,316 | | | 1,945,793 | |
| Other long-term liabilities | 11,563 | | | 13,845 | |
| Deferred tax liabilities | — | | | 6,044 | |
| Total Liabilities | $ | 2,652,901 | | | $ | 2,300,266 | |
| Total Stockholders' Equity | 124,452 | | | 160,330 | |
| Total Liabilities and Stockholders' Equity | $ | 2,777,353 | | | $ | 2,460,596 | |
Table 3 - Consolidated Revenue by Product and Segment
The following table summarizes revenue by product related to our business lines.
| | | | | | | | | | | | | | | | | | | | | | | | | | | | | | | | | | | | | | |
| | Three Months Ended |
| | September 30, 2022 | | September 30, 2021 |
| (in thousands, unaudited) | | U.S. | Canada Direct Lending | Canada POS Lending | Total | % of Total | | U.S. | Canada Direct Lending | Canada POS Lending | Total | % of Total |
| Revolving LOC | | $ | 2,210 | | $ | 50,251 | | $ | 24,575 | | $ | 77,036 | | 36.0 | % | | $ | 27,377 | | $ | 40,239 | | $ | 10,646 | | $ | 78,262 | | 37.4 | % |
| Installment | | 90,834 | | 12,645 | | — | | 103,479 | | 48.3 | % | | 101,036 | | 11,331 | | — | | 112,367 | | 53.7 | % |
| Total interest and fees | | 93,044 | | 62,896 | | 24,575 | | 180,515 | | 84.3 | % | | 128,413 | | 51,570 | | 10,646 | | 190,629 | | 91.1 | % |
| Insurance premiums and commissions | | 9,986 | | 14,045 | | 715 | | 24,746 | | 11.6 | % | | — | | 12,506 | | 93 | | 12,599 | | 6.0 | % |
| Other revenue | | 4,400 | | 2,038 | | 2,421 | | 8,859 | | 4.1 | % | | 3,261 | | 2,114 | | 677 | | 6,052 | | 2.9 | % |
| Total revenue | | $ | 107,430 | | $ | 78,979 | | $ | 27,711 | | $ | 214,120 | | 100.0 | % | | $ | 131,674 | | $ | 66,190 | | $ | 11,416 | | $ | 209,280 | | 100.0 | % |
| | | | | | | | | | | | | | | | | | | | | | | | | | | | | | | | | | | | | | |
| | Nine Months Ended |
| | September 30, 2022 | | September 30, 2021 |
| (in thousands, unaudited) | | U.S. | Canada Direct Lending | Canada POS Lending | Total | % of Total | | U.S. | Canada Direct Lending | Canada POS Lending | Total | % of Total |
| Revolving LOC | | $ 57,269 | | $ 143,296 | | $ 64,077 | | $ 264,642 | | 32.7 | % | | $ 78,391 | | $ 112,057 | | $ 18,585 | | $ 209,033 | | 35.2 | % |
| Installment | | 423,537 | | 35,623 | | — | | 459,160 | | 56.8 | % | | 297,803 | | 32,319 | | — | | 330,122 | | 55.6 | % |
| Total interest and fees | | 480,806 | | 178,919 | | 64,077 | | 723,802 | | 89.5 | % | | 376,194 | | 144,376 | | 18,585 | | 539,155 | | 90.8 | % |
| Insurance premiums and commissions | | 19,310 | | 40,988 | | 1,361 | | 61,659 | | 7.6 | % | | — | | 35,753 | | 268 | | 36,021 | | 6.1 | % |
| Other revenue | | 11,424 | | 6,100 | | 5,735 | | 23,259 | | 2.9 | % | | 10,766 | | 6,381 | | 1,201 | | 18,348 | | 3.1 | % |
| Total revenue | | $ 511,540 | | $ 226,007 | | $ 71,173 | | $ 808,720 | | 100.0 | % | | $ 386,960 | | $ 186,510 | | $ 20,054 | | $ 593,524 | | 100.0 | % |
Table 4 - Consolidated Loans Receivable
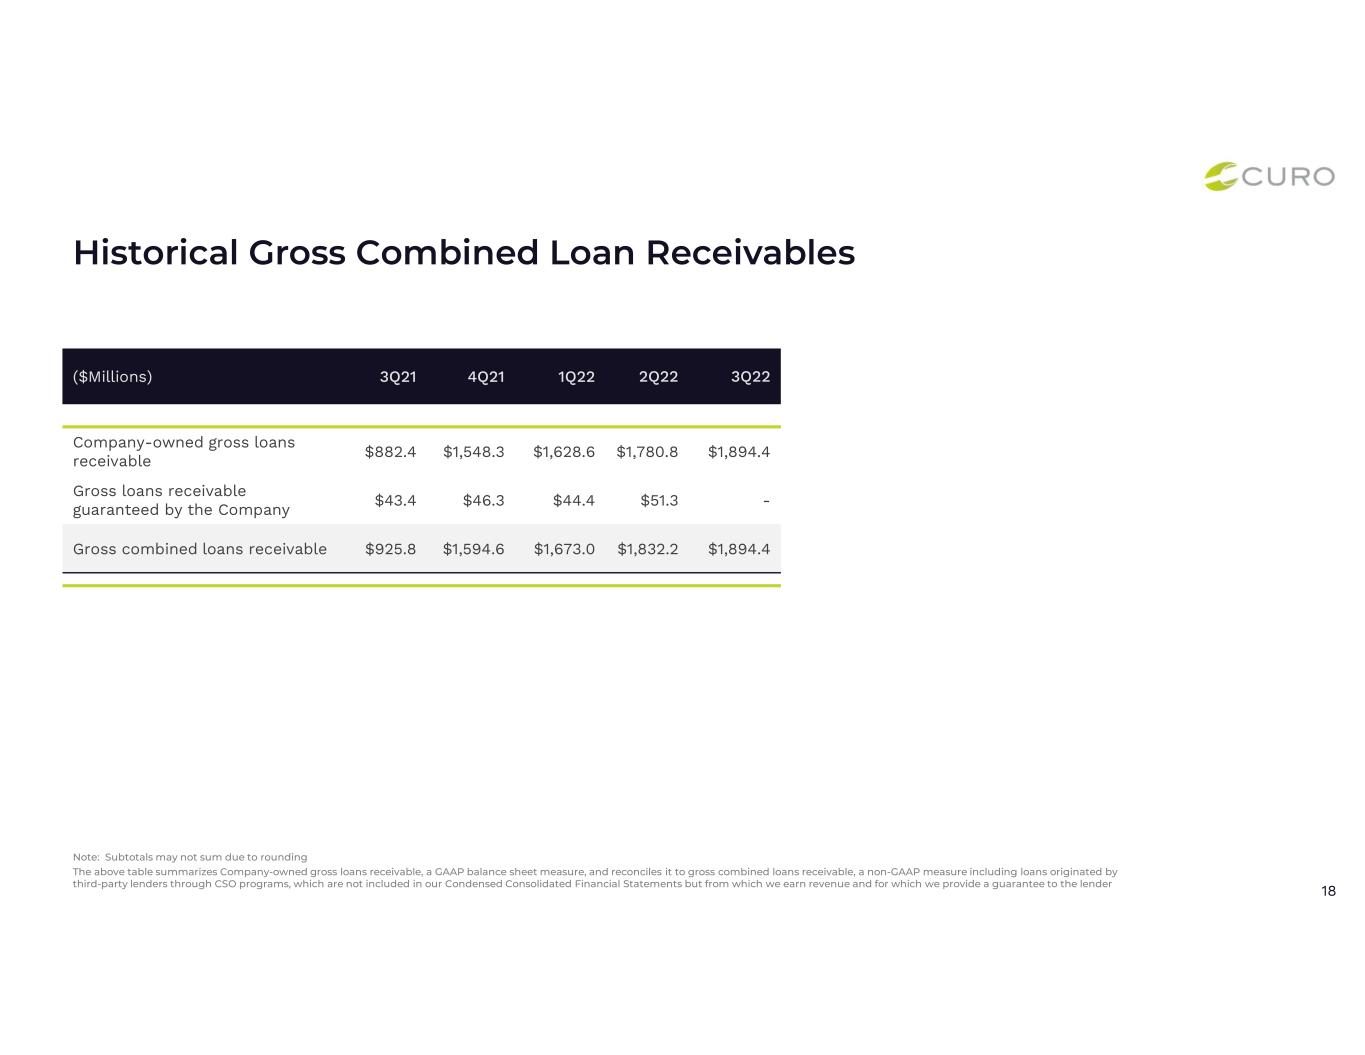
The following table presents our gross loans receivables. With the sale of the Legacy U.S. Direct Lending business, we no longer guarantee loans originated by third-party lenders through CSO programs.
| | | | | | | | | | | | | | | | | | | | | | | | | | | | | | | | | | | | | | | | | | | | | | | | | | | | | | | | | | | | |
| | | | | As of | | | | | | | | | |
| (in thousands, unaudited) | | | September 30,
2022 | | June 30,
2022 | | March 31,
2022 | | December 31,
2021 | | September 30,
2021 | | | | | | | | | | | | | | | | | | | | | | | |
| U.S. | | | | | | | | | | | | | | | | | | | | | | | | | | | | | | | | | | | | | | |
| Revolving LOC | | | $ | — | | | $ | 58,471 | | | $ | 49,077 | | | $ | 52,532 | | | $ | 51,196 | | | | | | | | | | | | | | | | | | | | | | | | | | | | |
| Installment - Company Owned | | | 739,100 | | | 627,651 | | | 589,652 | | | 609,413 | | | 137,987 | | | | | | | | | | | | | | | | | | | | | | | | | | | | |
| Canada Direct Lending | | | | | | | | | | | | | | | | | | | | | | | | | | | | | | | | | | | | | | |
| Revolving LOC | | | 439,117 | | | 442,738 | | | 424,485 | | | 402,405 | | | 366,509 | | | | | | | | | | | | | | | | | | | | | | | | | | | | |
| Installment | | | 25,940 | | | 24,817 | | | 23,578 | | | 24,792 | | | 24,315 | | | | | | | | | | | | | | | | | | | | | | | | | | | | |
| Canada POS Lending | | | | | | | | | | | | | | | | | | | | | | | | | | | | | | | | | | | | | | |
| Revolving LOC | | | 690,270 | | | 627,163 | | | 541,776 | | | 459,176 | | | 302,349 | | | | | | | | | | | | | | | | | | | | | | | | | | | | |
| Company Owned gross loans receivable | | | $ | 1,894,427 | | | $ | 1,780,840 | | | $ | 1,628,568 | | | $ | 1,548,318 | | | $ | 882,356 | | | | | | | | | | | | | | | | | | | | | | | | | | | | |
| Gross loans receivable Guaranteed by the Company | | | — | | | 51,323 | | | 44,420 | | | 46,317 | | | 43,422 | | | | | | | | | | | | | | | | | | | | | | | | | | | | |
Gross combined loans receivable (1) | | | $ | 1,894,427 | | | $ | 1,832,163 | | | $ | 1,672,988 | | | $ | 1,594,635 | | | $ | 925,778 | | | | | | | | | | | | | | | | | | | | | | | | | | | | |
(1) See "Non-GAAP Financial Measures" at the end of this release for definition and more information. | | | | | | | | | | | | | | | | | |
Segment Analysis
The following tables provide a summary of segment operating (loss) income and portfolio performance for the segment and period indicated.
Table 5 - Summary of Segment Operating (Loss) Income
| | | | | | | | | | | | | | | | | | | | | | | | | | | | | | |
| Three Months Ended September 30, 2022 | | Three Months Ended September 30, 2021 | | | | |
| (dollars in thousands, unaudited) | U.S. | Canada Direct Lending | Canada POS Lending | | U.S. | Canada Direct Lending | Canada POS Lending | | | | | | | |
| Total revenue | $ | 107,430 | | $ | 78,979 | | $ | 27,711 | | | $ | 131,674 | | $ | 66,190 | | $ | 11,416 | | | | | | | | |
| Provision for losses | 32,073 | | 32,947 | | 13,379 | | | 48,430 | | 14,003 | | 8,285 | | | | | | | | |
| Net revenue | 75,357 | | 46,032 | | 14,332 | | | 83,244 | | 52,187 | | 3,131 | | | | | | | | |
| Total operating expenses | 76,067 | | 26,773 | | 13,518 | | | 84,074 | | 26,003 | | 12,481 | | | | | | | | |
| Non-recourse interest expense | 11,226 | | 7,237 | | 11,700 | | | 2,598 | | 2,529 | | 3,880 | | | | | | | | |
| Recourse interest expense | 19,739 | | (47) | | 294 | | | 16,883 | | (89) | | 4 | | | | | | | | |
| Segment operating (loss) income | $ | (31,675) | | $ | 12,069 | | $ | (11,180) | | | $ | (20,311) | | $ | 23,744 | | $ | (13,234) | | | | | | | | |
| | | | | | | | | | | | | | | | | | | | | | | | | | | | | | |
| Nine Months Ended September 30, 2022 | | Nine Months Ended September 30, 2021 | | | | |
| (dollars in thousands, unaudited) | U.S. | Canada Direct Lending | Canada POS Lending | | U.S. | Canada Direct Lending | Canada POS Lending | | | | | | | |
| Total revenue | $ | 511,540 | | $ | 226,007 | | $ | 71,173 | | | $ | 386,960 | | $ | 186,510 | | $ | 20,054 | | | | | | | | |
| Provision for losses | 196,461 | | 80,960 | | 28,055 | | | 108,108 | | 31,793 | | 12,127 | | | | | | | | |
| Net revenue | 315,079 | | 145,047 | | 43,118 | | | 278,852 | | 154,717 | | 7,927 | | | | | | | | |
| Total operating expenses | 302,641 | | 82,126 | | 45,714 | | | 245,623 | | 76,090 | | 25,577 | | | | | | | | |
| Non-recourse interest expense | 26,635 | | 17,442 | | 25,998 | | | 6,728 | | 7,562 | | 8,302 | | | | | | | | |
| Recourse interest expense | 59,838 | | (75) | | 845 | | | 46,449 | | (269) | | 12 | | | | | | | | |
| Segment operating (loss) income | $ | (74,035) | | $ | 45,554 | | $ | (29,439) | | | $ | (19,948) | | $ | 71,334 | | $ | (25,964) | | | | | | | | |
Table 6 - Summary of Adjusted Segment Operating (Loss) Income
| | | | | | | | | | | | | | | | | | | | | | | | | | | | | | | | | | | | | | | | | | | | | | | | | | | |
| Three Months Ended September 30, 2022 | | Three Months Ended September 30, 2021 | | | | | | | | | | | |
| (dollars in thousands, unaudited) | U.S. | Canada Direct Lending | Canada POS Lending | | U.S. | Canada Direct Lending | Canada POS Lending | | | | | | | | | | | | | | |
| Total revenue | $ | 107,430 | | $ | 78,979 | | $ | 27,711 | | | $ | 131,674 | | $ | 66,190 | | $ | 11,416 | | | | | | | | | | | | | | | |
| Provision for losses | 32,073 | | 32,947 | | 13,379 | | | 48,430 | | 14,003 | | 8,285 | | | | | | | | | | | | | | | |
| Net revenue | 75,357 | | 46,032 | | 14,332 | | | 83,244 | | 52,187 | | 3,131 | | | | | | | | | | | | | | | |
Adjusted operating expense (1) | 66,796 | | 26,621 | | 13,528 | | | 74,109 | | 25,909 | | 8,206 | | | | | | | | | | | | | | | |
| Non-recourse interest expense | 11,226 | | 7,237 | | 11,700 | | | 2,598 | | 2,529 | | 3,880 | | | | | | | | | | | | | | | |
| Recourse interest expense | 19,739 | | (47) | | 294 | | | 16,883 | | (89) | | 4 | | | | | | | | | | | | | | | |
Adjusted segment operating (loss) income (1) | $ | (22,404) | | $ | 12,221 | | $ | (11,190) | | | $ | (10,346) | | $ | 23,838 | | $ | (8,959) | | | | | | | | | | | | | | | |
| (1) See "Non-GAAP Financial Measures" at the end of this release for definition and more information. | | | | | | | | | | | | | | |
| | | | | | | | | | | | | | | | | | | | | | | | | | | | | | |
| Nine Months Ended September 30, 2022 | | Nine Months Ended September 30, 2021 | | | | |
| (dollars in thousands, unaudited) | U.S. | Canada Direct Lending | Canada POS Lending | | U.S. | Canada Direct Lending | Canada POS Lending | | | | | | | |
| Total revenue | $ | 511,540 | | $ | 226,007 | | $ | 71,173 | | | $ | 386,960 | | $ | 186,510 | | $ | 20,054 | | | | | | | | |
| Provision for losses | 196,461 | | 80,960 | | 28,055 | | | 108,108 | | 31,793 | | 12,127 | | | | | | | | |
| Net revenue | 315,079 | | 145,047 | | 43,118 | | | 278,852 | | 154,717 | | 7,927 | | | | | | | | |
Adjusted operating expense (1) | 280,629 | | 81,707 | | 43,959 | | | 217,809 | | 75,848 | | 15,824 | | | | | | | | |
| Non-recourse interest expense | 26,635 | | 17,442 | | 25,998 | | | 6,728 | | 7,562 | | 8,302 | | | | | | | | |
| Recourse interest expense | 59,838 | | (75) | | 845 | | | 46,449 | | (269) | | 12 | | | | | | | | |
Adjusted segment operating (loss) income (1) | $ | (52,023) | | $ | 45,972 | | $ | (27,684) | | | $ | 7,866 | | $ | 71,576 | | $ | (16,211) | | | | | | | | |
| (1) See "Non-GAAP Financial Measures" at the end of this release for definition and more information. | | | | | | | |
Table 7 - U.S. Portfolio Performance
| | | | | | | | | | | | | | | | | | | | | | | | | | | | |
| (in thousands, except percentages) | | Q3 2022 | Q2 2022(6) | Q1 2022 | | Q4 2021(1) | Q3 2021 | | | | | |
Gross combined loans receivable (2) | | | | | | | | | | | | |
| Revolving LOC | | $ | — | $ | 58,471 | $ | 49,077 | | $ | 52,532 | $ | 51,196 | | | | | |
| Installment loans - Company Owned | | 739,100 | 627,651 | 589,652 | | 137,782 | 137,987 | | | | | |
| Total U.S. Company Owned gross loans receivable | | 739,100 | 686,122 | 638,729 | | 190,314 | 189,183 | | | | | |
Installment loans - Guaranteed by the Company (3) | | — | 51,323 | 44,420 | | 46,317 | 43,422 | | | | | |
Total U.S. gross combined loans receivable (2) | | $ | 739,100 | $ | 737,445 | $ | 683,149 | | $ | 236,631 | $ | 232,605 | | | | | |
| | | | | | | | | | | | |
| Lending Revenue: | | | | | | | | | | | | |
| Revolving LOC | | $ | 2,210 | $ | 28,145 | $ | 26,913 | | $ | 27,911 | $ | 27,377 | | | | | |
| Installment loans - Company Owned | | 86,936 | 121,595 | 113,833 | | 56,820 | 57,659 | | | | | |
Installment loans - Guaranteed by the Company (3) | | 3,898 | 48,283 | 48,991 | | 47,348 | 43,377 | | | | | |
| Total U.S. lending revenue | | $ | 93,044 | $ | 198,023 | $ | 189,737 | | $ | 132,079 | $ | 128,413 | | | | | |
| | | | | | | | | | | | |
| Lending Provision: | | | | | | | | | | | | |
| Revolving LOC | | $ | — | $ | 11,831 | $ | 9,577 | | $ | 11,592 | $ | 8,140 | | | | | |
| Installment loans - Company Owned | | 29,045 | 54,868 | 32,962 | | 18,618 | 16,792 | | | | | |
Installment loans - Guaranteed by the Company (3) | | — | 28,313 | 21,749 | | 25,967 | 23,146 | | | | | |
| Total U.S. lending provision | | $ | 29,045 | $ | 95,012 | $ | 64,288 | | $ | 56,177 | $ | 48,078 | | | | | |
| | | | | | | | | | | | |
| | | | | | | | | | | | |
| | | | | | | | | | | | |
| | | | | | | | | | | | |
| | | | | | | | | | | | |
| | | | | | | | | | | | |
| | | | | | | | | | | | |
NCOs (7) | | | | | | | | | | | | |
| Revolving LOC | | $ 1,140 | $ 10,248 | $ 10,055 | | $ 11,481 | $ 8,329 | | | | | |
| Installment loans - Company Owned | | 25,722 | 40,757 | 36,247 | | 19,664 | 19,548 | | | | | |
Installment loans - Guaranteed by the Company (3) | | 1,589 | 27,395 | 21,492 | | 26,065 | 21,404 | | | | | |
| Total U.S. NCOs | | $ 28,452 | $ 78,400 | $ 67,794 | | $ 57,210 | $ 49,281 | | | | | |
| | | | | | | | | | | | |
NCO rate (4) (7) | | | | | | | | | | | | |
| Revolving LOC | | 3.9% | 19.1% | 19.8% | | 22.1% | 16.9% | | | | | |
| Installment loans - Company Owned | | 3.8% | 6.7% | 6.0% | | 14.3% | 14.1% | | | | | |
| Total U.S. Company Owned NCO rate | | 3.8% | 7.7% | 7.1% | | 16.4% | 14.8% | | | | | |
Installment loans - Guaranteed by the Company (3) | | 6.2% | 57.2% | 47.4% | | 58.1% | 53.2% | | | | | |
| Total U.S. NCO rate | | 3.9% | 11.0% | 14.7% | | 24.4% | 21.6% | | | | | |
| | | | | | | | | | | | |
| | | | | |
| | | | | | | | | | | | |
| | | | | | | | | | | | |
| | | | | | | | | | | | |
| | | | | | | | | | | | |
| | | | | | | | | | | | |
| | | | | | | | | | | | | | | | | | | | | | | | | | | | |
| (in thousands, except percentages) | | Q3 2022 | Q2 2022(6) | Q1 2022 | | Q4 2021(1) | Q3 2021 | | | | | |
ALL and CSO Liability for Losses rate (5) | | | | | | | | | | | | |
| Revolving LOC | | — | % | 25.1 | % | 26.7% | | 25.9% | 26.3% | | | | | |
| Installment loans - Company Owned | | 4.4 | % | 6.8 | % | 4.2% | | 12.7% | 13.4% | | | | | |
| Total U.S. Company Owned ALL rate | | 4.4 | % | 8.4 | % | 5.9% | | 16.3% | 16.9% | | | | | |
Installment loans - Guaranteed by the Company (3) | | — | % | 15.7 | % | 16.1% | | 14.9% | 16.1% | | | | | |
| Total ALL and CSO Liability for Losses rate | | 4.4 | % | 8.9 | % | 6.6% | | 16.0% | 16.8% | | | | | |
| | | | | | | | | | | | |
31+ days past-due rate (5) | | | | | | | | | | | | |
| Revolving LOC | | — | % | 17.4 | % | 19.1% | | 19.2% | 18.3% | | | | | |
| Installment loans - Company Owned | | 10.5 | % | 10.0 | % | 9.6% | | 9.4% | 11.9% | | | | | |
Total U.S. Company Owned past-due rate(8) | | 10.5 | % | 10.7 | % | 10.4% | | 10.1% | 13.6% | | | | | |
| | | | | | | | | | | | |
Installment loans - Guaranteed by the Company (3) | | — | % | 2.6 | % | 4.5% | | 3.1% | 3.8% | | | | | |
| | | | | | | | | | | | |
| | | | | | | | | | | | |
(1) On December 27, 2021, we acquired Heights Finance, which accounted for approximately $472 million of U.S. Installment loans as of December 31, 2021. As the period between December 27, 2021 and December 31, 2021 did not result in material loan performance, we have excluded Heights Finance from the table for the fourth quarter of 2021. |
| (2) Non-GAAP measure. For a description of each non-GAAP metric, see "Non-GAAP Financial Measures." |
(3) Includes loans originated by third-party lenders through CSO programs. Installment gross loans receivable Guaranteed by the Company are not included in the Consolidated Financial Statements. All balances in connection with the CSO programs were disposed of on July 8, 2022 upon the completion of the divestiture of the Legacy U.S. Direct Lending business. |
| (4) We calculate NCO rate as total NCOs divided by Average gross loans receivable. The amount and timing of recoveries are impacted by our collection strategies, which are based on customer behavior and risk profile and include direct customer communications and the periodic sale of charged off loans. |
(5) We calculate (i) Allowance for loan losses (ALL) and CSO Liability for losses rate and (ii) past-due rate as the respective totals divided by gross loans receivable at each respective quarter end. |
| (6) Includes loan balances and activity classified as Held for Sale. | |
| (7) For the first, second and third quarters of 2022, NCOs presented above include $5.0 million, $10.3 million and $0.5 million, respectively, of NCO's related to the purchase accounting fair value discount, which are excluded from provision. |
(8) The total past-due rate for U.S. Lending including loans 1-30 days past-due were 20.0%, 21.2%, 17.7%, 18.3% and 22.3% for the three months ended September 30, 2022, June 30, 2022, March 31, 2022, December 31, 2021 and September 30, 2021, respectively. |
Table 8 - Canada Direct Lending Portfolio Performance
| | | | | | | | | | | | | | | | | | | | | | | | | | | | |
| (in thousands, except percentages) | | Q3 2022 | Q2 2022 | Q1 2022 | | Q4 2021 | Q3 2021 | | | | | |
| Gross loans receivable | | | | | | | | | | | | |
| Revolving LOC | | $ | 439,117 | $ | 442,738 | $ | 424,485 | | $ | 402,405 | $ | 366,509 | | | | | |
| Installment loans | | 25,941 | 24,817 | 23,578 | | 24,792 | 24,315 | | | | | |
| Total gross loans receivable | | $ | 465,058 | $ | 467,555 | $ | 448,063 | | $ | 427,197 | $ | 390,824 | | | | | |
| | | | | | | | | | | | |
| Lending Revenue: | | | | | | | | | | | | |
| Revolving LOC | | 50,251 | $ | 47,591 | $ | 45,455 | | $ | 43,943 | $ | 40,239 | | | | | |
| Installment loans | | 12,645 | 11,868 | 11,109 | | 11,416 | 11,331 | | | | | |
| Total lending revenue | | $ | 62,896 | $ | 59,459 | $ | 56,564 | | $ | 55,359 | $ | 51,570 | | | | | |
| | | | | | | | | | | | |
| Lending Provision: | | | | | | | | | | | | |
| Revolving LOC | | $ | 28,408 | $ | 22,641 | $ | 19,156 | | $ | 20,080 | $ | 11,375 | | | | | |
| Installment loans | | 4,466 | 3,303 | 2,723 | | 2,945 | 2,512 | | | | | |
| Total lending provision | | $ | 32,874 | $ | 25,944 | $ | 21,879 | | $ | 23,025 | $ | 13,887 | | | | | |
| | | | | | | | | | | | |
| NCOs | | | | | | | | | | | | |
| Revolving LOC | | $ 23,652 | $ 20,160 | $ 21,590 | | $ 15,112 | $ 9,887 | | | | | |
| Installment loans | | 4,061 | 2,904 | 2,647 | | 2,758 | 2,444 | | | | | |
| Total NCOs | | $ 27,713 | $ 23,064 | $ 24,237 | | $ 17,870 | $ 12,331 | | | | | |
| | | | | | | | | | | | |
NCO rate (1) | | | | | | | | | | | | |
| Revolving LOC | | 5.4% | 4.6% | 5.2% | | 3.9% | 2.8% | | | | | |
| Installment loans | | 16.0% | 12.0% | 10.9% | | 11.2% | 10.2% | | | | | |
| Total NCO rate | | 5.9% | 5.0% | 5.5% | | 4.4% | 3.3% | | | | | |
| | | | | | | | | | | | |
ALL rate (2) | | | | | | | | | | | | |
| Revolving LOC | | 7.9% | 7.2% | 7.2 | % | | 8.0 | % | 7.5 | % | | | | | |
| Installment loans | | 10.3% | 9.7% | 8.8 | % | | 8.0 | % | 7.4 | % | | | | | |
| Total ALL rate | | 8.0% | 7.4% | 7.3 | % | | 8.0 | % | 7.5 | % | | | | | |
| | | | | | | | | | | | |
31+ days past-due rate (2) | | | | | | | | | | | | |
| Revolving LOC | | 5.1% | 4.2% | 4.3 | % | | 3.2 | % | 2.5 | % | | | | | |
| Installment loans | | 1.0% | 0.8% | 1.0 | % | | 0.9 | % | 0.7 | % | | | | | |
Total past-due rate(3) | | 4.8% | 4.0% | 4.1 | % | | 3.1 | % | 2.4 | % | | | | | |
| | | | | | | | | | | | |
| (1) We calculate NCO rate as total NCOs divided by Average gross loans receivable. The amount and timing of recoveries are impacted by our collection strategies, which are based on customer behavior and risk profile and include direct customer communications and the periodic sale of charged off loans. |
| (2) We calculate ALL rate and past-due rate as the respective totals divided by gross loans receivable at each respective quarter end. |
(3) The total past-due rate for Canada Direct Lending including loans 1-30 days past-due were 9.5%, 8.3%, 7.7%, 6.7% and 5.1% for the three months ended September 30, 2022, June 30, 2022, March 31, 2022, December 31, 2021 and September 30, 2021, respectively. |
Table 9 - Canada POS Lending Portfolio Performance
| | | | | | | | | | | | | | | | | | | | | | | | | | | | |
| (in thousands, except percentages) | | Q3 2022 | Q2 2022 | Q1 2022 | | Q4 2021 | Q3 2021 | | | | | |
| Revolving LOC | | | | | | | | | | | | |
| | | | | | | | | | | | |
| | | | | | | | | | | | |
| Total gross loans receivable | | $ | 690,270 | $ | 627,163 | $ | 541,776 | | $ | 459,176 | $ | 302,349 | | | | | |
| | | | | | | | | | | | |
| | | | | | | | | | | | |
| Total lending revenue | | $ | 24,575 | $ | 20,846 | $ | 18,655 | | $ | 13,704 | $ | 10,646 | | | | | |
| | | | | | | | | | | | |
| | | | | | | | | | | | |
| Total lending provision | | $ | 13,379 | $ | 5,963 | $ | 8,714 | | $ | 12,511 | $ | 8,285 | | | | | |
| | | | | | | | | | | | |
| | | | | | | | | | | | |
| | | | | | | | | | | | |
| | | | | | | | | | | | |
| | | | | | | | | | | | |
Canada POS Lending NCOs (1) | | $ | 6,114 | $ | 3,537 | $ | 2,727 | | $ | 1,731 | $ | 1,827 | | | | | |
| | | | | | | | | | | | |
| | | | | | | | | | | | |
NCO rate (1)(2) | | 0.9 | % | 0.6 | % | 0.5 | % | | 0.5 | % | 0.7 | % | | | | | |
| | | | | | | | | | | | |
| | | | | | | | | | | | |
| | | | | | | | | | | | |
| | | | | | | | | | | | |
| | | | | | | | | | | | |
ALL rate (3) | | 4.8 | % | 4.5 | % | 5.1 | % | | 4.8 | % | 3.8 | % | | | | | |
| | | | | | | | | | | | |
| | | | | | | | | | | | |
31+ days past-due rate (3)(4) | | 3.6 | % | 2.8 | % | 2.2 | % | | 1.9 | % | 2.1 | % | | | | | |
| | | | | | | | | | | | |
| | | | | | | | | | | | |
| | | | | | | | | | | | |
| | | | | | | | | | | | |
| | | | | | | | | | | | |
| | | | | | | | | | | | |
| | | | | | | | | | | | |
| | | | | | | | | | | | |
| (1) For the third and fourth quarters of 2021, NCOs presented above include $0.6 million and $0.8 million, respectively, of NCO's related to the fair value discount, which are excluded from provision. |
| (2) We calculate NCO rate as total NCOs divided by Average gross loans receivable. |
|
|
|
| (3) We calculate ALL rate and past-due rate as the respective totals divided by gross loans receivable at each respective quarter end. |
(4) The total past-due rate for Canada POS Lending including loans 1-30 days past-due were 5.8%, 5.3%, 4.2%, 4.1% and 4.8% for the three months ended September 30, 2022, June 30, 2022, March 31, 2022, December 31, 2021 and September 30, 2021, respectively. | | |
|
|
Non-GAAP Financial Measures
In addition to the financial information prepared in conformity with U.S. GAAP, we provide certain “non-GAAP financial measures,” including:
•Adjusted Net Income ("ANI") and Adjusted Earnings Per Share, or the Adjusted Earnings Measures (net income plus or minus certain legal and other costs, income or loss from equity method investment, goodwill and intangible asset impairments, transaction-related costs, restructuring costs, loss on extinguishment of debt, adjustments related to acquisition accounting, share-based compensation, intangible asset amortization, gain on sale of business, changes in fair value of contingent consideration, certain tax adjustments and cumulative tax effect of applicable adjustments, on a total and per share basis);
•EBITDA (earnings before interest, income taxes, depreciation and amortization);
•Adjusted EBITDA (EBITDA plus or minus certain non-cash and other adjusting items); and
•Gross Combined Loans Receivable (includes loans originated by third-party lenders through CSO programs which are not included in the Consolidated Financial Statements). As a result of the sale of the Legacy U.S. Direct Lending business, we no longer guarantee loans originated by third-party lenders through CSO programs.
We believe that presentation of non-GAAP financial information is meaningful and useful in understanding the activities and business metrics of the Company's operations. We believe that these non-GAAP financial measures reflect an additional way of viewing aspects of the business that, when viewed with the Company's U.S. GAAP results, provide a more complete understanding of factors and trends affecting the business.
We believe that investors regularly rely on non-GAAP financial measures to assess operating performance and that such measures may highlight trends in the business that may not otherwise be apparent when relying on financial measures calculated in accordance with U.S. GAAP. In addition, we believe that the adjustments shown above are useful to investors to allow them to compare our financial results during the periods shown without the effect of each of these income or expense items. In addition, we believe that these non-GAAP financial measures are frequently used by securities analysts, investors and other interested parties in the evaluation of public companies in our industry, many of which present non-GAAP financial measures when reporting their results.
In addition to reporting loans receivable information in accordance with U.S. GAAP, we provide Gross Combined Loans Receivable consisting of owned loans receivable plus loans originated by third-party lenders through the CSO programs, which we guaranteed but do not include in the Consolidated Financial Statements. Management believes this analysis provides investors with important information needed to evaluate overall lending performance. As noted above, the Company no longer provides these guarantees to third-party lenders as a result of the sale of the Legacy U.S. Direct Lending business.
Non-GAAP financial measures should not be considered as alternatives to income, segment operating income, or any other performance measure derived in accordance with U.S. GAAP, or as an alternative to cash flows from operating activities or any other liquidity measure derived in accordance with U.S. GAAP. Readers should consider the information in addition to, but not instead of or superior to, the financial statements prepared in accordance with U.S. GAAP. This non-GAAP financial information may be determined or calculated differently by other companies, limiting the usefulness of those measures for comparative purposes.
Description and Reconciliations of Non-GAAP Financial Measures
Non-GAAP financial measures have limitations as analytical tools, and you should not consider these measures in isolation or as a substitute for analysis of our income or cash flows as reported under U.S. GAAP. Some of these limitations are:
•they do not include cash expenditures or future requirements for capital expenditures or contractual commitments;
•they do not include changes in, or cash requirements for, working capital needs;
•they do not include the interest expense, or the cash requirements necessary to service interest or principal payments on debt;
•depreciation and amortization are non-cash expense items reported in the statements of cash flows; and
•other companies in our industry may calculate these measures differently, limiting their usefulness as comparative measures.
We calculate Adjusted Earnings per Share utilizing diluted shares outstanding at quarter-end. If we record a loss under U.S. GAAP, shares outstanding utilized to calculate Diluted Loss per Share are equivalent to basic shares outstanding. Shares outstanding utilized to calculate Adjusted Earnings per Share reflect the number of diluted shares we would have reported if reporting net income under U.S. GAAP. If we record an Adjusted Loss per Share, shares outstanding utilized to calculate Diluted Loss per Share are equivalent to basic shares outstanding.
We believe investors use the non-GAAP measures we present to analyze operating performance and to evaluate our ability to incur and service debt and the capacity for making capital expenditures. Adjusted EBITDA is also useful to investors to help assess our estimated enterprise value.
Table 10 - Reconciliation of Net Income and Diluted Earnings per Share to Adjusted Net Income and Adjusted Diluted Earnings per Share, non-GAAP measures
| | | | | | | | | | | | | | | | | | | | | | | | | | | | | | | | |
| (in thousands, except per share data, unaudited) | | Three Months Ended
September 30, | | Nine Months Ended
September 30, |
| 2022 | 2021 | Change $ | Change % | | 2022 | 2021 | Change $ | Change % |
| Net income (loss) | | $ | 25,653 | | $ | (42,039) | | $ | 67,692 | | # | | $ 909 | | $ 88,213 | | ($ 87,304) | | (99.0) | % |
| Adjustments: | | | | | | | | | | |
Restructuring costs (1) | | 739 | | 5,651 | | | | | 2,954 | | 11,414 | | | |
Legal and other costs (2) | | 46 | | 370 | | | | | 1,083 | | 370 | | | |
Loss (income) from equity method investment (3) | | 2,309 | | 1,582 | | | | | 2,053 | | (676) | | | |
Gain from equity method investment (11) | | — | | — | | | | | — | | (135,387) | | | |
Transaction costs (4) | | 10,063 | | 141 | | | | | 10,063 | | 6,482 | | | |
Acquisition-related adjustments (5) | | (2,883) | | 4,292 | | | | | 709 | | 9,787 | | | |
Change in fair value of contingent consideration (6) | | (11,355) | | 3,825 | | | | | (7,605) | | 3,825 | | | |
Loss on extinguishment of debt (12) | | 3,702 | | 42,262 | | | | | 3,702 | | 42,262 | | | |
Share-based compensation (7) | | 1,448 | | 3,998 | | | | | 9,958 | | 10,148 | | | |
Intangible asset amortization (8) | | 3,151 | | 1,774 | | | | | 9,652 | | 4,471 | | | |
Gain on sale of business (13) | | (68,443) | | — | | | | | (68,443) | | — | | | |
Cumulative tax effect of adjustments (9) | | 23,677 | | (15,411) | | | | | 18,061 | | 13,058 | | | |
| Adjusted net (loss) income | | $ | (11,893) | | $ | 6,445 | | $ | (18,338) | | # | | $ | (16,904) | | $ 53,967 | | $ | (70,871) | | # |
| | | | | | | | | | |
| Net income (loss) | | $ | 25,653 | | $ | (42,039) | | | | | $ 909 | | $ 88,213 | | | |
| Diluted weighted average shares outstanding | | 40,835 | | 41,220 | | | | | 40,754 | | 43,422 | | | |
| Adjusted diluted average shares outstanding | | 40,835 | | 43,285 | | | | | 40,754 | | 43,422 | | | |
| Diluted earnings (loss) per share | | $ | 0.63 | | $ | (1.02) | | $ | 1.65 | | # | | $ | 0.02 | | $ | 2.03 | | $ | (2.01) | | # |
| Per share impact of adjustments to net (loss) income | | (0.92) | | 1.17 | | | | | (0.43) | | (0.79) | | | |
| Adjusted diluted (loss) earnings per share | | $ | (0.29) | | $ | 0.15 | | $ | (0.44) | | (293.3) | % | | ($ 0.41) | | $ 1.24 | | $ | (1.65) | | (133.1) | % |
| Note: Footnotes follow Reconciliation of Net income table on the next page |
|
Table 11 - Reconciliation of Net Income to EBITDA and Adjusted EBITDA, Non-GAAP Measures
| | | | | | | | | | | | | | | | | | | | | | | | | | | | | | | | |
| | Three Months Ended
September 30, | | Nine Months Ended
September 30, |
| (in thousands, unaudited) | | 2022 | 2021 | Change $ | Change % | | 2022 | 2021 | Change $ | Change % |
| Net income (loss) | | $ | 25,653 | | $ | (42,039) | | $ | 67,692 | | # | | $ 909 | | $ 88,213 | | $ | (87,304) | | (99.0) | % |
| Provision (benefit) for income taxes | | 17,348 | | (13,375) | | 30,723 | | # | | 11,464 | | 29,241 | | (17,777) | | (60.8) | % |
| Interest expense | | 50,149 | | 25,805 | | 24,344 | | 94.3 | % | | 130,683 | | 68,784 | | 61,899 | | 90.0 | % |
| Depreciation and amortization | | 9,499 | | 7,285 | | 2,214 | | 30.4 | % | | 27,985 | | 19,685 | | 8,300 | | 42.2 | % |
| EBITDA | | 102,649 | | (22,324) | | 124,973 | | # | | 171,041 | | 205,923 | | (34,882) | | (16.9) | % |
Restructuring costs (1) | | 739 | | 5,651 | | | | | 2,954 | | 11,414 | | | |
Legal and other costs (2) | | 46 | | 370 | | | | | 1,083 | | 370 | | | |
Loss (income) from equity method investment (3) | | 2,309 | | 1,582 | | | | | 2,053 | | (676) | | | |
Gain from equity method investment (11) | | — | | — | | | | | — | | (135,387) | | | |
Transaction costs (4) | | 10,063 | | 141 | | | | | 10,063 | | 6,482 | | | |
Acquisition-related adjustments (5) | | (2,883) | | 4,292 | | | | | 709 | | 9,787 | | | |
Change in fair value of contingent consideration (6) | | (11,355) | | 3,825 | | | | | (7,605) | | 3,825 | | | |
Loss on extinguishment of debt (12) | | 3,702 | | 40,206 | | | | | 3,702 | | 40,206 | | | |
Gain on sale of business (13) | | (68,443) | | — | | | | | (68,443) | | — | | | |
Share-based compensation (7) | | 1,448 | | 3,998 | | | | | 9,958 | | 10,148 | | | |
Other adjustments (10) | | — | | (118) | | | | | (581) | | (392) | | | |
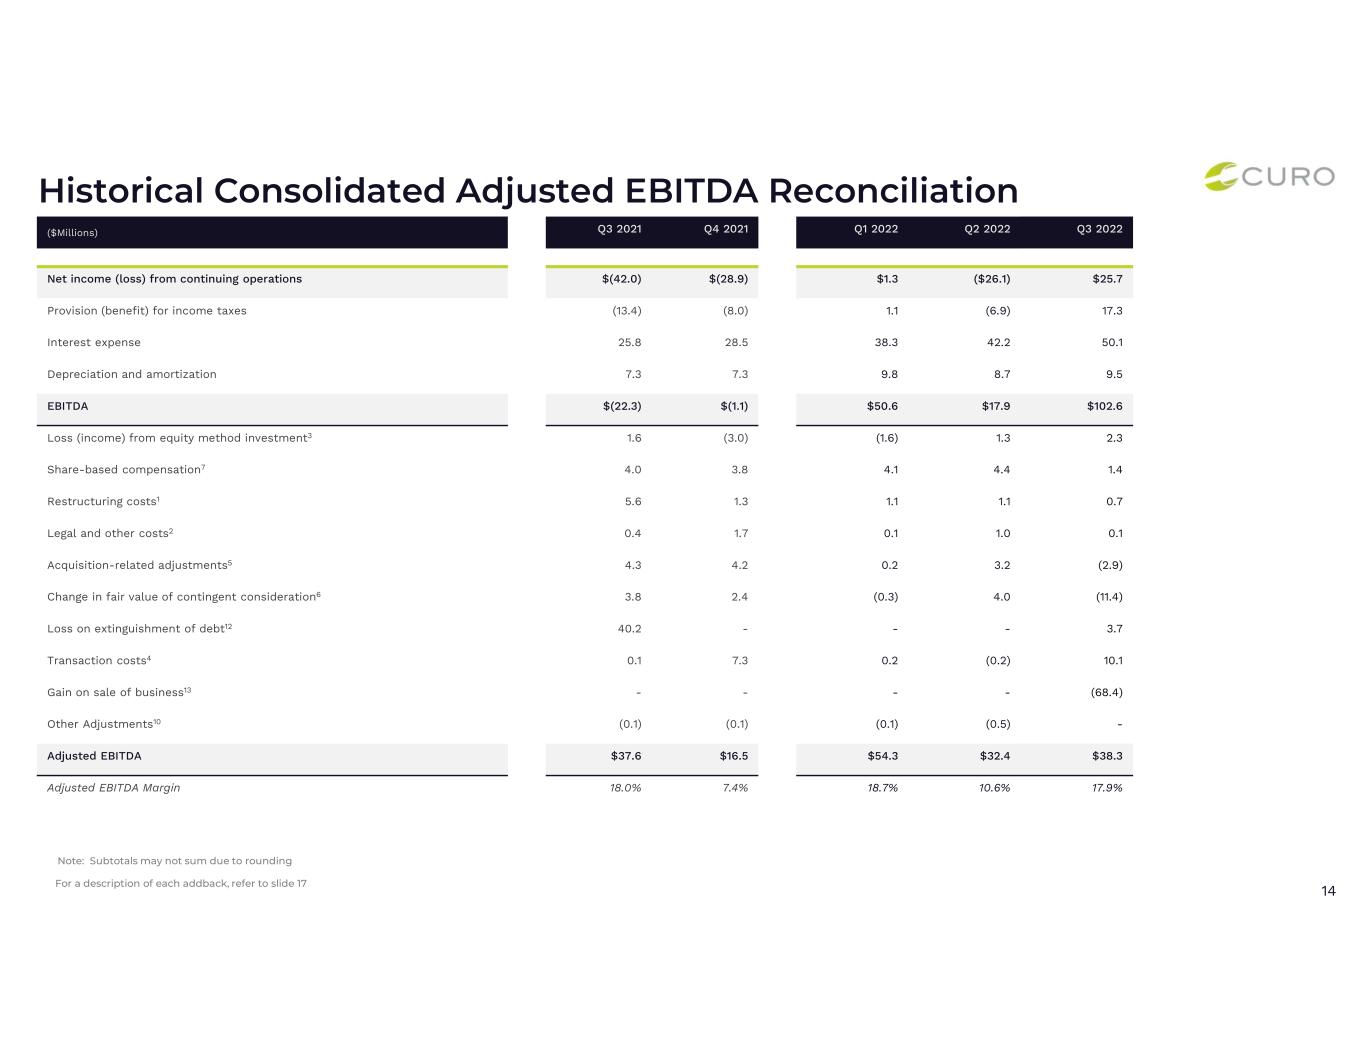
| Adjusted EBITDA | | $ | 38,275 | | $ | 37,623 | | $ | 652 | | 1.7 | % | | $ | 124,934 | | $ | 151,700 | | $ | (26,766) | | (17.6) | % |
| Adjusted EBITDA Margin | | 17.9 | % | 18.0 | % | | | | 15.4 | % | 25.6 | % | | |
| # - Change greater than 100% or not meaningful |
Table 12 - Reconciliation of Total Operating Expense to Adjusted Operating Expense
| | | | | | | | | | | | | | | | | | | | | | | | | | | | | | |
| Three Months Ended September 30, 2022 | | Three Months Ended September 30, 2021 | | | | |
| (dollars in thousands, unaudited) | U.S. | Canada Direct Lending | Canada POS Lending | | U.S. | Canada Direct Lending | Canada POS Lending | | | | | | | |
| Total operating expense | $ | 76,067 | | $ | 26,773 | | $ | 13,518 | | | $ | 84,074 | | $ | 26,003 | | $ | 12,481 | | | | | | | | |
| Less: | | | | | | | | | | | | | | |
Restructuring costs (1) | 739 | | — | | — | | | 5,651 | | — | | — | | | | | | | | |
Legal and other costs (2) | 46 | | — | | — | | | 370 | | — | | — | | | | | | | | |
Transaction costs (4) | 10,063 | | — | | — | | | 141 | | — | | — | | | | | | | | |
Acquisition-related adjustments (5) | (2,883) | | — | | — | | | — | | — | | 4,292 | | | | | | | | |
Share-based compensation (7) | 1,306 | | 152 | | (10) | | | 3,998 | | — | | — | | | | | | | | |
Other adjustments (10) | — | | — | | — | | | (195) | | 94 | | (17) | | | | | | | | |
| Adjusted operating expense | $ | 66,796 | | $ | 26,621 | | $ | 13,528 | | | $ | 74,109 | | $ | 25,909 | | $ | 8,206 | | | | | | | | |
| | | | | | | | | | | | | | | | | | | | | | | | | | | | | | |
| Nine Months Ended September 30, 2022 | | Nine Months Ended September 30, 2021 | | | | |
| (dollars in thousands, unaudited) | U.S. | Canada Direct Lending | Canada POS Lending | | U.S. | Canada Direct Lending | Canada POS Lending | | | | | | | |
| Total operating expense | $ | 302,641 | | $ | 82,126 | | $ | 45,714 | | | 245,623 | | 76,090 | | 25,577 | | | | | | | | |
| Less: | | | | | | | | | | | | | | |
Restructuring costs (1) | 2,954 | | — | | — | | | 11,414 | | — | | — | | | | | | | | |
Legal and other costs (2) | 1,076 | | 7 | | — | | | 370 | | — | | — | | | | | | | | |
Transaction costs (4) | 10,063 | | — | | — | | | 6,482 | | — | | — | | | | | | | | |
Acquisition-related adjustments (5) | 491 | | — | | 218 | | | — | | — | | 9,787 | | | | | | | | |
Share-based compensation (7) | 8,068 | | 396 | | 1,494 | | | 10,148 | | — | | — | | | | | | | | |
Other adjustments (10) | (640) | | 16 | | 43 | | | (600) | | 242 | | (34) | | | | | | | | |
| Adjusted operating expense | $ | 280,629 | | $ | 81,707 | | $ | 43,959 | | | $ | 217,809 | | $ | 75,848 | | $ | 15,824 | | | | | | | | |
| | | | | |
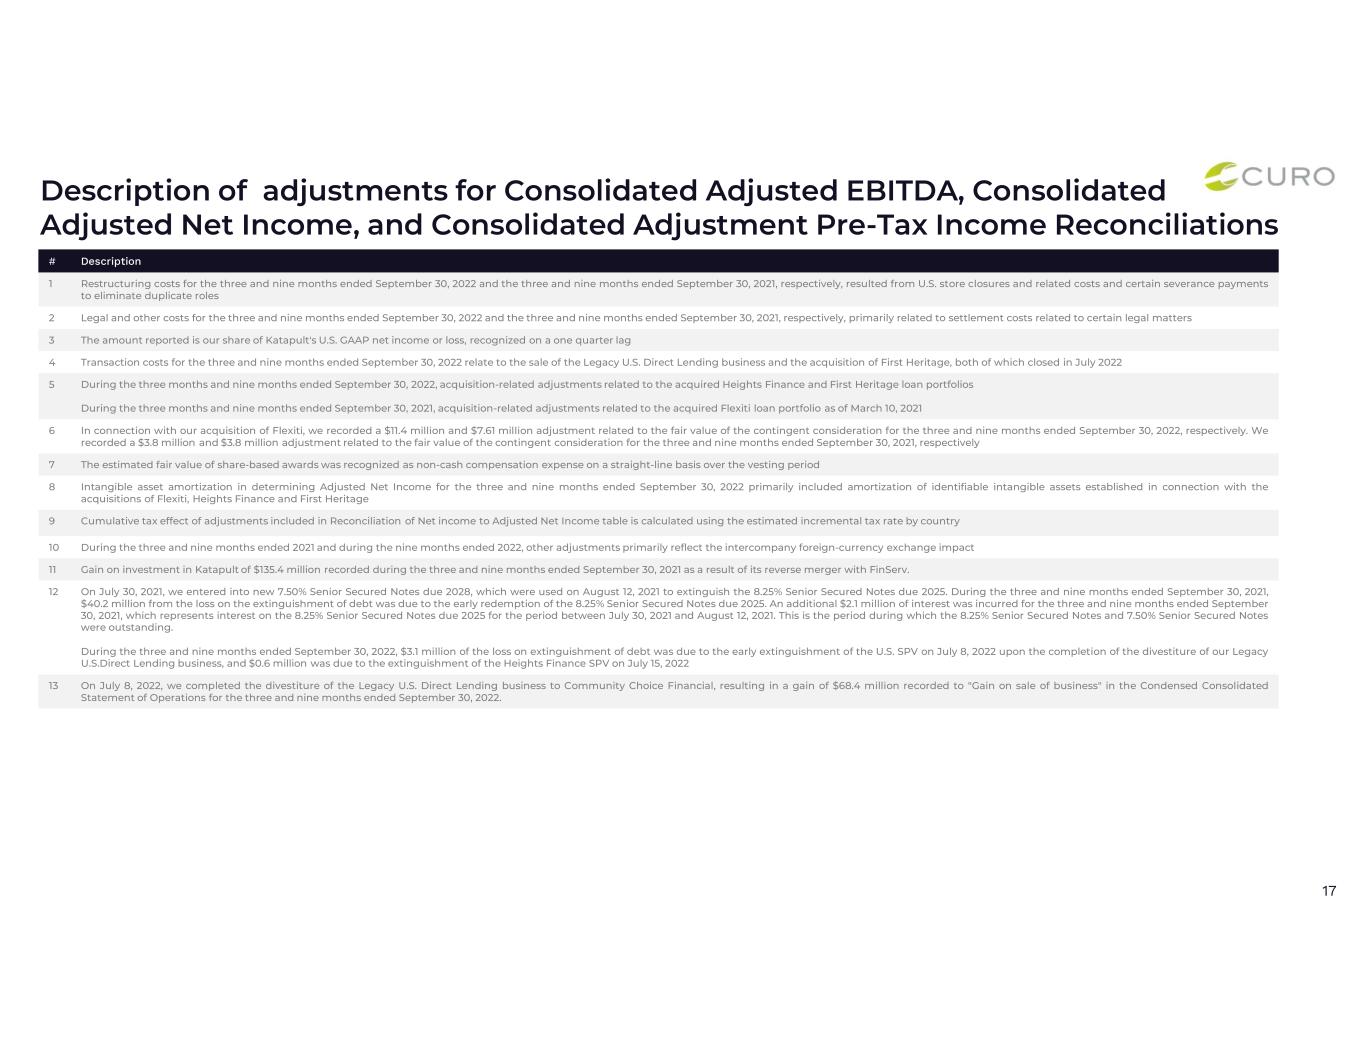
| (1) | Restructuring costs for the three and nine months ended September 30, 2022 and the three and nine months ended September 30, 2021, respectively, resulted from U.S. store closures and related costs and certain severance payments to eliminate duplicate roles. |
| (2) | Legal and other costs for the three and nine months ended September 30, 2022 and the three and nine months ended September 30, 2021, respectively, primarily related to settlement costs related to certain legal matters. |
| (3) | The amount reported is our share of Katapult's U.S. GAAP net income or loss, recognized on a one quarter lag. |
| (4) | Transaction costs for the three and nine months ended September 30, 2022 relate to, the sale of the Legacy U.S. Direct Lending business, and the acquisition of First Heritage, both of which closed in July 2022.
|
| (5) | During the three months and nine months ended September 30, 2022, acquisition-related adjustments related to the acquired Heights Finance and First Heritage loan portfolios.
During the three months and nine months ended September 30, 2021, acquisition-related adjustments related to the acquired Flexiti loan portfolio. |
| (6) | In connection with our acquisition of Flexiti, we recorded a $11.4 million and $7.61 million adjustment related to the fair value of the contingent consideration for the three and nine months ended September 30, 2022, respectively. We recorded a $3.8 million and $3.8 million adjustment related to the fair value of the contingent consideration for the three and nine months ended September 30, 2021, respectively. |
| (7) | The estimated fair value of share-based awards was recognized as non-cash compensation expense on a straight-line basis over the vesting period. |
| (8) | Intangible asset amortization in determining ANI for the three and nine months ended September 30, 2022 primarily included amortization of identifiable intangible assets established in connection with the acquisitions of Flexiti, Heights Finance and First Heritage. |
| (9) | Cumulative tax effect of adjustments included in Reconciliation of Net income to Adjusted Net Income table is calculated using the estimated incremental tax rate by country. |
| (10) | During the three and nine months ended 2021 and during the nine months ended 2022, other adjustments primarily reflect the intercompany foreign-currency exchange impact. |
| (11) | Gain on investment in Katapult of $135.4 million recorded during the three and nine months ended September 30, 2021 as a result of its reverse merger with FinServ. |
| (12) | On July 30, 2021, we entered into new 7.50% Senior Secured Notes due 2028, which were used on August 12, 2021 to extinguish the 8.25% Senior Secured Notes due 2025. During the three and nine months ended September 30, 2021, $40.2 million from the loss on the extinguishment of debt was due to the early redemption of the 8.25% Senior Secured Notes due 2025. An additional $2.1 million of interest was incurred for the three and nine months ended September 30, 2021, which represents interest on the 8.25% Senior Secured Notes due 2025 for the period between July 30, 2021 and August 12, 2021. This is the period during which the 8.25% Senior Secured Notes and 7.50% Senior Secured Notes were outstanding.
During the three and nine months ended September 30, 2022, $3.1 million of the loss on extinguishment of debt was due to the early extinguishment of the U.S. SPV on July 8, 2022 upon the completion of the divestiture of our Legacy U.S.Direct Lending business to Community Choice Financial, and $0.6 million was due to the extinguishment of the Heights Finance SPV on July 15, 2022. |
| (13) | On July 8, 2022, the Company completed the divestiture of its Legacy U.S. Direct Lending business to Community Choice Financial, resulting in a gain of $68.4 million recorded to "Gain on sale of business" in the Condensed Consolidated Statement of Operations for the three and nine months ended September 30, 2022. |
Forward-Looking Statements
This press release contains forward-looking statements. These forward-looking statements include projections, estimates and assumptions about various matters, such as future financial and operational performance, including reduction in operating expenses, and our belief in the usefulness of the various non-GAAP financial measures used in this release. In addition, words such as “guidance,” “estimate,” “anticipate,” “believe,” “forecast,” “step,” “plan,” “predict,” “focused,” “project,” “is likely,” “expect,” “intend,” “should,” “will,” “confident,” variations of such words and similar expressions are intended to identify forward-looking statements. Our ability to achieve these forward-looking statements is based on certain assumptions, judgments and other factors, both within and outside of our control, that could cause actual results to differ materially from those in the forward-looking statements, including: errors in our internal forecasts or those of companies in which we invest; the effects of competition on our business or on those companies in which we invest; our ability to attract and retain customers; market, financial, political and legal conditions; actions of regulators and the negative impact of those actions on our business; the continuing impact of COVID-19 pandemic or any other similar wide-spread event on our business and the global economy; our dependence on third-party lenders to provide the cash we need to fund our loans and our ability to affordably access third-party financing; our level of indebtedness; our ability to successfully integrate acquired businesses; our ability to protect our proprietary technology and analytics and keep up with that of our competitors; disruption of our information technology systems that adversely affect our business operations;
ineffective pricing of the credit risk of our prospective or existing customers; inaccurate information supplied by customers or third parties that could lead to errors in judging customers’ qualifications to receive loans; improper disclosure of customer personal data; failure of third parties who provide products, services or support to us; any failure of third-party lenders upon whom we rely to conduct business in certain states; disruption to our relationships with banks and other third-party electronic payment solutions providers as well as other factors discussed in our filings with the Securities and Exchange Commission. These projections, estimates and assumptions may prove to be inaccurate in the future. These forward-looking statements are not guarantees of future performance and involve known and unknown risks and uncertainties that are difficult to predict with regard to timing, extent, likelihood and degree of occurrence. There may be additional risks that CURO presently does not know or that it currently believes are immaterial that could also cause actual results to differ from those contained in the forward-looking statements. Given these risks and uncertainties, investors should not place undue reliance on forward-looking statements as a prediction of actual future results. We undertake no obligation to update, amend or clarify any forward-looking statement for any reason.
All product names, logos, brands, trademarks and registered trademarks are property of their respective owners.
About CURO
CURO Group Holdings Corp. (NYSE: CURO) is a full-spectrum consumer credit lender serving U.S. and Canadian customers for over 25 years. Our roots in the consumer finance market run deep. We’ve worked diligently to provide customers a variety of convenient, easily accessible financial services. Our decades of alternative data power a hard-to-replicate underwriting and scoring engine, mitigating risk across the full spectrum of credit products. We operate a number of brands including Cash Money®, LendDirect®, Flexiti®, Opt+®, Revolve Finance®, Heights Finance, Southern Finance, Covington Credit, Quick Credit, First Phase, and First Heritage Credit.
Conference Call
CURO will host a conference call to discuss these results at 5:00 p.m. Eastern Time on Wednesday, November 2, 2022. The live webcast of the call can be accessed at the CURO Investor Relations website at http://ir.curo.com/.
You may access the call at 1-833-953-2430 (1-412-317-5759 for international callers). Please ask to join the CURO Group Holdings call. A replay of the conference call will be available until November 9, 2022, at 5:00 p.m. Eastern Time. An archived version of the webcast will be available on the CURO Investors website for 90 days. You may access the conference call replay at 1-877-344-7529 (1-412-317-0088 for international callers). The replay access code is 3181575.
Final Results
The financial results presented and discussed herein are on a preliminary and unaudited basis; final unaudited data will be included in the Company’s Quarterly Report on Form 10-Q for the three and nine months ended September 30, 2022.
Investor Relations:
Roger Dean
Executive Vice President and Chief Financial Officer
Phone: 844-200-0342
(CURO-NWS)