
curo-20230509
false000171129100017112912023-05-092023-05-09

UNITED STATES
SECURITIES AND EXCHANGE COMMISSION
WASHINGTON, DC 20549
_______________________________________________________________________
FORM 8-K
__________________________________________________________________________
 
CURRENT REPORT PURSUANT
TO SECTION 13 OR 15(d) OF THE
SECURITIES EXCHANGE ACT OF 1934
Date of report (Date of earliest event reported): May 9, 2023
________________________________________________________________________
CURO GROUP HOLDINGS CORP
(Exact Name of Registrant as Specified in Its Charter)
________________________________________________________________________
Delaware001-3831590-0934597
(State or other Jurisdiction of Incorporation)(Commission File Number)(IRS Employer Identification No.)
200 West Hubbard, 8th Floor, Chicago, Illinois
60654
(Address of Principal Executive Offices)(Zip Code)

(312) 470-2000
(Registrant’s Telephone Number, Including Area Code)
N/A
(Former Name or Former Address, if Changed Since Last Report)
________________________________________________________________________
Check the appropriate box below if the Form8-K filing is intended to simultaneously satisfy the filing obligation of the registrant under any of the following provisions:
Written communications pursuant to Rule 425 under the Securities Act (17 CFR 230.425)
Soliciting material pursuant to Rule 14a-12 under the Exchange Act (17 CFR 240.14a-12)
Pre-commencement communications pursuant to Rule 14d-2(b) under the Exchange Act (17 CFR 240.14d-2(b))
Pre-commencement communications pursuant to Rule 13e-4(c) under the Exchange Act (17 CFR 240.13e-4(c))

Securities registered pursuant to Section 12(b) of the Act:
Title of each classTrading symbol(s)Name of each exchange on which registered
Common stockCURONYSE

Indicate by check mark whether the registrant is an emerging growth company as defined in Rule 405 of the Securities Act of 1933 (§230.405 of this chapter) or Rule12b-2of the Securities Exchange Act of 1934(§240.12b-2of this chapter).

    Emerging growth company  

If an emerging growth company, indicate by check mark if the registrant has elected not to use the extended transition period for complying with any new or revised financial accounting standards provided pursuant to Section 13(a) of the Exchange Act.  ☐


ITEM 2.02     Results of Operations and Financial Condition

On May 10, 2023, CURO Group Holdings Corp. (the “Company”) issued a press release announcing its financial results for the three months ended March 31, 2023. A copy of the press release and a supplemental presentation that will be used in conjunction with its earnings call with investors on May 10, 2023 is attached hereto as Exhibit 99.1 and Exhibit 99.2, respectively, and is incorporated herein by reference.

The information in this item, including Exhibit 99.1 and Exhibit 99.2, is being furnished, not filed. Accordingly, the information in this item will not be incorporated by reference into any registration statement unless specifically identified therein as being incorporated by reference therein.

ITEM 5.02
Departure of Directors or Certain Officers; Election of Directors; Appointment of Certain Officers; Compensatory Arrangements of Certain Officers.

2023 Short-Term Incentive Plan

On May 9 2023, the Company’s Board of Directors (the “Board”) approved the 2023 Short-Term Incentive Plan (the “2023 STIP”) for participation by executive officers, including our named executive officers. Under the 2023 STIP, participants will be eligible to earn a cash bonus in an amount based upon a targeted percentage of the participant’s base salary. A participant’s cash bonus will be earned based upon the achievement of either or both of two specified Company performance objectives: (i) 2023 pre-tax income before provision build and recourse interest expense (80%) and (ii) 2023 minimum unrestricted cash (20%).

For the portion attributable to pre-tax income before provision build and recourse interest expense, a participant will be eligible to earn 80% of target bonus if the Company achieves a pre-determined level. Bonus eligibility for achievement above or below that level will be determined by the Compensation Committee of the Board.

For the portion attributable to the minimum unrestricted cash objective, a participant will be eligible to earn 20% of target bonus if the Company achieves a pre-determined level. This objective is a pass or fail objective.

A participant must be employed by the Company for the entire performance period and be an active employee at the time of payment to be eligible to receive a cash bonus under the 2023 STIP, except as otherwise (i) required by state law, (ii) provided in an employment agreement between the participant and the Company or (iii) determined by the Compensation Committee of the Board.

A form of award agreement for the 2023 STIP is filed as Exhibit 10.1 to this Current Report on Form 8-K and is incorporated into this Item 5.02 by reference.

ITEM 9.01     Financial Statements and Exhibits

(d). Exhibits
Exhibit NumberDescription
10.1
99.1
99.2
104Cover Page Interactive Data File (embedded within the Inline XBRL document)

Signatures
Pursuant to the requirements of the Securities Exchange Act of 1934, the registrant has duly caused this report to be signed on its behalf by the undersigned hereunto duly authorized on this 10th day of May, 2023.

                        CURO Group Holdings Corp.
                        By: /s/ Ismail Dawood______
                        Ismail Dawood
                        Chief Financial Officer


2023 Short-Term Incentive Compensation Plan and Award Notice
You have been chosen to participate in the 2023 Short-Term Incentive Compensation Plan (“STIP”) of CURO Group Holdings Corp. (the “Company”) based on your expected contributions to the Company’s financial objectives for the 2023 plan year, which is from January 1, 2023 to December 31, 2023.
Purpose
The purpose of the STIP is to incent and reward eligible employees for their material contributions to the operating and financial performance of the Company.

Eligibility Criteria

Identified employees of the Company and any of its subsidiaries, hired before October 1 of the plan year, are eligible to participate in the STIP. Further eligibility requirements are as follows:
1.New hires: Employees hired into a STIP eligible position during the plan year, and before October 1, are eligible to participate in the STIP. Unless otherwise agreed, the STIP payment will be pro-rated based on the employee’s hire date.
2.Promotions: Employees promoted into a STIP eligible role during the plan year, and before October 1, are eligible to participate in the STIP. Unless otherwise agreed, the STIP payment will be pro-rated based on the employee’s promotion date.
3.Leave of Absences: Employees on an unpaid leave of absence longer than 30 calendar days will receive a pro-rated incentive payment based on the paid time worked during the plan year.

Plan Design
You are eligible to receive an award of _% of your base salary as of December 31, 2023 (“Eligible STIP Compensation”), under the STIP. The amount of Eligible STIP Compensation you actually earn, if any, will be determined based on achievement of two separate Company performance objectives approved by the Company’s Compensation Committee (the “Committee”), as follows (the “Company Performance Objectives”):
1.Pre-Tax Income before Provision build and Recourse interest expense – 80% of your Eligible STIP Compensation is based on the Company’s Pre-Tax Income [_] before Provision build and Recourse interest expense (“Pre-Tax Income”). The Company’s Pre-Tax Income objective for the 2023 plan year is $[_] (“Target Pre-Tax Income”). If the actual Pre-Tax Income of the Company is above or below the Target Pre-Tax Income, the achievement level will be determined by the Committee.

2.Minimum Unrestricted Cash – 20% of your Eligible STIP Compensation is based on the Company’s Minimum Unrestricted Cash (“Minimum Unrestricted Cash”). The Company’s Minimum Unrestricted Cash objective for the 2023 plan year is $[_] (“Target Minimum Unrestricted Cash”). The unrestricted cash objective is pass or fail.


Note: The Company reserves the right to adjust the metrics to account for the financial impact of acquisitions, meaningful non-recurring events or other significant Company events during the year.
General Provisions


Form of Payment

The Company expects awards earned under the STIP to be paid in cash, less all required withholdings and deductions, no later than March 15, 2024. The Company reserves the right, in its sole discretion and as approved by the Committee, to change the form of any award earned.

Termination of Employment

To earn an award under the STIP, you must be employed by the Company for the entire performance period and be an active employee at the time of payment, unless otherwise (i) required by state law, (ii) provided in an employment agreement between you and the Company or (iii) determined by the Committee. In no event will an award under the STIP be accelerated in the event of termination of employment, except as provided herein.

Program Termination and Amendment

The Committee may amend, modify, terminate or suspend operation of the STIP at any time. Notice of any such changes will be communicated to participants.  

Benefits Not Guaranteed

Neither the establishment of the STIP nor participation in the STIP shall provide any guarantee or other assurance that an award will be payable under the STIP. There is no obligation of uniformity of treatment of employees or participants under the STIP.

Confidentiality

The two financial objectives set forth in Section 1 and 2 above are confidential and by participating in the STIP you explicitly agree to keep those objectives confidential.
 
No Employment Right

Participation in the STIP does not constitute a commitment, guarantee or agreement that the Company will continue to employ you and this STIP shall not be construed or applied as an employment contract or obligation.
 
Governing Law

The validity, construction and effect of the STIP shall be determined in accordance with the laws of the United States State or Canadian Province in which you work without giving effect to conflicts of law principles. The STIP is intended to be exempt from U.S. Internal Revenue Code Section 409A as a short-term deferral and will be operated and interpreted consistently with those intentions.
 
Severability

The provisions of the STIP are severable. If any provision is determined to be unenforceable, in whole or in part, then such provision shall be modified so as to be enforceable to the maximum extent permitted by law. If such provision cannot be modified to be enforceable, the provision shall be severed from the STIP to the extent unenforceable. The remaining provisions and any partially enforceable provisions shall remain in full force and effect. 

Acknowledgement


I have received and reviewed a copy of this 2023 Short-Term Incentive Compensation Plan and Award Notice.
PARTICIPANT


By:                                             
Signature


CURO Group Holdings Corp. Reports
First Quarter 2023 Financial Results
Chicago, Illinois--May 10, 2023 - CURO Group Holdings Corp. (NYSE: CURO) (“CURO” or the “Company”), a tech-enabled, omni-channel consumer finance company serving consumers in the U.S. and Canada, today announced financial results for its first quarter ended March 31, 2023.

Highlights
Net revenue increased 19.8% sequentially to $146.5 million
Operating expenses declined 6.2% sequentially to $118.2 million, and $35.5 million and 23.1% year over year
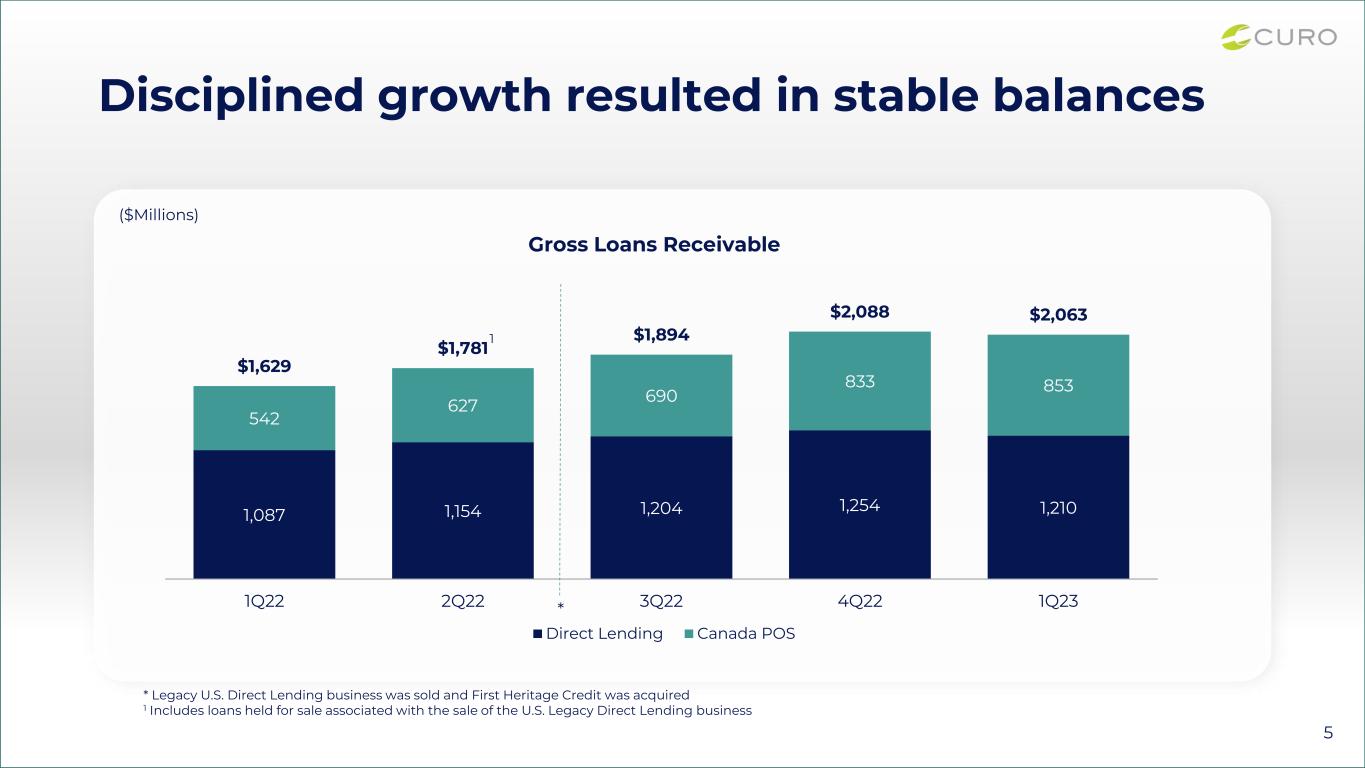
Gross loans receivables of $2.1 billion were slightly lower by 1.2% sequentially
Net charge-off rate improved 326 bps sequentially to 11.5%, and 30 bps sequentially to 14.5% excluding the changes in the Direct Lending brands in Canada charge-off policies
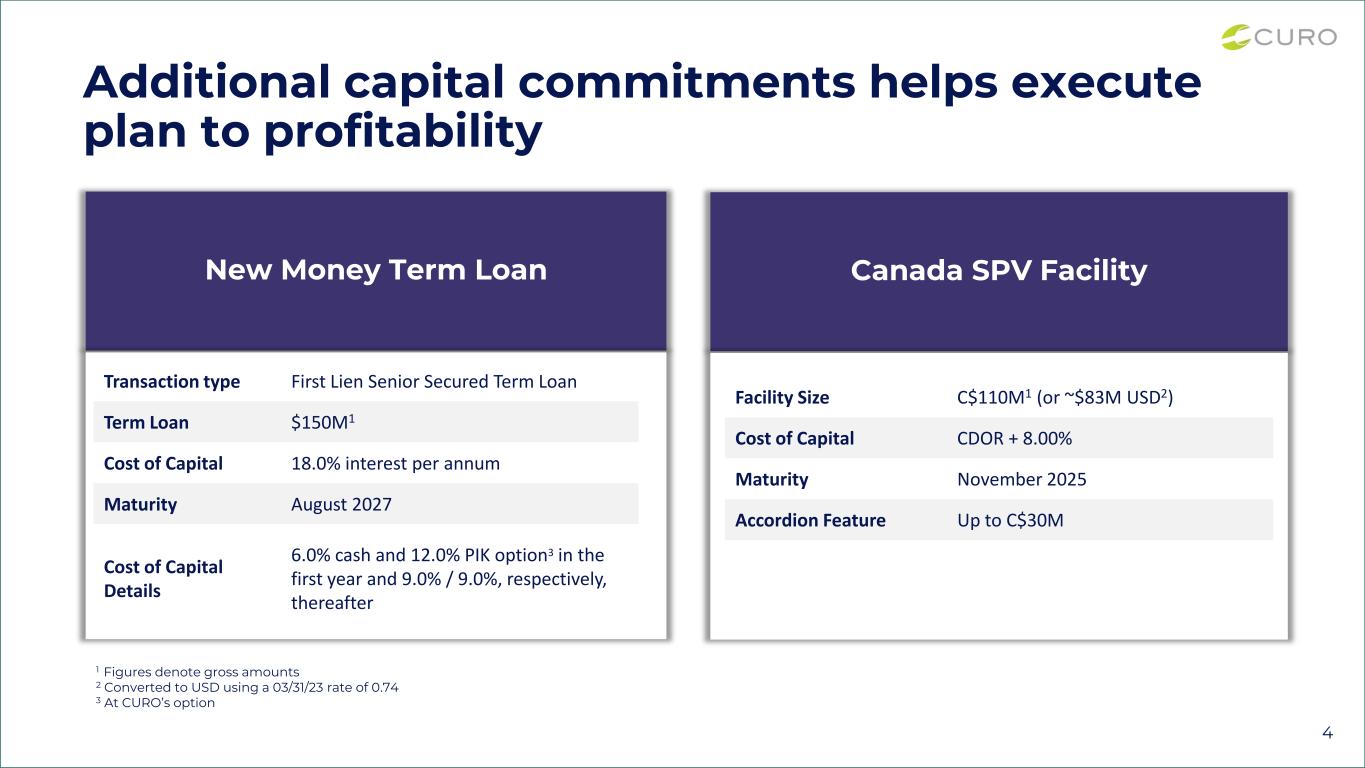
On May 9, 2023, finalized a $150.0 million term loan and a C$110.0 million non-recourse revolving warehouse facility
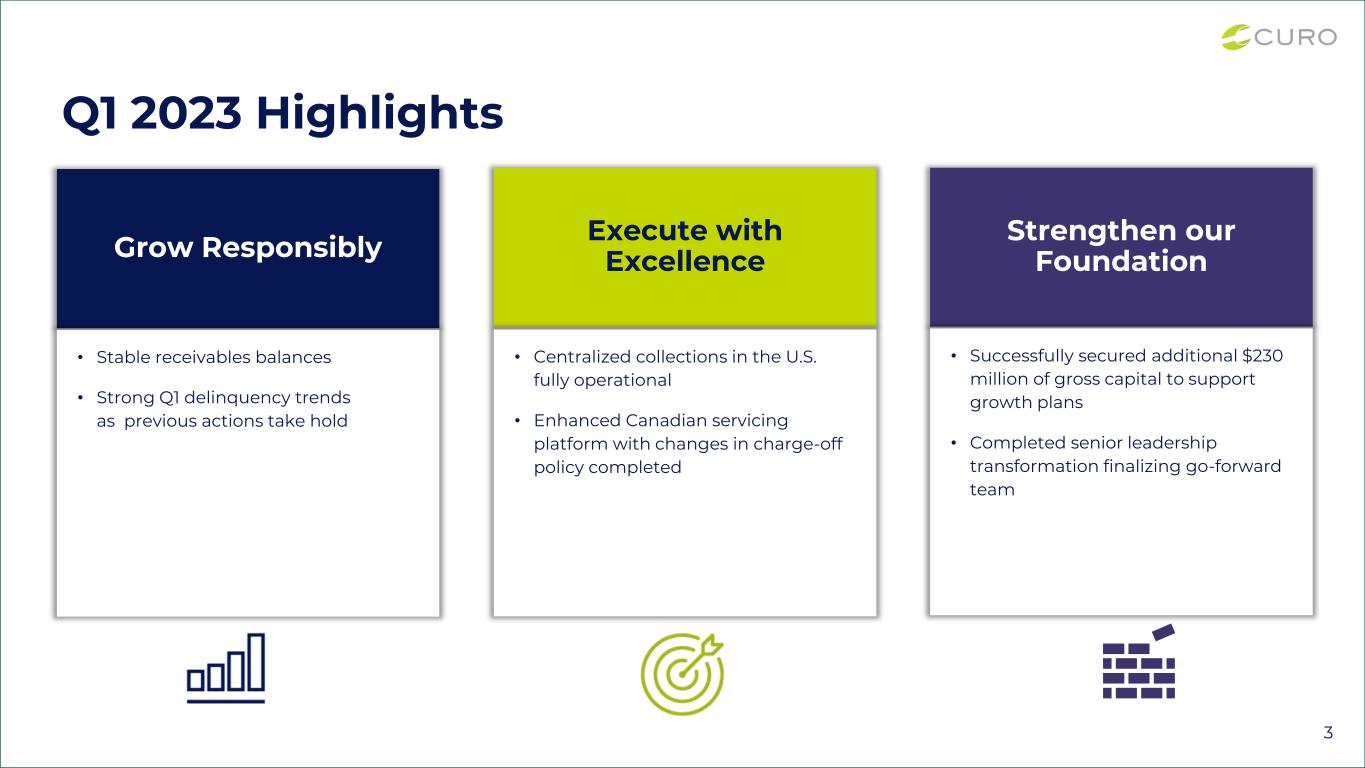
Our first quarter results highlight the emerging benefits of our business transformation and differentiated operating model,” said Doug Clark, Chief Executive Officer of CURO. “Subsequent to the quarter, we successfully raised over $230 million in gross capital, a key step to executing our plan to profitability and demonstrates continued access to capital markets and supportive lending partners. We also delivered results that were favorable relative to our guidance expectations, including solid revenue, well-managed operating expenses and stable credit quality. With a close eye on the various challenges presented by the macro environment, we will continue to execute on our business plan, support our customers and remain focused on generating long-term sustainable returns for our investors.”

Consolidated Summary Results

For the three months ended March 31, 2023, the Company had total revenue of $209.5 million compared with total revenue of $217.2 million sequentially, primarily driven by product mix shift. Net revenue was $146.5 million, an increase of $24.2 million, or 19.8% sequentially, primarily driven by a lower provision for loan loss expense related to the decrease in the net charge-off rate.

For the three months ended March 31, 2023, the Company had total operating expenses of $118.2 million, a decrease of $7.8 million, or 6.2%, sequentially. The decline reflected lower restructuring charges and operating expenses, in both cases related to store closures and headcount reductions in the U.S. and Canada. One-time restructuring charges recognized in the first quarter of 2023 and the fourth quarter of 2022 were $10.0 million and $13.1 million, respectively, representing $3.1 million of the sequential decrease.

Net loss of $59.5 million ($1.46 per share) for the three months ended March 31, 2023, compared with Net loss of $186.4 million ($4.60 per share) for the three months ended December 31, 2022. The $126.9 million improvement in Net loss in the first quarter of 2023 compared to the prior quarter was driven by a $24.2 million increase in net revenue quarter over quarter due to product mix shift, the decline in Provision for loan loss, a $7.8 million decrease in total Operating expenses related to store closures and restructuring activities completed in the fourth quarter of 2022 and the $145.2 million Goodwill impairment charge in the fourth quarter of 2022, with no such charge in the first quarter of 2023, partially offset by a $29.0 million Provision for income taxes to create a valuation allowance on U.S. deferred tax assets, and a $4.0 million increase in Interest expense.

Gross loans receivable of $2.1 billion at March 31, 2023 were slightly lower by 1.2% sequentially, primarily driven by a decrease of $55.2 million, or 6.9%, in Direct Lending Installment Loans, partially offset by an increase of $19.8 million, or 2.4%, in Canada POS Lending.
As of January 1, 2023, the Company adopted Accounting Standards Update No. 2016-13, Financial Instruments—Credit Losses (Topic 326): Measurement of Credit Losses on Financial Instruments ("CECL"). This adoption resulted in a onetime pre-tax increase to our Allowance for loan losses of $135.2 million, which was recorded to opening Accumulated deficit and did not impact the Statement of Operations.

The Company's Net charge-off rate in the first quarter improved 326 bps, sequentially, to 11.5%, primarily driven by a change in our Direct Lending brands in Canada charge-off policies during the quarter, as part of the alignment of charge-off policies across the Company, as well as improved recoveries as a result of improvements to our credit collection processes. The Company's 91+ days delinquency ratio increased by 60 bps, sequentially, to 3.2% primarily driven by these policy changes.

1


As of or for the Quarter Ended
Mar 31,Dec 31,Sep 30,Jun 30,Mar 31,
Delinquency and Loss Ratios
20232022202220222022
31-60 days delinquency ratio1.8 %1.9 %2.5 %2.4 %2.1 %
61-90 days delinquency ratio1.5 %1.3 %1.5 %1.8 %1.9 %
91+ days delinquency ratio3.2 %2.6 %2.6 %2.0 %2.2 %
Net charge-offs11.5 %14.8 %13.2 %24.0 %23.2 %

Funding and Liquidity

As of March 31, 2023, principal debt balances outstanding of $2.7 billion, which consisted of 65.5% of fixed rate or hedged variable rate debt and 34.5% of variable rate debt. We had $54.9 million of Cash and cash equivalents on the Consolidated Balance Sheet and available for general corporate purposes.

As of March 31, 2023, unrestricted cash and cash equivalents, together with $109.9 million in unused borrowing capacity and $140.1 million of unencumbered Gross loans receivable, provided approximately $303.6 million in available capital resources.

About CURO
CURO Group Holdings Corp. (NYSE: CURO) is a leading consumer credit lender serving U.S. and Canadian customers for over 25 years. Our roots in the consumer finance market run deep. We’ve worked diligently to provide customers a variety of convenient, easily accessible financial services. Our decades of diversified data power a hard-to-replicate underwriting and scoring engine, mitigating risk across the full spectrum of credit products. We operate a number of brands including Cash Money®, LendDirect®, Flexiti®, Heights Finance, Southern Finance, Covington Credit, Quick Credit and First Heritage Credit.
Conference Call
CURO will host a conference call to discuss these results at 8:30 a.m. Eastern Time on Wednesday, May 10, 2023. The live webcast of the call can be accessed at the CURO Investor Relations website at http://ir.curo.com/.
You may access the call at 1-833-953-2430 (1-412-317-5759 for international callers). Please ask to join the CURO Group Holdings call. A replay of the conference call will be available until May 17, 2023, at 5:00 p.m. Eastern Time. An archived version of the webcast will be available on the CURO Investors website for 90 days. You may access the conference call replay at 1-877-344-7529 (1-412-317-0088 for international callers). The replay access code is 1314764.
Final Results
The financial results presented and discussed herein are on a preliminary and unaudited basis; final unaudited data will be included in the Company’s Quarterly Report on Form 10-Q for the three months ended March 31, 2023.

2


Table 1 - Consolidated Statements of Operations
(in thousands, unaudited)Three Months Ended,
Mar 31,Dec 31,Sept 30,Jun 30,Mar 31,
20232022202220222022
Revenue
Interest and fees revenue$179,437 $181,605 $180,515 $278,331 $264,956 
Insurance and other income30,036 35,593 33,605 26,073 25,240 
Total revenue209,473 217,198 214,120 304,404 290,196 
Provision for losses62,932 94,849 78,399 129,546 97,531 
Net revenue146,541 122,349 135,721 174,858 192,665 
Operating Expenses
Salaries and benefits64,805 66,067 53,413 82,427 79,729 
Occupancy11,672 12,114 12,827 17,507 17,037 
Advertising2,175 3,692 5,244 12,707 10,500 
Direct operations13,092 11,832 11,729 20,293 20,274 
Depreciation and amortization9,021 8,337 9,499 8,672 9,814 
Other operating expense17,433 24,002 23,645 18,787 16,377 
Total operating expenses118,198 126,044 116,357 160,393 153,731 
Other expense (income)
Interest expense58,943 54,978 50,149 42,193 38,341 
Loss (income) from equity method investment3,413 1,932 2,309 1,328 (1,584)
Goodwill impairment— 145,241 — — — 
Loss on extinguishment of debt— 689 3,702 — — 
Loss (gain) on change in fair value of contingent consideration2,728 — (11,354)4,014 (265)
Gain on sale of business2,027 — (68,443)— — 
Total other expense 67,111 202,840 (23,637)47,535 36,492 
(Loss) income before income taxes(38,768)(206,535)43,001 (33,070)2,442 
Provision (benefit) for income taxes20,703 (20,142)17,348 (6,990)1,106 
Net (loss) income (59,471)(186,393)25,653 (26,080)1,336 
Basic (loss) earnings per share$(1.46)$(4.60)$0.63 $(0.65)$0.03 
Diluted (loss) earnings per share$(1.46)$(4.60)$0.63 $(0.65)$0.03 
Weighted average common shares outstanding:
Basic40,783 40,488 40,479 40,376 40,368 
Diluted40,783 40,488 40,835 40,376 41,308 

3


Table 2 - Consolidated Balance Sheets
As of
Mar 31,Dec 31,Sep 30,Jun 30,Mar 31,
(in thousands, unaudited)20232022202220222022
ASSETS
Cash and cash equivalents54,935 73,932 45,683 37,394 60,209 
Restricted cash123,282 91,745 144,020 97,465 110,118 
Gross loans receivable 2,062,829 2,087,833 1,894,427 1,592,815 1,628,568 
Less: Allowance for loan losses(259,959)(122,028)(102,743)(90,286)(98,168)
Loans receivable, net1,802,870 1,965,805 1,791,684 1,502,529 1,530,400 
Income taxes receivable20,100 21,918 13,469 46,450 28,664 
Prepaid expenses and other47,295 53,057 65,167 25,370 40,112 
Property and equipment, net29,867 31,957 37,402 38,752 54,865 
Investment in Katapult20,502 23,915 25,848 28,157 29,484 
Right of use asset - operating leases54,597 61,197 64,683 64,602 114,305 
Deferred tax assets53,474 49,893 31,986 23,993 20,066 
Goodwill276,487 276,269 424,292 352,990 430,967 
Intangibles, net127,387 123,677 120,345 113,130 113,640 
Other assets10,991 15,828 12,774 8,558 9,535 
Assets held for sale (1)
— — — 338,779 — 
Total Assets2,621,787 2,789,193 2,777,353 2,678,169 2,542,365 
LIABILITIES AND STOCKHOLDERS' EQUITY
Liabilities
Accounts payable and accrued liabilities $85,875 $73,827 $66,723 $81,423 $84,783 
Deferred revenue33,227 32,259 25,111 23,425 24,265 
Lease liability - operating leases55,468 62,847 66,370 67,339 120,593 
Contingent consideration related to acquisition18,128 16,884 15,770 30,354 26,687 
Income taxes payable— — — — 
Accrued interest 20,090 38,460 18,048 34,970 16,481 
Liability for losses on CSO lender-owned consumer loans— — — — 7,166 
Debt2,627,263 2,607,314 2,449,316 2,189,431 2,090,085 
Other long-term liabilities10,552 11,736 11,563 12,146 13,679 
Deferred tax liabilities— — — 12,360 5,839 
Liabilities held for sale (1)
— — — 111,137 — 
Total Liabilities2,850,603 2,843,327 2,652,901 2,562,589 2,389,578 
Total Stockholders' (Deficit) Equity(228,816)(54,134)124,452 115,580 152,787 
Total Liabilities and Stockholders' (Deficit) Equity2,621,787 2,789,193 2,777,353 2,678,169 2,542,365 
(1) Assets held for sale and Liabilities held for sale represent the balance, as of June 30, 2022, for assets and liabilities, respectively, associated with the sale of the Legacy U.S. Direct Lending Business. The sale of the Legacy U.S. Direct Lending business closed in July 2022.
    

4


Table 3 - Consolidated Portfolio Performance
(in thousands, except percentages, unaudited)Q1 2023Q4 2022Q3 2022
Q2 2022(1)
Q1 2022
Gross loans receivable (5)
Revolving LOC1,314,6951,284,5151,129,3871,128,3721,015,338
Installment loans748,134803,318765,040652,468613,230
Total gross loans receivable$2,062,829$2,087,833$1,894,427$1,780,840$1,628,568
Lending Revenue
Revolving LOC84,22581,17077,03796,58291,023
Installment loans95,212100,435103,478181,749173,933
Total lending revenue$179,437$181,605$180,515$278,331$264,956
Lending Provision
Revolving LOC30,10646,74541,78740,43537,447
Installment loans31,13946,44233,51086,48457,435
Total lending provision$61,245$93,187$75,297$126,919$94,882
NCOs (2) (6)
Revolving LOC17,95335,38730,90733,94534,372
Installment loans (5)
41,07838,16831,37271,05660,386
Total NCOs$59,031$73,555$62,279$105,001$94,758
NCO rate (annualized) (2) (3) (5)
Revolving LOC5.6%11.6%10.8%12.8%14.4%
Installment loans21.5%19.6%17.6%44.8%38.8%
Total NCO rate11.5%14.8%13.2%24.0%23.2%
ACL rate (4) (5) (6)
Revolving LOC13.3%6.1%6.0%6.7%7.0%
Installment loans11.3%5.4%4.6%8.1%5.5%
Total ACL rate12.6%5.8%5.4%6.7%6.0%
31+ days past-due rate (4) (5)
Revolving LOC5.5%3.3%4.1%4.1%3.7%
Installment loans8.2%9.6%10.2%9.2%9.0%
Total past-due rate6.5%5.8%6.6%6.1%5.8%
(1) Includes loan balances and activity classified as Held for Sale.
(2) NCOs presented above include $0.0 million, $0.0 million, $0.5 million, $10.3 million, and $5.0 million for the three months ended March 31, 2023, December 31, 2022, September 30, 2022, June 30, 2022, March 31, 2022, respectively, related to the purchase accounting fair value discount, which are excluded from provision.
(3) We calculate NCO rate as total quarterly NCOs divided by Average gross loans receivable; then we annualize the rate. The amount and timing of recoveries are impacted by our collection strategies, which are based on customer behavior and risk profile and include direct customer communications and the periodic sale of charged off loans.
(4) We calculate (i) Allowance for credit losses ("ACL") rate and (ii) 31+ days past-due rate as the respective totals divided by gross loans receivable at each respective quarter end.
(5) All balances in connection with the CSO program were disposed of on July 8, 2022 upon the completion of the divestiture of the Legacy U.S. Direct Lending business, as such these balances have been excluded from this amount.
(6) We adopted ASU 2016-13, Financial Instruments - Credit Losses (Topic 326): Measurement of Credit Losses on Financial Instruments on January 1, 2023, which requires us to estimate the lifetime expected credit loss on financial instruments. Our previous model required the recognition of credit losses when it was probable that a loss had been incurred.


5


Table 4 - Direct Lending Segment - Operating (Loss)/Income
(in thousands, unaudited)Three Months Ended,
Mar 31,Dec 31,Sep 30,Jun 31,Mar 31,
20232022202220222022
Total revenue$169,368 $181,925 $186,409 $281,251 $269,887 
Provision for losses48,364 77,724 65,020 123,584 88,817 
Net revenue121,004 104,201 121,389 157,667 181,070 
Total operating expenses103,151 111,632 102,840 143,965 137,963 
Segment operating (loss) income$17,853 $(7,431)$18,549 $13,702 $43,107 


6


Table 5 - Direct Lending Segment - Portfolio Performance
(in thousands, except percentages, unaudited)Q1 2023Q4 2022Q3 2022
Q2 2022(1)
Q1 2022
Gross loans receivable (5)
Revolving LOC461,443451,077439,117501,209473,562
Installment loans 748,133803,318765,041652,467613,231
Total gross loans receivable1,209,5761,254,3951,204,1581,153,6761,086,793
Lending Revenue
Revolving LOC49,09249,91552,46175,73672,368
Installment loans95,212100,435103,478181,747173,934
Total lending revenue144,304150,350155,939257,483246,302
Lending Provision
Revolving LOC15,53929,62028,40834,47228,734
Installment loans31,13946,44233,51186,48557,435
Total lending provision46,67876,06261,919120,95786,169
NCOs (2) (5)
Revolving LOC6,23426,71524,79330,40831,645
Installment loans41,07838,16829,78343,66138,894
Total NCOs47,31264,88354,57674,06970,539
NCO rate (annualized) (2) (3) (5)
Revolving LOC5.5%23.8%20.9%25.0%27.6%
Installment loans 21.5%19.3%16.7%27.7%25.3%
Total NCO rate15.6%20.9%18.4%26.5%26.3%
ACL rate (4) (5) (6)
Revolving LOC25.6%8.4%7.9 %9.3 %9.2 %
Installment loans11.3%5.4%4.6 %6.9 %4.4 %
Total ACL rate16.8%6.5%5.8 %7.9 %6.5 %
31+ days past-due rate (4) (5)
Revolving LOC8.4%4.1%5.1 %5.8 %5.8 %
Installment loans8.2%9.6%10.2 %9.7 %9.3 %
Total past-due rate8.3%7.6%8.3 %8.0 %7.8 %
(1) Includes loan balances and activity classified as Held for Sale.
(2) NCOs presented above include $0.0 million, $0.0 million, $0.5 million, $10.3 million and $5.0 million for the three months ended March 31, 2023, December 31, 2022, September 30, 2022, June 30, 2022 and March 31, 2022, respectively, related to the purchase accounting fair value discount, which are excluded from provision.
(3) We calculate NCO rate as total quarterly NCOs divided by Average gross loans receivable, then we annualize the rate. The amount and timing of recoveries are impacted by our collection strategies, which are based on customer behavior and risk profile and include direct customer communications and the periodic sale of charged off loans.
(4) We calculate (i) ACL rate and (ii) 31+ days past-due rate as the respective totals divided by gross loans receivable at each respective quarter end.
(5) All balances in connection with the CSO program were disposed of on July 8, 2022 upon the completion of the divestiture of the Legacy U.S. Direct Lending Business, as such these balances have been excluded from this amount.
(6) We adopted ASU 2016-13, Financial Instruments - Credit Losses (Topic 326): Measurement of Credit Losses on Financial Instruments on January 1, 2023, which requires us to estimate the lifetime expected credit loss on financial instruments. Our previous model required the recognition of credit losses when it was probable that a loss had been incurred.
7


Table 6 - Canada POS Lending Segment - Operating Income/(Loss)
(in thousands, unaudited)Three Months Ended,
Mar 31,Dec 31,Sept 30,Jun 30,Mar 31,
20232022202220222022
Total revenue$40,105 $35,273 $27,710 $23,154 $20,309 
Provision for losses14,568 17,125 13,378 5,963 8,714 
Net revenue25,537 18,148 14,332 17,191 11,595 
Total operating expenses15,047 14,412 13,519 16,427 15,768 
Segment operating income (loss)$10,490 $3,736 $813 $764 $(4,173)

Table 7 - Canada POS Lending Segment - Portfolio Performance
(in thousands, except percentages, unaudited)Q1 2023Q4 2022Q3 2022Q2 2022Q1 2022
Revolving LOC
Gross loans receivable853,253833,438690,270627,163541,776
Lending revenue35,13331,25524,57520,84618,655
Lending provision14,56817,12513,3795,9638,714
NCOs 11,7198,672$6,114$3,537$2,727
NCO rate (annualized) (1)
5.6 %4.4 %3.6 %2.4 %2.0 %
ACL rate (2) (3)
6.7 %4.9 %4.8 %4.5 %5.1 %
31+ days past-due rate (2)
3.9 %2.9 %3.6 %2.8 %1.8 %
(1) We calculate NCO rate as total quarterly NCOs divided by Average gross loans receivable then we annualized the rate. The amount and timing of recoveries are impacted by our collection strategies, which are based on customer behavior and risk profile and include direct customer communications and the periodic sale of charged off loans.
(2) We calculate (i) ACL rate and (ii) 31+ days past-due rate as the respective totals divided by gross loans receivable at each respective quarter end.
(3) We adopted ASU 2016-13, Financial Instruments - Credit Losses (Topic 326): Measurement of Credit Losses on Financial Instruments on January 1, 2023, which requires us to estimate the lifetime expected credit loss on financial instruments. Our previous model required the recognition of credit losses when it was probable that a loss had been incurred.

Forward-Looking Statements
This press release contains forward-looking statements. These forward-looking statements include projections, estimates and assumptions about various matters, such as future financial and operational performance, including our belief in the benefits of our business transformation and differentiated operating model, our ability to execute on our plan to profitability and demonstrate continued access to capital markets and our ability to execute on our business plan, support our customers and remain focused on generating long-term sustainable returns for our investors. In addition, words such as “guidance,” “estimate,” “anticipate,” “believe,” “forecast,” “step,” “plan,” “predict,” “focused,” “project,” “is likely,” “expect,” "anticipate," “intend,” “should,” “will,” “confident,” variations of such words and similar expressions are intended to identify forward-looking statements. Our ability to achieve these forward-looking statements is based on certain assumptions, judgments and other factors, both within and outside of our control, that could cause actual results to differ materially from those in the forward-looking statements, including: risks relating to the uncertainty of projected financial and operational information and forecasts, including errors in our internal forecasts; our ability to manage growth; our dependence on third-party lenders to provide the cash we need to fund our loans and our ability to affordably access third-party financing; our level of indebtedness; the effects of competition on our business; our ability to attract and retain customers; global economic, market, financial, political or health conditions or events; actions of regulators and the impact of those actions on our business; our ability to successfully integrate acquired businesses; our ability to protect our proprietary technology and analytics and keep up with that of our competitors; disruption of our information technology systems that adversely affect our business operations; ineffective pricing of the credit risk of our prospective or existing customers; inaccurate information supplied by customers or third parties that could lead to errors in judging customers’ qualifications to receive loans; improper disclosure of customer personal data; failure of third parties who provide products, services or support to us; disruption to our relationships with banks and other third-party electronic payment solutions providers as well as other factors discussed in our filings with the Securities and Exchange Commission. These projections, estimates and assumptions may prove to be inaccurate in the future. These forward-looking statements are not guarantees of future performance and involve known and unknown risks and uncertainties that are difficult to predict with regard to timing, extent, likelihood and degree of occurrence. There may be additional risks that we presently do not know or that we currently believe are immaterial that could also cause actual results to differ from those contained in the forward-looking statements. Given these risks and uncertainties, investors should not place undue reliance on forward-looking statements as a prediction of actual future results. We undertake no obligation to update, amend or clarify any forward-looking statement for any reason.

8


Investor Relations:

Phone: 844-200-0342

Email: [email protected]

(CURO-NWS)
9

Q1 2023 Earnings Presentation May 10, 2023

 
Disclaimer IMPORTANT: You must read the following information before continuing to the rest of the presentation, which is being provided to you for informational purposes only. FORWARD-LOOKING STATEMENTS This presentation contains forward-looking statements. These forward-looking statements include projections, estimates and assumptions about various matters such as our ability to continue to access capital markets and our future operational performance, including our second quarter outlook, the timing and terms of our capital raising activities, and our growth strategy framework. In addition, words such as “estimate,” “believe,” “forecast,” “predict,” “project,” “intend,” “should” and variations of such words and similar expressions are intended to identify forward-looking statements. Our ability to achieve these forward-looking statements is based on certain assumptions, judgments and other factors, both within and outside of our control, that could cause actual results to differ materially from those in the forward-looking statements, including, risks relating to the uncertainty of projected financial information and forecasts, our level of indebtedness; our dependence on third-party lenders to provide the cash we need to fund our indebtedness and our ability to affordably access third-party financing; the impact of regulations on our business; the effects of competition on our business; our ability to attract and retain customers; global economic, market, financial, political or public health conditions or events; our ability to integrate acquired businesses; our ability to protect our proprietary technology and analytics; disruption of our information technology systems; improper disclosure of customer personal data, as well as other factors discussed in our filings with the Securities and Exchange Commission. The foregoing factors, as well as other existing risk factors and new risk factors that emerge from time to time, may cause actual results to differ materially from those contained in any forward-looking statements. Given these risks and uncertainties, investors should not place undue reliance on forward-looking statements as a prediction of actual future results. Furthermore, the Company undertakes no obligation to update, amend or clarify forward-looking statements. NON-GAAP FINANCIAL MEASURES In addition to the financial information prepared in conformity with U.S. GAAP, we provide certain “non-GAAP financial measures.” Such measures are intended as a supplemental measure of our performance that are not required by, or presented in accordance with, GAAP. We present these non-GAAP financial measures because we believe that, when viewed with our GAAP results and the accompanying reconciliation, such measures provide useful information for comparing our performance over various reporting periods as they remove from our operating results the impact of items that we believe do not reflect our core operating performance. These non- GAAP financial measures are not substitutes for any GAAP financial measure and there are limitations to using them. Although the Company believes that these non-GAAP financial measures can make an evaluation of our operating performance more consistent because they remove items that do not reflect our core operations, other companies in the Company’s industry may define their own non-GAAP financial measures differently or use different measures. As a result, it may be difficult to use any non-GAAP financial measure to compare the performance of other companies to our performance. The non-GAAP financial measures presented in these slides should not be considered as measures of the income generated by our business or discretionary cash available to us to invest in the growth of our business. Our management compensates for these limitations by reference to GAAP results and using these non-GAAP financial measures as supplemental measures. Reconciliation of non-GAAP metrics to the closest comparable GAAP metrics are included in the Appendix. All product names, logos, brands, trademarks and registered trademarks are property of their respective owners. 2

 
Q1 2023 Highlights Strengthen our Foundation • Successfully secured additional $230 million of gross capital to support growth plans • Completed senior leadership transformation finalizing go-forward team Execute with Excellence • Centralized collections in the U.S. fully operational • Enhanced Canadian servicing platform with changes in charge-off policy completed Grow Responsibly • Stable receivables balances • Strong Q1 delinquency trends as previous actions take hold 3

 
Additional capital commitments helps execute plan to profitability Canada SPV FacilityNew Money Term Loan Facility Size C$110M1 (or ~$83M USD2) Cost of Capital CDOR + 8.00% Maturity November 2025 Accordion Feature Up to C$30M Transaction type First Lien Senior Secured Term Loan Term Loan $150M1 Cost of Capital 18.0% interest per annum Maturity August 2027 Cost of Capital Details 6.0% cash and 12.0% PIK option3 in the first year and 9.0% / 9.0%, respectively, thereafter 4 1 Figures denote gross amounts 2 Converted to USD using a 03/31/23 rate of 0.74 3 At CURO’s option

 
1,087 1,154 1,204 1,254 1,210 542 627 690 833 853 $1,629 $1,781 $1,894 $2,088 $2,063 1Q22 2Q22 3Q22 4Q22 1Q23 Gross Loans Receivable Direct Lending Canada POS Disciplined growth resulted in stable balances ($Millions) * Legacy U.S. Direct Lending business was sold and First Heritage Credit was acquired 1 Includes loans held for sale associated with the sale of the U.S. Legacy Direct Lending business * 1 5
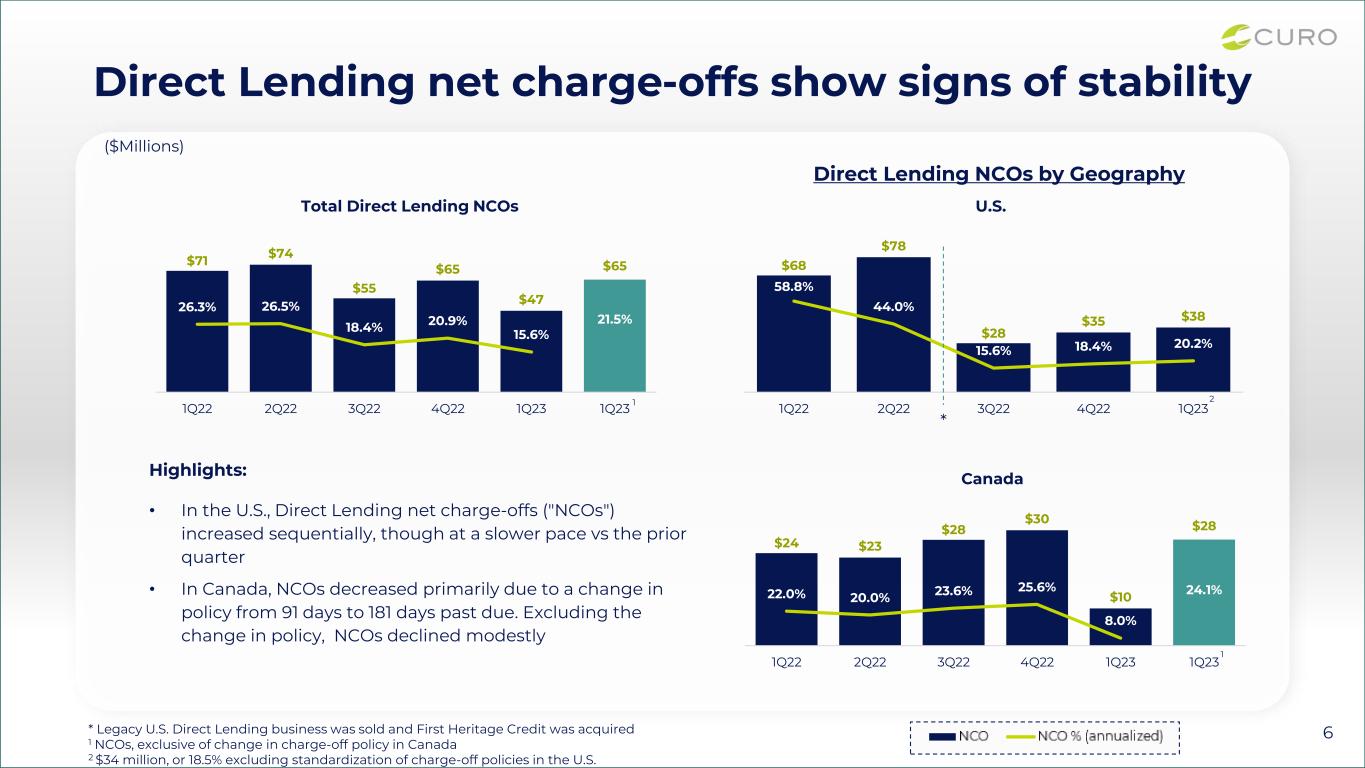

 
$68 $78 $28 $35 $38 58.8% 44.0% 15.6% 18.4% 20.2% 1Q22 2Q22 3Q22 4Q22 1Q23 U.S. $71 $74 $55 $65 $47 $65 26.3% 26.5% 18.4% 20.9% 15.6% 21.5% 1Q22 2Q22 3Q22 4Q22 1Q23 1Q23 Total Direct Lending NCOs $24 $23 $28 $30 $10 $28 22.0% 20.0% 23.6% 25.6% 8.0% 24.1% 1Q22 2Q22 3Q22 4Q22 1Q23 1Q23 Canada Direct Lending net charge-offs show signs of stability Highlights: • In the U.S., Direct Lending net charge-offs ("NCOs") increased sequentially, though at a slower pace vs the prior quarter • In Canada, NCOs decreased primarily due to a change in policy from 91 days to 181 days past due. Excluding the change in policy, NCOs declined modestly * Legacy U.S. Direct Lending business was sold and First Heritage Credit was acquired 1 NCOs, exclusive of change in charge-off policy in Canada 2 $34 million, or 18.5% excluding standardization of charge-off policies in the U.S. ($Millions) * 1 1 Direct Lending NCOs by Geography 2 6
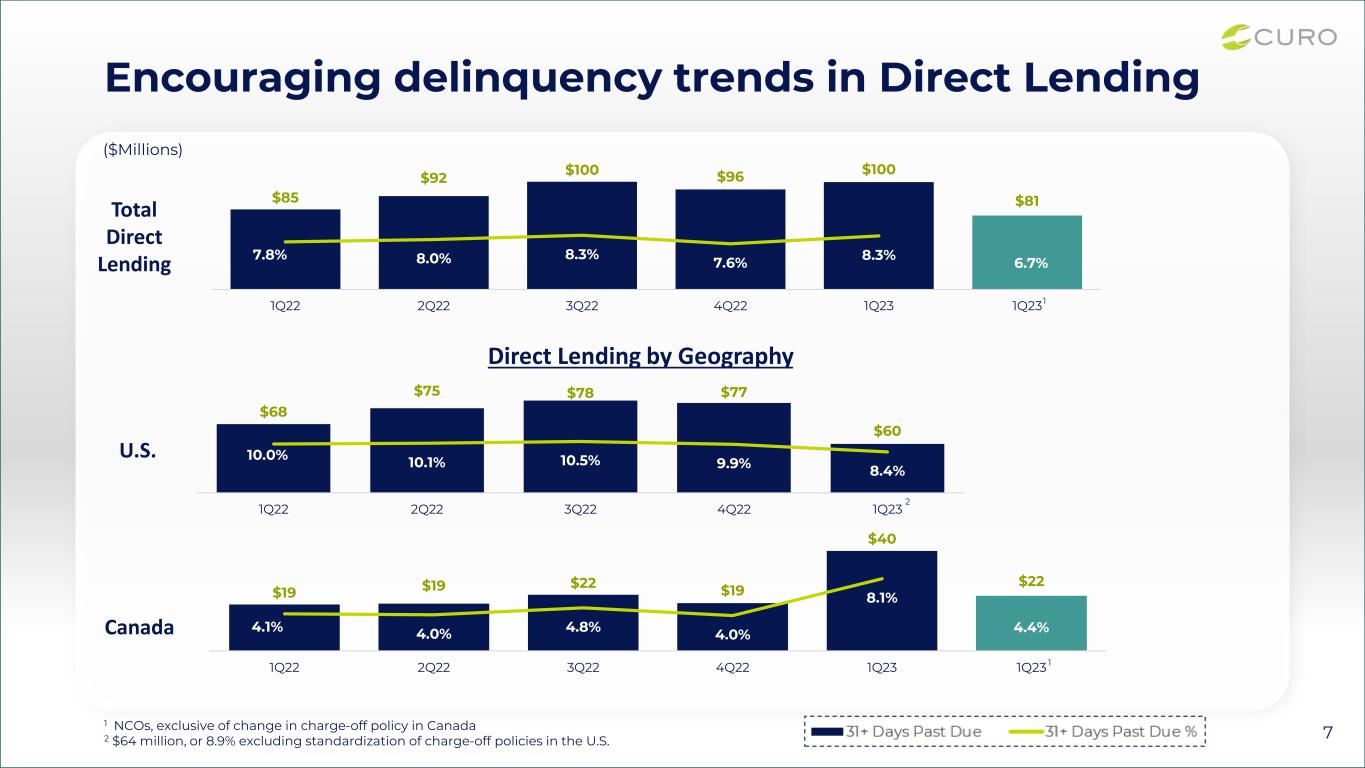

 
$85 $92 $100 $96 $100 $81 7.8% 8.0% 8.3% 7.6% 8.3% 6.7% 1Q22 2Q22 3Q22 4Q22 1Q23 1Q23 $19 $19 $22 $19 $40 $22 4.1% 4.0% 4.8% 4.0% 8.1% 4.4% 1Q22 2Q22 3Q22 4Q22 1Q23 1Q23 Encouraging delinquency trends in Direct Lending ($Millions) 1 NCOs, exclusive of change in charge-off policy in Canada 2 $64 million, or 8.9% excluding standardization of charge-off policies in the U.S. 1 Canada U.S. Total Direct Lending 1 Direct Lending by Geography 7 $68 $75 $78 $77 $60 10.0% 10.1% 10.5% 9.9% 8.4% 1Q22 2Q22 3Q22 4Q22 1Q23 2
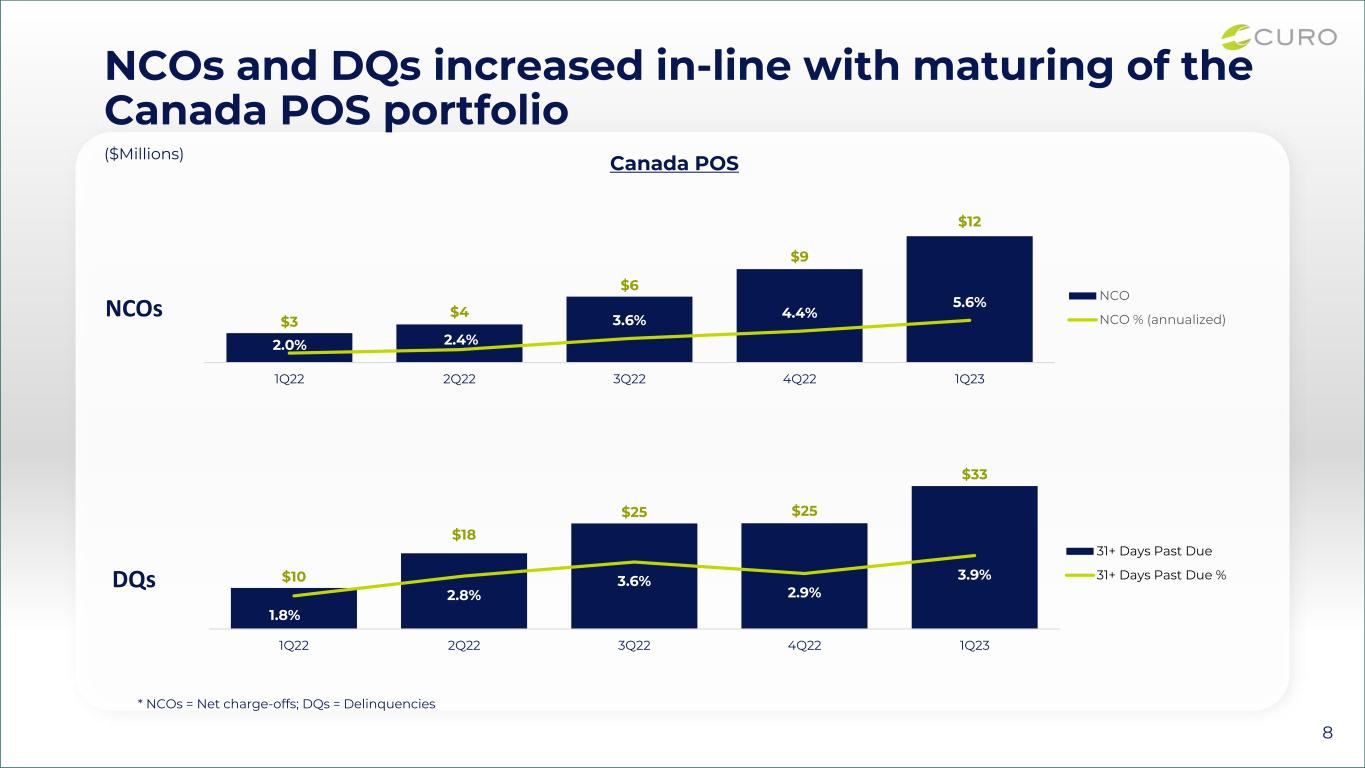

 
NCOs and DQs increased in-line with maturing of the Canada POS portfolio $3 $4 $6 $9 $12 2.0% 2.4% 3.6% 4.4% 5.6% 1Q22 2Q22 3Q22 4Q22 1Q23 NCO NCO % (annualized) $10 $18 $25 $25 $33 1.8% 2.8% 3.6% 2.9% 3.9% 1Q22 2Q22 3Q22 4Q22 1Q23 31+ Days Past Due 31+ Days Past Due % NCOs DQs ($Millions) 8 * NCOs = Net charge-offs; DQs = Delinquencies Canada POS
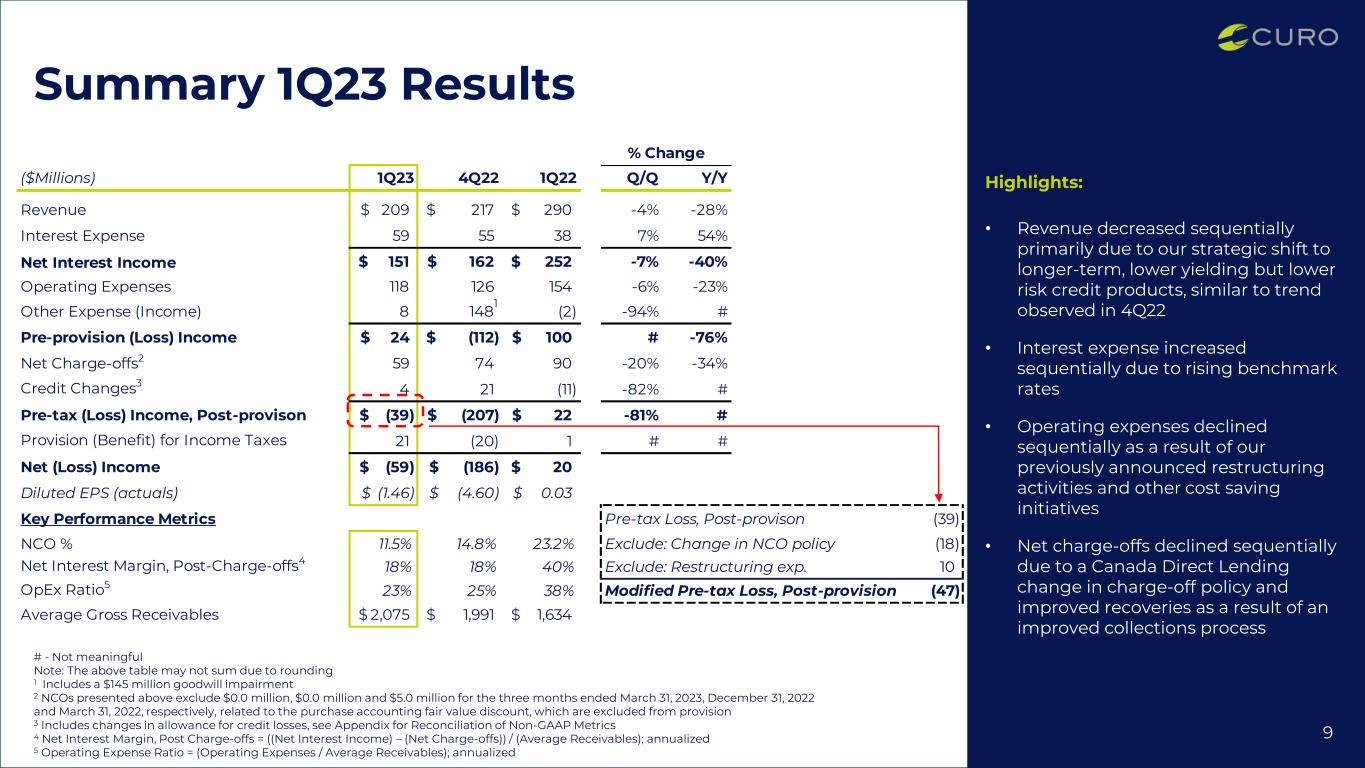

 
% Change ($Millions) 1Q23 4Q22 1Q22 Q/Q Y/Y Revenue 209$ 217$ 290$ -4% -28% Interest Expense 59 55 38 7% 54% Net Interest Income 151$ 162$ 252$ -7% -40% Operating Expenses 118 126 154 -6% -23% Other Expense (Income) 8 148 (2) -94% # Pre-provision (Loss) Income 24$ (112)$ 100$ # -76% Net Charge-offs2 59 74 90 -20% -34% Credit Changes3 4 21 (11) -82% # Pre-tax (Loss) Income, Post-provison (39)$ (207)$ 22$ -81% # Provision (Benefit) for Income Taxes 21 (20) 1 # # Net (Loss) Income (59)$ (186)$ 20$ Diluted EPS (actuals) (1.46)$ (4.60)$ 0.03$ Key Performance Metrics Pre-tax Loss, Post-provison (39) NCO % 11.5% 14.8% 23.2% Exclude: Change in NCO policy (18) Net Interest Margin, Post-Charge-offs4 18% 18% 40% Exclude: Restructuring exp. 10 OpEx Ratio5 23% 25% 38% Modified Pre-tax Loss, Post-provision (47) Average Gross Receivables 2,075$ 1,991$ 1,634$ Summary 1Q23 Results Highlights: • Revenue decreased sequentially primarily due to our strategic shift to longer-term, lower yielding but lower risk credit products, similar to trend observed in 4Q22 • Interest expense increased sequentially due to rising benchmark rates • Operating expenses declined sequentially as a result of our previously announced restructuring activities and other cost saving initiatives • Net charge-offs declined sequentially due to a Canada Direct Lending change in charge-off policy and improved recoveries as a result of an improved collections process # - Not meaningful Note: The above table may not sum due to rounding 1 Includes a $145 million goodwill impairment 2 NCOs presented above exclude $0.0 million, $0.0 million and $5.0 million for the three months ended March 31, 2023, December 31, 2022 and March 31, 2022, respectively, related to the purchase accounting fair value discount, which are excluded from provision 3 Includes changes in allowance for credit losses, see Appendix for Reconciliation of Non-GAAP Metrics 4 Net Interest Margin, Post Charge-offs = ((Net Interest Income) – (Net Charge-offs)) / (Average Receivables); annualized 5 Operating Expense Ratio = (Operating Expenses / Average Receivables); annualized 1 9
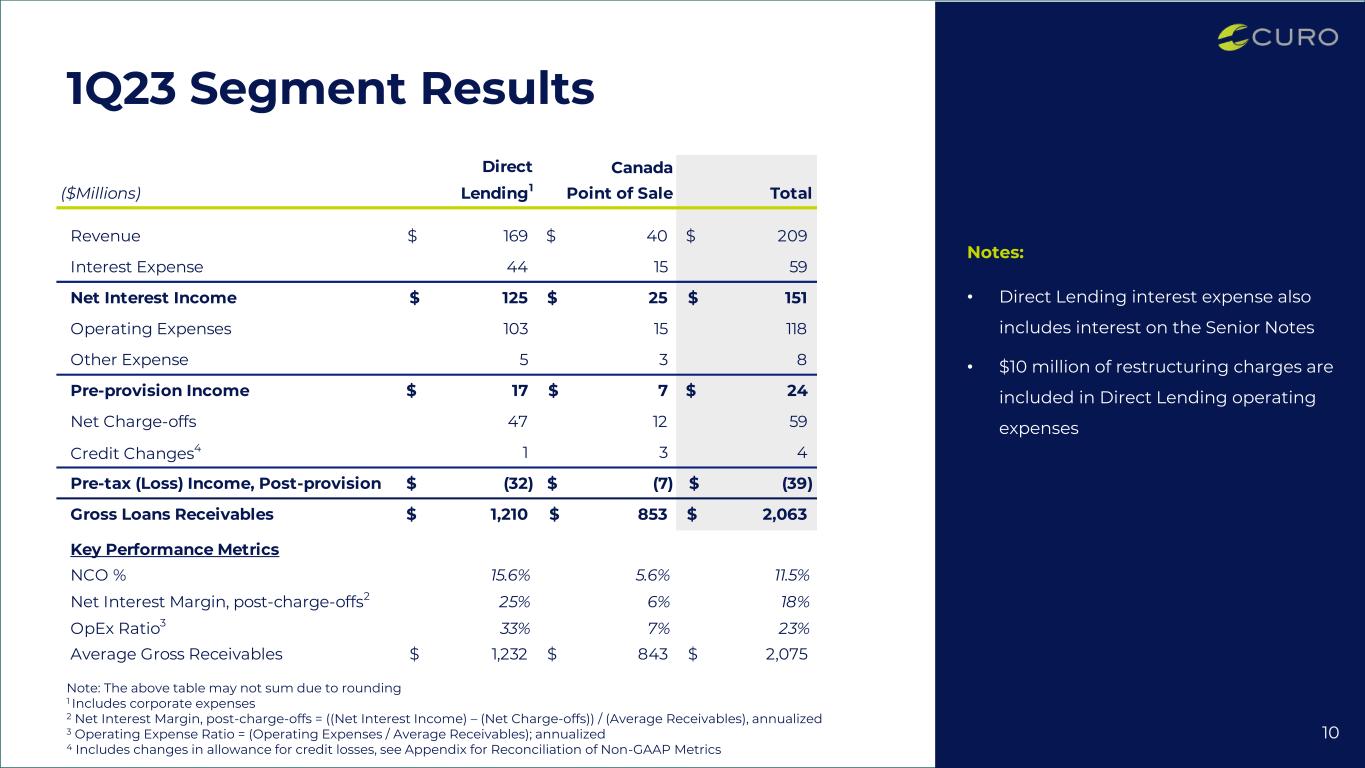

 
1Q23 Segment Results 10 Notes: • Direct Lending interest expense also includes interest on the Senior Notes • $10 million of restructuring charges are included in Direct Lending operating expenses Note: The above table may not sum due to rounding 1 Includes corporate expenses 2 Net Interest Margin, post-charge-offs = ((Net Interest Income) – (Net Charge-offs)) / (Average Receivables), annualized 3 Operating Expense Ratio = (Operating Expenses / Average Receivables); annualized 4 Includes changes in allowance for credit losses, see Appendix for Reconciliation of Non-GAAP Metrics ($Millions) Direct Lending1 Canada Point of Sale Total Revenue 169$ 40$ 209$ Interest Expense 44 15 59 Net Interest Income 125$ 25$ 151$ Operating Expenses 103 15 118 Other Expense 5 3 8 Pre-provision Income 17$ 7$ 24$ Net Charge-offs 47 12 59 Credit Changes4 1 3 4 Pre-tax (Loss) Income, Post-provision (32)$ (7)$ (39)$ Gross Loans Receivables 1,210$ 853$ 2,063$ Key Performance Metrics NCO % 15.6% 5.6% 11.5% Net Interest Margin, post-charge-offs2 25% 6% 18% OpEx Ratio3 33% 7% 23% Average Gross Receivables 1,232$ 843$ 2,075$
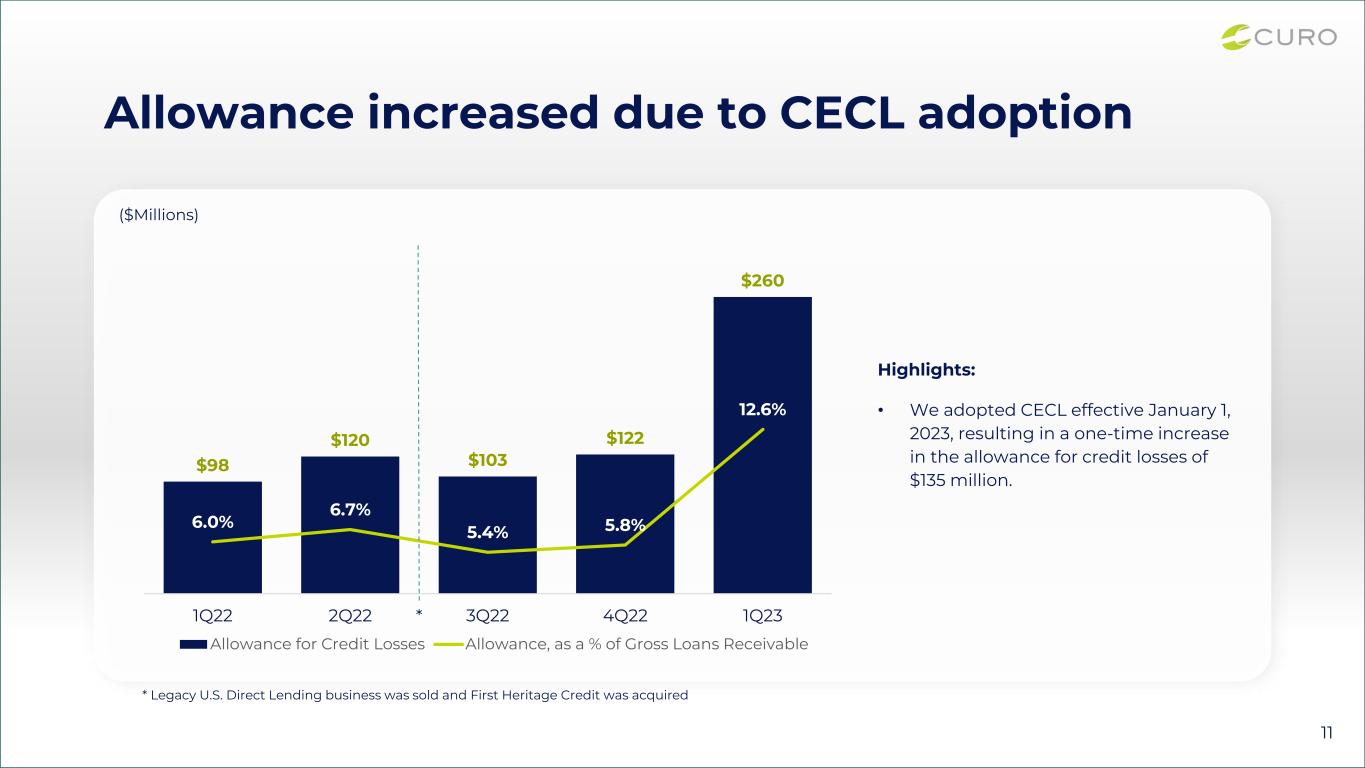

 
$98 $120 $103 $122 $260 6.0% 6.7% 5.4% 5.8% 12.6% 1Q22 2Q22 3Q22 4Q22 1Q23 Allowance for Credit Losses Allowance, as a % of Gross Loans Receivable Allowance increased due to CECL adoption ($Millions) Highlights: • We adopted CECL effective January 1, 2023, resulting in a one-time increase in the allowance for credit losses of $135 million. * * Legacy U.S. Direct Lending business was sold and First Heritage Credit was acquired 1 11
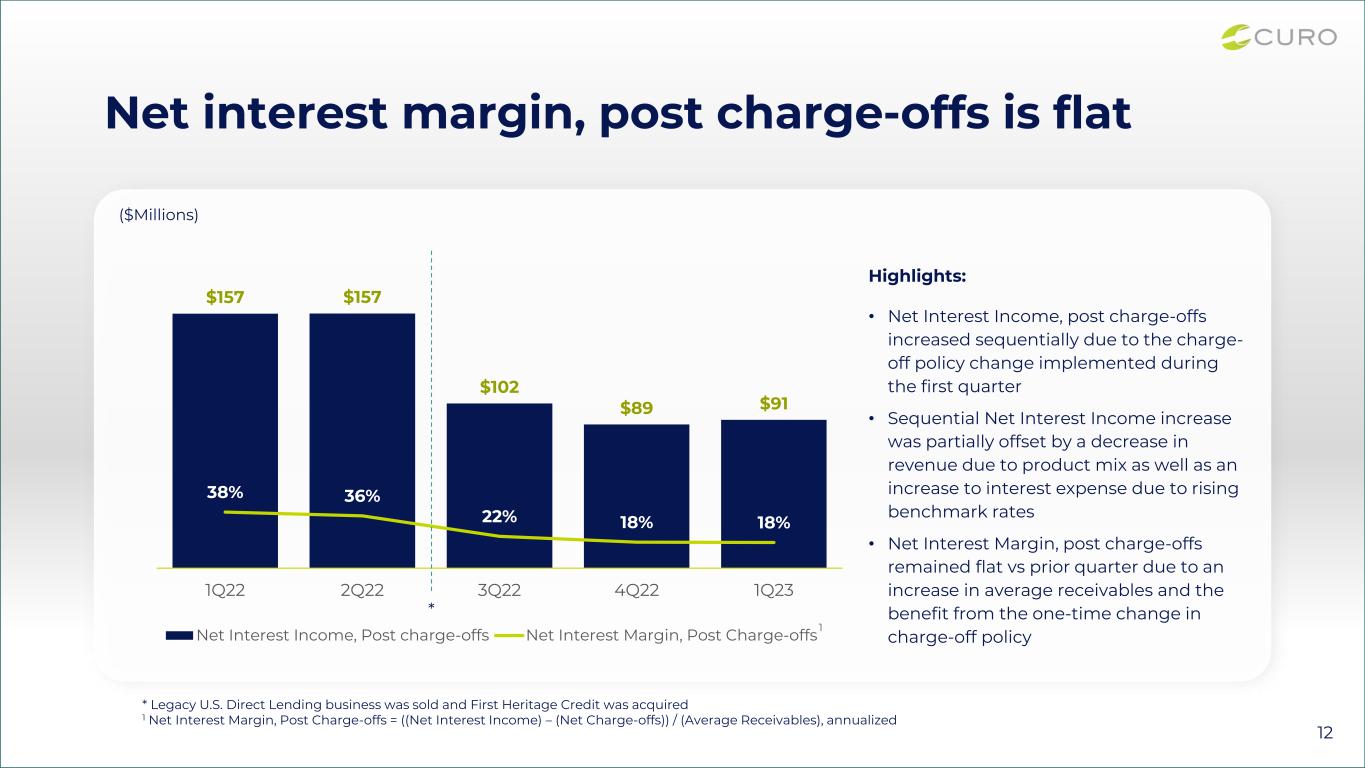

 
$157 $157 $102 $89 $91 38% 36% 22% 18% 18% 1Q22 2Q22 3Q22 4Q22 1Q23 Net Interest Income, Post charge-offs Net Interest Margin, Post Charge-offs Net interest margin, post charge-offs is flat ($Millions) Highlights: • Net Interest Income, post charge-offs increased sequentially due to the charge- off policy change implemented during the first quarter • Sequential Net Interest Income increase was partially offset by a decrease in revenue due to product mix as well as an increase to interest expense due to rising benchmark rates • Net Interest Margin, post charge-offs remained flat vs prior quarter due to an increase in average receivables and the benefit from the one-time change in charge-off policy * * Legacy U.S. Direct Lending business was sold and First Heritage Credit was acquired 1 Net Interest Margin, Post Charge-offs = ((Net Interest Income) – (Net Charge-offs)) / (Average Receivables), annualized 1 12
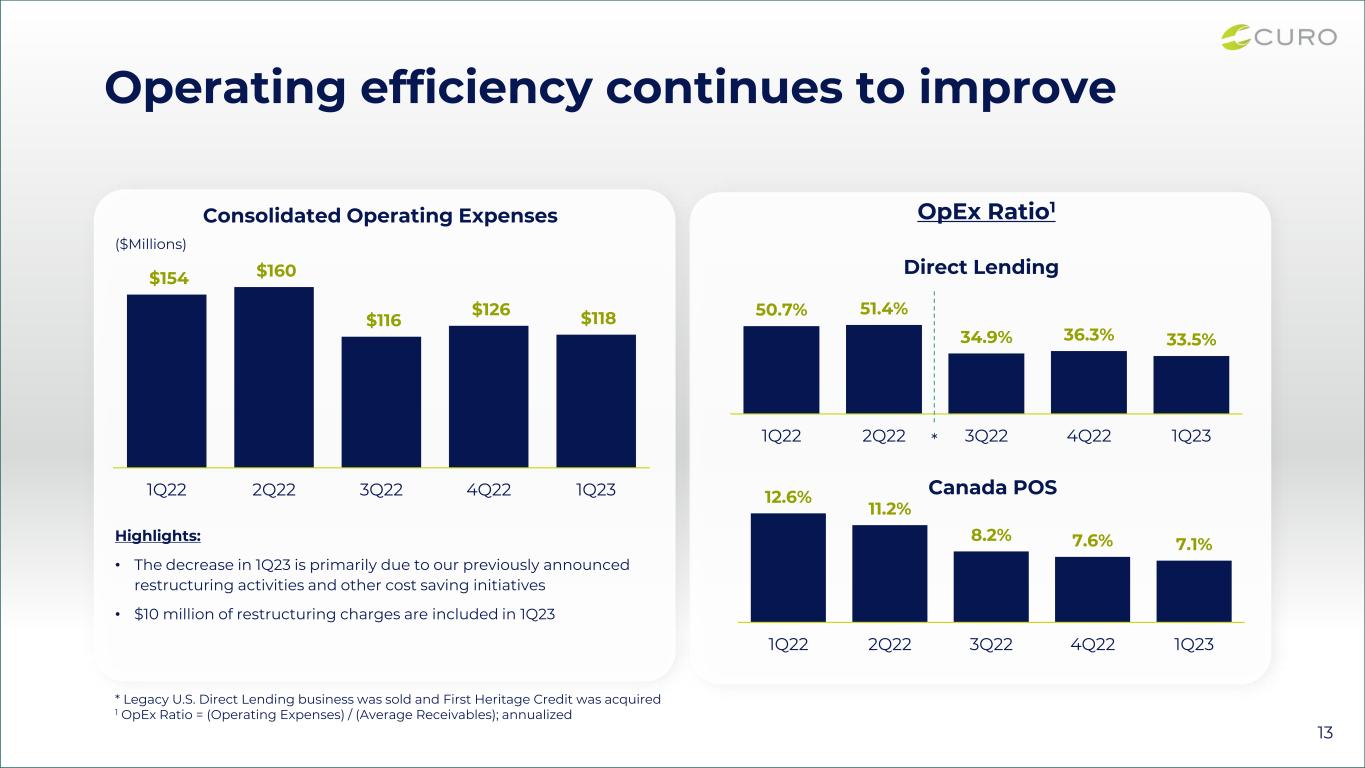

 
50.7% 51.4% 34.9% 36.3% 33.5% 1Q22 2Q22 3Q22 4Q22 1Q23 Direct Lending Operating efficiency continues to improve Highlights: • The decrease in 1Q23 is primarily due to our previously announced restructuring activities and other cost saving initiatives • $10 million of restructuring charges are included in 1Q23 * * Legacy U.S. Direct Lending business was sold and First Heritage Credit was acquired 1 OpEx Ratio = (Operating Expenses) / (Average Receivables); annualized OpEx Ratio1 12.6% 11.2% 8.2% 7.6% 7.1% 1Q22 2Q22 3Q22 4Q22 1Q23 Canada POS $154 $160 $116 $126 $118 1Q22 2Q22 3Q22 4Q22 1Q23 Consolidated Operating Expenses ($Millions) 13
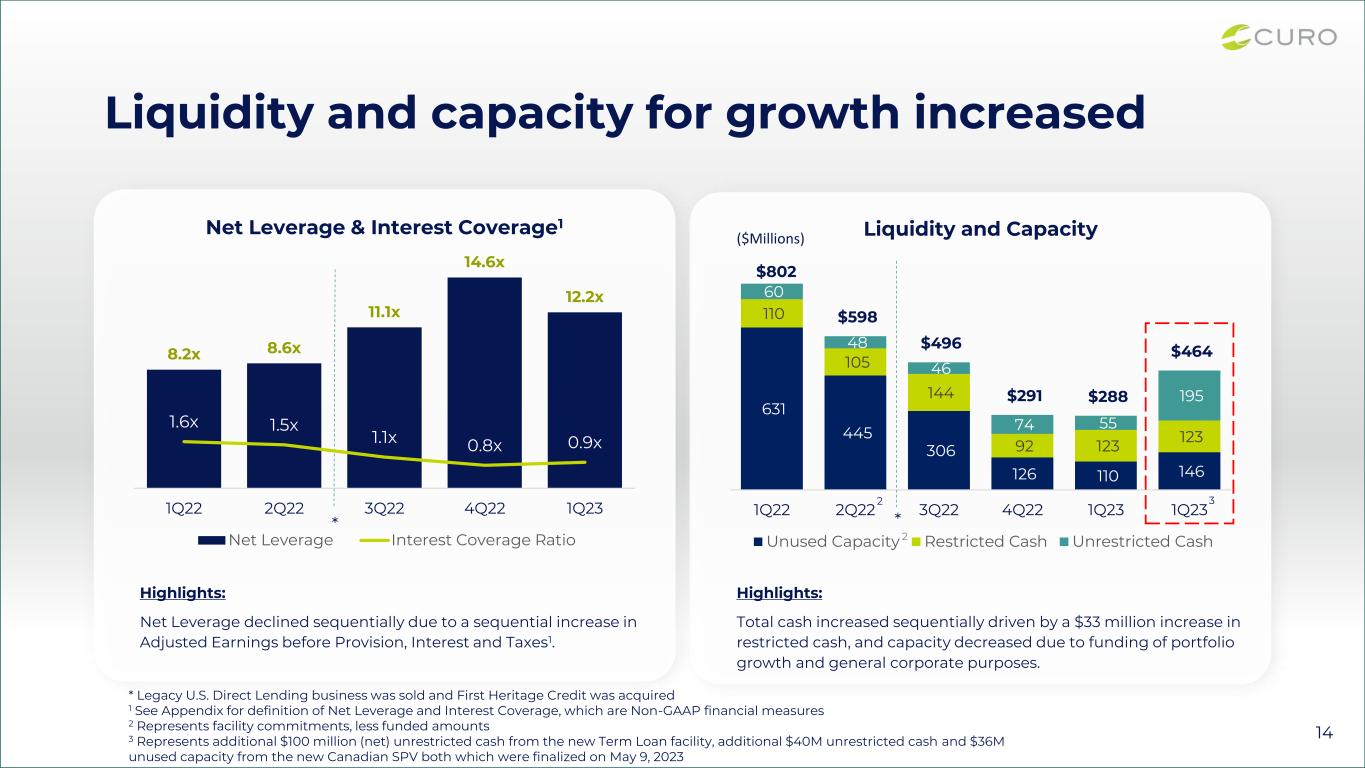

 
631 445 306 126 110 146 110 105 144 92 123 123 60 48 46 74 55 195 $802 $598 $496 $291 $288 $464 1Q22 2Q22 3Q22 4Q22 1Q23 1Q23 Liquidity and Capacity Unused Capacity Restricted Cash Unrestricted Cash Liquidity and capacity for growth increased * Legacy U.S. Direct Lending business was sold and First Heritage Credit was acquired 1 See Appendix for definition of Net Leverage and Interest Coverage, which are Non-GAAP financial measures 2 Represents facility commitments, less funded amounts 3 Represents additional $100 million (net) unrestricted cash from the new Term Loan facility, additional $40M unrestricted cash and $36M unused capacity from the new Canadian SPV both which were finalized on May 9, 2023 Highlights: Net Leverage declined sequentially due to a sequential increase in Adjusted Earnings before Provision, Interest and Taxes1. * * ($Millions) 2 Highlights: Total cash increased sequentially driven by a $33 million increase in restricted cash, and capacity decreased due to funding of portfolio growth and general corporate purposes. 2 8.2x 8.6x 11.1x 14.6x 12.2x 1.6x 1.5x 1.1x 0.8x 0.9x 1Q22 2Q22 3Q22 4Q22 1Q23 Net Leverage & Interest Coverage1 Net Leverage Interest Coverage Ratio 3 14
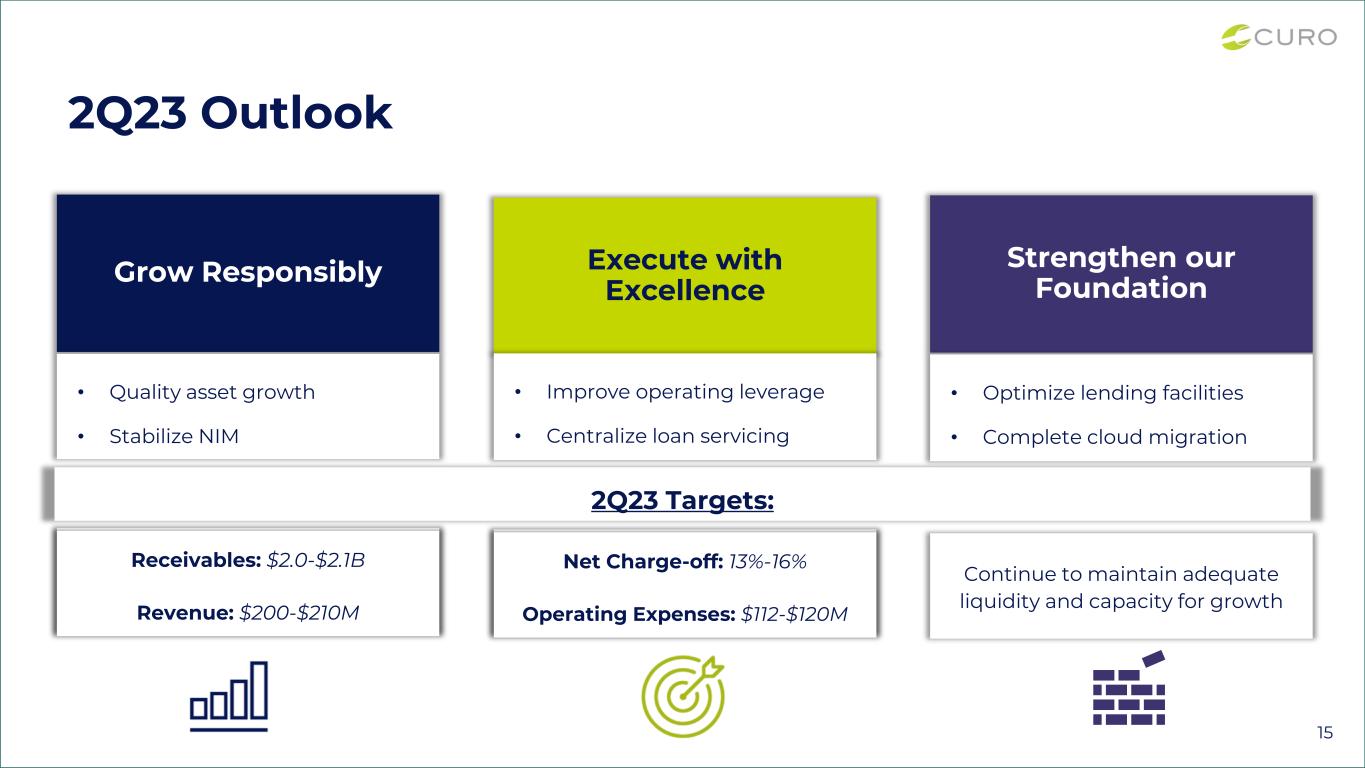

 
2Q23 Outlook Strengthen our Foundation • Optimize lending facilities • Complete cloud migration Com Execute with Excellence • Improve operating leverage • Centralize loan servicing Grow Responsibly • Quality asset growth • Stabilize NIM Receivables: $XX-$XX OpEx Ratio: $XX-$XX Continue to maintain adequate liquidity and capacity for growth 2Q23 Targets: Receivables: $2.0-$2.1B Revenue: $200-$210M Net Charge-off: 13%-16% Operating Expenses: $112-$120M 15
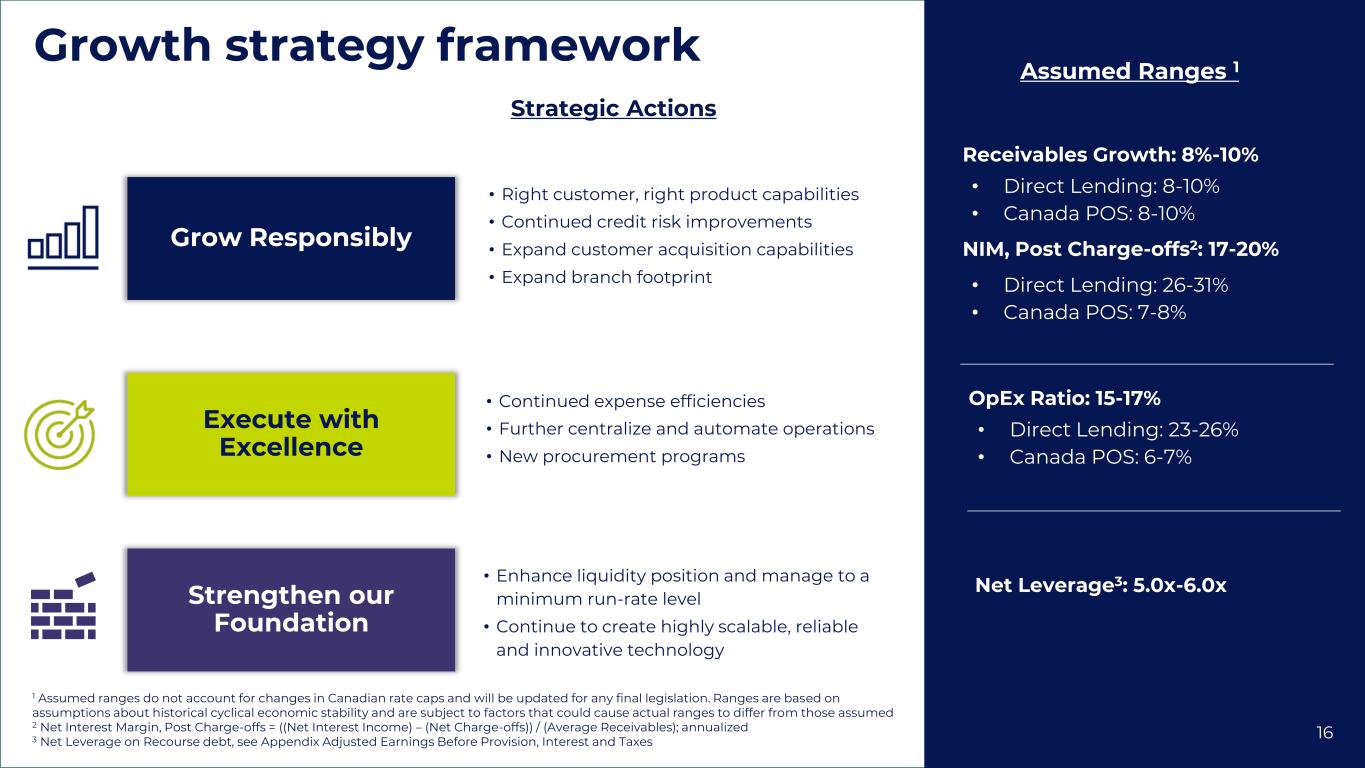

 
Growth strategy framework Strengthen our Foundation Execute with Excellence Grow Responsibly Receivables Growth: 8%-10% • Direct Lending: 8-10% • Canada POS: 8-10% NIM, Post Charge-offs2: 17-20% • Direct Lending: 26-31% • Canada POS: 7-8% 1 Assumed ranges do not account for changes in Canadian rate caps and will be updated for any final legislation. Ranges are based on assumptions about historical cyclical economic stability and are subject to factors that could cause actual ranges to differ from those assumed 2 Net Interest Margin, Post Charge-offs = ((Net Interest Income) – (Net Charge-offs)) / (Average Receivables); annualized 3 Net Leverage on Recourse debt, see Appendix Adjusted Earnings Before Provision, Interest and Taxes Assumed Ranges 1 Strategic Actions • Enhance liquidity position and manage to a minimum run-rate level • Continue to create highly scalable, reliable and innovative technology • Continued expense efficiencies • Further centralize and automate operations • New procurement programs • Right customer, right product capabilities • Continued credit risk improvements • Expand customer acquisition capabilities • Expand branch footprint OpEx Ratio: 15-17% • Direct Lending: 23-26% • Canada POS: 6-7% Net Leverage3: 5.0x-6.0x 1616


 
17 Appendix
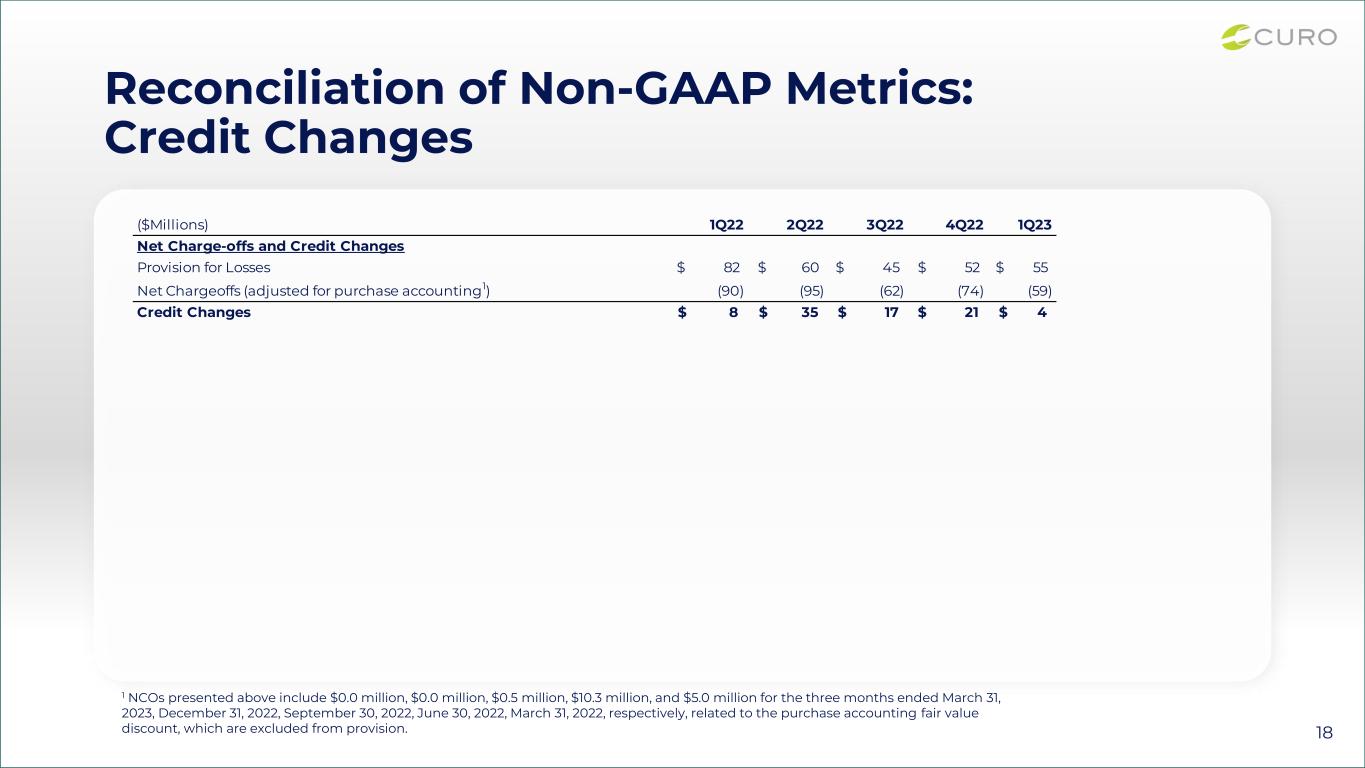

 
Reconciliation of Non-GAAP Metrics: Credit Changes 1 NCOs presented above include $0.0 million, $0.0 million, $0.5 million, $10.3 million, and $5.0 million for the three months ended March 31, 2023, December 31, 2022, September 30, 2022, June 30, 2022, March 31, 2022, respectively, related to the purchase accounting fair value discount, which are excluded from provision. ($Millions) 1Q22 2Q22 3Q22 4Q22 1Q23 Net Charge-offs and Credit Changes Provision for Losses 82$ 60$ 45$ 52$ 55$ Net Chargeoffs (adjusted for purchase accounting1) (90) (95) (62) (74) (59) Credit Changes 8$ 35$ 17$ 21$ 4$ 18
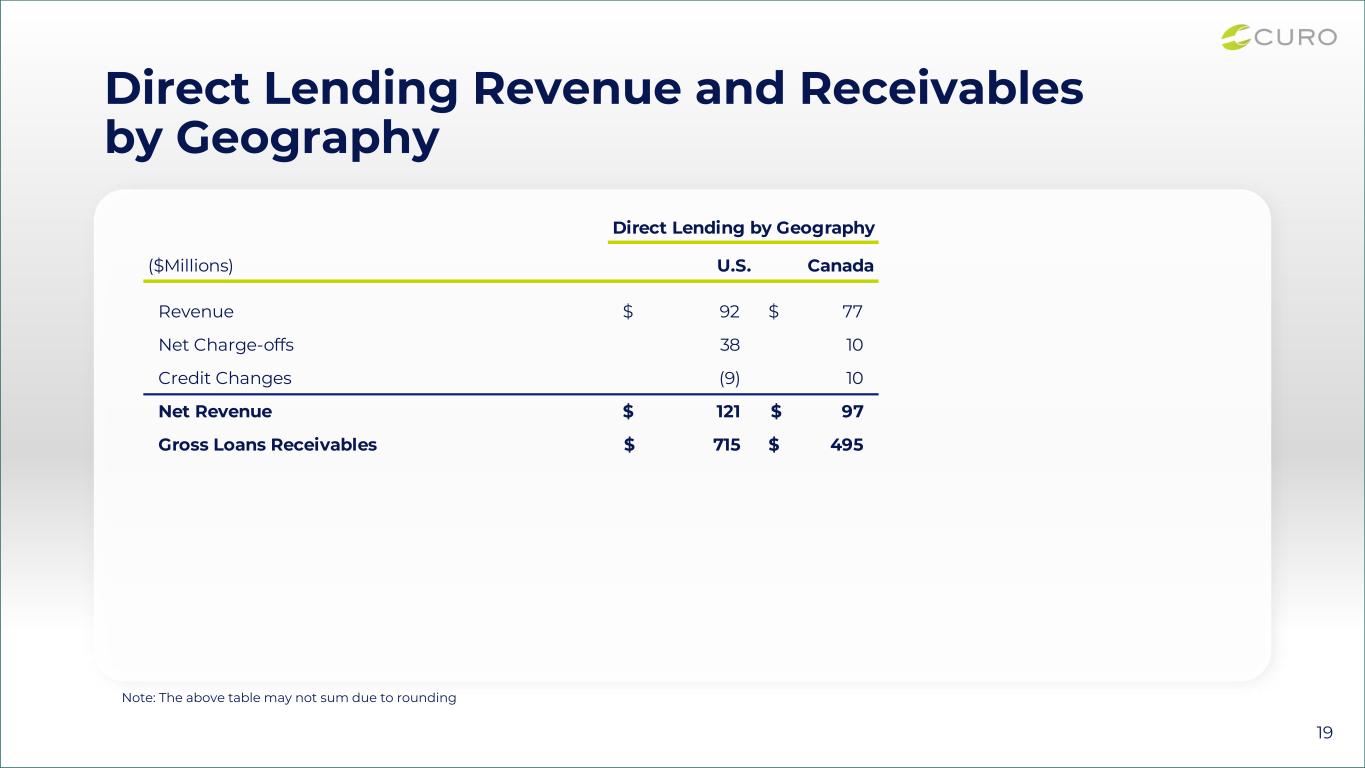

 
Direct Lending Revenue and Receivables by Geography Note: The above table may not sum due to rounding Direct Lending by Geography ($Millions) U.S. Canada Revenue $ 92 $ 77 Net Charge-offs 38 10 Credit Changes (9) 10 Net Revenue $ 121 $ 97 Gross Loans Receivables $ 715 $ 495 19
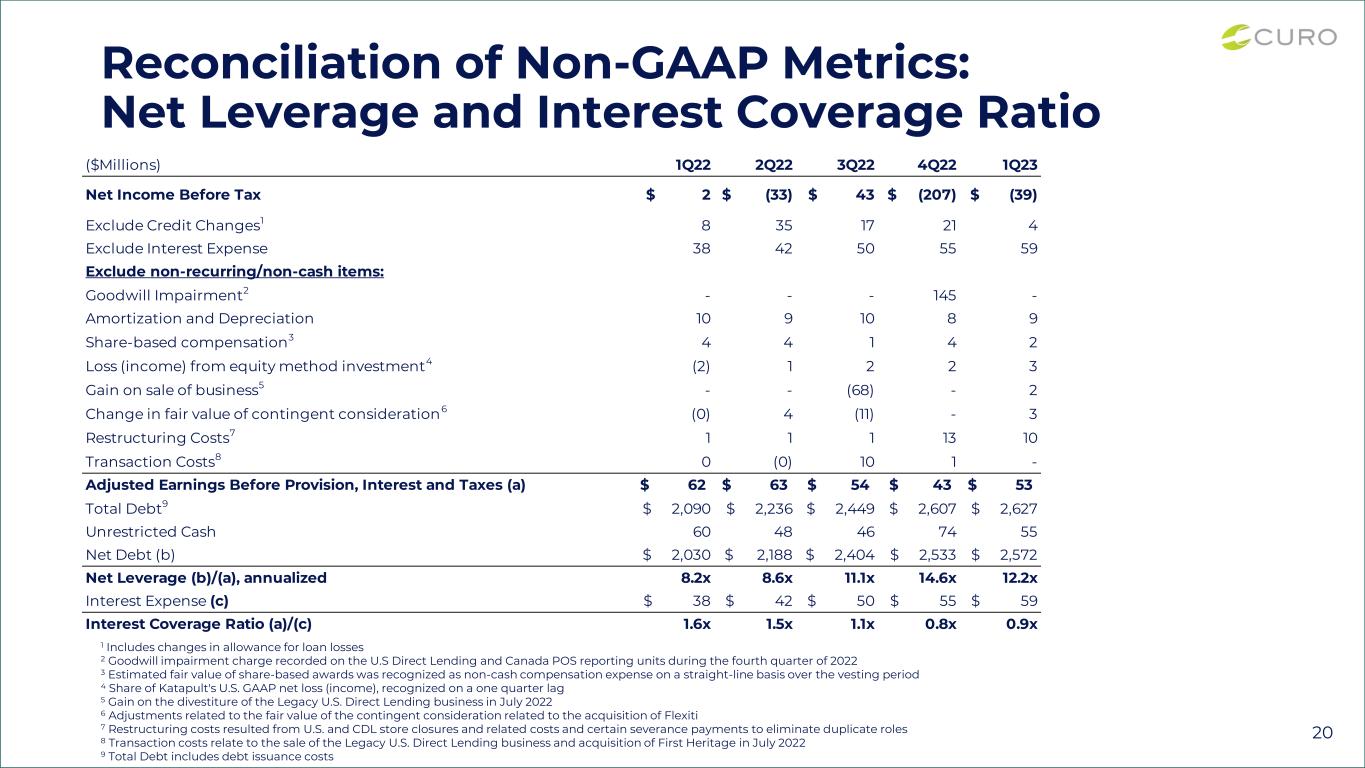

 
Reconciliation of Non-GAAP Metrics: Net Leverage and Interest Coverage Ratio 1 Includes changes in allowance for loan losses 2 Goodwill impairment charge recorded on the U.S Direct Lending and Canada POS reporting units during the fourth quarter of 2022 3 Estimated fair value of share-based awards was recognized as non-cash compensation expense on a straight-line basis over the vesting period 4 Share of Katapult's U.S. GAAP net loss (income), recognized on a one quarter lag 5 Gain on the divestiture of the Legacy U.S. Direct Lending business in July 2022 6 Adjustments related to the fair value of the contingent consideration related to the acquisition of Flexiti 7 Restructuring costs resulted from U.S. and CDL store closures and related costs and certain severance payments to eliminate duplicate roles 8 Transaction costs relate to the sale of the Legacy U.S. Direct Lending business and acquisition of First Heritage in July 2022 9 Total Debt includes debt issuance costs ($Millions) 1Q22 2Q22 3Q22 4Q22 1Q23 Net Income Before Tax $ 2 $ (33) $ 43 $ (207) $ (39) Exclude Credit Changes1 8 35 17 21 4 Exclude Interest Expense 38 42 50 55 59 Exclude non-recurring/non-cash items: Goodwill Impairment2 - - - 145 - Amortization and Depreciation 10 9 10 8 9 Share-based compensation3 4 4 1 4 2 Loss (income) from equity method investment4 (2) 1 2 2 3 Gain on sale of business5 - - (68) - 2 Change in fair value of contingent consideration6 (0) 4 (11) - 3 Restructuring Costs7 1 1 1 13 10 Transaction Costs8 0 (0) 10 1 - Adjusted Earnings Before Provision, Interest and Taxes (a) 62$ 63$ 54$ 43$ 53$ Total Debt9 $ 2,090 $ 2,236 $ 2,449 $ 2,607 $ 2,627 Unrestricted Cash 60 48 46 74 55 Net Debt (b) $ 2,030 $ 2,188 $ 2,404 $ 2,533 $ 2,572 Net Leverage (b)/(a), annualized 8.2x 8.6x 11.1x 14.6x 12.2x Interest Expense (c) $ 38 $ 42 $ 50 $ 55 $ 59 Interest Coverage Ratio (a)/(c) 1.6x 1.5x 1.1x 0.8x 0.9x 20
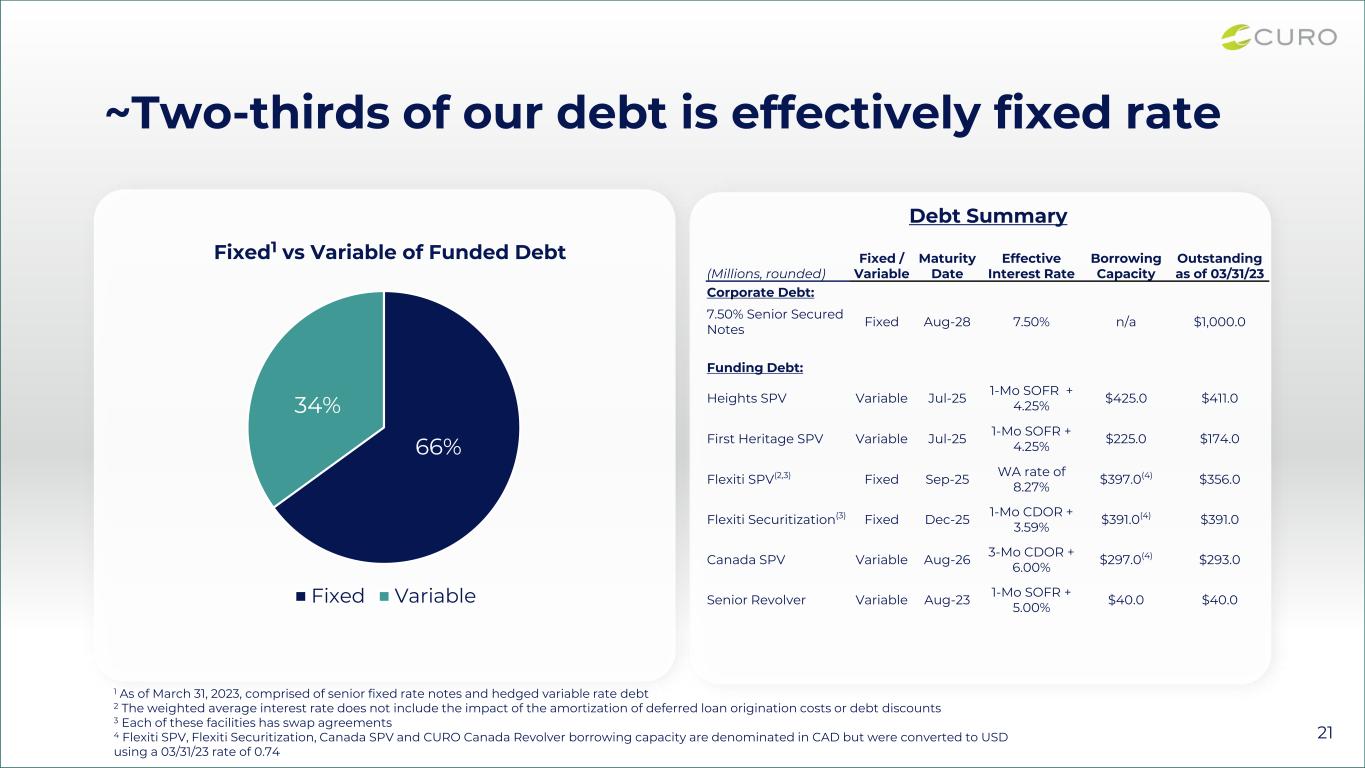

 
21 ~Two-thirds of our debt is effectively fixed rate 66% 34% Fixed1 vs Variable of Funded Debt Fixed Variable (Millions, rounded) Fixed / Variable Maturity Date Effective Interest Rate Borrowing Capacity Outstanding as of 03/31/23 Corporate Debt: 7.50% Senior Secured Notes Fixed Aug-28 7.50% n/a $1,000.0 Funding Debt: Heights SPV Variable Jul-25 1-Mo SOFR + 4.25% $425.0 $411.0 First Heritage SPV Variable Jul-25 1-Mo SOFR + 4.25% $225.0 $174.0 Flexiti SPV(2,3) Fixed Sep-25 WA rate of 8.27% $397.0(4) $356.0 Flexiti Securitization(3) Fixed Dec-25 1-Mo CDOR + 3.59% $391.0(4) $391.0 Canada SPV Variable Aug-26 3-Mo CDOR + 6.00% $297.0(4) $293.0 Senior Revolver Variable Aug-23 1-Mo SOFR + 5.00% $40.0 $40.0 1 As of March 31, 2023, comprised of senior fixed rate notes and hedged variable rate debt 2 The weighted average interest rate does not include the impact of the amortization of deferred loan origination costs or debt discounts 3 Each of these facilities has swap agreements 4 Flexiti SPV, Flexiti Securitization, Canada SPV and CURO Canada Revolver borrowing capacity are denominated in CAD but were converted to USD using a 03/31/23 rate of 0.74 Debt Summary