CURO Group Holdings Corp. Announces
First Quarter 2021 Financial Results
Doubled quarterly dividend
Authorized $50 million share repurchase program
Added Philip Gitler as Executive Vice President and Chief Strategy Officer
Wichita, Kansas--May 3, 2021-CURO Group Holdings Corp. (NYSE: CURO) (“CURO” or the “Company”), a tech-enabled, multi-channel and multi-product consumer finance company serving a wide range of non-prime and prime consumers in the U.S. and Canada and a market leader in the industry based on revenue, today announced financial results for its first quarter ended March 31, 2021.
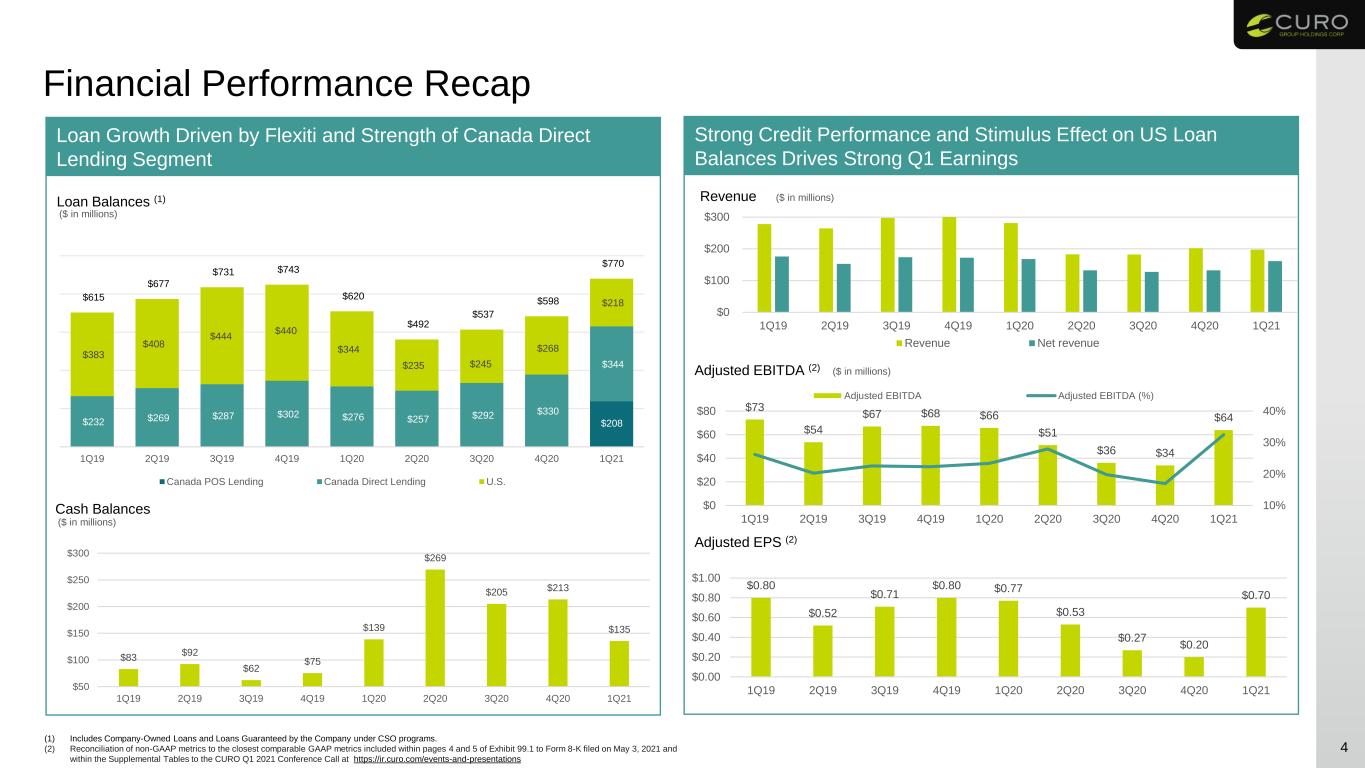
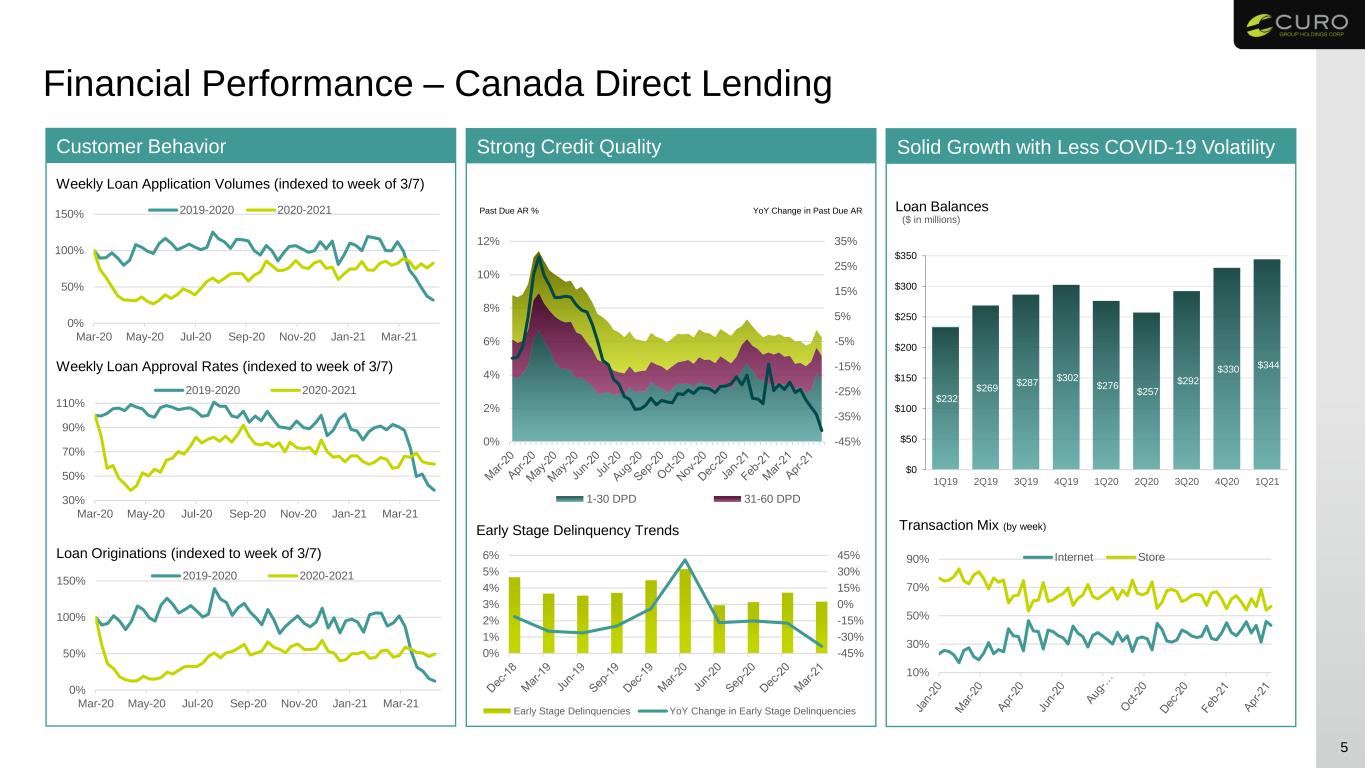
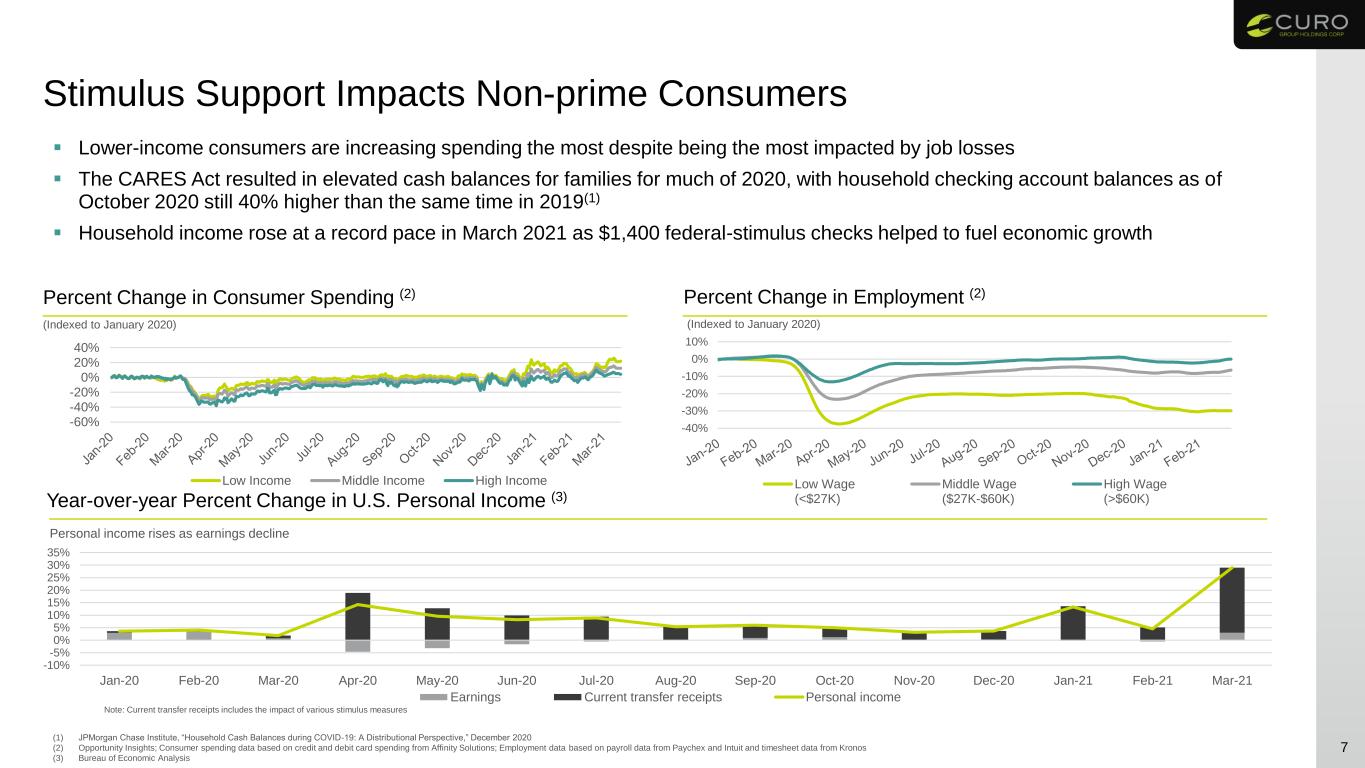
“We are pleased to report very strong earnings as the credit quality of our loan portfolio continued to remain at historically strong levels in the first quarter of 2021,” said Don Gayhardt, CURO's Chief Executive Officer. “While we typically experience normal seasonal loan balance declines across all products in the first quarter, our Canada Direct Lending segment delivered sequential loan growth of $13.4 million, or 4.1%, and year-over-year loan growth of 24.4%. U.S. results continue to be affected by COVID-19, mainly the third government stimulus payments in March 2021. While stimulus and U.S. federal income tax refunds reduce loan demand, they also drive exceptional credit performance and payment rates.”
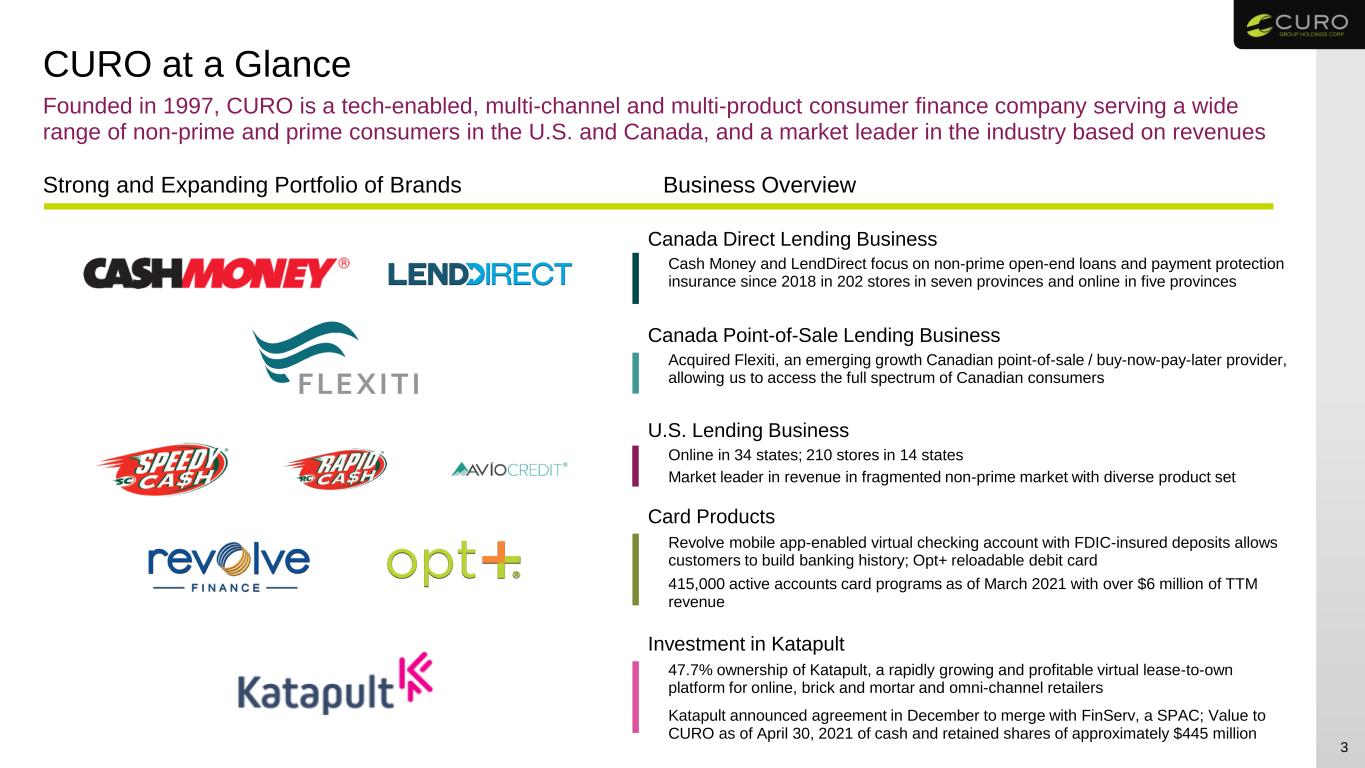
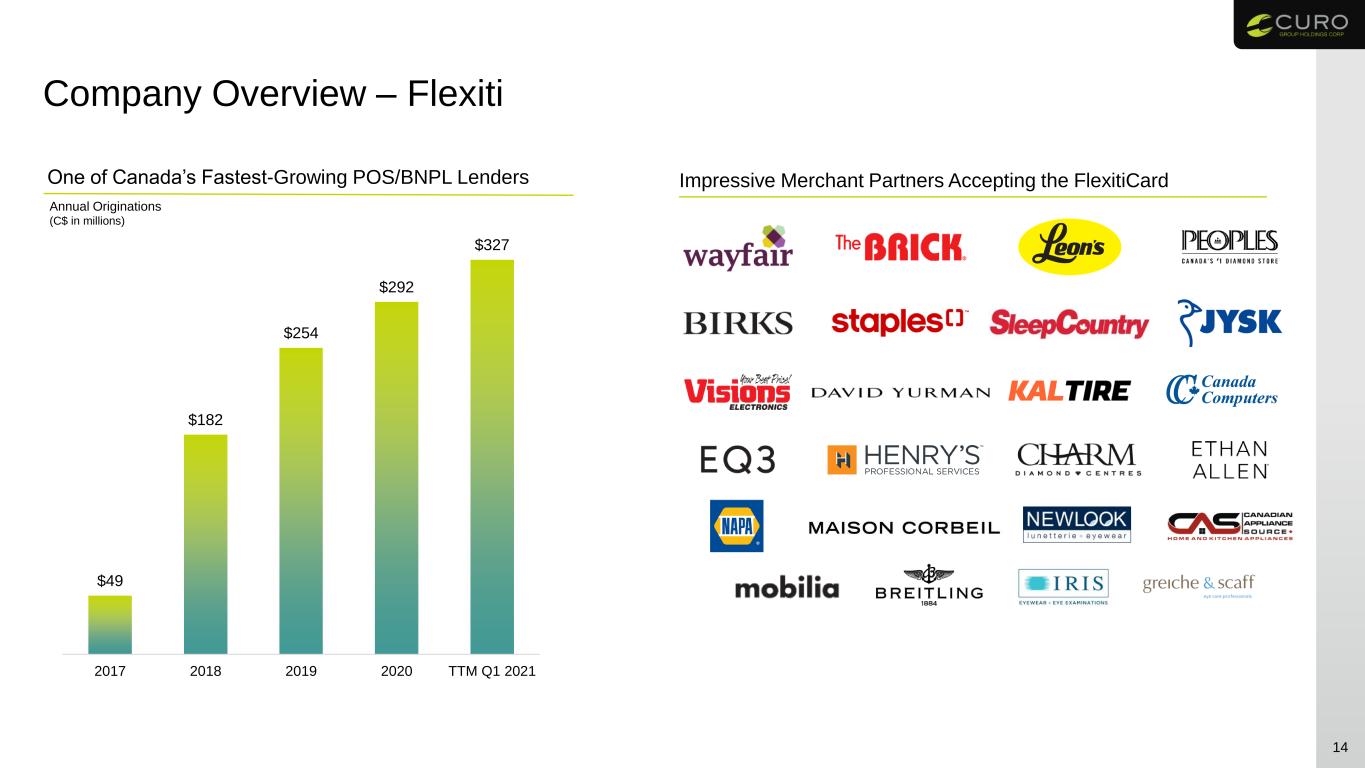
“Also, we closed our acquisition of Flexiti on March 10, 2021. Flexiti grew originations 69.0% year-over-year in the first quarter and added several new merchant partnerships. The combination of CURO’s and Flexiti’s complementary, market-leading businesses in Canada position us well to drive revenue growth and create long-term shareholder value.”
“We expect to see the Katapult and FinServ merger close by the end of the second quarter and we continue to be excited about the benefits of this merger, which will increase our balance sheet flexibility while maintaining a meaningful representation on Katapult’s board. The total value of our stake, before taxes and based on FinServ’s stock price as of April 30, 2021, is approximately $445 million, including earn-out shares.”
“Finally, we are very pleased to announce that Philip Gitler has joined us as EVP and Chief Strategy Officer. Phil has a long career in corporate and asset-backed finance and he has deep familiarity with our company and our industry. We think that he is very well-suited to help us execute on our strategic priorities, particularly as it relates to M&A, strategic investments and organic growth opportunities.“
Consolidated Summary Results - Unaudited
| | | | | | | | | | | | | | | | | | |
| | Three Months Ended March 31, | | |
| (in millions, except per share data) | | 2021 | 2020 | Variance | | | | |
| Revenue | | $ 196.6 | | $ 280.8 | | (30.0) | % | | | | |
| Net Revenue | | 160.4 | | 167.3 | | (4.1) | % | | | | |
| | | | | | | | |
| Company Owned gross loans receivable | | 731.0 | | 564.4 | | 29.5 | % | | | | |
| Unrestricted Cash | | 135.4 | | 138.7 | | (2.4) | % | | | | |
| Net income | | 25.7 | | 36.3 | | (29.2) | % | | | | |
Adjusted Net Income (1) | | 30.1 | | 32.3 | | (6.8) | % | | | | |
| Diluted Earnings per Share from continuing operations | | $ 0.59 | | $ 0.86 | | (31.4) | % | | | | |
Adjusted Diluted Earnings per Share from continuing operations (1) | | $ 0.69 | | $ 0.77 | | (10.4) | % | | | | |
EBITDA (1) | | 58.7 | | 59.8 | | (1.8) | % | | | | |
Adjusted EBITDA (1) | | 63.8 | | 65.8 | | (3.0) | % | | | | |
| Weighted Average Shares — diluted | | 43.6 | | 41.9 | | | | | | |
| (1) These are non-GAAP metrics. For a reconciliation of each non-GAAP metric to the nearest GAAP metric, see the applicable reconciliations contained under "Results of Operations." For a description of each non-GAAP metric, see "Non-GAAP Financial Measures." |
|
|
First quarter 2021 and recent developments include:
•Net Revenue decrease of $6.9 million, or 4.1%, year over year, as the impact of lower net charge-off ("NCO") rates partially mitigated the negative effect of lower loan balances.
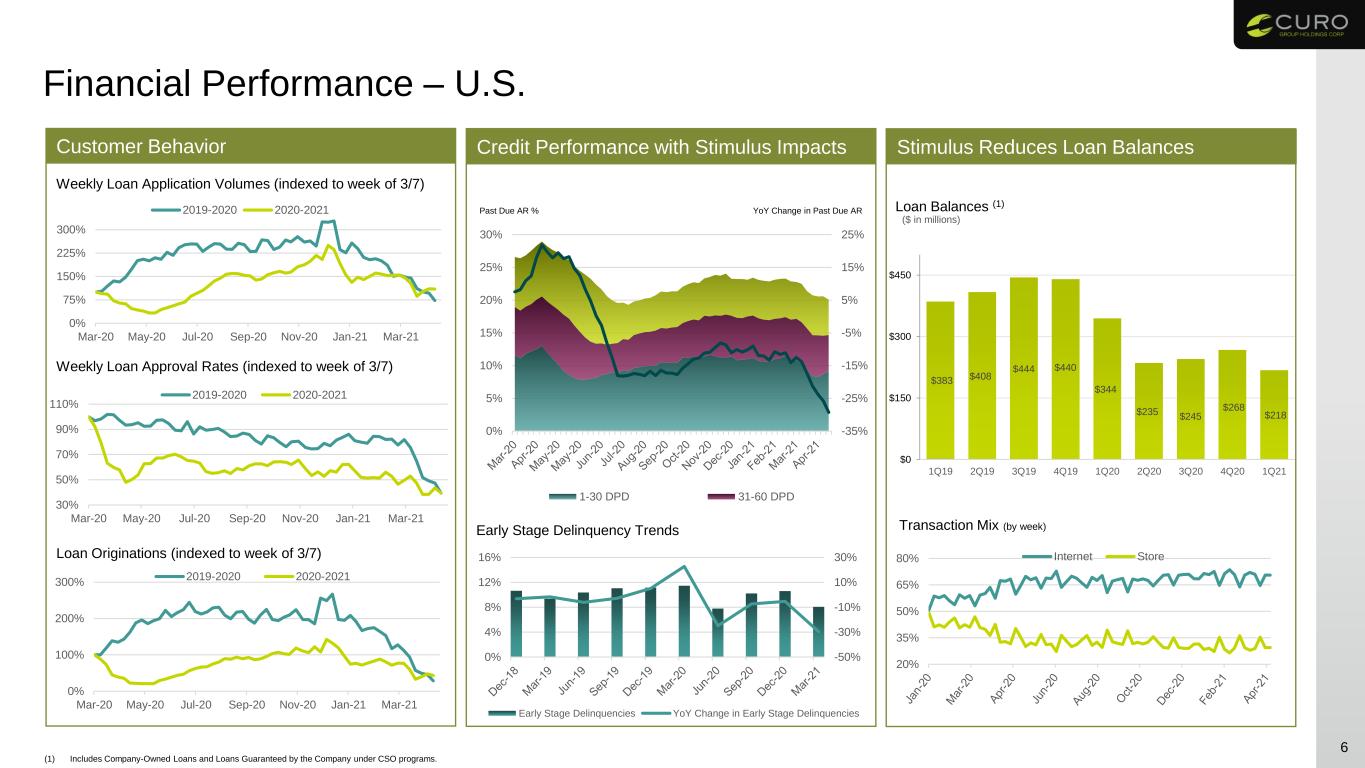
•U.S. Company Owned gross loans receivable declined $102.3 million, or 35.5%, compared to the prior-year period, resulting from the impact of COVID-19 on customer demand and higher payment rates.
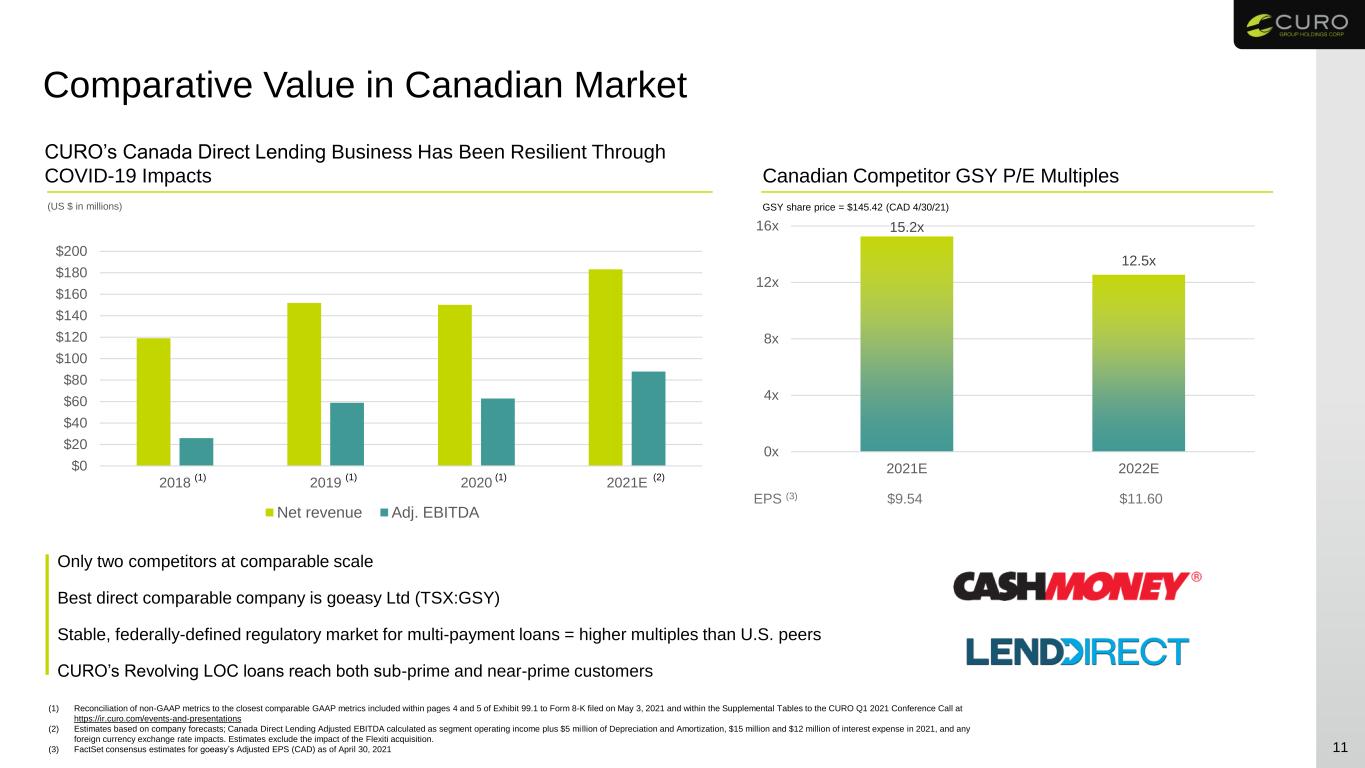
•Canada Direct Lending gross loans receivable were $343.7 million as of March 31, 2021, an increase of $67.4 million, or 24.4%, versus the prior-year period, primarily due to growth of Revolving Line-of-Credit ("LOC") loans.
•U.S. NCO rate, including loans Guaranteed by the Company, of 16.2% improved 34.3%, or 850 basis points ("bps"), compared to the prior-year period. Sequentially (defined within this release as the change from the fourth quarter of 2020 to the first quarter of 2021) the NCO rate improved 22.7%, or 475 bps.
•Canada Direct Lending NCO rate of 3.8% improved 49.4%, or 370 bps year over year and remained stable sequentially.
•New government stimulus programs in the U.S. late in the quarter led to lower past-due gross loans receivable as a percentage of total gross loans receivable ("past-due rate") compared to historical trends. U.S. Company Owned past-due rate decreased year over year from 26.2% to 19.9% and sequentially from 21.9% to 19.9%.
•Canada Direct Lending past-due rates improved year over year from 9.0% to 6.1% and improved sequentially from 6.4% to 6.1%.
•Diluted Earnings per Share from continuing operations of $0.59 compared to $0.86 in the prior-year quarter. Adjusted Diluted Earnings per Share of $0.69 compared to $0.77 for the first quarter of 2020.
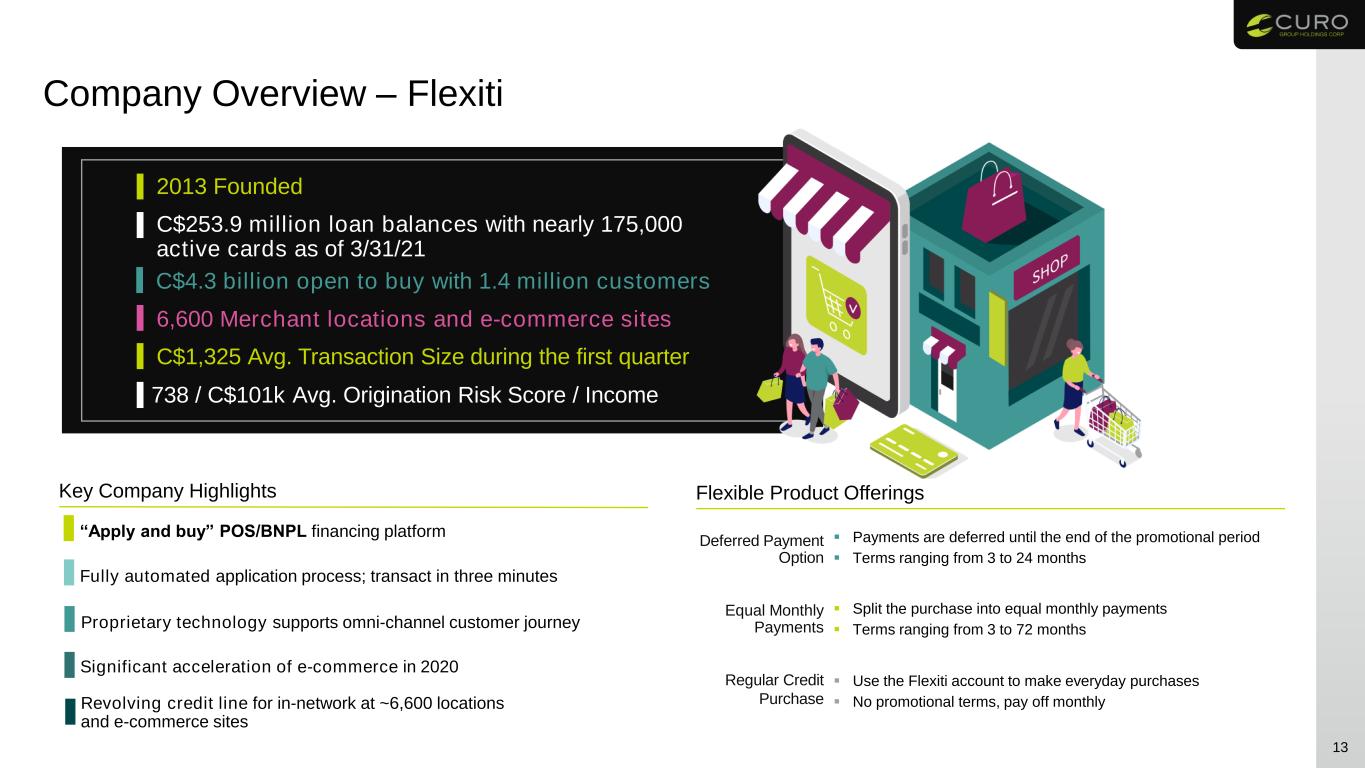
•The completion of our acquisition of Flexiti Financial Inc. ("Flexiti"), an emerging growth Canadian point-of-sale ("POS") / buy-now-pay-later ("BNPL") provider, on March 10, 2021. Flexiti gross loans receivable and related revenue are referred to as "Canada POS Lending" throughout this release. As of March 31, 2021, Canada POS Lending gross loans receivable were $201.5 million.
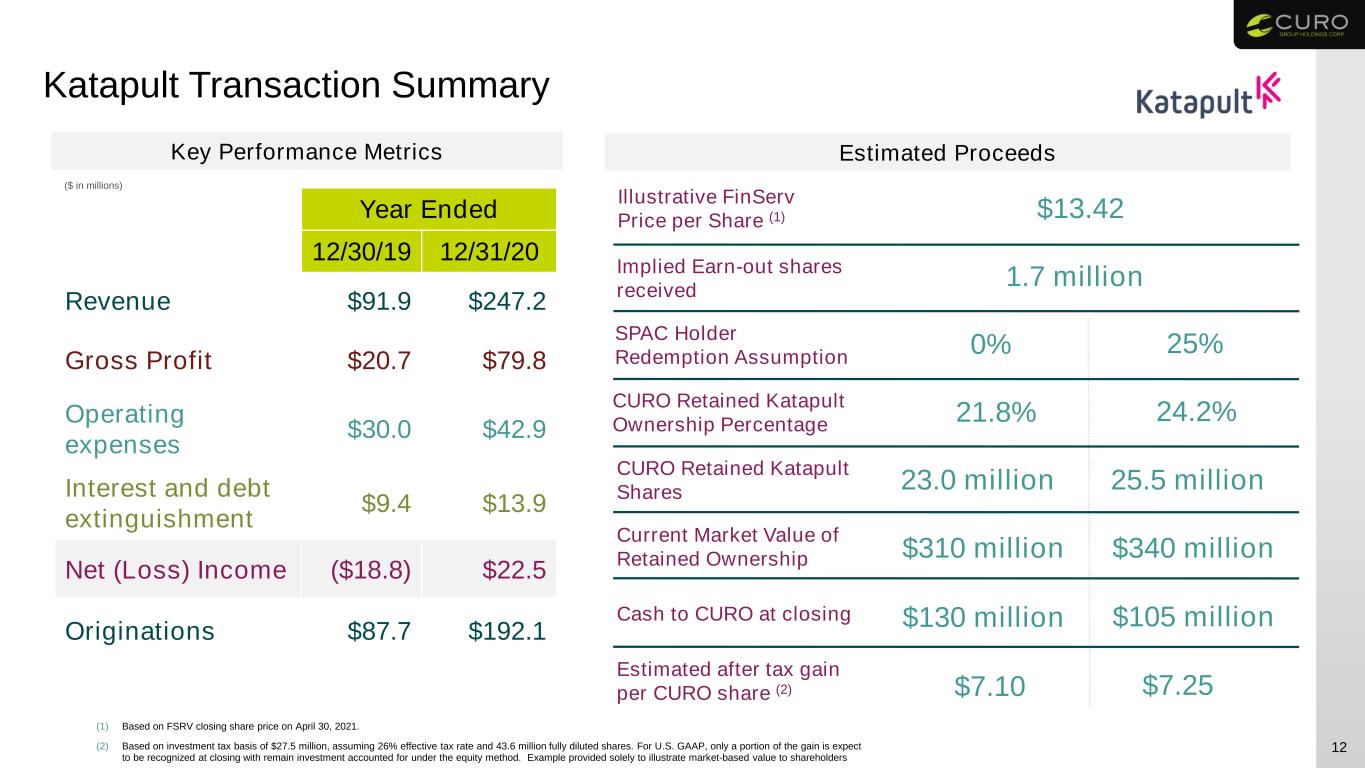
•Katapult Holdings Inc. ("Katapult"), originations increased 119.0%, or $104.4 million, to $192.1 million as of December 31, 2020, compared to $87.7 million as of December 31, 2019, as disclosed in FinServ Acquisition Corp.'s ("FinServ") Form S-4 filed with the Securities and Exchange Commission (the "SEC") on April 2, 2021. The merger between Katapult and FinServ is expected to close by the end of the second quarter, subject to approval by FinServ's stockholders and other customary closing conditions.
•Authorization by our Board of Directors of a share repurchase program for the repurchase of up to $50.0 million of CURO common stock. The repurchase will continue until completed or terminated. We expect the purchases to be made from time-to-time in the open market and/or in privately-negotiated transactions at our discretion, subject to market conditions and other factors. Any repurchased shares will be available for use in connection with equity plans and for other corporate purposes.
•Increase in the quarterly dividend to $0.11 per share, an increase of 100%, and declaration of the next quarterly dividend, payable on May 27, 2021, to stockholders of record as of May 14, 2021.
Tables throughout this release may not foot or cross-foot due to rounding.
Consolidated Revenue by Product and Segment
The following table summarizes revenue by product, including credit services organization ("CSO") fees, for the period indicated:
| | | | | | | | | | | | | | | | | | | | | | | | | | | | | | | | | | | | | | |
| | Three Months Ended |
| | March 31, 2021 | | March 31, 2020 |
| (in millions, unaudited) | | U.S. | Canada Direct Lending | Canada POS Lending | Total | % of Total | | U.S. | Canada Direct Lending | Canada POS Lending | Total | % of Total |
| Revolving LOC | | $ 26.9 | | $ 34.4 | | $ 1.4 | | $ 62.7 | | 31.9 | % | | $ 42.0 | | $ 29.0 | | $ — | | $ 71.0 | | 25.3 | % |
| Installment | | 105.9 | | 10.4 | | — | | 116.4 | | 59.2 | % | | 175.3 | | 18.6 | | — | | 193.9 | | 69.0 | % |
| Ancillary | | 3.6 | | 13.6 | | 0.2 | | 17.5 | | 8.9 | % | | 4.5 | | 11.5 | | — | | 16.0 | | 5.7 | % |
| Total revenue | | $ 136.5 | | $ 58.4 | | $ 1.6 | | $ 196.6 | | 100.0 | % | | $ 221.8 | | $ 59.0 | | $ — | | $ 280.8 | | 100.0 | % |
During the three months ended March 31, 2021, total revenues declined $84.3 million, or 30.0%, to $196.6 million, compared to the prior-year period. U.S. and Canada Direct Lending revenues declined 38.5% and 1.0%, respectively. Since the onset of COVID-19, we have experienced lower customer demand and favorable credit performance, including increased or accelerated repayments and favorable payment trends as customers benefited from government stimulus programs (collectively "COVID-19 Impacts"). COVID-19 Impacts on U.S. results for the current quarter were more pronounced due to additional government stimulus programs in late March 2021 and slower reopening of major markets during 2020. In Canada, effects of the pandemic and related government responses were mitigated by the growth and maturation of Revolving LOC products and more focused and limited stimulus. Canada Direct Lending Revolving LOC gross loans receivable grew $79.0 million, or 32.9%, year over year, contributing to related revenue growth of $5.4 million, or 18.5% for the three months ended March 31, 2021 compared to the three months ended March 31, 2020. We recognized $1.6 million of Canada POS Lending revenue for the Flexiti post-acquisition period of March 10, 2021 to March 31, 2021. Canada POS Lending revenue includes merchant discount revenue, which is unearned when received and recognized over the life of the credit card loan term. Unearned revenue is not recognized in purchase accounting and, therefore, merchant discount revenue recognized as of March 31, 2021 relates to merchant fees received after the acquisition of Flexiti.
From a product perspective, Revolving LOC revenue for the three months ended March 31, 2021 decreased $8.3 million, or 11.7%, year over year, primarily driven by a decline in U.S. revenue, partially offset by growth in Canada Direct Lending revenue of $5.4 million, or 18.5%, and Canada POS lending of $1.4 million. For the three months ended March 31, 2021, Installment revenue decreased $77.5 million, or 40.0%, compared to the prior-year period, as a result of COVID-19 impacts and normal seasonality.
Ancillary revenue increased $1.5 million, or 9.5% versus the prior-year period, primarily due to the sale of insurance products to Revolving LOC and Installment loan customers in Canada.
The following table presents online revenue and online transaction compositions, including CSO fees, of the products and services that we currently offer within the U.S. and Canada Direct Lending segments:
| | | | | | | | | | | | | | | | | | |
| | Three Months Ended March 31, | | |
| | 2021 | | 2020 | | | | |
| Online revenues as a percentage of consolidated revenue | | 50.9 | % | | 47.5 | % | | | | |
| Online transactions as a percentage of consolidated transactions | | 60.2 | % | | 48.2 | % | | | | |
Online revenue as a percentage of consolidated revenue increased during the three months ended March 31, 2021 due to COVID-19 Impacts and the resulting transition of customers using our online channel which allows for a safe and contactless option.
Consolidated Loans Receivable
The following table reconciles Company Owned gross loans receivable, a GAAP-basis balance sheet measure, to Gross combined loans receivable, a non-GAAP measure(1). Gross combined loans receivable includes loans originated by third-party lenders through CSO programs, which are not included in the Condensed Consolidated Financial Statements but from which we earn revenue by providing a guarantee to the unaffiliated lender.
| | | | | | | | | | | | | | | | | | | | | | | | | | | | | | | | | | | | | | | | | | | | | | | | | | | | |
| | As of | | | | | | | | | |
| (in millions, unaudited) | | | March 31,
2021 | | December 31,
2020 | | September 30,
2020 | | June 30,
2020 | | March 31,
2020 | | | | | | | | | | | | | | | |
| U.S. | | | | | | | | | | | | | | | | | | | | | | | | | | | | | | |
| Revolving LOC | | | $ 43.4 | | | $ 55.6 | | | $ 56.7 | | | $ 52.2 | | | $ 73.7 | | | | | | | | | | | | | | | | | | | | |
| Installment - Company Owned | | | 142.4 | | | 167.9 | | 148.6 | | 146.5 | | | 214.4 | | | | | | | | | | | | | | | | | | | | |
| Canada Direct Lending | | | | | | | | | | | | | | | | | | | | | | | | | | | | | | |
| Revolving LOC | | | 319.3 | | | 303.3 | | | 265.5 | | | 231.9 | | | 240.3 | | | | | | | | | | | | | | | | | | | | |
| Installment | | | 24.4 | | | 26.9 | | | 26.6 | | | 24.9 | | | 36.0 | | | | | | | | | | | | | | | | | | | | |
| Canada POS Lending | | | | | | | | | | | | | | | | | | | | | | | | | | | | | | |
| Revolving LOC | | | 201.5 | | | — | | | — | | | — | | | — | | | | | | | | | | | | | | | | | | | | |
| Company Owned gross loans receivable | | | $ 731.0 | | | $ 553.7 | | | $ 497.4 | | | $ 455.5 | | | $ 564.4 | | | | | | | | | | | | | | | | | | | | |
| Gross loans receivable Guaranteed by the Company | | | 32.4 | | | 44.1 | | 39.8 | | 34.1 | | | 55.9 | | | | | | | | | | | | | | | | | | | | |
Gross combined loans receivable (1) | | | $ 763.5 | | | $ 597.8 | | | $ 537.2 | | | $ 489.6 | | | $ 620.4 | | | | | | | | | | | | | | | | | | | | |
(1) See "Non-GAAP Financial Measures" at the end of this release for definition and more information. | | | | | | | | | | | | | | | | | |
Gross combined loans receivable increased $143.1 million, or 23.1%, to $763.5 million as of March 31, 2021, from $620.4 million as of March 31, 2020. The increase was driven by Canada Direct Lending growth of $67.4 million, or 24.4%, and Canada POS Lending gross loans receivables of $201.5 million related to the acquisition of Flexiti. Excluding Flexiti loan balances, gross combined loans receivable were down 9.4% year over year. U.S. gross combined loans receivable declined $125.8 million, or 36.6%, due to COVID-19 Impacts and additional government stimulus in the first quarter of 2021. Excluding Flexiti loans, gross loans receivable decreased sequentially $35.9 million, or 6.0%, with Canada Direct Lending growing $13.4 million, or 4.1%, and the U.S. declining $49.3 million, or 18.4%, as a result of U.S. government stimulus in the first quarter of 2021 and federal income tax seasonality. Gross combined loans receivable performance by product is described further in the following sections.
Results of Consolidated Operations
Condensed Consolidated Statements of Operations
| | | | | | | | | | | | | | | | | | | | | | |
| (in millions, unaudited) | | Three Months Ended March 31, | | |
| 2021 | 2020 | Change $ | Change % | | | | | |
| Revenue | | $ 196.6 | | $ 280.8 | | ($ 84.3) | | (30.0) | % | | | | | |
| Provision for losses | | 36.1 | | 113.5 | | (77.4) | | (68.2) | % | | | | | |
| Net revenue | | 160.4 | | 167.3 | | (6.9) | | (4.1) | % | | | | | |
| Advertising | | 8.1 | | 12.2 | | (4.1) | | (33.8) | % | | | | | |
| Non-advertising costs of providing services | | 50.3 | | 55.4 | | (5.0) | | (9.1) | % | | | | | |
| Total cost of providing services | | 58.4 | | 67.6 | | (9.2) | | (13.6) | % | | | | | |
| Gross margin | | 102.0 | | 99.7 | | 2.3 | | 2.3 | % | | | | | |
| Operating expense | | | | | | | | | | |
| Corporate, district and other expenses | | 48.8 | | 42.8 | | 6.0 | | 14.1 | % | | | | | |
| Interest expense | | 19.5 | | 17.3 | | 2.2 | | 12.8 | % | | | | | |
| | | | | | | | | | |
| (Income) loss from equity method investment | | (0.5) | | 1.6 | | (2.2) | | # | | | | | |
| | | | | | | | | | |
| | | | | | | | | | |
| Total operating expense | | 67.8 | | 61.7 | | 6.1 | | 9.9 | % | | | | | |
| Income from continuing operations before income taxes | | 34.2 | | 38.0 | | (3.8) | | (9.9) | % | | | | | |
| Provision for income taxes | | 8.4 | | 1.9 | | 6.5 | | # | | | | | |
| Net income from continuing operations | | 25.7 | | 36.0 | | (10.3) | | (28.5) | % | | | | | |
| Net income from discontinued operations, net of tax | | — | | 0.3 | | (0.3) | | # | | | | | |
| Net income | | $ 25.7 | | $ 36.3 | | ($ 10.6) | | (29.1) | % | | | | | |
| # - Variance greater than 100% or not meaningful |
Reconciliation of Net Income from Continuing Operations and Diluted Earnings per Share to Adjusted Net Income and Adjusted Diluted Earnings per Share, non-GAAP measures
| | | | | | | | | | | | | | | | | | | | | | |
| (in millions, except per share data, unaudited) | | Three Months Ended March 31, | | |
| 2021 | 2020 | Change $ | Change % | | | | | |
| Net income from continuing operations | | $ 25.7 | | $ 36.0 | | ($ 10.3) | | (28.5) | % | | | | | |
| Adjustments: | | | | | | | | | | |
| | | | | | | | | | |
| | | | | | | | | | |
Legal and other costs (1) | | — | | 0.9 | | | | | | | | |
| | | | | | | | | | |
(Income) loss from equity method investment (2) | | (0.5) | | 1.6 | | | | | | | | |
| | | | | | | | | | |
Transaction costs (3) | | 3.2 | | 0.2 | | | | | | | | |
Share-based compensation (4) | | 2.7 | | 3.2 | | | | | | | | |
Intangible asset amortization (5) | | 0.8 | | 0.7 | | | | | | | | |
| | | | | | | | | | |
| | | | | | | | | | |
Impact of tax law changes (6) | | — | | (9.1) | | | | | | | | |
Cumulative tax effect of adjustments (7) | | (1.7) | | (1.3) | | | | | | | | |
| Adjusted Net Income | | $ 30.1 | | $ 32.3 | | ($ 2.1) | | (6.7) | % | | | | | |
| | | | | | | | | | |
| Net income from continuing operations | | $ 25.7 | | $ 36.0 | | | | | | | | |
| Diluted Weighted Average Shares Outstanding | | 43.6 | | 41.9 | | | | | | | | |
| | | | | | | | | | |
| Diluted Earnings per Share from continuing operations | | $ 0.59 | | $ 0.86 | | ($ 0.27) | | (31.4) | % | | | | | |
| Per Share impact of adjustments to Net income from continuing operations | | 0.10 | | (0.09) | | | | | | | | |
| Adjusted Diluted Earnings per Share | | $ 0.69 | | $ 0.77 | | ($ 0.08) | | (10.4) | % | | | | | |
| Note: Footnotes follow Reconciliation of Net income table immediately below |
|
Reconciliation of Net Income from Continuing Operations to EBITDA and Adjusted EBITDA, Non-GAAP Measures
| | | | | | | | | | | | | | | | | | | | | | |
| | Three Months Ended March 31, | | |
| (in millions, unaudited) | | 2021 | 2020 | Change $ | Change % | | | | | |
| Net income from continuing operations | | $ 25.7 | | $ 36.0 | | ($ 10.3) | | (28.5) | % | | | | | |
| Provision for income taxes | | 8.4 | | 1.9 | | 6.5 | | # | | | | | |
| Interest expense | | 19.5 | | 17.3 | | 2.2 | | 12.8 | % | | | | | |
| Depreciation and amortization | | 5.0 | | 4.5 | | 0.4 | | 9.4 | % | | | | | |
| EBITDA | | 58.7 | | 59.8 | | (1.1) | | (1.9) | % | | | | | |
| | | | | | | | | | |
| | | | | | | | | | |
Legal and other costs (1) | | — | | 0.9 | | | | | | | | |
| | | | | | | | | | |
(Income) loss from equity method investment (2) | | (0.5) | | 1.6 | | | | | | | | |
| | | | | | | | | | |
Transaction costs (3) | | 3.2 | | 0.2 | | | | | | | | |
Share-based compensation (4) | | 2.7 | | 3.2 | | | | | | | | |
| | | | | | | | | | |
Other adjustments (8) | | (0.2) | | — | | | | | | | | |
| Adjusted EBITDA | | $ 63.8 | | $ 65.8 | | ($ 2.0) | | (3.1) | % | | | | | |
| Adjusted EBITDA Margin | | 32.4 | % | 23.4 | % | | | | | | | |
|
|
| | | | | |
| |
| |
| (1) | Legal and other costs for the three months ended March 31, 2020 included (i) costs for certain securities litigation and related matters and (ii) severance costs for certain corporate employees. |
| |
| |
| (2) | The amounts reported includes our share of the estimated U.S. GAAP net (income) loss of Katapult. |
| |
| (3) | Transaction costs for the three months ended March 31, 2021 relate to the acquisition of Flexiti and for the three months ended March 31, 2020 relate to the acquisition of Ad Astra. |
| (4) | The estimated fair value of share-based awards is recognized as non-cash compensation expense on a straight-line basis over the vesting period. |
| |
| (5) | The amortization expense on intangible assets is recognized on a straight-line basis over the life of the intangible asset. |
| |
| (6) | On March 27, 2020, the Coronavirus Aid, Relief and Economic Security Act ("CARES Act") was enacted by the U.S. Federal government in response to the COVID-19 pandemic. The CARES Act, among other things, allows NOLs incurred in 2018, 2019 and 2020 to be carried back to each of the five preceding taxable years to generate a refund of previously paid income taxes. For the three months ended March 31, 2020, we recorded an income tax benefit of $9.1 million related to the carryback of NOL from tax years 2018 and 2019. |
| (7) | Cumulative tax effect of adjustments included in Reconciliation of Net income from continuing operations to EBITDA and Adjusted EBITDA table is calculated using the estimated incremental tax rate by country. |
| (8) | Other adjustments primarily include the intercompany foreign-currency exchange impact. |
For the Three Months Ended March 31, 2021 and 2020
Revenue and Net Revenue
Revenue decreased 30.0% to $196.6 million for the three months ended March 31, 2021, from $280.8 million for the three months ended March 31, 2020, as a result of the decline in U.S. and Canada Direct Lending gross loan receivables discussed previously. Year over year, U.S. and Canada Direct Lending revenues decreased 38.5% and 1.0% (6.6% on a constant-currency basis), respectively, partially offset by $1.6 million of Canada POS Lending revenue from Flexiti after closing the acquisition. As previously mentioned, COVID-19 Impacts on year over year results for Canada were less pronounced compared to the U.S. due to continued growth of our Revolving LOC loans in Canada.
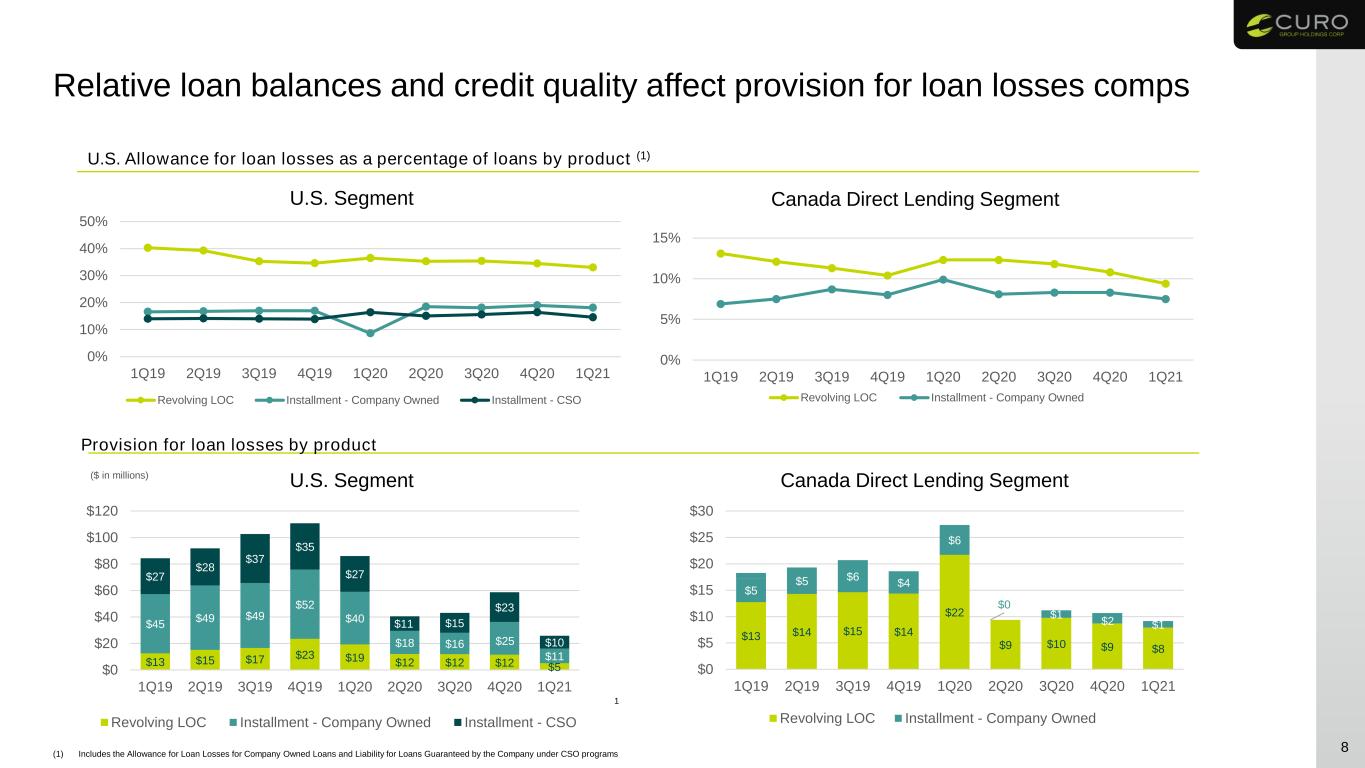
Provision for losses decreased by $77.4 million, or 68.2%, for the three months ended March 31, 2021 compared to the prior-year period. The decrease in provision for loan losses was due to lower loan balances in the U.S. in 2021, resulting from COVID-19 Impacts, compared to 2020 and significantly improved NCO rates year over year in both the U.S. and Canada Direct Lending segments as discussed in more detail in the "Segment Analysis" sections.
Cost of Providing Services
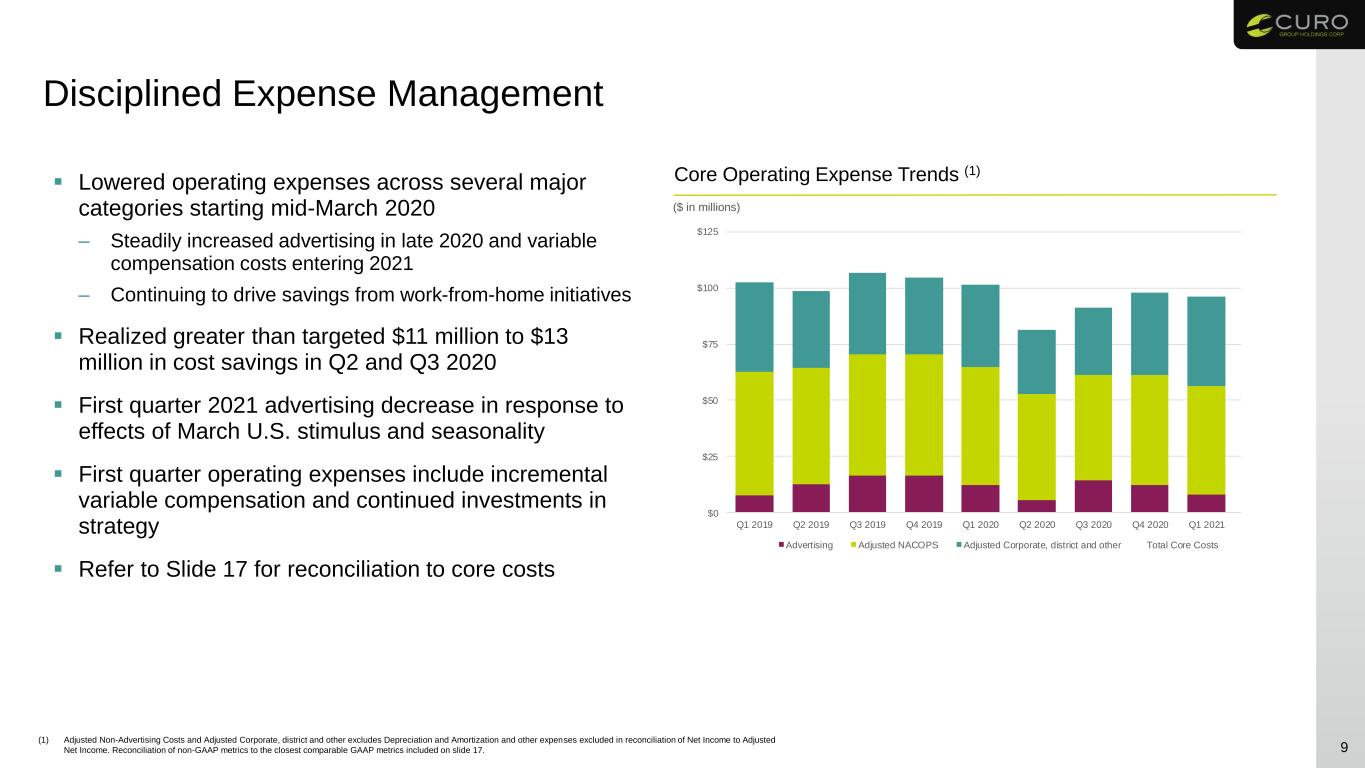
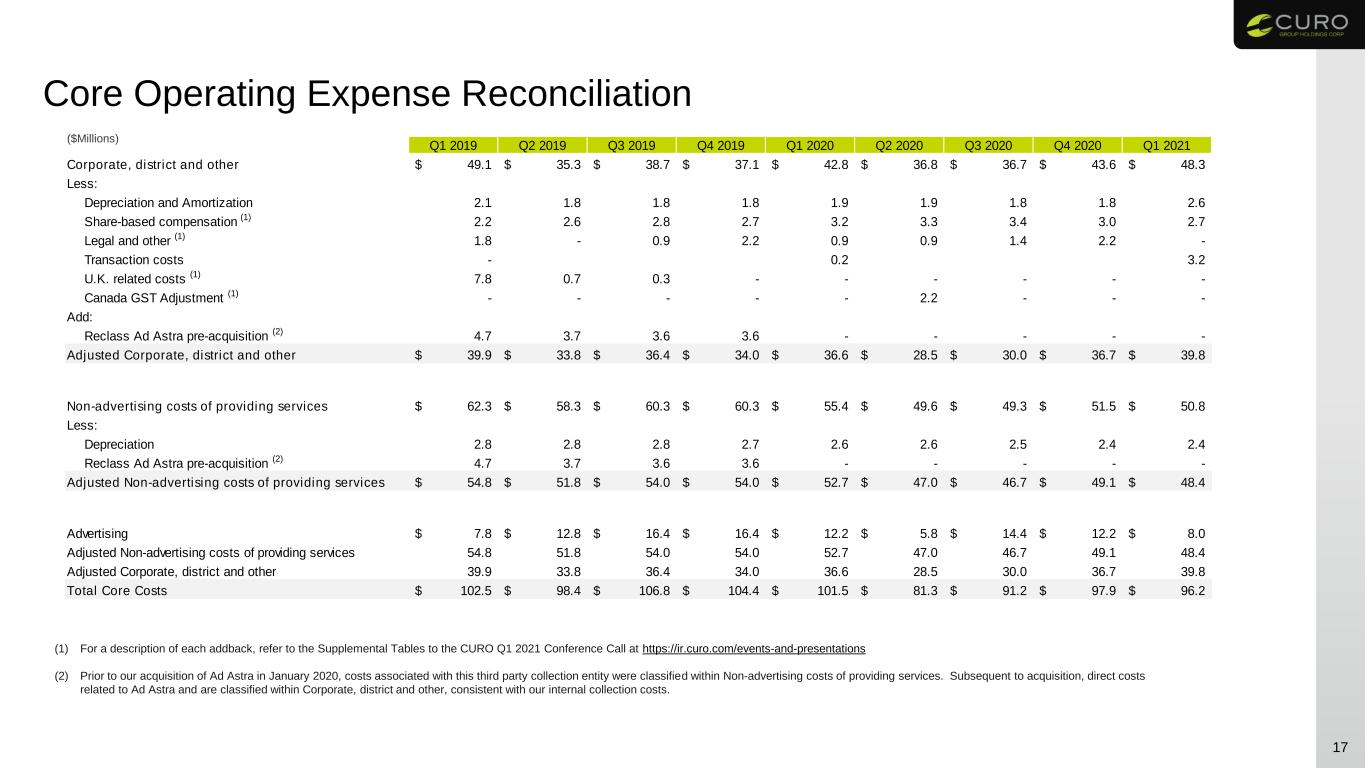
Non-advertising costs of providing services decreased $5.0 million, or 9.1%, to $50.3 million in the three months ended March 31, 2021, compared to $55.4 million in the three months ended March 31, 2020. The decrease was due to lower underwriting and other variable costs as a result of lower volume and lower collection costs stemming from stimulus-related repayments.
Advertising costs decreased $4.1 million, or 33.8%, year over year in response to product demand changes resulting from COVID-19.
Corporate, District and Other Expenses
Corporate, district and other expenses were $48.8 million for the three months ended March 31, 2021, an increase of $6.0 million, or 14.1%, compared to the three months ended March 31, 2020. The increase year over year was primarily due to (i) transaction costs related to the acquisition of Flexiti, (ii) $2.6 million of Flexiti operating expenses post-closing, and (iii) the timing and extent of variable compensation compared to the prior-year period. These expenses were partially offset by travel and other cost reductions, including work-from-home initiatives. Refer to the "Segment Analysis" sections below for further details.
Equity Method Investment
Refer to the "Katapult Update for the Three Months Ended March 31, 2021 and 2020" below for details.
Interest Expense
Interest expense for the three months ended March 31, 2021 increased $2.2 million, or 12.8%, on higher year-over-year borrowings.
Provision for Income Taxes
The effective income tax rate for the three months ended March 31, 2021 was 24.7%. The effective income tax rate was slightly lower than the federal and state/provincial statutory rates of approximately 26% primarily as the result of several non-taxable events.
Refer to the "Reconciliation of Net Income from Continuing Operations and Diluted Earnings per Share to Adjusted Net Income and Adjusted Diluted Earnings per Share, non-GAAP measures" for additional information. The effective income tax rate of adjusted tax expense included in the Adjusted Net Income for the three months ended March 31, 2021 was 25.5%.
Katapult Update for the Three Months Ended March 31, 2021 and 2020
A portion of our investment in Katapult is accounted for using the equity method of accounting and is included in "Investments in Katapult" on the unaudited Condensed Consolidated Balance Sheet. Our recognized share of Katapult's earnings was $0.5 million for the first quarter of 2021 compared to losses of $1.6 million for the three months ended March 31, 2020. We recognize our share of Katapult’s earnings on a one-quarter lag.
In December 2020, we announced that Katapult and FinServ entered into a merger agreement that, when completed, we expect will provide consideration to us in a combination of cash and stock. Based on market prices as of the date of this release, we expect to receive consideration with a total value of approximately $445 million. To date, our total cash investment in Katapult is $27.5 million. Upon closing of the merger, we anticipate receiving cash of up to $130 million while maintaining at least a 21% ownership, on a fully-diluted basis, in the newly formed public company. The transaction is expected to close by the end of the second quarter and remains subject to approval by FinServ's stockholders and other customary closing conditions. The transaction will result in both a cash tax liability and deferred tax liability, with the cash tax liability dependent upon cash received at closing. Assuming cash proceeds to us of $130 million, our estimated cash tax liability would be approximately $35 million.
The table below presents select financial information for Katapult for the periods presented:
| | | | | | | | | | | | | | |
| | For the Year Ended December 31, (1) |
| (in millions) | | 2020 | | 2019 |
| Revenue | | $ 247.2 | | | $ 91.9 | |
| Cost of revenue | | 167.4 | | | 71.2 | |
| Gross profit | | 79.8 | | | 20.7 | |
| | | | |
| Operating expenses | | 42.9 | | | 30.0 | |
| Interest and loss on extinguishment of debt | | 13.9 | | | 9.4 | |
| Income before income taxes | | 23.0 | | | (18.8) | |
| Net income | | $ 22.5 | | | ($ 18.8) | |
| | | | |
| Originations | | $ 192.1 | | | $ 87.7 | |
| Cash and restricted cash | | $ 69.6 | | | $ 12.2 | |
| Gross property held for lease | | $ 213.8 | | | $ 110.4 | |
| (1) Source: FinServ's Registration Statement on Form S-4, pages F-24, F-28, F-36 and 98, filed with the SEC on April 2, 2021. |
Segment Analysis
Following the acquisition of Flexiti on March 10, 2021, we report financial results for three reportable segments: U.S., Canada Direct Lending and Canada POS Lending, instead of our prior U.S. and Canada segments. Following is a summary of portfolio performance and results of operations for the segment and period indicated.
U.S. Portfolio Performance
| | | | | | | | | | | | | | | | | | | | | | | |
| (in millions, except percentages) | | Q1 2021 | | Q4 2020 | Q3 2020 | Q2 2020 | Q1 2020 |
Gross combined loans receivable (1) | | | | | | | |
| Revolving LOC | | $ 43.4 | | $ 55.6 | $ 56.7 | $ 53.2 | $ 73.7 |
| Installment loans - Company Owned | | 142.4 | | 167.9 | 148.6 | 146.5 | 214.4 |
| Total U.S. Company Owned gross loans receivable | | 185.8 | | 223.5 | 205.3 | 199.7 | 288.1 |
Installment loans - Guaranteed by the Company (2) | | 32.4 | | 44.1 | 39.8 | 34.1 | 55.9 |
Total U.S. gross combined loans receivable (1) | | $ 218.2 | | $ 267.6 | $ 245.1 | $ 233.8 | $ 344.0 |
| | | | | | | |
| Lending Revenue: | | | | | | | |
| Revolving LOC | | $ 26.9 | | $ 31.1 | $ 30.4 | $ 30.9 | $ 42.0 |
| Installment loans - Company Owned | | 64.5 | | 68.9 | 62.2 | 65.1 | 107.2 |
Installment loans - Guaranteed by the Company (2) | | 41.4 | | 43.0 | 36.7 | 37.8 | 68.1 |
| Total U.S. lending revenue | | $ 132.9 | | $ 143.0 | $ 129.4 | $ 133.8 | $ 217.3 |
| | | | | | | |
| Lending Provision: | | | | | | | |
| Revolving LOC | | $ 5.0 | | $ 11.6 | $ 11.9 | $ 12.0 | $ 19.3 |
| Installment loans - Company Owned | | 11.2 | | 24.6 | 16.3 | 17.6 | 39.8 |
Installment loans - Guaranteed by the Company (2) | | 9.6 | | 22.6 | 14.9 | 11.7 | 26.4 |
| Total U.S. lending provision | | $ 25.8 | | $ 58.8 | $ 43.1 | $ 41.2 | $ 85.5 |
| | | | | | | |
| Lending Net Revenue | | | | | | | |
| Revolving LOC | | $ 21.9 | | $ 19.5 | $ 18.5 | $ 18.9 | $ 22.7 |
| Installment loans - Company Owned | | 53.4 | | 44.3 | 46.0 | 47.6 | 67.4 |
Installment loans - Guaranteed by the Company (2) | | 31.8 | | 20.4 | 21.8 | 26.0 | 41.7 |
| Total U.S. lending net revenue | | $ 107.0 | | $ 84.2 | $ 86.3 | $ 92.5 | $ 131.8 |
| | | | | | | |
| | | | | | | | | | | | | | | | | | | | | | | |
| (in millions, except percentages) | | Q1 2021 | | Q4 2020 | Q3 2020 | Q2 2020 | Q1 2020 |
| NCOs | | | | | | | |
| Revolving LOC | | $ 9.9 | | $ 12.5 | $ 10.6 | $ 20.1 | $ 21.2 |
| Installment loans - Company Owned | | 17.3 | | 19.6 | 16.8 | 29.9 | 47.7 |
Installment loans - Guaranteed by the Company (2) | | 12.2 | | 21.6 | 13.9 | 15.7 | 27.8 |
| Total U.S. NCOs | | $ 39.4 | | $ 53.7 | $ 41.3 | $ 65.7 | $ 96.8 |
| | | | | | | |
NCO rate (3) | | | | | | | |
| Revolving LOC | | 20.0% | | 22.3% | 19.3% | 31.7% | 27.0% |
| Installment loans - Company Owned | | 11.2% | | 12.4% | 11.4% | 16.6% | 19.3% |
| Total U.S. Company Owned NCO rate | | 13.3% | | 15.0% | 13.5% | 20.5% | 21.2% |
Installment loans - Guaranteed by the Company (2) | | 31.7% | | 51.5% | 37.6% | 35.0% | 42.0% |
| Total U.S. NCO rate | | 16.2% | | 21.0% | 17.2% | 22.8% | 24.7% |
| | | | | | | |
ALL and CSO Liability for Losses (4) | | | | | | | |
| Revolving LOC | | $ 14.3 | | $ 19.2 | $ 20.1 | $ 18.8 | $ 26.9 |
| Installment loans - Company Owned | | 25.8 | | 32.0 | 27.0 | 27.1 | 39.8 |
Installment loans - Guaranteed by the Company (2) | | 4.7 | | 7.2 | 6.2 | 5.2 | 9.2 |
| Total U.S. ALL and CSO Liability for Losses | | $ 44.9 | | $ 58.4 | $ 53.3 | $ 51.1 | $ 75.9 |
| | | | | | | |
ALL and CSO Liability for Losses rate (5) | | | | | | | |
| Revolving LOC | | 33.0% | | 34.5% | 35.4% | 35.3% | 36.5% |
| Installment loans - Company Owned | | 18.1% | | 19.0% | 18.1% | 18.5% | 18.6% |
| Total U.S. Company Owned ALL rate | | 21.6% | | 22.9% | 22.9% | 23.0% | 23.2% |
Installment loans - Guaranteed by the Company (2) | | 14.6% | | 16.4% | 15.6% | 15.1% | 16.4% |
| Total ALL and CSO Liability for Losses rate | | 20.6% | | 21.8% | 21.7% | 21.8% | 22.1% |
| | | | | | | |
Past-due rate (5) | | | | | | | |
| Revolving LOC | | 26.3% | | 30.7% | 27.9% | 26.6% | 36.2% |
| Installment loans - Company Owned | | 18.0% | | 19.0% | 16.6% | 17.6% | 22.7% |
| Total U.S. Company Owned past-due rate | | 19.9% | | 21.9% | 19.8% | 20.0% | 26.2% |
| | | | | | | |
Installment loans - Guaranteed by the Company (2) | | 12.8% | | 14.1% | 15.4% | 12.1% | 17.1% |
| | | | | | | |
| | | | | | | |
| | | | | | | |
| | | | | | | |
| | | | | | | |
| | | | | | | |
| | | | | | | |
| | | | | | | |
| (1) Non-GAAP measure. For a description of each non-GAAP metric, see "Non-GAAP Financial Measures." |
| (2) Includes loans originated by third-party lenders through CSO programs. Installment gross loans receivable Guaranteed by the Company are not included in the Condensed Consolidated Financial Statements. |
| (3) We calculate NCO rate as total NCOs divided by Average gross loans receivables. |
| (4) We report allowance for loan losses ("ALL") as a contra-asset reducing gross loans receivable and the CSO Liability for Losses as a liability on the Condensed Consolidated Balance Sheets. |
| (5) We calculate (i) ALL and CSO Liability for losses rate and (ii) past-due rate as the respective totals divided by gross loans receivable at each respective quarter end. |
|
U.S. Net Revenue
U.S. revenues decreased by $85.3 million, or 38.5%, to $136.5 million, compared to the prior-year period for the three months ended March 31, 2021, as a result of the COVID-19 related declines in gross combined loans receivable and normal seasonality. See the loan performance discussions below for further details on regulatory impacts.
The provision for losses decreased $60.0 million, or 69.7%, primarily as a result of lower loan volume and lower NCOs from COVID-19 Impacts as previously described. U.S. NCOs, including loans Guaranteed by the Company, decreased by $57.4 million, or 59.3% year over year, and the U.S. NCO rate improved from 24.7% in the prior year to 16.2% for the three months ended March 31, 2021.
U.S. Revolving LOC loan performance
U.S. Revolving LOC loan balances as of March 31, 2021 decreased $30.3 million, or 41.1%, compared to the prior year, resulting in a related revenue decrease of $15.1 million, or 35.9%, primarily due to COVID-19 Impacts and the conversion of Virginia Revolving LOC loans to Installment loans in response to regulatory changes effective January 1, 2021. The Revolving LOC ALL as a percentage of Revolving LOC gross loans receivable ("allowance coverage") decreased year over year from 36.5% to 33.0% for the three months ended March 31, 2021. The decrease was due to sustained favorable trends in NCOs throughout 2020 and the first quarter of 2021, and lower past-due rates compared to historical trends. Year over year, NCO rates improved 700 bps and past-due rates improved 990 bps. Sequentially, NCO rates improved by 225 bps, or 10.1%, and past-due rates improved by 440 bps, or 14.5%.
U.S. Installment loan performance - Company Owned
U.S. Installment loan balances as of March 31, 2021 decreased $72.0 million, or 33.6%, and revenue decreased $42.7 million, or 39.8%, compared to the prior year, primarily due to COVID-19 Impacts and regulatory changes in California, effective January 1, 2020 that affected multi-pay installment products. Excluding the impacted California loans, U.S. Installment loans decreased $24.6 million, or 18.3%, year over year. The Installment loans allowance coverage decreased from 18.6% in the prior year to 18.1% as of March 31, 2021, largely due to sustained favorable trends in NCOs and lower past-due rates, partially offset by growth in the Verge Credit brand. We launched Verge installment loans originated by Stride Bank in the fourth quarter of 2019 and have executed pilot programs in several states. After testing various offers, rates, terms and approval criteria, Stride has informed us that it plans to focus on near-prime loans as they represent a larger addressable market and offer greater opportunity to scale. As a result, Stride has decided to discontinue new Verge Credit loans. Verge loan balances totaled $29.7 million as of March 31, 2021. We expect an orderly run-off of these balances over the next 24 months. We continue to maintain various relationships with Stride and are working together to develop additional products that meet customer needs.
Year over year, NCO rates and past-due rates improved by 800 bps and 475 bps, respectively. Sequentially, allowance coverage decreased from 19.0% to 18.1% primarily from (i) lower NCOs, (ii) a decline in TDR loans as a percentage of total gross loans receivable, and (iii) lower past-due gross loans receivable as a percentage of total gross loans receivable compared to historical trends.
U.S. Installment loan performance - Guaranteed by the Company
U.S. Installment loans Guaranteed by the Company declined $23.5 million, or 42.0%, year over year, primarily due to COVID-19 Impacts, which includes effects of the government stimulus in the first quarter of 2021. The allowance rate decreased 180 bps year over year due to sustained favorable NCO trends and lower past-due gross loans receivable compared to historical trends. Sequentially, allowance coverage and past-due balances declined from 16.4% to 14.6% and from 14.1% to 12.8%, respectively, for the three months ended March 31, 2021. NCO rates improved year over year from 42.0% to 31.7%, and sequentially from 51.5% to 31.7%, as a result of government stimulus-related pay-downs during the first quarter of 2021.
Following is a summary of results of operations for the U.S. segment for the periods indicated.
U.S. Results of Operations
| | | | | | | | | | | | | | | | | | | |
| Three Months Ended March 31, | | |
| (dollars in millions, unaudited) | 2021 | 2020 | Change $ | Change % | | | | | |
| Revenue | $ 136.5 | | $ 221.8 | | ($ 85.3) | | (38.5) | % | | | | | |
| Provision for losses | 26.1 | | 86.0 | | (60.0) | | (69.7) | % | | | | | |
| Net revenue | 110.4 | | 135.7 | | (25.3) | | (18.6) | % | | | | | |
| Advertising | 7.1 | | 10.9 | | (3.8) | | (34.8) | % | | | | | |
| Non-advertising costs of providing services | 32.2 | | 37.2 | | (5.1) | | (13.7) | % | | | | | |
| Total cost of providing services | 39.3 | | 48.2 | | (8.9) | | (18.5) | % | | | | | |
| Gross margin | 71.1 | | 87.5 | | (16.4) | | (18.7) | % | | | | | |
| Corporate, district and other expenses | 40.6 | | 37.7 | | 2.9 | | 7.8 | % | | | | | |
| Interest expense | 16.4 | | 14.8 | | 1.5 | | 10.2 | % | | | | | |
| | | | | | | | | |
| (Income) loss from equity method investment | (0.5) | | 1.6 | | (2.2) | | # | | | | | |
| | | | | | | | | |
| | | | | | | | | |
| Total operating expense | 56.4 | | 54.1 | | 2.3 | | 4.2 | % | | | | | |
| Segment operating income | 14.7 | | 33.4 | | (18.7) | | (55.9) | % | | | | | |
| Interest expense | 16.4 | | 14.8 | | 1.5 | | 10.2 | % | | | | | |
| Depreciation and amortization | 3.1 | | 3.4 | | (0.3) | | (7.4) | % | | | | | |
EBITDA (1) | 34.2 | | 51.6 | | (17.4) | | (33.8) | % | | | | | |
| | | | | | | | | |
| | | | | | | | | |
| Legal and other costs | — | | 0.9 | | (0.9) | | | | | | | |
| Transaction costs | 3.2 | | 0.2 | | 2.9 | | | | | | | |
| (Income) loss from equity method investment | (0.5) | | 1.6 | | (2.2) | | | | | | | |
| | | | | | | | | |
| Share-based compensation | 2.7 | | 3.2 | | (0.5) | | | | | | | |
| Other adjustments | (0.2) | | (0.1) | | (0.1) | | | | | | | |
Adjusted EBITDA (1) | $ 39.3 | | $ 57.5 | | ($ 18.2) | | (31.7) | % | | | | | |
| (1) These are non-GAAP metrics. For a description of each non-GAAP addback, see the applicable reconciliations contained under "Results of Consolidated Operations." For a description of each non-GAAP metric, see "Non-GAAP Financial Measures." | | | | | |
| # - Variance greater than 100% or not meaningful. |
U.S. Segment Results - For the Three Months Ended March 31, 2021 and 2020
For a discussion of revenue, provision for losses and related gross combined loans receivables, see "U.S. Portfolio Performance," above.
Non-advertising costs of providing services for the three months ended March 31, 2021 were $32.2 million, a decrease of $5.1 million, or 13.7%, compared to $37.2 million for the three months ended March 31, 2020. The decrease was primarily driven by (i) lower underwriting and other variable costs as a result of COVID-19 related demand constraints and (ii) lower collection costs resulting from government stimulus-related repayments.
Advertising costs decreased $3.8 million, or 34.8%, year over year in response to demand changes resulting from COVID-19.
Corporate, district and other expenses were $40.6 million for the three months ended March 31, 2021, an increase of $2.9 million, or 7.8%, compared to the prior-year period. The year-over-year increase was primarily due to transaction costs related to the acquisition of Flexiti and the timing and extent of variable compensation compared to the prior-year period. These expenses were partially offset by certain cost reductions, including work-from-home initiatives.
U.S. interest expense for the three months ended March 31, 2021 increased $1.5 million, or 10.2%, primarily related to the Non-Recourse U.S. SPV Facility, which we closed in April 2020.
As previously described, we recognize our share of Katapult’s income on a one-quarter lag and recorded income of $0.5 million for the three months ended March 31, 2021.
Canada Direct Lending and Canada POS Lending Portfolio Performance
| | | | | | | | | | | | | | | | | | | | | | | |
| (in millions, except percentages) | | Q1 2021 | | Q4 2020 | Q3 2020 | Q2 2020 | Q1 2020 |
| Gross loans receivable | | | | | | | |
| Canada Direct Lending Revolving LOC | | $ 319.3 | | $ 303.3 | $ 265.5 | $ 231.9 | $ 240.3 |
| Canada Direct Lending Installment loans | | 24.4 | | 26.9 | 26.6 | 24.9 | 36.0 |
| Total Canada Direct Lending gross loans receivable | | $ 343.7 | | $ 330.2 | $ 292.1 | $ 256.8 | $ 276.3 |
| | | | | | | |
| | | | | | | |
| | | | | | | |
| Total Canada POS Lending gross loans receivable | | $ 201.5 | | $ — | $ — | $ — | $ — |
| | | | | | | |
| Lending Revenue: | | | | | | | |
| Canada Direct Lending Revolving LOC | | $ 34.4 | | $ 32.0 | $ 28.3 | $ 25.8 | $ 29.0 |
| Canada Direct Lending Installment loans | | 10.4 | | 11.1 | 10.2 | 9.7 | 18.6 |
| Total Canada Direct Lending - lending revenue | | $ 44.8 | | $ 43.1 | $ 38.5 | $ 35.5 | $ 47.6 |
| | | | | | | |
| Canada POS Lending - lending revenue | | $ 1.4 | | $ — | $ — | $ — | $ — |
| | | | | | | |
| Lending Provision: | | | | | | | |
| Canada Direct Lending Revolving LOC | | $ 7.9 | | $ 8.7 | $ 9.8 | $ 9.4 | $ 21.7 |
| Canada Direct Lending Installment loans | | 1.2 | | 2.0 | 1.4 | (0.3) | 5.7 |
| Total Canada Direct Lending - lending provision | | $ 9.1 | | $ 10.7 | $ 11.2 | $ 9.1 | $ 27.4 |
| | | | | | | |
| Canada POS Lending - lending provision | | $ 0.9 | | $ — | $ — | $ — | $ — |
| | | | | | | |
| Lending Net Revenue | | | | | | | |
| Canada Direct Lending Revolving LOC | | $ 26.5 | | $ 23.3 | $ 18.5 | $ 16.5 | $ 7.3 |
| Canada Direct Lending Installment loans | | 9.2 | | 9.1 | 8.8 | 10.0 | 12.9 |
| Total Canada Direct Lending - lending net revenue | | $ 35.7 | | $ 32.4 | $ 27.3 | $ 26.5 | $ 20.2 |
| | | | | | | |
| Canada POS Lending - lending net revenue | | $ 0.5 | | $ — | $ — | $ — | $ — |
| | | | | | | |
| NCOs | | | | | | | |
| Canada Direct Lending Revolving LOC | | $ 11.1 | | $ 8.9 | $ 7.6 | $ 11.6 | $ 15.9 |
| Canada Direct Lending Installment loans | | 1.7 | | 2.1 | 1.3 | 1.4 | 5.8 |
| Total Canada Direct Lending NCOs | | $ 12.8 | | $ 11.0 | $ 8.9 | $ 13.0 | $ 21.7 |
| | | | | | | |
| Canada POS Lending NCOs | | $ 0.2 | | $ — | $ — | $ — | $ — |
| | | | | | | |
NCO rate (1) | | | | | | | |
| Canada Direct Lending Revolving LOC | | 3.6% | | 3.1% | 3.0% | 4.9% | 6.4% |
| Canada Direct Lending Installment loans | | 6.5% | | 7.7% | 5.0% | 4.6% | 13.5% |
| Total Canada Direct Lending NCO rate | | 3.8% | | 3.5% | 3.2% | 4.9% | 7.5% |
| | | | | | | |
| Canada POS Lending NCO rate | | NM (2) | | —% | —% | —% | —% |
| | | | | | | |
ALL (3) | | | | | | | |
| Canada Direct Lending Revolving LOC | | $ 29.9 | | $ 32.8 | $ 31.3 | $ 28.5 | $ 29.6 |
| Canada Direct Lending Installment loans | | 1.8 | | 2.2 | 2.2 | 2.0 | 3.6 |
| Total Canada Direct Lending ALL | | $ 31.7 | | $ 35.0 | $ 33.5 | $ 30.5 | $ 33.2 |
| | | | | | | |
Canada POS Lending ALL (4) | | $ 0.5 | | $ — | $ — | $ — | $ — |
| | | | | | | |
| | | | | | | | | | | | | | | | | | | | | | | |
| (in millions, except percentages) | | Q1 2021 | | Q4 2020 | Q3 2020 | Q2 2020 | Q1 2020 |
ALL rate (5) | | | | | | | |
| Canada Direct Lending Revolving LOC | | 9.4 | % | | 10.8 | % | 11.8 | % | 12.3 | % | 12.3 | % |
| Canada Direct Lending Installment loans | | 7.5 | % | | 8.3 | % | 8.3 | % | 8.1 | % | 9.9 | % |
| Total Canada Direct Lending ALL rate | | 9.2 | % | | 10.6 | % | 11.5 | % | 11.9 | % | 12.0 | % |
| | | | | | | |
| Canada POS Lending ALL rate | | 0.3 | % | | — | % | — | % | — | % | — | % |
| | | | | | | |
Past-due rate (5) | | | | | | | |
| Canada Direct Lending Revolving LOC | | 6.4 | % | | 6.8 | % | 6.0 | % | 7.3 | % | 9.7 | % |
| Canada Direct Lending Installment loans | | 2.1 | % | | 2.1 | % | 2.9 | % | 3.7 | % | 4.1 | % |
| Total Canada Direct Lending past-due rate | | 6.1 | % | | 6.4 | % | 5.7 | % | 7.0 | % | 9.0 | % |
| | | | | | | |
| Canada POS Lending past-due rate | | 5.7 | % | | — | % | — | % | — | % | — | % |
| | | | | | | |
| | | | | | | |
| | | | | | | |
| | | | | | | |
| | | | | | | |
| | | | | | | |
| | | | | | | |
| | | | | | | |
| (1) We calculate NCO rate as total NCOs divided by Average gross loans receivables. |
| (2) Not material or not meaningful. |
| (3) We report ALL as a contra-asset reducing gross loans receivable on the Condensed Consolidated Balance Sheets. |
| (4) Loans originated pre-acquisition have been adjusted to fair value at the acquisition date and included estimates of future losses. The ALL represents estimated incurred losses for loans originated after acquisition plus an incurred losses for acquired loans in excess of the remaining fair value discount. |
| (5) We calculate ALL rate and past-due rate as the respective totals divided by gross loans receivable at each respective quarter end. |
|
|
Canada Direct Lending Net Revenue
Canada Direct Lending revenue declined year over year by $1.0 million, or 1.7%, ($3.9 million, or 6.6%, on a constant-currency basis), for the three months ended March 31, 2021, as a result of COVID-19 Impacts on Installment gross loans receivable, offset by increases in Revolving LOC gross loans receivable. Sequentially, Canada Direct Lending revenue increased $3.0 million, or 5.3%, driven by increases in Revolving LOC and ancillary revenue, partially offset by a decrease in Installment revenue.
The provision for losses decreased $18.3 million, or 66.4%, ($18.7 million, or 68.2%, on a constant-currency basis), to $9.2 million for the three months ended March 31, 2021, compared to $27.5 million in the prior-year period. The decrease in provision for loan losses was the result of lower NCOs and the related impact of changes in allowance coverage due to an increase in credit quality for Revolving LOC loans. As of March 31, 2021, allowance coverage decreased sequentially by 135 basis points, or 12.9%, compared to a sequential increase of 200 bps, or 19.8%, as of March 31, 2020. On a quarterly basis, loss rates improved approximately 370 bps, or 49.4%, year over year due to COVID-19 Impacts and overall seasoning of the Revolving LOC loan portfolio.
Canada Direct Lending Revolving LOC loan performance
Canada Direct Lending Revolving LOC gross loans receivable increased $79.0 million, or 32.9%, ($41.7 million, or 17.4%, on a constant-currency basis) year over year and $16.0 million, or 5.3% ($13.0 million, or 4.3%, on a constant-currency basis) sequentially. Revolving LOC revenue increased $5.4 million, or 18.5%, year over year and $2.4 million, or 7.5%, sequentially ($3.4 million, or 11.9%, and $1.4 million, or 4.5%, respectively, on a constant-currency basis). The allowance coverage decreased year over year from 12.3% to 9.4% as of March 31, 2021 due to sustained favorable trends in NCOs and continued lower past-due balances. The year-over-year NCO rate and past-due rate for Revolving LOC gross loans receivable improved by 290 bps and 325 bps, respectively.
Canada Direct Lending Installment loan performance
Installment revenues decreased $8.1 million, or 43.8%, ($8.7 million, or 46.9%, on a constant-currency basis) as a result of a year over year decline in Installment gross loans receivable of $11.6 million, or 32.3% ($14.5 million, or 40.2%, on a constant-currency basis). The decreases in Installment loans and related revenue were due to a continued shift to Revolving LOC loans, as well as COVID-19 related constraints on demand, particularly as related to store-driven Installment loans. The Installment allowance coverage decreased year over year from 9.9% to 7.5% as a result of sustained favorable trends in NCOs and past-due balances stemming from COVID-19 Impacts. The year-over-year NCO rate and past-due rate for Installment loans improved by 695 bps and 200 bps, respectively. Sequentially, Installment gross loans receivable decreased $2.6 million, or 9.5%, ($2.8 million, or 10.4%, on a constant-currency basis) and related revenue decreased $0.7 million, or 5.9% ($1.0 million, or 8.6%, on a constant-currency basis).
Canada POS Lending Revolving LOC loan performance
Canada POS Lending Revolving LOC gross loans receivable as of March 31, 2021 were $201.5 million, which generated $1.4 million of interest revenue for the period of acquisition through quarter end. Revolving LOC gross loans receivable charge-off at 180 days past due, or in some instances earlier, when specific criteria are met. NCOs were $0.2 million from March 10, 2021 (the acquisition date) through March 31, 2021. Originations for the three months ended March 31, 2021 were $85.0 million in Canadian dollars ("C$"), an increase of C$34.7 million, or 69.0%, from the prior-year period of C$50.3 million.
Canada Direct Lending and Canada POS Lending Results of Operations
| | | | | | | | | | | | | | | | | | | | | | | | | | | | | | | | | | | | | |
| Three Months Ended March 31, | | |
| 2021 | | 2020 | | | | | | | | |
| Canada Direct Lending | Canada POS Lending | Consolidated Canada | | Canada Direct Lending | Canada POS Lending | Consolidated Canada | | Consolidated Canada | | | | | |
| (dollars in millions, unaudited) | | | Change $ | Change % | | | | | |
| Revenue | $ 58.4 | | $ 1.6 | | $ 60.1 | | | $ 59.0 | | $ — | | $ 59.0 | | | $ 1.0 | | 1.7 | % | | | | | |
| Provision for losses | 9.2 | | 0.9 | | 10.1 | | | 27.5 | | — | | 27.5 | | | ($ 17.4) | | (63.3) | % | | | | | |
| Net revenue | 49.2 | | 0.8 | | 50.0 | | | 31.5 | | — | | 31.5 | | | $ 18.4 | | 58.4 | % | | | | | |
| Advertising | 0.9 | | — | | 0.9 | | | 1.3 | | — | | 1.3 | | | ($ 0.3) | | (26.0) | % | | | | | |
| Non-advertising costs of providing services | 18.1 | | 0.1 | | 18.2 | | | 18.1 | | — | | 18.1 | | | $ — | | 0.2 | % | | | | | |
| Total cost of providing services | 19.0 | | 0.1 | | 19.1 | | | 19.4 | | — | | 19.4 | | | ($ 0.3) | | (1.5) | % | | | | | |
| Gross margin | 30.2 | | 0.7 | | 30.9 | | | 12.2 | | — | | 12.2 | | | $ 18.7 | | # | | | | | |
| Corporate, district and other expenses | 5.6 | | 2.6 | | 8.2 | | | 5.2 | | — | | 5.2 | | | $ 3.1 | | 59.8 | % | | | | | |
| Interest expense | 2.4 | | 0.8 | | 3.2 | | | 2.5 | | — | | 2.5 | | | $ 0.7 | | 28.4 | % | | | | | |
| Total operating expense | 8.0 | | 3.5 | | 11.4 | | | 7.6 | | — | | 7.6 | | | $ 3.8 | | 49.6 | % | | | | | |
| Segment operating income | 22.2 | | (2.8) | | 19.4 | | | 4.5 | | — | | 4.5 | | | $ 14.9 | | # | | | | | |
| Interest expense | 2.4 | | 0.8 | | 3.2 | | | 2.5 | | — | | 2.5 | | | $ 0.7 | | 28.4 | % | | | | | |
| Depreciation and amortization | 1.1 | | 0.7 | | 1.8 | | | 1.2 | | — | | 1.2 | | | $ 0.7 | | 58.5 | % | | | | | |
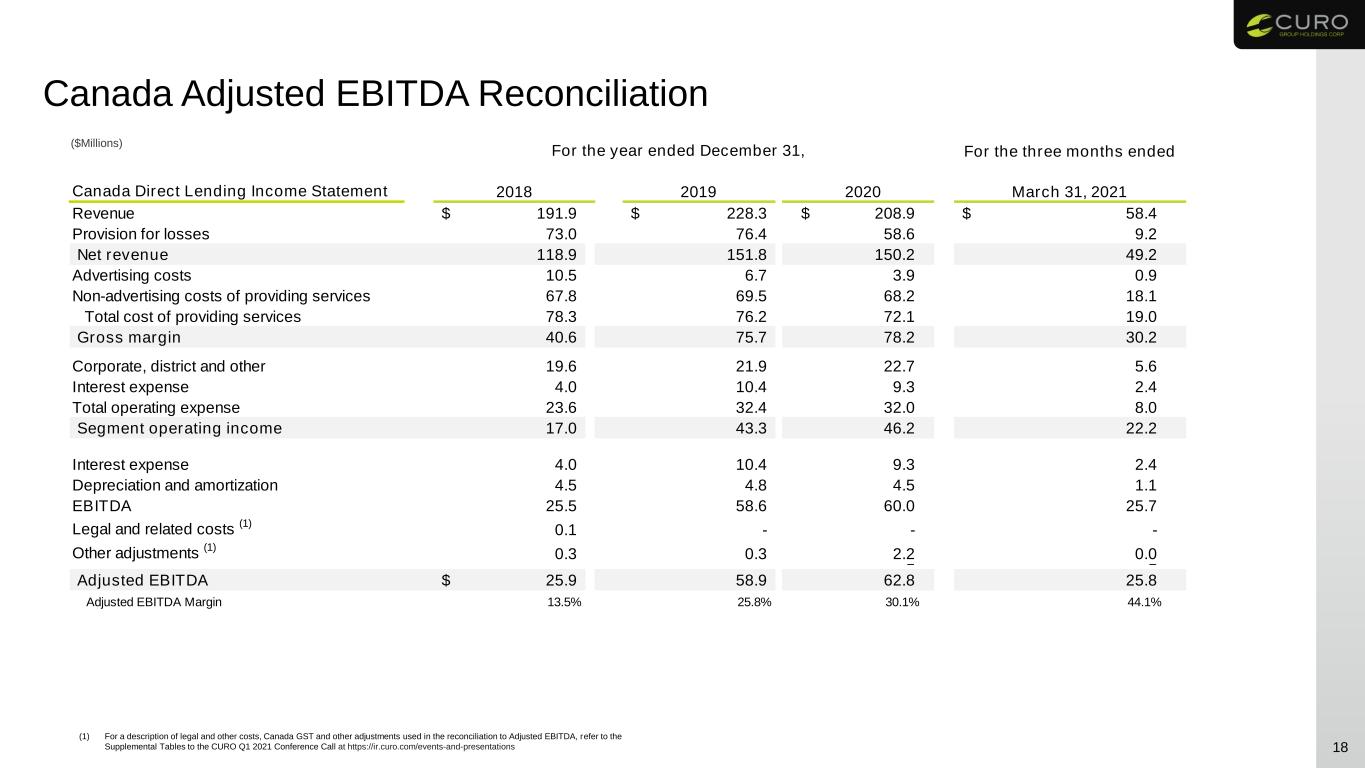
EBITDA (1) | 25.7 | | (1.3) | | 24.5 | | | 8.2 | | — | | 8.2 | | | $ 16.3 | | # | | | | | |
| | | | | | | | | | | | | | | |
| | | | | | | | | | | | | | | |
| | | | | | | | | | | | | | | |
| | | | | | | | | | | | | | | |
| Other adjustments | — | | — | | — | | | 0.2 | | — | | 0.2 | | | ($ 0.1) | | | | | | | |
Adjusted EBITDA (1) | $ 25.8 | | ($ 1.3) | | $ 24.5 | | | $ 8.3 | | $ — | | $ 8.3 | | | $ 16.2 | | # | | | | | |
| # - Variance greater than 100% or not meaningful. | | | | | | | | | | |
| (1) These are non-GAAP metrics. For a description of each non-GAAP addback, see the applicable reconciliations contained under "Results of Consolidated Operations." For a description of each non-GAAP metric, see "Non-GAAP Financial Measures." | | | | | |
Canada Direct Lending Segment Results - For the Three Months Ended March 31, 2021 and 2020
For a discussion of revenue, provision for losses and related gross combined loans receivables, see "Canada Direct Lending Portfolio Performance," above.
Canada cost of providing services were consistent to the prior-year period at $19.0 million for the three months ended March 31, 2021 compared to $19.4 million for the three months ended March 31, 2020.
Canada operating expenses were consistent to the prior-year period at $8.0 million for the three months ended March 31, 2021 compared to $7.6 million for the three months ended March 31, 2020.
Canada POS Lending Segment Results - For the Three Months Ended March 31, 2021
For a discussion of revenue, provision for losses and related gross combined loans receivables, see the "Canada POS Lending Portfolio Performance," above. Canada POS Lending segment revenue also includes revenue from merchant discounts and ancillary products. Merchant discount revenue represents the fee charged to merchant partners to help facilitate customer credit card purchases at merchant locations. The fee is recognized over the credit card loan term, which ranges from three to 72 months. Ancillary revenue includes administrative fees, annual fees, insurance product fees and other fees charged to customers.
CURO GROUP HOLDINGS CORP. AND SUBSIDIARIES
CONDENSED CONSOLIDATED BALANCE SHEETS
(in millions)
| | | | | | | | | | | |
| March 31, 2021 (unaudited) | | December 31, 2020 |
| | | |
| ASSETS |
| Cash and cash equivalents | $ 135.4 | | | $ 213.3 | |
Restricted cash (includes restricted cash of consolidated VIEs of $47.6 million and $32.0 million as of March 31, 2021 and December 31, 2020, respectively) | 80.4 | | | 54.8 | |
Gross loans receivable (includes loans of consolidated VIEs of $554.6 million and $360.4 million as of March 31, 2021 and December 31, 2020, respectively) | 731.0 | | | 553.7 | |
Less: Allowance for loan losses (includes allowance for losses of consolidated VIEs of $44.9 million and $54.1 million as of March 31, 2021 and December 31, 2020, respectively) | (72.4) | | | (86.2) | |
| Loans receivable, net | 658.6 | | | 467.6 | |
| Income taxes receivable | 24.1 | | | 32.1 | |
Prepaid expenses and other (includes prepaid expenses and other of consolidated VIEs of $0 and $0.4 million as of March 31, 2021 and December 31, 2020, respectively) | 26.8 | | | 28.0 | |
| Property and equipment, net | 57.6 | | | 59.7 | |
| Investment in Katapult | 27.9 | | | 27.4 | |
| Right of use asset - operating leases | 112.3 | | | 115.0 | |
| Deferred tax assets | 1.5 | | | — | |
| Goodwill and Intangibles, net | 273.9 | | | 176.5 | |
| | | |
| Other assets | 9.1 | | | 8.6 | |
| | | |
| Total Assets | $ 1,407.6 | | | $ 1,183.0 | |
| LIABILITIES AND STOCKHOLDERS' EQUITY |
| Liabilities | | | |
Accounts payable and accrued liabilities (includes accounts payable and accrued liabilities of consolidated VIEs of $8.0 million and $34.1 million as of March 31, 2021 and December 31, 2020, respectively) | $ 67.6 | | | $ 49.6 | |
| Deferred revenue | 5.5 | | | 5.4 | |
| Lease liability - operating leases | 119.1 | | | 122.6 | |
| Contingent consideration related to acquisition | 20.6 | | | — | |
| Income taxes payable | 0.3 | | | — | |
Accrued interest (includes accrued interest of consolidated VIEs of $1.2 million and $1.1 million as of March 31, 2021 and December 31, 2020, respectively) | 5.9 | | | 20.1 | |
| Liability for losses on CSO lender-owned consumer loans | 4.7 | | | 7.2 | |
| | | |
Debt (includes debt and issuance costs of consolidated VIEs of $331.9 million and $12.2 million as of March 31, 2021 and $147.4 million and $7.8 million as of December 31, 2020, respectively) | 1,000.2 | | | 819.7 | |
| | | |
| Other long-term liabilities | 15.2 | | | 15.4 | |
| Deferred tax liabilities | 8.3 | | | 11.0 | |
| | | |
| Total Liabilities | $ 1,247.5 | | | $ 1,051.1 | |
| | | |
| Stockholders' Equity | | | |
| | | |
| | | |
| | | |
| | | |
| | | |
| | | |
| Total Stockholders' Equity | $ 160.2 | | | $ 131.9 | |
| Total Liabilities and Stockholders' Equity | $ 1,407.6 | | | $ 1,183.0 | |
Balance Sheet Changes - March 31, 2021 Compared to December 31, 2020
Cash and cash equivalents - The decrease in Cash from December 31, 2020 was primarily due to the acquisition of Flexiti, partially offset by lower demand for loan products due to seasonality and impacts from COVID-19, including the first quarter U.S. government stimulus.
Restricted cash - The increase in Restricted cash from December 31, 2020 was primarily due to our Non-Recourse U.S. SPV Facility, our new Non-Recourse Flexiti SPE Facility entered into as part of our acquisition in March 2021, and growth in Revolve and Opt+ products.
Gross loans receivable and Allowance for loan losses - The increase in Gross loans receivable from December 31, 2020 was primarily due to the acquisition of Flexiti, which accounted for $201.5 million of gross loans receivable as of March 31, 2021, and growth in the Canada Direct Lending Revolving LOC loans. The increase was partially offset by a decline in the U.S. As noted in "Consolidated Loans Receivable" and "Portfolio Performance Analysis" above, changes in Gross loans receivable and related ALL were due to expected lower customer demand and loan origination volumes as a result of COVID-19 impacts, including the 2021 U.S. government stimulus.
Goodwill and Intangible Assets - The increases in Goodwill and Intangible assets from December 31, 2020 were due to our acquisition of Flexiti on March 10, 2021, which resulted in $95.5 million of goodwill and intangible assets as of March 31, 2021.
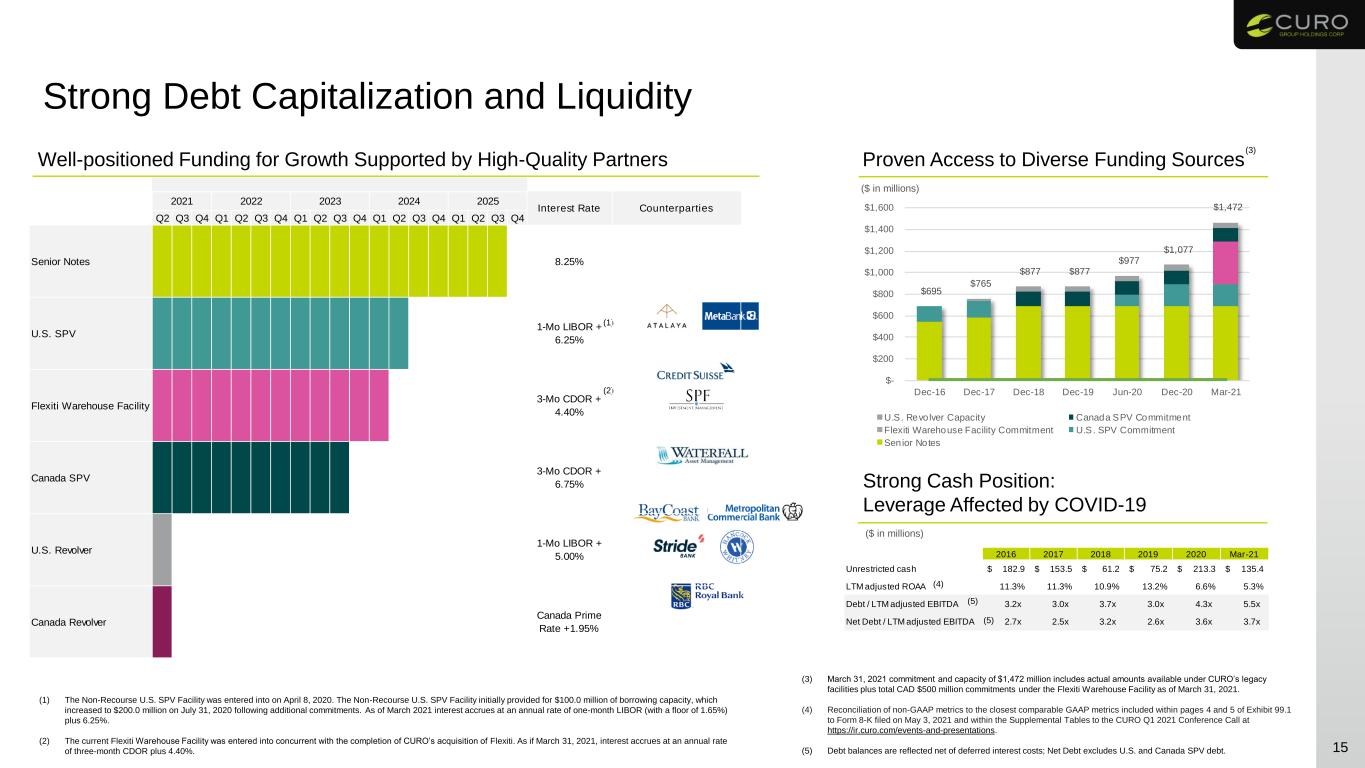
Accrued Interest - The decrease in accrued interest from December 31, 2020 is primarily due to interest payments on our 8.25% Senior Secured Notes, which are due semi-annually on September 1 and March 1.
Contingent Consideration related to acquisition - The acquisition of Flexiti on March 10, 2021 included an up-front purchase price as well as a cash earn-out of up to approximately $32.8 million. The cash earn-out is recorded at fair value based on discounted expected cash flows and remeasured quarterly.
Liability for losses on CSO lender-owned consumer loans - As noted in "U.S. Portfolio Performance Analysis" above, changes in Liability for losses on CSO lender-owned consumer loans were due to expected lower customer demand and loan origination volumes as a result of COVID-19.
Debt Capitalization Summary
(in millions, net of deferred financing costs)
| | | | | | | | | | | | | | | | | | | | |
| | Capacity | Interest Rate | Maturity | Counter-parties | Balance as of March 31, 2021 (in USD) |
| | | | | | |
| | | | | | |
Non-Recourse Canada SPV Facility (1) | | C$175.0 million | 3-Mo CDOR + 6.75% | September 2, 2023 | Waterfall Asset Management | $ 97.3 | |
| Senior Secured Revolving Credit Facility | | $50.0 million | 1-Mo LIBOR + 5.00% | June 30, 2021 | BayCoast Bank; Stride Bank; Hancock-Whitney Bank; Metropolitan Commercial Bank | — | |
| | | | | | |
| | | | | | |
| | | | | | |
| Non-Recourse U.S. SPV Facility | | $200.0 million | 1-Mo LIBOR + 6.25%(2) | April 8, 2024 | Atalaya Capital Management, MetaBank | 44.0 | |
Non-Recourse Flexiti SPE Facility (1)(3) | | C$500.0 million | 3-Mo CDOR + 4.40% | March 10, 2024 | Credit Suisse (Class A); SPF (Class B) | 178.4 | |
Cash Money Revolving Credit Facility (1) | | C$10.0 million | Canada Prime Rate +1.95% | On-demand | Royal Bank of Canada | — | |
| 8.25% Senior Secured Notes (due 2025) | | $690.0 million | 8.25% | September 1, 2025 | | 680.4 | |
| (1) Capacity amounts are denominated in Canadian dollars, while outstanding balances as of March 31, 2021 are denominated in U.S. dollars. |
|
(2) The Non-Recourse U.S. SPV Facility initially provided for $100.0 million of borrowing capacity, which increased to $200.0 million on July 31, 2020 following additional commitments. As a result of the increase in commitments, interest now accrues at an annual rate of one-month LIBOR (with a floor of 1.65%) plus the lesser of (i) 6.95% and (ii) the sum of (a) 6.25% on balances up to $145.5 million and (b) 9.75% on balances greater than $145.5 million. |
| (3) The current Non-Recourse Flexiti SPE Facility was entered into concurrent with the Flexiti acquisition. Interest accrues at an annual rate of three-month CDOR plus 4.40%. |
Non-GAAP Financial Measures
In addition to the financial information prepared in conformity with U.S. GAAP, we provide certain “non-GAAP financial measures,” including:
•Adjusted Net Income and Adjusted Earnings Per Share, or the Adjusted Earnings Measures (net income from continuing operations plus or minus certain legal and other costs, income or loss from equity method investment, goodwill and intangible asset impairments, transaction-related costs, share-based compensation, intangible asset amortization, certain tax adjustments and impacts from tax law changes and cumulative tax effect of applicable adjustments, on a total and per share basis);
•EBITDA (earnings before interest, income taxes, depreciation and amortization);
•Adjusted EBITDA (EBITDA plus or minus certain non-cash and other adjusting items);
•Adjusted effective income tax rate (effective tax rate plus or minus certain non-cash and other adjusting items); and
•Gross Combined Loans Receivable (includes loans originated by third-party lenders through CSO programs which are not included in the Consolidated Financial Statements).
We believe that presentation of non-GAAP financial information is meaningful and useful in understanding the activities and business metrics of the Company's operations. We believe that these non-GAAP financial measures reflect an additional way of viewing aspects of the business that, when viewed with the Company's U.S. GAAP results, provide a more complete understanding of factors and trends affecting the business.
We believe that investors regularly rely on non-GAAP financial measures, such as Adjusted Net Income, Adjusted Earnings per Share, EBITDA and Adjusted EBITDA, to assess operating performance and that such measures may highlight trends in the business that may not otherwise be apparent when relying on financial measures calculated in accordance with U.S. GAAP. In addition, we believe that the adjustments shown above are useful to investors in order to allow them to compare our financial results during the periods shown without the effect of each of these income or expense items. In addition, we believe that Adjusted Net Income, Adjusted Earnings per Share, EBITDA and Adjusted EBITDA are frequently used by securities analysts, investors and other interested parties in the evaluation of public companies in our industry, many of which present Adjusted Net Income, Adjusted Earnings per Share, EBITDA and/or Adjusted EBITDA when reporting their results.
In addition to reporting loans receivable information in accordance with U.S. GAAP, we provide Gross Combined Loans Receivable consisting of owned loans receivable plus loans originated by third-party lenders through the CSO programs, which we guarantee but do not include in the Condensed Consolidated Financial Statements. Management believes this analysis provides investors with important information needed to evaluate overall lending performance.
We provide non-GAAP financial information for informational purposes and to enhance understanding of the U.S. GAAP Consolidated Financial Statements. Adjusted Net Income, Adjusted Earnings per Share, EBITDA, Adjusted EBITDA and Gross Combined Loans Receivable should not be considered as alternatives to income from continuing operations, segment operating income, or any other performance measure derived in accordance with U.S. GAAP, or as an alternative to cash flows from operating activities or any other liquidity measure derived in accordance with U.S. GAAP. Readers should consider the information in addition to, but not instead of or superior to, the financial statements prepared in accordance with U.S. GAAP. This non-GAAP financial information may be determined or calculated differently by other companies, limiting the usefulness of those measures for comparative purposes.
Description and Reconciliations of Non-GAAP Financial Measures
Adjusted Net Income, Adjusted Earnings per Share, EBITDA and Adjusted EBITDA Measures have limitations as analytical tools, and you should not consider these measures in isolation or as a substitute for analysis of our income or cash flows as reported under U.S. GAAP. Some of these limitations are:
•they do not include cash expenditures or future requirements for capital expenditures or contractual commitments;
•they do not include changes in, or cash requirements for, working capital needs;
•they do not include the interest expense, or the cash requirements necessary to service interest or principal payments on debt;
•depreciation and amortization are non-cash expense items reported in the statements of cash flows; and
•other companies in our industry may calculate these measures differently, limiting their usefulness as comparative measures.
We calculate Adjusted Earnings per Share utilizing diluted shares outstanding at year-end. If the Company records a loss from continuing operations under U.S. GAAP, shares outstanding utilized to calculate Diluted Earnings per Share from continuing operations are equivalent to basic shares outstanding. Shares outstanding utilized to calculate Adjusted Earnings per Share from continuing operations reflect the number of diluted shares the Company would have reported if reporting net income from continuing operations under U.S. GAAP.
As noted above, Gross Combined Loans Receivable includes loans originated by third-party lenders through CSO programs which are not included in the consolidated financial statements but from which we earn revenue and for which we provide a guarantee to the lender. Management believes this analysis provides investors with important information needed to evaluate overall lending performance.
We believe Adjusted Net Income, Adjusted Earnings per Share, EBITDA and Adjusted EBITDA are used by investors to analyze operating performance and to evaluate our ability to incur and service debt and the capacity for making capital expenditures. Adjusted EBITDA is also useful to investors to help assess our estimated enterprise value. The computation of Adjusted EBITDA as presented in this release may differ from the computation of similarly-titled measures provided by other companies.
Forward-Looking Statements
This press release contains forward-looking statements. These forward-looking statements include projections, estimates and assumptions about our ability to drive revenue growth and create long-term shareholder value; the expected timing impact of the Katapult merger and its impact on us, including the potential value we expect to receive, the mix of cash and stock, potential earn out, and resulting ownership position and our cash tax liability; the expected timing of the Katapult merger; the expected financial and operational benefits of our acquisition of Flexiti Financial; the run-off of Verge loan balances and our belief in the usefulness of the various non-GAAP financial measures used in this release. In addition, words such as “guidance,” “estimate,” “anticipate,” “believe,” “forecast,” “step,” “plan,” “predict,” “focused,” “project,” “is likely,” “expect,” “intend,” “should,” “will,” “confident,” variations of such words and similar expressions are intended to identify forward-looking statements. Our ability to achieve these forward-looking statements is based on certain assumptions, judgments and other factors, both within and outside of our control, that could cause actual results to differ materially from those in the forward-looking statements, including: the inability of the parties to the Katapult transaction to successfully or timely consummate the proposed business combination, including the risk that any required
regulatory approvals are not obtained, are delayed or are subject to unanticipated conditions that could adversely affect the combined company or the expected benefits of the proposed transaction or that the approval of FinServ stockholders is not obtained; failure to realize the anticipated benefits of the proposed Katapult transaction; risks relating to the uncertainty of projected financial information with respect to Katapult; the effects of competition on Katapult’s future business; Katapult’s the ability to attract and retain customers; market, financial, political and legal conditions; the impact of COVID-19 pandemic on us, our investments Katapult’s and our business and the global economy; risks related to the concentration of Katapult’s business among a relatively small number of merchants; the ability of FinServ or the combined company to issue equity or equity-linked securities or obtain debt financing in connection with the proposed business combination or in the future; our dependence on third-party lenders to provide the cash we need to fund our loans and our ability to affordably access third-party financing; errors in our internal forecasts; our level of indebtedness; our ability to integrate acquired businesses; our dependence on third-party lenders to provide the cash we need to fund our loans and our ability to affordably access third-party financing; actions of regulators and the negative impact of those actions on our business; our ability to protect our proprietary technology and analytics and keep up with that of our competitors; disruption of our information technology systems that adversely affect our business operations; ineffective pricing of the credit risk of our prospective or existing customers; inaccurate information supplied by customers or third parties that could lead to errors in judging customers’ qualifications to receive loans; improper disclosure of customer personal data; failure of third parties who provide products, services or support to us; any failure of third-party lenders upon whom we rely to conduct business in certain states; disruption to our relationships with banks and other third-party electronic payment solutions providers; disruption caused by employee or third-party theft and errors in our stores as well as other factors discussed in our filings with the Securities and Exchange Commission. These projections, estimates and assumptions may prove to be inaccurate in the future. These forward-looking statements are not guarantees of future performance and involve known and unknown risks and uncertainties that are difficult to predict with regard to timing, extent, likelihood and degree of occurrence. There may be additional risks that CURO presently does not know or that it currently believes are immaterial that could also cause actual results to differ from those contained in the forward-looking statements. Given these risks and uncertainties, investors should not place undue reliance on forward-looking statements as a prediction of actual future results. We undertake no obligation to update, amend or clarify any forward-looking statement for any reason.
About CURO
CURO Group Holdings Corp. (NYSE: CURO), serves the evolving needs of the financial consumer. In 1997, the Company was founded in Riverside, California by three Wichita, Kansas childhood friends to meet the growing consumer need for short-term loans. Their success led to opening stores across the United States, later expanding to offer online loans and financial services in the United States and Canada and now broadening into a full-spectrum consumer lender through the point-of-sale / buy-now-pay-later channel. CURO combines its market expertise with a fully integrated technology platforms, an omni-channel approach and advanced credit decisioning to provide an array of credit products across all mediums. CURO operates under a number of brands including Speedy Cash®, Rapid Cash®, Cash Money®, LendDirect®, Flexiti®, Avío Credit®, Opt+® and Revolve Finance®. With over 20 years of operating experience, CURO provides financial freedom to non-prime consumers.
Conference Call
CURO will host a conference call to discuss these results at 8:15 a.m. Eastern Time on Tuesday, May 4, 2021. The live webcast of the call can be accessed at the CURO Investor Relations website at http://ir.curo.com/.
You may access the call at 1-866-807-9684 (1-412-317-5415 for international callers). Please ask to join the CURO Group Holdings call. A replay of the conference call will be available until May 11, 2021, at 8:15 a.m. Eastern Time. An archived version of the webcast will be available on the CURO Investors website for 90 days. You may access the conference call replay at 1-877-344-7529 (1-412-317-0088 for international callers). The replay access code is 10155812.
Final Results
The financial results presented and discussed herein are on a preliminary and unaudited basis; final unaudited data will be included in the Company’s Quarterly Report on Form 10-Q for the three months ended March 31, 2021.
Investor Relations:
Roger Dean
Executive Vice President and Chief Financial Officer
Phone: 844-200-0342
Or
Financial Profiles, Inc.
(CURO-NWS)