CURO GROUP HOLDINGS CORP.
Restricted Stock Unit Grant Notice
CURO Group Holdings Corp. (the “Company”), pursuant to its 2017 Incentive Plan, as amended from time-to-time (the “Plan”), hereby grants to Participant Restricted Stock Units for the number of shares of the Company’s common stock set forth below. The Restricted Stock Units are subject to all of the terms and conditions as set forth in this Restricted Stock Unit Grant Notice (this “Grant Notice”), in the Restricted Stock Unit Award Agreement (attached hereto as Attachment I) and the Plan (attached hereto as Attachment II), both of which are incorporated herein in their entirety. Capitalized terms not explicitly defined herein but defined in the Plan or the Restricted Stock Unit Award Agreement will have the same definitions as in the Plan or the Restricted Stock Unit Award Agreement. If there is any conflict between the terms in this Grant Notice and the Plan, the terms of the Plan will control.
Name of Participant: _____________________________________
Date of Grant: _____________________________________
Time Based Vesting Commencement Date: _____________________________________
Performance Period: January 1, 2021 ending on December 31, 2023
Number of Restricted Stock Units: _____________________________________
Vesting Schedule: Time-Based Vesting: One-half of the Award is subject to time-based vesting. Provided that the Participant has not experienced a Termination prior to such date, on each of the first, second and third anniversaries of the Time-Based Vesting Commencement Date (which is the day immediately prior to the grant date), a total of one-sixth of the Restricted Stock Units shall vest.
Performance-Based Vesting: One-half of the Award is subject to performance-based vesting over a period of 36 months, beginning on January 1, 2021 and ending on December 31, 2023 (“Performance Period”). The performance metric shall be relative total shareholder return of the Company for the Performance Period compared to that of the Company’s designated peer group, with a performance target (“Performance Target”) determined by the Company. Upon conclusion of the Performance Period, provided that the Participant has not experienced a Termination prior to such date, one-half of the Award will vest based on achievement of the Performance Target at the levels identified in the table below. The Performance Target is as follows:
If the Company’s total shareholder return for the Performance Period is at or above the percentiles (identified in the table below) of the total shareholder return among the Company’s peer group for the Performance Period, the Performance Target will be met for that level of performance. As shown in the table below, payouts for achievement between threshold, target, and maximum performance levels are linearly interpolated.
| | | | | | | | |
| Relative TSR | % of Target Achievement | Shares Earned as % of Target Achievement |
Maximum - 67th percentile | 133% | 125% |
> 50th percentile to 67th percentile | 100.1% to 132.9% | 100% plus a number of shares calculated on a pro rata basis (based on the amount by which Relative TRS exceeds 100% of Target Relative TSR) |
Target - 50th percentile | 100% | 100% |
> 33rd percentile to 49th percentile |
67.1% to 99.9% | 75% plus a number of shares calculated on a pro rata basis (based on the amount by which Relative TSR exceeds 67% of Target Relative TSR) |
Threshold - 33rd percentile | 67% | 75% |
< 33rd percentile | Less than 67% | None |
Calculation of TSR: The TSR for the start of the Performance Period shall use the average of the closing price as of December 31, 2020 and for the trailing 19 trading days and the TSR for the end of the Performance Period shall use the average of the closing price as of December 31, 2023 and for the trailing 19 trading days.
Company Peer Group: For purposes of the Performance Target, the Company’s designated peer group consists of the following companies:
The Aaron’s Company, Inc. Conn’s
Credit Acceptance Corporation Elevate Credit
Encore Capital Group Enova International
EZ Corp FirstCash Financial Services, Inc.
Green Dot Corporation GreenSky LLC
H&R Block, Inc. Lending Club
OneMain Holdings PRA Group, Inc.
World Acceptance Corporation
If, during the Performance Period, any company in the peer group merges out of existence, ceases to be a reporting company under the Exchange Act or for other similar reasons in the judgment of the Committee ceases to provide a meaningful basis for comparison of shareholder return, such company will be removed from the peer group.
Issuance Schedule: Subject to any change in respect of a capitalization adjustment (as provided in Section 11 of the Plan), one share of Stock will be issued for each Restricted Stock Unit that vests at the time set forth in Section 6 of the Award Agreement.
Restrictive Covenants: As a condition of the grant of Restricted Stock Units hereunder, the undersigned Participant hereby affirms all confidentiality, non-interference, invention assignment or similar covenants previously made by the Participant in favor of the Company however made and acknowledges that such covenants are independent obligations of the Participant (such covenants, the “Restrictive Covenants”). The Participant hereby acknowledges and agrees that this Grant Notice and the Restrictive Covenants are considered separate agreements, and the Restrictive Covenants will survive the termination of this Grant Notice for any reason.
Additional Terms/Acknowledgements: By signing below or, if applicable, electronically accepting this Restricted Stock Unit Award, the undersigned Participant acknowledges having received and reviewed in their entirety, and fully understands and agrees to all provisions of this Grant Notice, the Restricted Stock Unit Award Agreement, the Plan and the Restrictive Covenants. Participant acknowledges and agrees that this Grant Notice and the Restricted Stock Unit Award Agreement may not be modified, amended or revised except as provided in the Plan. Participant further acknowledges that, as of the Date of Grant, this Grant Notice, the Restricted Stock Unit Award Agreement, the Plan and the Restrictive Covenants set forth the entire agreement and understanding between Participant and the Company regarding the acquisition of Stock pursuant to the Award specified above and supersede all prior oral and written agreements, promises and/or representations on that subject with the exception of (i) Restricted Stock Units previously granted and delivered to the Participant, (ii) any compensation recoupment policy that is adopted by the Company or is otherwise required by applicable law, and (iii) any written employment or severance arrangement that would provide for vesting acceleration of this Restricted Stock Unit Award upon the terms and conditions set forth therein. By accepting this Restricted Stock Unit Award, Participant consents to receive such documents by electronic delivery and to participate in the Plan through an on-line or electronic system established and maintained by the Company or another third party designated by the Company.
Withholding Tax Election. Withholding Taxes shall be satisfied as provided in Section 10(a) of the Restricted Stock Unit Award Agreement attached hereto as Attachment I.
This award of Restricted Stock Units is subject to the Participant’s signing a copy of this Grant Notice. The Participant shall forfeit the Restricted Stock Units if the Participant does not execute this Grant Notice or otherwise accept the Restricted Stock Units within 60 days of the Date of Grant, unless waived by the Company.
| | | | | | | | | | | | | | |
| CURO GROUP HOLDINGS CORP | | PARTICIPANT |
| By: | | | By: | |
| Signature | | | Signature |
| Title: | | | Title: | |
| Date: | | | | |
Attachment I
CURO Group Holdings Corp.
Restricted Stock Unit Award Agreement
Pursuant to the Restricted Stock Unit Grant Notice (the “Grant Notice”) and this Restricted Stock Unit Award Agreement (this “Agreement”), CURO Group Holdings Corp., a Delaware corporation (the “Company”) has granted you Restricted Stock Units (this “Award”) under its 2017 Incentive Plan (the “Plan”) for the number of Restricted Stock Units indicated in the Grant Notice.
If there is any conflict between the terms in this Agreement and the Plan, the terms of the Plan will control. Capitalized terms not explicitly defined in this Agreement or in the Grant Notice but defined in the Plan will have the same definitions as in the Plan.
The details of your Restricted Stock Unit Award, in addition to those set forth in the Grant Notice and the Plan, are as follows:
1.Grant of the Award. This Award represents the right to be issued on a future date one (1) share of Stock for each Restricted Stock Unit that vests on the applicable vesting date(s) (subject to any adjustment under Section 3 below) as indicated in the Grant Notice. As of the Date of Grant, the Company will credit to a bookkeeping account maintained by or on behalf of the Company for your benefit (the “Account”) the number of Restricted Stock Units subject to the Award. This Award was granted in consideration of your services to the Company.
2.Vesting. Subject to the limitations contained herein, your Award will vest as provided in your Grant Notice. Vesting will cease upon your Termination. Upon such Termination, the Restricted Stock Units credited to the Account that were not vested on the date of such Termination will be forfeited at no cost to the Company and you will have no further right, title or interest in or to such underlying shares of Stock.
3.Number of Shares. The number of Restricted Stock Units subject to your Award may be adjusted from time to time for capitalization adjustments, as provided in Section 11 of the Plan. Any additional Restricted Stock Units, shares, cash or other property that becomes subject to the Award pursuant to this Section 3, if any, shall be subject, in a manner determined by the Board, to the same forfeiture restrictions, restrictions on transferability, and time and manner of delivery as applicable to the other Restricted Stock Units covered by your Award. Notwithstanding the provisions of this Section 3, no fractional shares or rights for fractional shares of Stock shall be created pursuant to this Section 3. Any fraction of a share will be rounded down to the nearest whole share.
4.Securities Law Compliance. You may not be issued any shares of Stock under your Award unless the shares of Stock underlying the Restricted Stock Units are then registered under the Securities Act or, if not registered, the Company has determined that such issuance of the shares would be exempt from the registration requirements of the Securities Act. The issuance of shares of Stock must also comply with all other applicable laws and regulations governing the Award, and you shall not receive such Stock if the Company determines that such receipt would not be in material compliance with such laws and regulations.
5.Transfer Restrictions. Prior to the time that shares of Stock have been delivered to you, you may not transfer, pledge, sell or otherwise dispose of this Award or the shares issuable in respect of your Award, except as expressly provided in this Section 5. For example, you may not use shares that may be issued in respect of your Restricted Stock Units as security for a loan. The restrictions on transfer set forth herein will lapse upon delivery to you of shares in respect of your vested Restricted Stock Units.
a.Domestic Relations Orders. Upon receiving written permission from the Board or its duly authorized designee, and provided that you and the designated transferee enter into transfer and other agreements required by the Company, you may transfer your right to receive the distribution of Stock or other
consideration hereunder, pursuant to the terms of a domestic relations order, official marital settlement agreement or other divorce or separation instrument as permitted by Treasury Regulation 1.421-1(b)(2) that contains the information required by the Company to effectuate the transfer. You are encouraged to discuss the proposed terms of any division of this Award with the Company prior to finalizing the domestic relations order or marital settlement agreement to help ensure the required information is contained within the domestic relations order or marital settlement agreement.
b.Beneficiary Designation. Upon receiving written permission from the Board or its duly authorized designee, you may, by delivering written notice to the Company, in a form approved by the Company, designate a third party who, on your death, will thereafter be entitled to receive the shares issuable in respect of your Award. In the absence of such a designation, your executor or administrator of your estate will be entitled to receive any Stock or other consideration that vested but was not issued before your death.
6.Date of Issuance.
a.In the event one or more Restricted Stock Units vests, the Company shall issue to you one (1) share of Stock for each Restricted Stock Unit that vests on the applicable vesting date(s) (subject to any adjustment under Section 3 above). The issuance date determined by this paragraph is referred to as the “Original Issuance Date.”
b.If the Original Issuance Date falls on a date that is not a business day, delivery shall instead occur on the next following business day.
c.The form of delivery (e.g., a stock certificate or electronic entry evidencing such shares) shall be determined by the Company.
7.Dividends. You shall be entitled to any cash dividends, stock dividends or other distribution declared that you would have received had your Restricted Stock Units been actual shares of Stock on the date of such distribution; provided, however, that the Company will retain custody of all dividends and distributions, if any (“Retained Distributions”)(and such Retained Distributions shall be subject to forfeiture and the same restrictions, terms and vesting and other conditions as are applicable to the Restricted Stock Units) until such time, if ever, as the Restricted Stock Units with respect to which such Retained Distributions shall have been made, paid or declared shall have become vested, and such Retained Distributions shall not bear interest or be segregated in a separate account. Any applicable Retained Distributions shall be delivered to you as soon as practicable following each applicable vesting date.
8.Restrictive Legends. The shares of Stock issued under your Award shall be endorsed with appropriate legends as determined by the Company.
9.Award Not a Service Contract. This Agreement is not an employment or service contract, and nothing in this Agreement will be deemed to create in any way whatsoever any obligation on your part to continue in the service of the Company or an Affiliate, or of the Company or an Affiliate to continue your service. In addition, nothing in this Agreement will obligate the Company or an Affiliate, their respective stockholders, boards of directors, officers or employees to continue any relationship that you might have as an employee, director of or consultant for the Company or an Affiliate.
10.Withholding Obligations.
a.On or before the time you receive a distribution of the shares of Stock underlying your Award, and at any other time as reasonably requested by the Company in accordance with applicable tax laws, you hereby agree to make adequate provision for any sums required to satisfy the federal, state, local and foreign tax withholding obligations of the Company or any Affiliate that arise in connection with your Award (the “Withholding Taxes”) measured based on the Fair Market Value of such shares of Stock as of the trading day immediately preceding the day shares of Stock are issued to you pursuant to Section 6. The Company or any Affiliate may, in the discretion of the Company, satisfy all or any portion of the Withholding Taxes obligation relating to your Award by any of the following means or by a combination of such means: (i) causing you to sell that portion of the shares of Stock to be delivered pursuant to your Award necessary to generate a cash payment sufficient to satisfy the
Withholding Taxes, and to remit such cash payment to the Company, or (ii) withholding shares of Stock from the shares of Stock issued or otherwise issuable to you in connection with the Award with a Fair Market Value (measured as of the date shares of Stock are issued to pursuant to Section 6) equal to the amount of such Withholding Taxes. Alternatively, at your option, you may elect to remit a cash payment to the Company equal to the full amount of such Withholding Taxes. Notwithstanding the foregoing, the number of such shares of Stock sold or withheld pursuant to clause (i) or (ii), or the amount of any cash payment tendered to the Company to satisfy such Withholding Taxes, will not exceed the amount necessary to satisfy the Company’s required tax withholding obligations using appropriate withholding rates for federal, state, local and foreign tax purposes, including payroll taxes, as determined by the Company.
b.Unless the tax withholding obligations of the Company and/or any Affiliate are satisfied, the Company shall have no obligation to deliver to you any shares of Stock.
c.In the event the Company’s obligation to withhold arises prior to the delivery to you of shares of Stock or it is determined after the delivery of shares of Stock to you that the amount of the Company’s withholding obligation was greater than the amount withheld by the Company, you agree to indemnify and hold the Company harmless from any failure by the Company to withhold the proper amount.
11.Tax Consequences. You hereby agree that the Company does not have a duty to design or administer the Plan or its other compensation programs in a manner that minimizes your tax liabilities. You will not make any claim against the Company, or any of its officers, directors, employees or Affiliates related to tax liabilities arising from your Award or your other compensation.
12.Notices. Any notices provided for in your Award or the Plan will be given in writing (including electronically) and will be deemed effectively given upon receipt or, in the case of notices delivered by mail by the Company to you, five (5) days after deposit in the United States mail, postage prepaid, addressed to you at the last address you provided to the Company. The Company may, in its sole discretion, decide to deliver any documents related to participation in the Plan and this Award by electronic means or to request your consent to participate in the Plan by electronic means. By accepting this Award, you consent to receive such documents by electronic delivery and to participate in the Plan through an on-line or electronic system established and maintained by the Company or another third party designated by the Company.
13.Unsecured Obligation. Your Award is unfunded, and as a holder of a vested Award, you shall be considered a general, unsecured creditor of the Company with respect to the Company’s obligation, if any, to issue shares or other property pursuant to this Agreement.
14.Governing Plan Document. Your Award is subject to all the provisions of the Plan, the provisions of which are hereby made a part of your Award, and is further subject to all interpretations, amendments, rules and regulations which may from time to time be promulgated and adopted pursuant to the Plan. If there is any conflict between the provisions of your Award and those of the Plan, the provisions of the Plan will control. In addition, your Award (and any compensation paid or shares issued under your Award) is subject to recoupment in accordance with The Dodd–Frank Wall Street Reform and Consumer Protection Act and any implementing regulations thereunder, any clawback policy adopted by the Company, any compensation recovery policy otherwise required by applicable law, and any stock ownership guidelines adopted by the Company from time to time.
15.Other Documents. You hereby acknowledge receipt of and the right to receive a document providing the information required by Rule 428(b)(1) promulgated under the Securities Act, which includes the Plan prospectus. In addition, you acknowledge receipt of the Company’s policy permitting certain individuals to sell shares only during certain “open window” periods under, and as otherwise permitted by, the Company’s insider trading policy, in effect from time to time.
16.Effect On Other Employee Benefit Plans. The value of this Award will not be included as compensation, earnings, salaries, or other similar terms used when calculating your benefits under any employee benefit plan sponsored by the Company or any Affiliate, except as such plan otherwise expressly provides. The
Company expressly reserves its rights to amend, modify, or terminate any of the Company’s or any Affiliate’s employee benefit plans.
17.Voting Rights. You will not have voting or any other rights as a stockholder of the Company with respect to the shares of Stock to be issued pursuant to this Award until such shares are issued to you. Upon such issuance, you will obtain full voting and other rights as a stockholder of the Company. Nothing contained in this Award, and no action taken pursuant to its provisions, will create or be construed to create a trust of any kind or a fiduciary relationship between you and the Company or any other person.
18.Severability. If all or any part of this Agreement or the Plan is declared by any court or governmental authority to be unlawful or invalid, such unlawfulness or invalidity will not invalidate any portion of this Agreement or the Plan not declared to be unlawful or invalid. Any Section of this Agreement (or part of such a Section) so declared to be unlawful or invalid shall, if possible, be construed in a manner which will give effect to the terms of such Section or part of a Section to the fullest extent possible while remaining lawful and valid.
19.Miscellaneous.
a.The rights and obligations of the Company under your Award will be transferable to any one or more persons or entities, and all covenants and agreements hereunder will inure to the benefit of, and be enforceable by, the Company’s successors and assigns.
b.You agree upon request to execute any further documents or instruments necessary or desirable in the sole determination of the Company to carry out the purposes or intent of your Award.
c.You acknowledge and agree that you have reviewed your Award in its entirety, have had an opportunity to obtain the advice of counsel prior to executing and accepting your Award and fully understand all provisions of your Award.
d.This Agreement will be subject to all applicable laws, rules, and regulations, and to such approvals by any governmental agencies or national securities exchanges as may be required.
e.All obligations of the Company under the Plan and this Agreement will be binding on any successor to the Company, whether the existence of such successor is the result of a direct or indirect purchase, merger, consolidation, or otherwise, of all or substantially all of the business and/or assets of the Company.
* * *
This Restricted Stock Unit Award Agreement will be deemed to be signed by you upon the signing by you of the Restricted Stock Unit Grant Notice to which it is attached.
CURO Group Holdings Corp. Announces
Fourth Quarter and Full Year 2020 Financial Results
Wichita, Kansas--February 4, 2021-CURO Group Holdings Corp. (NYSE: CURO) (“CURO” or the “Company”), a market leader in providing credit to non-prime consumers, today announced financial results for its fourth quarter ended December 31, 2020.
“After being tested on many levels in 2020, we ended the year encouraged by our employees' resiliency and cautiously optimistic about our opportunities for 2021 and beyond,” said Don Gayhardt, President and Chief Executive Officer. “In the fourth quarter of 2020, we delivered quarterly sequential loan balance growth of 11.3% compared to 1.6% quarterly sequential growth in the fourth quarter of 2019. While overall loan balances finished the year 19.5% below prior year levels (11.7% excluding regulatory-impacted California installment loans), loan balances in Canada increased 9.2% on the year. Despite COVID-19 impacts that lowered loan demand and balances after the first quarter, historically good credit performance and strict expense management allowed us to post solid quarterly earnings for all of 2020 while significantly increasing cash and liquidity levels.”
“As we announced in December, we also unlocked significant shareholder value from our $27.5 million investment in Katapult, a leading e-commerce FinTech platform focused on non-prime consumers. On December 18, 2020, Katapult announced its merger with FinServ Acquisition Corp. (Nasdaq: FSRV), a special purpose acquisition company, as the first step towards becoming a separate, publicly traded company, expected in a few months. Under the terms of Katapult's merger with FinServ, at that time we expect to receive up to $130 million in cash and retain at least 21% ownership of the new public company. This transaction will increase our balance sheet flexibility while maintaining a meaningful equity stake and board representation in Katapult. Based on the market value of FSRV shares as of February 3rd, the total value of CURO’s stake is over $500 million, including earn-out shares, before taxes.”
“Then, as we announced earlier this week, we agreed to acquire Flexiti Financial, one of Canada’s fastest-growing POS/BNPL providers with a market-leading omni-channel FinTech platform. This acquisition enhances our value creation opportunities in Canada by allowing us to serve customers across all channels in which they access credit and with an expanded product set. It also increases CURO’s long-term growth profile and provides further product and geographical diversification.”
Consolidated Summary Results - Unaudited
| | | | | | | | | | | | | | | | | | | | | | | | | | |
| | Three Months Ended December 31,(1) | | For the Year Ended December 31,(1) |
| (in thousands, except per share data) | | 2020 | 2019 | Variance | | 2020 | 2019 | Variance |
| Revenue | | $ 202,078 | | $ 302,294 | | (33.2) | % | | $ 847,396 | | $ 1,141,797 | | (25.8) | % |
| Gross margin | | 68,591 | | 95,299 | | (28.0) | % | | 308,359 | | 378,616 | | (18.6) | % |
| Company Owned gross loans receivable | | 553,722 | | 665,828 | | (16.8) | % | | 553,722 | | 665,828 | | (16.8) | % |
| Unrestricted Cash | | 213,343 | | 75,242 | | 183.5 | % | | 213,343 | | 75,242 | | 183.5 | % |
| Net income | | 4,474 | | 30,218 | | (85.2) | % | | 75,733 | | 111,488 | | (32.1) | % |
Adjusted Net Income (2) | | 8,556 | | 34,793 | | (75.4) | % | | 74,328 | | 130,059 | | (42.9) | % |
| Diluted Earnings per Share from continuing operations | | $ 0.11 | | $ 0.68 | | (83.8) | % | | $ 1.77 | | $ 2.26 | | (21.7) | % |
Adjusted Diluted Earnings per Share (2) | | $ 0.20 | | $ 0.80 | | (75.0) | % | | $ 1.77 | | $ 2.83 | | (37.5) | % |
EBITDA (2) | | 31,063 | | 61,526 | | (49.5) | % | | 170,550 | | 230,848 | | (26.1) | % |
Adjusted EBITDA (2) | | 34,332 | | 67,534 | | (49.2) | % | | 187,363 | | 261,132 | | (28.2) | % |
| Weighted Average Shares — diluted | | 42,579 | | 43,243 | | | | 42,091 | | 45,974 | | |
| (1) Excludes discontinued operations; see "Results of Discontinued Operations" for additional details. |
|
| (2) These are non-GAAP metrics. For a reconciliation of each non-GAAP metric to the nearest GAAP metric, see the applicable reconciliations contained under "Results of Operations." For a description of each non-GAAP metric, see "Non-GAAP Financial Measures." |
|
|
Fourth quarter 2020 and recent developments include:
•Sequential increase (described within this release as the change from the third quarter to the fourth quarter) in Company Owned gross loans receivable and Gross combined loans receivable of $56.3 million, or 11.3%, and $60.6 million, or 11.3%, respectively, compared to $8.2 million, or 1.2%, and $11.8 million, or 1.6%, of sequential growth for the quarter ended December 31, 2019.
•Consolidated Company Owned net charge-off ("NCO") rate decline of 48.3%, or 760 basis points ("bps"), compared to the fourth quarter of 2019.
•Year-over-year reduction in loan balances from COVID-19 effects on customer demand and regulatory changes that became effective January 1, 2020 for Unsecured and Secured Installment loans in California. Company Owned gross loans receivable declined 7.4% in 2020 excluding affected loan portfolios in California.
•Revenue decrease of $100.2 million, or 33.2%, versus the prior-year period, due to the decrease in loan balances, as well as a mix shift toward Canada, where products average less revenue than the U.S.
•Net Revenue decrease of $39.8 million, or 23.1%, year over year, as the impact of lower NCO rates partially mitigated the negative effect of lower loan balances.
•Definitive merger agreement between Katapult Holdings, Inc. ("Katapult") and Finserv Acquisition Corp., ("FinServ"). On our total minority investment of $27.5 million, the merger is expected to provide us a combination of cash and stock consideration between $520 million and $540 million, based on current market prices and subject to FinServ shareholder redemptions. We expect our ownership stake in the resulting publicly traded entity to be no less than 21% of its fully diluted shares.
•Continued growth of our technology, marketing and servicing relationship for Verge Credit loans, issued and funded by a bank.
•Entered into an agreement to acquire Flexiti Financial Inc. ("Flexiti"), an emerging growth Canadian Point-of-Sale / Buy Now Pay Later ("POS/BNPL") provider. Under the terms of the agreement, CURO will acquire Flexiti for cash at closing of $85 million and contingent consideration of up to $36 million based on the achievement of risk-adjusted revenue and origination targets over the next two years.
•Diluted Earnings per Share from continuing operations decreased to $0.11 from $0.68. Adjusted Diluted Earnings per Share decreased to $0.20 compared to $0.80 for the fourth quarter of 2019.
•Our Board of Directors declared a $0.055 per share dividend payable on March 2, 2021 to stockholders of record as of February 16, 2021.
Full-year 2020 developments include:
•Revenue decrease of $294.4 million, or 25.8%, compared to the prior year, due to the aforementioned decrease in loan balances. California Installment revenues, which were impacted by January 1, 2020 regulatory changes, were $67.6 million for the year ended December 31, 2020, compared to $139.5 million for the year ended December 31, 2019.
•Net Revenue decline of $114.7 million, or 17.0%, and gross margin decline of $70.3 million, or 18.6%, year-over-year as the revenue decline was partially offset by lower provision expense.
•Diluted Earnings per Share from continuing operations of $1.77 compared to $2.26 in the prior year. Adjusted Diluted Earnings per Share of $1.77 compared to $2.83 for 2019.
•Ended the fourth quarter of 2020 with $213.3 million in cash and $310.5 million of liquidity (including undrawn capacity on revolving credit facilities, which is subject to continued collateral performance for the asset backed facilities and covenant compliance) compared to $75.2 million in cash and $187.8 million of liquidity at the end of 2019.
•On April 8, 2020, we announced the closing of a new Asset-Backed Revolving Credit Facility to provide financing for U.S. Unsecured Installment and Open-End loans. On July 31, 2020, we closed on additional commitments bringing the total borrowing capacity on the Non-Recourse U.S. SPV Facility up to $200.0 million, dependent upon the borrowing base of eligible collateral.
•Completion of our acquisition of Ad Astra Recovery Services, Inc. ("Ad Astra"), which had been our exclusive provider of third-party collection services for the U.S. business, on January 3, 2020.
•Implemented our COVID-19 Customer Care Program, which enables our team members to provide relief to customers affected by COVID-19 in various ways, ranging from due date extensions, interest or fee forgiveness, payment waivers or extended payment plans, depending on a customer’s individual circumstances. As of January 31, 2021, we have granted concessions on more than 84,000 loans, or 16% of our active loans, and waived over $6.0 million in payments and fees. We also temporarily suspended certain returned item fees.
•Instituted a cash dividend policy in the first quarter of 2020, with dividend payments made to stockholders in February, May, August and November 2020.
Throughout this release, we exclude financial results of our former U.K. operations for all periods presented, as they were discontinued for accounting and reporting purposes in February 2019. See “Results of Discontinued Operations” below for additional information.
The COVID-19 pandemic began to have a pervasive impact in March 2020. Year-over-year comparisons for the three months and year ended December 31, 2020 were impacted by factors related to COVID-19, such as lower consumer demand, increased or accelerated repayments and favorable payment trends as customers benefited from government stimulus programs at the start of the pandemic, our decision to tighten credit, favorable credit performance as a result of these factors, and our approach to managing expenses (collectively, "COVID-19 Impacts"). Sequential loan growth, transaction volume and the related financial results of operations for the three months ended December 31, 2020 were impacted positively by normal seasonality and selectively returning credit scoring to pre-COVID-19 levels, together with continued historically low delinquencies and NCO rates.
Consolidated Revenue by Product and Segment
The following table summarizes revenue by product, including credit services organization ("CSO") fees, for the period indicated:
| | | | | | | | | | | | | | | | | | | | | | | | | | | | | | | | | | |
| | Three Months Ended |
| | December 31, 2020 | | December 31, 2019 |
| (in thousands, unaudited) | | U.S. | Canada | | Total | % of Total | | U.S. | Canada | | Total | % of Total |
| Open-End | | $ 31,111 | | $ 31,962 | | | $ 63,073 | | 31.2 | % | | $ 43,278 | | $ 28,017 | | | $ 71,295 | | 23.6 | % |
| Unsecured Installment | | 77,733 | | 1,055 | | | 78,788 | | 39.0 | % | | 133,953 | | 1,658 | | | 135,611 | | 44.9 | % |
| Secured Installment | | 16,757 | | — | | | 16,757 | | 8.3 | % | | 28,690 | | — | | | 28,690 | | 9.5 | % |
| Single-Pay | | 17,409 | | 10,051 | | | 27,460 | | 13.6 | % | | 30,192 | | 19,652 | | | 49,844 | | 16.5 | % |
| Ancillary | | 3,578 | | 12,422 | | | 16,000 | | 7.9 | % | | 4,159 | | 12,695 | | | 16,854 | | 5.6 | % |
| Total revenue | | $ 146,588 | | $ 55,490 | | | $ 202,078 | | 100.0 | % | | $ 240,272 | | $ 62,022 | | | $ 302,294 | | 100.0 | % |
During the three months ended December 31, 2020, total revenue declined $100.2 million, or 33.2%, to $202.1 million, compared to the prior-year period. Geographically, U.S. and Canada revenues declined 39.0% and 10.5%, respectively. COVID-19 Impacts on year-over-year results for Canada were less than the U.S. due to the faster reopening of major markets and the continued popularity and growth of Open-End loans in Canada. Sequentially, total revenue increased $20.1 million, or 11.0%, primarily from sequential growth in Open-End and Unsecured Installment loan balances compared to the third quarter of 2020.
From a product perspective, Open-End revenues increased sequentially $4.4 million, or 7.4%, on related loan growth of $36.7 million, or 11.4%, primarily due to normal seasonality and growth in Open-End loans in Canada. Open-End loan balances in Canada grew $51.2 million, or 20.3%, from December 31, 2019, with related revenue growth of $3.9 million, or 14.1%. Open-End growth in Canada was partially offset by a decrease in U.S. Open-End loans of $27.8 million, or 33.4%, with a related revenue decrease of $12.2 million, or 28.1%. Open-End loan balances in both countries were also affected by COVID-19 Impacts; namely, our decision to initially tighten credit, reduced application volumes and lower utilization of approved credit lines.
For the three months ended December 31, 2020, Unsecured Installment and Secured Installment revenues decreased $56.8 million, or 41.9%, and $11.9 million, or 41.6%, respectively, compared to the prior-year period because of COVID-19 Impacts and regulatory changes in California that were effective January 1, 2020. Excluding California, Unsecured Installment and Secured Installment revenues decreased $41.4 million, or 36.8%, and $6.6 million, or 33.1%, respectively. For the three months ended December 31, 2020, Installment revenues increased sequentially $11.4 million, or 13.6%, on related loan growth of $21.5 million, or 12.4%, primarily driven by growth in the Verge Credit brand
Single-Pay revenue declined $22.4 million, or 44.9%, for the three months ended December 31, 2020, compared to the prior-year period, primarily due to COVID-19 impacts on loan volumes and balances, which declined $37.7 million, or 46.2%, year over year. Single-Pay loan volumes in both the U.S. and Canada were particularly affected by the broad reduction in storefront usage by customers during periods of self-quarantine and stay-at-home orders, periodic store closures for COVID-19 protocols, and increased pay-downs as a result of government stimulus programs. For the three months ended December 31, 2020, Single-Pay revenues increased sequentially $2.4 million, or 9.5%, on related loan growth of $2.5 million, or 6.1%, as a result of normal seasonality and reduced quarantine and stay-at-home restrictions.
Ancillary revenues, which include the sale of insurance products to Open-End and Installment loan customers in Canada, decreased $0.9 million, or 5.1%, versus the prior-year period, stemming primarily from lower check cashing fees. Canada insurance revenue was flat year over year with higher premium revenue offset by higher customer claims. Sequentially, ancillary revenues increased $1.9 million, or 13.4%, for the three months ended December 31, 2020, due to the aforementioned growth in Canada Open-End loans.
The following table summarizes revenue by product, including CSO fees, for the period indicated:
| | | | | | | | | | | | | | | | | | | | | | | | | | | | | | | | | | |
| | For the Year Ended |
| | December 31, 2020 | | December 31, 2019 |
| (in thousands, unaudited) | | U.S. | Canada | | Total | % of Total | | U.S. | Canada | | Total | % of Total |
| Open-End | | $ 134,449 | | $ 115,053 | | | $ 249,502 | | 29.4 | % | | $ 147,794 | | $ 97,462 | | | $ 245,256 | | 21.5 | % |
| Unsecured Installment | | 333,991 | | 5,125 | | | 339,116 | | 40.0 | % | | 523,979 | | 6,751 | | | 530,730 | | 46.5 | % |
| Secured Installment | | 79,136 | | — | | | 79,136 | | 9.3 | % | | 110,513 | | — | | | 110,513 | | 9.7 | % |
| Single-Pay | | 75,930 | | 44,503 | | | 120,433 | | 14.2 | % | | 112,925 | | 78,524 | | | 191,449 | | 16.8 | % |
| Ancillary | | 15,018 | | 44,191 | | | 59,209 | | 7.0 | % | | 18,295 | | 45,554 | | | 63,849 | | 5.6 | % |
| Total revenue | | $ 638,524 | | $ 208,872 | | | $ 847,396 | | 100.0 | % | | $ 913,506 | | $ 228,291 | | | $ 1,141,797 | | 100.0 | % |
Full-year comparisons also were influenced by COVID-19 Impacts. For the year ended December 31, 2020, total revenue declined $294.4 million, or 25.8%, to $847.4 million, compared to the prior year. Geographically, U.S. and Canada revenues declined 30.1% and 8.5%, respectively. COVID-19 Impacts on year-over-year results for Canada were less than the U.S. due to the faster reopening of major markets and the continued popularity and growth of Open-End loans in Canada.
From a product perspective, Open-End revenues grew $4.2 million, or 1.7%, compared to the prior year, primarily due to $51.2 million, or 20.3%, of Open-End loan growth in Canada, partially offset by a $27.8 million, or 33.4%, loan balance decline in the U.S.
For the year ended December 31, 2020, Unsecured Installment and Secured Installment revenues decreased 36.1% and 28.4%, respectively, because of COVID-19 Impacts, regulatory changes in California that became effective January 1, 2020 and regulatory changes for CSOs in Ohio that were effective May 1, 2019. Excluding California, Unsecured Installment and Secured Installment revenue decreased 32.0% and 18.9%, respectively.
Single-Pay revenue declined $71.0 million, or 37.1%, for the year ended December 31, 2020, compared to the prior year, primarily due to COVID-19 impacts on loan volume and balances, which declined $37.7 million, or 46.2%. Single-Pay loan volumes were particularly affected by the broad reduction in storefront usage in both the U.S. and Canada by customers during periods of self-quarantine and stay-at-home orders, periodic closures of our stores for cleaning purposes, and increased pay-downs as a result of government stimulus programs.
Ancillary revenues, which include the sale of insurance products to Open-End and Installment loan customers in Canada, decreased $4.6 million, or 7.3%, versus the prior year, primarily stemming from lower check cashing fees.
The following table presents online revenue and online transaction compositions, including CSO fees, of the products and services that we currently offer:
| | | | | | | | | | | | | | | | | | | | | | | | | | |
| | Three Months Ended December 31, | | Year Ended December 31, |
| | 2020 | | 2019 | | 2020 | | 2019 |
| Online revenues as a percentage of consolidated revenue | | 50.9 | % | | 46.9 | % | | 48.5 | % | | 45.6 | % |
| Online transactions as a percentage of consolidated transactions | | 58.5 | % | | 48.1 | % | | 54.7 | % | | 45.8 | % |
Online revenue as a percentage of consolidated revenue increased during the three months and year ended December 31, 2020 due to COVID-19 Impacts and the resulting transition of customers using our online channel which provides customers a safe and contactless option.
Loan Volume and Portfolio Performance Analysis
The following table reconciles Company Owned gross loans receivable, a GAAP-basis balance sheet measure to Gross combined loans receivable, a non-GAAP measure(1). Gross combined loans receivable includes loans originated by third-party lenders through CSO programs, which are not included in the Consolidated Financial Statements but from which we earn revenue by providing a guarantee to the unaffiliated lender.
| | | | | | | | | | | | | | | | | | | | | | | | | | | | | | | | | | | | | | | | | | | | | | | | | | |
| | As of | | | | | | | | | |
| (in millions, unaudited) | | | December 31,
2020 | | September 30,
2020 | | June 30,
2020 | | March 31,
2020 | | December 31,
2019 | | | | | | | | | | | | | |
| Open-End | | | $ 358.9 | | | $ 322.2 | | | $ 285.2 | | | $ 314.0 | | | $ 335.5 | | | | | | | | | | | | | | | | | | |
| Unsecured Installment | | | 102.4 | | | 84.9 | | 81.6 | | | 123.1 | | | 160.8 | | | | | | | | | | | | | | | | | | |
| Secured Installment | | | 48.6 | | | 49.0 | | 53.6 | | | 72.6 | | | 88.1 | | | | | | | | | | | | | | | | | | |
| Single-Pay | | | 43.8 | | 41.3 | | 36.1 | | 54.7 | | 81.4 | | | | | | | | | | | | | | | | | |
| Company Owned gross loans receivable | | | $ 553.7 | | | $ 497.4 | | | $ 456.5 | | | $ 564.4 | | | $ 665.8 | | | | | | | | | | | | | | | | | | |
| Gross loans receivable Guaranteed by the Company | | | 44.1 | | | 39.8 | | 34.1 | | | 55.9 | | | 76.7 | | | | | | | | | | | | | | | | | | |
Gross combined loans receivable (1) | | | $ 597.8 | | | $ 537.2 | | | $ 490.6 | | | $ 620.3 | | | $ 742.5 | | | | | | | | | | | | | | | | | | |
(1) See "Non-GAAP Financial Measures" at the end of this release for definition and more information.
Gross combined loans receivable decreased $144.7 million, or 19.5%, to $597.8 million as of December 31, 2020, from $742.5 million as of December 31, 2019. The decrease was driven by COVID-19 Impacts and, for Installment loans, the impact of regulatory changes in California that were effective January 1, 2020. Sequentially, gross combined loans receivable increased $60.6 million, or 11.3%, as demand increased during the fourth quarter from normal seasonality, reduced government stimulus benefits, continued growth in Open-End in Canada and growth in the Verge Credit brand.
Gross combined loans receivable performance by product is described further in the following sections.
Open-End Loans
Open-End loan balances as of December 31, 2020 increased $23.4 million, or 7.0% ($16.4 million, or 4.9%, on a constant-currency basis), compared to December 31, 2019. Open-End balances in Canada increased $51.2 million, or 20.3% ($44.2 million, or 17.5%, on a constant-currency basis), year over year and $37.8 million, or 14.2% ($54.1 million, or 22.8%, on a constant currency basis), sequentially. Open-End loan balances in the U.S. declined $27.8 million, or 33.4% year over year. Sequentially, U.S. Open-End balances declined $1.2 million, or 2.1%, primarily due to the conversion of Virginia Open-End loans to Installment loans in advance of regulatory changes effective January 1, 2021.
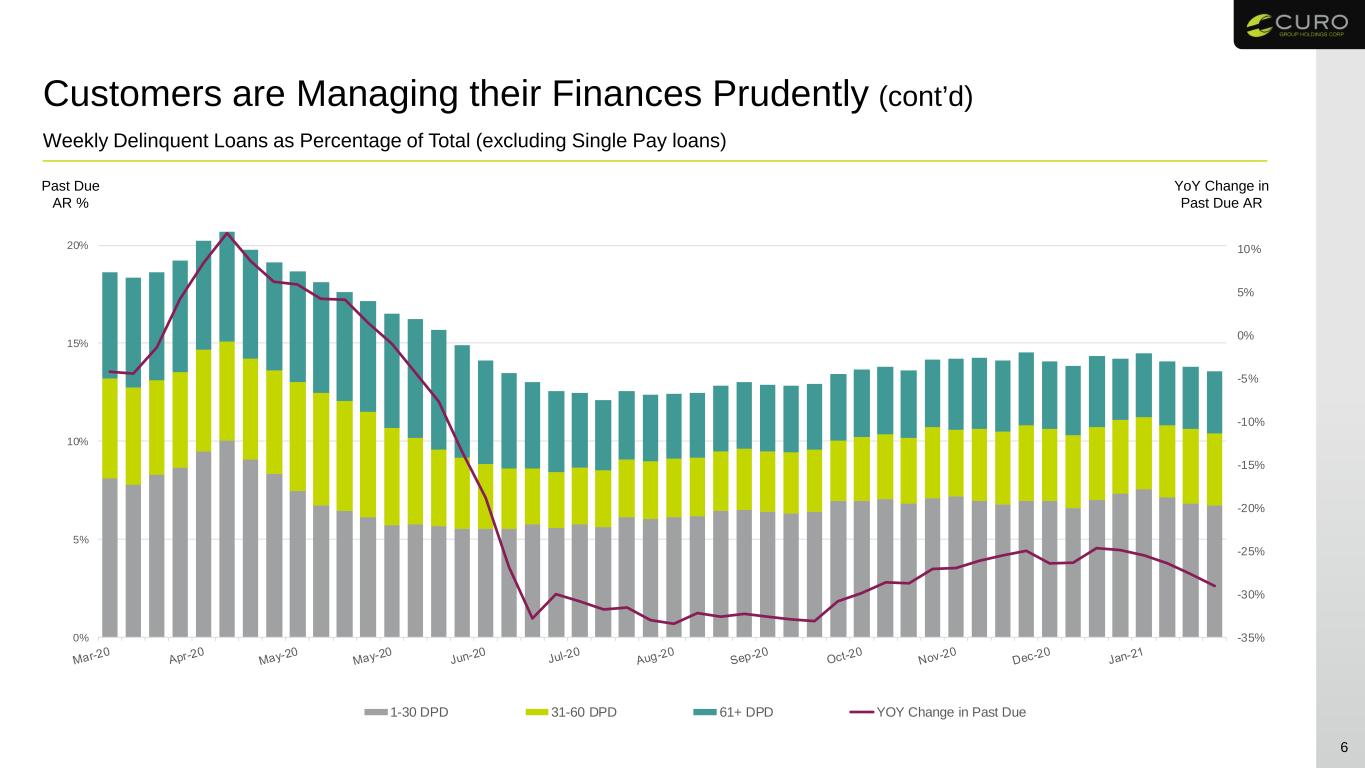
The Open-End Allowance for loan losses as a percentage of Open-End gross loans receivable ("allowance coverage") decreased sequentially from 16.0% to 14.5% as of December 31, 2020 and decreased from 16.4% year over year. The decrease was due to (i) sustained favorable trends in NCOs throughout 2020, (ii) the sequential decrease in Troubled Debt Restructuring ("TDRs") loans as a percentage of total gross loans receivable, and (iii) continued lower past-due gross loans receivable as a percentage of total gross loans receivable compared to historical trends. Year over year, NCO rates improved 520 bps and past-due rates improved 440 bps.
| | | | | | | | | | | | | | | | | | | | | | | | | | | | | | | | | | | |
| 2020 | | 2019 | | | | | | | | | | | | |
| (dollars in thousands, unaudited) | Fourth Quarter | Third Quarter | Second Quarter | First Quarter | | Fourth Quarter | | | | | | | | | | | | | | | |
| Open-End loans: | | | | | | | | | | | | | | | | | | | | | |
| Revenue | $ 63,073 | $ 58,711 | $ 56,736 | $ 70,982 | | $ 71,295 | | | | | | | | | | | | | | | |
| Provision for losses | 20,262 | 21,655 | 21,341 | 40,991 | | 37,816 | | | | | | | | | | | | | | | |
| Net revenue | $ 42,811 | $ 37,056 | $ 35,395 | $ 29,991 |
| $ 33,479 | | | | | | | | | | | | | | | |
| Net charge-offs | $ 21,407 | $ 18,163 | $ 31,684 | $ 37,098 | | $ 37,426 | | | | | | | | | | | | | | | |
| Open-End gross loan balances: | | | | | | | | | | | | | | | | | | | | | |
| Open-End gross loans receivable | $ 358,884 | $ 322,234 | $ 285,156 | $ 314,006 | | $ 335,524 | | | | | | | | | | | | | | | |
Average Open-End gross loans receivable (1) | $ 340,559 | $ 303,695 | $ 299,581 | $ 324,765 |
| $ 325,248 | | | | | | | | | | | | | | | |
| Open-End allowance for loan losses: | | | | | | | | | | | | | | | | | | | | | |
| Allowance for loan losses | $ 51,958 | $ 51,417 | $ 47,319 | $ 56,458 | | $ 55,074 | | | | | | | | | | | | | | | |
| Open-End Allowance for loan losses as a percentage of Open-End gross loans receivable | 14.5% | 16.0% | 16.6% | 18.0% | | 16.4% | | | | | | | | | | | | | | | |
| Open-End past-due balances: | | | | | | | | | | | | | | | | | | | | | |
| Open-End past-due gross loans receivable | $ 37,779 | $ 31,807 | $ 31,208 | $ 49,987 | | $ 50,072 | | | | | | | | | | | | | | | |
| Past-due Open-End gross loans receivable - percentage | 10.5% | 9.9% | 10.9% | 15.9% | | 14.9% | | | | | | | | | | | | | | | |
| Open-End ratios: | | | | | | | | | | | | | | | | | | | | | |
NCO rate (2) | 6.3% | 6.0% | 10.6% | 11.4% | | 11.5% | | | | | | | | | | | | | | | |
| (1) Average gross loans receivable calculated as average of beginning of quarter and end of quarter gross loans receivable. | | | | | | | | | |
| (2) We calculate NCO rate as NCOs divided by Average gross loans receivables. | | | | | | | | | | | | | | |
| | | | | | | | |
| | | | | | | | | | | | | | | | | | | | | |
| | | | | | | | | | | | | | | | | | | | | |
| | | | | | | | | | | | | | | | | | | | | |
| | | | | | | | | | | | | | | | | | | | | |
| | | | | | | | | | | | | | | | | | | | | |
| | | | | | | | | | | | | | | | | | | | | |
| | |
Q1 2019 Open-End Loss Recognition Change
Effective January 1, 2019, we modified the timeframe over which we charge-off Open-End loans and made related refinements to our loss provisioning methodology. Prior to January 1, 2019, we deemed Open-End loans uncollectible and charged-off when a customer missed a scheduled payment and the loan was considered past-due. Because of our continuing shift to Open-End loans in Canada and our analysis of payment patterns on early-stage versus late-stage delinquencies, we revised our estimates and now consider Open-End loans uncollectible when the loan has been contractually past-due for 90 consecutive days. Consequently, past-due Open-End loans and related accrued interest now remain in loans receivable for 90 days before being charged off against the allowance for loan losses. All recoveries on charged-off loans are credited to the allowance for loan losses. We evaluate the adequacy of the allowance for loan losses compared to the related gross loans receivable balances that include accrued interest.
Prospectively from January 1, 2019, past-due, unpaid balances plus related accrued interest charge-off on day 91.
This change was treated as a change in accounting estimate for accounting purposes and applied prospectively beginning January 1, 2019.
In addition, the following table illustrates, on a non-GAAP pro forma basis, the 2019 quarterly results as if the Q1 2019 Open-End Loss Recognition Change had been applied to our outstanding Open-End loan portfolio as of December 31, 2018. This table is illustrative of retrospective application to determine the NCOs that would have been incurred in each quarter of 2019 from the December 31, 2018 loan book. The primary purpose of this pro forma illustration is to provide a representative level of NCO rates from applying the Q1 2019 Open-End Loss Recognition Change.
| | | | | | | | | | | | | | | | | |
| Pro Forma | | 2019 |
| (dollars in thousands, unaudited) | | Fourth Quarter | Third Quarter | Second Quarter | First Quarter |
Open-End loans: | | | | | |
| | | | | |
| | | | | |
| | | | | |
| Pro Forma NCOs | | $ 38,748 | | $ 29,762 | | $ 29,648 | | $ 31,788 | |
Open-End gross loan balances: | | | | | |
Open-End gross loans receivable | | $ 335,524 | | $ 314,971 | | $ 283,311 | | $ 240,790 | |
Pro Forma Average Open-End gross loans receivable (1) | | $ 325,248 | | $ 299,141 | | $ 262,050.5 | | $ 245,096 | |
Pro Forma NCO rate (2) | | 11.9 | % | 9.9 | % | 11.3 | % | 13.0 | % |
| (1) Average gross loans receivable calculated as average of beginning of quarter and end of quarter gross loans receivable. |
| (2) We calculate NCO rate as NCOs divided by Average gross loans receivables. |
Unsecured Installment Loans - Company Owned
Company Owned Unsecured Installment revenue for the three months ended December 31, 2020 and related gross loans receivable decreased $27.0 million, or 42.6%, and $58.4 million, or 36.3%, respectively, from the prior-year period. The decrease in receivables was primarily due to COVID-19 Impacts and regulatory changes in California that were effective January 1, 2020, partially offset by growth in the Verge Credit brand. Sequentially, Company Owned Unsecured Installment revenue and related gross loans receivable increased $5.2 million, or 16.7%, and $21.8 million, or 17.6%, respectively.
Unsecured Installment loans in California were $23.6 million, or 23.0%, of total Company Owned Unsecured Installment loans as of December 31, 2020, a decrease of $47.8 million from December 31, 2019. Sequentially, California Unsecured Installment loans decreased $3.8 million. Excluding California, Company Owned Unsecured Installment loans receivable decreased $10.6 million, or 11.8%, from the prior-year period, while revenues for the three months ended December 31, 2020 decreased $11.0 million, or 28.4%, compared to the prior-year period, due to COVID-19 Impacts. Sequentially, excluding California, Company Owned Unsecured Installment revenue and related loans receivable increased $7.2 million, or 33.5% and $21.2 million, or 36.8%, respectively, from September 30, 2020. The receivable increase was due to normal seasonality, reduced quarantine and stay-at-home orders and less government stimulus during the fourth quarter.
The Unsecured Installment quarterly NCO rate improved approximately 920 bps year-over-year, as a result of COVID-19 Impacts. Sequentially, the quarterly NCO rate increased from 11.5% in the third quarter to 12.1% in the fourth quarter of 2020 on higher new customer origination mix and expansion into new states.
The Unsecured Installment allowance coverage increased year-over-year, from 22.1% as of December 31, 2019, to 23.5% as of December 31, 2020, as a result of certain loan modifications under the Customer Care Program, which were classified as TDRs. Loans classified as TDRs are included within Company Owned gross loans receivable. Amounts waived on these loans are immediately charged-off and the impairment for these loans is included within the Allowance for loan losses. Determination of the impairment for TDRs includes an estimate of their lifetime losses, which is greater than estimated incurred losses at a point in time. TDRs increased our total Unsecured Installment allowance coverage by nearly 100 bps from the allowance coverage that would have otherwise been required. Sequentially, the allowance coverage increased from 22.2% to 23.5%, as a result of moderately higher past-due balances from 21.1% to 23.6%, due largely to growth in new geographical markets, as well as the aforementioned increase in the NCO rate.
Unsecured Installment Loans - Guaranteed by the Company
Unsecured Installment loans Guaranteed by the Company declined $31.1 million year over year, primarily due to COVID-19 Impacts. Sequentially, Unsecured Installment loans Guaranteed by the Company increased $4.4 million, or 11.2%, due to normal seasonality, reduced quarantine and stay-at-home orders and less government stimulus during the fourth quarter.
NCO rates for Unsecured Installment loans Guaranteed by the Company increased year over year from 47.6% to 52.5%, and sequentially from 38.6% to 52.5%, as new customer volume improved and origination mix shifted online. The CSO liability for losses as a percentage of loans Guaranteed by the Company increased year-over-year from 14.2% to 16.6% as of December 31, 2020 due primarily to an increased liability for certain loans modified under the Customer Care Program. Sequentially, past-due balances as a percent of gross loans receivable decreased from 15.3% to 14.1%. The CSO liability for losses increased from 15.8% to 16.6% during the three months ended December 31, 2020, as a result of the aforementioned increase in NCO rate.
| | | | | | | | | | | | | | | | | | | | | | | | | | | | | | | | | | | |
| 2020 | | 2019 | | | | | | | | | | | | |
| (dollars in thousands, unaudited) | Fourth Quarter | Third Quarter | Second Quarter | First Quarter | | Fourth Quarter | | | | | | | | | | | | | | | |
| Unsecured Installment loans: | | | | | | | | | | | | | | | | | | | | | |
| Revenue - Company Owned | $ 36,387 | $ 31,168 | $ 33,405 | $ 55,569 | | $ 63,428 | | | | | | | | | | | | | | | |
| Provision for losses - Company Owned | 16,506 | 9,647 | 12,932 | 26,182 | | 33,183 | | | | | | | | | | | | | | | |
| Net revenue - Company Owned | $ 19,881 | $ 21,521 | $ 20,473 | $ 29,387 | | $ 30,245 | | | | | | | | | | | | | | | |
| Net charge-offs - Company Owned | $ 11,308 | $ 9,595 | $ 23,110 | $ 32,775 | | $ 35,729 | | | | | | | | | | | | | | | |
| | | | | | | | | | | | | | | | | | | | | |
Revenue - Guaranteed by the Company (1) | $ 42,401 | $ 36,240 | $ 37,024 | $ 66,840 | | $ 72,183 | | | | | | | | | | | | | | | |
Provision for losses - Guaranteed by the Company (1) | 22,535 | 14,884 | 11,418 | 26,338 | | 34,858 | | | | | | | | | | | | | | | |
Net revenue - Guaranteed by the Company (1) | $ 19,866 | $ 21,356 | $ 25,606 | $ 40,502 | | $ 37,325 | | | | | | | | | | | | | | | |
Net charge-offs - Guaranteed by the Company (1) | $ 21,505 | $ 13,882 | $ 15,432 | $ 27,749 | | $ 34,486 | | | | | | | | | | | | | | | |
| Unsecured Installment gross combined loans receivable: | | | | | | | | | | | | | | | | | | | | | |
| Company Owned | $ 102,425 | $ 84,959 | $ 81,601 | $ 123,118 | | $ 160,782 | | | | | | | | | | | | | | | |
Guaranteed by the Company (1) | 43,175 | 38,822 | 33,082 | 54,097 | | 74,317 | | | | | | | | | | | | | | | |
Unsecured Installment gross combined loans receivable (1)(2) | $ 145,600 | $ 123,781 | $ 114,683 | $ 177,215 | | $ 235,099 | | | | | | | | | | | | | | | |
| Average gross loans receivable: | | | | | | | | | | | | | | | | | | | | | |
Average Unsecured Installment gross loans receivable - Company Owned (3) | $ 93,692 | $ 83,280 | $ 102,360 | $ 141,950 | | $ 167,636 | | | | | | | | | | | | | | | |
Average Unsecured Installment gross loans receivable - Guaranteed by the Company (1)(3) | $ 40,999 | $ 35,952 | $ 43,590 | $ 64,207 | | $ 72,511 | | | | | | | | | | | | | | | |
| Allowance for loan losses and CSO liability for losses: | | | | | | | | | | | | | | | | | | | | | |
Unsecured Installment Allowance for loan losses (4) | $ 24,073 | $ 18,859 | $ 18,451 | $ 28,965 | | $ 35,587 | | | | | | | | | | | | | | | |
Unsecured Installment CSO liability for losses (1)(4) | $ 7,160 | $ 6,130 | $ 5,128 | $ 9,142 | | $ 10,553 | | | | | | | | | | | | | | | |
| Unsecured Installment Allowance for loan losses as a percentage of Unsecured Installment gross loans receivable | 23.5% | 22.2% | 22.6% | 23.5% | | 22.1% | | | | | | | | | | | | | | | |
Unsecured Installment CSO liability for losses as a percentage of Unsecured Installment gross loans Guaranteed by the Company (1) | 16.6% | 15.8% | 15.5% | 16.9% | | 14.2% | | | | | | | | | | | | | | | |
| Unsecured Installment past-due balances: | | | | | | | | | | | | | | | | | | | | | |
| Unsecured Installment gross loans receivable - Company Owned | $ 24,190 | $ 17,942 | $ 17,766 | $ 34,966 | | $ 43,100 | | | | | | | | | | | | | | | |
Unsecured Installment gross loans - Guaranteed by the Company (1) | $ 6,079 | $ 5,953 | $ 4,019 | $ 9,232 | | $ 12,477 | | | | | | | | | | | | | | | |
| Past-due Unsecured Installment Company Owned gross loans receivable -- percentage | 23.6% | 21.1% | 21.8% | 28.4% | | 26.8% | | | | | | | | | | | | | | | |
Past-due Unsecured Installment gross loans Guaranteed by the Company -- percentage (1) | 14.1% | 15.3% | 12.1% | 17.1% | | 16.8% | | | | | | | | | | | | | | | |
| Unsecured Installment other information: | | | | | | | | | | | | | | | | | | | | | |
Originations - Company Owned | $ 66,502 | $ 49,833 | $ 24,444 | $ 55,941 | | $ 87,080 | | | | | | | | | | | | | | | |
| | | | | | | | | | | | | | | | | | | | | |
Originations - Guaranteed by the Company (1) | $ 57,053 | $ 51,433 | $ 33,700 | $ 64,836 | | $ 91,004 | | | | | | | | | | | | | | | |
| | | | | | | | | | | | | | | | | | | | | |
| Unsecured Installment ratios: | | | | | | | | | | | | | | | | | | | | | |
| | | | | | | | | | | | | | | | | | | | | |
NCO rate - Company Owned (5) | 12.1% | 11.5% | 22.6% | 23.1% | | 21.3% | | | | | | | | | | | | | | | |
NCO rate - Guaranteed by the Company (1)(5) | 52.5% | 38.6% | 35.4% | 43.2% | | 47.6% | | | | | | | | | | | | | | | |
(1) Includes loans originated by third-party lenders through CSO programs, which are not included in the Condensed Consolidated Financial Statements. |
| (2) Non-GAAP measure. For a description of each non-GAAP metric, see "Non-GAAP Financial Measures." | | | |
| (3) Average gross loans receivable calculated as average of beginning of quarter and end of quarter gross loans receivable. |
(4) We report Allowance for loan losses as a contra-asset reducing gross loans receivable and the CSO liability for losses as a liability on the Condensed Consolidated Balance Sheets. |
| (5) We calculate NCO rate as NCOs divided by Average gross loans receivables. | | | | | | | | | | | | | | |
Secured Installment Loans
Secured Installment revenue and the related gross combined loans receivable for the three months ended December 31, 2020 decreased 41.6% and 45.2%, respectively, compared to the prior-year period. The decreases were due to COVID-19 Impacts and regulatory changes in California that were effective January 1, 2020. California accounted for $13.7 million, or 27.6%, of total Secured Installment gross combined loans receivable as of December 31, 2020, as compared to $36.5 million, or 40.4%, as of December 31, 2019, a decrease of $22.8 million, year over year. Excluding California, Secured Installment loans receivable decreased $18.0 million, or 33.5%, from the prior-year period, while revenues decreased $6.6 million, or 33.1%, year over year, due to COVID-19 Impacts.
The Secured Installment NCO rate improved 440 bps compared to the prior-year period. Secured Installment Allowance for loan losses and CSO liability for losses as a percentage of Secured Installment gross combined loans receivable increased from 11.5% as of December 31, 2019 to 14.4% as of December 31, 2020. The increase was primarily attributable to the classification of certain loan modifications under the Customer Care Program as TDRs, partially offset by the impact of lower past-due receivables as of December 31, 2020. TDRs increased our total Secured Installment allowance coverage by 270 bps from the allowance coverage that would otherwise have been required. Despite the sequential increase in past-due Secured Installment gross combined loans receivable, the Secured Installment Allowance for loan losses and CSO liability for losses as a percentage of Secured Installment gross combined loans receivable remained flat at 14.4% due to sustained favorable trends in NCOs throughout 2020.
| | | | | | | | | | | | | | | | | | | | | | | | | | | | | | | | | | | |
| 2020 | | 2019 | | | | | | | | | | | | |
| (dollars in thousands, unaudited) | Fourth Quarter | Third Quarter | Second Quarter | First Quarter | | Fourth Quarter | | | | | | | | | | | | | | | |
| Secured Installment loans: | | | | | | | | | | | | | | | | | | | | | |
| Revenue | $ 16,757 | $ 16,692 | $ 19,401 | $ 26,286 | | $ 28,690 | | | | | | | | | | | | | | | |
| Provision for losses | 4,028 | 3,291 | 7,238 | 9,682 | | 11,492 | | | | | | | | | | | | | | | |
| Net revenue | $ 12,729 | $ 13,401 | $ 12,163 | $ 16,604 |
| $ 17,198 | | | | | | | | | | | | | | | |
| Net charge-offs | $ 4,090 | $ 4,033 | $ 9,092 | $ 10,284 | | $ 11,548 | | | | | | | | | | | | | | | |
| Secured Installment gross combined loan balances: | | | | | | | | | | | | | | | | | | | | | |
| | | | | | | | | | | | | | | | | | | | | |
| | | | | | | | | | | | | | | | | | | | | |
Secured Installment gross combined loans receivable (1)(2) | $ 49,563 | $ 49,921 | $ 54,635 | $ 74,405 | | $ 90,411 | | | | | | | | | | | | | | | |
| | | | | | | | | | | | | | | | | | | | | |
| | | | | | | | | | | | | | | | | | | | | |
Average Secured Installment gross combined loans receivable (3) | $ 49,742 | $ 52,278 | $ 64,520 | $ 82,408 | | $ 91,445 | | | | | | | | | | | | | | | |
Secured Installment Allowance for loan losses and CSO liability for losses (4) | $ 7,115 | $ 7,177 | $ 7,919 | $ 9,773 | | $ 10,375 | | | | | | | | | | | | | | | |
| | | | | | | | | | | | | | | | | | | | | |
| | | | | | | | | | | | | | | | | | | | | |
Secured Installment Allowance for loan losses and CSO liability for losses as a percentage of Secured Installment gross combined loans receivable (1) | 14.4% | 14.4% | 14.5% | 13.1% |
| 11.5% | | | | | | | | | | | | | | | |
| Secured Installment past-due balances: | | | | | | | | | | | | | | | | | | | | | |
| | | | | | | | | | | | | | | | | | | | | |
| | | | | | | | | | | | | | | | | | | | | |
Secured Installment past-due gross combined loans receivable (1)(2) | $ 8,430 | $ 7,703 | $ 9,072 | $ 15,612 | | $ 17,902 | | | | | | | | | | | | | | | |
| | | | | | | | | | | | | | | | | | | | | |
| | | | | | | | | | | | | | | | | | | | | |
Past-due Secured Installment gross combined loans receivable -- percentage (1) | 17.0% | 15.4% | 16.6% | 21.0% |
| 19.8% | | | | | | | | | | | | | | | |
| Secured Installment other information: | | | | | | | | | | | | | | | | | | | | | |
Originations (2) | $ 21,884 | $ 19,216 | $ 11,242 | $ 20,990 | | $ 40,961 | | | | | | | | | | | | | | | |
| | | | | | | | | | | | | | | | | | | | | |
| Secured Installment ratios: | | | | | | | | | | | | | | | | | | | | | |
| | | | | | | | | | | | | | | | | | | | | |
NCO Rate (5) | 8.2% | 7.7% | 14.1% | 12.5% | | 12.6% | | | | | | | | | | | | | | | |
(1) Non-GAAP measure. For a description of each non-GAAP metric, see "Non-GAAP Financial Measures." | | | |
| (2) Includes loans originated by third-party lenders through CSO programs, which are not included in the Consolidated Financial Statements. | | | |
| (3) Average gross loans receivable calculated as average of beginning of quarter and end of quarter gross loans receivable. | | | |
| (4) We report Allowance for loan losses as a contra-asset reducing gross loans receivable and the CSO liability for losses as a liability on the Consolidated Balance Sheets. | | | |
| (5) We calculate NCO rate as NCOs divided by Average gross loans receivables. | | | | | | | | | | | | | | |
| | | |
| | | |
Single-Pay
Single-Pay revenue declined $22.4 million, or 44.9%, year over year, while related receivables declined $37.7 million, or 46.2%, for the three months ended December 31, 2020, primarily due to COVID-19 Impacts. Single-Pay loan volume was particularly affected by the reduction in store traffic as customers self-quarantined and the increased loan repayments funded by government stimulus programs. Sequentially, Single-Pay revenues increased $2.4 million, or 9.5%, on related loan growth of $2.5 million, or 6.1%, due to normal seasonality and reduced quarantine and stay-at-home orders during the fourth quarter. The Single-Pay Allowance for loan losses as a percentage of Single-Pay gross loans receivable, which was consistent year over year, decreased sequentially from 7.7% to 7.0% as of December 31, 2020, due to sustained favorable NCO trends throughout 2020.
| | | | | | | | | | | | | | | | | | | | | | | | | | | | | | | | | | | |
| 2020 | | 2019 | | | | | | | | |
| (dollars in thousands, unaudited) | Fourth Quarter | Third Quarter | Second Quarter | First Quarter | | Fourth Quarter | | | | | | | | | | | | | | | |
| Single-pay loans: | | | | | | | | | | | | | | | | | | | | | |
| Revenue | $ 27,460 | $ 25,084 | $ 22,732 | $ 45,157 | | $ 49,844 | | | | | | | | | | | | | | | |
| Provision for losses | 6,153 | 4,799 | (2,588) | 9,639 | | 12,289 | | | | | | | | | | | | | | | |
| Net revenue | $ 21,307 | $ 20,285 | $ 25,320 | $ 35,518 | | $ 37,555 | | | | | | | | | | | | | | | |
| Net charge-offs | $ 6,367 | $ 4,439 | ($ 598) | $ 10,517 | | $ 12,145 | | | | | | | | | | | | | | | |
| Single-Pay gross loan balances: | | | | | | | | | | | | | | | | | | | | | |
| | | | | | | | | | | | | | | | | | | | | |
| | | | | | | | | | | | | | | | | | | | | |
| Single-Pay gross loans receivable | $ 43,780 | $ 41,274 | $ 36,130 | $ 54,728 | | $ 81,447 | | | | | | | | | | | | | | | |
Average Single-Pay gross loans receivable (1) | $ 42,527 | $ 38,702 | $ 45,429 | $ 68,088 | | $ 78,787 | | | | | | | | | | | | | | | |
| Single-Pay Allowance for loan losses | $ 3,084 | $ 3,197 | $ 2,802 | $ 4,693 | | $ 5,869 | | | | | | | | | | | | | | | |
| | | | | | | | | | | | | | | | | | | | | |
| Single-Pay Allowance for loan losses as a percentage of Single-Pay gross loans receivable | 7.0% | 7.7% | 7.8% | 8.6% |
| 7.2% | | | | | | | | | | | | | | | |
NCO rate (2) | 15.0% | 11.5% | (1.3)% | 15.4% | | 15.4% | | | | | | | | | | | | | | | |
| (1) We calculate Average gross loans receivable, which we utilize to calculate product yield and NCO rates, as average of beginning of quarter and end of quarter gross loans receivable. | | | | | | | | | |
| (2) We calculate NCO rate as NCOs divided by Average gross loans receivables. | | | | | | | | | | | | | | |
| | | | | | | | | | | | | | | | | | | | | |
| | | |
| | | |
| | | |
Results of Consolidated Operations
Condensed Consolidated Statements of Operations
| | | | | | | | | | | | | | | | | | | | | | | | | | | | | | | | |
| (in thousands, unaudited) | | Three Months Ended December 31, | | Year Ended December 31, |
| 2020 | 2019 | Change $ | Change % | | 2020 | 2019 | Change $ | Change % |
| Revenue | | $ 202,078 | | $ 302,294 | | ($ 100,216) | | (33.2) | % | | $ 847,396 | | $ 1,141,797 | | ($ 294,401) | | (25.8) | % |
| Provision for losses | | 69,832 | | 130,289 | | (60,457) | | (46.4) | % | | 288,811 | | 468,551 | | (179,740) | | (38.4) | % |
| Net revenue | | 132,246 | | 172,005 | | (39,759) | | (23.1) | % | | 558,585 | | 673,246 | | (114,661) | | (17.0) | % |
| Advertising | | 12,158 | | 16,408 | | (4,250) | | (25.9) | % | | 44,552 | | 53,398 | | (8,846) | | (16.6) | % |
| Non-advertising costs of providing services | | 51,497 | | 60,298 | | (8,801) | | (14.6) | % | | 205,674 | | 241,232 | | (35,558) | | (14.7) | % |
| Total cost of providing services | | 63,655 | | 76,706 | | (13,051) | | (17.0) | % | | 250,226 | | 294,630 | | (44,404) | | (15.1) | % |
| Gross margin | | 68,591 | | 95,299 | | (26,708) | | (28.0) | % | | 308,359 | | 378,616 | | (70,257) | | (18.6) | % |
| | | | | | | | | | |
| Operating expense | | | | | | | | | | |
| Corporate, district and other expenses | | 43,607 | | 37,060 | | 6,547 | | 17.7 | % | | 159,853 | | 160,103 | | (250) | | (0.2) | % |
| Interest expense | | 18,691 | | 17,686 | | 1,005 | | 5.7 | % | | 72,709 | | 69,763 | | 2,946 | | 4.2 | % |
| | | | | | | | | | |
| (Income) loss from equity method investment | | (1,893) | | 1,163 | | (3,056) | | # | | (4,546) | | 6,295 | | (10,841) | | # |
| | | | | | | | | | |
| | | | | | | | | | |
| Total operating expense | | 60,405 | | 55,909 | | 4,496 | | 8.0 | % | | 228,016 | | 236,161 | | (8,145) | | (3.4) | % |
| Income from continuing operations before income taxes | | 8,186 | | 39,390 | | (31,204) | | (79.2) | % | | 80,343 | | 142,455 | | (62,112) | | (43.6) | % |
| Provision for income taxes | | 3,712 | | 9,819 | | (6,107) | | (62.2) | % | | 5,895 | | 38,557 | | (32,662) | | (84.7) | % |
| Net income from continuing operations | | 4,474 | | 29,571 | | (25,097) | | (84.9) | % | | 74,448 | | 103,898 | | (29,450) | | (28.3) | % |
| Net income from discontinued operations, net of tax | | — | | 647 | | (647) | | # | | 1,285 | | 7,590 | | (6,305) | | (83.1) | % |
| Net income | | $ 4,474 | | $ 30,218 | | ($ 25,744) | | (85.2) | % | | $ 75,733 | | $ 111,488 | | ($ 35,755) | | (32.1) | % |
| # - Variance greater than 100% or not meaningful |
Reconciliation of Net Income from Continuing Operations and Diluted Earnings per Share to Adjusted Net Income and Adjusted Diluted Earnings per Share, non-GAAP measures
| | | | | | | | | | | | | | | | | | | | | | | | | | | | | | | | |
| (in thousands, except per share data, unaudited) | | Three Months Ended December 31, | | Year Ended December 31, |
| 2020 | 2019 | Change $ | Change % | | 2020 | 2019 | Change $ | Change % |
| Net income from continuing operations | | $ 4,474 | | $ 29,571 | | ($ 25,097) | | (84.9) | % | | $ 74,448 | | $ 103,898 | | ($ 29,450) | | (28.3) | % |
| Adjustments: | | | | | | | | | | |
| | | | | | | | | | |
| | | | | | | | | | |
Legal and other costs (1) | | 2,160 | | 2,173 | | | | | 5,662 | | 4,795 | | | |
U.K. related costs (2) | | — | | — | | | | | — | | 8,844 | | | |
(Income) loss from equity method investment (3) | | (1,893) | | 1,163 | | | | | (4,546) | | 6,295 | | | |
| | | | | | | | | | |
| | | | | | | | | | |
Share-based compensation (4) | | 3,014 | | 2,736 | | | | | 12,910 | | 10,323 | | | |
| Intangible asset amortization | | 705 | | 576 | | | | | 2,951 | | 2,884 | | | |
Canada GST adjustment (5) | | — | | — | | | | | 2,160 | | — | | | |
Income tax valuations (6) | | — | | — | | | | | (3,472) | | — | | | |
Impact of tax law changes (7) | | — | | — | | | | | (11,251) | | — | | | |
Cumulative tax effect of adjustments (8) | | 96 | | (1,426) | | | | | (4,534) | | (6,980) | | | |
| Adjusted Net Income | | $ 8,556 | | $ 34,793 | | ($ 26,237) | | (75.4) | % | | $ 74,328 | | $ 130,059 | | ($ 55,731) | | (42.9) | % |
| | | | | | | | | | |
| Net income from continuing operations | | $ 4,474 | | $ 29,571 | | | | | $ 74,448 | | $ 103,898 | | | |
| Diluted Weighted Average Shares Outstanding | | 42,579 | | 43,243 | | | | | 42,091 | | 45,974 | | | |
| | | | | | | | | | |
| Diluted Earnings per Share from continuing operations | | $ 0.11 | | $ 0.68 | | ($ 0.57) | | (83.8) | % | | $ 1.77 | | $ 2.26 | | ($ 0.49) | | (21.7) | % |
| Per Share impact of adjustments to Net income from continuing operations | | 0.09 | | 0.12 | | | | | — | | 0.57 | | | |
| Adjusted Diluted Earnings per Share | | $ 0.20 | | $ 0.80 | | ($ 0.60) | | (75.0) | % | | $ 1.77 | | $ 2.83 | | ($ 1.06) | | (37.5) | % |
| Note: Footnotes follow Reconciliation of Net income table immediately below |
|
Reconciliation of Net Income from Continuing Operations to EBITDA and Adjusted EBITDA, Non-GAAP Measures
| | | | | | | | | | | | | | | | | | | | | | | | | | | | | | | | |
| | Three Months Ended December 31, | | Year Ended December 31, |
| (in thousands, except per share data, unaudited) | | 2020 | 2019 | Change $ | Change % | | 2020 | 2019 | Change $ | Change % |
| Net income from continuing operations | | $ 4,474 | | $ 29,571 | | ($ 25,097) | | (84.9) | % | | $ 74,448 | | $ 103,898 | | ($ 29,450) | | (28.3) | % |
| Provision for income taxes | | 3,712 | | 9,819 | | (6,107) | | (62.2) | % | | 5,895 | | 38,557 | | (32,662) | | (84.7) | % |
| Interest expense | | 18,691 | | 17,686 | | 1,005 | | 5.7 | % | | 72,709 | | 69,763 | | 2,946 | | 4.2 | % |
| Depreciation and amortization | | 4,186 | | 4,450 | | (264) | | (5.9) | % | | 17,498 | | 18,630 | | (1,132) | | (6.1) | % |
| EBITDA | | 31,063 | | 61,526 | | (30,463) | | (49.5) | % | | 170,550 | | 230,848 | | (60,298) | | (26.1) | % |
| | | | | | | | | | |
| | | | | | | | | | |
Legal and other costs (1) | | 2,160 | | 2,173 | | | | | 5,662 | | 4,795 | | | |
U.K. related costs (2) | | — | | — | | | | | — | | 8,844 | | | |
(Income) loss from equity method investment (3) | | (1,893) | | 1,163 | | | | | (4,546) | | 6,295 | | | |
| | | | | | | | | | |
Share-based compensation (4) | | 3,014 | | 2,736 | | | | | 12,910 | | 10,323 | | | |
Canada GST adjustment (5) | | — | | — | | | | | 2,160 | | — | | | |
Other adjustments (9) | | (12) | | (64) | | | | | 627 | | 27 | | | |
| Adjusted EBITDA | | $ 34,332 | | $ 67,534 | | ($ 33,202) | | (49.2) | % | | $ 187,363 | | $ 261,132 | | ($ 73,769) | | (28.2) | % |
| Adjusted EBITDA Margin | | 17.0 | % | 22.3 | % | | | | 22.1 | % | 22.9 | % | | |
|
|
| | | | | |
| |
| |
| (1) | Legal and other costs for the year ended December 31, 2020 included (i) costs for certain litigation and related matters of $2.4 million, (ii) legal and advisory costs related to the Katapult and Flexiti transactions of $2.7 million, and (iii) severance costs for certain corporate employees of $0.5 million.
Legal and other costs for the year ended December 31, 2019 included (i) costs related to certain securities litigation and related matters of $2.5 million, (ii) legal and advisory costs of $0.3 million related to the repurchase of shares from FFL, (iii) $1.8 million due to eliminating 121 positions in North America in the first quarter, and (iv) $0.3 million of legal and advisory costs related to the purchase of Ad Astra. |
| |
| |
| (2) | U.K. related costs of $8.8 million for the year ended December 31, 2019 relate to placing the U.K. subsidiaries into administration on February 25, 2019, which included $7.6 million to obtain consent from the holders of the 8.25% Senior Secured Notes to deconsolidate the U.K. segment and $1.2 million for other costs. |
| |
| (3) | The income from equity method investment for the year ended December 31, 2020 of $4.5 million includes our share of the estimated U.S. GAAP net income of Katapult.
The loss from equity method investment for the year ended December 31, 2019 of $6.3 million includes (i) our share of the estimated U.S. GAAP net loss of Katapult and (ii) a $3.7 million market value adjustment recognized during the second quarter of 2019 as a result of an equity raising round from April through July of 2019 that implied a value per share less than the value per share raised in prior raises. |
| (4) | The estimated fair value of share-based awards is recognized as non-cash compensation expense on a straight-line basis over the vesting period. |
| (5) | We received a Notice of Adjustment from Canadian tax authority auditors in the second quarter 2020 related to the treatment of certain expenses in prior years for purposes of calculating the Goods and Services Tax ("GST") due. |
| (6) | During the year ended December 31, 2020, a Texas court ruling related to the apportionment of income to the state for another company resulted in a change in estimate regarding the realization of a tax benefit previously taken. Accordingly, we recorded a $1.1 million liability for our estimated exposure related to this position. Also in the year ended December 31, 2020, we released a $4.6 million valuation allowance related to Net Operating Losses ("NOLs") for certain entities in Canada. |
| (7) | On March 27, 2020, the Coronavirus Aid, Relief and Economic Security Act ("CARES Act") was enacted by the U.S. Federal government in response to the COVID-19 pandemic. The CARES Act, among other things, allows NOLs incurred in 2018, 2019 and 2020 to be carried back to each of the five preceding taxable years to generate a refund of previously paid income taxes. For the year ended December 31, 2020, we recorded an income tax benefit of $11.3 million related to the carryback of NOL from tax years 2018 and 2019. |
| (8) | Cumulative tax effect of adjustments included in Reconciliation of Net income from continuing operations to EBITDA and Adjusted EBITDA table is calculated using the estimated incremental tax rate by country. Fourth quarter 2020 cumulative tax effect is impacted by certain non-deductible transaction costs included within Legal and other costs, share-based compensation vesting below share value at grant date, and IRS compensation deductibility limits. |
| (9) | Other adjustments primarily include the intercompany foreign-currency exchange impact. |
For the Three Months Ended December 31, 2020 and 2019
Revenue and Net Revenue
Revenue decreased 33.2% to $202.1 million for the three months ended December 31, 2020, from $302.3 million for the three months ended December 31, 2019, as a result of the declines in combined gross loan receivables discussed previously. Year over year, U.S. and Canada revenues decreased 39.0% and 10.5% (11.7% on a constant-currency basis), respectively. As previously mentioned, COVID-19 impacts on year over year results for Canada were less pronounced compared to the U.S. due to the faster reopening of Canadian markets and the continued growth of our Open-End loans in Canada.
Provision for losses decreased by $60.5 million, or 46.4%, for the three months ended December 31, 2020 compared to the prior-year period. The decrease in provision for loan losses was due to lower loan balances in 2020, resulting from COVID-19 Impacts, compared to 2019 and significantly improved NCO rates year over year as discussed in more detail in the "Loan Volume and Portfolio Performance Analysis" and "Segment Analysis" sections.
Cost of Providing Services
Non-advertising costs of providing services decreased $8.8 million, or 14.6%, to $51.5 million in the three months ended December 31, 2020, compared to $60.3 million in the three months ended December 31, 2019. Of the $8.8 million decrease, $3.6 million related to third-party collection costs incurred in 2019 related to Ad Astra, which previously were included in Non-advertising costs of providing services. Subsequent to our acquisition of Ad Astra, which became our wholly owned subsidiary as of January 3, 2020, its operating costs are included within "Corporate, district and other expenses," consistent with presentation of our other internal collection costs. The remaining decrease year over year in Non-advertising costs of providing services was due to lower underwriting and other variable costs as a result of lower demand and lower collection costs as a result of stimulus-related pay-downs.
Advertising costs decreased $4.3 million, or 25.9%, year over year because of COVID-19 Impacts.
Corporate, District and Other Expenses
Corporate, district and other expenses were $43.6 million for the three months ended December 31, 2020, an increase of $6.5 million, or 17.7%, compared to the three months ended December 31, 2019. Corporate, district and other expenses in the three months ended December 31, 2020 included $1.9 million of collection costs related to Ad Astra. Comparable costs were included in Non-advertising costs of providing services prior to the acquisition of Ad Astra. Excluding Ad Astra costs, Corporate, district and other expenses increased $4.6 million year over year, primarily due to the timing and extent of variable compensation and higher professional fees year over year, partially offset by travel and other cost reductions, including work-from-home initiatives to manage COVID-19 Impacts.
Equity Method Investment
Refer to the "Katapult Update for the Three Months and Year Ended December 31, 2020 and 2019" below for details.
Interest Expense
Interest expense for the three months ended December 31, 2020 increased $1.0 million, or 5.7%, on slightly higher year-over-year borrowings.
Provision for Income Taxes
The effective income tax rate for the three months ended December 31, 2020 was 45.3%. The effective income tax rate was higher than the federal and state/provincial statutory rates of approximately 26%, primarily as the result of several non-taxable events, which skewed the effective tax rate due to the lower level of pre-tax income during the quarter.
Refer to the Reconciliation of Net Income from continuing operations to Adjusted Net Income for additional information. The effective income tax rate of adjusted tax expense included in the Adjusted Net Income for the three months ended December 31, 2020 was 29.7%.
For the Year Ended December 31, 2020 and 2019
Revenue and Net Revenue
Revenue decreased $294.4 million, or 25.8%, to $847.4 million for the year ended December 31, 2020 from $1,141.8 million for the year ended December 31, 2019 as a result of the declines in combined gross loans receivable discussed above. Year over year, U.S. decreased 30.1%, primarily from COVID-19 Impacts, and Canada decreased 8.5% (7.7% on a constant-currency basis). As previously mentioned, COVID-19 impacts on year-over-year results for Canada were less pronounced compared to the U.S. due to the faster reopening of Canadian markets and the continued growth of our Open-End loans in Canada.
Provision for losses decreased by $179.7 million, or 38.4%, for the year ended December 31, 2020 compared to the prior year. The decrease in provision for loan losses was primarily due to lower loan volume and lower NCOs as a result of COVID-19 Impacts, as discussed in more detail in the "Loan Volume and Portfolio Performance Analysis" and "Segment Analysis" sections.
Cost of Providing Services
Non-advertising costs of providing services decreased $35.6 million, or 14.7%, to $205.7 million in the year ended December 31, 2020, compared to $241.2 million in the year ended December 31, 2019. Of the $35.6 million decrease, $15.5 million was related to third-party collection costs incurred in 2019 related to Ad Astra, which were included in Non-advertising costs of providing services prior to the acquisition of Ad Astra. Following the January 3, 2020 acquisition, we included Ad Astra operating costs within "Corporate, district and other expenses," consistent with the presentation of our other internal collection costs. The remaining decrease in Non-advertising costs of providing services was due to (i) lower underwriting and other variable costs as a result of lower demand, (ii) lower collection costs after governmental stimulus-related pay-downs and (iii) lower discretionary variable compensation.
Advertising costs decreased $8.8 million, or 16.6%, year over year because of COVID-19 Impacts.
Corporate, District and Other Expenses
Corporate, district and other expenses were $159.9 million for the year ended December 31, 2020, a decrease of $0.3 million, or 0.2%, compared to the year ended December 31, 2019. Corporate, district and other expenses in the year ended December 31, 2020 included $9.6 million of collection costs related to Ad Astra, which prior to our acquisition of it, were included in Non-advertising costs of providing services. For the year ended December 31, 2020, corporate, district and other expenses also included (i) $12.9 million of share-based compensation costs, (ii) $2.2 million of Canadian GST described in our reconciliation to Adjusted Net Income above and (iii) $5.7 million of legal and other costs described in our reconciliation to Adjusted Net Income above. For the year ended December 31, 2019, corporate district and other costs included (i) U.K.-related costs of $8.8 million, (ii) $10.3 million of share-based compensation and (iii) $4.8 million of legal and other costs as described in our reconciliation to Adjusted Net Income above. Share-based compensation costs increased primarily as a result of awards granted in the first quarter of 2020.
Excluding Ad Astra costs, share-based compensation expense and other costs described above, comparable corporate, district and other expenses decreased $6.6 million year over year, primarily due to the timing and extent of variable compensation and other cost reductions, including work-from-home initiatives to manage COVID-19 Impacts.
Equity Method Investment
Refer to the "Katapult Update for the Three Months and Year Ended December 31, 2020 and 2019" below for details.
Interest Expense
Interest expense for the year ended December 31, 2020 increased $2.9 million, or 4.2%, on slightly higher year-over-year borrowings.
Provision for Income Taxes
The effective income tax rate for the year ended December 31, 2020 was 7.3%. The effective income tax rate was lower compared to the federal and state/provincial statutory rates of approximately 26%, primarily as the result of discrete, one-time tax benefits related to usage of NOLs and other valuation allowance releases and the aforementioned fourth quarter non-taxable events.
First, given the CARES Act impact treatment of NOLs as described above, we recorded an income tax benefit of $11.3 million related to the carry-back of U.S. federal NOLs from tax years 2018 and 2019, which offsets our tax liability for years prior to tax reform and will generate a refund of previously-paid taxes at a 35% statutory rate.
Second, we recorded a tax benefit of $4.6 million related to the release of a valuation allowance previously recorded against NOLs for certain entities in Canada. In addition, we released a valuation allowance of $1.1 million against the cumulative losses from our investment in Katapult, as we continued to record equity method income from this investment during the year.
The tax benefits described above were partially offset by an increase in the reserve for uncertain tax positions in the U.S. of $1.1 million and the impact of the fourth quarter non-taxable events. Refer to the Reconciliation of Net Income from continuing operations to Adjusted Net Income for additional information.
The effective income tax rate of adjusted tax expense included in Adjusted Net Income for the year ended December 31, 2020 was 25.3%.
Katapult Update for the Three Months and Year Ended December 31, 2020 and 2019
A portion of our investment in Katapult is accounted for using the equity method of accounting. We recognize our share of its income or loss on a two-month lag with a corresponding adjustment to the carrying value of the investment included in "Investments" on the unaudited Consolidated Balance Sheet. As of December 31, 2020, our recognized share of Katapult's earnings through October 31, 2020 was $1.9 million for the fourth quarter and $4.5 million for the full year, as compared with losses of $1.2 million and $6.3 million for the three months and year ended December 31, 2019, respectively.
During the third quarter of 2020, we acquired additional equity interests in Katapult from certain existing owners for $11.2 million. As a result of these acquisitions, a portion of our Katapult ownership will continue to be recognized under the equity method of accounting and a portion has been reclassified and will be measured at cost less impairment. During the fourth quarter of 2020, we purchased an additional equity interest in Katapult for $1.6 million.
In December 2020, we announced that Katapult and FinServ entered into a definitive merger agreement that, when completed, we expect will provide consideration to us in a combination of cash and stock. Based on market prices as of the date of this release, we expect to receive consideration with a total value between $520 million and $540 million, an increase from $365 million at the time the transaction was agreed to in December 2020. To date, our total cash investment in Katapult is $27.5 million. Upon closing of the transaction, we anticipate receiving cash of up to $130 million while maintaining at least a 21% ownership, on a fully-diluted basis, in the newly formed public company. The transaction is expected to close during the first half of 2021 and remains subject to approval by FinServ's stockholders and other customary closing conditions. The transaction will result in both a cash tax liability and deferred tax liability, with the cash tax liability dependent upon cash received at closing. Assuming cash proceeds to us of $130 million, our estimated cash tax liability is approximately $35 million.
The table below presents select financial information for Katapult for the periods presented:
| | | | | | | | | | | | | | |
| | For the Nine Months Ended September 30, (1) |
| (in thousands) | | 2020 | | 2019 |
| Revenue | | $ 173,842 | | | $ 59,479 | |
| Cost of revenue | | 116,534 | | | 46,576 | |
| Gross profit | | 57,308 | | | 12,903 | |
| | | | |
| Operating expenses | | 28,195 | | | 22,611 | |
| Interest and loss on extinguishment of debt | | 10,091 | | | 6,594 | |
| Income before income taxes | | 19,022 | | | (16,302) | |
| Net income | | $ 18,599 | | | ($ 16,302) | |
| | | | |
| Originations | | $ 142,462 | | | $ 54,094 | |
| Cash and restricted cash | | $ 39,239 | | | |
| Gross property held for lease | | $ 179,302 | | | |
| (1) Source: Katapult's Registration Statement on Form S-4, pages F-62, F-63, F-69 and 101, filed with the SEC on January 29, 2021. |
Segment Analysis
We report financial results for two reportable segments: the U.S. and Canada. Following is a summary of results of operations for the segment and period indicated:
| | | | | | | | | | | | | | | | | | | | | | | | | | | | | |
| U.S. Segment Results | Three Months Ended December 31, | | Year Ended December 31, |
| (dollars in thousands, unaudited) | 2020 | 2019 | Change $ | Change % | | 2020 | 2019 | Change $ | Change % |
| Revenue | $ 146,588 | | $ 240,272 | | ($ 93,684) | | (39.0) | % | | $ 638,524 | | $ 913,506 | | ($ 274,982) | | (30.1) | % |
| Provision for losses | 59,108 | | 111,576 | | (52,468) | | (47.0) | % | | 230,164 | | 392,105 | | (161,941) | | (41.3) | % |
| Net revenue | 87,480 | | 128,696 | | (41,216) | | (32.0) | % | | 408,360 | | 521,401 | | (113,041) | | (21.7) | % |
| Advertising | 11,083 | | 15,016 | | (3,933) | | (26.2) | % | | 40,702 | | 46,735 | | (6,033) | | (12.9) | % |
| Non-advertising costs of providing services | 33,990 | | 42,848 | | (8,858) | | (20.7) | % | | 137,467 | | 171,714 | | (34,247) | | (19.9) | % |
| Total cost of providing services | 45,073 | | 57,864 | | (12,791) | | (22.1) | % | | 178,169 | | 218,449 | | (40,280) | | (18.4) | % |
| Gross margin | 42,407 | | 70,832 | | (28,425) | | (40.1) | % | | 230,191 | | 302,952 | | (72,761) | | (24.0) | % |
| Corporate, district and other expenses | 38,368 | | 31,754 | | 6,614 | | 20.8 | % | | 137,152 | | 138,180 | | (1,028) | | (0.7) | % |
| Interest expense | 16,347 | | 15,079 | | 1,268 | | 8.4 | % | | 63,413 | | 59,325 | | 4,088 | | 6.9 | % |
| | | | | | | | | |
| (Income) loss from equity method investment | (1,893) | | 1,163 | | (3,056) | | # | | (4,546) | | 6,295 | | (10,841) | | # |
| | | | | | | | | |
| | | | | | | | | |
| Total operating expense | 52,822 | | 47,996 | | 4,826 | | 10.1 | % | | 196,019 | | 203,800 | | (7,781) | | (3.8) | % |
| Segment operating (loss) income | (10,415) | | 22,836 | | (33,251) | | # | | 34,172 | | 99,152 | | (64,980) | | (65.5) | % |
| Interest expense | 16,347 | | 15,079 | | 1,268 | | 8.4 | % | | 63,413 | | 59,325 | | 4,088 | | 6.9 | % |
| Depreciation and amortization | 3,078 | | 3,263 | | (185) | | (5.7) | % | | 12,992 | | 13,816 | | (824) | | (6.0) | % |
| EBITDA | 9,010 | | 41,178 | | (32,168) | | (78.1) | % | | 110,577 | | 172,293 | | (61,716) | | (35.8) | % |
| | | | | | | | | |
| | | | | | | | | |
| Legal and other costs | 2,160 | | 2,173 | | (13) | | | | 5,662 | | 4,660 | | 1,002 | | |
| U.K. related costs | — | | — | | — | | | | — | | 8,844 | | (8,844) | | |
| (Income) loss from equity method investment | (1,893) | | 1,163 | | (3,056) | | | | (4,546) | | 6,295 | | (10,841) | | |
| | | | | | | | | |
| Share-based compensation | 3,014 | | 2,736 | | 278 | | | | 12,910 | | 10,323 | | 2,587 | | |
| Other adjustments | (117) | | 22 | | (139) | | | | (58) | | (184) | | 126 | | |
| Adjusted EBITDA | $ 12,174 | | $ 47,272 | | ($ 35,098) | | (74.2) | % | | $ 124,545 | | $ 202,231 | | ($ 77,686) | | (38.4) | % |
| # - Variance greater than 100% or not meaningful. |
U.S. Segment Results - For the Three Months Ended December 31, 2020 and 2019
U.S. revenues decreased by $93.7 million, or 39.0%, to $146.6 million, compared to the prior-year period for the three months ended December 31, 2020, as a result of the declines in combined gross loans receivable described above. Excluding the impact of California Installment loan runoff stemming from regulatory changes that were effective January 1, 2020, U.S. revenues decreased $73.0 million, or 35.0%. Sequentially, U.S. revenues increased $13.7 million, or 10.3%. Excluding California portfolios impacted by regulatory changes, U.S. revenues increased $16.6 million, or 13.9%, sequentially.
The provision for losses decreased $52.5 million, or 47.0%, primarily as a result of lower loan volume and lower NCOs, as previously described. U.S. NCOs decreased by $57.7 million, or 51.8%, year over year and the U.S. NCO rate improved by 420 bps to 21.0% for the three months ended December 31, 2020 from 25.2% in the prior-year period.
Non-advertising costs of providing services for the three months ended December 31, 2020 were $34.0 million, a decrease of $8.9 million, or 20.7%, compared to $42.8 million for the three months ended December 31, 2019. The decrease was primarily driven by Ad Astra costs of $3.6 million, which prior to its acquisition by us were included in Non-advertising costs of providing services. The remaining decrease year over year in Non-advertising costs of providing services was due to (i) lower underwriting and other variable costs as a result of lower demand and (ii) lower collection costs resulting from government stimulus-related pay-downs.
Advertising costs decreased $3.9 million, or 26.2%, year over year because of COVID-19 Impacts.
Corporate, district and other expenses were $38.4 million for the three months ended December 31, 2020, an increase of $6.6 million, or 20.8%, compared to the prior-year period. Corporate, district and other expenses for the three months ended December 31, 2020 included $1.9 million of collection costs related to Ad Astra, which were historically included in Non-advertising costs of providing services. Excluding Ad Astra costs, Corporate, district and other expenses increased $4.4 million year over year, primarily due to the timing and extent of variable compensation and higher professional fees compared to the prior-year period, partially offset by certain cost reductions, including work-from-home initiatives, to manage COVID-19 Impacts.
U.S. interest expense for the three months ended December 31, 2020 increased $1.3 million, or 8.4%, primarily related to the new Non-Recourse U.S. SPV Facility, which we closed in April 2020.
As described above, we recognize our share of Katapult’s income on a two-month lag and recorded income of $1.9 million for the three months ended December 31, 2020.
U.S. Segment Results - For the Year Ended December 31, 2020 and 2019
U.S. revenues decreased by $275.0 million, or 30.1%, to $638.5 million for the year ended December 31, 2020 compared to the prior year, as a result of decreases in combined gross loans receivable. Excluding the aforementioned impact of California Installment loan runoff, U.S. revenues decreased by $203.0 million, or 26.2%.
The provision for losses decreased $161.9 million, or 41.3%, for the year ended December 31, 2020, compared to the prior year, primarily as a result of lower loan volume and lower NCOs. Year-over-year U.S. NCOs decreased $140.1 million, or 35.2%.
Non-advertising costs of providing services for the year ended December 31, 2020 were $137.5 million, a decrease of $34.2 million, or 19.9%, compared to $171.7 million for the year ended December 31, 2019. The decrease was primarily driven by Ad Astra costs of $15.5 million, which prior to its acquisition by us were included in Non-advertising costs of providing services. The remaining decrease year over year in Non-advertising costs of providing services was due to (i) lower underwriting and other variable costs as a result of lower demand, (ii) lower collection costs resulting from stimulus-related pay-downs and (iii) lower discretionary variable compensation.
Advertising costs decreased $6.0 million, or 12.9%, year over year because of COVID-19 Impacts.
Corporate, district and other expenses were $137.2 million for the year ended December 31, 2020, a decrease of $1.0 million, or 0.7%, compared to the year ended December 31, 2019. Corporate, district and other expenses for the year ended December 31, 2020 included $9.6 million of collection costs related to Ad Astra, which were historically included in Non-advertising costs of providing services. For the year ended December 31, 2020, corporate, district and other costs included (i) $5.7 million of legal and other costs described in our reconciliation to Adjusted Net Income above and (ii) $12.9 million of share-based compensation costs. For the year ended December 31, 2019, corporate, district and other expenses included (i) U.K. related costs of $8.8 million as described in our reconciliation to Adjusted Net Income above, (ii) $4.7 million of legal and other costs also described in our reconciliation to Adjusted Net Income above and (iii) share-based compensation costs of $10.3 million. Share-based compensation costs increased primarily as a result of awards granted in the first quarter of 2020.
Excluding these items, comparable corporate, district and other expenses decreased $5.4 million year over year, primarily due to the timing and extent of variable compensation and certain cost reductions, including work-from-home initiatives, to manage COVID-19 Impacts, partially offset by higher professional fees for the year ended December 31, 2020.
As described above, and given the two-month lag, we recorded equity income from our investment in Katapult of $4.5 million for the year ended December 31, 2020.
U.S. interest expense for the year ended December 31, 2020 increased $4.1 million, or 6.9%, as a result of higher borrowings year-over-year, including the new Non-Recourse U.S. SPV Facility, which we closed in April 2020.
| | | | | | | | | | | | | | | | | | | | | | | | | | | | | |
| Canada Segment Results | Three Months Ended December 31, | | Year Ended December 31, |
| (dollars in thousands, unaudited) | 2020 | 2019 | Change $ | Change % | | 2020 | 2019 | Change $ | Change % |
| Revenue | $ 55,490 | | $ 62,022 | | ($ 6,532) | | (10.5) | % | | $ 208,872 | | $ 228,291 | | ($ 19,419) | | (8.5) | % |
| Provision for losses | 10,724 | | 18,713 | | (7,989) | | (42.7) | % | | 58,647 | | 76,446 | | (17,799) | | (23.3) | % |
| Net revenue | 44,766 | | 43,309 | | 1,457 | | 3.4 | % | | 150,225 | | 151,845 | | (1,620) | | (1.1) | % |
| Advertising | 1,075 | | 1,392 | | (317) | | (22.8) | % | | 3,850 | | 6,663 | | (2,813) | | (42.2) | % |
| Non-advertising costs of providing services | 17,507 | | 17,450 | | 57 | | 0.3 | % | | 68,207 | | 69,518 | | (1,311) | | (1.9) | % |
| Total cost of providing services | 18,582 | | 18,842 | | (260) | | (1.4) | % | | 72,057 | | 76,181 | | (4,124) | | (5.4) | % |
| Gross margin | 26,184 | | 24,467 | | 1,717 | | 7.0 | % | | 78,168 | | 75,664 | | 2,504 | | 3.3 | % |
| Corporate, district and other expenses | 5,239 | | 5,306 | | (67) | | (1.3) | % | | 22,701 | | 21,923 | | 778 | | 3.5 | % |
| Interest expense | 2,344 | | 2,607 | | (263) | | (10.1) | % | | 9,296 | | 10,438 | | (1,142) | | (10.9) | % |
| | | | | | | | | |
| Total operating expense | 7,583 | | 7,913 | | (330) | | (4.2) | % | | 31,997 | | 32,361 | | (364) | | (1.1) | % |
| Segment operating income | 18,601 | | 16,554 | | 2,047 | | 12.4 | % | | 46,171 | | 43,303 | | 2,868 | | 6.6 | % |
| Interest expense | 2,344 | | 2,607 | | (263) | | (10.1) | % | | 9,296 | | 10,438 | | (1,142) | | (10.9) | % |
| Depreciation and amortization | 1,108 | | 1,187 | | (79) | | (6.7) | % | | 4,506 | | 4,814 | | (308) | | (6.4) | % |
| EBITDA | 22,053 | | 20,348 | | 1,705 | | 8.4 | % | | 59,973 | | 58,555 | | 1,418 | | 2.4 | % |
| Legal and other costs | — | | — | | — | | | | — | | 135 | | (135) | | |
| | | | | | | | | |
| | | | | | | | | |
| Canada GST adjustment | — | | — | | — | | | | 2,160 | | — | | 2,160 | | |
| Other adjustments | 105 | | (86) | | 191 | | | | 685 | | 211 | | 474 | | |
| Adjusted EBITDA | $ 22,158 | | $ 20,262 | | $ 1,896 | | 9.4 | % | | $ 62,818 | | $ 58,901 | | $ 3,917 | | 6.7 | % |
| | | | | | | |
Canada Segment Results - For the Three Months Ended December 31, 2020 and 2019
Canada gross loans receivable increased $27.9 million, or 9.2% ($20.3 million, or 6.7%, on a constant-currency basis) from the prior year. However, Canada revenue decreased $6.5 million, or 10.5% ($7.3 million, or 11.7%, on a constant-currency basis), to $55.5 million for the three months ended December 31, 2020, from $62.0 million in the prior-year period, as a result of the declines in Single-Pay gross loans receivable previously described, partially offset by increases in Open-End gross loans receivable. Sequentially, Canada revenue increased $6.3 million, or 12.9%, driven by increases in Open-End, Single-Pay and ancillary revenue.
Canada non-Single-Pay revenue increased $3.1 million, or 7.2% ($2.5 million, or 5.9%, on a constant-currency basis), to $45.4 million, compared to $42.4 million in the prior-year period, on growth of $45.6 million, or 17.1% ($38.5 million, or 14.4%, on a constant-currency basis), in related loan balances. Ancillary revenue, which includes sales of insurance to Open-End loan customers, decreased $0.3 million, or 2.2% ($0.4 million, or 3.4% on a constant-currency basis). The decrease was driven by additional insurance claims from consumers impacted by COVID-19 during the fourth quarter of 2020.
Single-Pay revenue decreased $9.6 million, or 48.9% ($9.7 million, or 49.5%, on a constant-currency basis), to $10.1 million for the three months ended December 31, 2020, and Single-Pay receivables decreased $17.7 million, or 49.6% ($18.2 million, or 50.7% on a constant-currency basis), to $18.1 million, from $35.8 million, in the prior-year period. The decreases in Single-Pay revenue and receivables were due to a continued shift to Open-End loans from Single-Pay, as well as a significant decline in demand attributable to COVID-19 Impacts. Sequentially, Single-Pay revenue increased $1.0 million, or 11.3%, on $1.4 million, or 8.3%, growth in related receivables, driven by normal seasonality.
The provision for losses decreased $8.0 million, or 42.7% ($8.1 million, or 43.2%, on a constant-currency basis), to $10.7 million for the three months ended December 31, 2020, compared to $18.7 million in the prior-year period. The decrease in provision for loan losses was primarily a result of lower loan volume and lower NCOs as a result of COVID-19 Impacts as previously described. On a quarterly basis, loss rates improved approximately 326 bps, or 48.0%, year over year due to favorable loan performance as a result of COVID-19 Impacts and overall portfolio maturation.
Canada cost of providing services for the three months ended December 31, 2020 was $18.6 million, a decrease of $0.3 million, or 1.4% ($0.5 million, or 2.6%, on a constant-currency basis), compared to $18.8 million for the three months ended December 31, 2019, primarily related to certain cost reductions to manage COVID-19 Impacts and closely targeted advertising efforts while managing growth during the fourth quarter of 2020.
Canada operating expenses for the three months ended December 31, 2020 were $7.6 million, a decrease of $0.3 million, or 4.2% ($0.4 million, or 5.5%, on a constant-currency basis), compared to $7.9 million in the prior-year period, primarily as a result of lower interest expense from lower year-over-year borrowings on our Non-Recourse Canada SPV Facility.
Canada Segment Results - For the Year Ended December 31, 2020 and 2019
Canada revenue decreased $19.4 million, or 8.5% ($17.5 million, or 7.7%, on a constant-currency basis), to $208.9 million for the year ended December 31, 2020, from $228.3 million in the prior year. Sequentially, revenue increased $6.3 million, or 12.9%, on growth of $38.1 million, or 13.0%, in related loan balances.
Canada non-Single-Pay revenue increased $14.6 million, or 9.7% ($16.1 million, or 10.8%, on a constant-currency basis), to $164.4 million, compared to $149.8 million in the prior year, on growth of $45.6 million, or 17.1% ($38.5 million, or 14.4%, on a constant-currency basis), in related loan balances. The increase was driven by continued growth of Open-End loan despite COVID-19 related impacts. Ancillary revenue, which includes sales of insurance to Open-End loan customers, remained flat year over year due to increased insurance claims from consumers impacted by COVID-19 during the year ended December 31, 2020.
Single-Pay revenue decreased $34.0 million, or 43.3% ($33.6 million, or 42.8%, on a constant-currency basis), to $44.5 million for the year ended December 31, 2020, and Single-Pay receivables decreased $17.7 million, or 49.6% ($18.2 million, or 50.7% on a constant-currency basis), to $18.1 million from $35.8 million, in the prior year. The decreases in Single-Pay revenue and receivables were due to product mix shift from Single-Pay loans to Open-End loans, as well as significant declines in demand attributable to COVID-19 Impacts.
The provision for losses decreased $17.8 million, or 23.3% ($17.0 million, or 22.3%, on a constant-currency basis), to $58.6 million for the year ended December 31, 2020, compared to $76.4 million in the prior year. The decrease in provision for loan losses was primarily a result of lower NCOs and favorable loan performance as a result of COVID-19 Impacts as discussed previously. Year-over-year Canada NCOs decreased $26.2 million, or 32.5%.
Canada cost of providing services for the year ended December 31, 2020 was $72.1 million, a decrease of $4.1 million, or 5.4% ($3.4 million, or 4.5%, on a constant-currency basis), compared to $76.2 million for the year ended December 31, 2019, primarily related to certain cost reductions to manage COVID-19 Impacts, as well as efficient and strategic advertising efforts through the course of 2020 to manage growth in Canada.
Canada operating expenses for the year ended December 31, 2020 were $32.0 million, a decrease of $0.4 million, or 1.1%, as a result of certain cost reductions to manage COVID-19 Impacts, partially offset by costs related to year-over-year growth in Canada.
Results of Discontinued Operations
On February 25, 2019, in accordance with the provisions of the U.K. Insolvency Act 1986 and as approved by the Boards of Directors of the U.K. Subsidiaries, insolvency practitioners from KPMG were appointed as Administrators for the U.K. Subsidiaries. The effect of the U.K. Subsidiaries’ entry into administration was to place their management, affairs, business and property of the U.K. Subsidiaries under the direct control of the Administrators. Accordingly, we deconsolidated the U.K. Subsidiaries, which comprised the U.K. reportable operating segment, as of February 25, 2019 and classified them as Discontinued Operations for all periods presented.
The following table presents the results of operations of the U.K. Subsidiaries, which meet the criteria of Discontinued Operations and, therefore, are excluded from our results of continuing operations:
| | | | | | | | | | | | | | | | | | | | | | | | | | | | |
| (in thousands, unaudited) | Three Months Ended December 31, | | Year Ended December 31, | | | | | |
| 2020 | 2019 | | 2020 | 2019(1) | | | | | | | | | | | |
| Revenue | $ — | | $ — | | | $ — | | $ 6,957 | | | | | | | | | | | | |
| Provision for losses | — | | — | | | — | | 1,703 | | | | | | | | | | | | |
| Net revenue | — | | — | | | — | | 5,254 | | | | | | | | | | | | |
| Cost of providing services | — | | — | | | — | | 1,082 | | | | | | | | | | | | |
| Corporate, district and other expenses | — | | — | | | — | | 3,806 | | | | | | | | | | | | |
| | | | | | | | | | | | | | | | |
| | | | | | | | | | | | | | | | |
| | | | | | | | | | | | | | | | |
| (Gain) loss on disposition | — | | — | | | (1,714) | | 39,414 | | | | | | | | | | | | |
| Pre-tax income (loss) from Discontinued Operations | — | | — | | | 1,714 | | (39,048) | | | | | | | | | | | | |
| | | | | | | | | | | | | | | | |
| | | | | | | | | | | | | | | | |
| Income tax (benefit) expense related to disposition | — | | (647) | | | 429 | | (46,638) | | | | | | | | | | | | |
| Net income from discontinued operations | $ — | | $ 647 | | | $ 1,285 | | $ 7,590 | | | | | | | | | | | | |
| (1) Includes U.K. Subsidiaries financial results from January 1, 2019 to February 25, 2019. | | | | | | | | | | | |
Revenue and expenses related to discontinued operations included activity prior to the deconsolidation of the U.K. subsidiaries effective February 25, 2019. For the year ended December 31, 2019, (Gain) Loss on disposition of $39.4 million included the non-cash effect of eliminating assets and liabilities of the U.K. Subsidiaries as of the date of deconsolidation, as well as the effect of cumulative currency exchange rate differences on the U.S. investment in the U.K.
In connection with the disposition of the U.K. Subsidiaries, the U.S. entity that owned our interests in the U.K. Subsidiaries recognized a loss on investment. This loss resulted in an estimated U.S. Federal and state income tax benefit of $46.6 million, which will be available to offset our future income tax obligations. In the fourth quarter of 2019, we revised the estimate of our tax basis in the U.K. Subsidiaries, resulting in a $0.6 million addition in the income tax benefit recorded in the first quarter of 2019.
During the year ended December 31, 2020, we received our final distribution from the Administrators related to the wind-down of the U.K. Subsidiaries, in the amount of $1.7 million.
CURO GROUP HOLDINGS CORP. AND SUBSIDIARIES
CONSOLIDATED BALANCE SHEETS
(in thousands)
| | | | | | | | | | | |
| December 31, 2020 (unaudited) | | December 31, 2019 |
| | | |
| ASSETS |
| Cash and cash equivalents | $ 213,343 | | | $ 75,242 | |
| Restricted cash (includes restricted cash of consolidated VIEs of $31,994 and $17,427 as of December 31, 2020 and December 31, 2019, respectively) | 54,765 | | | 34,779 | |
| Gross loans receivable (includes loans of consolidated VIEs of $360,431 and $244,492 as of December 31, 2020 and December 31, 2019, respectively) | 553,722 | | | 665,828 | |
| Less: Allowance for loan losses (includes allowance for losses of consolidated VIEs of $54,129 and $24,425 as of December 31, 2020 and December 31, 2019, respectively) | (86,162) | | | (106,835) | |
| Loans receivable, net | 467,560 | | | 558,993 | |
| Income taxes receivable | 32,062 | | | 11,426 | |
| Prepaid expenses and other (includes prepaid expenses and other of consolidated VIEs of $388 as of December 31, 2020) | 27,994 | | | 35,890 | |
| Property and equipment, net | 59,749 | | | 70,811 | |
| Investments | 27,370 | | | 10,068 | |
| Right of use asset - operating leases | 115,032 | | | 117,453 | |
| Deferred tax assets | — | | | 5,055 | |
| Goodwill | 136,091 | | | 120,609 | |
| Other intangibles, net | 40,425 | | | 33,927 | |
| Other assets | 8,595 | | | 7,642 | |
| | | |
| Total Assets | $ 1,182,986 | | | $ 1,081,895 | |
| LIABILITIES AND STOCKHOLDERS' EQUITY |
| Liabilities | | | |
| Accounts payable and accrued liabilities (includes accounts payable and accrued liabilities of consolidated VIEs of $34,055 and $13,462 as of December 31, 2020 and December 31, 2019, respectively) | $ 49,624 | | | $ 60,083 | |
| Deferred revenue | 5,394 | | | 10,170 | |
| Lease liability - operating leases | 122,648 | | | 124,999 | |
| | | |
| Accrued interest (includes accrued interest of consolidated VIEs of $1,147 and $871 as of December 31, 2020 and December 31, 2019, respectively) | 20,123 | | | 19,847 | |
| Liability for losses on CSO lender-owned consumer loans | 7,228 | | | 10,623 | |
| | | |
| Debt (includes debt and issuance costs of consolidated VIEs of $147,427 and $7,766 as of December 31, 2020 and $115,243 and $3,022 as of December 31, 2019, respectively) | 819,661 | | | 790,544 | |
| | | |
| Other long-term liabilities | 15,382 | | | 10,664 | |
| Deferred tax liabilities | 11,021 | | | 4,452 | |
| | | |
| Total Liabilities | $ 1,051,081 | | | $ 1,031,382 | |
| | | |
| Stockholders' Equity | | | |
| | | |
| | | |
| | | |
| | | |
| | | |
| | | |
| Total Stockholders' Equity | $ 131,905 | | | $ 50,513 | |
| Total Liabilities and Stockholders' Equity | $ 1,182,986 | | | $ 1,081,895 | |
Balance Sheet Changes - December 31, 2020 Compared to December 31, 2019
Cash and cash equivalents - The increase in Cash from December 31, 2019 was primarily due to lower demand for loan products due to impacts from COVID-19 and the run-off of the California Installment loan portfolios stemming from regulatory changes effective January 1, 2020.
Restricted cash - The increase in Restricted cash from December 31, 2019 was primarily due to growth in our Canada receivables in which certain eligible receivables are pledged as collateral under the Non-Recourse Canada SPV Facility, growth in Revolve and Opt+ products, and our new Non-Recourse U.S. SPV Facility, which we closed in April 2020.
Gross loans receivable and Allowance for loan losses - As noted in "Loan Volume and Portfolio Performance Analysis" above, changes in Gross loans receivable and related Allowance for loan losses were due to expected lower customer demand and loan origination volumes as a result of COVID-19 impacts and regulatory changes in California effective January 1, 2020.
Income taxes receivable and Deferred tax liabilities - The change in Income taxes receivable and Deferred tax liabilities resulted from the NOL carry-backs, as allowed by the CARES Act. See "Results of Consolidated Operations" for additional details.
Investments - Investments include our equity method investment in Katapult as well as our investment in Katapult through preferred shares not subject to equity method accounting. Prior to the third quarter of 2020, our entire investment in Katapult was accounted for under the equity method and was presented within Prepaid expenses and other. The entire balance is now presented separate within Investments in the Consolidated Balance Sheets. The increase in Investments from December 31, 2019 is the result of the acquisition of additional interests from other investors for $12.8 million during the third and fourth quarters of 2020, and the recognition of equity method income of $4.5 million as previously described.
Goodwill - The increase in Goodwill from December 31, 2019 was due to our acquisition of Ad Astra on January 3, 2020, which resulted in $14.8 million of goodwill, as well as foreign currency rate changes.
Liability for losses on CSO lender-owned consumer loans - As noted in "Loan Volume and Portfolio Performance Analysis" above, changes in Liability for losses on CSO lender-owned consumer loans were due to expected lower customer demand and loan origination volumes as a result of COVID-19.
Debt - The increase in Debt from December 31, 2019 was due to $43.6 million of net draws on our new Non-Recourse U.S. SPV Facility, net of deferred financing costs, partially offset by a net reduction in the Non-Recourse Canada SPV Facility.
Debt Capitalization Summary
(December 31, 2020 balances in thousands, net of deferred financing costs)
| | | | | | | | | | | | | | | | | | | | |
| | Capacity | Interest Rate | Maturity | Counter-parties | Balance as of December 31, 2020 |
| | | | | | |
| | | | | | |
Non-Recourse Canada SPV Facility (1) | | C$175.0 million | 3-Mo CDOR + 6.75% | September 2, 2023 | Waterfall Asset Management | $ 96,075 | |
| Senior Secured Revolving Credit Facility | | $50.0 million | 1-Mo LIBOR + 5.00% | June 30, 2021 | BayCoast Bank; Stride Bank; Hancock-Whitney Bank; Metropolitan Commercial Bank | — | |
| | | | | | |
| | | | | | |
| | | | | | |
| Non-Recourse U.S. SPV Facility | | $200.0 million | 1-Mo LIBOR + 6.25%(2) | April 8, 2024 | Atalaya Capital Management, MetaBank | 43,586 | |
Cash Money Revolving Credit Facility (1) | | C$10.0 million | Canada Prime Rate +1.95% | On-demand | Royal Bank of Canada | — | |
| 8.25% Senior Secured Notes (due 2025) | | $690.0 million | 8.25% | September 1, 2025 | | 680,000 | |
| (1) Capacity amounts are denominated in Canadian dollars, while outstanding balances as of December 31, 2020 are denominated in U.S. dollars. |
|
(2) The Non-Recourse U.S. SPV Facility initially provided for $100.0 million of borrowing capacity, which increased to $200.0 million on July 31, 2020 following additional commitments. As a result of the increase in commitments, interest now accrues at an annual rate of one-month LIBOR (with a floor of 1.65%) plus the lesser of (i) 6.95% and (ii) the sum of (a) 6.25% on balances up to $145.5 million and (b) 9.75% on balances greater than $145.5 million. |
Non-GAAP Financial Measures
In addition to the financial information prepared in conformity with U.S. GAAP, we provide certain “non-GAAP financial measures,” including:
•Adjusted Net Income and Adjusted Earnings Per Share, or the Adjusted Earnings Measures (net income from continuing operations plus or minus restructuring and other costs, certain legal and other costs, income or loss from equity method investment, goodwill and intangible asset impairments, certain costs related to the disposition of U.K., transaction-related costs, share-based compensation, intangible asset amortization, certain tax adjustments and impacts from tax law changes and cumulative tax effect of applicable adjustments, on a total and per share basis);
•EBITDA (earnings before interest, income taxes, depreciation and amortization);
•Adjusted EBITDA (EBITDA plus or minus certain non-cash and other adjusting items);
•Adjusted effective income tax rate (effective tax rate plus or minus certain non-cash and other adjusting items); and
•Gross Combined Loans Receivable (includes loans originated by third-party lenders through CSO programs which are not included in the Consolidated Financial Statements).
We believe that presentation of non-GAAP financial information is meaningful and useful in understanding the activities and business metrics of the Company's operations. We believe that these non-GAAP financial measures reflect an additional way of viewing aspects of the business that, when viewed with the Company's U.S. GAAP results, provide a more complete understanding of factors and trends affecting the business.
We believe that investors regularly rely on non-GAAP financial measures, such as Adjusted Net Income, Adjusted Earnings per Share, EBITDA and Adjusted EBITDA, to assess operating performance and that such measures may highlight trends in the business that may not otherwise be apparent when relying on financial measures calculated in accordance with U.S. GAAP. In addition, we believe that the adjustments shown above are useful to investors in order to allow them to compare our financial results during the periods shown without the effect of each of these income or expense items. In addition, we believe that Adjusted Net Income, Adjusted Earnings per Share, EBITDA and Adjusted EBITDA are frequently used by securities analysts, investors and other interested parties in the evaluation of public companies in our industry, many of which present Adjusted Net Income, Adjusted Earnings per Share, EBITDA and/or Adjusted EBITDA when reporting their results.
In addition to reporting loans receivable information in accordance with U.S. GAAP, we provide Gross Combined Loans Receivable consisting of owned loans receivable plus loans originated by third-party lenders through the CSO programs, which we guarantee but do not include in the Consolidated Financial Statements. Management believes this analysis provides investors with important information needed to evaluate overall lending performance.
We provide non-GAAP financial information for informational purposes and to enhance understanding of the U.S. GAAP Consolidated Financial Statements. Adjusted Net Income, Adjusted Earnings per Share, EBITDA, Adjusted EBITDA and Gross Combined Loans Receivable should not be considered as alternatives to income from continuing operations, segment operating income, or any other performance measure derived in accordance with U.S. GAAP, or as an alternative to cash flows from operating activities or any other liquidity measure derived in accordance with U.S. GAAP. Readers should consider the information in addition to, but not instead of or superior to, the financial statements prepared in accordance with U.S. GAAP. This non-GAAP financial information may be determined or calculated differently by other companies, limiting the usefulness of those measures for comparative purposes.
Description and Reconciliations of Non-GAAP Financial Measures
Adjusted Net Income, Adjusted Earnings per Share, EBITDA and Adjusted EBITDA Measures have limitations as analytical tools, and you should not consider these measures in isolation or as a substitute for analysis of our income or cash flows as reported under U.S. GAAP. Some of these limitations are:
•they do not include cash expenditures or future requirements for capital expenditures or contractual commitments;
•they do not include changes in, or cash requirements for, working capital needs;
•they do not include the interest expense, or the cash requirements necessary to service interest or principal payments on debt;
•depreciation and amortization are non-cash expense items reported in the statements of cash flows; and
•other companies in our industry may calculate these measures differently, limiting their usefulness as comparative measures.
We calculate Adjusted Earnings per Share utilizing diluted shares outstanding at year-end. If the Company records a loss from continuing operations under U.S. GAAP, shares outstanding utilized to calculate Diluted Earnings per Share from continuing operations are equivalent to basic shares outstanding. Shares outstanding utilized to calculate Adjusted Earnings per Share from continuing operations reflect the number of diluted shares the Company would have reported if reporting net income from continuing operations under U.S. GAAP.
As noted above, Gross Combined Loans Receivable includes loans originated by third-party lenders through CSO programs which are not included in the consolidated financial statements but from which we earn revenue and for which we provide a guarantee to the lender. Management believes this analysis provides investors with important information needed to evaluate overall lending performance.
We believe Adjusted Net Income, Adjusted Earnings per Share, EBITDA and Adjusted EBITDA are used by investors to analyze operating performance and to evaluate our ability to incur and service debt and the capacity for making capital expenditures. Adjusted EBITDA is also useful to investors to help assess our estimated enterprise value. The computation of Adjusted EBITDA as presented in this release may differ from the computation of similarly-titled measures provided by other companies.
Forward-Looking Statements
This press release contains forward-looking statements. These forward-looking statements include projections, estimates and assumptions about the impact of the Katapult merger on us, including the potential value we expect to receive, the mix of cash and stock, potential earn out, and resulting ownership position; the expected timing of the Katapult merger; the expected financial and operational benefits of our acquisition of Flexiti Financial; and our belief in the usefulness of the various non-GAAP financial measures used in this release. In addition, words such as “guidance,” “estimate,” “anticipate,” “believe,” “forecast,” “step,” “plan,” “predict,” “focused,” “project,” “is likely,” “expect,” “intend,” “should,” “will,” “confident,” variations of such words and similar expressions are intended to identify forward-looking statements. Our ability to achieve these forward-looking statements is based on certain assumptions, judgments and other factors, both within and outside of our control, that could cause actual results to differ materially from those in the forward-looking statements, including: the inability of the parties to the Katapult transaction to successfully or timely consummate the proposed business combination, including the risk that any required regulatory approvals are not obtained, are delayed or are subject to unanticipated conditions that could adversely affect the combined company or the
expected benefits of the proposed transaction or that the approval of FinServ stockholders is not obtained; failure to realize the anticipated benefits of the proposed Katapult transaction; risks relating to the uncertainty of projected financial information with respect to Katapult; the effects of competition on Katapult’s future business; Katapult’s ability to attract and retain customers; market, financial, political and legal conditions; the impact of COVID-19 pandemic on Katapult’s and our business and the global economy; risks related to the concentration of Katapult’s business among a relatively small number of merchants; the ability of FinServ or the combined company to issue equity or equity-linked securities or obtain debt financing in connection with the proposed business combination or in the future; our dependence on third-party lenders to provide the cash we need to fund our loans and our ability to affordably access third-party financing; errors in our internal forecasts; our level of indebtedness; our ability to integrate acquired businesses; our dependence on third-party lenders to provide the cash we need to fund our loans and our ability to affordably access third-party financing; actions of regulators and the negative impact of those actions on our business; our ability to protect our proprietary technology and analytics and keep up with that of our competitors; disruption of our information technology systems that adversely affect our business operations; ineffective pricing of the credit risk of our prospective or existing customers; inaccurate information supplied by customers or third parties that could lead to errors in judging customers’ qualifications to receive loans; improper disclosure of customer personal data; failure of third parties who provide products, services or support to us; any failure of third-party lenders upon whom we rely to conduct business in certain states; disruption to our relationships with banks and other third-party electronic payment solutions providers; disruption caused by employee or third-party theft and errors in our stores as well as other factors discussed in our filings with the Securities and Exchange Commission. These projections, estimates and assumptions may prove to be inaccurate in the future. These forward-looking statements are not guarantees of future performance and involve known and unknown risks and uncertainties that are difficult to predict with regard to timing, extent, likelihood and degree of occurrence. There may be additional risks that CURO presently does not know or that it currently believes are immaterial that could also cause actual results to differ from those contained in the forward-looking statements. Given these risks and uncertainties, investors should not place undue reliance on forward-looking statements as a prediction of actual future results. We undertake no obligation to update, amend or clarify any forward-looking statement for any reason.
About CURO
CURO Group Holdings Corp. (NYSE: CURO), operating in two countries and powered by its fully integrated technology platform, is a provider of credit to non-prime consumers. In 1997, the Company was founded in Riverside, California by three Wichita, Kansas childhood friends to meet the growing consumer need for short-term loans. Their success led to opening stores across the United States and expanding to offer online loans and financial services across two countries. Today, CURO combines its market expertise with a fully integrated technology platform, omni-channel approach and advanced credit decisioning to provide an array of credit products across all mediums. CURO operates under a number of brands including Speedy Cash®, Rapid Cash®, Cash Money®, LendDirect®, Avío Credit®, Opt+® and Revolve Finance®. With over 20 years of operating experience, CURO provides financial freedom to non-prime consumers.
Conference Call
CURO will host a conference call to discuss these results at 8:15 a.m. Eastern Time on Friday, February 5, 2021. The live webcast of the call can be accessed at the CURO Investor Relations website at http://ir.curo.com/.
You may access the call at 1-866-807-9684 (1-412-317-5415 for international callers). Please ask to join the CURO Group Holdings call. A replay of the conference call will be available until February 12, 2021, at 8:15 a.m. Eastern Time. An archived version of the webcast will be available on the CURO Investors website for 90 days. You may access the conference call replay at 1-877-344-7529 (1-412-317-0088 for international callers). The replay access code is 10151924.
Final Results
The financial results presented and discussed herein are on a preliminary and unaudited basis; final audited data will be included in the Company’s Annual Report on Form 10-K for the year ended December 31, 2020.
Investor Relations:
Roger Dean
Executive Vice President and Chief Financial Officer
Phone: 844-200-0342
Or
Financial Profiles, Inc.
(CURO-NWS)