
curo-20220502
false000171129100017112912022-05-022022-05-02

UNITED STATES
SECURITIES AND EXCHANGE COMMISSION
WASHINGTON, DC 20549
_______________________________________________________________________
FORM 8-K
__________________________________________________________________________
 
CURRENT REPORT PURSUANT
TO SECTION 13 OR 15(d) OF THE
SECURITIES EXCHANGE ACT OF 1934
Date of report (Date of earliest event reported): May 2, 2022
________________________________________________________________________
CURO GROUP HOLDINGS CORP.
(Exact Name of Registrant as Specified in Its Charter)
________________________________________________________________________
Delaware001-3831590-0934597
(State or other Jurisdiction of Incorporation)(Commission File Number)(IRS Employer Identification No.)
3615 North Ridge Road, Wichita, Kansas
67205
(Address of Principal Executive Offices)(Zip Code)

(316) 772-3801
(Registrant’s Telephone Number, Including Area Code)
N/A
(Former Name or Former Address, if Changed Since Last Report)
________________________________________________________________________
Check the appropriate box below if the Form8-K filing is intended to simultaneously satisfy the filing obligation of the registrant under any of the following provisions:
Written communications pursuant to Rule 425 under the Securities Act (17 CFR 230.425)
Soliciting material pursuant to Rule 14a-12 under the Exchange Act (17 CFR 240.14a-12)
Pre-commencement communications pursuant to Rule 14d-2(b) under the Exchange Act (17 CFR 240.14d-2(b))
Pre-commencement communications pursuant to Rule 13e-4(c) under the Exchange Act (17 CFR 240.13e-4(c))

Securities registered pursuant to Section 12(b) of the Act:
Title of each classTrading symbol(s)Name of each exchange on which registered
Common stockCURONYSE

Indicate by check mark whether the registrant is an emerging growth company as defined in Rule 405 of the Securities Act of 1933 (§230.405 of this chapter) or Rule12b-2of the Securities Exchange Act of 1934(§240.12b-2of this chapter).

    Emerging growth company  

If an emerging growth company, indicate by check mark if the registrant has elected not to use the extended transition period for complying with any new or revised financial accounting standards provided pursuant to Section 13(a) of the Exchange Act.  ☐


ITEM 2.02     Results of Operations and Financial Condition

On May 2, 2022, CURO Group Holdings Corp. (the “Company”) issued a press release announcing its financial results for the three months ended March 31, 2022. A copy of the press release and a supplemental presentation that will be used in conjunction with its earnings call with investors on May 2, 2022 is attached hereto as Exhibit 99.1 and Exhibit 99.2, respectively, and is incorporated herein by reference.

The information in this item, including Exhibit 99.1 and Exhibit 99.2, is being furnished, not filed. Accordingly, the information in this item will not be incorporated by reference into any registration statement unless specifically identified therein as being incorporated by reference therein.

ITEM 8.01     Other Events

On April 28, 2022, the Board declared a quarterly cash dividend of $0.11 per share pursuant to its dividend program. The dividend is payable on May 23, 2022 to stockholders of record as of the close of business on May 10, 2022. The declaration and amounts of future dividends are within the discretion of the Board, taking into account such considerations as the Board may deem relevant at the time, including, without limitation, the Company’s financial condition, financial performance, available liquidity and applicable legal requirements.

ITEM 9.01     Financial Statements and Exhibits

(d). Exhibits
Exhibit NumberDescription
99.1
99.2
104Cover Page Interactive Data File (embedded within the Inline XBRL document)

Signatures
Pursuant to the requirements of the Securities Exchange Act of 1934, the registrant has duly caused this report to be signed on its behalf by the undersigned hereunto duly authorized on this 2nd day of May, 2022.

                        CURO Group Holdings Corp.
                        By: /s/ Roger Dean______
                        Roger Dean
                        Executive Vice President and Chief Financial Officer


CURO Group Holdings Corp. Announces
First Quarter 2022 Financial Results

Consolidated Revenue Grew 47.6% in the Quarter Compared to 2021

Wichita, Kansas--May 2, 2022-CURO Group Holdings Corp. (NYSE: CURO) (“CURO” or the “Company”), a tech-enabled, omni-channel consumer finance company serving a full spectrum of non-prime and prime consumers in the U.S. and Canada, today announced financial results for its first quarter ended March 31, 2022.

“We are very pleased to end the first quarter with over $1.6 billion of gross loans receivable – more than doubling our loan book year-over-year,” said Don Gayhardt, CURO’s Chief Executive Officer. “Our Heights Finance acquisition added $462.9 million of growth, but excluding Heights Finance the rest of our company-owned businesses grew loans 59.5% compared to the first quarter of 2021. Sequentially, we grew loans over $80 million or 5.2% despite normal seasonality for U.S. federal tax refunds.”

“Consolidated net charge-off rates improved 90bps compared to the first quarter of 2021 because of our managed portfolio mix shift to larger, longer-term, lower-yielding loans with lower loss rates. Credit performance continues to normalize with portfolio-level net charge-off and past-due rates up year-over-year but improved versus the fourth quarter of 2021.”

“We are very pleased so far with our business results and the talent we added with the acquisition of Heights in December and our combined teams will continue to be intensely focused in the coming months to ensure we execute on the growth and value-creation opportunities."

"Finally, while we are pleased that we are moving into a more manageable phase of the pandemic in both the US and Canada, persistent inflation and related interest rate increases and changing shopping and borrowing habits are adding new complexities to daily operations as well as longer-range forecasting."

Consolidated Summary Results

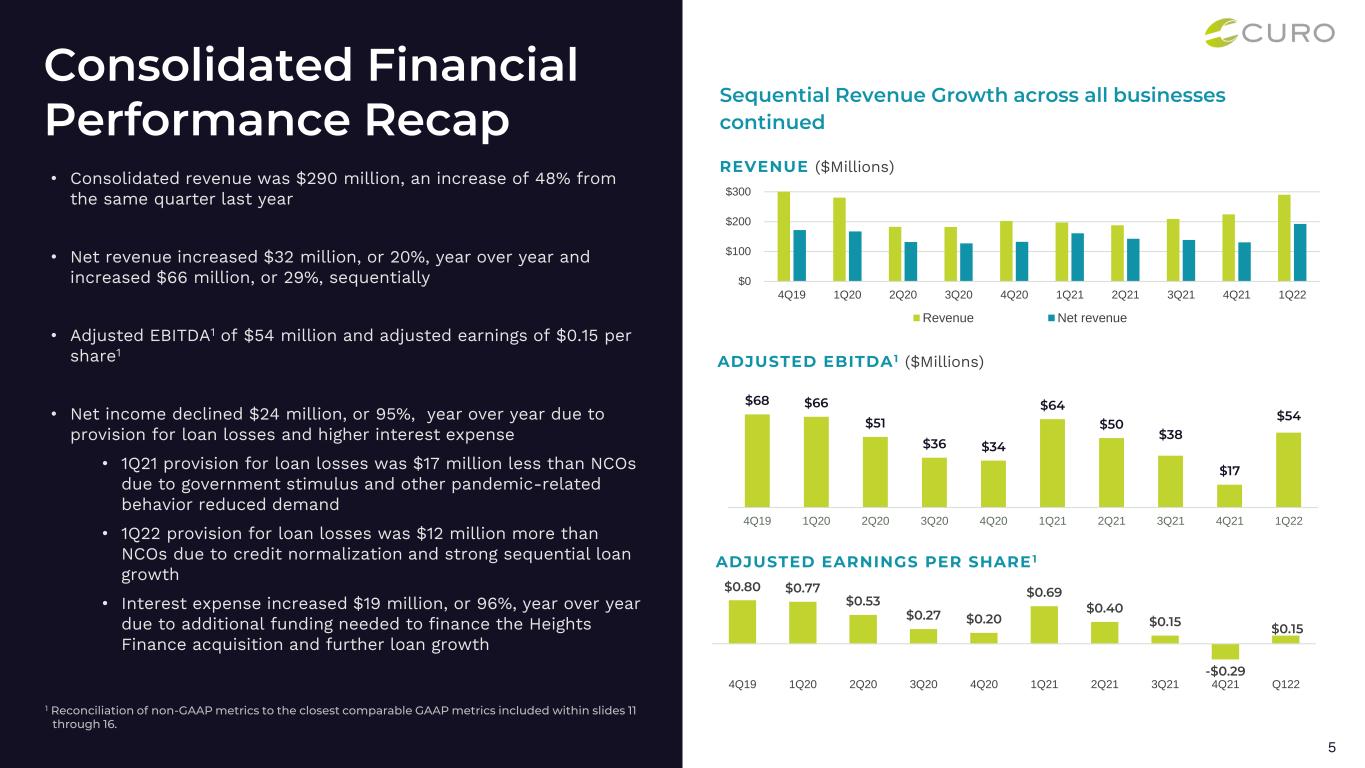
We reported Net income of $1.3 million ($0.03 per share) and Adjusted Net Income of $6.3 million ($0.15 adjusted diluted earnings per share) on revenue of $290.2 million for the three months ended March 31, 2022, compared with Net income of $25.7 million ($0.59 per share) and Adjusted Net Income of $30.1 million ($0.69 adjusted diluted earnings per share) on total revenue of $196.6 million for the three months ended March 31, 2021.

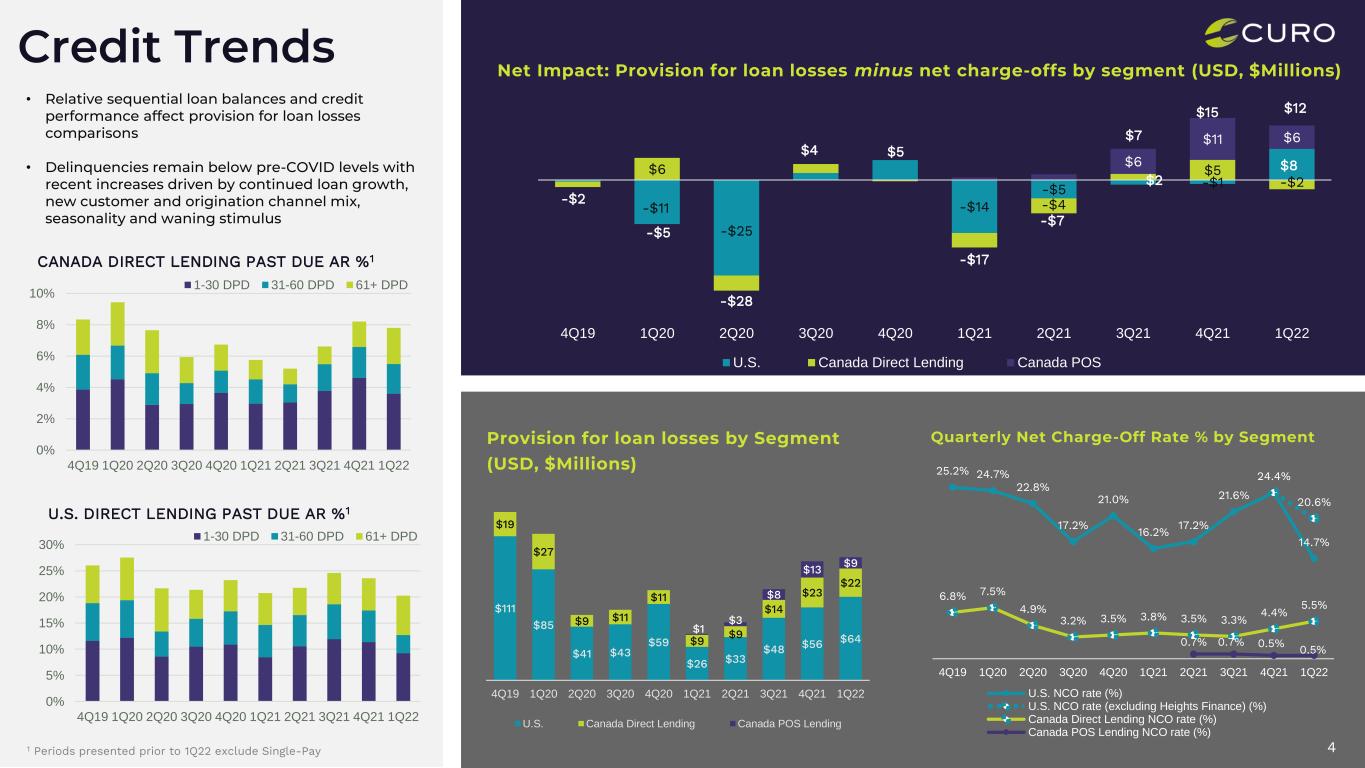
The decline in Net income was primarily driven by year-over-year comparisons for the provision for loan losses and, secondarily, higher interest expense. Government stimulus and other pandemic-related behavior reduced demand, increased payment rates and lowered loss rates in the first quarter of 2021, resulting in a provision for loan losses that was $16.5 million less than net charge-offs ("NCOs"). Credit normalization and strong sequential loan growth in the first quarter of 2022 resulted in a provision for loan losses that exceeded NCOs by $12.1 million, which included the impact of purchase accounting. This shift resulted in a $28.7 million pretax swing year over year. Interest expense increased because of the additional 7.50% Senior Secured Notes issued to finance, in part, (i) the Heights Finance acquisition and (ii) the expansion of non-recourse asset-backed facilities to support loan growth.

Below are additional highlights of our performance during the three months ended March 31, 2022:

Revenue and Net Revenue
Revenue increased $93.6 million, or 47.6%, year over year, primarily driven by our December 27, 2021 acquisition of Heights Finance, which accounted for $65.7 million of revenue for the first quarter of 2022, as well as a full quarter of Canada POS Lending revenue of $20.3 million, compared to a partial quarter of $1.6 million in the prior-year period.
Sequentially, revenue increased $65.9 million, or 29.4%, driven by growth of $59.4 million, or 42.7% in the U.S. due to our acquisition of Heights Finance, $5.5 million, or 37.3%, in Canada POS Lending and $1.0 million, or 1.4%, in Canada Direct Lending.
For the three months ended March 31, 2022, net revenue increased $32.3 million, or 20.1%, year over year, and $62.0 million, or 47.4%, sequentially. The sequential increase was due to seasonality and our acquisition of Heights Finance. Excluding Heights Finance, net revenue increased sequentially $17.0 million, or 13.0%.

Loans Receivable
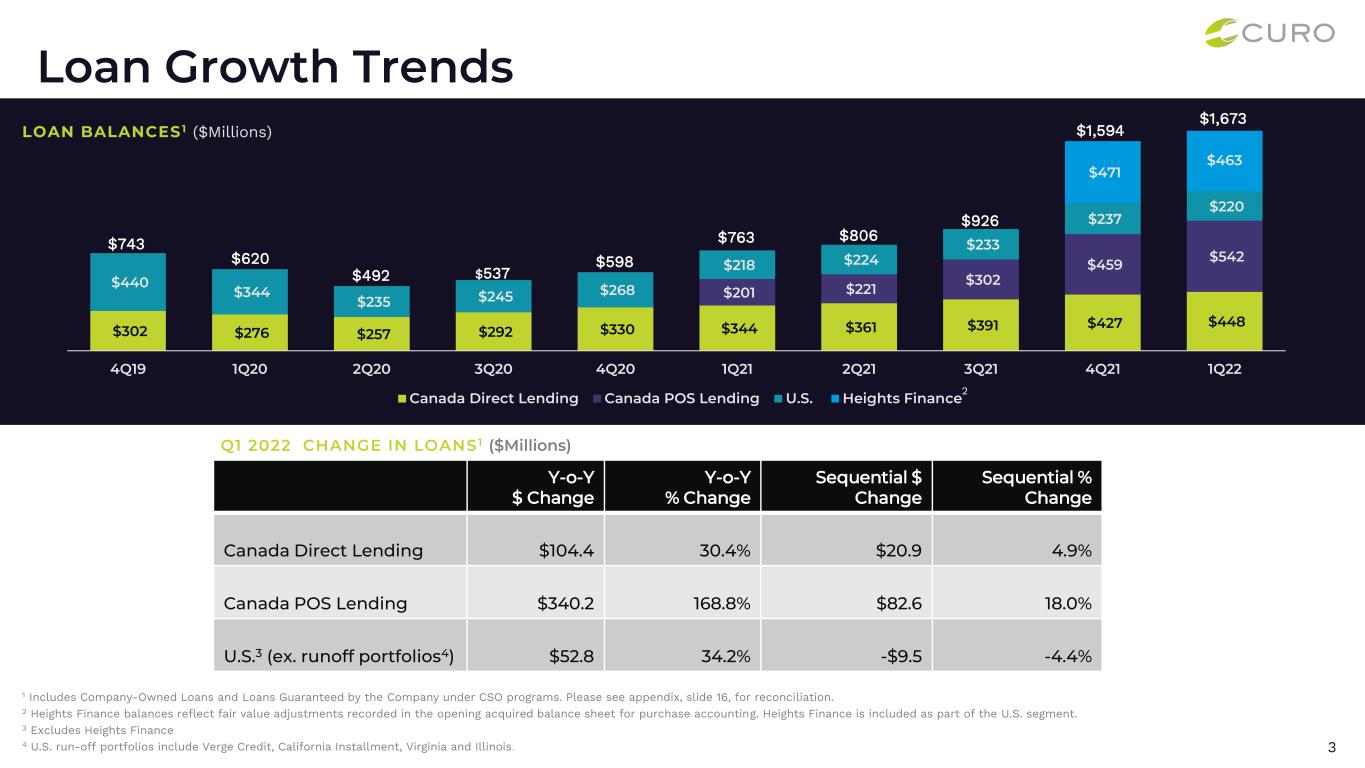
Sequential loan growth in Company Owned gross loans receivable and combined gross loans receivable of $80.3 million, or 5.2%, and $78.4 million, or 4.9%, respectively, was primarily due to growth in Canada POS Lending of $82.6 million, or 18.0%.
Year-over-year growth in Company Owned gross loans receivable and combined gross loans receivable of $897.6 million, or 122.8%, and $909.5 million, or 119.1%, respectively, which included Heights Finance. Excluding Heights Finance, combined gross loans receivables increased $446.7 million, or 58.5%, year over year, primarily driven by $340.2 million, or 168.8%, for Canada POS Lending.
1


NCOs and Delinquency Metrics
Consolidated quarterly NCO rates improved year over year by 90 bps, primarily from the relative growth of Canada POS Lending and the acquisition of Heights Finance, which shifts portfolio mix to lower loss-rate products.
Sequentially, consolidated quarterly NCO rates improved 70 bps.
Consolidated past-due rates increased 190 bps year over year as credit continued to normalize compared to the first quarter of 2021 which was abnormally affected by pandemic-related U.S. government stimulus. Consolidated past-due rates improved by 110 bps sequentially, primarily due to our acquisition of Heights Finance.
Other Highlights
Declaration of the next quarterly dividend of $0.11 per share, payable on May 23, 2022 to stockholders of record as of May 10, 2022.
On March 31, 2022, we expanded our Non-Recourse Canada SPV Facility from C$350.0 million to C$400.0 million, with the ability to expand its committed capacity by an additional C$50 million to support loan growth within Canada Direct Lending and Canada POS Lending.

From the second quarter of 2020 through the first half of 2021, we experienced lower customer demand in the U.S. and Canada Direct Lending, good credit performance, increased or accelerated repayments and favorable payment trends, as customers were aided by government stimulus programs while periodically enduring pandemic lockdowns as a result of COVID-19. From the third quarter of 2021 through the first quarter of 2022, our markets were less affected by COVID-19, resulting in positive growth trends in revenue and receivables.

Results of Consolidated Operations
Beginning January 1, 2022, we began reporting "Interest and fees revenue," "Insurance premiums and commissions" and "Other revenue" in place of our previously reported "Revenue" on our Statements of Operations. Prior period presentations have been revised to conform to the current period presentation.
Table 1 - Consolidated Statements of Operations
(in thousands, unaudited)Three Months Ended March 31,
20222021Change $Change %
Revenue
Interest and fees revenue$264,956 $179,123 $85,833 47.9 %
Insurance premiums and commissions18,260 11,569 6,691 57.8 %
Other revenue6,980 5,859 1,121 19.1 %
Total revenue290,196 196,551 93,645 47.6 %
Change in allowance for loan losses12,112 (16,545)28,657 #
Net-charge offs85,419 52,690 32,729 62.1 %
Provision for losses97,531 36,145 61,386 169.8 %
Net revenue192,665 160,406 32,259 20.1 %
Operating Expenses
Salaries and benefits79,729 54,917 24,812 45.2 %
Occupancy17,037 14,347 2,690 18.7 %
Advertising10,500 8,084 2,416 29.9 %
Direct operations20,274 11,969 8,305 69.4 %
Depreciation and amortization9,814 4,965 4,849 97.7 %
Other operating expense16,112 12,952 3,160 24.4 %
Total operating expenses153,466 107,234 46,232 43.1 %
Other expense (income)
Interest expense38,341 19,539 18,802 96.2 %
Income from equity method investment(1,584)(546)(1,038)#
Total other expense (income)36,757 18,993 17,764 93.5 %
Income before income taxes2,442 34,179 (31,737)(92.9)%
Provision for incomes taxes1,106 8,444 (7,338)(86.9)%
Net income1,336 25,735 (24,399)(94.8)%
# - Variance greater than 100% or not meaningful

2


Table 2 - Consolidated Balance Sheets
(in thousands)
March 31, 2022 (unaudited)
December 31, 2021
ASSETS
Cash and cash equivalents60,209 63,179 
Restricted cash
110,118 98,896 
Gross loans receivable
1,628,568 1,548,318 
Less: Allowance for loan losses
(98,168)(87,560)
Loans receivable, net1,530,400 1,460,758 
Income taxes receivable28,664 31,774 
Prepaid expenses and other
40,112 42,038 
Property and equipment, net54,865 54,635 
Investments in Katapult29,484 27,900 
Right of use asset - operating leases114,305 116,300 
Deferred tax assets20,066 15,639 
Goodwill430,967 429,792 
Intangibles, net113,640 109,930 
Other assets9,535 9,755 
Total Assets2,542,365 2,460,596 
LIABILITIES AND STOCKHOLDERS' EQUITY
Liabilities
Accounts payable and accrued liabilities
$84,783 $121,434 
Deferred revenue24,265 21,649 
Lease liability - operating leases120,593 122,431 
Contingent consideration related to acquisition26,687 26,508 
Income taxes payable— 680 
Accrued interest
16,481 34,974 
Liability for losses on CSO lender-owned consumer loans7,166 6,908 
Debt
2,090,085 1,945,793 
Other long-term liabilities13,679 13,845 
Deferred tax liabilities5,839 6,044 
Total Liabilities2,389,578 2,300,266 
Stockholders' Equity
Total Stockholders' Equity152,787 160,330 
Total Liabilities and Stockholders' Equity2,542,365 2,460,596 


3


Table 3 - Consolidated Revenue by Product and Segment

The following table summarizes revenue by product, including revenue we earn from operating as a credit services organization ("CSO") by charging customers a fee for arranging an unrelated third party to make a loan to that customer, which we refer to as "CSO fees," for the period indicated:
Three Months Ended
March 31, 2022March 31, 2021
(in thousands, unaudited)U.S.Canada Direct LendingCanada POS LendingTotal% of TotalU.S.Canada Direct LendingCanada POS LendingTotal% of Total
Revolving LOC26,913 45,455 18,655 91,023 31.4 %26,923 34,368 1,444 62,735 31.9 %
Installment162,824 11,109 — 173,933 59.9 %105,941 10,447 — 116,388 59.2 %
Total interest and fees189,737 56,564 18,655 264,956 91.3 %132,864 44,815 1,444 179,123 91.1 %
Insurance premiums and commissions5,001 13,023 236 18,260 6.3 %— 11,569 32 11,601 5.9 %
Other revenue3,661 1,901 1,418 6,980 2.4 %3,628 2,056 143 5,827 3.0 %
   Total revenue198,399 71,488 20,309 290,196 100.0 %136,492 58,440 1,619 196,551 100.0 %

Table 4 - Consolidated Loans Receivable

The following table reconciles Company Owned gross loans receivable, a GAAP-basis balance sheet measure, to Gross combined loans receivable, a non-GAAP measure(1). Gross combined loans receivable includes loans originated by third-party lenders through CSO programs, which are not included in the Consolidated Financial Statements but from which we earn revenue by providing a guarantee to the unaffiliated lender.
As of
(in thousands, unaudited)March 31,
2022
December 31,
2021
September 30,
2021
June 30,
2021
March 31,
2021
U.S.
Revolving LOC49,077 52,532 51,196 47,277 43,387 
Installment - Company Owned589,652 609,413 137,987 139,234 142,396 
Canada Direct Lending
Revolving LOC424,485 402,405 366,509 337,700 319,307 
Installment23,578 24,792 24,315 23,564 24,385 
Canada POS Lending
Revolving LOC541,776 459,176 302,349 221,453 201,539 
Company Owned gross loans receivable1,628,568 1,548,318 882,356 769,228 731,014 
Gross loans receivable Guaranteed by the Company44,420 46,317 43,422 37,093 32,439 
Gross combined loans receivable (1)
1,672,988 1,594,635 925,778 806,321 763,453 
(1) See "Non-GAAP Financial Measures" at the end of this release for definition and more information.

4


Segment Analysis

The following is a summary of segment operating (loss) income and portfolio performance for the segment and period indicated (all periods unaudited except for Q4 2021).

Table 5 - Summary of Segment Operating (Loss) Income

Three Months Ended March 31, 2022Three Months Ended March 31, 2021
(dollars in thousands, unaudited)U.S.Canada Direct LendingCanada POS LendingU.S.Canada Direct LendingCanada POS Lending
Total revenue$198,399 $71,488 $20,309 $136,492 $58,440 $1,619 
Provision for losses66,825 21,992 8,714 26,056 9,234 855 
Net revenue131,574 49,496 11,595 110,436 49,206 764 
Total operating expenses110,941 27,021 15,504 79,893 24,604 2,737 
Non-recourse interest expense7,864 4,030 6,626 1,627 2,355 826 
Recourse interest expense19,821 — — 14,731 — — 
Income from equity method investment(1,584)— — (546)— — 
Segment operating (loss) income$(5,468)$18,445 $(10,535)$14,731 $22,247 $(2,799)

Table 6 - Summary of Adjusted Segment Operating (Loss) Income

Three Months Ended March 31, 2022Three Months Ended March 31, 2021
(dollars in thousands, unaudited)U.S.Canada Direct LendingCanada POS LendingU.S.Canada Direct LendingCanada POS Lending
Total revenue$198,399 $71,488 $20,309 $136,492 $58,440 $1,619 
Provision for losses66,825 21,992 8,714 26,056 9,234 855 
Net revenue131,574 49,496 11,595 110,436 49,206 764 
Adjusted operating expense (1)
106,356 26,819 15,005 74,296 24,563 2,737 
Non-recourse interest expense7,864 4,030 6,626 1,627 2,355 826 
Recourse interest expense19,821 — — 14,731 — — 
Income from equity method investment(1,584)— — (546)— — 
Adjusted segment operating (loss) income (1)
$(883)$18,647 $(10,036)$20,328 $22,288 $(2,799)
(1) These are non-GAAP metrics. For a description of each non-GAAP addback, see the applicable reconciliations and descriptions of each non-GAAP metric, see "Non-GAAP Financial Measures."

Table 7 - U.S. Portfolio Performance

(in thousands, except percentages)Q1 2022
Q4 2021(1)
Q3 2021Q2 2021Q1 2021
Gross combined loans receivable (2)
Revolving LOC49,07752,53251,19647,27743,387
Installment loans - Company Owned589,652137,782137,987139,234142,396
Total U.S. Company Owned gross loans receivable638,729190,314189,183186,511185,783
Installment loans - Guaranteed by the Company (3)
44,42046,31743,42237,09332,439
Total U.S. gross combined loans receivable (2)
683,149236,631232,605223,604218,222
Lending Revenue:
Revolving LOC26,91327,91127,37724,09126,923
Installment loans - Company Owned113,83356,82057,65955,91864,516
Installment loans - Guaranteed by the Company (3)
48,99147,34843,37734,90841,425
Total U.S. lending revenue189,737132,079128,413114,917132,864
Lending Provision:
Revolving LOC9,57711,5928,1406,6215,039
Installment loans - Company Owned32,96218,61816,79214,04811,159
5


(in thousands, except percentages)Q1 2022
Q4 2021(1)
Q3 2021Q2 2021Q1 2021
Installment loans - Guaranteed by the Company (3)
21,74925,96723,14612,5839,648
Total U.S. lending provision64,28856,17748,07833,25225,846
NCO rate (4)
Revolving LOC19.8%22.1%16.9%16.0%20.0%
Installment loans - Company Owned6.0%14.3%14.1%13.2%11.2%
Total U.S. Company Owned NCO rate7.1%16.4%14.8%13.9%13.3%
Installment loans - Guaranteed by the Company (3)
47.4%58.1%53.2%34.6%31.7%
Total U.S. NCO rate14.7%24.4%21.6%17.2%16.2%
ALL and CSO Liability for Losses rate (4)
Revolving LOC26.7 %25.9%26.3%28.9%33.0%
Installment loans - Company Owned4.2 %12.7%13.4%15.3%18.1%
Total U.S. Company Owned ALL rate5.9 %16.3%16.9%18.7%21.6%
Installment loans - Guaranteed by the Company (3)
16.1 %14.9%16.1%14.2%14.6%
Total ALL and CSO Liability for Losses rate6.6 %16.0%16.8%18.0%20.6%
Past-due rate (5)
Revolving LOC29.7 %30.5%30.5%26.6%26.3%
Installment loans - Company Owned19.1 %19.4%20.1%18.7%18.0%
Total U.S. Company Owned past-due rate19.9 %22.5%22.9%20.7%19.9%
Installment loans - Guaranteed by the Company (3)
18.5 %17.7%19.8%17.4%12.8%
(1) On December 27, 2021, we acquired Heights Finance, which accounted for approximately $472 million of U.S. Installment loans as of December 31, 2021. As the period between December 27, 2021 and December 31, 2021 did not result in material loan performance, we have excluded Heights Finance from the table for the fourth quarter of 2021.
(2) Non-GAAP measure. For a description of each non-GAAP metric, see "Non-GAAP Financial Measures."
(3) Includes loans originated by third-party lenders through CSO programs. Installment gross loans receivable Guaranteed by the Company are not included in the Consolidated Financial Statements.
(4) We calculate NCO rate as total NCOs divided by Average gross loans receivables.
(5) We calculate (i) ALL and CSO Liability for losses rate and (ii) past-due rate as the respective totals divided by gross loans receivable at each respective quarter end.


6


Table 8 - Canada Direct Lending Portfolio Performance

(in thousands, except percentages)Q1 2022Q4 2021Q3 2021Q2 2021Q1 2021
Gross loans receivable
Revolving LOC424,485402,405366,509337,700319,307
Installment loans 23,57824,79224,31523,56424,385
Total gross loans receivable448,063427,197390,824361,264343,692
Lending Revenue:
Revolving LOC45,45543,94340,23937,45034,368
Installment loans 11,10911,41611,33110,54110,447
Total lending revenue56,56455,35951,57047,99144,815
Lending Provision:
Revolving LOC19,15620,08011,3757,0667,909
Installment loans2,7232,9452,5121,4381,234
Total lending provision21,87923,02513,8878,5049,143
NCO rate (1)
Revolving LOC5.2%3.9%2.8%3.3%3.6%
Installment loans10.9%11.2%10.2%6.3%6.5%
Total NCO rate5.5%4.4%3.3%3.5%3.8%
ALL rate (2)
Revolving LOC7.2 %8.0 %7.5 %7.9 %9.4 %
Installment loans8.8 %8.0 %7.4 %7.5 %7.5 %
Total ALL rate7.3 %8.0 %7.5 %7.9 %9.2 %
Past-due rate (2)
Revolving LOC8.0 %8.9 %6.8 %5.8 %6.4 %
Installment loans2.0 %2.2 %2.0 %2.3 %2.1 %
Total past-due rate7.7 %8.5 %6.5 %5.5 %6.1 %
(1) We calculate NCO rate as total NCOs divided by Average gross loans receivables.
(2) We calculate ALL rate and past-due rate as the respective totals divided by gross loans receivable at each respective quarter end.
7


Table 9 - Canada POS Lending Portfolio Performance

(in thousands, except percentages)Q1 2022Q4 2021Q3 2021Q2 2021Q1 2021
Revolving LOC
Total gross loans receivable541,776459,176302,349221,453201,539
Total lending revenue18,65513,70410,6466,4951,383
Total lending provision8,71412,5118,2852,986855
NCO rate (1)(2)
0.5%0.5%0.7%0.7 %
NM (3)
ALL rate (4)
5.1 %4.8 %3.8 %2.1 %0.3 %
Past-due rate (4)(5)
4.2 %4.1 %4.8 %5.4 %5.7 %
(1) For the second, third and fourth quarters of 2021, NCOs presented above include $2.4 million, $0.6 million and $0.8 million, respectively, of NCO's related to the fair value discount, which are excluded from provision.
(2) We calculate NCO rate as total NCOs divided by Average gross loans receivables.
(3) Not material or not meaningful.
(4) We calculate ALL rate and past-due rate as the respective totals divided by gross loans receivable (excluding the fair value discount on acquired loans) at each respective quarter end.
(5) The past-due rate for Canada POS Lending for loans 31+ days past-due were 2.2%, 1.9%, 2.1%, 2.6% and 3.0% for the three months ended March 31, 2022, December 31, 2021, September 30, 2021, June 30, 2021 and March 31, 2021, respectively.

Non-GAAP Financial Measures

In addition to the financial information prepared in conformity with U.S. GAAP, we provide certain “non-GAAP financial measures,” including:
Adjusted Net Income ("ANI") and Adjusted Earnings Per Share, or the Adjusted Earnings Measures (net income plus or minus certain legal and other costs, income or loss from equity method investment, goodwill and intangible asset impairments, transaction-related costs, restructuring costs, loss on extinguishment of debt, adjustments related to acquisition accounting, share-based compensation, intangible asset amortization, certain tax adjustments and impacts from tax law changes and cumulative tax effect of applicable adjustments, on a total and per share basis);
EBITDA (earnings before interest, income taxes, depreciation and amortization);
Adjusted EBITDA (EBITDA plus or minus certain non-cash and other adjusting items); and
Gross Combined Loans Receivable (includes loans originated by third-party lenders through CSO programs which are not included in the Consolidated Financial Statements).

We believe that presentation of non-GAAP financial information is meaningful and useful in understanding the activities and business metrics of the Company's operations. We believe that these non-GAAP financial measures reflect an additional way of viewing aspects of the business that, when viewed with the Company's U.S. GAAP results, provide a more complete understanding of factors and trends affecting the business.
We believe that investors regularly rely on non-GAAP financial measures, to assess operating performance and that such measures may highlight trends in the business that may not otherwise be apparent when relying on financial measures calculated in accordance with U.S. GAAP. In addition, we believe that the adjustments shown above are useful to investors to allow them to compare our financial results during the periods shown without the effect of each of these income or expense items. In addition, we believe that these non-GAAP financial measures are frequently used by securities analysts, investors and other interested parties in the evaluation of public companies in our industry, many of which present non-GAAP financial measures when reporting their results.

In addition to reporting loans receivable information in accordance with U.S. GAAP, we provide Gross Combined Loans Receivable consisting of owned loans receivable plus loans originated by third-party lenders through the CSO programs, which we guarantee but do not include in the Consolidated Financial Statements. Management believes this analysis provides investors with important information needed to evaluate overall lending performance.

We provide non-GAAP financial information for informational purposes and to enhance understanding of the U.S. GAAP Consolidated Financial Statements. Non-GAAP financial measures should not be considered as alternatives to income, segment operating income, or any other performance measure derived in accordance with U.S. GAAP, or as an alternative to cash flows from operating activities or any other liquidity measure derived in accordance with U.S. GAAP. Readers should consider the information in addition to, but not instead of or superior to, the financial statements prepared in accordance with U.S. GAAP. This non-GAAP financial information may be determined or calculated differently by other companies, limiting the usefulness of those measures for comparative purposes.
8


Description and Reconciliations of Non-GAAP Financial Measures
Non-GAAP financial measures have limitations as analytical tools, and you should not consider these measures in isolation or as a substitute for analysis of our income or cash flows as reported under U.S. GAAP. Some of these limitations are:
they do not include cash expenditures or future requirements for capital expenditures or contractual commitments;
they do not include changes in, or cash requirements for, working capital needs;
they do not include the interest expense, or the cash requirements necessary to service interest or principal payments on debt;
depreciation and amortization are non-cash expense items reported in the statements of cash flows; and
other companies in our industry may calculate these measures differently, limiting their usefulness as comparative measures.

We calculate Adjusted Earnings per Share utilizing diluted shares outstanding at year-end. If we record a loss under U.S. GAAP, shares outstanding utilized to calculate Diluted Earnings per Share are equivalent to basic shares outstanding. Shares outstanding utilized to calculate Adjusted Earnings per Share reflect the number of diluted shares we would have reported if reporting net income under U.S. GAAP.

As noted above, Gross Combined Loans Receivable includes loans originated by third-party lenders through CSO programs which are not included in the consolidated financial statements but from which we earn revenue and for which we provide a guarantee to the lender. Management believes this analysis provides investors with important information needed to evaluate overall lending performance.

We believe investors use the non-GAAP measures we present to analyze operating performance and to evaluate our ability to incur and service debt and the capacity for making capital expenditures. Adjusted EBITDA is also useful to investors to help assess our estimated enterprise value.

Table 10 - Reconciliation of Net Income and Diluted Earnings per Share to Adjusted Net Income and Adjusted Diluted Earnings per Share, non-GAAP measures
(in thousands, except per share data, unaudited)Three Months Ended
March 31,
20222021Change $Change %
Net income1,336 25,735 (24,399)(94.8)%
Adjustments:
Restructuring costs (1)
1,069 — 
Legal and other costs (2)
87 — 
Income from equity method investment (3)
(1,584)(546)
Transaction costs (4)
168 3,160 
Acquisition-related adjustments (5)
221 — 
Change in fair value of contingent consideration (6)
(264)— 
Share-based compensation (7)
4,093 2,683 
Intangible asset amortization (8)
2,977 831 
Cumulative tax effect of adjustments (9)
(1,828)(1,735)
Adjusted Net Income6,275 30,128 (23,853)(79.2)%
Net income1,336 25,735 
Diluted Weighted Average Shares Outstanding41,308 43,596 
Adjusted Diluted Average Shares Outstanding41,308 43,596 
Diluted Earnings per Share0.03 0.59 (0.56)(94.9)%
Per Share impact of adjustments to Net income0.12 0.10 
Adjusted Diluted Earnings per Share0.15 0.69 (0.54)(78.3)%
Note: Footnotes follow Reconciliation of Net income table on the next page


9


Table 11 - Reconciliation of Net Income to EBITDA and Adjusted EBITDA, Non-GAAP Measures
Three Months Ended
March 31,
(in thousands, unaudited)20222021Change $Change %
Net income1,336 25,735 (24,399)(94.8)%
Provision for income taxes1,106 8,444 (7,338)(86.9)%
Interest expense38,341 19,539 18,802 96.2 %
Depreciation and amortization9,814 4,965 4,849 97.7 %
EBITDA50,597 58,683 (8,086)(13.8)%
Restructuring costs (1)
1,069 — 
Legal and other costs (2)
87 — 
Income from equity method investment (3)
(1,584)(546)
Transaction costs (4)
168 3,160 
Acquisition-related adjustments (5)
221 — 
Change in fair value of contingent consideration (6)
(264)— 
Share-based compensation (7)
4,093 2,683 
Other adjustments (10)
(88)(205)
Adjusted EBITDA54,299 63,775 (9,476)(14.9)%
Adjusted EBITDA Margin18.7 %32.4 %
# - Change greater than 100% or not meaningful
Table 12 - Reconciliation of Total Operating Expense to Adjusted Operating Expense
Three Months Ended March 31, 2022Three Months Ended March 31, 2021
(dollars in thousands, unaudited)U.S.Canada Direct LendingCanada POS LendingU.S.Canada Direct LendingCanada POS Lending
Total operating expense$110,941 $27,021 $15,504 $79,893 $24,604 $2,737 
Less:
Restructuring costs (1)
1,069 — — — — — 
Legal and other costs (2)
87 — — — — — 
Transaction costs (4)
168 — — 3,160 — — 
Acquisition-related adjustments (5)
— 218 — — — 
Change in fair value of contingent consideration (6)
— — (264)— — — 
Share-based compensation (7)
3,503 115 475 2,683 — — 
Other adjustments (10)
(245)87 70 (246)41 — 
Adjusted operating expense$106,356 $26,819 $15,005 $74,296 $24,563 $2,737 
(1)Restructuring costs for the three months ended March 31, 2022 resulted from U.S. store closures and related costs and certain severance payments to eliminate duplicate roles.
(2)Legal and other costs for the three months ended March 31, 2022 primarily related to settlement costs related to certain legal matters.
(3)
The amount reported is our share of Katapult's U.S. GAAP net income, recognized on a one quarter lag.
(4)
Transaction costs for the three months ended March 31, 2022 relate to our Heights Finance acquisition in December 2021.

Transaction costs for the three months ended March 31, 2021 relate to the acquisition of Flexiti in March 2021.
(5)During the three months ended March 31, 2022, $0.2 million of acquisition-related adjustments relate to the acquired Flexiti loan portfolio as of March 10, 2021.
(6)In connection with our acquisition of Flexiti, we recorded a $0.3 million adjustment related to the fair value of the contingent consideration for the three months ended March 31, 2022.
(7)The estimated fair value of share-based awards was recognized as non-cash compensation expense on a straight-line basis over the vesting period.
(8)
Intangible asset amortization in determining ANI for the three months ended March 31, 2022 primarily included amortization of identifiable intangible assets established in connection with the acquisitions of Flexiti and Heights Finance.
(9)
Cumulative tax effect of adjustments included in Reconciliation of Net income to Adjusted Net Income table is calculated using the estimated incremental tax rate by country.
(10)Other adjustments primarily reflect the intercompany foreign-currency exchange impact.

10


Forward-Looking Statements
This press release contains forward-looking statements. These forward-looking statements include projections, estimates and assumptions about our business results and growth trends and our ability to create value; our ability to accelerate our transition into longer-term, higher-balance and lower-rate credit products; our belief that recent acquisitions will solidify our position as a full spectrum non-prime and prime consumer lender in the U.S. and Canada and accelerate our long-term revenue and earnings growth prospects; and our belief in the usefulness of the various non-GAAP financial measures used in this release. In addition, words such as “guidance,” “estimate,” “anticipate,” “believe,” “forecast,” “step,” “plan,” “predict,” “focused,” “project,” “is likely,” “expect,” “intend,” “should,” “will,” “confident,” variations of such words and similar expressions are intended to identify forward-looking statements. Our ability to achieve these forward-looking statements is based on certain assumptions, judgments and other factors, both within and outside of our control, that could cause actual results to differ materially from those in the forward-looking statements, including: errors in our internal forecasts or those of companies in which we invest; the effects of competition on our business or on those companies in which we invest; our ability to attract and retain customers; market, financial, political and legal conditions; actions of regulators and the negative impact of those actions on our business; the continuing impact of COVID-19 pandemic or any other similar wide-spread event on our business and the global economy; our dependence on third-party lenders to provide the cash we need to fund our loans and our ability to affordably access third-party financing; our level of indebtedness; our ability to successfully integrate acquired businesses; our ability to protect our proprietary technology and analytics and keep up with that of our competitors; disruption of our information technology systems that adversely affect our business operations; ineffective pricing of the credit risk of our prospective or existing customers; inaccurate information supplied by customers or third parties that could lead to errors in judging customers’ qualifications to receive loans; improper disclosure of customer personal data; failure of third parties who provide products, services or support to us; any failure of third-party lenders upon whom we rely to conduct business in certain states; disruption to our relationships with banks and other third-party electronic payment solutions providers as well as other factors discussed in our filings with the Securities and Exchange Commission. These projections, estimates and assumptions may prove to be inaccurate in the future. These forward-looking statements are not guarantees of future performance and involve known and unknown risks and uncertainties that are difficult to predict with regard to timing, extent, likelihood and degree of occurrence. There may be additional risks that CURO presently does not know or that it currently believes are immaterial that could also cause actual results to differ from those contained in the forward-looking statements. Given these risks and uncertainties, investors should not place undue reliance on forward-looking statements as a prediction of actual future results. We undertake no obligation to update, amend or clarify any forward-looking statement for any reason.

All product names, logos, brands, trademarks and registered trademarks are property of their respective owners.

About CURO
CURO Group Holdings Corp. (NYSE: CURO) is a full-spectrum consumer credit provider across the U.S. and Canada. The Company was founded in 1997 by three childhood friends in Kansas to meet the growing consumer need for short-term loans. Today, CURO operates a robust, omni-channel platform providing comprehensive credit solutions to help customers achieve their financial goals. CURO’s decades of experience with alternative data power the underwriting and scoring engine, mitigating risk across the full spectrum of credit products. CURO operates under a number of brands including Speedy Cash, Rapid Cash, Cash Money, LendDirect, Flexiti, Avío Credit, Opt+, Revolve Finance, Heights Finance, Southern Finance, Covington Credit, Quick Credit and First Phase. Our diversified product channels allows us to meet the changing needs and preferences of our customers.
Conference Call
CURO will host a conference call to discuss these results at 5:00 p.m. Eastern Time on Monday, May 2, 2022. The live webcast of the call can be accessed at the CURO Investor Relations website at http://ir.curo.com/.
You may access the call at 1-833-953-2430 (1-412-317-5759 for international callers). Please ask to join the CURO Group Holdings call. A replay of the conference call will be available until May 9, 2022, at 5:00 p.m. Eastern Time. An archived version of the webcast will be available on the CURO Investors website for 90 days. You may access the conference call replay at 1-877-344-7529 (1-412-317-0088 for international callers). The replay access code is 5460332.
Final Results
The financial results presented and discussed herein are on a preliminary and unaudited basis; final unaudited data will be included in the Company’s Quarterly Report on Form 10-Q for the three months ended March 31, 2022.
Investor Relations:
Roger Dean
Executive Vice President and Chief Financial Officer
Phone: 844-200-0342
Email: [email protected]

Or

Financial Profiles, Inc.
[email protected]
11


(CURO-NWS)
12

First Quarter 2022 Earnings Presentation M A Y 2 , 2 0 2 2

 
2 D I S C L A I M E R IMPORTANT: You must read the following information before continuing to the rest of the presentation, which is being provided to you for informational purposes only. FORWARD-LOOKING STATEMENTS This presentation contains forward-looking statements. These forward-looking statements include projections, estimates and assumptions about various matters such as future financial and operational performance, including revenue and adjusted pre-tax income. In addition, words such as “guidance,” “estimate,” “anticipate,” “believe,” “forecast,” “step,” “plan,” “predict,” “focused,” “project,” “is likely,” “expect,” “intend,” “should,” “will,” “confident,” variations of such words and similar expressions are intended to identify forward-looking statements. Our ability to achieve these forward-looking statements is based on certain assumptions, judgments and other factors, both within and outside of our control, that could cause actual results to differ materially from those in the forward-looking statements, including, the effects of competition on our business; our ability to attract and retain customers across all of our markets and products; financial, political and legal conditions; actions of regulators and the negative impact of those actions on our business; the future impact of COVID-19 pandemic or any other global event on our business and the global economy; our dependence on third-party lenders to provide the cash we need to fund our loans and our ability to affordably access third-party financing; errors in our internal forecasts; our level of indebtedness; our ability to integrate acquired businesses, including Flexiti and Heights Finance; our ability to protect our proprietary technology and analytics and keep up with that of our competitors; disruption of our information technology systems that adversely affect our business operations; ineffective pricing of the credit risk of our prospective or existing customers; inaccurate information supplied by customers or third parties that could lead to errors in judging customers’ qualifications to receive loans; improper disclosure of customer personal data; failure of third parties who provide products, services or support to us; any failure of third-party lenders upon whom we rely to conduct business in certain states; disruption to our relationships with banks and other third-party electronic payment solutions providers as well as other factors discussed in our filings with the Securities and Exchange Commission. Our determination of the provision for loan losses involves judgments that are inherently forward-looking. These projections, estimates and assumptions may prove to be inaccurate in the future. These forward-looking statements are not guarantees of future performance and involve known and unknown risks and uncertainties that are difficult to predict with regard to timing, extent, likelihood and degree of occurrence. There may be additional risks that we presently do not know or that we currently believe are immaterial that could also cause actual results to differ from those contained in the forward-looking statements. Given these risks and uncertainties, investors should not place undue reliance on forward-looking statements as a prediction of actual future results. We undertake no obligation to update, amend or clarify any forward-looking statement for any reason. NON-GAAP FINANCIAL MEASURES In addition to the financial information prepared in conformity with U.S. GAAP, we provide certain “non-GAAP financial measures,” including: Adjusted Net Income (Net Income from continuing operations minus certain non-cash and other adjusting items); Adjusted Earnings Per Share (Adjusted net income divided by diluted weighted average shares outstanding); Adjusted Pre-Tax Income, (Income from continuing operations before income taxes minus certain non-cash and other adjusting items); Adjusted EBITDA (EBITDA plus or minus certain non-cash and other adjusting items); Gross Combined Loans Receivable (includes loans originated by third-party lenders through CSO programs which are not included in our consolidated financial statements); and Adjusted operating expense. Such measures are intended as a supplemental measure of our performance that are not required by, or presented in accordance with, GAAP. We present these non-GAAP financial measures because we believe that, when viewed with our GAAP results and the accompanying reconciliation, such measures provide useful information for comparing our performance over various reporting periods as they remove from our operating results the impact of items that we believe do not reflect our core operating performance. These non-GAAP financial measures are not substitutes for any GAAP financial measure and there are limitations to using them. Although the Company believes that these non-GAAP financial measures can make an evaluation of our operating performance more consistent because they remove items that do not reflect our core operations, other companies in the Company’s industry may define their own non-GAAP financial measures differently or use different measures. As a result, it may be difficult to use any non-GAAP financial measure to compare the performance of other companies to our performance. The non-GAAP financial measures presented in these slides should not be considered as measures of the income generated by our business or discretionary cash available to us to invest in the growth of our business. Our management compensates for these limitations by reference to GAAP results and using these non-GAAP financial measures as supplemental measures. Reconciliation of non-GAAP metrics to the closest comparable GAAP metrics are included on slides 11 to 16. All product names, logos, brands, trademarks and registered trademarks are property of their respective owners.

 
3 LOAN BALANCES 1 ($Millions) 1 Includes Company-Owned Loans and Loans Guaranteed by the Company under CSO programs. Please see appendix, slide 16, for reconciliation. 2 Heights Finance balances reflect fair value adjustments recorded in the opening acquired balance sheet for purchase accounting. Heights Finance is included as part of the U.S. segment. 3 Excludes Heights Finance 4 U.S. run-off portfolios include Verge Credit, California Installment, Virginia and Illinois. $302 $276 $257 $292 $330 $344 $361 $391 $427 $448 $201 $221 $302 $459 $542 $440 $344 $235 $245 $268 $218 $224 $233 $237 $220 $471 $463 4Q19 1Q20 2Q20 3Q20 4Q20 1Q21 2Q21 3Q21 4Q21 1Q22 Canada Direct Lending Canada POS Lending U.S. Heights Finance $743 $620 $492 $537 $598 $763 $806 $926 $1,594 2 $1,673 Loan Growth Trends Y-o-Y $ Change Y-o-Y % Change Sequential $ Change Sequential % Change Canada Direct Lending $104.4 30.4% $20.9 4.9% Canada POS Lending $340.2 168.8% $82.6 18.0% U.S.3 (ex. runoff portfolios4) $52.8 34.2% -$9.5 -4.4% Q1 2022 CHANGE IN LOANS 1 ($Millions)

 
4 Provision for loan losses by Segment (USD, $Millions) $111 $85 $41 $43 $59 $26 $33 $48 $56 $64 $19 $27 $9 $11 $11 $9 $9 $14 $23 $22 $1 $3 $8 $13 $9 4Q19 1Q20 2Q20 3Q20 4Q20 1Q21 2Q21 3Q21 4Q21 1Q22 U.S. Canada Direct Lending Canada POS Lending -$11 -$25 -$14 -$5 -$1 $6 -$4 $5 -$2 $6 $11 $6 -$2 -$5 -$28 $4 $5 -$17 -$7 $7 $15 $12 4Q19 1Q20 2Q20 3Q20 4Q20 1Q21 2Q21 3Q21 4Q21 1Q22 U.S. Canada Direct Lending Canada POS $2 $8 Net Impact: Provision for loan losses minus net charge-offs by segment (USD, $Millions) Quarterly Net Charge-Off Rate % by Segment CANADA DIRECT LENDING PAST DUE AR %1 0% 2% 4% 6% 8% 10% 4Q19 1Q20 2Q20 3Q20 4Q20 1Q21 2Q21 3Q21 4Q21 1Q22 1-30 DPD 31-60 DPD 61+ DPD 0% 5% 10% 15% 20% 25% 30% 4Q19 1Q20 2Q20 3Q20 4Q20 1Q21 2Q21 3Q21 4Q21 1Q22 1-30 DPD 31-60 DPD 61+ DPD U.S. DIRECT LENDING PAST DUE AR %1 1 Periods presented prior to 1Q22 exclude Single-Pay Credit Trends • Relative sequential loan balances and credit performance affect provision for loan losses comparisons • Delinquencies remain below pre-COVID levels with recent increases driven by continued loan growth, new customer and origination channel mix, seasonality and waning stimulus 25.2% 24.7% 22.8% 17.2% 21.0% 16.2% 17.2% 21.6% 24.4% 14.7% 20.6% 6.8% 7.5% 4.9% 3.2% 3.5% 3.8% 3.5% 3.3% 4.4% 5.5% 0.7% 0.7% 0.5% 0.5% 4Q19 1Q20 2Q20 3Q20 4Q20 1Q21 2Q21 3Q21 4Q21 1Q22 U.S. NCO rate (%) U.S. NCO rate (excluding Heights Finance) (%) Canada Direct Lending NCO rate (%) Canada POS Lending NCO rate (%)

 
5 Consolidated Financial Performance Recap Sequential Revenue Growth across all businesses continued REVENUE ($Millions) ADJUSTED EBITDA 1 ($Millions) ADJUSTED EARNINGS PER SHARE 1 $0 $100 $200 $300 4Q19 1Q20 2Q20 3Q20 4Q20 1Q21 2Q21 3Q21 4Q21 1Q22 Revenue Net revenue $68 $66 $51 $36 $34 $64 $50 $38 $17 $54 4Q19 1Q20 2Q20 3Q20 4Q20 1Q21 2Q21 3Q21 4Q21 1Q22 $0.80 $0.77 $0.53 $0.27 $0.20 $0.69 $0.40 $0.15 -$0.29 $0.15 4Q19 1Q20 2Q20 3Q20 4Q20 1Q21 2Q21 3Q21 4Q21 Q122 1 Reconciliation of non-GAAP metrics to the closest comparable GAAP metrics included within slides 11 through 16. • Consolidated revenue was $290 million, an increase of 48% from the same quarter last year • Net revenue increased $32 million, or 20%, year over year and increased $66 million, or 29%, sequentially • Adjusted EBITDA1 of $54 million and adjusted earnings of $0.15 per share1 • Net income declined $24 million, or 95%, year over year due to provision for loan losses and higher interest expense • 1Q21 provision for loan losses was $17 million less than NCOs due to government stimulus and other pandemic-related behavior reduced demand • 1Q22 provision for loan losses was $12 million more than NCOs due to credit normalization and strong sequential loan growth • Interest expense increased $19 million, or 96%, year over year due to additional funding needed to finance the Heights Finance acquisition and further loan growth
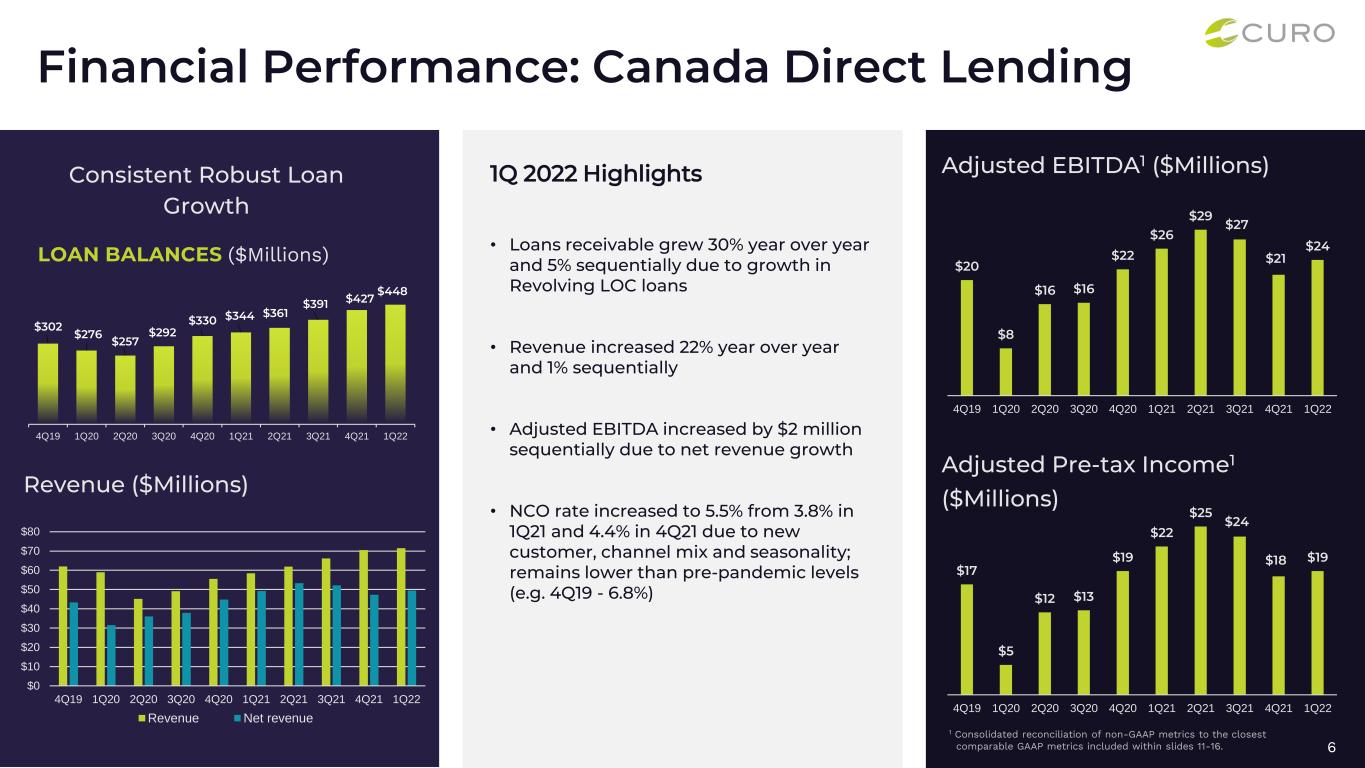

 
6 Financial Performance: Canada Direct Lending Consistent Robust Loan Growth LOAN BALANCES ($Millions) $302 $276 $257 $292 $330 $344 $361 $391 … $448 4Q19 1Q20 2Q20 3Q20 4Q20 1Q21 2Q21 3Q21 4Q21 1Q22 $0 $10 $20 $30 $40 $50 $60 $70 $80 4Q19 1Q20 2Q20 3Q20 4Q20 1Q21 2Q21 3Q21 4Q21 1Q22 Revenue Net revenue $17 $5 $12 $13 $19 $22 $25 $24 $18 $19 4Q19 1Q20 2Q20 3Q20 4Q20 1Q21 2Q21 3Q21 4Q21 1Q22 Revenue ($Millions) Adjusted Pre-tax Income1 ($Millions) 1 Consolidated reconciliation of non-GAAP metrics to the closest comparable GAAP metrics included within slides 11-16. $427 • Loans receivable grew 30% year over year and 5% sequentially due to growth in Revolving LOC loans • Revenue increased 22% year over year and 1% sequentially • Adjusted EBITDA increased by $2 million sequentially due to net revenue growth • NCO rate increased to 5.5% from 3.8% in 1Q21 and 4.4% in 4Q21 due to new customer, channel mix and seasonality; remains lower than pre-pandemic levels (e.g. 4Q19 - 6.8%) 1Q 2022 Highlights $20 $8 $16 $16 $22 $26 $29 $27 $21 $24 4Q19 1Q20 2Q20 3Q20 4Q20 1Q21 2Q21 3Q21 4Q21 1Q22 Adjusted EBITDA1 ($Millions)
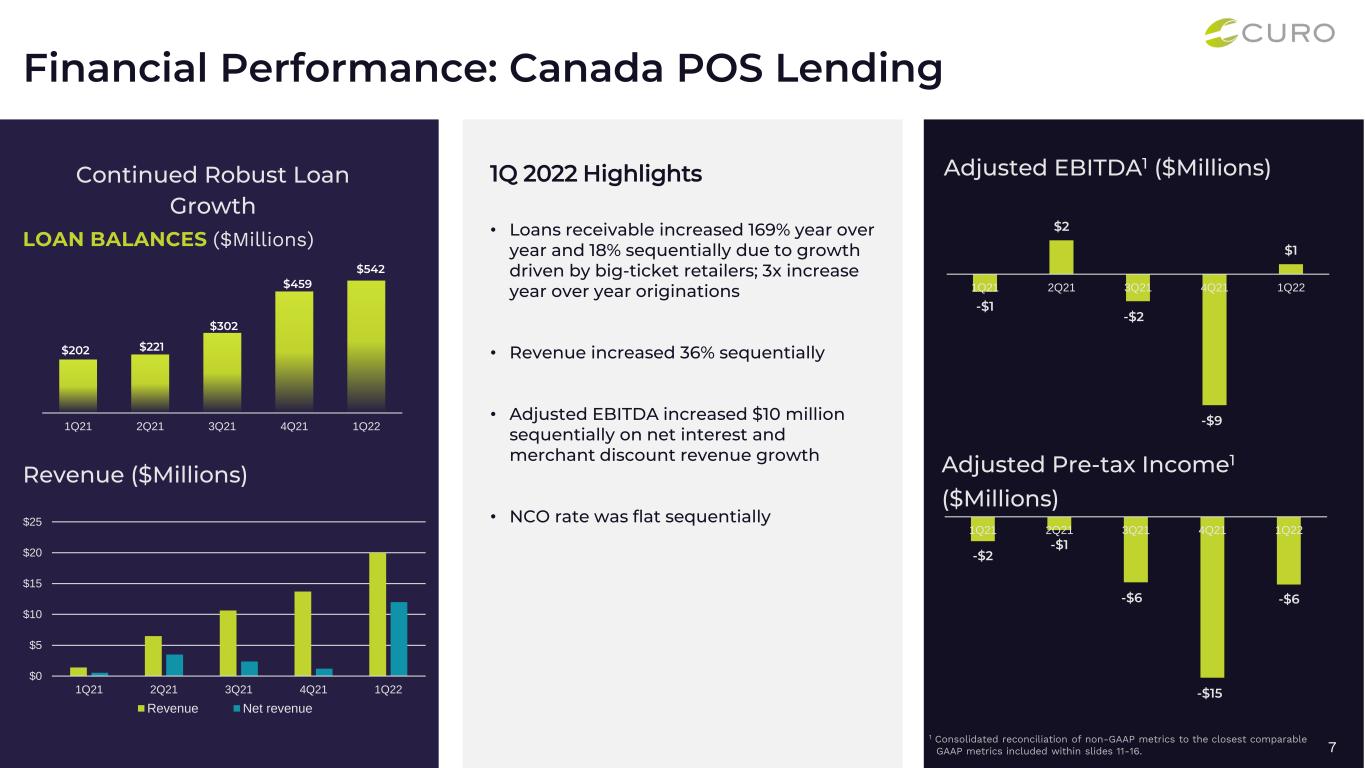

 
7 Financial Performance: Canada POS Lending Continued Robust Loan Growth LOAN BALANCES ($Millions) $202 $221 $302 … $542 1Q21 2Q21 3Q21 4Q21 1Q22 $0 $5 $10 $15 $20 $25 1Q21 2Q21 3Q21 4Q21 1Q22 Revenue Net revenue -$2 -$1 -$6 -$15 -$6 1Q21 2Q21 3Q21 4Q21 1Q22 Revenue ($Millions) Adjusted Pre-tax Income1 ($Millions) 1 Consolidated reconciliation of non-GAAP metrics to the closest comparable GAAP metrics included within slides 11-16. $459 • Loans receivable increased 169% year over year and 18% sequentially due to growth driven by big-ticket retailers; 3x increase year over year originations • Revenue increased 36% sequentially • Adjusted EBITDA increased $10 million sequentially on net interest and merchant discount revenue growth • NCO rate was flat sequentially 1Q 2022 Highlights -$1 $2 -$2 -$9 $1 1Q21 2Q21 3Q21 4Q21 1Q22 Adjusted EBITDA1 ($Millions)
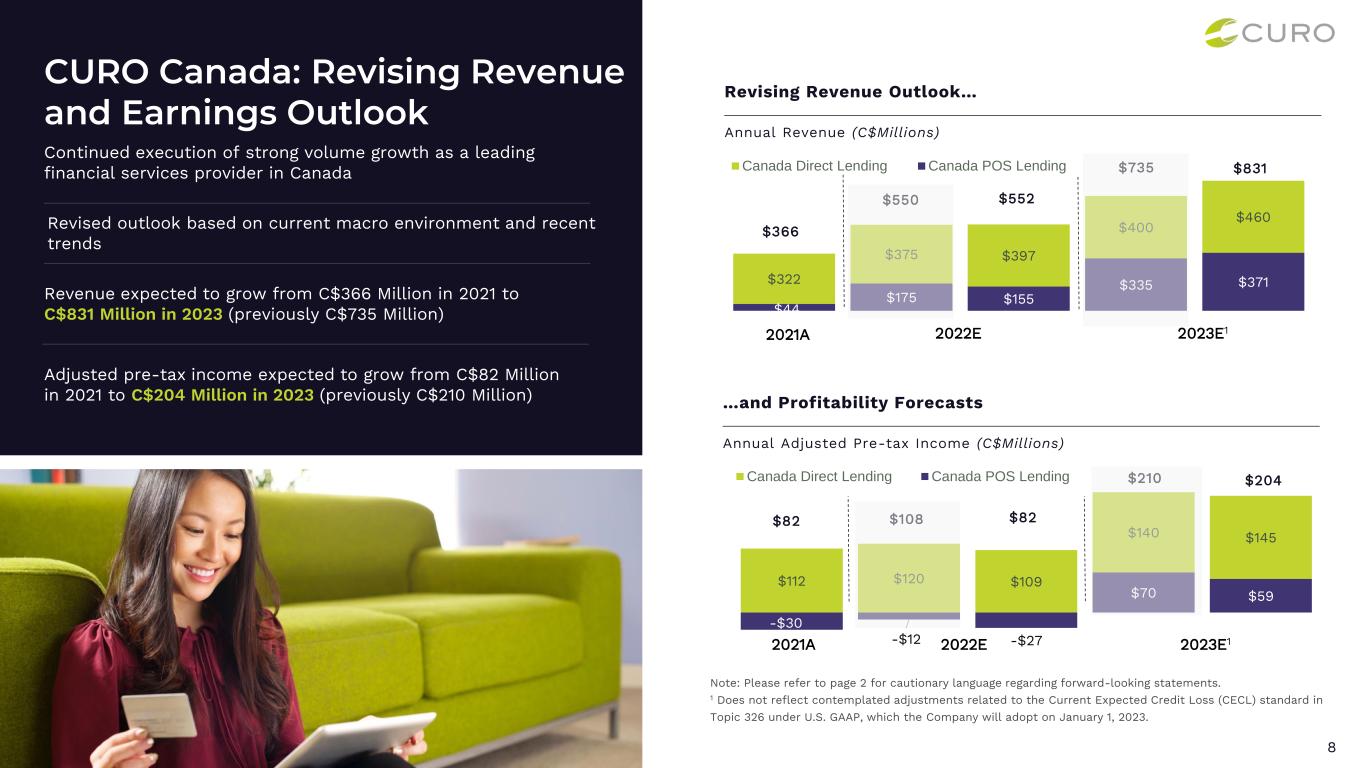

 
CURO Canada: Revising Revenue and Earnings Outlook 8 Continued execution of strong volume growth as a leading financial services provider in Canada Revised outlook based on current macro environment and recent trends Revenue expected to grow from C$366 Million in 2021 to C$831 Million in 2023 (previously C$735 Million) Adjusted pre-tax income expected to grow from C$82 Million in 2021 to C$204 Million in 2023 (previously C$210 Million) Revising Revenue Outlook… Annual Revenue (C$Millions) Note: Please refer to page 2 for cautionary language regarding forward-looking statements. 1 Does not reflect contemplated adjustments related to the Current Expected Credit Loss (CECL) standard in Topic 326 under U.S. GAAP, which the Company will adopt on January 1, 2023. …and Profitability Forecasts Annual Adjusted Pre-tax Income (C$Millions) $44 $175 $155 $335 $371$322 $375 $397 $400 $460 Canada Direct Lending Canada POS Lending 2021A 2022E 2023E1 $550 $735 $366 $552 $831 -$30 -$12 -$27 $70 $59 $112 $120 $109 $140 $145 Canada Direct Lending Canada POS Lending $82$82 $108 $204$210 2021A 2022E 2023E1 8
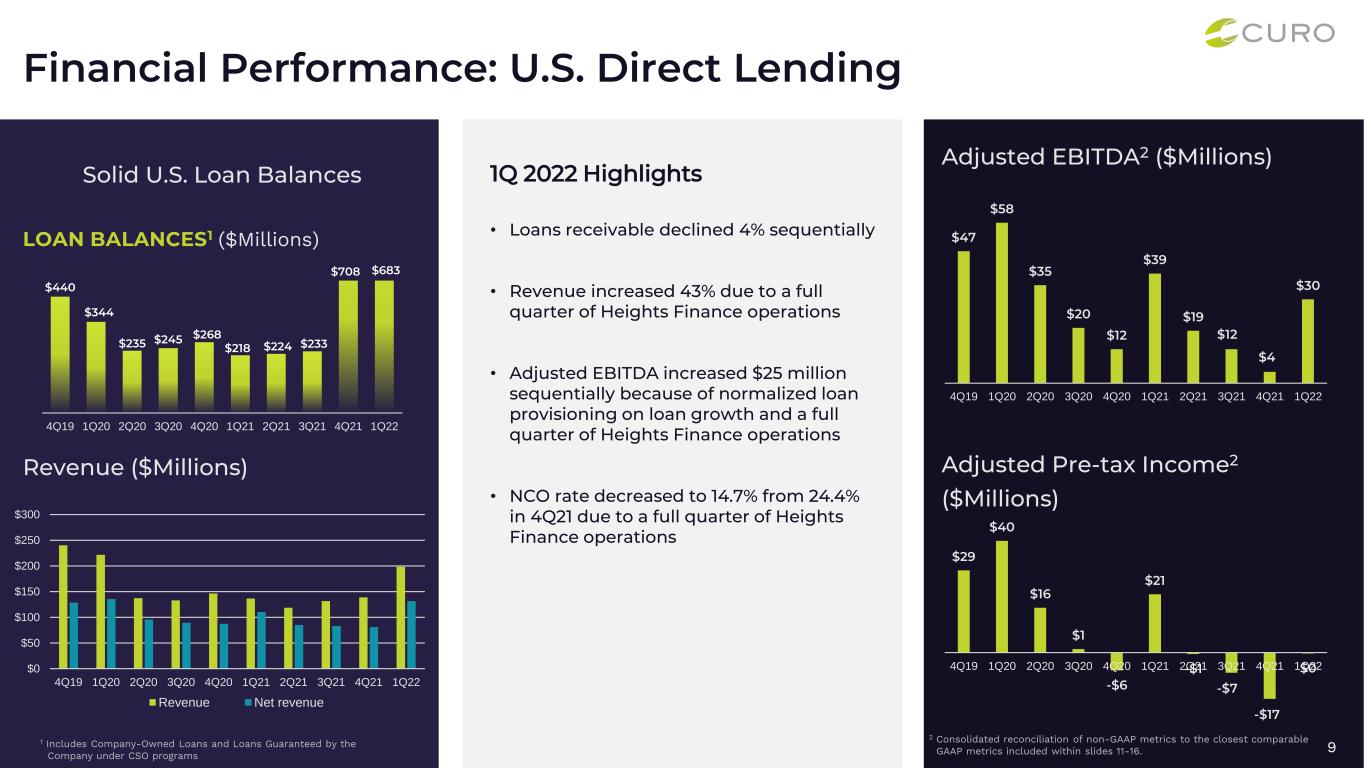

 
9 Financial Performance: U.S. Direct Lending Solid U.S. Loan Balances LOAN BALANCES1 ($Millions) $440 $344 $235 $245 $268 $218 $224 $233 … $683 4Q19 1Q20 2Q20 3Q20 4Q20 1Q21 2Q21 3Q21 4Q21 1Q22 1 Includes Company-Owned Loans and Loans Guaranteed by the Company under CSO programs $0 $50 $100 $150 $200 $250 $300 4Q19 1Q20 2Q20 3Q20 4Q20 1Q21 2Q21 3Q21 4Q21 1Q22 Revenue Net revenue $29 $40 $16 $1 -$6 $21 -$1 -$7 -$17 $04Q19 1Q20 2Q20 3Q20 4Q20 1Q21 2Q21 3Q21 4Q21 1Q22 Revenue ($Millions) Adjusted Pre-tax Income2 ($Millions) 2 Consolidated reconciliation of non-GAAP metrics to the closest comparable GAAP metrics included within slides 11-16. $708 • Loans receivable declined 4% sequentially • Revenue increased 43% due to a full quarter of Heights Finance operations • Adjusted EBITDA increased $25 million sequentially because of normalized loan provisioning on loan growth and a full quarter of Heights Finance operations • NCO rate decreased to 14.7% from 24.4% in 4Q21 due to a full quarter of Heights Finance operations 1Q 2022 Highlights $47 $58 $35 $20 $12 $39 $19 $12 $4 $30 4Q19 1Q20 2Q20 3Q20 4Q20 1Q21 2Q21 3Q21 4Q21 1Q22 Adjusted EBITDA2 ($Millions)


 
10 Appendix
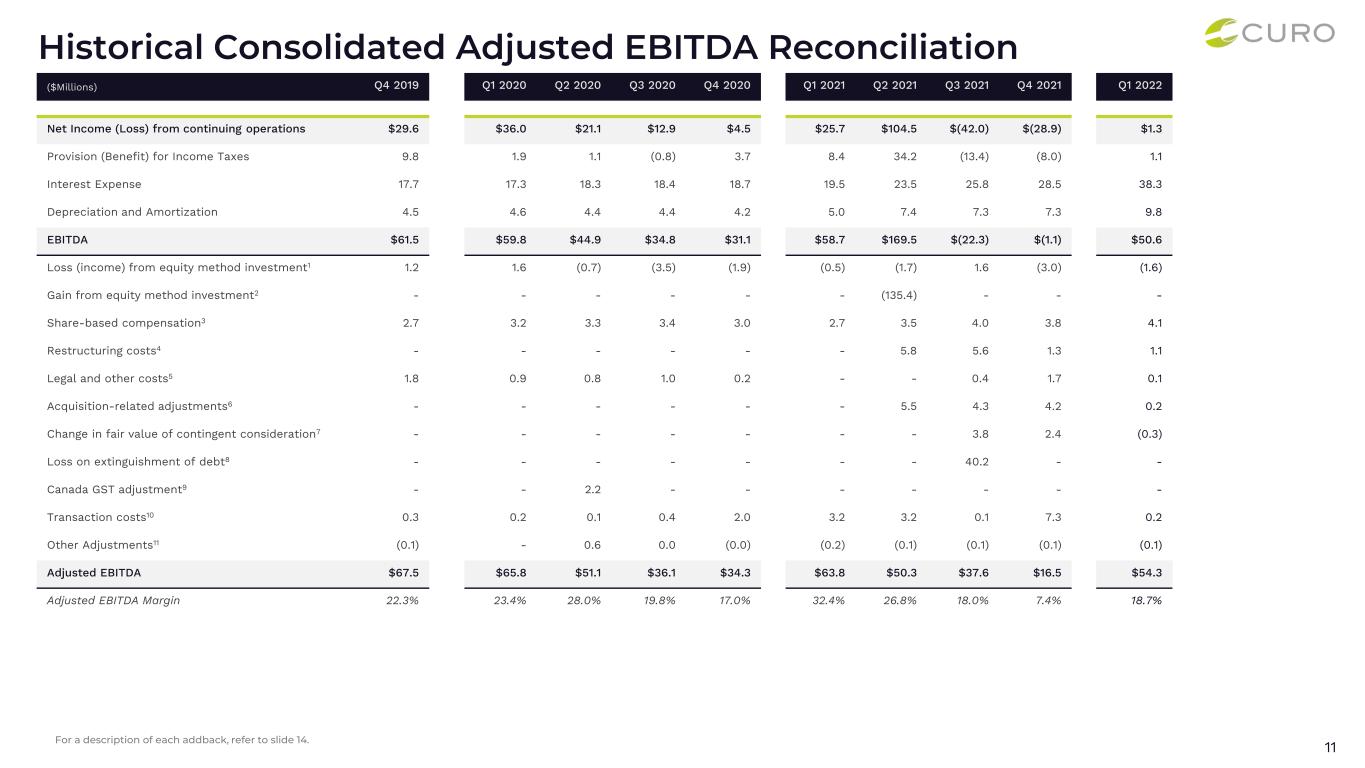

 
11 Historical Consolidated Adjusted EBITDA Reconciliation ($Millions) Q4 2019 Q1 2020 Q2 2020 Q3 2020 Q4 2020 Q1 2021 Q2 2021 Q3 2021 Q4 2021 Q1 2022 Net Income (Loss) from continuing operations $29.6 $36.0 $21.1 $12.9 $4.5 $25.7 $104.5 $(42.0) $(28.9) $1.3 Provision (Benefit) for Income Taxes 9.8 1.9 1.1 (0.8) 3.7 8.4 34.2 (13.4) (8.0) 1.1 Interest Expense 17.7 17.3 18.3 18.4 18.7 19.5 23.5 25.8 28.5 38.3 Depreciation and Amortization 4.5 4.6 4.4 4.4 4.2 5.0 7.4 7.3 7.3 9.8 EBITDA $61.5 $59.8 $44.9 $34.8 $31.1 $58.7 $169.5 $(22.3) $(1.1) $50.6 Loss (income) from equity method investment1 1.2 1.6 (0.7) (3.5) (1.9) (0.5) (1.7) 1.6 (3.0) (1.6) Gain from equity method investment2 - - - - - - (135.4) - - - Share-based compensation3 2.7 3.2 3.3 3.4 3.0 2.7 3.5 4.0 3.8 4.1 Restructuring costs4 - - - - - - 5.8 5.6 1.3 1.1 Legal and other costs5 1.8 0.9 0.8 1.0 0.2 - - 0.4 1.7 0.1 Acquisition-related adjustments6 - - - - - - 5.5 4.3 4.2 0.2 Change in fair value of contingent consideration7 - - - - - - - 3.8 2.4 (0.3) Loss on extinguishment of debt8 - - - - - - - 40.2 - - Canada GST adjustment9 - - 2.2 - - - - - - - Transaction costs10 0.3 0.2 0.1 0.4 2.0 3.2 3.2 0.1 7.3 0.2 Other Adjustments11 (0.1) - 0.6 0.0 (0.0) (0.2) (0.1) (0.1) (0.1) (0.1) Adjusted EBITDA $67.5 $65.8 $51.1 $36.1 $34.3 $63.8 $50.3 $37.6 $16.5 $54.3 Adjusted EBITDA Margin 22.3% 23.4% 28.0% 19.8% 17.0% 32.4% 26.8% 18.0% 7.4% 18.7% For a description of each addback, refer to slide 14.
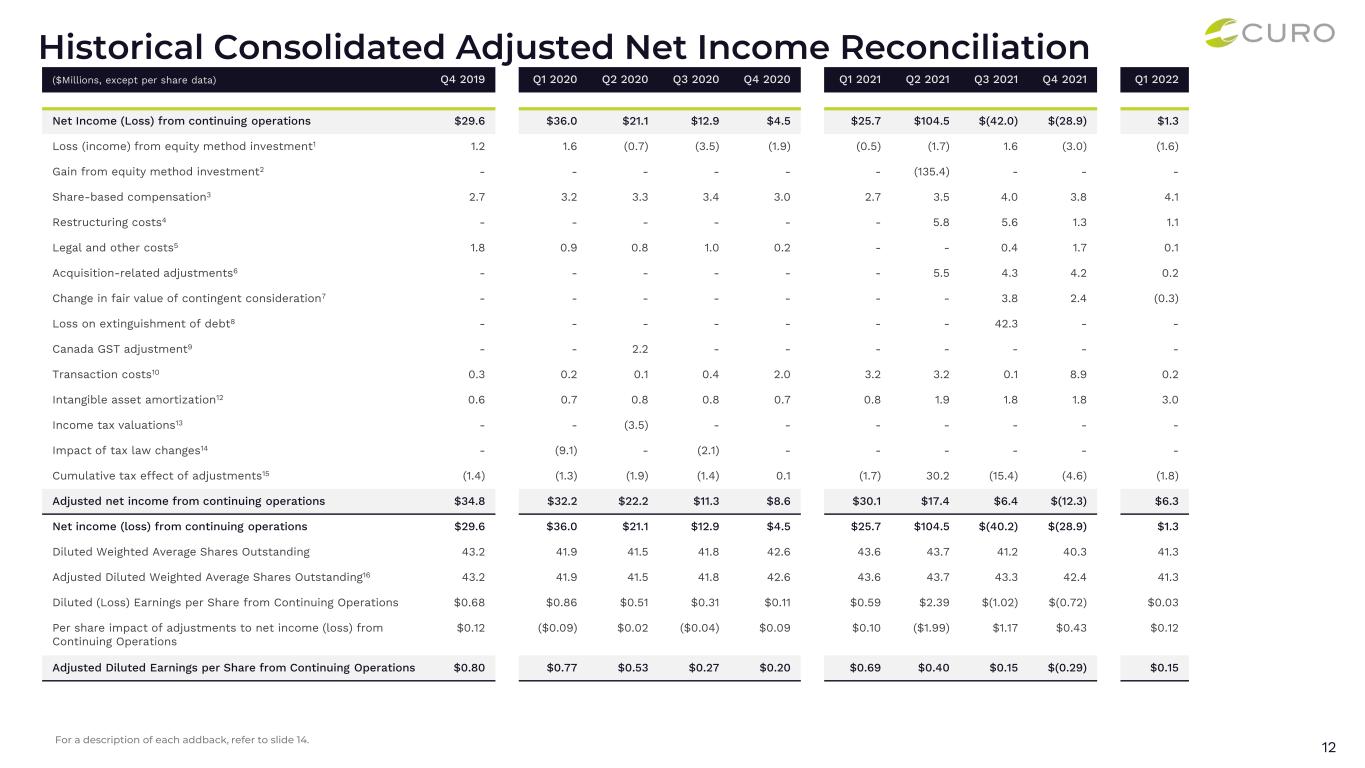

 
12 Historical Consolidated Adjusted Net Income Reconciliation ($Millions, except per share data) Q4 2019 Q1 2020 Q2 2020 Q3 2020 Q4 2020 Q1 2021 Q2 2021 Q3 2021 Q4 2021 Q1 2022 Net Income (Loss) from continuing operations $29.6 $36.0 $21.1 $12.9 $4.5 $25.7 $104.5 $(42.0) $(28.9) $1.3 Loss (income) from equity method investment1 1.2 1.6 (0.7) (3.5) (1.9) (0.5) (1.7) 1.6 (3.0) (1.6) Gain from equity method investment2 - - - - - - (135.4) - - - Share-based compensation3 2.7 3.2 3.3 3.4 3.0 2.7 3.5 4.0 3.8 4.1 Restructuring costs4 - - - - - - 5.8 5.6 1.3 1.1 Legal and other costs5 1.8 0.9 0.8 1.0 0.2 - - 0.4 1.7 0.1 Acquisition-related adjustments6 - - - - - - 5.5 4.3 4.2 0.2 Change in fair value of contingent consideration7 - - - - - - - 3.8 2.4 (0.3) Loss on extinguishment of debt8 - - - - - - - 42.3 - - Canada GST adjustment9 - - 2.2 - - - - - - - Transaction costs10 0.3 0.2 0.1 0.4 2.0 3.2 3.2 0.1 8.9 0.2 Intangible asset amortization12 0.6 0.7 0.8 0.8 0.7 0.8 1.9 1.8 1.8 3.0 Income tax valuations13 - - (3.5) - - - - - - - Impact of tax law changes14 - (9.1) - (2.1) - - - - - - Cumulative tax effect of adjustments15 (1.4) (1.3) (1.9) (1.4) 0.1 (1.7) 30.2 (15.4) (4.6) (1.8) Adjusted net income from continuing operations $34.8 $32.2 $22.2 $11.3 $8.6 $30.1 $17.4 $6.4 $(12.3) $6.3 Net income (loss) from continuing operations $29.6 $36.0 $21.1 $12.9 $4.5 $25.7 $104.5 $(40.2) $(28.9) $1.3 Diluted Weighted Average Shares Outstanding 43.2 41.9 41.5 41.8 42.6 43.6 43.7 41.2 40.3 41.3 Adjusted Diluted Weighted Average Shares Outstanding16 43.2 41.9 41.5 41.8 42.6 43.6 43.7 43.3 42.4 41.3 Diluted (Loss) Earnings per Share from Continuing Operations $0.68 $0.86 $0.51 $0.31 $0.11 $0.59 $2.39 $(1.02) $(0.72) $0.03 Per share impact of adjustments to net income (loss) from Continuing Operations $0.12 ($0.09) $0.02 ($0.04) $0.09 $0.10 ($1.99) $1.17 $0.43 $0.12 Adjusted Diluted Earnings per Share from Continuing Operations $0.80 $0.77 $0.53 $0.27 $0.20 $0.69 $0.40 $0.15 $(0.29) $0.15 For a description of each addback, refer to slide 14.
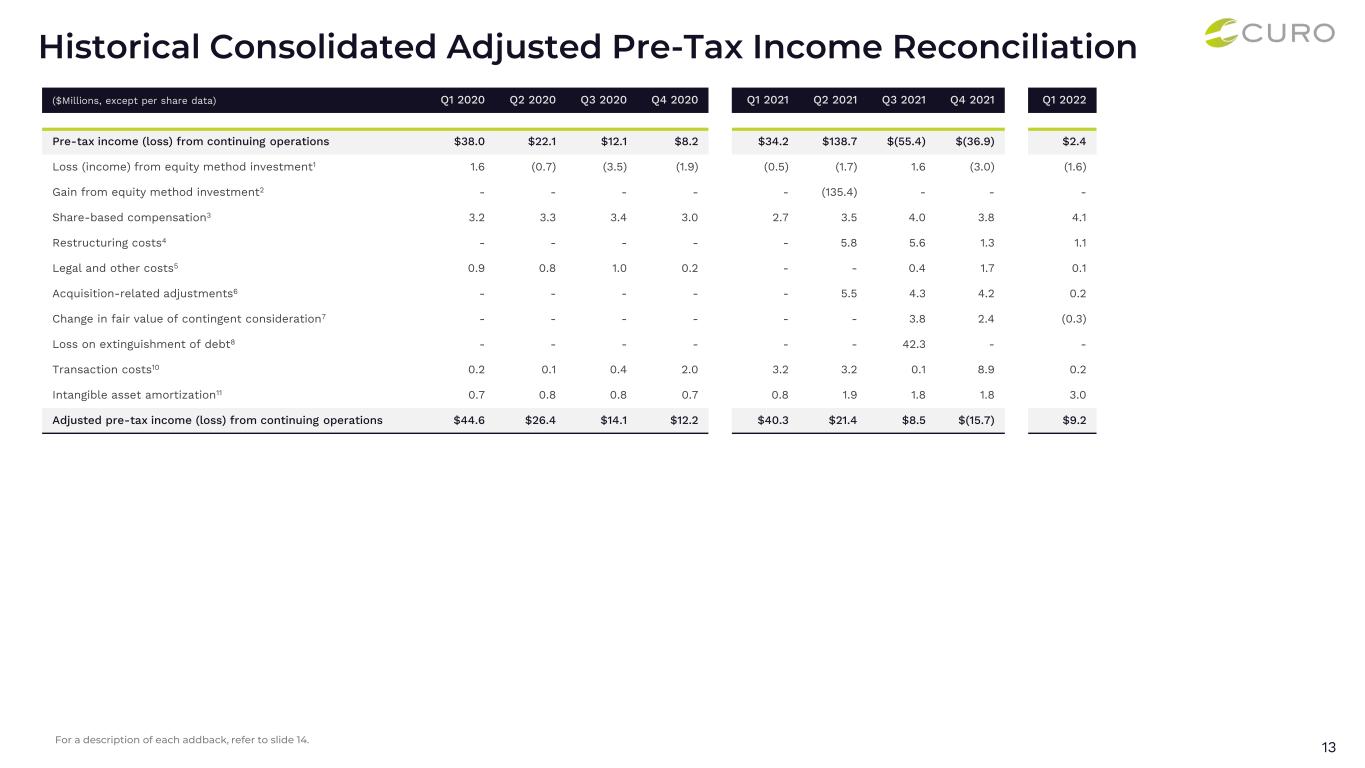

 
13 Historical Consolidated Adjusted Pre-Tax Income Reconciliation ($Millions, except per share data) Q1 2020 Q2 2020 Q3 2020 Q4 2020 Q1 2021 Q2 2021 Q3 2021 Q4 2021 Q1 2022 Pre-tax income (loss) from continuing operations $38.0 $22.1 $12.1 $8.2 $34.2 $138.7 $(55.4) $(36.9) $2.4 Loss (income) from equity method investment1 1.6 (0.7) (3.5) (1.9) (0.5) (1.7) 1.6 (3.0) (1.6) Gain from equity method investment2 - - - - - (135.4) - - - Share-based compensation3 3.2 3.3 3.4 3.0 2.7 3.5 4.0 3.8 4.1 Restructuring costs4 - - - - - 5.8 5.6 1.3 1.1 Legal and other costs5 0.9 0.8 1.0 0.2 - - 0.4 1.7 0.1 Acquisition-related adjustments6 - - - - - 5.5 4.3 4.2 0.2 Change in fair value of contingent consideration7 - - - - - - 3.8 2.4 (0.3) Loss on extinguishment of debt8 - - - - - - 42.3 - - Transaction costs10 0.2 0.1 0.4 2.0 3.2 3.2 0.1 8.9 0.2 Intangible asset amortization11 0.7 0.8 0.8 0.7 0.8 1.9 1.8 1.8 3.0 Adjusted pre-tax income (loss) from continuing operations $44.6 $26.4 $14.1 $12.2 $40.3 $21.4 $8.5 $(15.7) $9.2 For a description of each addback, refer to slide 14.
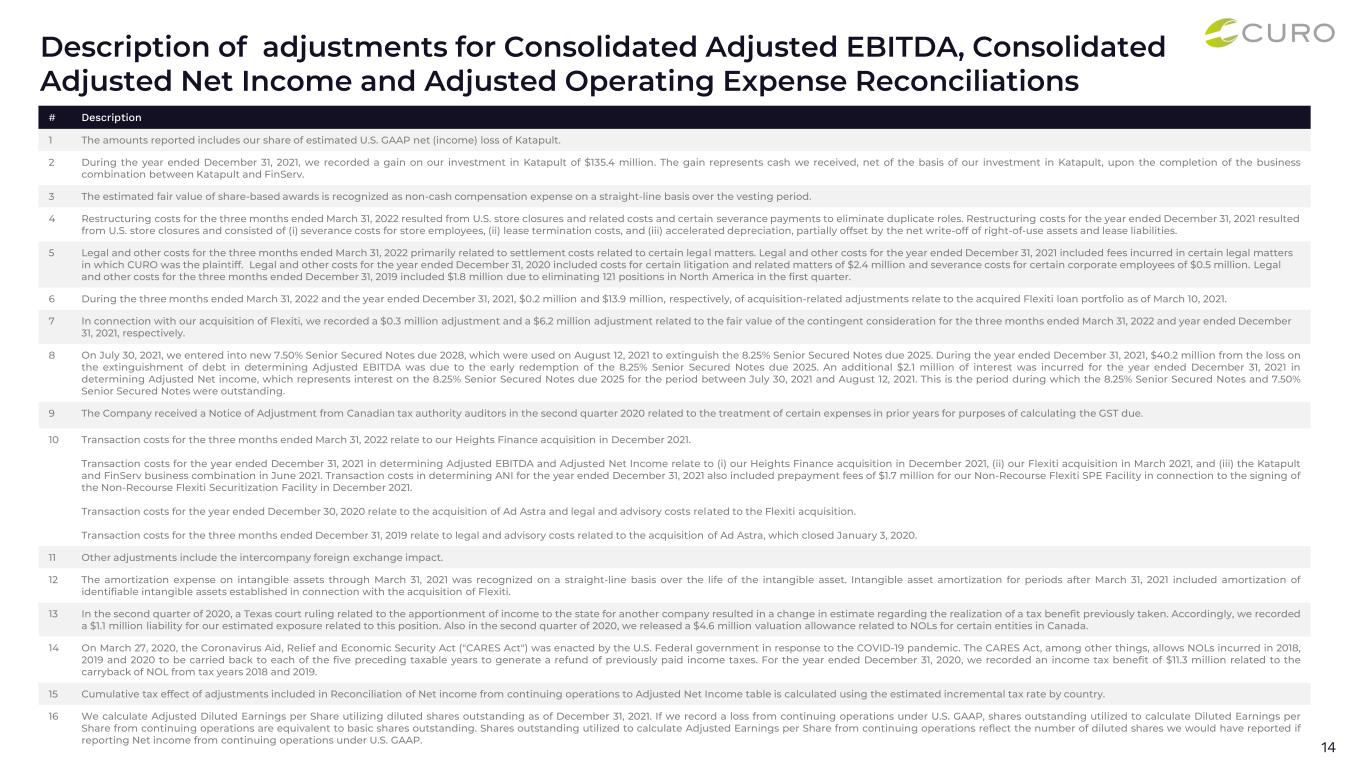

 
14 # Description 1 The amounts reported includes our share of estimated U.S. GAAP net (income) loss of Katapult. 2 During the year ended December 31, 2021, we recorded a gain on our investment in Katapult of $135.4 million. The gain represents cash we received, net of the basis of our investment in Katapult, upon the completion of the business combination between Katapult and FinServ. 3 The estimated fair value of share-based awards is recognized as non-cash compensation expense on a straight-line basis over the vesting period. 4 Restructuring costs for the three months ended March 31, 2022 resulted from U.S. store closures and related costs and certain severance payments to eliminate duplicate roles. Restructuring costs for the year ended December 31, 2021 resulted from U.S. store closures and consisted of (i) severance costs for store employees, (ii) lease termination costs, and (iii) accelerated depreciation, partially offset by the net write-off of right-of-use assets and lease liabilities. 5 Legal and other costs for the three months ended March 31, 2022 primarily related to settlement costs related to certain legal matters. Legal and other costs for the year ended December 31, 2021 included fees incurred in certain legal matters in which CURO was the plaintiff. Legal and other costs for the year ended December 31, 2020 included costs for certain litigation and related matters of $2.4 million and severance costs for certain corporate employees of $0.5 million. Legal and other costs for the three months ended December 31, 2019 included $1.8 million due to eliminating 121 positions in North America in the first quarter. 6 During the three months ended March 31, 2022 and the year ended December 31, 2021, $0.2 million and $13.9 million, respectively, of acquisition-related adjustments relate to the acquired Flexiti loan portfolio as of March 10, 2021. 7 In connection with our acquisition of Flexiti, we recorded a $0.3 million adjustment and a $6.2 million adjustment related to the fair value of the contingent consideration for the three months ended March 31, 2022 and year ended December 31, 2021, respectively. 8 On July 30, 2021, we entered into new 7.50% Senior Secured Notes due 2028, which were used on August 12, 2021 to extinguish the 8.25% Senior Secured Notes due 2025. During the year ended December 31, 2021, $40.2 million from the loss on the extinguishment of debt in determining Adjusted EBITDA was due to the early redemption of the 8.25% Senior Secured Notes due 2025. An additional $2.1 million of interest was incurred for the year ended December 31, 2021 in determining Adjusted Net income, which represents interest on the 8.25% Senior Secured Notes due 2025 for the period between July 30, 2021 and August 12, 2021. This is the period during which the 8.25% Senior Secured Notes and 7.50% Senior Secured Notes were outstanding. 9 The Company received a Notice of Adjustment from Canadian tax authority auditors in the second quarter 2020 related to the treatment of certain expenses in prior years for purposes of calculating the GST due. 10 Transaction costs for the three months ended March 31, 2022 relate to our Heights Finance acquisition in December 2021. Transaction costs for the year ended December 31, 2021 in determining Adjusted EBITDA and Adjusted Net Income relate to (i) our Heights Finance acquisition in December 2021, (ii) our Flexiti acquisition in March 2021, and (iii) the Katapult and FinServ business combination in June 2021. Transaction costs in determining ANI for the year ended December 31, 2021 also included prepayment fees of $1.7 million for our Non-Recourse Flexiti SPE Facility in connection to the signing of the Non-Recourse Flexiti Securitization Facility in December 2021. Transaction costs for the year ended December 30, 2020 relate to the acquisition of Ad Astra and legal and advisory costs related to the Flexiti acquisition. Transaction costs for the three months ended December 31, 2019 relate to legal and advisory costs related to the acquisition of Ad Astra, which closed January 3, 2020. 11 Other adjustments include the intercompany foreign exchange impact. 12 The amortization expense on intangible assets through March 31, 2021 was recognized on a straight-line basis over the life of the intangible asset. Intangible asset amortization for periods after March 31, 2021 included amortization of identifiable intangible assets established in connection with the acquisition of Flexiti. 13 In the second quarter of 2020, a Texas court ruling related to the apportionment of income to the state for another company resulted in a change in estimate regarding the realization of a tax benefit previously taken. Accordingly, we recorded a $1.1 million liability for our estimated exposure related to this position. Also in the second quarter of 2020, we released a $4.6 million valuation allowance related to NOLs for certain entities in Canada. 14 On March 27, 2020, the Coronavirus Aid, Relief and Economic Security Act ("CARES Act") was enacted by the U.S. Federal government in response to the COVID-19 pandemic. The CARES Act, among other things, allows NOLs incurred in 2018, 2019 and 2020 to be carried back to each of the five preceding taxable years to generate a refund of previously paid income taxes. For the year ended December 31, 2020, we recorded an income tax benefit of $11.3 million related to the carryback of NOL from tax years 2018 and 2019. 15 Cumulative tax effect of adjustments included in Reconciliation of Net income from continuing operations to Adjusted Net Income table is calculated using the estimated incremental tax rate by country. 16 We calculate Adjusted Diluted Earnings per Share utilizing diluted shares outstanding as of December 31, 2021. If we record a loss from continuing operations under U.S. GAAP, shares outstanding utilized to calculate Diluted Earnings per Share from continuing operations are equivalent to basic shares outstanding. Shares outstanding utilized to calculate Adjusted Earnings per Share from continuing operations reflect the number of diluted shares we would have reported if reporting Net income from continuing operations under U.S. GAAP. Description of adjustments for Consolidated Adjusted EBITDA, Consolidated Adjusted Net Income and Adjusted Operating Expense Reconciliations
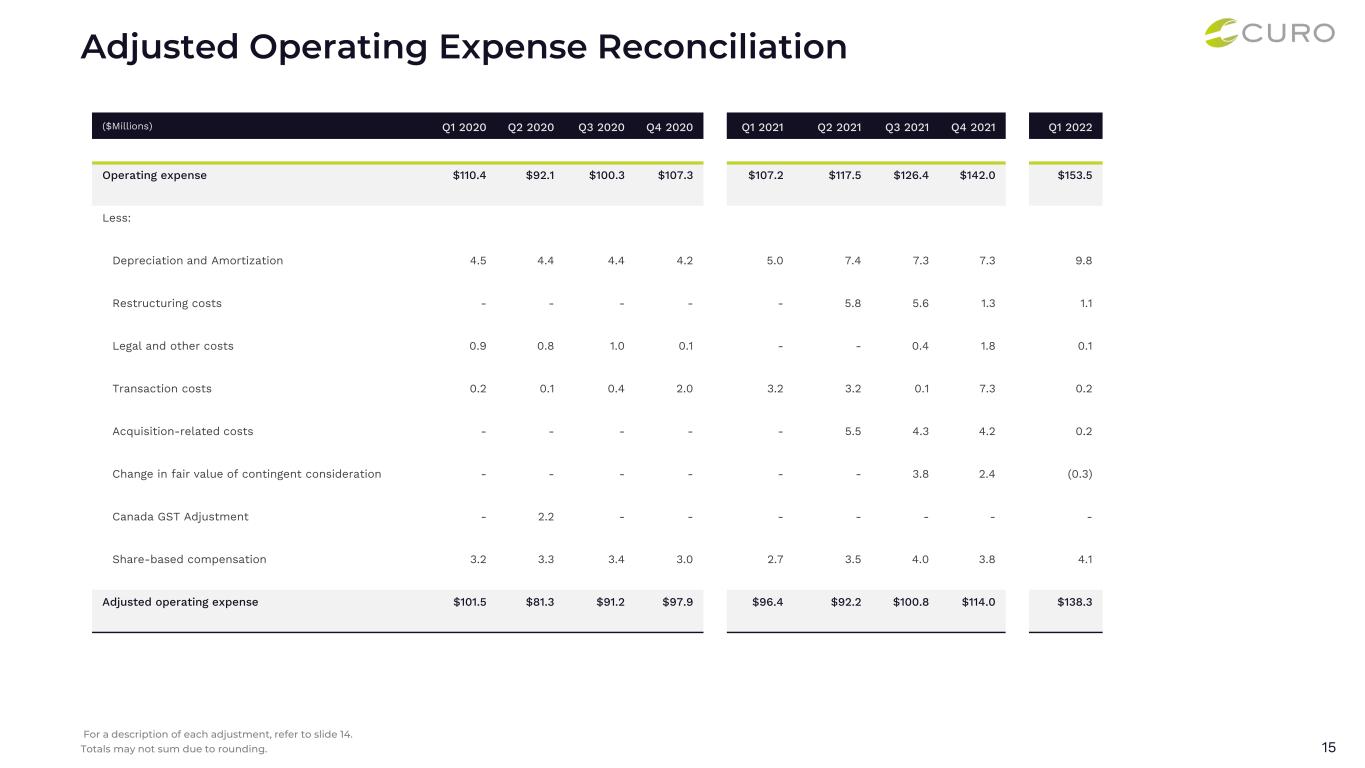

 
15 Adjusted Operating Expense Reconciliation ($Millions) Q1 2020 Q2 2020 Q3 2020 Q4 2020 Q1 2021 Q2 2021 Q3 2021 Q4 2021 Q1 2022 Operating expense $110.4 $92.1 $100.3 $107.3 $107.2 $117.5 $126.4 $142.0 $153.5 Less: Depreciation and Amortization 4.5 4.4 4.4 4.2 5.0 7.4 7.3 7.3 9.8 Restructuring costs - - - - - 5.8 5.6 1.3 1.1 Legal and other costs 0.9 0.8 1.0 0.1 - - 0.4 1.8 0.1 Transaction costs 0.2 0.1 0.4 2.0 3.2 3.2 0.1 7.3 0.2 Acquisition-related costs - - - - - 5.5 4.3 4.2 0.2 Change in fair value of contingent consideration - - - - - - 3.8 2.4 (0.3) Canada GST Adjustment - 2.2 - - - - - - - Share-based compensation 3.2 3.3 3.4 3.0 2.7 3.5 4.0 3.8 4.1 Adjusted operating expense $101.5 $81.3 $91.2 $97.9 $96.4 $92.2 $100.8 $114.0 $138.3 For a description of each adjustment, refer to slide 14. Totals may not sum due to rounding.
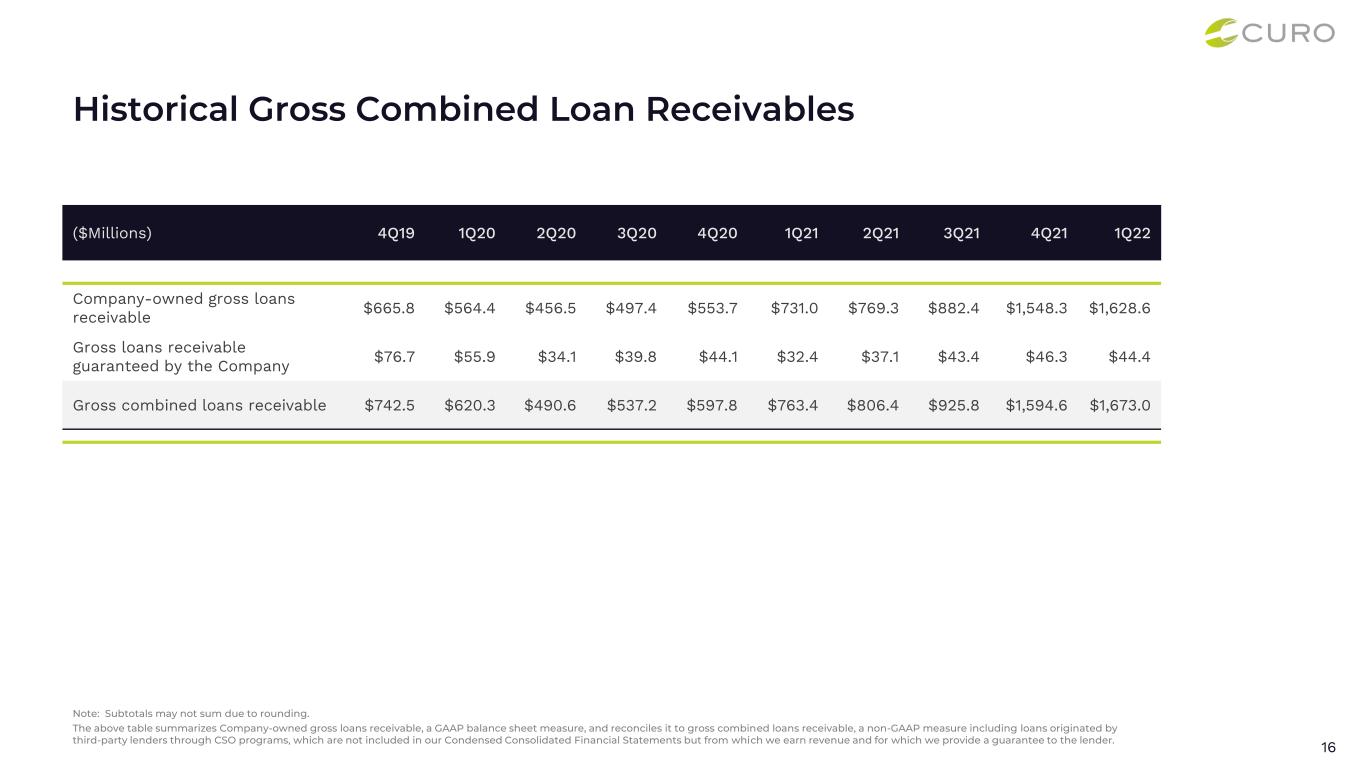

 
16 Historical Gross Combined Loan Receivables ($Millions) 4Q19 1Q20 2Q20 3Q20 4Q20 1Q21 2Q21 3Q21 4Q21 1Q22 Company-owned gross loans receivable $665.8 $564.4 $456.5 $497.4 $553.7 $731.0 $769.3 $882.4 $1,548.3 $1,628.6 Gross loans receivable guaranteed by the Company $76.7 $55.9 $34.1 $39.8 $44.1 $32.4 $37.1 $43.4 $46.3 $44.4 Gross combined loans receivable $742.5 $620.3 $490.6 $537.2 $597.8 $763.4 $806.4 $925.8 $1,594.6 $1,673.0 Note: Subtotals may not sum due to rounding. The above table summarizes Company-owned gross loans receivable, a GAAP balance sheet measure, and reconciles it to gross combined loans receivable, a non-GAAP measure including loans originated by third-party lenders through CSO programs, which are not included in our Condensed Consolidated Financial Statements but from which we earn revenue and for which we provide a guarantee to the lender.