Exhibit 99.1
|
|
PRESS RELEASE |
FOR IMMEDIATE RELEASE |
|
Omaha, Nebraska |
November 6, 2025
MEDIA CONTACT:
Fran Del Valle
Greystone
917-922-5653
fran@influencecentral.com
INVESTOR CONTACT:
Andy Grier
Investor Relations
402-952-1235
Greystone Housing Impact Investors Reports Third Quarter 2025 Financial Results and Operational Initiatives
Omaha, Nebraska – On November 6, 2025, Greystone Housing Impact Investors LP (NYSE: GHI) (the “Partnership”) announced financial results for the three months ended September 30, 2025. The Partnership will host a call today at 4:30 p.m. Eastern Time to discuss the results and business outlook. Details for accessing the call can be found below under "Earnings Webcast & Conference Call."
Financial Highlights
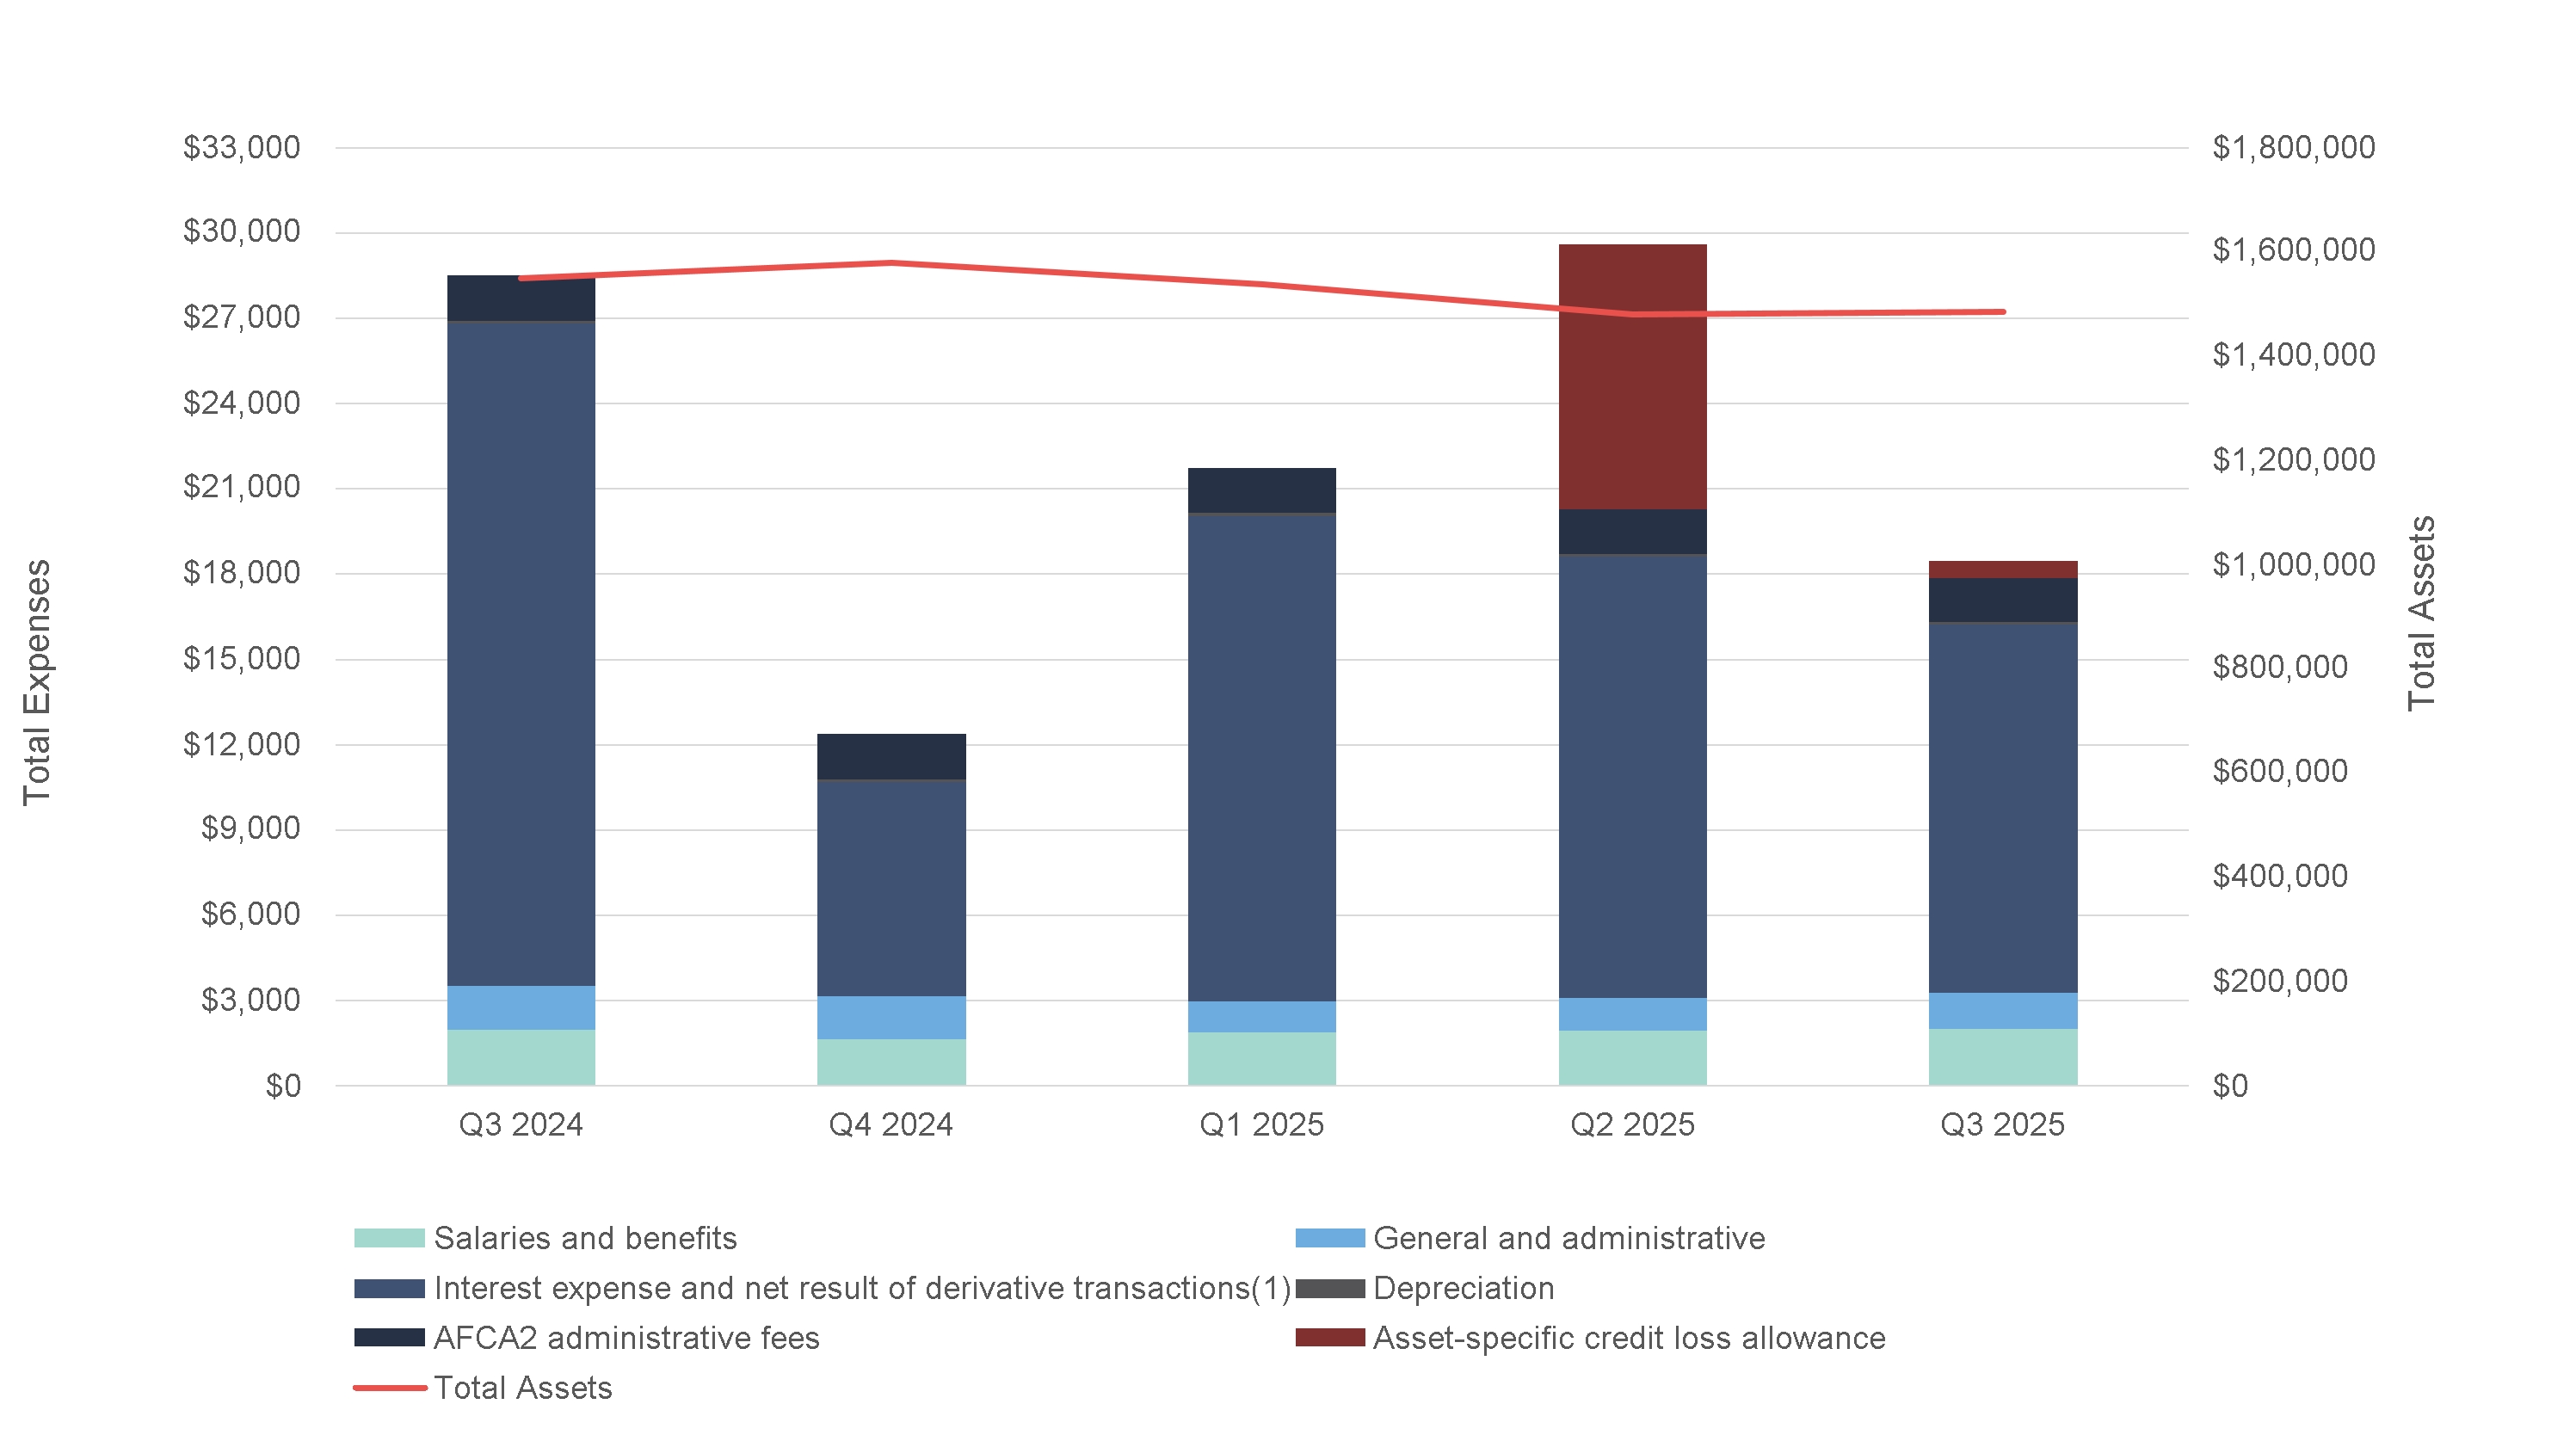
The Partnership reported the following results as of and for the three months ended September 30, 2025:
•Net income of $2.0 million or $0.03 per Beneficial Unit Certificate (“BUC”), basic and diluted
•Cash Available for Distribution (“CAD”) of $4.6 million or $0.20 per BUC
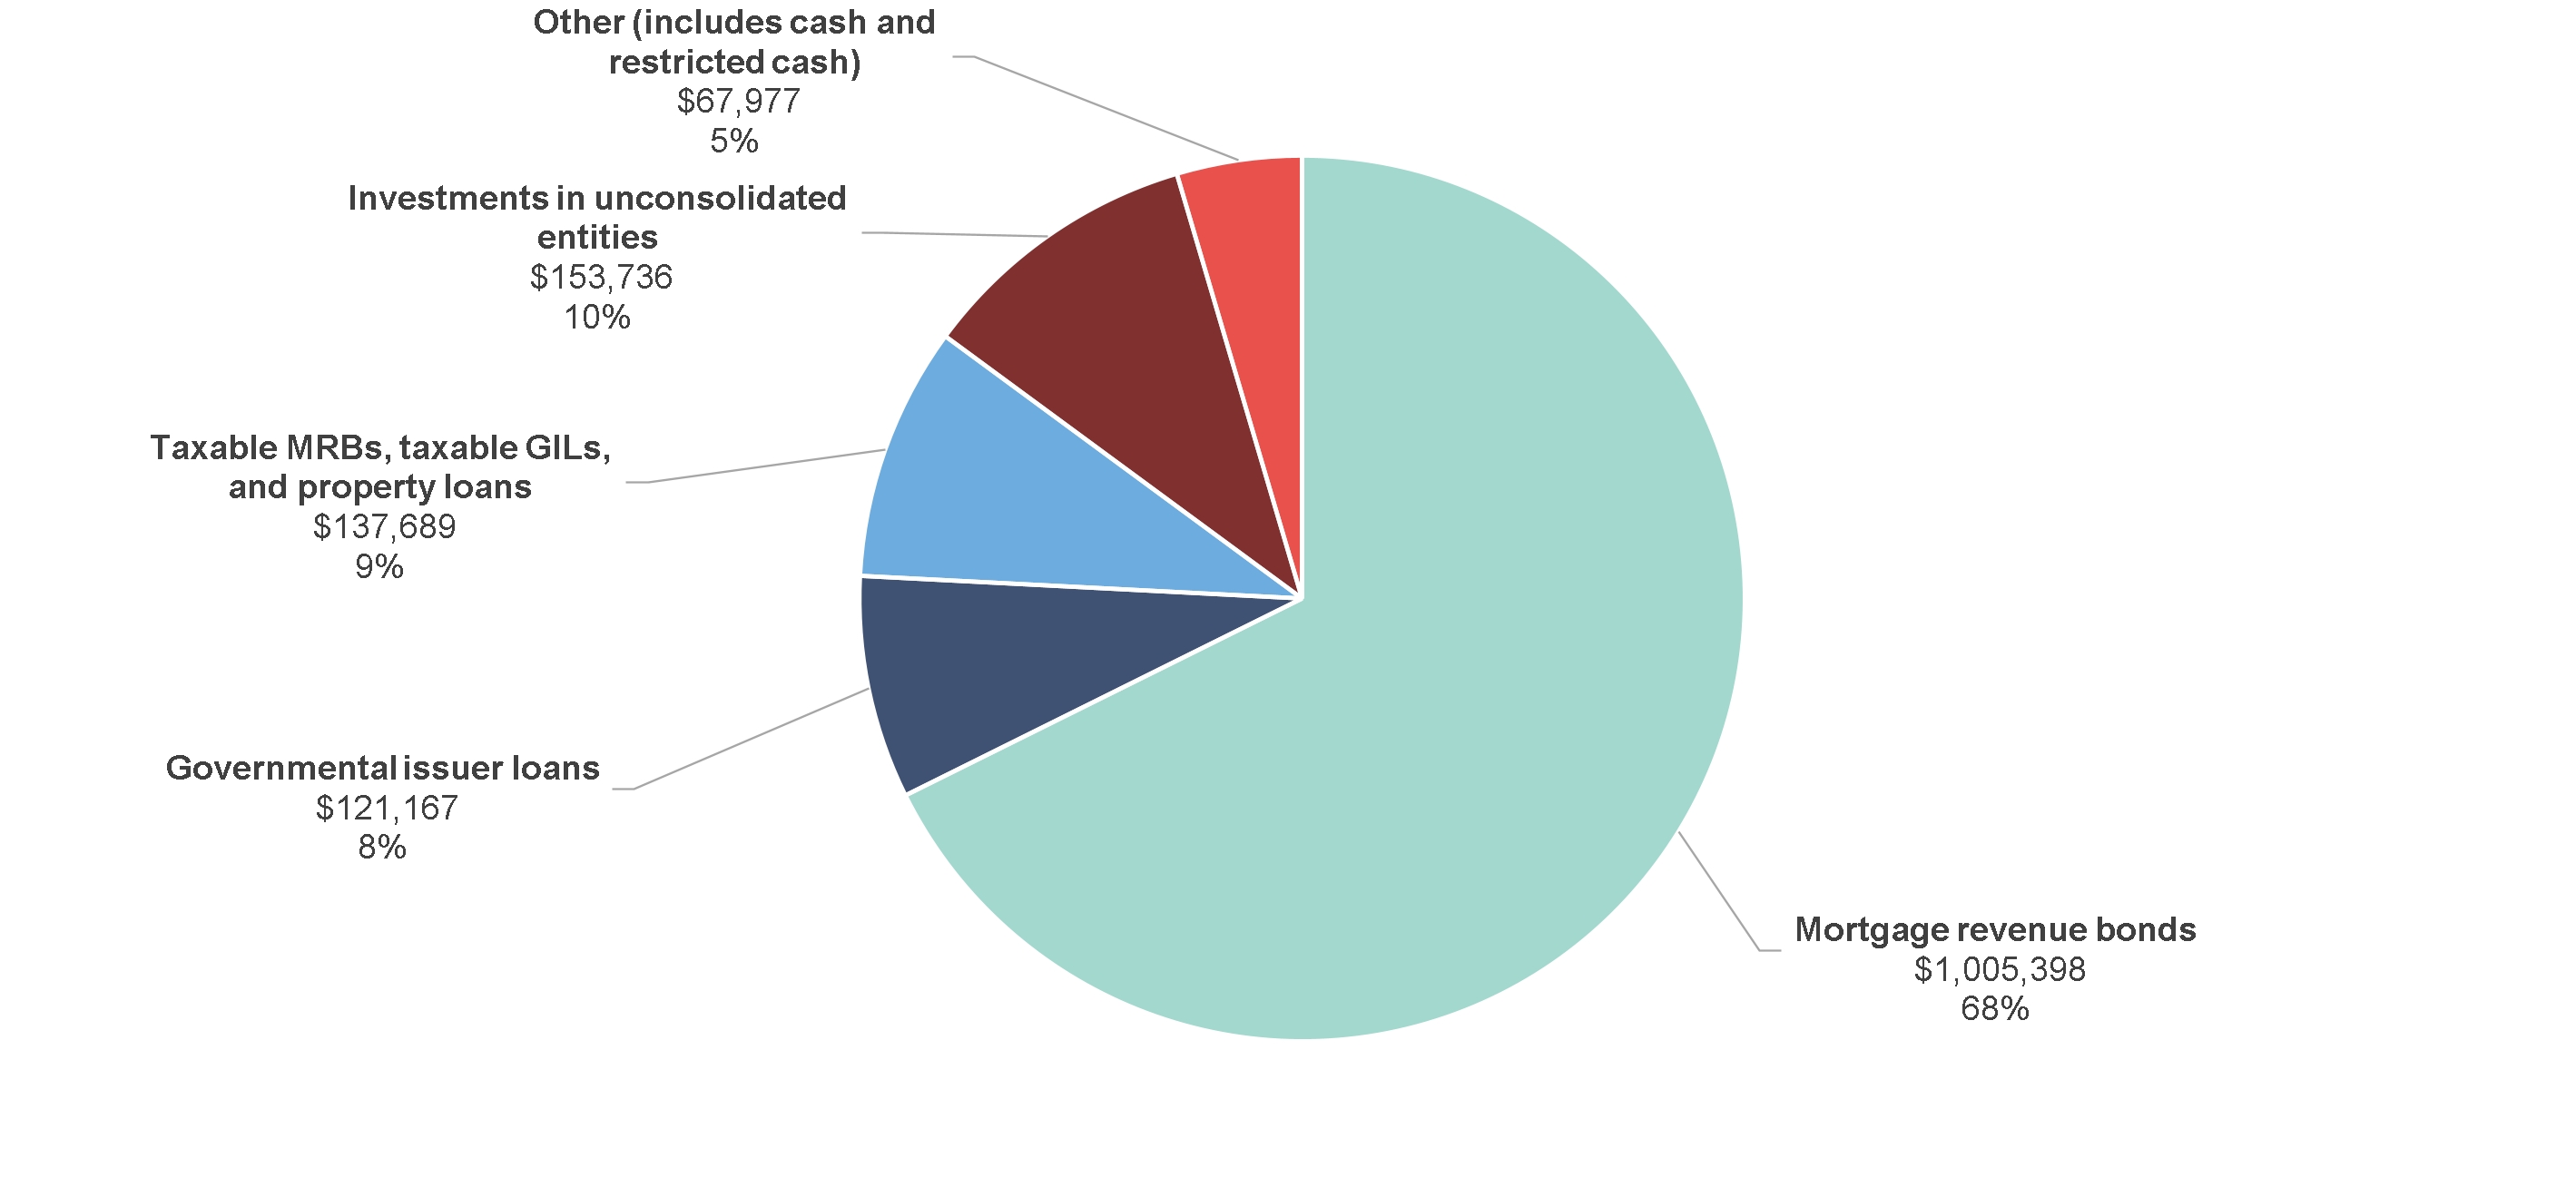
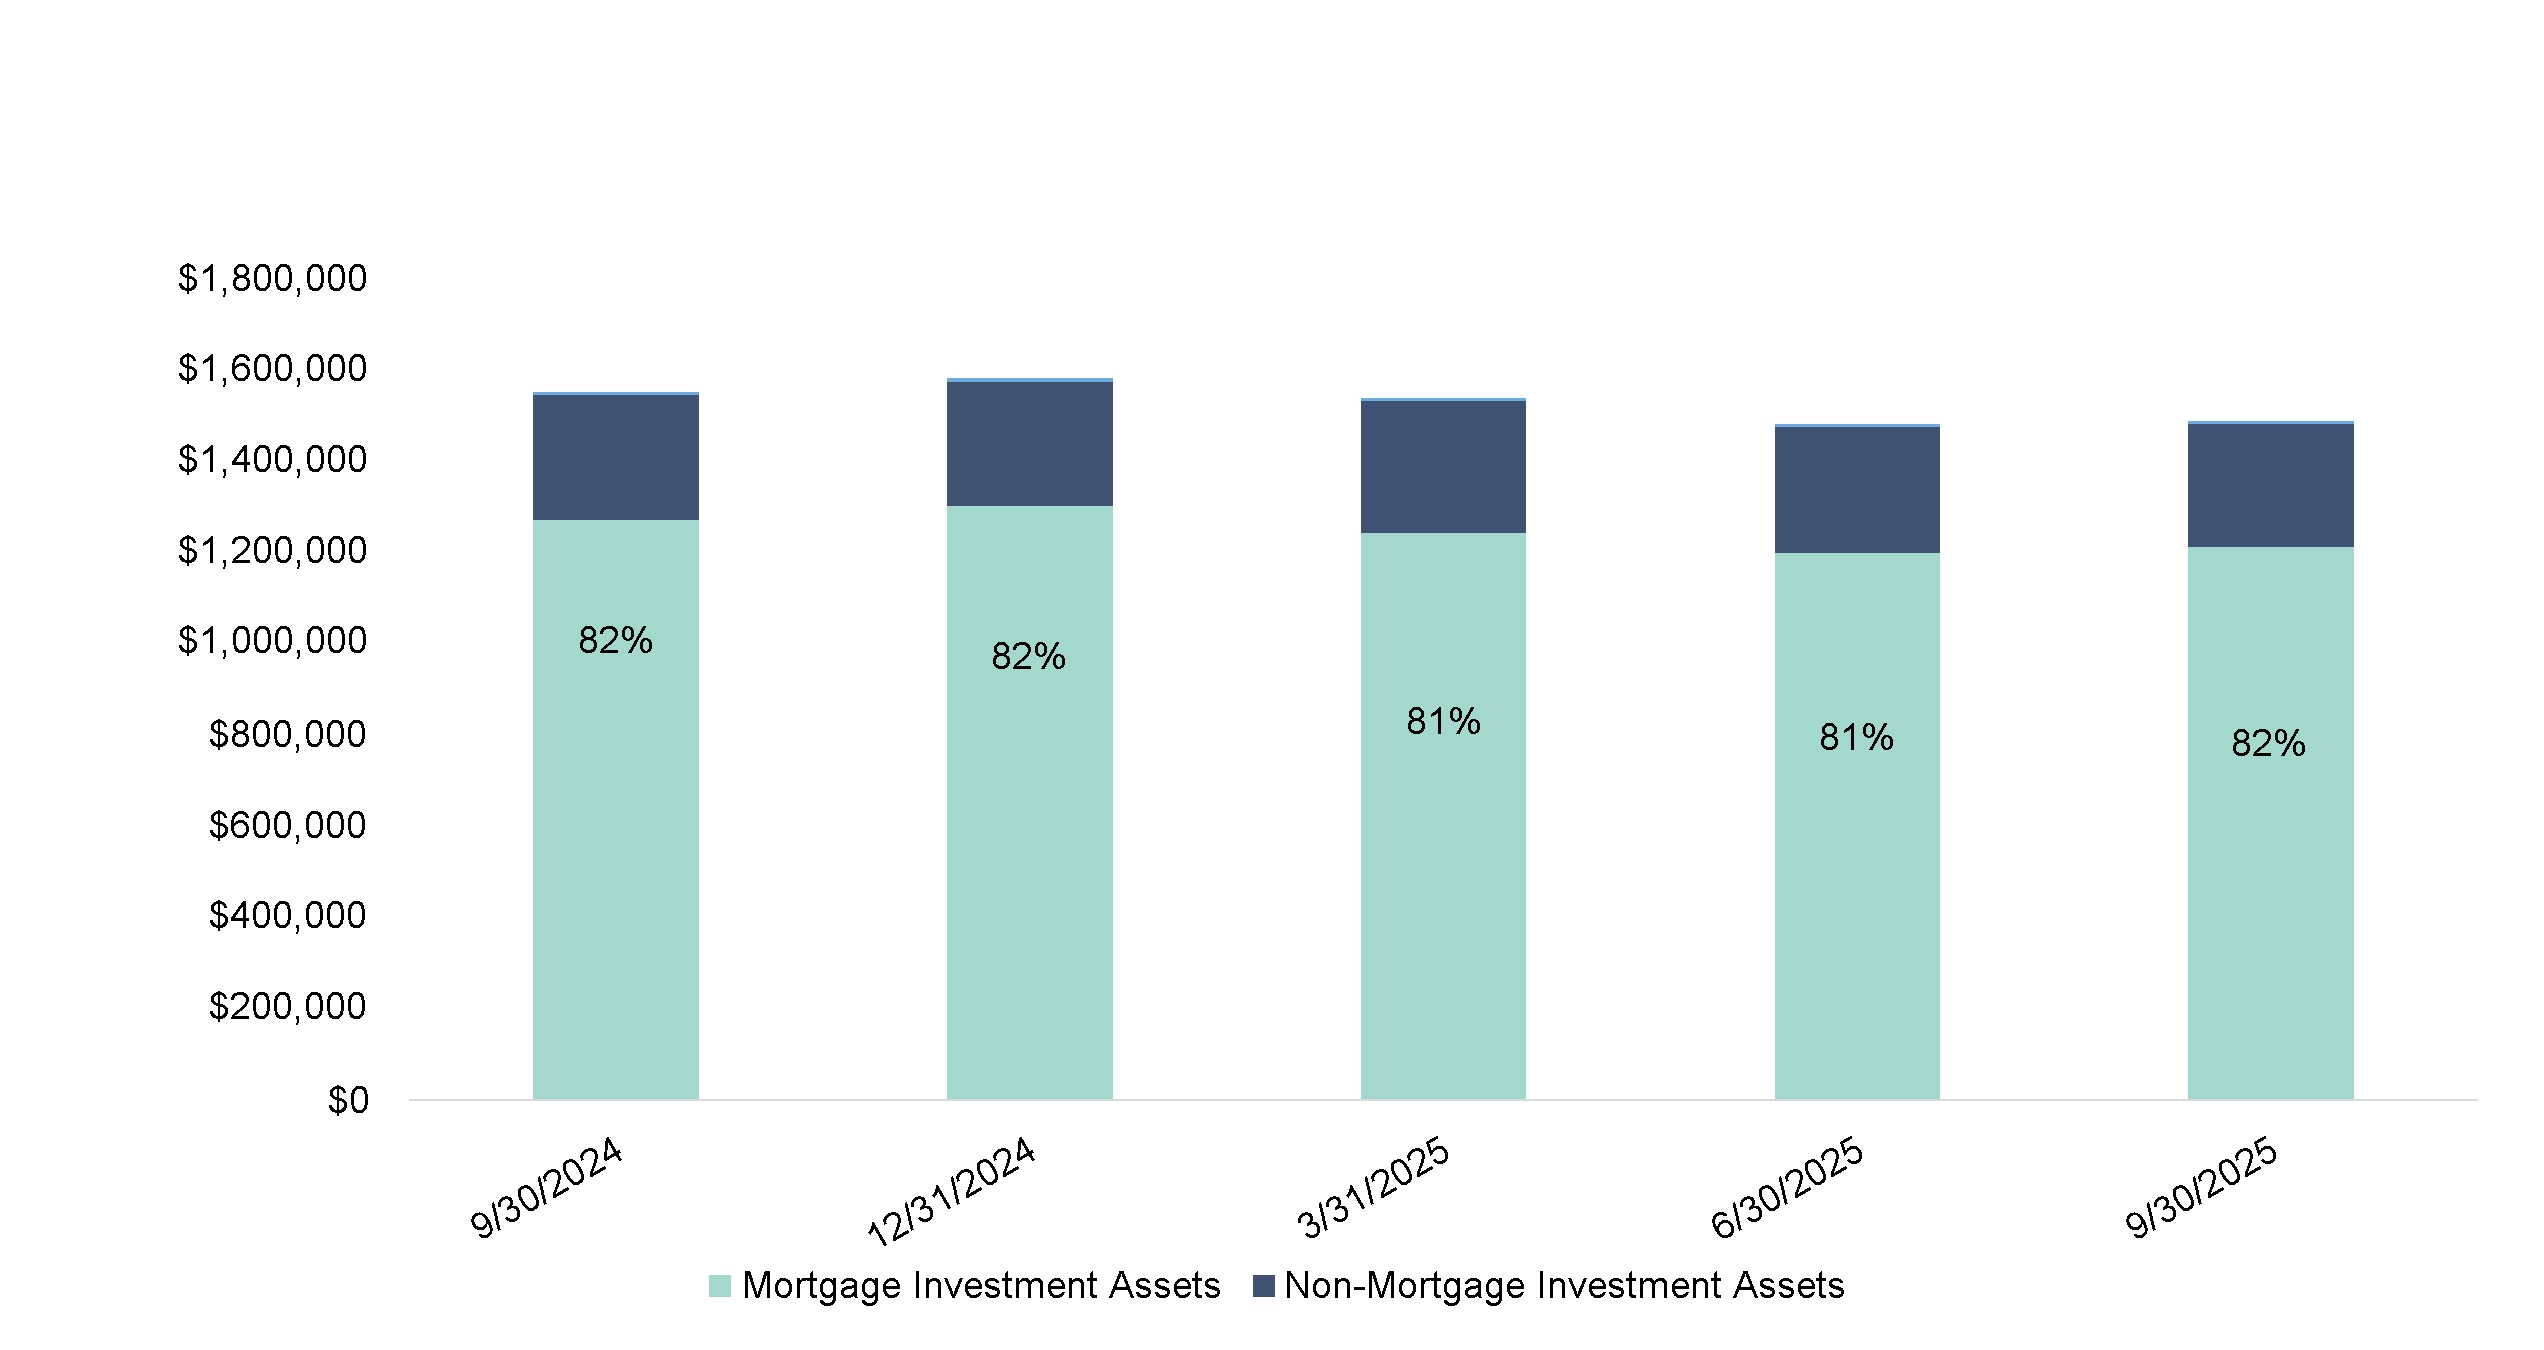
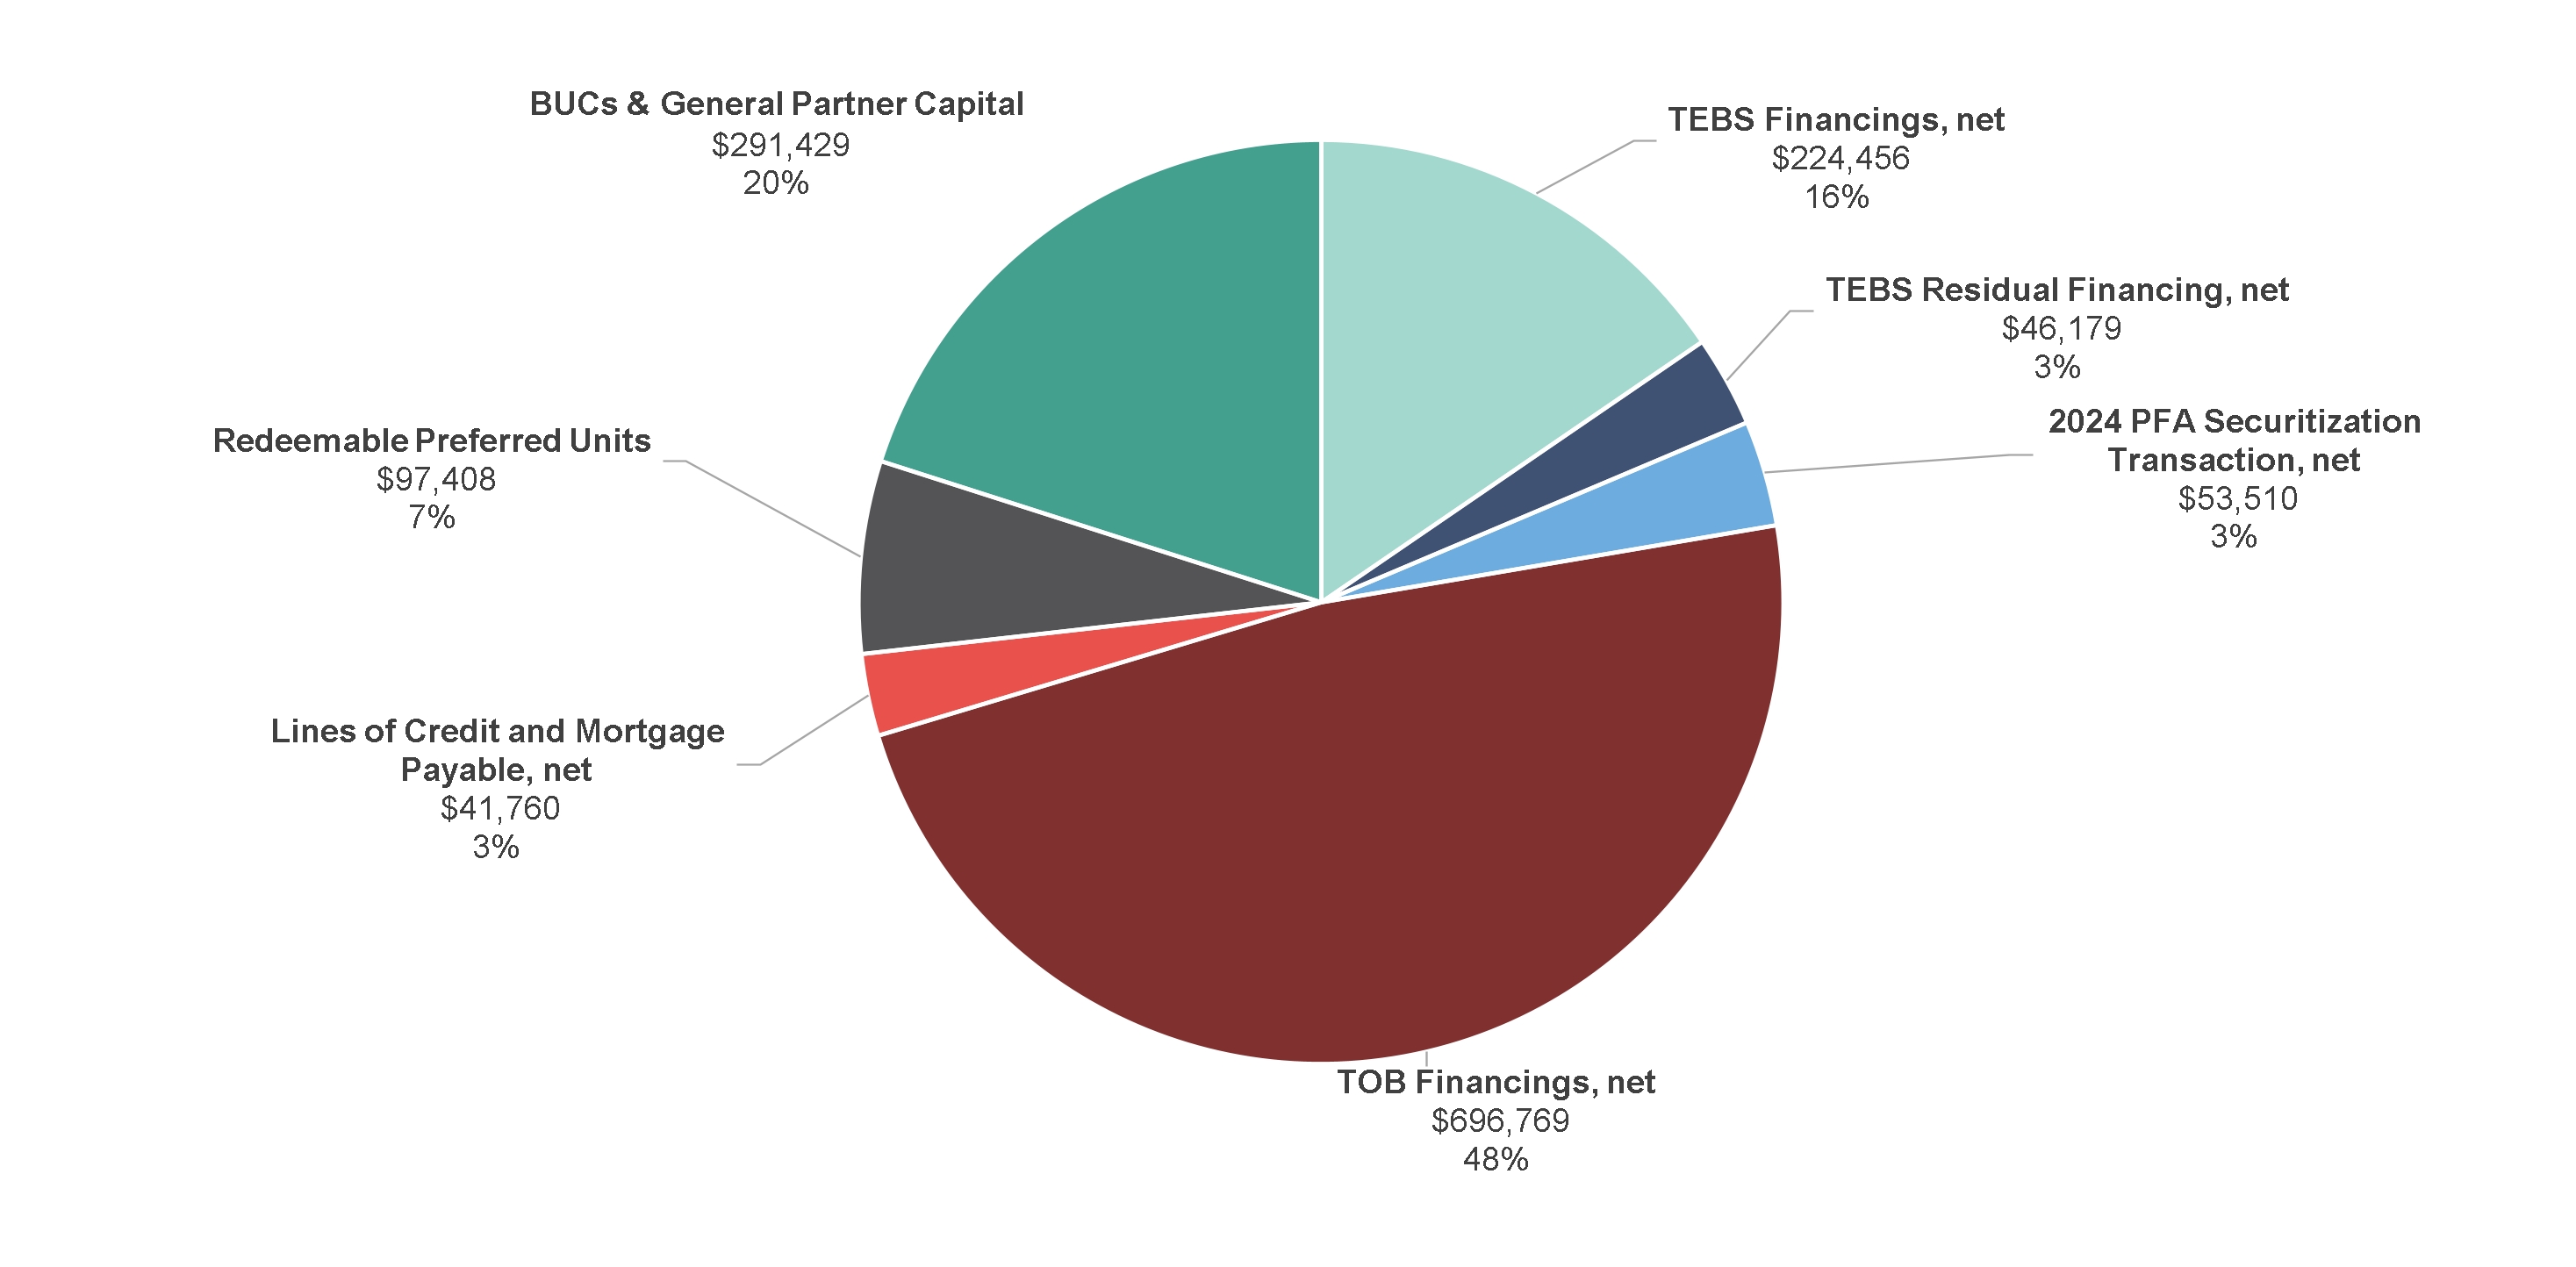
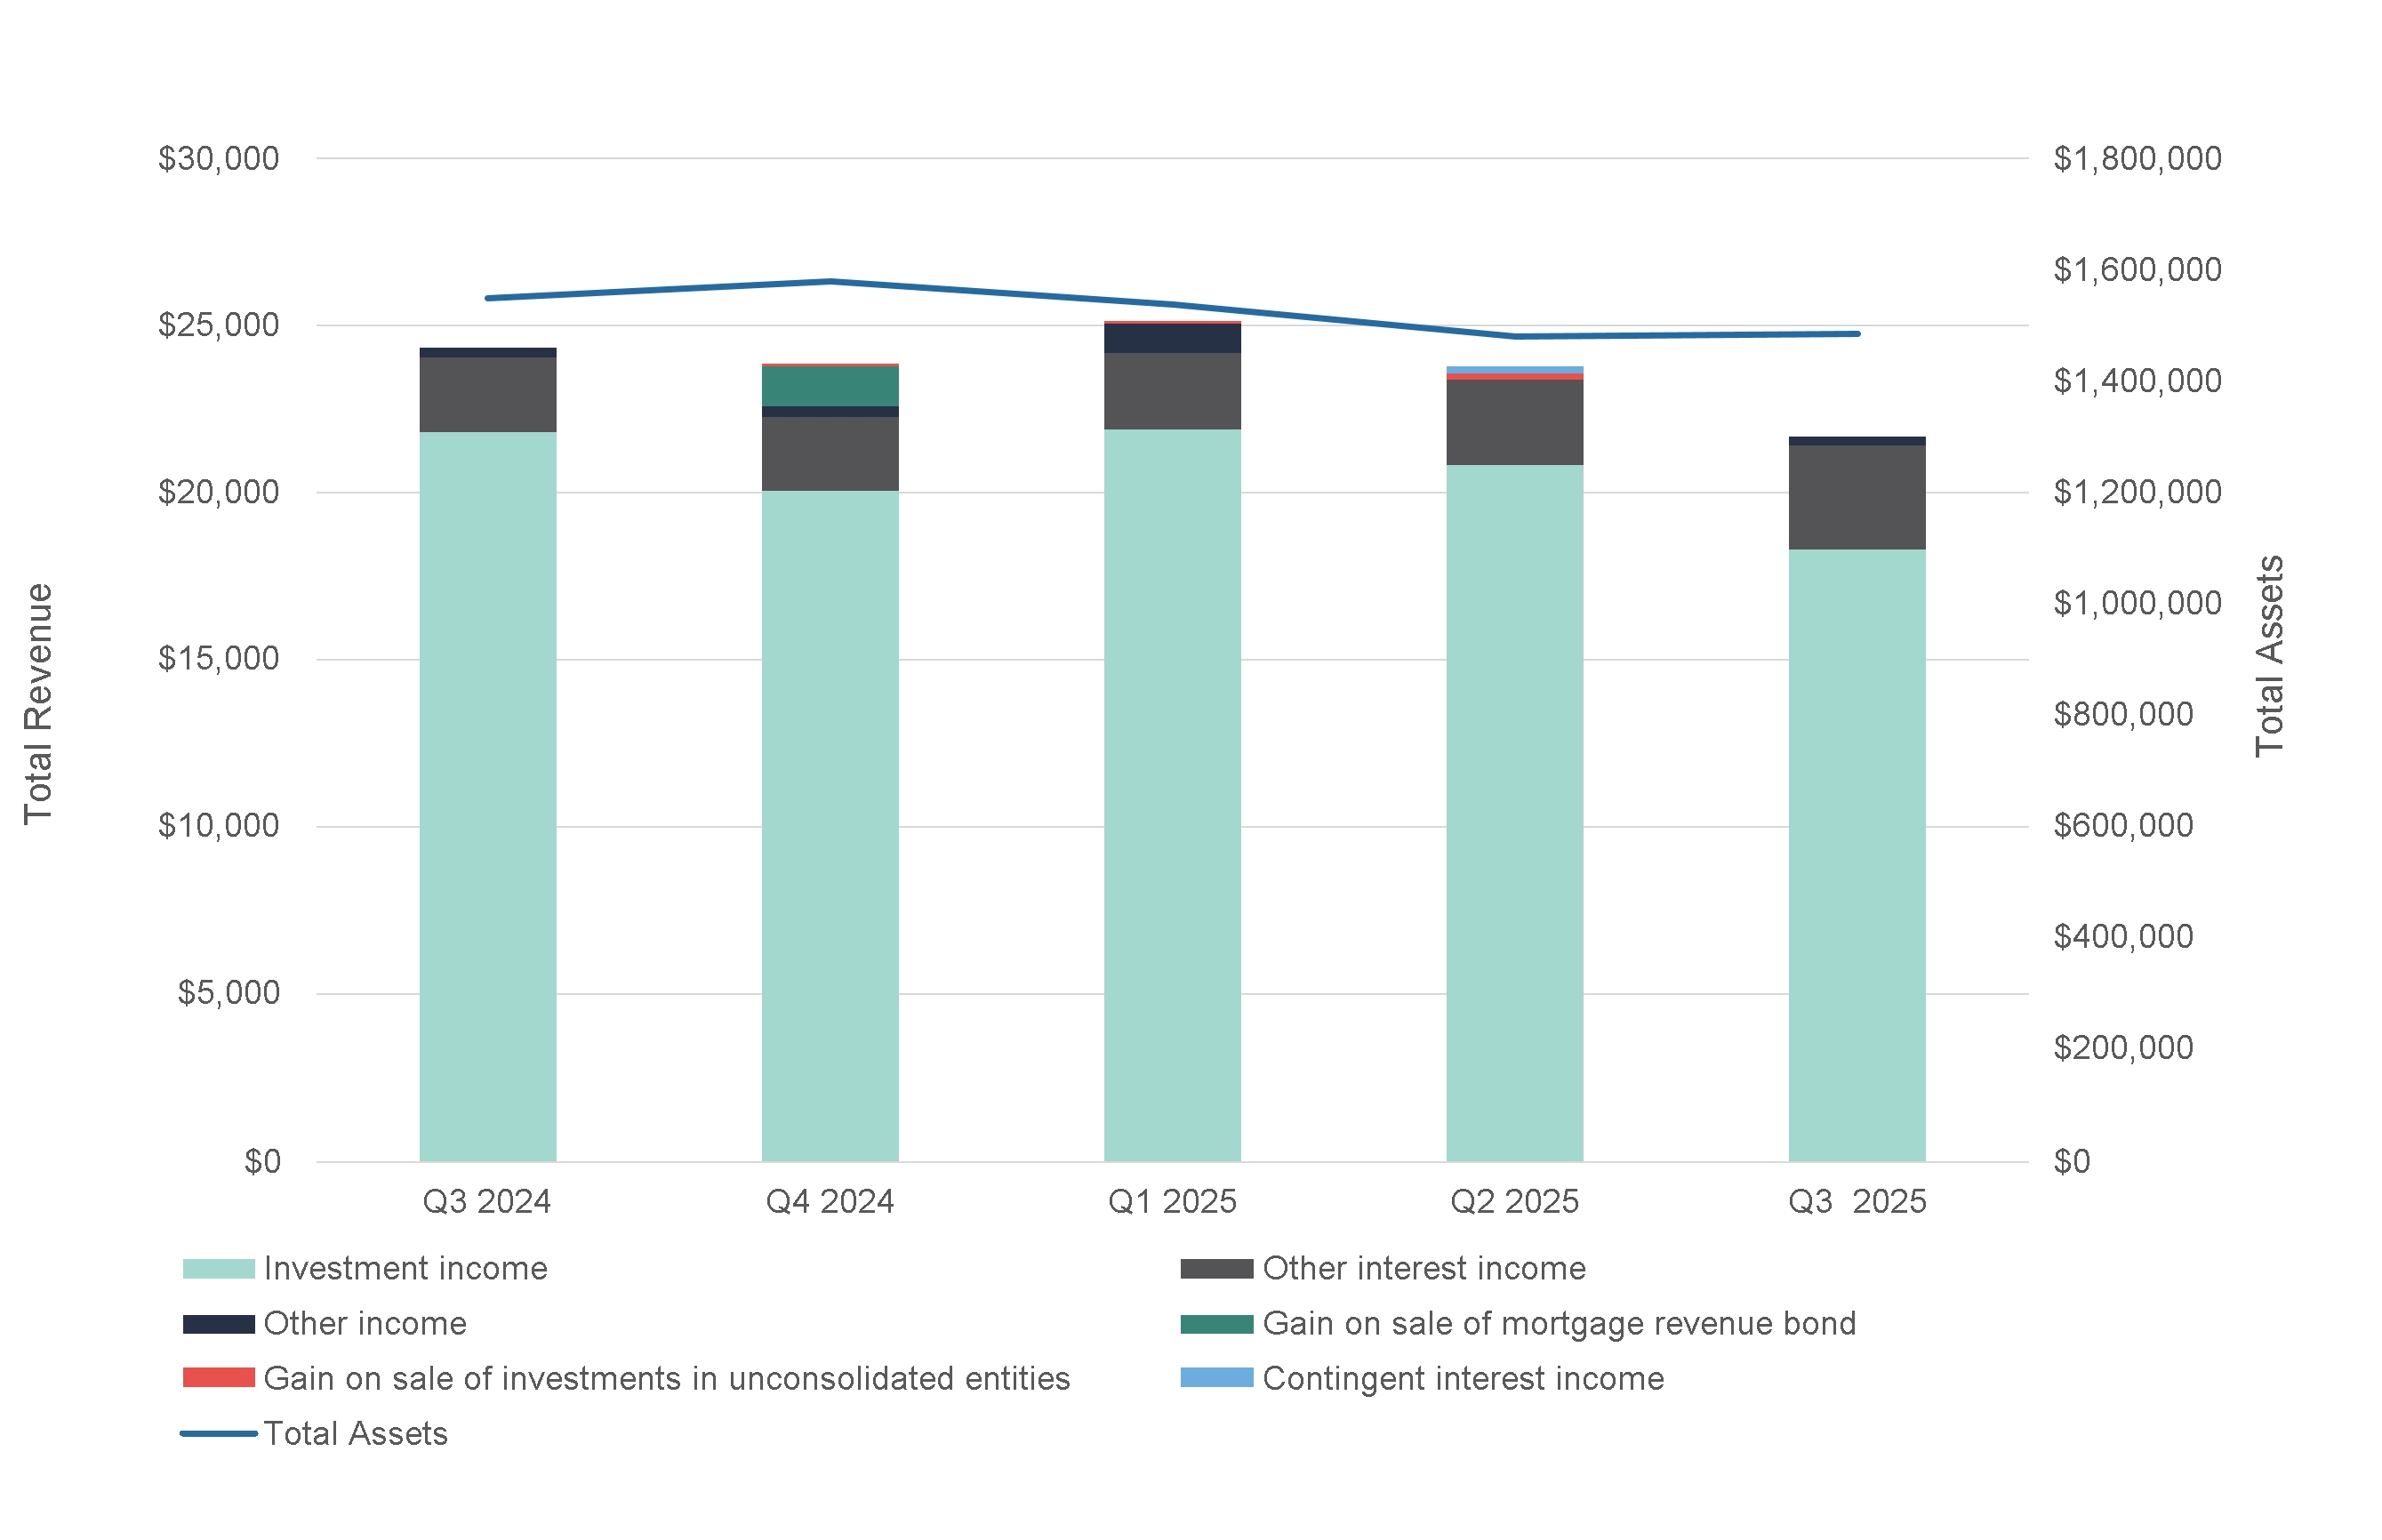
•Total assets of $1.49 billion
•Total Mortgage Revenue Bond (“MRB”) and Governmental Issuer Loan (“GIL”) investments of $1.13 billion
A reconciliation of net income to CAD is included below under “Disclosure Regarding Non-GAAP Measures - Cash Available for Distribution.”
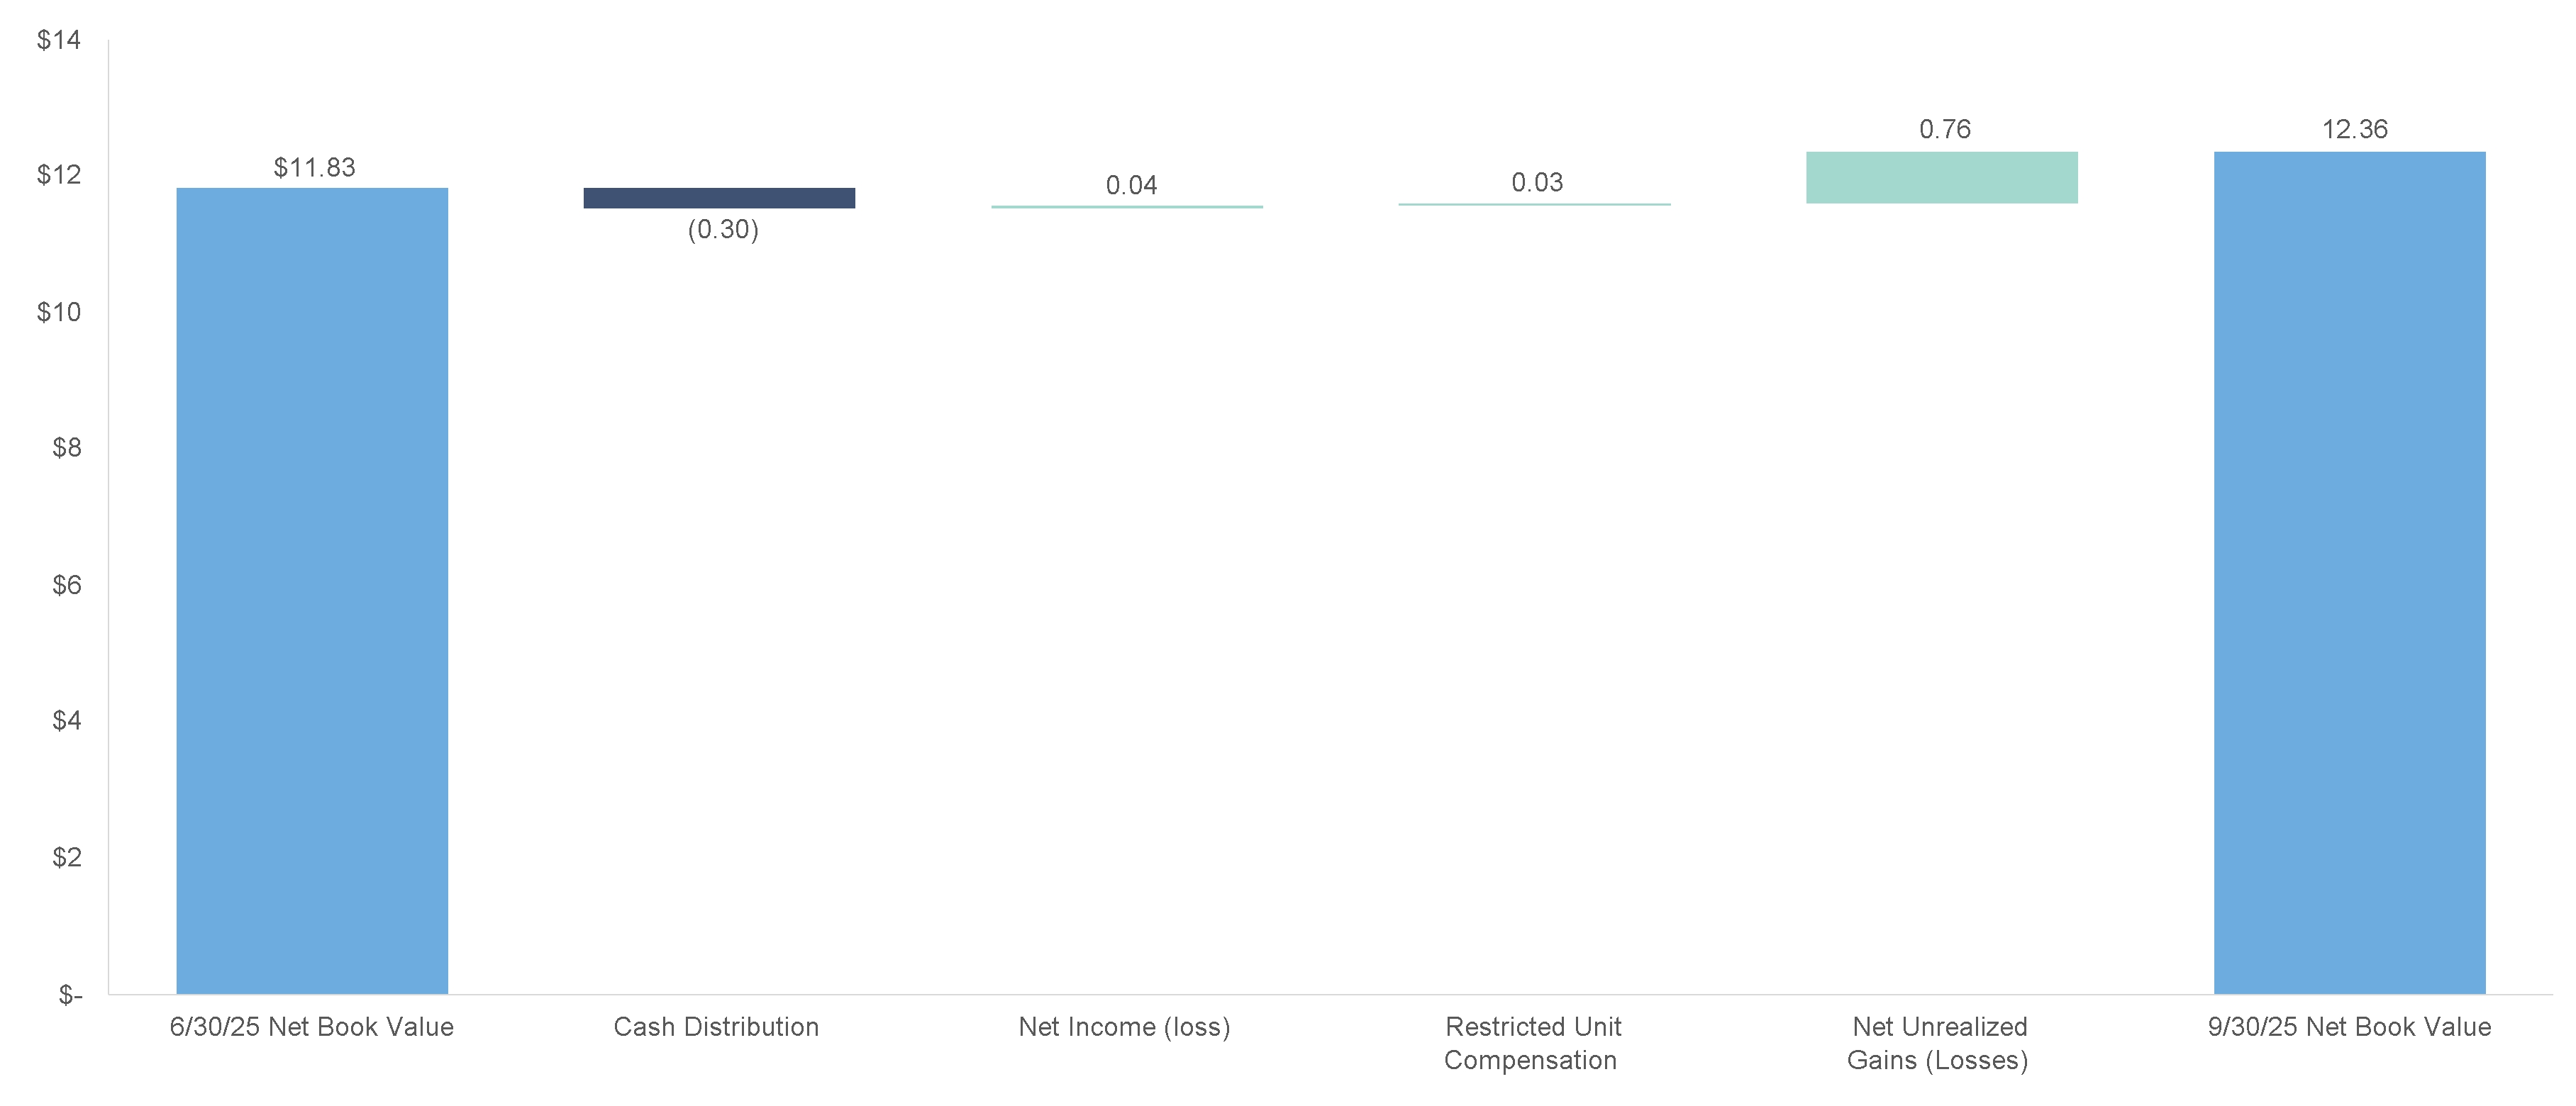
In September 2025, the Partnership announced that the Board of Managers of Greystone AF Manager LLC declared a regular quarterly distribution to the Partnership's BUC holders of $0.30 per BUC. The distribution was paid on October 31, 2025, to BUC holders of record as of the close of trading on September 30, 2025.
The Partnership also announced that Vantage at Loveland, a 288-unit market rate multifamily property located in Loveland, CO (the “Property”), has been publicly listed for sale at the direction of the Property-owning entity’s managing member. The Partnership’s non-controlling investment in the Property was originated in April 2021 and the Partnership has contributed net equity totaling $21.1 million during construction and stabilization. Construction of the Property was completed in October 2024. The Property reported 90% physical occupancy as of September 30, 2025.
Operational Initiatives
In 2015, the Partnership began investing in joint ventures related to the construction of market rate multifamily properties. Based largely on the overall low-interest rate environment and high investor demand for market rate multifamily properties, these investment structures provided the Partnership with the opportunity for attractive returns once properties were fully developed and sold to third parties.
In more recent periods, market conditions, such as higher interest rates and higher multifamily capitalization rates began negatively impacting multifamily asset values, resulting in lower returns upon sales of these properties. The Partnership believes these challenging conditions will continue to impact market rate multifamily investment profitability for the foreseeable future. The Partnership, however, remains positive on market rate senior housing investment opportunities.
Additionally, the Partnership also sees strong investment opportunities for its traditional investments in tax-exempt MRBs associated with affordable multifamily properties, as well as for seniors housing and skilled nursing properties. Greystone’s strong lending relationships across affordable housing, seniors housing, and skilled nursing business lines are also providing investment opportunities for the Partnership. The Partnership believes these tax-exempt MRB opportunities will allow the Partnership to deploy capital in investments with more predictable returns, since profitability is based on the net interest spread between the bond interest rate and the related debt financing rate.
Based on these factors, the Partnership will be implementing a strategy to reduce its capital allocation to joint venture equity investments in market rate multifamily properties going forward. The Partnership and the respective managing members will manage the remaining portfolio of market rate multifamily investments to maximize sales prices and returns to the extent possible, with return of capital from the sale of these investments to be redeployed into primarily tax-exempt mortgage revenue bond investments.
The Partnership believes this change in investment strategy provides many benefits to unitholders, including more stable investment earnings, an increase in the proportion of tax-advantage income allocated to unitholders in the long-term, and more capital allocated to a proven investment class that is core to the Partnership’s operations that also leverages the strong relationships and knowledge base of Greystone’s other lending platforms.
The Partnership and the Board of Managers will continue refining this operating strategy in the coming quarters. The Partnership and Board of Managers are also assessing the potential impact, if any, this change in strategy will have on the Partnership’s short-term and long-term earnings expectations and future unitholder distributions, with a focus on the long-term benefit to unitholders and the Partnership.
Recent Investment and Financing Activity
The Partnership reported the following updates for the third quarter of 2025:
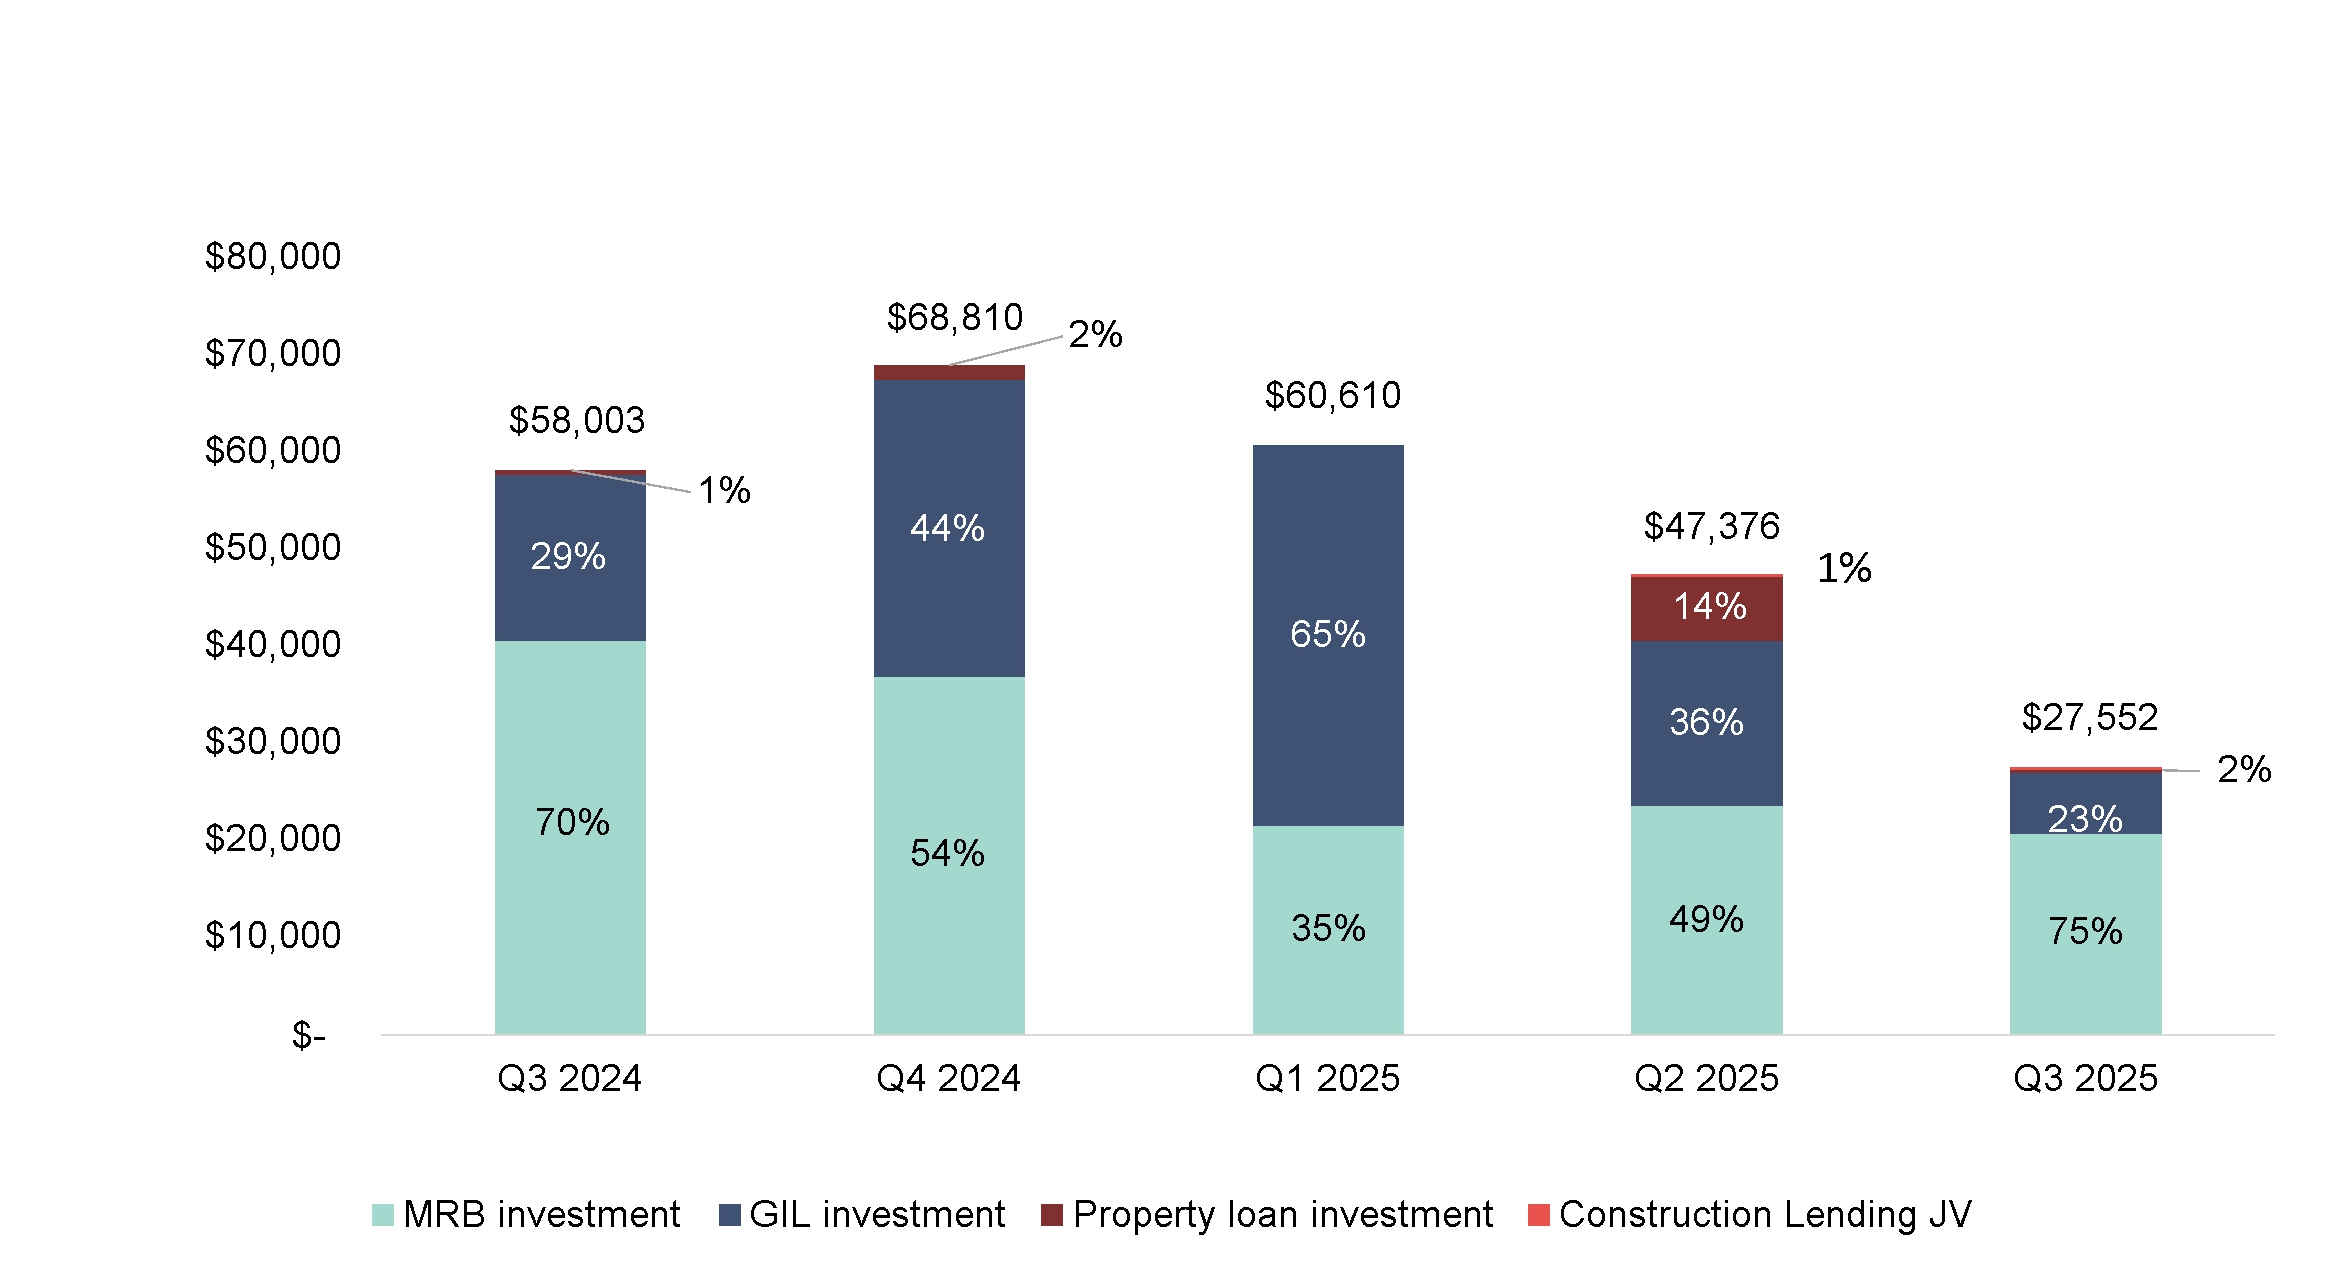
•Advances and acquisitions of MRB, taxable MRB, taxable GIL and property loan investments totaled approximately $27.5 million.
•Redemptions and paydowns of MRB investments totaled approximately $29.0 million.
•Advances to market-rate joint venture equity investments totaled approximately $383,000.
Additionally, in October 2025, the Partnership issued Series B Preferred Units to a new investor for gross proceeds of $5.0 million. The Partnership intends to use the proceeds from this issuance to acquire additional investments, fund its existing investment commitments, and support general operations.
Investment Portfolio Updates
The Partnership announced the following updates regarding its investment portfolio:
•All MRB and GIL investments are current on contractual principal and interest payments and the Partnership has received no requests for forbearance of contractual principal and interest payments from borrowers as of September 30, 2025.
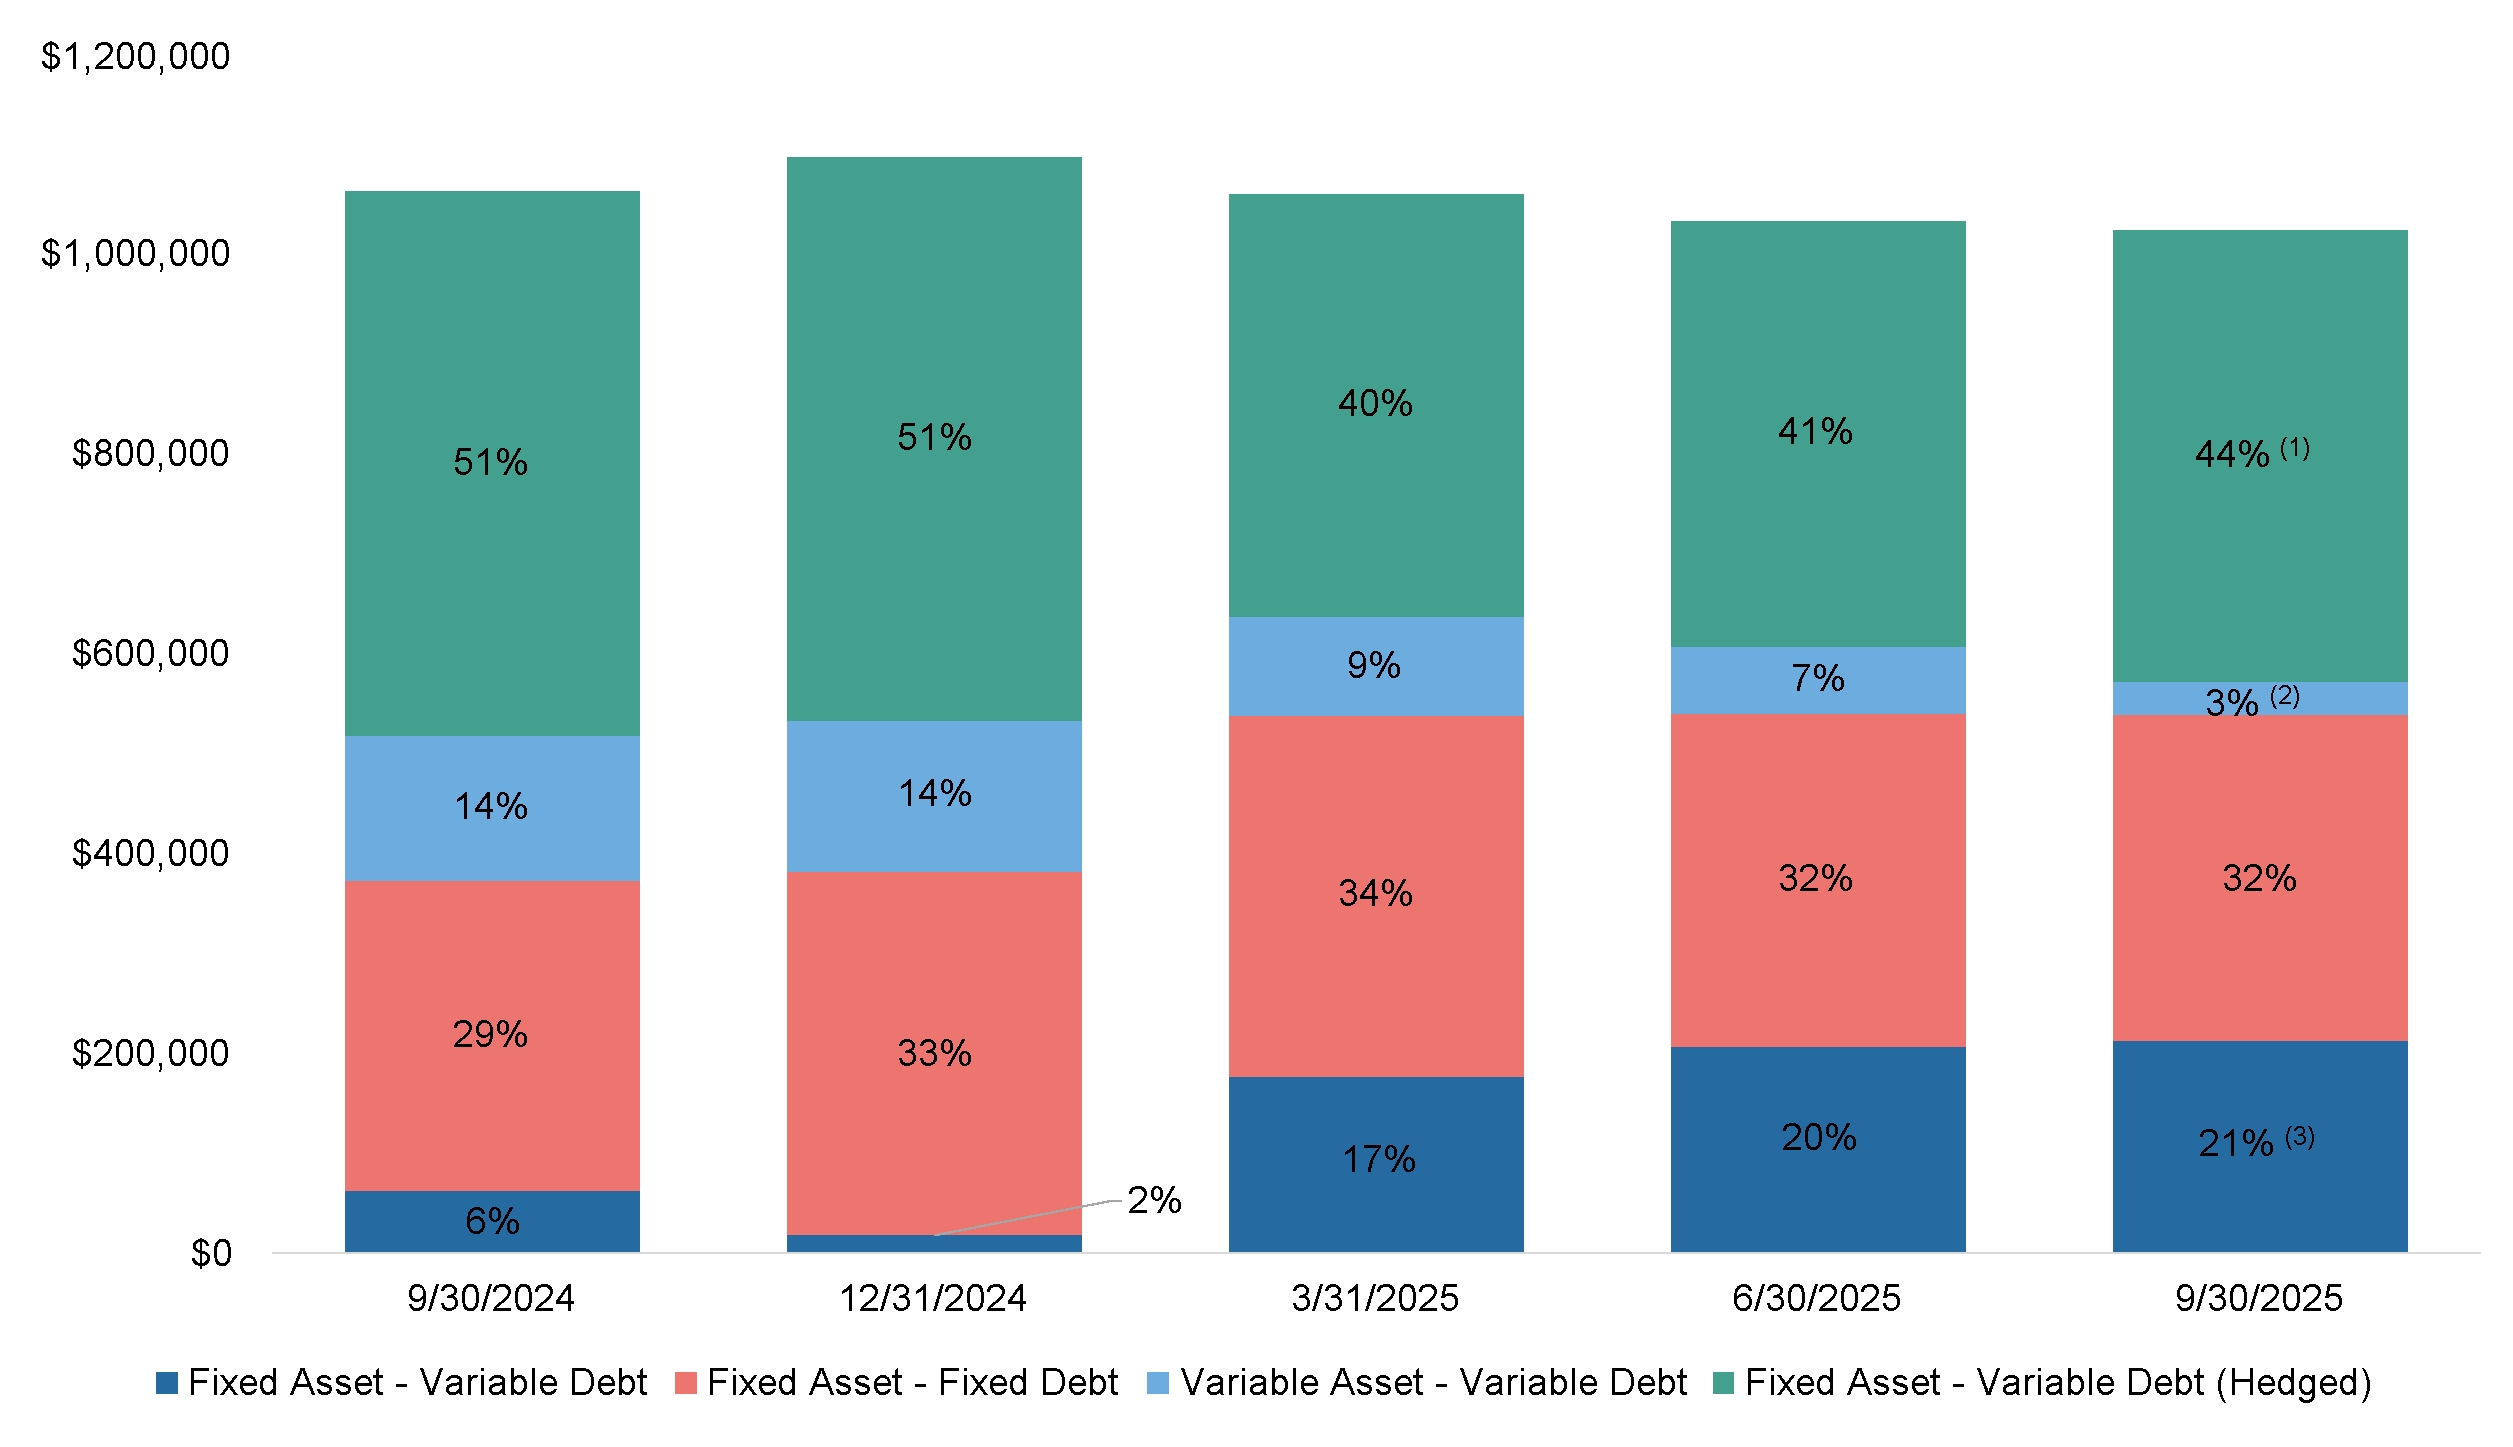
•The Partnership continues to execute its hedging strategy, primarily through interest rate swaps, to reduce the impact of changing market interest rates with net receipts totaling approximately $814,000 to the Partnership.
•Seven current market-rate joint venture equity investment properties have completed construction and two properties are nearing completion. Three properties have previously achieved 90% occupancy.
Earnings Webcast & Conference Call
The Partnership will host a conference call for investors on Thursday, November 6, 2025 at 4:30 p.m. Eastern Time to discuss the Partnership’s third quarter 2025 results.
For those interested in participating in the question-and-answer session, participants may dial-in toll free at (877) 407-8813. International participants may dial-in at +1 (201) 689-8521. No pin or code number is needed.
The call is also being webcast live in listen-only mode. The webcast can be accessed via the Partnership's website under “News & Events” or via the following link:
https://event.choruscall.com/mediaframe/webcast.html?webcastid=o0SEcItM
It is recommended that you join 15 minutes before the conference call begins (although you may register, dial-in or access the webcast at any time during the call).
A recorded replay of the webcast will be made available on the Partnership’s Investor Relations website at http://www.ghiinvestors.com.
About Greystone Housing Impact Investors LP
Greystone Housing Impact Investors LP was formed in 1998 under the Delaware Revised Uniform Limited Partnership Act for the primary purpose of acquiring, holding, selling and otherwise dealing with a portfolio of mortgage revenue bonds which have been issued to provide construction and/or permanent financing for affordable multifamily, seniors and student housing properties. The Partnership is pursuing a business strategy of acquiring additional mortgage revenue bonds and other investments on a leveraged basis. The Partnership expects and believes the interest earned on these mortgage revenue bonds is excludable from gross income for federal income tax purposes. The Partnership seeks to achieve its investment growth strategy by investing in additional mortgage revenue bonds and other investments as permitted by its Second Amended and Restated Limited Partnership Agreement, dated December 5, 2022 (the “Partnership Agreement”), taking advantage of attractive financing structures available in the securities market, and entering into interest rate risk management instruments. Greystone Housing Impact Investors LP press releases are available at www.ghiinvestors.com.
Safe Harbor Statement
Certain statements in this press release are intended to be covered by the safe harbor for “forward-looking statements” provided by the Private Securities Litigation Reform Act of 1995. These forward-looking statements generally can be identified by use of statements that include, but are not limited to, phrases such as “believe,” “expect,” “future,” “anticipate,” “intend,” “plan,” “foresee,” “may,” “should,” “will,” “estimates,” “potential,” “continue,” or other similar words or phrases. Similarly, statements that describe objectives, plans, or goals also are forward-looking statements. Such forward-looking statements involve inherent risks and uncertainties, many of which are difficult to predict and are generally beyond the control of the Partnership. The Partnership cautions readers that a number of important factors could cause actual results to differ materially from those expressed in, implied, or projected by such forward-looking statements. Risks and uncertainties include, but are not limited to: defaults on the mortgage loans securing our mortgage revenue bonds and governmental issuer loans; the competitive environment in which the Partnership operates; risks associated with investing in multifamily, student, senior citizen residential properties and commercial properties; general economic, geopolitical, and financial conditions, including the current and future impact of changing interest rates, inflation, and international conflicts (including the Russia-Ukraine war and conflicts in the Middle East) on business operations, employment, and financial conditions; the impact of a continued partial shutdown of the U.S. government; uncertain conditions within the domestic and international macroeconomic environment, including monetary and fiscal policy and conditions in the investment, credit, interest rate, and derivatives markets; any effects on our business resulting from new U.S. domestic or foreign governmental trade measures, including but not limited to tariffs, import and export controls, foreign exchange intervention accomplished to offset the effects of trade policy or in response to currency volatility, and other restrictions on free trade; adverse reactions in U.S. financial markets related to actions of foreign central banks or the economic performance of foreign economies, including in particular China, Japan, the European Union, and the United Kingdom; the general condition of the real estate markets in the regions in which the Partnership operates, which may be unfavorably impacted by pressures in the commercial real estate sector, incrementally higher unemployment rates, persistent elevated inflation levels, and other factors; changes in interest rates and credit spreads, as well as the success of any hedging strategies the Partnership may undertake in relation to such changes, and the effect such changes may have on the relative spreads between the yield on investments and cost of financing; the potential for inflationary impacts resulting from macroeconomic conditions and policy initiatives; the Partnership’s ability to access debt and equity capital to finance its assets; current maturities of the Partnership’s financing arrangements and the Partnership’s ability to renew or refinance such financing arrangements; local, regional, national and international economic and credit market conditions; recapture of previously issued Low Income Housing Tax Credits in accordance with Section 42 of the Internal Revenue Code; geographic concentration of properties related to investments held by the Partnership; changes in the U.S. corporate tax code and other government regulations affecting the Partnership’s business; risks related to the development and use of artificial intelligence; and the other risks detailed in the Partnership’s SEC filings (including but not limited to, the Partnership’s Annual Report on Form 10-K, Quarterly Reports on Form 10-Q, and Current Reports on Form 8-K). Readers are urged to consider these factors carefully in evaluating the forward-looking statements.
If any of these risks or uncertainties materializes or if any of the assumptions underlying such forward-looking statements proves to be incorrect, the developments and future events concerning the Partnership set forth in this press release may differ materially from those expressed or implied by these forward-looking statements. You are cautioned not to place undue reliance on these statements, which speak only as of the date of this document. We anticipate that subsequent
events and developments will cause our expectations and beliefs to change. The Partnership assumes no obligation to update such forward-looking statements to reflect events or circumstances after the date of this document or to reflect the occurrence of unanticipated events, unless obligated to do so under the federal securities laws.
GREYSTONE HOUSING IMPACT INVESTORS LP
CONDENSED CONSOLIDATED STATEMENTS OF OPERATIONS
(UNAUDITED)
|
|
|
|
|
|
|
|
|
|
|
|
|
|
|
|
|
|
|
|
For the Three Months Ended September 30, |
|
|
For the Nine Months Ended September 30, |
|
|
2025 |
|
|
2024 |
|
|
2025 |
|
|
2024 |
|
|
Revenues: |
|
|
|
|
|
|
|
|
|
|
|
|
|
Investment income |
|
$ |
18,301,211 |
|
|
$ |
21,820,973 |
|
|
$ |
61,004,197 |
|
|
$ |
60,920,706 |
|
|
Other interest income |
|
|
3,106,309 |
|
|
|
2,235,339 |
|
|
|
7,952,738 |
|
|
|
7,309,664 |
|
|
Contingent interest income |
|
|
- |
|
|
|
- |
|
|
|
208,059 |
|
|
|
- |
|
|
Other income |
|
|
269,890 |
|
|
|
289,238 |
|
|
|
1,228,715 |
|
|
|
455,005 |
|
|
Total revenues |
|
|
21,677,410 |
|
|
|
24,345,550 |
|
|
|
70,393,709 |
|
|
|
68,685,375 |
|
|
Provision for credit losses |
|
|
534,084 |
|
|
|
(226,000 |
) |
|
|
9,414,818 |
|
|
|
(1,012,308 |
) |
|
Depreciation |
|
|
1,335 |
|
|
|
5,967 |
|
|
|
7,523 |
|
|
|
17,900 |
|
|
Interest expense |
|
|
13,140,392 |
|
|
|
15,489,187 |
|
|
|
41,500,896 |
|
|
|
44,191,387 |
|
|
Net result from derivative transactions |
|
|
(100,147 |
) |
|
|
7,897,016 |
|
|
|
4,315,206 |
|
|
|
(255,582 |
) |
|
General and administrative |
|
|
4,816,648 |
|
|
|
5,112,958 |
|
|
|
14,061,774 |
|
|
|
14,864,773 |
|
|
Total expenses |
|
|
18,392,312 |
|
|
|
28,279,128 |
|
|
|
69,300,217 |
|
|
|
57,806,170 |
|
|
Other income: |
|
|
|
|
|
|
|
|
|
|
|
|
|
Gain on sale of real estate assets |
|
|
- |
|
|
|
- |
|
|
|
- |
|
|
|
63,739 |
|
|
Gain on sale of mortgage revenue bond |
|
|
- |
|
|
|
- |
|
|
|
- |
|
|
|
1,012,581 |
|
|
Gain on sale of investments in unconsolidated entities |
|
|
- |
|
|
|
- |
|
|
|
200,736 |
|
|
|
56,986 |
|
|
Earnings (losses) from investments in unconsolidated entities |
|
|
(1,318,993 |
) |
|
|
(704,096 |
) |
|
|
(3,078,320 |
) |
|
|
(825,652 |
) |
|
Income (loss) before income taxes |
|
|
1,966,105 |
|
|
|
(4,637,674 |
) |
|
|
(1,784,092 |
) |
|
|
11,186,859 |
|
|
Income tax benefit |
|
|
(2,050 |
) |
|
|
(1,967 |
) |
|
|
(7,545 |
) |
|
|
(3,951 |
) |
|
Net income (loss) |
|
|
1,968,155 |
|
|
|
(4,635,707 |
) |
|
|
(1,776,547 |
) |
|
|
11,190,810 |
|
|
Redeemable Preferred Unit distributions and accretion |
|
|
(1,029,641 |
) |
|
|
(741,476 |
) |
|
|
(2,819,969 |
) |
|
|
(2,250,194 |
) |
|
Net income (loss) available to Partners |
|
$ |
938,514 |
|
|
$ |
(5,377,183 |
) |
|
$ |
(4,596,516 |
) |
|
$ |
8,940,616 |
|
|
|
|
|
|
|
|
|
|
|
|
|
|
|
|
Net income (loss) available to Partners allocated to: |
|
|
|
|
|
|
|
|
|
|
|
|
|
General Partner |
|
$ |
9,385 |
|
|
$ |
(53,772 |
) |
|
$ |
42,799 |
|
|
$ |
88,836 |
|
|
Limited Partners - BUCs |
|
|
800,606 |
|
|
|
(5,399,340 |
) |
|
|
(4,900,780 |
) |
|
|
8,649,222 |
|
|
Limited Partners - Restricted units |
|
|
128,523 |
|
|
|
75,929 |
|
|
|
261,465 |
|
|
|
202,558 |
|
|
|
|
$ |
938,514 |
|
|
$ |
(5,377,183 |
) |
|
$ |
(4,596,516 |
) |
|
$ |
8,940,616 |
|
|
BUC holders' interest in net income (loss) per BUC, basic and diluted |
|
$ |
0.03 |
|
|
$ |
(0.23 |
) |
|
$ |
(0.21 |
) |
|
$ |
0.38 |
|
* |
Weighted average number of BUCs outstanding, basic |
|
|
23,171,226 |
|
|
|
23,085,261 |
|
|
|
23,171,226 |
|
|
|
23,056,467 |
|
* |
Weighted average number of BUCs outstanding, diluted |
|
|
23,171,226 |
|
|
|
23,085,261 |
|
|
|
23,171,226 |
|
|
|
23,056,467 |
|
* |
* The amounts indicated above have been adjusted to reflect the distribution completed on April 30, 2024 in the form of additional BUCs at a ratio of 0.00417 BUCs for each BUC outstanding as of March 28, 2024 on a retroactive basis.
Disclosure Regarding Non-GAAP Measures - Cash Available for Distribution
The Partnership believes that CAD provides relevant information about the Partnership’s operations and is necessary, along with net income, for understanding its operating results. To calculate CAD, the Partnership begins with net income as computed in accordance with GAAP and adjusts for non-cash expenses or income consisting of depreciation expense, amortization expense related to deferred financing costs, amortization of premiums and discounts, fair value adjustments to derivative instruments, provisions for credit and loan losses, impairments on MRBs, GILs, real estate assets and property loans, deferred income tax expense (benefit), and restricted unit compensation expense. The Partnership also adjusts net income for the Partnership’s share of (earnings) losses of investments in unconsolidated entities related to the Market Rate Joint Venture Investments segment as such amounts are primarily depreciation expenses and development costs that are expected to be recovered upon an exit event. The Partnership also deducts Tier 2 income (see Note 22 to the Partnership’s condensed consolidated financial statements) distributable to the General Partner as defined in the Partnership Agreement and distributions and accretion for the Preferred Units. Net income is the GAAP measure most comparable to CAD. There is no generally accepted methodology for computing CAD, and the Partnership’s computation of CAD may not be comparable to CAD reported by other companies. Although the Partnership considers CAD to be a useful measure of the Partnership’s operating performance, CAD is a non-GAAP measure that should not be considered as an alternative to net income calculated in accordance with GAAP, or any other measures of financial performance presented in accordance with GAAP.
The following table shows the calculation of CAD (and a reconciliation of the Partnership’s net income, as determined in accordance with GAAP, to CAD) for the three and nine months ended September 30, 2025 and 2024 (all per BUC amounts are presented giving effect to the distributions in form of additional BUCs on a retroactive basis for all periods presented):
|
|
|
|
|
|
|
|
|
|
|
|
|
|
|
|
|
|
|
|
For the Three Months Ended September 30, |
|
|
For the Nine Months Ended September 30, |
|
|
2025 |
|
|
2024 |
|
|
2025 |
|
|
2024 |
|
|
Net income (loss) |
|
$ |
1,968,155 |
|
|
$ |
(4,635,707 |
) |
|
$ |
(1,776,547 |
) |
|
$ |
11,190,810 |
|
|
Unrealized (gains) losses on derivatives, net |
|
|
714,077 |
|
|
|
9,695,459 |
|
|
|
6,740,050 |
|
|
|
4,880,661 |
|
|
Depreciation expense |
|
|
1,335 |
|
|
|
5,967 |
|
|
|
7,523 |
|
|
|
17,900 |
|
|
Provision for credit losses (1) |
|
|
534,084 |
|
|
|
(226,000 |
) |
|
|
9,414,818 |
|
|
|
(843,000 |
) |
|
Amortization of deferred financing costs |
|
|
345,384 |
|
|
|
360,349 |
|
|
|
1,114,080 |
|
|
|
1,187,700 |
|
|
Restricted unit compensation expense |
|
|
747,560 |
|
|
|
564,699 |
|
|
|
1,486,882 |
|
|
|
1,455,581 |
|
|
Deferred income taxes |
|
|
(1,023 |
) |
|
|
(951 |
) |
|
|
(785 |
) |
|
|
1,271 |
|
|
Redeemable Preferred Unit distributions and accretion |
|
|
(1,029,641 |
) |
|
|
(741,476 |
) |
|
|
(2,819,969 |
) |
|
|
(2,250,194 |
) |
|
Tier 2 income allocable to the General Partner (2) |
|
|
- |
|
|
|
- |
|
|
|
(92,852 |
) |
|
|
- |
|
|
Recovery of prior credit loss (3) |
|
|
(11,060 |
) |
|
|
(17,344 |
) |
|
|
51,164 |
|
|
|
(51,844 |
) |
|
Bond premium, discount and acquisition fee amortization, net
of cash received |
|
|
55,880 |
|
|
|
498,983 |
|
|
|
318,728 |
|
|
|
1,337,376 |
|
|
(Earnings) losses from investments in unconsolidated entities |
|
|
1,320,297 |
|
|
|
704,096 |
|
|
|
3,049,867 |
|
|
|
825,652 |
|
|
Total CAD |
|
$ |
4,645,048 |
|
|
$ |
6,208,075 |
|
|
$ |
17,492,959 |
|
|
$ |
17,751,913 |
|
|
|
|
|
|
|
|
|
|
|
|
|
|
|
|
Weighted average number of BUCs outstanding, basic |
|
|
23,171,226 |
|
|
|
23,085,261 |
|
|
|
23,171,226 |
|
|
|
23,056,467 |
|
|
Net income (loss) per BUC, basic |
|
$ |
0.03 |
|
|
$ |
(0.23 |
) |
|
$ |
(0.21 |
) |
|
$ |
0.38 |
|
|
Total CAD per BUC, basic |
|
$ |
0.20 |
|
|
$ |
0.27 |
|
|
$ |
0.75 |
|
|
$ |
0.77 |
|
|
Cash Distributions declared, per BUC |
|
$ |
0.30 |
|
|
$ |
0.37 |
|
|
$ |
0.97 |
|
|
$ |
1.108 |
|
|
BUCs Distributions declared, per BUC (4) |
|
$ |
- |
|
|
$ |
- |
|
|
$ |
- |
|
|
$ |
0.07 |
|
|
(1)The adjustments reflect the change in allowances for credit losses under the CECL standard which requires the Partnership to update estimates of expected credit losses for its investment portfolio at each reporting date. Credit losses are not reported within CAD until such losses are realized. The provision for credit loss includes asset-specific provisions for credit losses for affordable multifamily investments totaling approximately $596,000 and $9.9 million for the three and nine months ended September 30, 2025, respectively. In connection with the final settlement of the bankruptcy estate of the Provision Center 2014-1 MRB in July 2024, the Partnership recovered approximately $169,000 of its previously recognized allowance credit loss which is not included as an adjustment to net income in the calculation of CAD for the nine months ended September 30, 2024.
(2)As described in Note 22 to the Partnership’s condensed consolidated financial statements, Net Interest Income representing contingent interest and Net Residual Proceeds representing contingent interest (Tier 2 income) will be distributed 75% to the limited partners and BUC holders, as a class, and 25% to the General Partner. This adjustment represents 25% of Tier 2 income due to the General Partner. Tier 2 income for the nine months ended September 30, 2025 related to the gain on sale of Vantage at Helotes and the premium received upon redemption of the Companion at Thornhill Apartments MRB. There was no Tier 2 income for the three months ended September 30, 2025 and 2024 and the nine months ended September 30, 2024
(3)The Partnership determined there was a recovery of previously recognized impairment recorded for the Live 929 Apartments Series 2022A MRB prior to the adoption of the CECL standard effective January 1, 2023. The Partnership is accreting the recovery of prior credit loss for this MRB into investment income over the term of the MRB consistent with applicable guidance. The accretion of recovery of value, net of adjustments, is presented as a reduction to current CAD as the original provision for credit loss was an addback for CAD calculation purposes in the period recognized.
(4)The Partnership declared the First Quarter 2024 BUCs Distribution payable in the form of additional BUCs equal to $0.07 per BUC for outstanding BUCs as of the record date of March 28, 2024.


 2
2