Exhibit 99.1
|
|
News Release |

Graham Corporation ◆ 20 Florence Avenue ◆ Batavia, NY 14020
IMMEDIATE RELEASE
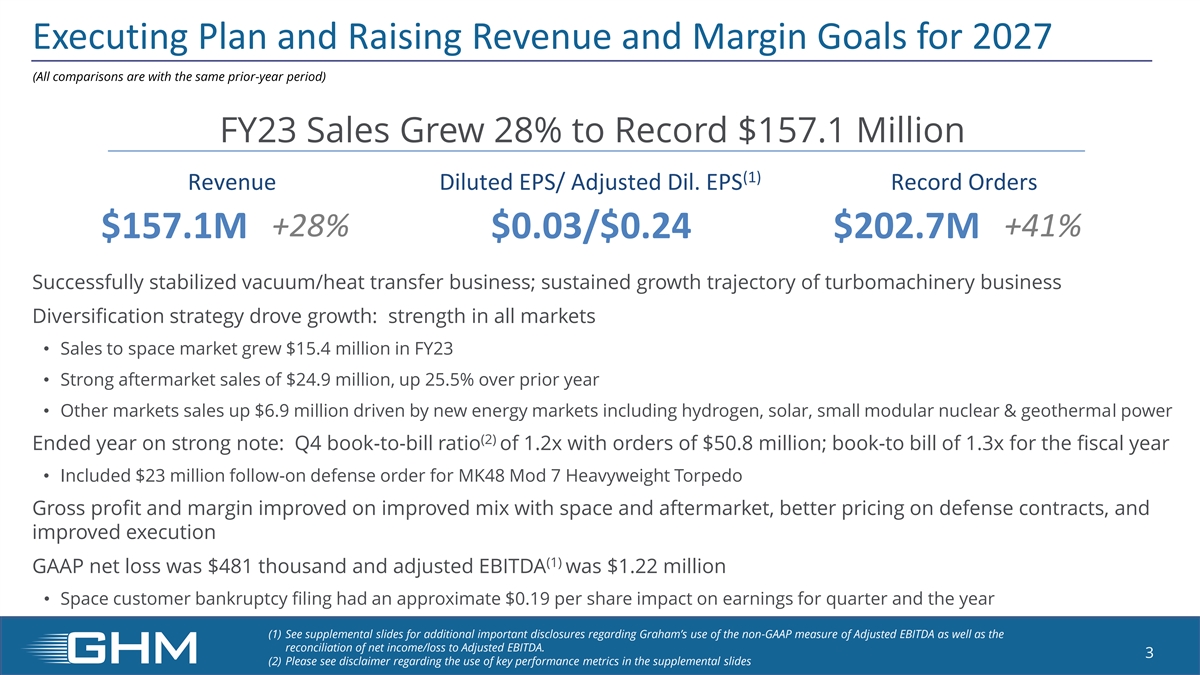
GRAHAM CORPORATION REPORTS SALES GROWTH OF 28%
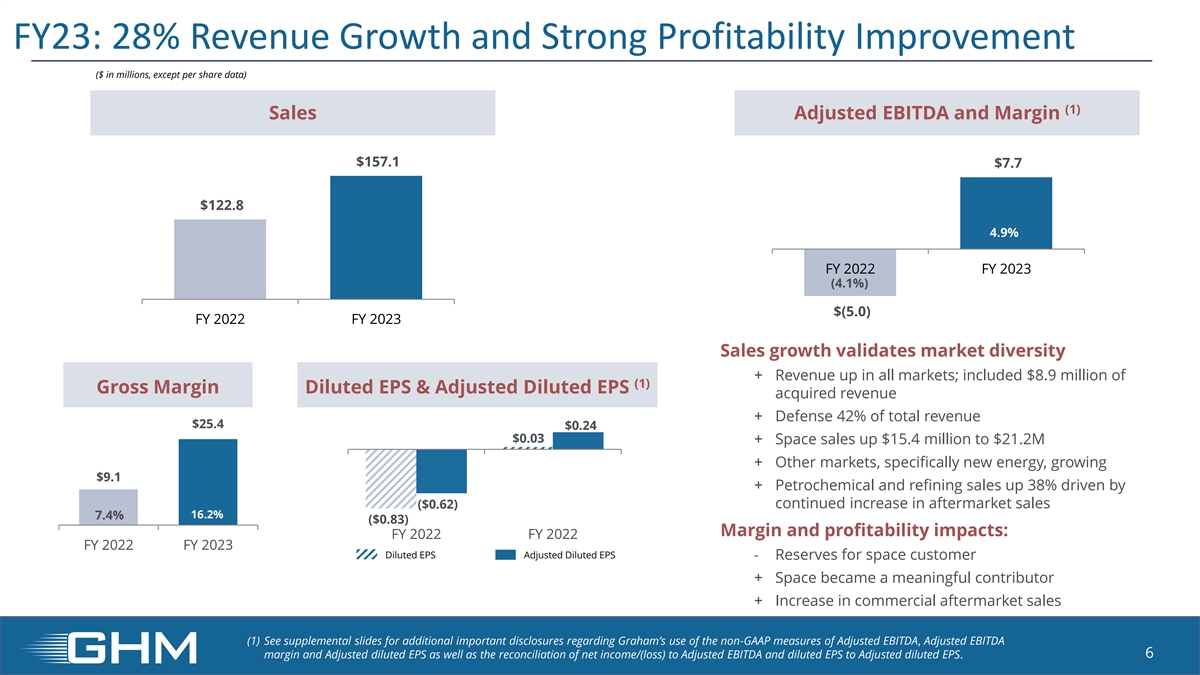
TO RECORD $157.1 MILLION FOR FISCAL 2023
| • | FISCAL 2023 SALES GROWTH DRIVEN BY STRENGTH IN AFTERMARKET SALES TO REFINING AND PETROCHEMICAL MARKETS AND DIVERSIFICATION INTO THE SPACE INDUSTRY |
| • | NET INCOME FOR FISCAL 2023 WAS $367 THOUSAND, COMPARED TO LOSS IN PRIOR FISCAL YEAR; ACHIEVED ADJUSTED EBITDA* OF $7.7 MILLION WITHIN GUIDANCE RANGE DESPITE $2.5 MILLION RESERVE FOR INVENTORY AND BAD DEBT FOR LARGE SPACE CUSTOMER, NET OF ASSOCIATED PERFORMANCE-BASED COMPENSATION |
| • | FOURTH QUARTER REVENUE GREW 8% TO $43.0 MILLION DRIVEN BY STRENGTH IN AFTERMARKET AND SPACE INDUSTRY |
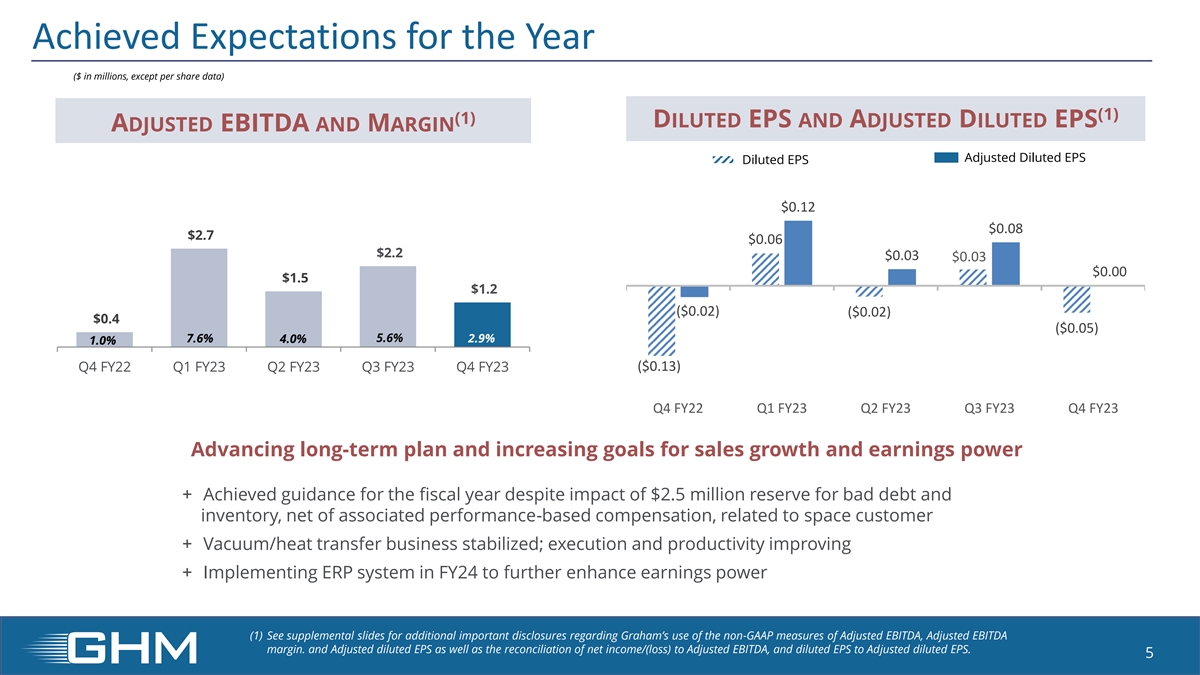
| • | FOURTH QUARTER NET LOSS OF $481 THOUSAND IMPACTED BY RESERVES FOR BAD DEBT AND INVENTORY; ADJUSTED EBITDA* OF $1.2 MILLION, OR 2.9% OF SALES |
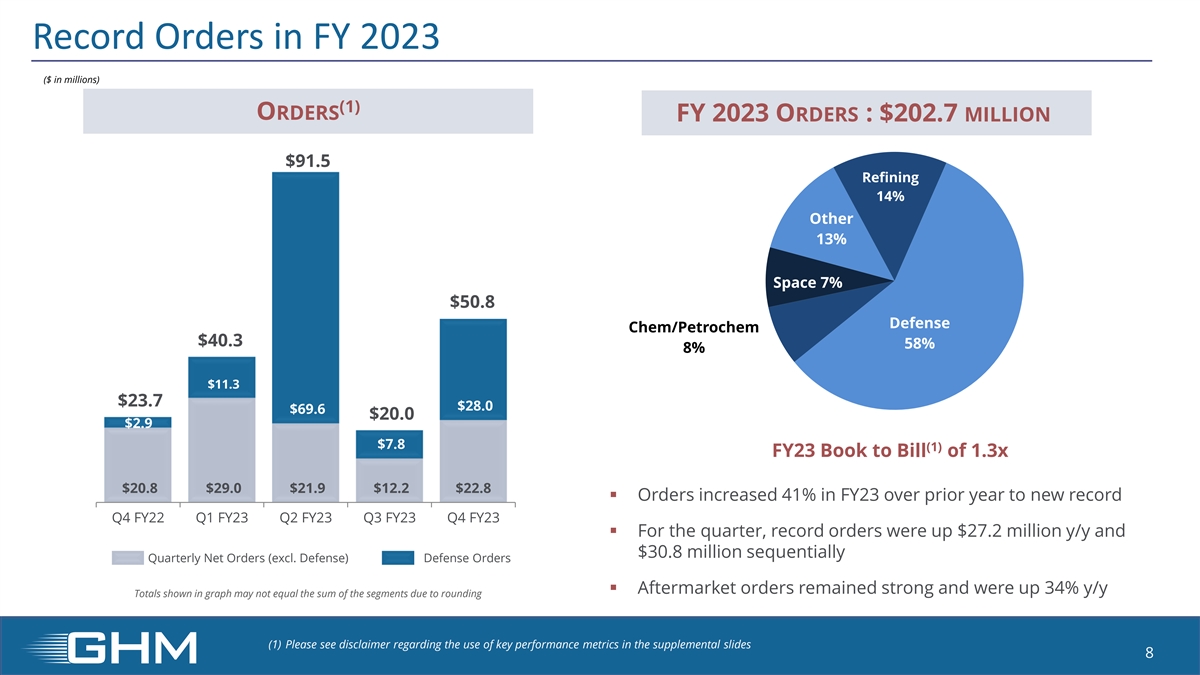
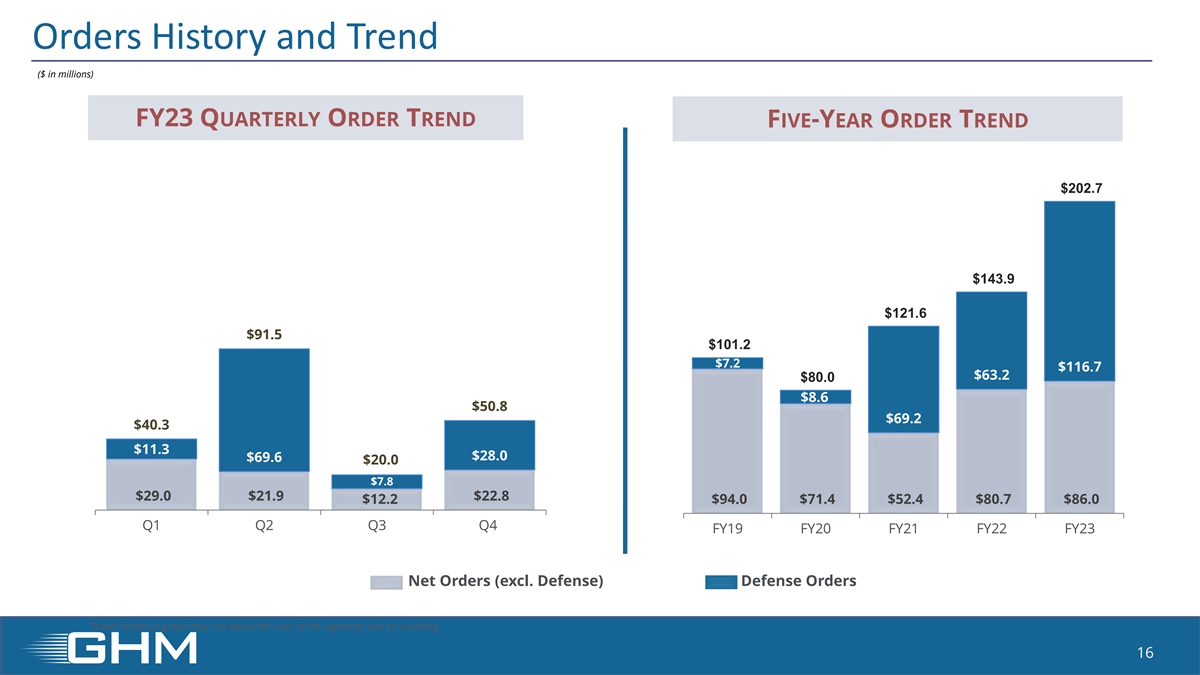
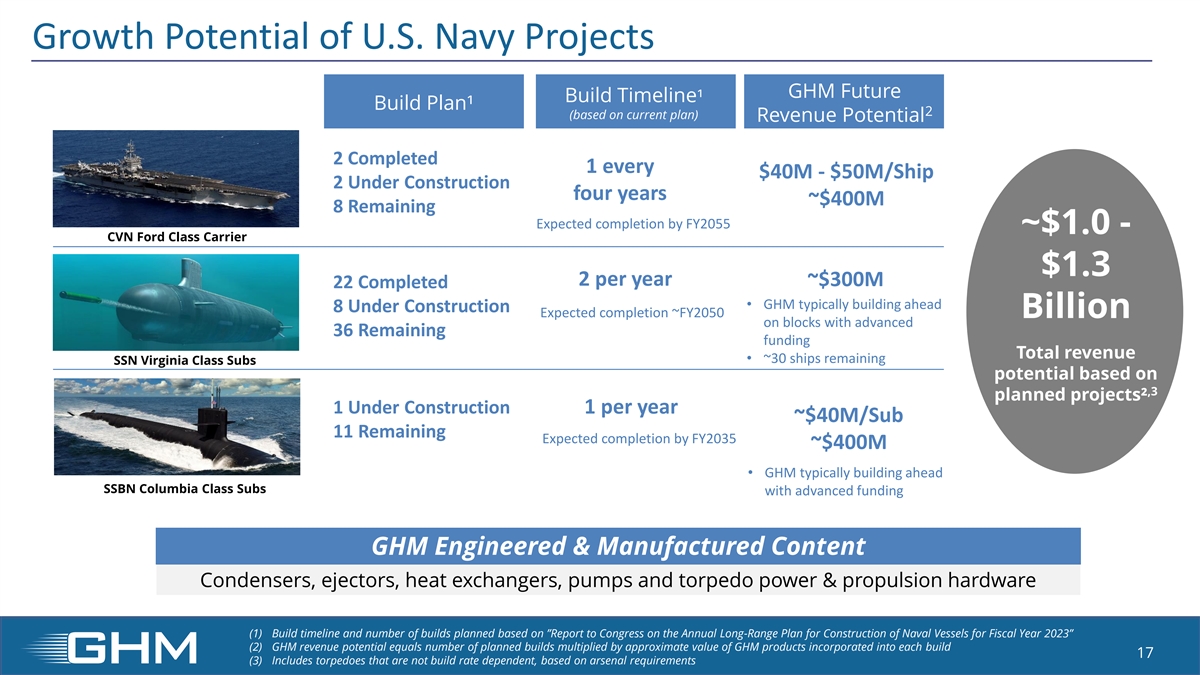
| • | FOURTH QUARTER ORDERS OF $50.8 MILLION, INCLUDING MK48 MOD 7 HEAVYWEIGHT TORPEDO FOLLOW-ON ORDER, LEADS TO RECORD FISCAL YEAR ORDERS OF $202.7 MILLION |
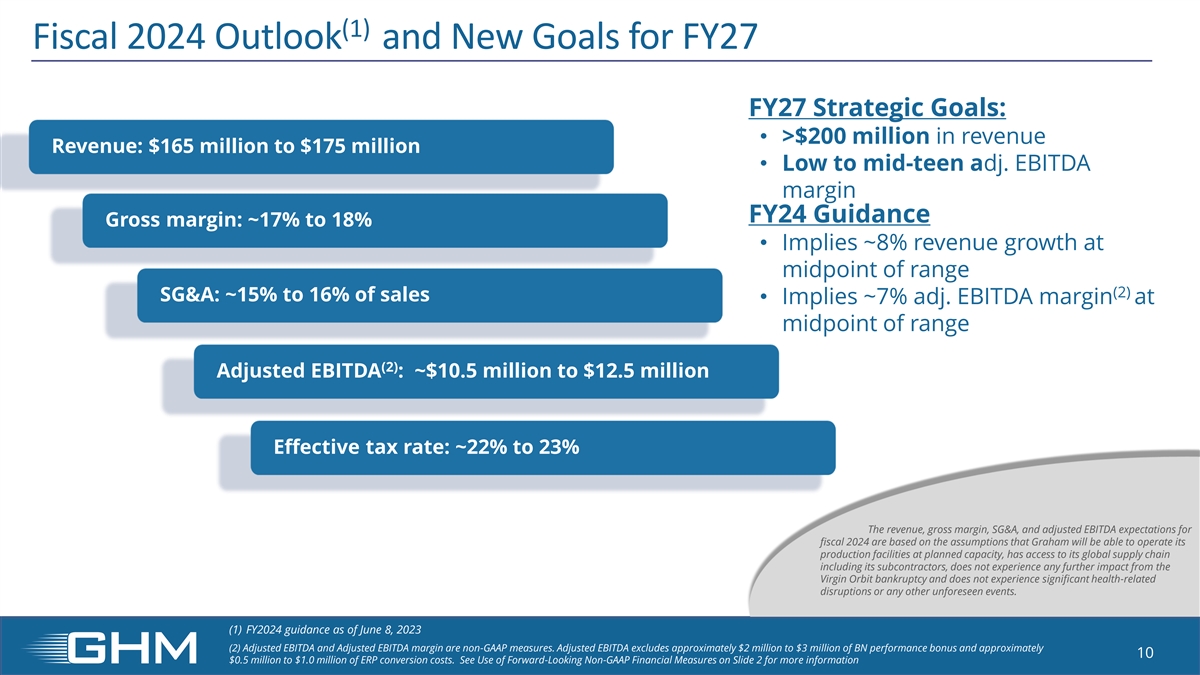
| • | EXPECT FISCAL 2024 REVENUE TO GROW TO APPROXIMATELY $165 MILLION TO $175 MILLION, UP 8% AT MID-POINT OVER PRIOR FISCAL YEAR WITH ADJUSTED EBITDA* IN THE RANGE OF $10.5 MILLION TO $12.5 MILLION, A 49% IMPROVEMENT OVER FISCAL 2023 AT THE MID-POINT OF THE RANGE |
| • | RAISING ORIGINAL STRATEGIC FINANCIAL GOALS TO NOW DELIVER OVER $200 MILLION IN REVENUE AND ACHIEVE LOW TO MID-TEEN ADJUSTED EBITDA MARGIN* IN FISCAL 2027 |
BATAVIA, NY, June 8, 2023 – Graham Corporation (NYSE: GHM) (“GHM” or the “Company”), a global leader in the design and manufacture of mission critical fluid, power, heat transfer and vacuum technologies for the defense, space, energy and process industries, today reported financial results for its fourth quarter and full fiscal year ended March 31, 2023 (“fiscal 2023”). Financial results include those of Barber-Nichols, LLC (“BN” or “the acquisition”) from the date it was acquired on June 1, 2021.
Daniel J. Thoren, President and CEO, commented, “We made great strides in fiscal 2023 to stabilize our business, improve our performance, and capture new opportunities. We ended fiscal 2023 on a strong note, achieving our guidance for the year despite the significant reserve related to a space market customer. We delivered record revenue, achieved adjusted EBITDA of $7.7 million, had record annual orders and ended with a strong backlog of $302 million that supports further growth and margin expansion. Further, we believe our book-to-bill ratio for the fiscal year of 1.3x is validation of the importance of the investments we have made, our customer’s confidence in our execution, and the success we are having in winning new business across our diversified markets. Importantly, we are expanding our opportunity with existing customers while diversifying with new customers and applications.”
Graham Corporation Reports Sales Growth of 28% to Record $157.1 Million for Fiscal 2023
June 8, 2023
Page 2 of 12
Fourth Quarter Fiscal 2023 Performance Review
(All comparisons are with the same prior-year period unless noted otherwise.)
| ($ in millions except per share data) | Q4 FY23 | Q4 FY22 | $ Change | |||||||||
| Net sales |
$ | 43.0 | $ | 39.7 | $ | 3.3 | ||||||
| Gross profit |
$ | 7.2 | $ | 4.2 | $ | 3.0 | ||||||
| Gross margin |
16.6% | 10.6% | ||||||||||
| Operating loss |
$ | (0.4 | ) | $ | (2.1 | ) | $ | 1.7 | ||||
| Operating margin |
(0.8% | ) | (5.2% | ) | ||||||||
| Net loss |
$ | (0.5 | ) | $ | (1.4 | ) | $ | 0.9 | ||||
| Diluted net loss per share |
$ | (0.05 | ) | $ | (0.13 | ) | $ | 0.08 | ||||
| Adjusted net income (loss)* |
$ | 0.0 | $ | (0.2 | ) | $ | 0.2 | |||||
| Adjusted diluted net income (loss) per share* |
$ | 0.00 | $ | (0.02 | ) | $ | 0.02 | |||||
| Adjusted EBITDA* |
$ | 1.2 | $ | 0.4 | $ | 0.8 | ||||||
| Adjusted EBITDA margin* |
2.9% | 1.0% | ||||||||||
| * | Graham believes that adjusted EBITDA (defined as consolidated net income (loss) before net interest expense, income taxes, depreciation, amortization, other acquisition related expenses (income), and other unusual/nonrecurring expenses), and adjusted EBITDA margin (adjusted EBITDA as a percentage of net sales), which are non-GAAP measures, help in the understanding of its operating performance. Moreover, Graham’s credit facility also contains ratios based on adjusted EBITDA as defined in the lending agreement. Graham also believes that adjusted net income (loss) and adjusted diluted net income (loss) per share, which excludes intangible amortization, other costs related to the acquisition, and other unusual/nonrecurring (income) expenses, provides a better representation of the cash earnings of the Company. See the attached tables and other information on pages 9 and 10 for important disclosures regarding Graham’s use of adjusted EBITDA, adjusted EBITDA margin, adjusted net income (loss), and adjusted diluted net income (loss) per share, as well as the reconciliation of net income (loss) to adjusted EBITDA, adjusted net income (loss), and adjusted diluted net income (loss) per share. |
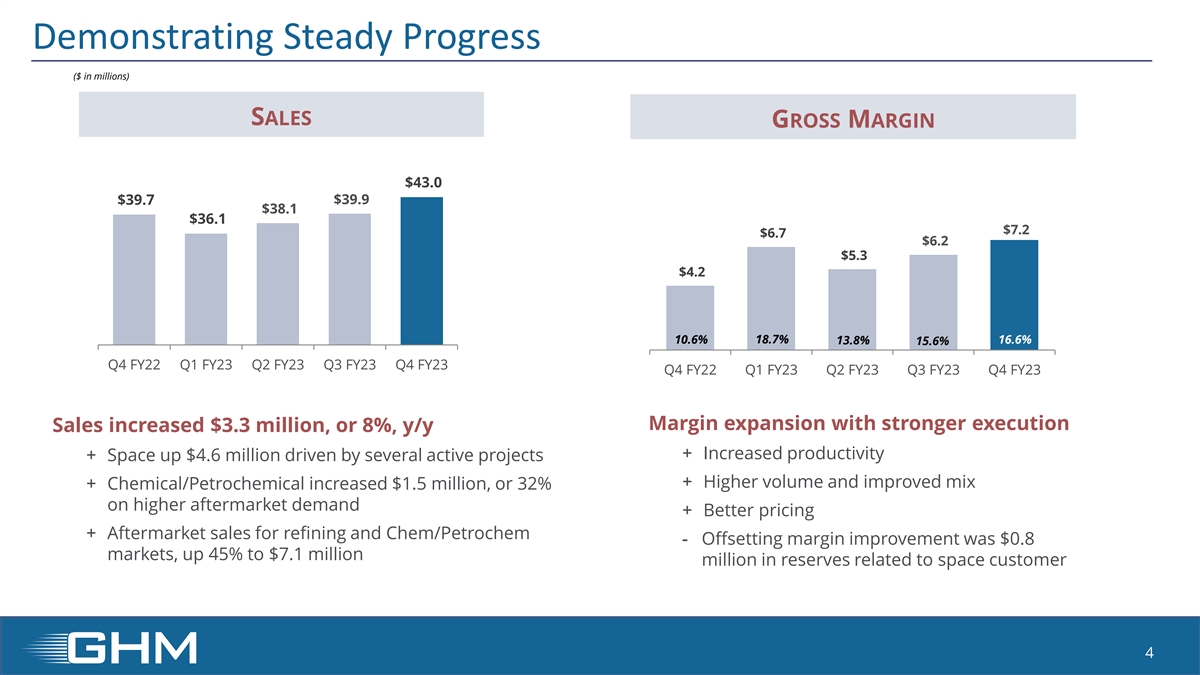
Net sales of $43.0 million increased 8%, or $3.3 million. Growth in the space market, as well as improvements in the commercial aftermarket, offset continued weakness in large refining and petrochemical capital investment projects. Aftermarket sales to the refining and petrochemical markets were $7.1 million, up 45%. See supplemental data for a further breakdown of sales by market and region.
Compared with the prior year period, the 70% increase in gross profit and 6 percentage point expansion of gross margin reflected increased productivity, higher volume and improved mix of higher margin sales. Offsetting gross profit and margin improvement were $0.8 million in reserves related to the bankruptcy filing of a major space customer, net of associated performance-based compensation.
Selling, general and administrative expense (“SG&A”), inclusive of amortization, in the fourth quarter of fiscal 2023 was $7.5 million, or 17% of sales, up $1.4 million over the prior-year period. Impacting SG&A in the quarter was $1.7 million, or 4% of sales, in reserves related to the space customer, net of associated performance-based compensation. The prior year’s fourth quarter SG&A was impacted by $0.2 million in acquisition-related costs.
Net loss and loss per diluted share were $481 thousand and $0.05, respectively. On a non-GAAP basis, adjusted diluted net income* and net income per share* were breakeven. Reserves related to the space customer, net of associated performance-based compensation, had an approximate $0.19 per share impact on earnings in the quarter.
Graham Corporation Reports Sales Growth of 28% to Record $157.1 Million for Fiscal 2023
June 8, 2023
Page 3 of 12
Full Year Fiscal 2023 Performance Review
(All comparisons are with the same prior-year period unless noted otherwise.)
| ($ in millions except per share data) | FY23 | FY22 | Change | |||||||||
| Net sales |
$ | 157.1 | $ | 122.8 | $ | 34.3 | ||||||
| Gross profit |
$ | 25.4 | $ | 9.1 | $ | 16.3 | ||||||
| Gross margin |
16.2% | 7.4% | ||||||||||
| Operating income (loss) |
$ | 1.3 | $ | (11.3 | ) | $ | 12.6 | |||||
| Operating margin |
0.8% | (9.2% | ) | |||||||||
| Net income (loss) |
$ | 0.4 | $ | (8.8 | ) | $ | 9.2 | |||||
| Diluted net income (loss) per share |
$ | 0.03 | $ | (0.83 | ) | $ | 0.86 | |||||
| Adjusted net income (loss)* |
$ | 2.5 | $ | (6.6 | ) | $ | 9.1 | |||||
| Adjusted diluted net income (loss) per share* |
$ | 0.24 | $ | (0.62 | ) | $ | 0.86 | |||||
| Adjusted EBITDA* |
$ | 7.7 | $ | (5.0 | ) | $ | 12.7 | |||||
| Adjusted EBITDA margin* |
4.9% | (4.1% | ) | |||||||||
Net sales for fiscal 2023 were $157.1 million, up $34.3 million, or 28%, driven by a $15.4 million increase in sales to multiple customers in the space industry. Sales to the defense market increased 5%, or $3.1 million, to $65.3 million, representing 42% of total revenue. Aftermarket sales to the refining and petrochemical markets increased 25.5% to $24.9 million, or 15.9% of total revenue. See supplemental data for a further breakdown of sales by market and region.
Year-over-year, gross margin improved 8.8 percentage points reflecting improved mix of sales related to higher margin projects (commercial space and aftermarket) and improved execution and pricing on defense contracts. These improvements were partially offset by the same impact of inventory reserves, net of associated performance-based compensation, as noted in the fourth quarter. Gross profit in fiscal 2022 included an estimated $10 million impact related to labor and material cost overruns for first article U.S. Navy projects. In fiscal 2023, the Company completed four first article U.S. Navy projects, and remains on schedule to complete its remaining two first article projects by the end of the first half of fiscal 2024.
SG&A expense, inclusive of amortization, was $24.2 million, up $2.9 million or 13% over the prior year. The increase reflects the $1.7 million of reserves accrued for the space customer, net of associated performance-based compensation, and $1.4 million incremental SG&A expense from the full year of the acquisition. Offsetting these increases were cost containment measures such as the reduction of outside sales agents and delayed hiring of non-critical positions, as well as the elimination of $0.6 million in acquisition and integration costs incurred in the prior year.
Net income and income per diluted share were $0.4 million and $0.03, respectively. On a non-GAAP basis, adjusted net income* and adjusted diluted net income per share* were $2.5 million and $0.24, respectively.
Christopher Thome, Chief Financial Officer, commented, “We have successfully diversified into the defense industry, as well as new markets such as space and new energy. At fiscal year-end, we had $8.2 million in backlog for the space market that reflected orders from several space customers and a variety of programs. This included no orders from the space customer that unfortunately filed for bankruptcy protection in our fourth quarter. While a disappointment, our improved operations enabled us to absorb the impact of this event and still meet our guidance.” There remains approximately $1 million to $2 million
Graham Corporation Reports Sales Growth of 28% to Record $157.1 Million for Fiscal 2023
June 8, 2023
Page 4 of 12
in potential additional exposure related to the space customer depending on the outcome of their proceedings and asset sale. However, at this time, the Company does not expect further impact in fiscal 2024 or beyond.
Cash Management and Balance Sheet
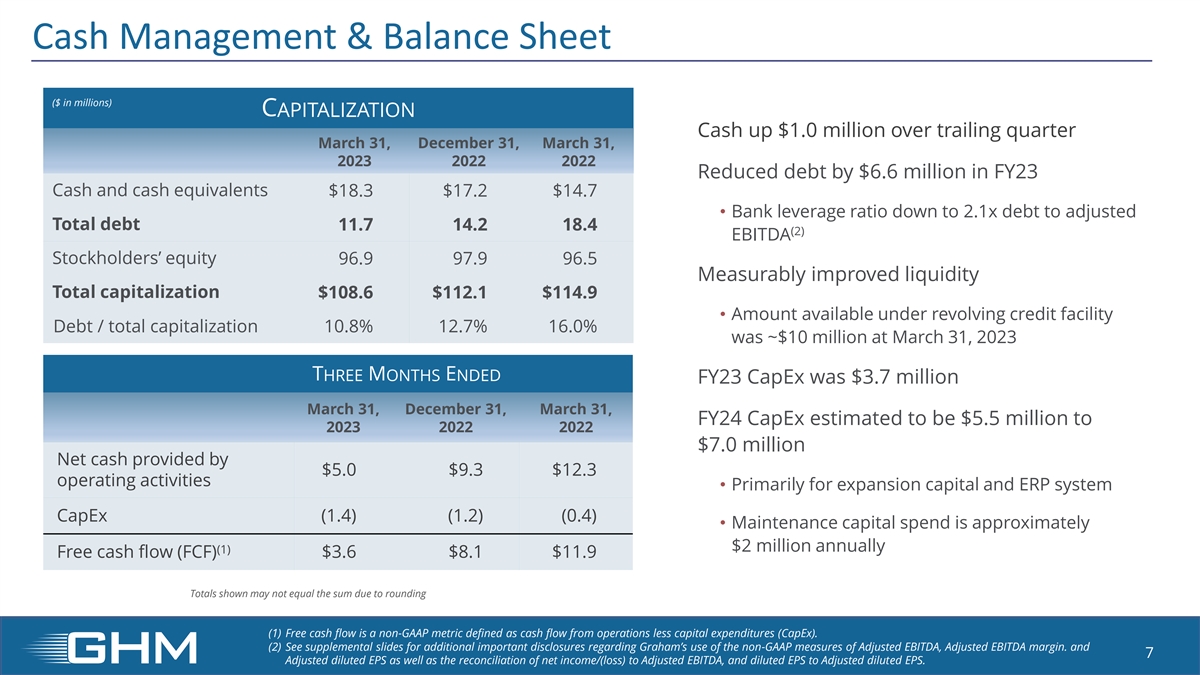
Cash generated from operations in the fourth quarter was $5.0 million. Cash and cash equivalents on March 31, 2023, were $18.3 million compared with $17.2 million on December 31, 2022. Capital expenditures for the fourth quarter of fiscal 2023 were $1.3 million.
Debt at fiscal year-end was down $2.4 million to $11.7 million compared with December 31, 2022. As of March 31, 2023, the Company was in compliance with its lending agreement with a leverage ratio as calculated in accordance with the terms of the credit facility of 2.1x. At March 31, 2023, the amount available under the revolving credit facility was approximately $10 million.
Orders and Backlog
See supplemental data for a further breakdown of orders and backlog by market.
| Q1 22 | Q2 22 | Q3 22 | Q4 22 | FY22 | Q1 23 | Q2 23 | Q3 23 | Q4 23 | FY23 | |||||||||||||||||||||||||||||||
| Orders |
$ | 20.9 | $ | 31.4 | $ | 68.0 | $ | 23.7 | $ | 143.9 | $ | 40.3 | $ | 91.5 | $ | 20.0 | $ | 50.9 | $ | 202.7 | ||||||||||||||||||||
| Backlog |
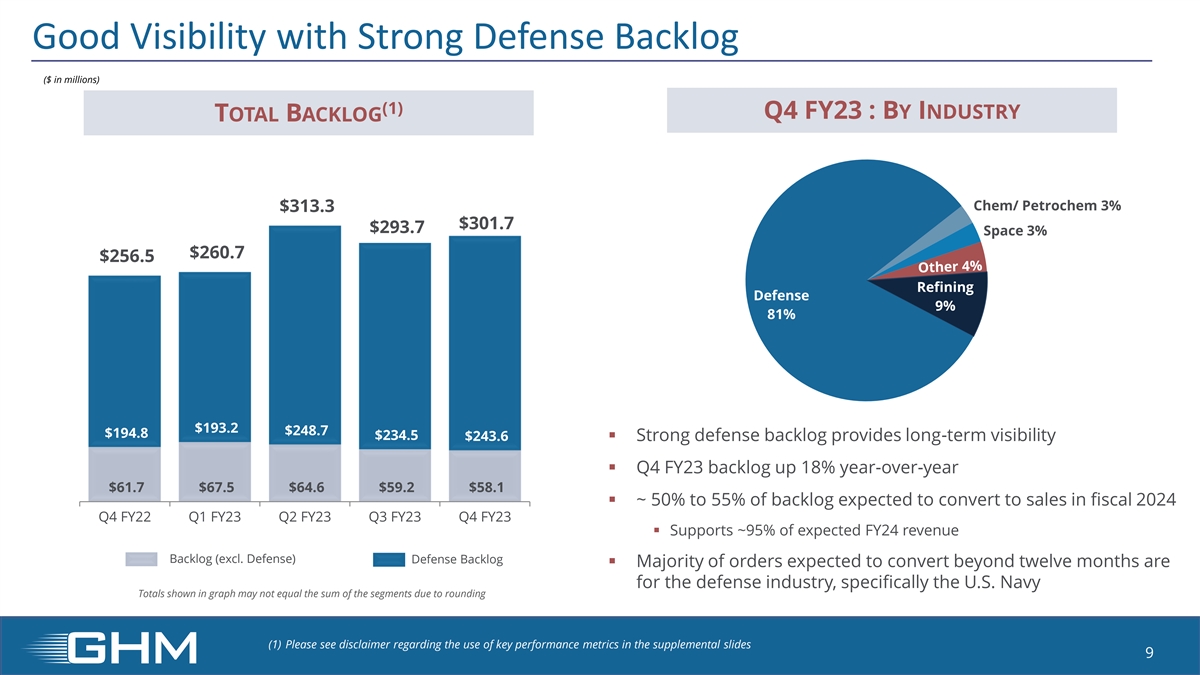
$ | 235.9 | $ | 233.2 | $ | 272.6 | $ | 256.5 | $ | 256.5 | $ | 260.7 | $ | 313.3 | $ | 293.7 | $ | 301.7 | $ | 301.7 | ||||||||||||||||||||
Orders for the three-month period ended March 31, 2023, were up $27.2 million, or 115%, to $50.8 million compared with $23.7 million for the same period of fiscal 2022. Aftermarket orders for the refining and petrochemical markets were $11.5 million in the fiscal 2023 fourth quarter, an increase of 37%.
Record orders in fiscal 2023 of $202.7 million were driven by demand in most markets including defense, space, and new energy, as well as aftermarket demand in refining and petrochemical markets. Aftermarket orders were up 34% to $40.6 million for the year.
Backlog at fiscal year-end was $301.7 million, compared with $293.7 million on December 31, 2022, and $256.5 million on March 31, 2022. Approximately 50% to 55% of orders currently in backlog are expected to be converted to sales in fiscal 2024 and another 25% to 30% is expected to convert to sales within the next year. The majority of orders expected to convert beyond twelve months are for the defense industry, specifically the U.S. Navy.
Graham Corporation Reports Sales Growth of 28% to Record $157.1 Million for Fiscal 2023
June 8, 2023
Page 5 of 12
Fiscal 2024 Outlook
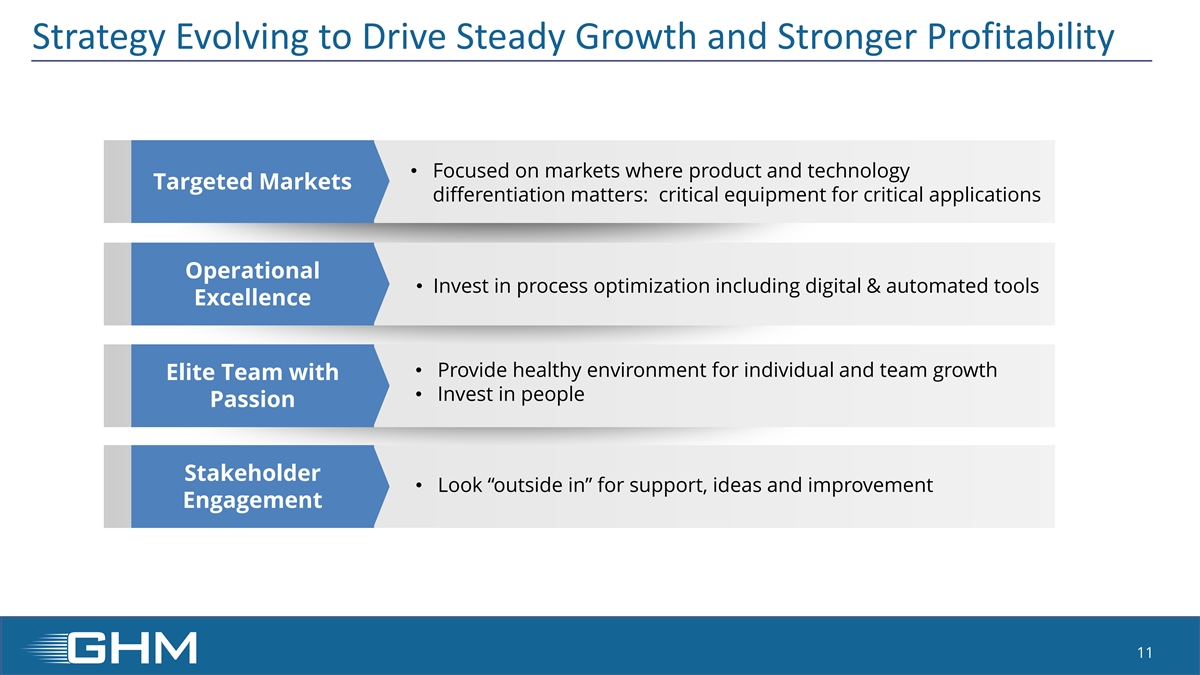
Mr. Thoren concluded, “These are exciting times for our Company. We continue to evolve our strategy to reduce our cyclicality and further diversify our opportunities as we develop technologies that help solve our customers’ problems. We are focusing our efforts to:
| • | Pursue clearly defined markets where product and technology differentiation matters |
| • | Drive operational excellence while investing in process optimization including digital and automated tools |
| • | Build an elite team of people passionate about their work |
| • | Engage all stakeholders to capture value |
We have made significant progress with the advancements in our business, which puts us ahead of schedule in achieving our fiscal 2027 goals. As a result, we now believe that we can achieve greater than $200 million in revenue and adjusted EBITDA margins in the low to mid-teens in fiscal 2027.”
The Company established guidance for fiscal 2024 as follows:
| (as of June 8, 2023) |
Fiscal 2024 Guidance |
|||
| Revenue: | $165 million to $175 million | |||
| Gross margin: | ~17%-18% | |||
| SG&A expense(1) | ~15%-16% of sales | |||
| Adjusted EBITDA(2) | $10.5 million to $12.5 million | |||
| Effective tax rate | ~22%-23% | |||
| Capital expenditures | $5.5 million - $7.0 million |
| (1) | SG&A expense as a % of sales includes approximately $2 million to $3 million of BN performance bonus and approximately $0.5 million to $1.0 million of enterprise resource planning system (“ERP”) conversion costs. |
| (2) | Adjusted EBITDA excludes approximately $2 million to $3 million of BN performance bonus and approximately $0.5 million to $1.0 million of ERP conversion costs. See “Forward-Looking Non-GAAP Measures” below for additional information about this non-GAAP measure. |
WEBCAST AND CONFERENCE CALL
GHM’s management will host a conference call and live webcast today at 11:00 a.m. Eastern Time (“ET”) to review its financial condition and operating results, as well as its strategy and outlook. The review will be accompanied by a slide presentation, which will be made available immediately prior to the conference call on GHM’s investor relations website.
A question-and-answer session will follow the formal presentation. GHM’s conference call can be accessed by calling (201) 689-8560. Alternatively, the webcast can be monitored from the events section of GHM’s investor relations website.
A telephonic replay will be available from 2:00 p.m. ET on the day of the teleconference through Thursday, June 22, 2023 at 11:59 p.m. ET. To listen to the archived call, dial (412) 317-6671 and enter conference ID number 13738114 or access the webcast replay via the Company’s website at ir.grahamcorp.com, where a transcript will also be posted once available.
Graham Corporation Reports Sales Growth of 28% to Record $157.1 Million for Fiscal 2023
June 8, 2023
Page 6 of 12
About Graham Corporation
GHM is a global leader in the design and manufacture of mission critical fluid, power, heat transfer and vacuum technologies for the defense, space, energy, and process industries. The Graham Manufacturing and Barber-Nichols’ global brands are built upon world-renowned engineering expertise in vacuum and heat transfer, cryogenic pumps, and turbomachinery technologies, as well as its responsive and flexible service and the unsurpassed quality customers have come to expect from the Company’s products and systems.
Graham Corporation routinely posts news and other important information on its website, grahamcorp.com, where additional information on Graham Corporation and its businesses can be found.
Safe Harbor Regarding Forward Looking Statements
This news release contains forward-looking statements within the meaning of Section 27A of the Securities Act of 1933, as amended, and Section 21E of the Securities Exchange Act of 1934, as amended.
Forward-looking statements are subject to risks, uncertainties and assumptions and are identified by words such as “expects,” “outlook,” “anticipates,” “believes,” “could,” “guidance,” “should,” ”may”, “will,” “tends,” “focus,” “plan” and other similar words. All statements addressing operating performance, events, or developments that Graham Corporation expects or anticipates will occur in the future, including but not limited to, profitability of future projects and the business, its ability to deliver to plan, its ability to meet customers’ shipment and delivery expectations, the future impact of low margin defense projects and related cost overruns, expected expansion and growth opportunities within its domestic and international markets, anticipated sales, revenues, adjusted EBITDA, adjusted EBITDA margins, capital expenditures and SG&A expenses, the timing of conversion of backlog to sales, orders, market presence, profit margins, tax rates, foreign sales operations, its ability to improve cost competitiveness and productivity, customer preferences, changes in market conditions in the industries in which it operates, changes in general economic conditions and customer behavior, forecasts regarding the timing and scope of the economic recovery in its markets, and its acquisition and growth strategy, are forward-looking statements. Because they are forward-looking, they should be evaluated in light of important risk factors and uncertainties. These risk factors and uncertainties are more fully described in Graham Corporation’s most recent Annual Report filed with the Securities and Exchange Commission (the “SEC”), included under the heading entitled “Risk Factors”, and in other reports filed with the SEC.
Should one or more of these risks or uncertainties materialize or should any of Graham Corporation’s underlying assumptions prove incorrect, actual results may vary materially from those currently anticipated. In addition, undue reliance should not be placed on Graham Corporation’s forward-looking statements. Except as required by law, Graham Corporation disclaims any obligation to update or publicly announce any revisions to any of the forward-looking statements contained in this news release.
Forward-Looking Non-GAAP Measures
Forward-looking adjusted EBITDA and adjusted EBITDA margin are non-GAAP measures. The Company is unable to present a quantitative reconciliation of these forward-looking non-GAAP financial measures to their most directly comparable forward-looking GAAP financial measures because such information is not available, and management cannot reliably predict the necessary components of such GAAP measures without unreasonable effort largely because forecasting or predicting our future operating results is subject to many factors out of our control or not readily predictable. In addition, the Company believes that such reconciliations would imply a degree of precision that would be confusing or misleading to investors. The unavailable information could have a significant impact on the Company’s fiscal 2024 financial results. These non-GAAP financial measures are preliminary estimates and are subject to risks and uncertainties, including, among others, changes in connection with purchase accounting, quarter-end, and year-end adjustments. Any variation between the Company’s actual results and preliminary financial estimates set forth above may be material.
Graham Corporation Reports Sales Growth of 28% to Record $157.1 Million for Fiscal 2023
June 8, 2023
Page 7 of 12
Key Performance Indicators
In addition to the foregoing non-GAAP measures, management uses the following key performance metrics to analyze and measure the Company’s financial performance and results of operations: orders, backlog, and book-to-bill ratio. Management uses orders and backlog as measures of current and future business and financial performance and these may not be comparable with measures provided by other companies. Orders represent written communications received from customers requesting the Company to provide products and/or services. Backlog is defined as the total dollar value of net orders received for which revenue has not yet been recognized. Management believes tracking orders and backlog are useful as it often times is a leading indicator of future performance. In accordance with industry practice, contracts may include provisions for cancellation, termination, or suspension at the discretion of the customer.
The book-to-bill ratio is an operational measure that management uses to track the growth prospects of the Company. The Company calculates the book-to-bill ratio for a given period as net orders divided by net sales.
Given that each of orders, backlog and book-to-bill ratio is an operational measure and that the Company’s methodology for calculating orders, backlog and book-to-bill ratio does not meet the definition of a non-GAAP measure, as that term is defined by the U.S. Securities and Exchange Commission, a quantitative reconciliation for each is not required or provided.
For more information, contact:
| Christopher J. Thome |
Deborah K. Pawlowski | |
| Vice President – Finance and CFO |
Kei Advisors LLC | |
| Phone: (585) 343-2216 |
Phone: (716) 843-3908 | |
| [email protected] |
FINANCIAL TABLES FOLLOW.
Graham Corporation Reports Sales Growth of 28% to Record $157.1 Million for Fiscal 2023
June 8, 2023
Page 8 of 12
Graham Corporation
Consolidated Statements of Operations – Unaudited
(Amounts in thousands, except per share data)
| Three Months Ended March 31, |
Year Ended March 31, |
|||||||||||||||||||||||
| 2023 | 2022 | % Change | 2023 | 2022 | % Change | |||||||||||||||||||
| Net sales |
$ | 43,027 | $ | 39,737 | 8% | $ | 157,118 | $ | 122,814 | 28% | ||||||||||||||
| Cost of products sold |
35,870 | 35,526 | 1% | 131,710 | 113,685 | 16% | ||||||||||||||||||
|
|
|
|
|
|
|
|
|
|||||||||||||||||
| Gross profit |
7,157 | 4,211 | NA | 25,408 | 9,129 | NA | ||||||||||||||||||
| Gross margin |
16.6% | 10.6% | 16.2% | 7.4% | ||||||||||||||||||||
| Other expenses and income: |
||||||||||||||||||||||||
| Selling, general and administrative |
7,235 | 5,852 | 24% | 23,063 | 20,386 | 13% | ||||||||||||||||||
| Selling, general and administrative – amortization |
274 | 274 | 0% | 1,095 | 913 | 20% | ||||||||||||||||||
| Other operating expense (income), net |
— | 135 | (100% | ) | — | (827 | ) | (100% | ) | |||||||||||||||
|
|
|
|
|
|
|
|
|
|||||||||||||||||
| Operating profit (loss) |
(352 | ) | (2,050 | ) | NA | 1,250 | (11,343 | ) | NA | |||||||||||||||
|
|
|
|
|
|
|
|
|
|||||||||||||||||
| Operating margin |
(0.8% | ) | (5.2% | ) | 0.8% | -9.2% | ||||||||||||||||||
| Other income, net |
(62 | ) | (111 | ) | (44% | ) | (250 | ) | (527 | ) | (53% | ) | ||||||||||||
| Interest income |
(58 | ) | (7 | ) | 729% | (129 | ) | (50 | ) | 158% | ||||||||||||||
| Interest expense |
300 | 150 | 100% | 1,068 | 450 | 137% | ||||||||||||||||||
|
|
|
|
|
|
|
|
|
|||||||||||||||||
| Income (loss) before provision (benefit) for income taxes |
(532 | ) | (2,082 | ) | NA | 561 | (11,216 | ) | NA | |||||||||||||||
| Provision (benefit) for income taxes |
(51 | ) | (657 | ) | NA | 194 | (2,443 | ) | NA | |||||||||||||||
|
|
|
|
|
|
|
|
|
|||||||||||||||||
| Net income (loss) |
$ | (481 | ) | $ | (1,425 | ) | NA | $ | 367 | $ | (8,773 | ) | NA | |||||||||||
|
|
|
|
|
|
|
|
|
|||||||||||||||||
| Per share data: |
||||||||||||||||||||||||
| Basic: |
||||||||||||||||||||||||
| Net income (loss) |
$ | (0.05 | ) | $ | (0.13 | ) | NA | $ | 0.03 | $ | (0.83 | ) | NA | |||||||||||
|
|
|
|
|
|
|
|
|
|||||||||||||||||
| Diluted: |
||||||||||||||||||||||||
| Net income (loss) |
$ | (0.05 | ) | $ | (0.13 | ) | NA | $ | 0.03 | $ | (0.83 | ) | NA | |||||||||||
|
|
|
|
|
|
|
|
|
|||||||||||||||||
| Weighted average common shares outstanding: |
||||||||||||||||||||||||
| Basic |
10,617 | 10,645 | 10,614 | 10,541 | ||||||||||||||||||||
| Diluted |
10,617 | 10,645 | 10,654 | 10,541 | ||||||||||||||||||||
| Dividends declared per share |
$ | — | $ | — | $ | — | $ | 0.33 | ||||||||||||||||
|
|
|
|
|
|
|
|
|
|||||||||||||||||
N/A: Not Applicable
Graham Corporation Reports Sales Growth of 28% to Record $157.1 Million for Fiscal 2023
June 8, 2023
Page 9 of 12
Graham Corporation
Consolidated Balance Sheets – Unaudited
(Amounts in thousands, except per share data)
| March 31, 2023 |
March 31, 2022 |
|||||||
| Assets |
||||||||
| Current assets: |
||||||||
| Cash and cash equivalents |
$ | 18,257 | $ | 14,741 | ||||
| Trade accounts receivable, net of allowances ($1,841 and $87 at March 31 and March 31, 2022, respectively) |
24,000 | 27,645 | ||||||
| Unbilled revenue |
39,684 | 25,570 | ||||||
| Inventories |
26,293 | 17,414 | ||||||
| Prepaid expenses and other current assets |
1,534 | 1,391 | ||||||
| Income taxes receivable |
302 | 459 | ||||||
|
|
|
|
|
|||||
| Total current assets |
110,070 | 87,220 | ||||||
| Property, plant and equipment, net |
25,523 | 24,884 | ||||||
| Prepaid pension asset |
6,107 | 7,058 | ||||||
| Operating lease assets |
8,237 | 8,394 | ||||||
| Goodwill |
23,523 | 23,523 | ||||||
| Customer relationships, net |
10,718 | 11,308 | ||||||
| Technology and technical know-how, net |
9,174 | 9,679 | ||||||
| Other intangible assets, net |
7,610 | 8,990 | ||||||
| Deferred income tax asset |
2,798 | 2,441 | ||||||
| Other assets |
158 | 194 | ||||||
|
|
|
|
|
|||||
| Total assets |
$ | 203,918 | $ | 183,691 | ||||
|
|
|
|
|
|||||
| Liabilities and stockholders’ equity |
||||||||
| Current liabilities: |
||||||||
| Current portion of long-term debt |
$ | 2,000 | $ | 2,000 | ||||
| Current portion of finance lease obligations |
29 | 23 | ||||||
| Accounts payable |
20,222 | 16,662 | ||||||
| Accrued compensation |
10,401 | 7,991 | ||||||
| Accrued expenses and other current liabilities |
6,434 | 6,047 | ||||||
| Customer deposits |
46,042 | 25,644 | ||||||
| Operating lease liabilities |
1,022 | 1,057 | ||||||
| Income taxes payable |
16 | — | ||||||
|
|
|
|
|
|||||
| Total current liabilities |
86,166 | 59,424 | ||||||
| Long-term debt |
9,744 | 16,378 | ||||||
| Finance lease obligations |
85 | 11 | ||||||
| Operating lease liabilities |
7,498 | 7,460 | ||||||
| Deferred income tax liability |
108 | 62 | ||||||
| Accrued pension and postretirement benefit liabilities |
1,342 | 1,666 | ||||||
| Other long-term liabilities |
2,042 | 2,196 | ||||||
|
|
|
|
|
|||||
| Total liabilities |
106,985 | 87,197 | ||||||
|
|
|
|
|
|||||
| Stockholders’ equity: |
||||||||
| Preferred stock, $1.00 par value, 500 shares authorized |
— | — | ||||||
| Common stock, $0.10 par value, 25,500 shares authorized, 10,774 and 10,801 shares issued and 10,635 and 10,636 shares outstanding at March 31, 2022 and 2021, respectively |
1,075 | 1,080 | ||||||
| Capital in excess of par value |
28,061 | 27,770 | ||||||
| Retained earnings |
77,443 | 77,076 | ||||||
| Accumulated other comprehensive loss |
(7,463 | ) | (6,471 | ) | ||||
| Treasury stock (138 and 164 shares at March 31, 2022 and 2021, respectively) |
(2,183 | ) | (2,961 | ) | ||||
|
|
|
|
|
|||||
| Total stockholders’ equity |
96,933 | 96,494 | ||||||
|
|
|
|
|
|||||
| Total liabilities and stockholders’ equity |
$ | 203,918 | $ | 183,691 | ||||
|
|
|
|
|
|||||
Graham Corporation Reports Sales Growth of 28% to Record $157.1 Million for Fiscal 2023
June 8, 2023
Page 10 of 12
Graham Corporation
Consolidated Statements of Cash Flows – Unaudited
(Amounts in thousands)
| Year Ended March 31, |
||||||||
| 2023 | 2022 | |||||||
| Operating activities: |
||||||||
| Net income (loss) |
$ | 367 | $ | (8,773 | ) | |||
| Adjustments to reconcile net income (loss) to net cash provided (used) by operating activities: |
||||||||
| Depreciation |
3,511 | 3,077 | ||||||
| Amortization |
2,476 | 2,522 | ||||||
| Space accounts receivable and inventory reserves |
3,050 | — | ||||||
| Amortization of actuarial losses |
672 | 996 | ||||||
| Amortization of debt issuance costs |
212 | — | ||||||
| Equity-based compensation expense |
806 | 809 | ||||||
| Gain on disposal or sale of property, plant and equipment |
— | 23 | ||||||
| Change in fair value of contingent consideration |
— | (1,900 | ) | |||||
| Deferred income taxes |
(120 | ) | (3,233 | ) | ||||
| (Increase) decrease in operating assets: |
||||||||
| Accounts receivable |
1,520 | (2,055 | ) | |||||
| Unbilled revenue |
(14,228 | ) | 1,550 | |||||
| Inventories |
(9,919 | ) | 3,483 | |||||
| Prepaid expenses and other current and non-current assets |
(97 | ) | (340 | ) | ||||
| Income taxes receivable |
139 | (1,208 | ) | |||||
| Operating lease assets |
1,206 | 1,059 | ||||||
| Prepaid pension asset |
(651 | ) | (1,207 | ) | ||||
| Increase (decrease) in operating liabilities: |
||||||||
| Accounts payable |
3,467 | (3,238 | ) | |||||
| Accrued compensation, accrued expenses and other current and non-current liabilities |
2,654 | 1,164 | ||||||
| Customer deposits |
20,526 | 5,523 | ||||||
| Operating lease liabilities |
(1,049 | ) | (962 | ) | ||||
| Long-term portion of accrued compensation, accrued pension liability and accrued postretirement benefits |
(628 | ) | 491 | |||||
|
|
|
|
|
|||||
| Net cash provided (used) by operating activities |
13,914 | (2,219 | ) | |||||
|
|
|
|
|
|||||
| Investing activities: |
||||||||
| Purchase of property, plant and equipment |
(3,749 | ) | (2,324 | ) | ||||
| Redemption of investments at maturity |
— | 5,500 | ||||||
| Acquisition of Barber-Nichols, LLC |
— | (60,282 | ) | |||||
|
|
|
|
|
|||||
| Net cash used by investing activities |
(3,749 | ) | (57,106 | ) | ||||
|
|
|
|
|
|||||
| Financing activities: |
||||||||
| Borrowings of short-term debt obligations |
5,000 | — | ||||||
| Principal repayments on debt |
(11,000 | ) | (39,750 | ) | ||||
| Proceeds from the issuance of debt |
— | 58,250 | ||||||
| Principal repayments on finance lease obligations |
(23 | ) | (21 | ) | ||||
| Repayments on lease financing obligations |
(275 | ) | (225 | ) | ||||
| Payment of debt issuance costs |
(122 | ) | (271 | ) | ||||
| Dividends paid |
— | (3,523 | ) | |||||
| Purchase of treasury stock |
(21 | ) | (41 | ) | ||||
|
|
|
|
|
|||||
| Net cash (used) provided by financing activities |
(6,441 | ) | 14,419 | |||||
|
|
|
|
|
|||||
| Effect of exchange rate changes on cash |
(208 | ) | 115 | |||||
|
|
|
|
|
|||||
| Net increase (decrease) in cash and cash equivalents |
3,516 | (44,791 | ) | |||||
| Cash and cash equivalents at beginning of period |
14,741 | 59,532 | ||||||
|
|
|
|
|
|||||
| Cash and cash equivalents at end of period |
$ | 18,257 | $ | 14,741 | ||||
|
|
|
|
|
|||||
Graham Corporation Reports Sales Growth of 28% to Record $157.1 Million for Fiscal 2023
June 8, 2023
Page 11 of 12
Graham Corporation
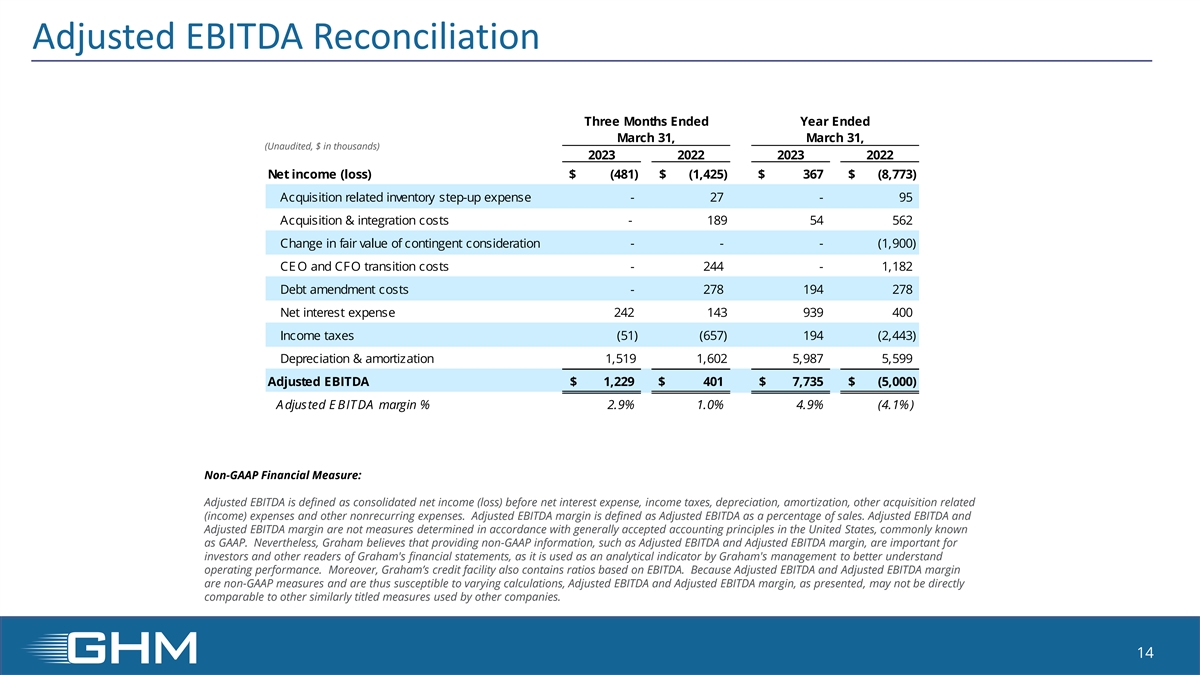
Adjusted EBITDA Reconciliation
(Unaudited, $ in thousands, except per share amounts)
| Three Months Ended March 31, |
Year Ended March 31, |
|||||||||||||||
| 2023 | 2022 | 2023 | 2022 | |||||||||||||
| Net income (loss) |
$ | (481 | ) | $ | (1,425 | ) | $ | 367 | $ | (8,773 | ) | |||||
| Acquisition related inventory step-up expense |
— | 27 | — | 95 | ||||||||||||
| Acquisition & integration costs |
— | 189 | 54 | 562 | ||||||||||||
| Change in fair value of contingent consideration |
— | — | — | (1,900 | ) | |||||||||||
| CEO and CFO transition costs |
— | 244 | — | 1,182 | ||||||||||||
| Debt amendment costs |
— | 278 | 194 | 278 | ||||||||||||
| Net interest expense |
242 | 143 | 939 | 400 | ||||||||||||
| Income taxes |
(51 | ) | (657 | ) | 194 | (2,443 | ) | |||||||||
| Depreciation & amortization |
1,519 | 1,602 | 5,987 | 5,599 | ||||||||||||
|
|
|
|
|
|
|
|
|
|||||||||
| Adjusted EBITDA |
$ | 1,229 | $ | 401 | $ | 7,735 | $ | (5,000 | ) | |||||||
|
|
|
|
|
|
|
|
|
|||||||||
| Adjusted EBITDA margin % |
2.9% | 1.0% | 4.9% | (4.1% | ) | |||||||||||
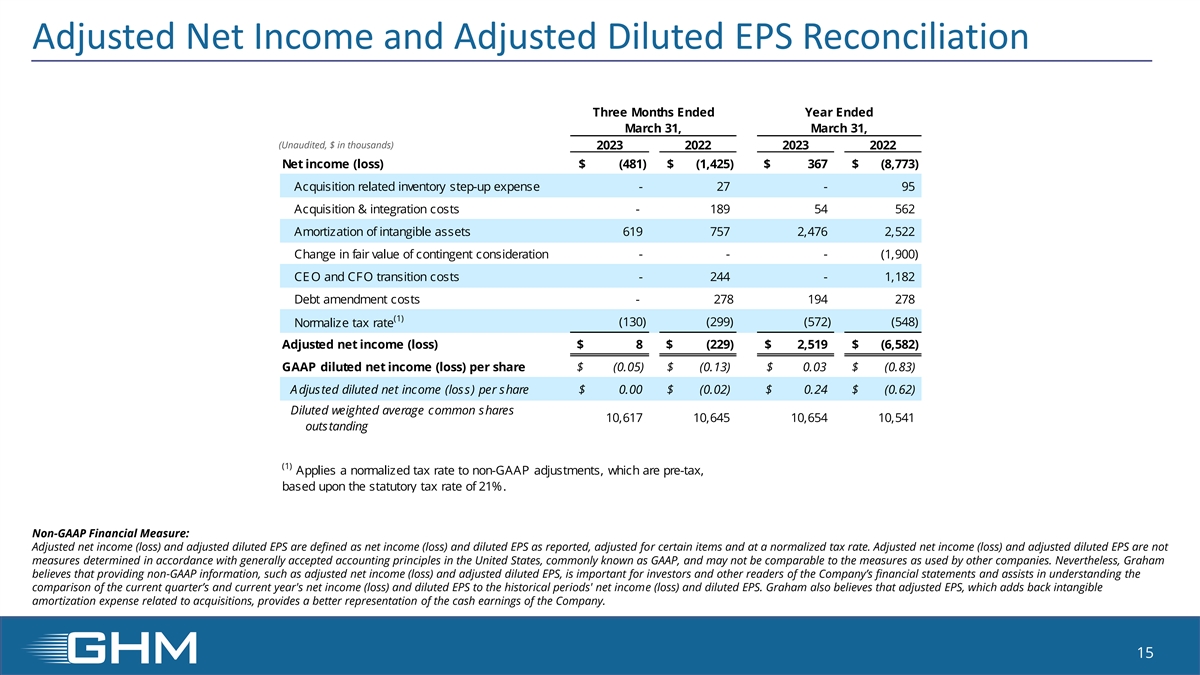
Adjusted Net Income (Loss) and Adjusted Diluted Earnings (Loss) per Share Reconciliation
(Unaudited, $ in thousands, except per share amounts)
| Three Months Ended March 31, |
Year Ended March 31, |
|||||||||||||||
| 2023 | 2022 | 2023 | 2022 | |||||||||||||
| Net income (loss) |
$ | (481 | ) | $ | (1,425 | ) | $ | 367 | $ | (8,773 | ) | |||||
| Acquisition related inventory step-up expense |
— | 27 | — | 95 | ||||||||||||
| Acquisition & integration costs |
— | 189 | 54 | 562 | ||||||||||||
| Amortization of intangible assets |
619 | 757 | 2,476 | 2,522 | ||||||||||||
| Change in fair value of contingent consideration |
— | — | — | (1,900 | ) | |||||||||||
| CEO and CFO transition costs |
— | 244 | — | 1,182 | ||||||||||||
| Debt amendment costs |
— | 278 | 194 | 278 | ||||||||||||
| Normalize tax rate(1) |
(130 | ) | (299 | ) | (572 | ) | (548 | ) | ||||||||
|
|
|
|
|
|
|
|
|
|||||||||
| Adjusted net income (loss) |
$ | 8 | $ | (229 | ) | $ | 2,519 | $ | (6,582 | ) | ||||||
|
|
|
|
|
|
|
|
|
|||||||||
| GAAP diluted net income (loss) per share |
$ | (0.05 | ) | $ | (0.13 | ) | $ | 0.03 | $ | (0.83 | ) | |||||
| Adjusted diluted net income (loss) per share |
$ | 0.00 | $ | (0.02 | ) | $ | 0.24 | $ | (0.62 | ) | ||||||
| Diluted weighted average common shares outstanding |
10,617 | 10,645 | 10,654 | 10,541 | ||||||||||||
| (1) | Applies a normalized tax rate to non-GAAP adjustments, which are pre-tax, based upon the statutory tax rate of 21%. |
Graham Corporation Reports Sales Growth of 28% to Record $157.1 Million for Fiscal 2023
June 8, 2023
Page 12 of 12
Non-GAAP Financial Measures
Adjusted EBITDA is defined as consolidated net income (loss) before net interest expense, income taxes, depreciation, amortization, other acquisition related expenses, and other unusual/nonrecurring expenses. Adjusted EBITDA margin is defined as Adjusted EBITDA as a percentage of sales. Adjusted EBITDA and Adjusted EBITDA margin are not measures determined in accordance with generally accepted accounting principles in the United States, commonly known as GAAP. Nevertheless, Graham believes that providing non-GAAP information, such as Adjusted EBITDA and Adjusted EBITDA margin, is important for investors and other readers of Graham’s financial statements, as it is used as an analytical indicator by Graham’s management to better understand operating performance. Moreover, Graham’s credit facility also contains ratios based on EBITDA. Because Adjusted EBITDA and Adjusted EBITDA margin are non-GAAP measures and are thus susceptible to varying calculations, Adjusted EBITDA, and Adjusted EBITDA margin, as presented, may not be directly comparable to other similarly titled measures used by other companies.
Adjusted net income (loss) and adjusted diluted earnings (loss) per share are defined as net income (loss) and diluted earnings (loss) per share as reported, adjusted for certain items and at a normalized tax rate. Adjusted net income (loss) and adjusted diluted earnings (loss) per share are not measures determined in accordance with GAAP, and may not be comparable to the measures as used by other companies. Nevertheless, Graham believes that providing non-GAAP information, such as adjusted net income and adjusted diluted earnings (loss) per share, is important for investors and other readers of the Company’s financial statements and assists in understanding the comparison of the current quarter’s and current fiscal year’s net income (loss) and diluted earnings (loss) per share to the historical periods’ net income (loss) and diluted earnings (loss) per share. Graham also believes that adjusted earnings (loss) per share, which adds back intangible amortization expense related to acquisitions, provides a better representation of the cash earnings of the Company.
###