8-K
GRAHAM CORP false 0000716314 0000716314 2022-06-08 2022-06-08

UNITED STATES

SECURITIES AND EXCHANGE COMMISSION

WASHINGTON, D.C. 20549

FORM 8-K

CURRENT REPORT

PURSUANT TO SECTION 13 OR 15(d) OF THE SECURITIES EXCHANGE ACT OF 1934

Date of Report (Date of earliest event reported):    June 8, 2022                                                                                                                                              

Graham Corporation


(Exact name of Registrant as specified in its charter)


Delaware   001-08462   16-1194720

(State or other jurisdiction of

incorporation)


(Commission

File Number)


(IRS Employer

Identification No.)


20 Florence Avenue, Batavia, New York   14020
(Address of principal executive offices)   (Zip Code)

Registrant’s telephone number, including area code:      (585) 343-2216                                                                                                                                  

N/A


(Former name or former address, if changed since last report)

Check the appropriate box below if the Form 8-K filing is intended to simultaneously satisfy the filing obligation of the Registrant under any of the following provisions:

[  ] Written communications pursuant to Rule 425 under the Securities Act (17 CFR 230.425)

[  ] Soliciting material pursuant to Rule 14a-12 under the Exchange Act (17 CFR 240.14a-12)

[  ] Pre-commencement communications pursuant to Rule 14d-2(b) under the Exchange Act (17 CFR 240.14d-2(b))

[  ] Pre-commencement communications pursuant to Rule 13e-4(c) under the Exchange Act (17 CFR 240.13e-4(c))

Securities registered pursuant to Section 12(b) of the Act:


Title of each class   Trading Symbol(s)   Name of each exchange on which registered
Common Stock, par value $0.10 per share   GHM   NYSE

Indicate by check mark whether the registrant is an emerging growth company as defined in Rule 405 of the Securities Act of 1933 (§230.405 of this chapter) or Rule 12b-2 of the Securities Exchange Act of 1934 (§240.12b-2 of this chapter).

Emerging growth company  

If an emerging growth company, indicate by check mark if the registrant has elected not to use the extended transition period for complying with any new or revised financial accounting standards provided pursuant to Section 13(a) of the Exchange Act.  ☐


Item 2.02.

Results of Operations and Financial Condition.

On June 8, 2022, Graham Corporation (the “Company”) issued a press release describing its results of operations and financial condition for its fourth quarter and fiscal year ended March 31, 2022 (“fiscal year 2022”). The Company’s earnings press release is attached to this Current Report on Form 8-K (the “Form 8-K”) as Exhibit 99.1.

In addition, on June 9, 2022, the Company posted slides with respect to its fourth quarter and fiscal year 2022 financial results to the Investor Relations section of its website that will accompany the Company’s earnings conference call and webcast at 11:00 a.m. Eastern Time on June 9, 2022. The slides are attached to this Form 8-K as Exhibit 99.2.

The information furnished pursuant to this Item 2.02, including Exhibit 99.1 and Exhibit 99.2, shall not be deemed “filed” for purposes of Section 18 of the Securities Exchange Act of 1934, as amended (the “Exchange Act”), or otherwise subject to the liabilities under such section and shall not be deemed to be incorporated by reference into any filing of the Company under the Securities Act of 1933, as amended (the “Securities Act”), or the Exchange Act.


Item 7.01

Regulation FD Disclosure.

On June 8, 2022, the Company issued a press release describing its strategic plan. The Company’s press release with respect to its strategic plan is attached to this Current Report on Form 8-K as Exhibit 99.3.

On June 9, 2022, the Company posted slides to the Investor Relations section of its website with respect to its strategic plan that will also accompany the Company’s earnings conference call and webcast at 11:00 a.m. Eastern Time on June 9, 2022. The slides are attached to this Form 8-K as Exhibit 99.4.

The information furnished pursuant to this Item 7.01, including Exhibit 99.3 and Exhibit 99.4, shall not be deemed “filed” for purposes of Section 18 of the Exchange Act, or otherwise subject to the liabilities under such section and shall not be deemed to be incorporated by reference into any filing of the Company under the Securities Act or the Exchange Act.


Item 9.01.

Financial Statements and Exhibits.

(d) Exhibits.


 Exhibit No.


Description

99.1

  Press Release dated June 8, 2022 describing the results of operations and financial condition for Graham Corporation’s fourth quarter and fiscal year ended March 31, 2022

99.2

  Slides with respect to Graham Corporation’s fourth quarter and fiscal year 2022 financial results for the June 9, 2022 Earnings Conference Call and Webcast

99.3

  Press Release dated June 8, 2022 describing Graham Corporation’s strategic plan

99.4

  Slides regarding Graham Corporation’s strategic plan for the June 9, 2022 Earnings Conference Call and Webcast

104

  Cover Page Interactive Data File (embedded within the Inline XBRL document)


SIGNATURES

Pursuant to the requirements of the Securities Exchange Act of 1934, the Registrant has duly caused this Report to be signed on its behalf by the undersigned hereunto duly authorized.


      Graham Corporation
Date:  June 9, 2022     By:  

/s/ Christopher Thome

      Christopher Thome
      Vice President – Finance and Chief Financial Officer

Exhibit 99.1


LOGO


News Release  


  Graham Corporation  ¨  20 Florence Avenue  ¨  Batavia, NY 14020

IMMEDIATE RELEASE

GRAHAM CORPORATION REPORTS

FISCAL 2022 FOURTH QUARTER AND FULL YEAR RESULTS


REVENUE OF $39.7 MILLION IN THE QUARTER, UP 55% OVER PRIOR-YEAR PERIOD; FISCAL 2022 REVENUE INCREASED 26% TO $122.8 MILLION


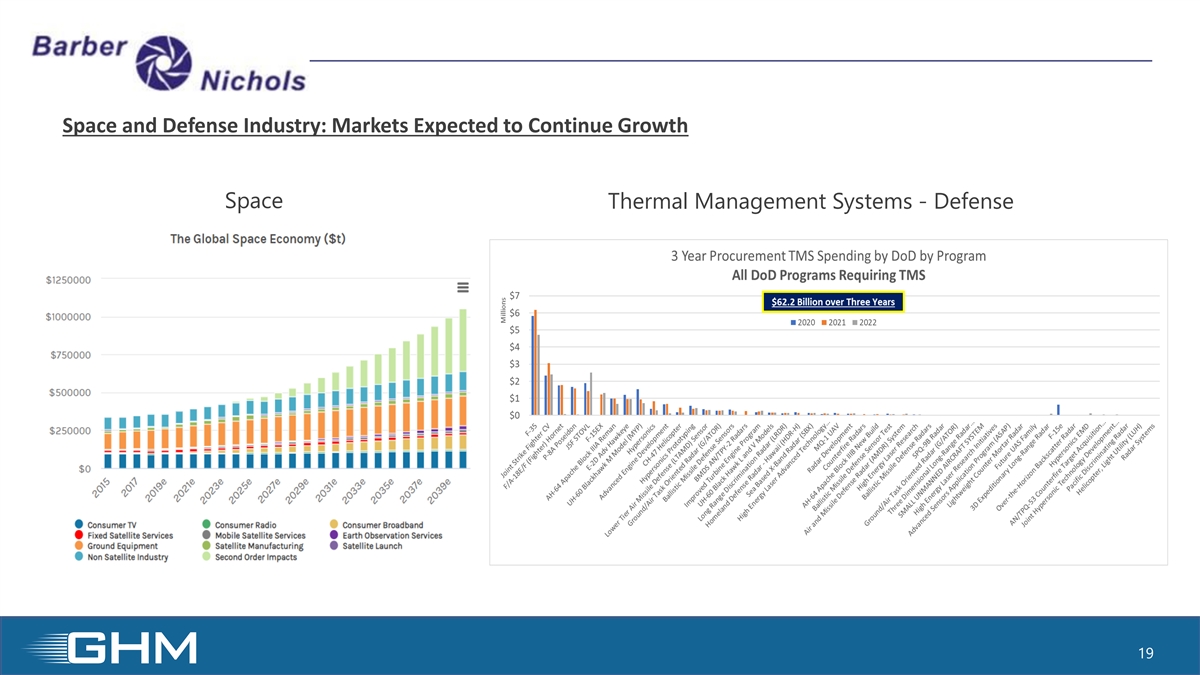
DEFENSE INDUSTRY REVENUE IN QUARTER OF $18.7 MILLION WAS 47% OF TOTAL AND WAS $62.2 MILLION, OR 51% OF TOTAL, FOR THE FISCAL YEAR DEMONSTRATING SHIFT IN BUSINESS MIX


YEAREND BACKLOG WAS $256.5 MILLION INCLUDING $195 MILLION, OR 76%, RELATED TO THE DEFENSE INDUSTRY


BARBER-NICHOLS ACQUISITION CONTRIBUTED 62% OF ORDERS IN QUARTER, OR $14.6 MILLION OF $23.7 MILLION TOTAL AND CONTINUED TO OUTPERFORM EXPECTATIONS


RECORDED FOURTH QUARTER NET LOSS OF $1.4 MILLION AND $0.4 MILLION IN ADJUSTED EBITDA*; FISCAL 2022 NET LOSS OF $8.8 MILLION


RECENTLY SHIPPED ON SCHEDULE FIRST ARTICLE U.S. NAVY PROJECT; DELIVERY ADVANCED EFFORTS TO REDUCE COST OVERRUNS


EXPECT FISCAL 2023 REVENUE TO GROW TO $135 MILLION TO $150 MILLION, UP 16% AT MID-POINT OVER FISCAL 2022; EXPECT ADJUSTED EBITDA* TO INCREASE TO $6.5 MILLION TO $9.5 MILLION

BATAVIA, NY, June 8, 2022 – Graham Corporation (NYSE: GHM), a global leader in the design and manufacture of mission critical fluid, power, heat transfer and vacuum technologies for the defense, space, energy and process industries, today reported financial results for its fourth quarter and full fiscal year ended March 31, 2022, (“fiscal 2022”). Financial results include those of Barber-Nichols, LLC (“BN” or “the acquisition”) from the date it was acquired on June 1, 2021.

Daniel J. Thoren, President and CEO, commented, “Fiscal 2022 was a challenging year, but we made good progress in the quarter and are validating our strategy to increase margins overall and in markets with strong growth drivers such as defense and space. Importantly, we are improving processes and have added talent to mitigate the challenges in our Batavia, NY defense operations. In addition, our fluid and power business is winning new contracts that provide opportunity for more growth and long-term production, and our aftermarket sales continue to be strong, which is a leading indicator for future capital investment by our customers.


-MORE-


Graham Corporation Reports Fiscal 2022 Fourth Quarter and Full Year Results

June 8, 2022

Page 2 of 13


“Notably, we recently shipped a first article condenser for a critical navy submarine application and are on schedule to ship additional critical U.S. Navy projects throughout fiscal 2023. As we make further progress on our production schedule and grow our welding staff, we will be able to reduce our reliance on contract welders. This is expected to help with margin improvement over the coming quarters.”

Fiscal 2023 Outlook

Mr. Thoren concluded, “The future of Graham is very positive. At the heart of the Company, we are engineering experts in complex fluid, power, heat transfer and vacuum systems. Expanding our focus to more growth-oriented markets of defense, space and alternative energy, augments our legacy energy and process businesses where we have a large global installed base. As we look out over the next five years, a new, reenergized Graham has the platform to grow in fluid and power technologies and plans to build a better heat transfer and vacuum technologies business. We believe that over time this strategy will create a stronger enterprise with materially expanded adjusted EBITDA margins in the low to mid-teens with high single-digit top-line growth as we continually improve.”

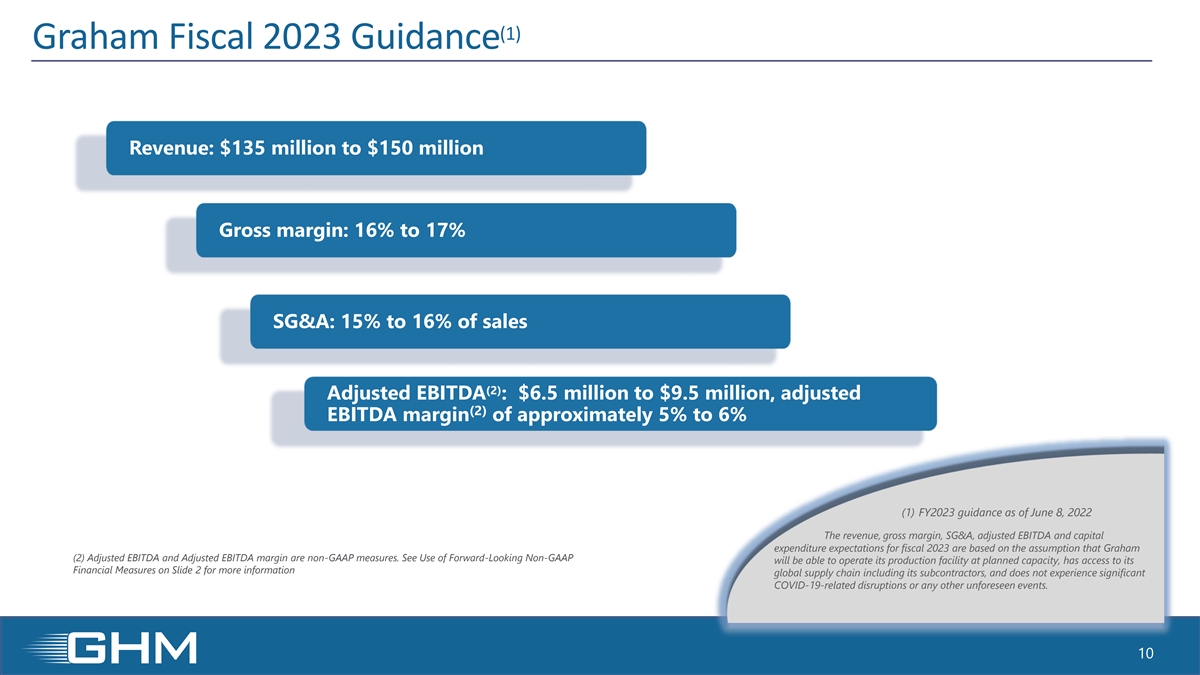
Revenue in fiscal 2023 is expected to be $135 million to $150 million with gross margins of approximately 16% to 17% and selling, general and administrative (“SG&A”) expenses to be approximately 15% to 16% of sales. The expected effective tax rate for fiscal 2023 is approximately 21% to 22%. Adjusted EBITDA for fiscal 2023 is expected to be approximately $6.5 million to $9.5 million, yielding an adjusted EBITDA margin* of approximately 5% to 6% compared with a $5.0 million loss in fiscal 2022. The Company expects the first quarter of fiscal 2023 to remain challenging and for results to improve as the year progresses.

Capital expenditures for fiscal 2023 are expected to be $4.5 million to $5.5 million.

Separately today, the Company announced its new strategic plan outlining its operating and financial goals.

Fourth Quarter Fiscal 2022 Sales Summary (All comparisons are with the same prior-year period unless noted otherwise.)

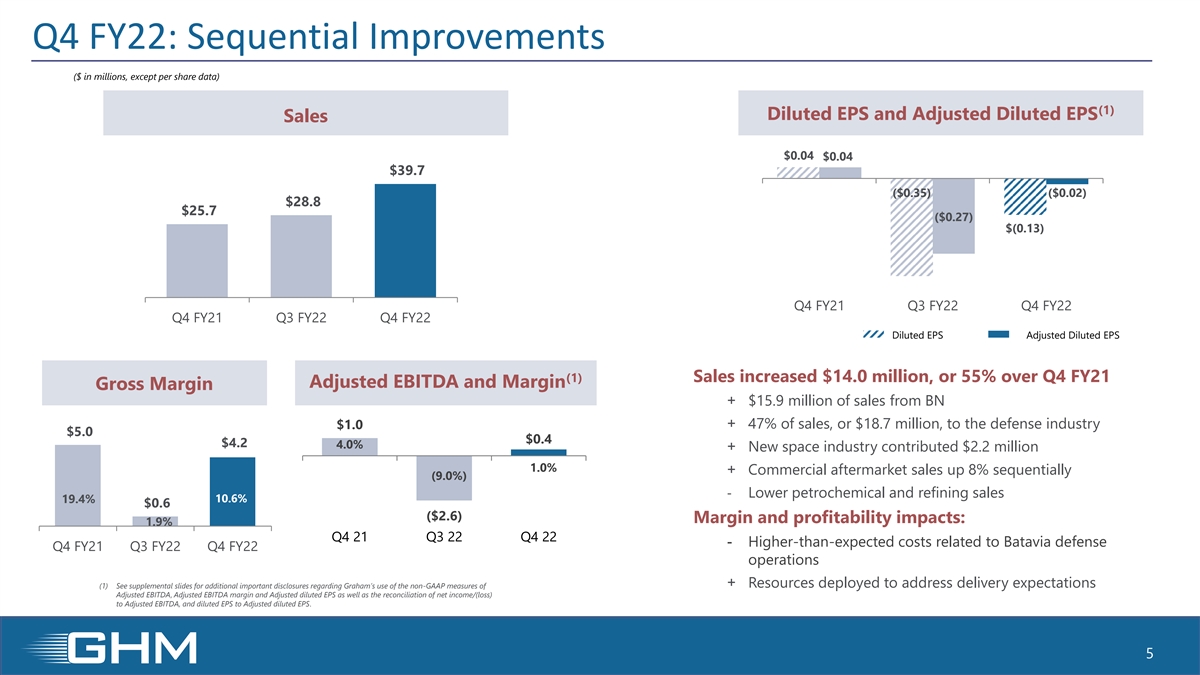
Net sales of $39.7 million increased 55%, or $14.0 million, as acquired revenue of $15.9 million and strong aftermarket sales were partially offset by declines in the organic businesses. By industry, improvements in the defense and space industry, which is new to the Company with the acquisition of BN, offset weakness in refining and chemical/petrochemical sales. See the accompanying financial tables for a further breakdown of sales by industry and region.


-MORE-


Graham Corporation Reports Fiscal 2022 Fourth Quarter and Full Year Results

June 8, 2022

Page 3 of 13


Fourth Quarter Fiscal 2022 Performance Review (All comparisons are with the same prior-year period unless noted otherwise.)


($ in millions except per share data)    Q4 FY22   Q4 FY21   Change  

Net sales

     $ 39.7         $ 25.7         $ 14.0  

Gross profit

     $ 4.2       $ 5.0       $ (0.8)  

Gross margin

     10.6%       19.4%    

Operating (loss) profit

     $ (2.1)       $ 0.6       $ (2.7)  

Operating margin

       (5.2%)       2.3%    

Net (loss) income

     $ (1.4)       $ 0.4       $ (1.8)  

Diluted EPS

     $ (0.13)       $ 0.04    

Adjusted EBITDA*

     $ 0.4       $ 1.0       $ (0.6)  

Adjusted EBITDA margin*

     1.0%       4.0%    

*Graham believes that adjusted EBITDA (defined as consolidated net (loss) income before net interest expense, income taxes, depreciation, amortization, other acquisition related expenses (income), and other unusual/nonrecurring expenses), and adjusted EBITDA margin (adjusted EBITDA as a percentage of sales), which are non-GAAP measures, help in the understanding of its operating performance. Moreover, Graham’s credit facility also contains ratios based on adjusted EBITDA as defined in the lending agreement. Graham also believes that adjusted diluted (loss) earnings per share, which excludes intangible amortization, other costs related to the acquisition, and other unusual/nonrecurring (income) expenses, provides a better representation of the cash earnings of the Company. See the attached tables and other information on pages 11 and 12 for important disclosures regarding Graham’s use of adjusted EBITDA, adjusted EBITDA margin and adjusted diluted (loss) earnings per share, as well as the reconciliation of net (loss) income to adjusted EBITDA and diluted (loss) earnings per share.

Compared with the prior year period, the decline in gross profit and contraction of gross margin reflected challenges with the defense business at Graham’s Batavia operations which had lower sales and higher costs relating to material and labor over runs for first article projects. Sequentially, gross margin improved 8.7 percentage points as the Company advanced these projects, improved processes, and reduced related costs.

SG&A expenses in the fourth quarter of fiscal 2022 were $6.1 million, up $1.7 million over the prior-year period including $0.3 million of intangible amortization. The acquisition added $1.7 million in incremental SG&A expenses in the quarter and there was an additional $0.2 million related to CFO transition costs and $0.3 million of costs in connection with a credit agreement amendment and waiver.

Net loss and loss per diluted share were $1.4 million and $0.13, respectively. On a non-GAAP basis, which excludes intangible amortization, other costs related to the acquisition, and other unusual/nonrecurring (income) expenses, adjusted diluted loss per share* was $0.02.


-MORE-


Graham Corporation Reports Fiscal 2022 Fourth Quarter and Full Year Results

June 8, 2022

Page 4 of 13


Full Year Fiscal 2022 Performance Review (All comparisons are with the same prior-year period unless noted otherwise.)


($ in millions except per share data)    YTD FY22   YTD FY21   Change

Net sales

     $ 122.8         $ 97.5         $ 25.3   

Gross profit

     $ 9.1       $ 20.5       $ (11.4)  

Gross margin

     7.4%       21.0%    

Operating (loss) profit

     $ (11.3)       $ 3.0       $ (14.3)  

Operating margin

       (9.2%)       3.1%    

Net (loss) income

     $ (8.8)       $ 2.4       $ (11.2)  

Diluted EPS

     $ (0.83)       $ 0.24    

Adjusted EBITDA*

     $ (5.0)       $ 5.1       $ (10.1)  

Adjusted EBITDA margin*

     -4.1%       5.2%    

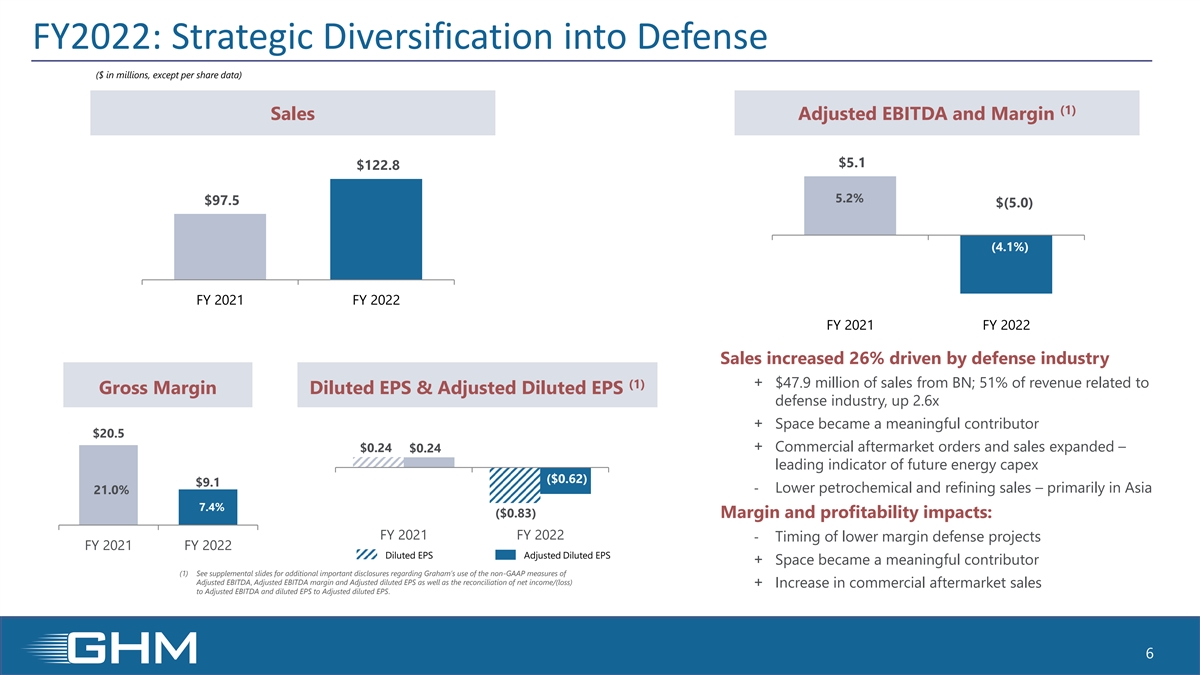
Net sales for the full fiscal year of 2022 were $122.8 million, up $25.3 million, or 26%, driven by sales of $47.9 million from the BN acquisition and higher aftermarket sales. Sales to the defense industry increased 160%, or $38.2 million, to $62.2 million, representing 51% of total revenue. The expansion in defense was partially offset by declines in the commercial refining and chemical markets, primarily in Asia.

Sales in the U.S. increased $44.9 million, or 85%, to $97.6 million and was 80% of total sales in the full year of fiscal 2022, as revenue from the acquisition is primarily in the U.S. International sales, which accounted for 20% of total sales, decreased by $19.6 million, or 44%, to $25.2 million.

Gross profit and margin were down compared with the prior-year period due to the same factors which impacted the quarter. The Company elected to over-resource certain critical defense orders in its Batavia operation, which included increasing the use of contract welders to meet delivery schedules and redirecting resources away from commercial business. Combined with cost overruns, Graham estimates that these factors were an impact of over $10 million to gross profit in fiscal 2022. The BN acquisition and strong aftermarket sales helped to offset those losses. The impact of the low margin defense projects and related cost overruns in the Batavia operations are expected to lessen over the coming quarters and are expected to be completed before the end of fiscal 2023.

SG&A expenses in the full year of fiscal 2022 were $21.3 million, including intangible amortization of $0.9 million, an increase of $3.8 million, compared with SG&A expenses of $17.5 million in the full year of fiscal 2021. The increase was primarily due to the addition of the BN business which added $4.8 million in incremental expenses as well as costs associated with the acquisition, executive management transition and financing. Offsetting these increases was reduced incentive compensation.

Net loss and loss per diluted share were $8.8 million and $0.83, respectively. On a non-GAAP basis, which excludes intangible amortization, other costs related to the acquisition, and other unusual/nonrecurring (income) expenses, adjusted diluted loss per share* was $0.62.


-MORE-


Graham Corporation Reports Fiscal 2022 Fourth Quarter and Full Year Results

June 8, 2022

Page 5 of 13


Cash Management and Balance Sheet

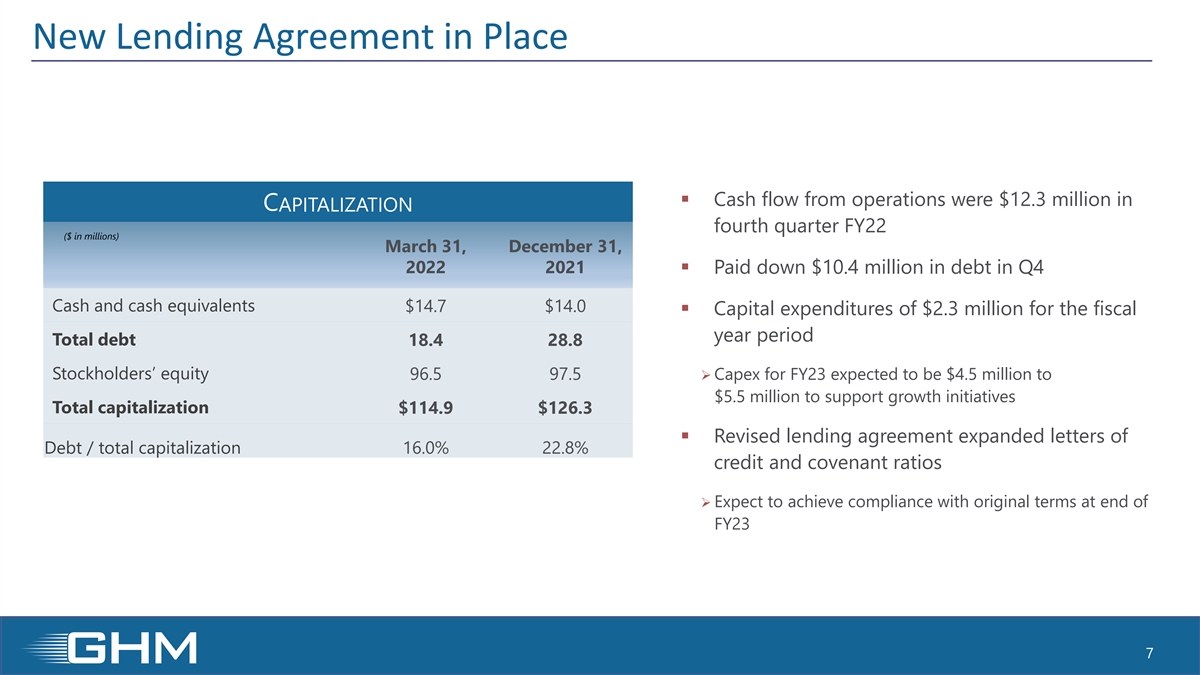
Cash generated from operations in the quarter was $12.3 million. Cash, cash equivalents and investments at March 31, 2022, were $14.7 million compared with $14.0 million at December 31, 2021, and $65.0 million at the end of fiscal 2021, which was prior to the BN acquisition. Capital expenditures in the quarter were $0.4 million and for fiscal 2022 were $2.3 million.

Debt at the end of the fourth quarter was reduced by $10.4 million to $18.4 million compared with the end of the fiscal 2022 third quarter. Graham executed a waiver and amendments to its credit agreement, which expanded availability for letters of credit and changed the minimum EBITDA requirements. The Company is in compliance with all financial covenants of that agreement.

Orders and Backlog

($ in millions)    


     Q1 21      Q2 21      Q3 21      Q4 21      FY2021       Q1 22      Q2 22      Q3 22      Q4 22      FY2022  
                     

Orders

   $ 11.5      $ 35.0      $ 61.8      $ 13.4      $ 121.6       $ 20.9      $ 31.4      $ 68.0      $ 23.7      $ 143.9  

Backlog

   $ 107.2      $ 114.9      $ 149.7      $ 137.6      $ 137.6       $ 235.9      $ 233.2      $ 272.6      $ 256.5      $ 256.5  

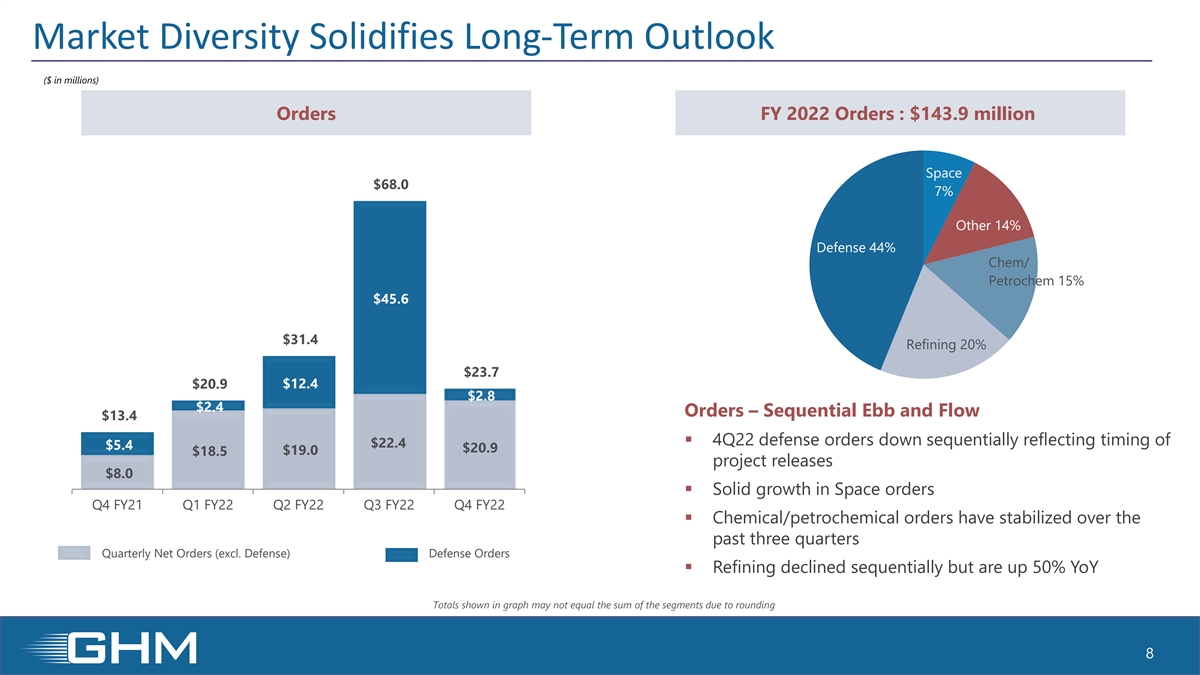
Orders for the three-month period ended March 31, 2022, were up $10.3 million, or 77%, to $23.7 million compared with $13.4 million for the same period of fiscal 2021. Orders related to the acquisition were $14.6 million for the fiscal 2022 fourth quarter.

Coming off strong orders in the third quarter of fiscal 2022, defense industry orders in the fourth quarter were $2.8 million, reflecting the timing of project releases. Space orders had a solid sequential increase of 86% to $5.4 million. In the energy business, refining was down 57% sequentially from the third quarter, but was up 50% compared with the prior-year period. Orders from the chemical and petrochemical market stabilized with a comparable level of orders over the past three fiscal quarters.

Aftermarket and small parts orders for the refining and chemical/petrochemical markets improved in the fourth quarter. This business tends to be a leading indicator of future capital investments by customers in this market.

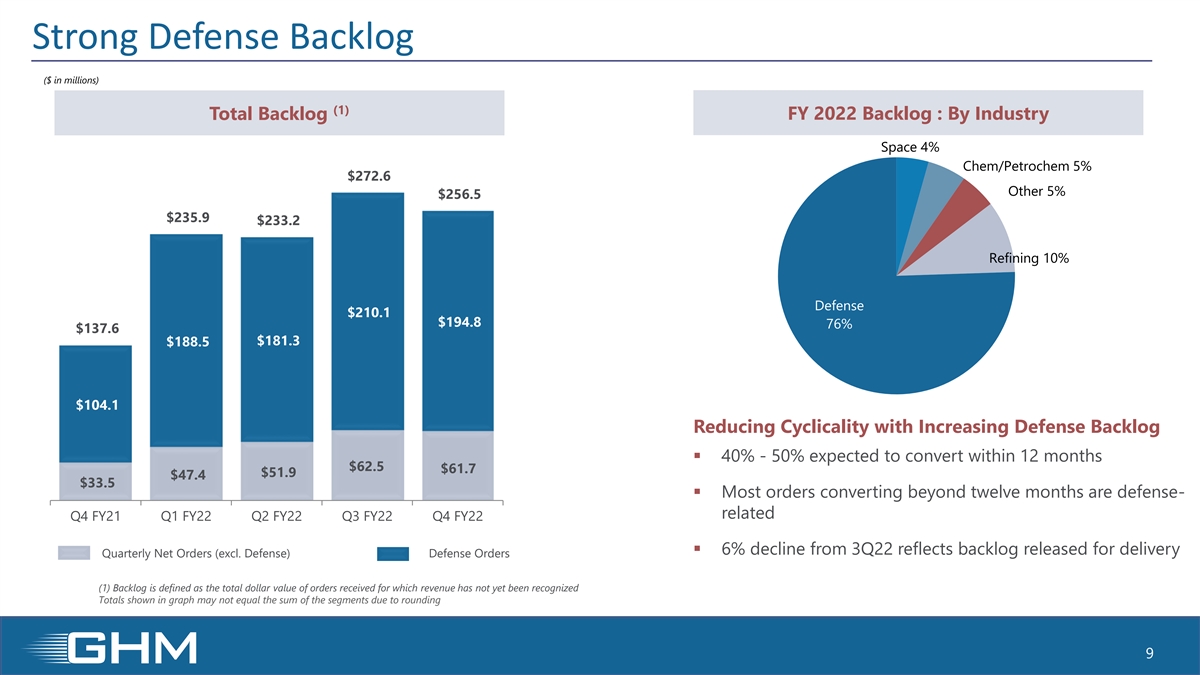
Backlog at March 31, 2022, was $256.5 million, compared with $272.6 million at December 31, 2021, and $137.6 million at March 31, 2021. The 6% sequential decrease primarily reflects backlog being released for delivery. The acquisition added $117.8 million to fiscal 2022 yearend backlog. Approximately 40% to 50% of orders currently in our backlog are expected to be converted to sales within one year. Most of the orders that are expected to convert beyond twelve months are for the defense industry, specifically the U.S. Navy.

Backlog by industry at March 31, 2022, was approximately:


76% for defense projects


10% for refinery projects


5% for chemical/petrochemical projects


4% for space projects


5% for other industrial applications


-MORE-


Graham Corporation Reports Fiscal 2022 Fourth Quarter and Full Year Results

June 8, 2022

Page 6 of 13


Corporate Strategy and Financial Results Webinar

The Company will host a webinar to discuss its corporate strategy and fourth quarter and fiscal year 2022 financial results tomorrow, June 9, 2022 at 11:00 a.m. Eastern Time. Internet webcast link and accompanying slide presentations will be available here: https://ir.grahamcorp.com/.

A question-and-answer session will follow the presentations. Questions may be submitted through the webinar portal or, alternatively, a teleconference number will be provided to ask any questions live at the event.

A webcast replay will be available on the Company’s investor relations website, where a transcript will also be posted once available.

ABOUT GRAHAM CORPORATION

Graham is a global leader in the design and manufacture of mission critical fluid, power, heat transfer and vacuum technologies for the defense, space, energy and process industries. The Graham Manufacturing and Barber-Nichols’ global brands are built upon world-renowned engineering expertise in vacuum and heat transfer, cryogenic pumps and turbomachinery technologies, as well as its responsive and flexible service and the unsurpassed quality customers have come to expect from the Company’s products and systems.

Graham routinely posts news and other important information on its website, www.grahamcorp.com, where additional information on Graham Corporation and its businesses can be found.

Safe Harbor Regarding Forward Looking Statements

This news release contains forward-looking statements within the meaning of Section 27A of the Securities Act of 1933, as amended, and Section 21E of the Securities Exchange Act of 1934, as amended.

Forward-looking statements are subject to risks, uncertainties and assumptions and are identified by words such as “expects,” “estimates,” “outlook,” “anticipates,” “believes,” “could,” “tends,” “opportunity,” “plans,” ”may,” “will,” and other similar words. All statements addressing operating performance, events, or developments that Graham Corporation expects or anticipates will occur in the future, including but not limited to, its ability and the timing needed to address challenges in its defense business, including at the Batavia, NY operations, profitability of future projects, the development and impact of improved processes, its ability to meet customers’ delivery expectations, the future impact of low margin defense projects and related cost overruns, expected expansion and growth opportunities within its domestic and international markets, anticipated revenue, adjusted EBITDA, adjusted EBITDA margins, and SG&A expenses, the timing of conversion of backlog to sales, market presence, profit margins, tax rates, foreign sales operations, its ability to improve cost competitiveness and productivity, customer preferences, changes in market conditions in the industries in which it operates, labor constraints, the effect on its business of volatility in commodities prices, including, but not limited to, changes in general economic conditions and customer behavior, forecasts regarding the timing and scope of the economic recovery in its markets, its acquisition and growth strategy and its operations in China, India and other international locations, are forward-looking statements. Because they are forward-looking, they should be evaluated in light of important risk factors and uncertainties. These risk factors and uncertainties are


-MORE-


Graham Corporation Reports Fiscal 2022 Fourth Quarter and Full Year Results

June 8, 2022

Page 7 of 13


more fully described in Graham Corporation’s most recent Annual Report filed with the Securities and Exchange Commission, included under the heading entitled “Risk Factors.”

Should one or more of these risks or uncertainties materialize or should any of Graham Corporation’s underlying assumptions prove incorrect, actual results may vary materially from those currently anticipated. In addition, undue reliance should not be placed on Graham Corporation’s forward-looking statements. Except as required by law, Graham Corporation disclaims any obligation to update or publicly announce any revisions to any of the forward-looking statements contained in this news release.

Forward-Looking Non-GAAP Measures

Forward looking adjusted EBITDA and adjusted EBITDA margin are non-GAAP measures. The Company is unable to present a quantitative reconciliation of these forward-looking non-GAAP financial measures to their most directly comparable forward-looking GAAP financial measures because such information is not available, and management cannot reliably predict the necessary components of such GAAP measures without unreasonable effort largely because forecasting or predicting our future operating results is subject to many factors out of our control or not readily predictable. In addition, the Company believes that such reconciliations would imply a degree of precision that would be confusing or misleading to investors. The unavailable information could have a significant impact on the Company’s fiscal 2023 financial results. These non-GAAP financial measures are preliminary estimates and are subject to risks and uncertainties, including, among others, changes in connection with purchase accounting, quarter-end and year-end adjustments. Any variation between the Company’s actual results and preliminary financial estimates set forth above may be material.

For more information, contact:

Christopher J. Thome

Vice President - Finance and CFO

Phone: (585) 343-2216


Deborah K. Pawlowski

Kei Advisors LLC

Phone: (716) 843-3908

[email protected]

FINANCIAL TABLES FOLLOW.


-MORE-


Graham Corporation Reports Fiscal 2022 Fourth Quarter and Full Year Results

June 8, 2022

Page 8 of 13


Graham Corporation

Consolidated Statements of Operations - Unaudited

(Amounts in thousands, except per share data)


     Three Months Ended   Year Ended
     March 31,   March 31,
     2022   2021   % Change   2022   2021   % Change


Net sales

     $ 39,737         $ 25,671       55%     $ 122,814        $ 97,489       26%

Cost of products sold

     35,526       20,690     72%     113,685       77,020     48%


Gross profit

     4,211       4,981     (15%)     9,129       20,469     (55%)

Gross margin

     10.6%       19.4%         7.4%       21.0%    

Other expenses and income:


Selling, general and administrative

     5,852       4,380     34%     20,386       17,471     17%

Selling, general and administrative – amortization

     274       -     NA     913       -     NA

Other operating expense (income), net

     135       -     NA     (827)       -     NA


Operating (loss) profit

     (2,050)       601     NA     (11,343)       2,998     NA


Operating margin

     (5.2%)       2.3%         -9.2%       3.1%    

Other (income) expense

     (111)       51     (318%)     (527)       (113)     366%

Interest income

     (7)       (24)     (71%)     (50)       (167)     (70%)

Interest expense

     150       2     7400%     450       11     3991%


(Loss) income before (benefit) provision for income taxes

     (2,082)       572     NA     (11,216)       3,267     NA

(Benefit) provision for income taxes

     (657)       184     NA     (2,443)       893     NA


Net (loss) income

     $ (1,425)       $ 388     NA     $ (8,773)       $ 2,374     NA


Per share data:


Basic:


Net (loss) income

     $ (0.13)       $ 0.04     NA     $ (0.83)       $ 0.24     NA


Diluted:


Net (loss) income

     $ (0.13)       $ 0.04     NA     $ (0.83)       $ 0.24     NA


Weighted average common shares outstanding:


Basic

     10,645       9,989         10,541       9,959    

Diluted

     10,645       9,989         10,541       9,959    

Dividends declared per share

     $ -         $ 0.11         $ 0.33       $ 0.44    


-MORE-


Graham Corporation Reports Fiscal 2022 Fourth Quarter and Full Year Results

June 8, 2022

Page 9 of 13


Graham Corporation

Consolidated Balance Sheets – Unaudited

(Amounts in thousands, except per share data)


     March 31,   March 31,
     2022   2021

Assets


Current assets:


Cash and cash equivalents

     $ 14,741         $ 59,532    

Investments

     -       5,500  

Trade accounts receivable, net of allowances ($87 and $29 at March 31, 2022 and 2021, respectively)

     27,645       17,378  

Unbilled revenue

     25,570       19,994  

Inventories

     17,414       17,332  

Prepaid expenses and other current assets

     1,391       512  

Income taxes receivable

     459       -  


Total current assets

     87,220       120,248  

Property, plant and equipment, net

     24,884       17,618  

Prepaid pension asset

     7,058       6,216  

Operating lease assets

     8,394       95  

Goodwill

     23,523       -  

Customer relationships

     11,308       -  

Technology and technical know-how

     9,679       -  

Other intangible assets, net

     8,990       -  

Deferred income tax asset

     2,441       -  

Other assets

     194       103  


Total assets

     $ 183,691       $ 144,280  


Liabilities and stockholders’ equity


Current liabilities:


Current portion of long-term debt

     $ 2,000       $ -  

Current portion of finance lease obligations

     23       21  

Accounts payable

     16,662       17,972  

Accrued compensation

     7,991       6,106  

Accrued expenses and other current liabilities

     6,047       4,628  

Customer deposits

     25,644       14,059  

Operating lease liabilities

     1,057       46  

Income taxes payable

     -       741  


Total current liabilities

     59,424       43,573  

Long-term debt

     16,378       -  

Finance lease obligations

     11       34  

Operating lease liabilities

     7,460       37  

Deferred income tax liability

     62       635  

Accrued pension and postretirement benefit liabilities

     1,666       2,072  

Other long-term liabilities

     2,196       -  


Total liabilities

     87,197       46,351  


Stockholders’ equity:


Preferred stock, $1.00 par value, 500 shares authorized

     -       -  

Common stock, $0.10 par value, 25,500 shares authorized,
10,801 and 10,748 shares issued and 10,636 and 9,959 shares
outstanding at March 31, 2022 and 2021, respectively

     1,080       1,075  

Capital in excess of par value

     27,770       27,272  

Retained earnings

     77,076       89,372  

Accumulated other comprehensive loss

     (6,471     (7,397

Treasury stock (164 and 790 shares at March 31, 2022 and 2021, respectively)

     (2,961     (12,393


Total stockholders’ equity

     96,494       97,929  


Total liabilities and stockholders’ equity

     $ 183,691       $ 144,280  


-MORE-


Graham Corporation Reports Fiscal 2022 Fourth Quarter and Full Year Results

June 8, 2022

Page 10 of 13


Graham Corporation

Consolidated Statements of Cash Flows – Unaudited

(Amounts in thousands)


     Year Ended
     March 31,
     2022   2021

Operating activities:


Net (loss) income

     $ (8,773 )       $ 2,374    

Adjustments to reconcile net (loss) income to net cash (used) provided by operating activities:


Depreciation

     3,077       1,945  

Amortization

     2,522       -  

Amortization of actuarial losses

     996       1,066  

Goodwill and other impairments

       184  

Equity-based compensation expense

     809       864  

Gain on disposal or sale of property, plant and equipment

     23       2  

Change in fair value of contingent consideration

     (1,900     -  

Deferred income taxes

     (3,233     (561

(Increase) decrease in operating assets:


Accounts receivable

     (2,055     (1,791

Unbilled revenue

     1,550       (5,298

Inventories

     3,483       5,185  

Prepaid expenses and other current and non-current assets

     (340     416  

Income taxes receivable

     (1,208     1,215  

Operating lease assets

     1,059       155  

Prepaid pension asset

     (1,207     (841

Increase (decrease) in operating liabilities:


Accounts payable

     (3,238     3,556  

Accrued compensation, accrued expenses and other current and non-current liabilities

     1,164       3,101  

Customer deposits

     5,523       (13,206

Operating lease liabilities

     (962     (158

Long-term portion of accrued compensation, accrued pension liability and accrued postretirement benefits

     491       70  


Net cash used by operating activities

     (2,219     (1,722


Investing activities:


Purchase of property, plant and equipment

     (2,324     (2,158

Proceeds from disposal of property, plant and equipment

     -       7  

Purchase of investments

     -       (42,603

Redemption of investments at maturity

     5,500       77,151  

Acquisition of Barber-Nichols, LLC

     (60,282     -  


Net cash (used) provided by investing activities

     (57,106     32,397  


Financing activities:


Principal repayments on debt

     (39,750     (4,599

Proceeds from the issuance of debt

     58,250       4,599  

Principal repayments on finance lease obligations

     (21     (40

Repayments on lease financing obligations

     (225     -  

Payment of debt issuance costs

     (271     -  

Dividends paid

     (3,523     (4,391

Purchase of treasury stock

     (41     (23


Net cash provided (used) by financing activities

     14,419       (4,454


Effect of exchange rate changes on cash

     115       356  


Net (decrease) increase in cash and cash equivalents

     (44,791     26,577  

Cash and cash equivalents at beginning of period

     59,532       32,955  


Cash and cash equivalents at end of period

     $ 14,741       $ 59,532  


-MORE-


Graham Corporation Reports Fiscal 2022 Fourth Quarter and Full Year Results

June 8, 2022

Page 11 of 13


Graham Corporation

Adjusted EBITDA Reconciliation - Unaudited

($ in thousands)


     Three Months Ended
March 31,
   Year Ended
March 31,
 
     2022    2021      2022      2021  

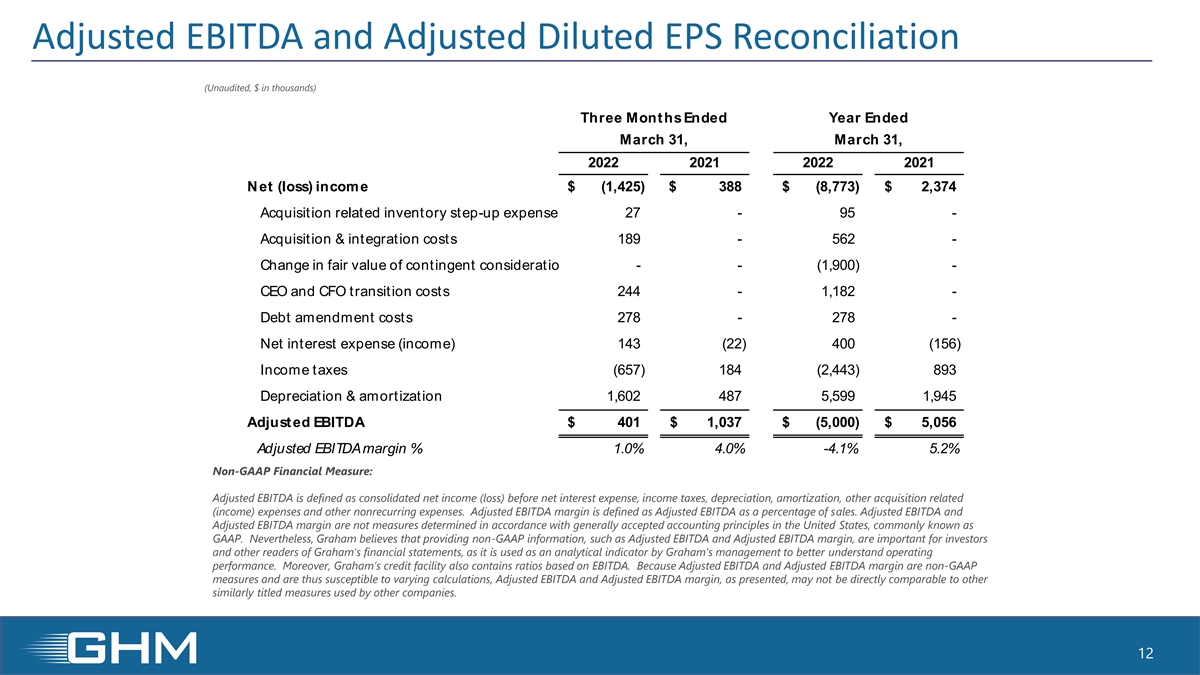
Net (loss) income

     $ (1,425)         $ 388           $ (8,773)         $ 2,374    

Acquisition related inventory step-up expense

     27          -          95          -    

Acquisition & integration costs

     189          -          562          -    

Change in fair value of contingent consideration

     -          -          (1,900)         -    

CEO and CFO transition costs

     244          -          1,182          -    

Debt amendment costs

     278          -          278          -    

Net interest expense (income)

     143          (22)         400          (156)   

Income taxes

     (657)         184          (2,443)         893    

Depreciation & amortization

     1,602          487          5,599          1,945    


Adjusted EBITDA

     $ 401          $ 1,037          $ (5,000)         $ 5,056    


Adjusted EBITDA margin %

     1.0%         4.0%         -4.1%         5.2%   

Adjusted Net Income and Adjusted Diluted (Loss) Earnings per Share Reconciliation -  Unaudited

($ in thousands, except per share amounts)


     Three Months Ended
March 31,
   Year Ended
March 31,
 
     2022    2021      2022      2021  

Net (loss) income

     $ (1,425)         $ 388          $ (8,773)         $ 2,374    

Acquisition related inventory step-up expense

     27          -          95          -    

Acquisition & integration costs

     189          -          562          -    

Amortization of intangible assets

     757          -          2,522          -    

Change in fair value of contingent consideration

     -          -          (1,900)         -    

CEO and CFO transition costs

     244          -          1,182          -    

Debt amendment costs

     278          -          278          -    

Normalize tax rate to 20%(1)

     (299)         -          (548)         -    


Adjusted net (loss) income

     $ (229)         $ 388          $ (6,582)         $ 2,374    


Adjusted diluted (loss) earnings per share

     $ (0.02)         $ 0.04          $ (0.62)         $ 0.24    

1) Applies a normalized tax rate of 20% to non-GAAP adjustments above, which are each pre-tax.

Non-GAAP Financial Measures:

Adjusted EBITDA is defined as consolidated net (loss) income before net interest expense, income taxes, depreciation, amortization, other acquisition related expenses, and other nonrecurring expenses. Adjusted EBITDA


-MORE-


Graham Corporation Reports Fiscal 2022 Fourth Quarter and Full Year Results

June 8, 2022

Page 12 of 13


margin is defined as Adjusted EBITDA as a percentage of sales. Adjusted EBITDA and Adjusted EBITDA margin are not measures determined in accordance with generally accepted accounting principles in the United States, commonly known as GAAP. Nevertheless, Graham believes that providing non-GAAP information, such as Adjusted EBITDA and Adjusted EBITDA margin, is important for investors and other readers of Graham’s financial statements, as it is used as an analytical indicator by Graham’s management to better understand operating performance. Moreover, Graham’s credit facility also contains ratios based on EBITDA. Because Adjusted EBITDA and Adjusted EBITDA margin are non-GAAP measures and are thus susceptible to varying calculations, Adjusted EBITDA and Adjusted EBITDA margin, as presented, may not be directly comparable to other similarly titled measures used by other companies.

Adjusted net income and adjusted diluted (loss) earnings per share are defined as net income and diluted (loss) earnings per share as reported, adjusted for certain items and at a normalized tax rate. Adjusted net income and adjusted diluted (loss) earnings per share are not measures determined in accordance with GAAP, and may not be comparable to the measures as used by other companies. Nevertheless, Graham believes that providing non-GAAP information, such as adjusted net income and adjusted diluted (loss) earnings per share, is important for investors and other readers of the Company’s financial statements and assists in understanding the comparison of the current quarter’s and current fiscal year’s net income and diluted (loss) earnings per share to the historical periods’ net income and diluted (loss) earnings per share. Graham also believes that adjusted (loss) earnings per share, which adds back intangible amortization expense related to acquisitions, provides a better representation of the cash earnings of the Company.

Graham Corporation

Additional Information – Unaudited

($ in millions)


ORDERS BY INDUSTRY FY 2022*


     Q1     % of     Q2     % of     Q3     % of     Q4     % of     FY2022     % of  
      6/30/21       Total         9/30/21       Total         12/31/21       Total         3/31/22       Total                  Total      

Refining

   $ 11.4       55%     $ 5.0       16%     $ 8.4       12%     $ 3.6       15%     $ 28.4       20%  

Chemical/ Petrochemical

   $ 3.4       16%     $ 6.1       19%     $ 6.2       9%     $ 6.5       28%     $ 22.1       15%  

Defense

   $ 2.4       12%     $ 12.4       40%     $ 45.6       67%     $ 2.8       12%     $ 63.2       44%  

Space

   $ -       0%     $ 2.4       8%     $ 2.9       4%     $ 5.4       23%     $ 10.6       7%  

Other Commercial

   $ 3.6       17%     $ 5.6       17%     $ 5.0       8%     $ 5.5       22%     $ 19.6       14%  

Total

   $ 20.9             $ 31.4             $ 68.0             $ 23.7             $ 143.9          

ORDERS BY INDUSTRY FY 2021*


     Q1     % of     Q2     % of     Q3     % of     Q4     % of     FY2021     % of  
      6/30/20     Total     9/30/20     Total     12/31/20     Total     3/31/21     Total            Total  

Refining

   $ 8.7       76%     $ 16.8       48%     $ 3.2       5%     $ 2.4       17%     $ 31.0       26%  

Chemical/ Petrochemical

   $ 1.6       14%     $ 3.3       9%     $ 4.6       7%     $ 2.7       20%     $ 12.3       10%  

Defense

   $ (1.2     -10%     $ 12.6       36%     $ 52.3       85%     $ 5.4       41%     $ 69.2       57%  

Other Commercial

   $ 2.4       20%     $ 2.3       7%     $ 1.7       3%     $ 2.9       22%     $ 9.1       7%  

Total

   $ 11.5             $ 35.0             $ 61.8             $ 13.4             $  121.6          
*Quarters may not sum to year-to-date/total fiscal year due to rounding.


-MORE-


Graham Corporation Reports Fiscal 2022 Fourth Quarter and Full Year Results

June 8, 2022

Page 13 of 13


Graham Corporation

Additional Information – Unaudited

($ in millions)


SALES BY INDUSTRY FY 2022*


     Q1      % of     Q2      % of     Q3      % of     Q4      % of     FY2022      % of  
      6/30/21        Total         9/30/21        Total         12/31/21        Total         3/31/22        Total                   Total      

Refining

   $ 4.6        23%     $ 6.3        19%     $ 4.0        14%     $ 9.5        24%     $ 24.4        20%  

Chemical/ Petrochemical

   $ 4.6        23%     $ 3.5        10%     $ 3.0        11%     $ 4.9        12%     $ 16.0        13%  

Defense

   $ 7.1        35%     $ 19.8        58%     $ 16.6        58%     $ 18.7        47%     $ 62.2        51%  

Space

   $ 0.7        4%     $ 1.3        4%     $ 1.5        5%     $ 2.2        6%     $ 5.7        5%  

Other Commercial

   $ 3.2        15%     $ 3.2        9%     $ 3.7        12%     $ 4.4        11%     $ 14.5        13%  

Total

   $ 20.2              $ 34.1              $ 28.8              $ 39.7              $ 122.8           

SALES BY INDUSTRY FY 2021*


     Q1      % of     Q2      % of     Q3      % of     Q4      % of     FY2021      % of  
      6/30/20      Total     9/30/20      Total     12/31/20      Total     3/31/21      Total             Total  

Refining

   $ 2.7        16%     $ 10.3        37%     $ 16.5        60%     $ 10.3        40%     $ 39.7        41%  

Chemical/ Petrochemical

   $ 8.0        48%     $ 5.5        20%     $ 4.8        18%     $ 5.8        23%     $ 24.0        24%  

Defense

   $ 3.5        21%     $ 9.4        34%     $ 4.5        17%     $ 6.5        25%     $ 24.0        25%  

Other Commercial

   $ 2.5        15%     $ 2.8        10%     $ 1.4        5%     $ 3.1        12%     $ 9.8        10%  

Total

   $ 16.7              $ 28.0              $ 27.2              $ 25.7              $ 97.5           

SALES BY REGION FY 2022*


     Q1      % of     Q2      % of     Q3      % of     Q4      % of     FY2022      % of  
      6/30/21      Total     9/30/21      Total     12/31/21      Total     3/31/22      Total             Total  

United States

   $ 13.9        69%     $ 26.2        77%     $ 24.7        86%     $ 32.8        83%     $ 97.6        80%  

Middle East

   $ 0.6        3%     $ 1.0        3%     $ 0.6        2%     $ 0.3        1%     $ 2.5        2%  

Asia

   $ 3.5        17%     $ 5.5        16%     $ 1.5        5%     $ 3.3        8%     $ 13.8        11%  

Other

   $ 2.2        11%     $ 1.4        4%     $ 2.0        7%     $ 3.3        8%     $ 8.9        7%  

Total

   $ 20.2              $ 34.1              $ 28.8              $ 39.7              $  122.8           

SALES BY REGION FY 2021*


     Q1      % of     Q2      % of     Q3      % of     Q4      % of     FY2021      % of  
      6/30/20      Total     9/30/20      Total     12/31/20      Total     3/31/21      Total             Total  

United States

   $ 9.4        56%     $ 17.3        62%     $ 10.7        39%     $ 15.3        60%     $ 52.7        54%  

Middle East

   $ 0.4        3%     $ 1.0        4%     $ 0.8        3%     $ 2.6        10%     $ 4.8        5%  

Asia

   $ 5.2        31%     $ 4.5        16%     $ 11.2        41%     $ 4.7        18%     $ 25.6        26%  

Other

   $ 1.7        10%     $ 5.2        18%     $ 4.5        17%     $ 3.1        12%     $ 14.4        15%  

Total

   $ 16.7              $ 28.0              $ 27.2              $ 25.7              $ 97.5           
*Quarters may not sum to year-to-date/total fiscal year due to rounding.


###
Exhibit 99.2 G r a h a m C o r p o r a t i o n Q4 FY2022 Teleconference June 9, 2022 Daniel J. Thoren, President and Chief Executive Officer Christopher J. Thome, Vice President - Finance and Chief Financial Officer www.GrahamCorp.com


Safe Harbor Statement This presentation contains forward-looking statements within the meaning of Section 27A of the Securities Act of 1933, as amended, and Section 21E of the Securities Exchange Act of 1934, as amended. Forward-looking statements are subject to risks, uncertainties and assumptions and are identified by words such as “expects,” “estimates,” “outlook,” “anticipates,” “believes,” “implies”, “could,” “opportunities,” “plans,” ”may,” “will,” and other similar words. All statements addressing operating performance, events, or developments that Graham Corporation expects or anticipates will occur in the future, including but not limited to, its dividend, any future waivers of financial covenants or compliance with the terms of its credit agreements, any amendments to its credit facility, its ability and the timing needed to address challenges in its defense business, including at the Batavia, NY operations, profitability of future projects, the development and impact of better documentation of build processes and pricing models, its ability to meet customers’ delivery expectations, the future impact of low margin defense projects and related cost overruns, anticipated capital contributions, the future expected contributions of BN, expected expansion and growth opportunities within its domestic and international markets, anticipated revenue, margins, adjusted EBITDA, adjusted EBITDA margins, and SG&A expenses, the timing of conversion of backlog to sales, market presence, profit margins, tax rates, foreign sales operations, its ability to improve cost competitiveness and productivity, customer preferences, changes in market conditions in the industries in which it operates, labor constraints, the effect on its business of volatility in commodities prices, including, but not limited to, changes in general economic conditions and customer behavior, forecasts regarding the timing and scope of the economic recovery in its markets, its acquisition and growth strategy and its operations in China, India and other international locations, are forward-looking statements. Because they are forward-looking, they should be evaluated in light of important risk factors and uncertainties. These risk factors and uncertainties are more fully described in Graham Corporation’s most recent Annual Report filed with the Securities and Exchange Commission, included under the heading entitled “Risk Factors.” Should one or more of these risks or uncertainties materialize or should any of Graham Corporation’s underlying assumptions prove incorrect, actual results may vary materially from those currently anticipated. In addition, undue reliance should not be placed on Graham Corporation’s forward-looking statements. Except as required by law, Graham Corporation disclaims any obligation to update or publicly announce any revisions to any of the forward-looking statements contained in this presentation. Use of Forward-Looking Non-GAAP Financial Measures Forward-looking adjusted EBITDA, adjusted EBITDA margin and adjusted diluted earnings per share are non-GAAP measures. The Company is unable to present a quantitative reconciliation of these forward-looking non-GAAP financial measures to their most directly comparable forward-looking GAAP financial measures because such information is not available, and management cannot reliably predict the necessary components of such GAAP measures without unreasonable effort largely because forecasting or predicting our future operating results is subject to many factors out of our control or not readily predictable. In addition, the Company believes that such reconciliations would imply a degree of precision that would be confusing or misleading to investors. The unavailable information could have a significant impact on the Company’s fiscal 2023 and future financial results. These non-GAAP financial measures are preliminary estimates and are subject to risks and uncertainties, including, among others, changes in connection with purchase accounting, quarter-end and year-end adjustments. Any variation between the Company’s actual results and preliminary financial data set forth in this presentation may be material. 2


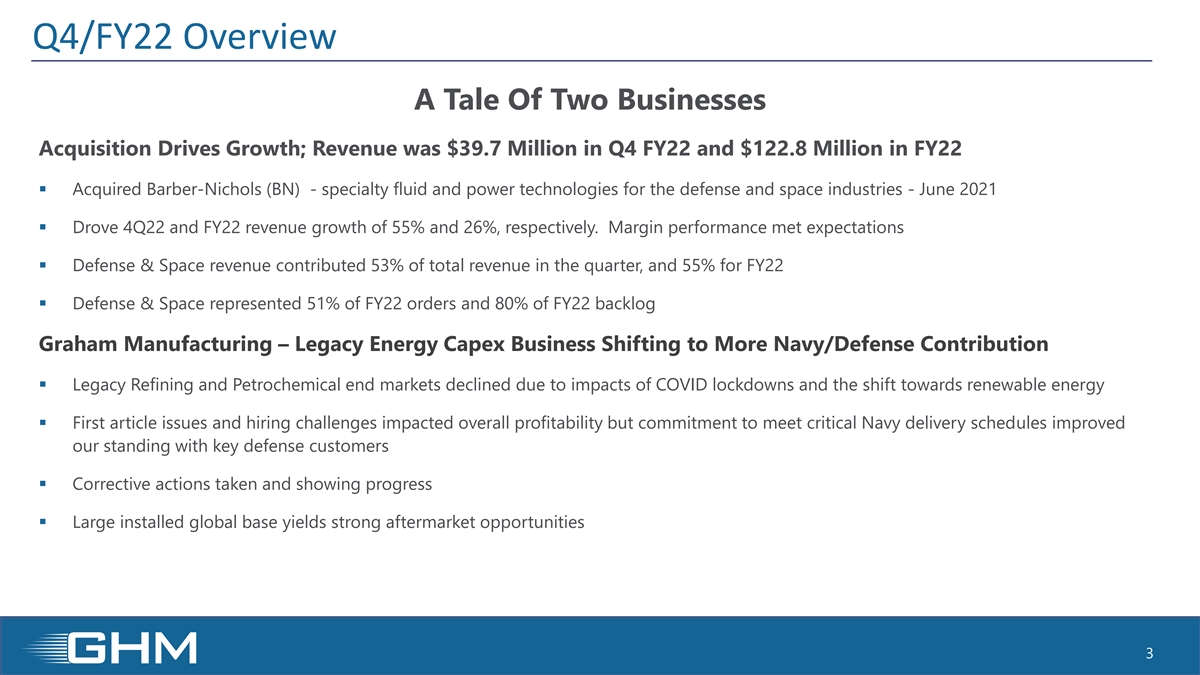
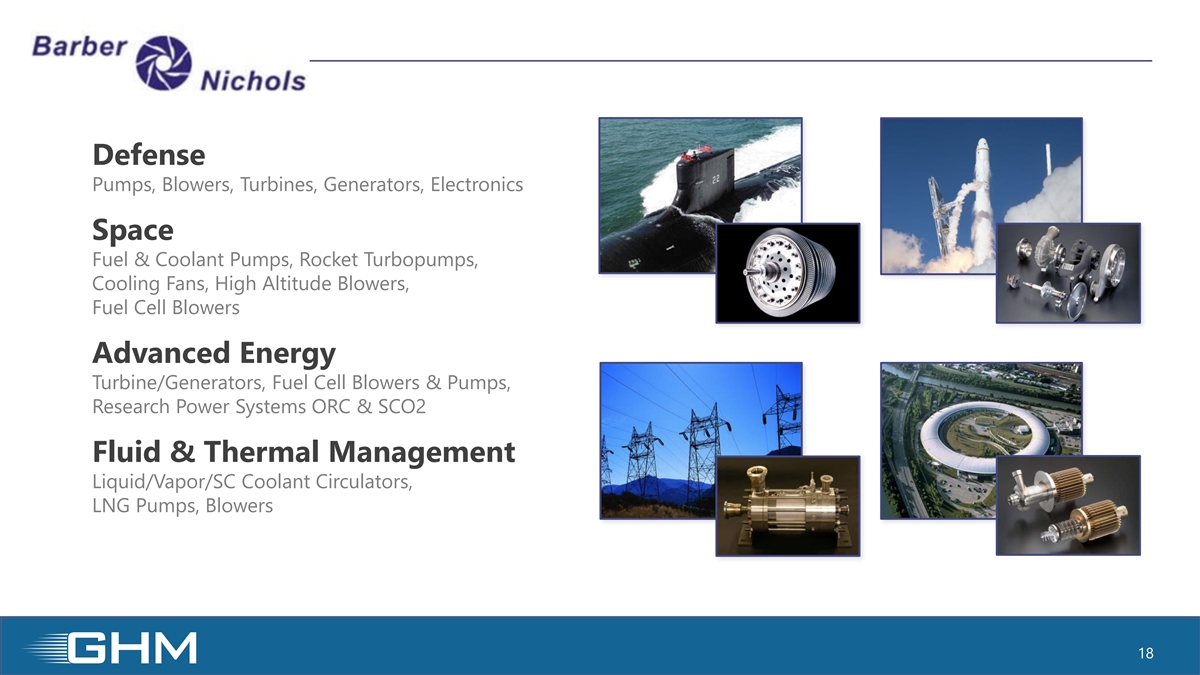
Q4/FY22 Overview A Tale Of Two Businesses Acquisition Drives Growth; Revenue was $39.7 Million in Q4 FY22 and $122.8 Million in FY22 ▪ Acquired Barber-Nichols (BN) - specialty fluid and power technologies for the defense and space industries - June 2021 ▪ Drove 4Q22 and FY22 revenue growth of 55% and 26%, respectively. Margin performance met expectations ▪ Defense & Space revenue contributed 53% of total revenue in the quarter, and 55% for FY22 ▪ Defense & Space represented 51% of FY22 orders and 80% of FY22 backlog Graham Manufacturing – Legacy Energy Capex Business Shifting to More Navy/Defense Contribution ▪ Legacy Refining and Petrochemical end markets declined due to impacts of COVID lockdowns and the shift towards renewable energy ▪ First article issues and hiring challenges impacted overall profitability but commitment to meet critical Navy delivery schedules improved our standing with key defense customers ▪ Corrective actions taken and showing progress ▪ Large installed global base yields strong aftermarket opportunities 3


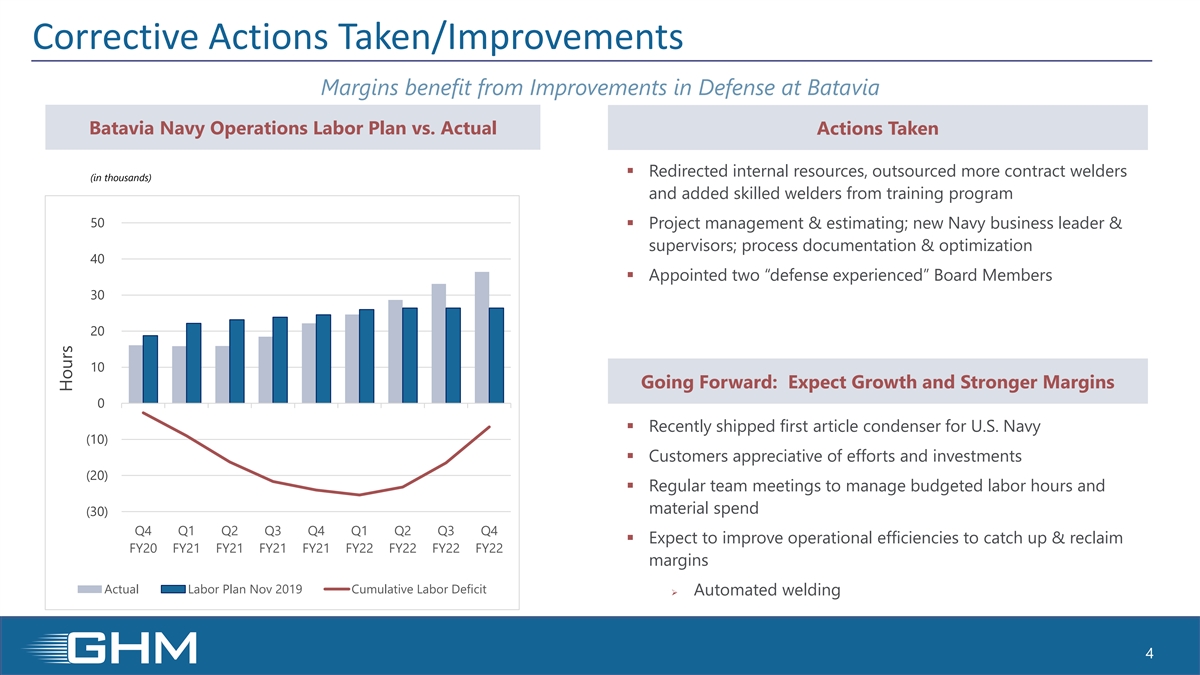
Corrective Actions Taken/Improvements Margins benefit from Improvements in Defense at Batavia Batavia Navy Operations Labor Plan vs. Actual Actions Taken ▪ Redirected internal resources, outsourced more contract welders (in thousands) and added skilled welders from training program 50 ▪ Project management & estimating; new Navy business leader & supervisors; process documentation & optimization 40 ▪ Appointed two “defense experienced” Board Members 30 20 10 Going Forward: Expect Growth and Stronger Margins 0 ▪ Recently shipped first article condenser for U.S. Navy (10) ▪ Customers appreciative of efforts and investments (20) ▪ Regular team meetings to manage budgeted labor hours and material spend (30) Q4 Q1 Q2 Q3 Q4 Q1 Q2 Q3 Q4 ▪ Expect to improve operational efficiencies to catch up & reclaim FY20 FY21 FY21 FY21 FY21 FY22 FY22 FY22 FY22 margins Actual Labor Plan Nov 2019 Cumulative Labor Deficit ➢ Automated welding 4 Hours


Q4 FY22: Sequential Improvements ($ in millions, except per share data) (1) Diluted EPS and Adjusted Diluted EPS Sales $0.04 $0.04 $39.7 ($0.35) ($0.02) $28.8 $25.7 ($0.27) $(0.13) Q4 FY21 Q3 FY22 Q4 FY22 6.7% Q4 FY21 Q3 FY22 Q4 FY22 Diluted EPS Adjusted Diluted EPS (1) Sales increased $14.0 million, or 55% over Q4 FY21 Adjusted EBITDA and Margin Gross Margin + $15.9 million of sales from BN + 47% of sales, or $18.7 million, to the defense industry $1.0 $5.0 $0.4 $4.2 4.0% + New space industry contributed $2.2 million 1.0% + Commercial aftermarket sales up 8% sequentially (9.0%) - Lower petrochemical and refining sales 10.6% 19.4% 1.0% $0.6 ($2.6) Margin and profitability impacts: 1.9% Q4 21 Q3 22 Q4 22 - Higher-than-expected costs related to Batavia defense Q4 FY21 Q3 FY22 Q4 FY22 operations + Resources deployed to address delivery expectations (1) See supplemental slides for additional important disclosures regarding Graham’s use of the non-GAAP measures of Adjusted EBITDA, Adjusted EBITDA margin and Adjusted diluted EPS as well as the reconciliation of net income/(loss) to Adjusted EBITDA, and diluted EPS to Adjusted diluted EPS. 5


FY2022: Strategic Diversification into Defense ($ in millions, except per share data) (1) Sales Adjusted EBITDA and Margin $5.1 $122.8 5.2% $97.5 $(5.0) (4.1%) FY 2021 FY 2022 FY 2021 FY 2022 Sales increased 26% driven by defense industry + $47.9 million of sales from BN; 51% of revenue related to (1) Gross Margin Diluted EPS & Adjusted Diluted EPS defense industry, up 2.6x + Space became a meaningful contributor $20.5 + Commercial aftermarket orders and sales expanded – $0.24 $0.24 leading indicator of future energy capex ($0.62) $9.1 - Lower petrochemical and refining sales – primarily in Asia 21.0% 7.4% ($0.83) Margin and profitability impacts: FY 2021 FY 2022 - Timing of lower margin defense projects FY 2021 FY 2022 Diluted EPS Adjusted Diluted EPS + Space became a meaningful contributor (1) See supplemental slides for additional important disclosures regarding Graham’s use of the non-GAAP measures of Adjusted EBITDA, Adjusted EBITDA margin and Adjusted diluted EPS as well as the reconciliation of net income/(loss) + Increase in commercial aftermarket sales to Adjusted EBITDA and diluted EPS to Adjusted diluted EPS. 6


New Lending Agreement in Place ▪ Cash flow from operations were $12.3 million in CAPITALIZATION fourth quarter FY22 ($ in millions) March 31, December 31, 2022 2021▪ Paid down $10.4 million in debt in Q4 Cash and cash equivalents $14.7 $14.0 ▪ Capital expenditures of $2.3 million for the fiscal year period Total debt 18.4 28.8 Stockholders’ equity 96.5 97.5 ➢ Capex for FY23 expected to be $4.5 million to $5.5 million to support growth initiatives Total capitalization $114.9 $126.3 ▪ Revised lending agreement expanded letters of Debt / total capitalization 16.0% 22.8% credit and covenant ratios ➢ Expect to achieve compliance with original terms at end of FY23 7


Market Diversity Solidifies Long-Term Outlook ($ in millions) Orders FY 2022 Orders : $143.9 million Space $68.0 7% Other 14% Defense 44% Chem/ Petrochem 15% $45.6 $31.4 Refining 20% $23.7 $20.9 $12.4 $2.8 $2.4 Orders – Sequential Ebb and Flow $13.4 ▪ 4Q22 defense orders down sequentially reflecting timing of $22.4 $5.4 $20.9 $19.0 $18.5 project releases $8.0 ▪ Solid growth in Space orders Q4 FY21 Q1 FY22 Q2 FY22 Q3 FY22 Q4 FY22 ▪ Chemical/petrochemical orders have stabilized over the past three quarters Quarterly Net Orders (excl. Defense) Defense Orders ▪ Refining declined sequentially but are up 50% YoY Totals shown in graph may not equal the sum of the segments due to rounding 8


Strong Defense Backlog ($ in millions) (1) Total Backlog FY 2022 Backlog : By Industry Space 4% Chem/Petrochem 5% $272.6 Other 5% $256.5 $235.9 $233.2 Refining 10% Defense $210.1 $194.8 76% $137.6 $181.3 $188.5 $104.1 Reducing Cyclicality with Increasing Defense Backlog ▪ 40% - 50% expected to convert within 12 months $62.5 $61.7 $51.9 $47.4 $33.5 ▪ Most orders converting beyond twelve months are defense- related Q4 FY21 Q1 FY22 Q2 FY22 Q3 FY22 Q4 FY22 ▪ 6% decline from 3Q22 reflects backlog released for delivery Quarterly Net Orders (excl. Defense) Defense Orders (1) Backlog is defined as the total dollar value of orders received for which revenue has not yet been recognized Totals shown in graph may not equal the sum of the segments due to rounding 9


(1) Graham Fiscal 2023 Guidance Revenue: $135 million to $150 million Gross margin: 16% to 17% SG&A: 15% to 16% of sales (2) Adjusted EBITDA : $6.5 million to $9.5 million, adjusted (2) EBITDA margin of approximately 5% to 6% (1) FY2023 guidance as of June 8, 2022 The revenue, gross margin, SG&A, adjusted EBITDA and capital expenditure expectations for fiscal 2023 are based on the assumption that Graham (2) Adjusted EBITDA and Adjusted EBITDA margin are non-GAAP measures. See Use of Forward-Looking Non-GAAP will be able to operate its production facility at planned capacity, has access to its Financial Measures on Slide 2 for more information global supply chain including its subcontractors, and does not experience significant COVID-19-related disruptions or any other unforeseen events. 10


Supplemental Information


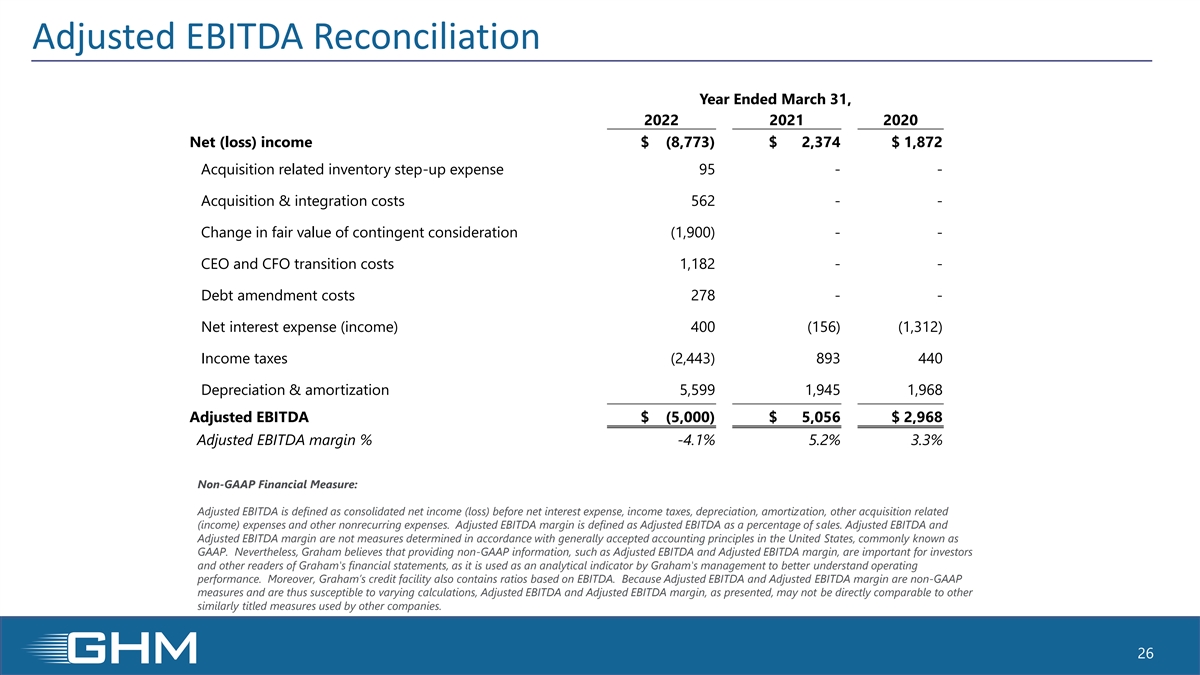
Adjusted EBITDA and Adjusted Diluted EPS Reconciliation (Unaudited, $ in thousands) Three Months Ended Year Ended March 31, March 31, 2022 2021 2022 2021 Net (loss) income $ (1,425) $ 388 $ (8,773) $ 2,374 Acquisition related inventory step-up expense 27 - 95 - Acquisition & integration costs 189 - 562 - Change in fair value of contingent consideration - - (1,900) - CEO and CFO transition costs 244 - 1,182 - Debt amendment costs 278 - 278 - Net interest expense (income) 143 (22) 400 ( 156) Income taxes ( 657) 184 ( 2,443) 893 Depreciation & amortization 1,602 487 5,599 1 ,945 Adjusted EBITDA $ 401 $ 1 ,037 $ (5,000) $ 5 ,056 Adjusted EBITDA margin % 1.0% 4.0% -4.1% 5.2% Non-GAAP Financial Measure: Adjusted EBITDA is defined as consolidated net income (loss) before net interest expense, income taxes, depreciation, amortization, other acquisition related (income) expenses and other nonrecurring expenses. Adjusted EBITDA margin is defined as Adjusted EBITDA as a percentage of sales. Adjusted EBITDA and Adjusted EBITDA margin are not measures determined in accordance with generally accepted accounting principles in the United States, commonly known as GAAP. Nevertheless, Graham believes that providing non-GAAP information, such as Adjusted EBITDA and Adjusted EBITDA margin, are important for investors and other readers of Graham's financial statements, as it is used as an analytical indicator by Graham's management to better understand operating performance. Moreover, Graham’s credit facility also contains ratios based on EBITDA. Because Adjusted EBITDA and Adjusted EBITDA margin are non-GAAP measures and are thus susceptible to varying calculations, Adjusted EBITDA and Adjusted EBITDA margin, as presented, may not be directly comparable to other similarly titled measures used by other companies. 12


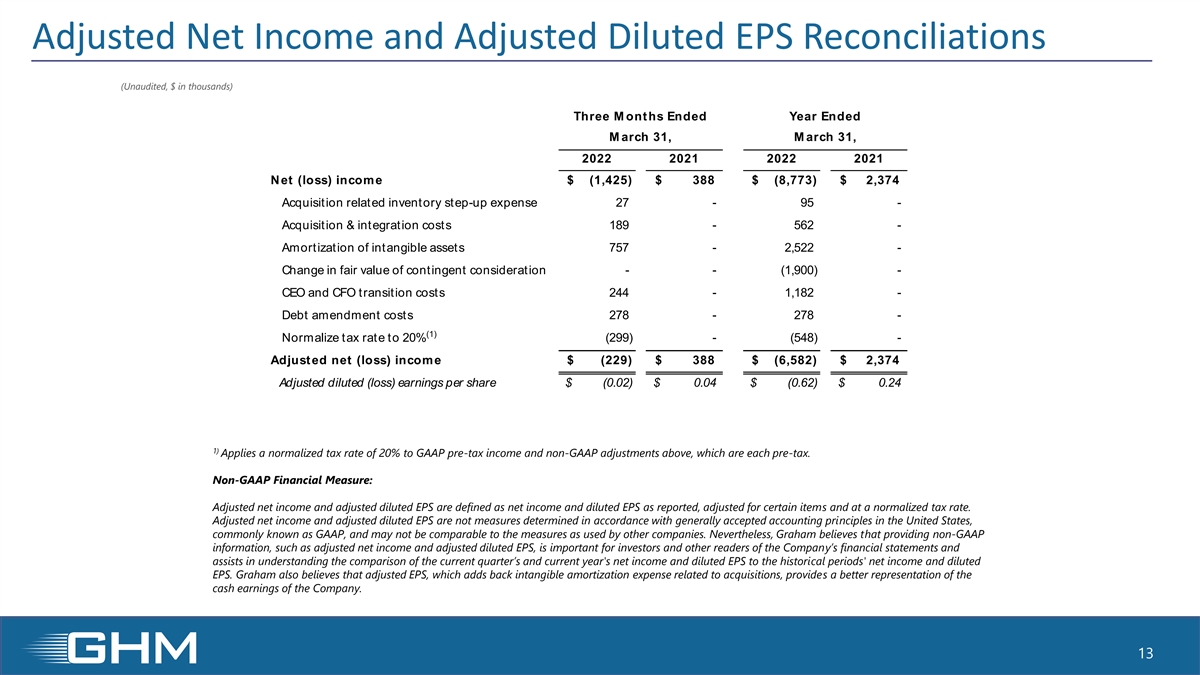
Adjusted Net Income and Adjusted Diluted EPS Reconciliations (Unaudited, $ in thousands) Three M onths Ended Year Ended M arch 31, M arch 31, 2022 2021 2022 2021 Net (loss) income $ (1,425) $ 388 $ (8,773) $ 2 ,374 Acquisition related inventory step-up expense 27 - 95 - Acquisition & integration costs 189 - 562 - Amortization of intangible assets 757 - 2,522 - Change in fair value of contingent consideration - - (1,900) - CEO and CFO transition costs 244 - 1,182 - Debt amendment costs 278 - 278 - (1) Normalize tax rate to 20% (299) - (548) - Adjusted net (loss) income $ (229) $ 388 $ (6,582) $ 2,374 Adjusted diluted (loss) earnings per share $ (0.02) $ 0.04 $ (0.62) $ 0.24 1) Applies a normalized tax rate of 20% to GAAP pre-tax income and non-GAAP adjustments above, which are each pre-tax. Non-GAAP Financial Measure: Adjusted net income and adjusted diluted EPS are defined as net income and diluted EPS as reported, adjusted for certain items and at a normalized tax rate. Adjusted net income and adjusted diluted EPS are not measures determined in accordance with generally accepted accounting principles in the United States, commonly known as GAAP, and may not be comparable to the measures as used by other companies. Nevertheless, Graham believes that providing non-GAAP information, such as adjusted net income and adjusted diluted EPS, is important for investors and other readers of the Company’s financial statements and assists in understanding the comparison of the current quarter’s and current year's net income and diluted EPS to the historical periods' net income and diluted EPS. Graham also believes that adjusted EPS, which adds back intangible amortization expense related to acquisitions, provides a better representation of the cash earnings of the Company. 13

Exhibit 99.3


LOGO   News Release


Graham Corporation ¨ 20 Florence Avenue ¨ Batavia, NY 14020

IMMEDIATE RELEASE

GRAHAM CORPORATION RELEASES NEW STRATEGIC PLAN

EXPECTED TO DRIVE ORGANIC GROWTH AND MARGIN EXPANSION


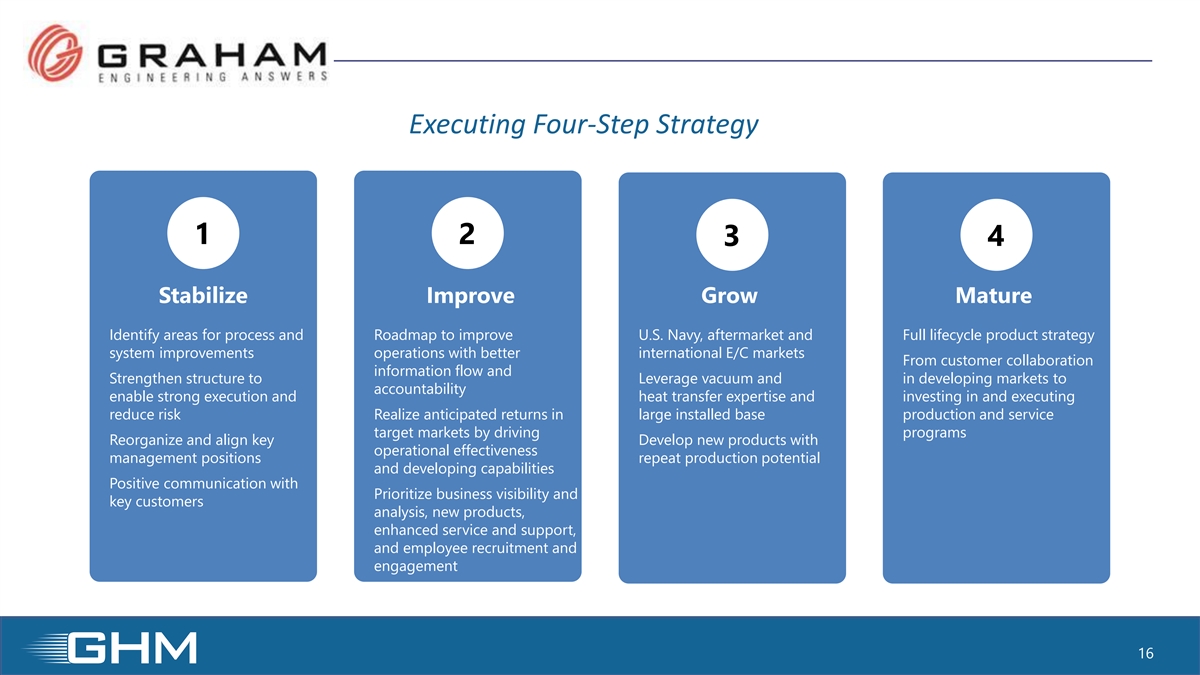
FIVE-YEAR STRATEGY ADVANCES PLANS TO GAIN TRACTION IN NEW MARKETS, INCREASE PENETRATION IN EXISTING MARKETS AND MATURE TO FULL LIFE CYCLE PRODUCT BUSINESS


TWO-PRONG APPROACH STRENGTHENS AND REDIRECTS LEGACY HEAT TRANSFER AND VACUUM TECHNOLOGY OPERATIONS AND INVESTS IN ADVANCEMENT OF NEW FLUID AND POWER TECHNOLOGIES BUSINESS

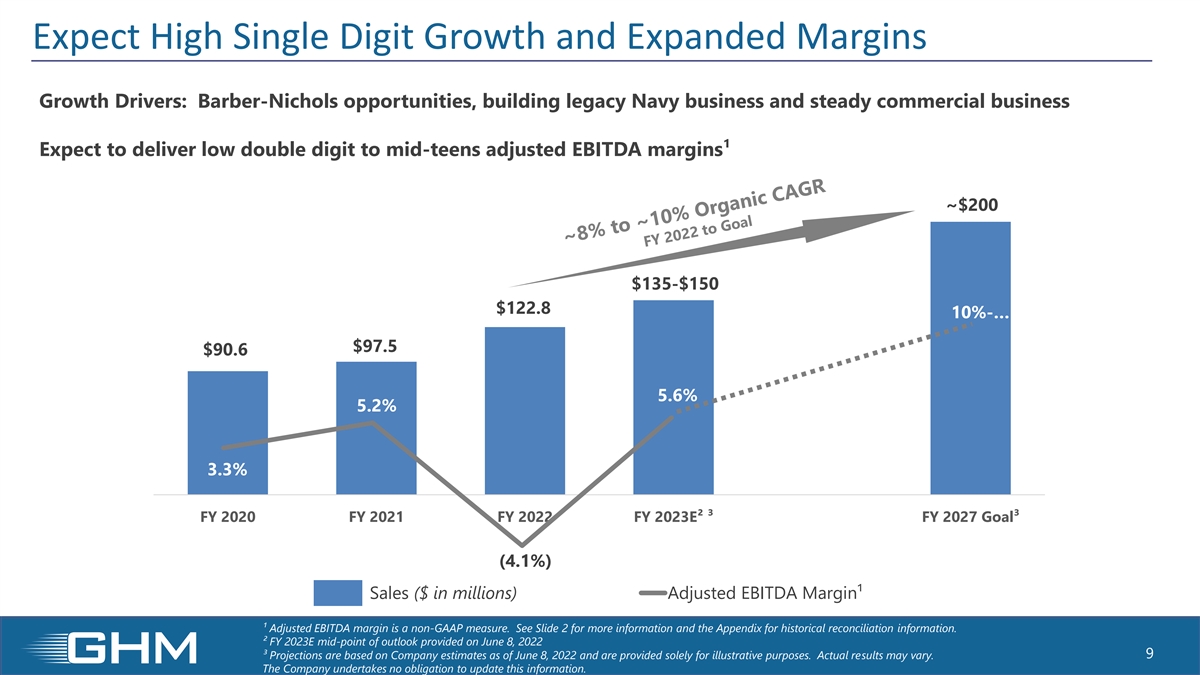
BATAVIA, NY, June 8, 2022 – Graham Corporation (NYSE: GHM), a global leader in the design and manufacture of mission critical fluid, power, heat transfer and vacuum technologies for the defense, space, energy and process industries, announced today its five-year strategic plan that is expected to drive high single digit revenue growth and low double digit to mid-teens adjusted EBITDA margins1.

Daniel J. Thoren, President and CEO, commented, “These are exciting times for Graham as we leverage our business acumen and operational strengths to build a scalable enterprise with stronger earnings potential. Our engineering expertise in complex fluid, power, heat transfer and vacuum systems technologies provides opportunities to expand our business and reach new customers. We have successfully transitioned into a diversified business with a solid defense industry base complemented by our well established refining and petrochemical industry presence. Importantly, we are gaining traction in the advanced energy, specifically hydrogen, and space markets as well.”

Grahams’ strategy takes a two-pronged approach to address the current status of its two operations, which are at different business cycle stages. The Batavia operation is focused on implementing improved processes, enhancing its team with new talent and increasing engagement to drive productivity, profitability and growth. To drive improvement, the Company is establishing a new business system centered on integration, accountability and transparency.

Mr. Thoren added, “Advancing this strategy for our heat transfer and vacuum technology business creates many opportunities for building a stable defense business providing critical equipment to the U.S. Navy while also rethinking how and where we go to market with our commercial products for our refining and petrochemical customers.

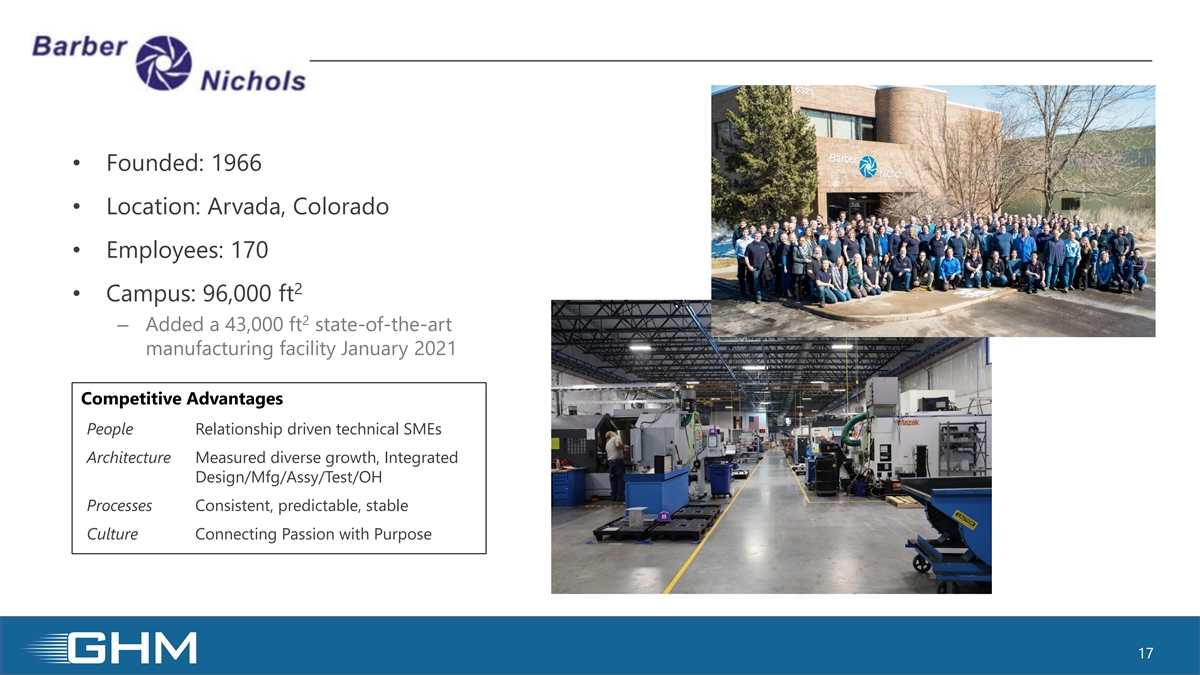
“The addition of Barber-Nichols (“BN”) last year was a step change for Graham, enabling a second prong to our strategy to enhance that business’s potential to gain greater market share, expand its product portfolio and address key markets with strong tailwinds.”


1 Forward looking adjusted EBITDA margin is a non-GAAP measure. See the note regarding forward looking non-GAAP measures at the end of this release.


Graham Corporation Releases New Strategic Plan Expected to Drive Organic Growth and Margin Expansion

June 8, 2022

Page 2 of 3


BN had evolved over the last ten years from a custom engineered, prototype manufacturer to a key provider of highly engineered solutions of critical equipment for higher volume applications. The Company believes this has created scalability, greatly improves margins and enables full product lifecycle support – from original design and development through aftermarket refurbishment and repair.

Mr. Thoren concluded, “We see similar potential in our legacy business to advance to a full product lifecycle model. Combined, we believe we have the potential to measurably grow over the next five years and deliver earnings at an even higher rate of growth. We believe this also establishes our platform and approach for further acquisitions and expansion in the future.”

Corporate Strategy and Financial Results Webinar

The Company will host a webinar to discuss its corporate strategy and fourth quarter and fiscal year 2022 financial results tomorrow, June 9, at 11:00 a.m. Eastern Time. Internet webcast link and accompanying slide presentations will be available here: https://ir.grahamcorp.com/.

A question-and-answer session will follow the presentations. Questions may be submitted through the webinar portal or, alternatively, a teleconference number will be provided to ask any questions live at the event.

A webcast replay will be available on the Company’s investor relations website, where a transcript will also be posted once available.

Safe Harbor Regarding Forward Looking Statements

This news release contains forward-looking statements within the meaning of Section 27A of the Securities Act of 1933, as amended, and Section 21E of the Securities Exchange Act of 1934, as amended.

Forward-looking statements are subject to risks, uncertainties and assumptions and are identified by words such as “expects,” “estimates,” “anticipates,” “believes,” “could,” “opportunities,” “potential,” “plan(s),” ”may,” and other similar words. All statements addressing operating performance, events, or developments that Graham Corporation expects or anticipates will occur in the future, including but not limited to, its ability and the timing needed to address challenges in its business, including at the Batavia, NY operations, profitability of future projects, the development and impact of improved processes, the evolution to a full life cycle product business, expected expansion and growth opportunities within its existing and new markets, anticipated revenue, earnings growth and the rate of such growth, adjusted EBITDA margins, profit margins, its ability to improve cost competitiveness and productivity, customer preferences, changes in market conditions in the industries in which it operates, its acquisition and growth strategy, are forward-looking statements. Because they are forward-looking, they should be evaluated in light of important risk factors and uncertainties. These risk factors and uncertainties are more fully described in Graham Corporation’s most recent Annual Report filed with the Securities and Exchange Commission, included under the heading entitled “Risk Factors.”


Graham Corporation Releases New Strategic Plan Expected to Drive Organic Growth and Margin Expansion

June 8, 2022

Page 3 of 3


Should one or more of these risks or uncertainties materialize or should any of Graham Corporation’s underlying assumptions prove incorrect, actual results may vary materially from those currently anticipated. In addition, undue reliance should not be placed on Graham Corporation’s forward-looking statements. Except as required by law, Graham Corporation disclaims any obligation to update or publicly announce any revisions to any of the forward-looking statements contained in this news release.

Forward-Looking Non-GAAP Measures

Forward looking adjusted EBITDA margin is a non-GAAP measures. The Company is unable to present a quantitative reconciliation of this forward-looking non-GAAP financial measure to its most directly comparable forward-looking GAAP financial measure because such information is not available, and management cannot reliably predict the necessary components of such GAAP measure without unreasonable effort largely because forecasting or predicting our future operating results is subject to many factors out of our control or not readily predictable. In addition, the Company believes that such reconciliation would imply a degree of precision that would be confusing or misleading to investors. The unavailable information could have a significant impact on the Company’s fiscal 2023 financial results. This non-GAAP financial measure is a preliminary estimate and is subject to risks and uncertainties, including, among others, changes in connection with purchase accounting, quarter-end and year-end adjustments. Any variation between the Company’s actual results and preliminary financial estimates set forth above may be material.

ABOUT GRAHAM CORPORATION

Graham is a global leader in the design and manufacture of mission critical fluid, power, heat transfer and vacuum technologies for the defense, space, energy and process industries. The Graham Manufacturing and Barber-Nichols’ global brands are built upon world-renowned engineering expertise in vacuum and heat transfer, cryogenic pumps and turbomachinery technologies, as well as its responsive and flexible service and the unsurpassed quality customers have come to expect from the Company’s products and systems.

Graham routinely posts news and other important information on its website, www.grahamcorp.com, where additional information on Graham Corporation and its businesses can be found.


FOR MORE INFORMATION, CONTACT:   
Christopher J. Thome    Deborah K. Pawlowski
Vice President - Finance and CFO    Kei Advisors LLC
Phone: (585) 343-2216    Phone: (716) 843-3908
   [email protected]

Exhibit 99.4 G r a h a m C o r p o r a t i o n Strategy Briefing June 9, 2022 Daniel J. Thoren, President and Chief Executive Officer Christopher J. Thome, Vice President – Finance and Chief Financial Officer www.GrahamCorp.com


Safe Harbor and Non-GAAP This presentation contains forward-looking statements within the meaning of Section 27A of the Securities Act of 1933, as amended, and Section 21E of the Securities Exchange Act of 1934, as amended. Forward-looking statements are subject to risks, uncertainties and assumptions and are identified by words such as “expects,” “estimates,” “outlook,” “anticipates,” “believes,” “implies”, “could,” “opportunities,” “potential,” “should,” “plans,” “goal,” ”may,” “will,” and other similar words. All statements addressing operating performance, events, or developments that Graham Corporation expects or anticipates will occur in the future, including but not limited to, its dividend, its ability and the timing needed to address challenges in its defense business, including at the Batavia, NY operations, profitability of future projects, the development and impact of better documentation of build processes and pricing models, its ability to meet customers’ delivery expectations, the future impact of low margin defense projects and related cost overruns, anticipated capital contributions, the future expected contributions of BN, expected expansion and growth opportunities within its domestic and international markets, anticipated revenue and sales, adjusted EBITDA, adjusted EBITDA margins, and SG&A expenses, its ability to generate free cash flow and expected free cash flow conversion rates, future capital expenditures and R&D spend, any share repurchases, its ability to reduce debt, market presence, profit margins, foreign sales operations, its ability to improve cost competitiveness and productivity, customer preferences, changes in market conditions in the industries in which it operates, labor constraints, the effect on its business of volatility in commodities prices, including, but not limited to, changes in general economic conditions and customer behavior, forecasts regarding the timing and scope of the economic recovery in its markets, its acquisition and growth strategy and its operations in China, India and other international locations, are forward-looking statements. Because they are forward-looking, they should be evaluated in light of important risk factors and uncertainties. These risk factors and uncertainties are more fully described in Graham Corporation’s most recent Annual Report filed with the Securities and Exchange Commission, included under the heading entitled “Risk Factors.” Should one or more of these risks or uncertainties materialize or should any of Graham Corporation’s underlying assumptions prove incorrect, actual results may vary materially from those currently anticipated. In addition, undue reliance should not be placed on Graham Corporation’s forward-looking statements. Except as required by law, Graham Corporation disclaims any obligation to update or publicly announce any revisions to any of the forward-looking statements contained in this presentation. Use of Forward-Looking Non-GAAP Financial Measures Forward-looking free cash flow conversion, adjusted EBITDA and adjusted EBITDA margin are non-GAAP measures. The Company is unable to present a quantitative reconciliation of these forward-looking non-GAAP financial measures to their most directly comparable forward-looking GAAP financial measures because such information is not available, and management cannot reliably predict the necessary components of such GAAP measures without unreasonable effort largely because forecasting or predicting our future operating results is subject to many factors out of our control or not readily predictable. In addition, the Company believes that such reconciliations would imply a degree of precision that would be confusing or misleading to investors. The unavailable information could have a significant impact on the Company’s fiscal 2023 and future financial results. These non-GAAP financial measures are preliminary estimates and are subject to risks and uncertainties, including, among others, changes in connection with purchase accounting, quarter-end and year-end adjustments. Any variation between the Company’s actual results and preliminary financial data set forth in this presentation may be material. 2


Our Mission Build Better Companies to Deliver Superior Performance


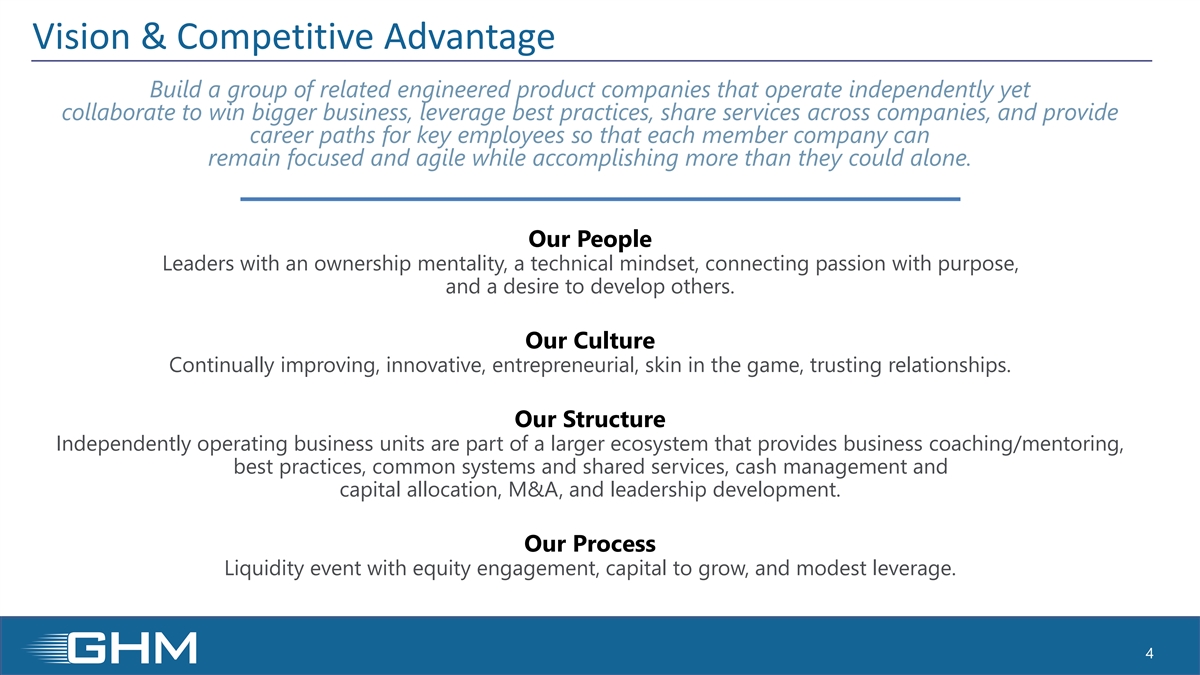
Vision & Competitive Advantage Build a group of related engineered product companies that operate independently yet collaborate to win bigger business, leverage best practices, share services across companies, and provide career paths for key employees so that each member company can remain focused and agile while accomplishing more than they could alone. Our People Leaders with an ownership mentality, a technical mindset, connecting passion with purpose, and a desire to develop others. Our Culture Continually improving, innovative, entrepreneurial, skin in the game, trusting relationships. Our Structure Independently operating business units are part of a larger ecosystem that provides business coaching/mentoring, best practices, common systems and shared services, cash management and capital allocation, M&A, and leadership development. Our Process Liquidity event with equity engagement, capital to grow, and modest leverage. 4


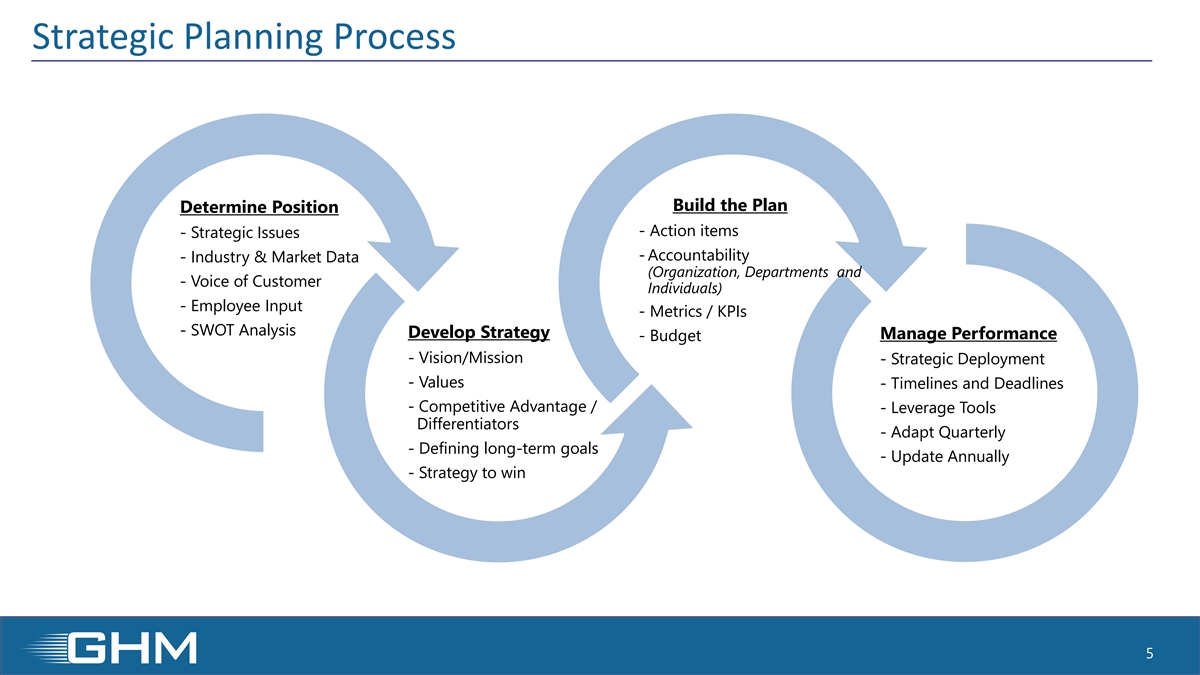
Strategic Planning Process Build the Plan Determine Position - Action items - Strategic Issues - Accountability - Industry & Market Data (Organization, Departments and - Voice of Customer Individuals) - Employee Input - Metrics / KPIs - SWOT Analysis Develop Strategy Manage Performance - Budget - Vision/Mission - Strategic Deployment - Values - Timelines and Deadlines - Competitive Advantage / - Leverage Tools Differentiators - Adapt Quarterly - Defining long-term goals - Update Annually - Strategy to win 5


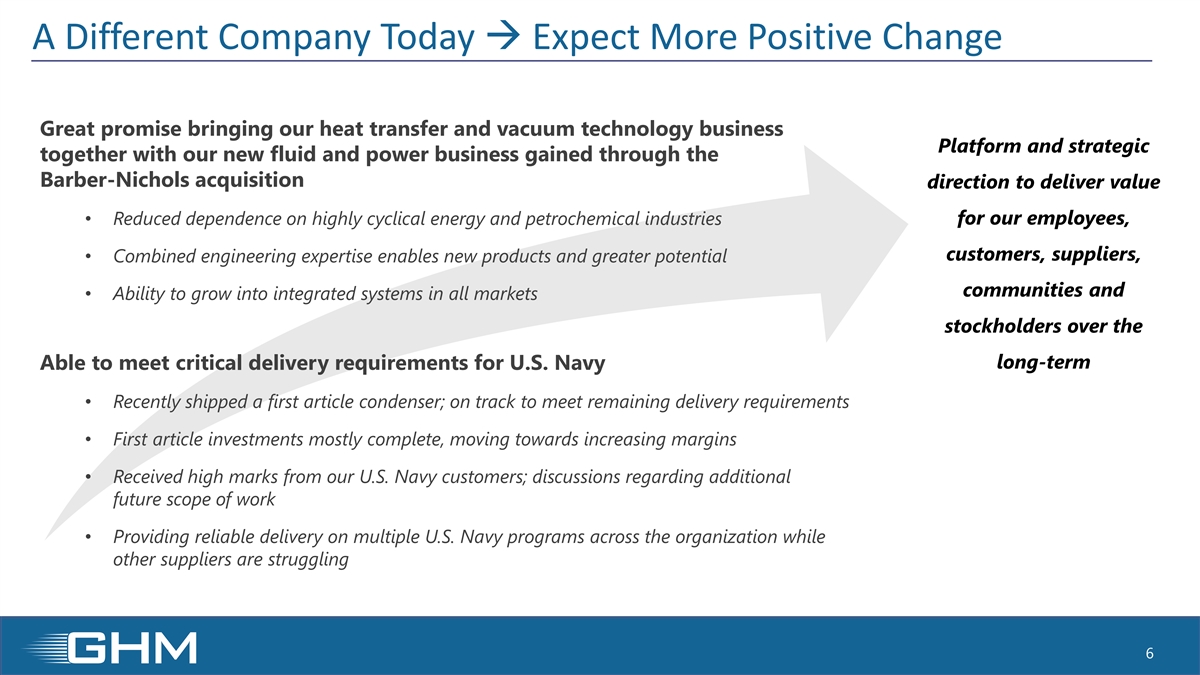
A Different Company Today → Expect More Positive Change Great promise bringing our heat transfer and vacuum technology business Platform and strategic together with our new fluid and power business gained through the Barber-Nichols acquisition direction to deliver value • Reduced dependence on highly cyclical energy and petrochemical industries for our employees, customers, suppliers, • Combined engineering expertise enables new products and greater potential communities and • Ability to grow into integrated systems in all markets stockholders over the long-term Able to meet critical delivery requirements for U.S. Navy • Recently shipped a first article condenser; on track to meet remaining delivery requirements • First article investments mostly complete, moving towards increasing margins • Received high marks from our U.S. Navy customers; discussions regarding additional future scope of work • Providing reliable delivery on multiple U.S. Navy programs across the organization while other suppliers are struggling 6


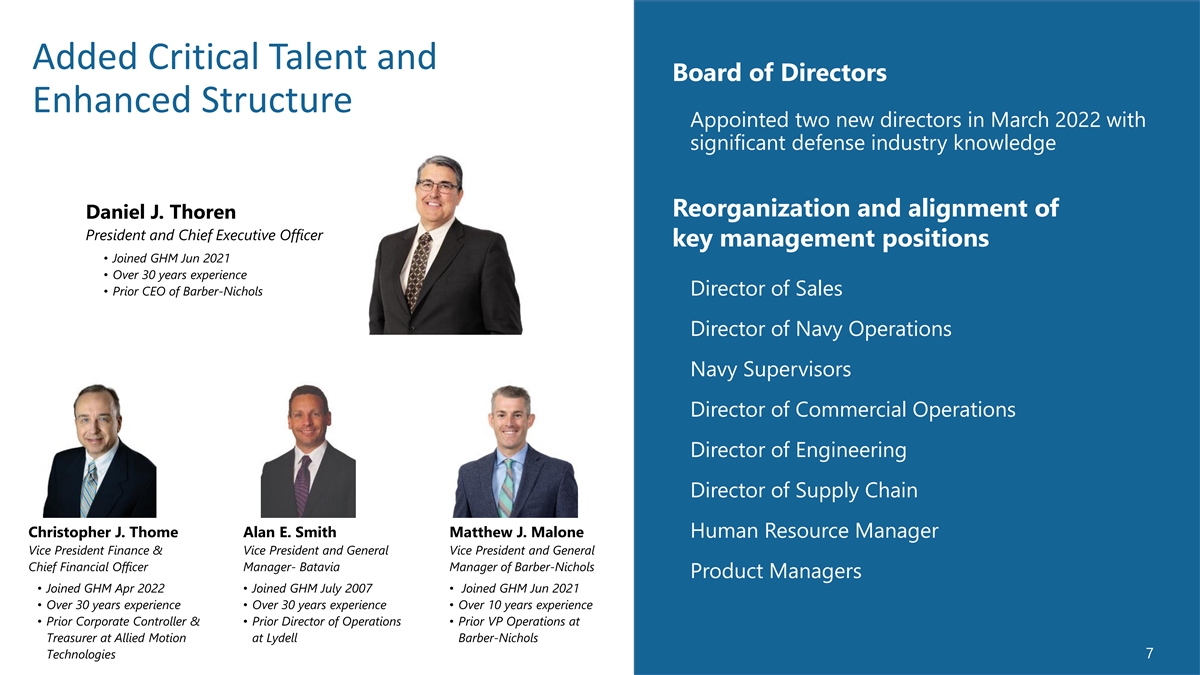
Added Critical Talent and Board of Directors Enhanced Structure Appointed two new directors in March 2022 with significant defense industry knowledge Reorganization and alignment of Daniel J. Thoren President and Chief Executive Officer key management positions • Joined GHM Jun 2021 • Over 30 years experience • Prior CEO of Barber-Nichols Director of Sales Director of Navy Operations Navy Supervisors Director of Commercial Operations Director of Engineering Director of Supply Chain Christopher J. Thome Alan E. Smith Matthew J. Malone Human Resource Manager Vice President Finance & Vice President and General Vice President and General Chief Financial Officer Manager- Batavia Manager of Barber-Nichols Product Managers • Joined GHM Apr 2022• Joined GHM July 2007• Joined GHM Jun 2021 • Over 30 years experience• Over 30 years experience• Over 10 years experience • Prior Corporate Controller & • Prior Director of Operations • Prior VP Operations at Treasurer at Allied Motion at Lydell Barber-Nichols Technologies 7


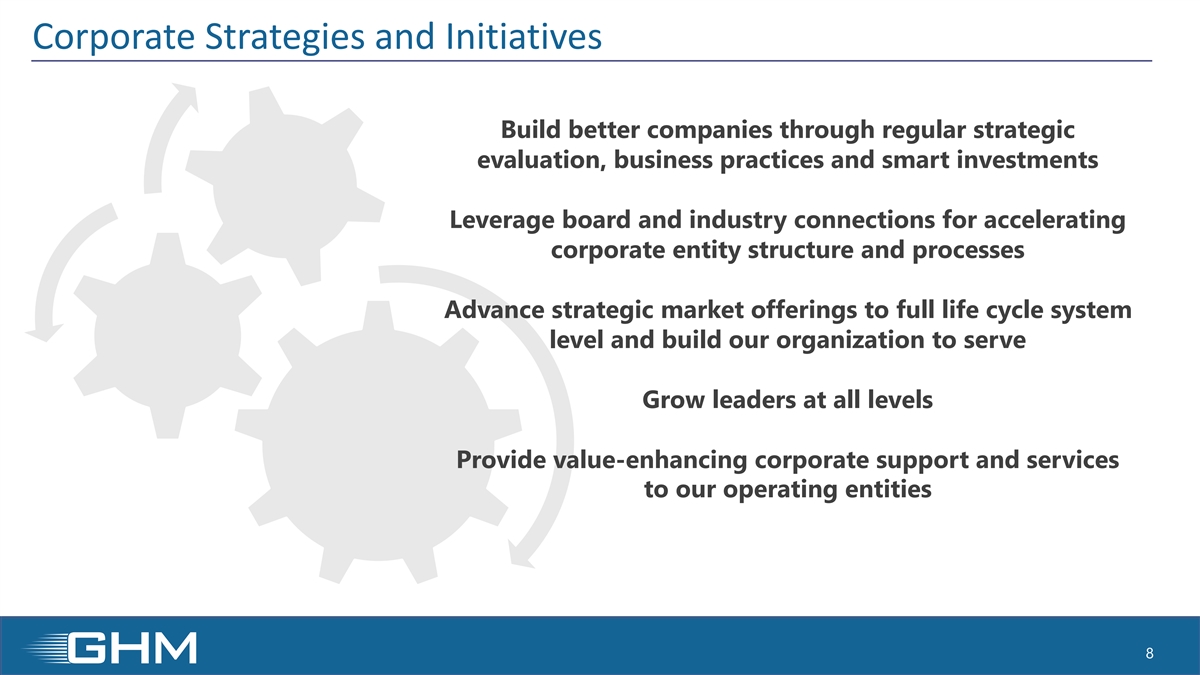
Corporate Strategies and Initiatives Build better companies through regular strategic evaluation, business practices and smart investments Leverage board and industry connections for accelerating corporate entity structure and processes Advance strategic market offerings to full life cycle system level and build our organization to serve Grow leaders at all levels Provide value-enhancing corporate support and services to our operating entities 8


Expect High Single Digit Growth and Expanded Margins Growth Drivers: Barber-Nichols opportunities, building legacy Navy business and steady commercial business Expect to deliver low double digit to mid-teens adjusted EBITDA margins¹ ~$200 $135-$150 $122.8 10%-… $97.5 $90.6 5.6% 5.2% 3.3% FY 2020 FY 2021 FY 2022 FY 2023E² ³ FY 2027 Goal³ (4.1%) Sales ($ in millions) Adjusted EBITDA Margin¹ ¹ Adjusted EBITDA margin is a non-GAAP measure. See Slide 2 for more information and the Appendix for historical reconciliation information. ² FY 2023E mid-point of outlook provided on June 8, 2022 ³ Projections are based on Company estimates as of June 8, 2022 and are provided solely for illustrative purposes. Actual results may vary. 9 The Company undertakes no obligation to update this information.


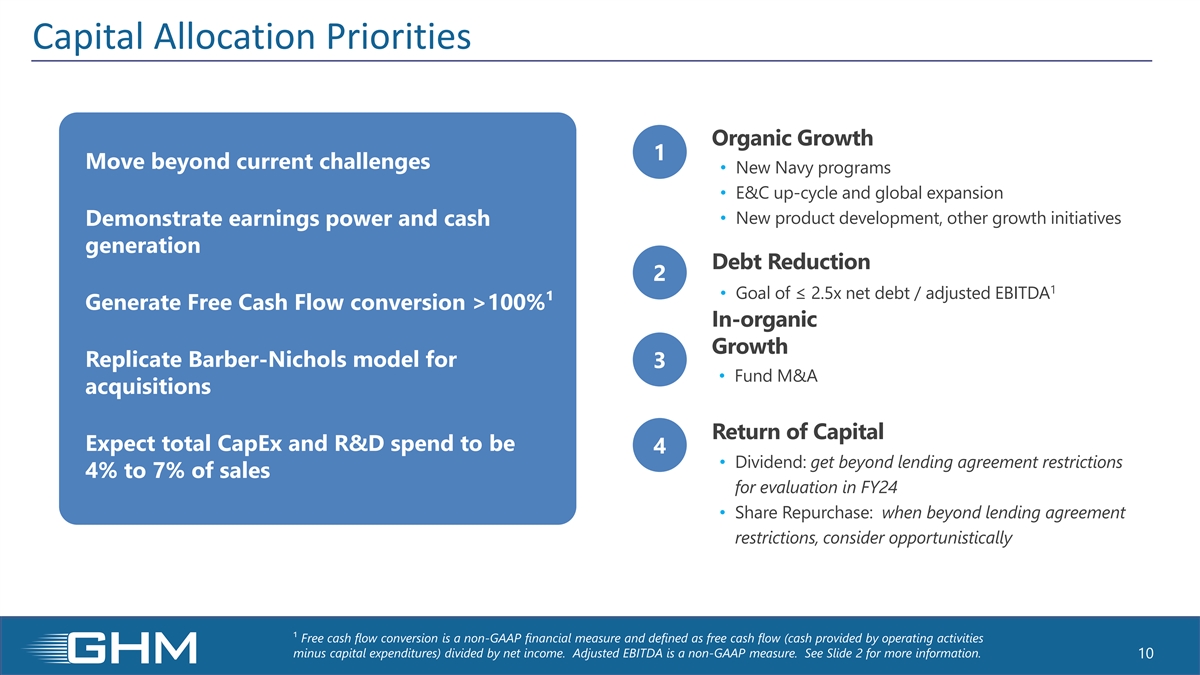
Capital Allocation Priorities Organic Growth 1 Move beyond current challenges • New Navy programs • E&C up-cycle and global expansion • New product development, other growth initiatives Demonstrate earnings power and cash generation Debt Reduction 2 1 • Goal of ≤ 2.5x net debt / adjusted EBITDA Generate Free Cash Flow conversion >100%¹ In-organic Growth Replicate Barber-Nichols model for 3 • Fund M&A acquisitions Return of Capital Expect total CapEx and R&D spend to be 4 • Dividend: get beyond lending agreement restrictions 4% to 7% of sales for evaluation in FY24 • Share Repurchase: when beyond lending agreement restrictions, consider opportunistically ¹ Free cash flow conversion is a non-GAAP financial measure and defined as free cash flow (cash provided by operating activities minus capital expenditures) divided by net income. Adjusted EBITDA is a non-GAAP measure. See Slide 2 for more information. 10


Visual: Growth Businesses with Strategies for Expanding Margins Graham Positioning Higher BN Space “New ” Energ y BN DoD Graha Operational BN improvements m Graham Rebuild Navy Aftermarket s Energy + Petchem. Global Energy GDP Global Upcycle Lower competition Lower Higher Differentiation + Margin Potential 11 Growth Index


• Founded: 1936 • Locations: Batavia, New York; Ahmedabad, India; Suzhou, China • Employees: 328 2 • Campus: 415,000 ft Competitive Advantages People Technical SMEs Architecture Int’l Offices, R&D, Fab Facilities, Installed Base Processes Quality, Weld, Service, Training Culture Problem Solving, Service Orientation 12


Defense Ejector Systems, Condensers, Heat Exchangers Chemical/Petrochemical Steam Surface Condensers, Ejector Systems, Liquid Ring Pumps, Heat Transfer Products Petroleum Refining Ejector Systems, Process Vacuum Condensers, Liquid Ring Pumps 13


Industry & Market Expectations U.S. Navy strategic ship budgets and build plans remain strong • Virginia Submarine: 2/year through 2049 • Columbia Submarine: 1/year after the first two boats for 12 total • Ford Aircraft Carrier: 1 every 4 years, 10 planned, 2 complete • SSN(X) next gen attack submarine design has begun CVN Carrier SSN Virginia Class Subs SSBN Columbia Class Subs 14


Industry & Market Data Expected Energy / Petrochem Market Trends • Oil demand could peak in 2029, depends on scenario • India refinery capacity grows at 4% CAGR and doubles petrochemical capacity by 2025 • China E&C growth slowing • Petrochemical market setting up for next big buildout (5 year lead time) • Asian & Indian pricing below domestic market • Domestic aftermarket budgets returning after industry and COVID-19 downturn – Capital equipment should follow 15


Executing Four-Step Strategy 1 2 3 4 Stabilize Improve Grow Mature Identify areas for process and Roadmap to improve U.S. Navy, aftermarket and Full lifecycle product strategy system improvements operations with better international E/C markets From customer collaboration information flow and Strengthen structure to Leverage vacuum and in developing markets to accountability enable strong execution and heat transfer expertise and investing in and executing reduce risk Realize anticipated returns in large installed base production and service target markets by driving programs Reorganize and align key Develop new products with operational effectiveness management positions repeat production potential and developing capabilities Positive communication with Prioritize business visibility and key customers analysis, new products, enhanced service and support, and employee recruitment and engagement 16


• Founded: 1966 • Location: Arvada, Colorado • Employees: 170 2 • Campus: 96,000 ft 2 – Added a 43,000 ft state-of-the-art manufacturing facility January 2021 Competitive Advantages People Relationship driven technical SMEs Architecture Measured diverse growth, Integrated Design/Mfg/Assy/Test/OH Processes Consistent, predictable, stable Culture Connecting Passion with Purpose 17


Defense Pumps, Blowers, Turbines, Generators, Electronics Space Fuel & Coolant Pumps, Rocket Turbopumps, Cooling Fans, High Altitude Blowers, Fuel Cell Blowers Advanced Energy Turbine/Generators, Fuel Cell Blowers & Pumps, Research Power Systems ORC & SCO2 Fluid & Thermal Management Liquid/Vapor/SC Coolant Circulators, LNG Pumps, Blowers 18


Space and Defense Industry: Markets Expected to Continue Growth Space Thermal Management Systems - Defense 19


New Energy Industry: Market Expected to Grow Significantly Hydrogen Clean Energy Technologies 20


Strategy focused on continued development and growth 1 2 3 4 Nurture customer Validate Develop disruptive Invest and execute partnerships in customized products for to win production developing target solutions in new existing markets and service markets applications programs Over the long-term, goal of achieving a full lifecycle product strategy 21


Our Commitment to Sustainability https://www.grahamcorp.com/sustainability 22


Transforming to Drive Value for All Stakeholders New platform for growth: BN provides growing, solid margin business with highly engineered turbomachinery solutions for more diverse markets that provides platform for scalability Capitalize on investment in U.S. Navy business with improved execution: creates opportunity for growth with strong profitability, long term visibility and significant cash generation Restructure legacy energy/petrochemical business and leverage international brand to build a competitive operation in markets with growth potential, specifically India and Asia, while capitalizing on large North America installed base to drive higher-margin aftermarket business 23


Questions and Answer Session Questions may be submitted through the webinar portal - Or - To ask in person dial 1-201-689-8560, where an operator will place you in the question queue. Please mute the audio on the webinar if asking questions on the conference line.


Supplemental Information www.GrahamCorp.com


Adjusted EBITDA Reconciliation Year Ended March 31, 2022 2021 2020 Net (loss) income $ (8,773) $ 2,374 $ 1,872 Acquisition related inventory step-up expense 95 - - Acquisition & integration costs 562 - - Change in fair value of contingent consideration (1,900) - - CEO and CFO transition costs 1,182 - - Debt amendment costs 278 - - Net interest expense (income) 400 (156) (1,312) Income taxes (2,443) 893 440 Depreciation & amortization 5,599 1,945 1,968 Adjusted EBITDA $ (5,000) $ 5,056 $ 2,968 Adjusted EBITDA margin % -4.1% 5.2% 3.3% Non-GAAP Financial Measure: Adjusted EBITDA is defined as consolidated net income (loss) before net interest expense, income taxes, depreciation, amortization, other acquisition related (income) expenses and other nonrecurring expenses. Adjusted EBITDA margin is defined as Adjusted EBITDA as a percentage of sales. Adjusted EBITDA and Adjusted EBITDA margin are not measures determined in accordance with generally accepted accounting principles in the United States, commonly known as GAAP. Nevertheless, Graham believes that providing non-GAAP information, such as Adjusted EBITDA and Adjusted EBITDA margin, are important for investors and other readers of Graham's financial statements, as it is used as an analytical indicator by Graham's management to better understand operating performance. Moreover, Graham’s credit facility also contains ratios based on EBITDA. Because Adjusted EBITDA and Adjusted EBITDA margin are non-GAAP measures and are thus susceptible to varying calculations, Adjusted EBITDA and Adjusted EBITDA margin, as presented, may not be directly comparable to other similarly titled measures used by other companies. 26