cmpo-20251103
false000182314400018231442025-11-032025-11-030001823144us-gaap:CommonStockMember2025-11-032025-11-030001823144us-gaap:WarrantMember2025-11-032025-11-03

UNITED STATES
SECURITIES AND EXCHANGE COMMISSION
Washington, D.C. 20549
 
FORM 8-K
 
CURRENT REPORT
Pursuant to Section 13 or 15(d)
of the Securities Exchange Act of 1934
 
Date of Report (Date of earliest event reported): November 3, 2025
 
CompoSecure, Inc.
(Exact Name of Registrant as Specified in its Charter)
 
Delaware 001-39687 85-2749902
(State or Other Jurisdiction
of Incorporation)
 (Commission
File Number)
 (IRS Employer
Identification No.)
 
309 Pierce Street
Somerset, New Jersey
 08873
(Address of Principal Executive Offices) (Zip Code)
(908) 518-0500
(Registrant’s telephone number, including area code)
 
Not Applicable
(Former name or former address, if changed since last report)
 
Check the appropriate box below if the Form 8-K filing is intended to simultaneously satisfy the filing obligation of the registrant under any of the following provisions:
Written communications pursuant to Rule 425 under the Securities Act (17 CFR 230.425)
Soliciting material pursuant to Rule 14a-12 under the Exchange Act (17 CFR 240.14a-12)
Pre-commencement communications pursuant to Rule 14d-2(b) under the Exchange Act (17 CFR 240.14d-2(b))
Pre-commencement communications pursuant to Rule 13e-4(c) under the Exchange Act (17 CFR 240.13e-4(c))
Securities registered pursuant to Section 12(b) of the Act:
Title of each class Trading
Symbol(s)
 Name of each exchange on
which registered
Class A Common stock, par value $0.0001 per share CMPO New York Stock Exchange
Redeemable warrants, each whole warrant exercisable for one share of Class A Common Stock CMPOW Nasdaq Global Market
Indicate by check mark whether the registrant is an emerging growth company as defined in Rule 405 of the Securities Act of 1933 (§ 230.405 of this chapter) or Rule 12b-2 of the Securities Exchange Act of 1934 (§ 240.12b-2 of this chapter).

Emerging growth company


If an emerging growth company, indicate by check mark if the registrant has elected not to use the extended transition period for complying with any new or revised financial accounting standards provided pursuant to Section 13(a) of the Exchange Act.
Item 2.02    Results of Operations and Financial Condition

On November 3, 2025, CompoSecure, Inc. (the “Company”) issued a press release announcing its financial results for the quarter ended September 30, 2025, and provided an investor presentation to accompany the press release. Copies of the press release and the investor presentation are furnished herewith as Exhibits 99.1 and 99.2, respectively.*

Item 7.01    Regulation FD Disclosure

The information included under Item 2.02 of this Current Report on Form 8-K is incorporated into this Item 7.01 by reference.*

Item 9.01 (d) Financial Statements and Exhibits

Exhibit No.
Exhibit Description
104
Cover Page Interactive Data File (embedded within the Inline XBRL document)

* The information in Items 2.02 and 7.01 of this Form 8-K shall not be deemed “filed” for purposes of Section 18 of the Securities Exchange Act of 1934, as amended (the “Exchange Act”) or otherwise subject to the liabilities of that section, nor shall it be deemed incorporated by reference in any filing under the Securities Act of 1933, as amended, or the Exchange Act, except as expressly set forth by specific reference in such a filing.


SIGNATURE

Pursuant to the requirements of the Securities Exchange Act of 1934, the registrant has duly caused this report to be signed on its behalf by the undersigned, hereunto duly authorized.

CompoSecure, Inc.
Date: November 3, 2025
By:
/s/ Steven J. Feder
Name:
Steven J. Feder
Title:
General Counsel & Corporate Secretary


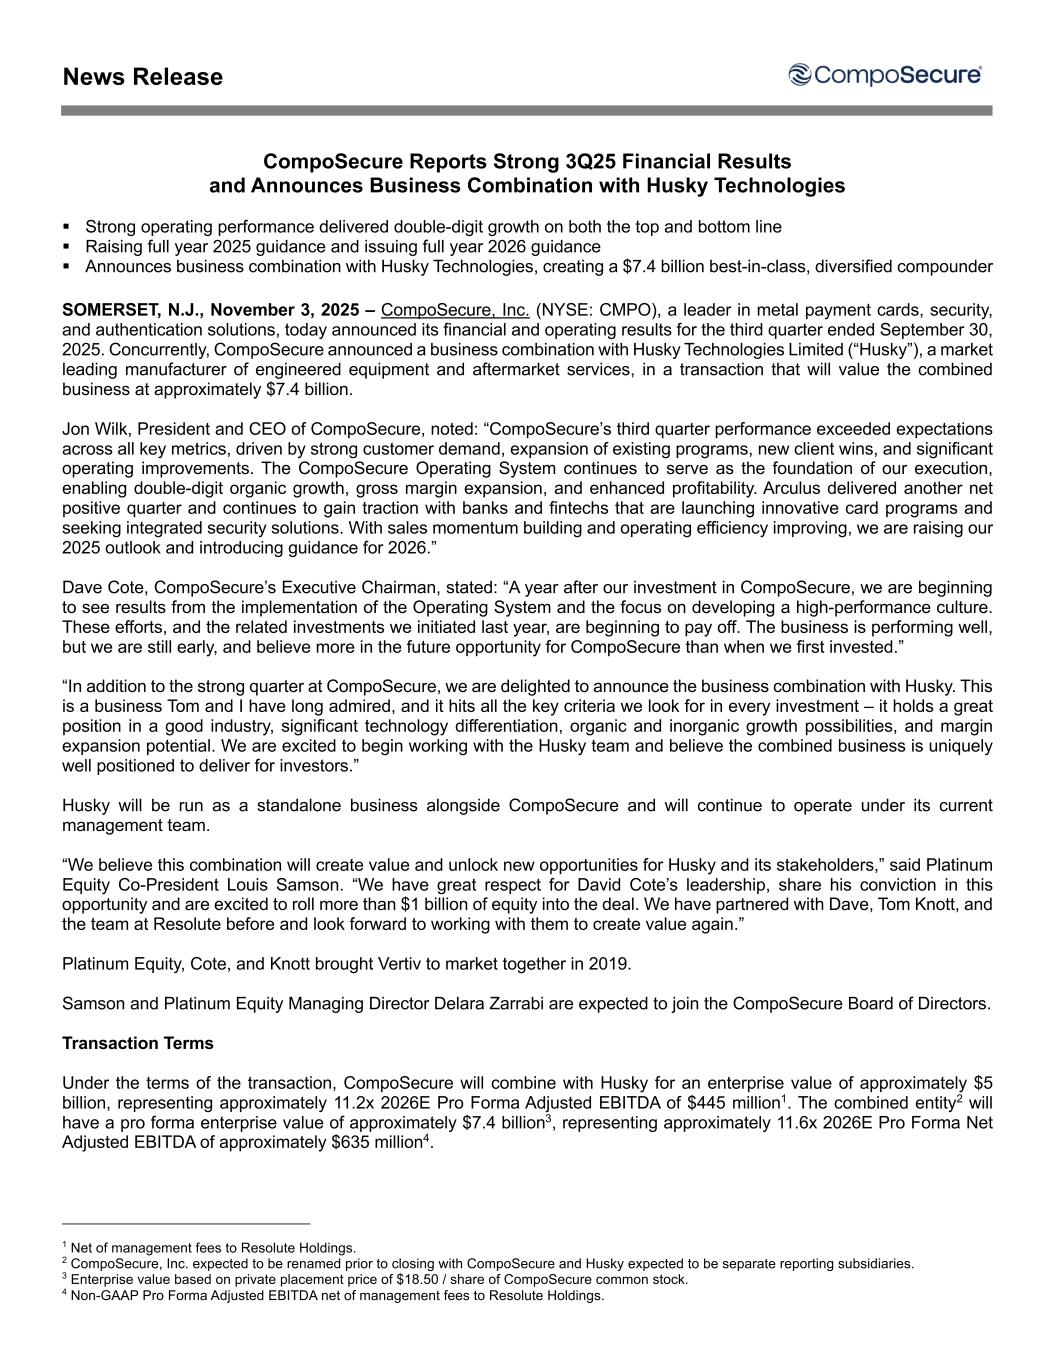
News Release CompoSecure Reports Strong 3Q25 Financial Results and Announces Business Combination with Husky Technologies § Strong operating performance delivered double-digit growth on both the top and bottom line § Raising full year 2025 guidance and issuing full year 2026 guidance § Announces business combination with Husky Technologies, creating a $7.4 billion best-in-class, diversified compounder SOMERSET, N.J., November 3, 2025 – CompoSecure, Inc. (NYSE: CMPO), a leader in metal payment cards, security, and authentication solutions, today announced its financial and operating results for the third quarter ended September 30, 2025. Concurrently, CompoSecure announced a business combination with Husky Technologies Limited (“Husky”), a market leading manufacturer of engineered equipment and aftermarket services, in a transaction that will value the combined business at approximately $7.4 billion. Jon Wilk, President and CEO of CompoSecure, noted: “CompoSecure’s third quarter performance exceeded expectations across all key metrics, driven by strong customer demand, expansion of existing programs, new client wins, and significant operating improvements. The CompoSecure Operating System continues to serve as the foundation of our execution, enabling double-digit organic growth, gross margin expansion, and enhanced profitability. Arculus delivered another net positive quarter and continues to gain traction with banks and fintechs that are launching innovative card programs and seeking integrated security solutions. With sales momentum building and operating efficiency improving, we are raising our 2025 outlook and introducing guidance for 2026.” Dave Cote, CompoSecure’s Executive Chairman, stated: “A year after our investment in CompoSecure, we are beginning to see results from the implementation of the Operating System and the focus on developing a high-performance culture. These efforts, and the related investments we initiated last year, are beginning to pay off. The business is performing well, but we are still early, and believe more in the future opportunity for CompoSecure than when we first invested.” “In addition to the strong quarter at CompoSecure, we are delighted to announce the business combination with Husky. This is a business Tom and I have long admired, and it hits all the key criteria we look for in every investment – it holds a great position in a good industry, significant technology differentiation, organic and inorganic growth possibilities, and margin expansion potential. We are excited to begin working with the Husky team and believe the combined business is uniquely well positioned to deliver for investors.” Husky will be run as a standalone business alongside CompoSecure and will continue to operate under its current management team. “We believe this combination will create value and unlock new opportunities for Husky and its stakeholders,” said Platinum Equity Co-President Louis Samson. “We have great respect for David Cote’s leadership, share his conviction in this opportunity and are excited to roll more than $1 billion of equity into the deal. We have partnered with Dave, Tom Knott, and the team at Resolute before and look forward to working with them to create value again.” Platinum Equity, Cote, and Knott brought Vertiv to market together in 2019. Samson and Platinum Equity Managing Director Delara Zarrabi are expected to join the CompoSecure Board of Directors. Transaction Terms Under the terms of the transaction, CompoSecure will combine with Husky for an enterprise value of approximately $5 billion, representing approximately 11.2x 2026E Pro Forma Adjusted EBITDA of $445 million1. The combined entity2 will have a pro forma enterprise value of approximately $7.4 billion3, representing approximately 11.6x 2026E Pro Forma Net Adjusted EBITDA of approximately $635 million4. 1 Net of management fees to Resolute Holdings. 2 CompoSecure, Inc. expected to be renamed prior to closing with CompoSecure and Husky expected to be separate reporting subsidiaries. 3 Enterprise value based on private placement price of $18.50 / share of CompoSecure common stock. 4 Non-GAAP Pro Forma Adjusted EBITDA net of management fees to Resolute Holdings.
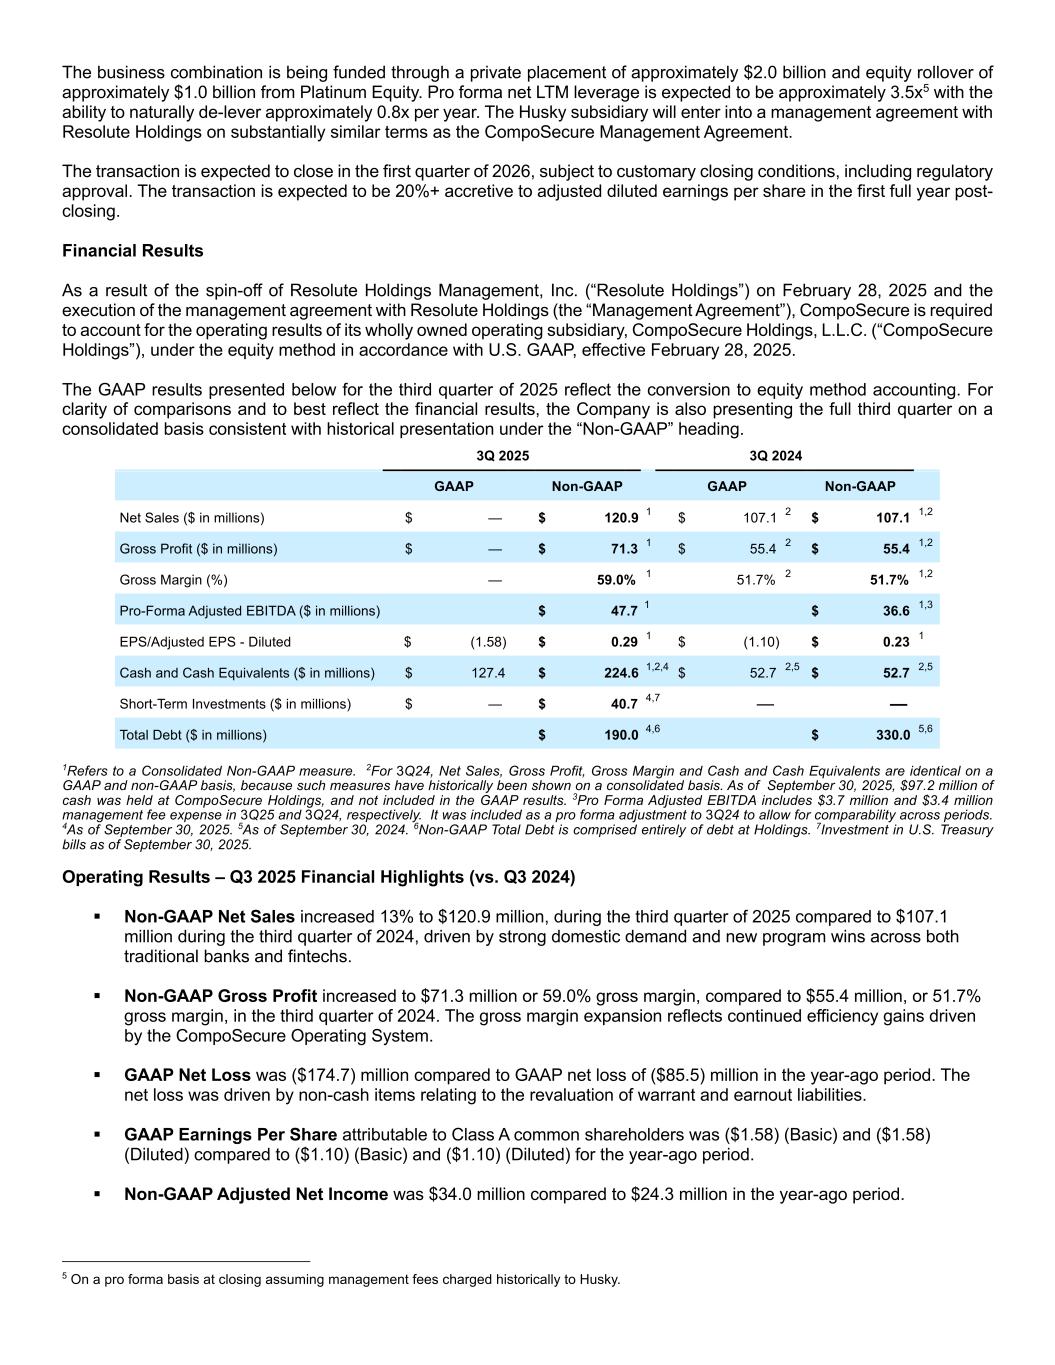

 
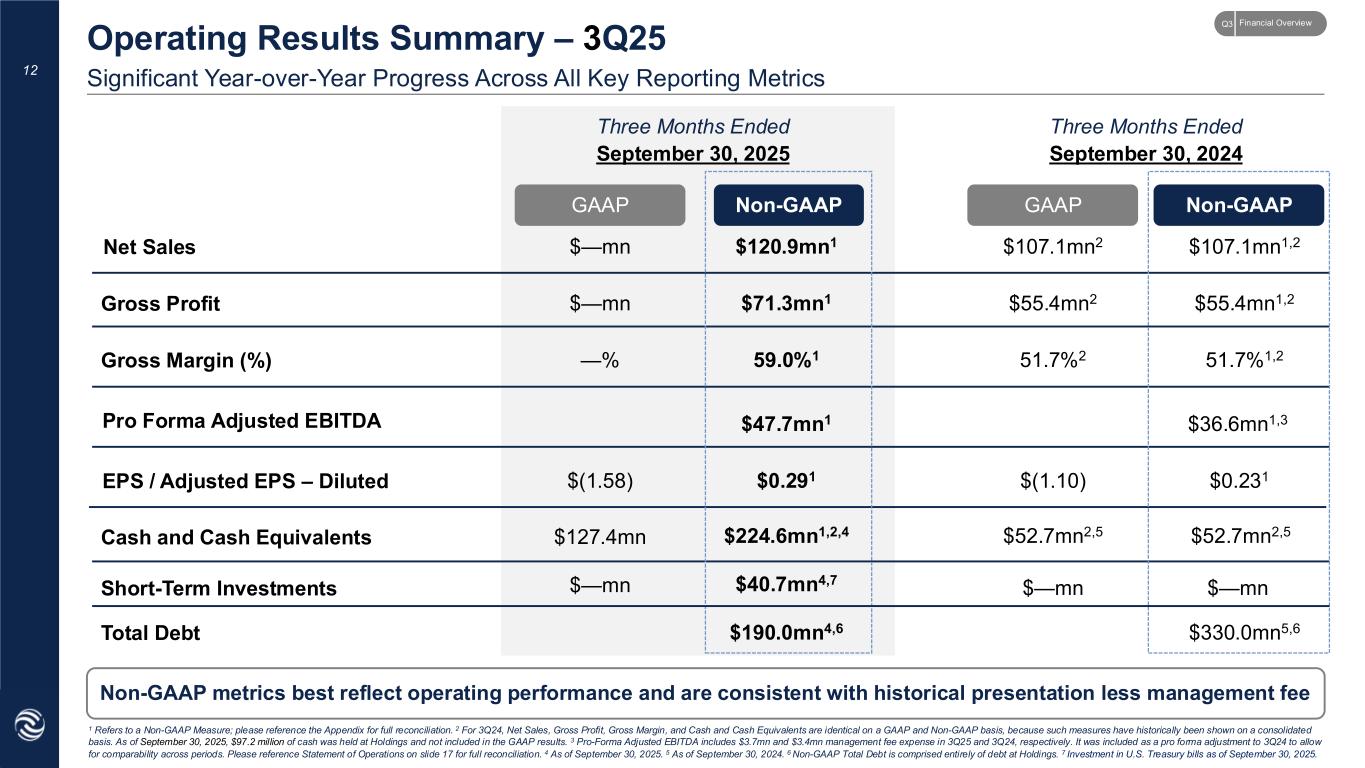
The business combination is being funded through a private placement of approximately $2.0 billion and equity rollover of approximately $1.0 billion from Platinum Equity. Pro forma net LTM leverage is expected to be approximately 3.5x5 with the ability to naturally de-lever approximately 0.8x per year. The Husky subsidiary will enter into a management agreement with Resolute Holdings on substantially similar terms as the CompoSecure Management Agreement. The transaction is expected to close in the first quarter of 2026, subject to customary closing conditions, including regulatory approval. The transaction is expected to be 20%+ accretive to adjusted diluted earnings per share in the first full year post- closing. Financial Results As a result of the spin-off of Resolute Holdings Management, Inc. (“Resolute Holdings”) on February 28, 2025 and the execution of the management agreement with Resolute Holdings (the “Management Agreement”), CompoSecure is required to account for the operating results of its wholly owned operating subsidiary, CompoSecure Holdings, L.L.C. (“CompoSecure Holdings”), under the equity method in accordance with U.S. GAAP, effective February 28, 2025. The GAAP results presented below for the third quarter of 2025 reflect the conversion to equity method accounting. For clarity of comparisons and to best reflect the financial results, the Company is also presenting the full third quarter on a consolidated basis consistent with historical presentation under the “Non-GAAP” heading. 3Q 2025 3Q 2024 GAAP Non-GAAP GAAP Non-GAAP Net Sales ($ in millions) $ — $ 120.9 1 $ 107.1 2 $ 107.1 1,2 Gross Profit ($ in millions) $ — $ 71.3 1 $ 55.4 2 $ 55.4 1,2 Gross Margin (%) — 59.0% 1 51.7% 2 51.7% 1,2 Pro-Forma Adjusted EBITDA ($ in millions) $ 47.7 1 $ 36.6 1,3 EPS/Adjusted EPS - Diluted $ (1.58) $ 0.29 1 $ (1.10) $ 0.23 1 Cash and Cash Equivalents ($ in millions) $ 127.4 $ 224.6 1,2,4 $ 52.7 2,5 $ 52.7 2,5 Short-Term Investments ($ in millions) $ — $ 40.7 4,7 — — Total Debt ($ in millions) $ 190.0 4,6 $ 330.0 5,6 1Refers to a Consolidated Non-GAAP measure. 2For 3Q24, Net Sales, Gross Profit, Gross Margin and Cash and Cash Equivalents are identical on a GAAP and non-GAAP basis, because such measures have historically been shown on a consolidated basis. As of September 30, 2025, $97.2 million of cash was held at CompoSecure Holdings, and not included in the GAAP results. 3Pro Forma Adjusted EBITDA includes $3.7 million and $3.4 million management fee expense in 3Q25 and 3Q24, respectively. It was included as a pro forma adjustment to 3Q24 to allow for comparability across periods. 4As of September 30, 2025. 5As of September 30, 2024. 6Non-GAAP Total Debt is comprised entirely of debt at Holdings. 7Investment in U.S. Treasury bills as of September 30, 2025. Operating Results – Q3 2025 Financial Highlights (vs. Q3 2024) § Non-GAAP Net Sales increased 13% to $120.9 million, during the third quarter of 2025 compared to $107.1 million during the third quarter of 2024, driven by strong domestic demand and new program wins across both traditional banks and fintechs. § Non-GAAP Gross Profit increased to $71.3 million or 59.0% gross margin, compared to $55.4 million, or 51.7% gross margin, in the third quarter of 2024. The gross margin expansion reflects continued efficiency gains driven by the CompoSecure Operating System. § GAAP Net Loss was ($174.7) million compared to GAAP net loss of ($85.5) million in the year-ago period. The net loss was driven by non-cash items relating to the revaluation of warrant and earnout liabilities. § GAAP Earnings Per Share attributable to Class A common shareholders was ($1.58) (Basic) and ($1.58) (Diluted) compared to ($1.10) (Basic) and ($1.10) (Diluted) for the year-ago period. § Non-GAAP Adjusted Net Income was $34.0 million compared to $24.3 million in the year-ago period. 5 On a pro forma basis at closing assuming management fees charged historically to Husky.

 
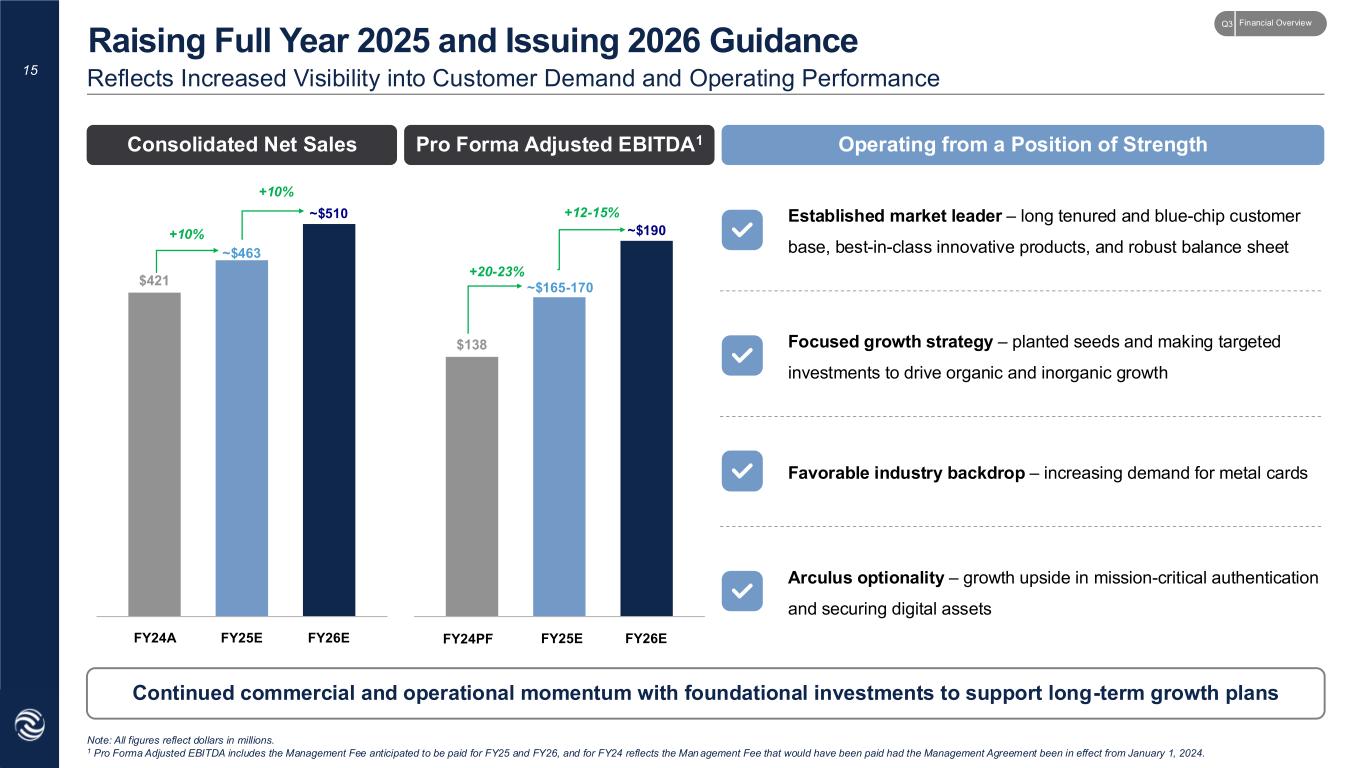
§ Non-GAAP Adjusted Earnings Per Share was $0.31 (Basic) and $0.29 (Diluted) compared to $0.27 (Basic) and $0.23 (Diluted) in the year-ago period. § Non-GAAP Pro Forma Adjusted EBITDA increased 30% to $47.7 million compared to $36.6 million in the year- ago period, due primarily to strong organic sales growth and continued margin expansion. Financial Condition § GAAP Financial Condition: At September 30, 2025, CompoSecure had $127.4 million of cash and cash equivalents. The Company's liquidity needs are expected to be met with funding from the operations of CompoSecure Holdings. § Non-GAAP Financial Condition: At September 30, 2025, CompoSecure had $265.3 million of cash and short term investments, and $190.0 million of total debt for total net cash of $75.3 million. This compares to cash and cash equivalents of $52.7 million and total debt of $330.0 million at September 30, 2024 for total net debt of $277.3 million. The increase in cash was primarily driven by $154.4 million in proceeds from warrant exercises as well as operating free cash flow. Additional Highlights § Numerous high-profile programs include: Citi Strata Elite, Chime, Itau, Bank of America (Alaska Airlines), BMO Escape, Iberia, Uphold, and Gemini XRP, among others § Appointed new Chief Financial Officer — Mary Holt § Partnered with N.exchange to enhance the Arculus Cold Storage Wallet with Smart Order Router for better-priced crypto swaps § Transferred Class A Common Stock to the New York Stock Exchange (NYSE) § Repurchased approximately 648,000 shares for $12.2 million, reflecting an average purchase price of $18.89 per share § Holders exercised 18.8 million warrants for approximately $149.5 million in cash 2025 and 2026 Financial Outlook CompoSecure raised guidance for the full year and now expects total Non-GAAP Net Sales of approximately $463 million and Non-GAAP Pro Forma Adjusted EBITDA of approximately $165-170 million. CompoSecure also announced financial guidance for fiscal year 2026, expecting total Non-GAAP Net Sales of approximately $510 million, up 10% year-over-year, and Non-GAAP Pro Forma Adjusted EBITDA of approximately $190 million, up 12-15% year-over-year, reflecting continued confidence in its growth strategy and operational execution. This guidance does not include any impact from the announced acquisition of Husky. Note: Guidance for Pro Forma Adjusted EBITDA includes the payment of the Resolute Holdings management fee. Third Quarter 2025 Earnings Conference Call CompoSecure’s management team will discuss the Company’s results during a conference call on Monday, November 3, 2025, starting at 8:00 a.m. Eastern Time. The call will contain forward-looking statements and other material information regarding CompoSecure’s financial and operating results. A live webcast and replay of the conference call will be available for interested parties to listen to by going to the Investor Relations section of the Company’s website at https://ir.composecure.com/news-events/events. Date: Monday, November 3, 2025 Time: 8:00 a.m. Eastern time Dial-in registration link: (646) 307-1963; Participant Code: 6594374 Live webcast registration link: here If you have any difficulty registering or connecting with the conference call, please contact Elevate IR at (720) 330-2829.

 
Advisors Morgan Stanley & Co. LLC acted as financial advisor to CompoSecure on the transaction and Paul, Weiss, Rifkind, Wharton & Garrison LLP served as legal counsel to CompoSecure. Goldman Sachs acted as exclusive financial advisor and Latham & Watkins LLP served as legal counsel to Husky Technologies. About CompoSecure Founded in 2000, CompoSecure (NYSE: CMPO) is a technology partner to market leaders, fintechs and consumers enabling trust for millions of people around the globe. The Company combines elegance, simplicity and security to deliver exceptional experiences and peace of mind in the physical and digital world. CompoSecure’s innovative payment card technology and metal cards with Arculus security and authentication capabilities deliver unique, premium branded experiences, enable people to access and use their financial and digital assets, and ensure trust at the point of a transaction. For more information, please visit CompoSecure.com and GetArculus.com. About Husky Technologies Founded in 1953, Husky is a leading global supplier of engineered equipment and aftermarket services. The company’s products are used to manufacture a wide range of plastic products, including beverage and food containers, medical devices and consumer electronic parts. Husky provides comprehensive and integrated systems solutions that are comprised of injection molding machines, molds, hot runners, controllers, and auxiliaries. Husky has more than 30 locations globally, supporting customers in over 140 countries. Husky’s manufacturing facilities are located in Canada, the United States, China, India, Luxembourg, and Switzerland. For more information, please visit Husky.co. Forward-Looking Statements This press release contains forward-looking statements as defined by the Private Securities Litigation Reform Act of 1995. These statements are based on the beliefs and assumptions of management. Although CompoSecure believes that its plans, intentions, and expectations reflected in or suggested by these forward-looking statements are reasonable, CompoSecure cannot assure you that it will achieve or realize these plans, intentions, or expectations. Forward-looking statements are inherently subject to risks, uncertainties, and assumptions. Generally, statements that are not historical facts, including statements concerning CompoSecure’s possible or assumed future actions, business strategies, events, results of operations, demand, the implementation of the CompoSecure Operating System and guidance for 2025 and 2026 are forward-looking statements. In some instances, these statements may be preceded by, followed by, or include the words “believes,” “estimates,” “expects,” “projects,” “outlook” “forecasts,” “may,” “will,” “should,” “seeks,” “plans,” “scheduled,” “anticipates” or “intends” or the negatives of these terms or variations of them or similar terminology. Forward-looking statements are not guarantees of performance. You should not put undue reliance on these statements which speak only as of the date hereof. You should understand that the following important factors, among others, could affect CompoSecure’s future results and could cause those results or other outcomes to differ materially from those expressed or implied in CompoSecure’s forward-looking statements: the ability of CompoSecure to grow and manage growth profitably, maintain relationships with customers, compete within its industry and retain its key employees; the possibility that CompoSecure may be adversely impacted by other global economic, business, competitive and/or other factors, including tariffs; the outcome of any legal proceedings that may be instituted against CompoSecure or others; future exchange and interest rates; changes in our accounting and/or financial presentation; and other risks and uncertainties, including those under “Risk Factors” in filings that have been made or will be made with the Securities and Exchange Commission. CompoSecure undertakes no obligation to update or revise publicly any forward-looking statements, whether as a result of new information, future events or otherwise, except as required by law. Use of Non-GAAP Financial Measures Due to the spin-off of Resolute Holdings Management, Inc. and the resulting shift to equity method accounting under GAAP beginning February 28, 2025, CompoSecure is presenting a broader set of Non-GAAP measures, including an Adjusted Statement of Operations (Unaudited), an Adjusted Balance Sheet (Unaudited) to provide investors with financial information that we believe allows for greater comparability with our historical financial presentation and better represents the underlying performance of the standalone business across reporting periods. This press release also includes certain Non-GAAP financial measures that are not prepared in accordance with accounting principles generally accepted in the United States (“GAAP”) and that may be different from Non-GAAP financial measures used by other companies. CompoSecure believes Non-GAAP Net Sales, Non-GAAP Gross Profit, Non-GAAP Gross Margin, EBITDA, Adjusted EBITDA, Non-GAAP Pro Forma Adjusted EBITDA, Non-GAAP Pro Forma Adjusted EBITDA Margin, Non-GAAP Adjusted Net Income, Non-GAAP Adjusted EPS (Basic and Diluted), Non-GAAP Adjusted Net Income, Non-GAAP Cash, Non-GAAP Net Debt, Non-GAAP Net Debt Leverage Ratio and Free Cash Flow, and related measures are useful to investors in evaluating CompoSecure’s financial performance. Specifically, we believe EBITDA, Adjusted EBITDA, Non-GAAP Adjusted EPS (Basic and Diluted)


Non-GAAP Pro Forma Adjusted EBITDA, and Non-GAAP Pro Forma Adjusted EBITDA Margin provide valuable insight into operational efficiency independent of capital structure and tax environment; Non-GAAP Net Sales, Non-GAAP Gross Profit, Non-GAAP Gross Margin, Non-GAAP Cash, Non-GAAP Net Debt, Non-GAAP Net Debt Leverage Ratio and Free Cash Flow offer investors a clearer view of ongoing profitability by excluding non-recurring and non-operational items; and related measures provide greater comparability with CompoSecure’s historical results, following the change in accounting presentation required as a result of the spin-off of Resolute Holdings. CompoSecure uses these Non-GAAP measures internally to establish forecasts, budgets and operational goals to manage and monitor its business, as well as evaluate its underlying historical performance and/or measure incentive compensation. We believe that these Non-GAAP financial measures depict the true performance of the business by encompassing only relevant and controllable events, enabling CompoSecure to evaluate and plan more effectively for the future. These Non-GAAP measures should not be considered as measures of financial performance under U.S. GAAP, and the items excluded from these measures are significant components in understanding and assessing CompoSecure’s financial performance. Accordingly, these key business metrics have limitations as an analytical tool. They should not be considered as an alternative to net income or any other performance measures derived in accordance with U.S. GAAP or as an alternative to cash flows from operating activities as a measure of CompoSecure’s liquidity. These Non-GAAP measures may be different from similarly titled Non-GAAP measures used by other companies. Additionally, CompoSecure’s debt agreements contain covenants based on variations of these measures for purposes of determining debt covenant compliance. CompoSecure believes that investors should have access to the same set of tools that its management uses in analyzing operating results. Please refer to the tables below for the reconciliation of GAAP measures to these Non-GAAP measures. Due to the forward-looking nature of the financial guidance included above, the charges excluded from the forward-looking Non-GAAP financial measures including Non-GAAP Net Sales, Non-GAAP Pro Forma Adjusted EBITDA (including year-over-year growth and multiples), including with respect to depreciation, amortization, interest, and taxes that would be required to reconcile the Non-GAAP financial measures to GAAP measures are inherently uncertain or difficult to predict, so it is not feasible to provide accurate forecasted Non-GAAP reconciliations without unreasonable effort. Consequently, no disclosure of estimated comparable GAAP measures is included, and no reconciliation of the forward-looking Non-GAAP financial measures is included. CompoSecure Corporate Contact Anthony Piniella Head of Communications, CompoSecure (917) 208-7724 [email protected] CompoSecure Investor Relations Contact Sean Mansouri, CFA Elevate IR (720) 330-2829 [email protected] Husky Technologies Corporate Contact [email protected]
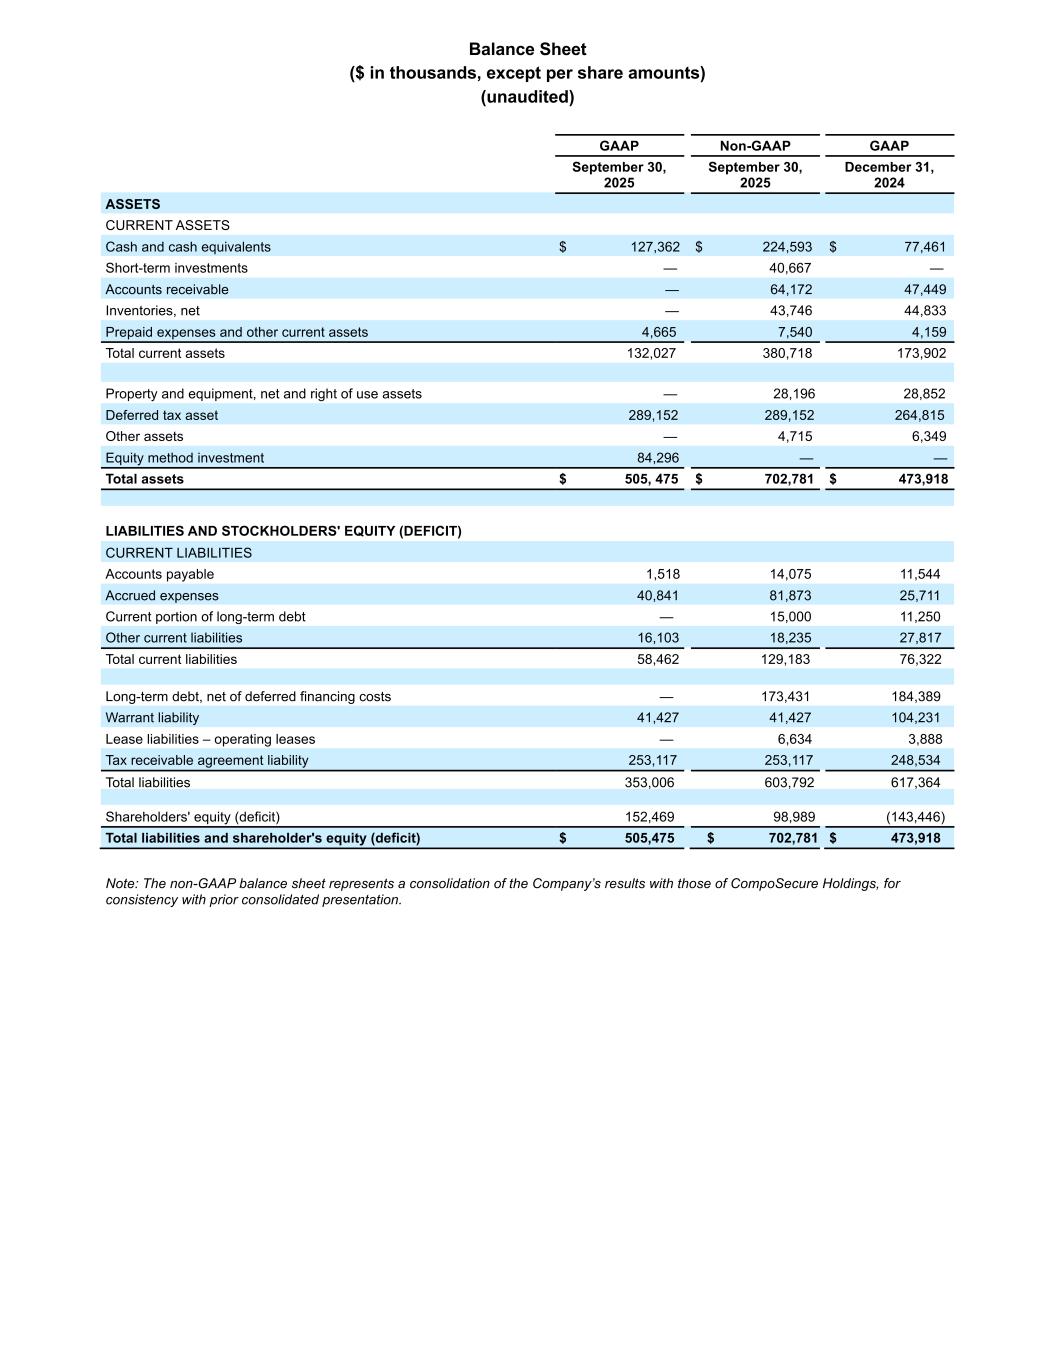

 
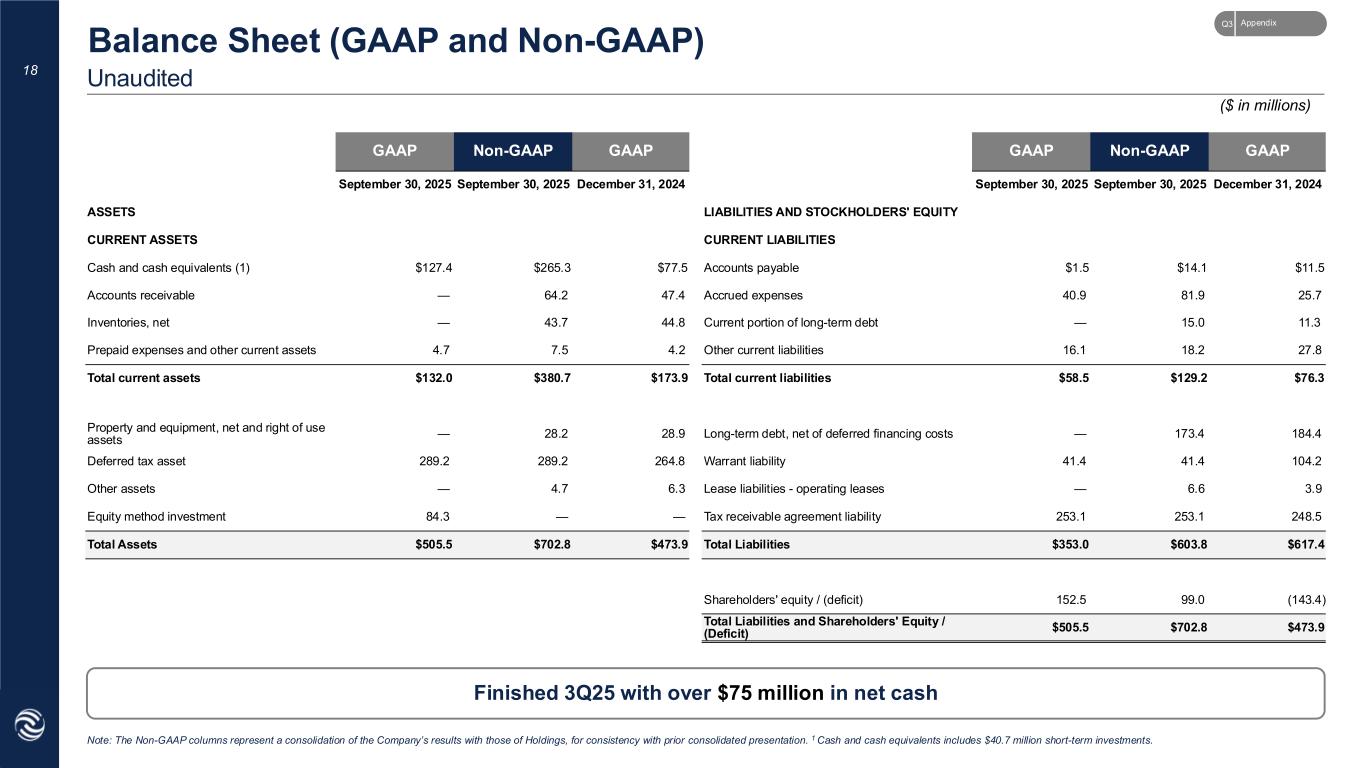
Balance Sheet ($ in thousands, except per share amounts) (unaudited) GAAP Non-GAAP GAAP September 30, 2025 September 30, 2025 December 31, 2024 ASSETS CURRENT ASSETS Cash and cash equivalents $ 127,362 $ 224,593 $ 77,461 Short-term investments — 40,667 — Accounts receivable — 64,172 47,449 Inventories, net — 43,746 44,833 Prepaid expenses and other current assets 4,665 7,540 4,159 Total current assets 132,027 380,718 173,902 Property and equipment, net and right of use assets — 28,196 28,852 Deferred tax asset 289,152 289,152 264,815 Other assets — 4,715 6,349 Equity method investment 84,296 — — Total assets $ 505, 475 $ 702,781 $ 473,918 LIABILITIES AND STOCKHOLDERS' EQUITY (DEFICIT) CURRENT LIABILITIES Accounts payable 1,518 14,075 11,544 Accrued expenses 40,841 81,873 25,711 Current portion of long-term debt — 15,000 11,250 Other current liabilities 16,103 18,235 27,817 Total current liabilities 58,462 129,183 76,322 Long-term debt, net of deferred financing costs — 173,431 184,389 Warrant liability 41,427 41,427 104,231 Lease liabilities – operating leases — 6,634 3,888 Tax receivable agreement liability 253,117 253,117 248,534 Total liabilities 353,006 603,792 617,364 Shareholders' equity (deficit) 152,469 98,989 (143,446) Total liabilities and shareholder's equity (deficit) $ 505,475 $ 702,781 $ 473,918 Note: The non-GAAP balance sheet represents a consolidation of the Company’s results with those of CompoSecure Holdings, for consistency with prior consolidated presentation.
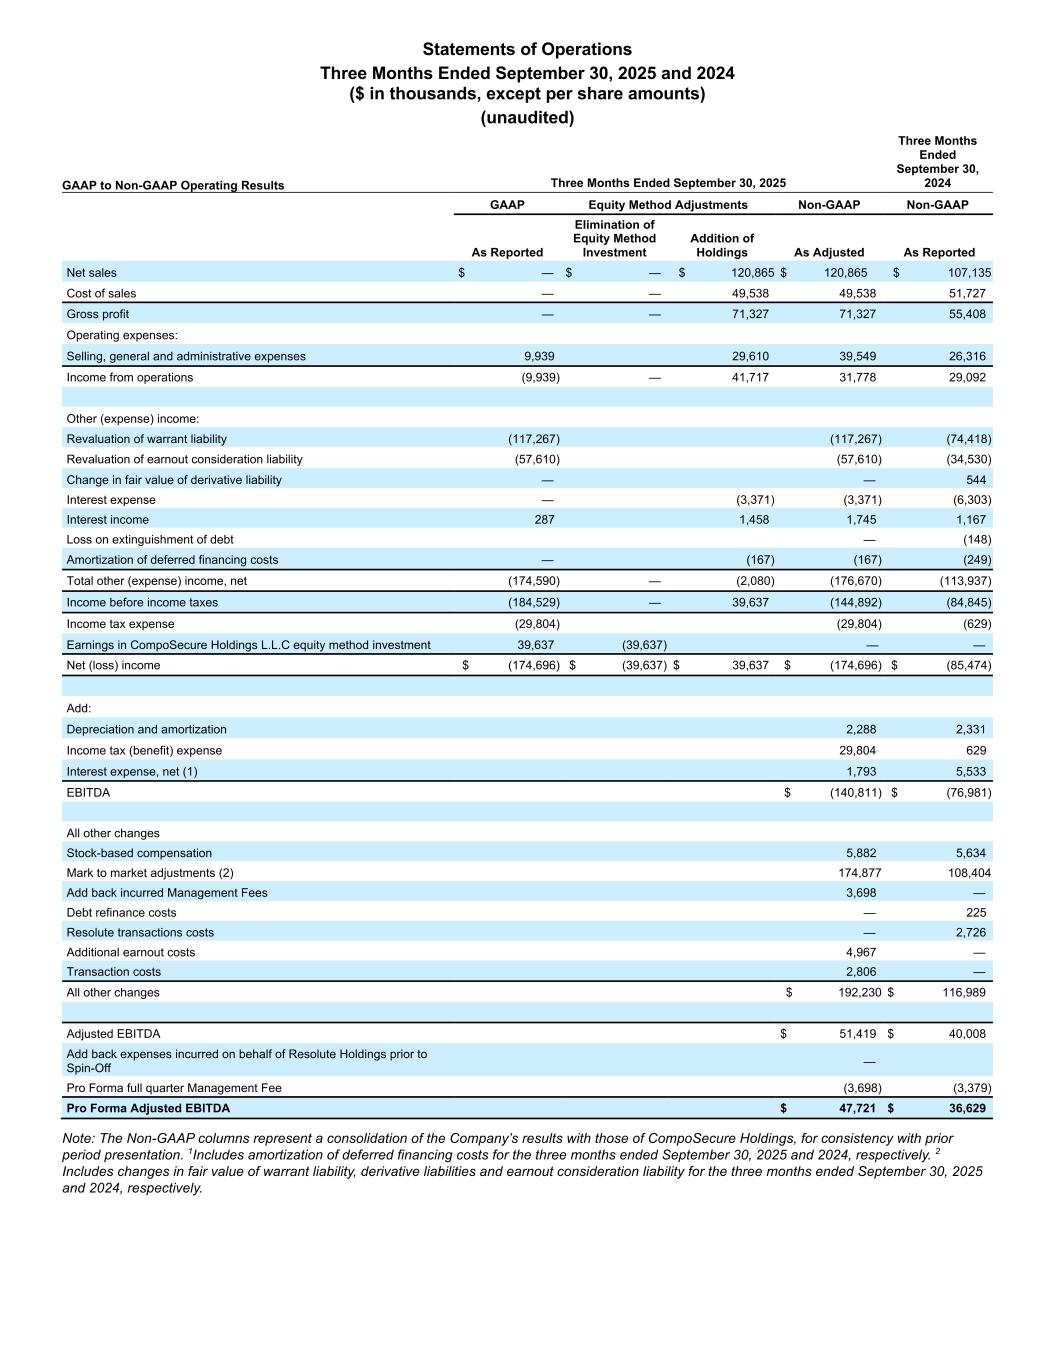

 
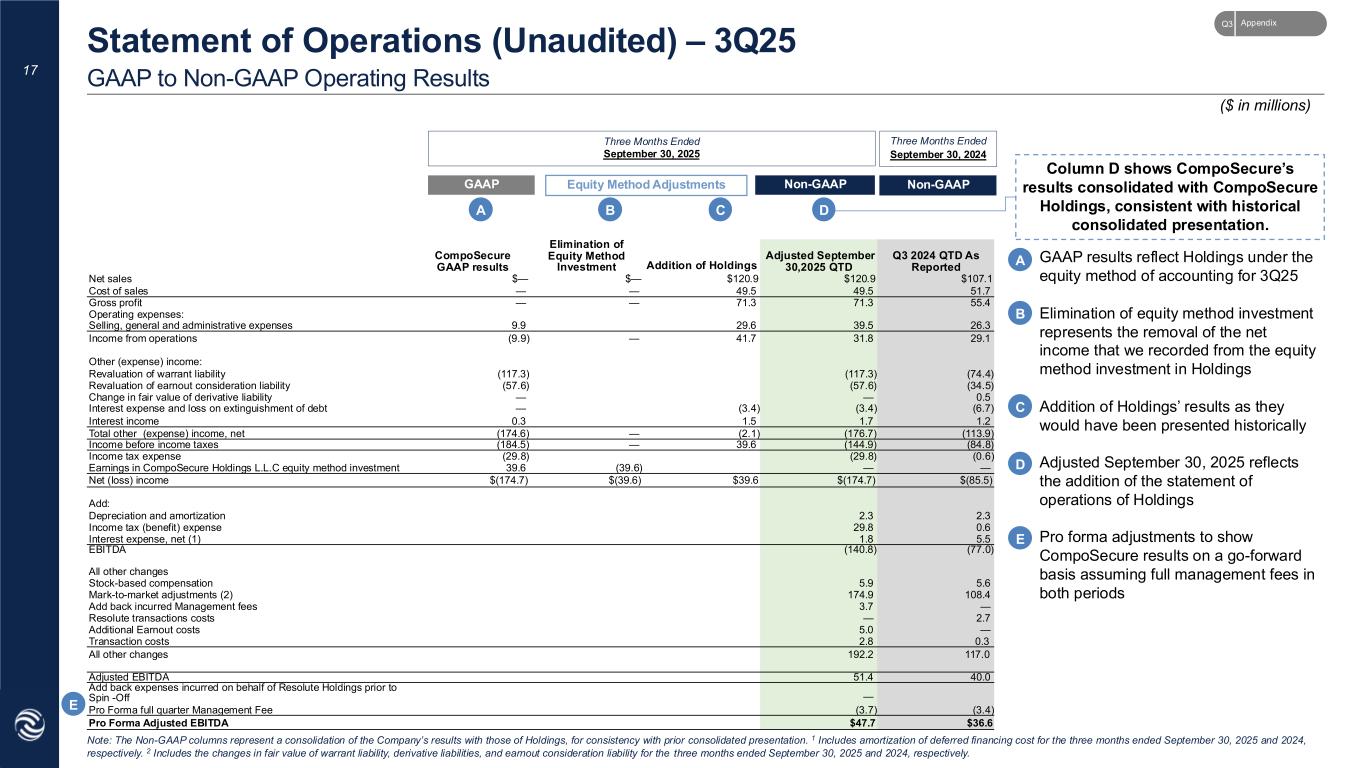
Statements of Operations Three Months Ended September 30, 2025 and 2024 ($ in thousands, except per share amounts) (unaudited) GAAP to Non-GAAP Operating Results Three Months Ended September 30, 2025 Three Months Ended September 30, 2024 GAAP Equity Method Adjustments Non-GAAP Non-GAAP As Reported Elimination of Equity Method Investment Addition of Holdings As Adjusted As Reported Net sales $ — $ — $ 120,865 $ 120,865 $ 107,135 Cost of sales — — 49,538 49,538 51,727 Gross profit — — 71,327 71,327 55,408 Operating expenses: Selling, general and administrative expenses 9,939 29,610 39,549 26,316 Income from operations (9,939) — 41,717 31,778 29,092 Other (expense) income: Revaluation of warrant liability (117,267) (117,267) (74,418) Revaluation of earnout consideration liability (57,610) (57,610) (34,530) Change in fair value of derivative liability — — 544 Interest expense — (3,371) (3,371) (6,303) Interest income 287 1,458 1,745 1,167 Loss on extinguishment of debt — (148) Amortization of deferred financing costs — (167) (167) (249) Total other (expense) income, net (174,590) — (2,080) (176,670) (113,937) Income before income taxes (184,529) — 39,637 (144,892) (84,845) Income tax expense (29,804) (29,804) (629) Earnings in CompoSecure Holdings L.L.C equity method investment 39,637 (39,637) — — Net (loss) income $ (174,696) $ (39,637) $ 39,637 $ (174,696) $ (85,474) Add: Depreciation and amortization 2,288 2,331 Income tax (benefit) expense 29,804 629 Interest expense, net (1) 1,793 5,533 EBITDA $ (140,811) $ (76,981) All other changes Stock-based compensation 5,882 5,634 Mark to market adjustments (2) 174,877 108,404 Add back incurred Management Fees 3,698 — Debt refinance costs — 225 Resolute transactions costs — 2,726 Additional earnout costs 4,967 — Transaction costs 2,806 — All other changes $ 192,230 $ 116,989 Adjusted EBITDA $ 51,419 $ 40,008 Add back expenses incurred on behalf of Resolute Holdings prior to Spin-Off — Pro Forma full quarter Management Fee (3,698) (3,379) Pro Forma Adjusted EBITDA $ 47,721 $ 36,629 Note: The Non-GAAP columns represent a consolidation of the Company’s results with those of CompoSecure Holdings, for consistency with prior period presentation. 1Includes amortization of deferred financing costs for the three months ended September 30, 2025 and 2024, respectively. 2 Includes changes in fair value of warrant liability, derivative liabilities and earnout consideration liability for the three months ended September 30, 2025 and 2024, respectively.
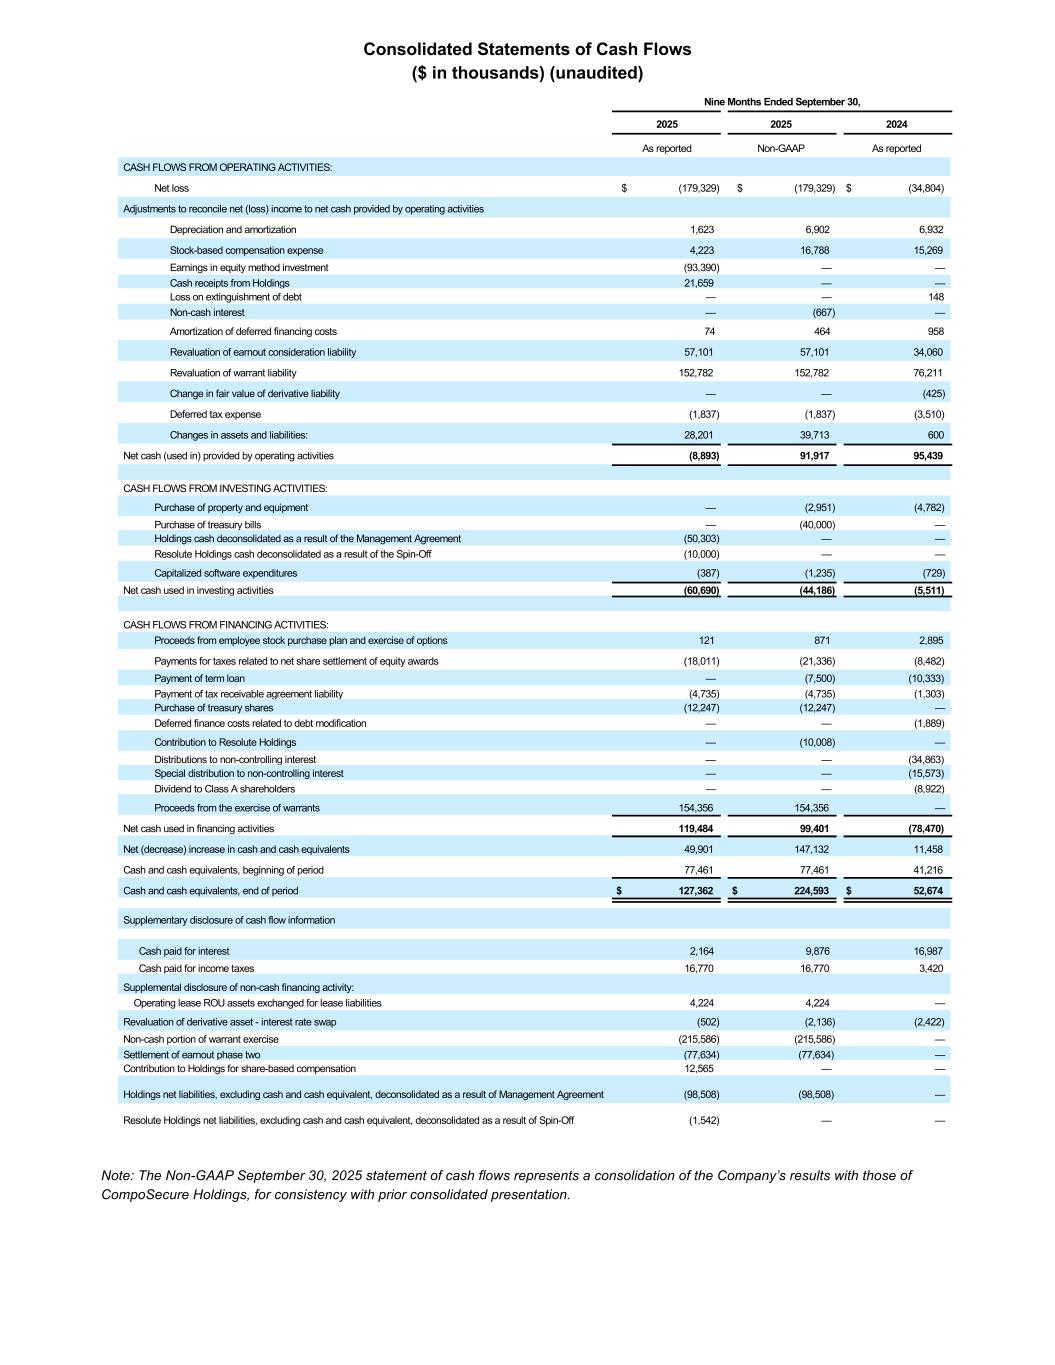

 
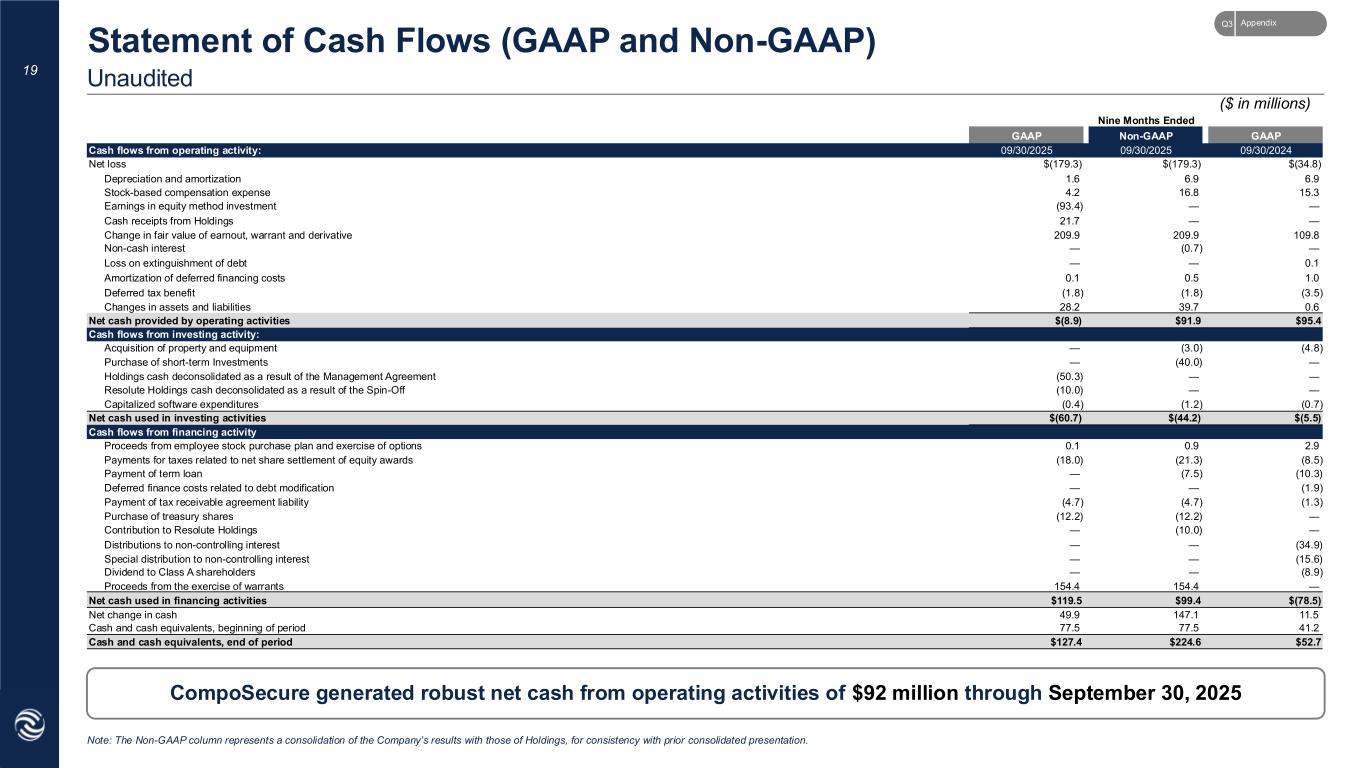
Consolidated Statements of Cash Flows ($ in thousands) (unaudited) Note: The Non-GAAP September 30, 2025 statement of cash flows represents a consolidation of the Company’s results with those of CompoSecure Holdings, for consistency with prior consolidated presentation. Nine Months Ended September 30, 2025 2025 2024 As reported Non-GAAP As reported CASH FLOWS FROM OPERATING ACTIVITIES: Net loss $ (179,329) $ (179,329) $ (34,804) Adjustments to reconcile net (loss) income to net cash provided by operating activities Depreciation and amortization 1,623 6,902 6,932 Stock-based compensation expense 4,223 16,788 15,269 Earnings in equity method investment (93,390) — — Cash receipts from Holdings 21,659 — — Loss on extinguishment of debt — — 148 Non-cash interest — (667) — Amortization of deferred financing costs 74 464 958 Revaluation of earnout consideration liability 57,101 57,101 34,060 Revaluation of warrant liability 152,782 152,782 76,211 Change in fair value of derivative liability — — (425) Deferred tax expense (1,837) (1,837) (3,510) Changes in assets and liabilities: 28,201 39,713 600 Net cash (used in) provided by operating activities (8,893) 91,917 95,439 CASH FLOWS FROM INVESTING ACTIVITIES: Purchase of property and equipment — (2,951) (4,782) Purchase of treasury bills — (40,000) — Holdings cash deconsolidated as a result of the Management Agreement (50,303) — — Resolute Holdings cash deconsolidated as a result of the Spin-Off (10,000) — — Capitalized software expenditures (387) (1,235) (729) Net cash used in investing activities (60,690) (44,186) (5,511) CASH FLOWS FROM FINANCING ACTIVITIES: Proceeds from employee stock purchase plan and exercise of options 121 871 2,895 Payments for taxes related to net share settlement of equity awards (18,011) (21,336) (8,482) Payment of term loan — (7,500) (10,333) Payment of tax receivable agreement liability (4,735) (4,735) (1,303) Purchase of treasury shares (12,247) (12,247) — Deferred finance costs related to debt modification — — (1,889) Contribution to Resolute Holdings — (10,008) — Distributions to non-controlling interest — — (34,863) Special distribution to non-controlling interest — — (15,573) Dividend to Class A shareholders — — (8,922) Proceeds from the exercise of warrants 154,356 154,356 — Net cash used in financing activities 119,484 99,401 (78,470) Net (decrease) increase in cash and cash equivalents 49,901 147,132 11,458 Cash and cash equivalents, beginning of period 77,461 77,461 41,216 Cash and cash equivalents, end of period $ 127,362 $ 224,593 $ 52,674 Supplementary disclosure of cash flow information Cash paid for interest 2,164 9,876 16,987 Cash paid for income taxes 16,770 16,770 3,420 Supplemental disclosure of non-cash financing activity: Operating lease ROU assets exchanged for lease liabilities 4,224 4,224 — Revaluation of derivative asset - interest rate swap (502) (2,136) (2,422) Non-cash portion of warrant exercise (215,586) (215,586) — Settlement of earnout phase two (77,634) (77,634) — Contribution to Holdings for share-based compensation 12,565 — — Holdings net liabilities, excluding cash and cash equivalent, deconsolidated as a result of Management Agreement (98,508) (98,508) — Resolute Holdings net liabilities, excluding cash and cash equivalent, deconsolidated as a result of Spin-Off (1,542) — —
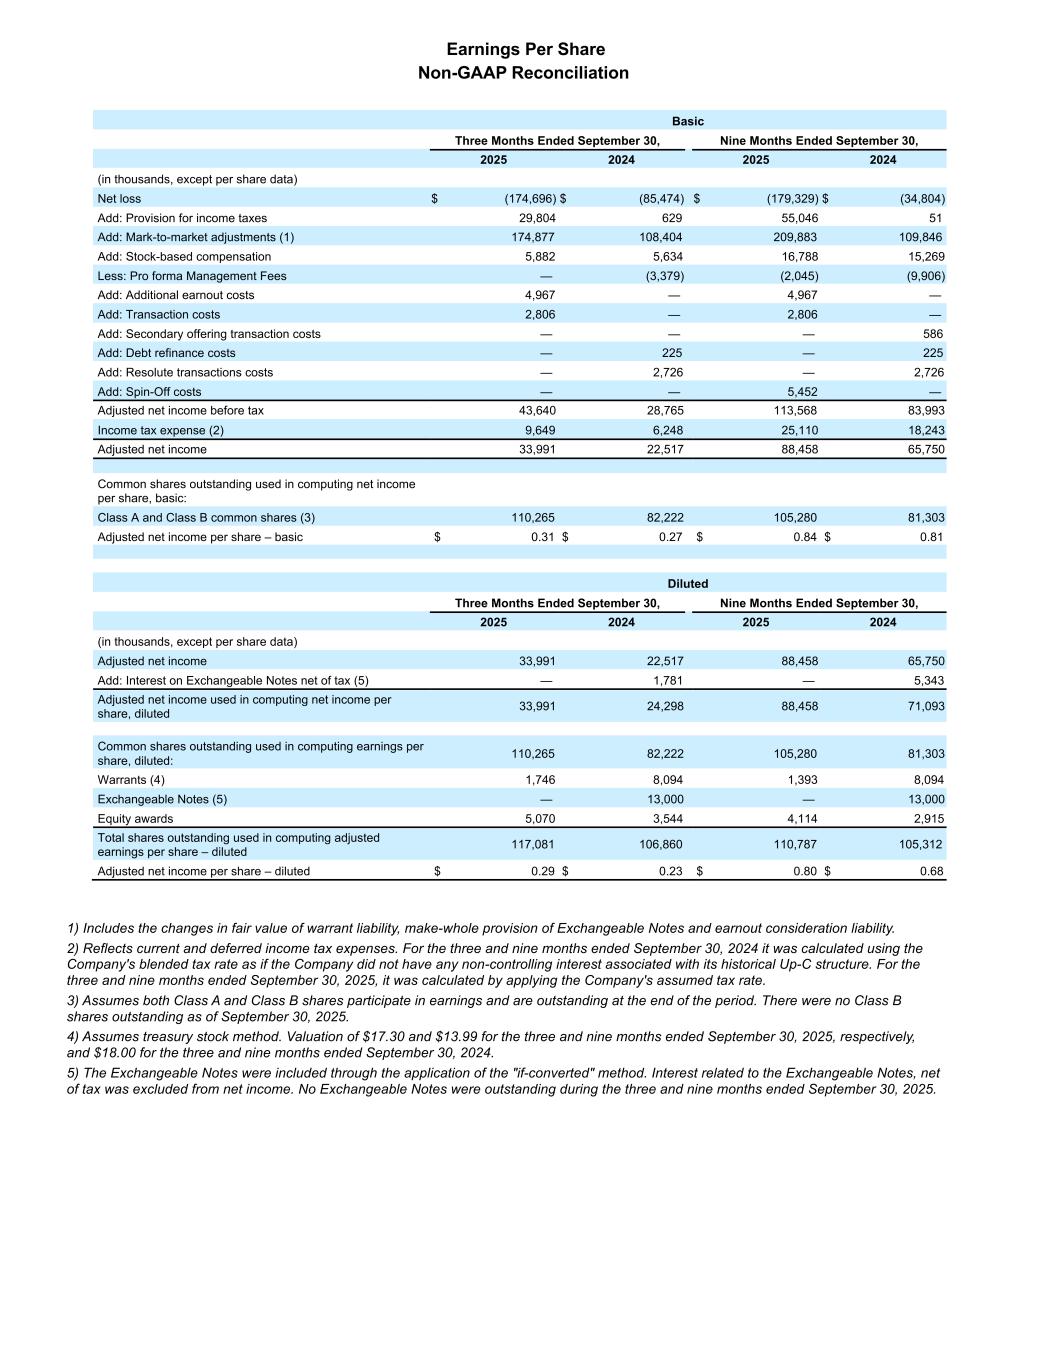

 
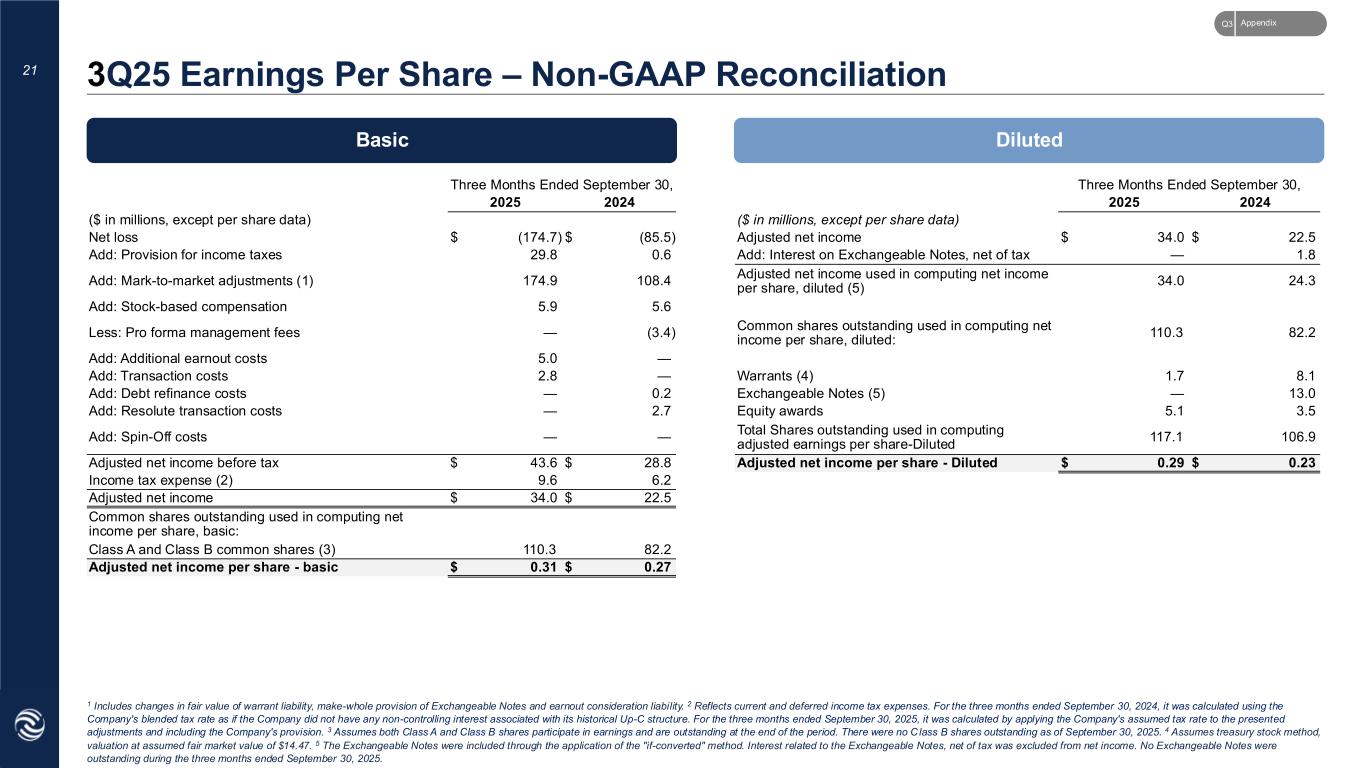
Earnings Per Share Non-GAAP Reconciliation Basic Three Months Ended September 30, Nine Months Ended September 30, 2025 2024 2025 2024 (in thousands, except per share data) Net loss $ (174,696) $ (85,474) $ (179,329) $ (34,804) Add: Provision for income taxes 29,804 629 55,046 51 Add: Mark-to-market adjustments (1) 174,877 108,404 209,883 109,846 Add: Stock-based compensation 5,882 5,634 16,788 15,269 Less: Pro forma Management Fees — (3,379) (2,045) (9,906) Add: Additional earnout costs 4,967 — 4,967 — Add: Transaction costs 2,806 — 2,806 — Add: Secondary offering transaction costs — — — 586 Add: Debt refinance costs — 225 — 225 Add: Resolute transactions costs — 2,726 — 2,726 Add: Spin-Off costs — — 5,452 — Adjusted net income before tax 43,640 28,765 113,568 83,993 Income tax expense (2) 9,649 6,248 25,110 18,243 Adjusted net income 33,991 22,517 88,458 65,750 Common shares outstanding used in computing net income per share, basic: Class A and Class B common shares (3) 110,265 82,222 105,280 81,303 Adjusted net income per share – basic $ 0.31 $ 0.27 $ 0.84 $ 0.81 Diluted Three Months Ended September 30, Nine Months Ended September 30, 2025 2024 2025 2024 (in thousands, except per share data) Adjusted net income 33,991 22,517 88,458 65,750 Add: Interest on Exchangeable Notes net of tax (5) — 1,781 — 5,343 Adjusted net income used in computing net income per share, diluted 33,991 24,298 88,458 71,093 Common shares outstanding used in computing earnings per share, diluted: 110,265 82,222 105,280 81,303 Warrants (4) 1,746 8,094 1,393 8,094 Exchangeable Notes (5) — 13,000 — 13,000 Equity awards 5,070 3,544 4,114 2,915 Total shares outstanding used in computing adjusted earnings per share – diluted 117,081 106,860 110,787 105,312 Adjusted net income per share – diluted $ 0.29 $ 0.23 $ 0.80 $ 0.68 1) Includes the changes in fair value of warrant liability, make-whole provision of Exchangeable Notes and earnout consideration liability. 2) Reflects current and deferred income tax expenses. For the three and nine months ended September 30, 2024 it was calculated using the Company's blended tax rate as if the Company did not have any non-controlling interest associated with its historical Up-C structure. For the three and nine months ended September 30, 2025, it was calculated by applying the Company's assumed tax rate. 3) Assumes both Class A and Class B shares participate in earnings and are outstanding at the end of the period. There were no Class B shares outstanding as of September 30, 2025. 4) Assumes treasury stock method. Valuation of $17.30 and $13.99 for the three and nine months ended September 30, 2025, respectively, and $18.00 for the three and nine months ended September 30, 2024. 5) The Exchangeable Notes were included through the application of the "if-converted" method. Interest related to the Exchangeable Notes, net of tax was excluded from net income. No Exchangeable Notes were outstanding during the three and nine months ended September 30, 2025.

 
November 3, 2025 Third Quarter 2025 Earnings Presentation


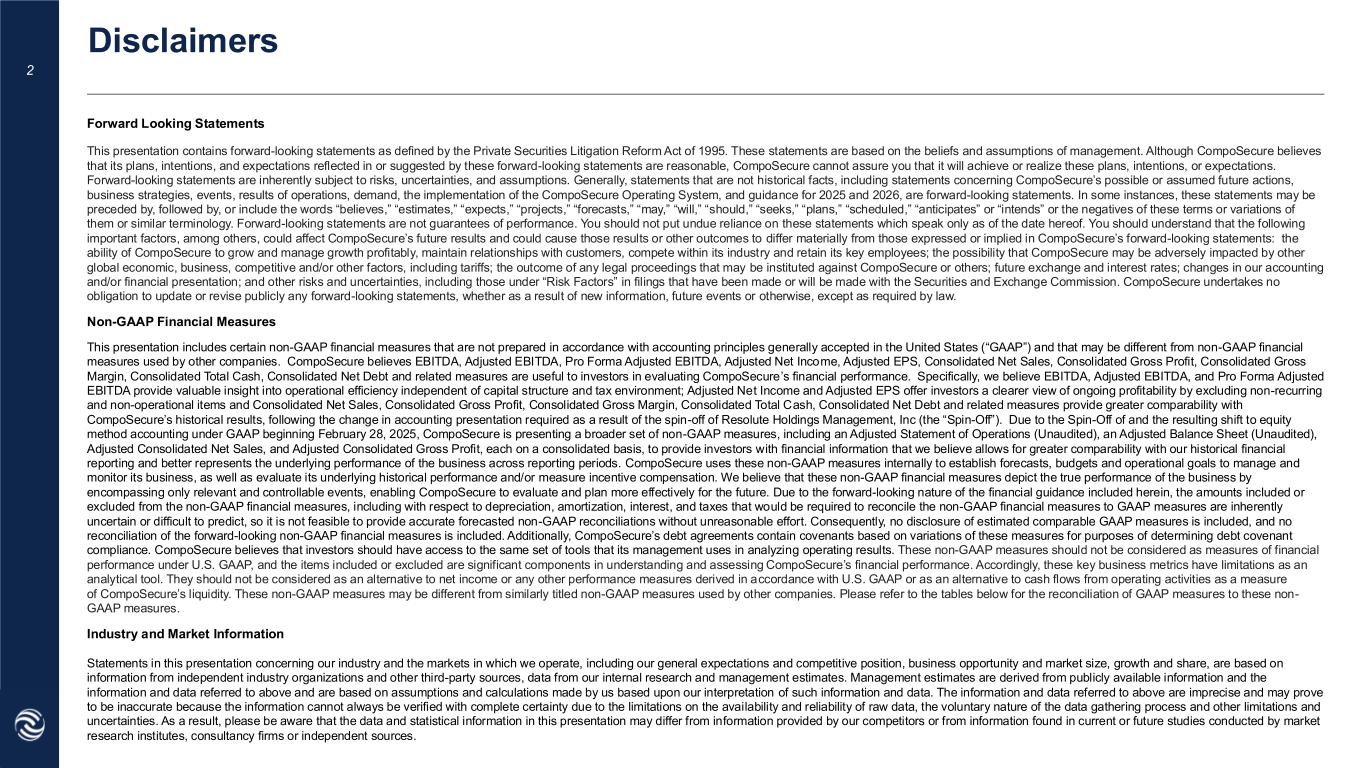
2 Forward Looking Statements This presentation contains forward-looking statements as defined by the Private Securities Litigation Reform Act of 1995. These statements are based on the beliefs and assumptions of management. Although CompoSecure believes that its plans, intentions, and expectations reflected in or suggested by these forward-looking statements are reasonable, CompoSecure cannot assure you that it will achieve or realize these plans, intentions, or expectations. Forward-looking statements are inherently subject to risks, uncertainties, and assumptions. Generally, statements that are not historical facts, including statements concerning CompoSecure’s possible or assumed future actions, business strategies, events, results of operations, demand, the implementation of the CompoSecure Operating System, and guidance for 2025 and 2026, are forward-looking statements. In some instances, these statements may be preceded by, followed by, or include the words “believes,” “estimates,” “expects,” “projects,” “forecasts,” “may,” “will,” “should,” “seeks,” “plans,” “scheduled,” “anticipates” or “intends” or the negatives of these terms or variations of them or similar terminology. Forward-looking statements are not guarantees of performance. You should not put undue reliance on these statements which speak only as of the date hereof. You should understand that the following important factors, among others, could affect CompoSecure’s future results and could cause those results or other outcomes to differ materially from those expressed or implied in CompoSecure’s forward-looking statements: the ability of CompoSecure to grow and manage growth profitably, maintain relationships with customers, compete within its industry and retain its key employees; the possibility that CompoSecure may be adversely impacted by other global economic, business, competitive and/or other factors, including tariffs; the outcome of any legal proceedings that may be instituted against CompoSecure or others; future exchange and interest rates; changes in our accounting and/or financial presentation; and other risks and uncertainties, including those under “Risk Factors” in filings that have been made or will be made with the Securities and Exchange Commission. CompoSecure undertakes no obligation to update or revise publicly any forward-looking statements, whether as a result of new information, future events or otherwise, except as required by law. Non-GAAP Financial Measures This presentation includes certain non-GAAP financial measures that are not prepared in accordance with accounting principles generally accepted in the United States (“GAAP”) and that may be different from non-GAAP financial measures used by other companies. CompoSecure believes EBITDA, Adjusted EBITDA, Pro Forma Adjusted EBITDA, Adjusted Net Income, Adjusted EPS, Consolidated Net Sales, Consolidated Gross Profit, Consolidated Gross Margin, Consolidated Total Cash, Consolidated Net Debt and related measures are useful to investors in evaluating CompoSecure’s financial performance. Specifically, we believe EBITDA, Adjusted EBITDA, and Pro Forma Adjusted EBITDA provide valuable insight into operational efficiency independent of capital structure and tax environment; Adjusted Net Income and Adjusted EPS offer investors a clearer view of ongoing profitability by excluding non-recurring and non-operational items and Consolidated Net Sales, Consolidated Gross Profit, Consolidated Gross Margin, Consolidated Total Cash, Consolidated Net Debt and related measures provide greater comparability with CompoSecure’s historical results, following the change in accounting presentation required as a result of the spin-off of Resolute Holdings Management, Inc (the “Spin-Off”). Due to the Spin-Off of and the resulting shift to equity method accounting under GAAP beginning February 28, 2025, CompoSecure is presenting a broader set of non-GAAP measures, including an Adjusted Statement of Operations (Unaudited), an Adjusted Balance Sheet (Unaudited), Adjusted Consolidated Net Sales, and Adjusted Consolidated Gross Profit, each on a consolidated basis, to provide investors with financial information that we believe allows for greater comparability with our historical financial reporting and better represents the underlying performance of the business across reporting periods. CompoSecure uses these non-GAAP measures internally to establish forecasts, budgets and operational goals to manage and monitor its business, as well as evaluate its underlying historical performance and/or measure incentive compensation. We believe that these non-GAAP financial measures depict the true performance of the business by encompassing only relevant and controllable events, enabling CompoSecure to evaluate and plan more effectively for the future. Due to the forward-looking nature of the financial guidance included herein, the amounts included or excluded from the non-GAAP financial measures, including with respect to depreciation, amortization, interest, and taxes that would be required to reconcile the non-GAAP financial measures to GAAP measures are inherently uncertain or difficult to predict, so it is not feasible to provide accurate forecasted non-GAAP reconciliations without unreasonable effort. Consequently, no disclosure of estimated comparable GAAP measures is included, and no reconciliation of the forward-looking non-GAAP financial measures is included. Additionally, CompoSecure’s debt agreements contain covenants based on variations of these measures for purposes of determining debt covenant compliance. CompoSecure believes that investors should have access to the same set of tools that its management uses in analyzing operating results. These non-GAAP measures should not be considered as measures of financial performance under U.S. GAAP, and the items included or excluded are significant components in understanding and assessing CompoSecure’s financial performance. Accordingly, these key business metrics have limitations as an analytical tool. They should not be considered as an alternative to net income or any other performance measures derived in accordance with U.S. GAAP or as an alternative to cash flows from operating activities as a measure of CompoSecure’s liquidity. These non-GAAP measures may be different from similarly titled non-GAAP measures used by other companies. Please refer to the tables below for the reconciliation of GAAP measures to these non- GAAP measures. Industry and Market Information Statements in this presentation concerning our industry and the markets in which we operate, including our general expectations and competitive position, business opportunity and market size, growth and share, are based on information from independent industry organizations and other third-party sources, data from our internal research and management estimates. Management estimates are derived from publicly available information and the information and data referred to above and are based on assumptions and calculations made by us based upon our interpretation of such information and data. The information and data referred to above are imprecise and may prove to be inaccurate because the information cannot always be verified with complete certainty due to the limitations on the availability and reliability of raw data, the voluntary nature of the data gathering process and other limitations and uncertainties. As a result, please be aware that the data and statistical information in this presentation may differ from information provided by our competitors or from information found in current or future studies conducted by market research institutes, consultancy firms or independent sources. Disclaimers


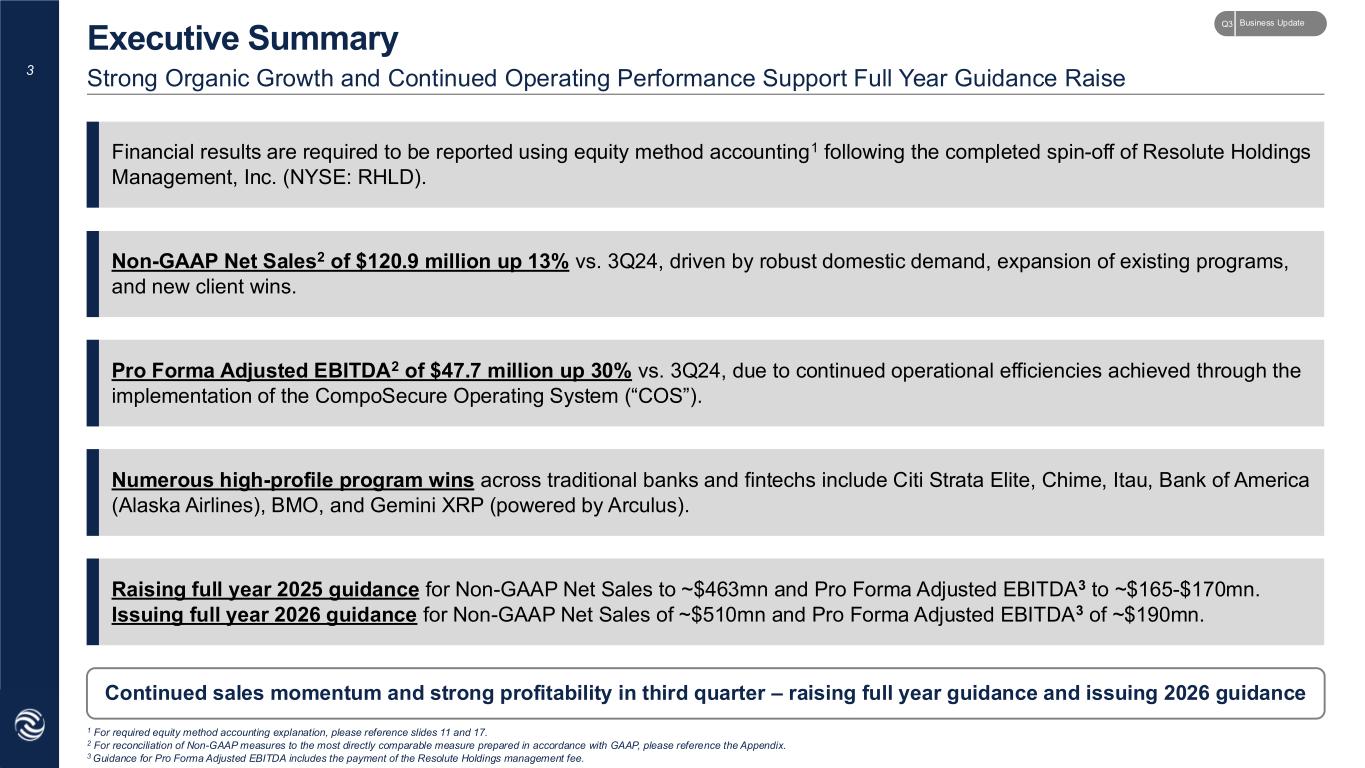
3 Continued sales momentum and strong profitability in third quarter – raising full year guidance and issuing 2026 guidance Financial results are required to be reported using equity method accounting1 following the completed spin-off of Resolute Holdings Management, Inc. (NYSE: RHLD). Non-GAAP Net Sales2 of $120.9 million up 13% vs. 3Q24, driven by robust domestic demand, expansion of existing programs, and new client wins. Pro Forma Adjusted EBITDA2 of $47.7 million up 30% vs. 3Q24, due to continued operational efficiencies achieved through the implementation of the CompoSecure Operating System (“COS”). Numerous high-profile program wins across traditional banks and fintechs include Citi Strata Elite, Chime, Itau, Bank of America (Alaska Airlines), BMO, and Gemini XRP (powered by Arculus). Raising full year 2025 guidance for Non-GAAP Net Sales to ~$463mn and Pro Forma Adjusted EBITDA3 to ~$165-$170mn. Issuing full year 2026 guidance for Non-GAAP Net Sales of ~$510mn and Pro Forma Adjusted EBITDA3 of ~$190mn. 1 For required equity method accounting explanation, please reference slides 11 and 17. 2 For reconciliation of Non-GAAP measures to the most directly comparable measure prepared in accordance with GAAP, please reference the Appendix. 3 Guidance for Pro Forma Adjusted EBITDA includes the payment of the Resolute Holdings management fee. Strong Organic Growth and Continued Operating Performance Support Full Year Guidance Raise Executive Summary Business UpdateQ3


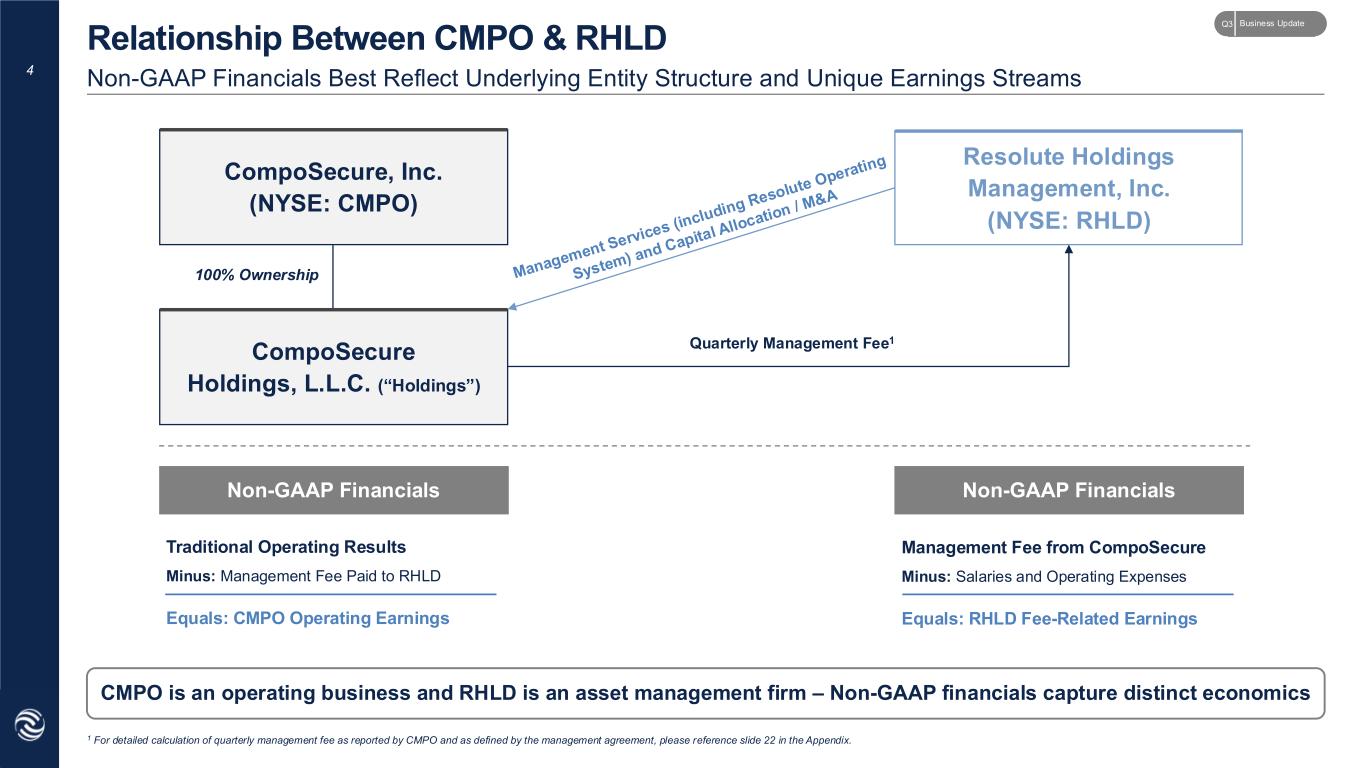
4 CMPO is an operating business and RHLD is an asset management firm – Non-GAAP financials capture distinct economics Non-GAAP Financials Best Reflect Underlying Entity Structure and Unique Earnings Streams Relationship Between CMPO & RHLD CompoSecure, Inc. (NYSE: CMPO) Resolute Holdings Management, Inc. (NYSE: RHLD) CompoSecure Holdings, L.L.C. (“Holdings”) 100% Ownership Quarterly Management Fee1 Non-GAAP Financials Non-GAAP Financials Traditional Operating Results Minus: Management Fee Paid to RHLD Equals: CMPO Operating Earnings Management Fee from CompoSecure Minus: Salaries and Operating Expenses Equals: RHLD Fee-Related Earnings 1 For detailed calculation of quarterly management fee as reported by CMPO and as defined by the management agreement, please reference slide 22 in the Appendix. Business UpdateQ3


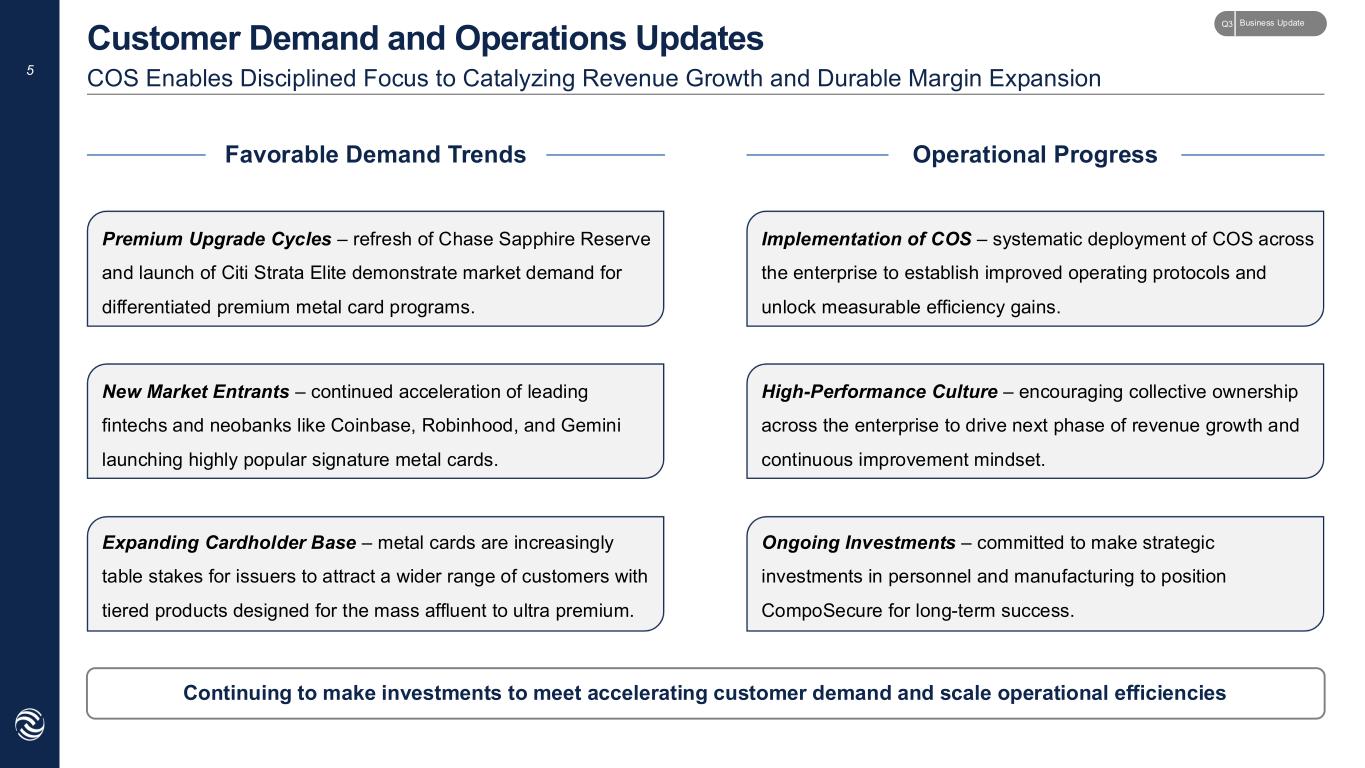
5 Continuing to make investments to meet accelerating customer demand and scale operational efficiencies Favorable Demand Trends Operational Progress Premium Upgrade Cycles – refresh of Chase Sapphire Reserve and launch of Citi Strata Elite demonstrate market demand for differentiated premium metal card programs. New Market Entrants – continued acceleration of leading fintechs and neobanks like Coinbase, Robinhood, and Gemini launching highly popular signature metal cards. Expanding Cardholder Base – metal cards are increasingly table stakes for issuers to attract a wider range of customers with tiered products designed for the mass affluent to ultra premium. Implementation of COS – systematic deployment of COS across the enterprise to establish improved operating protocols and unlock measurable efficiency gains. High-Performance Culture – encouraging collective ownership across the enterprise to drive next phase of revenue growth and continuous improvement mindset. Ongoing Investments – committed to make strategic investments in personnel and manufacturing to position CompoSecure for long-term success. COS Enables Disciplined Focus to Catalyzing Revenue Growth and Durable Margin Expansion Customer Demand and Operations Updates Business UpdateQ3


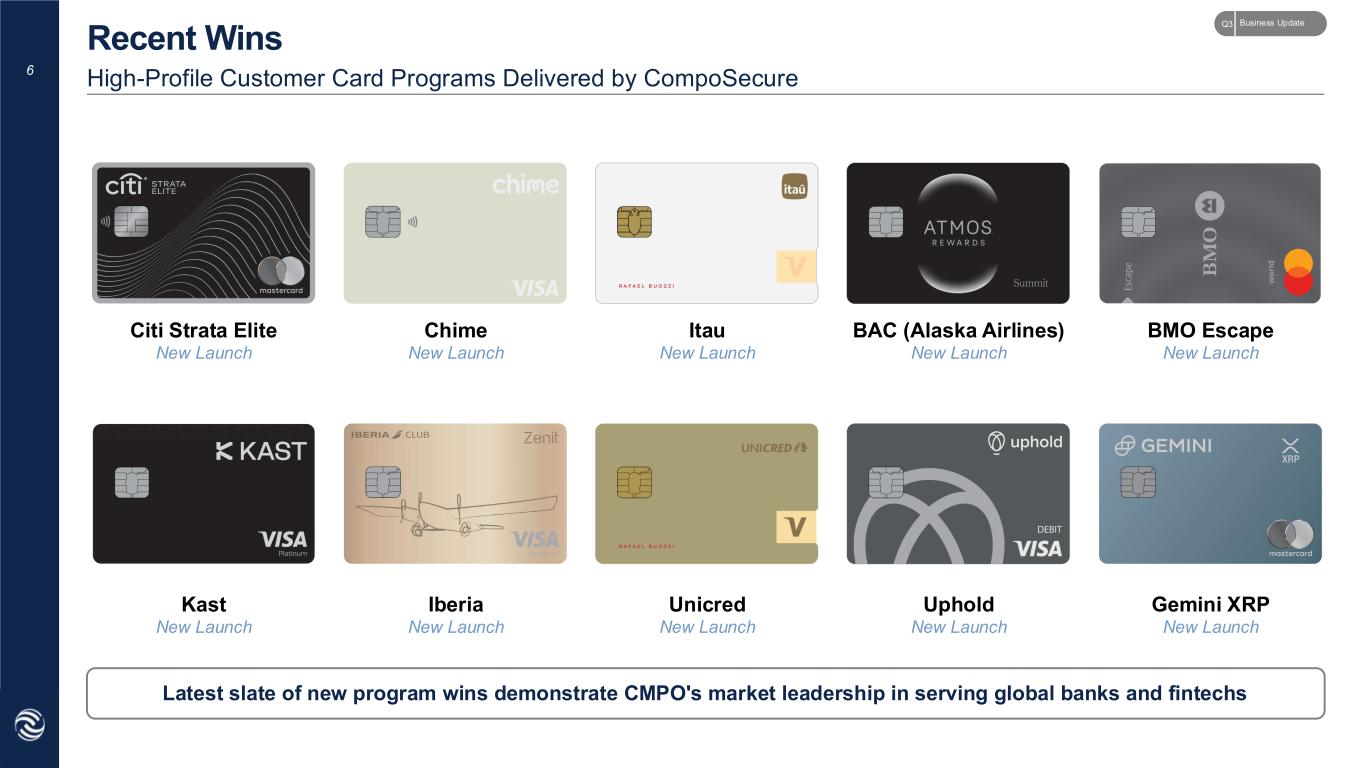
6 Citi Strata Elite New Launch Itau New Launch BAC (Alaska Airlines) New Launch BMO Escape New Launch Unicred New Launch Kast New Launch High-Profile Customer Card Programs Delivered by CompoSecure Recent Wins Latest slate of new program wins demonstrate CMPO's market leadership in serving global banks and fintechs Uphold New Launch Gemini XRP New Launch Chime New Launch Iberia New Launch Business UpdateQ3


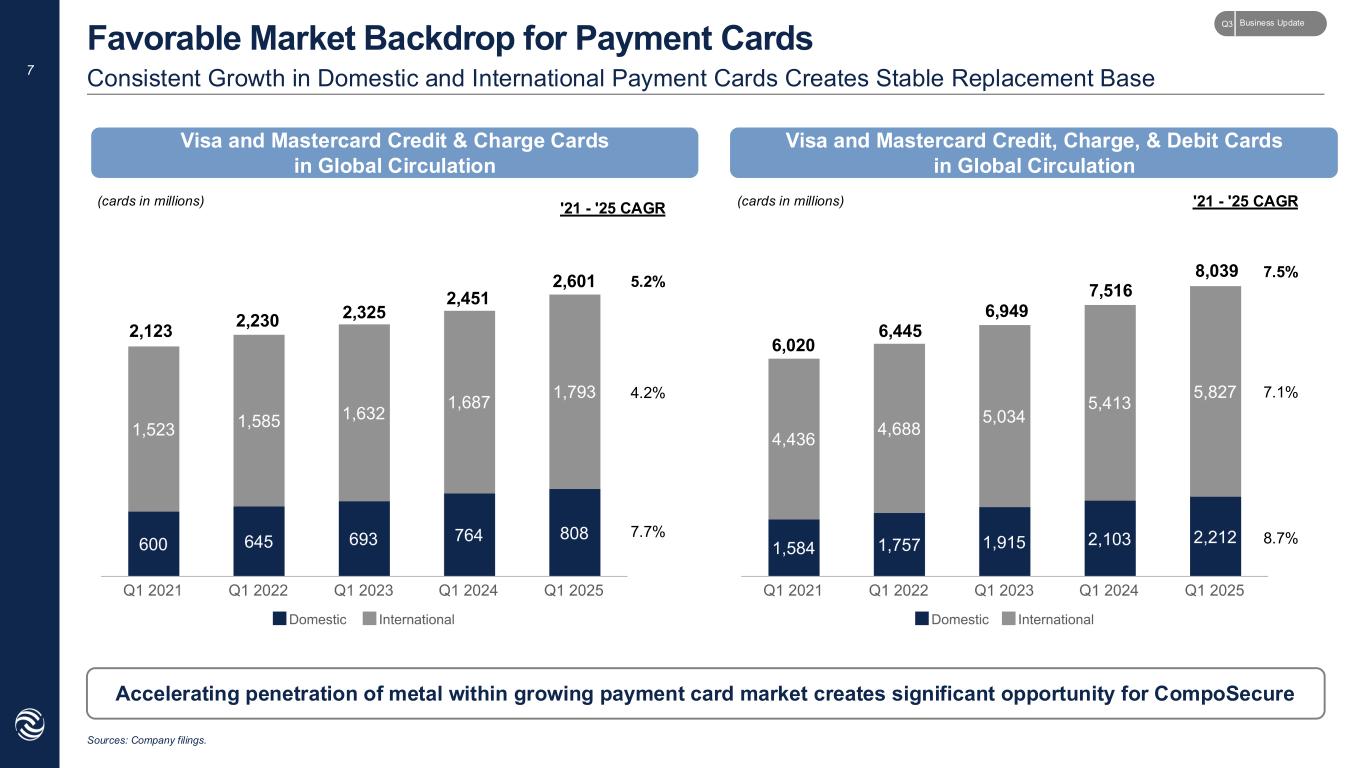
7 Sources: Company filings. Accelerating penetration of metal within growing payment card market creates significant opportunity for CompoSecure Visa and Mastercard Credit & Charge Cards in Global Circulation '21 - '25 CAGR Consistent Growth in Domestic and International Payment Cards Creates Stable Replacement Base Favorable Market Backdrop for Payment Cards 5.2% 4.2% 7.7% Visa and Mastercard Credit, Charge, & Debit Cards in Global Circulation '21 - '25 CAGR 7.5% 7.1% 8.7% (cards in millions) (cards in millions) 2,123 2,230 2,325 2,451 2,601 6,020 6,445 6,949 7,516 8,039 Business UpdateQ3


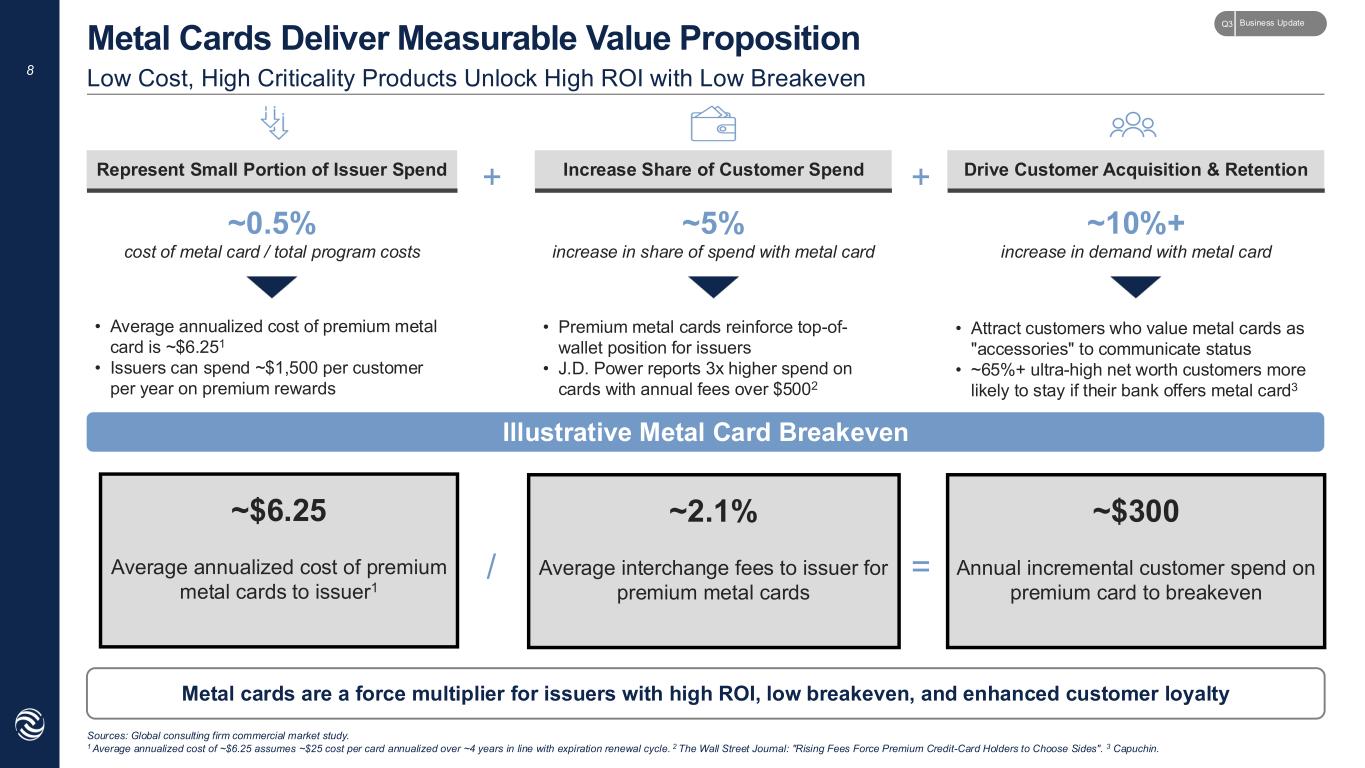
8 Sources: Global consulting firm commercial market study. 1 Average annualized cost of ~$6.25 assumes ~$25 cost per card annualized over ~4 years in line with expiration renewal cycle. 2 The Wall Street Journal: "Rising Fees Force Premium Credit-Card Holders to Choose Sides". 3 Capuchin. Metal cards are a force multiplier for issuers with high ROI, low breakeven, and enhanced customer loyalty Low Cost, High Criticality Products Unlock High ROI with Low Breakeven Metal Cards Deliver Measurable Value Proposition Illustrative Metal Card Breakeven ~2.1% Average interchange fees to issuer for premium metal cards ~$300 Annual incremental customer spend on premium card to breakeven ~$6.25 Average annualized cost of premium metal cards to issuer1 / = Represent Small Portion of Issuer Spend Increase Share of Customer Spend Drive Customer Acquisition & Retention+ + ~0.5% cost of metal card / total program costs • Average annualized cost of premium metal card is ~$6.251 • Issuers can spend ~$1,500 per customer per year on premium rewards ~5% increase in share of spend with metal card • Premium metal cards reinforce top-of- wallet position for issuers • J.D. Power reports 3x higher spend on cards with annual fees over $5002 ~10%+ increase in demand with metal card • Attract customers who value metal cards as "accessories" to communicate status • ~65%+ ultra-high net worth customers more likely to stay if their bank offers metal card3 Business UpdateQ3


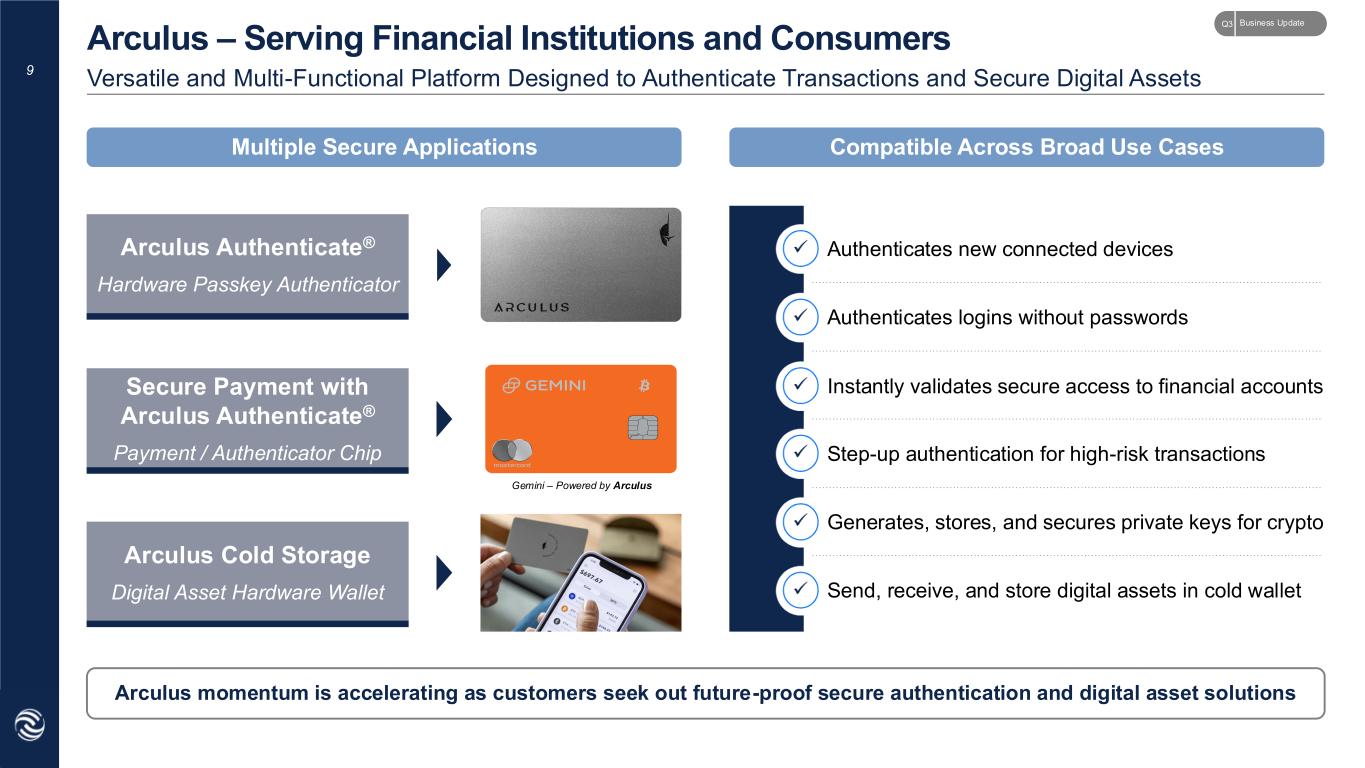
9 Arculus momentum is accelerating as customers seek out future-proof secure authentication and digital asset solutions Multiple Secure Applications Arculus Cold Storage Digital Asset Hardware Wallet Arculus Authenticate® Hardware Passkey Authenticator Authenticates new connected devices Authenticates logins without passwords Instantly validates secure access to financial accounts Step-up authentication for high-risk transactions Generates, stores, and secures private keys for crypto Send, receive, and store digital assets in cold wallet Compatible Across Broad Use Cases Versatile and Multi-Functional Platform Designed to Authenticate Transactions and Secure Digital Assets Arculus – Serving Financial Institutions and Consumers Gemini – Powered by Arculus Secure Payment with Arculus Authenticate® Payment / Authenticator Chip Business UpdateQ3


Financial Overview


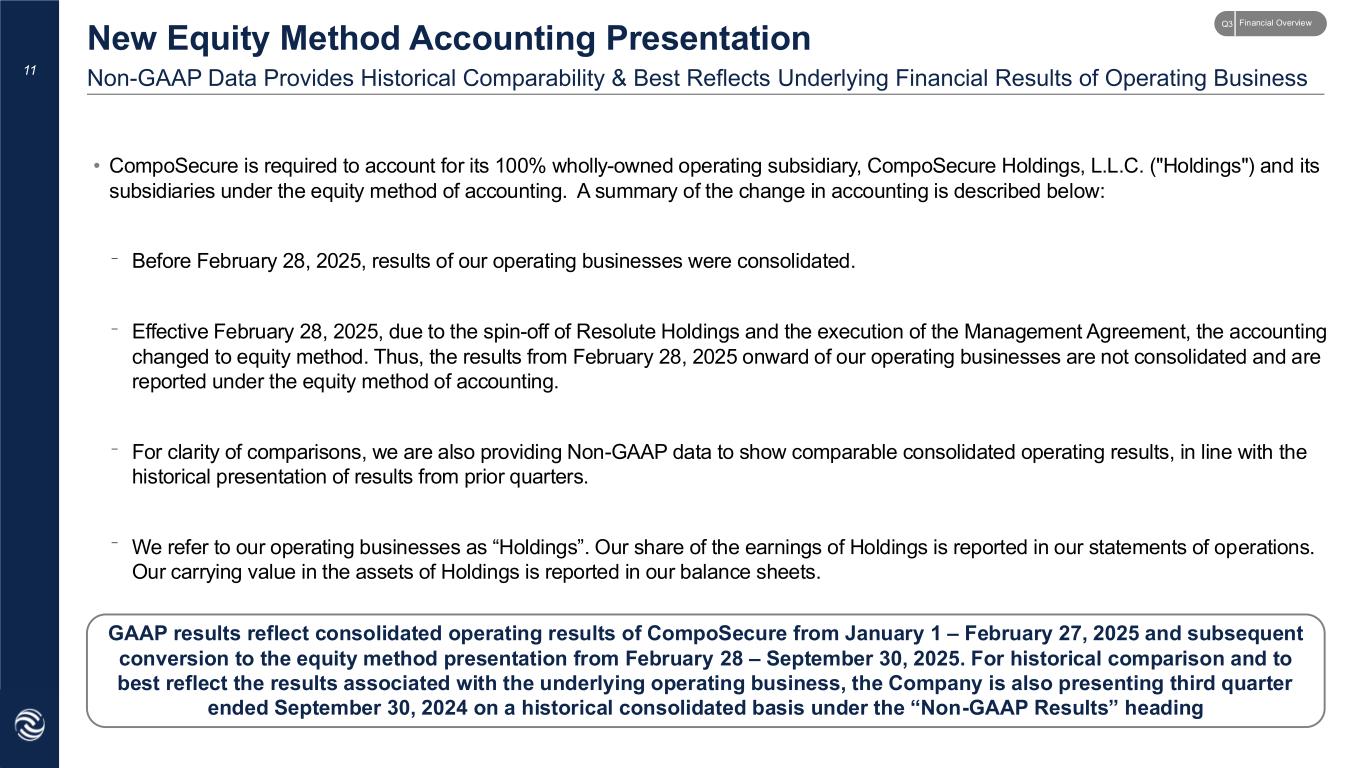
• CompoSecure is required to account for its 100% wholly-owned operating subsidiary, CompoSecure Holdings, L.L.C. ("Holdings") and its subsidiaries under the equity method of accounting. A summary of the change in accounting is described below: Before February 28, 2025, results of our operating businesses were consolidated. Effective February 28, 2025, due to the spin-off of Resolute Holdings and the execution of the Management Agreement, the accounting changed to equity method. Thus, the results from February 28, 2025 onward of our operating businesses are not consolidated and are reported under the equity method of accounting. For clarity of comparisons, we are also providing Non-GAAP data to show comparable consolidated operating results, in line with the historical presentation of results from prior quarters. We refer to our operating businesses as “Holdings”. Our share of the earnings of Holdings is reported in our statements of operations. Our carrying value in the assets of Holdings is reported in our balance sheets. GAAP results reflect consolidated operating results of CompoSecure from January 1 – February 27, 2025 and subsequent conversion to the equity method presentation from February 28 – September 30, 2025. For historical comparison and to best reflect the results associated with the underlying operating business, the Company is also presenting third quarter ended September 30, 2024 on a historical consolidated basis under the “Non-GAAP Results” heading 11 New Equity Method Accounting Presentation _ _ _ _ Non-GAAP Data Provides Historical Comparability & Best Reflects Underlying Financial Results of Operating Business Financial OverviewQ3


12 Significant Year-over-Year Progress Across All Key Reporting Metrics Operating Results Summary – 3Q25 Non-GAAP metrics best reflect operating performance and are consistent with historical presentation less management fee 1 Refers to a Non-GAAP Measure; please reference the Appendix for full reconciliation. 2 For 3Q24, Net Sales, Gross Profit, Gross Margin, and Cash and Cash Equivalents are identical on a GAAP and Non-GAAP basis, because such measures have historically been shown on a consolidated basis. As of September 30, 2025, $97.2 million of cash was held at Holdings and not included in the GAAP results. 3 Pro-Forma Adjusted EBITDA includes $3.7mn and $3.4mn management fee expense in 3Q25 and 3Q24, respectively. It was included as a pro forma adjustment to 3Q24 to allow for comparability across periods. Please reference Statement of Operations on slide 17 for full reconciliation. 4 As of September 30, 2025. 5 As of September 30, 2024. 6 Non-GAAP Total Debt is comprised entirely of debt at Holdings. 7 Investment in U.S. Treasury bills as of September 30, 2025. Net Sales Gross Profit Gross Margin (%) Pro Forma Adjusted EBITDA EPS / Adjusted EPS – Diluted Cash and Cash Equivalents Total Debt Three Months Ended September 30, 2025 GAAP Non-GAAP Three Months Ended September 30, 2024 GAAP Non-GAAP $—mn $120.9mn1 $71.3mn1$—mn 59.0%1—% $47.7mn1 $(1.58) $0.291 $127.4mn $224.6mn1,2,4 $190.0mn4,6 $107.1mn2 $107.1mn1,2 $55.4mn2 $55.4mn1,2 51.7%2 51.7%1,2 $36.6mn1,3 $(1.10) $0.231 $52.7mn2,5 $52.7mn2,5 $330.0mn5,6 Short-Term Investments $—mn $—mn $—mn$40.7mn4,7 Financial OverviewQ3


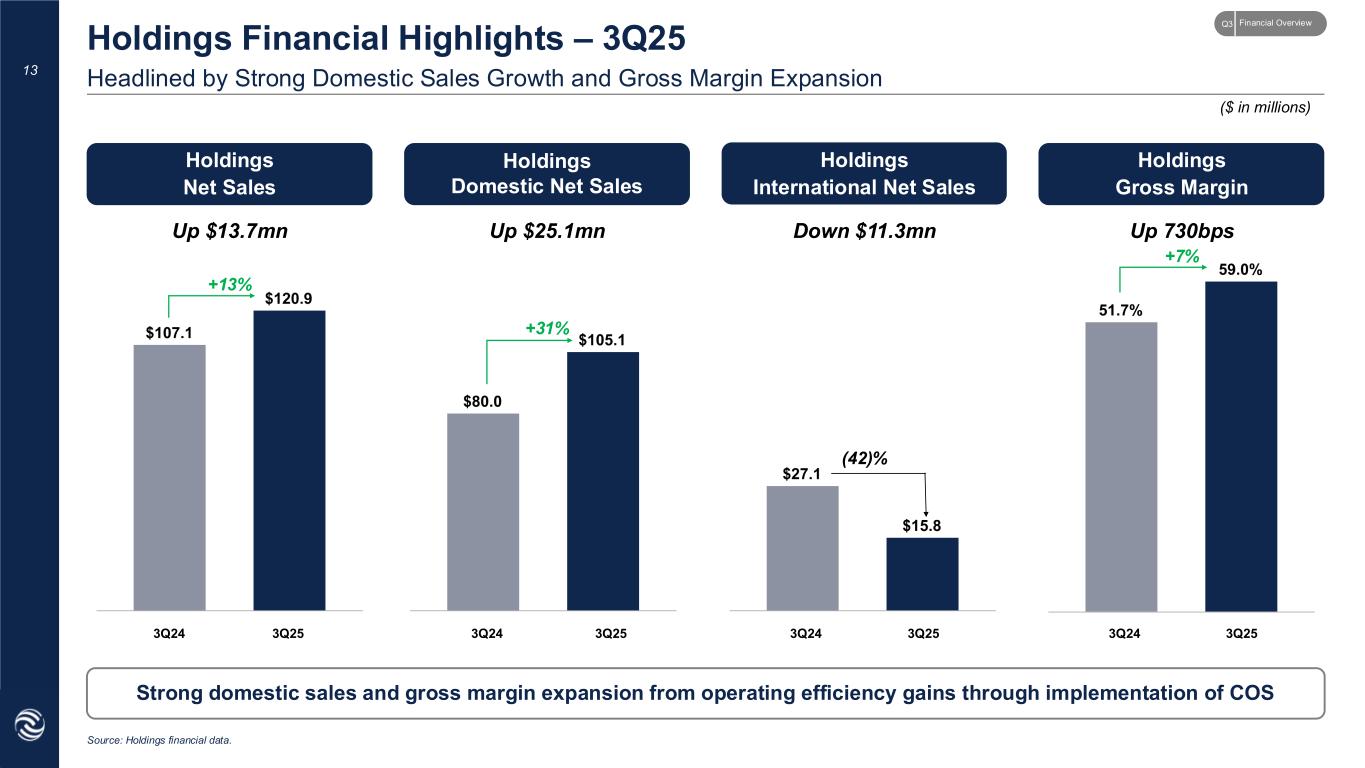
Holdings Net Sales Holdings Gross Margin Holdings International Net Sales Up $13.7mn Up 730bps Down $11.3mn ($ in millions) Holdings Domestic Net Sales Up $25.1mn 13 Headlined by Strong Domestic Sales Growth and Gross Margin Expansion Holdings Financial Highlights – 3Q25 Strong domestic sales and gross margin expansion from operating efficiency gains through implementation of COS +13% +31% (42)% +7% Source: Holdings financial data. 3Q24 3Q24 3Q24 3Q243Q25 3Q25 3Q25 3Q25 Financial OverviewQ3


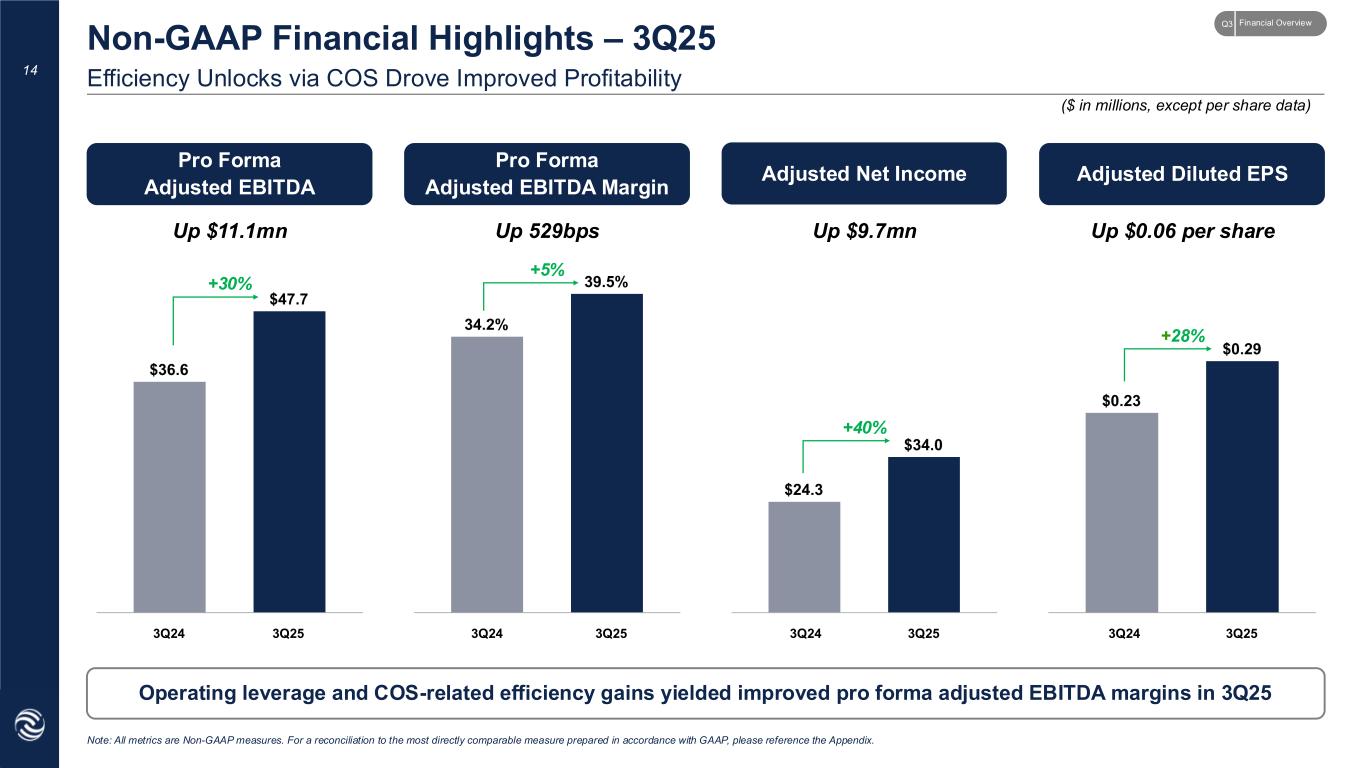
14 Efficiency Unlocks via COS Drove Improved Profitability Non-GAAP Financial Highlights – 3Q25 ($ in millions, except per share data) Pro Forma Adjusted EBITDA Adjusted Diluted EPSAdjusted Net Income Up $11.1mn Up $0.06 per shareUp $9.7mn Pro Forma Adjusted EBITDA Margin Up 529bps Note: All metrics are Non-GAAP measures. For a reconciliation to the most directly comparable measure prepared in accordance with GAAP, please reference the Appendix. Operating leverage and COS-related efficiency gains yielded improved pro forma adjusted EBITDA margins in 3Q25 +5% +40% +28% +30% 3Q24 3Q24 3Q24 3Q243Q25 3Q25 3Q25 3Q25 Financial OverviewQ3


15 Continued commercial and operational momentum with foundational investments to support long-term growth plans Consolidated Net Sales Pro Forma Adjusted EBITDA1 Note: All figures reflect dollars in millions. 1 Pro Forma Adjusted EBITDA includes the Management Fee anticipated to be paid for FY25 and FY26, and for FY24 reflects the Man agement Fee that would have been paid had the Management Agreement been in effect from January 1, 2024. Operating from a Position of Strength Reflects Increased Visibility into Customer Demand and Operating Performance Raising Full Year 2025 and Issuing 2026 Guidance Established market leader – long tenured and blue-chip customer base, best-in-class innovative products, and robust balance sheet Focused growth strategy – planted seeds and making targeted investments to drive organic and inorganic growth Favorable industry backdrop – increasing demand for metal cards Arculus optionality – growth upside in mission-critical authentication and securing digital assets +10% +20-23% FY24A FY26E +10% +12-15% FY25E FY24PF FY26EFY25E Financial OverviewQ3 ~$463 ~$510 ~$165-170 ~$190


Appendix


17 GAAP to Non-GAAP Operating Results Statement of Operations (Unaudited) – 3Q25 GAAP results reflect Holdings under the equity method of accounting for 3Q25 Elimination of equity method investment represents the removal of the net income that we recorded from the equity method investment in Holdings Addition of Holdings’ results as they would have been presented historically Adjusted September 30, 2025 reflects the addition of the statement of operations of Holdings Pro forma adjustments to show CompoSecure results on a go-forward basis assuming full management fees in both periods B C D A D Non-GAAPGAAP Non-GAAP Three Months Ended September 30, 2025 Three Months Ended September 30, 2024 Column D shows CompoSecure’s results consolidated with CompoSecure Holdings, consistent with historical consolidated presentation. Equity Method Adjustments ($ in millions) Note: The Non-GAAP columns represent a consolidation of the Company’s results with those of Holdings, for consistency with prior consolidated presentation. 1 Includes amortization of deferred financing cost for the three months ended September 30, 2025 and 2024, respectively. 2 Includes the changes in fair value of warrant liability, derivative liabilities, and earnout consideration liability for the three months ended September 30, 2025 and 2024, respectively. CompoSecure GAAP results Elimination of Equity Method Investment Addition of Holdings Adjusted September 30,2025 QTD Q3 2024 QTD As Reported Net sales $— $— $120.9 $120.9 $107.1 Cost of sales — — 49.5 49.5 51.7 Gross profit — — 71.3 71.3 55.4 Operating expenses: Selling, general and administrative expenses 9.9 29.6 39.5 26.3 Income from operations (9.9) — 41.7 31.8 29.1 Other (expense) income: Revaluation of warrant liability (117.3) (117.3) (74.4) Revaluation of earnout consideration liability (57.6) (57.6) (34.5) Change in fair value of derivative liability — — 0.5 Interest expense and loss on extinguishment of debt — (3.4) (3.4) (6.7) Interest income 0.3 1.5 1.7 1.2 Total other (expense) income, net (174.6) — (2.1) (176.7) (113.9) Income before income taxes (184.5) — 39.6 (144.9) (84.8) Income tax expense (29.8) (29.8) (0.6) Earnings in CompoSecure Holdings L.L.C equity method investment 39.6 (39.6) — — Net (loss) income $(174.7) $(39.6) $39.6 $(174.7) $(85.5) Add: Depreciation and amortization 2.3 2.3 Income tax (benefit) expense 29.8 0.6 Interest expense, net (1) 1.8 5.5 EBITDA (140.8) (77.0) All other changes Stock-based compensation 5.9 5.6 Mark-to-market adjustments (2) 174.9 108.4 Add back incurred Management fees 3.7 — Resolute transactions costs — 2.7 Additional Earnout costs 5.0 — Transaction costs 2.8 0.3 All other changes 192.2 117.0 Adjusted EBITDA 51.4 40.0 Add back expenses incurred on behalf of Resolute Holdings prior to Spin -Off — Pro Forma full quarter Management Fee (3.7) (3.4) Pro Forma Adjusted EBITDA $47.7 $36.6 AppendixQ3 E C B A E


GAAP Non-GAAP GAAP GAAP Non-GAAP GAAP September 30, 2025 September 30, 2025 December 31, 2024 September 30, 2025 September 30, 2025 December 31, 2024 ASSETS LIABILITIES AND STOCKHOLDERS' EQUITY CURRENT ASSETS CURRENT LIABILITIES Cash and cash equivalents (1) $127.4 $265.3 $77.5 Accounts payable $1.5 $14.1 $11.5 Accounts receivable — 64.2 47.4 Accrued expenses 40.9 81.9 25.7 Inventories, net — 43.7 44.8 Current portion of long-term debt — 15.0 11.3 Prepaid expenses and other current assets 4.7 7.5 4.2 Other current liabilities 16.1 18.2 27.8 Total current assets $132.0 $380.7 $173.9 Total current liabilities $58.5 $129.2 $76.3 Property and equipment, net and right of use assets — 28.2 28.9 Long-term debt, net of deferred financing costs — 173.4 184.4 Deferred tax asset 289.2 289.2 264.8 Warrant liability 41.4 41.4 104.2 Other assets — 4.7 6.3 Lease liabilities - operating leases — 6.6 3.9 Equity method investment 84.3 — — Tax receivable agreement liability 253.1 253.1 248.5 Total Assets $505.5 $702.8 $473.9 Total Liabilities $353.0 $603.8 $617.4 Shareholders' equity / (deficit) 152.5 99.0 (143.4) Total Liabilities and Shareholders' Equity / (Deficit) $505.5 $702.8 $473.9 18 Unaudited Balance Sheet (GAAP and Non-GAAP) Finished 3Q25 with over $75 million in net cash ($ in millions) Note: The Non-GAAP columns represent a consolidation of the Company’s results with those of Holdings, for consistency with prior consolidated presentation. 1 Cash and cash equivalents includes $40.7 million short-term investments. AppendixQ3


19 Unaudited Statement of Cash Flows (GAAP and Non-GAAP) CompoSecure generated robust net cash from operating activities of $92 million through September 30, 2025 Note: The Non-GAAP column represents a consolidation of the Company’s results with those of Holdings, for consistency with prior consolidated presentation. Nine Months Ended GAAP Non-GAAP GAAP Cash flows from operating activity: 09/30/2025 09/30/2025 09/30/2024 Net loss $(179.3) $(179.3) $(34.8) Depreciation and amortization 1.6 6.9 6.9 Stock-based compensation expense 4.2 16.8 15.3 Earnings in equity method investment (93.4) — — Cash receipts from Holdings 21.7 — — Change in fair value of earnout, warrant and derivative 209.9 209.9 109.8 Non-cash interest — (0.7) — Loss on extinguishment of debt — — 0.1 Amortization of deferred financing costs 0.1 0.5 1.0 Deferred tax benefit (1.8) (1.8) (3.5) Changes in assets and liabilities 28.2 39.7 0.6 Net cash provided by operating activities $(8.9) $91.9 $95.4 Cash flows from investing activity: Acquisition of property and equipment — (3.0) (4.8) Purchase of short-term Investments — (40.0) — Holdings cash deconsolidated as a result of the Management Agreement (50.3) — — Resolute Holdings cash deconsolidated as a result of the Spin-Off (10.0) — — Capitalized software expenditures (0.4) (1.2) (0.7) Net cash used in investing activities $(60.7) $(44.2) $(5.5) Cash flows from financing activity Proceeds from employee stock purchase plan and exercise of options 0.1 0.9 2.9 Payments for taxes related to net share settlement of equity awards (18.0) (21.3) (8.5) Payment of term loan — (7.5) (10.3) Deferred finance costs related to debt modification — — (1.9) Payment of tax receivable agreement liability (4.7) (4.7) (1.3) Purchase of treasury shares (12.2) (12.2) — Contribution to Resolute Holdings — (10.0) — Distributions to non-controlling interest — — (34.9) Special distribution to non-controlling interest — — (15.6) Dividend to Class A shareholders — — (8.9) Proceeds from the exercise of warrants 154.4 154.4 — Net cash used in financing activities $119.5 $99.4 $(78.5) Net change in cash 49.9 147.1 11.5 Cash and cash equivalents, beginning of period 77.5 77.5 41.2 Cash and cash equivalents, end of period $127.4 $224.6 $52.7 ($ in millions) AppendixQ3


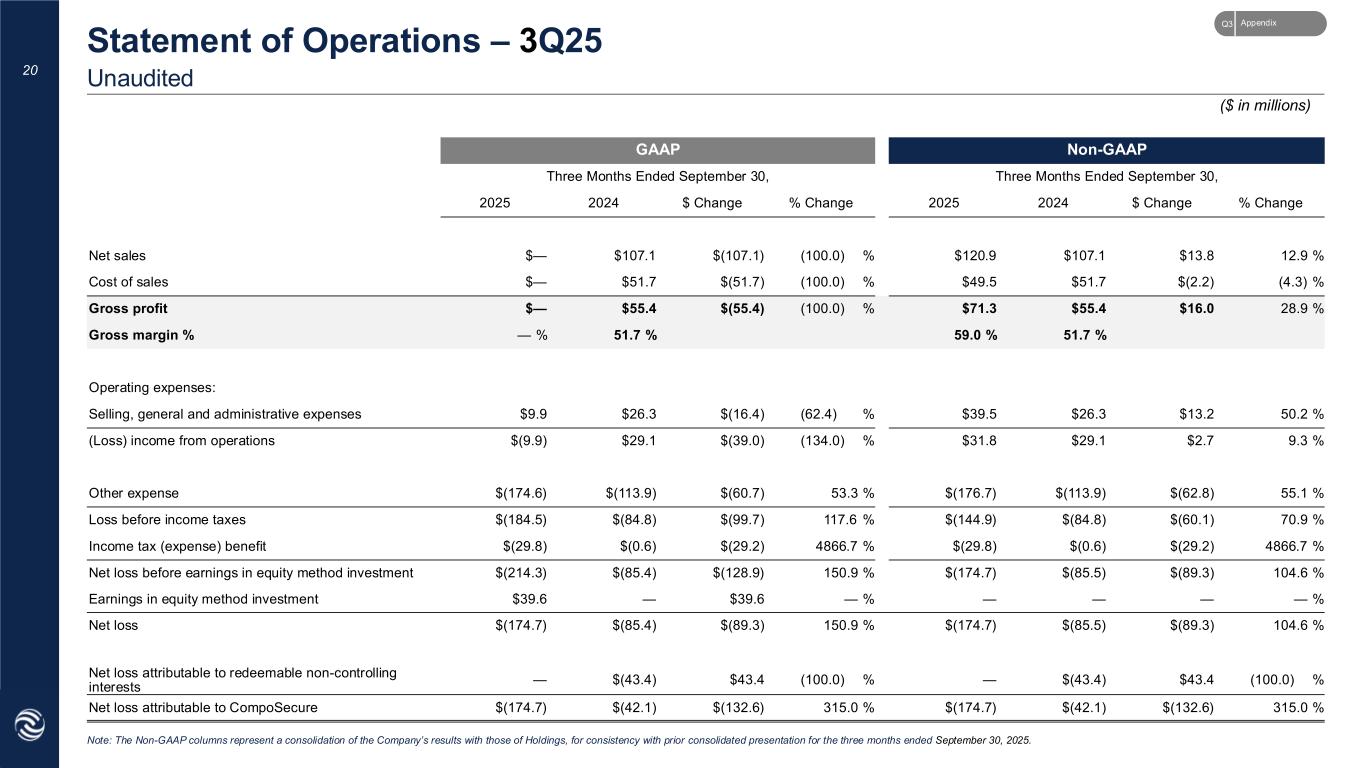
GAAP Non-GAAP Three Months Ended September 30, Three Months Ended September 30, 2025 2024 $ Change % Change 2025 2024 $ Change % Change Net sales $— $107.1 $(107.1) (100.0) % $120.9 $107.1 $13.8 12.9 % Cost of sales $— $51.7 $(51.7) (100.0) % $49.5 $51.7 $(2.2) (4.3) % Gross profit $— $55.4 $(55.4) (100.0) % $71.3 $55.4 $16.0 28.9 % Gross margin % — % 51.7 % 59.0 % 51.7 % Operating expenses: Selling, general and administrative expenses $9.9 $26.3 $(16.4) (62.4) % $39.5 $26.3 $13.2 50.2 % (Loss) income from operations $(9.9) $29.1 $(39.0) (134.0) % $31.8 $29.1 $2.7 9.3 % Other expense $(174.6) $(113.9) $(60.7) 53.3 % $(176.7) $(113.9) $(62.8) 55.1 % Loss before income taxes $(184.5) $(84.8) $(99.7) 117.6 % $(144.9) $(84.8) $(60.1) 70.9 % Income tax (expense) benefit $(29.8) $(0.6) $(29.2) 4866.7 % $(29.8) $(0.6) $(29.2) 4866.7 % Net loss before earnings in equity method investment $(214.3) $(85.4) $(128.9) 150.9 % $(174.7) $(85.5) $(89.3) 104.6 % Earnings in equity method investment $39.6 — $39.6 — % — — — — % Net loss $(174.7) $(85.4) $(89.3) 150.9 % $(174.7) $(85.5) $(89.3) 104.6 % Net loss attributable to redeemable non-controlling interests — $(43.4) $43.4 (100.0) % — $(43.4) $43.4 (100.0) % Net loss attributable to CompoSecure $(174.7) $(42.1) $(132.6) 315.0 % $(174.7) $(42.1) $(132.6) 315.0 % 20 Unaudited Statement of Operations – 3Q25 Note: The Non-GAAP columns represent a consolidation of the Company’s results with those of Holdings, for consistency with prior consolidated presentation for the three months ended September 30, 2025. ($ in millions) AppendixQ3

 
Basic Diluted Three Months Ended September 30, Three Months Ended September 30, 2025 2024 2025 2024 ($ in millions, except per share data) ($ in millions, except per share data) Net loss $ (174.7) $ (85.5) Adjusted net income $ 34.0 $ 22.5 Add: Provision for income taxes 29.8 0.6 Add: Interest on Exchangeable Notes, net of tax — 1.8 Add: Mark-to-market adjustments (1) 174.9 108.4 Adjusted net income used in computing net income per share, diluted (5) 34.0 24.3 Add: Stock-based compensation 5.9 5.6 Less: Pro forma management fees — (3.4) Common shares outstanding used in computing net income per share, diluted: 110.3 82.2 Add: Additional earnout costs 5.0 — Add: Transaction costs 2.8 — Warrants (4) 1.7 8.1 Add: Debt refinance costs — 0.2 Exchangeable Notes (5) — 13.0 Add: Resolute transaction costs — 2.7 Equity awards 5.1 3.5 Add: Spin-Off costs — — Total Shares outstanding used in computing adjusted earnings per share-Diluted 117.1 106.9 Adjusted net income before tax $ 43.6 $ 28.8 Adjusted net income per share - Diluted $ 0.29 $ 0.23 Income tax expense (2) 9.6 6.2 Adjusted net income $ 34.0 $ 22.5 Common shares outstanding used in computing net income per share, basic: Class A and Class B common shares (3) 110.3 82.2 Adjusted net income per share - basic $ 0.31 $ 0.27 21 3Q25 Earnings Per Share – Non-GAAP Reconciliation 1 Includes changes in fair value of warrant liability, make-whole provision of Exchangeable Notes and earnout consideration liability. 2 Reflects current and deferred income tax expenses. For the three months ended September 30, 2024, it was calculated using the Company's blended tax rate as if the Company did not have any non-controlling interest associated with its historical Up-C structure. For the three months ended September 30, 2025, it was calculated by applying the Company's assumed tax rate to the presented adjustments and including the Company's provision. 3 Assumes both Class A and Class B shares participate in earnings and are outstanding at the end of the period. There were no C lass B shares outstanding as of September 30, 2025. 4 Assumes treasury stock method, valuation at assumed fair market value of $14.47. 5 The Exchangeable Notes were included through the application of the "if-converted" method. Interest related to the Exchangeable Notes, net of tax was excluded from net income. No Exchangeable Notes were outstanding during the three months ended September 30, 2025. AppendixQ3

 
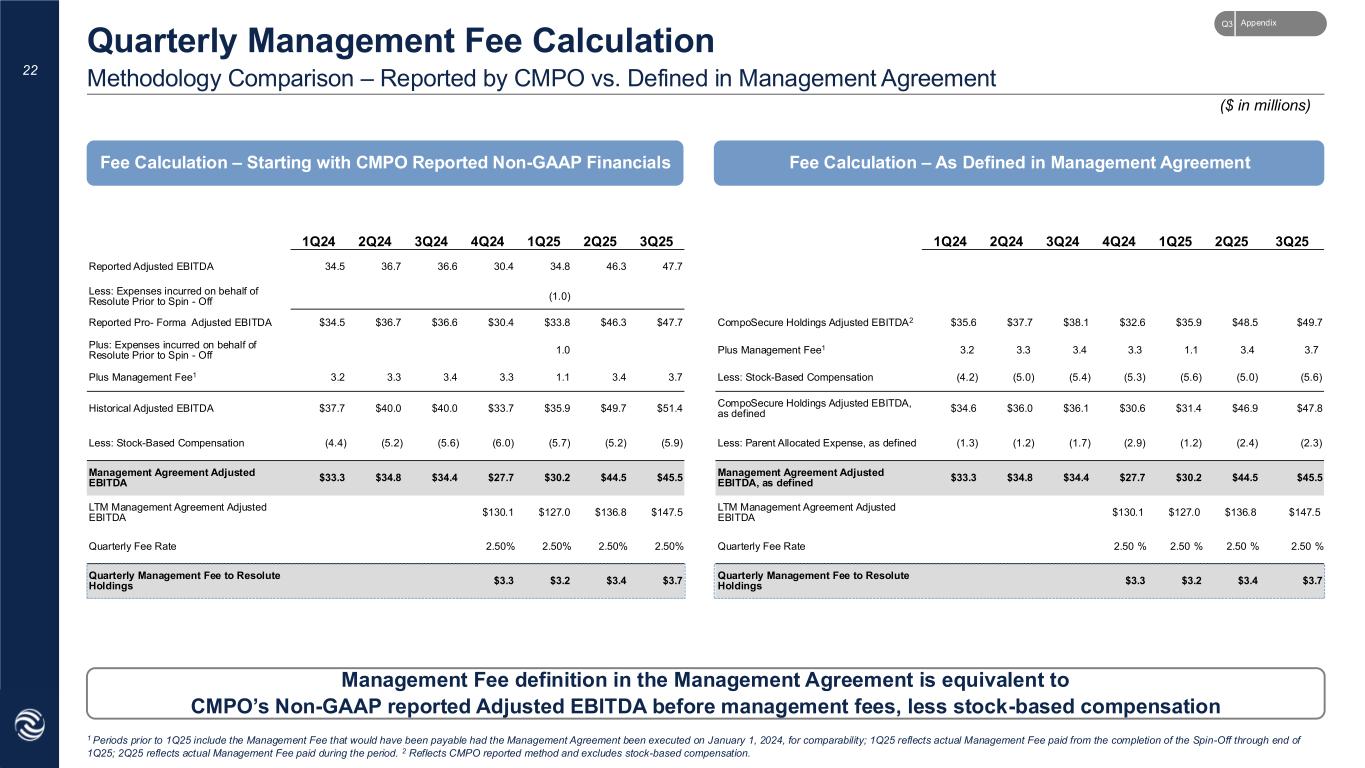
22 Methodology Comparison – Reported by CMPO vs. Defined in Management Agreement Quarterly Management Fee Calculation 1 Periods prior to 1Q25 include the Management Fee that would have been payable had the Management Agreement been executed on January 1, 2024, for comparability; 1Q25 reflects actual Management Fee paid from the completion of the Spin-Off through end of 1Q25; 2Q25 reflects actual Management Fee paid during the period. 2 Reflects CMPO reported method and excludes stock-based compensation. Fee Calculation – Starting with CMPO Reported Non-GAAP Financials Fee Calculation – As Defined in Management Agreement Management Fee definition in the Management Agreement is equivalent to CMPO’s Non-GAAP reported Adjusted EBITDA before management fees, less stock-based compensation ($ in millions) 1Q24 2Q24 3Q24 4Q24 1Q25 2Q25 3Q25 1Q24 2Q24 3Q24 4Q24 1Q25 2Q25 3Q25 Reported Adjusted EBITDA 34.5 36.7 36.6 30.4 34.8 46.3 47.7 Less: Expenses incurred on behalf of Resolute Prior to Spin - Off (1.0) Reported Pro- Forma Adjusted EBITDA $34.5 $36.7 $36.6 $30.4 $33.8 $46.3 $47.7 CompoSecure Holdings Adjusted EBITDA2 $35.6 $37.7 $38.1 $32.6 $35.9 $48.5 $49.7 Plus: Expenses incurred on behalf of Resolute Prior to Spin - Off 1.0 Plus Management Fee1 3.2 3.3 3.4 3.3 1.1 3.4 3.7 Plus Management Fee1 3.2 3.3 3.4 3.3 1.1 3.4 3.7 Less: Stock-Based Compensation (4.2) (5.0) (5.4) (5.3) (5.6) (5.0) (5.6) Historical Adjusted EBITDA $37.7 $40.0 $40.0 $33.7 $35.9 $49.7 $51.4 CompoSecure Holdings Adjusted EBITDA, as defined $34.6 $36.0 $36.1 $30.6 $31.4 $46.9 $47.8 Less: Stock-Based Compensation (4.4) (5.2) (5.6) (6.0) (5.7) (5.2) (5.9) Less: Parent Allocated Expense, as defined (1.3) (1.2) (1.7) (2.9) (1.2) (2.4) (2.3) Management Agreement Adjusted EBITDA $33.3 $34.8 $34.4 $27.7 $30.2 $44.5 $45.5 Management Agreement Adjusted EBITDA, as defined $33.3 $34.8 $34.4 $27.7 $30.2 $44.5 $45.5 LTM Management Agreement Adjusted EBITDA $130.1 $127.0 $136.8 $147.5 LTM Management Agreement Adjusted EBITDA $130.1 $127.0 $136.8 $147.5 Quarterly Fee Rate 2.50% 2.50% 2.50% 2.50% Quarterly Fee Rate 2.50 % 2.50 % 2.50 % 2.50 % Quarterly Management Fee to Resolute Holdings $3.3 $3.2 $3.4 $3.7 Quarterly Management Fee to Resolute Holdings $3.3 $3.2 $3.4 $3.7 AppendixQ3


Investor Relations Contact Sean Mansouri 720-330-2829 [email protected]