Exhibit 99.1

CompoSecure Reports Fourth Quarter and Full Year 2024 Financial Results
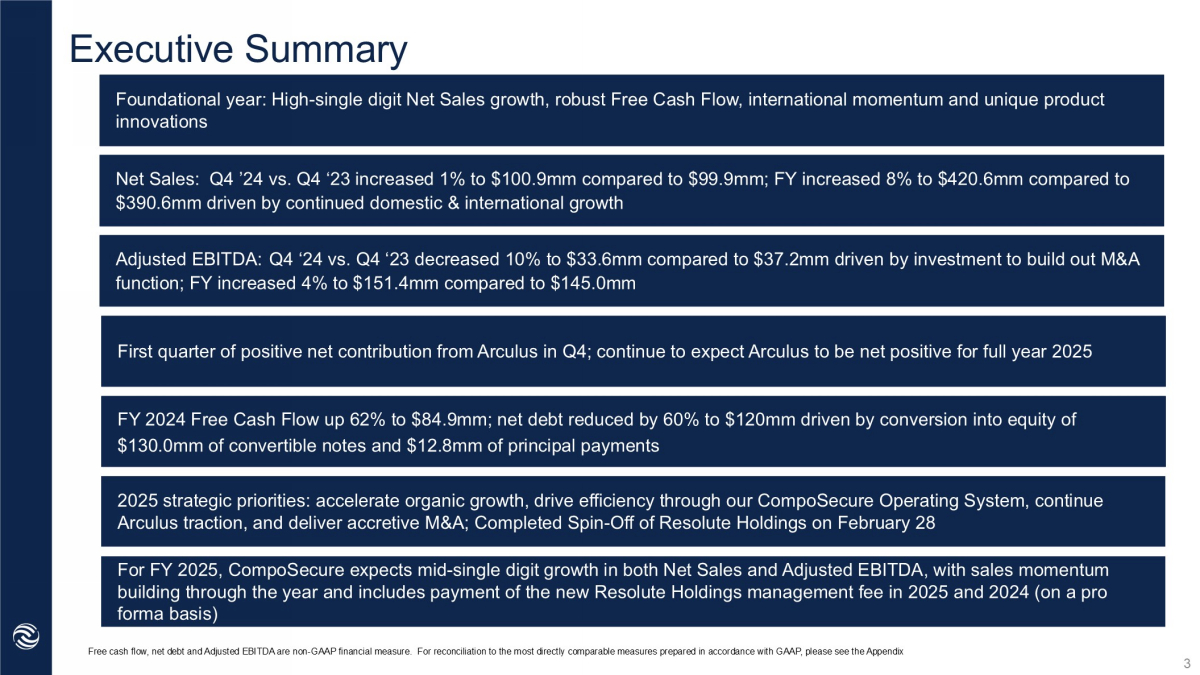
| · | FY 2024 Net Sales up 8% to $420.6 million — In-Line with Preliminary Results on February 10, 2025 |
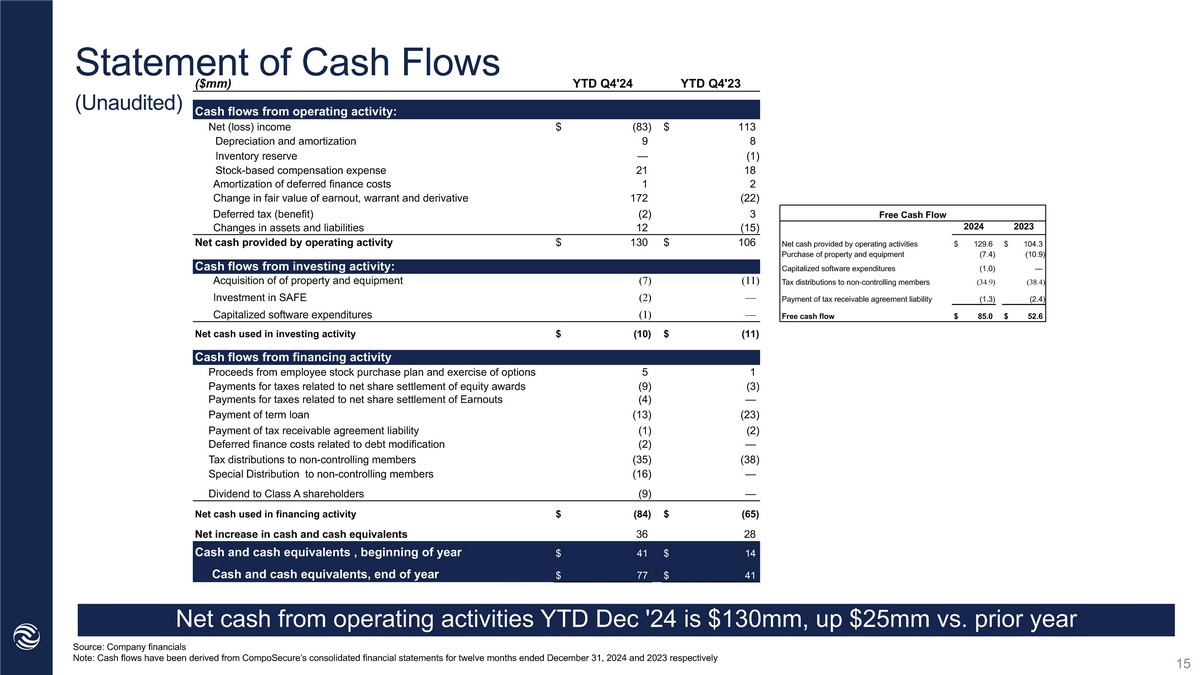
| · | FY 2024 Cash Flow from Operations up 24% to $129.6 million and Free Cash Flow up 62% to $84.9 million |
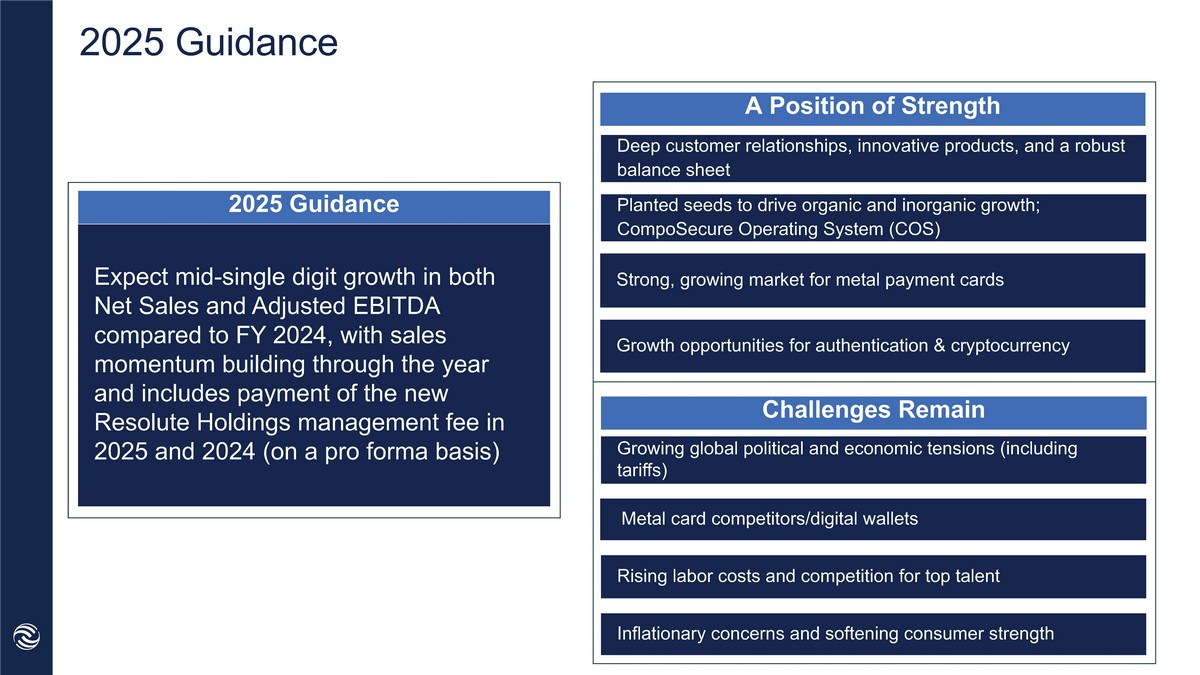
| · | Company Expects Mid-Single Digit Growth for 2025 Net Sales and Adjusted EBITDA |
| · | Completed Spin-Off of Resolute Holdings on February 28, 2025 |
SOMERSET, N.J., March 5, 2025 -- CompoSecure, Inc. (Nasdaq: CMPO), a leader in metal payment cards, security, and authentication solutions, today announced its operating results for the fourth quarter and full year ended December 31, 2024.
Jon Wilk, President and CEO of CompoSecure, commented: “2024 was a foundational year for CompoSecure, marked by high-single digit Net Sales growth, robust Free Cash Flow, international momentum and unique product innovations. We also made significant progress in fortifying our balance sheet in 2024, reducing net debt by 60% to $120 million.
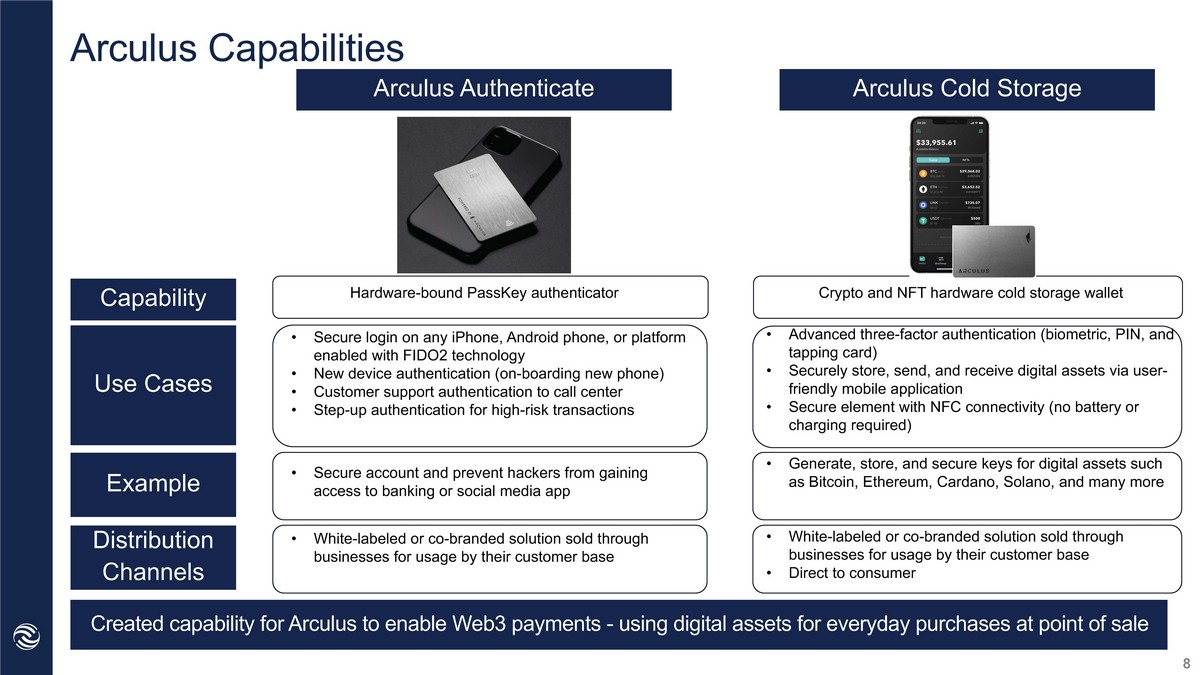
During the fourth quarter, we made strategic investments in the CompoSecure Operating System (COS) to deliver consistent excellence across the organization and focused on planting seeds to drive both organic and inorganic growth. For 2025, we will accelerate the adoption of COS and expect to build sales momentum throughout the year. Notably, we closed out the year with our first quarter of positive net contribution from Arculus in Q4, and continue to expect Arculus to be net positive for full year 2025.”
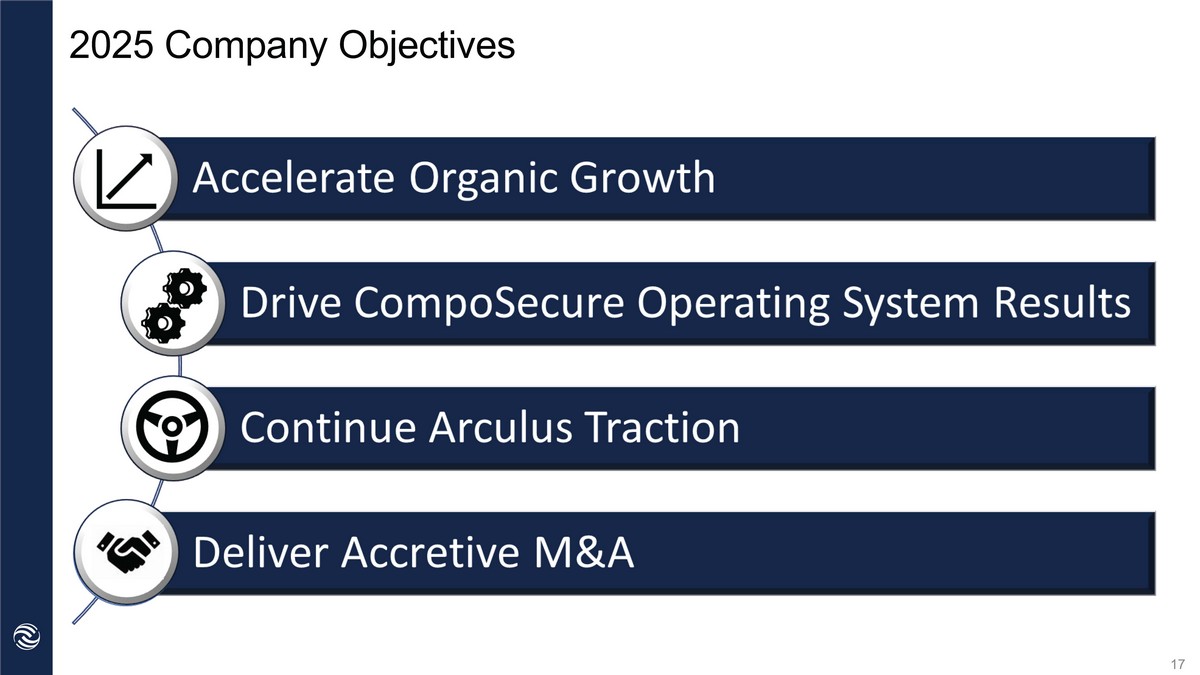
Dave Cote, CompoSecure’s Executive Chairman, added: “As we enter 2025, I am excited about the opportunities ahead for our business. The spin-off of Resolute Holdings marks an important step in our evolution as we position the business for accelerated growth and diversification of revenue. We are committed to cultivating a culture of high performance, driving efficiency through our CompoSecure Operating System, reigniting organic growth, and delivering on accretive M&A.”
Financial Highlights (Q4 2024 vs. Q4 2023 )
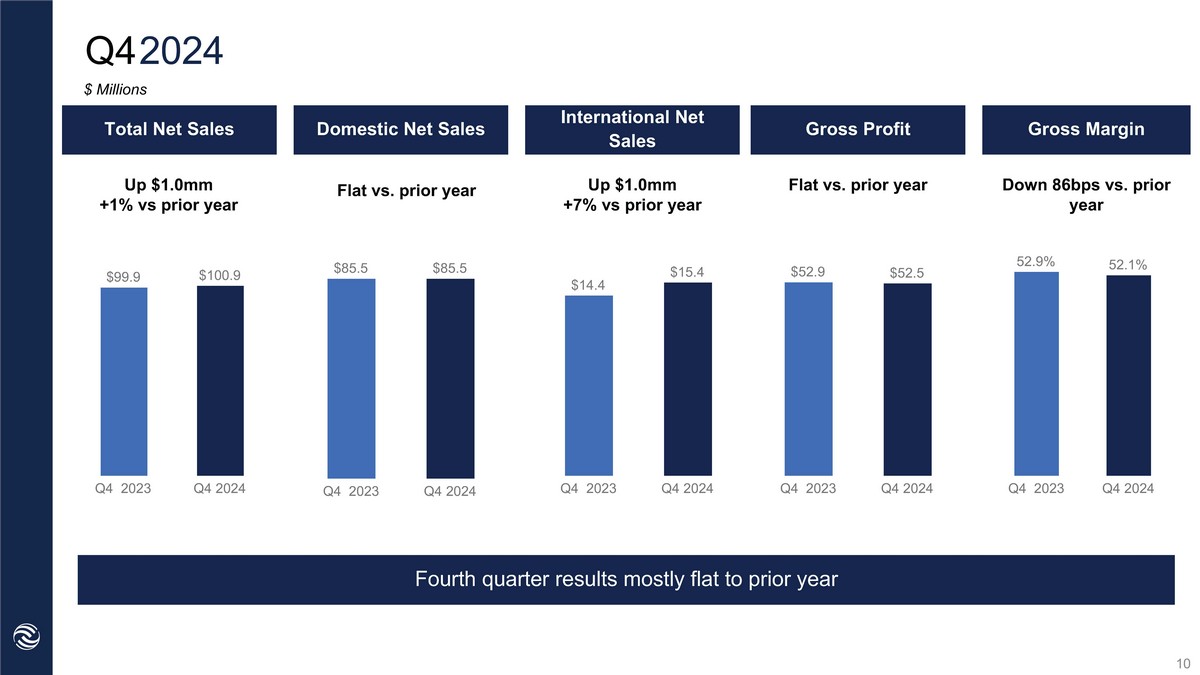
| · | Net Sales: Net Sales increased 1% to $100.9 million compared to $99.9 million. |
| · | Gross Profit: Gross Profit was $52.5 million or 52.1% of Net Sales, compared to $52.9 million or 52.9%. |
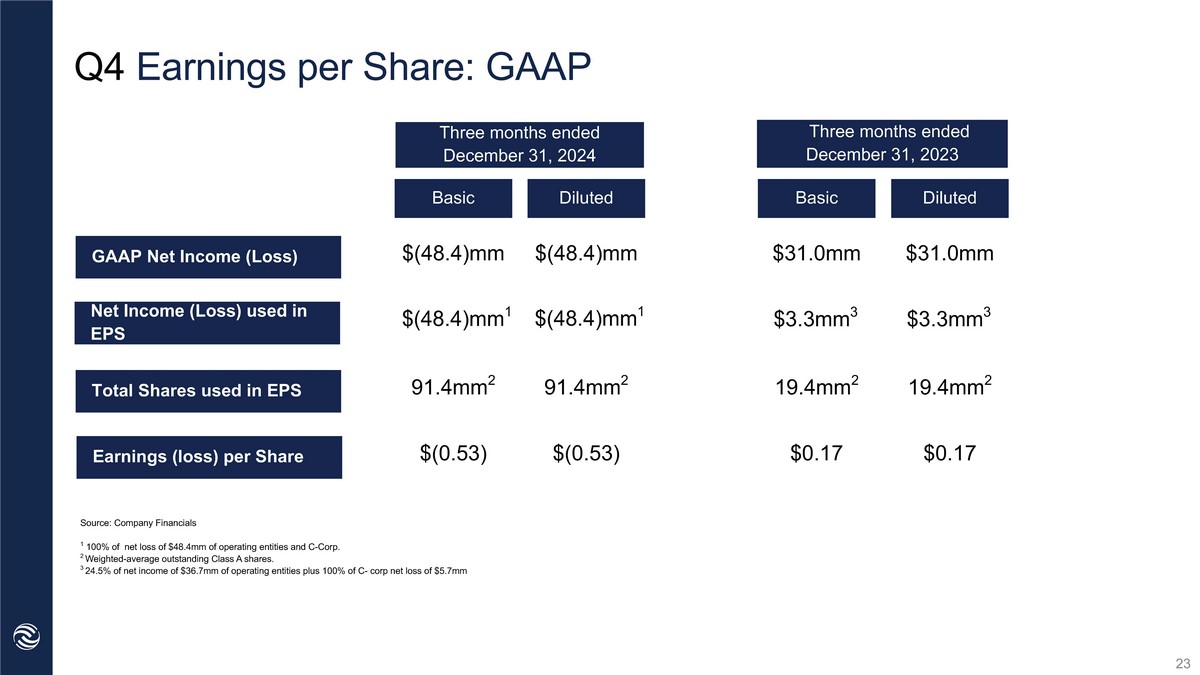
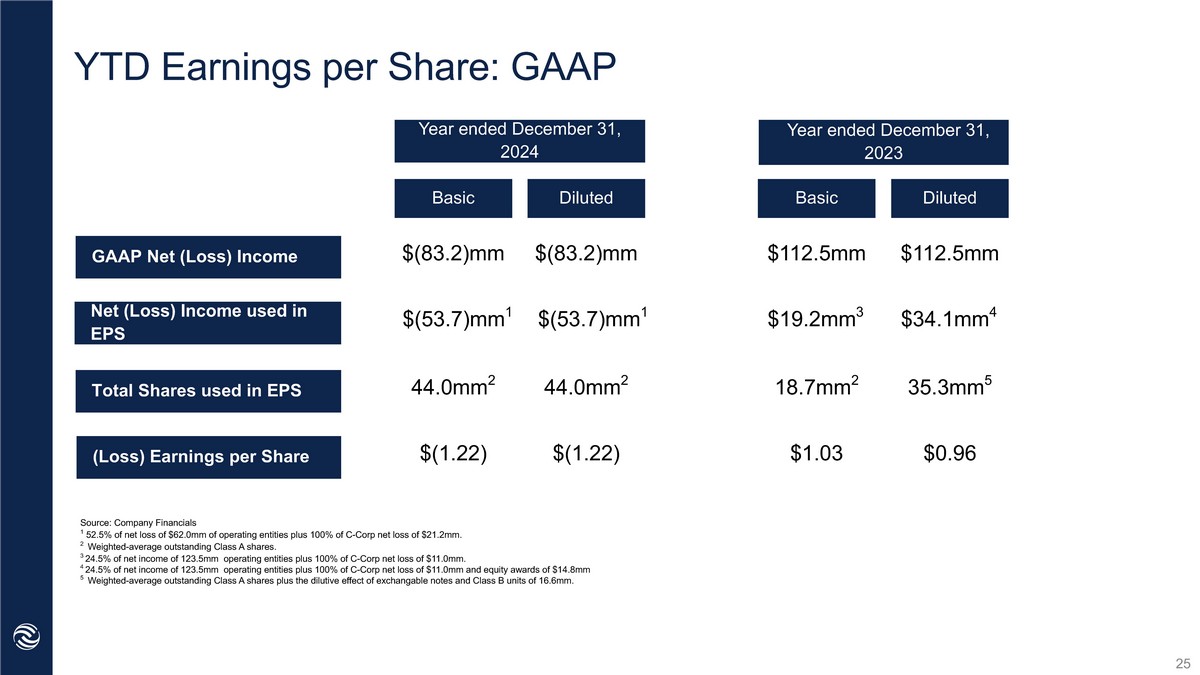
| · | Net Income(Loss)/EPS: Net Income/(Loss) was $(48.4) million compared to $31.0 million. The decrease was driven by an improvement to the Company’s stock price during the quarter, which led to a change in the fair value of warrant liabilities, earnout consideration liability and derivative liability. Net Income/(Loss) per share attributable to Class A common shareholders was $(0.53) (Basic) and $(0.53) (Diluted), compared to $0.17 (Basic) and $0.17 (Diluted) in the year-ago period. |
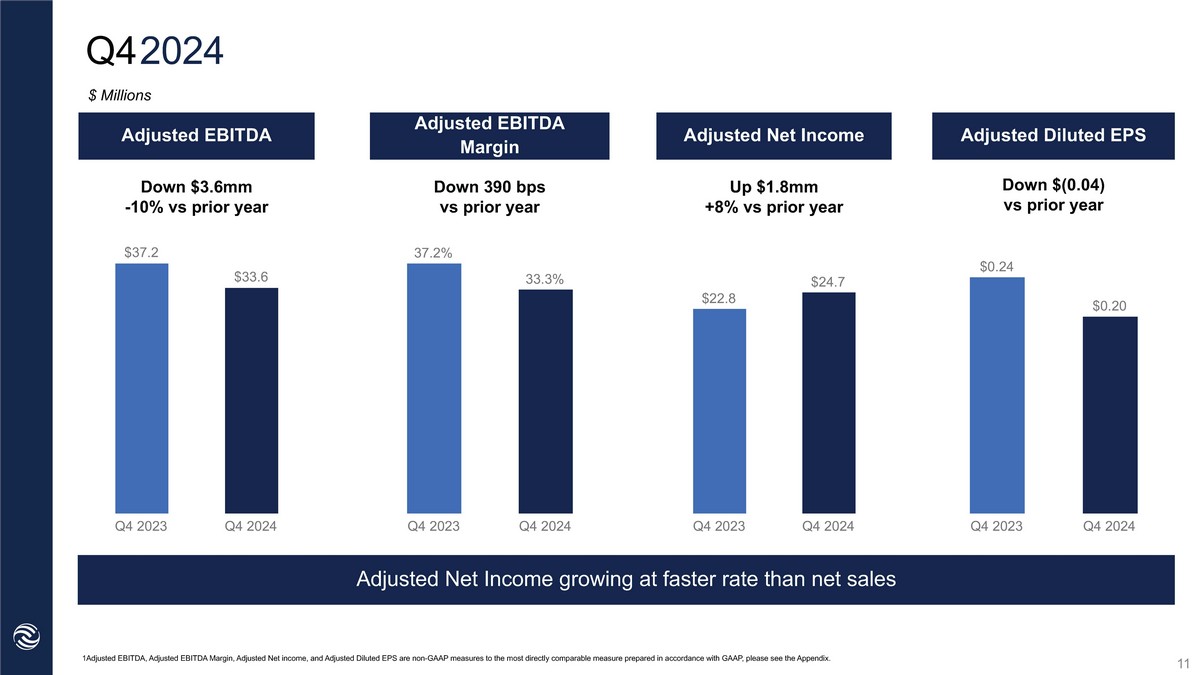
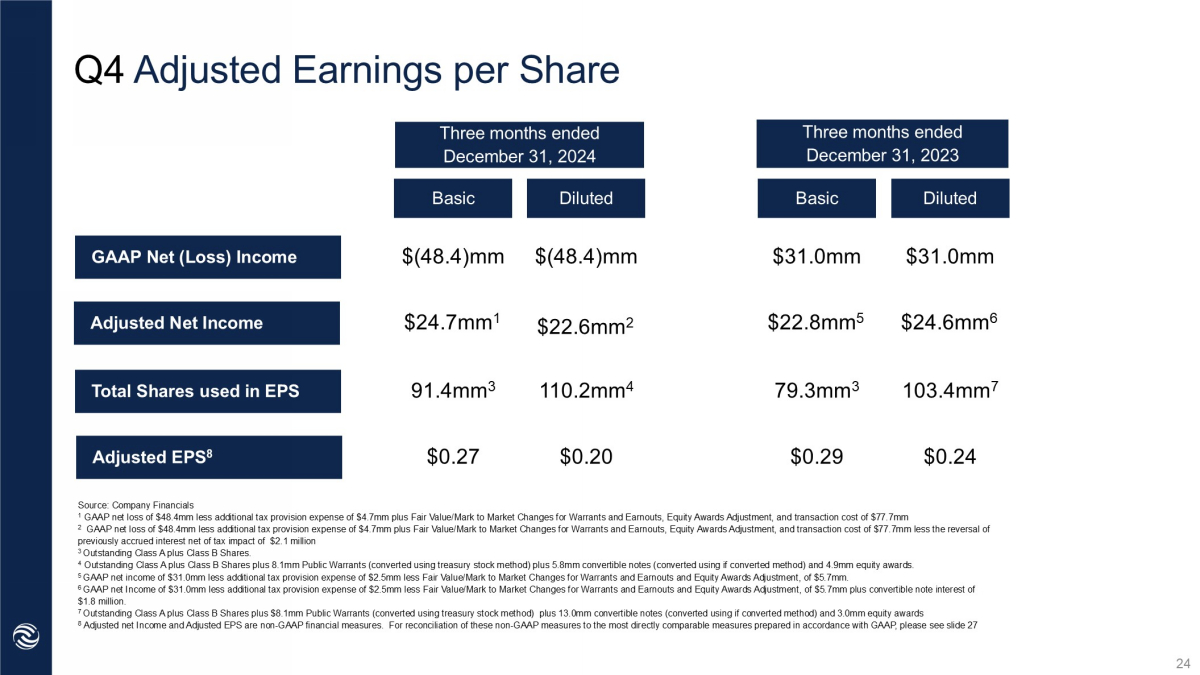
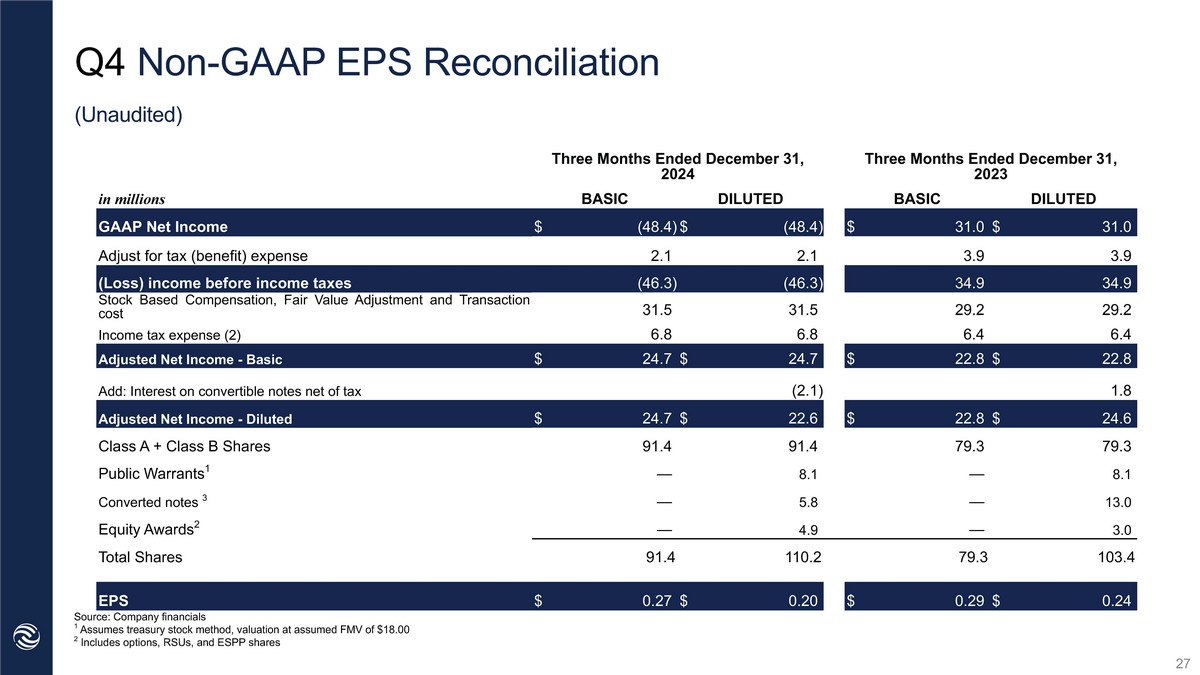
| · | Adjusted Net Income/Adjusted EPS: Adjusted Net Income (a non-GAAP measure) increased 8% to $24.7 million compared to $22.8 million in the year-ago period. Adjusted EPS (a non-GAAP measure) was $0.27 (Basic) and $0.20 (Diluted) compared to $0.29 (Basic) and $0.24 (Diluted) in the year-ago period. |
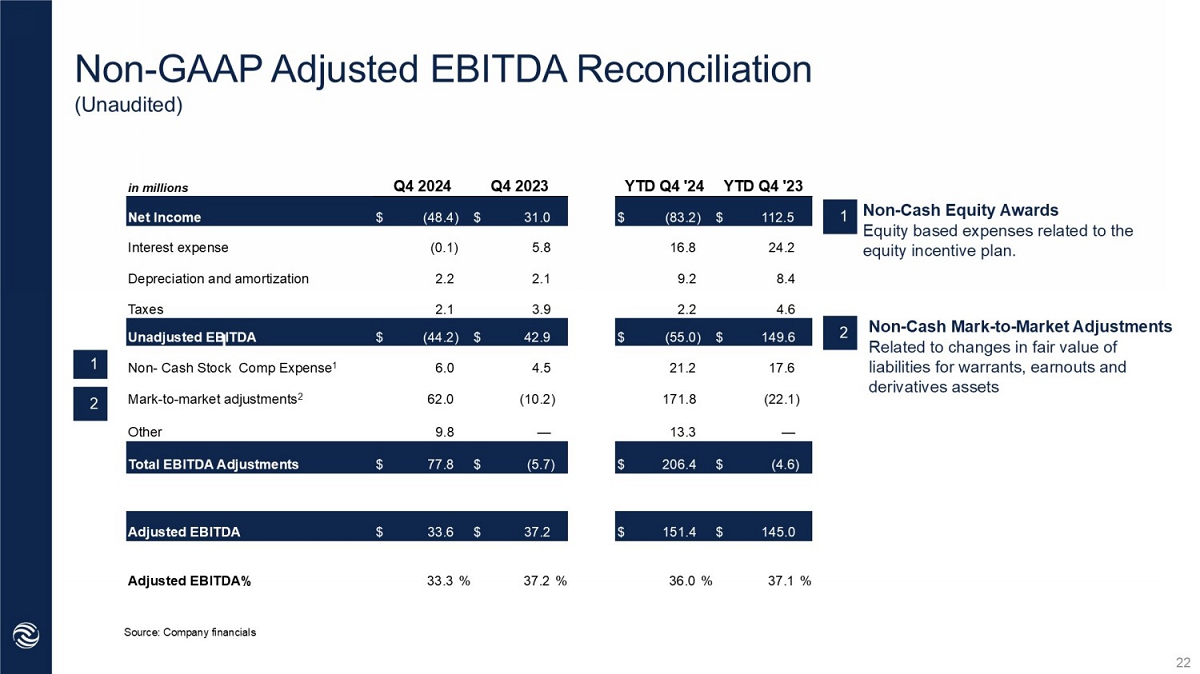
| · | Adjusted EBITDA: Adjusted EBITDA (a non-GAAP measure) decreased 10% to $33.6 million compared to $37.2 million primarily driven by investment in our M&A capabilities. |
See reconciliation of non-GAAP measures shown in table below.
FY 2024 Financial Highlights (vs. FY 2023)
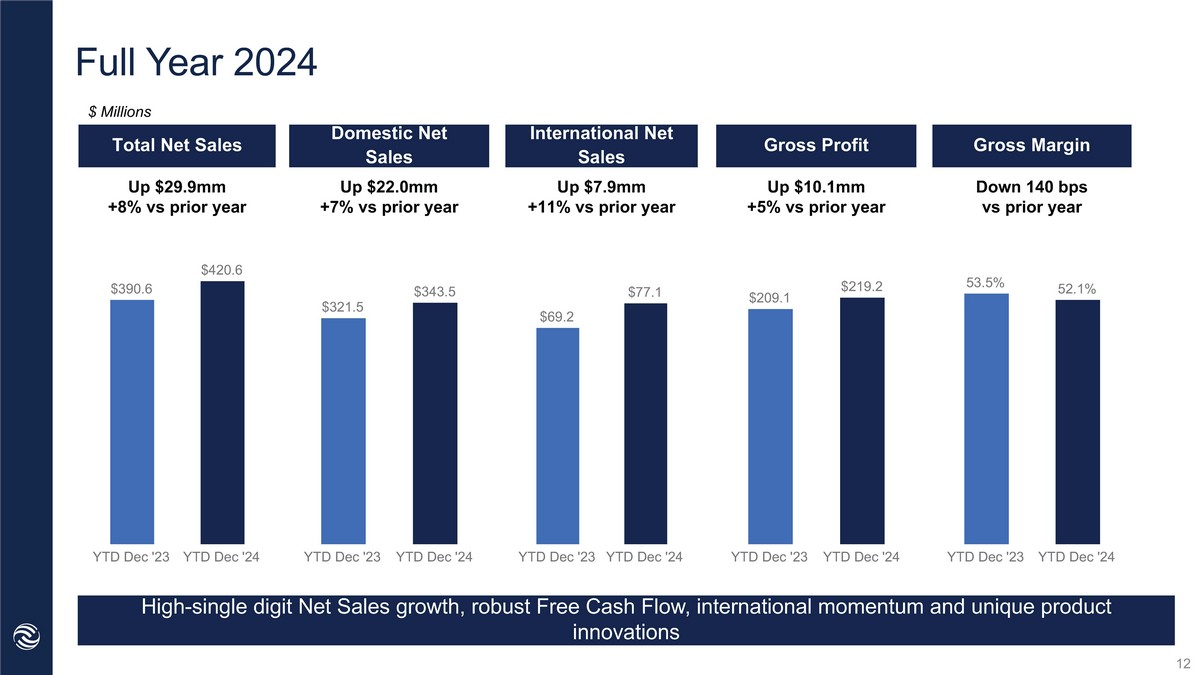
| · | Net Sales: Net Sales increased 8% to $420.6 million compared to $390.6 million. The increase was primarily driven by continued domestic growth of 7%, and international growth of 11%. |
| · | Gross Profit: Gross Profit was $219.2 million or 52.1% of Net Sales, compared to $209.1 million or 53.5%. The decline in gross margin was primarily due to lower production efficiencies from new and innovative card constructions, as well as the impact of inflationary pressure on wages and materials. |
| · | Net Income(Loss)/EPS: Net Income was $(83.2) million compared to $112.5 million. The decrease was driven by an improvement to the Company’s stock price which led to changes to the fair value of warrant liabilities, earnout consideration liability and derivative liability. Net Income per share attributable to Class A common stockholders was $(1.22) (Basic) and $(1.22) (Diluted), compared to $1.03 (Basic) and $0.96 (Diluted) in the year-ago period. |
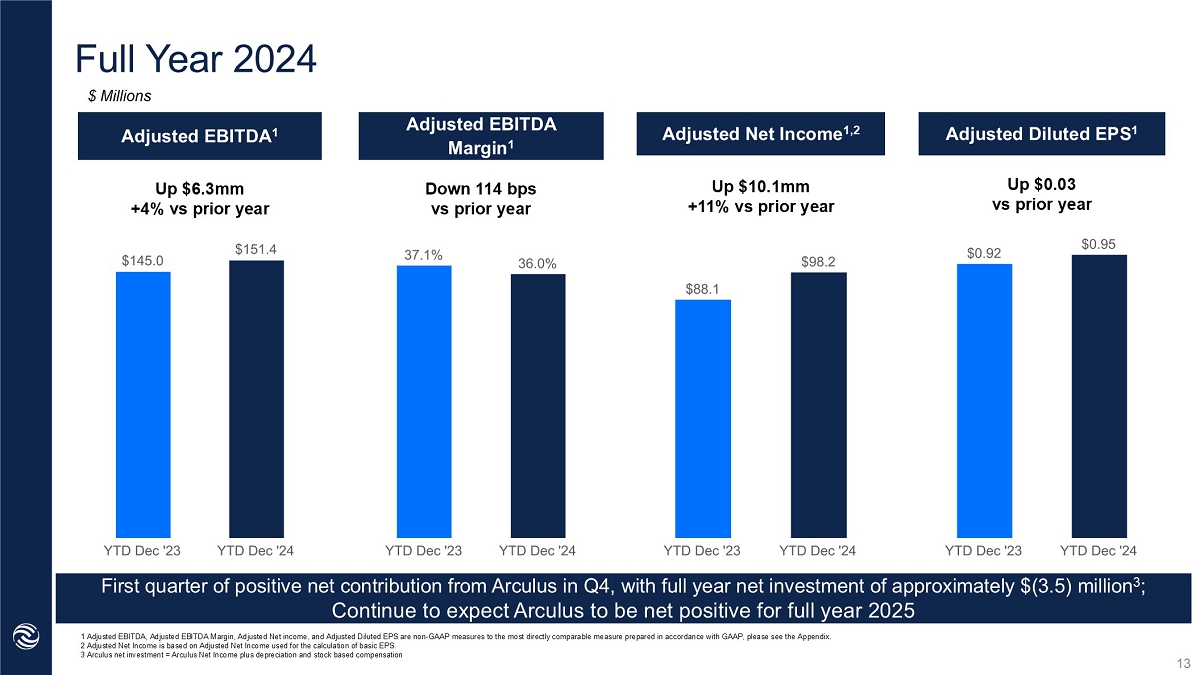
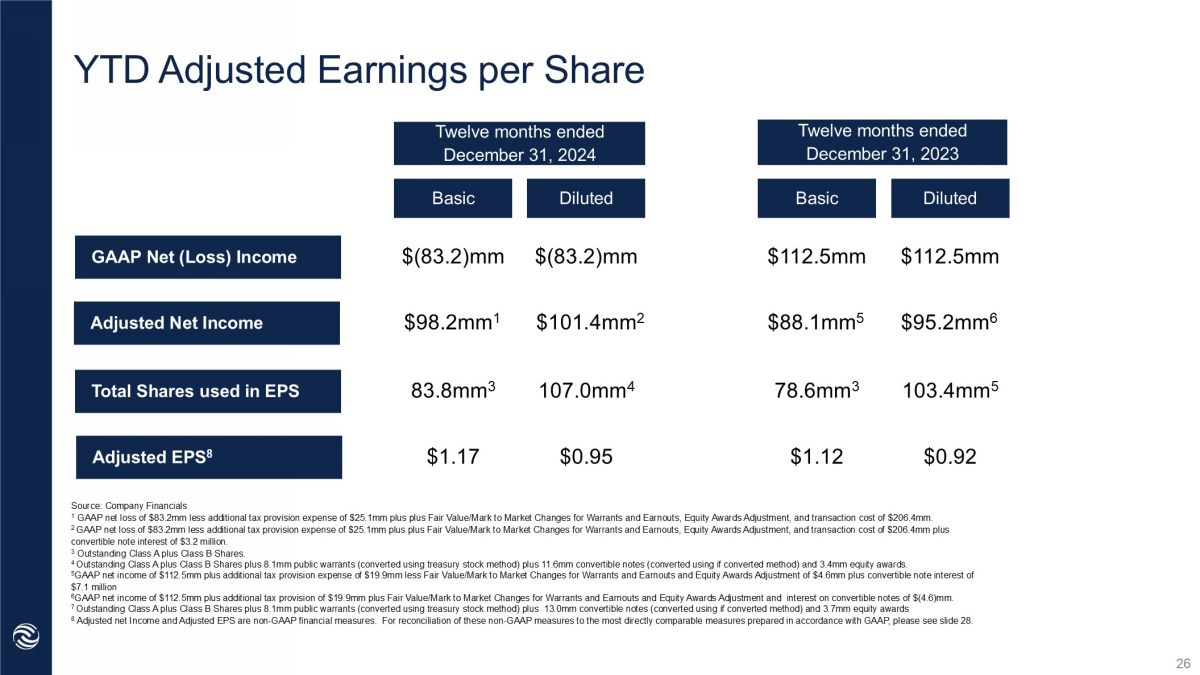
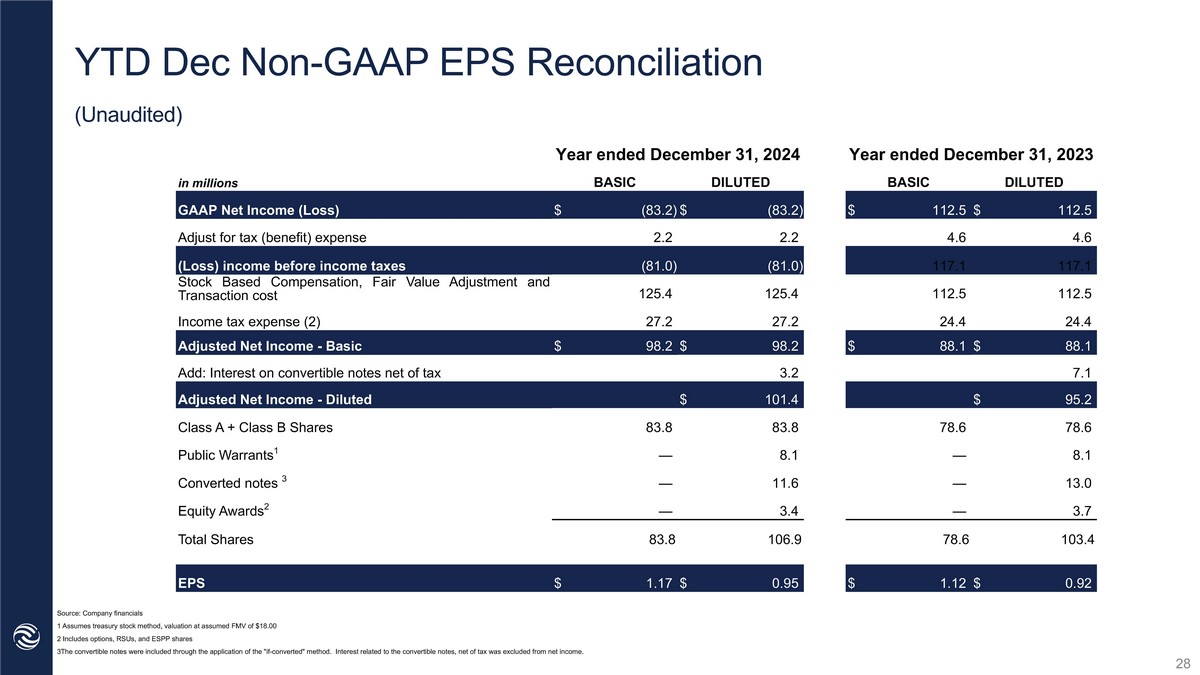
| · | Adjusted Net Income/Adjusted EPS: Adjusted Net Income (a non-GAAP measure) increased 11% to $98.2 million compared to $88.1 million in the year-ago period. Adjusted EPS (a non-GAAP measure) was $1.17 (Basic) and $0.95 (Diluted) compared to $1.12 (Basic) and $0.92 (Diluted) in the year-ago period. |
| · | Adjusted EBITDA: Adjusted EBITDA (a non-GAAP measure) increased 4% to $151.4 million compared to $145.0 million. |
Liquidity and Capital Structure
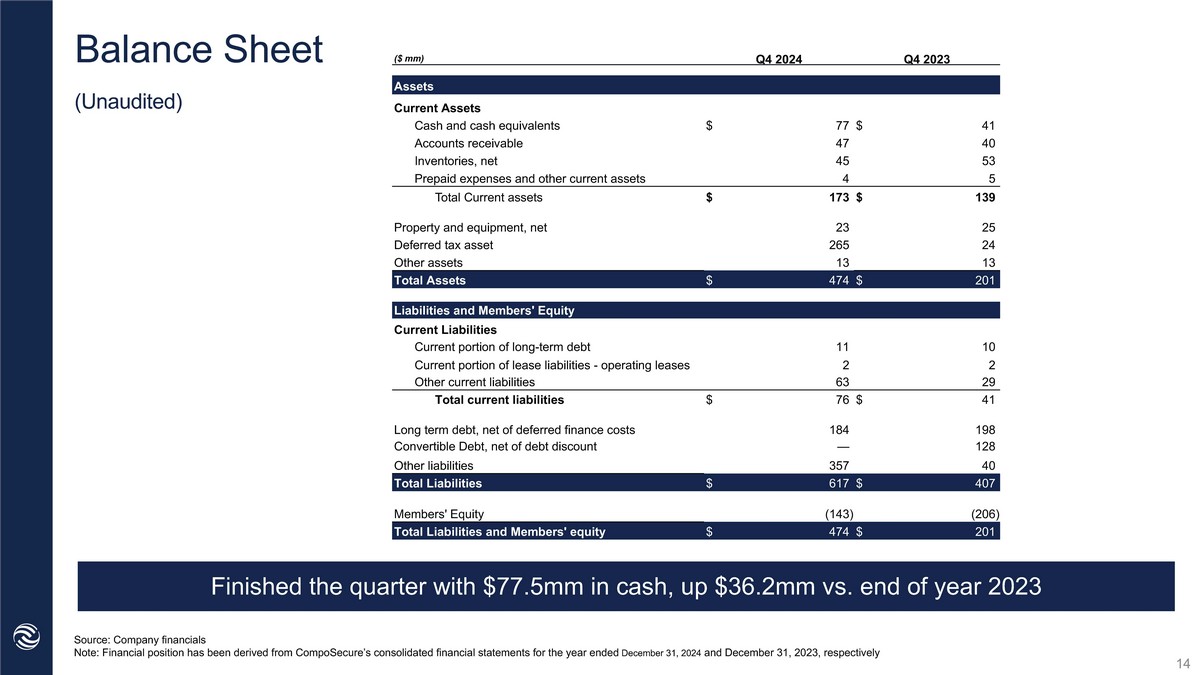
Balance Sheet: At December 31, 2024, CompoSecure had $77.5 million of cash and cash equivalents and $197.5 million of total debt (resulting in net debt of $120 million). This compares to cash and cash equivalents of $41.2 million and total debt of $340.3 million at December 31, 2023. The improvement was driven by strong Free Cash Flow generation as well as the conversion into equity of $130 million of exchangeable notes during the fourth quarter. CompoSecure’s secured debt leverage ratio was $1.25x at December 31, 2024 compared to 1.39x at December 31, 2023.
Full Year Highlights
| · | Appointed new Executive Chairman, David Cote, and expanded Board of Directors |
| · | Spun off Resolute Holdings, which entered into a management agreement with our wholly owned subsidiary, CompoSecure Holdings L.L.C. |
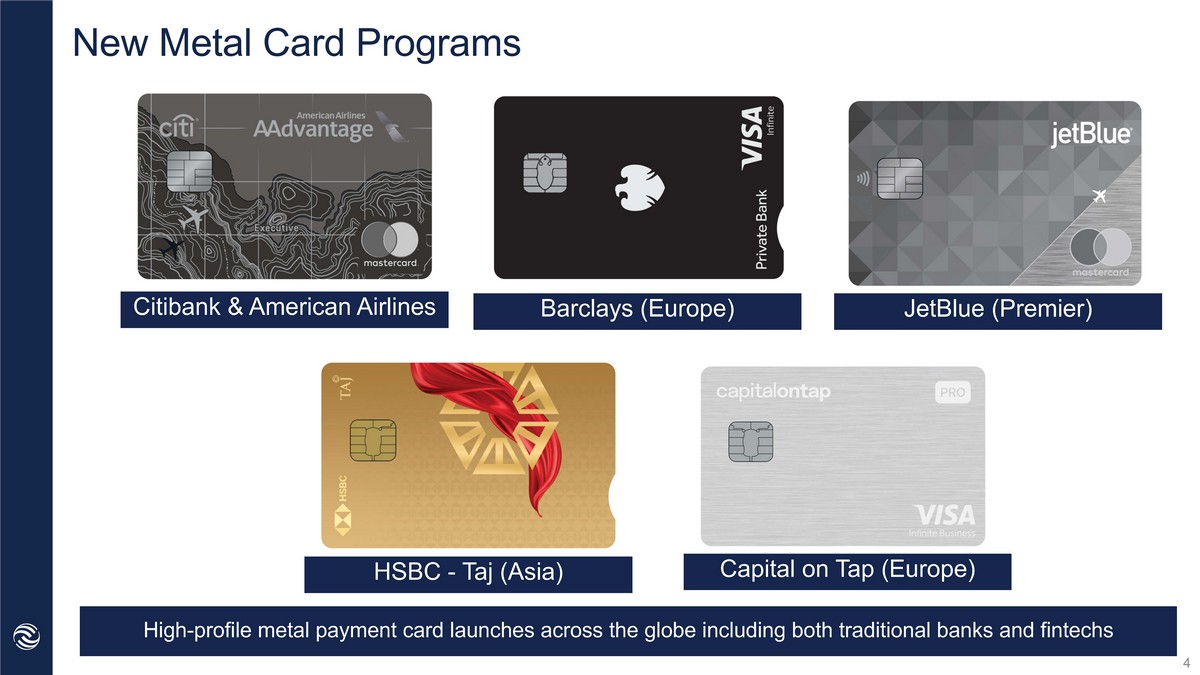
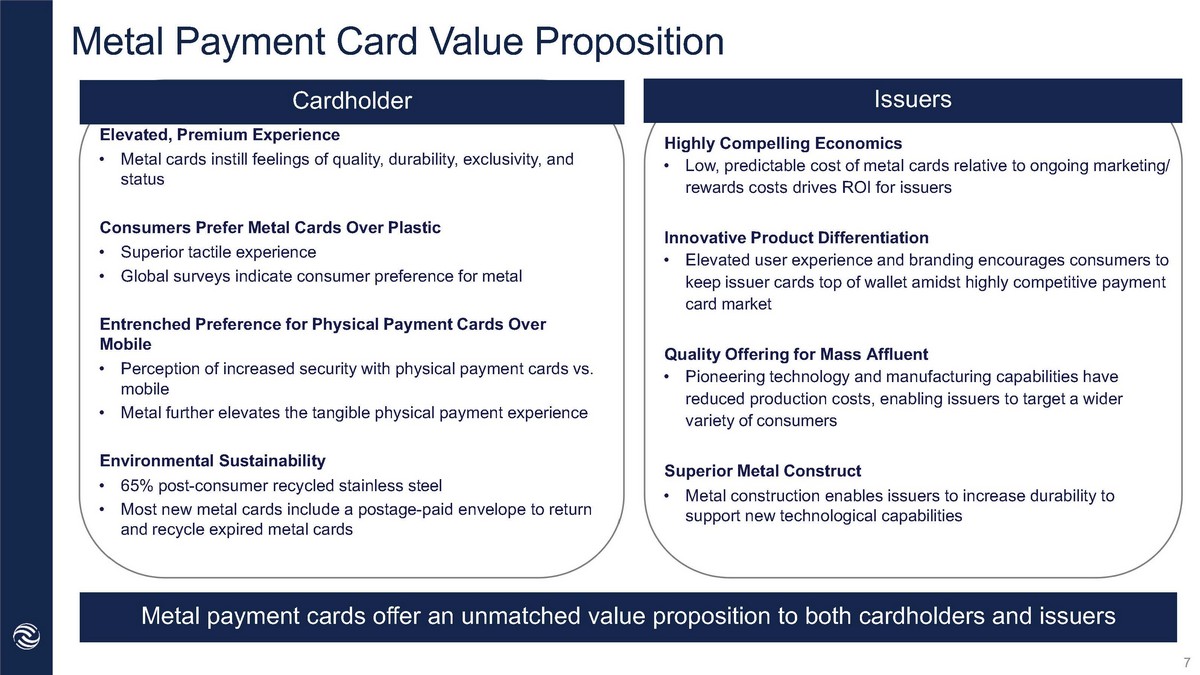
| · | Metal card program highlights include: Delta Reserve, Robinhood Gold, Citi/American Airlines, Barclays (Europe), JetBlue, HSBC, Capital on Tap, US Bank Smartly, Wells Fargo Expedia Onekey, and American Express White Gold |
| · | Award recognition: Received 9 company awards including the Banking Tech Visionary CEO award; three 2024 International Card Manufactures Awards (ICMA) Awards (Best Metal Cards, Best Environmentally-Friendly Cards, and Best Secure Payment Cards) |
2025 Financial Outlook
For FY 2025, CompoSecure expects mid-single digit growth in both Net Sales and Adjusted EBITDA with sales momentum building through the year and includes payment of the new Resolute Holdings management fee in 2025 and 2024 (on a pro forma basis).
Conference Call
CompoSecure will host a conference call and live audio webcast today at 5:00 p.m. Eastern Time to discuss its financial and operational results, followed by a question-and-answer period.
Date: Wednesday, March 5, 2025
Time: 5:00 p.m. Eastern Time
Dial-in registration link
Live webcast registration link
If you have any difficulty registering or connecting with the conference call, please contact Elevate IR at (720) 330-2829.
A live webcast and replay of the conference call will be available on the investor relations section of CompoSecure’s website at https://ir.composecure.com/news-events/events.
About CompoSecure
Founded in 2000, CompoSecure (Nasdaq: CMPO) is a technology partner to market leaders, fintech’s and consumers enabling trust for millions of people around the globe. The company combines elegance, simplicity and security to deliver exceptional experiences and peace of mind in the physical and digital world. CompoSecure’s innovative payment card technology and metal cards with Arculus security and authentication capabilities deliver unique, premium branded experiences, enable people to access and use their financial and digital assets, and ensure trust at the point of a transaction. For more information, please visit www.CompoSecure.com and www.GetArculus.com.
Forward-Looking Statements
This press release contains forward-looking statements as defined by the Private Securities Litigation Reform Act of 1995. These statements are based on the beliefs and assumptions of management. Although CompoSecure believes that its plans, intentions, and expectations reflected in or suggested by these forward-looking statements are reasonable, CompoSecure cannot assure you that it will achieve or realize these plans, intentions, or expectations. Forward-looking statements are inherently subject to risks, uncertainties, and assumptions. Generally, statements that are not historical facts, including statements concerning CompoSecure’s possible or assumed future actions, business strategies, events, or results of operations, are forward-looking statements. In some instances, these statements may be preceded by, followed by or include the words “believes,” “estimates,” “expects,” “projects,” “forecasts,” “may,” “will,” “should,” “seeks,” “plans,” “scheduled,” “anticipates” or “intends” or the negatives of these terms or variations of them or similar terminology. Forward-looking statements are not guarantees of performance. You should not put undue reliance on these statements which speak only as of the date hereof. You should understand that the following important factors, among others, could affect CompoSecure’s future results and could cause those results or other outcomes to differ materially from those expressed or implied in CompoSecure’s forward-looking statements: the possibility that the spin-off will not achieve its intended benefits; the ability of the Company to successfully execute its plans and strategies, including with respect to M&A; the possibility of disruption, including changes to existing business relationships, disputes, litigation or unanticipated costs in connection with the spin-off; uncertainty of the expected financial performance of CompoSecure or Resolute Holdings following completion of the spin-off; evolving legal, regulatory and tax regimes; actions by third parties, including government agencies; the ability of CompoSecure to diversify its business and customer base and to achieve enhancements in organic growth and operational efficiency, including for any future acquired companies; the ability of CompoSecure to create value for its shareholders and generate robust free cash flow; the ability of CompoSecure to grow and manage growth profitably, maintain relationships with customers, compete within its industry and retain its key employees; the possibility that CompoSecure may be adversely impacted by other global economic, business, competitive and/or other factors; the outcome of any legal proceedings that may be instituted against CompoSecure or others; future exchange and interest rates; and other risks and uncertainties, including those under “Risk Factors” in filings that have been made or will be made with the Securities and Exchange Commission. CompoSecure undertakes no obligations to update or revise publicly any forward-looking statements, whether as a result of new information, future events or otherwise, except as required by law.
Use of Non-GAAP Financial Measures
This press release includes certain non-GAAP financial measures that are not prepared in accordance with accounting principles generally accepted in the United States (“GAAP”) and that may be different from non-GAAP financial measures used by other companies. CompoSecure believes EBITDA, Adjusted EBITDA, Adjusted Net Income, Adjusted EPS, Free Cash Flow and Net Debt are useful to investors in evaluating CompoSecure’s financial performance. CompoSecure uses these measures internally to establish forecasts, budgets and operational goals to manage and monitor its business, as well as evaluate its underlying historical performance and/or to measure incentive compensation, as we believe that these non-GAAP financial measures depict the true performance of the business by encompassing only relevant and controllable events, enabling CompoSecure to evaluate and plan more effectively for the future. Due to the forward-looking nature of the financial guidance included above, specific quantification of the charges excluded from the non-GAAP financial measures included in such financial guidance, including with respect to depreciation, amortization, interest, and taxes, that would be required to reconcile the non GAAP financial measures included in such financial guidance to GAAP measures are not available, so it is not feasible to provide accurate forecasted non-GAAP reconciliations without unreasonable effort. Consequently, no disclosure of estimated comparable GAAP measures is included, and no reconciliation of the forward-looking non-GAAP financial measures is included. In addition, CompoSecure’s debt agreements contain covenants that use a variation of these measures for purposes of determining debt covenant compliance. CompoSecure believes that investors should have access to the same set of tools that its management uses in analyzing operating results. EBITDA, Adjusted EBITDA, Adjusted Net Income, Adjusted EPS, Free Cash Flow and Net Debt should not be considered as measures of financial performance under U.S. GAAP, and the items excluded from EBITDA, Adjusted EBITDA, Adjusted Net Income, Adjusted EPS, Free Cash Flow and Net Debt are significant components in understanding and assessing CompoSecure’s financial performance. Accordingly, these key business metrics have limitations as an analytical tool. They should not be considered as an alternative to net income or any other performance measures derived in accordance with U.S. GAAP or as an alternative to cash flows from operating activities as a measure of CompoSecure’s liquidity and may be different from similarly titled non-GAAP measures used by other companies. Please refer to the information included in this press release for the reconciliation of GAAP measures to these non-GAAP measures.
Corporate Contact
Anthony Piniella
Head of Communications, CompoSecure
(917) 208-7724
Investor Relations Contact
Sean Mansouri, CFA
Elevate IR
(720) 330-2829
CMPO@elevate-ir.
Condensed Consolidated Balance Sheet Data
(in thousands)
| December 31, 2024 | December 31, 2023 | |||||||
| Unaudited | ||||||||
| ASSETS | ||||||||
| CURRENT ASSETS | ||||||||
| Cash and cash equivalents | $ | 77,461 | $ | 41,216 | ||||
| Accounts receivable | 47,449 | 40,488 | ||||||
| Inventories, net | 44,833 | 52,540 | ||||||
| Prepaid expenses and other current assets | 4,159 | 5,133 | ||||||
| Total current assets | 173,902 | 139,377 | ||||||
| Property and equipment, net | 23,448 | 25,212 | ||||||
| Right-of-use asset - operating leases | 5,404 | 7,473 | ||||||
| Deferred tax asset | 264,815 | 23,697 | ||||||
| Derivative asset- interest rate swap | 2,749 | 5,258 | ||||||
| Deposits and other assets | 3,600 | 24 | ||||||
| Total assets | $ | 473,918 | $ | 201,041 | ||||
| LIABILITIES AND STOCKHOLDERS' DEFICIT | ||||||||
| CURRENT LIABILITIES | ||||||||
| Accrued expenses | 14,682 | 11,986 | ||||||
| Accounts payable | 11,544 | 5,193 | ||||||
| Commission payable | 2,563 | 4,429 | ||||||
| Bonus payable | 8,466 | 5,616 | ||||||
| Current portion of long-term debt | 11,250 | 10,313 | ||||||
| Current portion of lease liabilities - operating leases | 2,113 | 1,948 | ||||||
| Current portion of earnout consideration liability | 20,533 | 60 | ||||||
| Current portion of tax receivable agreement liability | 5,171 | 1,425 | ||||||
| Total current liabilities | 76,322 | 40,970 | ||||||
| Long-term debt, net of deferred finance costs | 184,389 | 198,331 | ||||||
| Convertible notes | — | 127,832 | ||||||
| Derivative liability - convertible notes redemption make-whole provision | — | 425 | ||||||
| Warrant liability | 104,231 | 8,294 | ||||||
| Lease liabilities - operating leases | 3,888 | 6,220 | ||||||
| Tax receivable agreement liability | 248,534 | 23,949 | ||||||
| Earnout consideration liability | — | 793 | ||||||
| Total liabilities | 617,364 | 406,814 | ||||||
| Commitments and contingencies (Note 15) | ||||||||
| Redeemable non-controlling interest | — | 596,587 | ||||||
| Preferred stock, $0.0001 par value; 10,000,000 shares authorized, no shares issued and outstanding. | — | — | ||||||
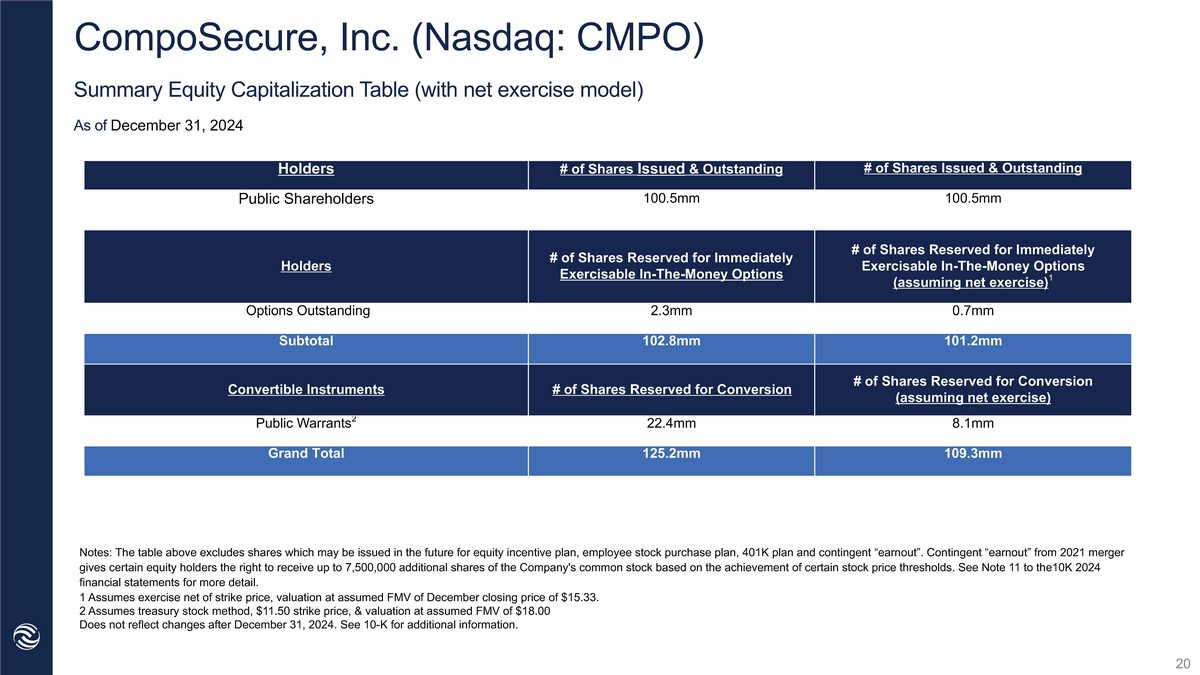
| Class A common stock, $0.0001 par value; 250,000,000 shares authorized, 100,462,844 and 19,415,123 shares issued and outstanding as of December 31, 2024 and 2023, respectively | 10 | 2 | ||||||
| Class B common stock, $0.0001 par value; 75,000,000 shares authorized 0 shares and 59,958,422 shares issued and outstanding as of December 31, 2024 and 2023, respectively | — | 6 | ||||||
| Additional paid-in-capital | 361,379 | 39,466 | ||||||
| Accumulated other comprehensive income | 2,543 | 4,991 | ||||||
| Accumulated deficit | (507,378 | ) | (846,825 | ) | ||||
| Total stockholders' deficit | $ | (143,446 | ) | $ | (802,360 | ) | ||
| TOTAL LIABILITIES AND STOCKHOLDERS' EQUITY (DEFICIT) | $ | 473,918 | $ | 201,041 | ||||
Consolidated Statements of Operations
(in thousands, except per share amounts)
(unaudited)
| Three months ended December 31, | Twelve months ended December 31, | |||||||||||||||
| 2024 | 2023 | 2024 | 2023 | |||||||||||||
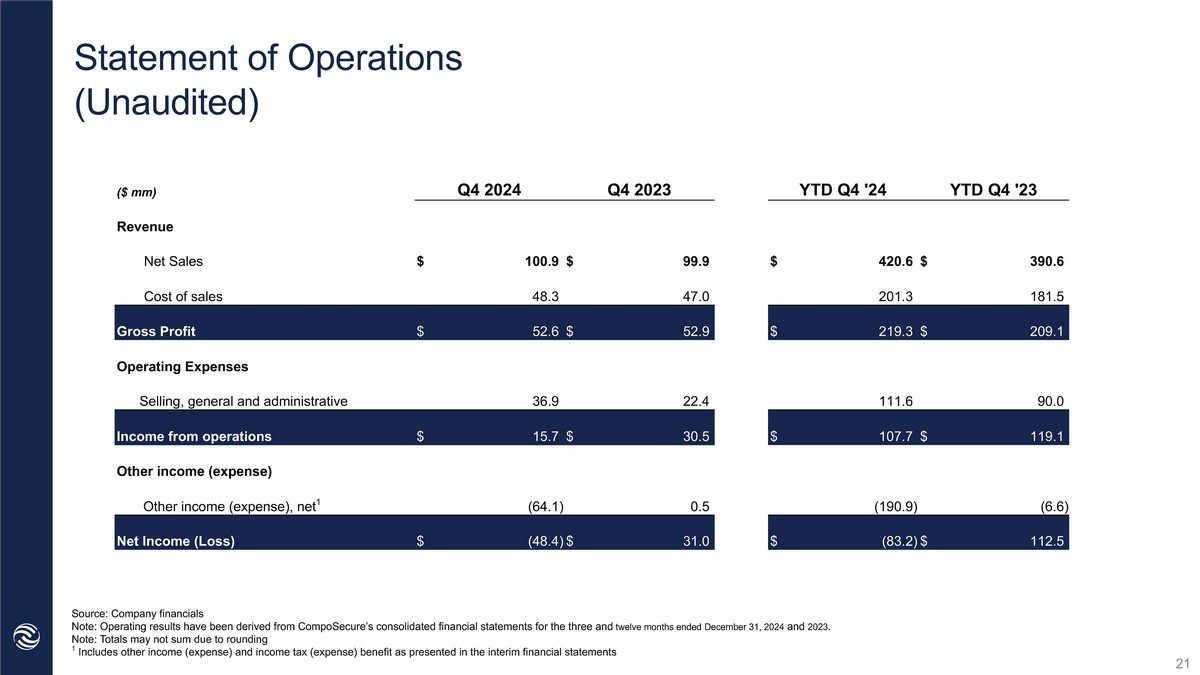
| Net sales | $ | 100,859 | $ | 99,900 | $ | 420,571 | $ | 390,629 | ||||||||
| Operating expenses: | ||||||||||||||||
| Cost of sales | 48,325 | 47,005 | 201,344 | 181,547 | ||||||||||||
| Selling, general and administrative expenses | 36,932 | 22,368 | 111,605 | 89,995 | ||||||||||||
| Total operating expenses | 85,257 | 69,373 | 312,949 | 271,542 | ||||||||||||
| Income from operations | 15,602 | 30,527 | 107,622 | 119,087 | ||||||||||||
| Total other income (expense), net | (61,824 | ) | 4,397 | (188,597 | ) | (2,011 | ) | |||||||||
| (Loss) income before income taxes | (46,222 | ) | 34,924 | (80,975 | ) | 117,076 | ||||||||||
| Income tax (expense) | (2,136 | ) | (3,901 | ) | (2,187 | ) | (4,556 | ) | ||||||||
| Net (loss) income | $ | (48,358 | ) | $ | 31,023 | $ | (83,162 | ) | $ | 112,520 | ||||||
| Net (loss) income attributable to redeemable non-controlling interests | $ | — | $ | 27,730 | $ | (29,443 | ) | $ | 93,281 | |||||||
| Net (loss) income attributable to CompoSecure, Inc. | $ | (48,358 | ) | $ | 3,293 | $ | (53,719 | ) | $ | 19,239 | ||||||
| Net (loss) income per share attributable to Class A common stockholders - basic | $ | (0.53 | ) | $ | 0.17 | $ | (1.22 | ) | $ | 1.03 | ||||||
| Net (loss) income per share attributable to Class A common stockholders - diluted | $ | (0.53 | ) | $ | 0.17 | $ | (1.22 | ) | $ | 0.96 | ||||||
| Weighted average shares used to compute net (loss) income per share attributable to Class A common stockholders - basic (in thousands) | 91,371 | 19,375 | 44,012 | 18,661 | ||||||||||||
| Weighted average shares used to compute net (loss) income per share attributable to Class A common stockholders - diluted (in thousands) | 91,371 | 19,375 | 44,012 | 35,312 | ||||||||||||
Consolidated Statements of Cash Flows
(in thousands)
(unaudited)
| Twelve months ended December 31, | ||||||||
| 2024 | 2023 | |||||||
| Cash flows from operating activities: | ||||||||
| Net (loss) income | $ | (83,162 | ) | $ | 112,520 | |||
| Adjustments to reconcile net income to net cash provided by operating activities | ||||||||
| Depreciation and amortization | 9,174 | 8,387 | ||||||
| Stock-based compensation expense | 21,235 | 17,562 | ||||||
| Inventory reserve | (294 | ) | (1,182 | ) | ||||
| Amortization of deferred financing costs | 1,155 | 1,546 | ||||||
| Loss on extinguishment of debt | 148 | — | ||||||
| Revaluation of earnout consideration liability | 76,305 | (14,237 | ) | |||||
| Revaluation of warrant liability | 95,937 | (8,047 | ) | |||||
| Change in fair value of derivative liability | (425 | ) | 139 | |||||
| Deferred tax expense | (2,469 | ) | 2,667 | |||||
| Changes in assets and liabilities | ||||||||
| Accounts receivable | (6,961 | ) | (3,216 | ) | ||||
| Inventories | 8,001 | (8,984 | ) | |||||
| Prepaid expenses and other assets | 974 | (1,309 | ) | |||||
| Accounts payable | 6,351 | (1,934 | ) | |||||
| Accrued expenses | 2,696 | 1,833 | ||||||
| Other liabilities | 888 | (1,433 | ) | |||||
| Net cash provided by operating activities | 129,553 | 104,312 | ||||||
| Cash flows from investing activities: | ||||||||
| Purchase of property and equipment | (7,410 | ) | (10,944 | ) | ||||
| Investment in SAFE | (1,500 | ) | — | |||||
| Capitalized software expenditures | (1,035 | ) | — | |||||
| Net cash used in investing activities | (9,945 | ) | (10,944 | ) | ||||
| Cash flows from financing activities: | ||||||||
| Proceeds from employee stock purchase plan and exercise of options | 4,998 | 1,196 | ||||||
| Payments for taxes related to net share settlement of equity awards | (8,994 | ) | (3,126 | ) | ||||
| Payments for taxes related to net share settlement of Earnouts | (3,789 | ) | — | |||||
| Payment of term loan | (12,813 | ) | (22,810 | ) | ||||
| Payment of tax receivable agreement liability | (1,303 | ) | (2,436 | ) | ||||
| Deferred finance costs related to debt modification | (2,104 | ) | (256 | ) | ||||
| Tax distributions to non-controlling members | (34,863 | ) | (38,362 | ) | ||||
| Special Distribution to non-controlling members | (15,573 | ) | — | |||||
| Dividend to Class A shareholders | (8,922 | ) | — | |||||
| Net cash used in financing activities | (83,363 | ) | (65,794 | ) | ||||
| Net increase (decrease) in cash and cash equivalents | 36,245 | 27,574 | ||||||
| Cash and cash equivalents , beginning of year | $ | 41,216 | $ | 13,642 | ||||
| Cash and cash equivalents, end of year | $ | 77,461 | $ | 41,216 | ||||
| Supplementary disclosure of cash flow information: | ||||||||
| Cash paid for interest expense | 20,608 | 27,247 | ||||||
| Cash paid for income taxes | 4,820 | 2,760 | ||||||
| Supplemental disclosure of non-cash financing activities: | ||||||||
| Derivative asset - interest rate swap | (2,448 | ) | (3,292 | ) | ||||
Non-GAAP Adjusted EBITDA Reconciliation
(in thousands)
(unaudited)
| Three months ended December 31, | Twelve months ended December 31, | |||||||||||||||
| 2024 | 2023 | 2024 | 2023 | |||||||||||||
| (in thousands) | ||||||||||||||||
| Net (loss) income | $ | (48,358 | ) | $ | 31,023 | $ | (83,162 | ) | $ | 112,520 | ||||||
| Add: | ||||||||||||||||
| Depreciation and amortization | 2,242 | 2,138 | 9,174 | 8,387 | ||||||||||||
| Interest expense, net (1) | (147 | ) | 5,801 | 16,780 | 24,156 | |||||||||||
| Income tax expense | 2,136 | 3,901 | 2,187 | 4,556 | ||||||||||||
| EBITDA | $ | (44,127 | ) | $ | 42,863 | $ | (55,021 | ) | $ | 149,619 | ||||||
| Stock-based compensation expense | 5,966 | 4,510 | 21,235 | 17,562 | ||||||||||||
| Mark-to-market adjustments, net (2) | 61,971 | (10,198 | ) | 171,817 | (22,145 | ) | ||||||||||
| September Resolute deal expenses | — | — | 2,726 | — | ||||||||||||
| Secondary offering transaction costs | — | — | 586 | — | ||||||||||||
| Debt refinance costs | — | — | 225 | — | ||||||||||||
| Additional earnout costs | 3,680 | — | 3,680 | — | ||||||||||||
| Spin-off costs | 6,119 | — | 6,119 | — | ||||||||||||
| Adjusted EBITDA | $ | 33,609 | $ | 37,175 | $ | 151,367 | $ | 145,036 | ||||||||
| (1) | Includes amortization of deferred financing cost for the three and twelve months ended December 31, 2024 and 2023, respectively. | |
| (2) | Includes the changes in fair value of warrant liability, derivative liabilities and earnout consideration liability for the three and twelve months ended December 31, 2024 and 2023, respectively. |
Non-GAAP Adjusted EPS Reconciliation
(in thousands)
(unaudited)
| Three months ended December 31, | Twelve months ended December 31, | |||||||||||||||
| 2024 | 2023 | 2024 | 2023 | |||||||||||||
| (in thousands) except per share amounts | ||||||||||||||||
| Basic: | ||||||||||||||||
| Net (loss) income | $ | (48,358 | ) | $ | 31,023 | $ | (83,162 | ) | $ | 112,520 | ||||||
| Add: provision for income taxes | 2,136 | 3,901 | 2,187 | 4,556 | ||||||||||||
| (Loss) income before income taxes | (46,222 | ) | 34,924 | (80,975 | ) | 117,076 | ||||||||||
| Add (less): mark-to-market adjustments (1) | 61,971 | (10,198 | ) | 171,817 | (22,145 | ) | ||||||||||
| Add: stock-based compensation | 5,966 | 4,510 | 21,235 | 17,562 | ||||||||||||
| Add: September Resolute deal expenses | — | — | 2,726 | — | ||||||||||||
| Add: secondary offering transaction costs | — | — | 586 | — | ||||||||||||
| Add: debt refinance costs | — | — | 225 | — | ||||||||||||
| Add: additional earnout costs | 3,680 | — | 3,680 | — | ||||||||||||
| Add: spin-off costs | 6,119 | — | 6,119 | — | ||||||||||||
| Adjustments total | 31,514 | 29,236 | 125,413 | 112,493 | ||||||||||||
| Income tax expense (2) | 6,845 | 6,399 | 27,240 | 24,433 | ||||||||||||
| Adjusted net income | $ | 24,669 | $ | 22,837 | $ | 98,173 | $ | 88,060 | ||||||||
| Common shares outstanding used in computing net income per share, basic: | ||||||||||||||||
| Class A and Class B common shares (3) | 91,371 | 79,334 | 83,834 | 78,619 | ||||||||||||
| Adjusted net income per share - basic | 0.27 | 0.29 | 1.17 | 1.12 | ||||||||||||
| Diluted: | ||||||||||||||||
| Adjusted net income | 24,669 | 22,837 | 98,173 | 88,060 | ||||||||||||
| Add: Interest on convertible notes net of tax | (2,110 | ) | 1,781 | 3,238 | 7,123 | |||||||||||
| Adjusted net income used in computing net income per share, diluted (5) | 22,559 | 24,618 | 101,411 | 95,183 | ||||||||||||
| Common shares outstanding used in computing net income per share, diluted: | ||||||||||||||||
| Warrants (4) | 8,094 | 8,094 | 8,094 | 8,094 | ||||||||||||
| Exchangeable Notes (5) | 5,795 | 13,000 | 11,629 | 13,000 | ||||||||||||
| Equity awards | 4,901 | 2,988 | 3,411 | 3,651 | ||||||||||||
| Total shares outstanding used in computing net income per share - diluted (5) | 110,161 | 103,416 | 106,968 | 103,364 | ||||||||||||
| Adjusted net income per share - diluted | $ | 0.20 | $ | 0.24 | $ | 0.95 | $ | 0.92 | ||||||||
| 1) | Includes the changes in fair value of warrant liability, make-whole provision of Exchangeable Notes, and earnout consideration liability. |
| 2) | Calculated using the Company's blended tax rate |
| 3) | Assumes both Class A and Class B shares participate in earnings and are outstanding at the end of the period.There were no Class B shares outstanding as of December 31, 2024. |
| 4) | Assumes treasury stock method, valuation at assumed fair market value of $18.00. |
| 5) | The Exchangeable Notes were included through the application of the "if-converted" method. Interest related to the Exchangeable Notes, net of tax was excluded from net income. |
Non-GAAP Free Cash Flow
(in thousands)
(unaudited)
| Twelve months ended December 31, | ||||||||
| 2024 | 2023 | |||||||
| Net cash provided by operating activities | $ | 129,553 | $ | 104,312 | ||||
| Purchase of property and equipment | (7,410 | ) | (10,944 | ) | ||||
| Capitalized software expenditures | (1,035 | ) | — | |||||
| Tax distributions to non-controlling members | (34,863 | ) | (38,362 | ) | ||||
| Payment of tax receivable agreement liability | (1,303 | ) | (2,436 | ) | ||||
| Free cash flow | $ | 84,942 | $ | 52,570 | ||||