8-K
GOLDMAN SACHS GROUP INC Depositary Shares, Each Representing 1/1,000th Interest in a Share of 5.50% Fixed-to-Floating Rate Non-Cumulative Preferred Stock, Series J Depositary Shares, Each Representing 1/1,000th Interest in a Share of 6.375% Fixed-to-Floating Rate Non-Cumulative Preferred Stock, Series K 5.793% Fixed-to-Floating Rate Normal Automatic Preferred Enhanced Capital Securities of Goldman Sachs Capital II NY false 0000886982 0000886982 2021-07-13 2021-07-13 0000886982 us-gaap:CommonStockMember 2021-07-13 2021-07-13 0000886982 gs:DepositarySharesEachRepresenting11000thInterestInAShareOfFloatingRateNonCumulativePreferredStockSeriesA3Member 2021-07-13 2021-07-13 0000886982 gs:DepositarySharesEachRepresenting11000thInterestInAShareOfFloatingRateNonCumulativePreferredStockSeriesC1Member 2021-07-13 2021-07-13 0000886982 gs:DepositarySharesEachRepresenting11000thInterestInAShareOfFloatingRateNonCumulativePreferredStockSeriesD2Member 2021-07-13 2021-07-13 0000886982 gs:DepositarySharesEachRepresenting11000thInterestInAShareOf5.50FixedToFloatingRateNonCumulativePreferredStockSeriesJMember 2021-07-13 2021-07-13 0000886982 gs:DepositarySharesEachRepresenting11000thInterestInAShareOf6.375FixedToFloatingRateNonCumulativePreferredStockSeriesK3Member 2021-07-13 2021-07-13 0000886982 gs:M5.793FixedToFloatingRateNormalAutomaticPreferredEnhancedCapitalSecuritiesOfGoldmanSachsCapitalIiMember 2021-07-13 2021-07-13 0000886982 gs:FloatingRateNormalAutomaticPreferredEnhancedCapitalSecuritiesOfGoldmanSachsCapitalIiiMember 2021-07-13 2021-07-13 0000886982 gs:MediumTermNotesSeriesFCallableFixedAndFloatingRateNotesDue2031OfGsFinanceCorpMember 2021-07-13 2021-07-13 0000886982 gs:MediumTermNotesSeriesEIndexLinkedNotesDue2028OfGsFinanceCorpMember 2021-07-13 2021-07-13

UNITED STATES SECURITIES AND EXCHANGE COMMISSION

Washington, D.C. 20549


Form 8-K


CURRENT REPORT PURSUANT TO SECTION 13 or 15(d) OF THE SECURITIES EXCHANGE ACT OF 1934


Date of Report (Date of earliest event reported): July 13, 2021

Commission File Number: 001-14965

The Goldman Sachs Group, Inc.

(Exact name of registrant as specified in its charter)


Delaware

(State or other jurisdiction of

incorporation or organization)


13-4019460

(IRS Employer

Identification No.)


200 West Street, New York, N.Y.      10282
(Address of principal executive offices)      (Zip Code)

(212) 902-1000

(Registrant’s telephone number, including area code)


N/A


(Former name or former address, if changed since last report.)

Check the appropriate box below if the Form 8-K filing is intended to simultaneously satisfy the filing obligation of the registrant under any of the following provisions:

Written communications pursuant to Rule 425 under the Securities Act (17 CFR 230.425)

Soliciting material pursuant to Rule 14a-12 under the Exchange Act (17 CFR 240.14a-12)

Pre-commencement communications pursuant to Rule 14d-2(b) under the Exchange Act (17 CFR 240.14d-2(b))

Pre-commencement communications pursuant to Rule 13e-4(c) under the Exchange Act (17 CFR 240.13e-4(c))


Securities registered pursuant to Section 12(b) of the Act:


Title of each class   Trading
Symbol
  

Exchange

on which

registered


Common stock, par value $.01 per share   GS    NYSE
Depositary Shares, Each Representing 1/1,000th Interest in a Share of Floating Rate Non-Cumulative Preferred Stock, Series A   GS PrA    NYSE
Depositary Shares, Each Representing 1/1,000th Interest in a Share of Floating Rate Non-Cumulative Preferred Stock, Series C   GS PrC    NYSE
Depositary Shares, Each Representing 1/1,000th Interest in a Share of Floating Rate Non-Cumulative Preferred Stock, Series D   GS PrD    NYSE
Depositary Shares, Each Representing 1/1,000th Interest in a Share of 5.50% Fixed-to-Floating Rate Non-Cumulative Preferred Stock, Series J   GS PrJ    NYSE
Depositary Shares, Each Representing 1/1,000th Interest in a Share of 6.375% Fixed-to-Floating Rate Non-Cumulative Preferred Stock, Series K   GS PrK    NYSE
5.793% Fixed-to-Floating Rate Normal Automatic Preferred Enhanced Capital Securities of Goldman Sachs Capital II   GS/43PE    NYSE
Floating Rate Normal Automatic Preferred Enhanced Capital Securities of Goldman Sachs Capital III   GS/43PF    NYSE
Medium-Term Notes, Series F, Callable Fixed and Floating Rate Notes due 2031 of GS Finance Corp.   GS/31B    NYSE
Medium-Term Notes, Series E, Index-Linked Notes due 2028 of GS Finance Corp.   FRLG    NYSE Arca


Indicate by check mark whether the registrant is an emerging growth company as defined in Rule 405 under the Securities Act (17 CFR 230.405) or Rule 12b-2 of the Exchange Act (17 CFR 240.12b-2).

Emerging growth company  

If an emerging growth company, indicate by check mark if the registrant has elected not to use the extended transition period for complying with any new or revised financial accounting standards provided pursuant to Section 13(a) of the Exchange Act.  ☐


TABLE OF CONTENTS


Item 2.02 Results of Operations and Financial Condition


Item 7.01 Regulation FD Disclosure


Item 9.01 Financial Statements and Exhibits


SIGNATURE


Exhibit 99.1: PRESS RELEASE


Exhibit 99.2: PRESENTATION


Item 2.02 Results of Operations and Financial Condition.

On July 13, 2021, The Goldman Sachs Group, Inc. (Group Inc. and, together with its consolidated subsidiaries, the firm) reported its earnings for the second quarter ended June 30, 2021. A copy of Group Inc.’s press release containing this information is attached as Exhibit 99.1 to this Report on Form 8-K and is incorporated herein by reference.

Item 7.01 Regulation FD Disclosure.

On July 13, 2021, at 9:30 a.m. (ET), the firm will hold a conference call to discuss the firm’s financial results, outlook and related matters. A copy of the presentation for the conference call is attached as Exhibit 99.2 to this Report on Form 8-K.

Item 9.01 Financial Statements and Exhibits.

(d) Exhibits.


  99.1

Press release of Group Inc. dated July 13, 2021 containing financial information for its second quarter ended June 30, 2021.

The quotation on page 1 of Exhibit 99.1 and the information under the caption “Highlights” on the following page (Excluded Sections) shall not be deemed “filed” for purposes of Section 18 of the Securities Exchange Act of 1934 (Exchange Act) or otherwise subject to the liabilities under that Section and shall not be deemed to be incorporated by reference into any filing of Group Inc. under the Securities Act of 1933 or the Exchange Act. The information included in Exhibit 99.1, other than in the Excluded Sections, shall be deemed “filed” for purposes of the Exchange Act.


  99.2

Presentation of Group Inc. dated July 13, 2021, for the conference call on July 13, 2021.

Exhibit 99.2 is being furnished pursuant to Item 7.01 of Form 8-K and the information included therein shall not be deemed “filed” for purposes of Section 18 of the Exchange Act or otherwise subject to the liabilities under that Section and shall not be deemed to be incorporated by reference into any filing of Group Inc. under the Securities Act of 1933 or the Exchange Act.


  101

Pursuant to Rule 406 of Regulation S-T, the cover page information is formatted in iXBRL (Inline eXtensible Business Reporting Language).


  104

Cover Page Interactive Data File (formatted in iXBRL in Exhibit 101).


SIGNATURE

Pursuant to the requirements of the Securities Exchange Act of 1934, the Registrant has duly caused this report to be signed on its behalf by the undersigned hereunto duly authorized.


THE GOLDMAN SACHS GROUP, INC.


          (Registrant)

Date: July 13, 2021


By:


/s/ Stephen M. Scherr


Name:  Stephen M. Scherr


Title:    Chief Financial Officer

Exhibit 99.1


LOGO


Second Quarter 2021 Earnings Results


    Media Relations: Andrea Williams 212-902-5400

    Investor Relations: Carey Halio 212-902-0300    


The Goldman Sachs Group, Inc.              

200 West Street | New York, NY 10282              


Second Quarter 2021 Earnings Results

Goldman Sachs Reports Second Quarter Earnings Per Common Share of $15.02 and Increases the Quarterly Dividend to $2.00 Per Common Share


“Our second quarter performance and record revenues for the first half of the year demonstrate the strength of our client franchise and our continued progress on our strategic priorities. While the economic recovery is underway, our clients and communities still face challenges in overcoming the pandemic. But, as always, I am proud of the dedication and resilience of our people, who have worked tirelessly to help our clients navigate the ever-changing market environment.”


- David M. Solomon, Chairman and Chief Executive Officer        


Financial Summary


Net Revenues


Net Earnings


EPS


2Q                           $15.39 billion 


2Q YTD                    $33.09 billion 


 2Q                           $5.49 billion 


 2Q YTD                 $12.32 billion 


2Q                                 $15.02 


2Q YTD                         $33.64 


Annualized ROE1


Annualized  ROTE1


Book Value Per Share


2Q                                       23.7% 


2Q YTD                               27.3% 


2Q                                     25.1% 


2Q YTD                             28.9% 


2Q                                  $264.90 


 YTD Growth                  12.2% 


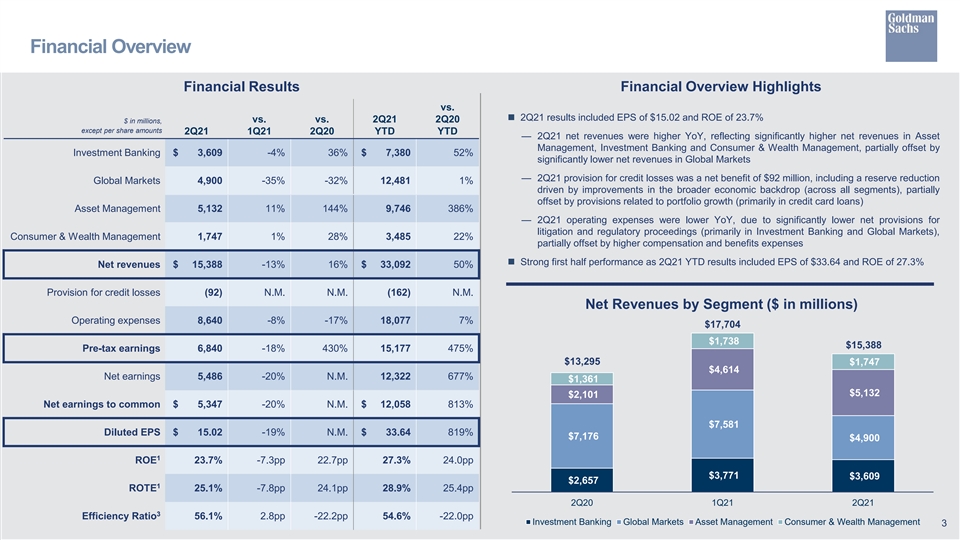
NEW YORK, July 13, 2021 – The Goldman Sachs Group, Inc. (NYSE: GS) today reported net revenues of $15.39 billion and net earnings of $5.49 billion for the second quarter ended June 30, 2021. Net revenues were $33.09 billion and net earnings were $12.32 billion for the first half of 2021.

Diluted earnings per common share (EPS) was $15.02 for the second quarter of 2021 compared with $0.53 for the second quarter of 2020 and $18.60 for the first quarter of 2021, and was $33.64 for the first half of 2021 compared with $3.66 for the first half of 2020. In the prior year, net provisions for litigation and regulatory proceedings reduced diluted EPS by $8.23 for the second quarter of 2020 and $8.76 for the first half of 2020.

Annualized return on average common shareholders’ equity (ROE)1 was 23.7% for the second quarter of 2021 and 27.3% for the first half of 2021. Annualized return on average tangible common shareholders’ equity (ROTE)1 was 25.1% for the second quarter of 2021 and 28.9% for the first half of 2021.

1      


Goldman Sachs Reports

Second Quarter 2021 Earnings Results


Highlights


Strong overall firm performance continued in the second quarter as results reflected the second highest quarterly net revenues of $15.39 billion, the second highest quarterly net earnings of $5.49 billion and the second highest quarterly diluted EPS of $15.02.


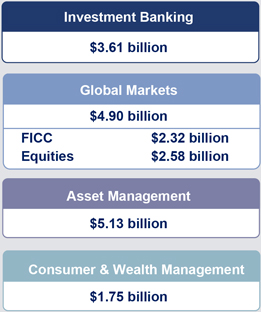
Investment Banking generated its second highest quarterly net revenues of $3.61 billion, which followed record net revenues in the first quarter of 2021. Quarterly net revenues were also the second highest in each of Financial advisory, Equity underwriting and Debt underwriting. The backlog2 increased significantly compared with the end of 2020, ending the quarter at a record level.


The firm ranked #1 in worldwide announced and completed mergers and acquisitions, worldwide equity and equity-related offerings, common stock offerings and initial public offerings for the year-to-date.3


Global Markets generated quarterly net revenues of $4.90 billion, reflecting solid client activity across both Fixed Income, Currency and Commodities (FICC) and Equities.


Asset Management generated record quarterly net revenues of $5.13 billion, reflecting record quarterly net revenues from Equity investments.


Consumer & Wealth Management generated record quarterly net revenues of $1.75 billion.


Firmwide assets under supervision2,4 increased $101 billion during the quarter, including long-term net inflows of $22 billion, to a record $2.31 trillion. Firmwide Management and other fees were a record $1.84 billion for the second quarter of 2021.


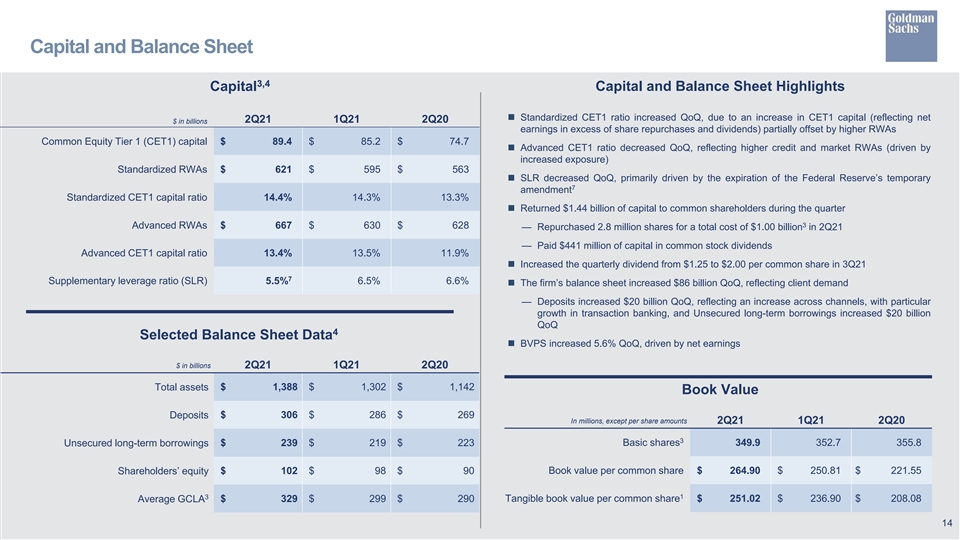
Book value per common share increased by 5.6% during the quarter and 12.2% during the first half of 2021 to $264.90.


On July 12, 2021, the Board of Directors of The Goldman Sachs Group, Inc. approved a 60% increase in the quarterly dividend to $2.00 per common share beginning in the third quarter of 2021.


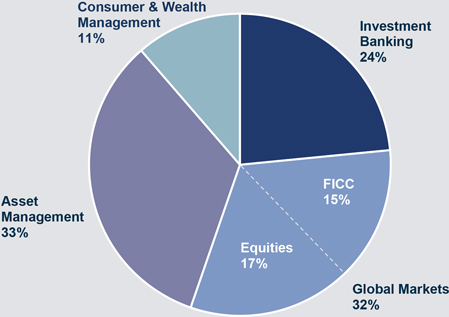
Quarterly Net Revenue Mix by Segment


         LOGO   LOGO

2      


Goldman Sachs Reports

Second Quarter 2021 Earnings Results


Net Revenues


Net revenues were $15.39 billion for the second quarter of 2021, 16% higher than the second quarter of 2020 and 13% lower than the first quarter of 2021. The increase compared with the second quarter of 2020 reflected significantly higher net revenues in Asset Management, Investment Banking and Consumer & Wealth Management, partially offset by significantly lower net revenues in Global Markets.


Net Revenues


$15.39 billion


  Investment Banking  


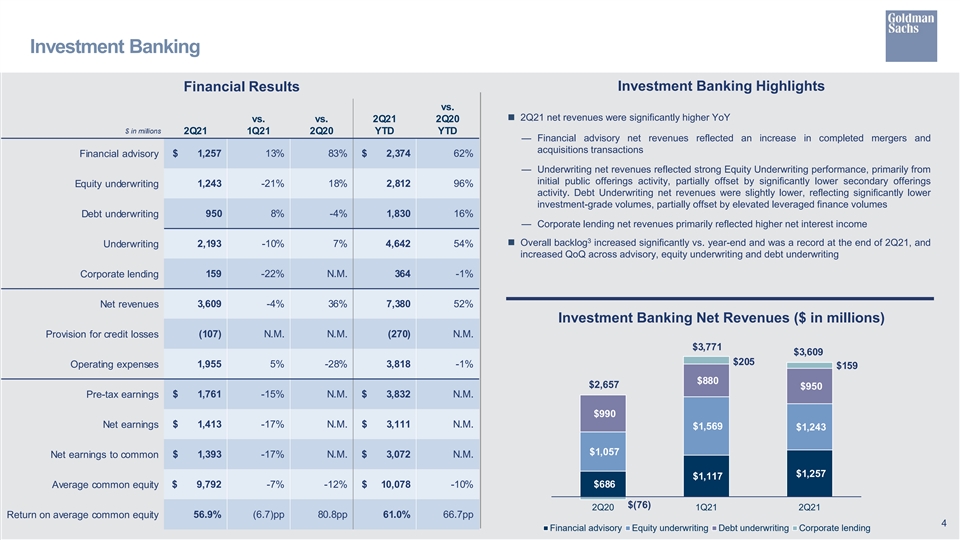
Net revenues in Investment Banking were $3.61 billion for the second quarter of 2021, 36% higher than the second quarter of 2020 and 4% lower than a strong first quarter of 2021. The increase compared with the second quarter of 2020 reflected significantly higher net revenues in Financial advisory and Corporate lending and higher net revenues in Underwriting.


The increase in Financial advisory net revenues reflected an increase in completed mergers and acquisitions transactions. The increase in Corporate lending net revenues primarily reflected higher net interest income. The increase in Underwriting net revenues was due to higher net revenues in Equity underwriting, primarily driven by strong industry-wide initial public offering activity, partially offset by a significant decline in industry-wide secondary offerings. Debt underwriting net revenues were slightly lower, primarily reflecting significantly lower industry-wide investment-grade volumes, partially offset by elevated industry-wide leveraged finance volumes.


The firm’s backlog2 increased significantly compared with the end of 2020, and was higher compared with the end of the first quarter of 2021.


Investment Banking


$3.61 billion


Financial Advisory


    $1.26 billion 


Underwriting


    $2.19 billion 


Corporate Lending  


    $159 million  


  Global Markets  


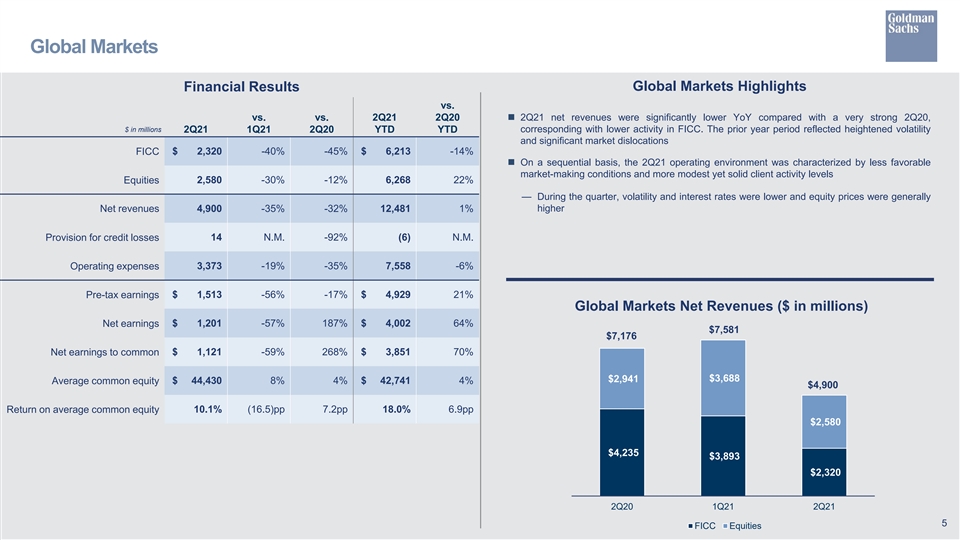
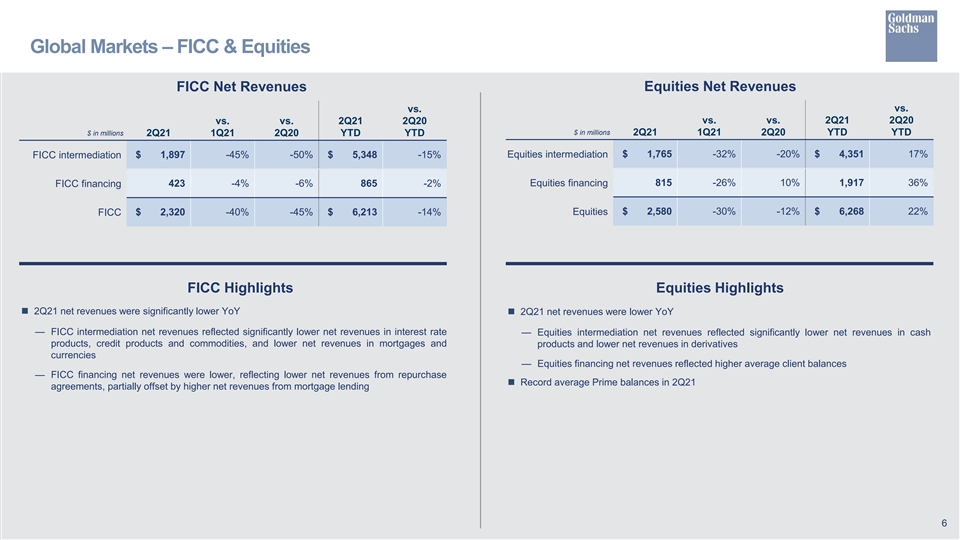
Net revenues in Global Markets were $4.90 billion for the second quarter of 2021, 32% lower than a strong second quarter of 2020 and 35% lower than a strong first quarter of 2021.


Net revenues in FICC were $2.32 billion, 45% lower than the second quarter of 2020, as the prior year period included strong activity levels due to high volatility amid the COVID-19 pandemic. The decrease in net revenues was due to significantly lower net revenues in FICC intermediation, reflecting significantly lower net revenues in interest rate products, credit products and commodities, and lower net revenues in mortgages and currencies. In addition, net revenues in FICC financing were lower, reflecting lower net revenues from repurchase agreements, partially offset by higher net revenues from mortgage lending.


Net revenues in Equities were $2.58 billion, 12% lower than the second quarter of 2020, due to significantly lower net revenues in Equities intermediation, reflecting significantly lower net revenues in cash products and lower net revenues in derivatives. Net revenues in Equities financing were higher, reflecting higher average client balances.


Global Markets


$4.90 billion


FICC Intermediation


$1.90 billion  


FICC Financing


$423 million  


FICC


$2.32 billion  


Equities Intermediation


$1.77 billion  


Equities Financing


$815 million  


Equities


$2.58 billion  


3      


Goldman Sachs Reports

Second Quarter 2021 Earnings Results


  Asset Management  


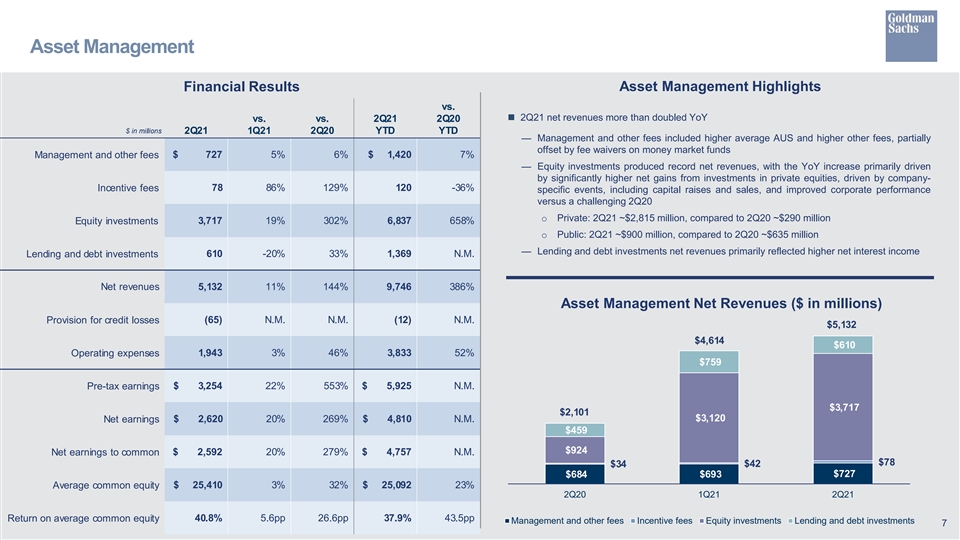
Net revenues in Asset Management were $5.13 billion for the second quarter of 2021, more than double the amount in the second quarter of 2020 and 11% higher than the first quarter of 2021. The increase compared with the second quarter of 2020 was primarily driven by significantly higher net revenues in Equity investments. In addition, Lending and debt investments net revenues, Incentive fees and Management and other fees were each higher.


The increase in Equity investments net revenues primarily reflected significantly higher net gains from investments in private equities, driven by company-specific events, including capital raises and sales, and improved corporate performance versus a challenging second quarter of 2020. The increase in Lending and debt investments net revenues was primarily due to higher net interest income. The increase in Incentive fees was due to harvesting. Management and other fees included the impact of higher average assets under supervision and higher other fees, partially offset by fee waivers on money market funds.


Asset Management


$5.13 billion


Management and


  Other Fees

  $727 million  
   

Incentive Fees

  $  78 million  
   

Equity Investments

  $3.72 billion  


Lending and Debt

  Investments


$610 million  


  Consumer & Wealth Management  


Net revenues in Consumer & Wealth Management were $1.75 billion for the second quarter of 2021, 28% higher than the second quarter of 2020 and essentially unchanged compared with the first quarter of 2021.


Net revenues in Wealth management were $1.38 billion, 25% higher than the second quarter of 2020. Management and other fees were higher, reflecting the impact of higher average assets under supervision, and net revenues in Private banking and lending were higher, primarily reflecting higher loan balances.


Net revenues in Consumer banking were $363 million, 41% higher than the second quarter of 2020, reflecting higher deposit and credit card balances.


Consumer &

Wealth Management


$1.75 billion


Wealth Management

  $1.38 billion  
   

Consumer Banking


$363 million  


Provision for Credit Losses


Provision for credit losses was a net benefit of $92 million for the second quarter of 2021, compared with net provisions of $1.59 billion for the second quarter of 2020 and a net benefit of $70 million for the first quarter of 2021. The second quarter of 2021 included reserve reductions on wholesale and consumer loans reflecting continued improvement in the broader economic environment following challenging conditions that began in the first half of 2020 as a result of the COVID-19 pandemic, partially offset by provisions related to portfolio growth (primarily in credit card loans).


The firm’s allowance for credit losses was $4.09 billion as of June 30, 2021.


Provision for Credit Losses


$(92) million


4      


Goldman Sachs Reports

Second Quarter 2021 Earnings Results


Operating Expenses


Operating expenses were $8.64 billion for the second quarter of 2021, 17% lower than the second quarter of 2020 and 8% lower than the first quarter of 2021. The firm’s efficiency ratio2 for the first half of 2021 was 54.6%, compared with 76.6% for the first half of 2020.


Operating Expenses


$8.64 billion


The decrease in operating expenses compared with the second quarter of 2020 was due to significantly lower non-compensation expenses, partially offset by higher compensation and benefits expenses (reflecting strong performance). Within non-compensation expenses, net provisions for litigation and regulatory proceedings were significantly lower, partially offset by higher transaction based expenses and higher technology expenses (included in communications and technology and depreciation and amortization).


Net provisions for litigation and regulatory proceedings for the second quarter of 2021 were $226 million compared with $2.96 billion for the second quarter of 2020.


Headcount was essentially unchanged compared with the end of the first quarter of 2021.


YTD Efficiency Ratio


54.6%


Provision for Taxes


The effective income tax rate for the first half of 2021 increased to 18.8% from 18.0% for the first quarter of 2021, primarily due to a decrease in the impact of tax benefits on the settlement of employee share-based awards in the first half of 2021 compared with the first quarter of 2021.


YTD Effective Tax Rate


18.8%


Other Matters


 On July 12, 2021, the Board of Directors of The Goldman Sachs Group, Inc. increased the quarterly dividend to $2.00 per common share from $1.25 per common share. The dividend will be paid on September 29, 2021 to common shareholders of record on September 1, 2021.


 During the quarter, the firm returned $1.44 billion of capital to common shareholders, including $1.00 billion of share repurchases (2.8 million shares at an average cost of $350.90) and $441 million of common stock dividends.2


 Global core liquid assets2 averaged $329 billion4 for the second quarter of 2021, compared with an average of $299 billion for the first quarter of 2021.


Declared Quarterly

Dividend Per Common Share


$2.00


Common Share Repurchases


$2.8 million shares for

$1.00 billion


Average GCLA


$329 billion


5      


Goldman Sachs Reports

Second Quarter 2021 Earnings Results


The Goldman Sachs Group, Inc. is a leading global financial institution that delivers a broad range of financial services across investment banking, securities, investment management and consumer banking to a large and diversified client base that includes corporations, financial institutions, governments and individuals. Founded in 1869, the firm is headquartered in New York and maintains offices in all major financial centers around the world.


  Cautionary Note Regarding Forward-Looking Statements  


This press release contains “forward-looking statements” within the meaning of the safe harbor provisions of the U.S. Private Securities Litigation Reform Act of 1995. Forward-looking statements are not historical facts or statements of current conditions, but instead represent only the firm’s beliefs regarding future events, many of which, by their nature, are inherently uncertain and outside of the firm’s control. It is possible that the firm’s actual results, financial condition and liquidity may differ, possibly materially, from the anticipated results, financial condition and liquidity in these forward-looking statements. For information about some of the risks and important factors that could affect the firm’s future results, financial condition and liquidity, see “Risk Factors” in Part I, Item 1A of the firm’s Annual Report on Form 10-K for the year ended December 31, 2020.

Information regarding the firm’s assets under supervision, capital ratios, risk-weighted assets, supplementary leverage ratio, balance sheet data, global core liquid assets and VaR consists of preliminary estimates. These estimates are forward-looking statements and are subject to change, possibly materially, as the firm completes its financial statements.

Statements about the firm’s investment banking transaction backlog also may constitute forward-looking statements. Such statements are subject to the risk that transactions may be modified or may not be completed at all and related net revenues may not be realized or may be materially less than expected. Important factors that could have such a result include, for underwriting transactions, a decline or weakness in general economic conditions, an outbreak of hostilities, volatility in the securities markets or an adverse development with respect to the issuer of the securities and, for financial advisory transactions, a decline in the securities markets, an inability to obtain adequate financing, an adverse development with respect to a party to the transaction or a failure to obtain a required regulatory approval. For information about other important factors that could adversely affect the firm’s investment banking transactions, see “Risk Factors” in Part I, Item 1A of the firm’s Annual Report on Form 10-K for the year ended December 31, 2020.


  Conference Call  


A conference call to discuss the firm’s financial results, outlook and related matters will be held at 9:30 am (ET). The call will be open to the public. Members of the public who would like to listen to the conference call should dial 1-888-281-7154 (in the U.S.) or 1-706-679-5627 (outside the U.S.). The number should be dialed at least 10 minutes prior to the start of the conference call. The conference call will also be accessible as an audio webcast through the Investor Relations section of the firm’s website, www.goldmansachs.com/investor-relations. There is no charge to access the call. For those unable to listen to the live broadcast, a replay will be available on the firm’s website or by dialing 1-855-859-2056 (in the U.S.) or 1-404-537-3406 (outside the U.S.) passcode number 64774224 beginning approximately three hours after the event. Please direct any questions regarding obtaining access to the conference call to Goldman Sachs Investor Relations, via e-mail, at [email protected].

6      


Goldman Sachs Reports

Second Quarter 2021 Earnings Results


The Goldman Sachs Group, Inc. and Subsidiaries

Segment Net Revenues (unaudited)

$ in millions


     THREE MONTHS ENDED           % CHANGE FROM  


JUNE 30,

2021


MARCH 31,

2021


JUNE 30,

2020


MARCH 31,

2021


JUNE 30,

2020


INVESTMENT BANKING


Financial advisory

    $             1,257         $           1,117         $                686                                13  %                           83  %  
                 

Equity underwriting

    1,243         1,569         1,057            (21)           18       

Debt underwriting


950  


880  


990   


8     


(4)    


Underwriting

    2,193         2,449         2,047            (10)           7       
                 

Corporate lending


159  


205  


(76)  


(22)    


N.M.     


Net revenues


3,609  


3,771  


2,657   


(4)    


36     


GLOBAL MARKETS


FICC intermediation

    1,897         3,451         3,786            (45)           (50)      

FICC financing


423  


442  


449   


(4)    


(6)    


FICC

    2,320         3,893         4,235            (40)           (45)      
                 

Equities intermediation

    1,765         2,586         2,199            (32)           (20)      


Equities financing


815  


1,102  


742   


(26)    


10     


Equities


2,580  


3,688  


2,941   


(30)    


(12)    


Net revenues


4,900  


7,581  


7,176   


(35)    


(32)    


ASSET MANAGEMENT


Management and other fees

    727         693         684            5            6       


Incentive fees


    78         42         34            86            129       

Equity investments

    3,717         3,120         924            19            302       


Lending and debt investments


610  


759  


459   


(20)    


33     


Net revenues


5,132  


4,614  


2,101   


11     


144     


CONSUMER & WEALTH MANAGEMENT


Management and other fees

    1,109         1,077         938            3            18       


Incentive fees

    15         26         10            (42)           50       


Private banking and lending


260  


264  


155   


(2)    


68     


Wealth management

    1,384         1,367         1,103            1            25       
                 

Consumer banking


363  


371  


258   


(2)    


41     


Net revenues


1,747  


1,738  


1,361   


1     


28     


Total net revenues


$        15,388  


$        17,704  


$            13,295   


(13)    


16     


Geographic Net Revenues (unaudited)2


$ in millions            
   
     THREE MONTHS ENDED                    


JUNE 30,

2021


MARCH 31,

2021


JUNE 30,

2020


Americas

    $          9,957         $        10,825         $              8,289           


EMEA

    3,478         4,713         3,453           


Asia


1,953  


2,166  


1,553   


Total net revenues


$        15,388  


$        17,704  


$            13,295   


Americas

    65%        61%        62%        


EMEA

    22%        27%        26%        


Asia


13% 


12% 


12%


Total


100% 


100% 


100%


7


Goldman Sachs Reports

Second Quarter 2021 Earnings Results


The Goldman Sachs Group, Inc. and Subsidiaries

Segment Net Revenues (unaudited)

$ in millions


     SIX MONTHS ENDED          % CHANGE FROM                                 


JUNE 30,

2021


JUNE 30,

2020


JUNE 30,

2020


INVESTMENT BANKING


Financial advisory

    $           2,374          $           1,467            62  %    
               

Equity underwriting

    2,812          1,435            96         


Debt underwriting

    1,830          1,573            16         


Underwriting

    4,642          3,008            54         


Corporate lending


364   


366   


(1)    


Net revenues


7,380   


4,841   


52     


GLOBAL MARKETS


FICC intermediation

    5,348          6,323            (15)        


FICC financing

    865          881            (2)        


FICC

    6,213          7,204            (14)        
               

Equities intermediation

    4,351          3,727            17         


Equities financing

    1,917          1,408            36         


Equities


6,268   


5,135   


22     


Net revenues


12,481   


12,339   


1     


ASSET MANAGEMENT


Management and other fees

    1,420          1,324            7         


Incentive fees

    120          188            (36)        


Equity investments

    6,837          902            658         


Lending and debt investments


1,369   


(409)  


N.M.    


Net revenues


9,746   


2,005   


386     


CONSUMER & WEALTH MANAGEMENT


Management and other fees

    2,186          1,897            15         


Incentive fees

    41          79            (48)        


Private banking and lending

    524          337            55         


Wealth management

    2,751          2,313            19         
               

Consumer banking


734   


540   


36     


Net revenues


3,485   


2,853   


22     


Total net revenues


$         33,092   


$         22,038   


50     


Geographic Net Revenues (unaudited)2

$ in millions


     SIX MONTHS ENDED                


JUNE 30,

2021


JUNE 30,

2020


Americas

    $         20,782          $         13,460            


EMEA

    8,191          5,561            


Asia


4,119   


3,017    


Total net revenues


$         33,092   


$         22,038    


Americas

    63%        61%         


EMEA

    25%        25%         


Asia


12% 


14% 


Total


100% 


100% 


8


Goldman Sachs Reports

Second Quarter 2021 Earnings Results


The Goldman Sachs Group, Inc. and Subsidiaries

Consolidated Statements of Earnings (unaudited)

In millions, except per share amounts and headcount


     THREE MONTHS ENDED          % CHANGE FROM           
       
     JUNE 30,
2021
          MARCH 31,     
2021
         JUNE 30,    
2020
                 MARCH 31,     
2021
         JUNE 30,    
2020


REVENUES


Investment banking

    $           3,450         $         3,566         $         2,733            (3) %        26  %    


Investment management

    1,905         1,796         1,635            6             17         


Commissions and fees

    833         1,073         875            (22)            (5)        


Market making

    3,274         5,893         5,787            (44)            (43)        


Other principal transactions


4,297 


3,894 


1,321  


10     


225     


Total non-interest revenues


13,759 


16,222 


12,351  


(15)    


11     


Interest income

    2,939         3,054         3,034            (4)            (3)        


Interest expense


1,310 


1,572 


2,090  


(17)    


     (37)        


Net interest income


1,629 


1,482 


944  


10     


73     


Total net revenues


15,388 


17,704 


13,295  


(13)    


16     


Provision for credit losses


(92)


(70)


1,590  


N.M.     


N.M.    


OPERATING EXPENSES


Compensation and benefits

    5,263         6,043         4,478            (13)            18         


Transaction based

    1,125         1,256         1,014            (10)            11         


Market development

    115         80         89            44             29         


Communications and technology

    371         375         345            (1)            8         


Depreciation and amortization

    520         498         499            4             4         


Occupancy

    241         247         233            (2)            3         


Professional fees

    344         360         311            (4)            11         


Other expenses


    661         578         3,445           


14     


(81)    


Total operating expenses


8,640 


9,437 


10,414  


(8)    


(17)    


Pre-tax earnings

    6,840         8,337         1,291            (18)            430         


Provision for taxes


    1,354         1,501         918           


(10)    


47     


Net earnings


    5,486         6,836         373           


(20)    


N.M.    


Preferred stock dividends


    139         125         176           


11     


(21)    


Net earnings applicable to common shareholders


$             5,347 


$           6,711 


$            197  


(20)    


N.M.    


EARNINGS PER COMMON SHARE2


Basic

    $             15.22         $           18.80         $           0.53            (19) %        N.M. %    


Diluted

    $             15.02         $           18.60         $           0.53            (19)            N.M.        


AVERAGE COMMON SHARES


Basic

    350.8         356.6         355.7            (2)            (1)        


Diluted

    356.0         360.9         355.7            (1)            –         


SELECTED DATA AT PERIOD-END


Common shareholders’ equity

    $         92,687         $       88,461         $       78,826            5             18         


Basic shares2

    349.9         352.7         355.8            (1)            (2)        


Book value per common share

    $         264.90         $       250.81         $       221.55            6             20         
                       

Headcount


40,800 


40,300 


39,100  


1     


4     


9


Goldman Sachs Reports

Second Quarter 2021 Earnings Results


The Goldman Sachs Group, Inc. and Subsidiaries

Consolidated Statements of Earnings (unaudited)

In millions, except per share amounts


     SIX MONTHS ENDED           % CHANGE FROM                                   


    JUNE 30,    

2021


    JUNE 30,    

2020


JUNE 30,

2020


REVENUES


Investment banking


    $           7,016        $          4,475           57 %     

Investment management


    3,701        3,403           9         

Commissions and fees


    1,906        1,895           1         

Market making


    9,167        9,469           (3)        

Other principal transactions


8,191 


539  


N.M.    


Total non-interest revenues


29,981 


19,781  


52     


Interest income


    5,993        7,784           (23)        

Interest expense


2,882 


5,527  


(48)    


Net interest income


3,111 


2,257  


38     


Total net revenues


33,092 


22,038  


50     


Provision for credit losses


(162)


2,527  


N.M.    


OPERATING EXPENSES


Compensation and benefits


    11,306        7,713           47         

Transaction based


    2,381        2,044           16         

Market development


    195        242           (19)        

Communications and technology


    746        666           12         

Depreciation and amortization


    1,018        936           9         

Occupancy


    488        471           4         

Professional fees


    704        658           7         

Other expenses


1,239 


4,142  


(70)    


Total operating expenses


18,077 


16,872  


7     


Pre-tax earnings

    15,177        2,639           475         


Provision for taxes

    2,855        1,053           171         

Net earnings


    12,322        1,586           677         

Preferred stock dividends


    264        266           (1)        


Net earnings applicable to common shareholders


    $         12,058        $          1,320           813         


EARNINGS PER COMMON SHARE2


Basic

    $           34.06        $            3.66           831 %     


Diluted

    $           33.64        $            3.66           819         


AVERAGE COMMON SHARES


Basic

    353.6        356.8           (1)        


Diluted


358.4 


356.8  


—     


10


Goldman Sachs Reports

Second Quarter 2021 Earnings Results


The Goldman Sachs Group, Inc. and Subsidiaries

Condensed Consolidated Balance Sheets (unaudited)4

$ in billions


     AS OF                     


JUNE 30,

2021


MARCH 31,

2021


ASSETS


Cash and cash equivalents

    $             240         $             191            


Collateralized agreements

    350         325            


Customer and other receivables

    162         165            


Trading assets

    376         374            


Investments

    91         88            


Loans

    131         121            


Other assets


    38         38            


Total assets


$           1,388  


$           1,302  


LIABILITIES AND SHAREHOLDERS’ EQUITY


Deposits

    $             306         $             286            


Collateralized financings

    217         193            


Customer and other payables

    239         224            


Trading liabilities

    199         201            


Unsecured short-term borrowings

    62         58            


Unsecured long-term borrowings

    239         219            


Other liabilities

    24         23            


Total liabilities


1,286  


1,204  


Shareholders’ equity


    102         98            


Total liabilities and shareholders’ equity


$           1,388  


$           1,302  


Capital Ratios and Supplementary Leverage Ratio (unaudited)2,4

$ in billions


     AS OF                      


JUNE 30,

2021


MARCH 31,

2021


Common equity tier 1 capital

    $             89.4         $             85.2            


STANDARDIZED CAPITAL RULES


Risk-weighted assets

    $             621         $             595            


Common equity tier 1 capital ratio

    14.4%       14.3%          


ADVANCED CAPITAL RULES


Risk-weighted assets

    $             667         $             630            


Common equity tier 1 capital ratio

    13.4%       13.5%          


SUPPLEMENTARY LEVERAGE RATIO


Supplementary leverage ratio


    5.5%  5      6.5%          


Average Daily VaR (unaudited)2,4

$ in millions


     THREE MONTHS ENDED                      


JUNE 30,

2021


MARCH 31,

2021


RISK CATEGORIES


Interest rates

    $               64         $               58            


Equity prices

    48         51            


Currency rates

    13         12            


Commodity prices

    22         22            


Diversification effect

    (57)        (54)           


Total


$             90  


$               89  


11


Goldman Sachs Reports

Second Quarter 2021 Earnings Results


The Goldman Sachs Group, Inc. and Subsidiaries

Assets Under Supervision (unaudited)2,4

$ in billions


     AS OF                                                                 
   
         JUNE 30,    
2021
        MARCH 31,    
2021
        JUNE 30,    
2020


SEGMENT


Asset Management


$        1,633 


$        1,567 


$        1,499 


Consumer & Wealth Management


672 


637 


558 


Total AUS


$        2,305 


$        2,204 


$        2,057 


ASSET CLASS


Alternative investments


$           211 


$            197 


$            179 


Equity


558 


516 


394 


Fixed income


914 


885 


817 


Total long-term AUS


1,683 


1,598 


1,390 


Liquidity products


622 


606 


667 


Total AUS


$        2,305 


$        2,204 


$        2,057 


     THREE MONTHS ENDED                    
   
     JUNE 30,
2021
    MARCH 31,
2021
    JUNE 30,
2020


ASSET MANAGEMENT


Beginning balance


$        1,567 


$        1,530 


$        1,309 


Net inflows / (outflows):


Alternative investments


(2)


Equity


(5)


Fixed income


12 


16 


Total long-term AUS net inflows / (outflows)


10 


22 


Liquidity products


16 


29 


121 


Total AUS net inflows / (outflows)


26 


51 


128 


Net market appreciation / (depreciation)


40 


(14)


62 


Ending balance


$        1,633 


$        1,567 


$        1,499 


CONSUMER & WEALTH MANAGEMENT


Beginning balance


$           637 


$            615 


$            509 


Net inflows / (outflows):


Alternative investments


– 


Equity


11 


(1)


Fixed income


(1)


– 


Total long-term AUS net inflows / (outflows)


12 


15 


(1)


Liquidity products


– 


(6)


12 


Total AUS net inflows / (outflows)


12 


11 


Net market appreciation / (depreciation)


23 


13 


38 


Ending balance


$            672 


$            637 


$            558 


FIRMWIDE


Beginning balance


$        2,204 


$        2,145 


$        1,818 


Net inflows / (outflows):


Alternative investments


(2)


Equity


14 


Fixed income


11 


18 


Total long-term AUS net inflows / (outflows)


22 


37 


Liquidity products


16 


23 


133 


Total AUS net inflows / (outflows)


38 


60 


139 


Net market appreciation / (depreciation)


63 


(1)


100 


Ending balance


$        2,305 


$        2,204 


$        2,057 


12


Goldman Sachs Reports

Second Quarter 2021 Earnings Results


Footnotes


  1.

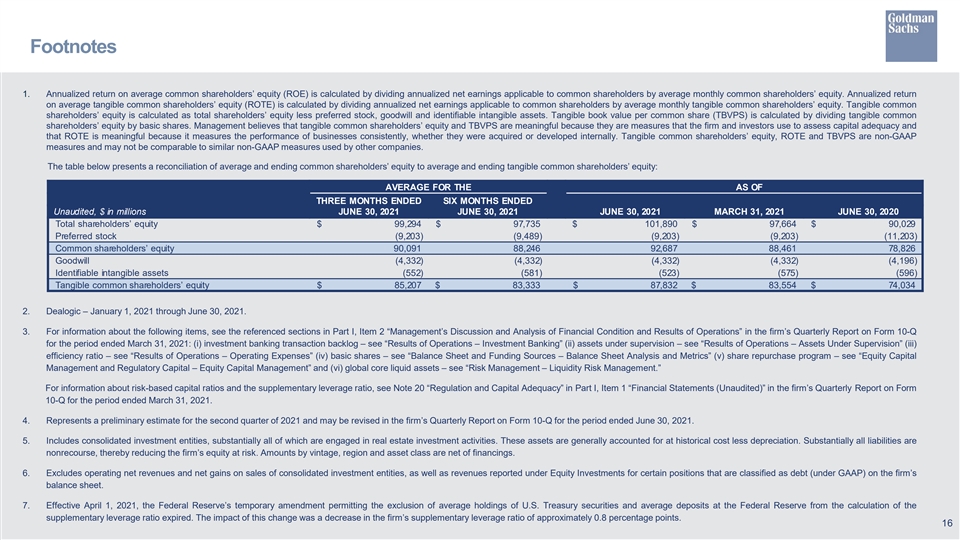
Annualized ROE is calculated by dividing annualized net earnings applicable to common shareholders by average monthly common shareholders’ equity. Annualized ROTE is calculated by dividing annualized net earnings applicable to common shareholders by average monthly tangible common shareholders’ equity (tangible common shareholders’ equity is calculated as total shareholders’ equity less preferred stock, goodwill and identifiable intangible assets). Management believes that ROTE is meaningful because it measures the performance of businesses consistently, whether they were acquired or developed internally, and that tangible common shareholders’ equity is meaningful because it is a measure that the firm and investors use to assess capital adequacy. ROTE and tangible common shareholders’ equity are non-GAAP measures and may not be comparable to similar non-GAAP measures used by other companies.


The table below presents a reconciliation of average common shareholders’ equity to average tangible common shareholders’ equity:


     AVERAGE FOR THE        
   
Unaudited, $ in millions  

 THREE MONTHS ENDED 

JUNE 30, 2021


   SIX MONTHS ENDED 
JUNE 30, 2021


Total shareholders’ equity


$            99,294 


$            97,735 


Preferred stock


(9,203)


(9,489)


Common shareholders’ equity


90,091 


88,246 


Goodwill


(4,332)


(4,332)


Identifiable intangible assets


(552)


(581)


Tangible common shareholders’ equity


$            85,207 


$            83,333 


  2.

For information about the following items, see the referenced sections in Part I, Item 2 “Management’s Discussion and Analysis of Financial Condition and Results of Operations” in the firm’s Quarterly Report on Form 10-Q for the period ended March 31, 2021: (i) investment banking transaction backlog – see “Results of Operations – Investment Banking” (ii) assets under supervision – see “Results of Operations – Assets Under Supervision” (iii) efficiency ratio – see “Results of Operations – Operating Expenses” (iv) share repurchase program – see “Equity Capital Management and Regulatory Capital – Equity Capital Management” (v) global core liquid assets – see “Risk Management – Liquidity Risk Management” (vi) basic shares – see “Balance Sheet and Funding Sources – Balance Sheet Analysis and Metrics” and (vii) VaR – see “Risk Management – Market Risk Management.”


For information about the following items, see the referenced sections in Part I, Item 1 “Financial Statements (Unaudited)” in the firm’s Quarterly Report on Form 10-Q for the period ended March 31, 2021: (i) risk-based capital ratios and the supplementary leverage ratio – see Note 20 “Regulation and Capital Adequacy” (ii) geographic net revenues – see Note 25 “Business Segments” and (iii) unvested share-based awards that have non-forfeitable rights to dividends or dividend equivalents in calculating EPS – see Note 21 “Earnings Per Common Share.”


  3.

Dealogic – January 1, 2021 through June 30, 2021.


  4.

Represents a preliminary estimate for the second quarter of 2021 and may be revised in the firm’s Quarterly Report on Form 10-Q for the period ended June 30, 2021.


  5.

Effective April 1, 2021, the Federal Reserve’s temporary amendment permitting the exclusion of average holdings of U.S. Treasury securities and average deposits at the Federal Reserve from the calculation of the supplementary leverage ratio expired. The impact of this change was a decrease in the firm’s supplementary leverage ratio of approximately 0.8 percentage points.


13      


Exhibit 99.2 Second Quarter 2021 Earnings Results Presentation July 13, 2021Exhibit 99.2 Second Quarter 2021 Earnings Results Presentation July 13, 2021


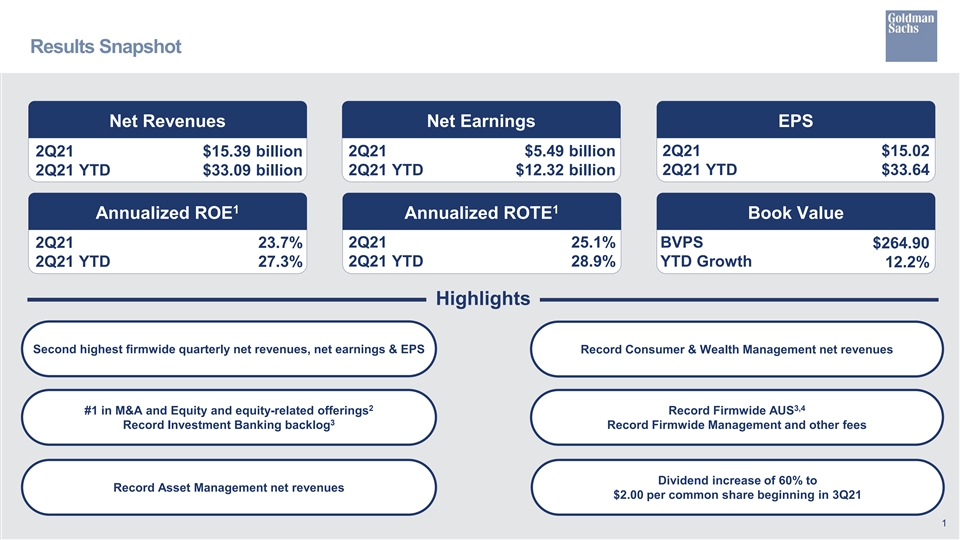
Results Snapshot Net Revenues Net Earnings EPS 2Q21 $5.49 billion 2Q21 $15.02 2Q21 $15.39 billion 2Q21 YTD $12.32 billion 2Q21 YTD $33.64 2Q21 YTD $33.09 billion 1 1 Annualized ROE Annualized ROTE Book Value 2Q21 23.7% 2Q21 25.1% BVPS $264.90 2Q21 YTD 27.3% 2Q21 YTD 28.9% YTD Growth 12.2% Highlights Second highest firmwide quarterly net revenues, net earnings & EPS Record Consumer & Wealth Management net revenues 2 3,4 #1 in M&A and Equity and equity-related offerings Record Firmwide AUS 3 Record Investment Banking backlog Record Firmwide Management and other fees Dividend increase of 60% to Record Asset Management net revenues $2.00 per common share beginning in 3Q21 1Results Snapshot Net Revenues Net Earnings EPS 2Q21 $5.49 billion 2Q21 $15.02 2Q21 $15.39 billion 2Q21 YTD $12.32 billion 2Q21 YTD $33.64 2Q21 YTD $33.09 billion 1 1 Annualized ROE Annualized ROTE Book Value 2Q21 23.7% 2Q21 25.1% BVPS $264.90 2Q21 YTD 27.3% 2Q21 YTD 28.9% YTD Growth 12.2% Highlights Second highest firmwide quarterly net revenues, net earnings & EPS Record Consumer & Wealth Management net revenues 2 3,4 #1 in M&A and Equity and equity-related offerings Record Firmwide AUS 3 Record Investment Banking backlog Record Firmwide Management and other fees Dividend increase of 60% to Record Asset Management net revenues $2.00 per common share beginning in 3Q21 1


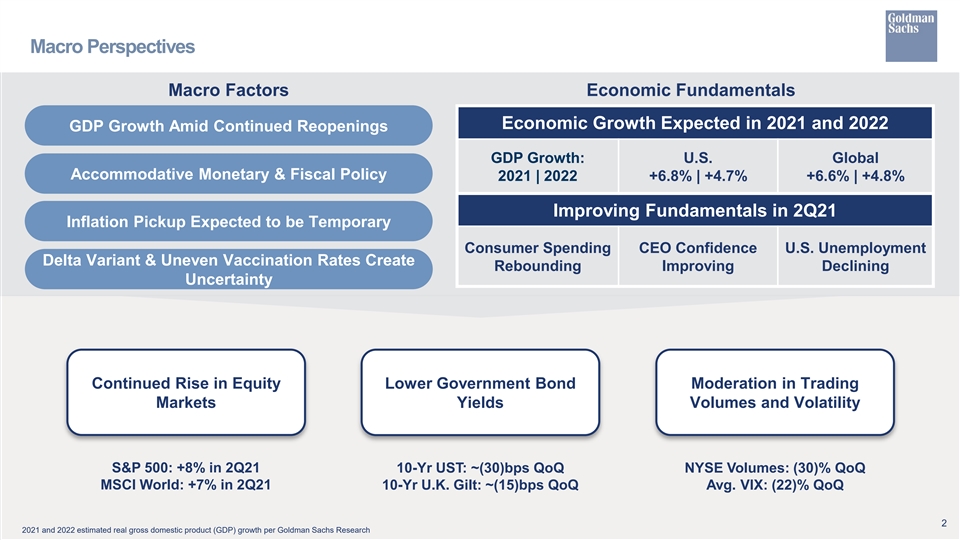
Macro Perspectives Macro Factors Economic Fundamentals Economic Growth Expected in 2021 and 2022 GDP Growth Amid Continued Reopenings GDP Growth: U.S. Global Accommodative Monetary & Fiscal Policy 2021 | 2022 +6.8% | +4.7% +6.6% | +4.8% Improving Fundamentals in 2Q21 Inflation Pickup Expected to be Temporary Consumer Spending CEO Confidence U.S. Unemployment Delta Variant & Uneven Vaccination Rates Create Rebounding Improving Declining Uncertainty Continued Rise in Equity Lower Government Bond Moderation in Trading Markets Yields Volumes and Volatility S&P 500: +8% in 2Q21 10-Yr UST: ~(30)bps QoQ NYSE Volumes: (30)% QoQ MSCI World: +7% in 2Q21 10-Yr U.K. Gilt: ~(15)bps QoQ Avg. VIX: (22)% QoQ 2 2021 and 2022 estimated real gross domestic product (GDP) growth per Goldman Sachs ResearchMacro Perspectives Macro Factors Economic Fundamentals Economic Growth Expected in 2021 and 2022 GDP Growth Amid Continued Reopenings GDP Growth: U.S. Global Accommodative Monetary & Fiscal Policy 2021 | 2022 +6.8% | +4.7% +6.6% | +4.8% Improving Fundamentals in 2Q21 Inflation Pickup Expected to be Temporary Consumer Spending CEO Confidence U.S. Unemployment Delta Variant & Uneven Vaccination Rates Create Rebounding Improving Declining Uncertainty Continued Rise in Equity Lower Government Bond Moderation in Trading Markets Yields Volumes and Volatility S&P 500: +8% in 2Q21 10-Yr UST: ~(30)bps QoQ NYSE Volumes: (30)% QoQ MSCI World: +7% in 2Q21 10-Yr U.K. Gilt: ~(15)bps QoQ Avg. VIX: (22)% QoQ 2 2021 and 2022 estimated real gross domestic product (GDP) growth per Goldman Sachs Research


Financial Overview Financial Results Financial Overview Highlights vs. n 2Q21 results included EPS of $15.02 and ROE of 23.7% $ in millions, vs. vs. 2Q21 2Q20 except per share amounts 2Q21 1Q21 2Q20 YTD YTD — 2Q21 net revenues were higher YoY, reflecting significantly higher net revenues in Asset Management, Investment Banking and Consumer & Wealth Management, partially offset by Investment Banking $ 3,609 -4% 36% $ 7,380 52% significantly lower net revenues in Global Markets — 2Q21 provision for credit losses was a net benefit of $92 million, including a reserve reduction Global Markets 4,900 -35% -32% 12,481 1% driven by improvements in the broader economic backdrop (across all segments), partially offset by provisions related to portfolio growth (primarily in credit card loans) Asset Management 5,132 11% 144% 9,746 386% — 2Q21 operating expenses were lower YoY, due to significantly lower net provisions for litigation and regulatory proceedings (primarily in Investment Banking and Global Markets), Consumer & Wealth Management 1,747 1% 28% 3,485 22% partially offset by higher compensation and benefits expenses n Strong first half performance as 2Q21 YTD results included EPS of $33.64 and ROE of 27.3% Net revenues $ 15,388 -13% 16% $ 33,092 50% Provision for credit losses (92) N.M. N.M. (162) N.M. Net Revenues by Segment ($ in millions) Operating expenses 8,640 -8% -17% 18,077 7% $17,704 $1,738 $15,388 Pre-tax earnings 6,840 -18% 430% 15,177 475% $13,295 $1,747 $4,614 Net earnings 5,486 -20% N.M. 12,322 677% $1,361 $5,132 $2,101 Net earnings to common $ 5,347 -20% N.M. $ 12,058 813% $7,581 Diluted EPS $ 15.02 -19% N.M. $ 33.64 819% $7,176 $4,900 1 ROE 23.7% -7.3pp 22.7pp 27.3% 24.0pp $3,771 $3,609 $2,657 1 25.1% -7.8pp 24.1pp 28.9% 25.4pp ROTE 2Q20 1Q21 2Q21 3 Efficiency Ratio 56.1% 2.8pp -22.2pp 54.6% -22.0pp Investment Banking Global Markets Asset Management Consumer & Wealth Management 3Financial Overview Financial Results Financial Overview Highlights vs. n 2Q21 results included EPS of $15.02 and ROE of 23.7% $ in millions, vs. vs. 2Q21 2Q20 except per share amounts 2Q21 1Q21 2Q20 YTD YTD — 2Q21 net revenues were higher YoY, reflecting significantly higher net revenues in Asset Management, Investment Banking and Consumer & Wealth Management, partially offset by Investment Banking $ 3,609 -4% 36% $ 7,380 52% significantly lower net revenues in Global Markets — 2Q21 provision for credit losses was a net benefit of $92 million, including a reserve reduction Global Markets 4,900 -35% -32% 12,481 1% driven by improvements in the broader economic backdrop (across all segments), partially offset by provisions related to portfolio growth (primarily in credit card loans) Asset Management 5,132 11% 144% 9,746 386% — 2Q21 operating expenses were lower YoY, due to significantly lower net provisions for litigation and regulatory proceedings (primarily in Investment Banking and Global Markets), Consumer & Wealth Management 1,747 1% 28% 3,485 22% partially offset by higher compensation and benefits expenses n Strong first half performance as 2Q21 YTD results included EPS of $33.64 and ROE of 27.3% Net revenues $ 15,388 -13% 16% $ 33,092 50% Provision for credit losses (92) N.M. N.M. (162) N.M. Net Revenues by Segment ($ in millions) Operating expenses 8,640 -8% -17% 18,077 7% $17,704 $1,738 $15,388 Pre-tax earnings 6,840 -18% 430% 15,177 475% $13,295 $1,747 $4,614 Net earnings 5,486 -20% N.M. 12,322 677% $1,361 $5,132 $2,101 Net earnings to common $ 5,347 -20% N.M. $ 12,058 813% $7,581 Diluted EPS $ 15.02 -19% N.M. $ 33.64 819% $7,176 $4,900 1 ROE 23.7% -7.3pp 22.7pp 27.3% 24.0pp $3,771 $3,609 $2,657 1 25.1% -7.8pp 24.1pp 28.9% 25.4pp ROTE 2Q20 1Q21 2Q21 3 Efficiency Ratio 56.1% 2.8pp -22.2pp 54.6% -22.0pp Investment Banking Global Markets Asset Management Consumer & Wealth Management 3


Investment Banking Financial Results Investment Banking Highlights vs. n 2Q21 net revenues were significantly higher YoY vs. vs. 2Q21 2Q20 $ in millions 2Q21 1Q21 2Q20 YTD YTD — Financial advisory net revenues reflected an increase in completed mergers and acquisitions transactions Financial advisory $ 1,257 13% 83% $ 2,374 62% — Underwriting net revenues reflected strong Equity Underwriting performance, primarily from initial public offerings activity, partially offset by significantly lower secondary offerings Equity underwriting 1,243 -21% 18% 2,812 96% activity. Debt Underwriting net revenues were slightly lower, reflecting significantly lower investment-grade volumes, partially offset by elevated leveraged finance volumes Debt underwriting 950 8% -4% 1,830 16% — Corporate lending net revenues primarily reflected higher net interest income 3 n Overall backlog increased significantly vs. year-end and was a record at the end of 2Q21, and Underwriting 2,193 -10% 7% 4,642 54% increased QoQ across advisory, equity underwriting and debt underwriting Corporate lending 159 -22% N.M. 364 -1% 3,609 -4% 36% 7,380 52% Net revenues Investment Banking Net Revenues ($ in millions) (107) N.M. N.M. (270) N.M. Provision for credit losses $3,771 $3,609 $205 1,955 5% -28% 3,818 -1% Operating expenses $159 $880 $2,657 $950 Pre-tax earnings $ 1,761 -15% N.M. $ 3,832 N.M. $990 Net earnings $ 1,413 -17% N.M. $ 3,111 N.M. $1,569 $1,243 $1,057 Net earnings to common $ 1,393 -17% N.M. $ 3,072 N.M. $1,257 $1,117 Average common equity $ 9,792 -7% -12% $ 10,078 -10% $686 $(76) 2Q20 1Q21 2Q21 Return on average common equity 56.9% (6.7)pp 80.8pp 61.0% 66.7pp 4 Financial advisory Equity underwriting Debt underwriting Corporate lendingInvestment Banking Financial Results Investment Banking Highlights vs. n 2Q21 net revenues were significantly higher YoY vs. vs. 2Q21 2Q20 $ in millions 2Q21 1Q21 2Q20 YTD YTD — Financial advisory net revenues reflected an increase in completed mergers and acquisitions transactions Financial advisory $ 1,257 13% 83% $ 2,374 62% — Underwriting net revenues reflected strong Equity Underwriting performance, primarily from initial public offerings activity, partially offset by significantly lower secondary offerings Equity underwriting 1,243 -21% 18% 2,812 96% activity. Debt Underwriting net revenues were slightly lower, reflecting significantly lower investment-grade volumes, partially offset by elevated leveraged finance volumes Debt underwriting 950 8% -4% 1,830 16% — Corporate lending net revenues primarily reflected higher net interest income 3 n Overall backlog increased significantly vs. year-end and was a record at the end of 2Q21, and Underwriting 2,193 -10% 7% 4,642 54% increased QoQ across advisory, equity underwriting and debt underwriting Corporate lending 159 -22% N.M. 364 -1% 3,609 -4% 36% 7,380 52% Net revenues Investment Banking Net Revenues ($ in millions) (107) N.M. N.M. (270) N.M. Provision for credit losses $3,771 $3,609 $205 1,955 5% -28% 3,818 -1% Operating expenses $159 $880 $2,657 $950 Pre-tax earnings $ 1,761 -15% N.M. $ 3,832 N.M. $990 Net earnings $ 1,413 -17% N.M. $ 3,111 N.M. $1,569 $1,243 $1,057 Net earnings to common $ 1,393 -17% N.M. $ 3,072 N.M. $1,257 $1,117 Average common equity $ 9,792 -7% -12% $ 10,078 -10% $686 $(76) 2Q20 1Q21 2Q21 Return on average common equity 56.9% (6.7)pp 80.8pp 61.0% 66.7pp 4 Financial advisory Equity underwriting Debt underwriting Corporate lending


Global Markets Financial Results Global Markets Highlights vs. vs. vs. 2Q21 2Q20n 2Q21 net revenues were significantly lower YoY compared with a very strong 2Q20, $ in millions corresponding with lower activity in FICC. The prior year period reflected heightened volatility 2Q21 1Q21 2Q20 YTD YTD and significant market dislocations FICC $ 2,320 -40% -45% $ 6,213 -14% n On a sequential basis, the 2Q21 operating environment was characterized by less favorable market-making conditions and more modest yet solid client activity levels 2,580 -30% -12% 6,268 22% Equities — During the quarter, volatility and interest rates were lower and equity prices were generally Net revenues 4,900 -35% -32% 12,481 1% higher Provision for credit losses 14 N.M. -92% (6) N.M. 3,373 -19% -35% 7,558 -6% Operating expenses Pre-tax earnings $ 1,513 -56% -17% $ 4,929 21% Global Markets Net Revenues ($ in millions) Net earnings $ 1,201 -57% 187% $ 4,002 64% $7,581 $7,176 $ 1,121 -59% 268% $ 3,851 70% Net earnings to common $2,941 $3,688 Average common equity $ 44,430 8% 4% $ 42,741 4% $4,900 Return on average common equity 10.1% (16.5)pp 7.2pp 18.0% 6.9pp $2,580 $4,235 $3,893 $2,320 2Q20 1Q21 2Q21 5 FICC EquitiesGlobal Markets Financial Results Global Markets Highlights vs. vs. vs. 2Q21 2Q20n 2Q21 net revenues were significantly lower YoY compared with a very strong 2Q20, $ in millions corresponding with lower activity in FICC. The prior year period reflected heightened volatility 2Q21 1Q21 2Q20 YTD YTD and significant market dislocations FICC $ 2,320 -40% -45% $ 6,213 -14% n On a sequential basis, the 2Q21 operating environment was characterized by less favorable market-making conditions and more modest yet solid client activity levels 2,580 -30% -12% 6,268 22% Equities — During the quarter, volatility and interest rates were lower and equity prices were generally Net revenues 4,900 -35% -32% 12,481 1% higher Provision for credit losses 14 N.M. -92% (6) N.M. 3,373 -19% -35% 7,558 -6% Operating expenses Pre-tax earnings $ 1,513 -56% -17% $ 4,929 21% Global Markets Net Revenues ($ in millions) Net earnings $ 1,201 -57% 187% $ 4,002 64% $7,581 $7,176 $ 1,121 -59% 268% $ 3,851 70% Net earnings to common $2,941 $3,688 Average common equity $ 44,430 8% 4% $ 42,741 4% $4,900 Return on average common equity 10.1% (16.5)pp 7.2pp 18.0% 6.9pp $2,580 $4,235 $3,893 $2,320 2Q20 1Q21 2Q21 5 FICC Equities


Global Markets – FICC & Equities FICC Net Revenues Equities Net Revenues vs. vs. vs. vs. 2Q21 2Q20 vs. vs. 2Q21 2Q20 $ in millions $ in millions 2Q21 1Q21 2Q20 YTD YTD 2Q21 1Q21 2Q20 YTD YTD $ 1,765 -32% -20% $ 4,351 17% FICC intermediation $ 1,897 -45% -50% $ 5,348 -15% Equities intermediation Equities financing 815 -26% 10% 1,917 36% FICC financing 423 -4% -6% 865 -2% $ 2,320 -40% -45% $ 6,213 -14% Equities $ 2,580 -30% -12% $ 6,268 22% FICC FICC Highlights Equities Highlights n 2Q21 net revenues were significantly lower YoY n 2Q21 net revenues were lower YoY — FICC intermediation net revenues reflected significantly lower net revenues in interest rate — Equities intermediation net revenues reflected significantly lower net revenues in cash products, credit products and commodities, and lower net revenues in mortgages and products and lower net revenues in derivatives currencies — Equities financing net revenues reflected higher average client balances — FICC financing net revenues were lower, reflecting lower net revenues from repurchase n Record average Prime balances in 2Q21 agreements, partially offset by higher net revenues from mortgage lending 6Global Markets – FICC & Equities FICC Net Revenues Equities Net Revenues vs. vs. vs. vs. 2Q21 2Q20 vs. vs. 2Q21 2Q20 $ in millions $ in millions 2Q21 1Q21 2Q20 YTD YTD 2Q21 1Q21 2Q20 YTD YTD $ 1,765 -32% -20% $ 4,351 17% FICC intermediation $ 1,897 -45% -50% $ 5,348 -15% Equities intermediation Equities financing 815 -26% 10% 1,917 36% FICC financing 423 -4% -6% 865 -2% $ 2,320 -40% -45% $ 6,213 -14% Equities $ 2,580 -30% -12% $ 6,268 22% FICC FICC Highlights Equities Highlights n 2Q21 net revenues were significantly lower YoY n 2Q21 net revenues were lower YoY — FICC intermediation net revenues reflected significantly lower net revenues in interest rate — Equities intermediation net revenues reflected significantly lower net revenues in cash products, credit products and commodities, and lower net revenues in mortgages and products and lower net revenues in derivatives currencies — Equities financing net revenues reflected higher average client balances — FICC financing net revenues were lower, reflecting lower net revenues from repurchase n Record average Prime balances in 2Q21 agreements, partially offset by higher net revenues from mortgage lending 6


Asset Management Financial Results Asset Management Highlights vs. n 2Q21 net revenues more than doubled YoY vs. vs. 2Q21 2Q20 $ in millions 2Q21 1Q21 2Q20 YTD YTD — Management and other fees included higher average AUS and higher other fees, partially offset by fee waivers on money market funds Management and other fees $ 727 5% 6% $ 1,420 7% — Equity investments produced record net revenues, with the YoY increase primarily driven by significantly higher net gains from investments in private equities, driven by company- Incentive fees 78 86% 129% 120 -36% specific events, including capital raises and sales, and improved corporate performance versus a challenging 2Q20 o Private: 2Q21 ~$2,815 million, compared to 2Q20 ~$290 million Equity investments 3,717 19% 302% 6,837 658% o Public: 2Q21 ~$900 million, compared to 2Q20 ~$635 million — Lending and debt investments net revenues primarily reflected higher net interest income Lending and debt investments 610 -20% 33% 1,369 N.M. Net revenues 5,132 11% 144% 9,746 386% Asset Management Net Revenues ($ in millions) Provision for credit losses (65) N.M. N.M. (12) N.M. $5,132 $4,614 $610 1,943 3% 46% 3,833 52% Operating expenses $759 $ 3,254 22% 553% $ 5,925 N.M. Pre-tax earnings $3,717 $2,101 $3,120 $ 2,620 20% 269% $ 4,810 N.M. Net earnings $459 $924 $ 2,592 20% 279% $ 4,757 N.M. Net earnings to common $78 $34 $42 $727 $684 $693 $ 25,410 3% 32% $ 25,092 23% Average common equity 2Q20 1Q21 2Q21 40.8% 5.6pp 26.6pp 37.9% 43.5pp Return on average common equity Management and other fees Incentive fees Equity investments Lending and debt investments 7Asset Management Financial Results Asset Management Highlights vs. n 2Q21 net revenues more than doubled YoY vs. vs. 2Q21 2Q20 $ in millions 2Q21 1Q21 2Q20 YTD YTD — Management and other fees included higher average AUS and higher other fees, partially offset by fee waivers on money market funds Management and other fees $ 727 5% 6% $ 1,420 7% — Equity investments produced record net revenues, with the YoY increase primarily driven by significantly higher net gains from investments in private equities, driven by company- Incentive fees 78 86% 129% 120 -36% specific events, including capital raises and sales, and improved corporate performance versus a challenging 2Q20 o Private: 2Q21 ~$2,815 million, compared to 2Q20 ~$290 million Equity investments 3,717 19% 302% 6,837 658% o Public: 2Q21 ~$900 million, compared to 2Q20 ~$635 million — Lending and debt investments net revenues primarily reflected higher net interest income Lending and debt investments 610 -20% 33% 1,369 N.M. Net revenues 5,132 11% 144% 9,746 386% Asset Management Net Revenues ($ in millions) Provision for credit losses (65) N.M. N.M. (12) N.M. $5,132 $4,614 $610 1,943 3% 46% 3,833 52% Operating expenses $759 $ 3,254 22% 553% $ 5,925 N.M. Pre-tax earnings $3,717 $2,101 $3,120 $ 2,620 20% 269% $ 4,810 N.M. Net earnings $459 $924 $ 2,592 20% 279% $ 4,757 N.M. Net earnings to common $78 $34 $42 $727 $684 $693 $ 25,410 3% 32% $ 25,092 23% Average common equity 2Q20 1Q21 2Q21 40.8% 5.6pp 26.6pp 37.9% 43.5pp Return on average common equity Management and other fees Incentive fees Equity investments Lending and debt investments 7


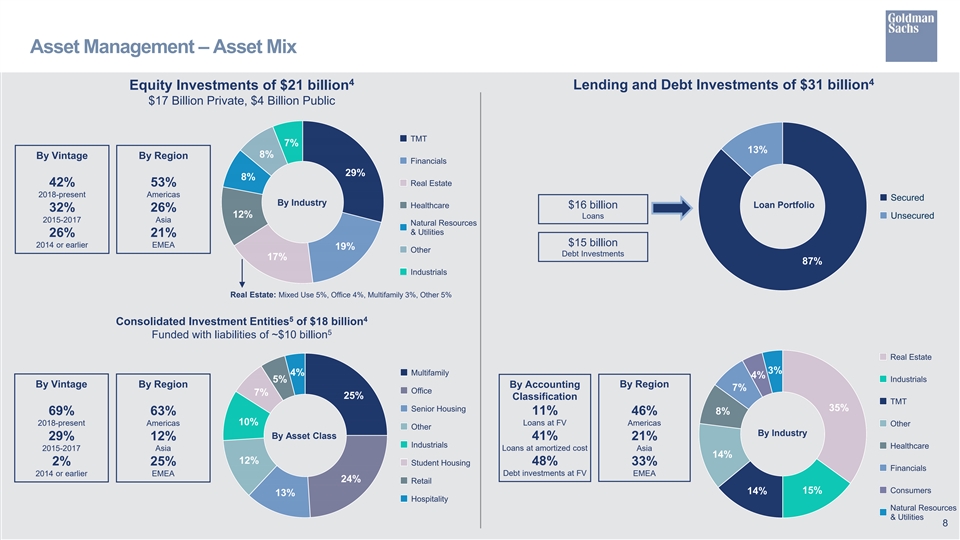
Asset Management – Asset Mix 4 4 Equity Investments of $21 billion Lending and Debt Investments of $31 billion $17 Billion Private, $4 Billion Public 7% 13% 8% By Vintage By Region 29% 8% 42% 53% 2018-present Americas By Industry Loan Portfolio $16 billion 32% 26% 12% Loans 2015-2017 Asia 26% 21% $15 billion 2014 or earlier EMEA 19% Debt Investments 17% 87% Real Estate: Mixed Use 5%, Office 4%, Multifamily 3%, Other 5% 5 4 Consolidated Investment Entities of $18 billion 5 Funded with liabilities of ~$10 billion 3% 4% 4% 5% By Vintage By Region By Accounting By Region 7% 7% 25% Classification 35% 69% 63% 11% 46% 8% 10% 2018-present Americas Loans at FV Americas By Industry By Asset Class 29% 12% 41% 21% 2015-2017 Asia Loans at amortized cost Asia 14% 12% 48% 33% 2% 25% 2014 or earlier EMEA Debt investments at FV EMEA 24% 14% 15% 13% 8Asset Management – Asset Mix 4 4 Equity Investments of $21 billion Lending and Debt Investments of $31 billion $17 Billion Private, $4 Billion Public 7% 13% 8% By Vintage By Region 29% 8% 42% 53% 2018-present Americas By Industry Loan Portfolio $16 billion 32% 26% 12% Loans 2015-2017 Asia 26% 21% $15 billion 2014 or earlier EMEA 19% Debt Investments 17% 87% Real Estate: Mixed Use 5%, Office 4%, Multifamily 3%, Other 5% 5 4 Consolidated Investment Entities of $18 billion 5 Funded with liabilities of ~$10 billion 3% 4% 4% 5% By Vintage By Region By Accounting By Region 7% 7% 25% Classification 35% 69% 63% 11% 46% 8% 10% 2018-present Americas Loans at FV Americas By Industry By Asset Class 29% 12% 41% 21% 2015-2017 Asia Loans at amortized cost Asia 14% 12% 48% 33% 2% 25% 2014 or earlier EMEA Debt investments at FV EMEA 24% 14% 15% 13% 8


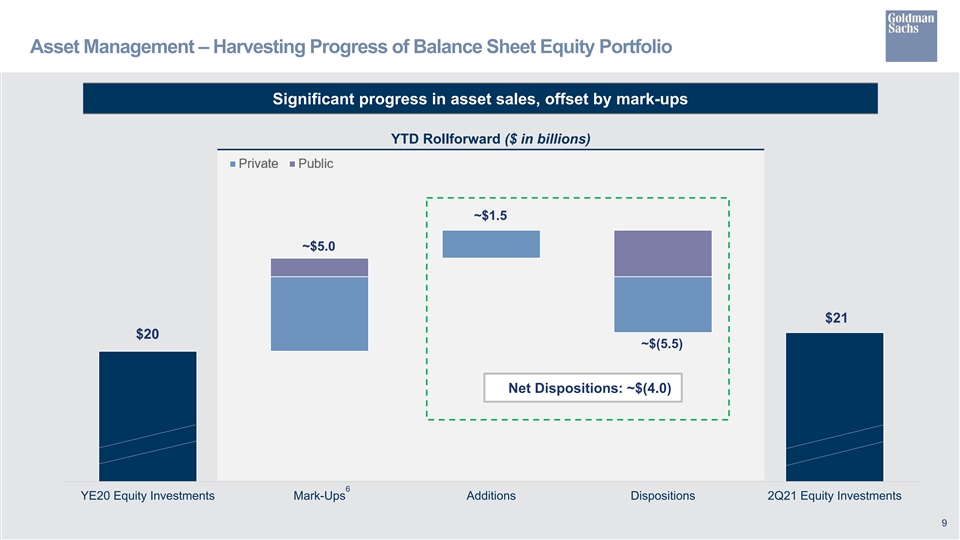
Asset Management – Harvesting Progress of Balance Sheet Equity Portfolio Significant progress in asset sales, offset by mark-ups YTD Rollforward ($ in billions) ~ ~$1. $1.5 5 ~ ~$5. $5.0 0 $21 $20 $20 ~$(5.5) Net Dispositions: ~$(4.0) 6 YE20 Equity Investments Mark-Ups Additions Dispositions 2Q21 Equity Investments 9Asset Management – Harvesting Progress of Balance Sheet Equity Portfolio Significant progress in asset sales, offset by mark-ups YTD Rollforward ($ in billions) ~ ~$1. $1.5 5 ~ ~$5. $5.0 0 $21 $20 $20 ~$(5.5) Net Dispositions: ~$(4.0) 6 YE20 Equity Investments Mark-Ups Additions Dispositions 2Q21 Equity Investments 9


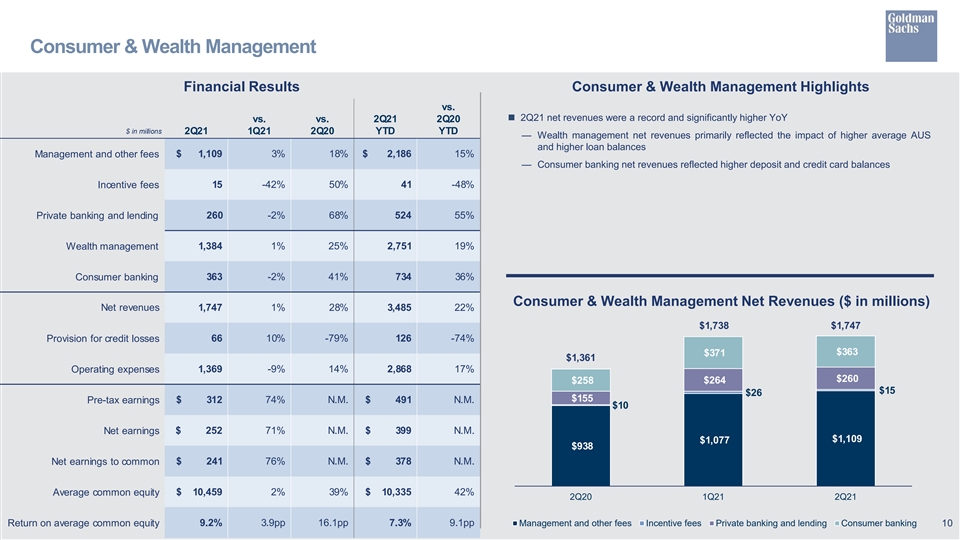
Consumer & Wealth Management Financial Results Consumer & Wealth Management Highlights vs. n 2Q21 net revenues were a record and significantly higher YoY vs. vs. 2Q21 2Q20 $ in millions 2Q21 1Q21 2Q20 YTD YTD — Wealth management net revenues primarily reflected the impact of higher average AUS and higher loan balances $ 1,109 3% 18% $ 2,186 15% Management and other fees — Consumer banking net revenues reflected higher deposit and credit card balances Incentive fees 15 -42% 50% 41 -48% Private banking and lending 260 -2% 68% 524 55% 1,384 1% 25% 2,751 19% Wealth management Consumer banking 363 -2% 41% 734 36% Consumer & Wealth Management Net Revenues ($ in millions) Net revenues 1,747 1% 28% 3,485 22% $1,738 $1,747 Provision for credit losses 66 10% -79% 126 -74% $363 $371 $1,361 1,369 -9% 14% 2,868 17% Operating expenses $260 $258 $264 $15 $26 $155 Pre-tax earnings $ 312 74% N.M. $ 491 N.M. $10 Net earnings $ 252 71% N.M. $ 399 N.M. $1,109 $1,077 $938 Net earnings to common $ 241 76% N.M. $ 378 N.M. $ 10,459 2% 39% $ 10,335 42% Average common equity 2Q20 1Q21 2Q21 Return on average common equity 9.2% 3.9pp 16.1pp 7.3% 9.1pp Management and other fees Incentive fees Private banking and lending Consumer banking 10Consumer & Wealth Management Financial Results Consumer & Wealth Management Highlights vs. n 2Q21 net revenues were a record and significantly higher YoY vs. vs. 2Q21 2Q20 $ in millions 2Q21 1Q21 2Q20 YTD YTD — Wealth management net revenues primarily reflected the impact of higher average AUS and higher loan balances $ 1,109 3% 18% $ 2,186 15% Management and other fees — Consumer banking net revenues reflected higher deposit and credit card balances Incentive fees 15 -42% 50% 41 -48% Private banking and lending 260 -2% 68% 524 55% 1,384 1% 25% 2,751 19% Wealth management Consumer banking 363 -2% 41% 734 36% Consumer & Wealth Management Net Revenues ($ in millions) Net revenues 1,747 1% 28% 3,485 22% $1,738 $1,747 Provision for credit losses 66 10% -79% 126 -74% $363 $371 $1,361 1,369 -9% 14% 2,868 17% Operating expenses $260 $258 $264 $15 $26 $155 Pre-tax earnings $ 312 74% N.M. $ 491 N.M. $10 Net earnings $ 252 71% N.M. $ 399 N.M. $1,109 $1,077 $938 Net earnings to common $ 241 76% N.M. $ 378 N.M. $ 10,459 2% 39% $ 10,335 42% Average common equity 2Q20 1Q21 2Q21 Return on average common equity 9.2% 3.9pp 16.1pp 7.3% 9.1pp Management and other fees Incentive fees Private banking and lending Consumer banking 10


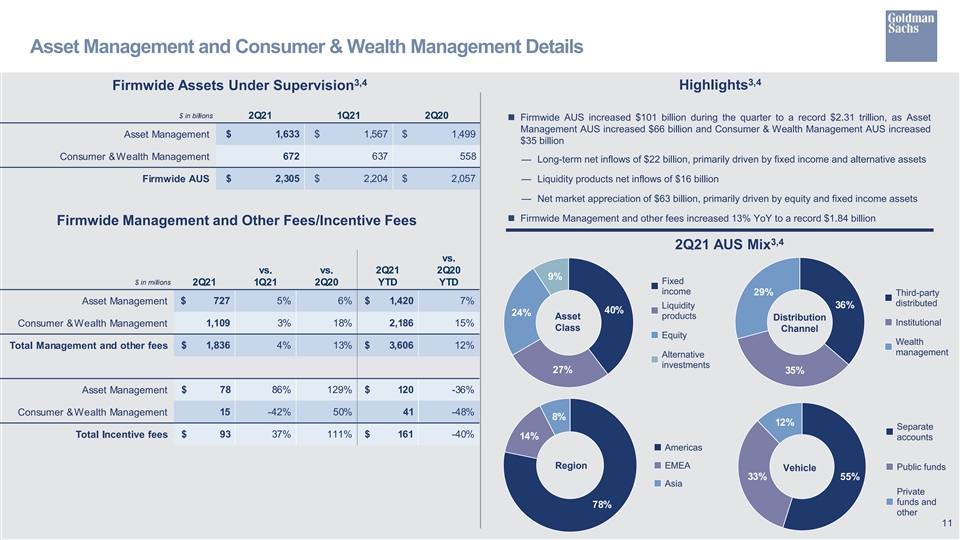
Asset Management and Consumer & Wealth Management Details 3,4 3,4 Firmwide Assets Under Supervision Highlights $ in billions 2Q21 1Q21 2Q20 n Firmwide AUS increased $101 billion during the quarter to a record $2.31 trillion, as Asset Management AUS increased $66 billion and Consumer & Wealth Management AUS increased Asset Management $ 1,633 $ 1,567 $ 1,499 $35 billion Consumer & Wealth Management 672 637 558 — Long-term net inflows of $22 billion, primarily driven by fixed income and alternative assets Firmwide AUS $ 2,305 $ 2,204 $ 2,057 — Liquidity products net inflows of $16 billion — Net market appreciation of $63 billion, primarily driven by equity and fixed income assets n Firmwide Management and other fees increased 13% YoY to a record $1.84 billion Firmwide Management and Other Fees/Incentive Fees 3,4 2Q21 AUS Mix vs. vs. vs. 2Q21 2Q20 9% $ in millions 2Q21 1Q21 2Q20 YTD YTD 29% $ 727 5% 6% $ 1,420 7% Asset Management 36% 40% 24% Asset Distribution 1,109 3% 18% 2,186 15% Consumer & Wealth Management Class Channel Total Management and other fees $ 1,836 4% 13% $ 3,606 12% 27% 35% Asset Management $ 78 86% 129% $ 120 -36% 15 -42% 50% 41 -48% Consumer & Wealth Management 8% 12% Total Incentive fees $ 93 37% 111% $ 161 -40% 14% Region Vehicle 33% 55% 78% 11Asset Management and Consumer & Wealth Management Details 3,4 3,4 Firmwide Assets Under Supervision Highlights $ in billions 2Q21 1Q21 2Q20 n Firmwide AUS increased $101 billion during the quarter to a record $2.31 trillion, as Asset Management AUS increased $66 billion and Consumer & Wealth Management AUS increased Asset Management $ 1,633 $ 1,567 $ 1,499 $35 billion Consumer & Wealth Management 672 637 558 — Long-term net inflows of $22 billion, primarily driven by fixed income and alternative assets Firmwide AUS $ 2,305 $ 2,204 $ 2,057 — Liquidity products net inflows of $16 billion — Net market appreciation of $63 billion, primarily driven by equity and fixed income assets n Firmwide Management and other fees increased 13% YoY to a record $1.84 billion Firmwide Management and Other Fees/Incentive Fees 3,4 2Q21 AUS Mix vs. vs. vs. 2Q21 2Q20 9% $ in millions 2Q21 1Q21 2Q20 YTD YTD 29% $ 727 5% 6% $ 1,420 7% Asset Management 36% 40% 24% Asset Distribution 1,109 3% 18% 2,186 15% Consumer & Wealth Management Class Channel Total Management and other fees $ 1,836 4% 13% $ 3,606 12% 27% 35% Asset Management $ 78 86% 129% $ 120 -36% 15 -42% 50% 41 -48% Consumer & Wealth Management 8% 12% Total Incentive fees $ 93 37% 111% $ 161 -40% 14% Region Vehicle 33% 55% 78% 11


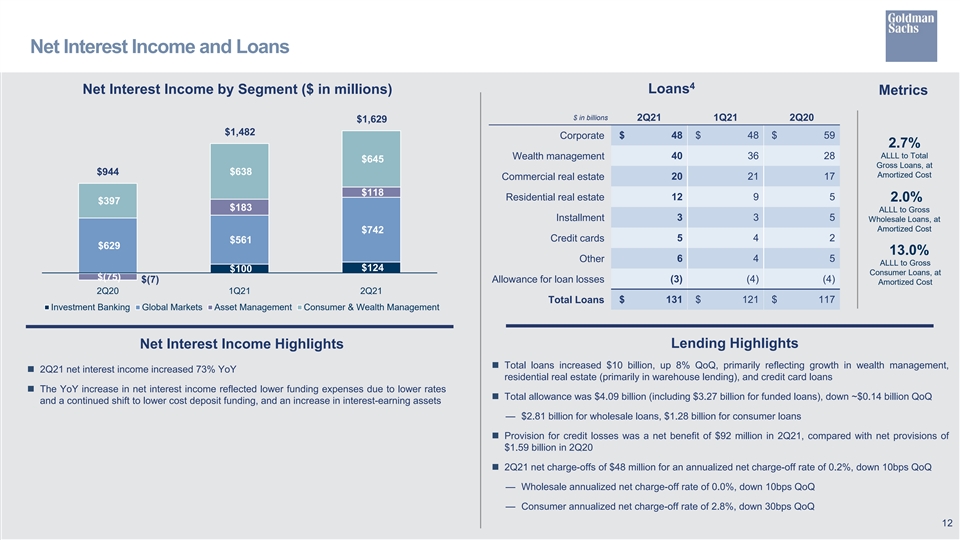
Net Interest Income and Loans 4 Loans Net Interest Income by Segment ($ in millions) Metrics $ in billions 2Q21 1Q21 2Q20 $1,629 $1,482 Corporate $ 48 $ 48 $ 59 2.7% 40 36 28 ALLL to Total Wealth management $645 Gross Loans, at $944 $638 Amortized Cost Commercial real estate 20 21 17 $118 12 9 5 Residential real estate 2.0% $397 $183 ALLL to Gross Installment 3 3 5 Wholesale Loans, at Amortized Cost $742 5 4 2 Credit cards $561 $629 13.0% Other 6 4 5 ALLL to Gross $124 $100 Consumer Loans, at $(75) (3) (4) (4) $(7) Allowance for loan losses Amortized Cost 2Q20 1Q21 2Q21 Total Loans $ 131 $ 121 $ 117 Investment Banking Global Markets Asset Management Consumer & Wealth Management Lending Highlights Net Interest Income Highlights n Total loans increased $10 billion, up 8% QoQ, primarily reflecting growth in wealth management, n 2Q21 net interest income increased 73% YoY residential real estate (primarily in warehouse lending), and credit card loans n The YoY increase in net interest income reflected lower funding expenses due to lower rates n Total allowance was $4.09 billion (including $3.27 billion for funded loans), down ~$0.14 billion QoQ and a continued shift to lower cost deposit funding, and an increase in interest-earning assets — $2.81 billion for wholesale loans, $1.28 billion for consumer loans n Provision for credit losses was a net benefit of $92 million in 2Q21, compared with net provisions of $1.59 billion in 2Q20 n 2Q21 net charge-offs of $48 million for an annualized net charge-off rate of 0.2%, down 10bps QoQ — Wholesale annualized net charge-off rate of 0.0%, down 10bps QoQ — Consumer annualized net charge-off rate of 2.8%, down 30bps QoQ 12Net Interest Income and Loans 4 Loans Net Interest Income by Segment ($ in millions) Metrics $ in billions 2Q21 1Q21 2Q20 $1,629 $1,482 Corporate $ 48 $ 48 $ 59 2.7% 40 36 28 ALLL to Total Wealth management $645 Gross Loans, at $944 $638 Amortized Cost Commercial real estate 20 21 17 $118 12 9 5 Residential real estate 2.0% $397 $183 ALLL to Gross Installment 3 3 5 Wholesale Loans, at Amortized Cost $742 5 4 2 Credit cards $561 $629 13.0% Other 6 4 5 ALLL to Gross $124 $100 Consumer Loans, at $(75) (3) (4) (4) $(7) Allowance for loan losses Amortized Cost 2Q20 1Q21 2Q21 Total Loans $ 131 $ 121 $ 117 Investment Banking Global Markets Asset Management Consumer & Wealth Management Lending Highlights Net Interest Income Highlights n Total loans increased $10 billion, up 8% QoQ, primarily reflecting growth in wealth management, n 2Q21 net interest income increased 73% YoY residential real estate (primarily in warehouse lending), and credit card loans n The YoY increase in net interest income reflected lower funding expenses due to lower rates n Total allowance was $4.09 billion (including $3.27 billion for funded loans), down ~$0.14 billion QoQ and a continued shift to lower cost deposit funding, and an increase in interest-earning assets — $2.81 billion for wholesale loans, $1.28 billion for consumer loans n Provision for credit losses was a net benefit of $92 million in 2Q21, compared with net provisions of $1.59 billion in 2Q20 n 2Q21 net charge-offs of $48 million for an annualized net charge-off rate of 0.2%, down 10bps QoQ — Wholesale annualized net charge-off rate of 0.0%, down 10bps QoQ — Consumer annualized net charge-off rate of 2.8%, down 30bps QoQ 12


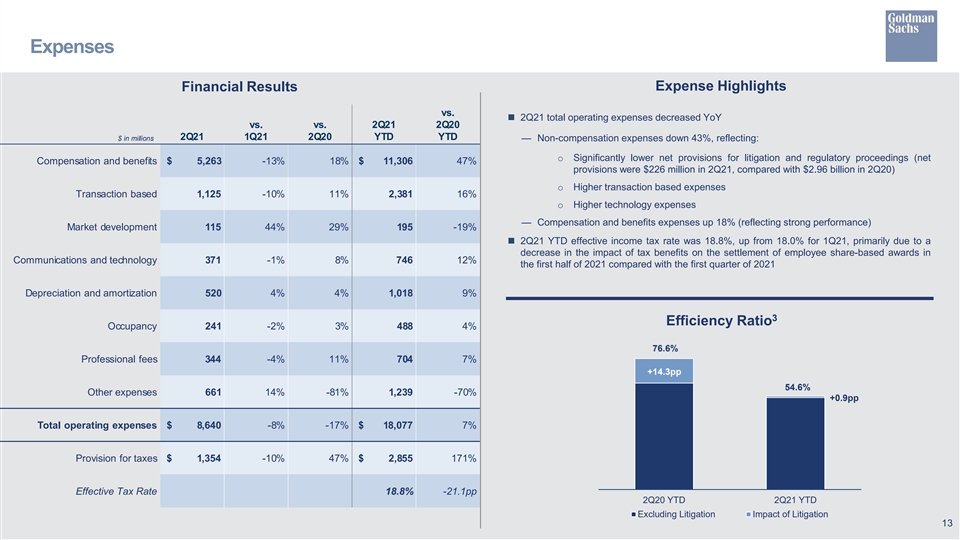
Expenses Financial Results Expense Highlights vs. n 2Q21 total operating expenses decreased YoY vs. vs. 2Q21 2Q20 2Q21 1Q21 2Q20 YTD YTD $ in millions — Non-compensation expenses down 43%, reflecting: o Significantly lower net provisions for litigation and regulatory proceedings (net Compensation and benefits $ 5,263 -13% 18% $ 11,306 47% provisions were $226 million in 2Q21, compared with $2.96 billion in 2Q20) o Higher transaction based expenses Transaction based 1,125 -10% 11% 2,381 16% o Higher technology expenses — Compensation and benefits expenses up 18% (reflecting strong performance) Market development 115 44% 29% 195 -19% n 2Q21 YTD effective income tax rate was 18.8%, up from 18.0% for 1Q21, primarily due to a decrease in the impact of tax benefits on the settlement of employee share-based awards in Communications and technology 371 -1% 8% 746 12% the first half of 2021 compared with the first quarter of 2021 Depreciation and amortization 520 4% 4% 1,018 9% 3 Efficiency Ratio Occupancy 241 -2% 3% 488 4% 76.6% Professional fees 344 -4% 11% 704 7% +14.3pp 54.6% Other expenses 661 14% -81% 1,239 -70% +0.9pp Total operating expenses $ 8,640 -8% -17% $ 18,077 7% Provision for taxes $ 1,354 -10% 47% $ 2,855 171% Effective Tax Rate 18.8% -21.1pp 2Q20 YTD 2Q21 YTD Excluding Litigation Impact of Litigation 13Expenses Financial Results Expense Highlights vs. n 2Q21 total operating expenses decreased YoY vs. vs. 2Q21 2Q20 2Q21 1Q21 2Q20 YTD YTD $ in millions — Non-compensation expenses down 43%, reflecting: o Significantly lower net provisions for litigation and regulatory proceedings (net Compensation and benefits $ 5,263 -13% 18% $ 11,306 47% provisions were $226 million in 2Q21, compared with $2.96 billion in 2Q20) o Higher transaction based expenses Transaction based 1,125 -10% 11% 2,381 16% o Higher technology expenses — Compensation and benefits expenses up 18% (reflecting strong performance) Market development 115 44% 29% 195 -19% n 2Q21 YTD effective income tax rate was 18.8%, up from 18.0% for 1Q21, primarily due to a decrease in the impact of tax benefits on the settlement of employee share-based awards in Communications and technology 371 -1% 8% 746 12% the first half of 2021 compared with the first quarter of 2021 Depreciation and amortization 520 4% 4% 1,018 9% 3 Efficiency Ratio Occupancy 241 -2% 3% 488 4% 76.6% Professional fees 344 -4% 11% 704 7% +14.3pp 54.6% Other expenses 661 14% -81% 1,239 -70% +0.9pp Total operating expenses $ 8,640 -8% -17% $ 18,077 7% Provision for taxes $ 1,354 -10% 47% $ 2,855 171% Effective Tax Rate 18.8% -21.1pp 2Q20 YTD 2Q21 YTD Excluding Litigation Impact of Litigation 13


Capital and Balance Sheet 3,4 Capital Capital and Balance Sheet Highlights n Standardized CET1 ratio increased QoQ, due to an increase in CET1 capital (reflecting net 2Q21 1Q21 2Q20 $ in billions earnings in excess of share repurchases and dividends) partially offset by higher RWAs Common Equity Tier 1 (CET1) capital $ 89.4 $ 85.2 $ 74.7 n Advanced CET1 ratio decreased QoQ, reflecting higher credit and market RWAs (driven by increased exposure) Standardized RWAs $ 621 $ 595 $ 563 n SLR decreased QoQ, primarily driven by the expiration of the Federal Reserve’s temporary 7 amendment Standardized CET1 capital ratio 14.4% 14.3% 13.3% n Returned $1.44 billion of capital to common shareholders during the quarter 3 Advanced RWAs $ 667 $ 630 $ 628 — Repurchased 2.8 million shares for a total cost of $1.00 billion in 2Q21 — Paid $441 million of capital in common stock dividends Advanced CET1 capital ratio 13.4% 13.5% 11.9% n Increased the quarterly dividend from $1.25 to $2.00 per common share in 3Q21 7 Supplementary leverage ratio (SLR) 5.5% 6.5% 6.6% n The firm’s balance sheet increased $86 billion QoQ, reflecting client demand — Deposits increased $20 billion QoQ, reflecting an increase across channels, with particular growth in transaction banking, and Unsecured long-term borrowings increased $20 billion QoQ 4 Selected Balance Sheet Data n BVPS increased 5.6% QoQ, driven by net earnings $ in billions 2Q21 1Q21 2Q20 $ 1,388 $ 1,302 $ 1,142 Total assets Book Value $ 306 $ 286 $ 269 Deposits In millions, except per share amounts 2Q21 1Q21 2Q20 3 Unsecured long-term borrowings $ 239 $ 219 $ 223 Basic shares 349.9 352.7 355.8 Shareholders’ equity $ 102 $ 98 $ 90 Book value per common share $ 264.90 $ 250.81 $ 221.55 3 1 Average GCLA $ 329 $ 299 $ 290 Tangible book value per common share $ 251.02 $ 236.90 $ 208.08 14Capital and Balance Sheet 3,4 Capital Capital and Balance Sheet Highlights n Standardized CET1 ratio increased QoQ, due to an increase in CET1 capital (reflecting net 2Q21 1Q21 2Q20 $ in billions earnings in excess of share repurchases and dividends) partially offset by higher RWAs Common Equity Tier 1 (CET1) capital $ 89.4 $ 85.2 $ 74.7 n Advanced CET1 ratio decreased QoQ, reflecting higher credit and market RWAs (driven by increased exposure) Standardized RWAs $ 621 $ 595 $ 563 n SLR decreased QoQ, primarily driven by the expiration of the Federal Reserve’s temporary 7 amendment Standardized CET1 capital ratio 14.4% 14.3% 13.3% n Returned $1.44 billion of capital to common shareholders during the quarter 3 Advanced RWAs $ 667 $ 630 $ 628 — Repurchased 2.8 million shares for a total cost of $1.00 billion in 2Q21 — Paid $441 million of capital in common stock dividends Advanced CET1 capital ratio 13.4% 13.5% 11.9% n Increased the quarterly dividend from $1.25 to $2.00 per common share in 3Q21 7 Supplementary leverage ratio (SLR) 5.5% 6.5% 6.6% n The firm’s balance sheet increased $86 billion QoQ, reflecting client demand — Deposits increased $20 billion QoQ, reflecting an increase across channels, with particular growth in transaction banking, and Unsecured long-term borrowings increased $20 billion QoQ 4 Selected Balance Sheet Data n BVPS increased 5.6% QoQ, driven by net earnings $ in billions 2Q21 1Q21 2Q20 $ 1,388 $ 1,302 $ 1,142 Total assets Book Value $ 306 $ 286 $ 269 Deposits In millions, except per share amounts 2Q21 1Q21 2Q20 3 Unsecured long-term borrowings $ 239 $ 219 $ 223 Basic shares 349.9 352.7 355.8 Shareholders’ equity $ 102 $ 98 $ 90 Book value per common share $ 264.90 $ 250.81 $ 221.55 3 1 Average GCLA $ 329 $ 299 $ 290 Tangible book value per common share $ 251.02 $ 236.90 $ 208.08 14


Cautionary Note Regarding Forward-Looking Statements This presentation contains “forward-looking statements” within the meaning of the safe harbor provisions of the U.S. Private Securities Litigation Reform Act of 1995. Forward-looking statements are not historical facts or statements of current conditions, but instead represent only the firm’s beliefs regarding future events, many of which, by their nature, are inherently uncertain and outside of the firm’s control. It is possible that the firm’s actual results, financial condition and liquidity may differ, possibly materially, from the anticipated results, financial condition and liquidity in these forward-looking statements. For information about some of the risks and important factors that could affect the firm’s future results, financial condition and liquidity and the forward-looking statements below, see “Risk Factors” in Part I, Item 1A of the firm’s Annual Report on Form 10-K for the year ended December 31, 2020. Information regarding the firm’s assets under supervision, capital ratios, risk-weighted assets, supplementary leverage ratio, balance sheet data and global core liquid assets (GCLA) consists of preliminary estimates. These estimates are forward-looking statements and are subject to change, possibly materially, as the firm completes its financial statements. Statements regarding (i) estimated GDP growth and inflation trends, (ii) the impact of the COVID-19 pandemic on the firm’s business, results, financial position and liquidity, (iii) the timing, profitability, benefits and other prospective aspects of business initiatives and the achievability of medium- and long-term targets and goals, (iv) the future state of the firm’s liquidity and regulatory capital ratios, (v) the firm’s prospective capital distributions (including dividends and repurchases), (vi) the firm’s future effective income tax rate, (vii) the firm’s investment banking transaction backlog, and (viii) the firm’s planned 2021 debt benchmark issuances are forward-looking statements. Statements regarding estimated GDP growth and inflation trends are subject to the risk that actual GDP growth and inflation trends may differ, possibly materially, due to, among other things, changes in general economic conditions. Statements about the effects of the COVID-19 pandemic on the firm’s business, results, financial position and liquidity are subject to the risk that the actual impact may differ, possibly materially, from what is currently expected. Statements about the timing, profitability, benefits and other prospective aspects of business initiatives and the achievability of medium and long-term targets and goals are based on the firm’s current expectations regarding the firm’s ability to implement these initiatives and achieve these targets and goals and may change, possibly materially, from what is currently expected. Statements about the future state of the firm’s liquidity and regulatory capital ratios, as well as its prospective capital distributions, are subject to the risk that the firm’s actual liquidity, regulatory capital ratios and capital distributions may differ, possibly materially, from what is currently expected. Statements about the firm’s future effective income tax rate are subject to the risk that the firm’s future effective income tax rate may differ from the anticipated rate indicated, possibly materially, due to, among other things, changes in the tax rates applicable to the firm, the firm’s earnings mix or profitability, the entities in which the firm generates profits and the assumptions made in forecasting the firm’s expected tax rate, and potential future guidance from the U.S. IRS. Statements about the firm’s investment banking transaction backlog are subject to the risk that transactions may be modified or may not be completed at all and related net revenues may not be realized or may be materially less than expected. Important factors that could have such a result include, for underwriting transactions, a decline or weakness in general economic conditions, an outbreak of hostilities, volatility in the securities markets or an adverse development with respect to the issuer of the securities and, for financial advisory transactions, a decline in the securities markets, an inability to obtain adequate financing, an adverse development with respect to a party to the transaction or a failure to obtain a required regulatory approval. Statements regarding the firm’s planned 2021 debt benchmark issuances are subject to the risk that actual issuances may differ, possibly materially, due to changes in market conditions, business opportunities or the firm’s funding needs. 15Cautionary Note Regarding Forward-Looking Statements This presentation contains “forward-looking statements” within the meaning of the safe harbor provisions of the U.S. Private Securities Litigation Reform Act of 1995. Forward-looking statements are not historical facts or statements of current conditions, but instead represent only the firm’s beliefs regarding future events, many of which, by their nature, are inherently uncertain and outside of the firm’s control. It is possible that the firm’s actual results, financial condition and liquidity may differ, possibly materially, from the anticipated results, financial condition and liquidity in these forward-looking statements. For information about some of the risks and important factors that could affect the firm’s future results, financial condition and liquidity and the forward-looking statements below, see “Risk Factors” in Part I, Item 1A of the firm’s Annual Report on Form 10-K for the year ended December 31, 2020. Information regarding the firm’s assets under supervision, capital ratios, risk-weighted assets, supplementary leverage ratio, balance sheet data and global core liquid assets (GCLA) consists of preliminary estimates. These estimates are forward-looking statements and are subject to change, possibly materially, as the firm completes its financial statements. Statements regarding (i) estimated GDP growth and inflation trends, (ii) the impact of the COVID-19 pandemic on the firm’s business, results, financial position and liquidity, (iii) the timing, profitability, benefits and other prospective aspects of business initiatives and the achievability of medium- and long-term targets and goals, (iv) the future state of the firm’s liquidity and regulatory capital ratios, (v) the firm’s prospective capital distributions (including dividends and repurchases), (vi) the firm’s future effective income tax rate, (vii) the firm’s investment banking transaction backlog, and (viii) the firm’s planned 2021 debt benchmark issuances are forward-looking statements. Statements regarding estimated GDP growth and inflation trends are subject to the risk that actual GDP growth and inflation trends may differ, possibly materially, due to, among other things, changes in general economic conditions. Statements about the effects of the COVID-19 pandemic on the firm’s business, results, financial position and liquidity are subject to the risk that the actual impact may differ, possibly materially, from what is currently expected. Statements about the timing, profitability, benefits and other prospective aspects of business initiatives and the achievability of medium and long-term targets and goals are based on the firm’s current expectations regarding the firm’s ability to implement these initiatives and achieve these targets and goals and may change, possibly materially, from what is currently expected. Statements about the future state of the firm’s liquidity and regulatory capital ratios, as well as its prospective capital distributions, are subject to the risk that the firm’s actual liquidity, regulatory capital ratios and capital distributions may differ, possibly materially, from what is currently expected. Statements about the firm’s future effective income tax rate are subject to the risk that the firm’s future effective income tax rate may differ from the anticipated rate indicated, possibly materially, due to, among other things, changes in the tax rates applicable to the firm, the firm’s earnings mix or profitability, the entities in which the firm generates profits and the assumptions made in forecasting the firm’s expected tax rate, and potential future guidance from the U.S. IRS. Statements about the firm’s investment banking transaction backlog are subject to the risk that transactions may be modified or may not be completed at all and related net revenues may not be realized or may be materially less than expected. Important factors that could have such a result include, for underwriting transactions, a decline or weakness in general economic conditions, an outbreak of hostilities, volatility in the securities markets or an adverse development with respect to the issuer of the securities and, for financial advisory transactions, a decline in the securities markets, an inability to obtain adequate financing, an adverse development with respect to a party to the transaction or a failure to obtain a required regulatory approval. Statements regarding the firm’s planned 2021 debt benchmark issuances are subject to the risk that actual issuances may differ, possibly materially, due to changes in market conditions, business opportunities or the firm’s funding needs. 15


Footnotes 1. Annualized return on average common shareholders’ equity (ROE) is calculated by dividing annualized net earnings applicable to common shareholders by average monthly common shareholders’ equity. Annualized return on average tangible common shareholders’ equity (ROTE) is calculated by dividing annualized net earnings applicable to common shareholders by average monthly tangible common shareholders’ equity. Tangible common shareholders’ equity is calculated as total shareholders’ equity less preferred stock, goodwill and identifiable intangible assets. Tangible book value per common share (TBVPS) is calculated by dividing tangible common shareholders’ equity by basic shares. Management believes that tangible common shareholders’ equity and TBVPS are meaningful because they are measures that the firm and investors use to assess capital adequacy and that ROTE is meaningful because it measures the performance of businesses consistently, whether they were acquired or developed internally. Tangible common shareholders’ equity, ROTE and TBVPS are non-GAAP measures and may not be comparable to similar non-GAAP measures used by other companies. The table below presents a reconciliation of average and ending common shareholders’ equity to average and ending tangible common shareholders’ equity: AVERAGE FOR THE AS OF THREE MONTHS ENDED SIX MONTHS ENDED Unaudited, $ in millions JUNE 30, 2021 JUNE 30, 2021 JUNE 30, 2021 MARCH 31, 2021 JUNE 30, 2020 Total shareholders’ equity $ 99,294 $ 97,735 $ 101,890 $ 97,664 $ 90,029 Preferred stock (9,203) (9,489) (9,203) (9,203) (11,203) Common shareholders’ equity 90,091 88,246 92,687 88,461 78,826 Goodwill (4,332) (4,332) (4,332) (4,332) (4,196) Identifiable intangible assets (552) (581) (523) (575) (596) Tangible common shareholders’ equity $ 85,207 $ 83,333 $ 87,832 $ 83,554 $ 74,034 2. Dealogic – January 1, 2021 through June 30, 2021. 3. For information about the following items, see the referenced sections in Part I, Item 2 “Management’s Discussion and Analysis of Financial Condition and Results of Operations” in the firm’s Quarterly Report on Form 10-Q for the period ended March 31, 2021: (i) investment banking transaction backlog – see “Results of Operations – Investment Banking” (ii) assets under supervision – see “Results of Operations – Assets Under Supervision” (iii) efficiency ratio – see “Results of Operations – Operating Expenses” (iv) basic shares – see “Balance Sheet and Funding Sources – Balance Sheet Analysis and Metrics” (v) share repurchase program – see “Equity Capital Management and Regulatory Capital – Equity Capital Management” and (vi) global core liquid assets – see “Risk Management – Liquidity Risk Management.” For information about risk-based capital ratios and the supplementary leverage ratio, see Note 20 “Regulation and Capital Adequacy” in Part I, Item 1 “Financial Statements (Unaudited)” in the firm’s Quarterly Report on Form 10-Q for the period ended March 31, 2021. 4. Represents a preliminary estimate for the second quarter of 2021 and may be revised in the firm’s Quarterly Report on Form 10-Q for the period ended June 30, 2021. 5. Includes consolidated investment entities, substantially all of which are engaged in real estate investment activities. These assets are generally accounted for at historical cost less depreciation. Substantially all liabilities are nonrecourse, thereby reducing the firm’s equity at risk. Amounts by vintage, region and asset class are net of financings. 6. Excludes operating net revenues and net gains on sales of consolidated investment entities, as well as revenues reported under Equity Investments for certain positions that are classified as debt (under GAAP) on the firm’s balance sheet. 7. Effective April 1, 2021, the Federal Reserve’s temporary amendment permitting the exclusion of average holdings of U.S. Treasury securities and average deposits at the Federal Reserve from the calculation of the supplementary leverage ratio expired. The impact of this change was a decrease in the firm’s supplementary leverage ratio of approximately 0.8 percentage points. 16Footnotes 1. Annualized return on average common shareholders’ equity (ROE) is calculated by dividing annualized net earnings applicable to common shareholders by average monthly common shareholders’ equity. Annualized return on average tangible common shareholders’ equity (ROTE) is calculated by dividing annualized net earnings applicable to common shareholders by average monthly tangible common shareholders’ equity. Tangible common shareholders’ equity is calculated as total shareholders’ equity less preferred stock, goodwill and identifiable intangible assets. Tangible book value per common share (TBVPS) is calculated by dividing tangible common shareholders’ equity by basic shares. Management believes that tangible common shareholders’ equity and TBVPS are meaningful because they are measures that the firm and investors use to assess capital adequacy and that ROTE is meaningful because it measures the performance of businesses consistently, whether they were acquired or developed internally. Tangible common shareholders’ equity, ROTE and TBVPS are non-GAAP measures and may not be comparable to similar non-GAAP measures used by other companies. The table below presents a reconciliation of average and ending common shareholders’ equity to average and ending tangible common shareholders’ equity: AVERAGE FOR THE AS OF THREE MONTHS ENDED SIX MONTHS ENDED Unaudited, $ in millions JUNE 30, 2021 JUNE 30, 2021 JUNE 30, 2021 MARCH 31, 2021 JUNE 30, 2020 Total shareholders’ equity $ 99,294 $ 97,735 $ 101,890 $ 97,664 $ 90,029 Preferred stock (9,203) (9,489) (9,203) (9,203) (11,203) Common shareholders’ equity 90,091 88,246 92,687 88,461 78,826 Goodwill (4,332) (4,332) (4,332) (4,332) (4,196) Identifiable intangible assets (552) (581) (523) (575) (596) Tangible common shareholders’ equity $ 85,207 $ 83,333 $ 87,832 $ 83,554 $ 74,034 2. Dealogic – January 1, 2021 through June 30, 2021. 3. For information about the following items, see the referenced sections in Part I, Item 2 “Management’s Discussion and Analysis of Financial Condition and Results of Operations” in the firm’s Quarterly Report on Form 10-Q for the period ended March 31, 2021: (i) investment banking transaction backlog – see “Results of Operations – Investment Banking” (ii) assets under supervision – see “Results of Operations – Assets Under Supervision” (iii) efficiency ratio – see “Results of Operations – Operating Expenses” (iv) basic shares – see “Balance Sheet and Funding Sources – Balance Sheet Analysis and Metrics” (v) share repurchase program – see “Equity Capital Management and Regulatory Capital – Equity Capital Management” and (vi) global core liquid assets – see “Risk Management – Liquidity Risk Management.” For information about risk-based capital ratios and the supplementary leverage ratio, see Note 20 “Regulation and Capital Adequacy” in Part I, Item 1 “Financial Statements (Unaudited)” in the firm’s Quarterly Report on Form 10-Q for the period ended March 31, 2021. 4. Represents a preliminary estimate for the second quarter of 2021 and may be revised in the firm’s Quarterly Report on Form 10-Q for the period ended June 30, 2021. 5. Includes consolidated investment entities, substantially all of which are engaged in real estate investment activities. These assets are generally accounted for at historical cost less depreciation. Substantially all liabilities are nonrecourse, thereby reducing the firm’s equity at risk. Amounts by vintage, region and asset class are net of financings. 6. Excludes operating net revenues and net gains on sales of consolidated investment entities, as well as revenues reported under Equity Investments for certain positions that are classified as debt (under GAAP) on the firm’s balance sheet. 7. Effective April 1, 2021, the Federal Reserve’s temporary amendment permitting the exclusion of average holdings of U.S. Treasury securities and average deposits at the Federal Reserve from the calculation of the supplementary leverage ratio expired. The impact of this change was a decrease in the firm’s supplementary leverage ratio of approximately 0.8 percentage points. 16