EXHIBIT 99.1
Hanmi Reports 2025 Fourth Quarter and Full Year Results
LOS ANGELES, Jan. 27, 2026 (GLOBE NEWSWIRE) -- Hanmi Financial Corporation (NASDAQ: HAFC or “Hanmi”), the parent company of Hanmi Bank (the “Bank”), today reported financial results for the fourth quarter of 2025 and full year.
Net income for the fourth quarter of 2025 was $21.2 million, or $0.70 per diluted share, compared with $22.1 million, or $0.73 per diluted share, for the third quarter of 2025. The return on average assets for the fourth quarter of 2025 was 1.07% and the return on average equity was 10.14%, compared with a return on average assets of 1.12% and a return on average equity of 10.69% for the third quarter of 2025.
For the full year of 2025, net income was $76.1 million, or $2.51 per diluted share, compared with $62.2 million, or $2.05 per diluted share, for 2024. The return on average assets for 2025 was 0.98% and the return on average equity was 9.32%, compared with a return on average assets and a return on average equity of 0.83% and 7.97%, respectively, for 2024.
CEO Commentary
“Hanmi delivered solid results in the fourth quarter, enabling us to finish 2025 with sustained momentum,” said Bonnie Lee, President and Chief Executive Officer. “We generated robust earnings growth of 22% for the year, driven by continued net interest margin expansion, healthy loan growth, and disciplined expense and credit management. These consistent results underscore the effectiveness of our relationship-driven banking model.”
“Throughout the year, we advanced several key initiatives that further enhanced our growth and diversification strategy. Investments in banking talent drove a 36% increase in loan production. The composition of our loan portfolio continues to evolve with C&I and residential mortgage loans increasing 25% and 10% for the year, respectively. Our noninterest bearing demand deposits represent 30% of total deposits, reinforcing the stability of our customer base and our credit quality remains strong, with nonperforming loans representing 0.28% of total loans.”
“We are excited about the opportunities ahead in 2026 and beyond and believe we are well positioned to continue delivering on our growth strategy. Our balance sheet is strong, with ample liquidity and excellent capital ratios. We anticipate solid loan and deposit growth, further net interest margin expansion, well managed expenses and stable asset quality to drive consistent performance and long-term value for our shareholders in the coming year,” concluded Lee.
Fourth Quarter 2025 Highlights:
- Net income was $21.2 million, or $0.70 per diluted share, down 3.7% from the third quarter, partially due to lower noninterest income of $1.6 million primarily related to a decrease in income on bank owned life insurance. Additionally, while noninterest expense increased $1.8 million due to higher salaries and professional fees, this was offset by an increase in net interest income of $1.8 million driven by lower cost of deposits.
- Net interest income continued to grow, increasing 2.9% from the prior quarter due to lower interest expense as the average rate on interest-bearing deposits declined 20 basis points. Although the yield on average loans declined by nine basis points, the average balance of loans increased 2%. This resulted in another quarter of net interest margin expansion (taxable equivalent) of six basis points to 3.28%.
- Return on average assets and return on average equity during the quarter were healthy at 1.07% and 10.14%, respectively.
- Asset quality remained strong as nonperforming assets to total assets was 0.26%, an improvement of one basis point from the prior quarter. Nonperforming loans to total loans was 0.28%, an improvement of two basis points from the prior quarter and credit loss expense was $1.9 million, compared to $2.1 million in the prior quarter.
- Loans receivable increased to $6.56 billion, up 0.5% from the end of the prior quarter. Loan production was $374.8 million, with a weighted average interest rate of 6.90% compared to the weighted average interest rate of 6.46% for payoffs.
- Deposits were $6.68 billion, down 1.3% from the prior quarter, however noninterest-bearing demand deposits, which demonstrate the stability of the customer base, represented 30.2% of total deposits.
- Hanmi's capital position remained strong with a ratio of tangible common equity to tangible assets1 of 9.99% while the Company returned $10.1 million of capital to shareholders in the form of share repurchases and dividends ($2.0 million in share repurchases and $8.1 million of dividends).
For more information about Hanmi, please see the Q4 2025 Investor Update (and Supplemental Financial Information), which is available on the Bank’s website at www.hanmi.com and via a current report on Form 8-K on the website of the Securities and Exchange Commission at www.sec.gov. Also, please refer to “Non-GAAP Financial Measures” herein for further details of the presentation of certain non-GAAP financial measures.
Quarterly Highlights
(Dollars in thousands, except per share data)
| | As of or for the Three Months Ended | | | Amount Change | |
| | Dec 31 | | | Sep 30 | | | Jun 30, | | | Mar 31, | | | Dec 31, | | | Q4-25 | | | Q4-25 | |
| | 2025 | | | 2025 | | | 2025 | | | 2025 | | | 2024 | | | vs. Q3-25 | | | vs. Q4-24 | |
| | | | | | | | | | | | | | | | | | | | | |
| Net income | $ | 21,239 | | | $ | 22,061 | | | $ | 15,117 | | | $ | 17,672 | | | $ | 17,695 | | | $ | (822 | ) | | $ | 3,544 | |
| Net income per diluted common share | $ | 0.70 | | | $ | 0.73 | | | $ | 0.50 | | | $ | 0.58 | | | $ | 0.58 | | | $ | (0.03 | ) | | $ | 0.12 | |
| | | | | | | | | | | | | | | | | | | | | |
| Assets | $ | 7,869,185 | | | $ | 7,856,731 | | | $ | 7,862,363 | | | $ | 7,729,035 | | | $ | 7,677,925 | | | $ | 12,454 | | | $ | 191,260 | |
| Loans receivable | $ | 6,563,367 | | | $ | 6,528,259 | | | $ | 6,305,957 | | | $ | 6,282,189 | | | $ | 6,251,377 | | | $ | 35,108 | | | $ | 311,990 | |
| Deposits | $ | 6,677,650 | | | $ | 6,766,639 | | | $ | 6,729,122 | | | $ | 6,619,475 | | | $ | 6,435,776 | | | $ | (88,989 | ) | | $ | 241,874 | |
| | | | | | | | | | | | | | | | | | | | | |
| Return on average assets | | 1.07 | % | | | 1.12 | % | | | 0.79 | % | | | 0.94 | % | | | 0.93 | % | | | -0.05 | | | | 0.14 | |
| Return on average stockholders' equity | | 10.14 | % | | | 10.69 | % | | | 7.48 | % | | | 8.92 | % | | | 8.89 | % | | | -0.55 | | | | 1.25 | |
| | | | | | | | | | | | | | | | | | | | | |
| Net interest margin | | 3.28 | % | | | 3.22 | % | | | 3.07 | % | | | 3.02 | % | | | 2.91 | % | | | 0.06 | | | | 0.37 | |
| Efficiency ratio (1) | | 54.95 | % | | | 52.65 | % | | | 55.74 | % | | | 55.69 | % | | | 56.79 | % | | | 2.30 | | | | -1.84 | |
| | | | | | | | | | | | | | | | | | | | | |
| Tangible common equity to tangible assets (2) | | 9.99 | % | | | 9.80 | % | | | 9.58 | % | | | 9.59 | % | | | 9.41 | % | | | 0.19 | | | | 0.58 | |
| Tangible common equity per common share (2) | $ | 26.27 | | | $ | 25.64 | | | $ | 24.91 | | | $ | 24.49 | | | $ | 23.88 | | | | 0.63 | | | | 2.39 | |
| | | | | | | | | | | | | | | | | | | | | |
| | | | | | | | | | | | | | | | | | | | | |
(1) Noninterest expense divided by net interest income plus noninterest income.
| |
(2) Refer to "Non-GAAP Financial Measures" for further details.
| |
_____________________
1 See Non-GAAP Financial Measures provided at the end of this news release.
Results of Operations
Net interest income for the fourth quarter increased $1.8 million, or 2.9%, to $62.9 million from $61.1 million for the third quarter, principally because of lower interest expense on interest-bearing deposits. Interest income on interest-earning assets was $105.1 million for the fourth quarter, down $0.1 million from the third quarter. Interest expense on interest-bearing liabilities, however, declined $1.9 million from the previous quarter to $42.2 million because of a 20 basis point decrease in the average rate on interest-bearing deposits.
The average yield on loans for the fourth quarter was 5.94%, down nine basis points from the previous quarter; however, the average balance of loans increased 2.4% to $6.46 billion. The average rate on interest-bearing deposits was 3.36%, down 20 basis points from the third quarter as the average balance of interest-bearing deposits remained relatively unchanged with an increase of 0.2% to $4.71 billion.
For the fourth quarter, net interest margin (taxable-equivalent) was 3.28%, up six basis points from the third quarter. Lower yields on securities and interest-bearing deposits at other banks contributed to a six basis point decline in net interest margin while the improvement in the average rate on interest-bearing liabilities provided a 12 basis point benefit. Net interest margin also benefited by approximately two basis points from an interest-recovery on a previously charged-off loan and loans returning to accrual status, while third quarter net interest margin benefited three basis points from similar activity.
On a full-year basis, net interest income in 2025 was $236.2 million, compared with $202.8 million for 2024, an increase of 16.5%, or $33.4 million. The increase reflects the benefit of lower market interest rates on interest-bearing deposits as well as growth in the average balance of loans. The average rate on interest-bearing deposits for 2025 was 3.56%, 60 basis points lower than the previous year, while the average balance increased 5.5% to $4.63 billion. The average balance of deposits increased 4.1% to $6.57 billion. Average loan yields for 2025, however, were 5.96%, and were not meaningfully affected by the changes in market interest rates. Average loans increased 3.1% to $6.30 billion.
Net interest margin (taxable-equivalent) for 2025 was 3.15% compared with 2.78% for 2024. The 37 basis point increase in the net interest margin primarily reflected the 35 basis point benefit of lower average rates on interest-bearing liabilities.
| | For the Three Months Ended (in thousands) | | | Percentage Change | |
| | Dec 31, | | | Sep 30, | | | Jun 30, | | | Mar 31, | | | Dec 31, | | | Q4-25 | | | Q4-25 | |
| Net Interest Income | 2025 | | | 2025 | | | 2025 | | | 2025 | | | 2024 | | | vs. Q3-25 | | | vs. Q4-24 | |
| | | | | | | | | | | | | | | | | | | | | |
| Interest and fees on loans receivable(1) | $ | 96,592 | | | $ | 95,691 | | | $ | 92,589 | | | $ | 90,887 | | | $ | 91,545 | | | | 0.9 | % | | | 5.5 | % |
| Interest on securities | | 6,323 | | | | 6,592 | | | | 6,261 | | | | 6,169 | | | | 5,866 | | | | -4.1 | % | | | 7.8 | % |
| Dividends on FHLB stock | | 361 | | | | 357 | | | | 354 | | | | 360 | | | | 360 | | | | 1.1 | % | | | 0.3 | % |
| Interest on deposits in other banks | | 1,837 | | | | 2,586 | | | | 2,129 | | | | 1,841 | | | | 2,342 | | | | -29.0 | % | | | -21.6 | % |
| Total interest and dividend income | $ | 105,113 | | | $ | 105,226 | | | $ | 101,333 | | | $ | 99,257 | | | $ | 100,113 | | | | -0.1 | % | | | 5.0 | % |
| | | | | | | | | | | | | | | | | | | | | |
| Interest on deposits | | 39,978 | | | | 42,244 | | | | 41,924 | | | | 40,559 | | | | 43,406 | | | | -5.4 | % | | | -7.9 | % |
| Interest on borrowings | | 695 | | | | 324 | | | | 684 | | | | 2,024 | | | | 1,634 | | | | 114.5 | % | | | -57.5 | % |
| Interest on subordinated debentures | | 1,561 | | | | 1,579 | | | | 1,586 | | | | 1,582 | | | | 1,624 | | | | -1.1 | % | | | -3.9 | % |
| Total interest expense | | 42,234 | | | | 44,147 | | | | 44,194 | | | | 44,165 | | | | 46,664 | | | | -4.3 | % | | | -9.5 | % |
| Net interest income | $ | 62,879 | | | $ | 61,079 | | | $ | 57,139 | | | $ | 55,092 | | | $ | 53,449 | | | | 2.9 | % | | | 17.6 | % |
| | | | | | | | | | | | | | | | | | | | | |
(1) Includes loans held for sale.
| | | |
| | For the Three Months Ended (in thousands) | | | Percentage Change | |
Average Earning Assets and Interest-bearing Liabilities
| Dec 31, | | | Sep 30, | | | Jun 30, | | | Mar 31, | | | Dec 31, | | | Q4-25 | | | Q4-25 | |
| 2025 | | | 2025 | | | 2025 | | | 2025 | | | 2024 | | | vs. Q3-25 | | | vs. Q4-24 | |
| Loans receivable (1) | $ | 6,456,239 | | | $ | 6,304,435 | | | $ | 6,257,741 | | | $ | 6,189,531 | | | $ | 6,103,264 | | | | 2.4 | % | | | 5.8 | % |
| Securities | | 955,811 | | | | 985,888 | | | | 993,975 | | | | 1,001,499 | | | | 998,313 | | | | -3.1 | % | | | -4.3 | % |
| FHLB stock | | 16,385 | | | | 16,385 | | | | 16,385 | | | | 16,385 | | | | 16,385 | | | | 0.0 | % | | | 0.0 | % |
| Interest-bearing deposits in other banks | | 191,731 | | | | 239,993 | | | | 200,266 | | | | 176,028 | | | | 204,408 | | | | -20.1 | % | | | -6.2 | % |
| Average interest-earning assets | $ | 7,620,166 | | | $ | 7,546,701 | | | $ | 7,468,367 | | | $ | 7,383,443 | | | $ | 7,322,370 | | | | 1.0 | % | | | 4.1 | % |
| | | | | | | | | | | | | | | | | | | | | |
| Demand: interest-bearing | $ | 77,297 | | | $ | 86,839 | | | $ | 81,308 | | | $ | 79,369 | | | $ | 79,784 | | | | -11.0 | % | | | -3.1 | % |
| Money market and savings | | 2,130,616 | | | | 2,122,967 | | | | 2,109,221 | | | | 2,037,224 | | | | 1,934,540 | | | | 0.4 | % | | | 10.1 | % |
| Time deposits | | 2,506,582 | | | | 2,494,285 | | | | 2,434,659 | | | | 2,345,346 | | | | 2,346,363 | | | | 0.5 | % | | | 6.8 | % |
| Average interest-bearing deposits | | 4,714,495 | | | | 4,704,091 | | | | 4,625,188 | | | | 4,461,939 | | | | 4,360,687 | | | | 0.2 | % | | | 8.1 | % |
| Borrowings | | 64,565 | | | | 27,772 | | | | 60,134 | | | | 179,444 | | | | 141,604 | | | | 132.5 | % | | | -54.4 | % |
| Subordinated debentures | | 130,385 | | | | 130,766 | | | | 130,880 | | | | 130,718 | | | | 130,567 | | | | -0.3 | % | | | -0.1 | % |
| Average interest-bearing liabilities | $ | 4,909,445 | | | $ | 4,862,629 | | | $ | 4,816,202 | | | $ | 4,772,101 | | | $ | 4,632,858 | | | | 1.0 | % | | | 6.0 | % |
| | | | | | | | | | | | | | | | | | | | | |
| Average Noninterest Bearing Deposits | | | | | | | | | | | | | | | | | | | | |
| Demand deposits - noninterest bearing | $ | 1,969,908 | | | $ | 1,960,331 | | | $ | 1,934,985 | | | $ | 1,895,953 | | | $ | 1,967,789 | | | | 0.5 | % | | | 0.1 | % |
| | | | | | | | | | | | | | | | | | | | | |
| (1) Includes loans held for sale. | | | | | | | | | | | | | | | | | | | | |
| | For the Three Months Ended | | | Yield/Rate Change | |
| | Dec 31, | | | Sep 30, | | | Jun 30, | | | Mar 31, | | | Dec 31, | | | Q4-25 | | | Q4-25 | |
| Average Yields and Rates | 2025 | | | 2025 | | | 2025 | | | 2025 | | | 2024 | | | vs. Q3-25 | | | vs. Q4-24 | |
| Loans receivable(1) | | 5.94 | % | | | 6.03 | % | | | 5.93 | % | | | 5.95 | % | | | 5.97 | % | | | -0.09 | | | | -0.03 | |
| Securities (2) | | 2.67 | % | | | 2.70 | % | | | 2.55 | % | | | 2.49 | % | | | 2.38 | % | | | -0.03 | | | | 0.29 | |
| FHLB stock | | 8.75 | % | | | 8.65 | % | | | 8.65 | % | | | 8.92 | % | | | 8.75 | % | | | 0.10 | | | | 0.00 | |
| Interest-bearing deposits in other banks | | 3.80 | % | | | 4.27 | % | | | 4.26 | % | | | 4.24 | % | | | 4.56 | % | | | -0.47 | | | | -0.76 | |
| Interest-earning assets | | 5.48 | % | | | 5.54 | % | | | 5.44 | % | | | 5.45 | % | | | 5.45 | % | | | -0.06 | | | | 0.03 | |
| | | | | | | | | | | | | | | | | | | | | |
| Interest-bearing deposits | | 3.36 | % | | | 3.56 | % | | | 3.64 | % | | | 3.69 | % | | | 3.96 | % | | | -0.20 | | | | -0.60 | |
| Borrowings | | 4.27 | % | | | 4.63 | % | | | 4.58 | % | | | 4.57 | % | | | 4.59 | % | | | -0.36 | | | | -0.32 | |
| Subordinated debentures | | 4.79 | % | | | 4.83 | % | | | 4.84 | % | | | 4.84 | % | | | 4.97 | % | | | -0.04 | | | | -0.18 | |
| Interest-bearing liabilities | | 3.41 | % | | | 3.60 | % | | | 3.68 | % | | | 3.75 | % | | | 4.01 | % | | | -0.19 | | | | -0.60 | |
| | | | | | | | | | | | | | | | | | | | | |
| Net interest margin (taxable equivalent basis) | | 3.28 | % | | | 3.22 | % | | | 3.07 | % | | | 3.02 | % | | | 2.91 | % | | | 0.06 | | | | 0.37 | |
| | | | | | | | | | | | | | | | | | | | | |
| Cost of deposits | | 2.37 | % | | | 2.51 | % | | | 2.56 | % | | | 2.59 | % | | | 2.73 | % | | | -0.14 | | | | -0.36 | |
| | | | | | | | | | | | | | | | | | | | | |
| (1) Includes loans held for sale. | | | | | | | | | | | | | | | | | | | | |
| (2) Amounts calculated on a fully taxable equivalent basis using the federal tax rate in effect for the periods presented. | | | | | | | |
| | | | | | | | |
Credit loss expense for the fourth quarter was $1.9 million, compared with $2.1 million for the third quarter of 2025. Fourth quarter credit loss expense included $1.7 million for loan losses and $0.2 million for off-balance sheet items. Third quarter credit loss expense of $2.1 million included a $2.5 million credit loss expense for loan losses and a $0.4 million credit loss recovery for off-balance sheet items.
Credit loss expense was $14.4 million for 2025, compared with $4.4 million for 2024. The credit loss expense for 2025 included a $14.2 million credit loss expense for loan losses and a $0.2 million credit loss recovery for off-balance sheet items. 2024 credit loss expense included a $4.8 million credit loss expense for loans and a $0.4 million credit loss recovery for off-balance sheet items. The increase for 2025 primarily reflects an $8.6 million charge-off of a syndicated commercial real estate office loan during the second quarter of 2025.
Noninterest income was $8.3 million for the fourth quarter, down $1.6 million, or 16.0%, from the third quarter. The decrease was primarily due to the absence of $0.9 million of death benefit claims from bank-owned life insurance policies and a $0.6 million decline in gain on the sale of residential mortgage loans. Gain on sale of SBA loans was $1.8 million for the fourth quarter of 2025, compared with $1.9 million for the third quarter of 2025. The volume of SBA loans sold for the fourth quarter decreased to $29.9 million from $32.6 million for the third quarter of 2025, while trade premiums were 7.40% for the fourth quarter of 2025 compared with 6.95% for the third quarter.
Noninterest income was $34.0 million for the full year of 2025, an increase of $2.4 million, or 7.6%, from $31.6 million for 2024. The increase was primarily due to a $1.7 million increase in gain on the sale of SBA loans, a $1.0 million increase in bank-owned life insurance income from death benefit claims, and a $0.8 million increase in trade finance and other service charges and fees. These items were partially offset by the absence of the $0.9 million gain on sale of a bank branch in 2024. The volume of SBA loans sold for 2025 increased to $130.0 million from $93.7 million for 2024, while trade premiums decreased to 7.45% for 2025, from 8.18% for 2024.
| | For the Three Months Ended (in thousands) | | | Percentage Change | |
| | Dec 31, | | | Sep 30, | | | Jun 30, | | | Mar 31, | | | Dec 31, | | | Q4-25 | | | Q4-25 | |
| Noninterest Income | 2025 | | | 2025 | | | 2025 | | | 2025 | | | 2024 | | | vs. Q3-25 | | | vs. Q4-24 | |
| Service charges on deposit accounts | $ | 2,196 | | | $ | 2,160 | | | $ | 2,169 | | | $ | 2,217 | | | $ | 2,192 | | | | 1.7 | % | | | 0.2 | % |
| Trade finance and other service charges and fees | | 1,735 | | | | 1,551 | | | | 1,461 | | | | 1,396 | | | | 1,364 | | | | 11.9 | % | | | 27.2 | % |
| Servicing income | | 924 | | | | 924 | | | | 754 | | | | 732 | | | | 668 | | | | 0.0 | % | | | 38.3 | % |
| Bank-owned life insurance income | | 315 | | | | 1,259 | | | | 708 | | | | 309 | | | | 316 | | | | -75.0 | % | | | -0.3 | % |
| All other operating income | | 758 | | | | 973 | | | | 819 | | | | 897 | | | | 1,037 | | | | -22.1 | % | | | -26.9 | % |
| Service charges, fees & other | | 5,928 | | | | 6,867 | | | | 5,911 | | | | 5,551 | | | | 5,577 | | | | -13.7 | % | | | 6.3 | % |
| | | | | | | | | | | | | | | | | | | | | |
| Gain on sale of SBA loans | | 1,790 | | | | 1,857 | | | | 2,160 | | | | 2,000 | | | | 1,443 | | | | -3.6 | % | | | 24.0 | % |
| Gain on sale of residential mortgage loans | | 581 | | | | 1,156 | | | | - | | | | 175 | | | | 337 | | | | -49.7 | % | | | 72.4 | % |
| Total noninterest income | $ | 8,299 | | | $ | 9,880 | | | $ | 8,071 | | | $ | 7,726 | | | $ | 7,357 | | | | -16.0 | % | | | 12.8 | % |
| | | | | | | | | | | | | | | | | | | | | |
Noninterest expense for the fourth quarter, before other-real-estate-owned and repossessed personal property expenses, increased 3.5% to $38.6 million from $37.3 million because of seasonally higher advertising and promotion expense, as well as an increase in personnel and higher professional fees and data processing expenses. Other-real-estate-owned expense included the first full quarter of operating expenses, as well as $0.3 million of past-due property taxes, for a hospitality property. The efficiency ratio for the fourth quarter was 54.95%, compared with 52.65% for the third quarter of 2025.
Noninterest expense increased by $6.5 million, or 4.6%, to $147.8 million for the full year of 2025 from $141.3 million for 2024. The increase reflected a $4.3 million increase in salaries and benefits due to merit increases and investment in new talent, the absence of a $1.6 million gain from the 2024 sale of other-real-estate-owned, an increase of $1.0 million in other operating expenses for higher loan-related and deposit-related expenses, and an increase of $0.6 million in data processing expense. Partially offsetting this increase was lower repossessed personal property expense of $0.9 million. The efficiency ratio for full-year 2025 decreased to 54.71%, from 60.31% for 2024.
| | For the Three Months Ended (in thousands) | | | Percentage Change | |
| | Dec 31, | | | Sep 30, | | | Jun 30, | | | Mar 31, | | | Dec 31, | | | Q4-25 | | | Q4-25 | |
| | 2025 | | | 2025 | | | 2025 | | | 2025 | | | 2024 | | | vs. Q3-25 | | | vs. Q4-24 | |
| Noninterest Expense | | | | | | | | | | | | | | | | | | | | |
| Salaries and employee benefits | $ | 22,472 | | | $ | 22,163 | | | $ | 22,069 | | | $ | 20,972 | | | $ | 20,498 | | | | 1.4 | % | | | 9.6 | % |
| Occupancy and equipment | | 4,339 | | | | 4,507 | | | | 4,344 | | | | 4,450 | | | | 4,503 | | | | -3.7 | % | | | -3.6 | % |
| Data processing | | 4,098 | | | | 3,860 | | | | 3,727 | | | | 3,787 | | | | 3,800 | | | | 6.2 | % | | | 7.8 | % |
| Professional fees | | 2,343 | | | | 1,978 | | | | 1,725 | | | | 1,468 | | | | 1,821 | | | | 18.5 | % | | | 28.7 | % |
| Supplies and communication | | 573 | | | | 423 | | | | 515 | | | | 517 | | | | 551 | | | | 35.5 | % | | | 4.0 | % |
| Advertising and promotion | | 1,010 | | | | 712 | | | | 798 | | | | 585 | | | | 821 | | | | 41.9 | % | | | 23.0 | % |
| All other operating expenses | | 3,795 | | | | 3,665 | | | | 3,567 | | | | 3,175 | | | | 3,847 | | | | 3.6 | % | | | -1.3 | % |
| Subtotal | | 38,630 | | | | 37,308 | | | | 36,745 | | | | 34,954 | | | | 35,841 | | | | 3.5 | % | | | 7.8 | % |
| | | | | | | | | | | | | | | | | | | | | |
| Other real estate owned expense (income) | | 474 | | | | 17 | | | | (461 | ) | | | 41 | | | | (1,588 | ) | | | 2688.2 | % | | | 129.8 | % |
| Repossessed personal property expense (income) | | 5 | | | | 32 | | | | 63 | | | | (11 | ) | | | 281 | | | | -84.4 | % | | | -98.2 | % |
| Total noninterest expense | $ | 39,109 | | | $ | 37,357 | | | $ | 36,347 | | | $ | 34,984 | | | $ | 34,534 | | | | 4.7 | % | | | 13.3 | % |
| | | | | | | | | | | | | | | | | | | | | |
Hanmi recorded a provision for income taxes of $8.9 million for the fourth quarter of 2025, compared with $9.4 million for the third quarter of 2025, representing effective tax rates of 29.5% and 29.9%, respectively. For the years ended December 31, 2025, and 2024, the provision for income taxes was $31.8 million and $26.4 million, representing effective tax rates of 29.5% and 29.8%, respectively.
Financial Position
Total assets at December 31, 2025, were $7.87 billion, a 0.2% increase from $7.86 billion at September 30, 2025. This increase was primarily due to a $35.1 million, or 0.5% increase in loans receivable, before the allowance for credit losses, which was partially offset by a $24.1 million decrease in securities available for sale.
| | As of (in thousands) | | | Percentage Change | |
| | Dec 31, | | | Sep 30, | | | Jun 30, | | | Mar 31, | | | Dec 31, | | | Q4-25 | | | Q4-25 | |
| | 2025 | | | 2025 | | | 2025 | | | 2025 | | | 2024 | | | vs. Q3-25 | | | vs. Q4-24 | |
| Loan Portfolio | | | | | | | | | | | | | | | | | | | | |
| Commercial real estate loans | $ | 4,030,105 | | | $ | 4,015,291 | | | $ | 3,948,922 | | | $ | 3,975,651 | | | $ | 3,949,622 | | | | 0.4 | % | | | 2.0 | % |
| Residential/consumer loans | | 1,049,872 | | | | 1,043,577 | | | | 993,869 | | | | 979,536 | | | | 951,302 | | | | 0.6 | % | | | 10.4 | % |
| Commercial and industrial loans | | 1,074,907 | | | | 1,052,522 | | | | 917,995 | | | | 854,406 | | | | 863,431 | | | | 2.1 | % | | | 24.5 | % |
| Equipment finance | | 408,483 | | | | 416,869 | | | | 445,171 | | | | 472,596 | | | | 487,022 | | | | -2.0 | % | | | -16.1 | % |
| Loans receivable | | 6,563,367 | | | | 6,528,259 | | | | 6,305,957 | | | | 6,282,189 | | | | 6,251,377 | | | | 0.5 | % | | | 5.0 | % |
| Loans held for sale | | 7,403 | | | | 6,512 | | | | 49,611 | | | | 11,831 | | | | 8,579 | | | | 13.7 | % | | | -13.7 | % |
| Total | $ | 6,570,770 | | | $ | 6,534,771 | | | $ | 6,355,568 | | | $ | 6,294,020 | | | $ | 6,259,956 | | | | 0.6 | % | | | 5.0 | % |
| | As of | |
| | Dec 31, | | | Sep 30, | | | Jun 30, | | | Mar 31, | | | Dec 31, | |
| | 2025 | | | 2025 | | | 2025 | | | 2025 | | | 2024 | |
| Composition of Loan Portfolio | | | | | | | | | | | | | | |
| Commercial real estate loans | | 61.3 | % | | | 61.4 | % | | | 62.2 | % | | | 63.1 | % | | | 63.1 | % |
| Residential/consumer loans | | 16.0 | % | | | 16.0 | % | | | 15.6 | % | | | 15.6 | % | | | 15.2 | % |
| Commercial and industrial loans | | 16.4 | % | | | 16.1 | % | | | 14.4 | % | | | 13.6 | % | | | 13.8 | % |
| Equipment finance | | 6.2 | % | | | 6.4 | % | | | 7.0 | % | | | 7.5 | % | | | 7.8 | % |
| Loans receivable | | 99.9 | % | | | 99.9 | % | | | 99.2 | % | | | 99.8 | % | | | 99.9 | % |
| Loans held for sale | | 0.1 | % | | | 0.1 | % | | | 0.8 | % | | | 0.2 | % | | | 0.1 | % |
| Total | | 100.0 | % | | | 100.0 | % | | | 100.0 | % | | | 100.0 | % | | | 100.0 | % |
| | | | | | | | | | | | | | | | | | | | |
New loan production was $374.8 million for the fourth quarter of 2025 with a weighted average rate of 6.90%, while payoffs were $123.1 million during the quarter at an average interest rate of 6.46%.
New loan production for full-year 2025 was $1.62 billion, an increase of 35.7% or $426.5 million, from $1.19 billion for the full year of 2024. The average rate for new loan production for 2025 was 7.04% compared with 7.87% for 2024. Payoffs for 2025 were $510.3 million at an average rate of 6.64% compared with $450.2 million at an average rate of 7.34% for 2024.
| | For the Three Months Ended (in thousands) | |
| | Dec 31, | | | Sep 30, | | | Jun 30, | | | Mar 31, | | | Dec 31, | |
| | 2025 | | | 2025 | | | 2025 | | | 2025 | | | 2024 | |
| New Loan Production | | | | | | | | | | | | | | |
| Commercial real estate loans | $ | 125,866 | | | $ | 176,826 | | | $ | 111,993 | | | $ | 146,606 | | | $ | 146,716 | |
| Residential/consumer loans | | 70,268 | | | | 103,247 | | | | 83,761 | | | | 55,000 | | | | 40,225 | |
| Commercial and industrial loans | | 82,079 | | | | 211,454 | | | | 53,444 | | | | 42,344 | | | | 60,159 | |
| SBA loans | | 44,065 | | | | 44,931 | | | | 46,829 | | | | 55,242 | | | | 49,740 | |
| Equipment finance | | 52,521 | | | | 34,315 | | | | 33,567 | | | | 46,749 | | | | 42,168 | |
| Subtotal | | 374,799 | | | | 570,773 | | | | 329,594 | | | | 345,941 | | | | 339,008 | |
| | | | | | | | | | | | | | | |
| | | | | | | | | | | | | | | |
| Payoffs | | (123,086 | ) | | | (142,963 | ) | | | (119,139 | ) | | | (125,102 | ) | | | (137,933 | ) |
| Amortization | | (133,992 | ) | | | (60,939 | ) | | | (151,357 | ) | | | (90,743 | ) | | | (60,583 | ) |
| Loan sales | | (63,642 | ) | | | (100,452 | ) | | | (35,388 | ) | | | (42,193 | ) | | | (67,852 | ) |
| Net line utilization | | (16,072 | ) | | | (39,497 | ) | | | 12,435 | | | | (53,901 | ) | | | (75,651 | ) |
| Charge-offs & OREO | | (2,899 | ) | | | (4,620 | ) | | | (12,377 | ) | | | (3,190 | ) | | | (3,356 | ) |
| | | | | | | | | | | | | | | |
| Loans receivable-beginning balance | | 6,528,259 | | | | 6,305,957 | | | | 6,282,189 | | | | 6,251,377 | | | | 6,257,744 | |
| Loans receivable-ending balance | $ | 6,563,367 | | | $ | 6,528,259 | | | $ | 6,305,957 | | | $ | 6,282,189 | | | $ | 6,251,377 | |
| | | | | | | | | | | | | | | | | | | | |
Deposits were $6.68 billion at the end of the fourth quarter of 2025, a decrease of $89.0 million, or 1.3%, from $6.77 billion at the end of the prior quarter. The change reflects an $84.0 million decrease in demand deposits and a $9.8 million decrease in money market and savings, partially offset by a $4.8 million increase in time deposits. Noninterest-bearing demand deposits represented 30.2% of total deposits at December 31, 2025, compared with 30.8% for the previous quarter and the ratio of average loans to average deposits for the fourth quarter was 96.6%, compared with 94.6% for the previous quarter.
| | As of (in thousands) | | | Percentage Change | |
| | Dec 31, | | | Sep 30, | | | Jun 30, | | | Mar 31, | | | Dec 31, | | | Q4-25 | | | Q4-25 | |
| | 2025 | | | 2025 | | | 2025 | | | 2025 | | | 2024 | | | vs. Q3-25 | | | vs. Q4-24 | |
| Deposit Portfolio | | | | | | | | | | | | | | | | | | | | |
| Demand: noninterest-bearing | $ | 2,015,212 | | | $ | 2,087,132 | | | $ | 2,105,369 | | | $ | 2,066,659 | | | $ | 2,096,634 | | | | -3.4 | % | | | -3.9 | % |
| Demand: interest-bearing | | 74,799 | | | | 86,834 | | | | 90,172 | | | | 80,790 | | | | 80,323 | | | | -13.9 | % | | | -6.9 | % |
| Money market and savings | | 2,084,218 | | | | 2,094,028 | | | | 2,092,847 | | | | 2,073,943 | | | | 1,933,535 | | | | -0.5 | % | | | 7.8 | % |
| Time deposits | | 2,503,421 | | | | 2,498,645 | | | | 2,440,734 | | | | 2,398,083 | | | | 2,325,284 | | | | 0.2 | % | | | 7.7 | % |
| Total deposits | $ | 6,677,650 | | | $ | 6,766,639 | | | $ | 6,729,122 | | | $ | 6,619,475 | | | $ | 6,435,776 | | | | -1.3 | % | | | 3.8 | % |
| | As of | |
| | Dec 31, | | | Sep 30, | | | Jun 30, | | | Mar 31, | | | Dec 31, | |
| | 2025 | | | 2025 | | | 2025 | | | 2025 | | | 2024 | |
| Composition of Deposit Portfolio | | | | | | | | | | | | | | |
| Demand: noninterest-bearing | | 30.2 | % | | | 30.8 | % | | | 31.3 | % | | | 31.2 | % | | | 32.6 | % |
| Demand: interest-bearing | | 1.1 | % | | | 1.3 | % | | | 1.3 | % | | | 1.2 | % | | | 1.2 | % |
| Money market and savings | | 31.2 | % | | | 31.0 | % | | | 31.1 | % | | | 31.3 | % | | | 30.0 | % |
| Time deposits | | 37.5 | % | | | 36.9 | % | | | 36.3 | % | | | 36.3 | % | | | 36.2 | % |
| Total deposits | | 100.0 | % | | | 100.0 | % | | | 100.0 | % | | | 100.0 | % | | | 100.0 | % |
| | | | | | | | | | | | | | | | | | | | |
Stockholders’ equity at December 31, 2025, was $796.4 million, up $16.8 million from $779.6 million at September 30, 2025. The increase included net income, net of dividends paid, of $13.1 million for the fourth quarter. In addition, the increase in stockholders' equity included a $6.5 million decrease in unrealized after-tax losses on securities available for sale due to changes in interest rates during the fourth quarter of 2025. Hanmi also repurchased 73,600 shares of common stock at an average share price of $26.75 with an aggregate cost of $2.0 million during the quarter. At December 31, 2025, 837,202 shares remain under Hanmi’s share repurchase program. Tangible common stockholders’ equity was $785.4 million, or 9.99% of tangible assets at December 31, 2025, compared with $768.5 million, or 9.80% of tangible assets at the end of the prior quarter. Please refer to the Non-GAAP Financial Measures section below for more information.
Hanmi and the Bank exceeded minimum regulatory capital requirements, and the Bank continues to exceed the minimum for the “well capitalized” category. At December 31, 2025, Hanmi’s preliminary common equity tier 1 capital ratio was 12.05% and its total risk-based capital ratio was 15.06%, compared with 12.00% and 15.05%, respectively, at the end of the prior quarter.
| | As of | | | Ratio Change | |
| | Dec 31, | | | Sep 30, | | | Jun 30, | | | Mar 31, | | | Dec 31, | | | Q4-25 | | | Q4-25 | |
| | 2025 | | | 2025 | | | 2025 | | | 2025 | | | 2024 | | | vs. Q3-25 | | | vs. Q4-24 | |
| Regulatory Capital ratios (1) | | | | | | | | | | | | | | | | | | | | |
| Hanmi Financial | | | | | | | | | | | | | | | | | | | | |
| Total risk-based capital | | 15.06 | % | | | 15.05 | % | | | 15.20 | % | | | 15.28 | % | | | 15.24 | % | | | 0.01 | | | | -0.18 | |
| Tier 1 risk-based capital | | 12.37 | % | | | 12.33 | % | | | 12.46 | % | | | 12.46 | % | | | 12.46 | % | | | 0.04 | | | | -0.09 | |
| Common equity tier 1 capital | | 12.05 | % | | | 12.00 | % | | | 12.12 | % | | | 12.12 | % | | | 12.11 | % | | | 0.05 | | | | -0.06 | |
| Tier 1 leverage capital ratio | | 10.70 | % | | | 10.64 | % | | | 10.63 | % | | | 10.67 | % | | | 10.63 | % | | | 0.06 | | | | 0.07 | |
| Hanmi Bank | | | | | | | | | | | | | | | | | | | | |
| Total risk-based capital | | 14.25 | % | | | 14.28 | % | | | 14.39 | % | | | 14.47 | % | | | 14.43 | % | | | -0.03 | | | | -0.18 | |
| Tier 1 risk-based capital | | 13.17 | % | | | 13.20 | % | | | 13.32 | % | | | 13.34 | % | | | 13.36 | % | | | -0.03 | | | | -0.19 | |
| Common equity tier 1 capital | | 13.17 | % | | | 13.20 | % | | | 13.32 | % | | | 13.34 | % | | | 13.36 | % | | | -0.03 | | | | -0.19 | |
| Tier 1 leverage capital ratio | | 11.47 | % | | | 11.46 | % | | | 11.43 | % | | | 11.49 | % | | | 11.47 | % | | | 0.01 | | | | 0.00 | |
| | | | | | | | | | | | | | | | | | | | | |
(1) Preliminary ratios for December 31, 2025
| | | | |
| | | | | |
Asset Quality
Loans 30 to 89 days past due and still accruing were 0.27% of loans at the end of the fourth quarter of 2025, compared with 0.18% at the end of the prior quarter and 0.30% at the end of the prior year.
Criticized loans totaled $97.0 million, or 1.48% of loans at December 31, 2025, up from $45.4 million, or 0.69% of loans at the end of the prior quarter. At December 31, 2024, criticized loans were $165.3 million, or 2.64% of loans. The fourth quarter change included a $54.3 million increase in special mention loans, offset by a $2.7 million decrease in classified loans. The increase in special mention loans was driven by $56.4 million in downgrades of pass-rated loans which included a $55.0 million hospitality loan, offset by $1.9 million in upgrades and $0.2 million in paydowns. The decrease in classified loans included $2.7 million of charge-offs, $2.3 million of paydowns and payoffs, and $0.7 million in upgrades, partially offset by $3.0 million of downgrades into the classified category. Of the $2.7 million in charge-offs, $1.9 million were equipment finance agreements. Of the $3.0 million in downgrades into the classified category, $1.9 million were equipment finance agreements.
Nonperforming loans were $18.1 million, or 0.28% of loans at December 31, 2025, down from $19.4 million, or 0.30% at the end of the prior quarter. At the end of last year, nonperforming loans were 0.23% of loans. The $1.3 million fourth quarter decrease reflected $2.2 million of charge-offs, $1.9 million of payoffs and paydowns, and $0.7 million of loans that were upgraded to performing loans. Of the $2.2 million of charge-offs, $1.9 million were equipment finance agreements. These declines were partially offset by $3.6 million of additions resulting from loans downgraded to non-performing status, of which $1.9 million were equipment financing agreements.
Nonperforming assets were $20.1 million at December 31, 2025, down from $21.4 million at the end of the prior quarter, which reflected the decrease in nonperforming loans. As a percentage of total assets, nonperforming assets were 0.26% at December 31, 2025, 0.27% at September 30, 2025, and 0.19% at December 31, 2024.
Gross charge-offs for the fourth quarter of 2025 were $2.9 million, compared with $2.6 million for the preceding quarter. Charge-offs during the fourth quarter included $2.0 million of equipment finance agreements. Recoveries of previously charged-off loans were $1.3 million in the fourth quarter of 2025, which included a $0.6 million recovery on a previously charged-off commercial line of credit and $0.6 million of recoveries on equipment financing agreements. As a result, there were $1.6 million of net charge-offs for the fourth quarter of 2025, or 0.10% of average loans annualized, compared to net recoveries of $0.5 million, or -0.03% for the prior quarter. For the 2025-year, net charge-offs were 0.23% of average loans compared with 0.07% for the prior year.
The allowance for credit losses was $69.9 million at December 31, 2025, compared with $69.8 million at September 30, 2025. Collectively evaluated allowances increased $1.2 million and specific allowances for loans decreased $1.1 million. The increase in the collectively evaluated allowance was due to an increase in qualitative loss factors. The ratio of the allowance for credit losses to loans was 1.07% at both December 31, 2025, and September 30, 2025. The ratio was 1.12% at year-end 2024.
| | As of or for the Three Months Ended (in thousands) | | | Amount Change | |
| | Dec 31, | | | Sep 30, | | | Jun 30, | | | Mar 31, | | | Dec 31, | | | Q4-25 | | | Q4-25 | |
| | 2025 | | | 2025 | | | 2025 | | | 2025 | | | 2024 | | | vs. Q3-25 | | | vs. Q4-24 | |
| Asset Quality Data and Ratios | | | | | | | | | | | | | | | | | | | | |
| | | | | | | | | | | | | | | | | | | | | |
| Delinquent loans: | | | | | | | | | | | | | | | | | | | | |
| Loans, 30 to 89 days past due and still accruing | $ | 17,610 | | | $ | 11,560 | | | $ | 10,953 | | | $ | 17,312 | | | $ | 18,454 | | | $ | 6,050 | | | $ | (844 | ) |
| Delinquent loans to total loans | | 0.27 | % | | | 0.18 | % | | | 0.17 | % | | | 0.28 | % | | | 0.30 | % | | | 0.09 | | | | (0.03 | ) |
| | | | | | | | | | | | | | | | | | | | | |
| Criticized loans: | | | | | | | | | | | | | | | | | | | | |
| Special mention | $ | 71,113 | | | $ | 16,775 | | | $ | 12,700 | | | $ | 118,380 | | | $ | 139,613 | | | $ | 54,338 | | | $ | (68,500 | ) |
| Classified | | 25,891 | | | | 28,590 | | | | 33,857 | | | | 46,519 | | | | 25,683 | | | | (2,699 | ) | | | 208 | |
| Total criticized loans(1) | $ | 97,004 | | | $ | 45,365 | | | $ | 46,557 | | | $ | 164,899 | | | $ | 165,296 | | | $ | 51,639 | | | $ | (68,292 | ) |
| | | | | | | | | | | | | | | | | | | | | |
| Criticized loans to total loans | | 1.48 | % | | | 0.69 | % | | | 0.74 | % | | | 2.62 | % | | | 2.64 | % | | | 0.79 | | | | (1.16 | ) |
| | | | | | | | | | | | | | | | | | | | | |
| Nonperforming assets: | | | | | | | | | | | | | | | | | | | | |
| Nonaccrual loans | $ | 18,112 | | | $ | 19,369 | | | $ | 25,967 | | | $ | 35,458 | | | $ | 14,272 | | | $ | (1,257 | ) | | $ | 3,840 | |
| Loans 90 days or more past due and still accruing | | - | | | | - | | | | - | | | | 112 | | | | - | | | | - | | | | - | |
| Nonperforming loans | | 18,112 | | | | 19,369 | | | | 25,967 | | | | 35,570 | | | | 14,272 | | | | (1,257 | ) | | | 3,840 | |
| Other real estate owned, net | | 1,980 | | | | 1,995 | | | | - | | | | 117 | | | | 117 | | | | (15 | ) | | | 1,863 | |
| Nonperforming assets(2) | $ | 20,092 | | | $ | 21,364 | | | $ | 25,967 | | | $ | 35,687 | | | $ | 14,389 | | | $ | (1,272 | ) | | $ | 5,703 | |
| | | | | | | | | | | | | | | | | | | | | |
| Nonperforming assets to total assets | | 0.26 | % | | | 0.27 | % | | | 0.33 | % | | | 0.46 | % | | | 0.19 | % | | | -0.01 | | | | 0.07 | |
| Nonperforming loans to total loans | | 0.28 | % | | | 0.30 | % | | | 0.41 | % | | | 0.57 | % | | | 0.23 | % | | | -0.02 | | | | 0.05 | |
| | | | | | | | | | | | | | | | | | | | | |
| (1) Includes nonaccrual loans of $18.1 million, $19.4 million, $24.1 million, $34.4 million, and $13.4 million as of Q4-25, Q3-25, Q2-25, Q1-25, and Q4-24, respectively. | |
| (2) Excludes repossessed personal property of $0.6 million, $0.4 million, $0.6 million, $0.7 million, and $0.6 million as of Q4-25, Q3-25, Q2-25, Q1-25, and Q4-24, respectively. | |
| | As of or for the Three Months Ended (in thousands) | |
| | Dec 31, | | | Sep 30, | | | Jun 30, | | | Mar 31, | | | Dec 31, | |
| | 2025 | | | 2025 | | | 2025 | | | 2025 | | | 2024 | |
| Allowance for credit losses related to loans: | | | | | | | | | | | | | | |
| Balance at beginning of period | $ | 69,781 | | | $ | 66,756 | | | $ | 70,597 | | | $ | 70,147 | | | $ | 69,163 | |
| Credit loss expense (recovery) on loans | | 1,701 | | | | 2,543 | | | | 7,523 | | | | 2,396 | | | | 855 | |
| Net loan (charge-offs) recoveries | | (1,579 | ) | | | 482 | | | | (11,364 | ) | | | (1,946 | ) | | | 129 | |
| Balance at end of period | $ | 69,903 | | | $ | 69,781 | | | $ | 66,756 | | | $ | 70,597 | | | $ | 70,147 | |
| | | | | | | | | | | | | | | |
| Net loan charge-offs (recoveries) to average loans (1) | | 0.10 | % | | | -0.03 | % | | | 0.73 | % | | | 0.13 | % | | | -0.01 | % |
| Allowance for credit losses to loans | | 1.07 | % | | | 1.07 | % | | | 1.06 | % | | | 1.12 | % | | | 1.12 | % |
| | | | | | | | | | | | | | | |
| Allowance for credit losses related to off-balance sheet items: | | | | | | | | | | | | | | |
| Balance at beginning of period | $ | 2,107 | | | $ | 2,506 | | | $ | 2,399 | | | $ | 2,074 | | | $ | 1,984 | |
| Credit loss expense (recovery) on off-balance sheet items | | 242 | | | | (399 | ) | | | 107 | | | | 325 | | | | 90 | |
| Balance at end of period | $ | 2,349 | | | $ | 2,107 | | | $ | 2,506 | | | $ | 2,399 | | | $ | 2,074 | |
| | | | | | | | | | | | | | | |
| Unused commitments to extend credit | $ | 930,122 | | | $ | 952,475 | | | $ | 915,847 | | | $ | 896,282 | | | $ | 782,587 | |
| | | | | | | | | | | | | | | |
(1) Annualized
| | | | |
| | | | | | | | | | | | | | | |
Corporate Developments
On October 24, 2025, Hanmi’s Board of Directors declared a cash dividend on its common stock for the 2025 fourth quarter of $0.27 per share. Hanmi paid the dividend on November 20, 2025, to stockholders of record as of the close of business on November 4, 2025.
Earnings Conference Call
Hanmi Bank will host its fourth quarter 2025 earnings conference call today, January 27, 2026, at 2:00 p.m. PST (5:00 p.m. EST) to discuss these results. This call will also be webcast. To access the call, please dial 1-877-407-9039 before 2:00 p.m. PST, using access code Hanmi Bank. To listen to the call online, either live or archived, please visit Hanmi’s Investor Relations website at https://investors.hanmi.com/ where it will also be available for replay approximately one hour following the call.
About Hanmi Financial Corporation
Headquartered in Los Angeles, California, Hanmi Financial Corporation owns Hanmi Bank, which serves multi-ethnic communities through its network of 32 full-service branches, five loan production offices and three loan centers in California, Texas, Illinois, Virginia, New Jersey, New York, Colorado, Washington, and Georgia. Hanmi Bank specializes in real estate, commercial, SBA and trade finance lending to small and middle market businesses. Additional information is available at www.hanmi.com.
Forward-Looking Statements
This press release contains forward-looking statements, which are included in accordance with the “safe harbor” provisions of the Private Securities Litigation Reform Act of 1995. All statements other than statements of historical fact are “forward–looking statements” for purposes of federal and state securities laws, including, but not limited to, statements about our anticipated future operating and financial performance, financial position and liquidity, business strategies, regulatory and competitive outlook, investment and expenditure plans, capital and financing needs and availability, plans and objectives of management for future operations, developments regarding our capital and strategic plans, and other similar forecasts and statements of expectation and statements of assumption underlying any of the foregoing. In some cases, you can identify forward-looking statements by terminology such as “may,” “will,” “should,” “could,” “expects,” “plans,” “intends,” “anticipates,” “believes,” “estimates,” “predicts,” “potential,” or “continue,” or the negative of such terms and other comparable terminology. Although we believe that our forward-looking statements to be reasonable, we cannot guarantee future results, levels of activity, performance, or achievements.
Forward-looking statements involve known and unknown risks, uncertainties and other factors that may cause our actual results, levels of activity, performance, or achievements to differ from those expressed or implied by the forward-looking statements. These factors include the following:
- a failure to maintain adequate levels of capital and liquidity to support our operations;
- general economic and business conditions internationally, nationally and in those areas in which we operate, including any potential recessionary conditions;
- volatility and deterioration in the credit and equity markets;
- changes in investor sentiment or consumer spending, borrowing and savings habits;
- availability of capital from private and government sources;
- demographic changes;
- competition for loans and deposits and failure to attract or retain loans and deposits;
- inflation and fluctuations in interest rates that reduce our margins and yields, the fair value of financial instruments, the level of loan originations or prepayments on loans we have made and make, the level of loan sales and the cost we pay to retain and attract deposits and secure other types of funding;
- our ability to enter new markets successfully and capitalize on growth opportunities;
- the current or anticipated impact of military conflict, terrorism, or other geopolitical events;
- the effect of potential future supervisory action against us or Hanmi Bank and our ability to address any issues raised in our regulatory exams;
- risks of natural disasters;
- legal proceedings and litigation brought against us;
- a failure in or breach of our operational or security systems or infrastructure, including cyberattacks;
- the failure to maintain current technologies;
- risks associated with Small Business Administration loans;
- failure to attract or retain key employees;
- our ability to access cost-effective funding;
- the imposition of tariffs or other domestic or international governmental policies and any retaliatory responses;
- the impact of a potential federal government shutdown, which may impact on our ability to effect sales of small business administration loans;
- changes in liquidity, including the size and composition of our deposit portfolio and the percentage of uninsured deposits in the portfolio;
- fluctuations in real estate values;
- changes in accounting policies and practices;
- changes in governmental regulation, including, but not limited to, any increase in FDIC insurance premiums and changes in the monetary policies of the U.S. Treasury and the Board of Governors of the Federal Reserve System;
- the ability of Hanmi Bank to make distributions to Hanmi Financial Corporation, which is restricted by certain factors, including Hanmi Bank’s retained earnings, net income, prior distributions made, and certain other financial tests;
- strategic transactions we may enter into, including the costs associated with the evaluation of any strategic opportunities and the overall effects of any acquisitions or dispositions we may make;
- the adequacy of and changes in the economic assumptions and methodology for computing our allowance for credit losses;
- our credit quality and the effect of credit quality on our credit losses expense and allowance for credit losses;
- changes in the financial performance and/or condition of our borrowers and the ability of our borrowers to perform under the terms of their loans and other terms of credit agreements;
- our ability to control expenses; and
- cyber security and fraud risks against our information technology and those of our third-party providers and vendors.
In addition, we set forth certain risks in our reports filed with the U.S. Securities and Exchange Commission, including, Item 1A of our Annual Report on Form 10-K for the year ended December 31, 2024, our Quarterly Reports on Form 10-Q, and Current Reports on Form 8-K that we will file hereafter, which could cause actual results to differ from those projected. We undertake no obligation to update such forward-looking statements except as required by law.
Investor Contacts:
Romolo (Ron) Santarosa
Senior Executive Vice President & Chief Financial Officer
213-427-5636
Lisa Fortuna
Investor Relations
Financial Profiles, Inc.
[email protected]
310-622-8251
| | | | | | | | | | | | | | | |
Hanmi Financial Corporation and Subsidiaries
Consolidated Balance Sheets (Unaudited)
(Dollars in thousands)
|
| | | | | | | | | | | | | | | |
| | December 31, | | | September 30, | | | Percentage | | | December 31, | | | Percentage | |
| | 2025 | | | 2025 | | | Change | | | 2024 | | | Change | |
| Assets | | | | | | | | | | | | | | |
| Cash and due from banks | $ | 212,841 | | | $ | 215,654 | | | | -1.3 | % | | $ | 304,800 | | | | -30.2 | % |
| Securities available for sale, at fair value | | 880,624 | | | | 904,721 | | | | -2.7 | % | | | 905,798 | | | | -2.8 | % |
| Loans held for sale, at the lower of cost or fair value | | 7,403 | | | | 6,512 | | | | 13.7 | % | | | 8,579 | | | | -13.7 | % |
| Loans receivable, net of allowance for credit losses | | 6,493,465 | | | | 6,458,478 | | | | 0.5 | % | | | 6,181,230 | | | | 5.1 | % |
| Accrued interest receivable | | 24,466 | | | | 23,986 | | | | 2.0 | % | | | 22,937 | | | | 6.7 | % |
| Premises and equipment, net | | 20,378 | | | | 20,340 | | | | 0.2 | % | | | 21,404 | | | | -4.8 | % |
| Customers' liability on acceptances | | 125 | | | | 342 | | | | -63.5 | % | | | 1,226 | | | | 89.8 | % |
| Servicing assets | | 6,459 | | | | 6,484 | | | | -0.4 | % | | | 6,457 | | | | 0.0 | % |
| Goodwill and other intangible assets, net | | 11,031 | | | | 11,031 | | | | 0.0 | % | | | 11,031 | | | | 0.0 | % |
| Federal Home Loan Bank ("FHLB") stock, at cost | | 16,385 | | | | 16,385 | | | | 0.0 | % | | | 16,385 | | | | 0.0 | % |
| Bank-owned life insurance | | 56,697 | | | | 56,382 | | | | 0.6 | % | | | 57,168 | | | | -0.8 | % |
| Prepaid expenses and other assets | | 139,311 | | | | 136,416 | | | | 2.1 | % | | | 140,910 | | | | -1.1 | % |
| Total assets | $ | 7,869,185 | | | $ | 7,856,731 | | | | 0.2 | % | | $ | 7,677,925 | | | | 2.5 | % |
| | | | | | | | | | | | | | | |
| Liabilities and Stockholders' Equity | | | | | | | | | | | | | | |
| Liabilities: | | | | | | | | | | | | | | |
| Deposits: | | | | | | | | | | | | | | |
| Noninterest-bearing | $ | 2,015,212 | | | $ | 2,087,132 | | | | -3.4 | % | | $ | 2,096,634 | | | | -3.9 | % |
| Interest-bearing | | 4,662,438 | | | | 4,679,507 | | | | -0.4 | % | | | 4,339,142 | | | | 7.5 | % |
| Total deposits | | 6,677,650 | | | | 6,766,639 | | | | -1.3 | % | | | 6,435,776 | | | | 3.8 | % |
| Accrued interest payable | | 34,783 | | | | 34,219 | | | | 1.6 | % | | | 34,824 | | | | -0.1 | % |
| Bank's liability on acceptances | | 125 | | | | 342 | | | | -63.5 | % | | | 1,226 | | | | 89.8 | % |
| Borrowings | | 150,000 | | | | 62,500 | | | | 140.0 | % | | | 262,500 | | | | -42.9 | % |
| Subordinated debentures | | 130,463 | | | | 130,309 | | | | 0.1 | % | | | 130,638 | | | | -0.1 | % |
| Accrued expenses and other liabilities | | 79,778 | | | | 83,172 | | | | -4.1 | % | | | 80,787 | | | | -1.2 | % |
| Total liabilities | | 7,072,799 | | | | 7,077,181 | | | | -0.1 | % | | | 6,945,751 | | | | 1.8 | % |
| | | | | | | | | | | | | | | |
| Stockholders' equity: | | | | | | | | | | | | | | |
| Common stock | | 34 | | | | 34 | | | | 0.0 | % | | | 34 | | | | 0.0 | % |
| Additional paid-in capital | | 594,667 | | | | 593,768 | | | | 0.2 | % | | | 591,069 | | | | 0.6 | % |
| Accumulated other comprehensive (loss) | | (43,175 | ) | | | (47,959 | ) | | | 10.0 | % | | | (70,723 | ) | | | 39.0 | % |
| Retained earnings | | 394,335 | | | | 381,183 | | | | 3.5 | % | | | 350,869 | | | | 12.4 | % |
| Less treasury stock | | (149,475 | ) | | | (147,476 | ) | | | -1.4 | % | | | (139,075 | ) | | | -7.5 | % |
| Total stockholders' equity | | 796,386 | | | | 779,550 | | | | 2.2 | % | | | 732,174 | | | | 8.8 | % |
| Total liabilities and stockholders' equity | $ | 7,869,185 | | | $ | 7,856,731 | | | | 0.2 | % | | $ | 7,677,925 | | | | 2.5 | % |
| | | | | | | | | | | | | | | |
Hanmi Financial Corporation and Subsidiaries
Consolidated Statements of Income (Unaudited)
(Dollars in thousands, except share and per share data)
| |
| | | |
| | Three Months Ended | |
| | December 31, | | | September 30, | | | Percentage | | | December 31, | | | Percentage | |
| | 2025 | | | 2025 | | | Change | | | 2024 | | | Change | |
| Interest and dividend income: | | | | | | | | | | | | | | |
| Interest and fees on loans receivable | $ | 96,592 | | | $ | 95,691 | | | | 0.9 | % | | $ | 91,545 | | | | 5.5 | % |
| Interest on securities | | 6,323 | | | | 6,592 | | | | -4.1 | % | | | 5,866 | | | | 7.8 | % |
| Dividends on FHLB stock | | 361 | | | | 357 | | | | 1.1 | % | | | 360 | | | | 0.3 | % |
| Interest on deposits in other banks | | 1,837 | | | | 2,586 | | | | -29.0 | % | | | 2,342 | | | | -21.6 | % |
| Total interest and dividend income | | 105,113 | | | | 105,226 | | | | -0.1 | % | | | 100,113 | | | | 5.0 | % |
| Interest expense: | | | | | | | | | | | | | | |
| Interest on deposits | | 39,978 | | | | 42,244 | | | | -5.4 | % | | | 43,406 | | | | -7.9 | % |
| Interest on borrowings | | 695 | | | | 324 | | | | 114.5 | % | | | 1,634 | | | | -57.5 | % |
| Interest on subordinated debentures | | 1,561 | | | | 1,579 | | | | -1.1 | % | | | 1,624 | | | | -3.9 | % |
| Total interest expense | | 42,234 | | | | 44,147 | | | | -4.3 | % | | | 46,664 | | | | -9.5 | % |
| Net interest income before credit loss expense | | 62,879 | | | | 61,079 | | | | 2.9 | % | | | 53,449 | | | | 17.6 | % |
| Credit loss expense | | 1,943 | | | | 2,145 | | | | -9.4 | % | | | 945 | | | | 105.6 | % |
| Net interest income after credit loss expense | | 60,936 | | | | 58,934 | | | | 3.4 | % | | | 52,504 | | | | 16.1 | % |
| Noninterest income: | | | | | | | | | | | | | | |
| Service charges on deposit accounts | | 2,196 | | | | 2,160 | | | | 1.7 | % | | | 2,192 | | | | 0.2 | % |
| Trade finance and other service charges and fees | | 1,735 | | | | 1,551 | | | | 11.9 | % | | | 1,364 | | | | 27.2 | % |
| Gain on sale of Small Business Administration ("SBA") loans | | 1,790 | | | | 1,857 | | | | -3.6 | % | | | 1,443 | | | | 24.0 | % |
| Other operating income | | 2,578 | | | | 4,312 | | | | -40.2 | % | | | 2,358 | | | | 9.3 | % |
| Total noninterest income | | 8,299 | | | | 9,880 | | | | -16.0 | % | | | 7,357 | | | | 12.8 | % |
| Noninterest expense: | | | | | | | | | | | | | | |
| Salaries and employee benefits | | 22,472 | | | | 22,163 | | | | 1.4 | % | | | 20,498 | | | | 9.6 | % |
| Occupancy and equipment | | 4,339 | | | | 4,507 | | | | -3.7 | % | | | 4,503 | | | | -3.6 | % |
| Data processing | | 4,098 | | | | 3,860 | | | | 6.2 | % | | | 3,800 | | | | 7.8 | % |
| Professional fees | | 2,343 | | | | 1,978 | | | | 18.5 | % | | | 1,821 | | | | 28.7 | % |
| Supplies and communications | | 573 | | | | 423 | | | | 35.5 | % | | | 551 | | | | 4.0 | % |
| Advertising and promotion | | 1,010 | | | | 712 | | | | 41.9 | % | | | 821 | | | | 23.0 | % |
| Other operating expenses | | 4,274 | | | | 3,714 | | | | 15.1 | % | | | 2,540 | | | | 68.3 | % |
| Total noninterest expense | | 39,109 | | | | 37,357 | | | | 4.7 | % | | | 34,534 | | | | 13.3 | % |
| Income before tax | | 30,126 | | | | 31,457 | | | | -4.2 | % | | | 25,327 | | | | 18.9 | % |
| Income tax expense | | 8,887 | | | | 9,396 | | | | -5.4 | % | | | 7,632 | | | | 16.4 | % |
| Net income | $ | 21,239 | | | $ | 22,061 | | | | -3.7 | % | | $ | 17,695 | | | | 20.0 | % |
| | | | | | | | | | | | | | | |
| Basic earnings per share: | $ | 0.71 | | | $ | 0.73 | | | | | | $ | 0.59 | | | | |
| Diluted earnings per share: | $ | 0.70 | | | $ | 0.73 | | | | | | $ | 0.58 | | | | |
| | | | | | | | | | | | | | | |
| Weighted-average shares outstanding: | | | | | | | | | | | | | | |
| Basic | | 29,694,534 | | | | 29,830,475 | | | | | | | 29,933,644 | | | | |
| Diluted | | 29,902,375 | | | | 29,880,865 | | | | | | | 30,011,773 | | | | |
| Common shares outstanding | | 29,894,757 | | | | 29,975,371 | | | | | | | 30,195,999 | | | | |
| | | |
Hanmi Financial Corporation and Subsidiaries
Consolidated Statements of Income (Unaudited)
(Dollars in thousands, except share and per share data)
| |
| | | |
| | Twelve Months Ended | |
| | December 31, | | | December 31, | | | Percentage | |
| | 2025 | | | 2024 | | | Change | |
| Interest and dividend income: | | | | | | | | |
| Interest and fees on loans receivable | $ | 375,760 | | | $ | 366,153 | | | | 2.6 | % |
| Interest on securities | | 25,345 | | | | 21,583 | | | | 17.4 | % |
| Dividends on FHLB stock | | 1,433 | | | | 1,436 | | | | -0.2 | % |
| Interest on deposits in other banks | | 8,390 | | | | 9,611 | | | | -12.7 | % |
| Total interest and dividend income | | 410,928 | | | | 398,783 | | | | 3.0 | % |
| Interest expense: | | | | | | | | |
| Interest on deposits | | 164,705 | | | | 182,692 | | | | -9.8 | % |
| Interest on borrowings | | 3,727 | | | | 6,746 | | | | -44.8 | % |
| Interest on subordinated debentures | | 6,306 | | | | 6,571 | | | | -4.0 | % |
| Total interest expense | | 174,738 | | | | 196,009 | | | | -10.9 | % |
| Net interest income before credit loss expense | | 236,190 | | | | 202,774 | | | | 16.5 | % |
| Credit loss expense | | 14,439 | | | | 4,419 | | | | 226.7 | % |
| Net interest income after credit loss expense | | 221,751 | | | | 198,355 | | | | 11.8 | % |
| Noninterest income: | | | | | | | | |
| Service charges on deposit accounts | | 8,742 | | | | 9,381 | | | | -6.8 | % |
| Trade finance and other service charges and fees | | 6,144 | | | | 5,309 | | | | 15.7 | % |
| Gain on sale of Small Business Administration ("SBA") loans | | 7,808 | | | | 6,112 | | | | 27.7 | % |
| Other operating income | | 11,281 | | | | 10,783 | | | | 4.6 | % |
| Total noninterest income | | 33,975 | | | | 31,585 | | | | 7.6 | % |
| Noninterest expense: | | | | | | | | |
| Salaries and employee benefits | | 87,676 | | | | 83,368 | | | | 5.2 | % |
| Occupancy and equipment | | 17,639 | | | | 18,146 | | | | -2.8 | % |
| Data processing | | 15,472 | | | | 14,876 | | | | 4.0 | % |
| Professional fees | | 7,514 | | | | 6,956 | | | | 8.0 | % |
| Supplies and communications | | 2,028 | | | | 2,261 | | | | -10.3 | % |
| Advertising and promotion | | 3,104 | | | | 3,028 | | | | 2.5 | % |
| Other operating expenses | | 14,366 | | | | 12,700 | | | | 13.1 | % |
| Total noninterest expense | | 147,799 | | | | 141,335 | | | | 4.6 | % |
| Income before tax | | 107,927 | | | | 88,605 | | | | 21.8 | % |
| Income tax expense | | 31,838 | | | | 26,404 | | | | 20.6 | % |
| Net income | $ | 76,089 | | | $ | 62,201 | | | | 22.3 | % |
| | | | | | | | | |
| Basic earnings per share: | $ | 2.53 | | | $ | 2.06 | | | | |
| Diluted earnings per share: | $ | 2.51 | | | $ | 2.05 | | | | |
| | | | | | | | | |
| Weighted-average shares outstanding: | | | | | | | | |
| Basic | | 29,852,149 | | | | 30,019,815 | | | | |
| Diluted | | 30,042,274 | | | | 30,102,336 | | | | |
| Common shares outstanding | | 29,894,757 | | | | 30,195,999 | | | | |
| | | |
Hanmi Financial Corporation and Subsidiaries
Average Balance, Average Yield Earned, and Average Rate Paid (Unaudited)
(Dollars in thousands)
| |
| | | |
| | Three Months Ended | |
| | December 31, 2025 | | | September 30, 2025 | | | December 31, 2024 | |
| | | | | Interest | | Average | | | | | | Interest | | Average | | | | | | Interest | | Average | |
| | Average | | | Income / | | Yield / | | | Average | | | Income / | | Yield / | | | Average | | | Income / | | Yield / | |
| | Balance | | | Expense | | Rate | | | Balance | | | Expense | | Rate | | | Balance | | | Expense | | Rate | |
| Assets | | | | | | | | | | | | | | | | | | | | | | | |
| Interest-earning assets: | | | | | | | | | | | | | | | | | | | | | | | |
| Loans: | | | | | | | | | | | | | | | | | | | | | | | |
| Commercial real estate (1) | $ | 4,004,348 | | | $ | 57,774 | | | 5.72 | % | | $ | 3,934,477 | | | $ | 56,908 | | | 5.74 | % | | $ | 3,882,407 | | | $ | 55,613 | | | 5.70 | % |
| Residential mortgage | | 1,043,250 | | | | 14,134 | | | 5.38 | % | | | 1,020,889 | | | | 13,812 | | | 5.37 | % | | | 936,635 | | | | 12,279 | | | 5.22 | % |
| Commercial and industrial (1) | | 990,279 | | | | 17,467 | | | 7.00 | % | | | 904,019 | | | | 17,593 | | | 7.72 | % | | | 777,738 | | | | 15,653 | | | 8.01 | % |
| Consumer | | 5,508 | | | | 87 | | | 6.29 | % | | | 8,323 | | | | 156 | | | 7.43 | % | | | 5,894 | | | | 104 | | | 7.02 | % |
| Equipment finance | | 412,854 | | | | 7,130 | | | 6.91 | % | | | 436,727 | | | | 7,222 | | | 6.61 | % | | | 500,590 | | | | 7,896 | | | 6.31 | % |
| Loans receivable (1) | | 6,456,239 | | | | 96,592 | | | 5.94 | % | | | 6,304,435 | | | | 95,691 | | | 6.03 | % | | | 6,103,264 | | | | 91,545 | | | 5.97 | % |
| Securities (2) | | 955,811 | | | | 6,323 | | | 2.67 | % | | | 985,888 | | | | 6,592 | | | 2.70 | % | | | 998,313 | | | | 5,866 | | | 2.38 | % |
| FHLB stock | | 16,385 | | | | 362 | | | 8.75 | % | | | 16,385 | | | | 358 | | | 8.65 | % | | | 16,385 | | | | 360 | | | 8.75 | % |
| Interest-bearing deposits in other banks | | 191,731 | | | | 1,836 | | | 3.80 | % | | | 239,993 | | | | 2,585 | | | 4.27 | % | | | 204,408 | | | | 2,342 | | | 4.56 | % |
| Total interest-earning assets | | 7,620,166 | | | | 105,113 | | | 5.48 | % | | | 7,546,701 | | | | 105,226 | | | 5.54 | % | | | 7,322,370 | | | | 100,113 | | | 5.45 | % |
| | | | | | | | | | | | | | | | | | | | | | | | |
| Noninterest-earning assets: | | | | | | | | | | | | | | | | | | | | | | | |
| Cash and due from banks | | 54,651 | | | | | | | | | 53,144 | | | | | | | | | 54,678 | | | | | | |
| Allowance for credit losses | | (69,786 | ) | | | | | | | | (67,851 | ) | | | | | | | | (69,291 | ) | | | | | |
| Other assets | | 247,808 | | | | | | | | | 252,039 | | | | | | | | | 246,744 | | | | | | |
| | | | | | | | | | | | | | | | | | | | | | | | |
| Total assets | $ | 7,852,839 | | | | | | | | $ | 7,784,033 | | | | | | | | $ | 7,554,501 | | | | | | |
| | | | | | | | | | | | | | | | | | | | | | | | |
| Liabilities and Stockholders' Equity | | | | | | | | | | | | | | | | | | | | | | | |
| Interest-bearing liabilities: | | | | | | | | | | | | | | | | | | | | | | | |
| Deposits: | | | | | | | | | | | | | | | | | | | | | | | |
| Demand: interest-bearing | $ | 77,297 | | | $ | 30 | | | 0.15 | % | | $ | 86,839 | | | $ | 38 | | | 0.17 | % | | $ | 79,784 | | | $ | 26 | | | 0.13 | % |
| Money market and savings | | 2,130,616 | | | | 15,130 | | | 2.82 | % | | | 2,122,967 | | | | 17,238 | | | 3.22 | % | | | 1,934,540 | | | | 16,564 | | | 3.41 | % |
| Time deposits | | 2,506,582 | | | | 24,818 | | | 3.93 | % | | | 2,494,285 | | | | 24,968 | | | 3.97 | % | | | 2,346,363 | | | | 26,816 | | | 4.55 | % |
| Total interest-bearing deposits | | 4,714,495 | | | | 39,978 | | | 3.36 | % | | | 4,704,091 | | | | 42,244 | | | 3.56 | % | | | 4,360,687 | | | | 43,406 | | | 3.96 | % |
| Borrowings | | 64,565 | | | | 695 | | | 4.27 | % | | | 27,772 | | | | 324 | | | 4.63 | % | | | 141,604 | | | | 1,634 | | | 4.59 | % |
| Subordinated debentures | | 130,385 | | | | 1,561 | | | 4.79 | % | | | 130,766 | | | | 1,579 | | | 4.83 | % | | | 130,567 | | | | 1,624 | | | 4.97 | % |
| Total interest-bearing liabilities | | 4,909,445 | | | | 42,234 | | | 3.41 | % | | | 4,862,629 | | | | 44,147 | | | 3.60 | % | | | 4,632,858 | | | | 46,664 | | | 4.01 | % |
| | | | | | | | | | | | | | | | | | | | | | | | |
| Noninterest-bearing liabilities and equity: | | | | | | | | | | | | | | | | | | | | | | | |
| Demand deposits: noninterest-bearing | | 1,969,908 | | | | | | | | | 1,960,331 | | | | | | | | | 1,967,789 | | | | | | |
| Other liabilities | | 142,754 | | | | | | | | | 142,592 | | | | | | | | | 162,064 | | | | | | |
| Stockholders' equity | | 830,732 | | | | | | | | | 818,481 | | | | | | | | | 791,790 | | | | | | |
| | | | | | | | | | | | | | | | | | | | | | | | |
| Total liabilities and stockholders' equity | $ | 7,852,839 | | | | | | | | $ | 7,784,033 | | | | | | | | $ | 7,554,501 | | | | | | |
| | | | | | | | | | | | | | | | | | | | | | | | |
| Net interest income | | | | $ | 62,879 | | | | | | | | $ | 61,079 | | | | | | | | $ | 53,449 | | | |
| | | | | | | | | | | | | | | | | | | | | | | | |
| Cost of deposits | | | | | | | 2.37 | % | | | | | | | | 2.51 | % | | | | | | | | 2.73 | % |
| Net interest spread (taxable equivalent basis) | | | | | | | 2.07 | % | | | | | | | | 1.94 | % | | | | | | | | 1.44 | % |
| Net interest margin (taxable equivalent basis) | | | | | | | 3.28 | % | | | | | | | | 3.22 | % | | | | | | | | 2.91 | % |
| | | | | | | | | | | | | | | | | | | | | | | | |
| | | | | | | | | | | | | | | | | | | | | | | | |
| | | | | | | | | | | | | | | | | | | | | | | | |
| (1) Includes average loans held for sale | | | |
| (2) Yields calculated on a fully taxable equivalent basis using the federal tax rate in effect for the periods presented. | | | |
| | |
Hanmi Financial Corporation and Subsidiaries
Average Balance, Average Yield Earned, and Average Rate Paid (Unaudited)
(Dollars in thousands)
| |
| | |
| | Twelve Months Ended | |
| | December 31, 2025 | | | December 31, 2024 | |
| | | | | Interest | | Average | | | | | | Interest | | Average | |
| | Average | | | Income / | | Yield / | | | Average | | | Income / | | Yield / | |
| | Balance | | | Expense | | Rate | | | Balance | | | Expense | | Rate | |
| Assets | | | | | | | | | | | | | | | |
| Interest-earning assets: | | | | | | | | | | | | | | | |
| Loans: | | | | | | | | | | | | | | | |
| Commercial real estate (1) | $ | 3,963,919 | | | $ | 225,929 | | | 5.70 | % | | $ | 3,874,291 | | | $ | 219,899 | | | 5.68 | % |
| Residential mortgage | | 1,004,057 | | | | 53,950 | | | 5.37 | % | | | 952,709 | | | | 49,344 | | | 5.18 | % |
| Commercial and industrial (1) | | 878,181 | | | | 65,518 | | | 7.46 | % | | | 741,568 | | | | 63,651 | | | 8.58 | % |
| Consumer | | 7,127 | | | | 501 | | | 7.03 | % | | | 6,509 | | | | 486 | | | 7.46 | % |
| Equipment finance | | 449,440 | | | | 29,862 | | | 6.64 | % | | | 535,636 | | | | 32,773 | | | 6.12 | % |
| Loans receivable (1) | | 6,302,724 | | | | 375,760 | | | 5.96 | % | | | 6,110,713 | | | | 366,153 | | | 5.99 | % |
| Securities (2) | | 984,172 | | | | 25,345 | | | 2.60 | % | | | 983,434 | | | | 21,583 | | | 2.22 | % |
| FHLB stock | | 16,385 | | | | 1,433 | | | 8.74 | % | | | 16,385 | | | | 1,437 | | | 8.76 | % |
| Interest-bearing deposits in other banks | | 202,152 | | | | 8,390 | | | 4.15 | % | | | 192,342 | | | | 9,610 | | | 5.00 | % |
| Total interest-earning assets | | 7,505,433 | | | | 410,928 | | | 5.48 | % | | | 7,302,874 | | | | 398,783 | | | 5.46 | % |
| | | | | | | | | | | | | | | | |
| Noninterest-earning assets: | | | | | | | | | | | | | | | |
| Cash and due from banks | | 53,861 | | | | | | | | | 55,830 | | | | | | |
| Allowance for credit losses | | (69,373 | ) | | | | | | | | (68,553 | ) | | | | | |
| Other assets | | 249,812 | | | | | | | | | 248,820 | | | | | | |
| | | | | | | | | | | | | | | | |
| Total assets | $ | 7,739,733 | | | | | | | | $ | 7,538,971 | | | | | | |
| | | | | | | | | | | | | | | | |
| Liabilities and Stockholders' Equity | | | | | | | | | | | | | | | |
| Interest-bearing liabilities: | | | | | | | | | | | | | | | |
| Deposits: | | | | | | | | | | | | | | | |
| Demand: interest-bearing | $ | 81,213 | | | $ | 124 | | | 0.15 | % | | $ | 83,807 | | | $ | 119 | | | 0.14 | % |
| Money market and savings | | 2,100,326 | | | | 66,147 | | | 3.15 | % | | | 1,870,541 | | | | 68,304 | | | 3.65 | % |
| Time deposits | | 2,445,794 | | | | 98,434 | | | 4.02 | % | | | 2,433,516 | | | | 114,269 | | | 4.70 | % |
| Total interest-bearing deposits | | 4,627,333 | | | | 164,705 | | | 3.56 | % | | | 4,387,864 | | | | 182,692 | | | 4.16 | % |
| Borrowings | | 82,512 | | | | 3,727 | | | 4.52 | % | | | 154,193 | | | | 6,746 | | | 4.38 | % |
| Subordinated debentures | | 130,687 | | | | 6,306 | | | 4.83 | % | | | 130,325 | | | | 6,571 | | | 5.04 | % |
| Total interest-bearing liabilities | | 4,840,532 | | | | 174,738 | | | 3.61 | % | | | 4,672,382 | | | | 196,009 | | | 4.20 | % |
| | | | | | | | | | | | | | | | |
| Noninterest-bearing liabilities and equity: | | | | | | | | | | | | | | | |
| Demand deposits: noninterest-bearing | | 1,940,552 | | | | | | | | | 1,920,492 | | | | | | |
| Other liabilities | | 142,508 | | | | | | | | | 165,288 | | | | | | |
| Stockholders' equity | | 816,141 | | | | | | | | | 780,809 | | | | | | |
| | | | | | | | | | | | | | | | |
| Total liabilities and stockholders' equity | $ | 7,739,733 | | | | | | | | $ | 7,538,971 | | | | | | |
| | | | | | | | | | | | | | | | |
| Net interest income | | | | $ | 236,190 | | | | | | | | $ | 202,774 | | | |
| | | | | | | | | | | | | | | | |
| Cost of deposits | | | | | | | 2.51 | % | | | | | | | | 2.90 | % |
| Net interest spread (taxable equivalent basis) | | | | | | | 1.87 | % | | | | | | | | 1.27 | % |
| Net interest margin (taxable equivalent basis) | | | | | | | 3.15 | % | | | | | | | | 2.78 | % |
| | | | | | | | | | | | | | | | |
| | | | | | | | | | | | | | | | |
| (1) Includes average loans held for sale | | | | | | | | | | | | | | | |
| (2) Yields calculated on a fully taxable equivalent basis using the federal tax rate in effect for the periods presented. | |
| | |
Non-GAAP Financial Measures
These disclosures should not be viewed as a substitute for results determined in accordance with GAAP, nor is it necessarily comparable to non-GAAP performance measures that may be presented by other companies.
Tangible Common Equity to Tangible Assets Ratio
Tangible common equity to tangible assets ratio is supplemental financial information determined by a method other than in accordance with U.S. generally accepted accounting principles (“GAAP”). This non-GAAP measure is used by management in the analysis of Hanmi’s capital strength. Tangible common equity is calculated by subtracting goodwill and other intangible assets from stockholders’ equity. Banking and financial institution regulators also exclude goodwill and other intangible assets from stockholders’ equity when assessing the capital adequacy of a financial institution. Management believes the presentation of this financial measure excluding the impact of these items provides useful supplemental information that is essential to a proper understanding of the capital strength of Hanmi.
The following table reconciles this non-GAAP performance measure to the GAAP performance measure for the periods indicated:
| | | | | | | | | | | | | | | |
Tangible Common Equity to Tangible Assets Ratio (Unaudited)
(In thousands, except share, per share data and ratios)
| |
| | | | | | | | | | | | | | | |
Hanmi Financial Corporation and Subsidiaries
| December 31, | | | September 30, | | | June 30, | | | March 31, | | | December 31, | |
| 2025 | | | 2025 | | | 2025 | | | 2025 | | | 2024 | |
| Assets | $ | 7,869,185 | | | $ | 7,856,731 | | | $ | 7,862,363 | | | $ | 7,729,035 | | | $ | 7,677,925 | |
| Less goodwill and other intangible assets | | (11,031 | ) | | | (11,031 | ) | | | (11,031 | ) | | | (11,031 | ) | | | (11,031 | ) |
| Tangible assets | $ | 7,858,154 | | | $ | 7,845,700 | | | $ | 7,851,332 | | | $ | 7,718,004 | | | $ | 7,666,894 | |
| | | | | | | | | | | | | | | |
| Stockholders' equity (1) | $ | 796,386 | | | $ | 779,550 | | | $ | 762,834 | | | $ | 751,485 | | | $ | 732,174 | |
| Less goodwill and other intangible assets | | (11,031 | ) | | | (11,031 | ) | | | (11,031 | ) | | | (11,031 | ) | | | (11,031 | ) |
| Tangible stockholders' equity (1) | $ | 785,355 | | | $ | 768,519 | | | $ | 751,803 | | | $ | 740,454 | | | $ | 721,143 | |
| | | | | | | | | | | | | | | |
| Stockholders' equity to assets | | 10.12 | % | | | 9.92 | % | | | 9.70 | % | | | 9.72 | % | | | 9.54 | % |
| Tangible common equity to tangible assets (1) | | 9.99 | % | | | 9.80 | % | | | 9.58 | % | | | 9.59 | % | | | 9.41 | % |
| | | | | | | | | | | | | | | |
| Common shares outstanding | | 29,894,757 | | | | 29,975,371 | | | | 30,176,568 | | | | 30,233,514 | | | | 30,195,999 | |
| Tangible common equity per common share | $ | 26.27 | | | $ | 25.64 | | | $ | 24.91 | | | $ | 24.49 | | | $ | 23.88 | |
| | | | | | | | | | | | | | | |
| | | | | | | | | | | | | | | |
| (1) There were no preferred shares outstanding at the periods indicated. | | | | |
| | | | | |
Preprovision Net Revenue
Preprovision net revenue is supplemental financial information determined by a method other than in accordance with U.S. GAAP. This non-GAAP measure is used by management to measure Hanmi’s core operational performance, excluding the impact of provisions for loan losses. By isolating preprovision net revenue, management can better understand the Company’s profitability and make more informed strategic decisions. Preprovision net revenue is calculated adding income tax expense and credit loss expense to net income. Management believes this financial measure highlights the Company's net revenue activities and operational efficiency, excluding unpredictable credit loss expense.
The following table details the Company's preprovision net revenues, which are non-GAAP measures, for the periods indicated:
| | | | | | | | | | | | | | | | | | |
Preprovision Net Revenue (Unaudited)
(In thousands, except percentages)
| |
| | | | | | | | | | | | | | | | | | |
| | | | | | | | | | | | | | | | | Percentage Change | |
Hanmi Financial Corporation and Subsidiaries
| December 31, | | | September 30, | | | June 30, | | | March 31, | | | December 31, | | | Q4-25 | | | Q4-25 | |
| 2025 | | | 2025 | | | 2025 | | | 2025 | | | 2024 | | | vs. Q3-25 | | | vs. Q4-24 | |
| Net income | $ | 21,239 | | | $ | 22,061 | | | $ | 15,117 | | | $ | 17,672 | | | $ | 17,695 | | | | | | | |
| Add back: | | | | | | | | | | | | | | | | | | | | |
| Credit loss expense | | 1,943 | | | | 2,145 | | | | 7,631 | | | | 2,721 | | | | 945 | | | | | | | |
| Income tax expense | | 8,887 | | | | 9,396 | | | | 6,115 | | | | 7,441 | | | | 7,632 | | | | | | | |
| Preprovision net revenue | $ | 32,069 | | | $ | 33,602 | | | $ | 28,863 | | | $ | 27,834 | | | $ | 26,272 | | | | -4.6 | % | | | 22.1 | % |
Exhibit 99.2

California | Colorado | Georgia | Illinois | New Jersey | New York | Texas | Virginia | Washington 4 Q 2 5 Ea rning s S u pp l e m en ta l Pre s en tat i o n January 27, 2026 NASDAQ | HAFC
2 TABLE OF CONTENTS 4Q25 PERFORMANCE RESULTS 5 – 21 LOAN PORTFOLIO DETAILS 22 – 31 4Q25 FINANCIAL SUMMARY 32 – 32 NON - GAAP RECONCILIATION 33 – 34
3 FORWARD - LOOKING STATEMENTS Hanmi Financial Corporation (the “Company”) cautions investors that any statements contained herein that are not historical facts are forward - looking statements within the meaning of the “safe harbor” provisions of the Private Securities Litigation Reform Act of 1995 , including, but not limited to, those statements regarding operating performance, financial position and liquidity, business strategies, regulatory, economic and competitive outlook, investment and expenditure plans, capital and financing needs and availability, litigation, plans and objectives, merger or sale activity, and all other forecasts and statements of expectation or assumption underlying any of the foregoing . These statements involve known and unknown risks and uncertainties that are difficult to predict . Investors should not rely on any forward - looking statement and should consider risks, such as changes in governmental policy, legislation and regulations, changes in monetary policy, economic uncertainty and changes in economic conditions, potential recessionary conditions, inflation, the effect of the imposition of tariffs and any retaliatory responses, the impact of a potential federal government shutdown, including our ability to effect sales of small business administration loans, fluctuations in interest rate and credit risk, competitive pressures, our ability to access cost - effective funding, the ability to enter into new markets successfully and capitalize on growth opportunities, balance sheet management, liquidity and sources of funding, the size and composition of our deposit portfolio, including the percentage of uninsured deposits in the portfolio, increased assessments by the Federal Deposit Insurance Corporation, risk and effect of natural disasters, a failure in or breach of our operational or security systems or infrastructure, including cyberattacks, the adequacy of and changes in the economic estimates and methodology of calculating our allowance for credit losses, and other operational factors . Forward - looking statements are based upon the good faith beliefs and expectations of management as of this date only and are further subject to additional risks and uncertainties, including, but not limited to, the risk factors set forth in our earnings release dated January 27 , 2026 , including the section titled “Forward Looking Statements” and the Company’s most recent Form 10 - K, 10 - Q and other filings with the Securities and Exchange Commission . The Company disclaims any obligation to update or revise the forward - looking statements herein .
4 NON - GAAP FINANCIAL INFORMATION This presentation contains financial information determined by methods other than in accordance with accounting principles generally accepted in the United States of America (“GAAP”) . These non - GAAP measures include tangible common equity to tangible assets, tangible common equity per share (including without the impact of available for sale securities on the accumulated other comprehensive income) and pro forma regulatory capital . Management uses these “non - GAAP” measures in its analysis of the Company’s performance . Management believes these non - GAAP financial measures allow for better comparability of period to period operating performance . Additionally, the Company believes this information is utilized by regulators and market analysts to evaluate a company’s financial condition and therefore, such information is useful to investors . These disclosures should not be viewed as a substitute for operating results determined in accordance with GAAP, nor are they necessarily comparable to non - GAAP performance measures that may be presented by other companies . A reconciliation of the non - GAAP measures used in this presentation to the most directly comparable GAAP measures is provided in the Appendix to this presentation .
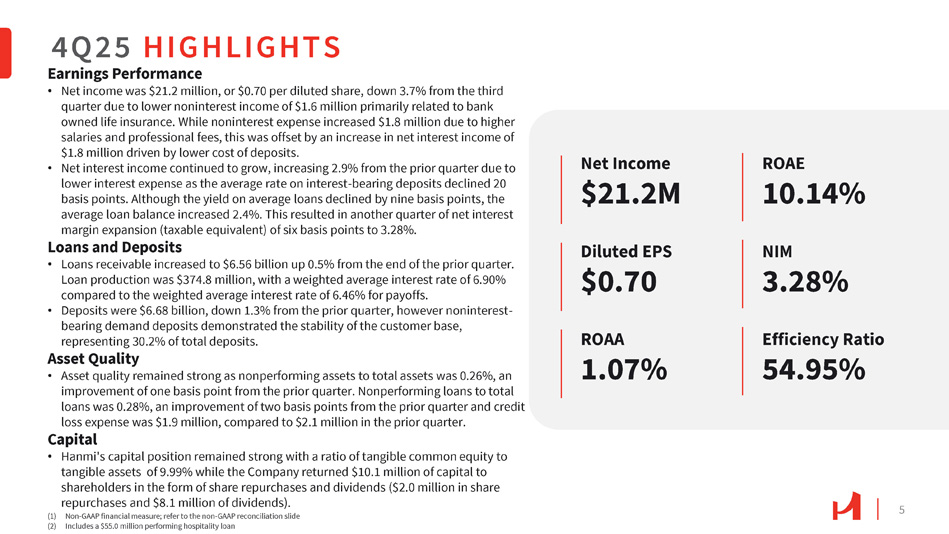
5 Net Income $21.2M Diluted EPS $0.70 ROAA 1.07% ROAE 10.14% NIM 3.28% Efficiency Ratio 54.95% Earnings Performance • Net income was $21.2 million, or $0.70 per diluted share, down 3.7% from the third quarter due to lower noninterest income of $1.6 million primarily related to bank owned life insurance. While noninterest expense increased $1.8 million due to higher salaries and professional fees, this was offset by an increase in net interest income of $1.8 million driven by lower cost of deposits. • Net interest income continued to grow, increasing 2.9% from the prior quarter due to lower interest expense as the average rate on interest - bearing deposits declined 20 basis points. Although the yield on average loans declined by nine basis points, the average loan balance increased 2.4%. This resulted in another quarter of net interest margin expansion (taxable equivalent) of six basis points to 3.28%. Loans and Deposits • Loans receivable increased to $6.56 billion up 0.5% from the end of the prior quarter. Loan production was $374.8 million, with a weighted average interest rate of 6.90% compared to the weighted average interest rate of 6.46% for payoffs. • Deposits were $6.68 billion, down 1.3% from the prior quarter, however noninterest - bearing demand deposits demonstrated the stability of the customer base, representing 30.2% of total deposits. Asset Quality • Asset quality remained strong as nonperforming assets to total assets was 0.26%, an improvement of one basis point from the prior quarter. Nonperforming loans to total loans was 0.28%, an improvement of two basis points from the prior quarter and credit loss expense was $1.9 million, compared to $2.1 million in the prior quarter. Capital • Hanmi's capital position remained strong with a ratio of tangible common equity to tangible assets of 9.99% while the Company returned $10.1 million of capital to shareholders in the form of share repurchases and dividends ($2.0 million in share repurchases and $8.1 million of dividends). (1) Non - GAAP financial measure; refer to the non - GAAP reconciliation slide (2) Includes a $55.0 million performing hospitality loan 4Q25 HIGHLIGHTS
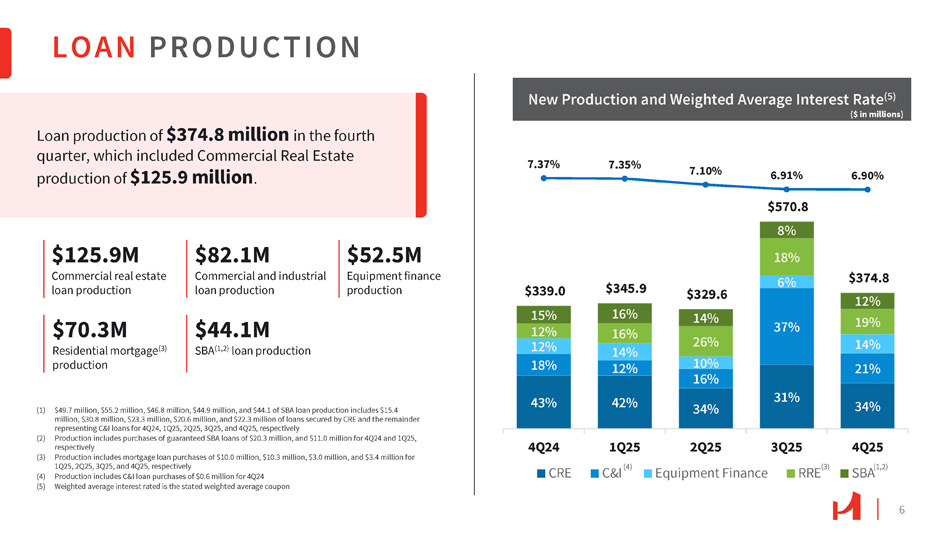
LOAN PRODUCTION 6 Loan production of $374.8 million in the fourth quarter, which included Commercial Real Estate production of $125.9 million . (1) $49.7 million, $55.2 million, $46.8 million, $44.9 million, and $44.1 of SBA loan production includes $15.4 million, $30.8 million, $23.3 million, $20.6 million, and $22.3 million of loans secured by CRE and the remainder representing C&I loans for 4Q24, 1Q25, 2Q25, 3Q25, and 4Q25, respectively (2) Production includes purchases of guaranteed SBA loans of $20.3 million, and $11.0 million for 4Q24 and 1Q25, respectively (3) Production includes mortgage loan purchases of $10.0 million, $10.3 million, $3.0 million, and $3.4 million for 1Q25, 2Q25, 3Q25, and 4Q25, respectively (4) Production includes C&I loan purchases of $0.6 million for 4Q24 (5) Weighted average interest rated is the stated weighted average coupon $125.9M Commercial real estate loan production $82.1M Commercial and industrial loan production $52.5M Equipment finance production $70.3M Residential mortgage (3) production $44.1M SBA (1,2) loan production 43% 42% 31% 34% 37% 6% $339.0 15% 12% 12% 18% $345.9 16% 16% 14% 12% $329.6 14% 26% 10% 16% 34% $570.8 8% 18% $374.8 12% 19% 14% 21% 7.37% 7.35% 7.10% 6.91% 6.90% 1Q25 C&I (4) 4Q25 SBA (1,2) 4Q24 CRE 2Q25 Equipment Finance 3Q25 RRE (3) New Production and Weighted Average Interest Rate (5) ($ in millions)
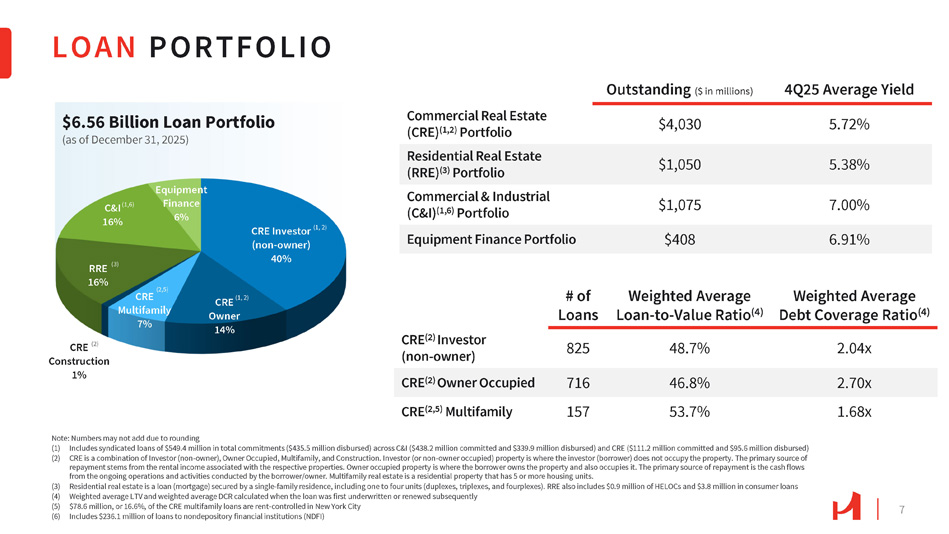
CRE Multifamily 7% 16% Equipment Finance 6% CRE (2) Construction 1% (2,5) CRE (1, 2) Owner 14% CRE Investor (1, 2) (non - owner) 40% RRE (3) C&I (1,6) 16% $6.56 Billion Loan Portfolio (as of December 31, 2025) LOAN PORTFOLIO 7 Note: Numbers may not add due to rounding (1) Includes syndicated loans of $549.4 million in total commitments ($435.5 million disbursed) across C&I ($438.2 million committed and $339.9 million disbursed) and CRE ($111.2 million committed and $95.6 million disbursed) (2) CRE is a combination of Investor (non - owner), Owner Occupied, Multifamily, and Construction. Investor (or non - owner occupied) property is where the investor (borrower) does not occupy the property. The primary source of repayment stems from the rental income associated with the respective properties. Owner occupied property is where the borrower owns the property and also occupies it. The primary source of repayment is the cash flows from the ongoing operations and activities conducted by the borrower/owner. Multifamily real estate is a residential property that has 5 or more housing units. (3) Residential real estate is a loan (mortgage) secured by a single - family residence, including one to four units (duplexes, triplexes, and fourplexes). RRE also includes $0.9 million of HELOCs and $3.8 million in consumer loans (4) Weighted average LTV and weighted average DCR calculated when the loan was first underwritten or renewed subsequently (5) $78.6 million, or 16.6%, of the CRE multifamily loans are rent - controlled in New York City (6) Includes $236.1 million of loans to nondepository financial institutions (NDFI) 4Q25 Average Yield Outstanding ($ in millions) 5.72% $4,030 Commercial Real Estate (CRE) (1,2) Portfolio 5.38% $1,050 Residential Real Estate (RRE) (3) Portfolio 7.00% $1,075 Commercial & Industrial (C&I) (1,6) Portfolio 6.91% $408 Equipment Finance Portfolio Weighted Average Debt Coverage Ratio (4) Weighted Average Loan - to - Value Ratio (4) # of Loans 2.04x 48.7% 825 CRE (2) Investor (non - owner) 2.70x 46.8% 716 CRE (2) Owner Occupied 1.68x 53.7% 157 CRE (2,5) Multifamily
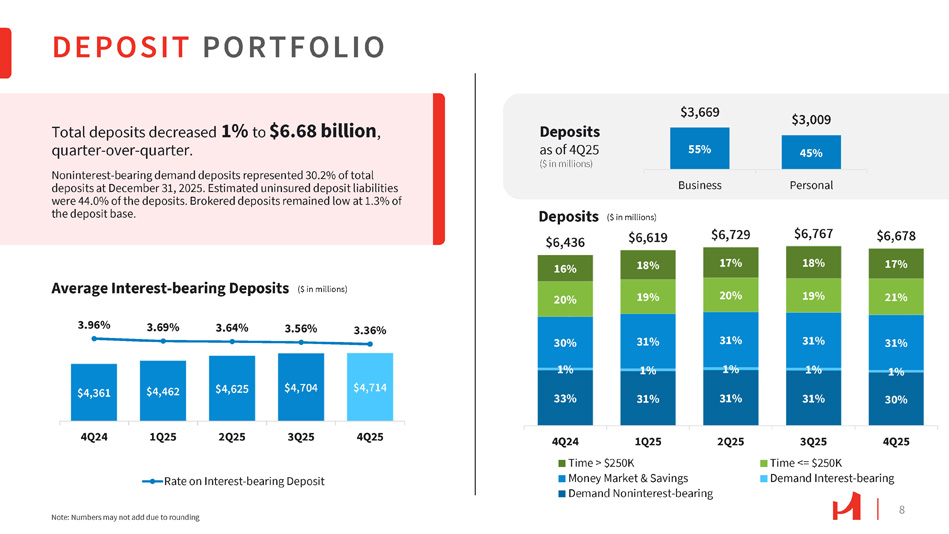
$4,361 $4,462 $4,625 $4,704 $4,714 3.96% 3.69% 3.64% 3.56% 3.36% 4Q24 1Q25 2Q25 3Q25 4Q25 Rate on Interest - bearing Deposit Average Interest - bearing Deposits DEPOSIT PORTFOLIO Total deposits decreased 1% to $6.68 billion , quarter - over - quarter. Noninterest - bearing demand deposits represented 30.2% of total deposits at December 31, 2025. Estimated uninsured deposit liabilities were 44.0% of the deposits. Brokered deposits remained low at 1.3% of the deposit base. Note: Numbers may not add due to rounding 20% Deposits $6,436 16% $6,678 $6,767 $6,729 $6,619 17% 18% 17% 18% 21% 19% 20% 19% 31% 31% 31% 31% 30% 1% 1% 1% 1% 1% 30% 31% 31% 31% 33% 4Q25 3Q25 Time <= $250K 2Q25 1Q25 4Q24 Time > $250K Demand Interest - bearing Money Market & Savings Demand Noninterest - bearing ($ in millions) Deposits as of 4Q25 ($ in millions) 55% 45% $3,669 $3,009 Business Personal 8 ($ in millions)
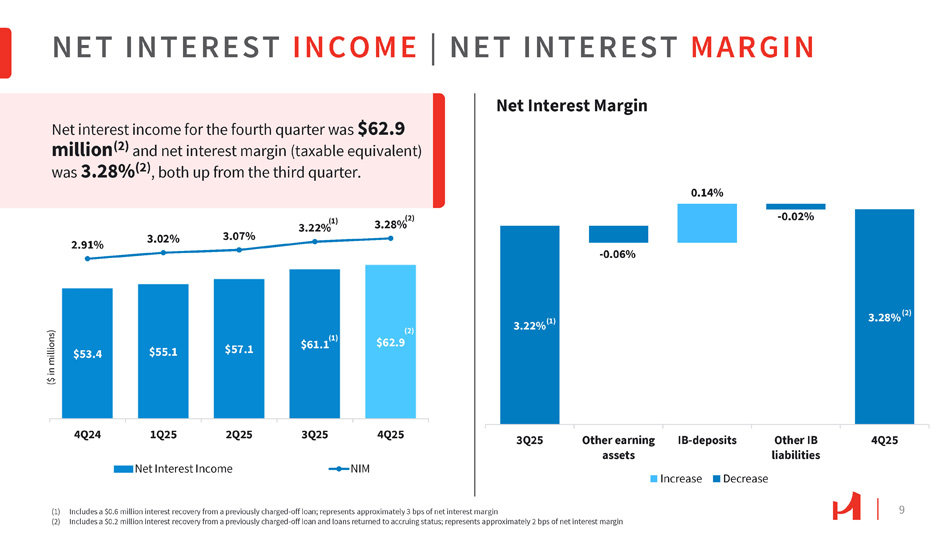
9 $53.4 $55.1 $57.1 2.91% 3.02% 3.07% 3.22% (1) 3.28% (2) 4Q24 1Q25 2Q25 Net Interest Income 3Q25 4Q25 NIM NET INTEREST INCOME | NET INTEREST MARGIN ($ in millions) $61.1 (1) (2) $62.9 3.22% (1) 3.28% (2) 0.14% - 0.06% - 0.02% 3Q25 Other earning assets IB - deposits Other IB liabilities 4Q25 Increase Decrease Net interest income for the fourth quarter was $62.9 million (2) and net interest margin (taxable equivalent) was 3.28% (2) , both up from the third quarter. Net Interest Margin (1) Includes a $0.6 million interest recovery from a previously charged - off loan; represents approximately 3 bps of net interest margin (2) Includes a $0.2 million interest recovery from a previously charged - off loan and loans returned to accruing status; represents approximately 2 bps of net interest margin
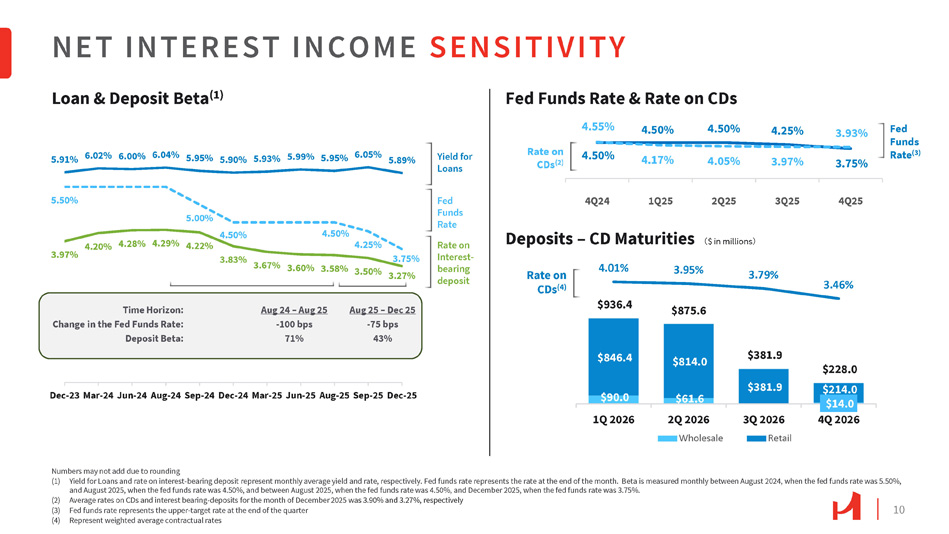
10 5.91% 6.02% 6.00% 6.04% 5.95% 5.90% 5.93% 5.99% 5.95% 6.05% 5.89% 3.97% 4.20% 3.83% 3.67% 3.60% 3.58% 3.50% 5.50% 5.00% 4.50% 4.28% 4.29% 4.22% 4.50% 4.25% 3.75% 3.27% Dec - 23 Mar - 24 Jun - 24 Aug - 24 Sep - 24 Dec - 24 Mar - 25 Jun - 25 Aug - 25 Sep - 25 Dec - 25 NET INTEREST INCOME SENSITIVITY $90.0 $61.6 $14.0 $846.4 $814.0 $381.9 $936.4 $875.6 $381.9 $228.0 $214.0 4.01% 3.95% 3.46% Rate on 3.79% CDs (4) 1Q 2026 4Q 2026 2Q 2026 Wholesale 3Q 2026 Retail 4.50% 4.50% 4.50% 4.25% 3.75% 4.55% 4.17% 4.05% 3.97% 3.93% 4Q24 1Q25 2Q25 Deposits – CD Maturities 㸦 $ in millions 㸧 3Q25 4Q25 Fed Funds Rate (3) Numbers may not add due to rounding (1) Yield for Loans and rate on interest - bearing deposit represent monthly average yield and rate, respectively. Fed funds rate represents the rate at the end of the month. Beta is measured monthly between August 2024, when the fed funds rate was 5.50%, and August 2025, when the fed funds rate was 4.50%, and between August 2025, when the fed funds rate was 4.50%, and December 2025, when the fed funds rate was 3.75%. (2) Average rates on CDs and interest bearing - deposits for the month of December 2025 wa s 3.90% and 3.27%, respectively (3) Fed funds rate represents the upper - target rate at the end of the quarter (4) Represent weighted average contractual rates Fed Funds Rate Rate on Interest - bearing deposit Yield for Loans Loan & Deposit Beta (1) Fed Funds Rate & Rate on CDs Rate on CDs (2) Time Horizon: Change in the Fed Funds Rate: Deposit Beta: Aug 24 – Aug 25 - 100 bps 71% Aug 25 – Dec 25 - 75 bps 43%
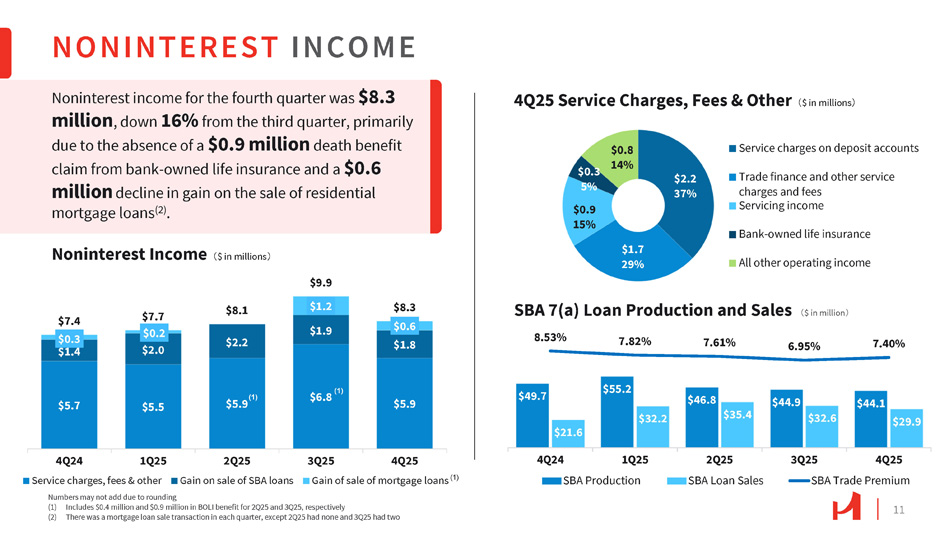
11 $2.2 37% $1.7 29% $0.3 5% $0.9 15% $0.8 14% Service charges on deposit accounts Trade finance and other service charges and fees Servicing income Bank - owned life insurance All other operating income NONINTEREST INCOME $49.7 $55.2 $46.8 $44.9 $44.1 $21.6 $32.2 $35.4 $32.6 $29.9 8.53% 7.82% 7.61% 6.95% 7.40% 4Q24 1Q25 SBA Production 2Q25 SBA Loan Sales 3Q25 4Q25 SBA Trade Premium $5.7 $5.5 $6.8 $5.9 $1.4 $2.0 $2.2 $1.9 $1.8 $0.3 $0.2 $1.2 $0.6 $7.4 $7.7 $8.1 $9.9 $8.3 4Q24 1Q25 Service charges, fees & other 2Q25 Gain on sale of SBA loans (1) $5.9 Numbers may not add due to rounding (1) Includes $0.4 million and $0.9 million in BOLI benefit for 2Q25 and 3Q25, respectively (2) There was a mortgage loan sale transaction in each quarter, except 2Q25 had none and 3Q25 had two Noninterest income for the fourth quarter was $8.3 million , down 16% from the third quarter, primarily due to the absence of a $0.9 million death benefit claim from bank - owned life insurance and a $0.6 million decline in gain on the sale of residential mortgage loans (2) . Noninterest Income 㸦 $ in millions 㸧 4Q25 Service Charges, Fees & Other 㸦 $ in millions 㸧 SBA 7(a) Loan Production and Sales 㸦 $ in million 㸧 (1) 3Q25 4Q25 Gain of sale of mortgage loans (1)
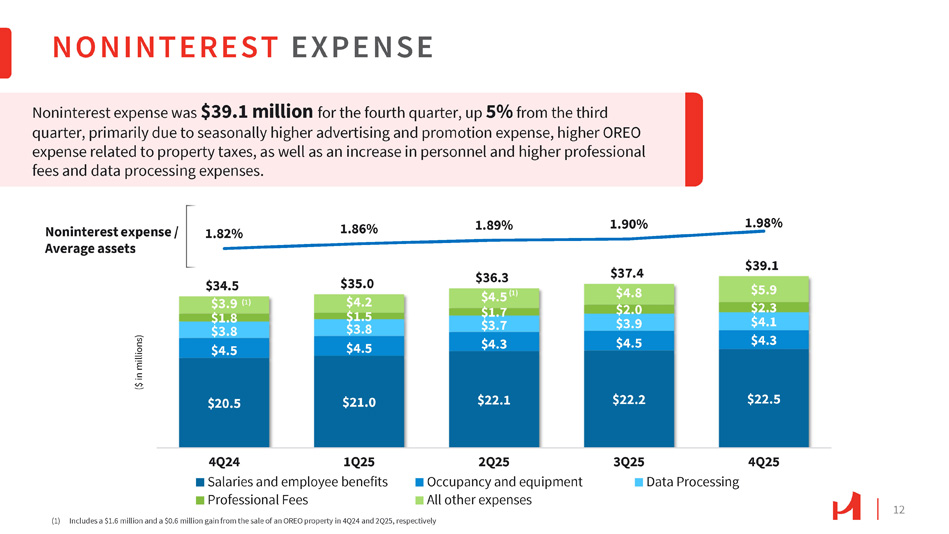
NONINTEREST EXPENSE 12 (1) Includes a $1.6 million and a $0.6 million gain from the sale of an OREO property in 4Q24 and 2Q25, respectively Noninterest expense was $39.1 million for the fourth quarter, up 5% from the third quarter, primarily due to seasonally higher advertising and promotion expense, higher OREO expense related to property taxes, as well as an increase in personnel and higher professional fees and data processing expenses. $20.5 $21.0 $22.1 $22.2 $22.5 $35.0 $4.2 $1.5 $3.8 $4.5 $37.4 $4.8 $2.0 $3.9 $4.5 $39.1 $5.9 $2.3 $4.1 $4.3 1.82% 1.86% 1.89% 1.90% 1.98% 4Q24 1Q25 Salaries and employee benefits Professional Fees 2Q25 Occupancy and equipment All other expenses $34.5 $3.9 (1) $1.8 $3.8 $4.5 $36.3 $4.5 (1) $1.7 $3.7 $4.3 3Q25 4Q25 Data Processing Noninterest expense / Average assets ($ in millions)
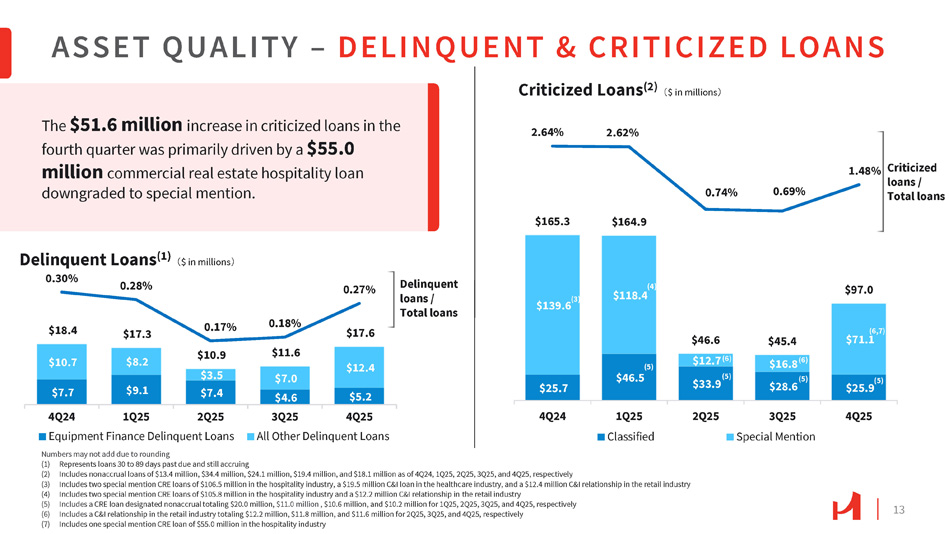
13 $7.7 $9.1 $5.2 $10.7 $8.2 $12.4 $18.4 $17.3 $10.9 $3.5 $7.4 $11.6 $7.0 $4.6 $17.6 0.30% 0.28% 0.17% 0.18% 0.27% 3Q25 4Q25 All Other Delinquent Loans 4Q24 1Q25 2Q25 Equipment Finance Delinquent Loans Numbers may not add due to rounding ASSET QUALITY – DELINQUENT & CRITICIZED LOANS Delinquent loans / Total loans $118.4 $165.3 $164.9 $97.0 2.64% 2.62% 0.74% 0.69% 1.48% Criticized loans / Total loans $139.6 (3) (1) Represents loans 30 to 89 days past due and still accruing (2) Includes nonaccrual loans of $13.4 million, $34.4 million, $24.1 million, $19.4 million, and $18.1 million as of 4Q24, 1Q25, 2Q25, 3Q25, and 4Q25, respectively (3) Includes two special mention CRE loans of $106.5 million in the hospitality industry, a $19.5 million C&I loan in the healthcare industry, and a $12.4 million C&I relationship in the retail industry (4) Includes two special mention CRE loans of $105.8 million in the hospitality industry and a $12.2 million C&I relationship in the retail industry (5) Includes a CRE loan designated nonaccrual totaling $20.0 million, $11.0 million , $10.6 million, and $10.2 million for 1Q25, 2Q25, 3Q25, and 4Q25, respectively (6) Includes a C&I relationship in the retail industry totaling $12.2 million, $11.8 million, and $11.6 million for 2Q25, 3Q25, and 4Q25, respectively (7) Includes one special mention CRE loan of $55.0 million in the hospitality industry (4) (6,7) $71.1 $25.9 (5) $45.4 $16.8 (6) (5) $28.6 $46.6 $12.7 (6) $33.9 (5) (5) $46.5 $25.7 4Q25 3Q25 Special Mention 2Q25 1Q25 Classified 4Q24 The $51.6 million increase in criticized loans in the fourth quarter was primarily driven by a $55.0 million commercial real estate hospitality loan downgraded to special mention. Delinquent Loans (1) 㸦 $ in millions 㸧 Criticized Loans (2) 㸦 $ in millions 㸧
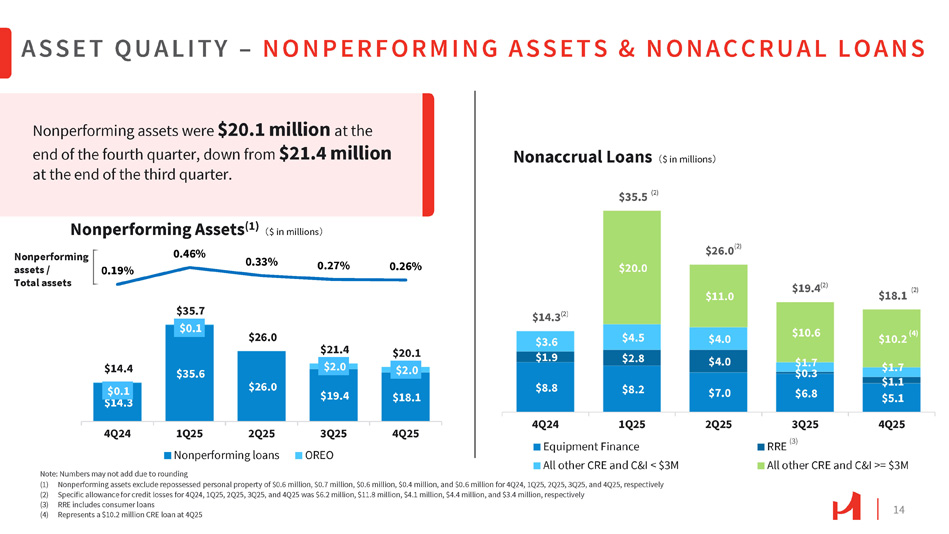
14 Nonperforming assets were $20.1 million at the end of the fourth quarter, down from $21.4 million at the end of the third quarter. $14.3 $35.6 $26.0 $19.4 $18.1 $0.1 $0.1 $2.0 $2.0 $14.4 $35.7 $26.0 $21.4 $20.1 0.19% 0.46% 0.33% 0.27% 0.26% 4Q25 3Q25 OREO ASSET QUALITY – NONPERFORMING ASSETS & NONACCRUAL LOANS (1) Nonperforming assets exclude repossessed personal property of $0.6 million, $0.7 million, $0.6 million, $0.4 million, and $0.6 million for 4Q24, 1Q25, 2Q25, 3Q25, and 4Q25, respectively (2) Specific allowance for credit losses for 4Q24, 1Q25, 2Q25, 3Q25, and 4Q25 was $6.2 million, $11.8 million, $4.1 million, $4.4 million, and $3.4 million, respectively (3) RRE includes consumer loans (4) Represents a $10.2 million CRE loan at 4Q25 4Q24 1Q25 2Q25 Nonperforming loans Note: Numbers may not add due to rounding $8.8 $8.2 $7.0 $4.5 $2.8 $4.0 $4.0 $1.7 $0.3 $6.8 $20.0 $11.0 $10.6 $35.5 (2) $19.4 2Q25 4Q25 4Q24 1Q25 Equipment Finance All other CRE and C&I < $3M $14.3 (2) $3.6 $1.9 3Q25 RRE (3) $18.1 (2) All other CRE and C&I >= $3M (2) $26.0 (2) $10.2 (4) $1.7 $1.1 $5.1 Nonperforming Assets (1) 㸦 $ in millions 㸧 Nonaccrual Loans 㸦 $ in millions 㸧 Nonperforming assets / Total assets
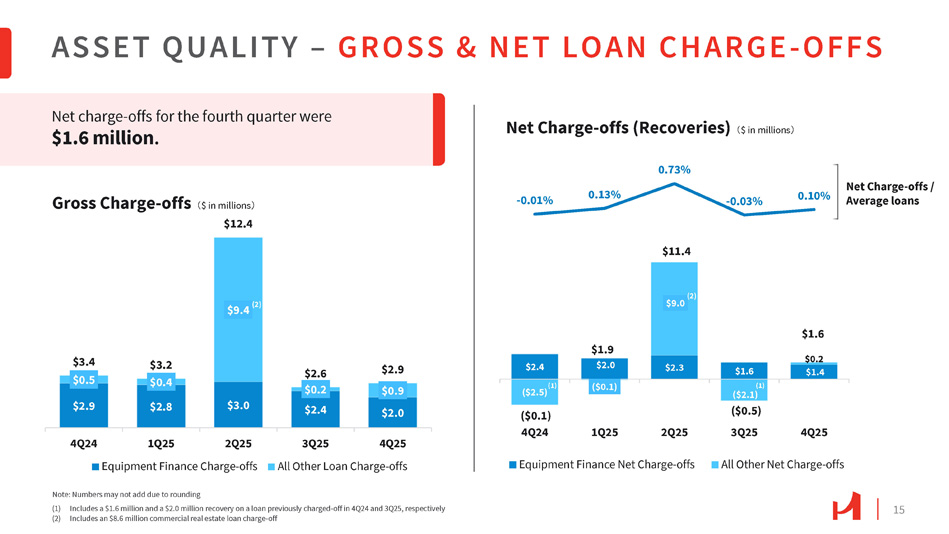
15 $2.9 $2.8 $3.0 $2.4 $2.0 $0.5 $0.4 $0.2 $0.9 $3.4 $3.2 $2.6 $2.9 $9.4 (2) 4Q24 1Q25 2Q25 Equipment Finance Charge - offs 3Q25 4Q25 All Other Loan Charge - offs ASSET QUALITY – GROSS & NET LOAN CHARGE - OFFS $2.4 $2.3 $1.6 ($0.1) $0.2 $1.4 $1.9 $2.0 $11.4 $1.6 (2) $9.0 (1) ($2.5) ($0.1) 4Q24 (1) ($2.1) ($0.5) 3Q25 - 0.01% 0.13% 0.73% - 0.03% 0.10% 1Q25 2Q25 4Q25 Equipment Finance Net Charge - offs All Other Net Charge - offs Note: Numbers may not add due to rounding (1) Includes a $1.6 million and a $2.0 million recovery on a loan previously charged - off in 4Q24 and 3Q25, respectively (2) Includes an $8.6 million commercial real estate loan charge - off Net charge - offs for the fourth quarter were $1.6 million . Gross Charge - offs 㸦 $ in millions 㸧 $12.4 Net Charge - offs (Recoveries) 㸦 $ in millions 㸧 Net Charge - offs / Average loans
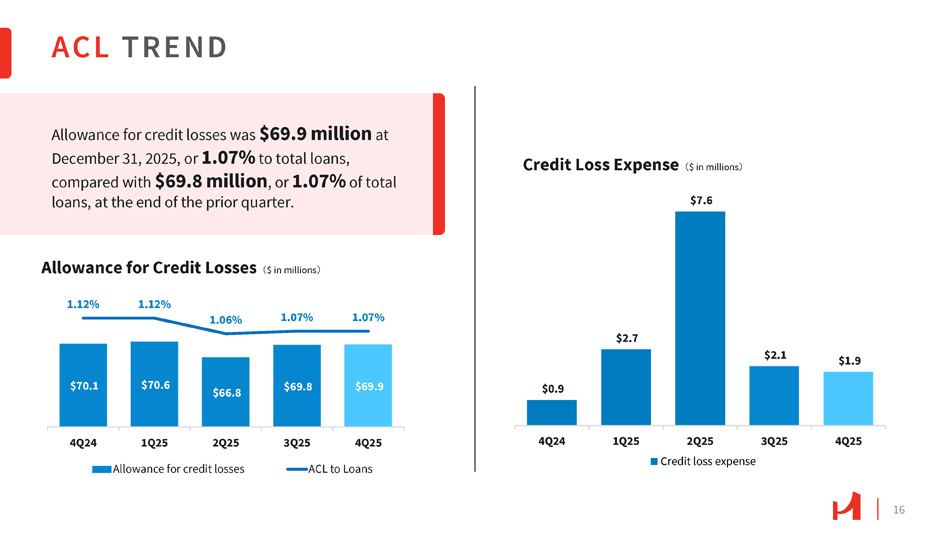
16 $70.1 $70.6 $66.8 $69.8 $69.9 1.06% 1.07% 1.07% Allowance for Credit Losses 㸦 $ in millions 㸧 1.12% 1.12% 4Q24 1Q25 2Q25 Allowance for credit losses 3Q25 4Q25 ACL to Loans $0.9 $2.7 Credit Loss Expense 㸦 $ in millions 㸧 $7.6 $2.1 $1.9 4Q24 1Q25 2Q25 Credit loss expense 3Q25 4Q25 Allowance for credit losses was $69.9 million at December 31, 2025, or 1.07% to total loans, compared with $69.8 million , or 1.07% of total loans, at the end of the prior quarter. ACL TREND
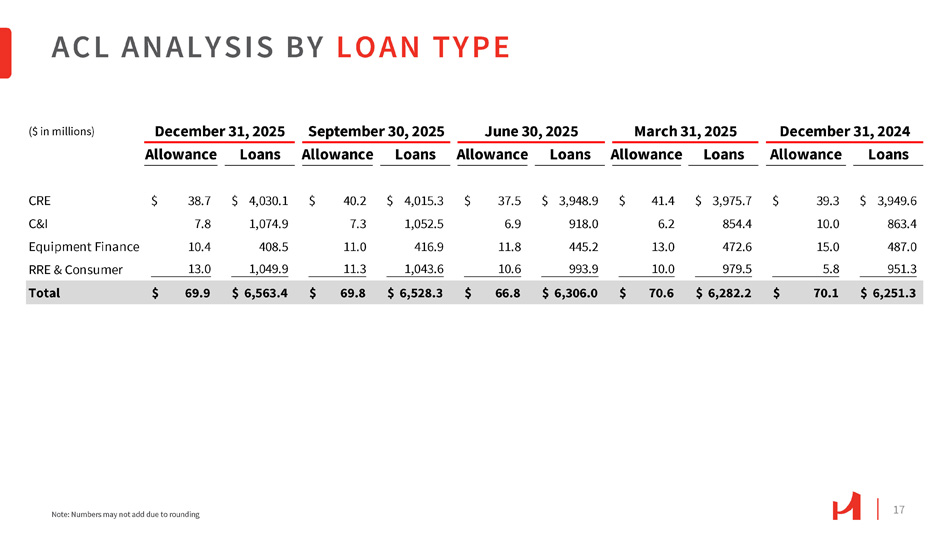
17 ACL ANALYSIS BY LOAN TYPE Note: Numbers may not add due to rounding Loans Allowance Loans Allowance Loans Allowance Loans Allowance Loans Allowance $ 3,949.6 $ 39.3 $ 3,975.7 $ 41.4 $ 3,948.9 $ 37.5 $ 4,015.3 $ 40.2 $ 4,030.1 $ 38.7 CRE 863.4 10.0 854.4 6.2 918.0 6.9 1,052.5 7.3 1,074.9 7.8 C&I 487.0 15.0 472.6 13.0 445.2 11.8 416.9 11.0 408.5 10.4 Equipment Finance 951.3 5.8 979.5 10.0 993.9 10.6 1,043.6 11.3 1,049.9 13.0 RRE & Consumer $ 6,251.3 $ 70.1 $ 6,282.2 $ 70.6 $ 6,306.0 $ 66.8 $ 6,528.3 $ 69.8 $ 6,563.4 $ 69.9 Total ($ in millions) December 31, 2025 September 30, 2025 June 30, 2025 March 31, 2025 December 31, 2024
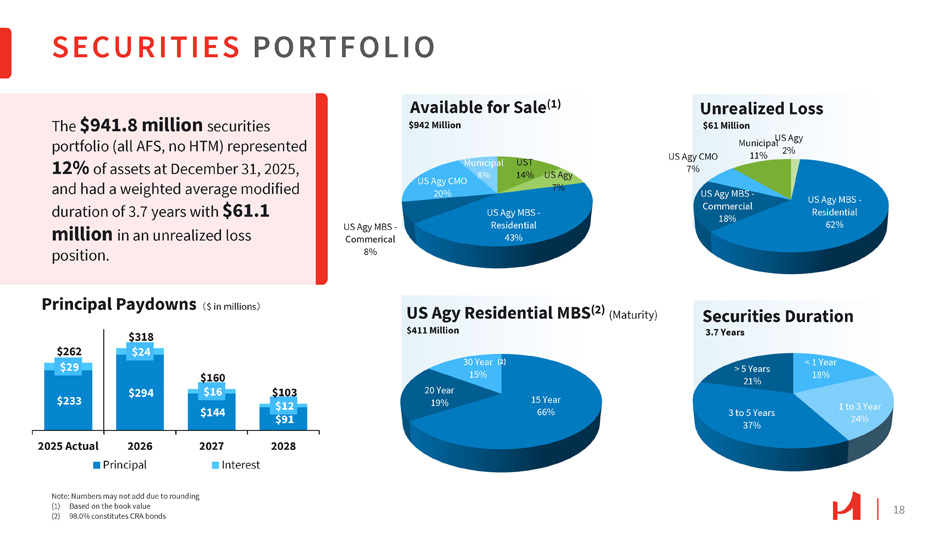
18 15 Year 66% 20 Year 19% SECURITIES PORTFOLIO $233 $294 $144 $91 $29 $24 $16 $12 $262 $318 $160 $103 2025 Actual 2026 Principal 2028 2027 Interest 2% US Agy MBS - Residential 62% US Agy MBS - Commercial 18% US Agy CMO 7% Municipa U l S Agy 11% UST 14% US Agy 7% US Agy MBS - Residential 43% US Agy MBS - Commerical 8% US Agy CMO 20% Municipal 8% Available for Sale (1) $942 Million < 1 Year 18% 1 to 3 Year 24% 3 to 5 Years 37% > 5 Years 21% $411 Million 30 Year (2) 15% Unrealized Loss $61 Million Securities Duration 3.7 Years Note: Numbers may not add due to rounding (1) Based on the book value (2) 98.0% constitutes CRA bonds The $941.8 million securities portfolio (all AFS, no HTM) represented 12% of assets at December 31, 2025, and had a weighted average modified duration of 3.7 years with $61.1 million in an unrealized loss position. Principal Paydowns 㸦 $ in millions 㸧 US Agy Residential MBS (2) (Maturity)
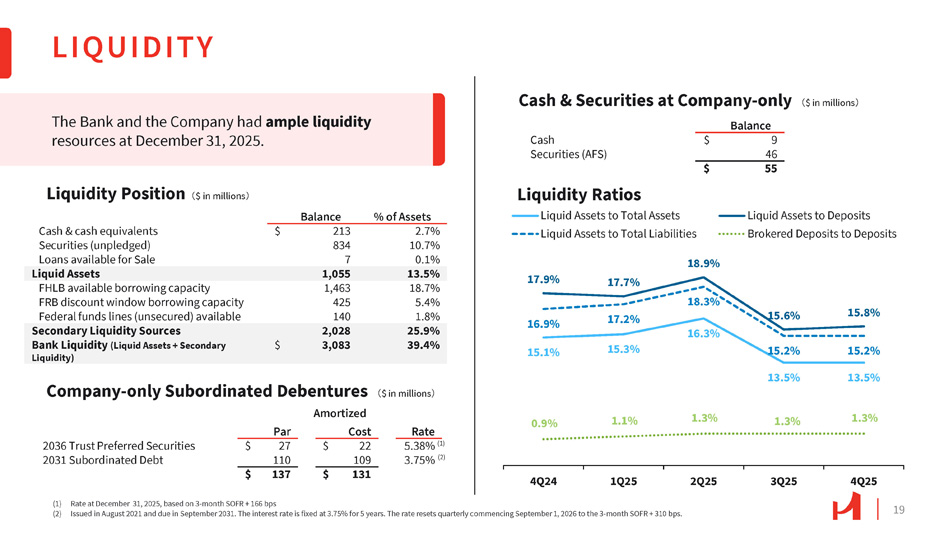
19 LIQUIDITY 4Q24 1Q25 (1) Rate at December 31, 2025, based on 3 - month SOFR + 166 bps (2) Issued in August 2021 and due in September 2031. The interest rate is fixed at 3.75% for 5 years. The rate resets quarterly commencing September 1, 2026 to the 3 - month SOFR + 310 bps. 15.1% 15.3% 16.3% 17.9% 17.7% 18.9% 15.6% 15.8% 16.9% 17.2% 18.3% 15.2% 13.5% 15.2% 13.5% 0.9% 1.1% 1.3% 1.3% 1.3% 2Q25 3Q25 4Q25 Liquid Assets to Total Assets Liquid Assets to Total Liabilities Liquid Assets to Deposits Brokered Deposits to Deposits Liquidity Position 㸦 $ in millions 㸧 Cash & Securities at Company - only 㸦 $ in millions 㸧 Company - only Subordinated Debentures 㸦 $ in millions 㸧 Liquidity Ratios % of Assets Balance 2.7% 213 $ Cash & cash equivalents 10.7% 834 Securities (unpledged) 0.1% 7 Loans available for Sale 13.5% 1,055 Liquid Assets 18.7% 1,463 FHLB available borrowing capacity 5.4% 425 FRB discount window borrowing capacity 1.8% 140 Federal funds lines (unsecured) available 25.9% 2,028 Secondary Liquidity Sources 39.4% 3,083 $ Bank Liquidity (Liquid Assets + Secondary Liquidity) Balance 9 $ Cash 46 Securities (AFS) 55 $ Amortized Rate Cost Par 5.38% 22 $ 27 $ 2036 Trust Preferred Securities 3.75% 109 110 2031 Subordinated Debt 131 $ 137 $ The Bank and the Company had ample liquidity resources at December 31, 2025. (1) (2)
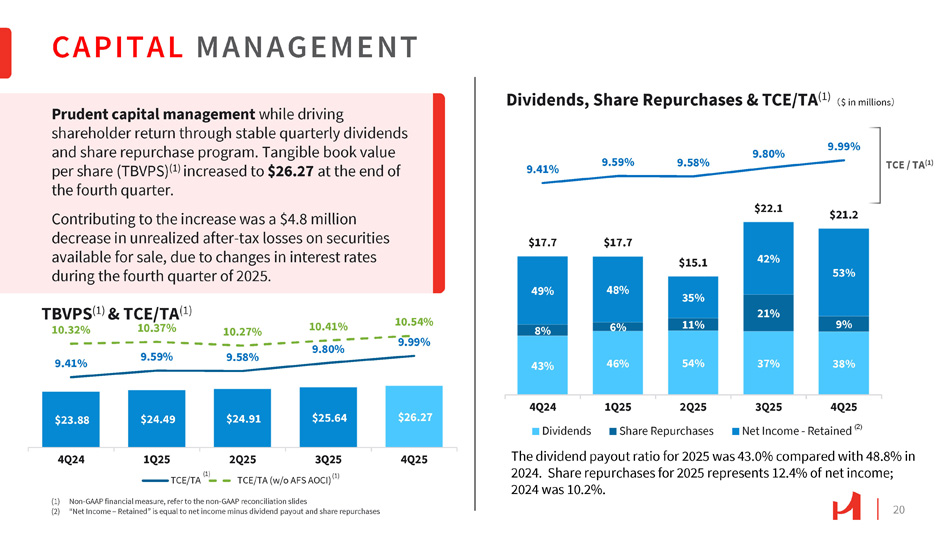
20 43% 46% 54% 37% 38% 8% 6% 21% 9% 49% 48% 35% 11% 42% 53% $17.7 $17.7 $15.1 $22.1 $21.2 9.41% 9.59% 9.58% 9.80% 9.99% 4Q24 Dividends 1Q25 2Q25 Share Repurchases 3Q25 4Q25 Net Income - Retained (2) $23.88 $24.49 $24.91 $25.64 $26.27 9.41% 9.59% 10.32% 10.37% 10.27% 9.58% 10.41% 9.80% 10.54% 9.99% 4Q24 1Q25 4Q25 (1) TCE/TA 2Q25 3Q25 TCE/TA (w/o AFS AOCI) (1) (1) Non - GAAP financial measure, refer to the non - GAAP reconciliation slides (2) “Net Income – Retained” is equal to net income minus dividend payout and share repurchases CAPITAL MANAGEMENT TCE / TA (1) Prudent capital management while driving shareholder return through stable quarterly dividends and share repurchase program. Tangible book value per share (TBVPS) (1) increased to $26.27 at the end of the fourth quarter. Contributing to the increase was a $4.8 million decrease in unrealized after - tax losses on securities available for sale, due to changes in interest rates during the fourth quarter of 2025. TBVPS (1) & TCE/TA (1) Dividends, Share Repurchases & TCE/TA (1) 㸦 $ in millions 㸧 The dividend payout ratio for 2025 was 43.0% compared with 48.8% in 2024. Share repurchases for 2025 represents 12.4% of net income; 2024 was 10.2%.
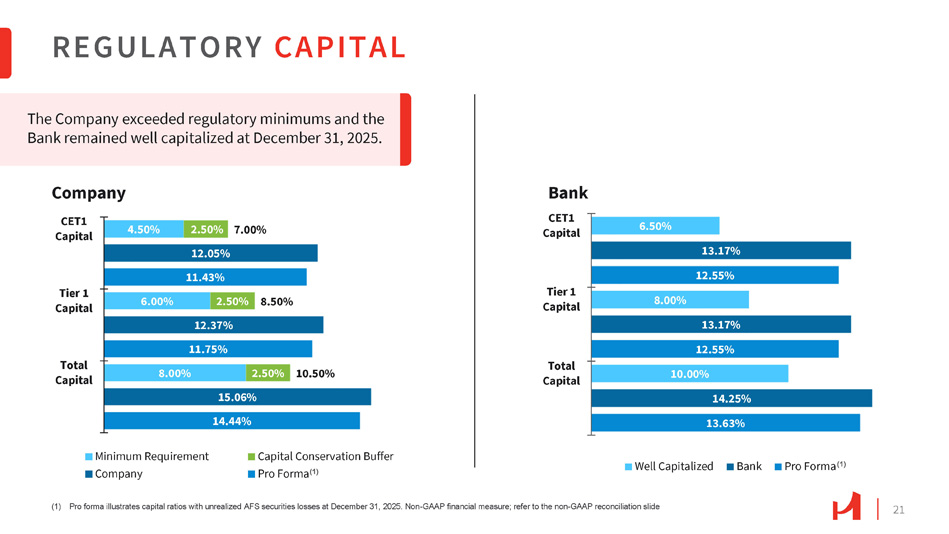
21 REGULATORY CAPITAL 8.00% 6.00% 4.50% 2.50% 15.06% 14.44% 2.50% 12.37% 11.75% 10.50% 8.50% 2.50% 7.00% 12.05% 11.43% Total Capital Tier 1 Capital CET1 Capital Minimum Requirement Company Capital Conservation Buffer Pro Forma (1) 8.00% 6.50% 13.17% 12.55% 10.00% 14.25% 13.63% 13.17% 12.55% Total Capital Tier 1 Capital Bank CET1 Capital Well Capitalized Bank Pro Forma (1) (1) Pro forma illustrates capital ratios with unrealized AFS securities losses at December 31, 2025. Non - GAAP financial measure; refer to the non - GAAP reconciliation slide Company The Company exceeded regulatory minimums and the Bank remained well capitalized at December 31, 2025.
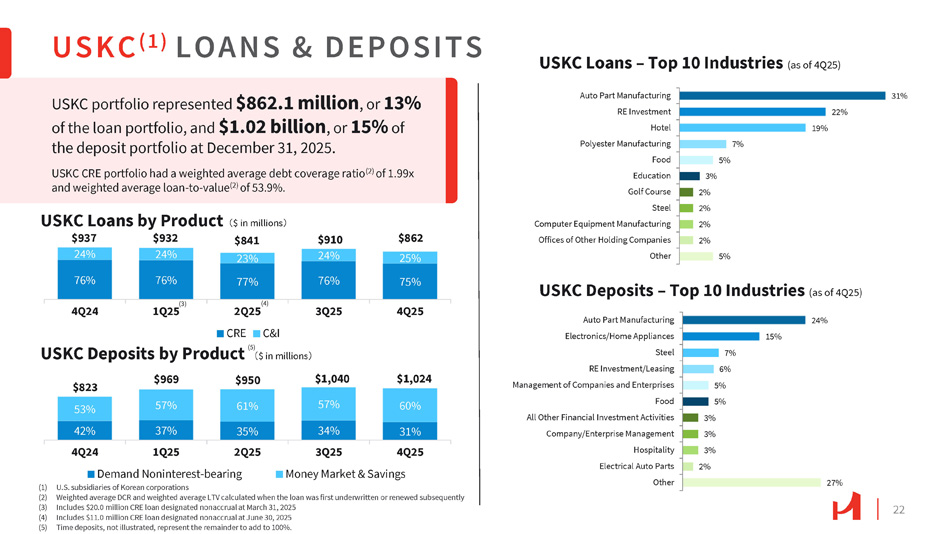
USKC ( 1 ) LOANS & DEPOSITS USKC portfolio represented $862.1 million , or 13% of the loan portfolio, and $1.02 billion , or 15% of the deposit portfolio at December 31, 2025. USKC CRE portfolio had a weighted average debt coverage ratio (2) of 1.99x and weighted average loan - to - value (2) of 53.9%. USKC Loans – Top 10 Industries (as of 4Q25) 31% 22% 19% 7% 5% 3% 2% 2% 2% 2% 5% Auto Part Manufacturing RE Investment Hotel Polyester Manufacturing Food Education Golf Course Steel Computer Equipment Manufacturing Offices of Other Holding Companies Other 24% 15% 7% 6% Auto Part Manufacturing Electronics/Home Appliances Steel RE Investment/Leasing 5% Management of Companies and Enterprises 5% Food 3% All Other Financial Investment Activities 3% Company/Enterprise Management 3% Hospitality 2% Electrical Auto Parts 27% Other 22 USKC Deposits – Top 10 Industries (as of 4Q25) $937 24% 76% $932 24% 76% $841 23% 77% $910 24% 76% $862 25% 75% 4Q24 1Q25 3Q25 4Q25 USKC Loans by Product 㸦 $ in millions 㸧 USKC Deposits by Product 㸦 $ in millions 㸧 $1,024 $1,040 $950 $823 $969 60% 31% 57% 34% 61% 35% 53% 57% 42% 37% 4Q25 3Q25 2Q25 4Q24 1Q25 Demand Noninterest - bearing Money Market & Savings (1) U.S. subsidiaries of Korean corporations (2) Weighted average DCR and weighted average LTV calculated when the loan was first underwritten or renewed subsequently (3) Includes $20.0 million CRE loan designated nonaccrual at March 31, 2025 (4) Includes $11.0 million CRE loan designated nonaccrual at June 30, 2025 (5) Time deposits, not illustrated, represent the remainder to add to 100%. (5) (3) (4) 2Q25 CRE C&I
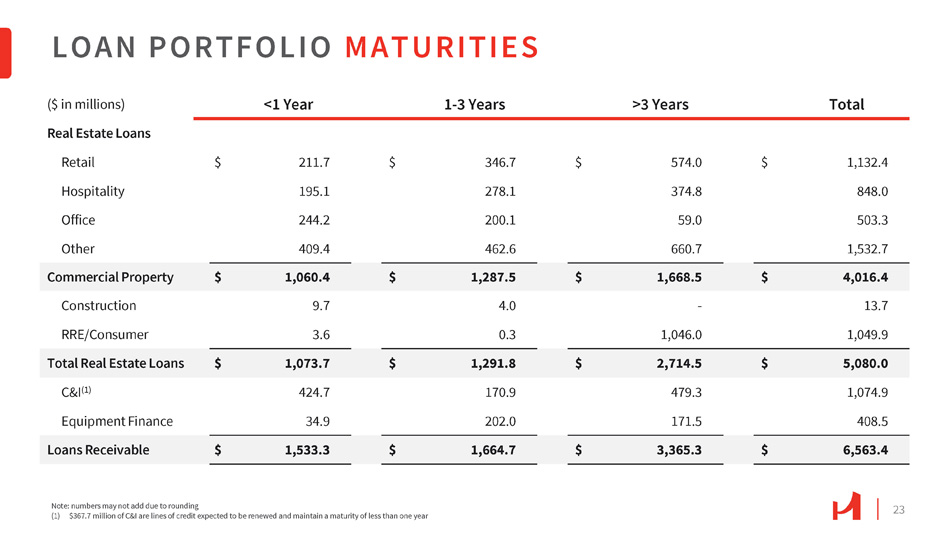
23 Total >3 Years 1 - 3 Years <1 Year ($ in millions) Real Estate Loans 1,132.4 $ 574.0 $ 346.7 $ 211.7 $ Retail 848.0 374.8 278.1 195.1 Hospitality 503.3 59.0 200.1 244.2 Office 1,532.7 660.7 462.6 409.4 Other 4,016.4 $ 1,668.5 $ 1,287.5 $ 1,060.4 $ Commercial Property 13.7 - 4.0 9.7 Construction 1,049.9 1,046.0 0.3 3.6 RRE/Consumer 5,080.0 $ 2,714.5 $ 1,291.8 $ 1,073.7 $ Total Real Estate Loans 1,074.9 479.3 170.9 424.7 C&I (1) 408.5 171.5 202.0 34.9 Equipment Finance 6,563.4 $ 3,365.3 $ 1,664.7 $ 1,533.3 $ Loans Receivable LOAN PORTFOLIO MATURITIES Note: numbers may not add due to rounding (1) $367.7 million of C&I are lines of credit expected to be renewed and maintain a maturity of less than one year
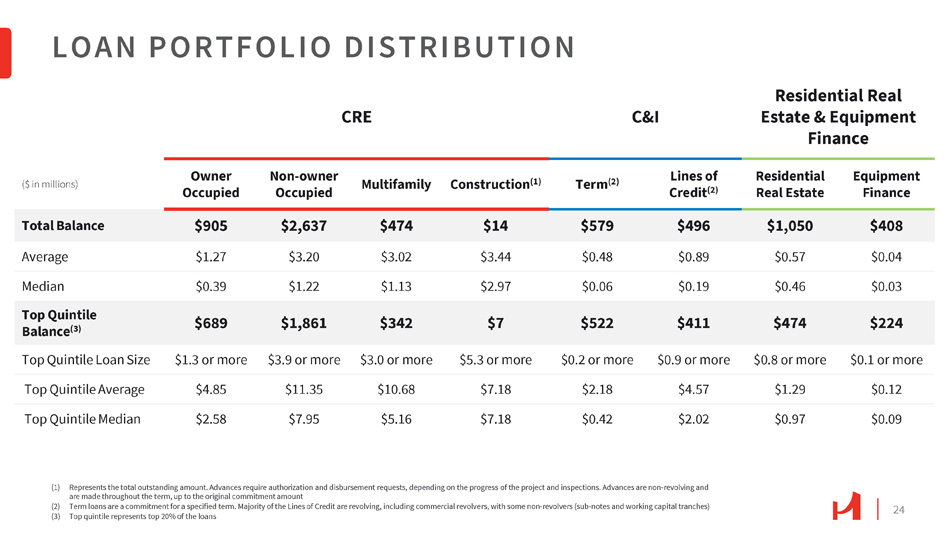
24 LOAN PORTFOLIO DISTRIBUTION Residential Real Estate & Equipment Finance C&I CRE Equipment Finance Residential Real Estate Lines of Credit (2) Term (2) Construction (1) Multifamily Non - owner Occupied Owner Occupied ($ in millions) $408 $1,050 $496 $579 $14 $474 $2,637 $905 Total Balance $0.04 $0.57 $0.89 $0.48 $3.44 $3.02 $3.20 $1.27 Average $0.03 $0.46 $0.19 $0.06 $2.97 $1.13 $1.22 $0.39 Median $224 $474 $411 $522 $7 $342 $1,861 $689 Top Quintile Balance (3) $0.1 or more $0.8 or more $0.9 or more $0.2 or more $5.3 or more $3.0 or more $3.9 or more $1.3 or more Top Quintile Loan Size $0.12 $1.29 $4.57 $2.18 $7.18 $10.68 $11.35 $4.85 Top Quintile Average $0.09 $0.97 $2.02 $0.42 $7.18 $5.16 $7.95 $2.58 Top Quintile Median (1) Represents the total outstanding amount. Advances require authorization and disbursement requests, depending on the progress of the project and inspections. Advances are non - revolving and are made throughout the term, up to the original commitment amount (2) Term loans are a commitment for a specified term. Majority of the Lines of Credit are revolving, including commercial revolvers, with some non - revolvers (sub - notes and working capital tranches) (3) Top quintile represents top 20% of the loans
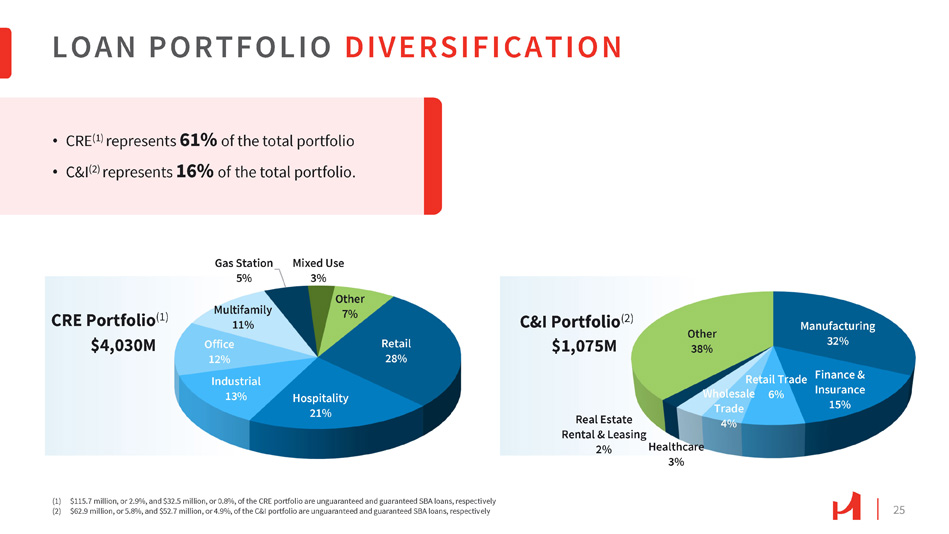
LOAN PORTFOLIO DIVERSIFICATION (1) $115.7 million, or 2.9%, and $32.5 million, or 0.8%, of the CRE portfolio are unguaranteed and guaranteed SBA loans, respectively (2) $62.9 million, or 5.8%, and $52.7 million, or 4.9%, of the C&I portfolio are unguaranteed and guaranteed SBA loans, respectively Retail 28% Hospitality 21% Industrial 13% Office 12% Multifamily 11% Gas Station 5% Mixed Use 3% Other 7% CRE Portfolio (1) $4,030M Manufacturing 32% Insurance 15% Retail Trade Finance & Wholesale 6% Trade 4% Healthcare 3% Real Estate Rental & Leasing 2% Other 38% C&I Portfolio (2) $1,075M • CRE (1) represents 61% of the total portfolio • C&I (2) represents 16% of the total portfolio. 25
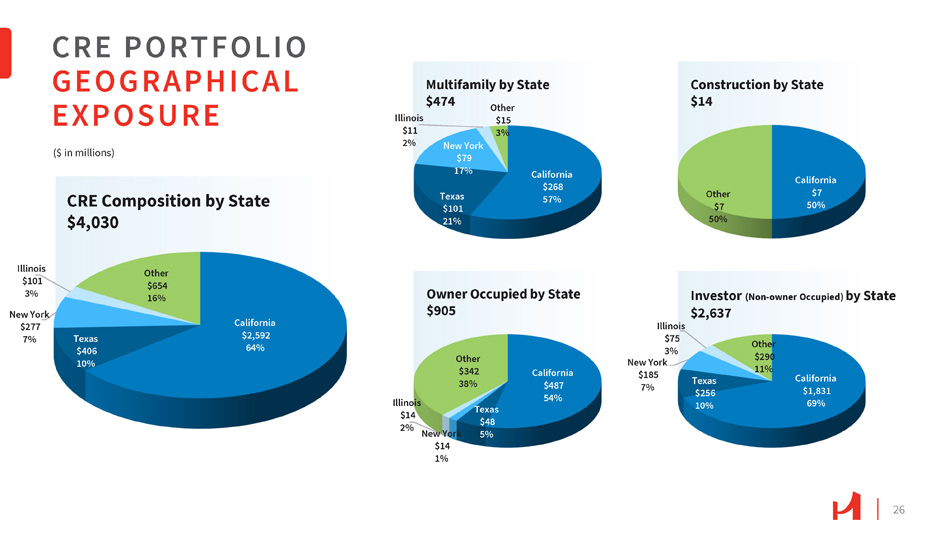
California $2,592 64% Texas $406 10% Illinois $101 3% New York $277 7% Other $654 16% CRE Composition by State $4,030 CRE PORTFOLIO GEOGRAPHICAL EXPOSURE 26 California $7 50% Other $7 50% Construction by State $14 California $487 54% Texas $48 5% New York $14 1% Illinois $14 2% Other $342 38% Owner Occupied by State $905 California $1,831 69% Texas $256 10% Illinois $75 3% New York $185 7% Other $290 11% Investor (Non - owner Occupied) by State $2,637 California $268 57% Texas $101 21% New York $79 17% Illinois $11 2% Other $15 3% Multifamily by State $474 ($ in millions)
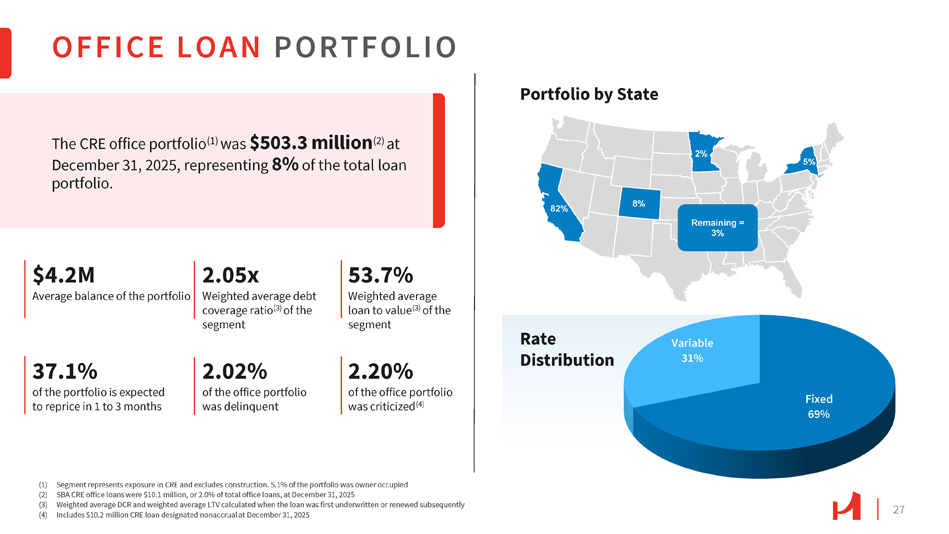
Rate Distribution Portfolio by State Fixed 69% Variable 31% OFFICE LOAN PORTFOLIO 27 (1) Segment represents exposure in CRE and excludes construction. 5.1% of the portfolio was owner occupied (2) SBA CRE office loans were $10.1 million, or 2.0% of total office loans, at December 31, 2025 (3) Weighted average DCR and weighted average LTV calculated when the loan was first underwritten or renewed subsequently (4) Includes $10.2 million CRE loan designated nonaccrual at December 31, 2025 The CRE office portfolio (1) was $503.3 million (2) at December 31, 2025, representing 8% of the total loan portfolio. $4.2M Average balance of the portfolio 2.05x Weighted average debt coverage ratio (3) of the segment 53.7% Weighted average loan to value (3) of the segment 37.1% of the portfolio is expected to reprice in 1 to 3 months 2.02% of the office portfolio was delinquent 2.20% of the office portfolio was criticized (4) Remaining = 3% 82% 8% 2% 5%
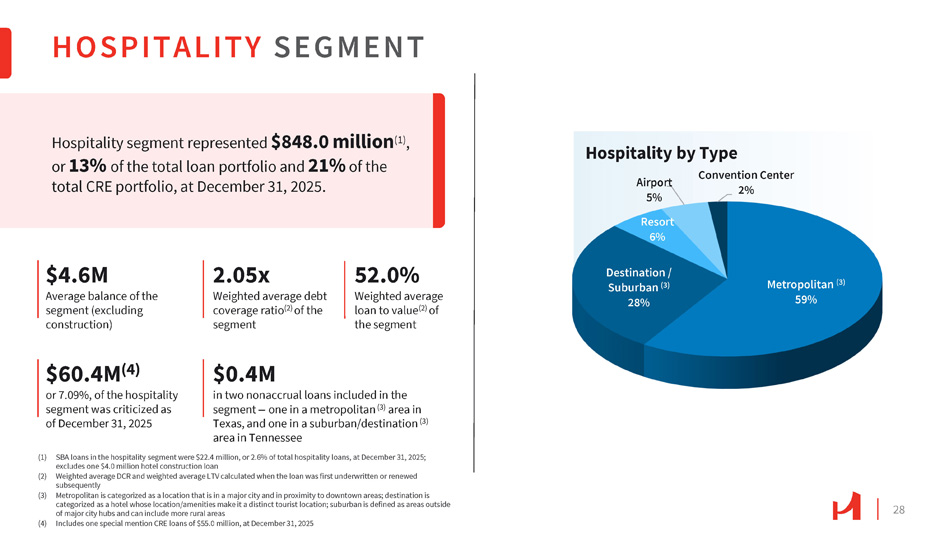
28 HOSPITALITY SEGMENT (1) SBA loans in the hospitality segment were $22.4 million, or 2.6% of total hospitality loans, at December 31, 2025; excludes one $4.0 million hotel construction loan (2) Weighted average DCR and weighted average LTV calculated when the loan was first underwritten or renewed subsequently (3) Metropolitan is categorized as a location that is in a major city and in proximity to downtown areas; destination is categorized as a hotel whose location/amenities make it a distinct tourist location; suburban is defined as areas outside of major city hubs and can include more rural areas (4) Includes one special mention CRE loans of $55.0 million, at December 31, 2025 Hospitality segment represented $848.0 million (1) , or 13% of the total loan portfolio and 21% of the total CRE portfolio, at December 31, 2025. $4.6M Average balance of the segment (excluding construction) 2.05x Weighted average debt coverage ratio (2) of the segment 52.0% Weighted average loan to value (2) of the segment $60.4M (4) or 7.09%, of the hospitality segment was criticized as of December 31, 2025 $0.4M in two nonaccrual loans included in the segment – one in a metropolitan (3) area in Texas, and one in a suburban/destination (3) area in Tennessee (3) Metropolitan 59% Destination / Suburban (3) 28% Airport 5% Resort 6% Convention Center 2% Hospitality by Type
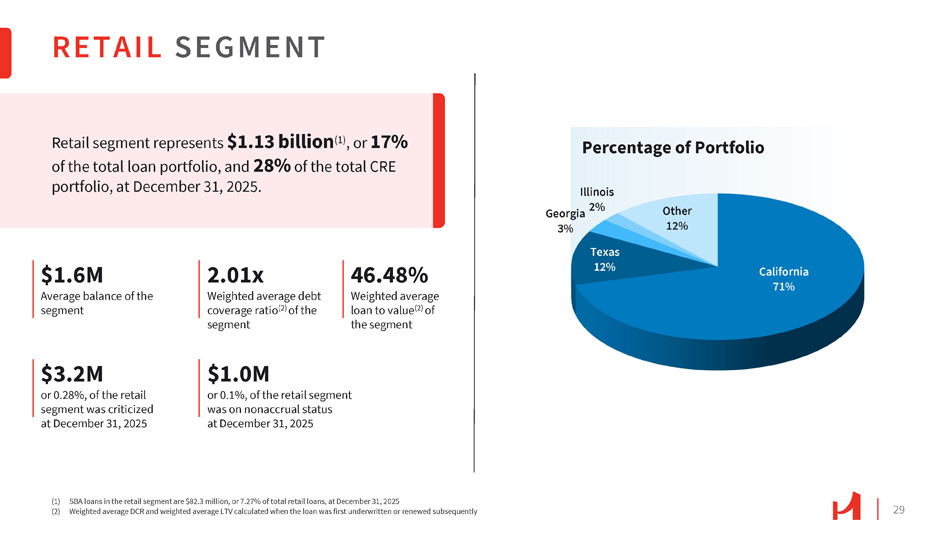
29 RETAIL SEGMENT Retail segment represents $1.13 billion (1) , or 17% of the total loan portfolio, and 28% of the total CRE portfolio, at December 31, 2025. $1.6M Average balance of the segment 2.01x Weighted average debt coverage ratio (2) of the segment 46.48% Weighted average loan to value (2) of the segment $3.2M or 0.28%, of the retail segment was criticized at December 31, 2025 $1.0M or 0.1%, of the retail segment was on nonaccrual status at December 31, 2025 California 71% Texas 12% Illinois Georgia 2% 3% Other 12% Percentage of Portfolio (1) SBA loans in the retail segment are $82.3 million, or 7.27% of total retail loans, at December 31, 2025 (2) Weighted average DCR and weighted average LTV calculated when the loan was first underwritten or renewed subsequently
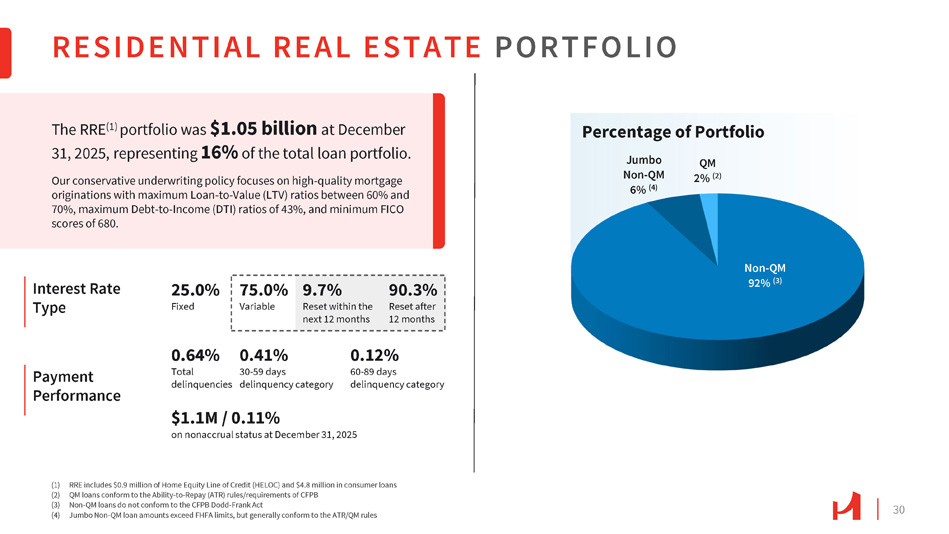
30 Payment Performance RESIDENTIAL REAL ESTATE PORTFOLIO The RRE (1) portfolio was $1.05 billion at December 31, 2025, representing 16% of the total loan portfolio. Our conservative underwriting policy focuses on high - quality mortgage originations with maximum Loan - to - Value (LTV) ratios between 60% and 70%, maximum Debt - to - Income (DTI) ratios of 43%, and minimum FICO scores of 680. 25.0% Fixed Non - QM 92% (3) Jumbo Non - QM 6% (4) QM 2% (2) (1) RRE includes $0.9 million of Home Equity Line of Credit (HELOC) and $4.8 million in consumer loans (2) QM loans conform to the Ability - to - Repay (ATR) rules/requirements of CFPB (3) Non - QM loans do not conform to the CFPB Dodd - Frank Act (4) Jumbo Non - QM loan amounts exceed FHFA limits, but generally conform to the ATR/QM rules Interest Rate Type 75.0% Variable 0.64% 0.41% Total 30 - 59 days delinquencies delinquency category 9.7% 90.3% Reset within the Reset after next 12 months 12 months 0.12% 60 - 89 days delinquency category $1.1M / 0.11% on nonaccrual status at December 31, 2025 Percentage of Portfolio
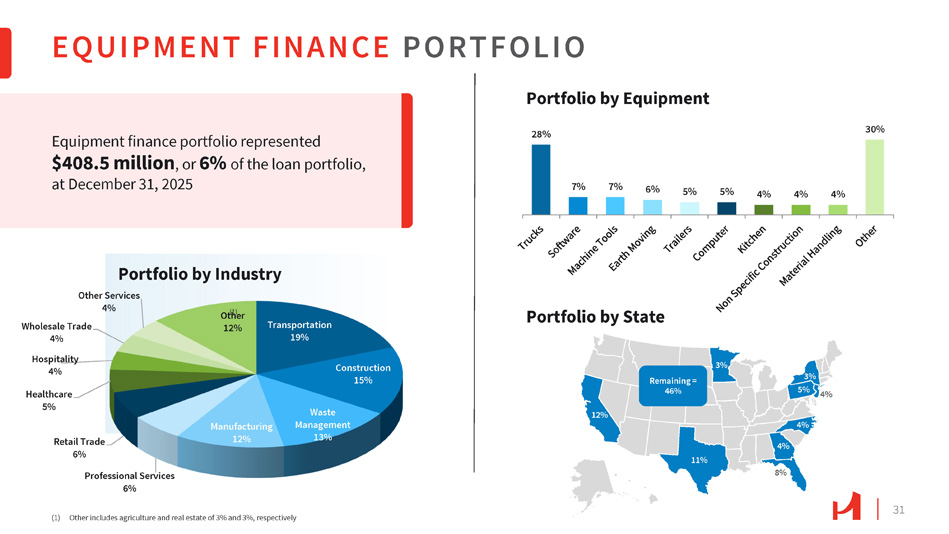
4% 3% 5% Remaining = 46% 12% 11% 4% 8% 4% 3% EQUIPMENT FINANCE PORTFOLIO 31 Transportation 19% Construction 15% Waste Management 13% Manufacturing 12% Retail Trade 6% Professional Services 6% Wholesale Trade 4% Hospitality 4% Healthcare 5% Other Services 4% Portfolio by Industry Ot ( h 1) er 12% (1) Other includes agriculture and real estate of 3% and 3%, respectively Equipment finance portfolio represented $408.5 million , or 6% of the loan portfolio, at December 31, 2025 7% 7% 6% 5% 5% 4% 4% 4% Portfolio by Equipment 28% 30% Portfolio by State
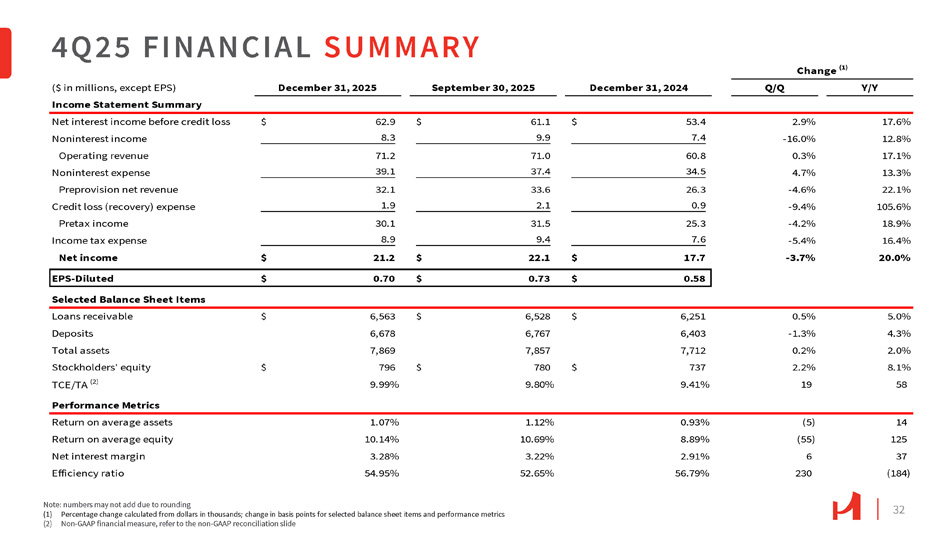
32 4 Q 25 FINANCIAL SUMMARY Note: numbers may not add due to rounding (1) Percentage change calculated from dollars in thousands; change in basis points for selected balance sheet items and performance metrics (2) Non - GAAP financial measure, refer to the non - GAAP reconciliation slide ($ in millions, except EPS) December 31, 2025 September 30, 2025 Income Statement Summary December 31, 2024 Q/Q Y/Y 17.6% 2.9% 53.4 $ 61.1 $ 62.9 $ Net interest income before credit loss 12.8% - 16.0% 7.4 9.9 8.3 Noninterest income 17.1% 0.3% 60.8 71.0 71.2 Operating revenue 13.3% 4.7% 34.5 37.4 39.1 Noninterest expense 22.1% - 4.6% 26.3 33.6 32.1 Preprovision net revenue 105.6% - 9.4% 0.9 2.1 1.9 Credit loss (recovery) expense 18.9% - 4.2% 25.3 31.5 30.1 Pretax income 16.4% - 5.4% 7.6 9.4 8.9 Income tax expense 20.0% - 3.7% 17.7 $ 22.1 $ 21.2 $ Net income 0.58 $ 0.73 $ 0.70 $ EPS - Diluted Selected Balance Sheet Items 5.0% 0.5% 6,251 $ 6,528 $ 6,563 $ Loans receivable 4.3% - 1.3% 6,403 6,767 6,678 Deposits 2.0% 0.2% 7,712 7,857 7,869 Total assets 8.1% 2.2% 737 $ 780 $ 796 $ Stockholders' equity 58 19 9.41% 9.80% 9.99% TCE/TA (2) Performance Metrics 14 (5) 0.93% 1.12% 1.07% Return on average assets 125 (55) 8.89% 10.69% 10.14% Return on average equity 37 6 2.91% 3.22% 3.28% Net interest margin (184) 230 56.79% 52.65% 54.95% Efficiency ratio Change (1)
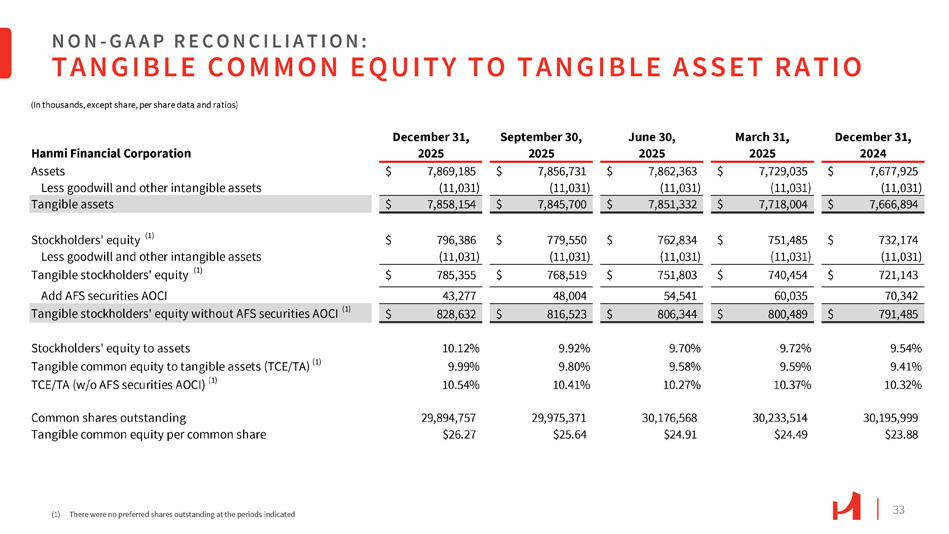
33 NON - G A A P R E C O N C I L I A T I O N : TANGIBLE COMMON EQUITY TO TANGIBLE ASSET RATIO (1) There were no preferred shares outstanding at the periods indicated December 31, March 31, June 30, September 30, December 31, 2024 2025 2025 2025 2025 Hanmi Financial Corporation 7,677,925 $ 7,729,035 $ 7,862,363 $ 7,856,731 $ 7,869,185 $ Assets (11,031) (11,031) (11,031) (11,031) (11,031) Less goodwill and other intangible assets $ 7,666,894 $ 7,718,004 $ 7,851,332 $ 7,845,700 $ 7,858,154 Tangible assets 732,174 $ 751,485 $ 762,834 $ 779,550 $ 796,386 $ Stockholders' equity (1) (11,031) (11,031) (11,031) (11,031) (11,031) Less goodwill and other intangible assets 721,143 $ 740,454 $ 751,803 $ 768,519 $ 785,355 $ Tangible stockholders' equity (1) 70,342 60,035 54,541 48,004 43,277 Add AFS securities AOCI $ 791,485 $ 800,489 $ 806,344 $ 816,523 $ 828,632 Tangible stockholders' equity without AFS securities AOCI (1) 9.54% 9.72% 9.70% 9.92% 10.12% Stockholders' equity to assets 9.41% 9.59% 9.58% 9.80% 9.99% Tangible common equity to tangible assets (TCE/TA) (1) 10.32% 10.37% 10.27% 10.41% 10.54% TCE/TA (w/o AFS securities AOCI) (1) 30,195,999 30,233,514 30,176,568 29,975,371 29,894,757 Common shares outstanding $23.88 $24.49 $24.91 $25.64 $26.27 Tangible common equity per common share (In thousands, except share, per share data and ratios)
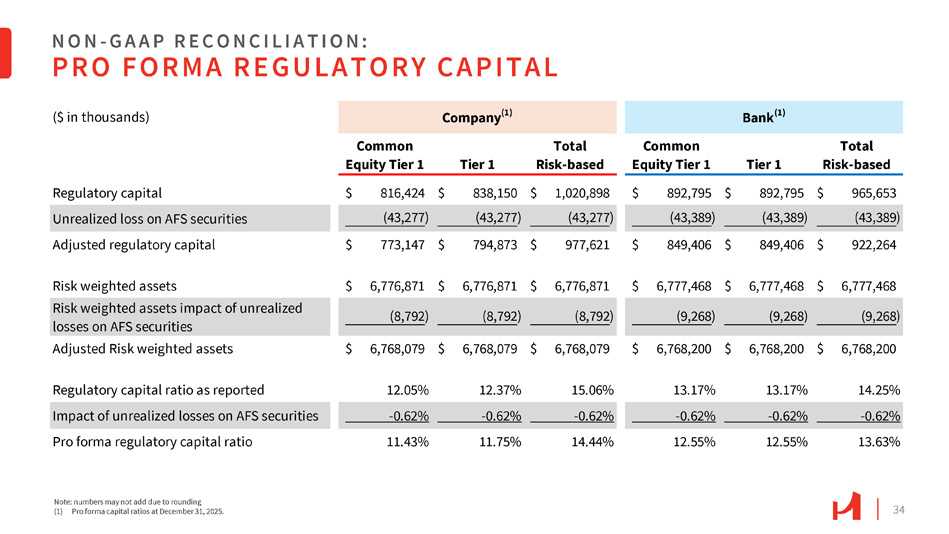
34 NON - G A A P R E C O N C I L I A T I O N : PRO FORMA REGULATORY CAPITAL Note: numbers may not add due to rounding (1) Pro forma capital ratios at December 31, 2025. Bank (1) Company (1) ($ in thousands) Total Risk - based Tier 1 Common Equity Tier 1 Total Risk - based Tier 1 Common Equity Tier 1 $ 965,653 $ 892,795 $ 892,795 $ 1,020,898 $ 838,150 $ 816,424 Regulatory capital (43,389 ) (43,389 ) (43,389 ) (43,277 ) (43,277 ) (43,277 ) Unrealized loss on AFS securities $ 922,264 $ 849,406 $ 849,406 $ 977,621 $ 794,873 $ 773,147 Adjusted regulatory capital $ 6,777,468 $ 6,777,468 $ 6,777,468 $ 6,776,871 $ 6,776,871 $ 6,776,871 Risk weighted assets $ 6,768,200 $ 6,768,200 $ 6,768,200 $ 6,768,079 $ 6,768,079 $ 6,768,079 Adjusted Risk weighted assets 14.25% 13.17% 13.17% 15.06% 12.37% 12.05% Regulatory capital ratio as reported - 0.62% - 0.62% - 0.62% - 0.62% - 0.62% - 0.62% Impact of unrealized losses on AFS securities 13.63% 12.55% 12.55% 14.44% 11.75% 11.43% Pro forma regulatory capital ratio Risk weighted assets impact of unrealized losses on AFS securities (8,792 ) (8,792 ) (8,792 ) (9,268 ) (9,268 ) (9,268 )
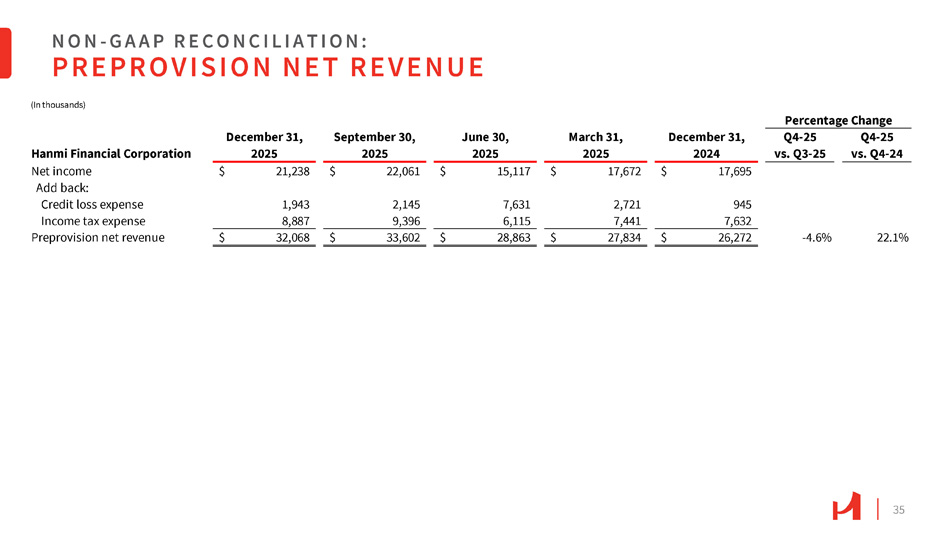
35 NON - G A A P R E C O N C I L I A T I O N : PREPROVISION NET REVENUE (In thousands) Percentage Change Q4 - 25 Q4 - 25 December 31, March 31, June 30, September 30, December 31, vs. Q3 - 25 vs. Q4 - 24 2024 2025 2025 2025 2025 Hanmi Financial Corporation $ 17,695 945 $ 17,672 2,721 $ 15,117 7,631 $ 22,061 2,145 $ 21,238 1,943 Net income Add back: Credit loss expense 7,632 7,441 6,115 9,396 8,887 Income tax expense - 4.6% 22.1% $ 26,272 $ 27,834 $ 28,863 $ 33,602 $ 32,068 Preprovision net revenue