false2025-12-01001-34073HUNTINGTON BANCSHARES INC /MD/0000049196MDOHDepositary Shares (each representing a 1/40th interest in a shareDepositary Shares (each representing a 1/1000th interest in aCommon Stock-Par Value $0.01 per Share00000491962025-12-012025-12-010000049196hban:DepositarySharesEachRepresentingA140thInterestInAShareMember2025-12-012025-12-010000049196hban:DepositarySharesEachRepresentingA140thInterestInAShareOf6875SeriesJNonCumulativePerpetualPreferredStockMember2025-12-012025-12-010000049196hban:DepositarySharesEachRepresentingA11000thInterestInAMember2025-12-012025-12-010000049196hban:CommonStockParValue001PerShareMember2025-12-012025-12-01
UNITED STATES
SECURITIES AND EXCHANGE COMMISSION
Washington, D.C. 20549
FORM 8-K
CURRENT REPORT
Pursuant to Section 13 OR 15(d)
of The Securities Exchange Act of 1934
Date of Report (Date of earliest event reported) December 1, 2025
Huntington Bancshares Incorporated
(Exact name of registrant as specified in its charter)
|
Maryland
(State or other jurisdiction of
incorporation or organization)
|
1-34073
(Commission
File Number)
|
31-0724920
(I.R.S. Employer
Identification No.)
|
Registrant’s address: 41 South High Street, Columbus, Ohio 43287
Registrant’s telephone number, including area code: (614) 480-2265
Not Applicable
(Former name or former address, if changed since last report.)
Check the appropriate box below if the Form 8-K filing is intended to simultaneously satisfy the filing obligation of the registrant under any
of the following provisions:
|
☒
|
Written communications pursuant to Rule 425 under the Securities Act (17 CFR 230.425)
|
|
☐
|
Soliciting material pursuant to Rule 14a-12 under the Exchange Act (17 CFR 240.14a-12)
|
|
☐
|
Pre-commencement communications pursuant to Rule 14d-2(b) under the Exchange Act (17 CFR 240.14d-2(b))
|
|
☐
|
Pre-commencement communications pursuant to Rule 13e-4(c) under the Exchange Act (17 CFR 240.13e-4(c))
|
Securities registered pursuant to Section 12(b) of the Act:
|
Title of class
|
Trading
Symbol(s)
|
Name of exchange
on which registered
|
|
Depositary Shares (each representing a 1/40th interest in a share of 4.500% Series H Non-Cumulative, perpetual preferred stock)
|
HBANP
|
NASDAQ
|
|
Depositary Shares (each representing a 1/1000th interest in a share of 5.70% Series I Non-Cumulative, perpetual preferred stock)
|
HBANM
|
NASDAQ
|
|
Depositary Shares (each representing a 1/40th interest in a share of 6.875% Series J Non-Cumulative, perpetual preferred stock)
|
HBANL
|
NASDAQ
|
|
Common Stock-Par Value $0.01 per Share
|
HBAN
|
NASDAQ
|
Indicate by check mark whether the registrant is an emerging growth company as defined in Rule 405 of the Securities Act of 1933 (§230.405) or
Rule 12b-2 of the Securities Exchange Act of 1934 (§240.12b-2).
Emerging growth company ☐
If an emerging growth company, indicate by check mark if the registrant has elected not to use the extended transition
period for complying with any new or revised financial accounting standards provided pursuant to Section 13(a) of the Exchange Act. ☐
Item 7.01. Regulation FD Disclosure.
Huntington Bancshares Incorporated (the “Company”) filed with the U.S. Securities and Exchange Commission (the “SEC”) a Registration Statement
on Form S-4 (Registration No. 333-291486) on November 13, 2025 (the “Registration Statement”) which contains a preliminary joint proxy statement/prospectus (the “Joint Proxy/Prospectus”), relating to shares of the Company’s common stock, par value
$0.01 per share, to be issued in connection with the proposed merger of Cadence Bank, a Mississippi-chartered bank, with and into The Huntington National Bank, a wholly owned bank subsidiary of Huntington. The Company is furnishing the exhibits to
this Current Report on Form 8-K attached hereto, each of which were previously filed by Cadence Bank with the Board of Governors of the Federal Reserve System under the Securities Exchange Act of 1934, as amended (the “Exchange Act”), for the
purposes of expressly incorporating such exhibits into an amended Registration Statement and Joint Proxy/Prospectus to be filed by the Company with the SEC.
The information contained in Item 7.01 of this report, including Exhibit 99.1 through Exhibit 99.16 shall not be deemed to be “filed” for
purposes of Section 18 of the Exchange Act, or otherwise subject to the liabilities of that section. The information contained in Item 7.01 of this report, including Exhibit 99.1 through Exhibit 99.16, shall not be incorporated by reference into any
filing under the Securities Act of 1933, as amended, or the Exchange Act, whether made before, on, or after the date hereof, regardless of any general incorporation language in such filing, unless expressly incorporated by specific reference to such
filing.
Item 9.01. Financial Statements and Exhibits.
(d) Exhibits
|
|
|
|
|
|
|
Consent of Forvis Mazars, LLP.
|
|
|
|
Annual Report on Form 10-K for the fiscal year ended December 31, 2024, filed by Cadence Bank with the Board of Governors of the
Federal Reserve System on February 21, 2025.
|
|
|
|
Quarterly Report on Form 10-Q for the quarter ended March 31, 2025, filed by Cadence Bank with the Board of Governors of the Federal
Reserve System on May 9, 2025.
|
|
|
|
Quarterly Report on Form 10-Q for the quarter ended June 30, 2025, filed by Cadence Bank with the Board of Governors of the Federal
Reserve System on August 8, 2025.
|
|
|
|
Quarterly Report on Form 10-Q for the quarter ended September 30, 2025, filed by Cadence Bank with the Board of Governors of the
Federal Reserve System on November 7, 2025.
|
|
|
|
Current Report on Form 8-K, filed by Cadence Bank with the Board of Governors of the Federal Reserve System on January 3, 2025 (as
amended on February 5, 2025 and April 25, 2025) (other than the portions not deemed to be filed). |
|
|
|
Current Report on Form 8-K, filed by Cadence Bank with the Board of Governors of the Federal Reserve System on January 21, 2025 (other
than the portions not deemed to be filed).
|
|
|
|
Current Report on Form 8-K, filed by Cadence Bank with the Board of Governors of the Federal Reserve System on January 27, 2025 (other
than the portions not deemed to be filed).
|
|
|
|
Current Report on Form 8-K, filed by Cadence Bank with the Board of Governors of the Federal Reserve System on April 25, 2025 (other
than the portions not deemed to be filed).
|
|
|
|
Current Report on Form 8-K, filed by Cadence Bank with the Board of Governors of the Federal Reserve System on April 25, 2025 (other
than the portions not deemed to be filed).
|
|
|
|
Current Report on Form 8-K, filed by Cadence Bank with the Board of Governors of the Federal Reserve System on October 27, 2025 (other
than the portions not deemed to be filed).
|
|
|
|
Current Report on Form 8-K, filed by Cadence Bank with the Board of Governors of the Federal Reserve System on October 27, 2025 (other
than the portions not deemed to be filed).
|
|
|
|
Current Report on Form 8-K, filed by Cadence Bank with the Board of Governors of the Federal Reserve System on October 27, 2025 (other
than the portions not deemed to be filed).
|
|
|
|
Current Report on Form 8-K, filed by Cadence Bank with the Board of Governors of the Federal Reserve System on October 27, 2025 (other
than the portions not deemed to be filed).
|
99.14
|
|
Current Report on Form 8-K, filed by Cadence Bank with the Board of Governors of the Federal Reserve System on October 30, 2025 (other than the portions not deemed to be filed). |
|
|
|
Definitive Proxy Statement on Schedule 14A, filed by Cadence Bank with the Board of Governors of the Federal Reserve System on March
14, 2025.
|
|
104
|
|
Cover Page Interactive Data File - the cover page XBRL tags are embedded within the Inline XBRL document.
|
CAUTION REGARDING FORWARD-LOOKING STATEMENTS
This communication may contain certain forward-looking statements, including, but not limited to, certain plans, expectations, goals, projections, and
statements about the benefits of the proposed transaction, the plans, objectives, expectations and intentions of Huntington Bancshares Incorporated (“Huntington”)
and Cadence Bank (“Cadence”), the expected timing of completion of the transaction, and other statements that are not historical facts. Such statements are
subject to numerous assumptions, risks, estimates, uncertainties and other important factors that change over time and could cause actual results to differ materially from any results, performance, or events expressed or implied by such
forward-looking statements, including as a result of the factors referenced below. Statements that do not describe historical or current facts, including statements about beliefs and expectations, are forward-looking statements. Forward-looking
statements may be identified by words such as expect, anticipate, continue, believe, intend, estimate, plan, trend, objective, target, goal, or similar expressions, or future or conditional verbs such as will, may, might, should, would, could, or
similar variations. The forward-looking statements are intended to be subject to the safe harbor provided by Section 27A of the Securities Act of 1933, Section 21E of the Securities Exchange Act of 1934, and the Private Securities Litigation Reform
Act of 1995.
Huntington and Cadence caution that the forward-looking statements in this communication are not guarantees of future performance and involve a number of
known and unknown risks, uncertainties and assumptions that are difficult to assess and are subject to change based on factors which are, in many instances, beyond Huntington’s and Cadence’s control. While there is no assurance that any list of
risks and uncertainties or risk factors is complete, below are certain factors which could cause actual results to differ materially from those contained or implied in the forward-looking statements or historical performance: changes in general
economic, political, or industry conditions; deterioration in business and economic conditions, including persistent inflation, supply chain issues or labor shortages, instability in global economic conditions and geopolitical matters, as well as
volatility in financial markets; changes in U.S. trade policies, including the imposition of tariffs and retaliatory tariffs; the impact of pandemics and other catastrophic events or disasters on the global economy and financial market conditions and
our business, results of operations, and financial condition; the impacts related to or resulting from bank failures and other volatility, including potential increased regulatory requirements and costs, such as Federal Deposit Insurance Corporation
(the “FDIC”) special assessments, long-term debt requirements and heightened capital requirements, and potential impacts to macroeconomic conditions, which
could affect the ability of depository institutions, including us, to attract and retain depositors and to borrow or raise capital; unexpected outflows of uninsured deposits which may require us to sell investment securities at a loss; changing
interest rates which could negatively impact the value of our portfolio of investment securities; the loss of value of our investment portfolio which could negatively impact market perceptions of us and could lead to deposit withdrawals; the effects
of social media on market perceptions of us and banks generally; cybersecurity risks; uncertainty in U.S. fiscal and monetary policy, including the interest rate policies of the Board of Governors of the Federal Reserve System (the “Federal Reserve”); volatility and disruptions in global capital, foreign exchange and credit markets; movements in interest rates; competitive pressures on product
pricing and services; success, impact, and timing of our business strategies, including market acceptance of any new products or services including those implementing our “Fair Play” banking philosophy; changes in policies and standards for
regulatory review of bank mergers; the nature, extent, timing, and results of governmental actions, examinations, reviews, reforms, regulations, and interpretations, including those related to the Dodd-Frank Wall Street Reform and Consumer Protection
Act and the Basel III regulatory capital reforms, as well as those involving the Securities and Exchange Commission (the “SEC”), the Office of the Comptroller
of the Currency, the Federal Reserve, the FDIC, the Consumer Financial Protection Bureau and state-level regulators; the occurrence of any event, change or other circumstances that could give rise to the right of one or both of the parties to
terminate the merger agreement between Huntington and Cadence; the outcome of any legal proceedings that may be instituted against Huntington or Cadence; delays in completing the proposed transaction involving Huntington and Cadence; the failure to
obtain necessary regulatory approvals (and the risk that such approvals may result in the imposition of conditions that could adversely affect the combined company or the expected benefits of the transaction); the failure to obtain Huntington
shareholder approval or Cadence shareholder approval or to satisfy any of the other conditions to the transaction on a timely basis or at all; the possibility that the anticipated benefits of the transaction are not realized when expected or at all,
including as a result of the impact of, or problems arising from, the integration of the two companies or as a result of the strength of the economy and competitive factors in the areas where Huntington and Cadence do business; the possibility that
the transaction may be more expensive to complete than anticipated, including as a result of unexpected factors or events; the ability of Huntington and Cadence to meet expectations regarding the timing, completion and accounting and tax treatment of
the transaction; diversion of management’s attention from ongoing business operations and opportunities; potential adverse reactions or changes to business, customer or employee relationships, including those resulting from the announcement or
completion of the transaction; the ability to complete the transaction and integration of Huntington and Cadence successfully; the dilution caused by Huntington’s issuance of additional shares of its capital stock in connection with the transaction;
and other factors that may affect the future results of Huntington and Cadence. Additional factors that could cause results to differ materially from those described above can be found in Huntington’s Annual Report on Form 10-K for the year ended
December 31, 2024 and in its subsequent Quarterly Reports on Form 10-Q, including for the quarters ended March 31, 2025, June 30, 2025 and September 30, 2025, each of which is on file with the SEC and available on the “Investor Relations” section of
Huntington’s website, http://www.huntington.com, under the heading “Investor Relations” and in other documents Huntington files with the SEC, and in Cadence’s Annual Report on Form 10-K for the year ended December 31, 2024 and in its subsequent
Quarterly Reports on Form 10-Q, including for the quarters ended March 31, 2025, June 30, 2025 and September 30, 2025, each of which is on file with the Federal Reserve and available on Cadence’s investor relations website, ir.cadencebank.com, under
the heading “Public Filings” and in other documents Cadence files with the Federal Reserve.
All forward-looking statements are expressly qualified in their entirety by the cautionary statements set forth above. Forward-looking statements speak only
as of the date they are made and are based on information available at that time. Neither Huntington nor Cadence assume any obligation to update forward-looking statements to reflect actual results, new information or future events, changes in
assumptions or changes in circumstances or other factors affecting forward-looking statements that occur after the date the forward-looking statements were made or to reflect the occurrence of unanticipated events except as required by federal
securities laws. If Huntington or Cadence updates one or more forward-looking statements, no inference should be drawn that Huntington or Cadence will make additional updates with respect to those or other forward-looking statements. As
forward-looking statements involve significant risks and uncertainties, caution should be exercised against placing undue reliance on such statements.
IMPORTANT ADDITIONAL INFORMATION
In connection with the proposed transaction, Huntington has filed with the SEC a Registration Statement on Form S-4 on November 13, 2025 (the “Registration
Statement”), that includes a Joint Proxy Statement of Huntington and Cadence and a Prospectus of Huntington, as well as other relevant documents concerning the proposed transaction. The Registration Statement is available at
https://www.sec.gov/Archives/edgar/data/49196/000114036125041757/ny20057909x1_s4.htm. The proposed transaction involving Huntington and Cadence will be submitted to Huntington’s shareholders and Cadence’s shareholders for their consideration. This
communication does not constitute an offer to sell or the solicitation of an offer to buy any securities or a solicitation of any vote or approval, nor shall there be any sale of securities in any jurisdiction in which such offer, solicitation or
sale would be unlawful prior to registration or qualification under the securities laws of any such jurisdiction. INVESTORS, SHAREHOLDERS OF HUNTINGTON AND SHAREHOLDERS OF CADENCE ARE URGED TO READ THE REGISTRATION STATEMENT AND THE JOINT PROXY
STATEMENT/PROSPECTUS REGARDING THE TRANSACTION AND ANY OTHER RELEVANT DOCUMENTS FILED WITH THE SEC AND THE FEDERAL RESERVE, AS WELL AS ANY AMENDMENTS OR SUPPLEMENTS TO THOSE DOCUMENTS, BECAUSE THEY CONTAIN IMPORTANT INFORMATION. Shareholders are able
to obtain a free copy of the definitive joint proxy statement/prospectus, as well as other filings containing information about Huntington and Cadence, without charge, at the SEC’s website (http://www.sec.gov) and Cadence’s website
(https://ir.cadencebank.com/fdic-federal-reserve-filings), respectively. Copies of the joint proxy statement/prospectus, when available, and the filings with the SEC and the Federal Reserve that are incorporated by reference in the joint proxy
statement/prospectus can also be obtained, without charge, by directing a request to Huntington Investor Relations, Huntington Bancshares Incorporated, Huntington Center, HC0935, 41 South High Street, Columbus, Ohio 43287, (800) 576-5007. Copies of
the joint proxy statement/prospectus, when available, and filings containing information about Cadence may be obtained after their filing with the Federal Reserve at (https://ir.cadencebank.com/fdic-federal-reserve-filings), by directing a request to
Will Fisackerly, Cadence Investor Relations, Cadence Bank, (800) 698-7878, IR@cadencebank.com. References to Cadence’s website do not constitute incorporation by reference of the information contained on the website and are not, and should not be,
deemed part of this filing.
PARTICIPANTS IN THE SOLICITATION
Huntington, Cadence, and certain of their respective directors and executive officers may be deemed to be participants in the solicitation of proxies from the
shareholders of Huntington and shareholders of Cadence in connection with the proposed transaction. Information regarding the interests of the directors and executive officers of Huntington and Cadence and other persons who may be deemed to be
participants in the solicitation of shareholders of Huntington and Cadence in connection with the transaction and a description of their direct and indirect interests, by security holdings or otherwise, are included in the definitive joint proxy
statement/prospectus related to the transaction, which was filed by Huntington with the SEC. Information regarding Huntington’s directors and executive officers is available in its definitive joint proxy statement relating to its 2025 Annual Meeting
of Shareholders, which was filed with the SEC on March 6, 2025, and other documents filed by Huntington with the SEC. Information regarding Cadence’s directors and executive officers is available in its definitive proxy statement relating to its
2025 Annual Meeting of Shareholders, which was filed with the Federal Reserve on March 14, 2025, and other documents filed by Cadence with the Federal Reserve. Other information regarding the participants in the proxy solicitation and a description
of their direct and indirect interests, by security holdings or otherwise, are contained in the joint proxy statement/prospectus and other relevant materials filed with the SEC and the Federal Reserve by Huntington and Cadence, respectively. Free
copies of these documents may be obtained as described above under “Important Additional Information.”
SIGNATURES
Pursuant to the requirements of the Securities Exchange Act of 1934, the Registrant has duly caused this report to be signed on its behalf by
the undersigned hereunto duly authorized.
| |
HUNTINGTON BANCSHARES INCORPORATED
|
| |
|
|
|
Date: December 1, 2025
|
By:
|
/s/Marcy C. Hingst
|
| |
|
Marcy C. Hingst
General Counsel and Corporate Secretary
|
Exhibit 23.1
Consent of Independent Registered Public Accounting Firm
We consent to the inclusion in this Current Report on Form 8-K of Huntington Bancshares Incorporated of our reports dated February 21, 2025, with respect
to the financial statements of Cadence Bank and the effectiveness of internal control over financial reporting, included in Cadence Bank’s Annual Report on Form 10‑K for the year ended December 31, 2024.
/s/ Forvis Mazars, LLP
Fort Worth, Texas
December 1, 2025
Exhibit 99.1
BOARD OF GOVERNORS OF THE
FEDERAL RESERVE SYSTEM
Washington, D.C. 20551
FORM 10-K
(Mark One)
|
x |
ANNUAL REPORT PURSUANT TO SECTION 13 OR 15(d) OF THE SECURITIES EXCHANGE ACT OF 1934 |
For the fiscal year ended December 31, 2024
OR
|
¨ |
TRANSITION REPORT PURSUANT TO SECTION 13 OR 15(d) OF THE SECURITIES EXCHANGE ACT OF 1934 |
For the transition period from ______________ to ______________
FDIC Certificate No. 11813
CADENCE BANK
(Exact name of registrant as specified in its charter)
| Mississippi |
|
64-0117230 |
| (State or other jurisdiction of incorporation or |
|
(I.R.S. Employer Identification No.) |
| organization) |
|
|
| |
|
|
| One Mississippi Plaza, 201 South Spring Street |
|
|
| Tupelo, Mississippi |
|
38804 |
| (Address of principal executive offices) |
|
(Zip Code) |
Registrant’s telephone number, including area code: (662) 680-2000
Securities registered pursuant to Section 12(b) of the Act:
| Title of Each Class |
|
Trading Symbol(s) |
|
Name of Each Exchange on Which Registered |
| Common stock, $2.50 par value per share |
|
CADE |
|
New York Stock Exchange |
| 5.50% Series A Non-Cumulative Perpetual Preferred Stock, par value $0.01 per share |
|
CADE Pr A |
|
New York Stock Exchange |
Securities registered pursuant to Section 12(g) of the Act: None.
Indicate by check mark if the registrant is a well-known seasoned issuer, as defined in
Rule 405 of the Securities Act. Yes x No ¨
Indicate by check mark if the registrant is not required to file reports pursuant to
Section 13 or Section 15(d) of the Act. Yes ¨ No x
Indicate by check mark whether the registrant (1) has filed all reports required to be
filed by Section 13 or 15(d) of the Securities Exchange Act of 1934 during the preceding 12 months (or for such shorter period that the registrant was required to file such reports), and (2) has been subject to such filing requirements for the past
90 days. Yes x No ¨
Indicate by check mark whether the registrant has submitted electronically every
Interactive Data File required to be submitted pursuant to Rule 405 of Regulation S-T (§ 232.405 of this chapter) during the preceding 12 months (or for such shorter period that the registrant was required to submit such files). Yes x No ¨
Indicate by check mark whether the registrant is a large accelerated filer, an accelerated filer, a non-accelerated filer, a smaller reporting
company, or an emerging growth company. See the definitions of “large accelerated filer,” “accelerated filer,” “smaller reporting company,” and “emerging growth company” in Rule 12b-2 of the Exchange Act.
| Large accelerated filer x |
Accelerated filer ¨ |
| Non-accelerated filer ¨ |
Smaller reporting company ¨ |
| |
Emerging growth company ¨ |
If an emerging growth company, indicate by check mark if the registrant has elected not
to use the extended transition period for complying with any new or revised financial accounting standards provided pursuant to Section 13(a) of the Exchange Act. ¨
Indicate by check mark whether the registrant has filed a report on and attestation to
its management’s assessment of the effectiveness of its internal control over financial reporting under Section 404(b) of the Sarbanes-Oxley Act (15 U.S.C. 7262(b)) by the registered public accounting firm that prepared or issued its audit report.
Yes x No ¨
If securities are registered pursuant to Section 12(b) of the Act, indicate by check mark
whether the financial statements of the registrant included in the filing reflect the correction of an error to previously issued financial statements. ¨
Indicate by check mark whether any of those error corrections are restatements that
required a recovery analysis of incentive-based compensation received by any of the registrant’s executive officers during the relevant recovery period pursuant to §240.10D-1(b). ¨
Indicate by check mark whether the registrant is a shell company (as defined in Rule
12b-2 of the Act). Yes ¨ No x
The aggregate market value of the registrant’s common stock held by non-affiliates of the registrant on June 30, 2024 was $5.1 billion, based on
the last reported sale price per share of the registrant’s common stock as reported on the New York Stock Exchange on June 30, 2024.
As of February 18, 2025, the registrant had outstanding 183,525,441 shares of common stock, par value $2.50 per share, and 6,900,000 shares of its
5.50% Series A Non-Cumulative Perpetual Preferred Stock, par value $0.01 per share.
DOCUMENTS INCORPORATED BY REFERENCE
To the extent stated herein, portions of the Definitive Proxy Statement on Schedule 14A to be used in connection with the registrant’s 2025 Annual
Meeting of Shareholders, scheduled to be held April 23, 2025, are incorporated by reference into Part III of this annual report on Form 10-K.
CADENCE BANK
FORM 10-K
For the Fiscal Year Ended December 31, 2024
TABLE OF CONTENTS
Glossary of Defined Terms
ACH - Automated Clearing House
ACL - Allowance for credit losses
AFS - Available for sale
AI - Artificial intelligence
ALM - Asset/liability management
ALCO - Asset/Liability Management Committee
AOCI - Accumulated other comprehensive income (loss)
ASC - Accounting Standards Codification
ASU - Accounting Standards Update
ATM - Automated teller machine
Basel III - Basel Committee’s 2010 Regulatory Capital Framework (Third Accord)
Basel Committee - Basel Committee on Banking Supervision
BHC Act - Bank Holding Company Act of 1956, as amended
Board - the Company’s Board of Directors
BOLI - Bank-owned life insurance
BTFP - Bank Term Funding Program
C&I - Commercial and industrial
CAD - Construction, acquisition and development
CAMT - Corporate alternative minimum tax rate
CDE - Community development entity
CECL - ASU 2016-13, Measurement of Credit Losses on Financial Instruments (“Current Expected Credit Losses”)
CEO - Chief Executive Officer
CET1 - Common Equity Tier 1
CFO - Chief Financial Officer
CFPB - Consumer Financial Protection Bureau
CIO - Chief Information Officer
CIS - Center for Internet Security
CISM - Certified Information Security Manager
CISO - Chief Information Security Officer
CISSP - Certified Information Systems Security Professional
Code - Code of Business Conduct and Ethics
CODM - Chief operating decision maker
Company - Cadence Bank and its subsidiaries
COO - Chief Operating Officer
COSO - Committee of Sponsoring Organizations of the Treadway Commission
COVID-19 - Coronavirus Disease 2019
CPR - Conditional Prepayment Rate
CRA - Community Reinvestment Act of 1977
CRE - Commercial real estate
CSC - Contractual servicing cost
DIF - Deposit Insurance Fund
DOJ - U.S. Department of Justice
EAP - Employee Assistance Program
EIR - Effective interest rate
EPS - Earnings per share
ESG - Environmental, Social and Governance
Exchange Act - Securities Exchange Act of 1934, as amended
EVE - Economic value of equity
FASB - Financial Accounting Standards Board
FDI Act - Federal Deposit Insurance Act
FDIC - Federal Deposit Insurance Corporation
FDICIA - Federal Deposit Insurance Corporation Improvement Act of 1991
FDM - Financial difficulty modification
Federal Reserve - Board of Governors of the Federal Reserve System
FHA - Federal Housing Administration
FHLB - Federal Home Loan Bank
FHLMC - Federal Home Loan Mortgage Corporation
FinCEN - Financial Crimes Enforcement Network
FNMA - Federal National Mortgage Association
FRB - Federal Reserve Bank
FTE - Fully taxable equivalent
GAAP - Generally Accepted Accounting Principles in the United States
GNMA - Government National Mortgage Association
HTC - Historic tax credits
IRA of 2022 - Inflation Reduction Act of 2022
IRR - Interest rate risk
ITM - Interactive teller machine
MBS - Mortgage-backed securities
MDBCF - Mississippi Department of Banking and Consumer Finance
MSR - Mortgage servicing rights
NAV - Net asset value
NII - Net interest income
NM - Not meaningful
NMTC - New market tax credit
NPA - Nonperforming asset(s)
NPL - Nonperforming loan(s)
NSF - Nonsufficient funds
NYSE - New York Stock Exchange
OCC - Office of the Comptroller of the Currency
OREO - Other real estate owned
PCAOB - Public Company Accounting Oversight Board
PCD - Purchased credit deteriorated
PSU - Performance stock unit
ROU - Right of use
RSA - Restricted stock award
RSU - Restricted stock unit
SBA - Small Business Administration
SBIC - Small Business Investment Company
SEC - U.S. Securities and Exchange Commission
SNC - Shared National Credit
SOFR - Secured Overnight Financing Rate
TBA - To be announced
TDR - Troubled debt restructuring
USDA - U.S. Department of Agriculture
VA - U.S. Department of Veterans Affairs
VIE - Variable interest entity
CAUTIONARY NOTE REGARDING FORWARD LOOKING STATEMENTS
Certain statements made in this annual report on Form 10-K (this “Report”) are not statements of historical fact and constitute “forward-looking
statements” within the meaning of Section 21E of the Exchange Act, and are subject to the safe harbor created thereby under the Private Securities Litigation Reform Act of 1995 as well as the “bespeaks caution” doctrine. These statements are often, but
not always, made through the use of words or phrases such as “anticipate,” “aspire,” “assume,” “believe,” “budget,” “contemplate,” “continue,” “could,” “estimate,” “expect,” “forecast,” “foresee,” “goal,” “hope,” “indicate,” “intend,” “may,” “might,”
“outlook,” “plan,” “project,” “projection,” “predict,” “prospect,” “potential,” “roadmap,” “seek,” “should,” “target,” “will,” and “would,” or the negative versions of those words, or other comparable words of a future or forward-looking nature. These
forward-looking statements may include, without limitation, discussions regarding general economic, interest rate, real estate market, competitive, employment, and credit market conditions; our assets; business; cash flows; financial condition;
liquidity; prospects; results of operations, and the Company’s ability to deploy capital into strategic and growth initiatives; deposit growth interest and fee-based revenue; capital resources; capital metrics; efficiency ratio; valuation of mortgage
servicing rights; mortgage production volume; net income; net interest revenue; non-interest revenue; net interest margin; interest expense; non-interest expense; earnings per share; interest rate sensitivity; interest rate risk; balance sheet and
liquidity management; off-balance sheet arrangements; fair value determinations; asset quality; credit quality; credit losses; provision and allowance for credit losses, impairments, charge-offs, recoveries and changes in volume; investment securities
portfolio yields and values; ability to manage the impact of pandemics and natural disasters; adoption and use of critical accounting policies; adoption and implementation of new accounting standards and their effect on our financial results and our
financial reporting; utilization of non-GAAP financial metrics; declaration and payment of dividends; ability to pay dividends or coupons on our 5.5% Series A Non-Cumulative Perpetual Preferred Stock, par value $0.01 per share, or our subordinated
notes; mortgage and commission revenue growth; implementation and execution of cost savings initiatives; ability to successfully litigate, resolve or otherwise dispense with threatened, ongoing and future litigation and administrative and investigatory
matters; ability to successfully complete pending or future acquisitions or divestitures; dispositions and other strategic growth opportunities and initiatives; ability to successfully integrate and manage acquisitions or divestitures; opportunities
and efforts to grow market share; reputation; ability to compete with other financial institutions; ability to recruit and retain key employees and personnel; access to capital markets; investment in other financial institutions; and ability to operate
our regulatory compliance programs in accordance with applicable law.
Forward-looking statements are based upon management’s expectations as well as certain assumptions and estimates made by, and information
available to, management at the time such statements were made. Forward-looking statements are not historical facts, are not guarantees of future results or performance and are subject to certain known and unknown risks, uncertainties and other factors
that are beyond our control and that may cause actual results to differ materially from those expressed in, or implied by, such forward-looking statements. These risks, uncertainties and other factors include, without limitation, general economic,
unemployment, credit market and real estate market conditions, and the effect of such conditions on the creditworthiness of borrowers, collateral values, the value of investment securities and asset recovery values; the risks of changes in interest
rates and their effects on the level and composition of deposits, loan demand, loan repayment velocity, and the values of loan collateral, securities and interest sensitive assets and liabilities; risks arising from market reactions to the banking
environment in general, or to conditions or situations at specific banks; risks arising from perceived instability in the banking sector; the impact of inflation, the failure of assumptions underlying the establishment of reserves for possible credit
losses, fair value for loans and other real estate owned; changes in the prices, values and sales volumes of residential and commercial real estate, especially as they relate to the value of collateral supporting the Company’s loans; a deterioration of
the credit rating for U.S. long-term sovereign debt, actions that the U.S. government may take to avoid exceeding the debt ceiling, or uncertainties surrounding the debt ceiling and the federal budget; the availability of and access to capital;
possible downgrades in our credit ratings or outlook which could increase the costs or availability of funding from capital markets; the ability to attract new or retain existing deposits or to retain or grow loans; potential delays or other problems
in implementing and executing our growth, expansion and acquisition or divestment strategies, including delays in obtaining regulatory or other necessary approvals, including in obtaining the approval of any pending transaction, or the failure to
realize any anticipated benefits or synergies from any acquisitions or growth strategies; significant turbulence or a disruption in the capital or financial markets; the effect of a fall in stock market prices on our investment banking business and our
fee income from our brokerage and wealth management businesses; the ability to grow additional interest and fee income or to control noninterest expense; competitive factors and pricing pressures, including their effect on our net interest margin;
changes in legal, financial and/or regulatory requirements (including those related to share repurchases); recently enacted and potential legislation and regulatory actions and the costs and expenses to comply with new and/or existing legislation and
regulatory actions, and any related rules and regulations; changes in U.S. Government monetary, fiscal and trade policy, including any changes that may result from U.S. elections; special assessments or changes to regular assessments by banking
regulators; possible adverse rulings, judgments, settlements and other outcomes of pending or future litigation or government actions; the ability to keep pace with technological changes, including changes regarding generative artificial intelligence,
maintaining cybersecurity and compliance with applicable cybersecurity regulatory requirements; increased competition in the financial services industry, particularly from regional and national institutions, as well as from fintech companies, risks
related to our reliance on third parties to provide key components of our business infrastructure, including the risks related to disruptions in services provided by disputes with, or financial difficulties of a third-party vendor, the impact of
failure in, or breach of, our operational or security systems or infrastructure, or those of third parties with whom we do business, including as a result of cyber-attacks or an increase in the incidence or severity of fraud, illegal payments, security
breaches or other illegal acts impacting us or our customers; natural disasters or acts of war or terrorism; international or political instability (including the impacts related to or resulting from Russia’s military action in Ukraine, or the
Israel-Hamas war, including the imposition of additional sanctions and export controls, as well as the broader impacts to financial markets and the global macroeconomic and geopolitical environments); risks related to, and the costs associated with,
ESG matters, including the scope and pace of related rulemaking activity; impairment of our goodwill or other intangible assets; adoption of new accounting standards or changes in existing standards; and other factors described in “Part I, Item 1A.
Risk Factors” in this Report or as detailed from time to time in the Company’s press and news releases, reports and other filings we file with the federal banking regulators.
The Company faces risks from: possible adverse rulings, judgments, settlements or other outcomes of pending, ongoing and future litigation, as
well as governmental, administrative and investigatory matters; the impairment of the company’s goodwill or other intangible assets; losses of key employees and personnel; the diversion of management’s attention from ongoing business operations and
opportunities; and the Company’s success in executing its business plans and strategies, and managing the risks involved in all of the foregoing.
Although the Company believes that the expectations reflected in these forward-looking statements are reasonable as of the date of this Report, if
one or more events related to these or other risks or uncertainties materialize, or if the Company’s underlying assumptions prove to be incorrect, actual results may prove to be materially different from the results expressed or implied by the
forward-looking statements. Accordingly, undue reliance should not be placed on any forward-looking statements. The forward-looking statements speak only as of the date of this Report, and the Company does not undertake any obligation to publicly
update or review any forward-looking statement, whether as a result of new information, future developments or otherwise, except as required by applicable law. New risks and uncertainties may emerge from time to time, and it is not possible for the
Company to predict their occurrence or how they will affect the Company. All written or oral forward-looking statements attributable to us are expressly qualified in their entirety by this section.
PART I
ITEM 1. BUSINESS.
COMPANY OVERVIEW
Cadence Bank (“We,” “Our,” or the “Company”), originally chartered in 1876, is a Mississippi state chartered commercial bank with dual
headquarters in Houston, Texas and Tupelo, Mississippi. The Company conducts commercial banking and financial services directly and through its banking-related subsidiaries. The Company operates over 350 commercial banking and mortgage locations in
Alabama, Arkansas, Florida, Georgia, Louisiana, Mississippi, Missouri, Tennessee and Texas.
Our common stock and our preferred stock are listed on the New York Stock Exchange under the symbols “CADE” and “CADE Pr A”, respectively. During
the fourth quarter of 2021, we changed our corporate name from BancorpSouth Bank to Cadence Bank in connection with our acquisition of Cadence Bancorporation. At December 31, 2024, the Company had total assets of $47.0 billion; total loans, net of
unearned income, of $33.7 billion; total deposits of $40.5 billion; and shareholders’ equity of $5.6 billion.
During the fourth quarter of 2024, the Company applied for and became a member of the Federal Reserve System. The Federal Reserve Board of St.
Louis is now the Company’s primary federal regulator in place of the FDIC.
The Company’s investor relations website address is https://ir.cadencebank.com. The Company makes available its annual reports on Form 10-K,
quarterly reports on Form 10-Q, current reports on Form 8-K, and all amendments to those reports free of charge on its investor website under the caption “Public Filings” as soon as reasonably practicable after such material is electronically filed
with, or furnished to, the Federal Reserve. The Company’s websites and the information contained therein or linked thereto are not, and are not intended to be, incorporated into this Report.
PRODUCTS AND SERVICES
LENDING ACTIVITIES
The Company’s lending activities include both commercial and consumer loans. Loan originations are derived from a number of sources including
direct solicitation by the Company’s loan officers, existing depositors and borrowers, builders, attorneys, walk-in customers and, in some instances, other lenders, real estate broker referrals and mortgage loan companies. The Company has established
systematic procedures for approving and monitoring loans that vary depending on the size and nature of the loan and applies these procedures in a disciplined manner.
Our loan and lease portfolio includes commercial and industrial loans, residential real estate loans, commercial real estate loans and consumer
loans. The principal risk associated with each category of loans we make is the creditworthiness of the borrower. Borrower creditworthiness is affected by general economic conditions, the attributes of the borrower and the borrower’s market or
industry. Attributes of the relevant business market or industry include the competitive environment, customer and supplier availability, the threat of substitutes and barriers to entry and exit.
Commercial Lending
The Company offers a variety of commercial loan services including term loans, lines of credit, equipment and receivable financing, energy,
restaurant, healthcare, technology, SBA, and agricultural loans. A broad range of short-to-medium term commercial loans, both secured and unsecured, are made available to businesses for working capital (including inventory and receivables), business
expansion (including acquisition and development of real estate and improvements), and the purchase of equipment and machinery. The Company also makes construction loans to real estate developers for the acquisition, development and construction of
residential and commercial properties.
Commercial loans are granted based on the borrower’s ability to generate cash flow to support its debt obligations and other cash related
expenses. A borrower’s ability to repay commercial loans is substantially dependent on the success of the business itself and on the quality of its management. As a general practice, the Company takes as collateral a security interest in any available
real estate, equipment, inventory, receivables, or other personal property, although such loans may also be made infrequently on an unsecured basis. In many instances, the Company requires personal guarantees of its commercial loans to provide
additional credit support.
The Company’s exposure to agricultural lending is minimal. Agricultural loans are generally supported by the financial strength of the borrower
and secured by the crops/livestock, crop insurance, equipment or real estate.
Residential Consumer Lending
A portion of the Company’s lending activity consists of the origination of fixed and adjustable-rate residential mortgage loans secured by
owner-occupied property located in the Company’s primary market areas. Home mortgage banking is unique in that a broad geographic territory may be served by originators working from strategically placed offices either within the Company’s traditional
banking facilities or from other locations. In addition, the Company offers construction loans, second mortgage loans and home equity lines of credit.
The Company finances the construction of individual, owner-occupied houses on the basis of written underwriting and construction loan management
guidelines. First mortgage construction loans are made to qualified individual borrowers and are generally supported by a take-out commitment from a permanent lender. The Company makes residential construction loans to individuals who intend to erect
owner-occupied housing on a purchased parcel of real estate. The construction phase of these loans has certain risks, including the viability of the contractor, the contractor’s ability to complete the project and changes in interest rates.
Mortgage lending serves to finance residential properties through long-term mortgages, both sold into the secondary market and retained in the
bank portfolio. Ongoing efforts to grow the bank portfolio through the company’s Right@Home product for low- to moderate-income borrowers have contributed to the department’s production. Revenue is primarily derived from loan origination and servicing
fees paid to the company by government-sponsored enterprises and other investors who purchase the mortgages after origination.
The sale of mortgage loans to the secondary market allows the Company to manage the interest rate risk related to such lending operations.
Generally, after the sale of a loan with servicing retained, the Company’s only involvement is to act as a servicing agent. In certain cases, the Company may be required to repurchase mortgage loans upon which customers have defaulted that were
previously sold in the secondary market if these loans did not meet the underwriting standards of the entity that purchased the loans.
Non-Residential Consumer Lending
Non-residential consumer loans made by the Company include loans for automobiles, recreation vehicles, boats, personal (secured and unsecured) and
deposit account secured loans. Non-residential consumer loans are attractive to the Company because they typically have a shorter term and carry higher interest rates than those charged on other types of loans.
The Company also issues credit cards solicited on the basis of applications received through referrals from the Company’s branches and other
marketing efforts. The Company generally has a small portfolio of credit card receivables outstanding. Credit card lines are underwritten using conservative credit criteria, including past credit history and debt-to- income ratios, similar to the
credit policies applicable to other personal consumer loans.
The Company grants consumer loans based on employment and financial information solicited from prospective borrowers as well as credit records
collected from various reporting agencies. Financial stability and credit history of the borrower are the primary factors the Company considers in granting such loans. The availability of collateral is also a factor considered in making such loans. The
geographic area of the borrower is another consideration, with preference given to borrowers in the Company’s primary market areas.
Shared National Credits
The federal banking agencies define a SNC as any loan(s) extended to a borrower by a supervised institution or any of its subsidiaries and
affiliates which aggregates $100 million or more and is shared by three or more institutions under a formal lending agreement or a portion of which is sold to two or more institutions, with the purchasing institutions assuming its pro rata share of the
credit risk. As part of our commercial focused relationship banking, we may act as an agent or participate in syndicated loan offerings because of the size of the customers and nature of industries we serve. On December 31, 2024, we have $4.1 billion
of outstanding SNCs, representing 12.3% of total loans.
For more information regarding the Company’s loans and leases, see “Management’s Discussion And Analysis of Financial Condition And Results Of
Operations – Loans and Leases.”
DEPOSITS
We offer our customers a variety of deposit products, including checking accounts, savings accounts, money market accounts, time deposits, and
other deposit accounts through multiple channels, including our extensive network of full-service branches, drive-through branches, ATMs, ITMs, and our online, mobile, and telephone banking platforms. At December 31, 2024, our total deposits were $40.5
billion and were comprised of 21.2% in noninterest-bearing deposits and 78.8% in interest bearing deposits. We intend to continue our efforts to provide funding for our business from customer relationship deposits.
The Company has been able to compete effectively for deposits in its primary market areas, while continuing to manage the exposure to higher
interest rates. The distribution and market share of deposits by type of deposit and by type of depositor are important considerations in the Company’s assessment of the stability of its funding sources and its access to additional funds. Furthermore,
management shifts the mix and maturity of the deposits depending on economic conditions and loan and investment policies in an attempt, within set policies, to minimize cost and maximize net interest margin.
For more information regarding the Company’s deposits, see “Management’s Discussion And Analysis of Financial Condition And Results Of Operations
– Deposits.”
OTHER SERVICES
Through Linscomb Wealth Inc., formerly Linscomb & Williams Inc., a subsidiary of Cadence Bank, and Cadence Trust, a division of Cadence Bank,
we offer wealth management and other fiduciary and private banking services targeted to affluent clients, including individuals, business owners, families, and professional service companies. In addition to generating fiduciary and investment
management fee income, we believe these services enable us to build new relationships and expand existing relationships to grow our deposits and loans. Through our wealth management line of business and our relationship with LPL Financial LLC, we offer
financial planning, retirement services and trust and investment management by a team of seasoned advisors, providing access for affluent clients as well as mass market clients, to a wide range of certificates of deposits, mutual funds, estate planning
products, insurance and annuities, individual retirement accounts, stocks, bonds, brokerage accounts, money market accounts, investment advisory services, and other financial products and services. Although we do not limit our customers to affluent
clients and business owners, the focus of our wealth management line of business is on the “mass affluent” ($500,000 to $2 million in investible assets) and “highly affluent” ($2 million to $5 million in investible assets) markets.
In addition to traditional banking activities and the other products and services specified above, we provide a broad array of financial services
to our customers, including: debit and credit card products, treasury management services, merchant services, automated clearing house services, lock-box services, remote deposit capture services, foreign exchange services, and other treasury services.
COMPETITION
Vigorous competition exists in all major areas where the Company is engaged in business. The Company competes for available loans and deposit
accounts with banks, thrifts, insurance companies, credit unions, mortgage bankers and finance companies, money market mutual funds, other financial services companies and fintech companies, some of which are not subject to the same degree of
regulation and restrictions imposed upon us. None of these competitors are dominant in the entire area served by the Company.
The principal areas of competition in the banking industry center on a financial institution’s ability and willingness to provide credit on a
timely and competitively priced basis, to offer a sufficient range of deposit and investment opportunities at competitive prices and maturities, and to offer personal and business financial services of sufficient quality and at competitive prices.
Management believes that the Company can compete effectively in all of these areas.
CREDIT POLICIES AND PROCEDURES
In the normal course of business, the Company assumes risks in extending credit. The Company manages these risks through underwriting in
accordance with its lending policies, loan review procedures and the diversification of its loan and lease portfolio. Although it is not possible to predict credit losses with certainty, management regularly reviews the characteristics of the loan and
lease portfolio to determine its overall risk profile and quality.
The provision for credit losses is the periodic cost (or credit) of providing an allowance or reserve for expected losses on loans and leases. The
Board of Directors has appointed a Credit Committee, composed of senior management and credit administration staff which meets on a quarterly basis or more frequently if required to review the recommendations of several internal working groups
developed for specific purposes including the allowance for credit losses, specific provision amounts, and charge-offs. The Allowance for Credit Losses (ACL) Group bases its estimates of credit losses on three primary components: (1) estimates of
expected losses that exist in various segments of performing loans and leases over the remaining contractual life of the loan portfolio using a reasonable and supportable economic forecast; (2) specifically identified losses in individually analyzed
credits which are collateral-dependent, which generally include loans internally graded as impaired and PCD Loss loans; and (3) qualitative factors related to economic conditions, portfolio concentrations, regulatory policy updates and other relevant
factors that address estimates of expected losses not fully addressed based upon management’s judgment of portfolio conditions.
The Company utilizes credit risk models to estimate the probability of default and loss given default of loans over their remaining life. Credit
factors such as financial condition of the borrower and guarantor, recent credit performance, delinquency, liquidity, cash flows, collateral type and value are used by the models to assess credit risk. In some cases, such as credit cards, a loss rate
model is used where lifetime loss rates are applied. Estimates of expected losses are influenced by the historical net losses experienced by the Company for loans and leases of comparable creditworthiness and structure. Specific loss assessments are
performed for loans and leases based upon the collateral protection. The Company’s reasonable and supportable eight quarter economic forecast is utilized to estimate credit losses before reverting to longer term historical loss experience. The Company
subscribes to various economic services and publications to assist with the development of inputs used in the modeling and qualitative framework for the ACL calculation. The economic forecasts consider changes in real gross domestic product,
unemployment rate, interest rates, valuations for residential and commercial real estate, and other indicators that may be correlated with the Company’s expected credit losses.
During 2024, the impact of inflation and higher interest rates resulted in concern that similar economic conditions may continue into 2025, and
the heightened risk of future customer loan defaults remains. The ACL estimate includes both portfolio changes and changes in economic conditions experienced during the period as well as forecasted to occur. The unemployment rate has the highest
weighting within the Company’s credit modeling framework. The Company’s forecast for unemployment includes a range between 4.17% and 5.83% through the fourth quarter of 2026. The Company considers several forecasts from external sources with management
weighting the forecast mix 60% baseline and 40% downside in the fourth quarter of 2024. In addition, qualitative factors such as changes in economic conditions, concentrations of risk, and changes in portfolio risk resulting from regulatory changes are
considered in determining the adequacy of the level of the ACL. Attention is paid to the quality of the loan and lease portfolio through a formal loan review process. An independent loan review department of the Company is responsible for reviewing the
credit rating and classification of individual credits and assessing trends in the portfolio, adherence to internal credit policies and procedures and other factors that may affect the overall adequacy of the ACL. The ACL Group is responsible for
ensuring that the allowance for credit losses provides adequate coverage of expected losses. The ACL Group meets at least quarterly to determine the amount of adjustments to the ACL, and it is comprised of senior management from the Company’s Credit
Administration, Risk, and Finance departments.
The Impairment Group is responsible for evaluating individual loans that have been specifically identified through various channels, including
examination of the Company’s watch list, past due listings, and loan officer assessments. An analysis is prepared to assess the extent the loan is collateral-dependent and whether a loss exposure exists, which is reviewed by the Impairment Group. The
Impairment Group reviews all loans where a borrower is considered to be experiencing financial difficulty if the loan is $1.0 million or greater to determine if it is probable that the Company will be unable to collect the contractual principal and
interest on the loan. The fair value of the underlying collateral is considered if the loan is collateral-dependent. The Impairment Group meets at least quarterly, and it is made up of senior management from the Company’s Credit Administration, Risk
and Finance departments.
In March 2022, the FASB issued ASU No. 2022-02, which eliminated the TDR accounting model for creditors that have adopted ASC 326. The guidance
became effective for the Company beginning January 1, 2023, and the Company elected to adopt the guidance via the modified retrospective transition method. With the removal of the TDR model, all loan modifications are now accounted for under the
general loan modification guidance in Subtopic 310-20. The update also requires enhanced disclosures regarding loan modifications for borrowers experiencing financial difficulty.
Loans of $1.0 million or more that are identified as collateral-dependent, which generally include loans internally graded as impaired or PCD Loss
loans, are reviewed by the Impairment Group which approves the amount of specific reserve, if any, and/or charge-off amounts. The evaluation of real estate loans generally focuses on the fair value of underlying collateral less estimated costs to sell
obtained from appraisals, as the repayment of these loans may be dependent on the liquidation of the collateral. In certain circumstances, other information such as comparable sales data is deemed to be a more reliable indicator of fair value of the
underlying collateral than the most recent appraisal. In these instances, such information is used in determining the specific provision recorded for the loan. For commercial and industrial loans, the evaluation generally focuses on these
considerations, as well as the projected liquidation of any pledged collateral. Our larger corporate and specialized industry loans are underwritten to the underlying enterprise value of the borrower. The value is in the equity of the business as a
going concern. Many valuation approaches are used in these situations including discounted cash flow, multiple of cash flow, or comparable sales approaches. The Impairment Group reviews the results of each evaluation and approves the final specific
provision amounts, which are then included in the analysis of the adequacy of the ACL in accordance with ASC 326.
A new appraisal is generally ordered for loans $1.0 million or greater that have characteristics of potential specific provision, such as
delinquency or other loan-specific factors identified by management, when a current appraisal (dated within the prior 12 months) is not available or when a current appraisal uses assumptions that are not consistent with the expected disposition of the
loan collateral. To measure a specific provision properly at the time that a loan is reviewed, a bank officer may estimate the collateral fair value based upon earlier appraisals received from outside appraisers, sales contracts, approved foreclosure
bids, comparable sales, officer estimates or current market conditions until a new appraisal is received. This estimate can be used to determine the extent of the specific provision on the loan. After a loan is determined to be collateral-dependent, it
is management’s policy to obtain an updated appraisal on at least an annual basis for impaired loans with a remaining recorded investment of $200 thousand and greater. Management performs a review of the pertinent facts and circumstances of each
collateral-dependent loan, such as changes in outstanding balances, information received from loan officers and receipt of re-appraisals, at least quarterly. As of each review date, management considers whether additional provision and/or charge-offs
should be recorded based on recent activity related to the loan-specific collateral as well as other relevant comparable assets. Any adjustment to reflect further exposure, either because management’s periodic review or as a result of an updated
appraisal, are made through recording additional ACL provisions and/or charge-offs.
When a guarantor is relied upon as a source of repayment, it is the Company’s policy to analyze the strength of the guaranty. This analysis varies
based on circumstances but may include a review of the guarantor’s personal and business financial statements and credit history, a review of the guarantor’s tax returns and the preparation of a cash flow analysis of the guarantor.
Any loan or portion thereof which is classified as “loss” or which is determined by management to be uncollectible because of factors such as the
borrower’s failure to pay interest or principal, the borrower’s financial condition, economic conditions in the borrower’s industry or the inadequacy of underlying collateral, is charged off.
The Company excludes accrued interest from interest income when it is determined that it is probable that all contractual principal and interest
will not be collected for loans.
REGULATION AND SUPERVISION
The following discussion sets forth certain material elements of the regulatory framework applicable to the Company. This discussion is a brief
summary of the regulatory environment in which the Company operates and is not designed to be a complete discussion of all statutes and regulations affecting the Company’s operations. Regulation of financial institutions is intended primarily for the
protection of depositors, the Deposit Insurance Fund and the safety and soundness of the U.S. financial system and generally is not intended for the protection of shareholders. Changes in applicable laws, and their implementation and application by
regulatory agencies, cannot necessarily be predicted but could have a material and adverse effect on the Company’s assets, business, cash flows, financial condition, liquidity, prospects and results of operations.
GENERAL
The Company is incorporated under the laws of the State of Mississippi and is subject to the applicable provisions of Mississippi banking laws, the
laws of the various states in which it operates, and federal law. The Company is subject to the supervision and examination of the Federal Reserve, CFPB, and the MDBCF. The Company’s deposits are insured by the FDIC to the fullest extent allowed by
law, and the FDIC has back-up supervisory authority over the Company. Violations of laws and regulations, or other unsafe and unsound practices, may result in regulatory agencies imposing fines or penalties, cease and desist orders, or other
enforcement actions. Under certain circumstances, these agencies may enforce these remedies directly against officers, directors, employees, and other parties participating in the affairs of a bank. Like all banks, we are regulated extensively under
federal and state law. Under federal and state laws and regulations pertaining to the safety and soundness of insured depository institutions, the Federal Reserve and the MDBCF have the authority to compel or restrict certain actions on our part if
they determine that we have insufficient capital or other resources, or are otherwise operating in a manner that may be deemed to be inconsistent with safe and sound banking practices. Under this authority, our regulators can require us or our
subsidiaries to enter into informal or formal supervisory agreements, including board resolutions, memoranda of understanding, written agreements and consent or cease and desist orders, pursuant to which we would be required to take identified
corrective actions to address cited concerns and to refrain from taking certain actions. Formal enforcement actions, such as formal agreements, consent orders and cease and desist orders are public and can negatively affect our reputation.
If we become subject to and are unable to comply with the terms of any regulatory actions or directives, supervisory agreements, or orders, then
we could become subject to additional, heightened supervisory actions and orders, possibly including prompt corrective action restrictions and/or other regulatory actions, including prohibitions on the payment of dividends on our common stock and
preferred stock. If our regulators were to take such supervisory actions, then we could, among other things, become subject to significant restrictions on our ability to develop any new business, as well as restrictions on our existing business, and we
could be required to raise additional capital, dispose of certain assets and liabilities within a prescribed period of time, or both. The terms of any such action could have a material negative effect on our business, reputation, operating flexibility,
financial condition, and the value of our common stock and preferred stock.
CHANGE IN CONTROL
Federal law restricts the amount of voting stock of a bank that a person may acquire without the prior approval of banking regulators. Under the
Change in Bank Control Act and the laws of the State of Mississippi, as well as the regulations thereunder, a person or group must give advance notice to the Federal Reserve and MDBCF before acquiring control of the Company. Upon receipt of such
notice, the Federal Reserve and/or MDBCF may approve or disapprove the acquisition. The Change in Bank Control Act creates a rebuttable presumption of control if a person or group acquires the power to vote 10% or more of our outstanding common stock.
The overall effect of such laws is to make it more difficult to acquire a bank by tender offer or similar means than it might be to acquire control of another type of corporation. Consequently, shareholders of the Company may be less likely to benefit
from the rapid increases in stock prices that may result from tender offers or similar efforts to acquire control of other companies. Investors should be aware of these requirements when acquiring shares of our stock.
GOVERNANCE AND FINANCIAL REPORTING OBLIGATIONS
We are required to comply with various corporate governance and financial reporting requirements under the Sarbanes-Oxley Act of 2002, as well as
rules and regulations adopted by the SEC, the PCAOB, and the NYSE. In particular, we are required to include management and independent registered public accounting firm reports on internal controls as part of our Annual Report on Form 10-K in order to
comply with Section 404 of the Sarbanes-Oxley Act. We have evaluated our controls, including compliance with the SEC rules on internal controls, and have and expect to continue to spend significant amounts of time and resources on compliance with these
rules. Our failure to comply with these internal control rules may materially adversely affect our reputation, ability to obtain the necessary certifications to financial statements, and the values of our securities.
CONSUMER FINANCIAL PROTECTION BUREAU
The CFPB is granted broad rulemaking, supervisory and enforcement powers under various federal consumer financial protection laws, including the
Equal Credit Opportunity Act, Truth in Lending Act, Real Estate Settlement Procedures Act, Fair Credit Reporting Act, Fair Debt Collection Practices Act, the Consumer Financial Privacy provisions of the Gramm-Leach- Bliley Act, and certain other
statutes. The CFPB has examination and primary enforcement authority under the consumer financial protection laws with respect to depository institutions with $10.0 billion or more in assets, including the Company.
The CFPB regulates the origination of mortgages, mortgage disclosures, mortgage servicing, foreclosures, and overdrafts, as well as many other
consumer issues. The CFPB has authority to enforce a prohibition of unfair, deceptive, or abusive practices in connection with the offering of consumer financial products. Additionally, the CFPB has proposed or will be proposing additional regulations,
or modifying existing regulations, that directly relate to our business. Although it is difficult to predict at this time the extent to which the CFPB’s rules impact the operations and financial condition of the Company, such rules may have a material
impact on the Company’s compliance costs, compliance risk, and fee income.
In March 2023, the CFPB issued a final rule to implement Section 1071 of the Dodd-Frank Act, which requires lenders to collect, and report
information about lending to “women owned, minority-owned and small businesses.” This rule is due to take effect in stages depending upon lending volume of the depository institution beginning in 2025. However, the final rule has been subject to
ongoing court challenges and may be revised by the CFPB. In December 2024, the CFPB finalized a rule that would substantially limit overdraft fees that larger institutions such as the Bank may charge consumers, with an effective date of October 1,
2025. If implemented, this rule would impact the Bank’s non-interest income. However, this rule has been challenged in court and may be revised by the CFPB. The CFPB issued a final rule in March 2024 that capped credit card late fees charged by certain
larger card issuers at $8.00. However, this final rule was subsequently enjoined by a court in Texas, and the litigation has continued. The Company is monitoring these developments, as well as executive orders and other directives from the executive
branch regarding the CFPB, its supervisory and examination activities, and the regulatory oversight applicable to the banking industry more broadly.
DIVIDENDS
Various federal and state laws limit the amount of dividends that the Company may pay to its shareholders without regulatory approval. Under
Mississippi law, the Company must obtain the non-objection of the Commissioner of the MDBCF prior to paying any dividend on the Company’s capital stock. Further, the Company may not pay any dividends if, after paying the dividend, it would be
undercapitalized under applicable capital requirements. The Federal Reserve also has the authority to prohibit the Company from engaging in business practices that the Federal Reserve considers to be unsafe or unsound, which, depending on the financial
condition of the Company, could include the payment of dividends.
CAPITAL REQUIREMENTS
We are required under federal law to maintain certain minimum capital levels based on ratios of capital to total assets and capital to
risk-weighted assets. The required capital ratios are minimums, and the Federal Reserve may determine that based on our size, complexity or risk profile, we must maintain a higher level of capital in order to operate in a safe and sound manner. Risks
such as concentration of credit risks and risks arising from non-traditional activities, as well as the institution’s exposure to a decline in the economic value of its capital due to changes in interest rates, and an institution’s ability to manage
those risks, are important factors that are to be taken into account in assessing an institution’s overall capital adequacy. The following is a brief description of the relevant provisions of these capital rules and their potential impact on our
capital levels.
We are subject to the following risk-based capital ratios: common equity Tier 1 (CET1) risk-based capital ratio, Tier 1 risk-based capital ratio,
which includes CET1 and additional Tier 1 capital, and total risk-based capital ratio, which includes Tier 1 and Tier 2 capital. CET1 is primarily comprised of the sum of common stock instruments and related surplus, net of treasury stock plus retained
earnings, less certain adjustments and deductions related to goodwill, intangible assets, mortgage servicing assets and deferred tax assets subject to temporary timing differences. Additional Tier 1 capital is primarily comprised of noncumulative
perpetual preferred stock. Tier 2 capital consists of instruments disqualified from Tier 1 capital, including qualifying subordinated debt and a limited amount of loan loss reserves up to a maximum of 1.25% of risk-weighted assets, subject to certain
eligibility criteria. The minimum capital to risk-weighted assets ratios are as follows: (1) CET1 of 4.5%, (2) Tier 1 capital of 6.0%, and (3) total capital of 8.0%. The capital rules also define the risk-weights assigned to assets and off- balance
sheet items to determine the risk-weighted asset components of the risk-based capital rules, including, for example, certain “high volatility” commercial real estate, past due assets, structured securities, and equity holdings.
The leverage capital ratio, which serves as a minimum capital standard, is the ratio of Tier 1 capital to quarterly average total consolidated
assets net of goodwill, certain other intangible assets and certain required deduction items. The required minimum leverage ratio for all banks is 4%.
In addition, the regulatory capital rules require a capital conservation buffer of 2.5%, comprised of CET1, above each of the minimum risk-based
capital ratio requirements (CET1, Tier 1, and total capital), which is designed to absorb losses during periods of economic stress. This buffer requirement must be met for the Company to be able to pay dividends, engage in share buybacks or make
discretionary bonus payments to executive management without restriction.
For more information, see the “Regulatory Capital” section of Item 7. “Management’s Discussion and Analysis of Financial Condition and Results of
Operations” of this Annual Report on Form 10-K.
PROMPT CORRECTIVE ACTION
The FDICIA requires federal bank regulatory authorities to take “prompt corrective action” with respect to depository institutions that do not
meet minimum capital requirements. For these purposes, FDICIA establishes five capital tiers: “well capitalized,” “adequately capitalized,” “undercapitalized,” “significantly undercapitalized,” and “critically undercapitalized.”
An institution is deemed to be:
|
● |
“well capitalized” if it has a total risk-based capital ratio of 10% or greater, a Tier 1 risk-based capital ratio of 8.0% or greater, a Tier 1 leverage ratio of 5.0% or greater, and a common equity Tier 1 risk-based
capital ratio of 6.5% or greater, and is not subject to a regulatory order, agreement or directive to meet and maintain a specific capital level for any capital measure; |
|
● |
“adequately capitalized” if it has a total risk-based capital ratio of 8.0% or greater, a Tier 1 risk-based capital ratio of 6.0% or greater, a Tier 1 leverage ratio of 4.0% or greater, and a common equity Tier 1
risk-based capital ratio of 4.5% or greater, and the institution does not meet the definition of a “well capitalized” institution; |
|
● |
“undercapitalized” if it does not meet the definition of an “adequately capitalized” institution; |
|
● |
“significantly undercapitalized” if it has a total risk-based capital ratio that is less than 6.0%, a Tier 1 risk-based capital ratio that is less than 4.0%, a Tier 1 leverage ratio that is less than 3.0%, and a
common equity Tier 1 risk based capital ratio that is less than 3.0%; and |
|
● |
“critically undercapitalized” if it has a ratio of tangible equity, as defined in the regulations, to total assets that is equal to or less than 2%. |
Throughout 2024, the Company’s regulatory capital ratios were in excess of the levels established for “well capitalized” institutions.
FDICIA generally prohibits a depository institution from making any capital distribution, including payment of a cash dividend, if the depository
institution would be “undercapitalized” after such payment. “Undercapitalized” institutions are subject to growth limitations and are required by the appropriate, primary federal regulator to submit a capital restoration plan.
If an “undercapitalized” institution fails to submit an acceptable plan, it is treated as if it is “significantly undercapitalized.”
“Significantly undercapitalized” institutions may be subject to a number of requirements and restrictions, including orders to sell sufficient voting stock to become “adequately capitalized,” requirements to reduce total assets, and cessation of
receipt of deposits from correspondent banks.
“Critically undercapitalized” institutions may not, beginning 60 days after becoming “critically undercapitalized,” make any payment of principal
or interest on their subordinated debt. In addition, “critically undercapitalized” institutions are subject to appointment of a receiver or conservator within 90 days of becoming so classified.
Under FDICIA, a depository institution that is not “well capitalized” is generally prohibited from accepting brokered deposits and offering
interest rates on deposits higher than the prevailing rate in its market. The Company is “well capitalized,” and the FDICIA brokered deposit rule did not adversely affect its ability to accept brokered deposits. The Company had $2.1 billion in brokered
deposits at December 31, 2024.
FDIC INSURANCE
The deposits of the Company are insured by the DIF, which the FDIC administers, up to applicable limits, which currently are set at $250,000 per
depositor, per insured bank, for each account ownership category. To fund the DIF, FDIC- insured banks are required to pay deposit insurance assessments to the FDIC. The deposit insurance assessment base is based on an insured institution’s average
consolidated total assets minus its average tangible equity. The FDIC uses a “scorecard” system to determine deposit insurance premiums for institutions like the Company that have more than $10 billion in assets. Each scorecard has a performance score
and a loss-severity score that is combined to produce a total score. The FDIC is authorized to make discretionary adjustments to the total score based upon significant risk factors that are not adequately captured in the scorecard, which is translated
into a premium rate.
Insurance of deposits may be terminated by the FDIC upon a finding that an institution has engaged in unsafe and unsound practices, is in an
unsafe or unsound condition to continue operations, or has violated any applicable law, regulation, rule, order or condition imposed by the FDIC. In addition, the Federal Deposit Insurance Act provides that, in the event of the liquidation or other
resolution of an insured depository institution, the claims of depositors of the institution, including the claims of the FDIC as subrogee of insured depositors, and certain claims for administrative expenses of the FDIC as a receiver, will have
priority over other general unsecured claims against the institution.
On October 18, 2022, the FDIC adopted a final rule, applicable to all insured depository institutions, to increase initial base deposit insurance
assessment rate schedules uniformly by two basis points. The final rule was effective for the first quarter of 2023. The increase in the assessment rate schedules in intended to increase the likelihood that the reserve ratio of the DIF reaches the
statutory minimum of 1.35% by the statutory deadline of September 30, 2028. The new assessment rate schedules will remain in effect unless and until the reserve ratio meets or exceeds 2% in order to support growth in the DIF in progressing toward the
FDIC’s long-term goal of a 2% Designated Reserve Ratio. Progressively lower assessment rate schedules will take effect when the reserve ratio reaches 2%, and again when it reaches 2.5%.
In November 2023, the FDIC issued a final rule to implement a special assessment to recover losses to the DIF incurred as a result of bank
failures earlier that year and the FDIC’s use of the systemic risk exception to cover certain deposits that were otherwise uninsured. The special assessment was based on estimated uninsured deposits as of December 31, 2022 (excluding the first $5.0
billion) and was assessed at a quarterly rate of 3.36 basis points, over eight quarterly assessment periods, beginning in the first quarter of 2024. As a result of this final rule, the Company recorded a liability of $36.2 million related to this
assessment and expensed this amount in the fourth quarter of 2023. This amount was based on our estimate of the full amount of the assessment at that time. In February 2024, the FDIC notified insured depository institutions that their loss estimate
related to the aforementioned bank failures had increased. In June 2024, due to the increased estimate of losses, the FDIC announced that it projected that the special assessment will be collected for an additional two quarters beyond the initial
eight-quarter collection period, at a lower rate. This updated assessment was made under the FDIC’s final rule whereby the estimated loss pursuant to the systemic risk determination can be periodically adjusted. The FDIC has also retained the ability
to cease collection early, extend the special assessment collection period, and impose a final shortfall special assessment. The extent to which any such additional future assessments will impact our future deposit insurance expense is currently
uncertain. During 2024, the Company recorded a liability of $4.6 million related to the additional special assessment and expensed during the same period.
STANDARDS FOR SAFETY AND SOUNDNESS
The Federal Deposit Insurance Act requires the federal bank regulatory agencies to prescribe, by regulation or guideline, operational and
managerial standards for all insured depository institutions relating to: (1) internal controls; (2) information systems and audit systems; (3) loan documentation; (4) credit underwriting; (5) interest rate risk exposure; and (6) asset quality. The
federal banking agencies have adopted regulations and Interagency Guidelines Establishing Standards for Safety and Soundness to implement these required standards. These guidelines set forth the safety and soundness standards used to identify and
address problems at insured depository institutions before capital becomes impaired. Under the regulations, if a regulator determines that a bank fails to meet any standards prescribed by the guidelines, the regulator may require the bank to submit an
acceptable plan to achieve compliance, consistent with deadlines for the submission and review of such safety and soundness compliance plans.
INTERSTATE BANKING AND BRANCHING LEGISLATION
Federal law allows banks to establish and operate a de novo branch in a state other than the bank’s home state if the law of the state where the
branch is to be located would permit establishment of the branch if the bank were chartered by that state, subject to standard regulatory review and approval requirements. Federal law also allows the Company to acquire an existing branch in a state in
which the Company is not headquartered and does not maintain a branch if the Federal Reserve and MDBCF approve the branch or acquisition, and if the law of the state in which the branch is located or to be located would permit the establishment of the
branch if the Company were chartered by that state.
Once a bank has established branches in a state through an interstate merger transaction or through de novo branching, the bank may then establish
and acquire additional branches within that state to the same extent that a state-chartered bank is allowed to establish or acquire branches within the state. Current federal law authorizes interstate acquisitions of banks without geographic
limitation. Further, a bank headquartered in one state is authorized to merge with a bank headquartered in another state, as long as neither of the states have opted out of such interstate merger authority prior to such date, and subject to any state
requirement that the target bank shall have been in existence and operating for a minimum period of time, not to exceed five years, and subject to certain deposit market-share limitations.
AFFILIATE TRANSACTIONS AND INSIDER LOANS
The Company is subject to Regulation W, which comprehensively implements statutory restrictions on transactions between a bank and its affiliates.
Regulation W combines the Federal Reserve’s interpretations and exemptions relating to Sections 23A and 23B of the Federal Reserve Act. Regulation W and Section 23A place limits on the amount of loans or extensions of credit to, investments in, or
certain other transactions with affiliates, and on the amount of advances to third parties collateralized by the securities or obligations of affiliates. Regulation W and Section 23B prohibit a bank from, among other things, engaging in certain
transactions with affiliates unless the transactions are on terms substantially the same, or at least as favorable to the bank, as those prevailing at the time for comparable transactions with non-affiliated companies.
The Company is also subject to certain restrictions on extensions of credit to executive officers, directors, certain principal shareholders and
their related interests. Such extensions of credit must be made on substantially the same terms, including interest rates and collateral, as those prevailing at the time for comparable transactions with third parties and must not involve more than the
normal risk of repayment or present other unfavorable features.
COMMUNITY REINVESTMENT ACT
The CRA provides an incentive for regulated financial institutions to meet the credit needs of their local community or communities, including low
and moderate income neighborhoods, consistent with the safe and sound operation of such financial institutions. The regulations provide that the appropriate banking regulator will assess reports under CRA in connection with applications for
establishment of domestic branches, acquisitions of banks or mergers involving financial holding companies. An unsatisfactory rating under CRA may serve as a basis to deny an application to acquire or establish a new bank, to establish a new branch or
to expand banking services. Cadence Bank received an “Outstanding” CRA rating on its most recent exam by the FDIC.
On October 24, 2023, the OCC, Federal Reserve, and FDIC issued a final rule to modernize their respective CRA regulations. The revised rules
substantially alter the methodology for assessing compliance with the CRA, with material aspects taking effect January 1, 2026 and revised data reporting requirements taking effect January 1, 2027. Among other things, the revised rules evaluate lending
outside traditional assessment areas generated by the growth of non-branch delivery systems, such as online and mobile banking, apply a metrics-based benchmarking approach to assessment, and clarify eligible CRA activities. The final rules may make it
more challenging and/or costly for the Company to receive a rating of at least “satisfactory” on its CRA exam. The revised CRA regulations have been subject to an injunction since March 29, 2024. The effective dates will be extended for each day the
injunction remains in place, pending the resolution of the lawsuit.
ANTI-TERRORISM AND MONEY LAUNDERING
Pursuant to federal law, the Company is required to: (i) establish an anti-money laundering program; (ii) establish due diligence policies,
procedures and controls with respect to its private banking accounts and correspondent banking accounts involving foreign individuals and certain foreign financial institutions; and (iii) avoid establishing, maintaining, administering or managing
correspondent accounts in the United States for, or on behalf of, foreign financial institutions that do not have a physical presence in any country. The Company is also required to follow certain minimum standards to verify the identity of customers,
both foreign and domestic, when a customer opens an account. In addition, federal law encourages cooperation among financial institutions, regulatory authorities and law enforcement authorities with respect to individuals, entities and organizations
engaged in, or reasonably suspected of engaging in, terrorist acts or money laundering activities. Federal banking regulators are required, when reviewing bank acquisition and merger applications, to take into account the effectiveness of the
anti-money laundering activities of the applicants.
On January 1, 2021, the Anti-Money Laundering Act of 2020 (the “AML Act”) was passed. The AML Act includes significant changes to anti-money
laundering rules, including the creation of a national registry maintained by FinCEN that banks may rely on to comply with customer due diligence requirements, enhancement of cooperation between banks and law enforcement, and improvement of corporate
transparency. Passage of the AML Act started a rulemaking and policy development process that includes the Corporate Transparency Act and a rulemaking that requires companies to report beneficial ownership to FinCEN for the first time in the history of
federal law. The Company continues to monitor developments related to these rules.
CONSUMER PRIVACY, DATA SECURITY, AND OTHER CONSUMER PROTECTION LAWS
Federal law generally prohibits disclosure of non-public consumer information to non-affiliated third parties unless the consumer has been given
the opportunity to object and has not objected to such disclosure. Financial institutions are further required to disclose their privacy policies to customers annually. Financial institutions, however, will be required to comply with state law if it is
more protective of consumer privacy than federal law.
Federal law also directed federal regulators to prescribe standards for the security of consumer information. The Company is subject to such
standards, as well as standards for notifying customers in the event of a security breach. The Company utilizes credit bureau data in underwriting activities. Use of such data is regulated under the Fair Credit Reporting Act and Regulation V on a
uniform, nationwide basis, including credit reporting, prescreening, and sharing of information between affiliates and the use of credit data. The Fair and Accurate Credit Transactions Act, which amended the Fair Credit Reporting Act, permits states to
enact identity theft laws that are not inconsistent with the conduct required by the provisions of that Act. Customers must be notified when unauthorized disclosure involves sensitive customer information that may be misused.
The federal banking regulators regularly issue guidance regarding cybersecurity intended to enhance cyber risk management standards among
financial institutions. As a result, financial institutions are expected to establish multiple lines of defense and to ensure their risk management processes address the risk posed by potential threats to the institution. A financial institution’s
management is expected to maintain sufficient processes to effectively respond and recover the institution’s operations after a cyber-attack. A financial institution is also expected to develop appropriate processes to enable recovery of data and
business operations if a critical service provider of the institution falls victim to this type of cyber-attack. Our information security protocols are designed in part to adhere to the requirements of this guidance.
On November 18, 2021, the federal banking agencies issued a new rule effective in 2022 that requires banks to notify their regulators within 36
hours of a “computer-security incident” that rises to the level of a “notification incident.”
A notification incident includes, among other things, a computer-security incident that materially disrupts or degrades, or is reasonable likely
to materially disrupt or degrade, a banking organization’s operations or activities or its ability to deliver products or services to a material portion of its customer base. The final rule also requires a bank service provider to notify a banking
organization of certain material disruptions in services provided to the banking organization.
State regulators have also been increasingly active in implementing privacy and cybersecurity standards and regulations. Recently, several states
have adopted regulations requiring certain financial institutions to implement cybersecurity programs and providing detailed requirements with respect to these programs, including data encryption requirements. Many states have also recently implemented
or modified their data breach notification and data privacy requirements. We expect this trend of state-level activity in those areas to continue and are continually monitoring developments in the states in which our customers are located.
The Company is also subject, in connection with its deposit, lending and leasing activities, to numerous federal and state laws aimed at
protecting consumers, including the Home Mortgage Disclosure Act, the Real Estate Settlement Procedures Act, the Equal Credit Opportunity Act, the Truth in Lending Act, the Truth in Savings Act, the Fair Housing Act, the Fair Credit Reporting Act, the
Electronic Funds Transfer Act, the Currency and Foreign Transactions Reporting Act, the National Flood Insurance Act, the Flood Protection Act, laws and regulations governing unfair, deceptive, and/or abusive acts and practices, the Service Members
Civil Relief Act, the Housing and Economic Recovery Act, and the Credit Card Accountability Act, among others, as well as various state laws.
COMMERCIAL REAL ESTATE LENDING CONCENTRATION
The federal banking agencies have promulgated guidance governing concentrations in commercial real estate lending for financial institutions. The
guidance provides that a bank has a concentration in commercial real estate lending if (i) total reported loans for construction, land development and other land represent 100% or more of total risk-based capital or (ii) total reported loans secured by
multifamily and non-farm residential properties and loans for construction, land development and other land represent 300% or more of total risk-based capital and the bank’s commercial real estate loan portfolio has increased 50% or more during the
prior 36 months. If a concentration is present, management must employ heightened risk management practices including board and management oversight and strategic planning, development of underwriting standards, risk assessment and monitoring through
market analysis and stress testing and increasing capital requirements.
INCENTIVE COMPENSATION
The Dodd-Frank Act required the federal banking agencies and the SEC to establish joint rules or guidelines for financial institutions with more
than $1 billion in assets, such as us, which prohibit incentive compensation arrangements that the agencies determine to encourage inappropriate risks by the institution. The federal banking agencies issued proposed rules in 2011 and previously issued
guidance on sound incentive compensation policies. In 2016, the federal banking agencies and the SEC proposed rules that would, depending upon the assets of the institution, directly regulate incentive compensation arrangements and would require
enhanced oversight and recordkeeping. At December 31, 2024, these rules have not been implemented.
The scope and content of banking regulators’ policies on executive compensation are continuing to develop and are likely to continue evolving in
the near future. It cannot be determined at this time whether compliance with such policies will adversely affect the Company’s ability to hire, retain and motivate its key employees.
In October 2022, the SEC adopted a final rule directing national securities exchanges and associations, including the NYSE, to implement listing
standards that require listed companies to adopt policies mandating the recovery or “clawback” of excess incentive-based compensation earned by a current or former executive officer during the three fiscal years preceding the date the listed company is
required to prepare an accounting restatement, including to correct an error that would result in a material misstatement if the error were corrected in the current period or left uncorrected in the current period. The NYSE’s listing standards pursuant
to the SEC’s rule became effective on October 2, 2023. We adopted a compensation recovery policy pursuant to the NYSE listing standards effective October 2, 2023, and included the policy as Exhibit 97.1 to the Form 10-K for the year ended December 31,
2023.
THE VOLCKER RULE
Section 13 of the BHC Act, commonly referred to as the “Volcker Rule,” generally prohibits us and our subsidiaries from (i) engaging in certain
proprietary trading, and (ii) acquiring or retaining an ownership interest in or sponsoring a “covered fund,” all subject to certain exceptions. The Volcker Rule also specifies certain limited activities in which we and our subsidiaries may continue to
engage and requires us to maintain a compliance program. In 2020, amendments to the proprietary trading and covered funds regulations issued by the federal banking agencies, the SEC, and the Commodity Futures Trading Commission took effect, simplifying
compliance and providing additional exclusions and exemptions.
DEBIT INTERCHANGE FEES
Interchange fees, or “swipe” fees, are fees that merchants pay to credit card companies and card-issuing banks such as the Company for processing
electronic payment transactions on their behalf. The maximum permissible interchange fee that a non-exempt issuer such as the Company may receive for an electronic debit transaction is the sum of 21 cents per transaction and 5 basis points multiplied
by the value of the transaction, subject to an upward adjustment of 1 cent if an issuer certifies that it has implemented policies and procedures reasonably designed to achieve the fraud-prevention standards set forth by the Federal Reserve. In
addition, card issuers and networks are prohibited from entering into arrangements requiring that debit card transactions be processed on a single network or only two affiliated networks and allows merchants to determine transaction routing. On October
25, 2023, the Federal Reserve proposed to lower the maximum interchange fee that a large debit card issuer can receive for a debit card transaction. The proposal would also establish a regular process for updating the maximum amount every other year
going forward. We continue to monitor the development of these proposed rule revisions.
EFFECT OF GOVERNMENTAL POLICIES
The Company is affected by the policies of regulatory authorities, including the Federal Reserve and the MDBCF. An important function of the
Federal Reserve is to regulate the national money supply. Among the instruments of monetary policy used by the Federal Reserve are: (i) purchases and sales of United States government and other securities in the marketplace; (ii) changes in the
discount rate, which is the rate any depository institution must pay to borrow from the Federal Reserve; (iii) changes in the reserve requirements of depository institutions; and (iv) indirectly, changes in the federal funds rate, which is the rate at
which depository institutions lend money to each other overnight. These instruments are intended to influence economic and monetary growth, interest rate levels, and inflation.
The monetary policies of the Federal Reserve and other governmental policies have had a significant effect on the operating results of commercial
banks in the past and are expected to continue to do so in the future. Because of changing conditions in the national and international economy and in the money markets, as well as the result of actions by monetary and fiscal authorities, it is not
possible to predict with certainty future changes in interest rates, deposit levels, loan demand, or the business and results of operations of the Company, or whether changing economic conditions will have a positive or negative effect on operations
and earnings.
OTHER PROPOSALS
Bills occasionally are introduced in the United States Congress and the Mississippi State Legislature and other state legislatures, and
regulations are occasionally proposed by federal and state regulatory agencies, any of which could affect the businesses, financial results and financial condition of the Company. Generally, it cannot be predicted whether or in what form any particular
proposals will be adopted or the extent to which the Company may be affected.
RECENT ACQUISITIONS AND TRANSACTION ACTIVITY
On January 22, 2025, the Company entered into an Agreement and Plan of Merger (the “Merger Agreement”) with FCB Financial Corp. pursuant to which
FCB Financial Corp., the parent company of First Chatham Bank, will merge with and into the Company with the Company surviving, immediately followed by First Chatham Bank merging with and into the Company with the Company surviving (collectively, the
“Merger”). Under the terms of the Merger Agreement, the Company will issue 2,300,000 shares of the Company’s common stock and $23.1 million in cash for all outstanding shares of FCB Financial Corp.’s capital stock, subject to certain conditions and
potential adjustments described in the Merger Agreement. The closing of the Merger is conditioned upon customary closing conditions, including receipt of all required regulatory approvals and approval by FCB Financial Corp.’s shareholders. Subject to
satisfaction of all closing conditions, the Merger is expected to close during the third quarter of 2025.
On November 30, 2023, the Company completed its previously announced sale of all of the issued and outstanding shares of capital stock of Cadence
Insurance, Inc., a former wholly owned subsidiary of the Company that conducted the Company’s insurance agency business (“Cadence Insurance”), to Arthur J. Gallagher Risk Management Services, LLC (“Gallagher”) (the “Sale Transaction”), pursuant to that
certain stock purchase agreement, dated as of October 24, 2023, by and among the Company, Cadence Insurance, Gallagher and Arthur J. Gallagher & Co. (the “Stock Purchase Agreement”). See Note 2 for additional details. The transaction resulted in a
pre-tax gain of $706.6 million. The gain, along with Cadence Insurance’s historical financial results for periods prior to the sale, is reflected in the Company’s consolidated financial statements as discontinued operations.
The following summarized financial information related to Cadence Insurance has been segregated from continuing operations and reported as
discontinued operations for the periods presented.
| (In thousands) |
|
Years Ended December 31, |
|
| Discontinued operations: |
|
2023 |
|
|
2022 |
|
| Net interest revenue |
|
$ |
128 |
|
|
$ |
12 |
|
| Total noninterest revenue |
|
|
863,141 |
|
|
|
150,547 |
|
| Total noninterest expense |
|
|
135,678 |
|
|
|
128,206 |
|
| Income from discontinued operations before income tax expense |
|
|
727,591 |
|
|
|
22,353 |
|
| Income tax expense |
|
|
188,971 |
|
|
|
6,433 |
|
| Income from discontinued operations, net of tax |
|
$ |
538,620 |
|
|
$ |
15,920 |
|
See Note 2 to the consolidated financial statements for information regarding discontinued operations.
Effective May 17, 2024, the Company completed the sale of Cadence Business Solutions, LLC, its payroll processing business unit, resulting in a net
gain on sale of approximately $12.0 million. The gain on sale was included in Other noninterest revenue within the accompanying consolidated statements of income.
HUMAN CAPITAL
We recognize that our most valuable asset is our people. One of our top strategic priorities is retaining and developing our talent. This includes
providing career development opportunities for all teammates, increasing their sense of belonging, training our next generation of leaders, and succession planning. Our daily goal is to create an environment that makes Cadence Bank a great place to
work. Our relationship with our teammates is based on our core values. We have not experienced any material employment-related issues or interruptions of services due to labor disagreements and are not a party to any collective bargaining agreements.
Sourcing Talent
As of December 31, 2024, our full-time equivalent employees numbered 5,335. Our recruiting practices and hiring decisions are among our most
important activities. To build a more talented and productive organization, we do not rely only on our individual network for recruiting; instead, we utilize social media, local job fairs, and educational organizations across the United States to find
motivated and qualified employees.
Our Board of Directors recognizes the importance of succession planning for our CEO and key executives. The Board annually reviews our succession
plans for senior leadership roles to ensure we will continue to have the right leadership talent in place to execute the organization’s long-term strategic plans. We have engaged outside coaches to work with certain high- potential candidates to
support their continued development and readiness for broader roles.
Education and Training
We are dedicated to the continual training and development of our employees to ensure we can develop future managers and leaders within our
organization. Our training starts immediately with onboarding procedures that focus on safety, responsibility, ethical conduct, and inclusive teamwork.
In addition to onboarding training, we provide extensive ongoing training and career development focused on:
|
● |
compliance with our Code of Business Conduct and Ethics; |
|
● |
laws and regulations applicable to our business; |
|
● |
skills and competencies directly related to employees’ job duties; |
|
● |
management skills necessary to develop our next generation of leaders; and |
|
● |
responsibility for personal safety and the safety of fellow employees. |
Health and Welfare
We support our teammates and their families’ health by offering full medical, dental, vision, life insurance, and long-term disability plans. We
also provide reimbursement accounts such as health and dependent care flexible spending accounts. We provide an Employee Assistance Program (EAP), which includes confidential services to help teammates and their families with personal or work-life
issues. EAP is available 24 hours, online or over the phone.
To make our benefits more affordable for lower-compensated teammates, we have a varying contribution structure whereby lower-compensated teammates
pay less for coverage. We also provide benefit options for our part-time teammates. Beginning in 2023, we announced a new parental leave policy that further enhances our paid leave for the birth or adoption of a child by providing up to 12 weeks of
leave. Additionally, we have revised our bereavement leave to provide more time away for our teammates following the loss of a spouse or child.
During 2024, we continued our wellness initiative, which rewards employees for participation by providing credit toward their health insurance
premiums. To participate, teammates partake in various health screenings and/or counseling from a health professional. This initiative allows employees to obtain points by participating in activities such as health screenings as part of their annual
wellness exams.
We continued our virtual physical therapy benefits to assist teammates in markets where physical therapy may be inconvenient due to location or
schedules. Teammates who participate do not need a physician’s order and may do so in the comfort of their homes. Virtual kits provide electronic monitors to guide exercise and measure results. All programs are conducted under the guidance of a
physician through virtual appointments or text within the program mobile app.
Retirement
We provide various resources and services to help our teammates prepare for retirement. We provide an employer- funded pension plan that sets
aside a cash contribution for all employees based on a percentage of their eligible pay and a 401(k) plan, with a company match, that includes various investment options.
Beginning in 2024, teammates could also make after-tax contributions, which can be converted to tax-advantaged Roth contributions. Additionally,
we introduced a Medicare assistance and education program for teammates considering or preparing for retirement. This program provides teammates with guidance regarding Medicare Part A and Part B enrollment.
Also, in 2024, we introduced the Cadence 401(k) Student Debt Retirement Savings feature to assist our teammates who have student loan debt and
want to contribute to their 401(k) plans. This program responds to employees who are balancing student loan payments with retirement savings. Under this program, when eligible teammates enroll, their student loan payments will be used as retirement
contributions and count toward their yearly 401(k) employer match.
Inclusion and Belonging
At Cadence, we embrace and celebrate the unique perspectives, backgrounds, and experiences of all our teammates, customers, and communities. We
expect our teammates to create a collaborative and inclusive environment that encourages teammate engagement and establishes our company as one that reflects and includes the communities we serve. Through our commitment to inclusion and belonging, we
strive to create a welcoming and inclusive environment where everyone feels valued and empowered to succeed. Our teammates are encouraged to bring their authentic selves to work, knowing that their individuality is an asset that contributes to our
collective success. We work as one team to leverage each other’s strengths and talents, fostering collaboration and innovation. By embracing inclusivity—one of the Company’s core values—we can deliver products and services to meet the needs of our
customers and stakeholders, ensuring that everyone feels heard and represented.
In 2024, we offered live training titled Leading with Inclusion to all our people leaders. The training was so well- received by Company
leadership that we made it available to all teammates and offered multiple live sessions that any teammate was welcome to attend. Over 80% of our Company attended leader or individual contributor training.
INFORMATION TECHNOLOGY
The ability to access and use technology is an increasingly competitive factor in the financial services industry. Technology is not only
important with respect to delivery of financial services and protection of the security of customer information but also in processing information. We must continually make technology investments to remain competitive in the financial services
industry. Those investments have included significant updates to our technology infrastructure, core processing, and deposit operations systems. Accordingly, we continually adapt to the changing technological needs and wants of our clients by investing
in our electronic banking platform. We use a combination of online and mobile banking channels to attract and retain clients and expand the convenience of banking with us. In most cases, our clients can initiate banking transactions from the
convenience of their personal computer or smart phone, reducing the number of in-branch visits necessary to conduct routine banking transactions. The remote transactions available to our clients include remote image deposit, bill payment, external and
internal transfers, ACH origination, and wire transfer. Enhancements to our online account originations capabilities have been a strong focus, specifically around deposits, savings, and credit card products, utilizing secure and convenient electronic
signature capabilities where available. We believe that our investments in technology and innovation are consistent with our clients’ needs and will support future migration of our clients’ transactions to these and other developing electronic banking
channels. Further, we closely monitor information security for trends and new threats, including cybersecurity risks, and invest significant resources to continuously improve the security and privacy of our systems and data. See “Part 1, Item 1.A.,
Risk Factors” for additional information regarding technology and cybersecurity risks.
CORPORATE INFORMATION
Shares of Common Stock
Listed on the NYSE
NYSE Symbol: CADE
Shares of Series A Preferred Stock
Listed on NYSE
NYSE Symbol: CADE Pr A
Transfer Agent and Registrar
Computershare Investor Services
150 Royall Street
Canton, MA 02021
Tel: (800) 368-5948
Internet address: www.computershare.com
ITEM 1A. RISK FACTORS.
SUMMARY OF RISK FACTORS
Our operations and financial results are subject to various risks and uncertainties, including, but not limited to, the principal risks summarized
below. Many of these risks are beyond our control although efforts are made to manage these risks while simultaneously optimizing operational and financial results. The occurrence of any of the following risks, as well as risks of which we are
currently unaware or currently deem immaterial, could materially and adversely affect our assets, business, cash flows, condition (financial or otherwise), liquidity, prospects, results of operations and the trading price of our capital stock. A
detailed discussion of our Risk Factors begins on page 25 following this Summary.
RISKS RELATED TO OUR BUSINESS
Market Risk
|
● |
Current uncertain economic conditions pose challenges, and could adversely affect our business, financial condition and results of operations; |
|
● |
Changes in interest rates could have an adverse impact on our results of operations and financial condition; |
|
● |
Inflationary pressures and rising prices may affect our results of operations and financial condition; |
|
● |
Our business is highly susceptible to local economic conditions as a result of the geographic concentration of our operations; and |
|
● |
By engaging in derivative transactions, we are exposed to credit and market risk, which could adversely affect our profitability and financial condition. |
Credit Risk
|
● |
If we do not properly manage our credit risk, our business could be seriously harmed; |
|
● |
Our ACL may not be adequate to absorb credit losses in our portfolio, which may adversely impact our business, financial condition and results of operations; |
|
● |
We make and hold in our portfolio real estate construction, acquisition and development loans, which are based upon estimates of costs and values associated with the completed project and which pose more credit risk
than other types of loans typically made by financial institutions; |
|
● |
Many of our loans are to commercial borrowers, which have unique risks compared to other types of loans; |
|
● |
Our loan portfolio includes lending in energy and other specialized industries; |
|
● |
Sustained low oil prices, volatility in oil prices and downturns in the energy industry, including in Texas, could materially and adversely affect us; |
|
● |
A significant portion of our loan portfolio is comprised of loan participations and SNCs, which could have a material adverse effect on our ability to monitor such lending relationships and lead to an increased risk
of loss; |
|
● |
The amount of our nonperforming and criticized assets may adversely affect our results of operations and financial condition; and |
|
● |
The fair value of our investment securities may decline. Factors beyond our control can significantly influence the fair value of our securities and can cause adverse changes to the fair value of these securities. |
Liquidity Risk
|
● |
Liquidity risk could impair our ability to fund operations and jeopardize our financial condition; |
|
● |
Adverse developments or concerns affecting the financial services industry in general or financial institutions that are similar to us or that may be viewed as being similar to us, such as bank failures and
disruption in the United States banking industry, could adversely affect our financial condition and results of operations; |
|
● |
We rely on customer deposits as a significant source of funding, and our deposits may decrease in the future; |
|
● |
The borrowing needs of our clients may increase, especially during a challenging economic environment, which could result in increased borrowing against our contractual obligations to extend credit; |
|
● |
An increased level of indebtedness could affect our ability to meet our obligations and may otherwise restrict our activities; and |
|
● |
We rely on the secondary mortgage market for some of our liquidity. |
Strategic Risk
|
● |
We compete with financial holding companies, bank holding companies, banks, insurance, fintech companies, other financial services companies and non-bank financial institutions, and consumers may decide not to use
banks to complete their financial transactions; |
|
● |
Our growth strategy includes risks that could have an adverse effect on our financial performance; |
|
● |
If we are unable to manage our growth effectively, our operations could be negatively affected; |
|
● |
We face risks in connection with completed or potential acquisitions; |
|
● |
We may not realize all of the anticipated benefits of any acquisition; |
|
● |
We may not be able to raise additional capital in the future; and |
|
● |
If the goodwill that we record in connection with a business acquisition becomes impaired, it could require a charge to earnings. |
Operational Risk
|
● |
Our business is, and will continue to be, dependent on technology and an inability to invest in technological improvements or obtain reliable technological support may adversely affect our results of operation and
financial condition; |
|
● |
The development and use of generative AI presents risks and challenges that may adversely impact the Company’s business; |
|
● |
We are subject to a variety of systems-failure and cybersecurity risks that could adversely affect our business and financial performance; |
|
● |
We may be adversely affected by the failure of certain third-party vendors to perform; |
|
● |
Our earnings could be adversely impacted by incidences of fraud and compliance failures that are not within our direct control; and |
|
● |
We are subject to environmental liability risk associated with our lending activities. |
RISKS RELATED TO THE REGULATION OF OUR INDUSTRY
Regulatory Risk
|
● |
The banking industry is highly regulated, and current and future legislative or regulatory changes could have a significant adverse effect on our business, financial condition, or results of operations; |
|
● |
Regulatory initiatives regarding bank capital requirements may require increased capital; |
|
● |
Changes in accounting rules applicable to banks could adversely affect our financial condition and results of operations; |
|
● |
Regulators periodically examine our business and we may be required to remediate adverse examination findings, and; |
|
● |
The Company is operating under a Consent Order, and failure to comply with the Consent Order could materially and adversely affect our business. |
Compliance Risk
|
● |
We are subject to numerous laws designed to protect consumers, including the CRA and fair lending laws, and failure to comply with these laws could lead to a wide variety of sanctions; |
|
● |
Federal, state and local consumer lending laws may restrict our ability to originate certain mortgage loans or increase our risk of liability with respect to such loans and could increase our cost of doing business; |
|
● |
The expanding body of federal, state and local regulations and/or the licensing of loan servicing, collections or other aspects of our business and our sales of loans to third parties may increase the cost of
compliance and the risks of noncompliance and subject us to litigation; and |
|
● |
We are subject to laws regarding the privacy, information security, and protection of personal information and any violation of these laws or another incident involving personal, confidential or proprietary
information of individuals could damage our reputation and otherwise adversely affect our operations and financial condition. |
GENERAL RISK FACTORS
Economic Conditions
|
● |
The fiscal and monetary policies of the U.S. government could have a material adverse effect on our results of operations; |
|
● |
The Federal Reserve has implemented significant economic strategies that have impacted interest rates, inflation, asset values, and the shape of the yield curve, over which the Company has no control and which the
Company may not be able to adequately anticipate; and, |
|
● |
The current economic environment poses significant challenges and could adversely affect our financial condition and results of operations. |
Investment in Our Common Stock and Preferred Stock
|
● |
The price of our common stock and preferred stock may fluctuate significantly, which may make it difficult for investors to resell shares of our common stock or preferred stock at a time or price they find
attractive; |
|
● |
The rights of our common shareholders are generally subordinate to the rights of holders of our debt securities and preferred stock and may be subordinate to the rights of holders of any class of preferred stock or
any debt securities that we may issue in the future; |
|
● |
Adverse changes in the ratings for our debt securities or preferred stock could have a material adverse effect on our business, financial condition and liquidity and may increase our funding costs or impair our
ability to effectively compete for business and clients; |
|
● |
Our ability to declare and pay dividends is limited; |
|
● |
Our ability to repurchase shares of our common or preferred stock is limited; |
|
● |
Our certificate of incorporation and bylaws include provisions that could impede a takeover of the Company; and |
|
● |
Shares of our common stock and preferred stock are not deposits insured by the FDIC and are subject to risk of loss and uncertain return on investment. |
Other Risks
|
● |
As a public company, we incur significant legal, accounting, insurance, compliance and other expenses. Any deficiencies in our financial reporting or internal controls could materially and adversely affect us,
including resulting in material misstatements in our financial statements, and the market price of our common stock; |
|
● |
We may be adversely affected by changes in U.S. tax laws; |
|
● |
We depend upon key personnel and we may not be able to retain them or attract, assimilate and retain highly qualified employees in the future; |
|
● |
We are required to make significant estimates and assumptions in the preparation of our financial statements. These estimates and assumptions may not be accurate and are subject to change; |
|
● |
We are involved in legal proceedings and may be the subject of additional litigation or government investigations in the future; the actual cost of legal proceedings may exceed our accruals for them; |
|
● |
Reputational and environmental, social, and governance risk may impact our results; |
|
● |
Our framework for managing risks may not be effective in mitigating risk and any resulting loss; and |
|
● |
Certain weather conditions have the potential to disrupt our business and adversely impact the operations and creditworthiness of our clients. |
RISK FACTORS
Our operations and financial results are subject to various risks and uncertainties, including, but not limited to, the material risks described
below. It is impossible to predict or identify all such factors and, as a result, the following factors should not be considered a complete discussion of the risks, uncertainties, or assumptions that could affect us.
In addition, certain statements in the following risk factors constitute forward-looking statements. Please refer to the section entitled
“Cautionary Note Regarding Forward-Looking Statements” beginning on page 5 of this Report.
RISKS RELATED TO OUR BUSINESS
Market Risk
Current uncertain economic conditions pose challenges, and could adversely affect our business, financial condition and results of operations.
We are operating in an uncertain economic environment. The pandemic caused a global economic slowdown, and while we have seen economic recovery in
the markets we serve, labor shortages and inflation risk are impacting the continued recovery. Continued economic uncertainty, or a recessionary or stagnant economy could result in financial stress on our borrowers, which could adversely affect our
business, financial condition, and results of operations. Deteriorating conditions in the regional economies we serve, or in certain sectors of those economies, could still drive losses beyond that which is provided for in our allowance for credit
losses. We could also face the following risks in connection with the following events:
|
● |
market developments and economic stagnation or slowdown may affect consumer confidence levels and may cause adverse changes in payment patterns, resulting in increased delinquencies and default rates on loans and
other credit facilities; |
|
● |
the processes we use to estimate the allowance for credit losses and other reserves may prove to be unreliable. Such estimates rely upon complex modeling inputs and judgments, including forecasts of economic
conditions, which may be rendered inaccurate and/or no longer subject to accurate forecasting; |
|
● |
our ability to assess the creditworthiness of our borrowers may be impaired if the models and approaches we use to select, manage, and underwrite loans become less predictive of future charge-offs; |
|
● |
regulatory scrutiny of the banking industry has increased and could continue to increase, leading to increased regulation of the industry that could lead to a higher cost of compliance, limit our ability to pursue
business opportunities and increase our exposure to litigation or fines; |
|
● |
ineffective monetary policy or other market conditions could cause rapid changes in interest rates and asset values that would have a materially adverse impact on our profitability and overall financial condition; |
|
● |
further erosion in the fiscal condition of the U.S. Treasury could lead to new taxes that would limit our ability to pursue growth and return profits to shareholders; and |
|
● |
The U.S. government’s decisions regarding its debt ceiling and the possibility that the U.S. could default on its debt obligations, or otherwise cease timely payment of obligations, may cause further interest rate
increases, disrupt access to capital markets and deepen recessionary conditions. |
If these conditions or similar ones continue to exist or worsen, we could experience continuing or increased adverse effects on our financial
condition.
Changes in interest rates could have an adverse impact on our results of operations and financial condition.
Significant increases in market interest rates on loans, or the perception that an increase may occur, could adversely affect both our ability to
originate new loans and our ability to grow. Beginning early in 2022 and continuing throughout 2023, in response to growing signs of inflation, the Federal Reserve increased interest rates rapidly. The Federal Reserve began lowering interest rates in
September 2024 in response to declining inflation and labor market concerns, followed by two additional cuts in November and December, although rates nonetheless remain elevated. Rapid changes in interest rates make it difficult for us to balance our
loan and deposit portfolios, which may adversely affect our results of operations by, for example, reducing asset yields or spreads, creating operating and system issues, or having other adverse impacts on our business. Decreases in interest rates
could result in an acceleration of loan prepayments. Increased market interest rates could also adversely affect the ability of our floating-rate borrowers to meet their higher payment obligations; if this occurred, it could cause an increase in
nonperforming assets and charge offs, which could adversely affect our business.
Further, our earnings and financial condition are dependent to a large degree upon net interest income, which is the difference or spread, between
interest earned on interest-earning assets and interest paid on interest bearing liabilities. When market rates of interest change, the interest we receive on our assets and the interest we pay on our liabilities may fluctuate. This can cause decreases
in our spread and can adversely affect our earnings and financial condition.
Interest rates are highly sensitive to many factors including:
|
● |
Federal monetary policies; and |
|
● |
Stability of domestic and foreign markets. |
Accordingly, fluctuations in interest rates could adversely affect our interest rate spread, and, in turn, our profitability. If the Federal
Reserve were to lower the target federal funds rate to below 0%, such rates could continue to constrain our interest rate spread and may adversely affect our business forecasts. On the other hand, increases in interest rates, to combat inflation or
otherwise, may result in a change in the mix of noninterest and interest bearing accounts. All else being equal, if the interest rates on the Company’s interest bearing liabilities increase at a faster pace than the interest rates on our
interest-earning assets, the result would be a reduction in net interest income and with it, a reduction in net earnings. Moreover, although we have implemented practices we believe will reduce the potential effects of changes in interest rates on our
net interest income, these practices may not always be successful. Accordingly, changes in levels of market interest rates could materially and adversely affect our net interest income and our net interest margin, asset quality, loan and lease
origination volume, liquidity, and overall profitability. We cannot assure you that we can minimize our interest rate risk.
In addition, the Company originates residential mortgage loans for sale and for our portfolio. The origination of residential mortgage loans is
highly dependent on the local real estate market and the level of interest rates. Increasing interest rates tend to reduce the origination of loans for sale and fee income, which we report as gain on sale of loans. Decreasing interest rates generally
result in increased prepayments of loans and mortgage-backed securities, as borrowers refinance their debt in order to reduce their borrowing cost. This typically leads to reinvestment at lower rates than the loans or securities were paying. Changes in
market interest rates could also reduce the value of our financial assets. Our financial condition and results of operations could be adversely affected if we are unsuccessful in managing the effects of changes in interest rates.
Inflationary pressures and rising prices may affect our results of operations and financial condition.
Although the U.S. economy experienced declining inflation in 2024, inflation continues to be above the Federal Reserve’s target rate, and
inflationary pressures are likely to continue into 2025. Inflation could lead to increased costs to our customers, making it more difficult for them to repay their loans or other obligations, increasing our credit risk. Sustained higher interest rates
by the Federal Reserve may be needed to tame persistent inflationary price pressures, which could push down asset prices and weaken economic activity. A deterioration in economic conditions in the United States and our markets could result in an
increase in loan delinquencies and nonperforming assets, decreases in loan collateral values and a decrease in demand for our products and services, all of which, in turn, would adversely affect our business, financial condition and results of
operations.
Our business is highly susceptible to local economic conditions as a result of the geographic concentration of our operations.
Our business is primarily concentrated in select markets in Alabama, Arkansas, Florida, Georgia, Louisiana, Mississippi, Missouri, Tennessee, and
Texas. Our financial condition and results of operations depend largely upon economic conditions in these market areas. Deterioration in economic conditions in the markets we serve could result in one or more of the following: an increase in loan
delinquencies; an increase in problem assets and foreclosures; a decrease in the demand for our products and services; and a decrease in the value of collateral for loans, especially real estate collateral, in turn reducing customers’ borrowing power,
the value of assets associated with problem loans and collateral coverage. Our markets are also susceptible to severe weather. The occurrence of adverse weather and natural disasters could destroy or cause a decline in the value of assets that serve as
collateral and increase the risk of delinquencies, defaults, foreclosures and losses on our loans, damage our facilities and offices, negatively impact regional economic conditions, result in a decline in local loan demand, loan originations and
deposit availability and negatively impact our growth strategy. Any one or more of these developments could have a material adverse effect on our business, financial condition or results of operations.
By engaging in derivative transactions, we are exposed to credit and market risk, which could adversely affect our profitability and financial condition.
We manage interest rate risk by, among other things, utilizing derivative instruments to minimize significant unplanned fluctuations in earnings
that are caused by interest rate volatility. Hedging interest rate risk is a complex process, requiring sophisticated models and constant monitoring, and is approximate. Due to interest rate fluctuations, hedged assets and liabilities will appreciate
or depreciate in market value. The effect of this unrealized appreciation or depreciation will generally be offset by income or loss on the derivative instruments that are linked to the hedged assets and liabilities. By engaging in derivative
transactions, we are exposed to credit and market risk. If the counterparty fails to perform, credit risk exists to the extent of the fair value gain in the derivative. Market risk exists to the extent that interest rates change in ways that are
significantly different from what we expected when we entered into the derivative transaction. The existence of credit and market risk associated with our derivative instruments could adversely affect our net interest income and, therefore, could have
a material effect on our business, financial condition and results of operations. Failure to manage interest rate risk could have a material adverse effect on our business. See “Management’s Discussion and Analysis of Financial Condition and Results of
Operations—Quantitative and Qualitative Disclosures about Market Risk.”
Credit Risk
If we do not properly manage our credit risk, our business could be seriously harmed.
There are substantial risks inherent in making any loan or lease, including, but not limited to:
|
● |
risks resulting from changes in economic and industry conditions; |
|
● |
risks inherent in dealing with borrowers; |
|
● |
risks inherent from uncertainties as to the future value of collateral; and |
|
● |
the risk of non-payment of loans and leases. |
Although we attempt to minimize our credit risk through prudent loan and lease underwriting procedures and by monitoring concentrations of our
loans and leases, there can be no assurance that these underwriting and monitoring procedures will reduce these risks as some of these risks are outside of our control. Moreover, as we continue to expand into new markets, credit administration and loan
and lease underwriting policies and procedures may need to be adapted to local conditions. The inability to properly manage our credit risk or appropriately adapt our credit administration and loan and lease underwriting policies and procedures to
local market conditions or changing economic circumstances could have an adverse effect on our allowance and provision for credit losses and our financial condition, results of operations and liquidity.
Our ACL may not be adequate to absorb credit losses in our portfolio, which may adversely impact our business, financial condition and results of operations.
Due to any declining economic conditions, our customers may not be able to repay their loans according to the original terms, and the collateral
securing the payment of those loans may be insufficient to pay any remaining loan balance. While we maintain our ACL to provide for loan defaults and nonperformance, losses may exceed the value of the collateral securing the loans and the allowance may
not fully cover any excess loss.
We make various assumptions and judgments about the collectability of our loan and lease portfolio and utilize these assumptions and judgments
when determining the ACL. The determination of the appropriate level of the ACL inherently involves a high degree of subjectivity and requires us to make significant estimates of current credit risks and future trends, all of which may undergo material
changes. Deterioration in economic conditions affecting borrowers, new information regarding existing loans, identification of additional problem loans and other factors, both within and outside of our control, may require an increase in the ACL. In
addition, bank regulatory agencies periodically review our ACL and may require an increase in the ACL or future provisions for credit losses, based on judgments different than those of management. Significant increases in the ACL will result in a
decrease in our net income and capital, and thus could have a material adverse effect on our financial condition and results of operations. See “Item 7. Management’s Discussion and Analysis of Financial Condition and Results of Operations - Results of
Operations - Provision for Credit Losses and Allowance for Credit Losses” included herein for more information regarding our process for determining the appropriate level of the ACL.
We make and hold in our portfolio real estate construction, acquisition and development loans, which are based upon estimates of costs and values associated with
the completed project and which pose more credit risk than other types of loans typically made by financial institutions.
At December 31, 2024, our real estate construction, acquisition and development loans represented 11.6% of our loan portfolio. These loans have
certain risks not present in other types of loans. The primary credit risks associated with real estate construction, acquisition and development loans are underwriting, project and market risks. Project risks include cost overruns, borrower credit
risk, project completion risk, general contractor credit risk and environmental and other hazard risks. Market risks are risks associated with the sale of the completed residential and commercial units. They include affordability risk, which means the
risk that borrowers cannot obtain affordable financing, product design risk, and risks posed by competing projects. Real estate construction, acquisition and development loans also involve additional risks because funds are advanced upon the security
of the project, which is of uncertain value prior to its completion, and costs may exceed realizable values in declining real estate markets. Because of the uncertainties inherent in estimating construction costs and the realizable market value of the
completed project and the effects of governmental regulation of real property, it is difficult to evaluate accurately the total funds required to complete a project and the related loan-to-value ratio. As a result, real estate construction, acquisition
and development loans often involve the disbursement of substantial funds with repayment dependent, in part, on the success of the ultimate project and the ability of the borrower to sell or lease the property, rather than the ability of the borrower
or guarantor to repay principal and interest. If our appraisal of the value of the completed project proves to be overstated or market values or rental rates decline, we may have inadequate security for the repayment of the loan upon completion of
construction of the project. If we are forced to foreclose on a project prior to or at completion due to a default, there can be no assurance that we will be able to recover all of the unpaid balance and accrued interest on the loan as well as related
foreclosure and holding costs. In addition, we may be required to fund additional amounts to complete the project and may have to hold the property for an unspecified period of time while we attempt to dispose of it. The adverse effects of the
foregoing matters upon our real estate construction, acquisition and development portfolio could result in an increase in nonperforming loans related to this portfolio and a resulting increase in charge-offs, which may have a material adverse effect on
our financial condition and results of operations.
Many of our loans are to commercial borrowers, which have unique risks compared to other types of loans.
At December 31, 2024, approximately 68.9% of our loan portfolio was comprised of commercial loans. Because payments on these loans are often
dependent on the successful operation or development of the property or business involved, their repayment is sensitive to adverse conditions in the real estate market and the general economy. Accordingly, downturns in the real estate market and
economy increase the risk related to commercial loans, particularly commercial real estate loans. Future declines in the real estate values in our markets could significantly impair the value of the particular collateral securing our loans and our
ability to sell the collateral upon foreclosure for an amount necessary to satisfy the borrower’s obligations to us. This could require increasing our allowance for loan losses to address the decrease in the value of the real estate securing our loans,
which could have a material adverse effect on our business, financial condition, results of operations and growth prospects. Commercial loans are also subject to loan specific risks, including risks associated with construction, cost overruns, project
completion risk, general contractor credit risk and risks associated with the ultimate sale or use of the completed construction. If a decline in economic conditions, natural disasters affecting commercial development or other issues cause difficulties
for our commercial loan borrowers, if we fail to evaluate the credit of these loans accurately when we underwrite them or if we fail to adequately monitor the performance of these loans, our lending portfolio could experience delinquencies, defaults
and credit losses that could have a material adverse effect on our business, financial condition or results of operations.
Our loan portfolio includes lending in energy and other specialized industries.
Our loan portfolio includes lending in energy and other specialized industries. At December 31, 2024, 6.1% of our total loans outstanding were to
companies operating in the hospitality and healthcare industries, and 4.3% were to companies operating in the energy sector. These industries and businesses are sensitive to economic conditions and complex factors (such as supply chain factors), which
may expose us to risks unique to these industries. Oil prices can fluctuate widely on a month-to- month basis in response to a variety of factors that are beyond our control. Factors that contribute to price fluctuations include war and instability in
oil-producing regions, worldwide economic conditions, weather conditions, the supply and price of domestic and foreign oil, natural gas and natural gas liquids, consumer demand, the price and availability of alternative fuels, the proximity to, and
capacity of, transportation facilities and the effect of worldwide energy conservation measures. Adverse economic conditions or business conditions relating to these industries could negatively impact our operating results more than if our loan
portfolio was not concentrated in these industries.
Sustained low oil prices, volatility in oil prices and downturns in the energy industry, including in Texas and Louisiana, could materially and adversely affect
us.
The economy in Texas and Louisiana significantly depends on the energy industry. A downturn or lack of growth in the energy industry and
energy-related businesses, including sustained low oil prices or the failure of oil prices to rise in the future, could adversely affect our results of operations and financial condition. The economic impacts of COVID-19 initially resulted in pricing
pressure on oil and gas and weaker demand for energy lending, however, energy prices have risen significantly during 2024 contributing to the overall inflation rate. These factors and general uncertainty resulting from continued volatility could have
other future adverse impacts such as job losses in energy-related industries, lower borrowing needs, higher transaction deposit balances and other effects that are difficult to isolate or quantify. Such impacts could particularly impact states with
significant dependence on the energy industry such as Texas and Louisiana, all of which could have a material adverse effect on our business, financial condition and results of operations.
A significant portion of our loan portfolio is comprised of loan participations and SNCs, which could have a material adverse effect on our ability to monitor such
lending relationships and lead to an increased risk of loss.
We participate in loans originated by other institutions and in SNCs, broadly defined as loans to larger institutions by a group of participating
lenders where the client’s needs are larger than any individual lender can prudently provide, and in which other lenders serve as the agent bank. Additionally, our specialized industries lending includes larger, national companies that tend to be
served through SNCs. At December 31, 2024, approximately 12.3% of our total loans, consisted of SNCs. For the vast majority of SNCs, we are not the lead bank. Our reduced control over the monitoring and management of these relationships could lead to
increased risk of loss, which could have a material adverse effect on our results of operations.
The amount of our nonperforming and criticized assets may adversely affect our results of operations and financial condition.
As of December 31, 2024 and 2023, our nonperforming assets to total assets were 0.58% and 0.45%, respectively. Total criticized loans as of
December 31, 2024 and 2023, were $794.6 million and $844.7 million, respectively (see “Asset Quality” section in Part II, Item 7, Management’s Discussion and Analysis). Increases in nonperforming assets and criticized loans could result in increased
provisions for credit losses, lost income, and additional expenses to maintain such assets which could have a material adverse effect on our results of operations.
The fair value of our investment securities may decline.
At December 31, 2024, the fair value of our available for sale securities portfolio was $7.3 billion. Factors beyond our control can significantly
influence the fair value of our securities and can cause adverse changes to the fair value of these securities. These factors include rating agency actions, defaults by or other adverse events affecting the issuer, lack of liquidity, changes in market
interest rates, and continued instability in the capital markets. A prolonged decline in the fair value of our securities could result in an other-than-temporary impairment write-down, which would affect our results of operations.
Liquidity Risk
Liquidity risk could impair our ability to fund operations and jeopardize our financial condition.
Liquidity is essential to our business. An inability to raise funds through deposits, borrowings, the sale of loans and other sources could have a
substantial negative effect on the Company’s liquidity. Our access to funding sources in amounts adequate to finance our activities or on terms which are acceptable to us could be impaired by factors that affect us specifically or the financial
services industry or economy in general. A decrease in the level of our business activity as a result of a downturn in the markets in which our loans are concentrated as well as adverse regulatory actions against us could detrimentally impact our
access to liquidity sources. In addition, our access to deposits may be affected by the liquidity and/or cash flow needs of depositors, which may be exacerbated in an inflationary, recessionary, or elevated rate environment. Our ability to borrow could
also be impaired by factors that are not specific to us, such as a disruption in the financial markets or negative views and expectations about the prospects for the financial services industry generally.
Adverse developments or concerns affecting the financial services industry in general or financial institutions that are similar to us or that may be viewed as
being similar to us, such as bank failures and disruption in the United States banking industry, could adversely affect our financial condition and results of operations.
In 2023, several financial institutions failed or required outside liquidity support, often as a result of the inability of the institutions to
obtain needed liquidity. The impact of this situation led to heightened risk of additional stress to other financial institutions, and the financial services industry generally as a result of increased lack of confidence in the financial sector.
Banking regulators took action in an effort to strengthen public confidence in the banking system, but there can be no assurance that these actions will stabilize the financial services industry and financial markets. While we currently do not
anticipate liquidity constraints of the kind that caused certain other financial institutions to fail or require external support, constraints on our liquidity could occur as a result of unanticipated deposit withdrawals, because of market distress or
our inability to access other sources of liquidity, including through the capital markets due to unforeseen market dislocations or interruptions.
Moreover, some of our customers may become less willing to maintain deposits at the Bank because of broader market concerns with the level of
insurance available on those deposits. Our business and our financial condition and results of operations could be adversely affected by soundness concerns regarding financial institutions generally, and our counterparties specifically, and limitations
resulting from further governmental action in an effort to stabilize or provide additional regulation of the financial system, as well as the impact of excessive deposit withdrawals. Actual events involving limited liquidity, defaults, nonperformance
or other adverse developments that affect financial institutions, or concerns or rumors about any events of these kinds or other similar events, have in the past and may in the future lead to erosion of customer confidence in the banking system or
certain banks, deposit volatility, liquidity issues, stock price volatility and other adverse developments. Any of these impacts, or any other impacts resulting from past bank failures or other related or similar events, could have a material adverse
effect on our liquidity and our current and/or projected business operations and financial condition and results of operations.
We rely on customer deposits as a primary source of funding, and our deposits may decrease in the future.
We rely on customer deposits as a significant source of funding. Competition among U.S. banks and non-banks for customer deposits is intense and
may increase the cost of deposits (particularly in an elevated rate environment) or prevent new deposits and may otherwise negatively affect our ability to grow our deposit base. Our deposit accounts may decrease in the future, and any such decrease
could have a material adverse impact on our sources of funding. Any changes we make to the rates offered on our deposit products to remain competitive with other financial institutions may adversely affect our profitability. The demand for our deposit
products may also be reduced due to a variety of factors such as demographic patterns, changes in customer preferences, including customers moving funds out of bank deposits and into alternative investments, such as the stock market, that may be
perceived as providing superior expected returns, reductions in consumers’ disposable income, regulatory actions that decrease customer access to particular products or the availability of competing products. In addition, a portion of our deposits are
brokered deposits. The levels of these types of deposits that we hold may be more volatile during changing economic conditions.
The borrowing needs of our clients may increase, especially during a challenging economic environment, which could result in increased borrowing against our
contractual obligations to extend credit.
A commitment to extend credit is a formal agreement to lend funds to a client as long as there is no violation of any condition established under
the agreement. The actual borrowing needs of our clients under these credit commitments have historically been lower than the contractual amount of the commitments. At December 31, 2024, we had $8.6 billion in unfunded credit commitments to our
clients. Actual borrowing needs of our clients may exceed our expectations for any numbers of reasons. This could adversely affect our liquidity, which could impair our ability to fund operations and meet obligations as they become due and could have a
material adverse effect on our business, financial condition and results of operations.
An increased level of indebtedness could affect our ability to meet our obligations and may otherwise restrict our activities.
Our indebtedness could limit our ability to borrow money for funding loans, capital expenditures, debt service requirements or other corporate
purposes; require us to dedicate a substantial portion of our cash flow to payments on our indebtedness; increase our vulnerability to general adverse economic and industry conditions; and limit our ability to respond to business opportunities,
including growing our business through acquisitions. In addition, the instruments governing our indebtedness contain certain restrictive covenants including with respect to consolidating or merging the Company or the Bank into another entity or
transferring substantially all of their respective assets or properties. Certain of the Company’s debt also contains restrictions on the Company’s ability to assign or grant a security interest in or otherwise dispose of any shares of the voting stock
of the Bank. Failure to meet any of these covenants could result in an event of default under these agreements. If an event of default occurs under these agreements, the lenders could elect to declare all amounts outstanding under these agreements to
be immediately due and payable.
Total interest expense on subordinated and long-term debt was $13.3 million on a pre-tax basis for 2024. Following paydowns of that debt, at
December 31, 2024, the Company had $10.7 million of subordinated and long-term debt outstanding. An increase in interest rates will increase our interest expense on any new debt we issue. See “Item 7A. Quantitative and Qualitative Disclosures about
Market Risk.” In addition, we may not be able to refinance our indebtedness on substantially similar terms, or at all, at or prior to the time that it comes due.
We rely on the mortgage secondary market for some of our liquidity.
We originate and sell a portion of our residential mortgage loans. We rely on FNMA and other purchasers to purchase loans in order to reduce our
credit risk and provide funding for additional loans we desire to originate. We cannot provide assurance that these purchasers will not materially limit their purchases from us due to capital constraints or other factors, including, with respect to
FNMA, a change in the criteria for conforming loans. In addition, various proposals have been made to reform the U.S. residential mortgage finance market, including the role of FNMA. The exact effects of any such reforms are not yet known, but may
limit our ability to sell conforming loans to FNMA. In addition, residential mortgage lending is highly regulated, and our inability to comply with all federal and state regulations and investor guidelines regarding the origination, underwriting
documentation and servicing of residential mortgage loans may also impact our ability to continue selling residential mortgage loans. If we are unable to continue to sell loans in the secondary market, our ability to fund, and thus originate,
additional residential mortgage loans may be adversely affected, which could have a material adverse effect on our business, financial condition or results of operations.
Strategic Risk
We compete with financial holding companies, bank holding companies, banks, insurance, fintech, other financial services companies and non-bank financial
institutions, and consumers may decide not to use banks to complete their financial transactions, which could adversely affect our net income.
The banking, insurance and financial services businesses are extremely competitive in our markets. Certain of our competitors, many of which are
well-established banks, credit unions, insurance agencies and other large financial institutions, have an advantage over us through substantially greater financial resources, lending limits and larger distribution networks, and are able to offer a
broader range of products and services. Other competitors, including fintech companies, many of which are smaller, are privately-held and thus benefit from greater flexibility in adopting or modifying growth or operational strategies than we do. If we
fail to compete effectively for deposits, loans, leases and other banking customers in our markets, we could lose substantial market share, suffer a slower growth rate or no growth and our financial condition, results of operations and liquidity could
be adversely affected.
Further, technology and other changes now allow parties to complete financial transactions without banks. For example, consumers can pay bills,
transfer funds directly and obtain loans without banks. This process could result in the loss of interest and fee income, as well as the loss of customer deposits and the income generated from those deposits.
Non-bank financial technology providers invest substantial resources in developing and designing new technology, particularly digital and mobile
technology, and are beginning to offer more traditional banking products either directly or through bank partnerships. Further, clients may choose to conduct business with other market participants who engage in business or offer products in areas we
deem speculative or risky, such as cryptocurrencies. Increased competition may negatively affect our earnings by creating pressure to lower prices or credit standards on our products and services requiring additional investment to improve the quality
and delivery of our technology and/or reducing our market share, or affecting the willingness of our clients to do business with us.
In addition, the widespread adoption of new technologies, including internet banking services, mobile banking services, payment systems, those
related to or involving AI, machine learning, blockchain and other distributed ledger technologies, could require substantial expenditures to modify or adapt our existing products and services as we grow and develop our internet banking and mobile
banking channel strategies in addition to remote connectivity solutions. We might not be successful in developing or introducing new products and services, integrating new products or services into our existing offerings, responding or adapting to
changes in consumer behavior, preferences, spending, investing and/or saving habits, achieving market acceptance of our products and services, reducing costs in response to pressures to deliver products and services at lower prices or sufficiently
developing and maintaining loyal customers.
Further, we may experience a decrease in customer deposits if customers perceive alternative investments, such as the stock market, as providing
superior expected returns. When customers move money out of bank deposits in favor of alternative investments, we may lose a relatively inexpensive source of funds, and be forced to rely more heavily on borrowings and other sources of funding to fund
our business and meet withdrawal demands, thereby increasing our funding costs and adversely affecting our net interest margin.
Our growth strategy includes risks that could have an adverse effect on our financial performance.
An element of our growth strategy is the acquisition of additional banks, bank holding companies, financial holding companies, and/or other
businesses related to the financial services industry that may complement our organizational structure in order to achieve greater economies of scale. The market for acquisitions remains highly competitive. Accordingly, we cannot assure you that
appropriate growth opportunities will continue to exist, that we will be able to acquire additional banks, bank holding companies and/or financial holding companies that satisfy our criteria or that any such acquisitions will be on terms favorable to
us. To the extent that we are unable to find suitable acquisition candidates, an important component of our growth strategy may be lost.
In addition, acquisitions of financial institutions involve operational risks and uncertainties and acquired companies may have unforeseen
liabilities, exposure to asset quality problems, key employee and customer retention problems and other problems that could negatively affect our organization. We may incur substantial costs to expand, and we cannot give assurance such expansion will
result in the levels of profits we seek. We may not be able to complete future acquisitions; and, if completed, we may not be able to successfully integrate the operations, management, products and services of the entities that we acquire and eliminate
redundancies. The integration process could result in the loss of key employees or disruption of the combined entity’s ongoing business or inconsistencies in standards, controls, procedures and policies that adversely affect our ability to maintain
relationships with customers and employees or achieve the anticipated benefits of the transaction. The integration process may also require significant time and attention from our management that they would otherwise direct at servicing existing
business and developing new business. Our inability to find suitable acquisition candidates and failure to successfully integrate the entities we acquire into our existing operations may increase our operating costs significantly and adversely affect
our business and earnings.
Further, our growth strategy requires that we continue to hire qualified personnel, while concurrently expanding our managerial and operational
infrastructure. We cannot assure you that we will be able to hire and retain qualified personnel or that we will be able to successfully expand our infrastructure to accommodate future acquisitions or growth. As a result of these factors, we may not
realize the expected economic benefits associated with our acquisitions. This could have a material adverse effect on our financial performance.
If we are unable to manage our growth effectively, our operations could be negatively affected.
If we experience growth in the future, we could face various risks and difficulties, including:
|
● |
finding suitable markets for expansion; |
|
● |
finding suitable candidates for acquisition; |
|
● |
attracting funding to support additional growth; |
|
● |
maintaining asset quality; |
|
● |
attracting and retaining qualified management and personnel; and |
|
● |
maintaining adequate regulatory capital. |
In addition, in order to manage our growth and maintain adequate information and reporting systems within our organization, we must identify, hire
and retain additional qualified associates, particularly in the accounting and operational areas of our business.
If we do not manage our growth effectively, our business, financial condition, results of operations and future prospects could be negatively
affected, and we may not be able to continue to implement our business strategy and successfully conduct our operations.
We face risks in connection with completed or potential acquisitions.
Historically, we have grown through the acquisition of other financial institutions as well as the development of de novo offices. During 2021, we
completed three bank mergers, including our acquisition of Cadence Bancorporation and Cadence Bank, N.A. (collectively, “Legacy Cadence”). On January 22, 2025, we announced the pending acquisition of FCB Financial Corp., the holding company for First
Chatham Bank. As appropriate opportunities present themselves, we have pursued and intend to continue to pursue additional acquisitions in the future that we believe are strategic and accretive to earnings. There can be no assurance that we will be
able to identify, negotiate, finance or consummate potential acquisitions successfully or, if consummated, integrate such acquisitions with our current business.
We may not realize all of the anticipated benefits of any acquisition.
Our ability to realize the anticipated benefits of any acquisition depend, to a large extent, on our ability to successfully integrate the
acquired business. The integration and combination of the acquired business is a complex, costly and time-consuming process. As a result, we have, and continue to devote significant management attention and resources to integrating acquired entities.
The integration process may disrupt our business and the business of the acquired institution in ways that limit the full realization of the anticipated benefits of the acquisition. The failure to meet any such challenges involved in completing
integration of the acquired businesses and realization of those anticipated benefits could cause an interruption of, or a loss of momentum in, our business activities, and could adversely impact our business, financial condition and results of
operations. In addition, completing integration of acquired businesses may still result in material unanticipated problems, expenses, liabilities, loss of customers and diversion of our management’s and employees’ attention. The challenges of combining
the operations of other companies include, among others:
|
● |
Difficulties in achieving anticipated cost savings, synergies, business opportunities and growth prospects, including the potential adverse impact of any outstanding debt the Company assumes in connection with a
merger; |
|
● |
Difficulties in the integration of operations and teams; |
|
● |
Difficulties in the assimilation and retention of employees; |
|
● |
Difficulties in managing the expanded operations of a larger and more complex company; |
|
● |
Challenges in keeping existing customers and obtaining new customers; |
|
● |
Challenges in attracting and retaining key personnel, including personnel that are considered key to future success; |
|
● |
Challenges related to an acquired entity’s credit quality and credit risk; and |
|
● |
Challenges in keeping key business relationships in place. |
Many of these factors are outside of our control and any one of them could result in increased costs and liabilities, decreases in expected income
and deposits, and diversion of management’s time and energy, which could have a material adverse effect on our business, financial condition and results of operations. Additionally, even if an integration is successful, the full benefits of the
transaction may not be realized, including the synergies, cost savings, growth opportunities or earnings accretion that are expected. These benefits may not be achieved within the anticipated time frame, or at all, and additional unanticipated costs
may be incurred in the integration of the businesses. These liabilities could include exposure to unexpected asset quality problems, compliance and regulatory violations, key employee and client retention problems and other problems that could result
in significant costs to us.
All of these factors could cause dilution to our earnings per share, decrease or delay the expected accretive effect of the transaction,
negatively impact the price of our common stock, or have a material adverse effect on our business, financial condition and results of operations.
We may not be able to raise additional capital in the future.
We are required by federal regulatory authorities to maintain adequate levels of capital to support our operations. In addition, we may elect to
raise additional capital to support our business or to finance any acquisitions or we may otherwise elect or be required to raise additional capital. As a publicly-traded company, a likely source of additional funds is the capital markets, accomplished
generally through the issuance of equity, including common stock, preferred stock, warrants, depository shares, rights, purchase contracts or units, and the issuance of senior or subordinated debt securities. Our ability to raise additional capital, if
needed, will depend on conditions in the capital markets, economic conditions and a number of other factors, many of which are outside our control, and on our financial performance. Accordingly, we cannot provide assurance of our ability to raise
additional capital if needed or to be able to do so on terms acceptable to us. Any occurrence that may limit its access to the capital markets, such as a decline in the confidence of investors, depositors of the Company or counterparties participating
in the capital markets, may adversely affect our capital costs and our ability to raise capital and, in turn, our liquidity. Moreover, if we need to raise capital in the future, we may have to do so when many other financial institutions are also
seeking to raise capital and would have to compete with those institutions for investors. If we cannot raise additional capital on favorable terms when needed, it may have a material adverse effect on our financial condition and results of operations.
If the goodwill that we record in connection with a business acquisition becomes impaired, it could require a charge to earnings.
Goodwill represents the amount by which the purchase price exceeds the fair value of net assets acquired in a business combination. We review
goodwill for impairment at least annually, or more frequently if events or changes in circumstances indicate the carrying value of the asset might be impaired.
We evaluate goodwill for impairment by comparing the estimated fair value of each reporting unit with its carrying amount, including goodwill. If
the carrying amount of a reporting unit exceeds its estimated fair value, an impairment loss is recognized in an amount equal to that excess. Factors that could cause an impairment charge include adverse changes to macroeconomic conditions, declines in
the profitability of the reporting unit, or declines in the tangible book value of the reporting unit. Future evaluations of goodwill may result in impairment which could have a material adverse effect on our business, financial condition and results
of operations.
Operational Risk
Our business is, and will continue to be, dependent on technology and an inability to invest in technological improvements or obtain reliable technological support
may adversely affect our results of operation and financial condition.
The financial services industry is undergoing rapid technological changes with frequent introductions of new technology-driven products and
services. In addition to better serving customers, the effective use of technology increases efficiency and enables financial institutions to reduce costs. Our ability to grow and compete will depend in part upon our ability to address the needs of
customers by using technology to provide products and services that will satisfy their operational needs, while managing the costs of expanding our technology infrastructure and our geographic footprint. Many competitors have substantially greater
resources to invest in technological improvements and third-party support. There can be no assurance that we will be able to effectively implement new technology-driven products and services or be successful in marketing these products and services to
our customers. For the foreseeable future, we expect to rely on third-party service providers and on other third parties for services and technical support. If those products and services become unreliable or fail, the adverse impact on customer
relationships and operations could be material.
The development and use of generative AI technology presents risks and challenges that may adversely impact the Company’s business.
The Company or its third-party (or fourth party) vendors, clients or counterparties may develop or incorporate AI technology in certain business
processes, services, or products. The legal and regulatory environment relating to AI is uncertain and rapidly evolving, both in the U.S. and internationally, and includes regulatory schemes targeted specifically at AI as well as provisions in
intellectual property, privacy, consumer protection, employment, and other laws applicable to the use of AI. These evolving laws and regulations could require changes in the Company’s consideration or implementation of AI technology and increase the
Company’s compliance costs and the risk of non-compliance. AI models, particularly generative AI models, may produce output or take action that is incorrect, that reflects biases included in the data on which they are trained, that results in the
release of private, confidential, or proprietary information, that infringes on the intellectual property rights of others, or that is otherwise harmful. In addition, the complexity of many AI models makes it difficult to understand why they are
generating particular outputs. This limited transparency increases the challenges associated with assessing the proper operation of AI models, understanding and monitoring the capabilities of the AI models, reducing erroneous output, eliminating bias,
and complying with regulations that require documentation or explanation of the basis on which decisions are made. Further, the Company may rely on AI models developed by third parties, and, to that extent, would be dependent in part on the manner in
which those third parties develop and train their models, including risks arising from the inclusion of any unauthorized material in the training data for their models and the effectiveness of the steps these third parties have taken to limit the risks
associated with the output of their models, matters over which the Company may have limited visibility. Any of these risks could expose the Company to liability or adverse legal or regulatory consequences and harm the Company’s reputation and the
public perception of its business or the effectiveness of its security measures.
We are subject to a variety of systems-failure and cybersecurity risks that could adversely affect our business and financial performance.
Our internal operations are subject to certain risks, including, but not limited to, information systems failures and errors, customer or employee
fraud and catastrophic failures resulting from terrorist acts, data piracy or natural disasters. We maintain a system of internal controls and security to mitigate the risks of many of these occurrences and maintain insurance coverage for certain
risks. However, should an event occur that is not prevented or detected by our internal controls, and is uninsured against, or in excess of applicable insurance limits, such occurrence could have an adverse effect on our business, financial condition,
results of operations, and liquidity.
The computer systems and network infrastructure we use could be vulnerable to unforeseen problems. Our operations are dependent upon the ability
to protect our computer equipment against damage from fire, severe storm, power loss, telecommunications failure or a similar catastrophic event. Any damage or failure of our computer systems or network infrastructure that causes an interruption in
operations could have an adverse effect on our financial condition, results of operations and liquidity.
In addition, our operations are dependent upon our ability to protect the computer systems and network infrastructure against damage from physical
break-ins, security breaches and other disruptive problems caused by internet users or other users. Computer break-ins and other disruptions could jeopardize the security of information stored in and transmitted through our computer systems and
networks, which may result in significant liability and reputation risk to us, and may deter potential customers. Although we, with the help of third-party service providers, intend to continue to actively monitor and, where necessary, implement
improved security technology and develop additional operational procedures to prevent damage or unauthorized access to our computer systems and network, there can be no assurance that these security measures or operational procedures will be
successful. In addition, new developments or advances in computer capabilities and AI or new discoveries in the field of cryptography could enable hackers or data pirates to compromise or breach the security measures we use to protect customer data
through more sophisticated cyber threats, including AI-generated phishing attacks and automated vulnerability exploitation. Any failure to maintain adequate security over our customers’ personal and transactional information could expose us to
reputational risk or consumer litigation and could have an adverse effect on our financial condition, results of operations and liquidity.
Our risk and exposure to cyber-attacks and other information security breaches remain heightened because of, among other things, the evolving
nature of these threats and the prevalence of internet and mobile banking. As cyber threats continue to evolve, we may be required to expend significant additional resources to continue to modify or enhance our protective measures or to investigate and
remediate any information security vulnerabilities. Disruptions or failures in the physical infrastructure or operating systems that support our businesses and customers, or cyber-attacks or security breaches of the networks, systems or devices that
customers use to access our products and services, could result in customer attrition, regulatory fines, penalties or intervention, reputational damage, reimbursement or other compensation costs, including litigation expense and/or additional
compliance costs, any of which could materially and adversely affect our business, results of operations or financial condition.
We may be adversely affected by the failure of certain third-party vendors to perform.
We rely upon certain third-party vendors to provide products and services necessary to maintain our day-to-day operations. These third parties
provide key components of our business operations. Accordingly, our operations are exposed to the risk that these vendors might not perform in accordance with applicable contractual arrangements or service level agreements. Any complications caused by
these third parties, including those resulting from disruptions in communication services provided by a vendor, failure of a vendor to handle current or higher volumes, cyber-attacks and security breaches at a vendor, failure of a vendor to provide
services for any reason, or poor performance of services, could adversely affect our ability to deliver products and services to our customers and otherwise conduct our business. Financial or operational difficulties of a third-party vendor could also
hurt our operations if those difficulties interfere with the vendor’s ability to provide services. Furthermore, our vendors could also be sources of operational and information security risk, including from breakdowns or failures of their own systems
or capacity constraints. Replacing these third-party vendors could also create significant delay and expense. Problems caused by external vendors could be disruptive to our operations, which could have a material adverse impact on our business and, in
turn, our financial condition and results of operations. We maintain a system of policies and procedures designed to monitor vendor risks, including, among other things: (i) changes in the vendor’s organizational structure; (ii) changes in the vendor’s
financial condition; (iii) changes in existing products and services or the introduction of new products and services; and (iv) changes in the vendor’s support for existing products and services. While we believe these policies and procedures help to
mitigate risk, the failure of an external vendor to perform in accordance with applicable contractual arrangements or service level agreements could be disruptive to our operations, which could have a material adverse effect on our financial condition
and results of operations.
Our earnings could be adversely impacted by incidences of fraud and compliance failures that are not within our direct control.
Financial institutions are inherently exposed to fraud risk. A fraud can be perpetrated by a customer of the Company, an employee, a vendor or
members of the general public. We are most subject to fraud and compliance risk in connection with the origination of loans, automated clearing house transactions, ATM transactions and checking transactions. Our largest fraud risk, associated with the
origination of loans, includes the intentional misstatement of information in property appraisals or other underwriting documentation provided to us by third parties. If any of the information upon which we rely is misrepresented, either fraudulently
or inadvertently, and the misrepresentation is not detected prior to asset funding, the value of the asset may be significantly lower than expected, or we may fund a loan we would not have funded or on terms we would not have extended. Whether a
misrepresentation is made by the applicant or another third party, we generally bear the risk of loss associated with the misrepresentation. A loan subject to a material misrepresentation is typically unsellable or subject to repurchase if it is sold
prior to detection of the misrepresentation. The sources of the misrepresentations are often difficult to locate, and it is often difficult to recover any of the monetary losses we may suffer. Accordingly, the compliance risk is that loans are not
originated in compliance with applicable laws and regulations and our standards. There can be no assurance that we can prevent or detect acts of fraud or violation of law or our compliance standards by third parties. Repeated incidences of fraud or
compliance failures could adversely impact the performance of our loan portfolio.
We are subject to environmental liability risk associated with our lending activities.
A significant portion of our loan portfolio is secured by real property. During the ordinary course of business, we may foreclose on and take
title to properties securing certain loans. In doing so, there is a risk that hazardous or toxic substances could be found on these properties. If hazardous or toxic substances are found, we may be liable for remediation costs, as well as for personal
injury and property damage. Environmental laws may require us to incur substantial expenses and may materially reduce the affected property’s value or limit our ability to use or sell the affected property. In addition, future laws or more stringent
interpretations or enforcement policies with respect to existing laws may increase our exposure to environmental liability. The remediation costs and any other financial liabilities associated with an environmental hazard could have a material adverse
effect on our business, results of operations and financial condition.
RISKS RELATED TO THE REGULATION OF OUR INDUSTRY
Regulatory Risk
The banking industry is highly regulated, and current and future legislative or regulatory changes could have a significant adverse effect on our business,
financial condition, or results of operations.
As a state chartered bank, we are subject to extensive federal supervision and regulation. Federal regulation of the banking industry, along with
tax and accounting laws, regulations, rules and standards, limit our operations significantly and control the methods by which we conduct business. In addition, compliance with laws and regulations can be difficult and costly, and changes to laws and
regulations can impose additional compliance costs. Many of these regulations are intended to protect depositors, customers, the public, the banking system as a whole or the FDIC DIF, not shareholders. Regulatory requirements and discretion affect our
lending practices, capital structure, investment practices, dividend policy and many other aspects of our business. There are laws and regulations which restrict transactions between us and our subsidiaries. These requirements may constrain our
operations, and the adoption of new laws and changes to or repeal of existing laws may have a further impact on our business, financial condition, results of operations and future prospects. The burdens imposed by federal and state regulations place
banks at a competitive disadvantage compared to non-bank competitors. We are also subject to requirements with respect to the confidentiality of information obtained from clients concerning their identities, business and personal financial information,
employment, and other matters. We require our personnel to agree to keep all such information confidential and we monitor compliance. Failure to comply with confidentiality requirements could result in material liability and adversely affect our
business, financial condition, results of operations and future prospects.
Federal and state regulatory agencies may adopt changes to their regulations or change the manner in which existing regulations are applied. We
cannot predict the substance or effect of pending or future legislation or regulation or the application of laws and regulations to our Company. Compliance with current and potential regulation, as well as regulatory scrutiny, may significantly
increase our costs, impede the efficiency of our internal business processes, require us to increase our regulatory capital, and limit our ability to pursue business opportunities in an efficient manner by requiring us to expend significant time,
effort and resources to ensure compliance and respond to any regulatory inquiries or investigations. In addition, press coverage and other public statements that assert some form of wrongdoing by financial services companies (including press coverage
and public statements that do not involve us) may result in regulatory inquiries or investigations, which, independent of the outcome, may be time-consuming and expensive and may divert time, effort and resources from our business. Evolving regulations
and guidance concerning executive compensation may also impose limitations on us that affect our ability to compete successfully for executive and management talent.
See the discussion above at “Item 1. Business – Regulation and Supervision” for an additional discussion of the extensive regulation and
supervision we are subject to.
Regulatory initiatives regarding bank capital requirements may require increased capital.
Cadence is subject to risk-based and leverage capital requirements. We must maintain certain risk-based and leverage capital ratios as required by
our banking regulators, which can change depending on economic conditions and our particular condition, risk profile, growth plans, and regulatory capital guidelines. Failure to meet minimum capital guidelines and/or other regulatory requirements can
subject the Company to certain mandatory and possibly additional discretionary actions by regulators that, if undertaken, could have a direct material adverse effect on the Company’s consolidated financial statements. Additional information, including
the Company’s and Bank’s compliance with applicable capital adequacy standards is provided in Note 18 to the consolidated financial statements and “Management’s Discussion and Analysis of Financial Condition and Results of Operations—Regulatory
Capital.”
Changes in accounting rules applicable to banks could adversely affect our financial condition and results of operations.
From time to time, the FASB and the SEC change the financial accounting and reporting standards that govern the preparation of our consolidated
financial statements. These changes can be hard to predict and can materially impact how we record and report our financial condition and results of operations. In some cases, we could be required to apply a new or revised standard retroactively,
resulting in a restatement of our prior period financial statements.
Regulators continually examine our business and we may be required to remediate adverse examination findings.
The federal and state banking regulators continually examine our business, including our compliance with laws and regulations, and we may become
subject to other regulatory agency examinations in the future. If, as a result of an examination, a federal or state banking agency were to determine that our financial condition, capital resources, asset quality, earnings prospects, management,
liquidity, or other aspects of any of our operations had become unsatisfactory, or that we were in violation of any law or regulation, it may require us to take a number of different remedial actions as it deems appropriate. These actions include the
power to enjoin “unsafe or unsound” practices, to require affirmative action to correct any conditions resulting from any violation or practice, to issue an administrative order that can be judicially enforced, to direct an increase in our capital, to
restrict our growth by preventing us from acquiring other financial institutions or limiting our ability to expand our business by engaging in new activities, to change the asset composition of our portfolio or balance sheet, to assess civil monetary
penalties against our officers or directors, to remove officers and directors and, if it is concluded that such conditions cannot be corrected or there is an imminent risk of loss to depositors, to terminate our deposit insurance and place us into
receivership or conservatorship. Any regulatory action against us could have a material adverse effect on our business, financial condition and results of operations.
The Company is operating under a Consent Order, and its failure to comply with the Consent Order could materially and adversely affect our business.
On August 30, 2021, Legacy Cadence Bank and the DOJ agreed to a settlement set forth in the consent order related to the investigation by the DOJ
of Legacy Cadence Bank’s fair lending program in Harris, Fort Bend and Montgomery Counties located in Houston, Texas during the period between 2014 and 2016 (the “Consent Order”). Under the Consent Order, Legacy Cadence Bank will, among other things,
implement a mutually agreed upon Fair Lending Plan, invest $4.17 million in a loan subsidy fund to increase credit opportunities to residents of majority-Black and Hispanic neighborhoods and will devote $1.38 million toward advertising, community
outreach, and credit repair and education. Legacy Cadence Bank will also open one full-service branch to serve the banking and credit needs of residents in a majority-Black and Hispanic neighborhood in Houston. In addition, Legacy Cadence Bank will
employ a director of community lending and development who will oversee these efforts and work in close consultation with Legacy Cadence Bank’s leadership. The Consent Order was signed by the United States District Court for the Northern District of
Georgia, Atlanta Division, on August 31, 2021. Pursuant to Section 5.2(g) of the Agreement and Plan of Merger with Legacy Cadence, dated April 12, 2021, and Paragraph 50 of the Consent Order, Legacy BancorpSouth Bank approved the negotiated settlement,
and subsequently, the Company agreed to accept the obligations of the Consent Order. The Consent Order is in effect for five years. For additional information regarding the terms of this settlement and the Consent Order, see Legacy Cadence’s Current
Report on Form 8-K that was filed with the SEC on August 30, 2021.
The Company is operating under the Consent Order. Our Board of Directors and senior management team have been working diligently to comply with
the Consent Order and believe that they have allocated sufficient resources to address the corrective actions required by the DOJ. Compliance with and resolution of the Consent Order will ultimately be determined by the DOJ. The Company’s failure to
comply with the Consent Order and to successfully implement its requirements may cause us to incur additional significant compliance costs, subject us to larger fines, result in serious reputational consequences, additional regulatory enforcement
actions, including the imposition of material restrictions on the activities of the Company or the assessment of fines or penalties against the Company and its officers and directors, which could prevent the Company from executing its business strategy
and negatively impact its business, or additional enforcement of the Consent Order through court proceedings. Any of these results could have a material and adverse effect on our business, results of operations, financial condition, cash flows and
stock price.
Compliance Risk
We are subject to numerous laws designed to protect consumers, including the CRA and fair lending laws, and failure to comply with these laws could lead to a wide
variety of sanctions.
The CRA, the Equal Credit Opportunity Act, the Fair Housing Act and other fair lending laws and regulations impose nondiscriminatory lending
requirements on financial institutions. The Department of Justice and other federal agencies, including the CFPB, are responsible for enforcing these laws and regulations. A successful regulatory challenge to an institution’s performance under the CRA
or fair lending laws and regulations could result in a wide variety of sanctions, including damages and civil money penalties, injunctive relief, restrictions on mergers and acquisitions activity, restrictions on expansion, and restrictions on entering
new business lines. As discussed in more detail above, the Company is subject to the Consent Order in connection with Legacy Cadence Bank’s compliance with fair lending laws. In the case of the CRA, the performance of a financial institution in meeting
the credit needs of its community and its overall CRA rating are factors that will be taken into consideration when the federal banking agencies evaluate applications related to mergers and acquisitions, as well as branch opening and relocations.
Private parties may also have the ability to challenge an institution’s performance under fair lending laws in private class action litigation. Such actions could have a material adverse effect on our business, financial condition and results of
operations.
Federal, state and local consumer lending laws may restrict our ability to originate certain mortgage loans or increase our risk of liability with respect to such
loans and could increase our cost of doing business.
Federal, state and local laws have been adopted that are intended to eliminate certain lending practices considered “predatory.” These laws
prohibit practices such as steering borrowers away from more affordable products, selling unnecessary insurance to borrowers, repeatedly refinancing loans and making loans without a reasonable expectation that the borrowers will be able to repay the
loans irrespective of the value of the underlying property. It is our policy not to make predatory loans, but these laws create the potential for liability with respect to our lending and loan investment activities. They increase our cost of doing
business and, ultimately, may prevent us from making certain loans and cause us to reduce the average percentage rate or the points and fees on loans that we do make.
The expanding body of federal, state and local regulations and/or the licensing of loan servicing, collections or other aspects of our business and our sales of
loans to third parties may increase the cost of compliance and the risks of noncompliance and subject us to litigation.
We service some of our own loans, and loan servicing is subject to extensive regulation by federal, state and local governmental authorities as
well as to various laws and judicial and administrative decisions imposing requirements and restrictions on those activities. The volume of new or modified laws and regulations has increased in recent years and, in addition, some individual
municipalities have begun to enact laws that restrict loan servicing activities including delaying or temporarily preventing foreclosures or forcing the modification of certain mortgages. If regulators impose new or more restrictive requirements, we
may incur additional significant costs to comply with such requirements which may further adversely affect us. In addition, were we to be subject to regulatory investigation or regulatory action regarding our loan modification and foreclosure
practices, our financial condition and results of operation could be adversely affected.
We are subject to laws regarding the privacy, information security and protection of personal information and any violation of these laws or
another incident involving personal, confidential or proprietary information of individuals could damage our reputation and otherwise adversely affect our operations and financial condition.
Our business requires the collection and retention of large volumes of customer data, including personally identifiable information in various
information systems that we maintain and in those maintained by third parties with whom we contract to provide data services. We also maintain important internal company data such as personally identifiable information about our employees and
information relating to our operations. We are subject to complex and evolving laws and regulations governing the privacy and protection of personal information of individuals (including customers, employees, suppliers and other third parties). For
example, our business is subject to the Gramm-Leach-Bliley Act which, among other things: (i) imposes certain limitations on our ability to share nonpublic personal information about our customers with nonaffiliated third parties; (ii) requires that we
provide certain disclosures to customers about our information collection, sharing and security practices and afford customers the right to “opt out” of any information sharing by us with nonaffiliated third parties (with certain exceptions); and (iii)
requires that we develop, implement and maintain a written comprehensive information security program containing appropriate safeguards based on our size and complexity, the nature and scope of our activities, and the sensitivity of customer
information we process, as well as plans for responding to data security breaches. Various state and federal banking regulators and states have also enacted data security breach notification requirements with varying levels of individual, consumer,
regulatory or law enforcement notification in certain circumstances in the event of a security breach. Ensuring that our collection, use, transfer and storage of personal information complies with all applicable laws and regulations can increase our
costs. Furthermore, we may not be able to ensure that all of our clients, suppliers, counterparties and other third parties have appropriate controls in place to protect the confidentiality of the information that they exchange with us, particularly
where such information is transmitted by electronic means. If personal, confidential or proprietary information of customers or others were to be mishandled or misused (in situations where, for example, such information was erroneously provided to
parties who are not permitted to have the information, or where such information was intercepted or otherwise compromised by third parties, including cyber criminals), we could be exposed to litigation or regulatory sanctions under personal information
laws and regulations. Concerns regarding the effectiveness of our measures to safeguard personal information, or even the perception that such measures are inadequate, could cause us to lose customers or potential customers for our products and
services and thereby reduce our revenues. Accordingly, any failure or perceived failure to comply with applicable privacy or data protection laws and regulations may subject us to inquiries, examinations and investigations that could result in
requirements to modify or cease certain operations or practices or in significant liabilities, fines or penalties, and could damage our reputation and otherwise adversely affect our operations and financial condition.
GENERAL RISK FACTORS
Economic Conditions
The fiscal and monetary policies and other actions of the U.S. government could have a material adverse effect on our results of operations.
Our business is significantly affected by fiscal and monetary policies of the U.S. federal government and its agencies, particularly the Federal
Reserve. Federal Reserve policies determine in large part the cost of funds for lending and investing and the returned earned on those loans and investments, both of which impact our net interest margin. Federal Reserve policies may also adversely
affect borrowers, potentially increasing the risk that they may fail to repay their loans or could adversely create asset bubbles which result from prolonged periods of accommodative policy. This, in turn, may result in volatile markets and rapidly
declining collateral values. The monetary policies of the Federal Reserve and other governmental policies have had a significant effect on the operating results of commercial banks in the past and are expected to continue to do so in the future.
Changes in any of these policies are influenced by macroeconomic conditions and other factors that are beyond our control. In addition, changes in trade policies by the United States, such as tariffs or retaliatory tariffs, may cause inflation which
could impact the prices of products sold by our borrowers and have the potential to reduce demand for their products, impacting their profitability and making it difficult for our borrowers to repay their loans. Adverse economic conditions and
government policy responses to such conditions could have a material adverse effect on our business, financial condition and results of operations.
The Federal Reserve implemented significant economic strategies that have impacted interest rates, inflation, asset values, and the shape of the yield curve, over
which the Company has no control and which the Company may not be able to adequately anticipate.
In recent years, the Federal Reserve implemented a series of accommodative domestic monetary initiatives through changes to the federal funds
target rate. The Federal Reserve reduced rates from 2019 through 2021, then increased rates throughout 2022 and 2023 in response to the significant increase in the domestic inflation rate in the U.S. In 2024, the Federal Reserve began to cut rates,
doing so three times, for a total of 1.0%, bringing the rate to 4.5% in December 2024. Further rate changes, increasing or decreasing the rate, are reportedly dependent on the Federal Reserve’s assessment of economic data as it becomes available. The
Company cannot predict the nature or timing of future changes in monetary, economic, or other policies or the effect that they may have on the Company’s business activities, financial condition and results of operations. Changes in monetary policy,
including changes in interest rates, could influence: (i) the amount of interest we receive on loans and securities; (ii) the amount of interest we pay on deposits and borrowings; (iii) our ability to originate loans and obtain deposits; (iv) the fair
value of our assets and liabilities; and (v) the reinvestment risk associated with changes in the duration of our mortgage-backed securities portfolio.
The current economic environment poses significant challenges and could adversely affect our financial condition and results of operations.
We are operating in a challenging and uncertain economic environment. The global credit and financial markets have from time to time experienced
extreme volatility and disruptions, including severely diminished liquidity and credit availability, declines in consumer confidence, declines in economic growth, increases in unemployment rates, high rates of inflation, and uncertainty about economic
stability. As a result, financial institutions continue to be affected by uncertainty in the real estate market, the credit markets, and the national financial market generally. We retain direct exposure to the commercial and residential real estate
markets, and we are affected by events in these markets. The financial markets and the global economy may also be adversely affected by the current or anticipated impact of military conflict, including the current conflict between Russia and Ukraine
and the conflicts in the Middle East, which increase volatility in commodity and energy prices, creating supply chain issues and causing instability in financial markets. Sanctions, tariffs, or other economic penalties imposed by the United States and
other countries in response to such conflicts could further adversely impact the financial markets and the global economy, and any economic countermeasures by the affected countries or others could exacerbate market and economic instability.
The uncertainty in economic conditions has subjected us and other financial institutions to increased regulatory scrutiny. In addition,
deterioration in local economic conditions in our markets could result in losses beyond that provided for in our ACL and result in increased loan delinquencies, problem assets, and foreclosures. This may also result in declining demand for products and
services, decreased deposits and increased borrowings under our current contractual obligations to extend credit, all of which would adversely impact our liquidity positions, and declining values for loan collateral, which in turn would reduce
customers’ borrowing power and the value of assets and collateral associated with our existing loans.
Investment in Our Common Stock and Preferred Stock
The price of our common stock and preferred stock may fluctuate significantly, which may make it difficult for investors to resell shares of our common stock or
preferred stock at a time or price they find attractive.
The price of our common stock and preferred stock may fluctuate significantly as a result of a variety of factors, many of which are beyond our
control. In addition to those described in “Cautionary Notice Regarding Forward Looking Statements,” these factors include, among others:
|
● |
actual or anticipated quarterly fluctuations in our operating results, financial condition or asset quality; |
|
● |
changes in financial estimates or the publication of research reports and recommendations by financial analysts or actions taken by rating agencies with respect to us or other financial institutions; |
|
● |
failure to declare dividends on our capital stock from time to time; |
|
● |
failure to meet analysts’ revenue or earnings estimates; |
|
● |
failure to integrate acquisitions or realize anticipated benefits from acquisitions; |
|
● |
strategic actions by us or our competitors, such as acquisitions, restructurings, dispositions or financings; |
|
● |
fluctuations in the stock price and operating results of our competitors or other companies that investors deem comparable to us; |
|
● |
future sales of our capital stock or other securities; |
|
● |
future repurchases of our common or preferred securities; |
|
● |
proposed or final regulatory changes or developments; |
|
● |
anticipated or pending regulatory investigations, proceedings, or litigation that may involve or affect us; |
|
● |
reports in the press or investment community generally relating to our reputation or the financial services industry; |
|
● |
domestic and international economic and political factors unrelated to our performance; |
|
● |
general market conditions and, in particular, developments related to market conditions for the financial services industry; |
|
● |
adverse weather conditions, including floods, tornadoes and hurricanes; and |
|
● |
geopolitical conditions such as acts or threats of terrorism or military conflicts. |
In addition, in recent years, the stock market in general has experienced extreme price and volume fluctuations. This volatility has had a
significant effect on the market price of securities issued by many companies, including for reasons unrelated to their operating performance. These broad market fluctuations may adversely affect the market price of our capital stock, notwithstanding
our operating results. We expect that the market price of our capital stock will continue to fluctuate and there can be no assurances about the levels of the market prices for our capital stock.
General market fluctuations, industry factors and general economic and political conditions and events, such as economic slowdowns or recessions,
interest rate changes or credit loss trends, could also cause the stock price of our capital stock to decrease regardless of operating results.
The rights of our common shareholders are generally subordinate to the rights of holders of our debt securities and preferred stock and may be subordinate to the
rights of holders of any class of preferred stock or any debt securities that we may issue in the future.
Our Board of Directors has the authority to issue debt securities as well as an aggregate of up to 500,000,000 shares of preferred stock without
any further action on the part of our shareholders. Our Board of Directors also has the power, without shareholder approval, to set the terms of any debt securities or series of preferred stock that may be issued, including voting rights, dividend
rights, and preferences over our common stock with respect to dividends or in the event of a dissolution, liquidation or winding up and other terms. The shares and subordinated notes have certain rights that are senior to our common stock. Any debt or
shares of preferred stock that we may issue in the future may be senior to our common stock. Accordingly, you should assume that any debt securities or preferred stock that we may issue in the future will also be senior to our common stock. Because our
decision to issue debt or equity securities or incur other borrowings in the future will depend on market conditions and other factors beyond our control, the amount, timing, nature or success of our future capital raising efforts is uncertain. Holders
of our common stock bear the risk that our future issuances of debt or equity securities or our occurrence of other borrowings may negatively affect the market price of our common stock.
In the event that we issue preferred stock or debt securities in the future that has preference over our common stock with respect to payment of
dividends or upon our liquidation, dissolution or winding up, or if we issue preferred stock with voting rights that dilute the voting power of our common stock, the rights of the holders of our common stock or the market price of our common stock
could be adversely affected.
Adverse changes in the ratings for our debt securities or preferred stock could have a material adverse effect on our business, financial condition and liquidity
and may increase our funding costs or impair our ability to effectively compete for business and clients.
The major rating agencies regularly evaluate us and their ratings of our long-term debt and preferred stock based on a number of factors,
including our financial strength and conditions affecting the financial services industry generally. In general, rating agencies base their ratings on many quantitative and qualitative factors, including capital adequacy, liquidity, asset quality,
business mix and level and quality of earnings, and we may not be able to maintain our current credit ratings and preferred stock ratings. Our ratings remain subject to change at any time, and it is possible that any rating agency will take action to
downgrade us in the future.
The ratings for our debt securities and preferred stock impact our ability to obtain funding. Reductions in any of the ratings for our debt
securities or preferred stock could adversely affect our ability to borrow funds and raise capital. Downgrades in our ratings could trigger additional collateral or funding obligations, which may adversely impact our liquidity. Therefore, any negative
credit rating actions could have a material adverse effect on our business, results of operations, financial condition or liquidity.
Furthermore, our clients and counterparties may be sensitive to the risks posed by a downgrade to our ratings and may terminate their
relationships with us, may be less likely to engage in transactions with us, or may only engage in transactions with us at a substantially higher cost. We cannot predict the extent to which client relationships or opportunities for future relationships
could be adversely affected due to a downgrade in our ratings. The inability to retain clients or to effectively compete for new business may have a material and adverse effect on our business, results of operations or financial condition.
Additionally, rating agencies themselves have been subject to scrutiny arising from the financial crisis. As a result or for unrelated reasons,
the rating agencies may make or may be required to make substantial changes to their ratings policies and practices. Such changes may, among other things, adversely affect the ratings of our securities or other securities in which we have an economic
interest.
Our ability to declare and pay dividends is limited.
There can be no assurance of whether or when we may pay dividends on our capital stock in the future. Future dividends, if any, will be declared
and paid at the discretion of our Board of Directors and will depend on a number of factors. Although the Company’s asset quality, earnings performance, liquidity and capital requirements will be taken into account before we declare or pay any future
dividends on our capital stock, our Board of Directors will also consider our liquidity and capital requirements. In addition, federal and state banking laws and regulations and state corporate laws restrict the amount of dividends we may declare and
pay. See “Item 1. Business - Regulation and Supervision” included herein for more information. Finally, so long as any shares of our 5.50% Series A Non-Cumulative Perpetual Preferred Stock, par value $0.01 (“Series A Preferred Stock”) remain
outstanding, unless we have paid in full (or declared and set aside funds sufficient for) applicable dividends on the Series A Preferred Stock, we may not declare or pay any dividend on our common stock, other than a dividend payable solely in shares
of common stock or in connection with a shareholder rights plan.
Our articles of incorporation and bylaws include provisions that could impede a takeover of the Company.
Certain provisions of our articles of incorporation and bylaws could delay, defer, or prevent a third party from acquiring control of our
organization or conduct a proxy contest, even if those events were perceived by many of our shareholders as beneficial to their interests. These provisions:
|
● |
enable our Board of Directors to issue additional shares of authorized, but unissued capital stock; |
|
● |
enable our Board of Directors to issue “blank check” preferred stock with such designations, rights and preferences as may be determined from time to time by the board; |
|
● |
enable our Board of Directors to increase the size of the board and fill the vacancies created by the increase; |
|
● |
provide for a plurality voting standard in the election of directors; |
|
● |
do not provide for cumulative voting in the election of directors; |
|
● |
enable our Board of Directors to amend our bylaws without shareholder approval; |
|
● |
do not allow for the removal of directors without cause; |
|
● |
limit the right of shareholders to call a special meeting; |
|
● |
require advance notice for director nominations and other shareholder proposals; and |
|
● |
require prior regulatory application and approval of any transaction involving control of our organization. |
These provisions, as well as our classified or “staggered” board of directors and change-in-control agreements with members of management may
discourage potential acquisition proposals and could delay or prevent a change in control, including when our shareholders might otherwise receive a premium over the market price of our shares.
Shares of our common stock and preferred stock are not deposits insured by the FDIC and are subject to risk of loss and uncertain return on investment.
Shares of our common stock and preferred stock are not deposit accounts and are not insured by the FDIC or any other government agency and are
subject to investment risk, including the possible loss of all of your investment.
Other Risks
As a public company, we incur significant legal, accounting, insurance, compliance and other expenses. Any deficiencies in our financial reporting or internal
controls could materially and adversely affect us, including resulting in material misstatements in our financial statements, and the market price of our common stock.
As a public company, we incur significant legal, accounting, insurance and other expenses. These costs and compliance with the rules of the SEC
and the rules of the applicable stock exchange may further increase our legal and financial compliance costs and make some activities more time consuming and costly. SEC rules require that our CEO and CFO periodically certify the existence and
effectiveness of our internal control over financial reporting and our independent registered public accounting firm is required to audit the effectiveness of our internal control over financial reporting. This process requires significant
documentation of policies, procedures and systems, review of that documentation by our internal auditing and accounting staff and our outside independent registered public accounting firm and testing of our internal control over financial reporting by
our internal auditing and accounting staff and our outside independent registered public accounting firm. This process involves considerable time and attention from management, which could prevent us from successfully implementing our business
initiatives and improving our business, results of operations and financial condition, may strain our internal resources, and increases our operating costs.
During our testing, we may identify deficiencies that would have to be remediated to satisfy the SEC rules for certification of our internal
control over financial reporting. A material weakness is defined by the standards issued by the PCAOB as a deficiency, or combination of deficiencies, in internal control over financial reporting that results in a reasonable possibility that a material
misstatement of our annual or interim financial statements will not be prevented or detected on a timely basis. Therefore, we would have to disclose in periodic reports we file with the Federal Reserve any material weakness in our internal control over
financial reporting. The existence of a material weakness would preclude management from concluding that our internal control over financial reporting is effective and would preclude our independent auditors from attesting to the effectiveness of our
internal control over financial reporting. In addition, disclosures of deficiencies of this type in our Federal Reserve reports could cause investors to lose confidence in our financial reporting, may negatively affect the market price of our common
stock, and could result in the delisting of our securities from the securities exchanges on which they trade. Moreover, effective internal controls are necessary to produce reliable financial reports and to prevent fraud. If we have deficiencies in our
disclosure controls and procedures or internal control over financial reporting, it may materially and adversely affect us.
We may be adversely affected by changes in U.S. tax laws.
We are subject to federal and applicable state tax regulations. Such tax regulations are often complex and require interpretation and changes in
these regulations could negatively impact our results of operations. In the normal course of business, we are routinely subject to examinations and challenges from federal and applicable state tax authorities regarding the amount of taxes due. Federal
and state taxing authorities have become increasingly aggressive in challenging tax positions taken by financial institutions. These tax positions may relate to tax compliance, sales and use, franchise, gross receipts, payroll, property and income tax
issues, including tax base, apportionment and tax credit planning. The challenges made by tax authorities may result in adjustments to the timing or amount of taxable income or deductions or the allocation of income among tax jurisdictions. If any such
challenges are made and are not resolved in our favor, they could have a material adverse effect on our results of operations.
We depend upon key personnel and we may not be able to retain them or attract, assimilate and retain highly qualified employees in the future.
Our success depends in significant part upon the continued service of our senior management team and our continuing ability to attract, assimilate
and retain highly qualified and skilled managerial, product development, lending, marketing and other personnel. We have an experienced senior management team and other key personnel that our board of directors believes is capable of managing and
growing our business. The loss of the services of any member of our senior management or other key personnel or the inability to hire or retain qualified personnel in the future could adversely affect our business, results of operations and financial
condition.
We are required to make significant estimates and assumptions in the preparation of our financial statements. These estimates and assumptions may not be accurate
and are subject to change.
The preparation of our consolidated financial statements in conformity with GAAP requires our management to make significant estimates and
assumptions that affect the reported amounts of assets and liabilities and disclosures of contingent assets and liabilities at the date of the consolidated financial statements, and the reported amounts of income and expense during the reporting
periods. Estimates are made by management in determining, among other things, the accounting for business combinations, estimates of fair value, ACL and valuation of deferred tax assets. If our underlying estimates and assumptions prove to be incorrect
or if events occur that require us to revise our previous estimates or assumptions, our financial condition and results of operations may be materially adversely affected.
We are involved in legal proceedings and may be the subject of additional litigation or government investigations in the future; the actual cost of legal
proceedings may exceed our accruals for them.
The nature of our business ordinarily results in a certain amount of litigation and investigations by government agencies having oversight over
our business. Although we have developed policies and procedures to minimize the impact of legal noncompliance and other disputes and endeavored to provide reasonable insurance coverage, litigation, government investigations and regulatory actions
present an ongoing risk.
We cannot predict with certainty the cost of defense, the cost of prosecution or the ultimate outcome of litigation and other proceedings filed by
or against us, our directors, management or employees, including remedies or damage awards. On at least a quarterly basis, we assess our liabilities and contingencies in connection with outstanding legal proceedings as well as certain threatened claims
(which are not considered incidental to the ordinary conduct of our business) utilizing the latest and most reliable information available. For matters where a loss is not probable or the amount of the loss cannot be estimated, no accrual is
established. For matters where it is probable we will incur a loss and the amount can be reasonably estimated, we establish an accrual for the loss. Once established, the accrual is adjusted periodically to reflect any relevant developments. The actual
cost of any outstanding legal proceedings and the potential loss, however, may turn out to be substantially higher than the amount accrued. Further, our insurance may not cover all litigation, other proceedings or claims, or the costs of defense. While
the final outcome of any legal proceedings is inherently uncertain, based on the information available, advice of counsel and available insurance coverage, if applicable, management believes that the litigation-related expense we have accrued is
adequate and that any incremental liability arising from pending legal proceedings, including class action litigation, and threatened claims and those otherwise arising in the ordinary course of business, will not have a material adverse effect on our
business or consolidated financial condition. It is possible, however, that future developments could result in an unfavorable outcome for any lawsuit or investigation in which we or our subsidiaries are involved, which may have a material adverse
effect on our business or our results of operations for one or more quarterly reporting periods. See “Item 7. Management’s Discussion and Analysis of Financial Condition and Results of Operations-Financial Condition - Certain Litigation and Other
Contingencies” for more information regarding material pending legal proceedings and ongoing government investigations.
Reputational and ESG risk may impact our results.
Our ability to originate and maintain deposit accounts is highly dependent upon customer and other external perceptions of our business practices
and/or our financial health. Adverse perceptions regarding our business practices and/or our financial health could damage our reputation in both the customer and funding markets, leading to difficulties in generating and maintaining accounts as well
as in financing them. Adverse developments with respect to customer or other external perceptions regarding the practices of our competitors, or our industry as a whole, may also adversely impact our reputation. While we carefully monitor internal and
external developments for areas of potential reputational risk and have established governance structures to assist in evaluating such risks in our business practices and decisions, adverse reputational impacts on third parties with whom we have
important relationships may also adversely impact our reputation. Adverse impacts on our reputation, or the reputation of our industry, may also result in greater regulatory and/or legislative scrutiny, which may lead to laws, regulations or regulatory
actions that may change or constrain the manner in which we engage with our customers and the products and services we offer. Adverse reputational impacts or events may also increase our litigation risk.
Our business faces public, investor, activist, legislative and regulatory scrutiny related to ESG. We face risking damage to our brand and
reputation if we fail to act responsibly in a number of areas, and investors and shareholder advocates are placing ever increasing emphasis on how corporations address ESG issues in their business strategy when making investment decisions and when
developing their investment theses and proxy recommendations. We may incur meaningful costs with respect to our ESG efforts and if such efforts are negatively perceived, our reputation and stock price may suffer.
There are increasing instances of “anti-ESG” legislation, regulation, and litigation related to ESG, which could impact ordinary banking
operations and increase litigation risk related to actions we choose to take. If legislatures in the states in which we operate adopt legislation intended to protect certain industries by limiting or prohibiting consideration of business and industry
factors in lending activities, certain portions of our lending operations may be impacted.
Our framework for managing risks may not be effective in mitigating risk and any resulting loss.
Our risk management framework seeks to mitigate risk and any resulting loss. We have established processes intended to identify, measure, monitor,
report and analyze the types of risk to which we are subject, including liquidity, credit, market, interest rate, operational, legal and compliance, and reputational risk. However, as with any risk management framework, there are inherent limitations
to our risk management processes and strategies. There may exist, or develop in the future, risks that we have not appropriately anticipated or identified. Also, breakdowns in our risk management framework could have a material adverse effect on our
financial condition and results of operations.
Certain weather conditions have the potential to disrupt our business and adversely impact the operations and creditworthiness of our clients.
We have operations in Alabama, Arkansas, Florida, Georgia, Louisiana, Mississippi, Missouri, Tennessee and Texas, which include areas susceptible
to hurricanes, tornados and tropical storms. Such weather conditions can disrupt our operations, result in damage to our branch office locations or negatively affect the local economies in which we operate. We cannot predict whether or to what extent
damage caused by future hurricanes, tornados, tropical storms or other adverse weather events will affect our operations or the economies in our market areas, but such weather conditions could result in a decline in loan originations and an increase in
the risk of delinquencies, foreclosures or loan losses. Our business or results of operations may be adversely affected by these and other negative effects of devastating hurricanes, tornados, tropical storms or other adverse weather events.
ITEM 1B. UNRESOLVED STAFF COMMENTS.
None.
ITEM 1C. CYBERSECURITY.
Cadence Bank’s information security program is designed to protect the security, availability, integrity, and confidentiality of our computer
systems, networks, software, and information assets, including client and other sensitive data. The program is comprised of policies, guidelines, and procedures intended to align with regulatory guidance and the Center for Internet Security Controls
(“CIS Controls”). CIS Controls are a prescriptive, prioritized, and simplified set of best practices that are used to strengthen cybersecurity. Assessing, identifying, and managing cybersecurity related risks are integrated into our overall enterprise
risk management process.
Cybersecurity Risk Management and Strategy
At Cadence Bank, we encourage all associates to be responsible for the security and confidentiality of client information. We communicate this
responsibility to associates upon hiring and regularly throughout their employment. We regularly provide associates with information security awareness training, including concerning the recognition and appropriate handling of potential phishing
activity which could potentially place client or employee data, or other sensitive company data, at risk. Our Enterprise Risk Management process integrates identification, assessment, and management of cybersecurity risks. Additionally, we maintain
procedures for the safe storage, handling, and secure disposal of sensitive information.
Cadence Bank protects its network and information assets with industry-tested security products and processes. Our information security team
actively monitors company networks and systems to detect suspicious or malicious activity. Internal and external resources attend to monitoring, investigation, and defense of the Company’s network and computer systems. We conduct vulnerability scans,
and contract with third-party vendors to perform penetration tests against the Company’s network. The Company also engages additional expert cyber consultants, as necessary and appropriate. Our Third-Party Risk Management program also engages with
different departments within the Company in order to identify and evaluate cyber risks of our vendors and external service providers so that the relevant lines of business can also engage to manage potential cyber risks of the vendor. Our information
security program includes review of known cyber issues of our vendors and consideration of any action by the Company in response. Additionally, the Company evaluates potential cyber risks, as appropriate, in its risk assessments.
As part of our information security program, we have adopted a Cyber Crisis and Data Breach Response Plan (Incident Response Plan), which is
overseen primarily by our CISO in close collaboration with our CIO, Legal, and other relevant leaders at the Company. The Incident Response Plan sets forth the Company’s processes and procedures for responding to significant cybersecurity incidents and
establishes procedures for escalation and reporting of potentially significant cybersecurity incidents to senior management, Legal, and/or our Board Risk Committee, as appropriate.
Our Information Security Event Response Team, which includes senior members of the Legal, Information Security, Enterprise Risk Management,
Operations Management, Compliance, Audit, Security, Business Continuity, and Corporate Communications departments, performs, at least annually, exercises to simulate responses to cybersecurity incidents. Each exercise results in lessons learned and
subsequent enhancements to the Incident Response Plan.
While we have experienced cybersecurity incidents in the past, to date none have materially affected or are reasonably likely to materially affect
the Company or our business strategy, financial position, results of operations and/or cash flows. Despite our efforts, there can be no assurance that our cybersecurity risk management processes and measures described will be fully implemented,
complied with, or effective in protecting our systems and information. We face risks from certain cybersecurity threats that, if realized, are reasonably likely to materially affect our business strategy, result of operations or financial condition.
See Item 1A. “Risk Factors” for further discussion of the material risks associated with an interruption or breach in our information systems or infrastructure.
Cybersecurity Governance
Our Board of Directors is responsible for overseeing the Company’s business, affairs, and material risks, including risks associated with
cybersecurity threats. The Board oversees the Company’s corporate risk governance processes primarily through its committees, and oversight of cybersecurity risks is delegated primarily to our Risk Management Committee. The Risk Management Committee
receives cybersecurity and relevant updates from our CISO and CIO on a quarterly basis, as well as relevant risk assessments and reporting on privacy or data breaches. At least annually, our CISO attends a meeting with the Risk Management Committee to
update members on material cybersecurity developments and risks. Additionally, the Board receives an information security program summary report quarterly from the CISO, outlining the overall status of our information security program and the Company’s
compliance with regulatory guidelines.
The Board’s oversight of cybersecurity risk is supported by our CISO, who reports to the CIO. Our CISO is a veteran information technology
executive with decades of experience in the information technology field. The CISO has managed the Company’s information security program for over two decades and worked for the Company for a number of years before he assumed that role. The CISO has a
B.S. in Computer Science and minored in Management Information Systems and Math. He is a CISSP and a CISM. Our CIO has more than two decades experience working in the information technology space in the private sector and before that spent a
significant number of years working in related fields in the U.S. Air Force. He holds a B.S. in Management Science, and an MBA in Information Technology.
Our CISO is responsible for the Company’s information security program. In this role, the CISO manages the Company’s information security and
day-to-day cybersecurity operations and supports the information security risk oversight responsibilities of the Board and its committees. The CISO is a member of the Company’s Operations department and reports to our CIO, who in turn reports to our
COO. The CISO attends Risk Management Committee meetings as a permanent invitee, provides cybersecurity and other relevant updates to the Risk Management Committee on a quarterly basis, and meets with the Risk Management Committee in executive session
at least annually to update committee members on material cybersecurity developments and risks. The CISO also provides the quarterly information security program summary report to the Board.
ITEM 2. PROPERTIES.
At December 31, 2024, the physical properties of the Company are located in the states of Alabama, Arkansas, Florida, Georgia, Louisiana,
Mississippi, Missouri, Tennessee and Texas. The Company maintains corporate offices in Houston, Texas and Tupelo, Mississippi, as well as Birmingham, Alabama. The Company’s main office is located at One Mississippi Plaza, 201 South Spring Street in the
central business district of Tupelo, Mississippi in a seven-floor, modern, glass, concrete and steel office building owned by the Company. The Company occupies approximately 98% of the space, with the remainder leased to an unaffiliated tenant. The
Company also owns an additional 289 buildings that provide space for branch banking, computer operations, lease servicing, mortgage banking, warehouse needs and other general purposes. In addition to the facilities the Company owns, 93 branch-banking,
mortgage banking, and operational facilities that are occupied under leases with unexpired terms ranging from one to twenty-six years. Of the owned and leased properties described above, 371 properties are used by the Community and Corporate Banking
segments, 117 are used by the Mortgage segment, 41 properties are used by the Banking Services segment, and 14 properties are used by the General Corporate and Other segment. Management considers all of the Company’s owned buildings and leased premises
to be in good condition. None of the Company’s properties are subject to material encumbrances.
ITEM 3. LEGAL PROCEEDINGS.
As reflected in publicly available information, the Company was impacted by the zero-day vulnerability of Progress’ MOVEit software. That has not
resulted, and is not expected to result, in a material impact to our business strategy, results of operations or financial condition. The Company has been named as a defendant in class action litigation arising from this incident, which is pending in
the District of Massachusetts. Addressing cybersecurity risks is a priority for the Company, and the Company is committed to ongoing enhancement of its systems of internal controls and business continuity and disaster recovery plans. See Item 1A. “Risk
Factors” for further discussion of the risks associated with an interruption or breach in our information systems or infrastructure.
Additional information in response to this item is incorporated herein by reference to “Note 21 - Commitments and Contingent Liabilities -
Litigation” in the notes to the consolidated financial statements included in Part II., Item 8. “Financial Statements” of this Report.
ITEM 4. MINE SAFETY DISCLOSURES.
None.
PART II—FINANCIAL INFORMATION
ITEM 5. MARKET FOR THE REGISTRANT’S COMMON EQUITY, RELATED STOCKHOLDER MATTERS AND ISSUER PURCHASES OF EQUITY SECURITIES.
MARKET FOR CAPITAL STOCK
The common stock of the Company trades on the NYSE under the symbol “CADE,” and the 5.50% Series A Non- Cumulative Perpetual Preferred Stock
trades on the NYSE under the symbol “CADE Pr A.”
HOLDERS OF RECORD
As of February 18, 2025, there were 5,816 shareholders of record of the Company’s common stock.
DIVIDENDS
The Company declared cash dividends each quarter in an aggregate annual amount of $1.00 and $0.94 per share of common stock during 2024 and 2023,
respectively. Future dividends, if any, will vary depending on the Company’s profitability, anticipated capital requirements and applicable federal and state regulations. Under Mississippi law, the Company must obtain the non-objection of the
Commissioner of the MDBCF prior to paying any dividend on the Company’s common stock. In addition, the Company may not pay any dividends if, after paying the dividend, it would be undercapitalized under applicable capital requirements. The Company is
further restricted by the authority federal banking regulators have to prohibit the Company from engaging in business practices that they consider unsafe or unsound, which, depending on the financial condition of the Company, could include the payment
of dividends. There can be no assurance that federal banking authorities or other regulatory bodies will not limit or prohibit future dividends. Finally, so long as any shares of our Series A Preferred Stock remain outstanding, unless we have paid in
full (or declared and set aside funds sufficient for) applicable dividends on the Series A Preferred Stock, we may not declare or pay any dividend on our common stock, other than a dividend payable solely in shares of common stock or in connection with
a shareholder rights plan. See “Item 1. Business - Regulation and Supervision” included herein for more information on restrictions and limitations on the Company’s ability to pay dividends.
ISSUER PURCHASES OF EQUITY SECURITIES
The Company had repurchases of shares of common stock during the quarter ended December 31, 2024 as follows:
| Period |
|
Total Number
of Shares
Purchased(1) (2)
|
|
|
Average Price
Paid per Share |
|
|
Total Number of
Shares Purchased
as Part of Publicly
Announced Plans
or Programs(2) |
|
|
Maximum Number
of Shares that May
Yet Be Purchased
Under the Plans
or Programs(2) |
|
| October 31, 2024 |
|
|
— |
|
|
$ |
— |
|
|
|
— |
|
|
|
8,762,979 |
|
| November 30, 2024 |
|
|
261 |
|
|
|
37.97 |
|
|
|
— |
|
|
|
8,762,979 |
|
| December 31, 2024 |
|
|
— |
|
|
|
— |
|
|
|
— |
|
|
|
8,762,979 |
|
| Total |
|
|
261 |
|
|
$ |
37.97 |
|
|
|
|
|
|
|
|
|
| (1) |
This column includes no shares redeemed in October 2024, 261 shares redeemed in November 2024, and no shares redeemed in December 2024 from employees for tax withholding purposes for stock compensation. There were no
shares repurchased under the stock repurchase program in the fourth quarter of 2024. |
| (2) |
On December 13, 2023, the Company announced a share repurchase program whereby the Company may acquire up to an aggregate of 10,000,000 shares of its common stock in the open market at prevailing market prices or in
privately negotiated transactions during the period January 2, 2024 through December 31, 2024. The extent and timing of any repurchases depends on market conditions and other corporate, legal and regulatory considerations. Repurchased shares are
held as authorized but unissued shares. These authorized but unissued shares will be available for use in connection with the Company’s equity incentive plans, other compensation programs, other transactions or for other corporate purposes as
determined by the Company’s Board of Directors. At the time of expiration on December 31, 2024, 1,237,021 had been repurchased under this program. |
RECENT SALES OF UNREGISTERED SECURITIES
From time to time, the Company issues securities in certain transactions that are described in its period and current reports. The securities
issued in these transactions are issued in reliance on the exemption provided by Section 3(a)(2) of the Securities Act of 1933, as amended, because the sales involve securities issued by a bank.
STOCK PERFORMANCE GRAPH
The graph below compares the annual percentage change in the cumulative total shareholder return on the Company’s common stock against the
cumulative total return of the S&P 500 Index and the KBW Nasdaq Bank Index for a period of five years. The graph assumes an investment of $100 in the Company’s common stock and in each respective index on December 31, 2019 and reinvestment of
dividends without commissions. The KBW Nasdaq Bank Index is a modified cap-weighted index consisting of 24 exchange-listed National Market System stocks, representing national money center banks and leading regional institutions. The performance graph
represents past performance and should not be considered to be an indication of future performance.
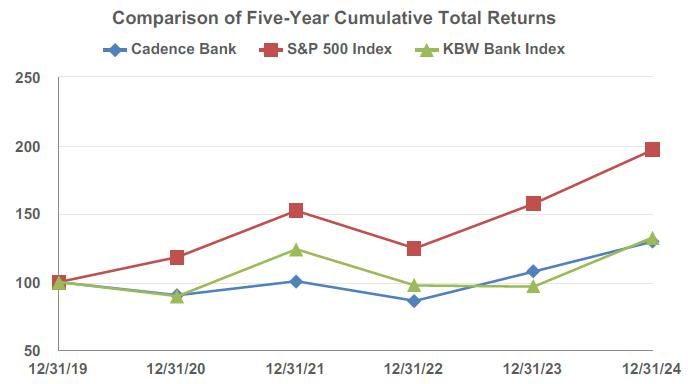
| |
|
Period Ending |
|
| Index |
|
12/31/19 |
|
|
12/31/20 |
|
|
12/31/21 |
|
|
12/31/22 |
|
|
12/31/23 |
|
|
12/31/24 |
|
| Cadence Bank |
|
|
100.00 |
|
|
|
90.37 |
|
|
|
100.65 |
|
|
|
86.21 |
|
|
|
107.73 |
|
|
|
129.66 |
|
| S&P 500 Index |
|
|
100.00 |
|
|
|
118.39 |
|
|
|
152.34 |
|
|
|
124.73 |
|
|
|
157.48 |
|
|
|
196.85 |
|
| KBW Nasdaq Bank Index |
|
|
100.00 |
|
|
|
89.69 |
|
|
|
124.08 |
|
|
|
97.53 |
|
|
|
96.66 |
|
|
|
132.63 |
|
This stock performance graph and related information shall not be deemed to be “soliciting material” or to be “filed” or subject to Regulation 14A
or 14C of the Exchange Act or to the liabilities of Section 18 of the Exchange Act, except to the extent that the Company specifically requests that such information be treated as soliciting material or specifically incorporates it by reference into
such filing.
ITEM 6. [RESERVED]
ITEM 7. MANAGEMENT’S DISCUSSION AND ANALYSIS OF FINANCIAL CONDITION AND RESULTS OF OPERATIONS.
OVERVIEW
The Company is a regional bank with dual headquarters in Houston, Texas and Tupelo, Mississippi with $47.0 billion in total assets at December 31,
2024. The Company has commercial banking operations in Alabama, Arkansas, Florida, Georgia, Louisiana, Mississippi, Missouri, Tennessee, and Texas. The Company and its subsidiaries provide commercial banking, leasing, mortgage origination and
servicing, brokerage, trust, and investment advisory services to corporate customers, local governments, individuals, and other financial institutions through an extensive network of branches and offices.
Management’s discussion and analysis provides a narrative discussion of the Company’s financial condition and results of operations. For a
complete understanding of the following discussion, refer to the consolidated financial statements and related notes presented elsewhere in this Report. Management’s discussion and analysis should also be read in conjunction with the risk factors
included in Item 1A of this Report. This discussion and analysis is based on reported financial information, and certain amounts for prior years have been reclassified to conform with the current financial statement presentation.
The financial condition and operating results of the Company are heavily influenced by economic trends nationally and in the specific markets in
which the Company’s subsidiaries provide financial services. Generally, the pressures of the national and regional economic cycle create a difficult operating environment for the financial services industry. During such times, the Company is not immune
to pressures and any economic downturn may have a negative impact on the Company and its customers in all of the markets it serves. Management believes future weakness in the economic environment could adversely affect the strength of the credit
quality of the Company’s assets. Therefore, management will continue to focus on early identification and resolution of credit issues.
The largest source of the Company’s revenue is derived from its corporate and community banking operations. The financial condition and operating
results of the Company are affected by the level and volatility of interest rates on loans, investment securities, deposits, and other borrowed funds, and the impact of economic downturns on loan demand, collateral values, and creditworthiness of
existing borrowers. The financial services industry is highly competitive and heavily regulated. The Company’s success depends on its ability to compete aggressively within its markets while maintaining sufficient asset quality and cost controls to
generate net income.
The information that follows is provided to enhance comparability of financial information between periods and to provide a better understanding
of the Company’s operations.
Significant 2024 Events and Recent Developments
During 2024, our results reflected improved financial performance resulting from various strategic accomplishments and continued success in
business development. We continued to generate quality loans, increase our core customer deposits, reduce our debt and attract fee business, while maintaining strong liquidity and capital. We experienced strong revenue growth coupled with lower
operating expenses, resulting in enhanced operating efficiency, while continuing to improve our net interest margin and reflect stable credit quality results. Also during 2024, the Company repurchased 1,237,021 shares of our common stock. We believe
these results positively position our Company for continued and future success.
Effective May 17, 2024, the Company completed the sale of Cadence Business Solutions, LLC, its payroll processing business, resulting in a net
gain on sale of approximately $12.0 million. The gain on sale was included in Other noninterest revenue within the accompanying consolidated statements of income.
In November 2024, Cadence Bank became a member bank of the Federal Reserve Board. As a result of this, the Company’s primary federal regulator is
now the Federal Reserve Bank of St. Louis.
On January 22, 2025, the Company announced it entered into a definitive merger agreement with FCB Financial Corp., the bank holding company for
First Chatham Bank, a Savannah, Georgia-based community bank. The merger has been unanimously approved by the boards of directors of both companies. Pending regulatory approval, the approval of FCB Financial Corp. shareholders, and the satisfaction of
other customary closing conditions, it is anticipated to close during the third quarter of 2025.
NON-GAAP FINANCIAL MEASURES AND RECONCILIATIONS
In addition to financial ratios based on measures defined by GAAP, the Company has identified “total tangible shareholders’ equity,” “tangible
common shareholders’ equity,” “total tangible common shareholders’ equity (excluding AOCI),” “total tangible assets,” “total tangible assets (excluding AOCI),” “tangible shareholders’ equity to tangible assets,” “tangible common shareholders’ equity to
tangible assets,” “tangible common shareholders’ equity to tangible assets (excluding AOCI),” “tangible common book value per share,” and “tangible book value per common share (excluding AOCI)” as non-GAAP financial measures used when evaluating the
performance of the Company.
|
● |
Total tangible shareholders’ equity is defined by the Company as total shareholders’ equity less goodwill and other intangible assets, net. |
|
● |
Total tangible common shareholders’ equity is defined by the Company as total shareholders’ equity less preferred stock, goodwill, and other intangible assets, net. |
|
● |
Total tangible common shareholders’ equity, excluding AOCI, is defined by the Company as total shareholders’ equity less preferred stock, goodwill, other intangible assets, net, and AOCI. |
|
● |
Total tangible assets are defined by the Company as total assets less goodwill and other intangible assets, net. |
|
● |
Total tangible assets, excluding AOCI, are defined by the Company as total assets less goodwill, other intangible assets, net, and AOCI. |
|
● |
Tangible common book value per share is defined by the Company as tangible common shareholders’ equity divided by total shares of common stock outstanding. |
|
● |
Tangible book value per common share, excluding AOCI, is defined by the Company as tangible common shareholders’ equity less AOCI divided by total shares of common stock outstanding. |
Management believes the ratios of tangible shareholders’ equity to tangible assets, tangible common shareholders’ equity to tangible assets and
tangible common shareholders’ equity to tangible assets (excluding AOCI) to be important to investors who are interested in evaluating the adequacy of the Company’s capital levels. Management also believes that tangible common book value per share and
tangible common book value per share (excluding AOCI) are important to investors who are interested in changes from period to period in book value per share exclusive of changes in intangible assets.
The following table reconciles these non-GAAP financial measures as presented above to GAAP financial measures as reflected in the Company’s
consolidated financial statements for the periods indicated:
TABLE 1—NON-GAAP FINANCIAL MEASURES
| |
|
Year Ended December 31, |
|
| (Dollars in thousands, except per share amounts) |
|
2024 |
|
|
2023 |
|
|
2022 |
|
| Total tangible assets, excluding AOCI |
|
|
|
|
|
|
|
|
|
|
|
|
| Total assets |
|
$ |
47,019,190 |
|
|
$ |
48,934,510 |
|
|
$ |
48,653,414 |
|
| Less: Goodwill |
|
|
1,366,923 |
|
|
|
1,367,785 |
|
|
|
1,367,785 |
|
| Other intangible assets, net |
|
|
83,190 |
|
|
|
100,191 |
|
|
|
119,579 |
|
| Total tangible assets |
|
$ |
45,569,077 |
|
|
$ |
47,466,534 |
|
|
$ |
47,166,050 |
|
| Less: AOCI |
|
|
(694,495 |
) |
|
|
(761,829 |
) |
|
|
(1,222,538 |
) |
| Total tangible assets, excluding AOCI |
|
$ |
46,263,572 |
|
|
$ |
48,228,363 |
|
|
$ |
48,388,588 |
|
| |
|
|
|
|
|
|
|
|
|
|
|
|
| Total tangible common shareholders’ equity, excluding AOCI |
|
|
|
|
|
|
|
|
|
|
|
|
| Total shareholders’ equity |
|
$ |
5,569,683 |
|
|
$ |
5,167,843 |
|
|
$ |
4,311,374 |
|
| Less: Goodwill |
|
|
1,366,923 |
|
|
|
1,367,785 |
|
|
|
1,367,785 |
|
| Other intangible assets, net |
|
|
83,190 |
|
|
|
100,191 |
|
|
|
119,579 |
|
| Total tangible shareholders’ equity |
|
$ |
4,119,570 |
|
|
$ |
3,699,867 |
|
|
$ |
2,824,010 |
|
| Less: Preferred stock |
|
|
166,993 |
|
|
|
166,993 |
|
|
|
166,993 |
|
| Total tangible common shareholders’ equity |
|
$ |
3,952,577 |
|
|
$ |
3,532,874 |
|
|
$ |
2,657,017 |
|
| Less: AOCI |
|
|
(694,495 |
) |
|
|
(761,829 |
) |
|
|
(1,222,538 |
) |
| Total tangible common shareholders’ equity, excluding AOCI |
|
$ |
4,647,072 |
|
|
$ |
4,294,703 |
|
|
$ |
3,879,555 |
|
| |
|
|
|
|
|
|
|
|
|
|
|
|
| Total common shares outstanding |
|
|
183,527,575 |
|
|
|
182,871,775 |
|
|
|
182,437,265 |
|
| |
|
|
|
|
|
|
|
|
|
|
|
|
| Tangible shareholders’ equity to tangible assets |
|
|
9.04 |
% |
|
|
7.79 |
% |
|
|
5.99 |
% |
| Tangible common shareholders’ equity to tangible assets |
|
|
8.67 |
% |
|
|
7.44 |
% |
|
|
5.63 |
% |
| Tangible common shareholders’ equity, excluding AOCI, to tangible assets, excluding AOCI |
|
|
10.04 |
% |
|
|
8.90 |
% |
|
|
8.02 |
% |
| Tangible common book value per share |
|
$ |
21.54 |
|
|
$ |
19.32 |
|
|
$ |
14.56 |
|
| Tangible book value per common share, excluding AOCI |
|
$ |
25.32 |
|
|
$ |
23.48 |
|
|
$ |
21.27 |
|
FINANCIAL HIGHLIGHTS
The following table presents financial highlights for the periods indicated:
TABLE 2—FINANCIAL HIGHLIGHTS
| |
|
As of and For the Year Ended December 31, |
|
| |
|
2024 |
|
|
2023 |
|
|
2022 |
|
| Common share data: |
|
|
|
|
|
|
|
|
|
|
|
|
| Basic earnings (loss) per share from continuing operations |
|
$ |
2.81 |
|
|
$ |
(0.03 |
) |
|
$ |
2.39 |
|
| Basic earnings per share |
|
|
2.81 |
|
|
|
2.92 |
|
|
|
2.47 |
|
| Diluted earnings (loss) per share from continuing operations |
|
|
2.77 |
|
|
|
(0.03 |
) |
|
|
2.37 |
|
| Diluted earnings per share |
|
|
2.77 |
|
|
|
2.92 |
|
|
|
2.46 |
|
| Cash dividends per share |
|
|
1.00 |
|
|
|
0.94 |
|
|
|
0.88 |
|
| Book value per share |
|
|
29.44 |
|
|
|
27.35 |
|
|
|
22.72 |
|
| Tangible common book value per share (1) |
|
|
21.54 |
|
|
|
19.32 |
|
|
|
14.56 |
|
| Tangible book value per common share, excluding AOCI (1) |
|
|
25.32 |
|
|
|
23.48 |
|
|
|
21.27 |
|
| Dividend payout ratio from continuing operations |
|
|
36.10 |
% |
|
|
NM |
|
|
|
37.13 |
% |
| Financial Ratios: |
|
|
|
|
|
|
|
|
|
|
|
|
| Return on average assets from continuing operations |
|
|
1.09 |
% |
|
|
0.01 |
% |
|
|
0.94 |
% |
| Return on average assets |
|
|
1.09 |
|
|
|
1.11 |
|
|
|
0.97 |
|
| Return on average shareholders’ equity from continuing operations |
|
|
9.78 |
|
|
|
0.08 |
|
|
|
9.78 |
|
| Return on average shareholders’ equity |
|
|
9.78 |
|
|
|
12.08 |
|
|
|
10.13 |
|
| Return on average common shareholders’ equity from continuing operations |
|
|
9.91 |
|
|
|
(0.13 |
) |
|
|
9.93 |
|
| Return on average common shareholders’ equity |
|
|
9.91 |
|
|
|
12.33 |
|
|
|
10.30 |
|
| Total shareholders’ equity to total assets |
|
|
11.85 |
|
|
|
10.56 |
|
|
|
8.86 |
|
| Total common shareholders’ equity to total assets |
|
|
11.49 |
|
|
|
10.22 |
|
|
|
8.52 |
|
| Tangible common shareholders’ equity to tangible assets (1) |
|
|
8.67 |
|
|
|
7.44 |
|
|
|
5.63 |
|
| Tangible common shareholders’ equity, excluding AOCI, to tangible assets, excluding AOCI (1) |
|
|
10.04 |
|
|
|
8.90 |
|
|
|
8.02 |
|
| Net interest margin-FTE |
|
|
3.30 |
|
|
|
3.08 |
|
|
|
3.15 |
|
| Credit Quality Ratios: |
|
|
|
|
|
|
|
|
|
|
|
|
| Net charge-offs to average loans and leases |
|
|
0.24 |
% |
|
|
0.23 |
% |
|
|
—% |
|
| Provision for credit losses to average loans and leases |
|
|
0.21 |
|
|
|
0.25 |
|
|
|
0.02 |
|
| ACL to net loans and leases |
|
|
1.37 |
|
|
|
1.44 |
|
|
|
1.45 |
|
| ACL to NPL |
|
|
174.09 |
|
|
|
216.54 |
|
|
|
410.22 |
|
| ACL to NPA |
|
|
170.38 |
|
|
|
210.46 |
|
|
|
386.04 |
|
| NPL to net loans and leases |
|
|
0.78 |
|
|
|
0.67 |
|
|
|
0.35 |
|
| NPA to total assets |
|
|
0.58 |
|
|
|
0.45 |
|
|
|
0.23 |
|
| Capital Adequacy Ratios: |
|
|
|
|
|
|
|
|
|
|
|
|
| Common Equity Tier 1 capital |
|
|
12.35 |
% |
|
|
11.62 |
% |
|
|
10.22 |
% |
| Tier 1 capital |
|
|
12.79 |
|
|
|
12.06 |
|
|
|
10.66 |
|
| Total capital |
|
|
13.97 |
|
|
|
14.32 |
|
|
|
12.81 |
|
| Tier 1 leverage capital |
|
|
10.41 |
|
|
|
9.30 |
|
|
|
8.43 |
|
|
(1) |
Non-GAAP financial measure. See “Non-GAAP Financial Measures and Reconciliations.” |
As of December 31, 2024, the target range for the federal funds rate was 4.25% to 4.50%. In the fourth quarter of 2024, the Federal Reserve
lowered interest rates by 100 basis points, easing monetary policy for the first time in four years. There could potentially be more rate cuts in 2025, however, the Federal Reserve continues to monitor relevant economic data and economic policy
changes. The prior years’ increases in interest rates has had a pronounced effect on both our balance sheet as well as our earnings. As seen in the following sections, the increase in net interest revenue for 2024 compared to 2023 and 2023 compared to
2022 resulted from a combination of higher yields on interest-earning assets and a shift in the mix of interest-earning assets. The increase was partially offset by an increase in interest expense, primarily on deposits due to both a mix shift out of
noninterest bearing and into interest bearing, and an increase in deposit rates. See “Net Interest Revenue” for further information.
The Company reported net income available to common shareholders of $514.1 million in 2024, compared to $532.8 million in 2023. Key factors
contributing to the $18.7 million decrease in net income available to common shareholders included (1) the $706.6 million gain, included in discontinued operations in 2023, on the sale of Cadence Insurance; mostly offset by (2) the increase in
noninterest revenue primarily due to the $435.6 million loss on sale of securities in 2023 as a result of our securities portfolio restructuring during that period; and (3) the decrease in noninterest expense from $1.2 billion in 2023 to $1.0 billion
in 2024 as a result of lower deposit insurance, personnel costs and merger costs. Net interest revenue increased slightly, remaining at $1.4 billion in 2024 and 2023. The Company recorded a provision for credit losses of $71.0 million and $80.0 million
for 2024 and 2023, respectively.
Net income available to common shareholders was $532.8 million in 2023, compared to $453.7 million in 2022. The primary factor contributing to the
$79.1 million increase in net income available to common shareholders in 2023 was the $706.6 million gain on the sale of Cadence Insurance, included in discontinued operations. The gain in discontinued operations was partially offset by the $458.8
million decrease in noninterest revenue in 2023 primarily due to the $435.6 million loss on sale of securities as a result of our securities portfolio restructuring during that period. Also contributing to the decline was an increase in noninterest
expense from $1.1 billion in 2022 to $1.2 billion in 2023 due to deposit insurance assessments related to the FDIC special assessment. Net interest revenue remained flat at $1.4 billion for 2023 and 2022. The Company recorded a provision for credit
losses of $80.0 million and $7.0 million for 2023 and 2022, respectively.
Net interest revenue for 2024 increased $84.9 million, or 6.3% to $1.4 billion compared to 2023. The increase was primarily related to increased
interest rates which resulted in an increase on yields earned on interest-earning assets coupled with growth in average balances in the loan and lease portfolio and other investments. This increase was partially offset by the increase in interest
expense due to increased market interest rates paid on average interest bearing liabilities for deposits, as well as a mix shift from noninterest bearing deposits into interest bearing. With the increase in rates paid on average interest bearing
liabilities, interest expense increased $152.3 million, or 15.9%, in 2024 compared to 2023. See Table 4 below for more information on yield/ rate analysis.
Net interest revenue for 2023 and 2022 remained relatively flat at $1.4 billion. In 2023, interest revenue increased due to increased interest
rates which resulted in an increase on yields earned on interest-earning assets coupled with growth in average balances in the loan and lease portfolio. The increase in interest revenue was mostly offset by the increase in interest expense due to
increased market interest rates paid on average interest bearing liabilities for deposits and short-term borrowings, as well as a mix shift from noninterest bearing deposits into interest bearing. Average interest-bearing liabilities increased to $32.7
billion in 2023 from $28.5 billion in 2022. As a result of the increase in average interest-bearing liabilities coupled with the increase in rates paid on average interest bearing liabilities, interest expense increased $749.5 million, or 358.1%, in
2023, compared to 2022. See Table 4 below for more information on yield/rate analysis.
The Company attempts to diversify its revenue streams with noninterest revenue received from wealth management activities, mortgage banking
operations, and other activities that generate fee income. Noninterest revenue for 2024 was $356.5 million, compared to negative $116.3 million for 2023. The primary contributor to the increase in noninterest revenue was a decrease in security net
losses of $432.7 million as a result of securities portfolio restructuring in 2023. Other factors contributing to the increase included increases in deposit service charges of $11.8 million, wealth management revenue of $8.0 million, and other
noninterest revenue of $21.6 million, primarily due to the gain on sale of Cadence Business Solutions, LLC. These increases were partially offset by a $1.7 million decrease in mortgage banking revenue. Excluding security net losses, noninterest revenue
for 2024, was $359.5 million, an increase of $40.2 million, or 12.6%, from $319.3 million in 2023. See “Noninterest Revenue” below for more information.
Noninterest revenue for 2023 was negative $116.3 million, compared to $342.5 million for 2022. The primary contributors to the decrease in
noninterest revenue from 2022 to 2023 were increased security losses of $435.3 million as a result of our securities portfolio restructuring in 2023 and a decrease in mortgage banking revenue of $25.9 million driven by the rate environment. These
decreases were partially offset by a $16.0 million increase in other noninterest revenue across various smaller fee revenue sources. Excluding security gains and losses, noninterest revenue for 2023, was $319.3 million, a decrease of $23.6 million or
6.9% from $342.9 million compared to 2022. See “Noninterest Revenue” below for more information.
Noninterest expense in 2024 decreased 9.6% to $1.0 billion from $1.2 billion in 2023. The decrease in noninterest expense in 2024 compared to 2023
was primarily a result of decreases in salaries and employee benefits, other noninterest expense, deposit insurance assessments, pension settlement expense and merger expense, partially offset by increases in occupancy and equipment and data processing
and software. Deposit insurance assessments decreased $32.3 million, or 44.7%, in 2024 compared to 2023, primarily due to the FDIC special assessment recorded in 2023. In 2024, salaries and employee benefits decreased $25.4 million, or 4.0%, compared
to 2023 primarily due to an increase in deferred salaries from increased loan production in 2024 and certain contractual one-time compensation payments made in 2023. Decreases in other noninterest expense for 2024 compared to 2023 included decreases in
legal, operational losses and various other miscellaneous expenses. See “Noninterest Expense” below for more information.
Noninterest expense in 2023 increased 4.2% to $1.2 billion from $1.1 billion for 2022. The increase in noninterest expense in 2023 compared to
2022 was primarily a result of increases in deposit insurance assessments related to the FDIC special assessment and other noninterest expense, partially offset by decreases in merger expense. In 2023, salaries and employee benefits remained relatively
flat compared to 2022. See “Noninterest Expense” below for more information.
RESULTS OF OPERATIONS
The following is a summary of our results of operations for the periods indicated:
TABLE 3—SUMMARY OF RESULTS OF OPERATIONS
| |
|
Year Ended December 31, |
|
| (Dollars in thousands) |
|
2024 |
|
|
2023 |
|
|
2022 |
|
| Earnings Summary: |
|
|
|
|
|
|
|
|
|
|
|
|
| Interest revenue |
|
$ |
2,547,357 |
|
|
$ |
2,310,167 |
|
|
$ |
1,560,581 |
|
| Interest expense |
|
|
1,111,142 |
|
|
|
958,811 |
|
|
|
209,290 |
|
| Net interest revenue |
|
|
1,436,215 |
|
|
|
1,351,356 |
|
|
|
1,351,291 |
|
| Provision for credit losses |
|
|
71,000 |
|
|
|
80,000 |
|
|
|
7,000 |
|
| Net interest revenue, after provision for credit losses |
|
|
1,365,215 |
|
|
|
1,271,356 |
|
|
|
1,344,291 |
|
| Noninterest revenue |
|
|
356,510 |
|
|
|
(116,343 |
) |
|
|
342,485 |
|
| Noninterest expense |
|
|
1,045,528 |
|
|
|
1,155,923 |
|
|
|
1,109,754 |
|
| Income (Loss) from continuing operations, before income taxes |
|
|
676,197 |
|
|
|
(910 |
) |
|
|
577,022 |
|
| Income tax expense (benefit) |
|
|
152,593 |
|
|
|
(4,594 |
) |
|
|
129,705 |
|
| Income from continuing operations |
|
|
523,604 |
|
|
|
3,684 |
|
|
|
447,317 |
|
| Income from discontinued operations, before income taxes |
|
|
— |
|
|
|
727,591 |
|
|
|
22,353 |
|
| Income tax expense from discontinued operations |
|
|
— |
|
|
|
188,971 |
|
|
|
6,433 |
|
| Income from discontinued operations, net of income taxes |
|
|
— |
|
|
|
538,620 |
|
|
|
15,920 |
|
| Net income |
|
|
523,604 |
|
|
|
542,304 |
|
|
|
463,237 |
|
| Less: preferred dividends |
|
|
9,488 |
|
|
|
9,488 |
|
|
|
9,488 |
|
| Net income available to common shareholders |
|
$ |
514,116 |
|
|
$ |
532,816 |
|
|
$ |
453,749 |
|
Net Interest Revenue
Net interest revenue is the difference between interest revenue earned on assets, such as loans, leases and securities, and interest expense paid
on liabilities, such as deposits and borrowings, and continues to provide the Company with its principal source of revenue. Net interest revenue is affected by the general level of interest rates, changes in interest rates and changes in the amount and
composition of interest earning assets and interest bearing liabilities. One of the Company’s long-term objectives is to manage interest earning assets and interest bearing liabilities to maximize net interest revenue, while balancing interest rate,
credit and liquidity risk. Net interest margin is determined by dividing FTE net interest revenue by average earning assets. For purposes of the following discussion, revenue from tax-exempt loans and investment securities have been adjusted to an FTE
basis, using an effective tax rate of 21% for the years ended December 31, 2024, 2023, and 2022.
The following table presents average interest earning assets, average interest bearing liabilities, net interest revenue- FTE, net interest
margin-FTE and net interest rate spread for each of the periods presented:
TABLE 4—CONSOLIDATED AVERAGE BALANCES AND YIELD/RATE ANALYSIS
| |
|
2024 |
|
|
2023 |
|
|
2022 |
|
| |
|
Average |
|
|
|
|
|
Yield/ |
|
|
Average |
|
|
|
|
|
Yield/ |
|
|
Average |
|
|
|
|
|
Yield/ |
|
| (Dollars in thousands) |
|
Balance |
|
|
Interest |
|
|
Rate |
|
|
Balance |
|
|
Interest |
|
|
Rate |
|
|
Balance |
|
|
Interest |
|
|
Rate |
|
| ASSETS |
|
|
|
|
|
|
|
|
|
|
|
|
|
|
|
|
|
|
|
|
|
|
|
|
|
|
|
|
|
|
|
|
|
|
|
|
| Loans and leases (net of unearned income)(1)(2) |
|
$ |
33,107,659 |
|
|
$ |
2,166,565 |
|
|
|
6.54 |
% |
|
$ |
31,913,925 |
|
|
$ |
2,006,549 |
|
|
|
6.29 |
% |
|
$ |
28,418,658 |
|
|
$ |
1,344,195 |
|
|
|
4.73 |
% |
| Loans held for sale, at fair value |
|
|
111,156 |
|
|
|
6,161 |
|
|
|
5.54 |
|
|
|
85,961 |
|
|
|
4,450 |
|
|
|
5.18 |
|
|
|
122,079 |
|
|
|
7,554 |
|
|
|
6.19 |
|
| Available for sale securities, at fair value: |
|
|
|
|
|
|
|
|
|
|
|
|
|
|
|
|
|
|
|
|
|
|
|
|
|
|
|
|
|
|
|
|
|
|
|
|
| Taxable |
|
|
7,881,989 |
|
|
|
243,466 |
|
|
|
3.09 |
|
|
|
9,971,325 |
|
|
|
208,122 |
|
|
|
2.09 |
|
|
|
13,163,403 |
|
|
|
183,915 |
|
|
|
1.40 |
|
| Tax-exempt (3) |
|
|
80,880 |
|
|
|
3,289 |
|
|
|
4.07 |
|
|
|
351,010 |
|
|
|
11,653 |
|
|
|
3.32 |
|
|
|
432,969 |
|
|
|
12,758 |
|
|
|
2.95 |
|
| Other investments |
|
|
2,450,623 |
|
|
|
130,499 |
|
|
|
5.33 |
|
|
|
1,629,036 |
|
|
|
83,577 |
|
|
|
5.13 |
|
|
|
923,861 |
|
|
|
16,371 |
|
|
|
1.77 |
|
| Total interest earning assets and revenue |
|
|
43,632,307 |
|
|
|
2,549,980 |
|
|
|
5.84 |
% |
|
|
43,951,257 |
|
|
|
2,314,351 |
|
|
|
5.27 |
% |
|
|
43,060,970 |
|
|
|
1,564,793 |
|
|
|
3.63 |
% |
| Other assets |
|
|
4,812,184 |
|
|
|
|
|
|
|
|
|
|
|
5,204,505 |
|
|
|
|
|
|
|
|
|
|
|
4,911,883 |
|
|
|
|
|
|
|
|
|
| Allowance for credit losses |
|
|
471,212 |
|
|
|
|
|
|
|
|
|
|
|
451,809 |
|
|
|
|
|
|
|
|
|
|
|
439,696 |
|
|
|
|
|
|
|
|
|
| Total |
|
$ |
47,973,279 |
|
|
|
|
|
|
|
|
|
|
$ |
48,703,953 |
|
|
|
|
|
|
|
|
|
|
$ |
47,533,157 |
|
|
|
|
|
|
|
|
|
| |
|
|
|
|
|
|
|
|
|
|
|
|
|
|
|
|
|
|
|
|
|
|
|
|
|
|
|
|
|
|
|
|
|
|
|
|
| LIABILITIES AND SHAREHOLDERS’ EQUITY |
|
|
|
|
|
|
|
|
|
|
|
|
|
|
|
|
|
|
|
|
|
|
|
|
|
|
|
|
|
|
|
|
|
|
|
|
| Deposits: |
|
|
|
|
|
|
|
|
|
|
|
|
|
|
|
|
|
|
|
|
|
|
|
|
|
|
|
|
|
|
|
|
|
|
|
|
| Interest bearing demand and money market |
|
$ |
18,739,210 |
|
|
$ |
573,826 |
|
|
|
3.06 |
% |
|
$ |
18,314,649 |
|
|
$ |
472,723 |
|
|
|
2.58 |
% |
|
$ |
18,541,402 |
|
|
|
109,893 |
|
|
|
0.59 |
% |
| Savings |
|
|
2,626,539 |
|
|
|
14,922 |
|
|
|
0.57 |
|
|
|
3,028,875 |
|
|
|
14,955 |
|
|
|
0.49 |
|
|
|
3,657,718 |
|
|
|
5,519 |
|
|
|
0.15 |
|
| Time |
|
|
8,330,176 |
|
|
|
368,572 |
|
|
|
4.42 |
|
|
|
6,674,231 |
|
|
|
246,476 |
|
|
|
3.69 |
|
|
|
3,545,402 |
|
|
|
24,253 |
|
|
|
0.68 |
|
| Fed funds purchased, securities sold under agreement to repurchase and other |
|
|
86,171 |
|
|
|
4,131 |
|
|
|
4.79 |
|
|
|
800,170 |
|
|
|
32,590 |
|
|
|
4.07 |
|
|
|
923,973 |
|
|
|
13,432 |
|
|
|
1.45 |
|
| Short-term FHLB borrowings |
|
|
— |
|
|
|
— |
|
|
|
— |
|
|
|
1,389,759 |
|
|
|
68,235 |
|
|
|
4.91 |
|
|
|
1,325,381 |
|
|
|
36,863 |
|
|
|
2.78 |
|
| Short-term BTFP borrowings |
|
|
2,845,902 |
|
|
|
136,404 |
|
|
|
4.79 |
|
|
|
2,052,055 |
|
|
|
104,696 |
|
|
|
5.10 |
|
|
|
— |
|
|
|
— |
|
|
|
— |
|
| Subordinated and long-term borrowings |
|
|
306,396 |
|
|
|
13,287 |
|
|
|
4.34 |
|
|
|
452,645 |
|
|
|
19,136 |
|
|
|
4.23 |
|
|
|
465,004 |
|
|
|
19,330 |
|
|
|
4.16 |
|
| Total interest bearing liabilities and expense |
|
|
32,934,394 |
|
|
|
1,111,142 |
|
|
|
3.37 |
% |
|
|
32,712,384 |
|
|
|
958,811 |
|
|
|
2.93 |
% |
|
|
28,458,880 |
|
|
|
209,290 |
|
|
|
0.74 |
% |
| Demand deposits - noninterest bearing |
|
|
8,780,004 |
|
|
|
|
|
|
|
|
|
|
|
10,610,698 |
|
|
|
|
|
|
|
|
|
|
|
13,733,384 |
|
|
|
|
|
|
|
|
|
| Other liabilities |
|
|
905,176 |
|
|
|
|
|
|
|
|
|
|
|
893,438 |
|
|
|
|
|
|
|
|
|
|
|
766,490 |
|
|
|
|
|
|
|
|
|
| Total liabilities |
|
|
42,619,574 |
|
|
|
|
|
|
|
|
|
|
|
44,216,520 |
|
|
|
|
|
|
|
|
|
|
|
42,958,754 |
|
|
|
|
|
|
|
|
|
| Shareholders’ equity |
|
|
5,353,705 |
|
|
|
|
|
|
|
|
|
|
|
4,487,433 |
|
|
|
|
|
|
|
|
|
|
|
4,574,403 |
|
|
|
|
|
|
|
|
|
| Total |
|
$ |
47,973,279 |
|
|
|
|
|
|
|
|
|
|
$ |
48,703,953 |
|
|
|
|
|
|
|
|
|
|
$ |
47,533,157 |
|
|
|
|
|
|
|
|
|
| Net interest revenue-FTE |
|
|
|
|
|
$ |
1,438,838 |
|
|
|
|
|
|
|
|
|
|
$ |
1,355,540 |
|
|
|
|
|
|
|
|
|
|
$ |
1,355,503 |
|
|
|
|
|
| Net interest margin-FTE |
|
|
|
|
|
|
|
|
|
|
3.30 |
% |
|
|
|
|
|
|
|
|
|
|
3.08 |
% |
|
|
|
|
|
|
|
|
|
|
3.15 |
% |
| Net interest rate spread |
|
|
|
|
|
|
|
|
|
|
2.47 |
% |
|
|
|
|
|
|
|
|
|
|
2.33 |
% |
|
|
|
|
|
|
|
|
|
|
2.90 |
% |
| Interest bearing liabilities to interest earning assets |
|
|
|
|
|
|
|
|
|
|
75.48 |
% |
|
|
|
|
|
|
|
|
|
|
74.43 |
% |
|
|
|
|
|
|
|
|
|
|
66.09 |
% |
|
(1) |
Includes taxable equivalent adjustment to interest of $1.9 million, $1.7 million and $1.5 million in 2024, 2023 and 2022, respectively, using an effective tax rate of 21% for all periods presented. |
|
(2) |
Nonaccrual loans are included in loans and leases (net of unearned income). Nonaccrual loans were $264.7 million, $216.1 million and $98.7 million in 2024, 2023 and 2022, respectively. |
|
(3) |
Includes taxable equivalent adjustment to interest of $0.7 million, $2.4 million and $2.7 million in 2024, 2023 and 2022, respectively, using an effective tax rate of 21% for all periods presented. |
Net interest revenue-FTE increased 6.1% to $1.4 billion in 2024 compared to 2023. The increase in net interest revenue-FTE was primarily due to
increased interest rates on loans, investment securities and other investments and the shift in average balances of investment securities to loans, which resulted in an increase on yields earned on interest-earning assets.
This increase was offset by the increase in interest expense due to increased rates paid on average interest bearing deposits and a shift out of
noninterest bearing deposits into time deposits. Average loans increased from 72.6% of average interest earning assets in 2023 to 75.9% in 2024.
Net interest revenue-FTE was flat at $1.4 billion in each of 2023 and 2022. The increase in interest revenue-FTE during 2023 was due to the
increased interest rates which resulted in an increase on yields earned on interest-earning assets coupled with growth in average balances in the loan and lease portfolio. This increase was offset by the increased rates paid on average interest bearing
liabilities for deposits and short-term borrowings, which also increased due to the rise in market interest rates. Average loans increased from 66.0% of average interest-earning assets in 2022 to 72.6% in 2023.
Interest revenue-FTE increased 10.2% to $2.5 billion in 2024, from $2.3 billion in 2023. The increase in interest revenue-FTE for 2024 was
primarily a result of the increase in yields earned on loans due to the increase in market rates over the prior year, as well as the securities portfolio repositioning in late 2023 and improved earning asset mix from continued deployment of cash.
Additionally, interest revenue-FTE included $11.9 million and $25.9 million in accretion related to the purchase discounts on acquired loans in 2024 and 2023, respectively.
Interest revenue-FTE increased 47.9% to $2.3 billion in 2023 from $1.6 billion in 2022. The increase in interest revenue-FTE for 2023 compared to
2022 was primarily a result of the increase in yields earned on interest-earning assets over the prior year due to the impact of rising interest rates on loan portfolio repricing activity and new loan production, as well as a mix shift as the Company
deployed cash flow from lower yielding securities into higher yielding loans and available for sale securities. Additionally, interest revenue-FTE included $25.9 million and $46.8 million in accretion related to the purchase discounts on acquired loans
in 2023 and 2022, respectively.
Interest expense increased 15.9% to $1.1 billion in 2024, compared to $958.8 million in 2023. The increase in interest expense for 2024 was
primarily a result of the overall rates paid on average interest-bearing deposits increasing 60 basis points for 2024, compared to 2023, which was in response to increased interest rates, combined with customer migration from noninterest bearing
deposits into time deposits.
Interest expense increased 358.1% to $958.8 million in 2023 from $209.3 million in 2022. The increase in interest expense for 2023 compared to
2022 was primarily a result of the overall rates paid on average interest-bearing liabilities increasing 219 basis points for 2023, compared to 2022 in response to rising interest rates and deposit competition combined with a mix shift out of
noninterest bearing deposits into time deposits.
Net interest margin-FTE for 2024 was 3.30%, an increase of 22 basis points, from 3.08% for 2023, which represented a decrease of 7 basis points
from 3.15% in 2022. Net interest revenue-FTE may also be analyzed by segregating the yield/rate and volume components of interest revenue and interest expense. The table below presents the components of our net interest revenue-FTE with the effect that
the varying levels of interest-earning assets and interest-bearing liabilities and the applicable rates have had on changes in net interest revenue from 2023 to 2024 and from 2022 to 2023. The changes in net interest revenue-FTE due to both rate and
volume have been allocated to volume and rate changes in proportion to the relationship of the absolute dollar amounts of the changes in each.
TABLE 5—RATE/VOLUME ANALYSIS
| |
|
2024 vs 2023 |
|
| |
|
Net Interest Revenue |
|
|
Increase |
|
|
|
|
|
|
|
| (In thousands) |
|
2024 |
|
|
2023 |
|
|
(Decrease) |
|
|
Volume |
|
|
Rate |
|
| INTEREST REVENUE |
|
|
|
|
|
|
|
|
|
|
|
|
|
|
|
|
|
|
|
|
| Loans and leases, net of unearned income |
|
$ |
2,166,565 |
|
|
$ |
2,006,549 |
|
|
$ |
160,016 |
|
|
$ |
76,519 |
|
|
$ |
83,497 |
|
| Loans held for sale |
|
|
6,161 |
|
|
|
4,450 |
|
|
|
1,711 |
|
|
|
1,379 |
|
|
$ |
332 |
|
| Available for sale securities: |
|
|
|
|
|
|
|
|
|
|
|
|
|
|
|
|
|
|
|
|
| Taxable |
|
|
243,466 |
|
|
|
208,122 |
|
|
|
35,344 |
|
|
|
(49,969 |
) |
|
|
85,313 |
|
| Non-taxable |
|
|
3,289 |
|
|
|
11,653 |
|
|
|
(8,364 |
) |
|
|
(10,529 |
) |
|
|
2,165 |
|
| Other |
|
|
130,499 |
|
|
|
83,577 |
|
|
|
46,922 |
|
|
|
43,639 |
|
|
|
3,283 |
|
| Total interest revenue-FTE |
|
|
2,549,980 |
|
|
|
2,314,351 |
|
|
|
235,629 |
|
|
|
61,039 |
|
|
|
174,590 |
|
| |
|
|
|
|
|
|
|
|
|
|
|
|
|
|
|
|
|
|
|
|
| INTEREST EXPENSE |
|
|
|
|
|
|
|
|
|
|
|
|
|
|
|
|
|
|
|
|
| Demand deposits - interest bearing |
|
|
573,826 |
|
|
|
472,723 |
|
|
|
101,103 |
|
|
|
11,184 |
|
|
|
89,919 |
|
| Savings deposits |
|
|
14,922 |
|
|
|
14,955 |
|
|
|
(33 |
) |
|
|
(2,127 |
) |
|
|
2,094 |
|
| Time deposits |
|
|
368,572 |
|
|
|
246,476 |
|
|
|
122,096 |
|
|
|
67,889 |
|
|
|
54,207 |
|
| Fed funds purchased, securities sold under agreement to repurchase and other |
|
|
4,131 |
|
|
|
32,590 |
|
|
|
(28,459 |
) |
|
|
(33,376 |
) |
|
|
4,917 |
|
| Short-term FHLB borrowings |
|
|
— |
|
|
|
68,235 |
|
|
|
(68,235 |
) |
|
|
(34,117 |
) |
|
|
(34,118 |
) |
| Short-term BTFP borrowings |
|
|
136,404 |
|
|
|
104,696 |
|
|
|
31,708 |
|
|
|
38,381 |
|
|
|
(6,673 |
) |
| Subordinated and long-term debt |
|
|
13,287 |
|
|
|
19,136 |
|
|
|
(5,849 |
) |
|
|
(6,330 |
) |
|
|
481 |
|
| Total interest expense |
|
|
1,111,142 |
|
|
|
958,811 |
|
|
|
152,331 |
|
|
|
41,504 |
|
|
|
110,827 |
|
| Net interest revenue-FTE |
|
$ |
1,438,838 |
|
|
$ |
1,355,540 |
|
|
$ |
83,298 |
|
|
$ |
19,535 |
|
|
$ |
63,763 |
|
| |
|
2023 vs 2022 |
|
| |
|
Net Interest Revenue |
|
|
Increase |
|
|
|
|
|
|
|
| (In thousands) |
|
2023 |
|
|
2022 |
|
|
(Decrease) |
|
|
Volume |
|
|
Rate |
|
| INTEREST REVENUE |
|
|
|
|
|
|
|
|
|
|
|
|
|
|
|
|
|
|
|
|
| Loans and leases, net of unearned income |
|
$ |
2,006,549 |
|
|
$ |
1,344,195 |
|
|
$ |
662,354 |
|
|
$ |
180,129 |
|
|
$ |
482,225 |
|
| Loans held for sale |
|
|
4,450 |
|
|
|
7,554 |
|
|
|
(3,104 |
) |
|
|
(2,000 |
) |
|
$ |
(1,104 |
) |
| Available for sale securities: |
|
|
|
|
|
|
|
|
|
|
|
|
|
|
|
|
|
|
|
|
| Taxable |
|
|
208,122 |
|
|
|
183,915 |
|
|
|
24,207 |
|
|
|
(51,852 |
) |
|
|
76,059 |
|
| Non-taxable |
|
|
11,653 |
|
|
|
12,758 |
|
|
|
(1,105 |
) |
|
|
(2,598 |
) |
|
|
1,493 |
|
| Other |
|
|
83,577 |
|
|
|
16,371 |
|
|
|
67,206 |
|
|
|
19,295 |
|
|
|
47,911 |
|
| Total interest revenue-FTE |
|
|
2,314,351 |
|
|
|
1,564,793 |
|
|
|
749,558 |
|
|
|
142,974 |
|
|
|
606,584 |
|
| |
|
|
|
|
|
|
|
|
|
|
|
|
|
|
|
|
|
|
|
|
| INTEREST EXPENSE |
|
|
|
|
|
|
|
|
|
|
|
|
|
|
|
|
|
|
|
|
| Demand deposits - interest bearing |
|
|
472,723 |
|
|
|
109,893 |
|
|
|
362,830 |
|
|
|
(1,360 |
) |
|
|
364,190 |
|
| Savings deposits |
|
|
14,955 |
|
|
|
5,519 |
|
|
|
9,436 |
|
|
|
(1,100 |
) |
|
|
10,536 |
|
| Time deposits |
|
|
246,476 |
|
|
|
24,253 |
|
|
|
222,223 |
|
|
|
37,135 |
|
|
|
185,088 |
|
| Fed funds purchased, securities sold under agreement to repurchase and other |
|
|
32,590 |
|
|
|
13,432 |
|
|
|
19,158 |
|
|
|
(2,024 |
) |
|
|
21,182 |
|
| Short-term FHLB borrowings |
|
|
68,235 |
|
|
|
36,863 |
|
|
|
31,372 |
|
|
|
1,872 |
|
|
|
29,500 |
|
| Short-term BTFP borrowings |
|
|
104,696 |
|
|
|
— |
|
|
|
104,696 |
|
|
|
104,696 |
|
|
|
— |
|
| Subordinated and long-term debt |
|
|
19,136 |
|
|
|
19,330 |
|
|
|
(194 |
) |
|
|
(519 |
) |
|
|
325 |
|
| Total interest expense |
|
|
958,811 |
|
|
|
209,290 |
|
|
|
749,521 |
|
|
|
138,700 |
|
|
|
610,821 |
|
| Net interest revenue-FTE |
|
$ |
1,355,540 |
|
|
$ |
1,355,503 |
|
|
$ |
37 |
|
|
$ |
4,274 |
|
|
$ |
(4,237 |
) |
Provision for Credit Losses and Allowance for Credit Losses (“ACL”)
An analysis of the ACL for loans for the periods indicated is provided in the following table:
TABLE 6—ACL
| |
|
Year Ended December 31, |
|
| (In thousands) |
|
2024 |
|
|
2023 |
|
|
2022 |
|
| Balance, beginning of period |
|
$ |
468,034 |
|
|
$ |
440,347 |
|
|
$ |
446,415 |
|
| Charge-offs: |
|
|
|
|
|
|
|
|
|
|
|
|
| Commercial and industrial |
|
|
|
|
|
|
|
|
|
|
|
|
| Non-real estate |
|
|
(76,694 |
) |
|
|
(72,401 |
) |
|
|
(17,874 |
) |
| Owner occupied |
|
|
(379 |
) |
|
|
(394 |
) |
|
|
(824 |
) |
| Total commercial and industrial |
|
|
(77,073 |
) |
|
|
(72,795 |
) |
|
|
(18,698 |
) |
| Commercial real estate |
|
|
|
|
|
|
|
|
|
|
|
|
| Construction, acquisition and development |
|
|
(779 |
) |
|
|
(808 |
) |
|
|
(298 |
) |
| Income producing |
|
|
(2,503 |
) |
|
|
(4,527 |
) |
|
|
(1,832 |
) |
| Total commercial real estate |
|
|
(3,282 |
) |
|
|
(5,335 |
) |
|
|
(2,130 |
) |
| Consumer |
|
|
|
|
|
|
|
|
|
|
|
|
| Residential mortgages |
|
|
(3,161 |
) |
|
|
(2,264 |
) |
|
|
(1,430 |
) |
| Other consumer |
|
|
(6,888 |
) |
|
|
(6,678 |
) |
|
|
(7,606 |
) |
| Total consumer |
|
|
(10,049 |
) |
|
|
(8,942 |
) |
|
|
(9,036 |
) |
| Total charge-offs |
|
|
(90,404 |
) |
|
|
(87,072 |
) |
|
|
(29,864 |
) |
| Recoveries: |
|
|
|
|
|
|
|
|
|
|
|
|
| Commercial and industrial |
|
|
|
|
|
|
|
|
|
|
|
|
| Non-real estate |
|
|
8,004 |
|
|
|
7,541 |
|
|
|
14,165 |
|
| Owner occupied |
|
|
511 |
|
|
|
1,582 |
|
|
|
2,292 |
|
| Total commercial and industrial |
|
|
8,515 |
|
|
|
9,123 |
|
|
|
16,457 |
|
| Commercial real estate |
|
|
|
|
|
|
|
|
|
|
|
|
| Construction, acquisition and development |
|
|
418 |
|
|
|
622 |
|
|
|
4,352 |
|
| Income producing |
|
|
447 |
|
|
|
1,071 |
|
|
|
3,521 |
|
| Total commercial real estate |
|
|
865 |
|
|
|
1,693 |
|
|
|
7,873 |
|
| Consumer |
|
|
|
|
|
|
|
|
|
|
|
|
| Residential mortgages |
|
|
1,234 |
|
|
|
2,000 |
|
|
|
3,017 |
|
| Other consumer |
|
|
1,549 |
|
|
|
1,688 |
|
|
|
2,566 |
|
| Total consumer |
|
|
2,783 |
|
|
|
3,688 |
|
|
|
5,583 |
|
| Total recoveries |
|
|
12,163 |
|
|
|
14,504 |
|
|
|
29,913 |
|
| Net (charge-offs) recoveries |
|
|
(78,241 |
) |
|
|
(72,568 |
) |
|
|
49 |
|
| Initial allowance on PCD loans |
|
|
— |
|
|
|
— |
|
|
|
(8,117 |
) |
| Adoption of new ASU related to modified loans (1) |
|
|
— |
|
|
|
255 |
|
|
|
— |
|
| Provision: |
|
|
|
|
|
|
|
|
|
|
|
|
| Provision for credit losses related to loans and leases (2) |
|
|
71,000 |
|
|
|
100,000 |
|
|
|
2,000 |
|
| Balance, end of period |
|
$ |
460,793 |
|
|
$ |
468,034 |
|
|
$ |
440,347 |
|
| |
|
|
|
|
|
|
|
|
|
|
|
|
| Loans and leases, net of unearned income - average |
|
$ |
33,107,659 |
|
|
$ |
31,913,925 |
|
|
$ |
28,418,658 |
|
| Loans and leases, net of unearned income - period end |
|
$ |
33,741,755 |
|
|
$ |
32,497,022 |
|
|
$ |
30,349,277 |
|
|
(1) |
Cadence adopted the new accounting guidance effective January 1, 2023, which eliminates the TDR recognition and measurement guidance via the modified retrospective transition method (ASU 2022-02). |
|
(2) |
Provision (reversal) for unfunded commitments was zero, $(20.0) million and $5.0 million in 2024, 2023 and 2022, respectively. |
TABLE 7—ACL RELATED RATIOS
| |
|
Year Ended December 31, |
|
| |
|
2024 |
|
|
2023 |
|
|
2022 |
|
| RATIOS |
|
|
|
|
|
|
|
|
|
| Provision for credit losses to average loans and leases, net of unearned income |
|
|
0.21 |
% |
|
|
0.25 |
% |
|
|
0.02 |
% |
| ACL to loans and leases, net of unearned income |
|
|
1.37 |
|
|
|
1.44 |
|
|
|
1.45 |
|
| Nonperforming loans to loans and leases, net of unearned income |
|
|
0.78 |
|
|
|
0.67 |
|
|
|
0.35 |
|
| ACL to nonperforming loans |
|
|
174.09 |
|
|
|
216.54 |
|
|
|
410.22 |
|
| |
|
|
|
|
|
|
|
|
|
|
|
|
| Net charge-offs (recoveries) to average loans and leases: |
|
|
|
|
|
|
|
|
|
|
|
|
| Commercial and industrial |
|
|
|
|
|
|
|
|
|
|
|
|
| Non-real estate |
|
|
0.21 |
% |
|
|
0.20 |
% |
|
|
0.01 |
% |
| Total commercial and industrial |
|
|
0.21 |
|
|
|
0.20 |
|
|
|
0.01 |
|
| Commercial real estate |
|
|
|
|
|
|
|
|
|
|
|
|
| Construction, acquisition and development |
|
|
— |
|
|
|
— |
|
|
|
(0.01 |
) |
| Income producing |
|
|
0.01 |
|
|
|
0.01 |
|
|
|
(0.01 |
) |
| Total commercial real estate |
|
|
0.01 |
|
|
|
0.01 |
|
|
|
(0.02 |
) |
| Consumer |
|
|
|
|
|
|
|
|
|
|
|
|
| Residential mortgages |
|
|
— |
|
|
|
— |
|
|
|
(0.01 |
) |
| Other consumer |
|
|
0.02 |
|
|
|
0.02 |
|
|
|
0.02 |
|
| Total consumer |
|
|
0.02 |
|
|
|
0.02 |
|
|
|
0.01 |
|
| Total |
|
|
0.24 |
% |
|
|
0.23 |
% |
|
|
— |
% |
For the years ended December 31, 2024, 2023, and 2022, net charge-offs totaled $78.2 million, compared to net charge-offs of $72.6 million and net
recoveries of $49 thousand, respectively. As a percentage of average loans and leases, net charge-offs totaled 0.24% in 2024 compared to 0.23% in 2023. For 2022, net recoveries as a percentage of average loans and leases were insignificant. Net
charge-offs in 2024 were primarily in the commercial and industrial non-real estate loan segment and centered in Corporate Banking due to a few larger credits. Net charge-offs in 2023 were also primarily in the commercial and industrial non-real estate
loan segment. In 2022, net recoveries were primarily in the commercial real estate segment and residential mortgages class offset somewhat by net charge-offs in the other consumer class.
The Company recorded $71.0 million in provision for credit losses ($71.0 million for loans and zero for unfunded commitments) during 2024,
compared to $80.0 million ($100.0 million for loans and $(20.0) million for unfunded commitments) for 2023 and $7.0 million ($2.0 million for loans and $5.0 million for unfunded commitments) during 2022.
The 2024 provision for credit losses is primarily attributable to loan portfolio growth combined with the resolution of a small number of larger
problem credits heavily weighted to the Corporate Banking segment of the bank. The 2023 provision for credit losses is primarily attributable to increases in the ACL allocated to the commercial and industrial segment due to higher specific reserves
combined with credit migration within the commercial and industrial and consumer segments. The $7.0 million of provision for credit losses recorded during 2022 was related to the provision for unfunded commitments of $5.0 million and $2.0 million for
provision related to loans and leases.
The ACL decreased $7.2 million to $460.8 million at December 31, 2024, from $468.0 million at December 31, 2023. This decrease was primarily seen
in the commercial and industrial loan segment due to resolutions on some larger problem credits occurring during the year. The ACL to nonperforming loans decreased to 174.09% at December 31, 2024, from 216.54% at December 31, 2023. For more information
about the Company’s classified, nonperforming, purchased credit deteriorated, and impaired loans, see “Item 7. Management’s Discussion and Analysis of Financial Condition and Results of Operations - Financial Condition - Loans and Leases” in Part II of
this Report.
The breakdown of the ACL by loan and lease segment and class is based, in part, on evaluations of specific loan and lease histories and the impact
of forecasted economic conditions on the portfolio segments. Accordingly, because these conditions are subject to change, the allocation is not necessarily indicative of the breakdown of any future allowance for credit losses. Several economic
forecasts from external sources are used in the estimation and allocation of the ACL. The forecasts cover an eight-quarter forecast horizon to establish a forecast range and are based on upside, downside, and base case scenarios. A blended scenario is
selected by management to reflect the probable economic conditions within the range. As of December 31, 2024, the forecast was weighted more heavily to a base forecast compared to a more balanced forecast weighting between the base and downside
scenarios as of December 31, 2023. This was a result of management’s view of the risk of heightened inflation and a recession easing over time.
The Company recognizes that higher interest rates, inflation, and slower economic growth may have short-term, long-term, and regional impacts to
the economy. In addition, qualitative factors such as changes in economic conditions, concentrations of risk, and changes in portfolio risk resulting from regulatory changes are considered in determining the adequacy of the level of the ACL (see Notes
1 and 5 to the consolidated financial statements).
TABLE 8—ACL BY SEGMENT AND CLASS
| |
|
December 31, 2024 |
|
|
December 31, 2023 |
|
| |
|
|
|
|
% of Loans in |
|
|
|
|
|
% of Loans in |
|
| |
|
|
|
|
Each Category |
|
|
|
|
|
Each Category |
|
| (Dollars in thousands) |
|
ACL |
|
|
to Total Loans |
|
|
ACL |
|
|
to Total Loans |
|
| Commercial and industrial |
|
|
|
|
|
|
|
|
|
|
|
|
|
|
|
|
| Non-real estate |
|
$ |
183,743 |
|
|
|
25.7 |
% |
|
$ |
194,577 |
|
|
|
27.5 |
% |
| Owner occupied |
|
|
35,177 |
|
|
|
13.8 |
|
|
|
31,445 |
|
|
|
13.4 |
|
| Total commercial and industrial |
|
|
218,920 |
|
|
|
39.5 |
|
|
|
226,022 |
|
|
|
40.9 |
|
| Commercial real estate |
|
|
|
|
|
|
|
|
|
|
|
|
|
|
|
|
| Construction, acquisition and development |
|
|
44,703 |
|
|
|
11.6 |
|
|
|
42,118 |
|
|
|
12.0 |
|
| Income producing |
|
|
64,957 |
|
|
|
17.8 |
|
|
|
69,209 |
|
|
|
17.7 |
|
| Total commercial real estate |
|
|
109,660 |
|
|
|
29.4 |
|
|
|
111,327 |
|
|
|
29.7 |
|
| Consumer |
|
|
|
|
|
|
|
|
|
|
|
|
|
|
|
|
| Residential mortgages |
|
|
125,464 |
|
|
|
30.4 |
|
|
|
124,851 |
|
|
|
28.7 |
|
| Other consumer |
|
|
6,749 |
|
|
|
0.7 |
|
|
|
5,834 |
|
|
|
0.7 |
|
| Total consumer |
|
|
132,213 |
|
|
|
31.1 |
|
|
|
130,685 |
|
|
|
29.4 |
|
| Total |
|
$ |
460,793 |
|
|
|
100.0 |
% |
|
$ |
468,034 |
|
|
|
100.0 |
% |
Noninterest Revenue
The components of noninterest revenue from continuing operations for the years ended December 31, 2024, 2023, and 2022, and the percentage change
between the periods are shown in the following table:
TABLE 9—NONINTEREST REVENUE
| |
|
2024 |
|
|
2023 |
|
|
2022 |
|
| (Dollars in thousands) |
|
Amount |
|
|
% Change |
|
|
Amount |
|
|
% Change |
|
|
Amount |
|
| Trust and asset management income (1) |
|
$ |
48,507 |
|
|
|
14.1 |
% |
|
$ |
42,513 |
|
|
|
11.3 |
% |
|
$ |
38,198 |
|
| Investment advisory fees (1) |
|
|
33,660 |
|
|
|
7.2 |
|
|
|
31,403 |
|
|
|
9.9 |
|
|
|
28,580 |
|
| Brokerage and annuity fees(1) |
|
|
12,755 |
|
|
|
(2.0 |
) |
|
|
13,012 |
|
|
|
(5.1 |
) |
|
|
13,708 |
|
| Deposit service charges |
|
|
73,497 |
|
|
|
19.1 |
|
|
|
61,718 |
|
|
|
(16.0 |
) |
|
|
73,478 |
|
| Credit card, debit card and merchant fees |
|
|
50,245 |
|
|
|
0.9 |
|
|
|
49,784 |
|
|
|
(14.4 |
) |
|
|
58,160 |
|
| Mortgage banking, excluding MSR and MSR hedge market value adjustment |
|
|
33,455 |
|
|
|
(0.9 |
) |
|
|
33,763 |
|
|
|
(7.3 |
) |
|
|
36,434 |
|
| MSR and MSR hedge market value adjustment |
|
|
(16,152 |
) |
|
|
(9.2 |
) |
|
|
(14,785 |
) |
|
|
(275.5 |
) |
|
|
8,426 |
|
| Securities losses, net |
|
|
(2,962 |
) |
|
|
99.3 |
|
|
|
(435,652 |
) |
|
|
NM |
|
|
|
(384 |
) |
| Bank-owned life insurance |
|
|
17,716 |
|
|
|
8.7 |
|
|
|
16,294 |
|
|
|
4.5 |
|
|
|
15,594 |
|
| Credit related fees |
|
|
27,352 |
|
|
|
1.9 |
|
|
|
26,830 |
|
|
|
0.2 |
|
|
|
26,768 |
|
| SBA income |
|
|
12,083 |
|
|
|
22.8 |
|
|
|
9,839 |
|
|
|
(35.9 |
) |
|
|
15,341 |
|
| Other miscellaneous income |
|
|
66,354 |
|
|
|
35.6 |
|
|
|
48,938 |
|
|
|
73.6 |
|
|
|
28,182 |
|
| Total noninterest revenue |
|
$ |
356,510 |
|
|
|
406.4 |
% |
|
$ |
(116,343 |
) |
|
|
(134.0 |
)% |
|
$ |
342,485 |
|
|
(1) |
Included in wealth management revenue on the consolidated statements of income.
|
| |
NM - not meaningful. |
Noninterest revenue for the year ended December 31, 2024 was $356.5 million, an increase of $472.9 million, or 406.4%, from 2023. Trust and asset
management income increased $6.0 million for 2024 compared to 2023. The increase was primarily associated with increased fees and new business. Deposit service charges increased $11.8 million for 2024 compared to 2023. The increase was primarily
attributable to increases in account analysis charges and in NSF and overdraft charges. Net securities losses decreased $432.7 million for 2024 compared to 2023. The decrease was primarily driven by securities portfolio restructurings that were
executed as a part of a balance sheet optimization initiatives during the 2023, including the sale in early 2023 of $1.5 billion in U.S. Treasury available for sale securities generating a realized loss of $51.3 million, and the fourth quarter of 2023
sale of available for sale securities totaling approximately $3.1 billion in par value for a realized loss of approximately $384.5 million. There were $2.9 million in security losses recognized during 2024. Other miscellaneous income includes payroll
processing revenue, foreign exchange revenue, wire transfer fees, and other miscellaneous items. Other miscellaneous income increased $17.4 million for 2024 compared to 2023. The increase includes the $12.0 million net gain recognized from the sale of
business, $4.7 million net gain on the extinguishment of debt, and a decrease in tax credit investment amortization, offset by a decrease in dividend income during 2024.
Noninterest revenue for the year ended December 31, 2023 was, negative $116.3 million, a decrease of $458.8 million, or 134.0%, from 2022. Credit
card, debit card and merchant fees decreased $8.4 million for 2023 compared to 2022. The decrease in 2023 is primarily driven by a decrease in vendor incentive revenue and a decrease in card interchange fees due to lower volume. Deposit service charge
revenue decreased $11.8 million for 2023 compared to 2022. The decline is primarily attributable to an $8 million adjustment to deposit service charges, resulting from changes in deposit service charges. Net securities losses increased $435.3 million
for 2023 compared to 2022. The increase in 2023 was primarily driven by the securities portfolio restructurings that were executed as a part of a balance sheet optimization initiative. During the first quarter of 2023, approximately $1.5 billion in
U.S. Treasury available for sale securities were sold generating a realized loss of approximately $51.3 million. Additionally, in the fourth quarter of 2023, available for sale securities totaling approximately $3.1 billion in par value were sold for a
realized loss of approximately $384.5 million. Proceeds from the sales were redeployed in accretive activities including reinvestment in higher-yielding securities, funding loans, and reducing higher cost brokered deposits. Credit related fees
increased $0.1 million for 2023 compared to 2022. The increase was primarily driven by volume increases in agency fees, unused line of credit fees and letter of credit fees. Other miscellaneous income increased $20.8 million for 2023 compared to 2022.
The increase was primarily driven by increases in dividend income from FHLB stock, earnings from limited partnerships, and advisory fees.
The Company’s revenue from mortgage banking typically fluctuates as mortgage interest rates change and is primarily attributable to two activities
- the origination and sale of new mortgage loans and the servicing of sold mortgage loans. Origination revenue is comprised of gains or losses from the sale of mortgage loans held for sale, origination fees, underwriting fees and other fees associated
with the origination of mortgage loans. For the years ended December 31, 2024 and 2023, mortgage loan held for sale origination volumes totaled $1.1 billion and $837.1 million, respectively, which produced origination revenue of $9.6 million and $9.9
million, respectively. The decrease in mortgage origination revenue was the result of lower margins on the mortgage loans held for sale that were sold during 2024 compared to 2023. During 2023, there was a production shift resulting in more mortgage
loans held for investment rather than those held for sale. During 2024, the focus was shifted to a more even split between the two, which largely contributed to the higher volume of mortgage loans held for sale originated and sold during 2024.
For the years ended December 31, 2023, and 2022, mortgage loan held for sale origination volumes totaled $837.1 million and $1.1 billion,
respectively, which produced origination revenue of $9.9 million and $12.9 million, respectively. The timing of increases in market interest rates caused decreases to the margins of loans sold and the volume of mortgage loans originated and sold for
the year ended December 31, 2023 compared to 2022. Interest rates during 2023 were higher than 2022 due to the increase in the federal funds target rate set by the Federal Reserve during the last part of 2022 and throughout 2023, which largely
contributed to the lower volumes of mortgages originated and sold.
Revenue from the mortgage servicing process includes fees from the actual servicing of mortgage loans. For the years ended December 31, 2024,
2023, and 2022, revenue from the servicing of mortgage loans were $23.8 million, $23.9 million, and $23.6 million respectively.
The Company services a class of residential mortgages that are first lien loans secured by a primary residence or second home. The MSR, which are
recognized as a separate asset on the date the corresponding mortgage loan is sold on a servicing retained basis, is recorded at fair value as determined at each accounting period end. At December 31, 2024 and December 31, 2023 the estimated fair value
of the MSR was $114.6 million and $106.8 million, respectively.
The Company is susceptible to significant fluctuations in MSR fair value during changing interest rate environments. The Company has an economic
hedge in place on its MSR and uses various instruments (including but not limited to Treasury options, SOFR and TBA futures and forwards) to mitigate the interest rate risk associated with the MSR. These hedging instruments are reported at fair value,
with adjustments included as part of mortgage banking revenue in the consolidated statements of income. At December 31, 2024, 2023, and 2022, this economic hedge covered approximately 75.1%, 73.1%, and 47.9%, respectively, of the MSR value. Reflecting
this sensitivity to interest rates, the fair value of the MSR, including the hedge, experienced a decrease of $16.2 million during 2024, a decrease of $14.8 million during 2023, and an increase of $8.4 million during 2022.
The following table presents the Company’s mortgage banking operations for the periods indicated:
TABLE 10— MORTGAGE BANKING OPERATIONS
| |
|
2024 |
|
|
2023 |
|
|
2022 |
|
| (Dollars in thousands) |
|
Amount |
|
|
% Change |
|
|
Amount |
|
|
% Change |
|
|
Amount |
|
| Production revenue: |
|
|
|
|
|
|
|
|
|
|
|
|
|
|
|
|
|
|
|
|
| Origination |
|
$ |
9,617 |
|
|
|
(3.0 |
)% |
|
$ |
9,910 |
|
|
|
(23.0 |
)% |
|
$ |
12,869 |
|
| Servicing |
|
|
23,838 |
|
|
|
(0.1 |
) |
|
|
23,853 |
|
|
|
1.2 |
|
|
|
23,565 |
|
| Total origination and servicing revenue |
|
|
33,455 |
|
|
|
(0.9 |
) |
|
|
33,763 |
|
|
|
(7.3 |
) |
|
|
36,434 |
|
| MSR and hedge market value adjustment |
|
|
(16,152 |
) |
|
|
(9.2 |
) |
|
|
(14,785 |
) |
|
|
(275.5 |
) |
|
|
8,426 |
|
| Total mortgage banking revenue |
|
$ |
17,303 |
|
|
|
(8.8 |
)% |
|
$ |
18,978 |
|
|
|
(57.7 |
)% |
|
$ |
44,860 |
|
| |
|
|
|
|
|
|
|
|
|
|
|
|
|
|
|
|
|
|
|
|
| Origination of mortgage loans held for sale |
|
$ |
1,140 |
|
|
|
36.2 |
% |
|
$ |
837 |
|
|
|
(23.8 |
)% |
|
$ |
1,098 |
|
| Mortgage loans serviced at quarter-end |
|
$ |
8,043 |
|
|
|
4.4 |
% |
|
$ |
7,703 |
|
|
|
0.1 |
% |
|
$ |
7,693 |
|
Noninterest Expense
The components of noninterest expense from continuing operations for the years ended December 31, 2024, 2023, and 2022, and the percentage change
between periods is shown in the following table:
TABLE 11—NONINTEREST EXPENSE
| |
|
2024 |
|
|
2023 |
|
|
2022 |
|
| (Dollars in thousands) |
|
Amount |
|
|
% Change |
|
|
Amount |
|
|
% Change |
|
|
Amount |
|
| Salaries and employee benefits |
|
$ |
609,307 |
|
|
|
(4.0 |
)% |
|
$ |
634,722 |
|
|
|
—% |
|
|
$ |
634,843 |
|
| Occupancy and equipment |
|
|
114,175 |
|
|
|
2.9 |
|
|
|
110,972 |
|
|
|
(3.0 |
) |
|
|
114,460 |
|
| Data processing and software |
|
|
121,884 |
|
|
|
1.2 |
|
|
|
120,443 |
|
|
|
8.4 |
|
|
|
111,107 |
|
| Merger expense |
|
|
— |
|
|
|
(100.0 |
) |
|
|
5,192 |
|
|
|
(89.8 |
) |
|
|
50,845 |
|
| Deposit insurance assessments |
|
|
39,922 |
|
|
|
(44.7 |
) |
|
|
72,224 |
|
|
|
286.0 |
|
|
|
18,712 |
|
| Pension settlement expense |
|
|
— |
|
|
|
(100.0 |
) |
|
|
11,826 |
|
|
|
31.1 |
|
|
|
9,023 |
|
| Advertising and public relations |
|
|
22,112 |
|
|
|
(21.5 |
) |
|
|
28,162 |
|
|
|
(31.4 |
) |
|
|
41,055 |
|
| Foreclosed property expense |
|
|
1,891 |
|
|
|
(24.0 |
) |
|
|
2,488 |
|
|
|
199.0 |
|
|
|
832 |
|
| Telecommunications |
|
|
5,857 |
|
|
|
1.4 |
|
|
|
5,775 |
|
|
|
(12.7 |
) |
|
|
6,617 |
|
| Travel and entertainment |
|
|
10,015 |
|
|
|
(9.0 |
) |
|
|
11,004 |
|
|
|
(3.5 |
) |
|
|
11,407 |
|
| Amortization of intangibles |
|
|
15,902 |
|
|
|
(18.0 |
) |
|
|
19,388 |
|
|
|
5.2 |
|
|
|
18,432 |
|
| Professional, consulting and outsourcing |
|
|
16,124 |
|
|
|
(18.9 |
) |
|
|
19,892 |
|
|
|
48.2 |
|
|
|
13,424 |
|
| Legal |
|
|
12,279 |
|
|
|
(38.9 |
) |
|
|
20,093 |
|
|
|
275.6 |
|
|
|
5,350 |
|
| Postage and shipping |
|
|
7,128 |
|
|
|
(15.6 |
) |
|
|
8,443 |
|
|
|
7.3 |
|
|
|
7,868 |
|
| Other miscellaneous expense |
|
|
68,932 |
|
|
|
(19.2 |
) |
|
|
85,299 |
|
|
|
29.7 |
|
|
|
65,779 |
|
| Total noninterest expense |
|
$ |
1,045,528 |
|
|
|
(9.6 |
)% |
|
$ |
1,155,923 |
|
|
|
4.2 |
% |
|
$ |
1,109,754 |
|
Noninterest expense for the year ended December 31, 2024 was $1.0 billion, a decrease of $110.4 million, or (9.6)%, from 2023. Occupancy and
equipment increased $3.2 million for 2024 compared to 2023, primarily due to increases in building maintenance and security related expenses. Data processing and software expense increased $1.4 million for 2024 compared to 2023, largely driven by
increases in external data processing volume and mobile and online banking costs, offset by a decrease in software maintenance costs. There were no merger expenses for 2024, compared to $5.2 million for 2023. Merger expenses in 2023 primarily included
compensation related expenses. Deposit insurance assessments decreased $32.3 million for 2024 compared to 2023, primarily due to the FDIC special assessment recorded in 2023. Professional, consulting and outsourcing expenses decreased $3.8 million for
2024 compared to 2023, primarily due to decreases in outsourced services costs. Legal expense decreased $7.8 million for 2024 compared to 2023, as a result of a decline in legal settlement costs. Other miscellaneous expense decreased $16.4 million for
2024 compared to 2023, driven by decreases in operational losses ($6.1 million), pension costs ($3.6 million), loan related expenses ($3.2 million), and delivery related expenses ($2.1 million).
Noninterest expense for the year ended December 31, 2023, was $1.2 billion, an increase of $46.2 million, or 4.2%, from 2022. Occupancy and
equipment decreased $3.5 million for 2023 compared to 2022, primarily due to a decrease of $4.2 million in building rent expense and a decrease of $1.3 million in equipment maintenance expense offset by an increase of $1.3 million in building
maintenance expense. Data processing and software expense increased $9.3 million for 2023 compared to 2022, driven by increases in vendor costs, increased technology initiatives, software maintenance costs, and card processing expenses. Merger expense
represents one-time expenses related to effecting the acquisition of another entity. Merger expenses for 2023 totaled $5.2 million compared to $50.8 million in 2022. These expenses in 2023 primarily included compensation related expenses. The expenses
in 2022 primarily included costs related to the franchise-wide rebranding of the Company under the Cadence Bank name, as well as employee retention, marketing, and technology related expenses. Deposit insurance assessments increased $53.5 million for
2023 compared to 2022, primarily due to a $36.2 million FDIC special assessment recorded in 2023, and to a lesser extent, increased short-term borrowings and brokered deposits in 2023. Advertising and public relations expense decreased $12.9 million
for 2023 compared to 2022, largely driven by incremental merger expenses related to the Company’s rebranding across our footprint. Amortization of intangibles increased $1.0 million for 2023 compared to 2022, primarily due to an adjustment to a core
deposit intangible in 2023 resulting from a reassessment of the estimated remaining lives assigned to certain core deposit intangible assets. Professional, consulting and outsourcing increased $6.5 million for 2023 compared to 2022, primarily due to
increases in consulting expenses and other professional fees. Legal expense increased $14.7 million for 2023 compared to 2022, largely driven by accruals for the settlement of certain legal matters. Other miscellaneous expense increased $19.5 million
for 2023 compared to 2022, primarily driven by increased operational losses ($6.7 million), pension costs ($5.9 million), transit and delivery related fees ($3.3 million), and loan related expenses ($3.7 million).
Salaries and employee benefits expense was the largest category of our noninterest expense. Salaries and employee benefits decreased $25.4 million
for 2024 compared to 2023. For 2023, salaries and employee benefits expense decreased $0.1 million compared to 2022. The decrease in 2024 was attributable to an increase in deferred salaries from increased mortgage loan production in 2024 and certain
contractual one-time compensation payments made in 2023. The decrease in 2023 was primarily the result of a decrease in employee headcount resulting from the branch optimization project, partially offset by increases in retail incentives due to the
Customer Connect program.
The components of salary and employee benefits expense for the periods indicated and the percentage change between years are shown in the
following table:
TABLE 12—SALARIES AND EMPLOYEE BENEFITS EXPENSE
| |
|
2024 |
|
|
2023 |
|
|
2022 |
|
| (Dollars in thousands) |
|
Amount |
|
|
% Change |
|
|
Amount |
|
|
% Change |
|
|
Amount |
|
| Regular salaries, net of deferred salaries |
|
$ |
373,366 |
|
|
|
(9.6 |
)% |
|
$ |
413,226 |
|
|
|
(6.1 |
)% |
|
$ |
440,273 |
|
| Commissions and incentive compensation |
|
|
129,816 |
|
|
|
15.1 |
|
|
|
112,772 |
|
|
|
14.8 |
|
|
|
98,244 |
|
| Taxes and employee benefits |
|
|
106,125 |
|
|
|
(2.4 |
) |
|
|
108,724 |
|
|
|
12.9 |
|
|
|
96,326 |
|
| Total salaries and employee benefits |
|
$ |
609,307 |
|
|
|
(4.0 |
)% |
|
$ |
634,722 |
|
|
|
—% |
|
|
$ |
634,843 |
|
Income Taxes
The Company recorded an income tax expense from continuing operations of $152.6 million for the year ended December 31, 2024, compared to an
income tax benefit from continuing operations of $4.6 million and an income tax expense of $129.7 million for the years ended December 31, 2023 and 2022, respectively. The increase in tax expense in 2024 can be attributed to higher pre-tax income. The
tax benefit in 2023 can be attributed to lower pre-tax income as a result of the loss incurred due to the restructure of the securities portfolio.
The Company recorded zero income tax expense related to discontinued operations for the year ended December 31, 2024, compared to an income tax
expense from discontinued operations of $189.0 million and $6.4 million for the years ended December 31, 2023 and 2022, respectively. There was no tax expense on discontinued operations in 2024 as the sale of Cadence Insurance closed in November 2023,
and reported as a discontinued operation in 2023 and periods prior.
The effective tax rate on continuing operations was 22.6%, 504.8%, and 22.5% for the years ended December 31, 2024, 2023, and 2022, respectively.
The decrease in the effective tax rate for 2024 and the increase in the effective tax rate for 2023 were both the result of the securities restructuring, as well as the disposition of Cadence Insurance and the associated gain on the sale being reported
in discontinued operations.
In August 2022, the IRA of 2022 was signed into law to address inflation, healthcare costs, climate change and renewal energy incentives, among
other things. Included in the IRA of 2022 are provisions for the creation of a 15% CAMT that is effective for tax years beginning January 1, 2023 for corporations with an average annual adjusted financial statement income in excess of $1 billion. For
2024, the Company is not subject to the 15% CAMT.
FINANCIAL CONDITION
The percentage of earning assets to total assets measures the effectiveness of management’s efforts to invest available funds representing the
most efficient and profitable uses. Earning assets at December 31, 2024, were $42.4 billion, or 90.1% of total assets, compared with $44.2 billion, or 90.3% of total assets, at December 31, 2023.
TABLE 13—FINANCIAL CONDITION SUMMARY
| (In thousands) |
|
As of and For the
Year Ended
December 31, 2024 |
|
|
As of and For the
Year Ended
December 31, 2023 |
|
| Period-End Balances: |
|
|
|
|
|
|
|
|
| Total assets |
|
$ |
47,019,190 |
|
|
$ |
48,934,510 |
|
| Available for sale securities |
|
|
7,293,988 |
|
|
|
8,075,476 |
|
| Loans and leases, net of unearned income |
|
|
33,741,755 |
|
|
|
32,497,022 |
|
| Total deposits |
|
|
40,496,201 |
|
|
|
38,497,137 |
|
| Securities sold under agreement to repurchase |
|
|
23,616 |
|
|
|
451,516 |
|
| Short-term BTFP borrowings |
|
|
— |
|
|
|
3,500,000 |
|
| Subordinated and long-term borrowings |
|
|
10,706 |
|
|
|
438,460 |
|
| Total shareholders’ equity |
|
|
5,569,683 |
|
|
|
5,167,843 |
|
| Common shareholders’ equity |
|
|
5,402,690 |
|
|
|
5,000,850 |
|
| Average Balances: |
|
|
|
|
|
|
|
|
| Total assets |
|
|
47,973,279 |
|
|
|
48,703,953 |
|
| Available for sale securities |
|
|
7,962,869 |
|
|
|
10,322,335 |
|
| Loans and leases, net of unearned income |
|
|
33,107,659 |
|
|
|
31,913,925 |
|
| Total deposits |
|
|
38,475,929 |
|
|
|
38,628,453 |
|
| Securities sold under agreement to repurchase |
|
|
81,092 |
|
|
|
770,777 |
|
| Federal funds purchased and short-term BTFP and FHLB borrowings |
|
|
2,850,981 |
|
|
|
3,471,207 |
|
| Subordinated and long-term borrowings |
|
|
306,396 |
|
|
|
452,645 |
|
| Total shareholders’ equity |
|
|
5,353,705 |
|
|
|
4,487,433 |
|
| Common shareholders’ equity |
|
|
5,186,712 |
|
|
|
4,320,440 |
|
Securities
The Company uses its securities portfolio as a source of revenue and liquidity, and to serve as collateral to secure certain types of deposits and
borrowings. These securities, which are available for possible sale, are recorded at fair value. The following table shows the carrying value of the Company’s AFS securities by investment category for the periods indicated:
TABLE 14—AVAILABLE FOR SALE SECURITIES SUMMARY
| |
|
December 31, |
|
| (In thousands) |
|
2024 |
|
|
2023 |
|
| Available for sale securities: |
|
|
|
|
|
|
|
|
| U.S. Treasury securities |
|
$ |
— |
|
|
$ |
465,018 |
|
| U.S. government agency securities |
|
|
281,231 |
|
|
|
332,011 |
|
| MBS issued or guaranteed by U.S. agencies |
|
|
|
|
|
|
|
|
| Residential pass-through: |
|
|
|
|
|
|
|
|
| Guaranteed by GNMA |
|
|
66,581 |
|
|
|
75,662 |
|
| Issued by FNMA and FHLMC |
|
|
3,965,556 |
|
|
|
4,387,101 |
|
| Other residential MBS |
|
|
934,721 |
|
|
|
727,434 |
|
| Commercial MBS |
|
|
1,549,641 |
|
|
|
1,742,837 |
|
| Total MBS |
|
|
6,516,499 |
|
|
|
6,933,034 |
|
| Obligations of states and political subdivisions |
|
|
132,069 |
|
|
|
137,624 |
|
| Corporate debt securities |
|
|
47,402 |
|
|
|
67,197 |
|
| Foreign debt securities |
|
|
316,787 |
|
|
|
140,592 |
|
| Total |
|
$ |
7,293,988 |
|
|
$ |
8,075,476 |
|
At December 31, 2024, the Company’s AFS securities totaled $7.3 billion compared to $8.1 billion at December 31, 2023. The decrease of $781.5
million, or 9.7%, was primarily driven by the maturities and paydowns of $1.6 billion and the sale of $15.1 million of AFS securities during the period. The decrease was offset by purchases of $751.8 million of higher yielding securities during the
period.
Net unrealized losses on AFS securities at December 31, 2024 and December 31, 2023 totaled $853.7 million and $940.2 million, respectively. At
December 31, 2024, management believes that the unrealized losses are due to noncredit- related factors, such as changes in interest rates and other market conditions (see Note 3 to the consolidated financial statements).
In 2023, the Company executed securities portfolio restructurings as a part of a balance sheet optimization initiative. During the first quarter
of 2023, approximately $1.5 billion in U.S. Treasury AFS securities were sold generating an after-tax realized loss of approximately $39.5 million. Additionally, in the fourth quarter of 2023, AFS securities totaling approximately $3.1 billion in par
value were sold for an after-tax realized loss of approximately $294.1 million. Proceeds from the sales were redeployed in accretive activities including reinvestment in higher-yielding securities, funding loans, and lowering higher-cost brokered
deposits. Of the December 2023 sales proceeds, $2.1 billion was reinvested in securities.
The following table shows the maturities and weighted average yields for the carrying value of the AFS securities at the dates indicated:
TABLE 15—MATURITY DISTRIBUTION OF AFS SECURITIES
| |
|
December 31, 2024 |
|
|
December 31, 2023 |
|
| (Dollars in thousands) |
|
Estimated
Fair Value |
|
|
Weighted
Average
Yield |
|
|
Estimated
Fair Value |
|
|
Weighted
Average
Yield |
|
| U.S. Treasury securities: |
|
|
|
|
|
|
|
|
|
|
|
|
|
|
|
|
| Due in less than one year |
|
$ |
— |
|
|
|
— |
% |
|
$ |
465,018 |
|
|
|
5.46 |
% |
| U.S. Treasury securities total |
|
|
— |
|
|
|
— |
|
|
|
465,018 |
|
|
|
5.46 |
|
| U.S. government agency securities: |
|
|
|
|
|
|
|
|
|
|
|
|
|
|
|
|
| Due in one to five years |
|
|
8,364 |
|
|
|
3.76 |
|
|
|
12,853 |
|
|
|
4.37 |
|
| Due in five to ten years |
|
|
204,624 |
|
|
|
4.10 |
|
|
|
249,502 |
|
|
|
4.66 |
|
| Due after ten years |
|
|
68,243 |
|
|
|
2.14 |
|
|
|
69,656 |
|
|
|
2.22 |
|
| U.S. government agency securities total |
|
|
281,231 |
|
|
|
3.62 |
|
|
|
332,011 |
|
|
|
4.14 |
|
| Obligations of states and political subdivisions: |
|
|
|
|
|
|
|
|
|
|
|
|
|
|
|
|
| Due in less than one year |
|
|
— |
|
|
|
— |
|
|
|
1,835 |
|
|
|
2.84 |
|
| Due in one to five years |
|
|
9,295 |
|
|
|
2.92 |
|
|
|
9,153 |
|
|
|
2.95 |
|
| Due in five to ten years |
|
|
15,563 |
|
|
|
2.22 |
|
|
|
15,655 |
|
|
|
2.22 |
|
| Due after ten years |
|
|
107,211 |
|
|
|
2.69 |
|
|
|
110,981 |
|
|
|
2.70 |
|
| Obligations of states and political subdivisions total |
|
|
132,069 |
|
|
|
2.66 |
|
|
|
137,624 |
|
|
|
2.66 |
|
| Corporate debt securities: |
|
|
|
|
|
|
|
|
|
|
|
|
|
|
|
|
| Due in one to five years |
|
|
— |
|
|
|
— |
|
|
|
5,181 |
|
|
|
5.90 |
|
| Due in five to ten years |
|
|
45,702 |
|
|
|
4.77 |
|
|
|
60,632 |
|
|
|
4.59 |
|
| Due after ten years |
|
|
1,700 |
|
|
|
4.50 |
|
|
|
1,384 |
|
|
|
4.50 |
|
| Corporate debt securities total |
|
|
47,402 |
|
|
|
4.76 |
|
|
|
67,197 |
|
|
|
4.69 |
|
| Foreign debt securities: |
|
|
|
|
|
|
|
|
|
|
|
|
|
|
|
|
| Due in one to five years |
|
|
87,855 |
|
|
|
3.36 |
|
|
|
51,507 |
|
|
|
2.25 |
|
| Due in five to ten years |
|
|
228,932 |
|
|
|
5.16 |
|
|
|
89,085 |
|
|
|
5.86 |
|
| Foreign debt securities total |
|
|
316,787 |
|
|
|
4.66 |
|
|
|
140,592 |
|
|
|
4.54 |
|
| |
|
|
|
|
|
|
|
|
|
|
|
|
|
|
|
|
| Total securities due in less than one year |
|
|
— |
|
|
|
— |
|
|
|
466,853 |
|
|
|
5.45 |
|
| Total securities due in one to five years |
|
|
105,514 |
|
|
|
3.35 |
|
|
|
78,694 |
|
|
|
2.92 |
|
| Total securities due in five to ten years |
|
|
494,821 |
|
|
|
4.59 |
|
|
|
414,874 |
|
|
|
4.82 |
|
| Total securities due after ten years |
|
|
177,154 |
|
|
|
2.50 |
|
|
|
182,021 |
|
|
|
2.53 |
|
| MBS |
|
|
6,516,499 |
|
|
|
2.87 |
|
|
|
6,933,034 |
|
|
|
2.54 |
|
| Total estimated fair value |
|
$ |
7,293,988 |
|
|
|
2.98 |
% |
|
$ |
8,075,476 |
|
|
|
2.83 |
% |
The weighted average yields reported in Table 15 have been calculated using the average daily balance of the related securities. The yields on
tax-exempt obligations of states and political subdivisions have been adjusted to a taxable equivalent basis using a 21% tax rate.
Loans and Leases
The Company’s loans and leases held for investment portfolio represents the largest single component of the Company’s earning asset base. Average
loans and leases comprised 75.9% and 72.6% of average earning assets during the years ended December 31, 2024 and 2023, respectively. The Company’s lending activities include both commercial and consumer loans and leases. The Company has established
systematic procedures for approving and monitoring loans and leases that vary depending on the size and nature of the loan or lease and applies these procedures in a disciplined manner. The Company also acts as agent or participant in syndications and
other financing arrangements with other financial institutions. The Company’s loans and leases are widely diversified by borrower and industry. Loans and leases, net of unearned income, totaled $33.7 billion at December 31, 2024, representing a 3.8%
increase from $32.5 billion at December 31, 2023.
The following table shows the composition of the Company’s loan and lease portfolio by segment and class at the dates indicated:
TABLE 16—LOANS AND LEASES PORTFOLIO
| (In thousands) |
|
December 31, 2024 |
|
|
December 31, 2023 |
|
| Commercial and industrial |
|
|
|
|
|
|
|
|
| Non-real estate |
|
$ |
8,670,529 |
|
|
$ |
8,935,598 |
|
| Owner occupied |
|
|
4,665,015 |
|
|
|
4,349,060 |
|
| Total commercial and industrial |
|
|
13,335,544 |
|
|
|
13,284,658 |
|
| Commercial real estate |
|
|
|
|
|
|
|
|
| Construction, acquisition and development |
|
|
3,909,184 |
|
|
|
3,910,962 |
|
| Income producing |
|
|
6,015,773 |
|
|
|
5,736,871 |
|
| Total commercial real estate |
|
|
9,924,957 |
|
|
|
9,647,833 |
|
| Consumer |
|
|
|
|
|
|
|
|
| Residential mortgages |
|
|
10,267,883 |
|
|
|
9,329,692 |
|
| Other consumer |
|
|
213,371 |
|
|
|
234,839 |
|
| Total consumer |
|
|
10,481,254 |
|
|
|
9,564,531 |
|
| Total loans and leases, net of unearned income (1) |
|
$ |
33,741,755 |
|
|
$ |
32,497,022 |
|
|
(1) |
Total loans and leases are net of $21.4 million and $38.4 million of unearned income at December 31, 2024 and December 31, 2023, respectively. |
The following table shows the Company’s loan and lease portfolio by segment and class at the dates indicated by geographical location.
TABLE 17—LOANS AND LEASES BY GEOGRAPHICAL LOCATION
| |
|
December 31, 2024 |
|
| (In thousands) |
|
Alabama |
|
|
Arkansas |
|
|
Florida |
|
|
Georgia |
|
|
Louisiana |
|
|
Mississippi |
|
|
Missouri |
|
|
Tennessee |
|
|
Texas |
|
|
Other |
|
|
Total |
|
| Commercial and industrial |
|
|
|
|
|
|
|
|
|
|
|
|
|
|
|
|
|
|
|
|
|
|
|
|
|
|
|
|
|
|
|
|
|
|
|
|
|
|
|
|
|
|
|
|
| Non-real estate |
|
$ |
413,359 |
|
|
$ |
169,534 |
|
|
$ |
532,224 |
|
|
$ |
446,812 |
|
|
$ |
371,543 |
|
|
$ |
536,651 |
|
|
$ |
64,846 |
|
|
$ |
399,346 |
|
|
$ |
3,478,755 |
|
|
$ |
2,257,459 |
|
|
$ |
8,670,529 |
|
| Owner occupied |
|
|
337,580 |
|
|
|
253,538 |
|
|
|
308,545 |
|
|
|
400,342 |
|
|
|
298,787 |
|
|
|
624,950 |
|
|
|
107,443 |
|
|
|
159,058 |
|
|
|
1,708,113 |
|
|
|
466,659 |
|
|
|
4,665,015 |
|
| Total commercial and industrial |
|
|
750,939 |
|
|
|
423,072 |
|
|
|
840,769 |
|
|
|
847,154 |
|
|
|
670,330 |
|
|
|
1,161,601 |
|
|
|
172,289 |
|
|
|
558,404 |
|
|
|
5,186,868 |
|
|
|
2,724,118 |
|
|
|
13,335,544 |
|
| Commercial real estate |
|
|
|
|
|
|
|
|
|
|
|
|
|
|
|
|
|
|
|
|
|
|
|
|
|
|
|
|
|
|
|
|
|
|
|
|
|
|
|
|
|
|
|
|
| Construction, acquisition and development |
|
|
230,810 |
|
|
|
65,358 |
|
|
|
438,173 |
|
|
|
543,249 |
|
|
|
36,194 |
|
|
|
169,336 |
|
|
|
45,690 |
|
|
|
180,566 |
|
|
|
1,656,715 |
|
|
|
543,093 |
|
|
|
3,909,184 |
|
| Income producing |
|
|
437,146 |
|
|
|
259,767 |
|
|
|
477,493 |
|
|
|
613,337 |
|
|
|
226,849 |
|
|
|
424,078 |
|
|
|
204,119 |
|
|
|
319,560 |
|
|
|
2,298,344 |
|
|
|
755,080 |
|
|
|
6,015,773 |
|
| Total commercial real estate |
|
|
667,956 |
|
|
|
325,125 |
|
|
|
915,666 |
|
|
|
1,156,586 |
|
|
|
263,043 |
|
|
|
593,414 |
|
|
|
249,809 |
|
|
|
500,126 |
|
|
|
3,955,059 |
|
|
|
1,298,173 |
|
|
|
9,924,957 |
|
| Consumer |
|
|
|
|
|
|
|
|
|
|
|
|
|
|
|
|
|
|
|
|
|
|
|
|
|
|
|
|
|
|
|
|
|
|
|
|
|
|
|
|
|
|
|
|
| Residential mortgages |
|
|
1,300,485 |
|
|
|
425,602 |
|
|
|
709,335 |
|
|
|
449,117 |
|
|
|
478,947 |
|
|
|
1,214,542 |
|
|
|
210,712 |
|
|
|
796,490 |
|
|
|
4,436,803 |
|
|
|
245,850 |
|
|
|
10,267,883 |
|
| Other consumer |
|
|
27,186 |
|
|
|
17,653 |
|
|
|
5,002 |
|
|
|
7,817 |
|
|
|
10,653 |
|
|
|
86,059 |
|
|
|
1,322 |
|
|
|
16,668 |
|
|
|
36,559 |
|
|
|
4,452 |
|
|
|
213,371 |
|
| Total consumer |
|
|
1,327,671 |
|
|
|
443,255 |
|
|
|
714,337 |
|
|
|
456,934 |
|
|
|
489,600 |
|
|
|
1,300,601 |
|
|
|
212,034 |
|
|
|
813,158 |
|
|
|
4,473,362 |
|
|
|
250,302 |
|
|
|
10,481,254 |
|
| Total |
|
$ |
2,746,566 |
|
|
$ |
1,191,452 |
|
|
$ |
2,470,772 |
|
|
$ |
2,460,674 |
|
|
$ |
1,422,973 |
|
|
$ |
3,055,616 |
|
|
$ |
634,132 |
|
|
$ |
1,871,688 |
|
|
$ |
13,615,289 |
|
|
$ |
4,272,593 |
|
|
$ |
33,741,755 |
|
| |
|
December 31, 2023 |
|
| (In thousands) |
|
Alabama |
|
|
Arkansas |
|
|
Florida |
|
|
Georgia |
|
|
Louisiana |
|
|
Mississippi |
|
|
Missouri |
|
|
Tennessee |
|
|
Texas |
|
|
Other |
|
|
Total |
|
| Commercial and industrial |
|
|
|
|
|
|
|
|
|
|
|
|
|
|
|
|
|
|
|
|
|
|
|
|
|
|
|
|
|
|
|
|
|
|
|
|
|
|
|
|
|
|
|
|
| Non-real estate |
|
$ |
417,687 |
|
|
$ |
158,759 |
|
|
$ |
503,957 |
|
|
$ |
528,205 |
|
|
$ |
346,840 |
|
|
$ |
532,593 |
|
|
$ |
62,507 |
|
|
$ |
373,991 |
|
|
$ |
3,718,233 |
|
|
$ |
2,292,826 |
|
|
$ |
8,935,598 |
|
| Owner occupied |
|
|
345,679 |
|
|
|
247,584 |
|
|
|
281,750 |
|
|
|
313,532 |
|
|
|
292,347 |
|
|
|
591,611 |
|
|
|
90,227 |
|
|
|
167,464 |
|
|
|
1,676,272 |
|
|
|
342,594 |
|
|
|
4,349,060 |
|
| Total commercial and industrial |
|
|
763,366 |
|
|
|
406,343 |
|
|
|
785,707 |
|
|
|
841,737 |
|
|
|
639,187 |
|
|
|
1,124,204 |
|
|
|
152,734 |
|
|
|
541,455 |
|
|
|
5,394,505 |
|
|
|
2,635,420 |
|
|
|
13,284,658 |
|
| Commercial real estate |
|
|
|
|
|
|
|
|
|
|
|
|
|
|
|
|
|
|
|
|
|
|
|
|
|
|
|
|
|
|
|
|
|
|
|
|
|
|
|
|
|
|
|
|
| Construction, acquisition and development |
|
|
202,977 |
|
|
|
79,365 |
|
|
|
363,597 |
|
|
|
472,953 |
|
|
|
54,985 |
|
|
|
194,535 |
|
|
|
46,014 |
|
|
|
182,393 |
|
|
|
1,799,697 |
|
|
|
514,446 |
|
|
|
3,910,962 |
|
| Income producing |
|
|
446,290 |
|
|
|
273,000 |
|
|
|
369,897 |
|
|
|
605,160 |
|
|
|
212,148 |
|
|
|
435,089 |
|
|
|
208,216 |
|
|
|
296,918 |
|
|
|
2,080,393 |
|
|
|
809,760 |
|
|
|
5,736,871 |
|
| Total commercial real estate |
|
|
649,267 |
|
|
|
352,365 |
|
|
|
733,494 |
|
|
|
1,078,113 |
|
|
|
267,133 |
|
|
|
629,624 |
|
|
|
254,230 |
|
|
|
479,311 |
|
|
|
3,880,090 |
|
|
|
1,324,206 |
|
|
|
9,647,833 |
|
| Consumer |
|
|
|
|
|
|
|
|
|
|
|
|
|
|
|
|
|
|
|
|
|
|
|
|
|
|
|
|
|
|
|
|
|
|
|
|
|
|
|
|
|
|
|
|
| Residential mortgages |
|
|
1,216,942 |
|
|
|
388,396 |
|
|
|
647,117 |
|
|
|
408,459 |
|
|
|
462,264 |
|
|
|
1,147,388 |
|
|
|
179,119 |
|
|
|
716,384 |
|
|
|
3,898,525 |
|
|
|
265,098 |
|
|
|
9,329,692 |
|
| Other consumer |
|
|
31,155 |
|
|
|
18,488 |
|
|
|
5,563 |
|
|
|
6,431 |
|
|
|
11,587 |
|
|
|
87,229 |
|
|
|
1,780 |
|
|
|
17,892 |
|
|
|
49,397 |
|
|
|
5,317 |
|
|
|
234,839 |
|
| Total consumer |
|
|
1,248,097 |
|
|
|
406,884 |
|
|
|
652,680 |
|
|
|
414,890 |
|
|
|
473,851 |
|
|
|
1,234,617 |
|
|
|
180,899 |
|
|
|
734,276 |
|
|
|
3,947,922 |
|
|
|
270,415 |
|
|
|
9,564,531 |
|
| Total |
|
$ |
2,660,730 |
|
|
$ |
1,165,592 |
|
|
$ |
2,171,881 |
|
|
$ |
2,334,740 |
|
|
$ |
1,380,171 |
|
|
$ |
2,988,445 |
|
|
$ |
587,863 |
|
|
$ |
1,755,042 |
|
|
$ |
13,222,517 |
|
|
$ |
4,230,041 |
|
|
$ |
32,497,022 |
|
Loans Acquired in Mergers and Acquisitions
In connection with past bank acquisitions, the Company acquired loans both with and without evidence of credit quality deterioration since
origination. Acquired loans are recorded at their fair value at the time of acquisition with no carryover from the acquired institution’s previously recorded allowance for credit losses.
The fair value for acquired loans recorded at the time of acquisition is based upon several factors including the timing and payment of expected
cash flows, as adjusted for estimated credit losses and prepayments, and then discounting these cash flows using comparable market rates. The resulting fair value adjustment is recorded in the form of a premium or discount to the unpaid principal
balance of each acquired loan. As it relates to acquired loans that, as of the date of acquisition, have experienced a more-than-insignificant deterioration in credit quality since origination (“PCD”), the net premium or net discount is adjusted to
reflect the Company’s ACL recorded for PCD loans at the time of acquisition, and the remaining fair value adjustment not related to credit is accreted or amortized into interest income over the remaining life of the loan. As it relates to acquired
loans not classified as PCD (“non-PCD”) loans, the credit loss and yield components of the fair value adjustment are aggregated, and the resulting net premium or net discount is accreted or amortized into interest income over the remaining life of the
loan. The Company records an ACL for non-PCD loans at the time of acquisition through provision expense, and therefore, no further adjustments are made to the net premium or net discount for non-PCD loans.
In addition, a grade is assigned to each loan during the valuation process. For acquired loans that are not individually reviewed during the
valuation process, such loans are assumed to have characteristics similar to the assigned rating of the acquired institution’s risk rating, adjusted for any estimated differences between the Company’s rating methodology and the acquired institution’s
risk rating methodology. Acquired loans that are individually evaluated at the acquisition date are assigned a specific reserve in the same manner as other loans individually evaluated and are assigned an internal grade representing PCD with Loss
Exposure.
The following is a discussion of the Company’s segments and classes of loans and leases:
Commercial and Industrial
Non-Real Estate - The Company engages in lending to small and medium-sized business enterprises and government entities through its
community banking locations and to regional and national business enterprises through its corporate banking division. C&I loans are loans and leases to finance business operations, equipment and owner-occupied facilities. These include both lines
of credit and term loans which are amortized over the useful life of the assets financed. Personal and/or corporate guarantees are generally obtained where available and prudent. Also included in this category are loans to finance agricultural
production. The Company recognizes that risk from economic cycles, commodity prices, pandemics, government regulation, supply-chain disruptions, product innovations or obsolescence, operational errors, lawsuits, natural disasters, fraud, losses due to
theft or embezzlement, loss of sponsor support, health or loss of key personnel, or competitive situations may adversely affect the scheduled repayment of business loans. In addition, risks in the agricultural sector including crop failures due to
weather, insects and other blights, commodity prices, governmental intervention, lawsuits, labor or logistical disruptions. Non-real estate loans decreased 3.0% from December 31, 2023, to December 31, 2024.
Owner Occupied - Owner occupied loans include loans secured by business facilities to finance business operations, equipment, agricultural
land and owner-occupied facilities. These include both lines of credit and term loans which are amortized over the useful life of the assets financed. Personal guarantees are generally obtained where available and prudent. The Company recognizes that
risk from economic cycles, pandemics, government regulation, supply-chain disruptions, product innovations or obsolescence, operational errors, lawsuits, natural disasters, losses due to theft or embezzlement, health or loss of key personnel, or
competitive situations may adversely affect the scheduled repayment of business loans. Owner occupied loans increased 7.3% from December 31, 2023, to December 31, 2024.
Commercial Real Estate
Construction, Acquisition and Development – CAD loans include both term loans and credit lines for construction of commercial, industrial,
residential, and multi-family buildings and for purchasing, carrying, and developing land into residential subdivisions or various types of commercial developments, such as industrial, warehouse, retail, office, and multi-family. The Company generally
engages in construction and development lending primarily in markets served by its branches. The Company recognizes that risks are inherent in the financing of real estate development and construction. These risks include location, market conditions
and price volatility, changes in interest rates, demand for developed land, lots and buildings, desirability of features and styling of completed developments and buildings, competition from other developments and builders, traffic patterns, remote
work patterns, governmental jurisdiction, tax structure, availability of utilities, roads, public transportation and schools, availability of permanent financing for homebuyers, zoning, environmental restrictions, lawsuits, economic and business cycle,
or labor and reputation of the builder or developer. CAD loans had no significant change from December 31, 2023, to December 31, 2024.
Each CAD loan is underwritten to address: (i) the desirability of the project, its market viability and projected absorption period; (ii) the
creditworthiness of the borrower and the guarantor, if applicable, as to liquidity, cash flow and assets available to ensure performance of the loan; (iii) equity contribution to the project; (iv) the developer’s experience and success with similar
projects; and (v) the value of the collateral.
Income Producing – Income producing loans include loans to finance income-producing commercial and multi-family properties. Lending in this
category is generally limited to properties located in the Company’s market area with only limited exposure to properties located elsewhere. Loans in this category include loans for neighborhood retail centers, medical and professional offices, single
retail stores, warehouses and apartments leased generally to local businesses and residents. The underwriting of these loans takes into consideration the occupancy and rental rates as well as the financial health of the borrower. The Company’s exposure
to national retail tenants is limited. The Company recognizes that risk from economic cycles, pandemics, delayed or missed rent payments, supply-chain disruptions, operational errors, lawsuits, natural disasters, losses due to theft or embezzlement,
health or loss of key personnel, or competitive situations may adversely affect the scheduled repayment of business loans. Income producing loans increased 4.9% from December 31, 2023, to December 31, 2024.
Consumer
Residential Mortgages – Consumer mortgages are first or second-lien loans to consumers secured by a primary residence or second home. This
category includes traditional mortgages and home equity loans and revolving lines of credit. The loans are generally secured by properties located primarily in markets served by the Company’s branches. These loans are underwritten in accordance with
the Company’s general loan policy and procedures which require, among other things, proper documentation of each borrower’s financial condition, satisfactory credit history, and property value. In addition to loans originated for the Company’s
portfolio, the Company originates and services consumer mortgages sold in the secondary market which are underwritten and closed pursuant to investor and agency guidelines. Residential mortgages increased 10.1% from December 31, 2023, to December 31,
2024.
Other Consumer – Other consumer lending includes consumer credit card accounts as well as personal revolving lines of credit and
installment loans. The Company offers credit cards primarily to its deposit and loan customers. Consumer installment loans include term loans of up to five years secured by automobiles, boats and recreational vehicles. The Company recognizes that there
are risks in consumer lending which include interruptions in the borrower’s personal and investment income due to loss of employment, market conditions, and general economic conditions, deterioration in the health and well-being of the borrower and
family members, natural disasters, pandemics, lawsuits, losses, or inability to generate income due to injury, accidents, theft, vandalism, or incarceration. Other consumer loans decreased 9.1% from December 31, 2023, to December 31, 2024.
Selected Loan Maturity and Interest Rate Sensitivity
The maturity distribution of the Company’s loan portfolio is one factor in management’s evaluation of the risk characteristics of the loan and
lease portfolio. The interest rate sensitivity of the Company’s loan and lease portfolio is important in the management of net interest margin. The Company attempts to manage the relationship between the interest rate sensitivity of its assets and
liabilities to produce an effective interest differential that is not significantly impacted by changes in the level of interest rates (See - Quantitative and Qualitative Disclosures About Market Risk). The following table shows the maturity
distribution based on remaining maturities of the Company’s loan and lease portfolio and the interest rate sensitivity of the Company’s loans and leases maturing after one year at the dates indicated:
TABLE 18—INTEREST RATE SENSITIVITY OF LOANS AND LEASES
| |
|
December 31, 2024 |
|
| |
|
|
|
|
|
|
|
|
|
|
|
|
|
Rate Structure for Loans |
|
| |
|
|
|
|
|
|
|
|
|
|
|
|
|
Maturing Over One Year |
|
| |
|
|
|
|
Over One |
|
|
Over Five |
|
|
|
|
|
|
|
|
|
|
| |
|
One Year |
|
|
Year through |
|
|
Years through |
|
|
Over Fifteen |
|
|
Fixed |
|
|
Variable |
|
| (In thousands) |
|
or Less |
|
|
Five Years |
|
|
Fifteen Years |
|
|
Years |
|
|
Interest Rate |
|
|
Interest Rate |
|
| Commercial and industrial |
|
|
|
|
|
|
|
|
|
|
|
|
|
|
|
|
|
|
|
|
|
|
|
|
| Non-real estate |
|
$ |
1,614,062 |
|
|
$ |
5,789,715 |
|
|
$ |
1,167,901 |
|
|
$ |
98,851 |
|
|
$ |
882,160 |
|
|
$ |
6,174,307 |
|
| Owner occupied |
|
|
236,466 |
|
|
|
1,057,772 |
|
|
|
1,926,975 |
|
|
|
1,443,802 |
|
|
|
1,582,554 |
|
|
|
2,845,995 |
|
| Total commercial and industrial |
|
|
1,850,528 |
|
|
|
6,847,487 |
|
|
|
3,094,876 |
|
|
|
1,542,653 |
|
|
|
2,464,714 |
|
|
|
9,020,302 |
|
| Commercial real estate |
|
|
|
|
|
|
|
|
|
|
|
|
|
|
|
|
|
|
|
|
|
|
|
|
| Construction, acquisition and development |
|
|
1,517,658 |
|
|
|
1,168,647 |
|
|
|
543,621 |
|
|
|
679,258 |
|
|
|
346,397 |
|
|
|
2,045,129 |
|
| Income producing |
|
|
898,518 |
|
|
|
1,600,538 |
|
|
|
1,075,478 |
|
|
|
2,441,239 |
|
|
|
846,873 |
|
|
|
4,270,382 |
|
| Total commercial real estate |
|
|
2,416,176 |
|
|
|
2,769,185 |
|
|
|
1,619,099 |
|
|
|
3,120,497 |
|
|
|
1,193,270 |
|
|
|
6,315,511 |
|
| Consumer |
|
|
|
|
|
|
|
|
|
|
|
|
|
|
|
|
|
|
|
|
|
|
|
|
| Residential mortgages |
|
|
214,528 |
|
|
|
214,603 |
|
|
|
1,098,220 |
|
|
|
8,740,532 |
|
|
|
3,895,731 |
|
|
|
6,157,624 |
|
| Other consumer |
|
|
35,751 |
|
|
|
167,391 |
|
|
|
9,468 |
|
|
|
761 |
|
|
|
80,291 |
|
|
|
97,329 |
|
| Total consumer |
|
|
250,279 |
|
|
|
381,994 |
|
|
|
1,107,688 |
|
|
|
8,741,293 |
|
|
|
3,976,022 |
|
|
|
6,254,953 |
|
| Total |
|
$ |
4,516,983 |
|
|
$ |
9,998,666 |
|
|
$ |
5,821,663 |
|
|
$ |
13,404,443 |
|
|
$ |
7,634,006 |
|
|
$ |
21,590,766 |
|
Loans Held-for-Sale
At December 31, 2024 and December 31, 2023, loans held for sale totaled $244.2 million and $186.3 million, respectively. Included in loans held
for sale are loans sold to GNMA with an option to repurchase totaling $69.0 million and $56.5 million at December 31, 2024 and December 31, 2023, respectively. The Company records the GNMA loans at fair value on the consolidated balance sheets with a
corresponding liability. GNMA optional repurchase programs allow financial institutions to buy back individual delinquent mortgage loans that meet certain criteria (90 days or more past due) from the securitized loan pool for which the institution
provides servicing. At the servicer’s option and without GNMA’s prior authorization, the servicer may repurchase such a delinquent loan for an amount equal to 100% of the remaining principal balance of the loan. Under ASC 860, this buyback option is
considered a conditional option until the delinquency criteria are met, at which time the option becomes unconditional. When the Company is deemed to have regained effective control over these loans under the unconditional buyback option, the loans can
no longer be reported as sold and must be brought back onto the consolidated balance sheet as loans held for sale, regardless of whether the Company intends to exercise the buy-back option. These GNMA loans are not included in the nonperforming loans
totals (See Table 19).
Asset Quality
Nonperforming Assets
NPA consists of NPL, OREO, and other repossessed assets. The increase from December 31, 2023 to December 31, 2024 in NPA was driven by the
increase of $48.6 million, or 22.5%, in nonaccrual loans and leases (See Tables 20 and 21). The majority of the increase in nonaccrual loans and leases was located in the C&I non-real estate and residential mortgages segments. The increase was
offset by the decrease of $0.4 million, or 7.9%, in foreclosed OREO and other NPA. NPA were as follows as of each period presented:
TABLE 19—NONPERFORMING ASSETS
| (In thousands) |
|
December 31, 2024 |
|
|
December 31, 2023 |
|
| Total NPL(1) |
|
$ |
264,692 |
|
|
$ |
216,141 |
|
| Foreclosed OREO and other NPA |
|
|
5,754 |
|
|
|
6,246 |
|
| Total NPA |
|
$ |
270,446 |
|
|
$ |
222,387 |
|
| NPL to total loans and leases |
|
|
0.78 |
% |
|
|
0.67 |
% |
| NPA to total assets |
|
|
0.58 |
% |
|
|
0.45 |
% |
| |
|
|
|
|
|
|
|
|
| GNMA loans 90 or more days past due eligible for repurchase |
|
$ |
68,993 |
|
|
$ |
56,524 |
|
| |
|
|
|
|
|
|
|
|
| Government guaranteed portion of nonaccrual loans and leases covered by the SBA, FHA, VA or USDA |
|
$ |
89,906 |
|
|
$ |
49,551 |
|
| |
|
|
|
|
|
|
|
|
| Loans and leases 90+ days past due, still accruing |
|
$ |
13,126 |
|
|
$ |
22,466 |
|
|
(1) |
See Tables 20 and 21 for more information regarding NPL. |
Nonperforming Loans
NPL consist of nonaccrual loans and leases. The Company’s policy provides that loans and leases are generally placed in nonaccrual status if, in
management’s opinion, payment in full of principal or interest is not expected or payment of principal or interest is more than 90 days past due for commercial loans and 120 days past due for consumer loans, unless the loan or lease is both
well-secured and in the process of collection. NPL increased 22.5% at December 31, 2024, compared to December 31, 2023. Excluding the government guaranteed portion of nonaccrual loans and leases, NPL increased 4.9% at December 31, 2024, compared to
December 31, 2023. NPL as a percentage of net loans and leases increased from 0.7% at December 31, 2023, to 0.8% at December 31, 2024. NPL trends increased during the year, primarily due to a few larger credits in the corporate bank’s commercial and
industrial loan segments. Additionally, residential loans have also seen an increase during the year. With the current forecast, the Company expects a moderate correlation between NPL trends and provision amounts.
Included in NPL at December 31, 2024, were loans of $75.8 million that are individually analyzed collateral-dependent loans for which a specific
provision has been considered to address the unsupported exposure. Collateral-dependent loans are typically assigned an internal rating of impaired or PCD (loss). However, additional risk ratings can be used as needed to align with regulatory
definitions. PCD (loss) represent loans with evidence of deterioration of credit quality since origination that are acquired, and for which it was probable, at acquisition, that the bank will be unable to collect all contractually required payments. At
December 31, 2024, $67.1 million of nonperforming collateral-dependent loans were rated as impaired and $8.7 million were rated as doubtful. Nonperforming collateral-dependent loans had a specific reserve of $16.9 million included in the total ACL of
$460.8 million at December 31, 2024, and were net of $1.9 million in partial charge-downs previously taken on these impaired loans. At December 31, 2024, there were no net partial charge-downs previously taken on PCD (loss) loans.
NPL at December 31, 2023, included $100.6 million of impaired loans that had a specific reserve of $41.6 million included in the ACL of $468.0
million at December 31, 2023, and were net of $4.8 million in partial charge-downs previously taken on these impaired loans. PCD (loss) loans included in NPL totaled $1.6 million and had a specific reserve of $62 thousand included in the ACL. Net
partial charge-downs previously taken on PCD (loss) loans were immaterial at December 31, 2023.
The following table presents the Company’s NPL by geographical location at the dates indicated:
TABLE 20—NONPERFORMING LOANS AND LEASES BY GEOGRAPHICAL LOCATION
| |
|
December 31, 2024 |
|
|
December 31, 2023 |
|
| |
|
|
|
|
|
|
|
NPL as a |
|
|
|
|
|
|
|
|
NPL as a |
|
| |
|
|
|
|
|
|
|
% of |
|
|
|
|
|
|
|
|
% of |
|
| (In thousands) |
|
Amortized Cost |
|
|
Total NPL |
|
|
Amortized Cost |
|
|
Amortized Cost |
|
|
Total NPL |
|
|
Amortized Cost |
|
| Alabama |
|
$ |
2,746,566 |
|
|
$ |
22,394 |
|
|
|
0.82 |
% |
|
$ |
2,660,730 |
|
|
$ |
15,985 |
|
|
|
0.60 |
% |
| Arkansas |
|
|
1,191,452 |
|
|
|
2,292 |
|
|
|
0.19 |
|
|
|
1,165,592 |
|
|
|
2,136 |
|
|
|
0.18 |
|
| Florida |
|
|
2,470,772 |
|
|
|
30,380 |
|
|
|
1.23 |
|
|
|
2,171,881 |
|
|
|
10,204 |
|
|
|
0.47 |
|
| Georgia |
|
|
2,460,674 |
|
|
|
17,245 |
|
|
|
0.70 |
|
|
|
2,334,740 |
|
|
|
68,894 |
|
|
|
2.95 |
|
| Louisiana |
|
|
1,422,973 |
|
|
|
5,669 |
|
|
|
0.40 |
|
|
|
1,380,171 |
|
|
|
3,975 |
|
|
|
0.29 |
|
| Mississippi |
|
|
3,055,616 |
|
|
|
13,702 |
|
|
|
0.45 |
|
|
|
2,988,445 |
|
|
|
12,589 |
|
|
|
0.42 |
|
| Missouri |
|
|
634,132 |
|
|
|
3,359 |
|
|
|
0.53 |
|
|
|
587,863 |
|
|
|
2,091 |
|
|
|
0.36 |
|
| Tennessee |
|
|
1,871,688 |
|
|
|
17,672 |
|
|
|
0.94 |
|
|
|
1,755,042 |
|
|
|
3,161 |
|
|
|
0.18 |
|
| Texas |
|
|
13,615,289 |
|
|
|
69,985 |
|
|
|
0.51 |
|
|
|
13,222,517 |
|
|
|
59,437 |
|
|
|
0.45 |
|
| Other |
|
|
4,272,593 |
|
|
|
81,994 |
|
|
|
1.92 |
|
|
|
4,230,041 |
|
|
|
37,669 |
|
|
|
0.89 |
|
| Total |
|
$ |
33,741,755 |
|
|
$ |
264,692 |
|
|
|
0.78 |
% |
|
$ |
32,497,022 |
|
|
$ |
216,141 |
|
|
|
0.67 |
% |
The following table provides additional details related to the Company’s loan and lease portfolio and the distribution of NPL by segment and class
at the dates indicated:
TABLE 21—NONPERFORMING LOANS AND LEASES BY SEGMENT AND CLASS
| |
|
December 31, 2024 |
|
|
December 31, 2023 |
|
| |
|
|
|
|
|
|
|
NPL as a |
|
|
|
|
|
|
|
|
NPL as a |
|
| |
|
|
|
|
|
|
|
% of |
|
|
|
|
|
|
|
|
% of |
|
| (In thousands) |
|
Amortized Cost |
|
|
Total NPL |
|
|
Amortized Cost |
|
|
Amortized Cost |
|
|
Total NPL |
|
|
Amortized Cost |
|
| Commercial and industrial |
|
|
|
|
|
|
|
|
|
|
|
|
|
|
|
|
|
|
|
|
|
|
|
|
| Non-real estate |
|
$ |
8,670,529 |
|
|
$ |
145,115 |
|
|
|
1.67 |
% |
|
$ |
8,935,598 |
|
|
$ |
131,559 |
|
|
|
1.47 |
% |
| Owner occupied |
|
|
4,665,015 |
|
|
|
16,904 |
|
|
|
0.36 |
|
|
|
4,349,060 |
|
|
|
7,097 |
|
|
|
0.16 |
|
| Total commercial and industrial |
|
|
13,335,544 |
|
|
|
162,019 |
|
|
|
1.21 |
|
|
|
13,284,658 |
|
|
|
138,656 |
|
|
|
1.04 |
|
| Commercial real estate |
|
|
|
|
|
|
|
|
|
|
|
|
|
|
|
|
|
|
|
|
|
|
|
|
| Construction, acquisition and development |
|
|
3,909,184 |
|
|
|
8,600 |
|
|
|
0.22 |
|
|
|
3,910,962 |
|
|
|
1,859 |
|
|
|
0.05 |
|
| Income producing |
|
|
6,015,773 |
|
|
|
18,542 |
|
|
|
0.31 |
|
|
|
5,736,871 |
|
|
|
17,485 |
|
|
|
0.30 |
|
| Total commercial real estate |
|
|
9,924,957 |
|
|
|
27,142 |
|
|
|
0.27 |
|
|
|
9,647,833 |
|
|
|
19,344 |
|
|
|
0.20 |
|
| Consumer |
|
|
|
|
|
|
|
|
|
|
|
|
|
|
|
|
|
|
|
|
|
|
|
|
| Residential mortgages |
|
|
10,267,883 |
|
|
|
75,287 |
|
|
|
0.73 |
|
|
|
9,329,692 |
|
|
|
57,881 |
|
|
|
0.62 |
|
| Other consumer |
|
|
213,371 |
|
|
|
244 |
|
|
|
0.11 |
|
|
|
234,839 |
|
|
|
260 |
|
|
|
0.11 |
|
| Total consumer |
|
|
10,481,254 |
|
|
|
75,531 |
|
|
|
0.72 |
|
|
|
9,564,531 |
|
|
|
58,141 |
|
|
|
0.61 |
|
| Total |
|
$ |
33,741,755 |
|
|
$ |
264,692 |
|
|
|
0.78 |
% |
|
$ |
32,497,022 |
|
|
$ |
216,141 |
|
|
|
0.67 |
% |
The following table provides details regarding the aging of the Company’s NPL by segment and class at the dates indicated:
TABLE 22—AGING OF NONACCRUAL LOANS AND LEASES
| |
|
December 31, 2024 |
|
| |
|
30-59 Days |
|
|
60-89 Days |
|
|
90+ Days |
|
|
Total |
|
|
|
|
|
Total |
|
| (In thousands) |
|
Past Due |
|
|
Past Due |
|
|
Past Due |
|
|
Past Due |
|
|
Current |
|
|
Nonaccrual |
|
| Commercial and industrial |
|
|
|
|
|
|
|
|
|
|
|
|
|
|
|
|
|
|
|
|
|
|
|
|
| Non-real estate |
|
$ |
1,943 |
|
|
$ |
357 |
|
|
$ |
93,758 |
|
|
$ |
96,058 |
|
|
$ |
49,057 |
|
|
$ |
145,115 |
|
| Owner occupied |
|
|
574 |
|
|
|
50 |
|
|
|
16,280 |
|
|
|
16,904 |
|
|
|
— |
|
|
|
16,904 |
|
| Total commercial and industrial |
|
|
2,517 |
|
|
|
407 |
|
|
|
110,038 |
|
|
|
112,962 |
|
|
|
49,057 |
|
|
|
162,019 |
|
| Commercial real estate |
|
|
|
|
|
|
|
|
|
|
|
|
|
|
|
|
|
|
|
|
|
|
|
|
| Construction, acquisition and development |
|
|
— |
|
|
|
21 |
|
|
|
8,579 |
|
|
|
8,600 |
|
|
|
— |
|
|
|
8,600 |
|
| Income producing |
|
|
— |
|
|
|
246 |
|
|
|
12,193 |
|
|
|
12,439 |
|
|
|
6,103 |
|
|
|
18,542 |
|
| Total commercial real estate |
|
|
— |
|
|
|
267 |
|
|
|
20,772 |
|
|
|
21,039 |
|
|
|
6,103 |
|
|
|
27,142 |
|
| Consumer |
|
|
|
|
|
|
|
|
|
|
|
|
|
|
|
|
|
|
|
|
|
|
|
|
| Residential mortgages |
|
|
5,379 |
|
|
|
7,656 |
|
|
|
56,829 |
|
|
|
69,864 |
|
|
|
5,423 |
|
|
|
75,287 |
|
| Other consumer |
|
|
13 |
|
|
|
28 |
|
|
|
153 |
|
|
|
194 |
|
|
|
50 |
|
|
|
244 |
|
| Total consumer |
|
|
5,392 |
|
|
|
7,684 |
|
|
|
56,982 |
|
|
|
70,058 |
|
|
|
5,473 |
|
|
|
75,531 |
|
| Total |
|
$ |
7,909 |
|
|
$ |
8,358 |
|
|
$ |
187,792 |
|
|
$ |
204,059 |
|
|
$ |
60,633 |
|
|
$ |
264,692 |
|
| |
|
December 31, 2023 |
|
| |
|
30-59 Days |
|
|
60-89 Days |
|
|
90+ Days |
|
|
Total |
|
|
|
|
|
Total |
|
| (In thousands) |
|
Past Due |
|
|
Past Due |
|
|
Past Due |
|
|
Past Due |
|
|
Current |
|
|
Nonaccrual |
|
| Commercial and industrial |
|
|
|
|
|
|
|
|
|
|
|
|
|
|
|
|
|
|
|
|
|
|
|
|
| Non-real estate |
|
$ |
10,093 |
|
|
$ |
8,652 |
|
|
$ |
93,666 |
|
|
$ |
112,411 |
|
|
$ |
19,148 |
|
|
$ |
131,559 |
|
| Owner occupied |
|
|
1,031 |
|
|
|
185 |
|
|
|
5,881 |
|
|
|
7,097 |
|
|
|
— |
|
|
|
7,097 |
|
| Total commercial and industrial |
|
|
11,124 |
|
|
|
8,837 |
|
|
|
99,547 |
|
|
|
119,508 |
|
|
|
19,148 |
|
|
|
138,656 |
|
| Commercial real estate |
|
|
|
|
|
|
|
|
|
|
|
|
|
|
|
|
|
|
|
|
|
|
|
|
| Construction, acquisition and development |
|
|
— |
|
|
|
— |
|
|
|
1,859 |
|
|
|
1,859 |
|
|
|
— |
|
|
|
1,859 |
|
| Income producing |
|
|
9,603 |
|
|
|
— |
|
|
|
6,362 |
|
|
|
15,965 |
|
|
|
1,520 |
|
|
|
17,485 |
|
| Total commercial real estate |
|
|
9,603 |
|
|
|
— |
|
|
|
8,221 |
|
|
|
17,824 |
|
|
|
1,520 |
|
|
|
19,344 |
|
| Consumer |
|
|
|
|
|
|
|
|
|
|
|
|
|
|
|
|
|
|
|
|
|
|
|
|
| Residential mortgages |
|
|
4,782 |
|
|
|
4,315 |
|
|
|
43,255 |
|
|
|
52,352 |
|
|
|
5,529 |
|
|
|
57,881 |
|
| Other consumer |
|
|
44 |
|
|
|
15 |
|
|
|
128 |
|
|
|
187 |
|
|
|
73 |
|
|
|
260 |
|
| Total consumer |
|
|
4,826 |
|
|
|
4,330 |
|
|
|
43,383 |
|
|
|
52,539 |
|
|
|
5,602 |
|
|
|
58,141 |
|
| Total |
|
$ |
25,553 |
|
|
$ |
13,167 |
|
|
$ |
151,151 |
|
|
$ |
189,871 |
|
|
$ |
26,270 |
|
|
$ |
216,141 |
|
OREO and Repossessed Assets
OREO consists of properties acquired through foreclosure. Repossessed assets consist of non-real estate assets acquired in partial or full
settlement of loans. OREO and repossessed assets totaled $5.8 million and $6.2 million at December 31, 2024, and December 31, 2023, respectively. The decrease of $0.4 million, or 7.9%, was primarily the result of write-downs and sales of OREO during
2024.
Because a portion of the Company’s NPL have been determined to be collateral-dependent, management expects the resolution of a significant number
of these loans may necessitate foreclosure proceedings resulting in further additions to OREO. At December 31, 2024, residential mortgages in process of foreclosure increased to $19.7 million compared to $10.9 million at December 31, 2023.
At the time of foreclosure, the fair value of the collateral for loans backed by real estate is typically determined by an appraisal performed by
a third-party appraiser holding professional certifications. Such appraisals are then reviewed and evaluated by the Company’s internal appraisal group. A market value appraisal using a 180-360-day marketing period is typically ordered and the OREO is
recorded at the time of foreclosure at its market value less estimated selling costs. For residential subdivisions that are not completed, the appraisals reflect the uncompleted status of the subdivision.
Since OREO is carried at the lower of cost or fair value less estimated selling costs on an ongoing basis, new appraisals are generally obtained
on at least an annual basis and the OREO carrying values are adjusted accordingly. The type of appraisals typically used for these periodic reappraisals are “Restricted Use Appraisals,” meaning the appraisal is for client use only. Other indications of
fair value are also used to attempt to ensure that OREO is carried at fair value. These include listing the property with a broker and acceptance of an offer to purchase from a third-party. If an OREO property is listed with a broker at an amount less
than the current carrying value, the carrying value is adjusted to reflect the list price less estimated selling costs and if an offer to purchase is accepted at a price less than the current carrying value, the carrying value is adjusted to reflect
that sales price, less estimated selling costs. The majority of the properties in OREO are actively marketed using a combination of real estate brokers, bank staff who are familiar with the particular properties and/or third parties.
Financial Difficulty Modifications
In March 2022, the FASB issued ASU No. 2022-02, eliminating the recognition and measurement guidance on TDRs for creditors that have adopted ASC
326 and requiring them to make enhanced disclosures about loan modifications for borrowers experiencing financial difficulty. The guidance became effective for Cadence beginning January 1, 2023, and was adopted via the modified retrospective transition
method.
With the removal of the TDR accounting model, the general loan modification guidance in Subtopic 310-20 is now applied to all loan modifications,
including modifications made for borrowers experiencing financial difficulty. Under this guidance, a modification is treated as a new loan only if both 1) the terms of the new loan are at least as favorable to the lender as the terms for comparable
loans to other customers with similar collection risks, and 2) modifications to the terms of the original loan are more than minor. If either condition is not met, the modification is accounted for as the continuation of the old loan with any effect of
the modification treated as a prospective adjustment to the loan’s effective interest rate. Modifications in scope for borrowers experiencing financial difficulty may include principal forgiveness, other-than-insignificant payment delay, interest rate
reduction, or a combination of modifications. During the year ended December 31, 2024, the most common concession related to term extensions. Other concessions included principal forgiveness, payment deferrals, and interest rate reductions.
At December 31, 2024, loans that were modified within the past twelve months for borrowers experiencing financial difficulty totaled $202.3
million, or 0.6%, of total loans and leases, net of unearned income. Loans are considered to be in payment default at 90 or more days past due for purposes of assessing modified loans for default. See Note 4 to the consolidated financial statements for
additional information for these loans.
Loan Concentrations
At December 31, 2024, the Company did not have any concentration of loans or leases in excess of 10% of total loans and leases outstanding which
were not otherwise disclosed as a category of loans or leases. Loan concentrations are considered to exist when there are amounts loaned to multiple borrowers engaged in similar activities which would cause them to be similarly impacted by economic or
other conditions. The Company conducts business in a geographically concentrated area and has a significant amount of loans secured by real estate to borrowers in varying activities and businesses but does not consider these factors alone in
identifying loan concentrations. The ability of the Company’s borrowers to repay loans is somewhat dependent upon the economic conditions prevailing in the Company’s market areas.
Internally Assigned Grades on Loans
The Company utilizes an internal loan classification system that is updated to perpetually grade loans according to certain credit quality
indicators. These credit quality indicators include, but are not limited to, recent credit performance, delinquency, liquidity, cash flows, debt coverage ratios, collateral type and loan-to-value ratio. See Note 4 to the consolidated financial
statements.
The following table provides details of the Company’s loan and lease portfolio by segment, class, and internally assigned grade at the dates
indicated:
TABLE 23—GRADES ON LOANS AND LEASES
| |
|
December 31, 2024 |
|
| |
|
|
|
|
Special |
|
|
|
|
|
|
|
|
|
|
|
|
|
|
|
|
| (In thousands) |
|
Pass |
|
|
Mention |
|
|
Substandard (1) |
|
|
Doubtful |
|
|
Impaired (1) |
|
|
PCD (Loss) |
|
|
Total |
|
| Commercial and industrial |
|
|
|
|
|
|
|
|
|
|
|
|
|
|
|
|
|
|
|
|
|
|
|
|
|
|
|
|
| Non-real estate |
|
$ |
8,208,176 |
|
|
$ |
106,996 |
|
|
$ |
311,096 |
|
|
$ |
8,743 |
|
|
$ |
31,996 |
|
|
$ |
3,522 |
|
|
$ |
8,670,529 |
|
| Owner occupied |
|
|
4,610,775 |
|
|
|
815 |
|
|
|
41,363 |
|
|
|
— |
|
|
|
10,968 |
|
|
|
1,094 |
|
|
|
4,665,015 |
|
| Total commercial and industrial |
|
|
12,818,951 |
|
|
|
107,811 |
|
|
|
352,459 |
|
|
|
8,743 |
|
|
|
42,964 |
|
|
|
4,616 |
|
|
|
13,335,544 |
|
| Commercial real estate |
|
|
|
|
|
|
|
|
|
|
|
|
|
|
|
|
|
|
|
|
|
|
|
|
|
|
|
|
| Construction, acquisition and development |
|
|
3,896,856 |
|
|
|
— |
|
|
|
12,262 |
|
|
|
— |
|
|
|
66 |
|
|
|
— |
|
|
|
3,909,184 |
|
| Income producing |
|
|
5,850,702 |
|
|
|
5,094 |
|
|
|
144,084 |
|
|
|
— |
|
|
|
15,893 |
|
|
|
— |
|
|
|
6,015,773 |
|
| Total commercial real estate |
|
|
9,747,558 |
|
|
|
5,094 |
|
|
|
156,346 |
|
|
|
— |
|
|
|
15,959 |
|
|
|
— |
|
|
|
9,924,957 |
|
| Consumer |
|
|
|
|
|
|
|
|
|
|
|
|
|
|
|
|
|
|
|
|
|
|
|
|
|
|
|
|
| Residential mortgages |
|
|
10,167,830 |
|
|
|
891 |
|
|
|
89,597 |
|
|
|
— |
|
|
|
8,154 |
|
|
|
1,411 |
|
|
|
10,267,883 |
|
| Other consumer |
|
|
212,865 |
|
|
|
— |
|
|
|
506 |
|
|
|
— |
|
|
|
— |
|
|
|
— |
|
|
|
213,371 |
|
| Total consumer |
|
|
10,380,695 |
|
|
|
891 |
|
|
|
90,103 |
|
|
|
— |
|
|
|
8,154 |
|
|
|
1,411 |
|
|
|
10,481,254 |
|
| Total |
|
$ |
32,947,204 |
|
|
$ |
113,796 |
|
|
$ |
598,908 |
|
|
$ |
8,743 |
|
|
$ |
67,077 |
|
|
$ |
6,027 |
|
|
$ |
33,741,755 |
|
|
(1) |
In the loan classifications above, $99.0 million of the substandard balance and $11.1 million of the impaired balance are covered by government guarantees from either the SBA, FHA, VA and USDA. |
| |
|
December 31, 2023 |
|
| (In thousands) |
|
Pass |
|
|
Special
Mention
|
|
|
Substandard (1) |
|
|
Loss |
|
|
Impaired (1) |
|
|
PCD (Loss) |
|
|
Total |
|
| Commercial and industrial |
|
|
|
|
|
|
|
|
|
|
|
|
|
|
|
|
|
|
|
|
|
|
|
|
|
|
|
|
| Non-real estate |
|
$ |
8,450,809 |
|
|
$ |
101,607 |
|
|
$ |
294,895 |
|
|
$ |
13 |
|
|
$ |
84,457 |
|
|
$ |
3,817 |
|
|
$ |
8,935,598 |
|
| Owner occupied |
|
|
4,287,190 |
|
|
|
32,409 |
|
|
|
27,070 |
|
|
|
— |
|
|
|
1,275 |
|
|
|
1,116 |
|
|
|
4,349,060 |
|
| Total commercial and industrial |
|
|
12,737,999 |
|
|
|
134,016 |
|
|
|
321,965 |
|
|
|
13 |
|
|
|
85,732 |
|
|
|
4,933 |
|
|
|
13,284,658 |
|
| Commercial real estate |
|
|
|
|
|
|
|
|
|
|
|
|
|
|
|
|
|
|
|
|
|
|
|
|
|
|
|
|
| Construction, acquisition and development |
|
|
3,894,551 |
|
|
|
3,364 |
|
|
|
13,047 |
|
|
|
— |
|
|
|
— |
|
|
|
— |
|
|
|
3,910,962 |
|
| Income producing |
|
|
5,527,388 |
|
|
|
23,727 |
|
|
|
170,217 |
|
|
|
— |
|
|
|
15,539 |
|
|
|
— |
|
|
|
5,736,871 |
|
| Total commercial real estate |
|
|
9,421,939 |
|
|
|
27,091 |
|
|
|
183,264 |
|
|
|
— |
|
|
|
15,539 |
|
|
|
— |
|
|
|
9,647,833 |
|
| Consumer |
|
|
|
|
|
|
|
|
|
|
|
|
|
|
|
|
|
|
|
|
|
|
|
|
|
|
|
|
| Residential mortgages |
|
|
9,258,002 |
|
|
|
4,066 |
|
|
|
66,050 |
|
|
|
— |
|
|
|
— |
|
|
|
1,574 |
|
|
|
9,329,692 |
|
| Other consumer |
|
|
234,367 |
|
|
|
— |
|
|
|
472 |
|
|
|
— |
|
|
|
— |
|
|
|
— |
|
|
|
234,839 |
|
| Total consumer |
|
|
9,492,369 |
|
|
|
4,066 |
|
|
|
66,522 |
|
|
|
— |
|
|
|
— |
|
|
|
1,574 |
|
|
|
9,564,531 |
|
| Total |
|
$ |
31,652,307 |
|
|
$ |
165,173 |
|
|
$ |
571,751 |
|
|
$ |
13 |
|
|
$ |
101,271 |
|
|
$ |
6,507 |
|
|
$ |
32,497,022 |
|
|
(1) |
In the loan classifications above, $61.1 million of the substandard balance and $8.4 million of the impaired balance is covered by government guarantees from the SBA, FHA, VA and USDA. |
The following tables provides details regarding the aging of the Company’s loan and lease portfolio by internally assigned grade at the dates indicated:
TABLE 24—AGING BY GRADE ON LOANS AND LEASES
| |
|
December 31, 2024 |
|
| |
|
|
|
|
30-59 Days |
|
|
60-89 Days |
|
|
90+ Days |
|
|
|
|
| (In thousands) |
|
Current |
|
|
Past Due |
|
|
Past Due |
|
|
Past Due |
|
|
Total |
|
| Pass |
|
$ |
32,857,689 |
|
|
$ |
65,955 |
|
|
$ |
22,789 |
|
|
$ |
771 |
|
|
$ |
32,947,204 |
|
| Special Mention |
|
|
113,796 |
|
|
|
— |
|
|
|
— |
|
|
|
— |
|
|
|
113,796 |
|
| Substandard (1) |
|
|
368,636 |
|
|
|
24,685 |
|
|
|
40,707 |
|
|
|
164,880 |
|
|
|
598,908 |
|
| Doubtful |
|
|
8,743 |
|
|
|
— |
|
|
|
— |
|
|
|
— |
|
|
|
8,743 |
|
| Impaired (1) |
|
|
29,908 |
|
|
|
1,904 |
|
|
|
— |
|
|
|
35,265 |
|
|
|
67,077 |
|
| PCD (Loss) |
|
|
4,932 |
|
|
|
1,095 |
|
|
|
— |
|
|
|
— |
|
|
|
6,027 |
|
| Total |
|
$ |
33,383,704 |
|
|
$ |
93,639 |
|
|
$ |
63,496 |
|
|
$ |
200,916 |
|
|
$ |
33,741,755 |
|
|
(1) |
In the loan classifications above, $99.0 million of the substandard balance and $11.1 million of the impaired balance are covered by government guarantees from either the SBA, FHA, VA and USDA. |
| |
|
December 31, 2023 |
|
| |
|
|
|
|
30-59 Days |
|
|
60-89 Days |
|
|
90+ Days |
|
|
|
|
| (In thousands) |
|
Current |
|
|
Past Due |
|
|
Past Due |
|
|
Past Due |
|
|
Total |
|
| Pass |
|
$ |
31,559,559 |
|
|
$ |
51,766 |
|
|
$ |
20,441 |
|
|
$ |
20,541 |
|
|
$ |
31,652,307 |
|
| Special Mention |
|
|
165,173 |
|
|
|
— |
|
|
|
— |
|
|
|
— |
|
|
|
165,173 |
|
| Substandard(1) |
|
|
438,423 |
|
|
|
18,518 |
|
|
|
17,893 |
|
|
|
96,917 |
|
|
|
571,751 |
|
| Loss |
|
|
— |
|
|
|
— |
|
|
|
13 |
|
|
|
— |
|
|
|
13 |
|
| Impaired(1) |
|
|
19,258 |
|
|
|
19,670 |
|
|
|
7,758 |
|
|
|
54,585 |
|
|
|
101,271 |
|
| PCD (Loss) |
|
|
4,933 |
|
|
|
— |
|
|
|
— |
|
|
|
1,574 |
|
|
|
6,507 |
|
| Total |
|
$ |
32,187,346 |
|
|
$ |
89,954 |
|
|
$ |
46,105 |
|
|
$ |
173,617 |
|
|
$ |
32,497,022 |
|
|
(1) |
In the loan classifications above, $61.1 million of the substandard balance and $8.4 million of the impaired balance is covered by government guarantees from the SBA, FHA, VA and USDA. |
At December 31, 2024, pass, substandard, and doubtful grade categories increased while special mention, loss, impaired, and PCD (loss) decreased
compared to December 31, 2023. Pass loans increased $1.3 billion, or 4.1%, compared to December 31, 2023. The increase in pass was seen across all loan categories except for slight decreases in C&I non-real estate and other consumer. Substandard
loans increased $27.2 million, or 4.7%, at December 31, 2024 compared to December 31, 2023. The increase in substandard was mainly driven by the increase in residential mortgages, C&I non-real estate, and C&I owner occupied, somewhat offset by
a decrease in CRE income producing. Special mention loans decreased $51.4 million, or 31.1%, compared to December 31, 2023. The decrease in special mention was driven primarily by a decrease in C&I owner occupied and CRE income producing, somewhat
offset by a increase in C&I non-real estate. Impaired loans decreased $34.2 million, or 33.8%, at December 31, 2024 compared to December 31, 2023. The decrease in impaired was primarily driven by a decrease in C&I non-real estate, slightly
offset by an increase in C&I owner occupied and residential mortgages. The Company has maintained stable credit results while continuing to grow loans. Of total loans and leases, 98.9% were current on their contractual payments at December 31,
2024.
Collateral for some of the Company’s loans and leases is subject to fair value estimates that can fluctuate with market conditions and other
external factors. In addition, while the Company has certain underwriting obligations related to such estimates, the estimates of some real property and other collateral are dependent upon third-party independent appraisers employed as independent
contractors of the Company.
Deposits
Deposits originating within the communities served by the Company continue to be the Company’s primary source of funding its earning assets. The
Company has been able to compete effectively for deposits in its primary market areas, while continuing to manage the exposure to higher interest rates. The distribution and market share of deposits by type of deposit and by type of depositor are
important considerations in the Company’s assessment of the stability of its funding sources and its access to additional funds. Furthermore, management shifts the mix and maturity of the deposits depending on economic conditions and loan and
investment policies in an attempt, within set policies, to minimize cost and maximize net interest margin.
The following table presents the Company’s deposits and the percentage change between the periods indicated:
TABLE 25—SUMMARY OF DEPOSITS
| |
|
2024 |
|
|
2023 |
|
|
2022 |
|
| (Dollars in thousands) |
|
Amount |
|
|
% Change |
|
|
Amount |
|
|
% Change |
|
|
Amount |
|
| Noninterest bearing demand deposits |
|
$ |
8,591,805 |
|
|
|
(6.9 |
)% |
|
$ |
9,232,068 |
|
|
|
(27.5 |
)% |
|
$ |
12,731,065 |
|
| Interest bearing demand and money market deposits |
|
|
19,345,114 |
|
|
|
0.4 |
|
|
|
19,276,596 |
|
|
|
1.2 |
|
|
|
19,040,131 |
|
| Savings |
|
|
2,588,406 |
|
|
|
(4.9 |
) |
|
|
2,720,913 |
|
|
|
(21.7 |
) |
|
|
3,473,746 |
|
| Time deposits |
|
|
9,970,876 |
|
|
|
37.2 |
|
|
|
7,267,560 |
|
|
|
95.8 |
|
|
|
3,711,672 |
|
| Total deposits |
|
$ |
40,496,201 |
|
|
|
5.2 |
% |
|
$ |
38,497,137 |
|
|
|
(1.2 |
)% |
|
$ |
38,956,614 |
|
Total deposits experienced an increase of 5.2% at December 31, 2024, compared to December 31, 2023 due to increases in core customer deposits
(which excludes brokered deposits and public funds) and brokered deposits, partially offset by a decrease in public funds. Brokered deposits were $2.1 billion at December 31, 2024, an increase of $1.3 billion, or 173.8%, compared to December 31, 2023.
This increase reflects the Company’s efforts to raise brokered deposits during 2024 to facilitate the pay off of the $3.5 billion BTFP balance at rates the Company viewed as favorable compared to other alternative funding sources. Total public funds
balances were $4.1 billion at December 31, 2024, a decline of $1.5 billion, or 27.2%, compared to December 31, 2023. This decrease primarily reflects a targeted effort to reduce certain less profitable public fund relationships. Core customer deposit
balances were $34.3 billion at December 31, 2024, an increase of $2.2 billion, or 6.9%, compared to December 31, 2023. Growth in core customer deposits reflected both organic growth of $1.8 billion as well as transfers from securities sold under
agreement to repurchase of $360.0 million compared to December 31, 2023. Noninterest bearing demand deposits decreased $640.3 million, or 6.9%, at December 31, 2024 compared to December 31, 2023. Time deposits increased $2.7 billion, or 37.2%, at
December 31, 2024 compared to December 31, 2023 due in part to an increase of $1.5 billion in core customer and public funds deposits and an increase of $1.1 billion in brokered time deposits.
The following table presents the classification of the Company’s deposits on an average basis for each of the periods indicated:
TABLE 26—AVERAGE BALANCE AND YIELD ON DEPOSITS
| |
|
2024 |
|
|
2023 |
|
|
2022 |
|
| |
|
Average |
|
|
Average |
|
|
Average |
|
|
Average |
|
|
Average |
|
|
Average |
|
| (Dollars in thousands) |
|
Amount |
|
|
Rate |
|
|
Amount |
|
|
Rate |
|
|
Amount |
|
|
Rate |
|
| Noninterest bearing demand deposits |
|
$ |
8,780,004 |
|
|
|
— |
% |
|
$ |
10,610,698 |
|
|
|
— |
% |
|
$ |
13,733,384 |
|
|
|
— |
% |
| Interest bearing demand deposits |
|
|
18,739,210 |
|
|
|
3.06 |
|
|
|
18,314,649 |
|
|
|
2.58 |
|
|
|
18,541,402 |
|
|
|
0.59 |
|
| Savings |
|
|
2,626,539 |
|
|
|
0.57 |
|
|
|
3,028,875 |
|
|
|
0.49 |
|
|
|
3,657,718 |
|
|
|
0.15 |
|
| Time |
|
|
8,330,176 |
|
|
|
4.42 |
|
|
|
6,674,231 |
|
|
|
3.69 |
|
|
|
3,545,402 |
|
|
|
0.68 |
|
| Total deposits |
|
$ |
38,475,929 |
|
|
|
|
|
|
$ |
38,628,453 |
|
|
|
|
|
|
$ |
39,477,906 |
|
|
|
|
|
Uninsured deposits are defined as the portion of deposit accounts in U.S. offices that exceed the FDIC insurance limit and amounts in any other
uninsured investment or deposit account that are classified as deposits and are not subject to any federal or state deposit insurance regimes. The uninsured portion of public funds owned by municipal and state government entities are collateralized by
the Company with investment securities and custodial letters of credit from the FHLB of Dallas. The following table segregates our deposits by deposit insurance categories.
TABLE 27—ESTIMATED TOTAL INSURED AND UNINSURED DEPOSITS
| (In thousands) |
|
December 31, 2024 |
|
|
December 31, 2023 |
|
| FDIC insured |
|
$ |
25,840,309 |
|
|
$ |
22,909,914 |
|
| Collateralized (uninsured) |
|
|
3,901,677 |
|
|
|
5,518,946 |
|
| Uninsured (excluding collateralized) |
|
|
10,754,215 |
|
|
|
10,068,277 |
|
| Total deposits |
|
$ |
40,496,201 |
|
|
$ |
38,497,137 |
|
The Company’s estimated uninsured time deposits at December 31, 2024 had maturities as follows:
TABLE 28—MATURITY OF UNINSURED TIME DEPOSITS
| (In thousands) |
|
Amount |
|
| Three months or less |
|
$ |
514,926 |
|
| Over three months through six months |
|
|
516,963 |
|
| Over six months through twelve months |
|
|
603,563 |
|
| Over 12 months |
|
|
86,263 |
|
| Total |
|
$ |
1,721,715 |
|
Borrowings
Short-term Borrowings
The Company has several types of available short-term borrowing arrangements including Federal funds purchased, securities sold under agreements
to repurchase, short-term FHLB borrowings and the Federal Reserve discount window. Federal funds purchased are unsecured lines, while the rest of these types of borrowings are collateralized by investment securities and loans. At December 31, 2024 and
December 31, 2023, the Company had total short-term borrowings of $23.6 million with a weighted average interest rate of 4.10% and $4.0 billion with a weighted average interest rate of 4.78%, respectively. Cadence’s BTFP borrowing was paid off during
the fourth quarter of 2024. See Note 9 to the Company’s consolidated financial statements for additional details.
Long-term Borrowings
Under the terms of the blanket floating lien security agreement with FHLB Dallas, the Company is required to maintain sufficient collateral to
secure borrowings. At December 31, 2024, the remaining borrowing availability totaled $13.0 billion. At December 31, 2024, there were no call features on long-term FHLB borrowings. See Note 9 to the Company’s consolidated financial statements for
additional details.
During 2024, the Company repurchased $68.0 million of the $300 million Subordinated Notes due November 20, 2029, resulting in a $1.8 million gain
on the extinguishment of debt, and called the remaining $215.2 million in the fourth quarter. In addition, the Company repurchased $0.5 million of our Subordinated Notes due June 2029 and called the remaining $138.9 million of these Subordinated Notes
due June 2029, resulting in a net gain on the extinguishment of debt of $4.7 million which was reported in other noninterest revenue in the consolidated statements of income. The following is a summary of our long-term borrowings at the dates
indicated:
TABLE 29—LONG-TERM BORROWINGS
| (Dollars in thousands) |
|
December 31, 2024 |
|
|
December 31, 2023 |
|
| 4.850% advances from FHLB Dallas, due August 2, 2027 |
|
$ |
706 |
|
|
$ |
771 |
|
| 4.125% fixed to floating rate, subordinated notes, due November 20, 2029, callable on November 20, 2024 |
|
|
— |
|
|
|
283,159 |
|
| 7.250% subordinated notes, due June 28, 2029, callable on June 28, 2024 |
|
|
— |
|
|
|
35,000 |
|
| 4.750% subordinated notes, due June 30, 2029, callable on June 30, 2024 |
|
|
— |
|
|
|
79,352 |
|
| 6.250% subordinated notes, due June 28, 2029, callable on June 28, 2024 |
|
|
— |
|
|
|
25,000 |
|
| 5.000% fixed to floating rate, subordinated notes, due June 30, 2030, callable on June 30, 2025 |
|
|
10,000 |
|
|
|
10,000 |
|
| Purchase accounting adjustment, net of amortization |
|
|
— |
|
|
|
5,786 |
|
| Debt issue costs |
|
|
— |
|
|
|
(608 |
) |
| Total long-term borrowings |
|
$ |
10,706 |
|
|
$ |
438,460 |
|
Liquidity and Capital Resources
Liquidity
One of the Company’s goals is to maintain adequate funds to meet increases in loan demand or any potential increase in the normal level of deposit
withdrawals. This goal is accomplished primarily by generating cash from the Company’s operating activities and maintaining sufficient short-term liquid assets. These sources, coupled with a stable core deposit base and a historical experience in the
capital markets, allow the Company to fund earning assets and maintain the availability of funds. Management believes that the Company’s traditional sources of maturing loans and investment securities, sales of loans held for sale, cash from operating
activities and a strong base of core deposits are adequate to meet the Company’s liquidity needs for normal operations over both the short-term and the long-term.
The following table summarizes the Company’s cash and cash equivalents as of the following dates:
TABLE 30—CASH AND CASH EQUIVALENTS
| (In thousands) |
|
December 31, 2024 |
|
|
December 31, 2023 |
|
| Cash and cash equivalents |
|
$ |
1,731,576 |
|
|
$ |
4,232,265 |
|
| Cash and cash equivalents as a percentage of: |
|
|
|
|
|
|
|
|
| Loans and lease, net |
|
|
5.1 |
% |
|
|
13.0 |
% |
| Total earning assets |
|
|
4.1 |
|
|
|
9.6 |
|
| Total assets |
|
|
3.7 |
|
|
|
8.6 |
|
| Total deposits |
|
|
4.3 |
|
|
|
11.0 |
|
| Total uninsured deposits |
|
|
11.8 |
|
|
|
27.2 |
|
During 2024, the Company took advantage of available liquidity present at the beginning of the year, along with the growth in deposits, to paydown
borrowing from the BTFP and subordinated debt, enabling the Company to reduce reliance on borrowings and mitigate the impact of increased interest rates on deposits.
The Company had the following sources of contingent liquidity available at December 31, 2024:
TABLE 31—CASH AND SOURCES OF CONTINGENT
LIQUIDITY
| (In thousands) |
|
Amount |
|
| Cash and cash equivalents |
|
$ |
1,731,576 |
|
| Unpledged investment securities (at par) (1) |
|
|
3,909,447 |
|
| Secured lines of credit availability at the FHLB and Federal Reserve |
|
|
14,607,478 |
|
| Unsecured Federal funds lines availability |
|
|
2,080,000 |
|
| Total |
|
$ |
22,328,501 |
|
|
(1) |
The fair value of unpledged investment securities was $3.5 billion at December 31, 2024. |
At December 31, 2024, the Company had irrevocable letters of credit issued by the FHLB totaling $47.5 million, which were used on behalf of our
customers.
The ability of the Company to obtain funding from these or other sources could be negatively affected should the Company experience a substantial
deterioration in its financial condition or its debt rating or should the availability of short-term funding become restricted as a result of the disruption in the financial markets. Management does not anticipate any short- or long-term changes to its
liquidity strategies and believes that the Company has ample sources to meet any liquidity challenges that may arise. The Company has sound and robust risk management practices that include an active ALCO to analyze and manage the Company’s liquidity
and interest rate risk (See - Quantitative and Qualitative Disclosures About Market Risk).
Other Liquidity Considerations
The Company’s operating lease obligations represent short and long-term operating lease and rental payments for facilities, certain software and
data processing and other equipment (see Note 7 to the consolidated financial statements for more information). Purchase obligations represent obligations to purchase goods and services that are legally binding and enforceable on the Company and that
specify all significant terms, including: fixed or minimum quantities to be purchased; fixed, minimum or variable price provisions; and the approximate timing of the transaction.
In the ordinary course of business, the Company enters into various off-balance sheet commitments and other arrangements to extend credit that are
not reflected on the consolidated balance sheets of the Company. The business purpose of these off-balance sheet commitments is the routine extension of credit. The Company also faces the risk of deteriorating credit quality of borrowers to whom a
commitment to extend credit has been made; however, no significant credit losses are expected from these commitments and arrangements. At December 31, 2024, letters of credit totaled $448.9 million and unfunded extensions of credit totaled $8.6 billion
(see Note 21 to the consolidated financial statement for more information). At December 31, 2024, the Company maintained a reserve for unfunded commitments of $8.6 million included in other liabilities.
Cash Obligations
The following table summarizes the Company’s contractual obligations at December 31, 2024. See Notes 1, 7, and 9 to the consolidated financial
statements for further disclosures regarding contractual obligations.
TABLE 32—CONTRACTUAL OBLIGATIONS
| |
|
Payments Due by Periods |
|
| |
|
|
|
|
Less Than |
|
|
One to Three |
|
|
Three to Five |
|
|
More than |
|
| (In thousands) |
|
Total |
|
|
One Year |
|
|
Years |
|
|
Years |
|
|
Five Years |
|
| Contractual Obligations: |
|
|
|
|
|
|
|
|
|
|
|
|
|
|
|
|
|
|
|
|
| Deposits without a stated maturity |
|
$ |
30,525,325 |
|
|
$ |
30,525,325 |
|
|
$ |
— |
|
|
$ |
— |
|
|
$ |
— |
|
| Deposits with a stated maturity |
|
|
9,970,876 |
|
|
|
9,562,714 |
|
|
|
347,916 |
|
|
|
60,063 |
|
|
|
183 |
|
| Subordinated and long-term borrowings |
|
|
10,706 |
|
|
|
61 |
|
|
|
645 |
|
|
|
— |
|
|
|
10,000 |
|
| Operating lease obligations |
|
|
187,798 |
|
|
|
11,241 |
|
|
|
23,119 |
|
|
|
22,902 |
|
|
|
130,536 |
|
| Securities sold under agreement to repurchase |
|
|
23,616 |
|
|
|
23,616 |
|
|
|
— |
|
|
|
— |
|
|
|
— |
|
| Limited partnership investments |
|
|
277,421 |
|
|
|
233,178 |
|
|
|
40,758 |
|
|
|
836 |
|
|
|
2,649 |
|
| Total contractual obligations |
|
$ |
40,995,742 |
|
|
$ |
40,356,135 |
|
|
$ |
412,438 |
|
|
$ |
83,801 |
|
|
$ |
143,368 |
|
Cash Flow Sources and Uses
Cash equivalents include cash and amounts due from banks, including interest bearing deposits with other banks. At December 31, 2024, cash and
cash equivalents totaled $1.7 billion compared to $4.2 billion at December 31, 2023. The ratio of cash and cash equivalents to total assets was 3.7% at December 31, 2024 compared to 8.6% at December 31, 2023.
Cash flows from discontinued operations are not presented separately in the consolidated statements of cash flows.
During 2024, operating activities provided $856.7 million in cash. During 2024, investing activities used $782.2 million in cash. Primary uses of
funds in investing activities during 2024 were net funding of loans $1.5 billion and purchases of AFS securities $751.8 million. These items were partially offset by proceeds from maturities, calls and payments of AFS securities of $1.6 billion. During
2024, financing activities used $2.6 billion, which primarily resulted from a decrease of $3.5 billion in BTFP and short-term FHLB advance, a decrease of $427.9 million in securities sold under agreements to repurchase and federal funds purchased and a
decrease of $422.6 million in long-term borrowings. These items were partially offset by an increase of $2.0 billion in deposits. During 2024, the Company took advantage of the extra liquidity present at the beginning of the year, along with the growth
in deposits to restructure the liability side of the balance sheet. This enabled the Company to reduce reliance on borrowings which mitigated the impact of increased interest rates on deposits.
Regulatory Capital
Regulatory capital at December 31, 2024 and December 31, 2023 was calculated in accordance with standards established by the federal banking
agencies as well as the interagency final rule published on September 30, 2020 entitled “Revised Transition of the Current Expected Credit Losses Methodology for Allowances” which delayed the estimated impact on regulatory capital stemming from the
adoption of CECL. The agencies granted this relief to allow institutions to focus on lending to customers in light of the economic and other impacts from COVID-19, while also maintaining the quality of regulatory capital. Under the final rule, the
Day-1 impact of the adoption of CECL and 25% of subsequent provisions for credit losses (“Day-2 impacts”) were deferred over a two-year period ending January 1, 2022. At that point, the amount is phased into regulatory capital on a pro rata basis over
a three-year period ending January 1, 2025.
Additionally, regulatory capital rules include a capital conservation buffer of 2.5% which the Company must maintain on top of its minimum
risk-based capital requirements. This buffer applies to all three risk-based capital measurements (CET1, Tier 1 and total capital to risk-weighted assets). A financial institution with a conservation buffer of less than the required amount is subject
to limitations on capital distributions, including dividend payments and stock repurchases, and certain discretionary bonus payments to executive officers.
Capital amounts and ratios for the Company at December 31, 2024 and December 31, 2023, are presented in the following table and as shown, exceed
the thresholds necessary to be considered “well capitalized.” Management believes that no events or changes have occurred subsequent to the indicated dates that would change this designation.
TABLE 33—REGULATORY CAPITAL
| |
|
December 31, 2024 |
|
|
December 31, 2023 |
|
| (Dollars in thousands) |
|
Amount |
|
|
Ratio |
|
|
Amount |
|
|
Ratio |
|
| Common equity Tier 1 capital (to risk-weighted assets) |
|
$ |
4,693,487 |
|
|
|
12.35 |
% |
|
$ |
4,363,020 |
|
|
|
11.62 |
% |
| Tier 1 capital (to risk-weighted assets) |
|
|
4,860,480 |
|
|
|
12.79 |
|
|
|
4,530,013 |
|
|
|
12.06 |
|
| Total capital (to risk-weighted assets) |
|
|
5,306,647 |
|
|
|
13.97 |
|
|
|
5,377,324 |
|
|
|
14.32 |
|
| Tier 1 leverage capital (to average assets) |
|
|
4,860,480 |
|
|
|
10.41 |
|
|
|
4,530,013 |
|
|
|
9.30 |
|
Uses of Capital
Subject to pre-approval from the Federal Reserve and MDBCF, the Company may pursue acquisitions of depository institutions and businesses closely
related to banking that further the Company’s business strategies. Management anticipates that consideration for any transactions would include shares of the Company’s common stock, cash or a combination thereof.
On December 13, 2023, the Company announced a share repurchase program whereby the Company may acquire up to an aggregate of 10,000,000 shares of
its common stock. The share repurchase program became effective on January 2, 2024, and expired on December 31, 2024. Under this share repurchase program, Cadence’s shares could have been purchased periodically in open market transactions at prevailing
market prices, in privately negotiated transactions, or by other means in accordance with federal securities laws. Repurchased shares were held as authorized but unissued shares available for use in connection with the Company’s stock compensation
programs, other transactions, or for other corporate purposes as determined by the Company’s Board of Directors. During the year ended December 31, 2024, the Company had repurchased 1,237,021 shares under this program.
During the first quarter of 2024, the Company increased the common stock dividend to $0.25 per share.
The IRA of 2022 includes a provision for an excise tax equal to 1% of the fair market value of any stock repurchased by covered corporations
during a taxable year, subject to certain limits and provisions. The excise tax was effective beginning in fiscal year 2023. While we may complete transactions subject to the new excise tax, we do not expect a material impact to our balance sheet or
our results of operations.
Impact of Inflation
The consolidated financial statements and related consolidated financial data presented herein have been prepared in accordance with GAAP and
practices within the banking industry which require the measurement of financial position and operating results in terms of historical dollars without considering the changes in the relative purchasing power of money over time due to inflation. The
effect of inflation on a financial institution differs from the effect on other types of businesses. While a financial institution’s operating expenses are affected by general inflation, the asset and liability structure of a financial institution
consists largely of monetary items. Monetary items, such as cash, investments, loans, deposits, and borrowings, are those assets and liabilities which are or will be converted into a fixed number of dollars regardless of changes in prices. As a result,
changes in interest rates can be more impactful to a financial institution’s performance than general inflation. Inflation may also have impacts on the Company’s customers, businesses and consumers and their ability or willingness to invest, save or
spend, and perhaps on their ability to repay loans. As such, there would likely be impacts on the general appetite for banking products and the credit health to the Company’s customers. See Part 1, Item 1.A., Risk Factors, for additional information
regarding the risks of inflation.
Certain Litigation and Other Contingencies
The nature of the Company’s business ordinarily results in certain types of claims, litigation, investigations, and other legal or administrative
cases and proceedings. Although the Company and its subsidiaries have policies and procedures to minimize legal noncompliance and the impact of claims and other proceedings and endeavored to procure reasonable amounts of insurance coverage, litigation
and regulatory actions present an ongoing risk.
The Company and its subsidiaries engage in lines of business that are heavily regulated and involve a large volume of actual or potential
financial transactions with customers or applicants, and the Company is a public company with a large number of shareholders. From time to time, applicants, borrowers, customers, shareholders, former employees, service providers, and other third
parties have brought actions against the Company or its subsidiaries, in cases claiming substantial damages. Financial services companies are subject to risks arising from changing regulatory frameworks or expectations, regulatory investigations, class
action litigation, and, from time to time, the Company and its subsidiaries have such actions brought against them. The Company and its subsidiaries are also subject to enforcement actions by federal or state regulators, including the CFPB, the DOJ,
state attorneys general, and the Federal Reserve or MDBCF, which may be adversely impacted by ongoing litigation in which the Company is involved. Additionally, the Company is, and management expects it to be, engaged in a number of foreclosure
proceedings and other collection actions as part of its lending and leasing collections activities, which, from time to time, have resulted in counterclaims against the Company and its subsidiaries. Various legal proceedings have and may arise in the
future out of claims against entities to which the Company is a successor as a result of business combinations.
When and as the Company determines it has meritorious defenses to the claims asserted, it vigorously defends against such claims. The Company will
consider settlement of claims when, in management’s judgment and in consultation with counsel, it is in the best interests of the Company to do so.
The Company cannot predict with certainty the cost of defense, the cost of prosecution, or the ultimate outcome of litigation or other proceedings
filed by or against it, its subsidiaries and its directors, management or employees, including remedies or damage awards. On at least a quarterly basis, the Company assesses its liabilities and contingencies in connection with outstanding legal
proceedings as well as certain threatened claims (which are not considered incidental to the ordinary conduct of the Company’s business) utilizing the latest and most reliable information available. For matters where a loss is not probable or the
amount of the loss cannot be estimated, the Company will not accrue. For matters where it is probable the Company will incur a loss and the amount can be reasonably estimated, the Company establishes an accrual for the loss. Once established, the
accrual is adjusted periodically to reflect any relevant developments. The actual cost of any such matters, however, may turn out to be substantially higher than the amount accrued. Further, the Company’s insurance policies have deductibles and
coverage limits, and such policies are unlikely to cover all costs and expenses related to the defense or prosecution of such legal proceedings or any losses arising therefrom.
Although the final outcome of any legal proceedings is inherently uncertain, based on the information available, advice of counsel and available
insurance coverage, if applicable, management believes that the litigation-related liability of $12.0 million accrued at December 31, 2024 is adequate and that any incremental change in potential liability arising from the Company’s legal proceedings
and threatened claims, including the matters described herein and those otherwise arising in the ordinary course of business, will not have a material adverse effect on the Company’s business or consolidated results of operations or financial
condition. It is possible, however, that future developments could result in an unfavorable outcome for, or resolution of any one or more of the legal proceedings in which the Company or its subsidiaries are defendants, which may be material to the
Company’s business or consolidated results of operations or financial condition for a particular fiscal period or periods.
On August 30, 2021, Legacy Cadence and the DOJ agreed to a settlement set forth in the consent order related to the investigation by the DOJ of
Legacy Cadence Bank’s fair lending program in Harris, Fort Bend, and Montgomery Counties located in Houston, Texas during the period between 2014 and 2016 (the “Consent Order”). The Consent Order was signed by the United States District Court for the
Northern District of Georgia, Atlanta Division, on August 31, 2021. Pursuant to Section 5.2(g) of the Agreement and Plan of Merger and Paragraph 50 of the Consent Order, Legacy BancorpSouth Bank approved the negotiated settlement, and subsequently, the
Company agreed to accept the obligations of the Consent Order. The Consent Order is in effect for five years. For additional information regarding the terms of this settlement and the Consent Order, see Legacy Cadence Bancorporation’s Current Report on
Form 8-K that was filed with the SEC on August 30, 2021.
Recent Pronouncements
Refer to Note 1 “Summary of Significant Accounting Policies” in the consolidated financial statements for a discussion of accounting standards
currently effective for 2024 and relevant accounting standards that have been issued but are not currently effective.
CRITICAL ACCOUNTING ESTIMATES
The Company’s consolidated financial statements are prepared in accordance with GAAP, which require the Company to make estimates and assumptions
(see Note 1 to the consolidated financial statements). Management bases our estimates on historical experience and on various other assumptions that we believe to be reasonable under current circumstances.
These assumptions form the basis for our judgments about the carrying values of assets and liabilities that are not readily available from
independent, objective sources. We evaluate our estimates on an ongoing basis. The use of alternative assumptions may result in significantly different estimates. Additionally, actual results may differ from these estimates.
Accounting policies are an integral part of our consolidated financial statements. A thorough understanding of these accounting policies is
essential when reviewing our reported results of operations and our financial position. The critical accounting estimates discussed below involve additional management judgment due to the complexity and subjectivity of the methods and assumptions used.
Allowance for Credit Losses
The Company bases its estimates of credit losses on three primary components: (1) estimates of expected losses that exist in various segments of
performing loans and leases over the remaining life of the loan portfolio using a reasonable and supportable economic forecast; (2) specifically identified losses in individually analyzed credits which are collateral-dependent, which generally include
loans internally graded as impaired and PCD Loss loans; and (3) qualitative factors related to economic conditions, portfolio concentrations, regulatory policy updates, and other relevant factors that address estimates of expected losses not fully
addressed based upon management’s judgment of portfolio conditions.
The Company utilizes credit risk models to estimate the probability of default and loss given default of loans over their remaining lives. The
probability of default settings in the models incorporate a risk grading process by utilizing pool-specific historical default rates. In addition, the loss given default assumptions in the models utilize historical losses for different types of
collateral on defaulted loans while giving consideration for the loan-to-value ratio at the time of default. The product of the probability of default and loss given default derives a base expected loss rate for each credit. Additionally, in some
cases, including credit cards, a loss rate model is used where lifetime loss rates are estimated. The base expected loss rate is adjusted by way of econometric models that measure the direction and magnitude of change in expected loss rates given a
change in forecasted economic variables.
The aforementioned credit risk models and econometric models were developed and are recalibrated using historical experience. Credit factors such
as financial condition of the borrower and guarantor, recent credit performance, delinquency, liquidity, cash flows, collateral type and collateral value are used by the models to assess credit risk. Estimates of expected losses are influenced by the
historical net losses experienced by the Company for loans and leases of comparable creditworthiness and structure. Specific loss assessments are performed for loans and leases based upon the collateral protection. The Company’s reasonable and
supportable eight quarter economic forecast is utilized to estimate credit losses before reverting back to longer term historical loss experience.
The ACL represents management’s best estimate, but significant downturns in circumstances relating to loan quality and economic conditions could
necessitate additional provisions or a reduction in the ACL. Unanticipated changes and events could have a significant impact on the financial performance of borrowers and their ability to perform as agreed. One of the most significant judgments used
in determining the ACL is the reasonable and supportable economic forecast. The economic indices sourced from the economic forecast and used in developing the estimate include the national unemployment rate, changes in the U.S. gross domestic product,
changes in commercial real estate prices and changes in home prices. The economic series for unemployment carries the highest weighting and is the most sensitive component of the estimate.
Given the dynamic relationship between macroeconomic variables within our modeling framework, it is difficult to estimate the impact of a change
in any one individual variable on the ACL. As a result, management uses a probability- weighted approach that incorporates a baseline and a downside risk economic scenario when formulating the quantitative estimate. The downside scenario is an estimate
of various forecast variable estimates that result should certain material downside risks be made manifest during the forecast period. Variables are negatively stressed further than what would be seen in the baseline scenario. Typically, these adverse
conditions will result in a negative impact on the allowance and would require increased levels in the allowance if they were to materialize.
However, to illustrate a hypothetical sensitivity analysis, management calculated a quantitative allowance using a 100% weighting applied to a
downside risk scenario. Under this scenario, as an example, the unemployment rate increases, to an estimated 5.9% and 5.8% at the end of 2025 and 2026, respectively. These numbers result in unemployment rates that are approximately 1.5% and 1.6% higher
than baseline scenario projections of 4.4% and 4.2%, respectively for the same time periods.
To demonstrate the sensitivity to key economic parameters used in the calculation of our ACL at December 31, 2024, management calculated the
difference between a 100% base forecast and a 100% downside risk scenario. These calculations are quantitative-only and exclude consideration of qualitative adjustments and produced a model result difference of $107.7 million.
The resulting difference is not intended to represent an expected increase in ACL for a number of reasons including the following:
|
● |
Management uses a weighted approach applied to multiple economic scenarios for its ACL estimation process; |
|
● |
The highly uncertain economic environment; |
|
● |
The difficulty in predicting the inter-relationships between the economic parameters used in the various economic scenarios; and |
|
● |
The sensitivity estimate does not account for our qualitative overlays and associated risk profile and size components incorporated by
management as part of its overall ACL framework. |
Goodwill and Other Intangible Assets
The acquisition method of accounting requires that assets acquired and liabilities assumed in business combinations are recorded at their fair
values. This often involves estimates based on third-party or internal valuations based on discounted cash flow analyses or other valuation techniques, which are inherently subjective. Business combinations also typically result in goodwill, which is
subject to ongoing periodic impairment tests based on the fair values of the reporting units to which the goodwill relates. The amortization of definite-lived intangible assets is based upon the estimated economic benefits to be received, which is also
subjective. Provisional estimates of fair values may be adjusted for a period of up to one year from the acquisition date if new information is obtained about facts and circumstances that existed as of the acquisition date that, if known, would have
affected the measurement of the amounts recognized as of that date. Adjustments recorded during this period are recognized in the current reporting period. Management uses various valuation methodologies to estimate the fair value of these assets and
liabilities, and often involves a significant degree of judgment, particularly when liquid markets do not exist for the particular item being valued. Examples of such items include loans, deposits, identifiable intangible assets and certain other
assets and liabilities.
Management uses significant estimates and assumptions to value such items, including projected cash flows, repayment rates, default rates and
losses assuming default, discount rates, and realizable collateral values. The credit allowance for PCD loans is recognized within business combination accounting. The ACL for non-PCD assets is recognized as provision expense in the same reporting
period as the business combination. The valuation of other identifiable intangible assets, including core deposit intangibles, trademarks, and customer list intangibles, requires assumptions such as projected attrition rates, expected revenue and
costs, discount rates and other forward-looking factors. The purchase date valuations and any subsequent adjustments also determine the amount of goodwill or bargain purchase gain recognized in connection with the business combination. The use of
different assumptions could produce significantly different valuation results, which could have material positive or negative effects on our results of operations. The Company uses the best estimates and assumptions to value assets acquired and
liabilities assumed, at the acquisition date, and these estimates are subject to refinement.
Goodwill represents the excess of the consideration paid over the fair value of the net assets acquired in a business combination. The Company
assesses goodwill for impairment at the reporting unit level on an annual basis, or more often if an event occurs or circumstances change which indicate there may be impairment. The impairment test compares the estimated fair value of each reporting
unit with its net book value. The Company’s annual assessment date is during the Company’s fourth quarter. When a quantitative assessment is deemed necessary, the fair value of the reporting unit is estimated using valuation techniques that market
participants would use in an acquisition of the reporting unit, such as estimated discounted cash flows, the quoted market price of our common stock adjusted for a control premium, and observable average price-to forward-earnings and price-to-tangible
book multiples of observed transactions. If the unit’s fair value is less than its carrying value, an estimate of the implied fair value of the goodwill is compared to the goodwill’s carrying value and any impairment recognized.
The Company performed a qualitative assessment to determine if it was more likely than not that a reporting unit’s fair value was less than its
carrying value during the fourth quarter of 2024. Based on this qualitative assessment, it was determined that no impairment of goodwill was indicated as of the assessment date and no triggering events were identified, therefore, a quantitative
analysis was not deemed necessary. See Note 8 to the consolidated financial statements for additional information on the Company’s goodwill and intangibles recorded in the periods presented.
ITEM 7A. QUANTITATIVE AND QUALITATIVE DISCLOSURES ABOUT MARKET RISK.
Interest Rate Risk Management
Market risk reflects the risk of economic loss resulting from changes in interest rates and other relevant market prices. This risk of loss can be
reflected in either reduced potential net interest revenue in future periods or diminished market values of financial assets. The Company’s market risk arises primarily from IRR that is inherent in its lending, investment and deposit taking activities.
The main causes of IRR are the differing structural characteristics of our assets, liabilities and off-balance sheet obligations and their
cumulative net reaction to changing interest rates. These structural characteristics include timing differences in maturity or repricing and the effect of embedded options such as loan prepayments, securities prepayments and calls, interest rate caps,
floors, collars, and deposit withdrawal options. In addition to these sources of IRR, basis risk results from differences in the spreads between various market interest rates and changes in the slope of the yield curve can contribute to additional IRR.
We evaluate IRR and develop guidelines regarding balance sheet composition and re-pricing, funding sources and pricing, and off-balance sheet
commitments that aim to moderate IRR. We use financial simulation models that reflect various interest rate scenarios and the related impact on NII and EVE over specified periods of time. NII is a shorter-term indicator while EVE is a longer-term
indicator of IRR. We refer to this process as ALM.
The primary objective of ALM is to manage interest rate risk within a desired risk tolerance for potential fluctuations in NII and EVE throughout
different interest rate cycles, which we aim to achieve through management of interest rate sensitive earning assets and liabilities. In general, we seek to maintain a desired risk tolerance with asset and liability balances within maturity and
repricing characteristics to limit our exposure to acceptable earnings volatility and changes in the value of assets and liabilities as interest rates fluctuate over time. Adjustments to maturity categories can be accomplished either by lengthening or
shortening the duration of an individual asset or liability category, or externally with interest rate derivative contracts, such as interest rate swaps, caps, collars, and floors. See “—Interest Rate Exposure” below for a more detailed discussion of
our various derivative positions.
Our ALM strategy is formulated and monitored by our ALCO in accordance with policies approved by the Board of Directors. ALCO meets regularly to
review, among other things, the sensitivity of our assets and liabilities to interest rate changes, the book and market values of assets and liabilities, unrealized gains and losses, recent purchase and sale activity, maturities of securities and
borrowings, and projected future transactions. ALCO also establishes and approves pricing and funding strategies with respect to overall asset and liability composition. ALCO reports regularly to our Risk Committee of the Board of Directors.
Financial simulation models are the primary tools we use to measure IRR exposures. These simulation models incorporate all of our earning assets
and liabilities. By examining a range of hypothetical deterministic interest rate scenarios, these models provide management with information regarding the potential impact on NII and EVE caused by changes in interest rates.
The models simulate the cash flows and accounting accruals generated by the financial instruments on our balance sheet, as well as the cash flows
generated by the new business that we anticipate over a 60-month forecast horizon. However, past the 36-month mark, the growth of the balances is static in the forecast. Numerous assumptions are made in the modeling process, including balance sheet
composition, re-pricing, a combination of market data and internal historical experiences, and maturity characteristics of existing and new business. These assumptions are reviewed regularly. Additionally, loan and investment prepayments, administered
rate account elasticity, and other option risks are considered as well as the uncertainty surrounding future customer behavior. Because our modeling is limited by the predictive power of historical data and current assumptions, and because our balance
sheet will be actively managed in the event of a change in interest rates, simulation results, including those discussed in “—Interest Rate Exposure” immediately below, are not intended as a forecast of the actual effect of a change in market interest
rates on our NII or EVE, or indicative of management’s expectations of actual results in the event of a fluctuation in market interest rates; however, these results are used to help measure the potential risks related to IRR.
Interest Rate Exposure
Based upon the current interest rate environment at December 31, 2024, our simulation model projects our sensitivity to an instantaneous increase
or decrease in interest rates over a one-year period as follows:
TABLE 34—INTEREST RATE SENSITIVITY
| |
|
Increase (Decrease) |
|
| (Dollars in millions) |
|
Net Interest Income |
|
|
Economic Value of Equity |
|
| Change (in Basis Points) in Interest Rates (12-Month Projection) |
|
Amount |
|
|
Percent |
|
|
Amount |
|
|
Percent |
|
| + 200 BP |
|
$ |
63.0 |
|
|
|
4.0 |
% |
|
$ |
(710.0 |
) |
|
|
(9.0 |
)% |
| + 100 BP |
|
|
32.0 |
|
|
|
2.0 |
|
|
|
(351.0 |
) |
|
|
(4.5 |
) |
| - 100 BP |
|
|
(32.0 |
) |
|
|
(2.1 |
) |
|
|
293.0 |
|
|
|
3.7 |
|
| - 200 BP |
|
|
(70.0 |
) |
|
|
(4.5 |
) |
|
|
501.0 |
|
|
|
6.4 |
|
Both the NII and EVE simulations include assumptions regarding balances, asset prepayment speeds, deposit and borrowings repricing and runoff and
interest rate relationships among balances that management believes to be reasonable for the various interest rate environments. Differences in actual occurrences from these assumptions may change our market risk exposure.
See “Table 15 – Maturity Distribution of AFS Securities” that shows the maturities and weighted average yields for the carrying value of the
available for sale securities as of December 31, 2024, and “Table 18 - Interest Rate Sensitivity of Loans” that shows the maturity distribution based on remaining maturities of the Company’s loan and lease portfolio and the interest rate sensitivity of
the Company’s loans and leases maturing after one year at December 31, 2024.
Derivative Positions
Overview. Our Board of Directors has authorized the ALCO to utilize financial futures, forward sales, options, interest rate swaps,
caps, collars, and floors, and other instruments to the extent appropriate, in accordance with regulations and our internal policy. From time to time, we expect to use interest rate swaps, caps, collars, and floors as macro hedges against inherent rate
sensitivity in our assets and our liabilities to synthetically alter the maturities or re-pricing characteristics of assets or liabilities to reduce imbalances.
We currently engage in only the following types of hedges: (1) those which enable us to transfer the interest rate risk exposure involved in our
daily business activities; and (2) those which serve to alter the market risk inherent in our investment portfolio, mortgage pipeline, mortgage servicing rights, or liabilities and thus help us to manage earnings and market value volatility within
approved risk tolerances.
The following is a discussion of our current derivative positions related to IRR.
Interest Rate Lock Commitments. In the ordinary course of business, the Company enters into certain commitments with customers in
connection with residential mortgage loan applications for loans the Company intends to sell. Such commitments are considered derivatives under current accounting guidance and are required to be recorded at fair value. The change in fair value of these
instruments is reflected currently in the mortgage banking revenue of the consolidated statements of income. The fair value of these derivatives is recorded on the consolidated balance sheets in other assets and other liabilities.
Forward Sales Commitments. The Company enters into forward sales commitments of MBS with investors to mitigate the effect of the interest
rate risk inherent in providing interest rate lock commitments to customers. During the period from commitment date to closing date, the Company is subject to the risk that market rates of interest may change. In an effort to mitigate such risk,
forward delivery sales commitments, under which the Company agrees to deliver certain MBS, are established. These commitments are non-hedging derivatives in accordance with current accounting guidance and recorded at fair value, with changes in fair
value reflected currently in the mortgage banking revenue of the consolidated statements of income. The fair value of these derivatives is recorded on the consolidated balance sheets in other assets and other liabilities.
Mortgage Servicing Right Hedges. The value of our MSR is dependent on changes in market interest rates. In order to mitigate the effects of
changes in rates on the value of our MSR, the Company has used various instruments (including but not limited to Treasury options, Treasury, SOFR and TBA futures and forwards, swap futures, etc.) as economic hedges.
Agreements Not Designated as Hedging Derivatives. The Company enters into interest rate swap, floor, cap and collar agreements on
commercial loans with customers to meet the financing needs and interest rate risk management needs of its customers. At the same time, the Company enters into offsetting interest rate swap agreements with a financial institution in order to minimize
the Company’s interest rate risk. These interest rate agreements are non-hedging derivatives and are recorded at fair value with changes in fair value reflected in noninterest income. The fair value of these derivatives is recorded on the consolidated
balance sheets in other assets and other liabilities.
See Note 20 to the consolidated financial statements for additional information regarding our derivative financial instruments.
ITEM 8. FINANCIAL STATEMENTS AND SUPPLEMENTARY DATA.
MANAGEMENT’S REPORT ON INTERNAL CONTROL OVER FINANCIAL REPORTING
To the Board of Directors of Cadence Bank:
The Company’s management is responsible for establishing and maintaining adequate internal control over financial reporting as defined in Rules
13a-15(f) and 15d-15(f) under the Exchange Act. The Company’s internal control over financial reporting is designed to provide reasonable assurance regarding the reliability of financial reporting and the preparation of financial statements for
external purposes in accordance with U.S. GAAP. The Company’s internal control over financial reporting includes those policies and procedures that:
(i) pertain to the maintenance of records that, in reasonable detail, accurately and fairly reflect the transactions and
dispositions of the assets of the Company;
(ii) provide reasonable assurance that transactions are recorded as necessary to permit preparation of financial statements in
accordance with U.S. GAAP, and that receipts and expenditures of the Company are being made only in accordance with authorizations of management and directors of the Company; and
(iii) provide reasonable assurance regarding prevention or timely detection of unauthorized acquisition, use or disposition of the
Company’s assets that could have a material effect on the financial statements.
Because of its inherent limitations, internal control over financial reporting may not prevent or detect misstatements. Also, projections of any
evaluation of effectiveness to future periods are subject to the risk that controls may become inadequate because of changes in conditions, or that the degree of compliance with the policies or procedures may deteriorate.
Under the supervision and with the participation of management, including the Chief Executive Officer and the Chief Financial Officer, the Company
conducted an assessment of the effectiveness of the Company’s internal control over financial reporting as of December 31, 2024. In making this assessment, management used the criteria set forth by the Committee of Sponsoring Organizations of the
Treadway Commission (COSO) in Internal Control-Integrated Framework (2013). Based on management’s assessment and those criteria, management believes that the Company maintained effective internal control over financial reporting as of December 31,
2024.
The Company’s independent registered public accounting firm has issued a report on the effectiveness of the Company’s internal control over
financial reporting. That report appears on page 95 of this Report.
| Date: |
February 21, 2025 |
|
|
| |
|
/s/ James D. Rollins III |
|
| |
|
James D. Rollins III |
|
| |
|
Chief Executive Officer |
|
| Date: |
February 21, 2025 |
|
|
| |
|
/s/ Valerie C. Toalson |
|
| |
|
Valerie C. Toalson |
|
| |
|
Chief Financial Officer and |
|
| |
|
President - Banking Services |
|
| |
|
(Principal Accounting Officer) |
|
Report of Independent Registered Public Accounting Firm
To the Shareholders, Board of Directors and Audit Committee
Cadence Bank
Tupelo, Mississippi
Opinion on the Internal Control over Financial Reporting
We have audited Cadence Bank’s (the “Company”) internal control over financial reporting as of December 31, 2024, based on criteria established in Internal
Control - Integrated Framework: (2013) issued by the Committee of Sponsoring Organizations of the Treadway Commission (“COSO”). In our opinion, the Company maintained, in all material respects, effective internal control over financial reporting
as of December 31, 2024, based on criteria established in Internal Control - Integrated Framework: (2013) issued by COSO.
We also have audited, in accordance with the standards of the Public Company Accounting Oversight Board (United States) (“PCAOB”), the consolidated financial
statements of the Company as of December 31, 2024 and 2023, and for each of the years in the three-year period ended December 31, 2024, and our report dated February 21, 2025, expressed an unqualified opinion on those financial statements.
Basis for Opinion
The Company’s management is responsible for maintaining effective internal control over financial reporting and for its assessment of the effectiveness of internal
control over financial reporting, included in the accompanying Management’s Report on Internal Control Over Financial Reporting. Our responsibility is to express an opinion on the Company’s internal control over financial reporting based on our
audit.
We are a public accounting firm registered with the PCAOB and are required to be independent with respect to the Company in accordance with the U.S. federal
securities laws and the applicable rules and regulations of the Securities and Exchange Commission and the PCAOB.
We conducted our audit in accordance with the standards of the PCAOB. Those standards require that we plan and perform the audit to obtain reasonable assurance about
whether effective internal control over financial reporting was maintained in all material respects. Our audit included obtaining an understanding of internal control over financial reporting, assessing the risk that a material weakness exists, and
testing and evaluating the design and operating effectiveness of internal control based on the assessed risk. Our audit also included performing such other procedures as we considered necessary in the circumstances. We believe that our audit provides a
reasonable basis for our opinion.
Definitions and Limitations of Internal Control over Financial Reporting
A company’s internal control over financial reporting is a process designed to provide reasonable assurance regarding the reliability of financial reporting and the
preparation of reliable financial statements for external purposes in accordance with generally accepted accounting principles. A company’s internal control over financial reporting includes those policies and procedures that (1) pertain to the
maintenance of records that, in reasonable detail, accurately and fairly reflect the transactions and dispositions of the assets of the company; (2) provide reasonable assurance that transactions are recorded as necessary to permit preparation of
financial statements in accordance with generally accepted accounting principles, and that receipts and expenditures of the company are being made only in accordance with authorizations of management and directors of the company; and (3) provide
reasonable assurance regarding prevention or timely detection of unauthorized acquisition, use, or disposition of the company’s assets that could have a material effect on the financial statements.
Because of its inherent limitations, internal control over financial reporting may not prevent or detect misstatements. Also, projections of any evaluation of
effectiveness to future periods are subject to the risk that controls may become inadequate because of changes in conditions or that the degree of compliance with the policies or procedures may deteriorate.
/s/ Forvis Mazars, LLP
Charlotte, North Carolina
February 21, 2025
Report of Independent Registered Public Accounting Firm
To the Shareholders, Board of Directors and Audit Committee
Cadence Bank
Tupelo, Mississippi
Opinion on the Consolidated Financial Statements
We have audited the accompanying consolidated balance sheets of Cadence Bank and Subsidiaries (the “Company”) as of December 31, 2024 and 2023, the related
consolidated statements of income, comprehensive income (loss), shareholders’ equity, and cash flows for each of the years in the three-year period ended December 31, 2024, and the related notes (collectively referred to as the “financial statements”).
In our opinion, the consolidated financial statements referred to above present fairly, in all material respects, the financial position of the Company as of December 31, 2024 and 2023, and the results of its operations and its cash flows for each of
the years in the three-year period ended December 31, 2024, in conformity with accounting principles generally accepted in the United States of America.
We also have audited, in accordance with the standards of the Public Company Accounting Oversight Board (United States) (“PCAOB”), the Company’s internal control over
financial reporting as of December 31, 2024, based on criteria established in Internal Control – Integrated Framework: (2013) issued by the Committee of Sponsoring Organizations of the Treadway Commission and our report dated February 21, 2025,
expressed an unqualified opinion thereon.
Basis for Opinion
These financial statements are the responsibility of the Company’s management. Our responsibility is to express an opinion on the Company’s financial statements based
on our audits.
We are a public accounting firm registered with the PCAOB and are required to be independent with respect to the Company in accordance with the U.S. federal
securities laws and the applicable rules and regulations of the Securities and Exchange Commission and the PCAOB.
We conducted our audits in accordance with the standards of the PCAOB. Those standards require that we plan and perform the audits to obtain reasonable assurance
about whether the financial statements are free of material misstatement, whether due to error or fraud.
Our audits included performing procedures to assess the risks of material misstatement of the financial statements, whether due to error or fraud, and performing
procedures that respond to those risks. Such procedures include examining, on a test basis, evidence regarding the amounts and disclosures in the financial statements. Our audits also included evaluating the accounting principles used and significant
estimates made by management, as well as evaluating the overall presentation of the financial statements. We believe that our audits provide a reasonable basis for our opinion.
Critical Audit Matters
The critical audit matter communicated below arises from the current-period audit of the financial statements that was communicated or required to be communicated to
the audit committee and that: (1) relate to accounts or disclosures that are material to the financial statements and (2) involved our especially challenging, subjective, or complex judgments. The communication of critical audit matters does not alter
in any way our opinion on the financial statements, taken as a whole, and we are not, by communicating the critical audit matter below, providing separate opinions on the critical audit matter or on the accounts or disclosures to which it relates.
Allowance for Credit Losses
As described in Notes 1, 5 and 6, the Company’s loan portfolio totaled $33.7 billion as of December 31, 2024, and the allowance for credit losses on loans (“ACL”) was
$460.8 million. This represents an estimate of expected losses inherent within the Company’s loan portfolio.
The Company bases its estimates of credit losses on three primary components: (1) estimates of expected losses that exist in various segments of performing loans and
leases over the remaining life of the loan portfolio using a reasonable and supportable economic forecast; (2) specifically identified losses in individually analyzed credits which are collateral dependent; and (3) qualitative factors related to
economic conditions, portfolio concentrations, regulatory policy updates, and other relevant factors that address estimates of expected losses not fully addressed based upon management’s judgment of portfolio conditions. The Company utilizes credit
risk models to estimate the probability of default and loss given default of loans over their remaining life. The product of the probability of default and loss given default derives a base expected loss rate for each loan. The base expected loss rate
is adjusted by way of econometric models that measure the direction and magnitude of change in expected loss rates given a change in forecasted economic variables.
We identified the valuation of the ACL as a critical audit matter. The principal considerations for our determination of the ACL as a critical audit matter includes
the subjectivity and complexity involved in management’s determination of credit loss estimates and assumptions, specifically the determination of weightings applied to the reasonable and supportable forecasts and management’s adjustment in determining
the economic conditions qualitative factor. This required an increased auditor effort, including specialized skill and knowledge, and a high degree of auditor subjectivity in evaluating the estimated credit losses for the loan portfolio.
The primary procedures we performed to address this critical audit matter included:
|
● |
Evaluated and tested the design and operating effectiveness of controls, including those related to technology, over the ACL, including: |
|
◦ |
The completeness and accuracy of inputs into the model used to determine the allowance for credit losses, |
|
◦ |
Management’s review of a reasonable and supportable forecast, |
|
◦ |
Management’s review of the qualitative adjustments to the modeled output, including management’s review of the determination of the economic conditions qualitative adjustment, |
|
● |
Evaluated management’s application of qualitative adjustments to the ACL, including testing the accuracy of the supporting calculation and evaluating whether the qualitative factors, including the economic conditions
qualitative adjustment, appropriately addressed the risks that were not fully accounted for in the quantitative component of the methodology; |
|
● |
Evaluated management’s determination of reasonable and supportable forecast, including testing the application of the forecast and the related scenario weighting, in both the quantitative and qualitative calculation. |
/s/ Forvis Mazars, LLP
We have served as the Company’s auditor since 2019.
Charlotte, North Carolina
February 21, 2025
Consolidated Balance Sheets
Cadence Bank and Subsidiaries
| (In thousands, except share and per share amounts) |
|
December 31, 2024 |
|
|
December 31, 2023 |
|
| ASSETS |
|
|
|
|
|
|
|
|
| Cash and due from banks |
|
$ |
624,884 |
|
|
$ |
798,177 |
|
| Interest bearing deposits with other banks and Federal funds sold |
|
|
1,106,692 |
|
|
|
3,434,088 |
|
| Total cash and cash equivalents |
|
|
1,731,576 |
|
|
|
4,232,265 |
|
| Available for sale securities, at fair value |
|
|
7,293,988 |
|
|
|
8,075,476 |
|
| Loans and leases, net of unearned income |
|
|
33,741,755 |
|
|
|
32,497,022 |
|
| Allowance for credit losses |
|
|
460,793 |
|
|
|
468,034 |
|
| Net loans and leases |
|
|
33,280,962 |
|
|
|
32,028,988 |
|
| Loans held for sale, at fair value |
|
|
244,192 |
|
|
|
186,301 |
|
| Premises and equipment, net |
|
|
783,456 |
|
|
|
802,133 |
|
| Goodwill |
|
|
1,366,923 |
|
|
|
1,367,785 |
|
| Other intangible assets, net |
|
|
83,190 |
|
|
|
100,191 |
|
| Bank-owned life insurance |
|
|
651,838 |
|
|
|
642,840 |
|
| Other assets |
|
|
1,583,065 |
|
|
|
1,498,531 |
|
| TOTAL ASSETS |
|
$ |
47,019,190 |
|
|
$ |
48,934,510 |
|
| LIABILITIES |
|
|
|
|
|
|
|
|
| Noninterest bearing demand deposits |
|
$ |
8,591,805 |
|
|
$ |
9,232,068 |
|
| Interest bearing demand and money market deposits |
|
|
19,345,114 |
|
|
|
19,276,596 |
|
| Savings |
|
|
2,588,406 |
|
|
|
2,720,913 |
|
| Time deposits |
|
|
9,970,876 |
|
|
|
7,267,560 |
|
| Total deposits |
|
|
40,496,201 |
|
|
|
38,497,137 |
|
| Securities sold under agreement to repurchase |
|
|
23,616 |
|
|
|
451,516 |
|
| Short-term BTFP borrowings |
|
|
— |
|
|
|
3,500,000 |
|
| Subordinated and long-term borrowings |
|
|
10,706 |
|
|
|
438,460 |
|
| Other liabilities |
|
|
918,984 |
|
|
|
879,554 |
|
| TOTAL LIABILITIES |
|
|
41,449,507 |
|
|
|
43,766,667 |
|
| SHAREHOLDERS’ EQUITY |
|
|
|
|
|
|
|
|
| Series A Non-Cumulative Perpetual Preferred stock, $0.01 par value per share; authorized - 500,000,000 shares; issued and outstanding - 6,900,000 shares for both periods presented |
|
|
166,993 |
|
|
|
166,993 |
|
| Common stock, $2.50 par value per share; authorized - 500,000,000 shares; issued and outstanding - 183,527,575 and 182,871,775 shares, respectively |
|
|
458,819 |
|
|
|
457,179 |
|
| Capital surplus |
|
|
2,742,913 |
|
|
|
2,743,066 |
|
| Accumulated other comprehensive loss |
|
|
(694,495 |
) |
|
|
(761,829 |
) |
| Retained earnings |
|
|
2,895,453 |
|
|
|
2,562,434 |
|
| TOTAL SHAREHOLDERS’ EQUITY |
|
|
5,569,683 |
|
|
|
5,167,843 |
|
| TOTAL LIABILITIES AND SHAREHOLDERS’ EQUITY |
|
$ |
47,019,190 |
|
|
$ |
48,934,510 |
|
See accompanying notes to the consolidated financial statements.
Consolidated Statements of Income
Cadence Bank and Subsidiaries
| |
|
Year Ended December 31, |
|
| (In thousands, except per share amounts) |
|
2024 |
|
|
2023 |
|
|
2022 |
|
| INTEREST REVENUE: |
|
|
|
|
|
|
|
|
|
|
|
|
| Loans and leases |
|
$ |
2,164,633 |
|
|
$ |
2,004,812 |
|
|
$ |
1,342,662 |
|
| Available for sale securities: |
|
|
|
|
|
|
|
|
|
|
|
|
| Taxable |
|
|
243,466 |
|
|
|
208,122 |
|
|
|
183,915 |
|
| Tax-exempt |
|
|
2,598 |
|
|
|
9,206 |
|
|
|
10,079 |
|
| Loans held for sale |
|
|
6,161 |
|
|
|
4,450 |
|
|
|
7,554 |
|
| Short-term investments |
|
|
130,499 |
|
|
|
83,577 |
|
|
|
16,371 |
|
| Total interest revenue |
|
|
2,547,357 |
|
|
|
2,310,167 |
|
|
|
1,560,581 |
|
| INTEREST EXPENSE: |
|
|
|
|
|
|
|
|
|
|
|
|
| Interest bearing demand deposits and money market accounts |
|
|
573,826 |
|
|
|
472,723 |
|
|
|
109,893 |
|
| Savings |
|
|
14,922 |
|
|
|
14,955 |
|
|
|
5,519 |
|
| Time deposits |
|
|
368,572 |
|
|
|
246,476 |
|
|
|
24,253 |
|
| Federal funds purchased and securities sold under agreement to repurchase |
|
|
4,101 |
|
|
|
32,581 |
|
|
|
13,432 |
|
| Short-term debt |
|
|
136,434 |
|
|
|
172,940 |
|
|
|
36,863 |
|
| Subordinated and long-term debt |
|
|
13,287 |
|
|
|
19,136 |
|
|
|
19,330 |
|
| Total interest expense |
|
|
1,111,142 |
|
|
|
958,811 |
|
|
|
209,290 |
|
| Net interest revenue |
|
|
1,436,215 |
|
|
|
1,351,356 |
|
|
|
1,351,291 |
|
| Provision for credit losses |
|
|
71,000 |
|
|
|
80,000 |
|
|
|
7,000 |
|
| Net interest revenue, after provision for credit losses |
|
|
1,365,215 |
|
|
|
1,271,356 |
|
|
|
1,344,291 |
|
| NONINTEREST REVENUE: |
|
|
|
|
|
|
|
|
|
|
|
|
| Wealth management |
|
|
94,922 |
|
|
|
86,928 |
|
|
|
80,486 |
|
| Deposit service charges |
|
|
73,497 |
|
|
|
61,718 |
|
|
|
73,478 |
|
| Credit card, debit card and merchant fees |
|
|
50,245 |
|
|
|
49,784 |
|
|
|
58,160 |
|
| Mortgage banking |
|
|
17,303 |
|
|
|
18,978 |
|
|
|
44,860 |
|
| Security losses, net |
|
|
(2,962 |
) |
|
|
(435,652 |
) |
|
|
(384 |
) |
| Other |
|
|
123,505 |
|
|
|
101,901 |
|
|
|
85,885 |
|
| Total noninterest revenue |
|
|
356,510 |
|
|
|
(116,343 |
) |
|
|
342,485 |
|
| NONINTEREST EXPENSE: |
|
|
|
|
|
|
|
|
|
|
|
|
| Salaries and employee benefits |
|
|
609,307 |
|
|
|
634,722 |
|
|
|
634,843 |
|
| Occupancy and equipment |
|
|
114,175 |
|
|
|
110,972 |
|
|
|
114,460 |
|
| Data processing and software |
|
|
121,884 |
|
|
|
120,443 |
|
|
|
111,107 |
|
| Deposit insurance assessments |
|
|
39,922 |
|
|
|
72,224 |
|
|
|
18,712 |
|
| Amortization of intangibles |
|
|
15,902 |
|
|
|
19,388 |
|
|
|
18,432 |
|
| Pension settlement expense |
|
|
— |
|
|
|
11,826 |
|
|
|
9,023 |
|
| Merger expense |
|
|
— |
|
|
|
5,192 |
|
|
|
50,845 |
|
| Other |
|
|
144,338 |
|
|
|
181,156 |
|
|
|
152,332 |
|
| Total noninterest expense |
|
|
1,045,528 |
|
|
|
1,155,923 |
|
|
|
1,109,754 |
|
| Income (loss) from continuing operations before income taxes |
|
|
676,197 |
|
|
|
(910 |
) |
|
|
577,022 |
|
| Income tax expense (benefit) |
|
|
152,593 |
|
|
|
(4,594 |
) |
|
|
129,705 |
|
| Income from continuing operations |
|
$ |
523,604 |
|
|
$ |
3,684 |
|
|
$ |
447,317 |
|
| Income from discontinued operations before income taxes |
|
|
— |
|
|
|
727,591 |
|
|
|
22,353 |
|
| Income tax expense from discontinued operations |
|
|
— |
|
|
|
188,971 |
|
|
|
6,433 |
|
| Income from discontinued operations, net of income taxes |
|
|
— |
|
|
|
538,620 |
|
|
|
15,920 |
|
| Net income |
|
|
523,604 |
|
|
|
542,304 |
|
|
|
463,237 |
|
| Less: preferred dividends |
|
|
9,488 |
|
|
|
9,488 |
|
|
|
9,488 |
|
| Net income available to common shareholders |
|
$ |
514,116 |
|
|
$ |
532,816 |
|
|
$ |
453,749 |
|
| Basic earnings (loss) per common share from continuing operations |
|
$ |
2.81 |
|
|
$ |
(0.03 |
) |
|
$ |
2.39 |
|
| Basic earnings per common share |
|
$ |
2.81 |
|
|
$ |
2.92 |
|
|
$ |
2.47 |
|
| Diluted earnings (loss) per common share from continuing operations |
|
$ |
2.77 |
|
|
$ |
(0.03 |
) |
|
$ |
2.37 |
|
| Diluted earnings per common share |
|
$ |
2.77 |
|
|
$ |
2.92 |
|
|
$ |
2.46 |
|
See accompanying notes to the consolidated financial statements.
Consolidated Statements of Comprehensive Income (Loss)
Cadence Bank and Subsidiaries
| |
|
Year Ended December 31, |
|
| (In thousands) |
|
2024 |
|
|
2023 |
|
|
2022 |
|
| Net income |
|
$ |
523,604 |
|
|
$ |
542,304 |
|
|
$ |
463,237 |
|
| Other comprehensive income (loss), net of tax: |
|
|
|
|
|
|
|
|
|
|
|
|
| Unrealized gains (losses) on AFS securities: |
|
|
|
|
|
|
|
|
|
|
|
|
| Net unrealized gains (losses), net of income taxes of $(21,118), $(243,832), and $337,781 |
|
|
68,286 |
|
|
|
788,474 |
|
|
|
(1,096,614 |
) |
| Reclassification adjustment for net losses realized in net income, net of income taxes of $700, $102,901, and $91 |
|
|
(2,262 |
) |
|
|
(332,751 |
) |
|
|
(293 |
) |
| Net change in unrealized gains (losses) on AFS securities, net of tax |
|
|
66,024 |
|
|
|
455,723 |
|
|
|
(1,096,907 |
) |
| Recognized employee benefit plan net periodic benefit cost, net of income taxes of $(405), $(1,542), and $(4,248) |
|
|
1,310 |
|
|
|
4,986 |
|
|
|
13,738 |
|
| Other comprehensive income (loss), net of tax |
|
|
67,334 |
|
|
|
460,709 |
|
|
|
(1,083,169 |
) |
| Comprehensive income (loss) |
|
$ |
590,938 |
|
|
$ |
1,003,013 |
|
|
$ |
(619,932 |
) |
See accompanying notes to the consolidated financial statements.
Consolidated Statements of Shareholders’ Equity
Cadence Bank and Subsidiaries
| |
|
Preferred Stock |
|
|
Common Stock |
|
|
Capital |
|
|
Accumulated
Other
Comprehensive |
|
|
Retained |
|
|
Total
Shareholders’ |
|
| (In thousands, except share and per share amounts) |
|
Shares |
|
|
Amount |
|
|
Shares |
|
|
Amount |
|
|
Surplus
|
|
|
(Loss) Income |
|
|
Earnings
|
|
|
Equity |
|
| Balance at December 31, 2021 |
|
|
6,900,000 |
|
|
$ |
166,993 |
|
|
|
188,337,658 |
|
|
$ |
470,844 |
|
|
$ |
2,841,998 |
|
|
$ |
(139,369 |
) |
|
$ |
1,907,521 |
|
|
$ |
5,247,987 |
|
| Net income |
|
|
— |
|
|
|
— |
|
|
|
— |
|
|
|
— |
|
|
|
— |
|
|
|
— |
|
|
|
463,237 |
|
|
|
463,237 |
|
| Other comprehensive loss, net of tax |
|
|
— |
|
|
|
— |
|
|
|
— |
|
|
|
— |
|
|
|
— |
|
|
|
(1,083,169 |
) |
|
|
— |
|
|
|
(1,083,169 |
) |
| Equity based compensation, net of forfeitures and shares withheld to cover taxes |
|
|
— |
|
|
|
— |
|
|
|
242,313 |
|
|
|
606 |
|
|
|
35,620 |
|
|
|
— |
|
|
|
— |
|
|
|
36,226 |
|
| Repurchase of stock |
|
|
— |
|
|
|
— |
|
|
|
(6,142,706 |
) |
|
|
(15,357 |
) |
|
|
(168,227 |
) |
|
|
— |
|
|
|
— |
|
|
|
(183,584 |
) |
| Preferred dividends declared, $1.38 per share |
|
|
— |
|
|
|
— |
|
|
|
— |
|
|
|
— |
|
|
|
— |
|
|
|
— |
|
|
|
(9,488 |
) |
|
|
(9,488 |
) |
| Cash dividends declared, $0.88 per share |
|
|
— |
|
|
|
— |
|
|
|
— |
|
|
|
— |
|
|
|
— |
|
|
|
— |
|
|
|
(159,835 |
) |
|
|
(159,835 |
) |
| Balance at December 31, 2022 |
|
|
6,900,000 |
|
|
$ |
166,993 |
|
|
|
182,437,265 |
|
|
$ |
456,093 |
|
|
$ |
2,709,391 |
|
|
$ |
(1,222,538 |
) |
|
$ |
2,201,435 |
|
|
$ |
4,311,374 |
|
| Net income |
|
|
— |
|
|
|
— |
|
|
|
— |
|
|
|
— |
|
|
|
— |
|
|
|
— |
|
|
|
542,304 |
|
|
|
542,304 |
|
| Other comprehensive income, net of tax |
|
|
— |
|
|
|
— |
|
|
|
— |
|
|
|
— |
|
|
|
— |
|
|
|
460,709 |
|
|
|
— |
|
|
|
460,709 |
|
| Equity based compensation, net of forfeitures and shares withheld to cover taxes |
|
|
— |
|
|
|
— |
|
|
|
334,910 |
|
|
|
837 |
|
|
|
30,188 |
|
|
|
— |
|
|
|
— |
|
|
|
31,025 |
|
| Exercise of stock options |
|
|
— |
|
|
|
— |
|
|
|
226,705 |
|
|
|
567 |
|
|
|
5,579 |
|
|
|
— |
|
|
|
— |
|
|
|
6,146 |
|
| Repurchase of stock, net of excise tax |
|
|
— |
|
|
|
— |
|
|
|
(127,105 |
) |
|
|
(318 |
) |
|
|
(2,092 |
) |
|
|
— |
|
|
|
— |
|
|
|
(2,410 |
) |
| Preferred dividends declared, $1.38 per share |
|
|
— |
|
|
|
— |
|
|
|
— |
|
|
|
— |
|
|
|
— |
|
|
|
— |
|
|
|
(9,488 |
) |
|
|
(9,488 |
) |
| Cash dividends declared, $0.94 per share |
|
|
— |
|
|
|
— |
|
|
|
— |
|
|
|
— |
|
|
|
— |
|
|
|
— |
|
|
|
(171,622 |
) |
|
|
(171,622 |
) |
| Cumulative effect of change in accounting principle, net of tax, for ASU 2022-02 |
|
|
— |
|
|
|
— |
|
|
|
— |
|
|
|
— |
|
|
|
— |
|
|
|
— |
|
|
|
(195 |
) |
|
|
(195 |
) |
| Balance at December 31, 2023 |
|
|
6,900,000 |
|
|
$ |
166,993 |
|
|
|
182,871,775 |
|
|
$ |
457,179 |
|
|
$ |
2,743,066 |
|
|
$ |
(761,829 |
) |
|
$ |
2,562,434 |
|
|
$ |
5,167,843 |
|
| Net income |
|
|
— |
|
|
|
— |
|
|
|
— |
|
|
|
— |
|
|
|
— |
|
|
|
— |
|
|
|
523,604 |
|
|
|
523,604 |
|
| Other comprehensive income, net of tax |
|
|
— |
|
|
|
— |
|
|
|
— |
|
|
|
— |
|
|
|
— |
|
|
|
67,334 |
|
|
|
— |
|
|
|
67,334 |
|
| Equity based compensation, net of forfeitures and shares withheld to cover taxes |
|
|
— |
|
|
|
— |
|
|
|
1,076,811 |
|
|
|
2,693 |
|
|
|
9,646 |
|
|
|
— |
|
|
|
— |
|
|
|
12,339 |
|
| Exercise of stock options |
|
|
— |
|
|
|
— |
|
|
|
895,289 |
|
|
|
2,238 |
|
|
|
22,353 |
|
|
|
— |
|
|
|
— |
|
|
|
24,591 |
|
| Repurchase of stock, net of excise tax |
|
|
— |
|
|
|
— |
|
|
|
(1,316,300 |
) |
|
|
(3,291 |
) |
|
|
(32,152 |
) |
|
|
— |
|
|
|
— |
|
|
|
(35,443 |
) |
| Preferred dividends declared, $1.38 per share |
|
|
— |
|
|
|
— |
|
|
|
— |
|
|
|
— |
|
|
|
— |
|
|
|
— |
|
|
|
(9,488 |
) |
|
|
(9,488 |
) |
| Cash dividends declared, $1.00 per share |
|
|
— |
|
|
|
— |
|
|
|
— |
|
|
|
— |
|
|
|
— |
|
|
|
— |
|
|
|
(182,637 |
) |
|
|
(182,637 |
) |
| Cumulative effect of change in accounting principle, net of tax, for ASU 2023-02 |
|
|
— |
|
|
|
— |
|
|
|
— |
|
|
|
— |
|
|
|
— |
|
|
|
— |
|
|
|
1,540 |
|
|
|
1,540 |
|
| Balance at December 31, 2024 |
|
|
6,900,000 |
|
|
$ |
166,993 |
|
|
|
183,527,575 |
|
|
$ |
458,819 |
|
|
$ |
2,742,913 |
|
|
$ |
(694,495 |
) |
|
$ |
2,895,453 |
|
|
$ |
5,569,683 |
|
See accompanying notes to the consolidated financial statements.
Consolidated Statements of Cash Flows
Cadence Bank and Subsidiaries
| |
|
Year Ended December 31, |
|
| (In thousands) |
|
2024 |
|
|
2023 |
|
|
2022 |
|
| Operating Activities: |
|
|
|
|
|
|
|
|
|
|
|
|
| Net income |
|
$ |
523,604 |
|
|
$ |
542,304 |
|
|
$
|
463,237 |
|
| Adjustments to reconcile net income to net cash provided by operations: |
|
|
|
|
|
|
|
|
|
|
|
|
| Depreciation, amortization, and accretion |
|
|
202,566 |
|
|
|
238,607 |
|
|
|
255,821 |
|
| Deferred income tax expense |
|
|
8,219 |
|
|
|
892 |
|
|
|
7,822 |
|
| Provision for credit losses |
|
|
71,000 |
|
|
|
80,000 |
|
|
|
7,000 |
|
| Gain on sale of loans, net |
|
|
(21,351 |
) |
|
|
(17,033 |
) |
|
|
(46,083 |
) |
| Gain on disposition of businesses |
|
|
(14,980 |
) |
|
|
(706,588 |
) |
|
|
— |
|
| Loss on sales of available for sale securities, net |
|
|
2,962 |
|
|
|
435,652 |
|
|
|
384 |
|
| Unrealized gain on limited partnerships, net |
|
|
(11,003 |
) |
|
|
(8,024 |
) |
|
|
(8,169 |
) |
| Share-based compensation expense |
|
|
32,710 |
|
|
|
39,983 |
|
|
|
36,877 |
|
| Proceeds from payments and sales of loans held for sale |
|
|
1,234,521 |
|
|
|
1,292,365 |
|
|
|
2,093,204 |
|
| Origination of loans held for sale |
|
|
(1,224,983 |
) |
|
|
(1,333,522 |
) |
|
|
(1,965,956 |
) |
| Decrease (increase) in accrued interest receivable |
|
|
2,010 |
|
|
|
(15,247 |
) |
|
|
(41,193 |
) |
| Increase in accrued interest payable |
|
|
10,171 |
|
|
|
73,149 |
|
|
|
19,050 |
|
| Net (increase) decrease in prepaid pension asset |
|
|
(4,619 |
) |
|
|
5,073 |
|
|
|
(5,037 |
) |
| Decrease (increase) in other assets |
|
|
39,145 |
|
|
|
(56,172 |
) |
|
|
20,567 |
|
| Increase in other liabilities |
|
|
22,016 |
|
|
|
4,394 |
|
|
|
75,360 |
|
| Other, net |
|
|
(15,326 |
) |
|
|
(12,327 |
) |
|
|
15,031 |
|
| Net cash provided by operating activities |
|
|
856,662 |
|
|
|
563,506 |
|
|
|
927,915 |
|
| Investing Activities: |
|
|
|
|
|
|
|
|
|
|
|
|
| Proceeds from disposition of business, net of cash transferred |
|
|
15,308 |
|
|
|
861,364 |
|
|
|
— |
|
| Purchases of available for sale securities |
|
|
(751,846 |
) |
|
|
(2,333,245 |
) |
|
|
(787,318 |
) |
| Proceeds from sales of available for sale securities |
|
|
15,059 |
|
|
|
4,294,947 |
|
|
|
369,614 |
|
| Proceeds from maturities, calls, and payments of available for sale securities |
|
|
1,576,542 |
|
|
|
2,021,799 |
|
|
|
2,569,336 |
|
| (Purchases) sales of FRB and FHLB stock, net |
|
|
(97,864 |
) |
|
|
121,243 |
|
|
|
(131,055 |
) |
| Increase in loans, net |
|
|
(1,486,004 |
) |
|
|
(2,333,391 |
) |
|
|
(3,630,970 |
) |
| Purchases of premises and equipment |
|
|
(80,074 |
) |
|
|
(98,283 |
) |
|
|
(94,499 |
) |
| Proceeds from sales of premises and equipment |
|
|
35,680 |
|
|
|
17,078 |
|
|
|
9,887 |
|
| Proceeds from disposition of foreclosed and repossessed property |
|
|
8,092 |
|
|
|
8,269 |
|
|
|
23,392 |
|
| Acquisition of businesses, net of cash paid |
|
|
— |
|
|
|
— |
|
|
|
(11,511 |
) |
| Proceeds from sales of loans transferred to held for sale |
|
|
60,578 |
|
|
|
26,153 |
|
|
|
64,580 |
|
| Net death benefits received on (purchases of) bank owned life insurance |
|
|
6,016 |
|
|
|
33 |
|
|
|
(17,564 |
) |
| Purchases of tax credit investments |
|
|
(71,703 |
) |
|
|
(83,813 |
) |
|
|
(66,637 |
) |
| Purchases of limited partnership interests |
|
|
(28,102 |
) |
|
|
(26,980 |
) |
|
|
(30,298 |
) |
| Other, net |
|
|
16,160 |
|
|
|
(79,126 |
) |
|
|
19,967 |
|
| Net cash (used in) provided by investing activities |
|
|
(782,158 |
) |
|
|
2,396,048 |
|
|
|
(1,713,076 |
) |
Consolidated Statements of Cash Flows (continued)
Cadence Bank and Subsidiaries
| |
|
Year Ended December 31, |
|
| (In thousands) |
|
2024 |
|
|
2023 |
|
|
2022 |
|
| Financing Activities: |
|
|
|
|
|
|
|
|
|
|
|
|
| Increase (decrease) in deposits, net |
|
|
1,999,373 |
|
|
|
(459,654 |
) |
|
|
(863,976 |
) |
| Net change in securities sold under agreement to repurchase and federal funds purchased |
|
|
(427,900 |
) |
|
|
(457,220 |
) |
|
|
(373,452 |
) |
| Net change in BTFP borrowings and short-term FHLB advances |
|
|
(3,500,000 |
) |
|
|
399,769 |
|
|
|
3,100,231 |
|
| Long-term borrowings called, repurchased, and repaid |
|
|
(422,560 |
) |
|
|
(22,536 |
) |
|
|
(17,844 |
) |
| Exercise of stock options |
|
|
24,591 |
|
|
|
6,146 |
|
|
|
— |
|
| Repurchase of common stock |
|
|
(35,443 |
) |
|
|
(2,410 |
) |
|
|
(183,584 |
) |
| Cash dividends paid on common stock |
|
|
(182,639 |
) |
|
|
(171,791 |
) |
|
|
(160,777 |
) |
| Cash dividends paid on preferred stock |
|
|
(9,488 |
) |
|
|
(9,488 |
) |
|
|
(9,488 |
) |
| Cash paid for tax withholding on vested share-based compensation and other |
|
|
(21,127 |
) |
|
|
(7,608 |
) |
|
|
(4,869 |
) |
| Other, net |
|
|
— |
|
|
|
1,744 |
|
|
|
— |
|
| Net cash (used in) provided by financing activities |
|
|
(2,575,193 |
) |
|
|
(723,048 |
) |
|
|
1,486,241 |
|
| Net (decrease) increase in cash and cash equivalents |
|
|
(2,500,689 |
) |
|
|
2,236,506 |
|
|
|
701,080 |
|
| Cash and cash equivalents at beginning of period |
|
|
4,232,265 |
|
|
|
1,995,759 |
|
|
|
1,294,679 |
|
| Cash and cash equivalents at end of period |
|
$ |
1,731,576 |
|
|
$ |
4,232,265 |
|
|
$ |
1,995,759 |
|
Supplemental Cash Flow Disclosures
Cadence Bank and Subsidiaries
| |
|
Year Ended December 31, |
|
| (In thousands) |
|
2024 |
|
|
2023 |
|
|
2022 |
|
| Supplemental Disclosures |
|
|
|
|
|
|
|
|
|
|
|
|
| Cash paid during the period for: |
|
|
|
|
|
|
|
|
|
|
|
|
| Interest |
|
$ |
1,100,972 |
|
|
$ |
885,661 |
|
|
$ |
190,241 |
|
| Income taxes, net of refunds |
|
|
115,078 |
|
|
|
163,452 |
|
|
|
72,445 |
|
| Cash paid for amounts included in lease liabilities |
|
|
17,812 |
|
|
|
20,262 |
|
|
|
22,221 |
|
| Non-cash investing activities, at fair value: |
|
|
|
|
|
|
|
|
|
|
|
|
| Acquisition of real estate and other assets in settlement of loans |
|
|
7,917 |
|
|
|
7,531 |
|
|
|
4,337 |
|
| Transfers of loans held for sale to loans |
|
|
8,123 |
|
|
|
45,307 |
|
|
|
1,624 |
|
| Transfers of loans to loans held for sale |
|
|
102,202 |
|
|
|
26,083 |
|
|
|
23,533 |
|
| Right of use assets obtained (reduced) in exchange for new operating lease liabilities |
|
|
7,433 |
|
|
|
(657 |
) |
|
|
28,663 |
|
| Increase in funding obligations for certain tax credit investments |
|
|
60,093 |
|
|
|
152,222 |
|
|
|
83,765 |
|
See accompanying notes to consolidated financial statements.
Notes to Consolidated Financial Statements
Cadence Bank and Subsidiaries
NOTE 1. SUMMARY OF SIGNIFICANT ACCOUNTING POLICIES
Basis of Presentation and Consolidation
The Company is a regional bank with dual headquarters in Houston, Texas and Tupelo, Mississippi with $47.0 billion in total assets at December 31,
2024. The Company has commercial banking operations in Alabama, Arkansas, Florida, Georgia, Louisiana, Mississippi, Missouri, Tennessee, and Texas. The Company and its subsidiaries provide commercial banking, leasing, mortgage origination and
servicing, brokerage, trust, and investment advisory services to corporate customers, local governments, individuals, and other financial institutions through an extensive network of branches and offices.
The Company and its subsidiaries follow GAAP, including, where applicable, general practices within the banking industry. The consolidated
financial statements include the accounts of the Company and its subsidiaries. Significant intercompany accounts and transactions have been eliminated in consolidation. The assessment of whether or not the Company has a controlling interest (i.e., the
primary beneficiary) in a VIE is performed on an on-going basis. All equity investments in non-consolidated VIEs are included in “other assets” in the Company’s consolidated balance sheets (see Note 23 for more information).
Effective May 17, 2024, the Company completed the sale of Cadence Business Solutions, LLC, its payroll processing business unit, resulting in a
net gain on sale of approximately $12.0 million. The gain on sale was included in Other noninterest revenue within the accompanying consolidated statements of income.
Certain amounts reported in prior years have been reclassified to conform to the 2024 presentation. These reclassifications did not materially
impact the Company’s consolidated financial statements.
In accordance with GAAP, the Company’s management evaluated subsequent events for potential recognition or disclosure in the consolidated
financial statements through the date of the issuance of the consolidated financial statements.
Discontinued Operations
On October 24, 2023, the Company entered into the Stock Purchase Agreement regarding the sale of Cadence Insurance to Arthur J. Gallagher Risk
Management Services, LLC and Arthur J. Gallagher & Co pursuant to which the Company agreed to sell all of the issued and outstanding shares of capital stock of Cadence Insurance to Gallagher for a purchase price of $904.0 million in cash, subject
to customary purchase price adjustments. The transaction closed on November 30, 2023. Cadence Insurance’s operating results have been presented as “discontinued operations” within the accompanying consolidated statements of income. Cash flows from both
continuing and discontinued operations are included in the consolidated statements of cash flows. There was no activity from these discontinued operations in 2024. See Note 2 and Note 19 for further discussion.
Nature of Operations
The Company operates under a state bank charter and is subject to regulation by the Federal Reserve Bank of St. Louis. The Company is a regional
banking franchise with more than 350 branch locations across the South, Midwest and Texas. Services and products include consumer banking, consumer loans, mortgages, home equity lines and loans, credit cards, commercial and business banking, treasury
management, specialized lending, asset-based lending, commercial real estate, equipment financing, correspondent banking, SBA lending, foreign exchange, wealth management, investment and trust services, financial planning, and retirement plan
management.
Use of Estimates
The preparation of financial statements in conformity with GAAP requires management to make estimates and assumptions that affect the reported
amounts of assets and liabilities and disclosure of contingent assets and liabilities at the date of the financial statements and the reported amounts of revenues and expenses during the reporting period. Actual results could differ from those
estimates. Material estimates that are susceptible to significant change in the near term are the ACL, valuation of goodwill, intangible assets, and deferred income taxes.
Securities
AFS Securities
Securities classified as AFS are those debt securities that are intended to be held for an indefinite period of time, but not necessarily to
maturity. Any decision to sell a security classified as AFS would be based on various factors, including movements in interest rates, liquidity needs, security risk assessments, changes in the mix of assets and liabilities and other similar factors.
These securities are carried at their estimated fair value, and the net unrealized gain or loss is reported as AOCI, net of tax, until realized upon sale. Premiums and discounts are recognized in interest income using the effective interest method.
Realized gains and losses on the sale of securities AFS are determined by specific identification using the cost on a trade date basis and are
included in securities (losses) gains, net in the Company’s consolidated statements of income.
The Company evaluates available for sale securities in an unrealized loss position to determine whether the decline in the fair value below the
amortized cost basis (impairment) is due to credit-related factors or noncredit-related factors. Any impairment that is not credit related is recognized in other comprehensive income, net of applicable taxes. Credit-related impairment is recognized as
an ACL on the balance sheet, limited to the amount by which the amortized cost basis exceeds the fair value with a charge to earnings. In evaluating available for sale securities in unrealized loss positions for impairment, management considers the
magnitude and duration of the decline, as well as the reasons for the decline, whether the securities are issued by the federal government or its agencies, whether downgrades by bond rating agencies have occurred, whether the Company would be required
to sell the securities before a full recovery of costs and the results of reviews of the issuers’ financial condition, among other facts. See Note 3 for additional information on AFS securities.
Held-to-Maturity Securities
Securities classified as held-to-maturity are those debt securities for which there is a positive intent and ability to hold to maturity. These
securities are carried at cost, adjusted for amortization of premium and accretion of discount, computed by the effective interest method. At December 31, 2024 and 2023, the Company did not have any held-to-maturity securities.
Trading Account Securities
Trading account securities are securities that are held for the purpose of selling them at a profit. The Company had no trading account securities
at December 31, 2024 and 2023.
Securities Purchased and Sold Under Agreements to Resell or Repurchase
Securities purchased under agreements to resell are accounted for as short-term investments and securities sold under agreements to repurchase are
accounted for as collateralized financing transactions and are recorded at the amounts at which the securities were acquired or sold plus accrued interest. The securities pledged as collateral are generally U.S. government and federal agency
securities.
FHLB Stock
The Company has ownership in FHLB of Dallas stock which does not have readily determinable fair value and no quoted market value, as ownership is
restricted to member institutions, and all transactions take place at par value with the FHLB as the only purchaser. Therefore, the Company accounts for this investment as a long-term asset and carries it at cost. Management’s determination as to
whether this investment is impaired is based on management’s assessment of the ultimate recoverability of the par value (cost) rather than recognizing temporary declines in fair value. Investment in FHLB stock is required for membership in the FHLB
system and in relation to the level of FHLB advances. FHLB stock is included in other assets in the accompanying consolidated balance sheets.
FRB Stock
In November 2024, the Company became a member of the Federal Reserve System. As a member bank, Cadence is required to purchase and hold shares of
capital stock in the Federal Reserve Bank of St. Louis. The capital stock has no readily determinable fair value and no quoted market value since ownership is restricted to member institutions. Therefore, the capital stock is carried at cost.
Impairment is based on management’s assessment on the recoverability of the cost rather than recognizing temporary declines in fair value. FRB stock is included in other assets in the accompanying consolidated balance sheets.
Derivative Financial Instruments and Hedging Activities
Derivative instruments are accounted for under the requirements of ASC Topic 815, Derivatives and Hedging. ASC 815 requires companies to
recognize derivative instruments as either assets or liabilities in the consolidated balance sheets at fair value. The fair value of derivative positions outstanding is included in other assets and other liabilities in the accompanying consolidated
balance sheets and in the net change in each of these financial statement line items in the accompanying consolidated statements of cash flows. The Company does not speculate using derivative instruments. See Note 20 for further discussion and details
of derivative financial instruments and hedging activities.
Interest Rate Lock Commitments
In the ordinary course of business, the Company enters into certain commitments with customers in connection with residential mortgage loan
applications for loans the Company intends to sell. Such commitments are considered derivatives under current accounting guidance and are required to be recorded at fair value. The change in fair value of these instruments is reflected currently in the
mortgage banking revenue of the consolidated statements of income. The fair value of these derivatives is recorded on the consolidated balance sheets in other assets and other liabilities.
Forward Sales Commitments
The Company enters into forward sales commitments of MBS with investors to mitigate the effect of the interest rate risk inherent in providing
interest rate lock commitments to customers. During the period from commitment date to closing date, the Company is subject to the risk that market rates of interest may change. In an effort to mitigate such risk, forward delivery sales commitments,
under which the Company agrees to deliver certain MBS, are established. These commitments are non-hedging derivatives in accordance with current accounting guidance and recorded at fair value, with changes in fair value reflected currently in the
mortgage banking revenue of the consolidated statements of income. The fair value of these derivatives is recorded on the consolidated balance sheets in other assets and other liabilities.
Agreements Not Designated as Hedging Derivatives
The Company enters into interest rate swap, floor, cap and collar agreements on commercial loans with customers to meet the financing needs and
interest rate risk management needs of its customers. At the same time, the Company enters into offsetting interest rate swap agreements with a financial institution in order to minimize the Company’s interest rate risk. These interest rate agreements
are non-hedging derivatives and are recorded at fair value with changes in fair value reflected in noninterest income. The fair value of these derivatives is recorded on the consolidated balance sheets in other assets and other liabilities.
Foreign Currency Contracts
The Company enters into certain foreign currency exchange contracts on behalf of its clients to facilitate their risk management strategies, while
at the same time entering into offsetting foreign currency exchange contracts with another counterparty in order to minimize the Company’s foreign currency exchange risk. The contracts are short term in nature, and any gain or loss incurred at
settlement is recorded as other noninterest income. The fair value of these contracts is reported in other assets and other liabilities. The Company does not apply hedge accounting to these contracts.
Risk Participation Agreements
Cadence has both bought and sold credit protection in the form of participations on interest rate swaps (swap participations). These swap
participations, which meet the definition of credit derivatives, were entered into in the ordinary course of business to serve the credit needs of customers. Swap participations, whereby Cadence has purchased credit protection, entitle Cadence to
receive a payment from the counterparty if the customer fails to make payment on any amounts due to Cadence upon early termination of the swap transaction. For contracts where Cadence sold credit protection, Cadence would be required to make payment to
the counterparty if the customer fails to make payment on any amounts due to the counterparty upon early termination of the swap transaction.
Mortgage Servicing Right Hedges
The value of our MSR is dependent on changes in market interest rates. In order to mitigate the effects of changes in rate on the value of our
MSR, the Company has used various instruments as an economic hedge. See Notes 17 and 20 for further information.
Counterparty Credit Risk
Derivative contracts involve the risk of dealing with both bank customers and institutional derivative counterparties and their ability to meet
contractual terms. Under Company policy, institutional counterparties must be approved by the Company’s Asset/Liability Management Committee. The Company’s credit exposure on derivatives is limited to the net fair value for each counterparty.
Transfers of Financial Assets
Transfers of financial assets are accounted for as sales when control over the transferred assets is surrendered. Control is generally considered
to have been surrendered when 1) the transferred assets are legally isolated from the Company or its consolidated affiliates, even in bankruptcy or other receivership, 2) the transferee has the right to pledge or exchange the assets with no conditions
that constrain the transferee and provide more than a trivial benefit to the Company, and 3) the Company does not maintain the obligation or unilateral ability to reclaim or repurchase the assets. If these sale criteria are met, the transferred assets
are removed from the Company’s balance sheet and a gain or loss on sale is recognized. If not met, the transfer is recorded as a secured borrowing, and the assets remain on the Company’s balance sheet, the proceeds from the transaction are recognized
as a liability, and gain or loss on sale is deferred until the sale criterion are achieved.
Loans Held-for-Sale
Mortgage Loans Held-for-Sale
The Company has elected to carry loans held-for-sale at fair value. The fair value of loans held-for-sale is based on commitments outstanding from
investors as well as what secondary markets are currently offering for portfolios with similar characteristics. Loans held-for-sale are subjected to recurring fair value adjustments. Loan sales are recognized when the transaction closes, the proceeds
are collected, ownership is transferred and, through the sales agreement, continuing involvement consists of the right to service the loan for a fee for the life of the loan, if applicable. Gains and losses on the sale of loans held-for-sale are
recorded as part of mortgage banking revenue on the consolidated statements of income. Fees on mortgage loans sold individually in the secondary market, including origination fees, service release premiums, processing and administrative fees, and
application fees, are recognized as mortgage banking revenue in the period in which the loans are sold.
Buyers generally have recourse to return a purchased loan to the Company under limited circumstances. Recourse conditions may include early
payment default, breach of representations or warranties, and documentation deficiencies. During 2024, 2023, and 2022, an insignificant number of loans were returned to the Company. At December 31, 2024 and 2023, the Company had reserved $1.8 million
and $2.3 million, respectively, for probable losses from representation and warranty obligations.
GNMA optional repurchase programs allow financial institutions to buy back individual delinquent mortgage loans that meet certain criteria from
the securitized loan pool for which the institution provides servicing. At the servicer’s option and without GNMA’s prior authorization, the servicer may repurchase such a delinquent loan for an amount equal to 100% of the remaining principal balance
of the loan. Under ASC 860, this buyback option is considered a conditional option until the delinquency criteria are met, at which time the option becomes unconditional. When the Company is deemed to have regained effective control over these loans
under the unconditional buyback option, the loans can no longer be reported as sold and must be brought back onto the consolidated balance sheet as loans held-for-sale, regardless of whether the Company intends to exercise the buy-back option. These
loans are reported as held-for-sale in accordance with GAAP with the offsetting liability being reported as other liabilities. Refer to Note 13 for additional information.
Commercial Loans Held-for-Sale
The Company originates certain commercial loans for which a portion is intended for sale. The Company also transfers certain commercial loans to
held-for-sale when management has the intent to sell the loan or a portion of the loan in the near term. These held-for-sale loans are recorded at fair value. At the time of transfer, write-downs on the loans are recorded as charge-offs and a new cost
basis is established. Any subsequent fair value adjustment is determined on an individual loan basis and is recognized as a valuation allowance with any charges included in other noninterest expense. Gains and losses on the sale of these loans are
included in other noninterest income when realized.
Loans and Leases and Related Provision and ACL
Loans and leases are presented in the consolidated financial statements at amortized cost. The components of amortized cost include unpaid
principal balance, unamortized discounts and premiums, and unamortized deferred fees and costs. Interest income is recognized based on the principal balance outstanding and the stated rate of the loan. Loan origination fees and certain direct
origination costs are capitalized and recognized as an adjustment of the yield on the related loan. Loans acquired through acquisition are initially recorded at fair value. Discounts and premiums created when the loans were recorded at their estimated
fair values at acquisition are accreted over the remaining term of the loan as an adjustment to the related loan’s yield. In the event of a loan pay-off, the remaining net deferred origination fees, and unamortized discounts and premiums are
automatically recognized into income. Where doubt exists as to the collectability of the loans and leases, interest income is recorded as payment is received.
The Company’s policy provides that loans and leases are generally placed in nonaccrual status if, in management’s opinion, payment in full of
principal or interest is not expected or payment of principal or interest is more than 90 days past due for commercial loans and 120 days past due for consumer loans, unless the loan or lease is both well-secured and in the process of collection. Once
placed in nonaccrual status, all accrued but uncollected interest related to the current fiscal year is reversed against the appropriate interest and fee income on loans and leases account with any accrued but uncollected interest related to prior
fiscal years is charged off against the ACL.
The ACL is maintained through charges to income in the form of a provision for credit losses at a level management believes is adequate to absorb
an estimate of expected credit losses over the contractual life of the loan portfolio as of the reporting date. Events that are not within the Company’s control, such as changes in economic conditions, could change subsequent to the reporting date and
could cause the ACL to be overstated or understated. The amount of the ACL is affected by loan charge-offs, which decreases the ACL; recoveries on loans previously charged off, which increases the ACL; the provision for credit losses charged to income,
which increases the ACL; and the release of provision for credit losses charged to income, which decreases the ACL.
PCD (Loss) is an internal grade for loans with evidence of deterioration of credit quality since origination that are acquired, and for which it
is probable, at acquisition, that the bank will be unable to collect all contractually required payments. Specific provisions related to PCD (Loss) loans found in ASC 326 include:
|
● |
ASC 326 provides special initial recognition and measurement for the Day One accounting for PCD assets. |
|
● |
ASC 326 requires entities that purchase certain financial assets (or portfolios of financial assets) with the intention of holding them for investment to determine whether the assets have experienced
more-than-insignificant deterioration in credit quality since origination. |
|
● |
More-than-insignificant deterioration will generally be determined by the asset’s delinquency status, credit risk rating, accruing status or other indicators of credit deterioration since origination. |
|
● |
An entity initially measures the amortized cost of a PCD asset by adding the acquisition date estimate of expected credit losses to the asset’s purchase price. Because the initial estimate for expected credit losses
is added to the purchase price to establish the Day One amortized cost, PCD accounting is commonly referred to as a “gross-up” approach. There is no credit loss expense recognized upon acquisition of a PCD asset; rather the “gross-up” is offset
by establishment of the initial allowance. |
|
● |
After initial recognition, the accounting for a PCD asset will generally follow the credit loss model. |
|
● |
Interest income for a PCD asset is recognized using the EIR calculated at initial measurement. This EIR is determined by comparing the amortized cost basis of the instrument to its contractual cash flows, consistent
with ASC 310-20. Accordingly, since the PCD gross-up is included in the amortized cost, the purchase discount related to estimated credit losses on acquisition is not accreted into interest income. Only the noncredit-related discount or premium
is accreted or amortized, using the EIR that was calculated at the time the asset was acquired. |
Loans of $1.0 million or more that are identified as collateral-dependent, which generally include loans internally graded as impaired or PCD Loss
loans, are reviewed by the Impairment Working Group which approves the amount of specific reserve, if any, and/or charge-off amounts. For loans which are determined to be collateral dependent, the value assigned for collateral support is influenced by
current appraisals, foreclosure bid estimates, market conditions, aging of accounts receivable or inventory, equipment documentation, observable market prices, estimates of enterprise or economic value, legal issues, appraisal assumptions and property
condition among other factors. For real estate secured loans, collateral support will be determined by the current appraisals ordered and reviewed by the Appraisal Department, less discounts including foreclosure/ bank ownership, taxes and cost to
sell. Generally, an individual reserve of the difference between the Bank’s amortized cost and the collateral support is recorded. A reserve of zero is appropriate when the collateral support equals or exceeds the amortized cost of the loan. The
Impairment Working Group reviews the results of each evaluation and approves the final specific provision amounts, which are then included in the analysis of the adequacy of the ACL in accordance with ASC 326.
New collateral valuations are generally ordered for loans $1.0 million or greater that have characteristics of potential specific provision, such
as delinquency or other loan-specific factors identified by management, when current collateral support (dated within the prior 12 months) is not available or when the current collateral support uses assumptions that are not consistent with the
expected disposition of the loan collateral. In order to measure a specific provision properly at the time that a loan is reviewed, a bank officer may estimate the collateral support based upon earlier collateral valuations received from outside
appraisers, sales contracts, approved foreclosure bids, comparable sales, officer estimates or current market conditions until a new collateral valuation is received. This estimate can be used to determine the extent of the specific provision on the
loan. Management performs a review of the pertinent facts and circumstances of each collateral-dependent loan, such as changes in outstanding balances, information received from loan officers and receipt of re-appraisals, at least quarterly. As of each
review date, management considers whether additional provision and/or charge-offs should be recorded based on recent activity related to the loan-specific collateral as well as other relevant comparable assets. Any adjustment to reflect further
exposure, either because management’s periodic review or as a result of updated collateral support, is made through recording additional ACL provisions and/or charge-offs.
When a guarantor is relied upon as a source of repayment, the Company analyzes the strength of the guaranty. This analysis varies based on
circumstances but may include a review of the guarantor’s personal and business financial statements and credit history, a review of the guarantor’s tax returns, and the preparation of a cash flow analysis of the guarantor. Management will continue to
update its analysis on individual guarantors as circumstances change.
In the normal course of business, management may grant modifications to borrowers that are experiencing financial difficulty. Loans identified as
meeting the criteria under ASC 310 are identified as an FDM. Any modification, renewal or forbearance on loans assigned a rating of “Special Mention” or worse, and loans of any rating which show evidence of financial difficulty is reviewed to determine
whether the borrower is experiencing financial difficulty and if so, which terms of the loan were modified.
If the borrower is experiencing financial difficulty and the loan is modified via forgiveness of principal, reduction in interest rate to a rate
below current market rates for issuance, payment extension or deferral for greater than 6 months (including extensions granted in the past 12 months), term or maturity date extension, or combination of these specific modification terms, the
modification requires disclosure. See Note 4 for the Company’s reportable modifications.
In the normal course of business, the Company assumes risks in extending credit. The Company manages these risks through underwriting in
accordance with its lending policies, loan review procedures and the diversification of its loan and lease portfolio. Although it is not possible to predict credit losses with certainty, management regularly reviews the characteristics of the loan and
lease portfolio to determine its overall risk profile and quality.
The provision for credit losses is the periodic cost (or credit) of providing an allowance or reserve for expected losses on loans and leases. The
Board of Directors has appointed a Credit Committee, composed of senior management and lending administration staff which meets on a quarterly basis, or more frequently if required, to review the recommendations of several internal working groups
developed for specific purposes including the ACL, specific provision amounts, and charge-offs. The ACL Working Group bases its estimates of credit losses on three primary components: (1) estimates of expected losses that exist in various segments of
performing loans and leases over the remaining life of the loan portfolio using a reasonable and supportable economic forecast; (2) specifically identified losses in individually analyzed credits which are collateral dependent; and (3) qualitative
factors related to economic conditions, portfolio concentrations, regulatory policy updates, and other relevant factors that address estimates of expected losses not fully addressed based upon management’s judgment of portfolio conditions.
For modeling purposes, loans with similar loan characteristics (including but not limited to underwriting factors, borrower financial conditions,
credit history, collateral type, market conditions, etc.) are run individually through one of several credit risk models to determine a one year probability of default and loss given default. These two figures are then multiplied to create a one-year
expected loss. All loans are then further segmented by portfolio for inclusion in one of several ACL models to estimate the loan’s lifetime losses based on its one-year loss estimate. The lifetime loss estimate generated by the model component includes
a macroeconomic forecast that includes several factors over a reasonable and supportable period, which the Company has determined is an eight quarter time period. After the reasonable and supportable period, all loans revert to their historic one year
expected loss estimates. The group may also consider the results of alternate models and calculations to ensure that the reserve includes all appropriate risk components.
The Company’s reasonable and supportable eight quarter economic forecast is utilized to estimate credit losses before reverting to longer term
historical loss experience. The Company subscribes to various economic services and publications to assist with the development of inputs used in the modeling and qualitative framework for the ACL calculation. The economic forecast considers changes in
real gross domestic product, nominal disposable income, unemployment rate, equity valuations and related volatility, valuations for residential and commercial real estate, and other indicators that may be correlated with the Company’s expected credit
losses.
The Company excludes accrued interest from interest income when it is determined that it is probable that all contractual principal and interest
will not be collected for loans. For loans with available commitments that are not unconditionally cancellable, expected losses are calculated by applying comparable loss rates on funded loans to the unfunded commitment balances. In addition, the loan
type and expected line utilization are considered when estimating losses on unfunded commitments.
Attention is paid to the quality of the loan and lease portfolio through a formal loan review process. An independent loan review department of
the Company is responsible for reviewing the credit rating and classification of individual credits and assessing trends in the portfolio, adherence to internal credit policies and procedures and other factors that may affect the overall adequacy of
the ACL. The ACL Working Group is responsible for ensuring that the ACL provides adequate coverage of expected losses. The ACL Working Group meets at least quarterly to determine the amount of adjustments to the ACL. The ACL Working Group is composed
of senior management from the Company’s credit administration, risk, and finance departments. The Impairment Working Group is responsible for evaluating individual loans that have been specifically identified through various channels, including
examination of the Company’s watch list, past due listings, and loan officer assessments. For all loans identified, an analysis is prepared to determine if the loan is collateral dependent and the extent of any loss exposure to be reviewed by the
Impairment Working Group. The Impairment Working Group reviews all loans restructured in an FDM if the loan is $1.0 million or greater to determine if it is probable that the Company will be unable to collect the contractual principal and interest on
the loan. An evaluation of the circumstances surrounding the loan is performed to determine whether the loan was collateral-dependent. The fair value of the underlying collateral is considered if the loan is collateral-dependent. The Impairment Working
Group meets at least quarterly. The Impairment Working Group is made up of senior management from the Company’s lending administration, risk, and finance departments.
If a loan to a borrower experiencing financial difficulty is modified, regardless of the modification type, the loan is individually evaluated and
reserved for as needed. Should the borrower’s financial condition, collateral protection or performance deteriorate, warranting reassessment of the loan rating or specific provision, additional reserves and/or charge-offs may be required.
Any loan or portion thereof which is classified as “loss” or which is determined by management to be uncollectible, because of factors such as the
borrower’s failure to pay interest or principal, the borrower’s financial condition, economic conditions in the borrower’s industry or the inadequacy of underlying collateral, is charged off. See Note 4 for additional information on loans and leases
and Note 5 for additional information on the ACL.
Premises and Equipment
Premises and equipment are stated at cost, less accumulated depreciation and amortization. Provisions for depreciation and amortization, computed
using straight-line methods, are charged to expense over the estimated useful lives of the assets. Costs of major additions and improvements are capitalized. Expenditures for routine maintenance and repairs are charged to expense as incurred. Upon
retirement, sale, or other disposition of property and equipment, the cost and accumulated depreciation are eliminated from the accounts, and any gains or losses are included in income. See Note 6 for additional information.
Leases
The Company leases various premises and equipment. At the inception of the contract, the Company determines if an arrangement is or contains a
lease and will recognize on the balance sheet a lease asset for its right to use the underlying asset and a lease liability for the corresponding lease obligation for contracts longer than a year. Both the asset and liability are initially measured at
the present value of the future minimum lease payments over the lease term. In determining the present value of lease payments, the Company uses our incremental borrowing rate as the discount rate for the leases.
The Company has elected the practical expedient to not separate non-lease components from lease components and instead to account for both as a
single lease component. The Company’s leases do not contain residual value guarantees or material variable lease payments. The Company does not have any material restrictions or covenants imposed by leases that would impact the Company’s ability to pay
dividends or cause the Company to incur additional financial obligations.
The Company elected to apply the short-term lease exception to existing leases that meet the definition of a short-term lease (less than 12
months), considering the lease term from the commencement date, not the remaining term at the date of adoption. Certain of the Company’s leases contain options to renew the lease therefore these renewal options are included in the determination of the
capitalization period and calculation of the lease liability and ROU asset as they are reasonably certain to be exercised.
Leases for which the Company is the lessor are substantially all accounted for as operating leases and the lease components and non-lease
components are accounted for separately. The remaining lease periods vary from one month to five years and the contractual maturities of gross lease receivables were not material to the financial position of our Company. See Note 7 for additional
required disclosures under ASC 842.
OREO and Repossessed Assets
OREO consists of properties acquired through foreclosure. Repossessed assets consists of non-real estate assets acquired in partial or full
settlement of loans. OREO and repossessed assets totaled $5.8 million and $6.2 million at December 31, 2024 and 2023, respectively, and included in other assets in the accompanying consolidated balance sheets. These assets are recorded at fair value,
less estimated costs to sell, on the date of foreclosure or repossession, establishing a new cost basis for the asset. Subsequent to the foreclosure or repossession date the asset is maintained at the lower of cost or fair value. Any write-down to fair
value required at the time of foreclosure or repossession is charged to the ACL. Subsequent gains or losses resulting from the sale of the property or additional valuation allowances required due to further declines in fair value are reported in other
noninterest expense.
Goodwill and Other Intangible Assets
Goodwill is not amortized but is evaluated for impairment at least annually in the fourth quarter, or more frequently if an event occurs or
circumstances change that would more likely than not reduce the fair value of a reporting unit below its carrying amount. As part of its testing, the Company may elect to first assess qualitative factors to determine whether it is more likely than not
that the fair value of a reporting unit is less than its carrying amount. If the results of the qualitative assessment indicate that more likely than not a reporting unit’s fair value is less than its carrying amount, the Company determines the fair
value of the respective reporting unit (through the application of various quantitative valuation methodologies) relative to its carrying amount to determine whether quantitative indicators of potential impairment are present (i.e., Step 1). The
Company may also elect to bypass the qualitative assessment and begin with Step 1. If the results of Step 1 indicate that the fair value of the reporting unit is below its carrying amount, the Company will recognize an impairment loss for the amount
that the reporting unit’s carrying amount exceeds its fair value (up to the amount of goodwill recorded). A reporting unit is defined as an operating segment or a component of that operating segment. Reporting units may vary, depending on the level at
which performance of the segment is reviewed. If impaired, the asset is written down to its estimated fair value. No impairment charges were recognized in any reporting unit through December 31, 2024. See Note 8 for additional information.
Other identifiable intangible assets consist primarily of core deposit premiums and customer relationships arising from acquisitions. These
intangibles were established using the discounted cash flow approach and are being amortized using an accelerated method over the estimated remaining life of each intangible recorded at acquisition. Additionally, trademarks and trade names, considered
finite-lived intangible assets, are reviewed for impairment when events or changes in circumstances indicate that the asset’s carrying amount may not be recoverable from undiscounted future cash flows or that it may exceed its fair value. No impairment
to these intangible assets has been identified in any period presented.
Servicing Rights Assets
The Company recognizes as assets the rights to service mortgage loans for others, known as MSR. The Company records MSR at fair value for all
loans sold on a servicing retained basis with subsequent adjustments to fair value of MSR in accordance with ASC 860. An estimate of the fair value of the Company’s MSR is determined utilizing assumptions about factors such as mortgage interest rates,
discount rates, mortgage loan prepayment speeds, market trends and industry demand. Because the valuation is determined by using discounted cash flow models, the primary risk inherent in valuing the MSR is the impact of fluctuating interest rates on
the estimated life of the servicing revenue stream. The use of different estimates or assumptions could also produce different fair values. The Company is susceptible to fluctuations in MSR value in changing interest rate environments. MSR are included
in the other assets category of the consolidated balance sheet. Changes in the fair value of MSR are recorded as part of mortgage banking revenue on the consolidated statements of income. See Note 17 for additional information.
Cash Surrender Value of Life Insurance
The Company invests in BOLI, which involves the purchasing of life insurance on selected employees. The Company is the owner of the policies and,
accordingly, the cash surrender value of the policies is included in total assets and increases in cash surrender values are reported as income in the consolidated statements of income. The cash value accumulation on BOLI is permanently tax deferred if
the policy is held to the insured person’s death and certain other conditions are met.
VIE and Other Investments
The Company is deemed to be the primary beneficiary and required to consolidate a VIE if it has a variable interest in the VIE that provides it
with a controlling financial interest. For such purposes, the determination of whether a controlling financial interest exists is based on whether a single party has both the power to direct the activities of the VIE that most significantly impact the
VIE’s economic performance and the obligation to absorb the losses of the VIE or the right to receive benefits from the VIE that could potentially be significant to the VIE. Conclusions reached regarding which interest holder is a VIE’s primary
beneficiary must be continuously evaluated. The Company has determined that certain of its investments meet the definition of VIE.
The Company invests in certain affordable housing projects as a limited partner and accounts for these investments and the related tax credits
using either the effective yield method or the proportional amortization method, depending upon the date of the investment. Under the effective yield method, the Company recognizes the tax credits as they are allocated and amortizes the initial costs
of the investments to provide a constant effective yield over the period that the tax credits are allocated. Under the proportional amortization method, the Company amortizes the cost of the investment in proportion to the tax credits and other tax
benefits received and recognizes the net investment performance in the income statement as a component of income tax expense.
Equity securities with readily determinable fair values not held for trading consist of marketable equity securities which are carried at fair
value with changes in fair value reported in net income.
For other investments in limited partnerships without readily determinable fair values, the Company has elected to account for these investments
using the practical expedient of the fair value of underlying net asset value. For investments in other limited partnerships without readily determinable fair values that do not qualify for the practical expedient, these investments are accounted for
at their cost minus impairment, plus or minus changes resulting from observable price changes in orderly transactions for the identical or a similar investment of the same issuer. Any changes in fair value are reported in net income. See Note 23 for
additional information about our variable interest entities and other investments.
Pension and Postretirement Benefits
The Company accounts for its defined benefit pension plans using an actuarial model that uses an approach which allocates pension costs over the
service period of employees in the plan. The Company also accounts for its other postretirement benefits by recognizing net periodic postretirement benefit costs as employees render the services necessary to earn their postretirement benefits. The
principle underlying the accounting is that employees render service ratably over the service period and, therefore, the income statement effects of the Company’s defined benefit pension and postretirement benefit plans should follow the same pattern.
The Company accounts for the over-funded or under-funded status of its defined benefit and other postretirement plans as an asset or liability in its consolidated balance sheets.
The discount rate is the rate used to determine the present value of the Company’s future benefit obligations for its pension and other
postretirement benefit plans. The Company determines the discount rate with the assistance of its actuary using the actuary’s proprietary model. The Company determined the discount rate by developing a level equivalent yield using its actuary’s model
at December 31, 2024 and incorporating the expected cash flows from the Cadence Bank Retirement Plan (the “Basic Plan”), the Cadence Bank Restoration Plan (the “Restoration Plan”) and the Cadence Bank Supplemental Executive Retirement Plan (the
“Supplemental Plan”). See Note 12 for additional information.
The Company offers a 401(k) defined contribution benefit plan to its employees. The plan provides for a 100% match of employee contributions up to
five percent of employee compensation. All contributions and related earnings are 100% vested.
As a result of the prior acquisitions, the Company has various legacy unqualified supplemental retirement plans. The plans allow for fixed payment
amounts to begin on a monthly or annual basis at a specified age. The annual cost charged to expense and the estimated present value of the projected payments was determined in accordance with the provisions of ASC 710 and ASC 715. The present value of
projected payments is recorded as a liability in the Company’s consolidated balance sheets. The Company provided a voluntary deferred compensation plan for certain of its executive and senior officers. Under this plan, the participants were allowed to
defer up to 25% of their base compensation and 100% of certain incentive compensation. The Company could, but was not obligated to, contribute to the plan. Amounts contributed to this plan were credited to a separate account for each participant and
are subject to a risk of loss in the event of the Company’s insolvency. The Company made no contributions to this plan in 2024, 2023, or 2022.
Share-Based Compensation
The Company administers several long-term incentive compensation plans that provide for the granting of various forms of incentive share-based
compensation. The Company values these units at the grant date fair value and recognizes expense over the requisite service period. The Company’s share-based compensation costs are recorded as a component of salaries and employee benefits in the
consolidated statements of income. The Company has elected to account for forfeitures of share-based compensation awards as they occur, and compensation cost is recorded assuming all recipients will complete the requisite service period. If an employee
forfeits an award because they do not complete the requisite service period, the Company will reverse compensation cost previously recognized in the period the award is forfeited. Upon the exercise of stock options, the granting of restricted stock
awards, or the vesting of share-based awards, the Company would fulfill these events by issuing new common shares. At December 31, 2024, the Company believes there are adequate authorized common shares to satisfy anticipated share-based award vesting
in 2025. See Note 14 for additional information.
Income Taxes
The Company and its significant subsidiaries are subject to income taxes in federal, state and local jurisdictions, and such corporations account
for income taxes under the asset and liability method. Deferred tax assets and liabilities are recognized for the future tax consequences attributable to differences between the financial statement carrying amounts of existing assets and liabilities
and their respective tax bases and net operating loss and tax credit carryforwards. Deferred tax assets and liabilities are measured using enacted tax rates expected to apply to taxable income in the years in which those temporary differences are
expected to be recovered or settled.
The recognition of a deferred tax asset is dependent upon a “more likely than not” expectation of realization of the deferred tax asset, based
upon the analysis of available evidence. The deferred tax asset recoverability is calculated using a consistent approach, which considers the relative impact of negative and positive evidence, including review of historical financial performance, and
all sources of future taxable income, such as projections of future taxable income exclusive of future reversals of temporary differences and carryforwards, tax planning strategies, and any carryback availability. A valuation allowance is required to
sufficiently reduce the deferred tax asset to the amount that is expected to be realized on a “more likely than not” basis. Changes in the valuation allowance are generally recorded through income. See Note 11 for more information about the Company’s
income taxes.
Common Stock Repurchases
The Company purchases shares of its common stock pursuant to share repurchase programs authorized by its Board of Directors. Repurchased shares
are available for use in the Company’s share-based compensation programs and other transactions or for other corporate purposes as determined by the Company’s Board of Directors. At the date of repurchase, shareholders’ equity is reduced by the
repurchase price. See Note 18 for additional information.
Revenue Recognition
Service Charges on Deposit Accounts
Service charges on deposit accounts consist of non-sufficient funds fees, account analysis fees, and other service charges on deposits which
consist primarily of monthly account fees. Non-sufficient funds fees are recognized at the time the account overdraft occurs in accordance with regulatory guidelines. Account analysis fees consist of fees charged to certain commercial demand deposit
accounts based upon account activity (and reduced by a credit which is based upon cash levels in the account). The Company’s performance obligation for these fees is satisfied and related revenue recognized, when the service is rendered.
Fees and Other Service Charges
Fees and other service charges primarily consist of debit and credit card income, merchant services and other service fees. These fees are earned
at a point in time as the Company’s performance obligation for service charges are satisfied, and related revenue recognized, when the services are rendered.
Assets Under Administration and Asset Management Fees
The Company does not include assets held in fiduciary or agency capacities in the consolidated balance sheets, as such items are not assets of the
Company. Fees from asset management activities are recorded on an accrual basis, over the period in which the service is provided. Fees are a function of the market value of assets administered and managed, the volume of transactions, and fees for
other services rendered, as set forth in the underlying client agreement. This revenue recognition involves the use of estimates and assumptions, including components that are calculated based on estimated asset valuations and transaction volumes. The
Company does not earn performance-based incentives. The Company’s performance obligation for these fees is satisfied, and related revenue recognized, when services are rendered.
Advisory Fees for Brokerage Services
Advisory fees for brokerage services are collected monthly through a third-party vendor at a predetermined rate in the contract. Revenue for such
performance obligations are recognized at the time the performance obligations are satisfied and is reflected in the Wealth Management line in the consolidated statements of income.
Credit Related Fees
Credit related fees primarily include fees assessed on the unused portion of commercial lines of credit (“unused commitment fees”) and syndication
agent fees. Unused commitment fees are recognized over the period of the related commitment. Syndication agent fees are earned to act as an agent for a period of time, usually one year. Arranger fees are earned to arrange a syndicate of lenders and are
generally recognized when the transaction is closed.
Bankcard Fees
Bankcard fees include primarily bankcard interchange revenue, which is recorded when services are provided.
Payroll Processing Revenue
Payroll processing revenue consists principally of payroll processing fees, property and casualty brokerage and employee benefits brokerage.
Payroll processing fees are charged as the services are provided and the Company satisfied its performance obligation simultaneously. Property and casualty brokerage include the brokerage of both personal and commercial coverages. The placement of the
policy is completion of the Company’s performance obligation and revenue is recognized at that time. The Company’s commission is a percentage of the premium. Employee benefits brokerage consists of assisting companies in designing and managing
comprehensive employee benefit programs. The services provided by the Company are collectively benefit management services which are considered a bundle of services that are highly interrelated. Each of the underlying services are activities to fulfill
the benefit management service and are not distinct and separate performance obligations. Revenue is recognized over the contract term as services are rendered on a monthly basis. Customer payments are usually received on a monthly basis. This revenue
is reflected in Other Income in the consolidated statements of income. During 2024, the Company completed the sale of Cadence Business Solutions, LLC, its payroll processing business unit, which discontinued this revenue stream.
SBA Income
SBA income consists of gains on sales of SBA loans, servicing fees, changes in the fair value of servicing rights, and other miscellaneous fees.
Servicing fee income is recorded for fees earned for servicing SBA loans. The fees are based on a contractual percentage of the outstanding principal or a fixed amount per loan and are recorded as income when earned. This revenue is reflected in Other
Income in the consolidated statements of income.
Advertising Costs
Advertising costs are expensed when the service is provided. See Note 22 for additional information.
Basic and Diluted EPS
Basic and diluted EPS are calculated in accordance with ASC 260, Earnings Per Share. Basic EPS is computed by dividing income available to
common shareholders by the weighted-average number of common shares outstanding for the period. Diluted EPS is computed using the weighted-average number of shares determined for the basic EPS computation plus the shares resulting from the assumed
exercise of all outstanding share-based awards using the treasury stock method. See Note 15 for additional information.
Comprehensive Income
Accounting principles generally require that recognized revenue, expenses, gains, and losses be included in net income. Although certain changes
in assets and liabilities, such as unrealized gains and losses on available for sale securities, pension liability and cash flow hedges, are reported as a separate component of the shareholders’ equity section of the consolidated balance sheets, such
items, along with net income, are components of comprehensive income. See Note 16 for additional information.
Cash Flows
For purposes of reporting cash flows, cash and cash equivalents include cash on hand and amounts due from banks, interest bearing deposits with
banks, and federal funds sold. Generally, federal funds are sold for one to seven day periods.
Cash flows from loans, either originated or acquired, are classified at the time according to management’s intent to either sell or hold the loan
for the foreseeable future. When management’s intent is to hold the loan for the foreseeable future, the cash flows of that loan are presented as investing cash flows.
Off-Balance Sheet Financial Instruments
In the ordinary course of business, the Company enters into off-balance sheet financial instruments consisting of commitments to extend credit,
credit card lines, standby letters of credit and commitments to purchase securities. Such financial instruments are recorded in the consolidated financial statements when they are exercised.
Fair Value of Financial Instruments
Fair value estimates are made at a specific point in time, based on relevant market information and other information about the Company’s
financial instruments. These estimates do not reflect any premium or discount that could result from offering for sale, at one time, the entire holdings of a particular financial instrument. Because no market exists for a portion of the financial
instruments, fair value estimates are also based on judgments regarding estimated cash flows, current economic conditions, risk characteristics of various financial instruments, and other factors. These estimates are subjective in nature and involve
uncertainties and matters of significant judgment and, therefore, cannot be determined with precision. Changes in assumptions could significantly affect the estimates.
Management employs independent third-party pricing services to provide fair value estimates for the Company’s financial instruments. Management
uses various procedures to validate that the prices received from pricing services and quotations received from dealers are reasonable for each relevant financial instrument, including reference to relevant broker/ dealer quotes or other market quotes
and a review of valuations and trade activity of comparable securities. Consideration is given to the nature of the quotes (e.g., indicative or firm) and the relationship of recently evidenced market activity to the prices provided by the third-party
pricing service.
Understanding the third-party pricing service’s valuation methods, assumptions and inputs used by the firm is an important part of the process of
determining that reasonable and reliable fair values are being obtained. Management evaluates quantitative and qualitative information provided by the third-party pricing services to assess whether they continue to exhibit the high level of expertise
that management relies upon.
Fair value estimates are based on existing financial instruments on the consolidated balance sheets, without attempting to estimate the value of
anticipated future business and the value of assets and liabilities that are not considered financial instruments. Significant assets and liabilities that are not considered financial instruments include deferred income taxes, premises and equipment,
goodwill and other intangible assets. In addition, the income tax ramifications related to the realization of the unrealized gains and losses on financial instruments can have a significant effect on fair value estimates and have not been considered in
any of the estimates. For further information about fair value measurements, see Note 13.
Related Party Transactions
In the normal course of business, loans are made to directors and executive officers and to companies in which they have a significant ownership
interest. In the opinion of management, these loans are made on substantially the same terms, including interest rates and collateral, as those prevailing at the time for comparable transactions with other parties, are consistent with sound banking
practices, and are within applicable regulatory and lending limitations. The aggregate balances of related party loans and deposits are insignificant at December 31, 2024 and 2023.
Recently Adopted Accounting Pronouncements
ASU No. 2022-03
In June 2022, the FASB issued ASU No. 2022-03, Fair Value Measurement (Topic 820): Fair Value Measurement of Equity Securities Subject to
Contractual Sale Restrictions. The amendments in the ASU clarify that a contractual restriction on the sale of an equity security is not considered part of the unit of account of the equity security and, therefore, is not considered in measuring
fair value. The ASU introduces new disclosure requirements to provide investors with information about the restriction including the nature and remaining duration of the restriction.
The guidance became effective for Cadence beginning January 1, 2024. Cadence does not include contractual sale restrictions as adjustments to the
measured fair value of our equity securities. The adoption of this guidance had no immediate impact to our consolidated financial statements.
ASU No. 2023-01
In March 2023, the FASB issued ASU No. 2023-01, Leases (Topic 842): Common Control Arrangements which amends the accounting for common
control leasing arrangements. The ASU requires all entities to amortize leasehold improvements associated with common control leases over the useful life to the common control group.
The guidance became effective for Cadence beginning January 1, 2024. Cadence adopted this guidance on a prospective basis. The adoption of this
guidance had no immediate impact to our consolidated financial statements.
ASU No. 2023-02
In March 2023, the FASB issued ASU No. 2023-02, Investments—Equity Method and Joint Ventures (Topic 323): Accounting for Investments in Tax
Credit Structures Using the Proportional Amortization Method. The ASU allows entities to elect the proportional amortization method, on a tax-credit-program-by-tax-credit-program basis, for all equity investments in tax credit programs meeting
the eligibility criteria in ASC 323-740-25-1. The ASU further prescribes specific information reporting entities must disclose about tax credit investments each period.
This guidance became effective for Cadence beginning January 1, 2024. Cadence adopted this guidance on a modified- retrospective basis. Cadence
evaluated all investments for which it still expects to receive income tax credits or other income tax benefits as of January 1, 2024, to determine which investments qualified for the proportional amortization method as of the date the investment was
entered into. Based on Cadence’s assessment of investments’ eligibility for proportional amortization as of January 1, 2024, Cadence had NMTC and HTC investments with investment balances of approximately $36 million that were eligible for the
proportional amortization method and for which Cadence still expects to receive income tax credits and other income tax benefits of approximately $51 million in future periods.
The Company recorded a cumulative-effect adjustment to retained earnings for the difference between (1) the cumulative amortization recognized for
the eligible investments from investment inception through January 1, 2024, under the equity method of accounting, and (2) the cumulative amortization that would be recognized for the same period under the proportional amortization method. The
Company’s cumulative adoption adjustment of $1.5 million was recorded to retained earnings and represents the excess amortization expense under the equity method of accounting and removal of the remaining deferred tax liabilities associated with the
eligible investments as of January 1, 2024.
ASU No. 2023-07
In November 2023, the FASB issued ASU No. 2023-07, Segment Reporting (Topic 280): Improvements to Reportable Segment Disclosures. The
amendments in the ASU improve reportable segment disclosure requirements primarily through enhanced disclosures about significant segment expenses. The amendments in the ASU are effective for annual periods beginning after December 15, 2023. As this
guidance is solely disclosure related, there was no quantitative impact to the Company’s consolidated financial statements. See Note 19 for additional information.
Pending Accounting Pronouncements
ASU No. 2023-05
In August 2023, the FASB issued ASU No. 2023-05, Business Combinations—Joint Venture Formations (Subtopic 805-60): Recognition and Initial
Measurement. The ASU applies to the formation of entities that meet the definition of a joint venture (or a corporate joint venture) as defined in the FASB ASC Master Glossary. The amendments in the ASU require that a newly formed joint venture,
upon formation, would initially measure its assets and liabilities at fair value (with exceptions to fair value measurement that are consistent with the business combinations guidance). The ASU allows a joint venture to apply measurement period
guidance in accordance with ASC 805-10, allowing the amounts recognized upon formation to be adjusted for provisional items during the measurement period not to exceed one year from the formation date.
The ASU does not amend the definition of a joint venture, the existing guidance for the accounting by an equity method investor for its investment
in a joint venture, or the accounting by a joint venture for contributions received subsequent to formation.
The amendments are effective prospectively for all joint ventures with a formation date on or after January 1, 2025, and early adoption is
permitted. A joint venture that was formed before the effective date of the ASU may elect to apply the amendments retrospectively if it has sufficient information. The Company does not anticipate any significant impact from this guidance on its
consolidated financial statements.
ASU No. 2023-06
In October 2023, the FASB issued ASU No. 2023-06, Disclosure Improvements: Codification Amendments in Response to the SEC’s Disclosure Update
and Simplification Initiative, that incorporates certain SEC disclosure requirements into the FASB Accounting Standards Codification. The amendments in the ASU are expected to clarify or improve disclosure and presentation requirements of a
variety of Codification Topics, allow users to more easily compare entities subject to the SEC’s existing disclosures with those entities that were not previously subject to the requirements, and align the requirements in the Codification with the
SEC’s regulations.
The ASU modifies the disclosure or presentation requirements of a variety of Topics in the Codification. The requirements are relatively narrow in
nature. Some of the amendments represent clarifications to, or technical corrections of, the current requirements.
The effective date for each amendment will be the date on which the SEC removes that related disclosure from its rules. If by June 30, 2027, the
SEC has not removed the related disclosure from its regulations, the amendments will be removed from the Codification and not become effective for any entity. As this guidance is solely disclosure related, there will be no quantitative impact to the
Company’s consolidated financial statements.
ASU No. 2023-08
In December 2023, the FASB issued ASU No. 2023-08, Intangibles—Goodwill and Other—Crypto Assets (Subtopic 350-60): Accounting for and
Disclosure of Crypto Assets. The amendments are intended to improve the accounting for certain crypto assets by requiring an entity to measure those crypto assets at fair value each reporting period with changes in fair value recognized in net
income. The amendments also improve the information provided to investors about an entity’s crypto asset holdings by requiring disclosure about significant holdings, contractual sale restrictions, and changes during the reporting period.
The amendments in the ASU are effective for fiscal years beginning after December 15, 2024, including interim periods within those fiscal years.
Early adoption is permitted for both interim and annual financial statements that have not yet been issued (or made available for issuance). If amendments are adopted in an interim period, they must be adopted as of the beginning of the fiscal year
that includes that interim period. The Company currently does not have and does not anticipate to have exposure to crypto assets and does not expect the adoption of this guidance to have any significant impact on its consolidated financial statements.
ASU No. 2023-09
In December 2023, the FASB issued ASU No. 2023-09, Income Taxes (Topic 740): Improvements to Income Tax Disclosures. The ASU is intended
to improve the transparency of income tax disclosures by requiring (1) consistent categories and greater disaggregation of information in the rate reconciliation and (2) income taxes paid disaggregated by jurisdiction. It also includes certain other
amendments intended to improve the effectiveness of income tax disclosures.
The amendments in the ASU are effective for annual periods beginning after December 15, 2024. Early adoption is permitted for annual financial
statements that have not yet been issued or made available for issuance. As this guidance is solely disclosure related, there will be no quantitative impact to the Company’s consolidated financial statements.
ASU No. 2024-01
In March 2024, the FASB issued ASU No. 2024-01, Compensation-Stock Compensation (Topic 718): Scope Application of Profits Interest and Similar
Awards, which provides four cases illustrating the scope application of Topic 718 for profits interest awards. Determining whether a profits interest award should be accounted for as a share-based payment arrangement or other compensation
requires judgement based on the facts and circumstances of the specific transaction. The illustrative example includes four fact patterns to demonstrate how an entity would apply the scope guidance in Topic 718 to determine whether profits interest
awards should be accounted for in accordance with Topic 718.
The amendments in the ASU are effective for annual periods beginning after December 15, 2024, and interim periods within those annual periods.
Early adoption is permitted for both interim and annual financial statements that have not yet been issued or made available for issuance. The amendments should be applied either (1) retrospectively to all prior periods presented in the financial
statements or (2) prospectively to profits, interest, and similar awards grated or modified on or after the date at which the entity first applies the amendments. The Company does not believe the adoption of this guidance will have an immediate impact
on its consolidated financial statements.
ASU No. 2024-02
In March 2024, the FASB issued ASU No. 2024-02, Codification Improvements--Amendments to Remove References to the Concepts Statements,
which contains amendments that remove references to various Concepts Statements. In most instances, the references are extraneous and not required to understand or apply the guidance. In other instances, the references were used in prior Statements to
provide guidance in certain topical areas. Generally, the amendments are not intended to result in significant accounting change for most entities. However, the FASB recognized that changes to that guidance may result in accounting change for some
entities. Therefore, the FASB provided transition guidance for all the amendments in this Update.
These amendments are effective for public business entities for fiscal years beginning after December 15, 2024. Early application of the
amendments is permitted for all entities, for any fiscal year or interim period for which financial statements have not yet been issued (or made available for issuance). If an entity adopts the amendments in an interim period, it must adopt them as of
the beginning of the fiscal year that includes that interim period. The Company does not anticipate any impact from guidance on its consolidated financial statements.
ASU No. 2024-03
In November 2024, The FASB issued ASU No. 2024-03, Income Statement—Reporting Comprehensive Income— Expense Disaggregation Disclosures
(Subtopic 220-40): Disaggregation of Income Statement Expenses, which requires disclosures in the note to the financial statements regarding specific expenses. The amendments do not change or remove existing disclosure requirements. The
amendments improve disclosure requirements through enhanced expense disaggregation.
The amendments require disclosures in each interim and annual reporting periods. The amendments are effective for fiscal year beginning after
December 15, 2026, and interim reporting periods beginning after December 15, 2027. Prospective adoption is required, however an entity may choose to adopt retrospectively. Early adoption is permitted. As this guidance is solely disclosure related,
there will be no quantitative impact to the Company’s consolidated financial statements.
ASU No. 2024-04
In November 2024, The FASB issued ASU No. 2024-04, Debt—Debt with Conversion and Other Options (Subtopic 470-20): Induced Conversions of
Convertible Debt Instruments, which clarifies requirements for determining whether certain settlements of convertible debt instruments, including convertible debt instruments with cash conversion features or convertible debt instruments that are
not currently convertible, should be accounted for as an induced conversion.
The amendments are effective for all entities for fiscal years beginning after December 15, 2025. Early adoption is permitted as of the beginning
of the annual reporting period for all entities that have adopted ASU 2020-06. If an entity adopts ASU No. 2024-04 in an interim reporting period, it should adopt it as of the beginning of the annual reporting period that includes that interim
reporting period. The Company does not anticipate any impact from guidance on its consolidated financial statements.
NOTE 2. DISCONTINUED OPERATIONS
On November 30, 2023, the Company completed the sale of its insurance subsidiary, Cadence Insurance, via a stock purchase agreement with Arthur J.
Gallagher Risk Management Services, LLC and Arthur J. Gallagher & Co. for $904 million, subject to customary purchase price adjustments. The transaction resulted in a pre-tax gain of $706.6 million, reported in the fourth quarter of 2023. The gain,
along with Cadence Insurance’s historical financial results for periods prior to the sale, is reflected in the Company’s consolidated financial statements as discontinued operations. Cadence Insurance’s operating results have been presented as
“Discontinued operations” within the accompanying consolidated financial statements and prior period amounts have been reclassified to conform with the discontinued operations presentation. There was no activity from these discontinued operations in
2024.
The following summarized financial information related to Cadence Insurance has been segregated from continuing operations and reported as
discontinued operations for the periods presented.
| (In thousands) |
|
Year Ended December 31, |
|
| Discontinued operations: |
|
2023 |
|
|
2022 |
|
| Net interest revenue |
|
$ |
128 |
|
|
$ |
12 |
|
| Noninterest revenue |
|
|
|
|
|
|
|
|
| Insurance commissions |
|
|
156,501 |
|
|
|
150,275 |
|
| Gain on sale of discontinued operations |
|
|
706,588 |
|
|
|
— |
|
| Other |
|
|
52 |
|
|
|
272 |
|
| Total noninterest revenue |
|
|
863,141 |
|
|
|
150,547 |
|
| Noninterest expense |
|
|
|
|
|
|
|
|
| Salaries and employee benefits |
|
|
117,129 |
|
|
|
110,180 |
|
| Occupancy and equipment |
|
|
4,919 |
|
|
|
5,088 |
|
| Data processing and software |
|
|
2,906 |
|
|
|
2,825 |
|
| Amortization of intangibles |
|
|
1,972 |
|
|
|
2,058 |
|
| Other |
|
|
8,752 |
|
|
|
8,055 |
|
| Total noninterest expense |
|
|
135,678 |
|
|
|
128,206 |
|
| Income from discontinued operations before income tax expense |
|
|
727,591 |
|
|
|
22,353 |
|
| Income tax expense |
|
|
188,971 |
|
|
|
6,433 |
|
| Income from discontinued operations, net of tax |
|
$ |
538,620 |
|
|
$ |
15,920 |
|
NOTE 3. AVAILABLE FOR SALE SECURITIES AND EQUITY SECURITIES
The amortized cost, unrealized gains and losses, and estimated fair value of available for sale securities are presented in the following tables:
| |
|
|
|
|
Gross |
|
|
Gross |
|
|
Estimated |
|
| |
|
Amortized |
|
|
Unrealized |
|
|
Unrealized |
|
|
Fair |
|
| (In thousands) |
|
Cost |
|
|
Gains |
|
|
Losses |
|
|
Value |
|
| December 31, 2024 |
|
|
|
|
|
|
|
|
|
|
|
|
|
|
|
|
| U.S. government agency securities |
|
$ |
321,454 |
|
|
$ |
20 |
|
|
$ |
40,243 |
|
|
$ |
281,231 |
|
| MBS issued or guaranteed by U.S. agencies |
|
|
|
|
|
|
|
|
|
|
|
|
|
|
|
|
| Residential pass-through: |
|
|
|
|
|
|
|
|
|
|
|
|
|
|
|
|
| Guaranteed by GNMA |
|
|
78,279 |
|
|
|
— |
|
|
|
11,698 |
|
|
|
66,581 |
|
| Issued by FNMA and FHLMC |
|
|
4,604,954 |
|
|
|
16 |
|
|
|
639,414 |
|
|
|
3,965,556 |
|
| Other residential MBS |
|
|
958,911 |
|
|
|
6,110 |
|
|
|
30,300 |
|
|
|
934,721 |
|
| Commercial MBS |
|
|
1,645,065 |
|
|
|
1,605 |
|
|
|
97,029 |
|
|
|
1,549,641 |
|
| Total MBS |
|
|
7,287,209 |
|
|
|
7,731 |
|
|
|
778,441 |
|
|
|
6,516,499 |
|
| Obligations of states and political subdivisions |
|
|
167,743 |
|
|
|
10 |
|
|
|
35,684 |
|
|
|
132,069 |
|
| Corporate debt securities |
|
|
52,751 |
|
|
|
— |
|
|
|
5,349 |
|
|
|
47,402 |
|
| Foreign debt securities |
|
|
318,539 |
|
|
|
443 |
|
|
|
2,195 |
|
|
|
316,787 |
|
| Total available for sale securities |
|
$ |
8,147,696 |
|
|
$ |
8,204 |
|
|
$ |
861,912 |
|
|
$ |
7,293,988 |
|
| |
|
|
|
|
Gross |
|
|
Gross |
|
|
Estimated |
|
| |
|
Amortized |
|
|
Unrealized |
|
|
Unrealized |
|
|
Fair |
|
| (In thousands) |
|
Cost |
|
|
Gains |
|
|
Losses |
|
|
Value |
|
| December 31, 2023 |
|
|
|
|
|
|
|
|
|
|
|
|
|
|
|
|
| U.S Treasury securities |
|
$ |
464,793 |
|
|
$ |
225 |
|
|
$ |
— |
|
|
$ |
465,018 |
|
| U.S. government agency securities |
|
|
370,891 |
|
|
|
218 |
|
|
|
39,098 |
|
|
|
332,011 |
|
| MBS issued or guaranteed by U.S. agencies |
|
|
|
|
|
|
|
|
|
|
|
|
|
|
|
|
| Residential pass-through: |
|
|
|
|
|
|
|
|
|
|
|
|
|
|
|
|
| Guaranteed by GNMA |
|
|
85,806 |
|
|
|
1 |
|
|
|
10,145 |
|
|
|
75,662 |
|
| Issued by FNMA and FHLMC |
|
|
5,097,172 |
|
|
|
95 |
|
|
|
710,166 |
|
|
|
4,387,101 |
|
| Other residential MBS |
|
|
756,244 |
|
|
|
2,440 |
|
|
|
31,250 |
|
|
|
727,434 |
|
| Commercial MBS |
|
|
1,850,447 |
|
|
|
1,413 |
|
|
|
109,023 |
|
|
|
1,742,837 |
|
| Total MBS |
|
|
7,789,669 |
|
|
|
3,949 |
|
|
|
860,584 |
|
|
|
6,933,034 |
|
| Obligations of states and political subdivisions |
|
|
172,252 |
|
|
|
13 |
|
|
|
34,641 |
|
|
|
137,624 |
|
| Corporate debt securities |
|
|
73,941 |
|
|
|
— |
|
|
|
6,744 |
|
|
|
67,197 |
|
| Foreign debt securities |
|
|
144,080 |
|
|
|
6 |
|
|
|
3,494 |
|
|
|
140,592 |
|
| Total available for sale securities |
|
$ |
9,015,626 |
|
|
$ |
4,411 |
|
|
$ |
944,561 |
|
|
$ |
8,075,476 |
|
For available for sale securities, gross gains of $7 thousand and gross losses of $3.0 million were recognized in 2024, gross gains of $817 thousand and gross losses
of $436.5 million in 2023, and gross gains of $317 thousand and gross losses of $835 thousand were recognized in 2022. There were no impairment charges related to credit losses included in gross realized losses for the years ended December 31, 2024
2023, or 2022.
Available for sale securities with a carrying value of $4.0 billion and $6.6 billion at December 31, 2024 and December 31, 2023, respectively, were pledged to secure
public and trust funds on deposit and for other purposes.
Proceeds from the sales of securities available for sale totaled $15.1 million in 2024, $4.3 billion in 2023, and $369.6 million in 2022.
The amortized cost and estimated fair value of available for sale securities at December 31, 2024 by contractual maturity are shown below. Actual
maturities may differ from contractual maturities because borrowers may have the right to call or prepay obligations with or without call or prepayment penalties.
| |
|
Amortized |
|
|
Estimated |
|
| (In thousands) |
|
Cost |
|
|
Fair Value |
|
| Maturing in one year or less |
|
$ |
— |
|
|
$ |
— |
|
| Maturing after one year through five years |
|
|
108,300 |
|
|
|
105,514 |
|
| Maturing after five years through ten years |
|
|
520,442 |
|
|
|
494,821 |
|
| Maturing after ten years |
|
|
231,745 |
|
|
|
177,154 |
|
| Mortgage-backed securities |
|
|
7,287,209 |
|
|
|
6,516,499 |
|
| Total available for sale securities |
|
$ |
8,147,696 |
|
|
$ |
7,293,988 |
|
At December 31, 2024 and December 31, 2023, approximately 80.4% and 82.5% of securities were in an unrealized loss position, respectively. At
December 31, 2024, there were 871 securities in a loss position for more than twelve months, and 33 securities in a loss position for less than twelve months. At December 31, 2023, there were 827 securities in a loss position for more than twelve
months, and 91 securities in a loss position for less than twelve months. A summary of available for sale investments with continuous unrealized loss positions for which an allowance for credit losses has not been recorded is as follows:
| |
|
Less Than 12 Months |
|
|
12 Months or Longer |
|
| |
|
Fair |
|
|
Unrealized |
|
|
Fair |
|
|
Unrealized |
|
| (In thousands) |
|
Value |
|
|
Losses |
|
|
Value |
|
|
Losses |
|
| December 31, 2024 |
|
|
|
|
|
|
|
|
|
|
|
|
| U.S. government agency securities |
|
$ |
74,795 |
|
|
$ |
221 |
|
|
$ |
200,798 |
|
|
$ |
40,022 |
|
| MBS |
|
|
249,197 |
|
|
|
2,314 |
|
|
|
5,123,218 |
|
|
|
776,127 |
|
| Obligations of states and political subdivisions |
|
|
303 |
|
|
|
7 |
|
|
|
121,117 |
|
|
|
35,677 |
|
| Corporate debt securities |
|
|
7,474 |
|
|
|
2,527 |
|
|
|
37,928 |
|
|
|
2,822 |
|
| Foreign debt securities |
|
|
— |
|
|
|
— |
|
|
|
52,806 |
|
|
|
2,195 |
|
| Total |
|
$ |
331,769 |
|
|
$ |
5,069 |
|
|
$ |
5,535,867 |
|
|
$ |
856,843 |
|
| |
|
Less Than 12 Months |
|
|
12 Months or Longer |
|
| |
|
Fair |
|
|
Unrealized |
|
|
Fair |
|
|
Unrealized |
|
| (In thousands) |
|
Value |
|
|
Losses |
|
|
Value |
|
|
Losses |
|
| December 31, 2023 |
|
|
|
|
|
|
|
|
|
|
|
|
| U.S. government agency securities |
|
$ |
103,099 |
|
|
$ |
563 |
|
|
$ |
187,683 |
|
|
$ |
38,535 |
|
| MBS |
|
|
730,925 |
|
|
|
9,644 |
|
|
|
5,347,365 |
|
|
|
850,940 |
|
| Obligations of states and political subdivisions |
|
|
— |
|
|
|
— |
|
|
|
127,291 |
|
|
|
34,641 |
|
| Corporate debt securities |
|
|
— |
|
|
|
— |
|
|
|
46,197 |
|
|
|
6,744 |
|
| Foreign debt securities |
|
|
69,288 |
|
|
|
1 |
|
|
|
51,507 |
|
|
|
3,493 |
|
| Total |
|
$ |
903,312 |
|
|
$ |
10,208 |
|
|
$ |
5,760,043 |
|
|
$ |
934,353 |
|
Management evaluates available for sale securities in unrealized loss positions to determine whether the impairment is due to credit-related
factors or noncredit-related factors. Credit loss is defined as the difference between the present value of the cash flows expected to be collected and the amortized cost basis. Management believes that the unrealized losses detailed in the previous
tables are due to noncredit-related factors, such as changes in interest rates and other market conditions. Therefore, no allowance for credit losses was recorded related to these securities at December 31, 2024 or December 31, 2023. Additionally, as
of December 31, 2024 management had no intent to sell these securities until the full recovery of unrealized losses, which may not be until maturity, and it is more likely than not that the Company would not be required to sell the securities prior to
recovery of costs. The fair value is expected to recover as the securities approach their maturity date or repricing date or if market yields for such investments decline.
In 2023, the Company executed a securities portfolio restructuring as a part of a balance sheet optimization initiative. During the first quarter
of 2023 approximately $1.5 billion in U.S. Treasury available for sale securities were sold generating an after-tax realized loss of approximately $39.5 million. Additionally, in the fourth quarter of 2023, available for sale securities totaling
approximately $3.1 billion in par value were sold for an after-tax realized loss of approximately $294.1 million. Proceeds from the sale were redeployed in accretive activities including reinvestment in higher-yielding securities, funding loans, and
reducing brokered deposits.
Reported in other assets in the accompanying consolidated balance sheets, equity investments with readily determinable fair values not held for
trading are recorded at fair value, with changes in fair value reported in net income. Additionally, the Company reports equity investments without readily determinable fair values in other assets in the accompanying consolidated balance sheets. These
investments include investments in the common stock of the FHLB of Dallas and the Federal Reserve Bank of St. Louis. The Company is required to own stock in the FHLB of Dallas for membership in the FHLB system and in relation to the level of FHLB
advances. The company is also required to purchase and hold shares of capital stock in the Federal Reserve Bank of St. Louis for membership in the Federal Reserve System. The Company accounts for these investments as long-term assets and carries them
at cost. During the years ended December 31, 2024 and 2023, there were no downward or upward adjustments to these investments for impairments or price changes from observable transactions.
| |
|
|
|
|
Gross |
|
|
Gross |
|
|
|
|
| |
|
|
|
|
Unrealized |
|
|
Unrealized |
|
|
Carrying |
|
| (In thousands) |
|
Cost |
|
|
Gains |
|
|
Losses |
|
|
Value |
|
| December 31, 2024 |
|
|
|
|
|
|
|
|
|
|
|
|
|
|
|
|
| Equity securities held at cost: |
|
|
|
|
|
|
|
|
|
|
|
|
|
|
|
|
| Federal Reserve Bank stock |
|
$ |
100,567 |
|
|
$ |
— |
|
|
$ |
— |
|
|
$ |
100,567 |
|
| Federal Home Loan Bank stock |
|
|
10,410 |
|
|
|
— |
|
|
|
— |
|
|
|
10,410 |
|
| Other equity securities |
|
|
20,582 |
|
|
|
— |
|
|
|
— |
|
|
|
20,582 |
|
| Total equity securities, held at cost |
|
$ |
131,559 |
|
|
$ |
— |
|
|
$ |
— |
|
|
$ |
131,559 |
|
| Equity securities held at fair value: |
|
|
|
|
|
|
|
|
|
|
|
|
|
|
|
|
| Farmer Mac stock |
|
$ |
49 |
|
|
$ |
543 |
|
|
$ |
— |
|
|
$ |
592 |
|
| Affordable Housing MBS Exchange Traded Fund |
|
|
24,994 |
|
|
|
— |
|
|
|
3,908 |
|
|
|
21,086 |
|
| Total equity securities, held at fair value |
|
$ |
25,043 |
|
|
$ |
543 |
|
|
$ |
3,908 |
|
|
$ |
21,678 |
|
| |
|
|
|
|
Gross |
|
|
Gross |
|
|
|
|
| |
|
|
|
|
Unrealized |
|
|
Unrealized |
|
|
Carrying |
|
| (In thousands) |
|
Cost |
|
|
Gains |
|
|
Losses |
|
|
Value |
|
| December 31, 2023 |
|
|
|
|
|
|
|
|
|
|
|
|
|
|
|
|
| Equity securities held at cost: |
|
|
|
|
|
|
|
|
|
|
|
|
|
|
|
|
| Federal Home Loan Bank stock |
|
$ |
13,113 |
|
|
$ |
— |
|
|
$ |
— |
|
|
$ |
13,113 |
|
| Other equity securities |
|
|
20,582 |
|
|
|
— |
|
|
|
— |
|
|
|
20,582 |
|
| Total equity securities, held at cost |
|
$ |
33,695 |
|
|
$ |
— |
|
|
$ |
— |
|
|
$ |
33,695 |
|
| Equity securities held at fair value: |
|
|
|
|
|
|
|
|
|
|
|
|
|
|
|
|
| Farmer Mac stock |
|
$ |
49 |
|
|
$ |
536 |
|
|
$ |
— |
|
|
$ |
585 |
|
| Affordable Housing MBS Exchange Traded Fund |
|
|
24,994 |
|
|
|
— |
|
|
|
3,471 |
|
|
|
21,523 |
|
| Total equity securities, held at fair value |
|
$ |
25,043 |
|
|
$ |
536 |
|
|
$ |
3,471 |
|
|
$ |
22,108 |
|
NOTE 4. LOANS AND LEASES
The following table is a summary of our loan and lease portfolio aggregated by segment and class at the periods indicated:
| (In thousands) |
|
December 31, 2024 |
|
|
December 31, 2023 |
|
| Commercial and industrial |
|
|
|
|
|
|
|
|
| Non-real estate |
|
$ |
8,670,529 |
|
|
$ |
8,935,598 |
|
| Owner occupied |
|
|
4,665,015 |
|
|
|
4,349,060 |
|
| Total commercial and industrial |
|
|
13,335,544 |
|
|
|
13,284,658 |
|
| Commercial real estate |
|
|
|
|
|
|
|
|
| Construction, acquisition and development |
|
|
3,909,184 |
|
|
|
3,910,962 |
|
| Income producing |
|
|
6,015,773 |
|
|
|
5,736,871 |
|
| Total commercial real estate |
|
|
9,924,957 |
|
|
|
9,647,833 |
|
| Consumer |
|
|
|
|
|
|
|
|
| Residential mortgages |
|
|
10,267,883 |
|
|
|
9,329,692 |
|
| Other consumer |
|
|
213,371 |
|
|
|
234,839 |
|
| Total consumer |
|
|
10,481,254 |
|
|
|
9,564,531 |
|
| Total loans and leases, net of unearned income (1) |
|
$ |
33,741,755 |
|
|
$ |
32,497,022 |
|
|
(1) |
Total loans and leases are net of $21.4 million and $38.4 million of unearned income at December 31, 2024 and December 31, 2023, respectively. |
The Company engages in lending to consumers, small and medium-sized business enterprises, and government entities through its community banking
locations and to regional and national business enterprises through its corporate banking division. The bank acts as agent or participant in SNC and other financing arrangements with other financial institutions. Loans are issued generally to finance
home purchases and improvements, personal expenditures, business investment and operations, construction and development, and income producing properties. Loans are underwritten to be repaid primarily by available cash flow from personal income,
investment income, business operations, rental income, or the sale of developed or constructed properties. Collateral and personal guaranties of business owners are generally required as a condition of the financing arrangements and provide additional
cash flow and proceeds from asset sales of guarantors in the event primary sources of repayment are no longer sufficient.
While loans are structured to provide protection to the Company if borrowers are unable to repay as agreed, the Company recognizes there are
numerous risks that may result in deterioration of the repayment ability of borrowers and guarantors. These risks include failure of business operations due to economic, legal, market, logistical, weather, health, governmental and force majeure
events. Concentrations in the Company’s loan and lease portfolio also present credit risks. The impact of a slowing economy, inflation, higher interest rates, and labor and supply chain shortages, poses additional risk to borrowers and financial
institutions. As a result of these factors, there is risk for businesses to experience difficulty in meeting repayment obligations, and the Company may experience losses or deterioration in performance in its loan portfolio. For information regarding
nonaccrual policies, past-dues or delinquency status, and recognizing write-offs within ACL, refer to “Note 1 - Summary of Significant Accounting Policies” included in Part II., Item 8 for additional information.
The Company has identified the following segments and classes of loans and leases with similar risk characteristics for measuring expected credit
losses:
Commercial and Industrial
Non-Real Estate – Commercial and industrial loans are loans and leases to finance business operations, equipment and owner-occupied
facilities for small and medium-sized enterprises, as well as larger corporate borrowers. These include both lines of credit and term loans which are amortized over the useful life of the assets financed. Personal and/or corporate guarantees are
generally obtained where available and prudent. This category also includes loans to finance agricultural production. The Company recognizes risk from economic cycles, commodity prices, pandemics, government regulation, supply-chain disruptions,
product innovations or obsolescence, operational errors, lawsuits, natural disasters, losses due to fraud, theft or embezzlement, loss of sponsor support, health or loss of key personnel or competitive situations may adversely affect the scheduled
repayment of business loans. In addition, risks in the agricultural sector including crop failures due to weather, insects and other blights, commodity prices, governmental intervention, lawsuits, labor or logistical disruptions.
Owner Occupied – Owner occupied loans include loans secured by business facilities to finance business operations, equipment and
owner-occupied facilities primarily for small and medium-sized enterprises. These include both lines of credit and term loans which are amortized over the useful life of the assets financed. Personal guarantees, if applicable, are generally required
for these loans. The Company recognizes that risk from economic cycles, pandemics, government regulation, supply-chain disruptions, product innovations or obsolescence, operational errors, lawsuits, natural disasters, losses due to theft or
embezzlement, health or loss of key personnel, or competitive situations may adversely affect the scheduled repayment of business loans.
Commercial Real Estate
Construction, Acquisition and Development – CAD loans include both loans and credit lines for the purpose of purchasing, carrying, and
developing land into residential subdivisions or various types of commercial developments, such as industrial, warehouse, retail, office, and multi-family. This category also includes loans and credit lines for construction of residential, multi-family
and commercial buildings. The Company generally engages in CAD lending primarily in local markets served by its branches. The Company recognizes that risks are inherent in the financing of real estate development and construction. These risks include
location, market conditions and price volatility, change in interest rates, demand for developed land, lots and buildings, desirability of features and styling of completed developments and buildings, competition from other developments and builders,
traffic patterns, remote work patterns, governmental jurisdiction, tax structure, availability of utilities, roads, public transportation and schools, availability of permanent financing for homebuyers, zoning, environmental restrictions, lawsuits,
economic and business cycle, labor, and reputation of the builder or developer.
Each CAD loan is underwritten to address: (i) the desirability of the project, its market viability and projected absorption period; (ii) the
creditworthiness of the borrower and the guarantor as to liquidity, cash flow and assets available to ensure performance of the loan; (iii) equity contribution to the project; (iv) the developer’s experience and success with similar projects; and (v)
the value of the collateral.
A substantial portion of CAD loans are secured by real estate in markets in which the Company is located. The Company’s loan policy generally
prohibits loans for the sole purpose of carrying interest reserves. Certain of the construction, acquisition and development loans were structured with interest-only terms. A portion of the residential mortgage and CRE portfolios were originated
through the permanent financing of construction, acquisition and development loans. Higher interest rates and the potential for slowing economic conditions could negatively impact borrowers’ and guarantors’ ability to repay their debt which would make
more of the Company’s loans collateral-dependent.
Income Producing – CRE loans include loans to finance income-producing commercial and multi-family properties. Lending in this category is
generally limited to properties located in the Company’s market area with only limited exposure to properties located elsewhere but owned by in-market borrowers. Loans in this category include loans for neighborhood retail centers, medical and
professional offices, single retail stores, industrials and apartments leased generally to local businesses and residents. The underwriting of these loans takes into consideration the occupancy and rental rates as well as the financial health of the
borrower. The Company’s exposure to national retail tenants is limited. The Company recognizes that risk from economic cycles, pandemics, government restrictions, delayed or missed rent payments, supply-chain disruptions, operational errors, lawsuits,
natural disasters, losses due to theft or embezzlement, health or loss of key personnel or competitive situations may adversely affect the scheduled repayment of business loans.
Consumer
Residential Mortgages – Residential mortgages are first or second-lien loans to consumers secured by a primary residence or second home.
This category includes traditional mortgages, home equity loans and revolving lines of credit. The loans are generally secured by properties located within the local market area of the community bank which originates and services the loan. These loans
are underwritten in accordance with the Company’s general loan policies and procedures which require, among other things, proper documentation of each borrower’s financial condition, satisfactory credit history, and property value. In addition to loans
originated through the Company’s branches, the Company originates and services residential mortgages sold in the secondary market which are underwritten and closed pursuant to investor and agency guidelines. At December 31, 2024 and December 31, 2023,
residential mortgage loans in process of foreclosure totaled $19.7 million and $10.9 million, respectively. Additionally, the Company held $4.4 million in foreclosed residential properties at both December 31, 2024 and December 31, 2023, respectively.
Other Consumer – Other consumer lending includes consumer credit cards as well as personal revolving lines of credit and installment loans.
The Company offers credit cards, primarily to its deposit and loan customers. Consumer installment loans generally includes term loans secured by automobiles, boats and recreational vehicles.
The Company recognizes there are risks in consumer lending which include interruptions in the borrower’s personal and investment income due to
loss of employment, market conditions, and general economic conditions, deterioration in the health and well-being of the borrower and family members, natural disasters, pandemics, lawsuits, losses, or inability to generate income due to injury,
accidents, theft, vandalism, or incarceration.
Credit Quality
The following tables provide details regarding the aging of the Company’s loan and lease portfolio, net of unearned income, at the periods
indicated:
| |
|
December 31, 2024 |
|
| (In thousands) |
|
30-59
Days
Past Due |
|
|
60-89
Days
Past Due |
|
|
90+ Days
Past Due |
|
|
Total
Past Due |
|
|
Current |
|
|
Total
Amortized
Cost |
|
|
90+ Days
Past Due
still
Accruing |
|
| Commercial and industrial |
|
|
|
|
|
|
|
|
|
|
|
|
|
|
|
|
|
|
|
|
|
|
|
|
|
|
|
|
| Non-real estate |
|
$ |
13,443 |
|
|
$ |
28,379 |
|
|
$ |
101,873 |
|
|
$ |
143,695 |
|
|
$ |
8,526,834 |
|
|
$ |
8,670,529 |
|
|
$ |
8,115 |
|
| Owner occupied |
|
|
10,375 |
|
|
|
3,836 |
|
|
|
16,280 |
|
|
|
30,491 |
|
|
|
4,634,524 |
|
|
|
4,665,015 |
|
|
|
— |
|
| Total commercial and industrial |
|
|
23,818 |
|
|
|
32,215 |
|
|
|
118,153 |
|
|
|
174,186 |
|
|
|
13,161,358 |
|
|
|
13,335,544 |
|
|
|
8,115 |
|
| Commercial real estate |
|
|
|
|
|
|
|
|
|
|
|
|
|
|
|
|
|
|
|
|
|
|
|
|
|
|
|
|
| Construction, acquisition and development |
|
|
4,254 |
|
|
|
663 |
|
|
|
8,579 |
|
|
|
13,496 |
|
|
|
3,895,688 |
|
|
|
3,909,184 |
|
|
|
— |
|
| Income producing |
|
|
3,971 |
|
|
|
1,226 |
|
|
|
12,193 |
|
|
|
17,390 |
|
|
|
5,998,383 |
|
|
|
6,015,773 |
|
|
|
— |
|
| Total commercial real estate |
|
|
8,225 |
|
|
|
1,889 |
|
|
|
20,772 |
|
|
|
30,886 |
|
|
|
9,894,071 |
|
|
|
9,924,957 |
|
|
|
— |
|
| Consumer |
|
|
|
|
|
|
|
|
|
|
|
|
|
|
|
|
|
|
|
|
|
|
|
|
|
|
|
|
| Residential mortgages |
|
|
60,009 |
|
|
|
28,937 |
|
|
|
61,578 |
|
|
|
150,524 |
|
|
|
10,117,359 |
|
|
|
10,267,883 |
|
|
|
4,750 |
|
| Other consumer |
|
|
1,587 |
|
|
|
455 |
|
|
|
413 |
|
|
|
2,455 |
|
|
|
210,916 |
|
|
|
213,371 |
|
|
|
261 |
|
| Total consumer |
|
|
61,596 |
|
|
|
29,392 |
|
|
|
61,991 |
|
|
|
152,979 |
|
|
|
10,328,275 |
|
|
|
10,481,254 |
|
|
|
5,011 |
|
| Total |
|
$ |
93,639 |
|
|
$ |
63,496 |
|
|
$ |
200,916 |
|
|
$ |
358,051 |
|
|
$ |
33,383,704 |
|
|
$ |
33,741,755 |
|
|
$ |
13,126 |
|
| |
|
December 31, 2023 |
|
| |
|
|
|
|
|
|
|
|
|
|
|
|
|
|
|
|
|
|
|
90+ Days |
|
| |
|
30-59 |
|
|
60-89 |
|
|
|
|
|
|
|
|
|
|
|
Total |
|
|
Past Due |
|
| |
|
Days |
|
|
Days |
|
|
90+ Days |
|
|
Total |
|
|
|
|
|
Amortized |
|
|
still |
|
| (In thousands) |
|
Past Due |
|
|
Past Due |
|
|
Past Due |
|
|
Past Due |
|
|
Current |
|
|
Cost |
|
|
Accruing |
|
| Commercial and industrial |
|
|
|
|
|
|
|
|
|
|
|
|
|
|
|
|
|
|
|
|
|
|
|
|
|
|
|
|
| Non-real estate |
|
$ |
22,750 |
|
|
$ |
14,574 |
|
|
$ |
113,607 |
|
|
$ |
150,931 |
|
|
$ |
8,784,667 |
|
|
$ |
8,935,598 |
|
|
$ |
19,941 |
|
| Owner occupied |
|
|
4,818 |
|
|
|
1,193 |
|
|
|
5,882 |
|
|
|
11,893 |
|
|
|
4,337,167 |
|
|
|
4,349,060 |
|
|
|
— |
|
| Total commercial and industrial |
|
|
27,568 |
|
|
|
15,767 |
|
|
|
119,489 |
|
|
|
162,824 |
|
|
|
13,121,834 |
|
|
|
13,284,658 |
|
|
|
19,941 |
|
| Commercial real estate |
|
|
|
|
|
|
|
|
|
|
|
|
|
|
|
|
|
|
|
|
|
|
|
|
|
|
|
|
| Construction, acquisition and development |
|
|
1,394 |
|
|
|
1,191 |
|
|
|
1,878 |
|
|
|
4,463 |
|
|
|
3,906,499 |
|
|
|
3,910,962 |
|
|
|
18 |
|
| Income producing |
|
|
11,179 |
|
|
|
4,702 |
|
|
|
6,390 |
|
|
|
22,271 |
|
|
|
5,714,600 |
|
|
|
5,736,871 |
|
|
|
29 |
|
| Total commercial real estate |
|
|
12,573 |
|
|
|
5,893 |
|
|
|
8,268 |
|
|
|
26,734 |
|
|
|
9,621,099 |
|
|
|
9,647,833 |
|
|
|
47 |
|
| Consumer |
|
|
|
|
|
|
|
|
|
|
|
|
|
|
|
|
|
|
|
|
|
|
|
|
|
|
|
|
| Residential mortgages |
|
|
48,244 |
|
|
|
23,934 |
|
|
|
45,520 |
|
|
|
117,698 |
|
|
|
9,211,994 |
|
|
|
9,329,692 |
|
|
|
2,265 |
|
| Other consumer |
|
|
1,569 |
|
|
|
511 |
|
|
|
340 |
|
|
|
2,420 |
|
|
|
232,419 |
|
|
|
234,839 |
|
|
|
213 |
|
| Total consumer |
|
|
49,813 |
|
|
|
24,445 |
|
|
|
45,860 |
|
|
|
120,118 |
|
|
|
9,444,413 |
|
|
|
9,564,531 |
|
|
|
2,478 |
|
| Total |
|
$ |
89,954 |
|
|
$ |
46,105 |
|
|
$ |
173,617 |
|
|
$ |
309,676 |
|
|
$ |
32,187,346 |
|
|
$ |
32,497,022 |
|
|
$ |
22,466 |
|
The Company utilizes an internal loan classification system that is continually updated to grade loans according to certain credit quality
indicators. These credit quality indicators include, but are not limited to, recent credit performance, delinquency, liquidity, cash flows, debt coverage ratios, collateral type and loan-to-value ratio. The Company’s internal loan classification system
is compatible with classifications used by regulatory agencies. Loans may be classified as follows:
Pass: Loans which are performing as agreed with few or no signs of weakness. These loans show sufficient cash flow, capital and collateral to repay the loan
as agreed.
Special Mention: Loans where potential weaknesses have developed which could cause a more serious problem if not corrected.
Substandard: Loans where well-defined weaknesses exist that require corrective action to prevent further deterioration. Loans are further characterized by
the possibility that the Company will sustain some loss if the deficiencies are not corrected.
Doubtful: Loans having all the characteristics of Substandard and which have deteriorated to a point where collection and liquidation in full is highly
questionable.
Loss: Loans that are considered uncollectible or with limited possible recovery.
Impaired: An internal grade for individually analyzed collateral-dependent loans for which a specific provision has been considered to address the
unsupported exposure.
PCD (Loss): An internal grade for loans with evidence of deterioration of credit quality since origination that are acquired, and for which it is probable,
at acquisition, that the bank will be unable to collect all contractually required payments.
The following tables provide details of the Company’s loan and lease portfolio, net of unearned income, by segment, class and internally assigned
grade at the periods indicated:
| |
|
December 31, 2024 |
|
| (In thousands) |
|
Pass |
|
|
Special
Mention |
|
|
Substandard(1) |
|
|
Doubtful |
|
|
Impaired(1) |
|
|
PCD (Loss) |
|
|
Total |
|
| Commercial and industrial |
|
|
|
|
|
|
|
|
|
|
|
|
|
|
|
|
|
|
|
|
|
|
|
|
|
|
|
|
| Non-real estate |
|
$ |
8,208,176 |
|
|
$ |
106,996 |
|
|
$ |
311,096 |
|
|
$ |
8,743 |
|
|
$ |
31,996 |
|
|
$ |
3,522 |
|
|
$ |
8,670,529 |
|
| Owner occupied |
|
|
4,610,775 |
|
|
|
815 |
|
|
|
41,363 |
|
|
|
— |
|
|
|
10,968 |
|
|
|
1,094 |
|
|
|
4,665,015 |
|
| Total commercial and industrial |
|
|
12,818,951 |
|
|
|
107,811 |
|
|
|
352,459 |
|
|
|
8,743 |
|
|
|
42,964 |
|
|
|
4,616 |
|
|
|
13,335,544 |
|
| Commercial real estate |
|
|
|
|
|
|
|
|
|
|
|
|
|
|
|
|
|
|
|
|
|
|
|
|
|
|
|
|
| Construction, acquisition and development |
|
|
3,896,856 |
|
|
|
— |
|
|
|
12,262 |
|
|
|
— |
|
|
|
66 |
|
|
|
— |
|
|
|
3,909,184 |
|
| Income producing |
|
|
5,850,702 |
|
|
|
5,094 |
|
|
|
144,084 |
|
|
|
— |
|
|
|
15,893 |
|
|
|
— |
|
|
|
6,015,773 |
|
| Total commercial real estate |
|
|
9,747,558 |
|
|
|
5,094 |
|
|
|
156,346 |
|
|
|
— |
|
|
|
15,959 |
|
|
|
— |
|
|
|
9,924,957 |
|
| Consumer |
|
|
|
|
|
|
|
|
|
|
|
|
|
|
|
|
|
|
|
|
|
|
|
|
|
|
|
|
| Residential mortgages |
|
|
10,167,830 |
|
|
|
891 |
|
|
|
89,597 |
|
|
|
— |
|
|
|
8,154 |
|
|
|
1,411 |
|
|
|
10,267,883 |
|
| Other consumer |
|
|
212,865 |
|
|
|
— |
|
|
|
506 |
|
|
|
— |
|
|
|
— |
|
|
|
— |
|
|
|
213,371 |
|
| Total consumer |
|
|
10,380,695 |
|
|
|
891 |
|
|
|
90,103 |
|
|
|
— |
|
|
|
8,154 |
|
|
|
1,411 |
|
|
|
10,481,254 |
|
| Total |
|
$ |
32,947,204 |
|
|
$ |
113,796 |
|
|
$ |
598,908 |
|
|
$ |
8,743 |
|
|
$ |
67,077 |
|
|
$ |
6,027 |
|
|
$ |
33,741,755 |
|
|
(1) |
In the loan classifications above, $99.0 million of the substandard balance and $11.1 million of the impaired balance is covered by government guarantees from the SBA, FHA, VA and USDA. |
| |
|
December 31, 2023 |
|
| (In thousands) |
|
Pass |
|
|
Special
Mention |
|
|
Substandard (1) |
|
|
Loss |
|
|
Impaired (1) |
|
|
PCD (Loss) |
|
|
Total |
|
| Commercial and industrial |
|
|
|
|
|
|
|
|
|
|
|
|
|
|
|
|
|
|
|
|
|
|
|
|
|
|
|
|
| Non-real estate |
|
$ |
8,450,809 |
|
|
$ |
101,607 |
|
|
$ |
294,895 |
|
|
$ |
13 |
|
|
$ |
84,457 |
|
|
$ |
3,817 |
|
|
$ |
8,935,598 |
|
| Owner occupied |
|
|
4,287,190 |
|
|
|
32,409 |
|
|
|
27,070 |
|
|
|
— |
|
|
|
1,275 |
|
|
|
1,116 |
|
|
|
4,349,060 |
|
| Total commercial and industrial |
|
|
12,737,999 |
|
|
|
134,016 |
|
|
|
321,965 |
|
|
|
13 |
|
|
|
85,732 |
|
|
|
4,933 |
|
|
|
13,284,658 |
|
| Commercial real estate |
|
|
|
|
|
|
|
|
|
|
|
|
|
|
|
|
|
|
|
|
|
|
|
|
|
|
|
|
| Construction, acquisition and development |
|
|
3,894,551 |
|
|
|
3,364 |
|
|
|
13,047 |
|
|
|
— |
|
|
|
— |
|
|
|
— |
|
|
|
3,910,962 |
|
| Income producing |
|
|
5,527,388 |
|
|
|
23,727 |
|
|
|
170,217 |
|
|
|
— |
|
|
|
15,539 |
|
|
|
— |
|
|
|
5,736,871 |
|
| Total commercial real estate |
|
|
9,421,939 |
|
|
|
27,091 |
|
|
|
183,264 |
|
|
|
— |
|
|
|
15,539 |
|
|
|
— |
|
|
|
9,647,833 |
|
| Consumer |
|
|
|
|
|
|
|
|
|
|
|
|
|
|
|
|
|
|
|
|
|
|
|
|
|
|
|
|
| Residential mortgages |
|
|
9,258,002 |
|
|
|
4,066 |
|
|
|
66,050 |
|
|
|
— |
|
|
|
— |
|
|
|
1,574 |
|
|
|
9,329,692 |
|
| Other consumer |
|
|
234,367 |
|
|
|
— |
|
|
|
472 |
|
|
|
— |
|
|
|
— |
|
|
|
— |
|
|
|
234,839 |
|
| Total consumer |
|
|
9,492,369 |
|
|
|
4,066 |
|
|
|
66,522 |
|
|
|
— |
|
|
|
— |
|
|
|
1,574 |
|
|
|
9,564,531 |
|
| Total |
|
$ |
31,652,307 |
|
|
$ |
165,173 |
|
|
$ |
571,751 |
|
|
$ |
13 |
|
|
$ |
101,271 |
|
|
$ |
6,507 |
|
|
$ |
32,497,022 |
|
|
(1) |
In the loan classifications above, $61.1 million of the substandard balance and $8.4 million of the impaired balance is covered by government guarantees from the SBA, FHA, VA and USDA. |
The following tables provide credit quality indicators, including gross charge-offs, by class and period of origination (vintage) at December 31,
2024:
| |
|
Commercial and Industrial - Non-Real Estate |
|
| |
|
Period Originated: |
|
|
|
|
|
|
|
|
|
|
| |
|
|
|
|
|
|
|
|
|
|
|
|
|
|
|
|
|
|
|
|
|
|
Revolving |
|
|
|
|
| |
|
|
|
|
|
|
|
|
|
|
|
|
|
|
|
|
|
|
|
|
|
|
Loans |
|
|
|
|
| |
|
|
|
|
|
|
|
|
|
|
|
|
|
|
|
|
|
|
|
Revolving |
|
|
Converted to |
|
|
|
|
| (Dollars in thousands) |
|
2024 |
|
|
2023 |
|
|
2022 |
|
|
2021 |
|
|
2020 |
|
|
Prior |
|
|
Loans |
|
|
Term |
|
|
Total |
|
| Pass |
|
$ |
1,361,684 |
|
|
$ |
926,422 |
|
|
$ |
1,036,579 |
|
|
$ |
695,625 |
|
|
$ |
209,100 |
|
|
$ |
563,337 |
|
|
$ |
3,397,031 |
|
|
$ |
18,398 |
|
|
$ |
8,208,176 |
|
| Special Mention |
|
|
13,242 |
|
|
|
10,942 |
|
|
|
— |
|
|
|
23,158 |
|
|
|
18,337 |
|
|
|
— |
|
|
|
41,317 |
|
|
|
— |
|
|
|
106,996 |
|
| Substandard |
|
|
8,855 |
|
|
|
49,842 |
|
|
|
70,136 |
|
|
|
43,832 |
|
|
|
12,370 |
|
|
|
27,648 |
|
|
|
75,638 |
|
|
|
22,775 |
|
|
|
311,096 |
|
| Doubtful |
|
|
— |
|
|
|
— |
|
|
|
— |
|
|
|
8,743 |
|
|
|
— |
|
|
|
— |
|
|
|
— |
|
|
|
— |
|
|
|
8,743 |
|
| Impaired |
|
|
— |
|
|
|
1,485 |
|
|
|
2,773 |
|
|
|
9,013 |
|
|
|
— |
|
|
|
— |
|
|
|
18,725 |
|
|
|
— |
|
|
|
31,996 |
|
| PCD (Loss) |
|
|
— |
|
|
|
— |
|
|
|
— |
|
|
|
— |
|
|
|
— |
|
|
|
3,522 |
|
|
|
— |
|
|
|
— |
|
|
|
3,522 |
|
| Total |
|
$ |
1,383,781 |
|
|
$ |
988,691 |
|
|
$ |
1,109,488 |
|
|
$ |
780,371 |
|
|
$ |
239,807 |
|
|
$ |
594,507 |
|
|
$ |
3,532,711 |
|
|
$ |
41,173 |
|
|
$ |
8,670,529 |
|
| % Criticized |
|
|
1.6 |
% |
|
|
6.3 |
% |
|
|
6.6 |
% |
|
|
10.9 |
% |
|
|
12.8 |
% |
|
|
5.2 |
% |
|
|
3.8 |
% |
|
|
55.3 |
% |
|
|
5.3 |
% |
| Gross charge-offs |
|
$ |
1,892 |
|
|
$ |
7,811 |
|
|
$ |
22,112 |
|
|
$ |
15,703 |
|
|
$ |
956 |
|
|
$ |
16,786 |
|
|
$ |
7,416 |
|
|
$ |
4,018 |
|
|
$ |
76,694 |
|
| |
|
Commercial and Industrial - Owner Occupied |
|
| |
|
Period Originated: |
|
|
|
|
|
|
|
|
|
|
| |
|
|
|
|
|
|
|
|
|
|
|
|
|
|
|
|
|
|
|
|
|
|
Revolving |
|
|
|
|
| |
|
|
|
|
|
|
|
|
|
|
|
|
|
|
|
|
|
|
|
|
|
|
Loans |
|
|
|
|
| |
|
|
|
|
|
|
|
|
|
|
|
|
|
|
|
|
|
|
|
Revolving |
|
|
Converted to |
|
|
|
|
| (Dollars in thousands) |
|
2024 |
|
|
2023 |
|
|
2022 |
|
|
2021 |
|
|
2020 |
|
|
Prior |
|
|
Loans |
|
|
Term |
|
|
Total |
|
| Pass |
|
$ |
704,999 |
|
|
$ |
607,548 |
|
|
$ |
893,114 |
|
|
$ |
756,156 |
|
|
$ |
402,671 |
|
|
$ |
1,122,908 |
|
|
$ |
123,149 |
|
|
$ |
230 |
|
|
$ |
4,610,775 |
|
| Special Mention |
|
|
— |
|
|
|
— |
|
|
|
— |
|
|
|
— |
|
|
|
815 |
|
|
|
— |
|
|
|
— |
|
|
|
— |
|
|
|
815 |
|
| Substandard |
|
|
2,249 |
|
|
|
5,616 |
|
|
|
6,638 |
|
|
|
5,204 |
|
|
|
2,057 |
|
|
|
18,889 |
|
|
|
710 |
|
|
|
— |
|
|
|
41,363 |
|
| Impaired |
|
|
394 |
|
|
|
2,335 |
|
|
|
5,911 |
|
|
|
1,053 |
|
|
|
— |
|
|
|
1,275 |
|
|
|
— |
|
|
|
— |
|
|
|
10,968 |
|
| PCD (Loss) |
|
|
— |
|
|
|
— |
|
|
|
— |
|
|
|
— |
|
|
|
— |
|
|
|
1,094 |
|
|
|
— |
|
|
|
— |
|
|
|
1,094 |
|
| Total |
|
$ |
707,642 |
|
|
$ |
615,499 |
|
|
$ |
905,663 |
|
|
$ |
762,413 |
|
|
$ |
405,543 |
|
|
$ |
1,144,166 |
|
|
$ |
123,859 |
|
|
$ |
230 |
|
|
$ |
4,665,015 |
|
| % Criticized |
|
|
0.4 |
% |
|
|
1.3 |
% |
|
|
1.4 |
% |
|
|
0.8 |
% |
|
|
0.7 |
% |
|
|
1.9 |
% |
|
|
0.6 |
% |
|
|
— |
% |
|
|
1.2 |
% |
| Gross charge-offs |
|
$ |
— |
|
|
$ |
1 |
|
|
$ |
263 |
|
|
$ |
6 |
|
|
$ |
41 |
|
|
$ |
67 |
|
|
$ |
1 |
|
|
$ |
— |
|
|
$ |
379 |
|
| |
|
Construction, Acquisition, & Development |
|
| |
|
Period Originated: |
|
|
|
|
|
|
|
|
|
|
| (Dollars in thousands) |
|
2024 |
|
|
2023 |
|
|
2022 |
|
|
2021 |
|
|
2020 |
|
|
Prior |
|
|
Revolving
Loans |
|
|
Revolving
Loans
Converted to
Term |
|
|
Total |
|
| Pass |
|
$ |
1,058,203 |
|
|
$ |
790,695 |
|
|
$ |
1,261,256 |
|
|
$ |
592,454 |
|
|
$ |
50,123 |
|
|
$ |
76,347 |
|
|
$ |
64,061 |
|
|
$ |
3,717 |
|
|
$ |
3,896,856 |
|
| Substandard |
|
|
264 |
|
|
|
2,032 |
|
|
|
3,514 |
|
|
|
5,889 |
|
|
|
304 |
|
|
|
259 |
|
|
|
— |
|
|
|
— |
|
|
|
12,262 |
|
| Impaired |
|
|
— |
|
|
|
— |
|
|
|
— |
|
|
|
— |
|
|
|
66 |
|
|
|
— |
|
|
|
— |
|
|
|
— |
|
|
|
66 |
|
| Total |
|
$ |
1,058,467 |
|
|
$ |
792,727 |
|
|
$ |
1,264,770 |
|
|
$ |
598,343 |
|
|
$ |
50,493 |
|
|
$ |
76,606 |
|
|
$ |
64,061 |
|
|
$ |
3,717 |
|
|
$ |
3,909,184 |
|
| % Criticized |
|
|
— |
% |
|
|
0.3 |
% |
|
|
0.3 |
% |
|
|
1.0 |
% |
|
|
0.7 |
% |
|
|
0.3 |
% |
|
|
— |
% |
|
|
— |
% |
|
|
0.3 |
% |
| Gross charge-offs |
|
$ |
— |
|
|
$ |
19 |
|
|
$ |
101 |
|
|
$ |
537 |
|
|
$ |
35 |
|
|
$ |
2 |
|
|
$ |
85 |
|
|
$ |
— |
|
|
$ |
779 |
|
| |
|
Commercial Real Estate - Income Producing |
|
| |
|
Period Originated: |
|
|
|
|
|
|
|
|
|
|
| (Dollars in thousands) |
|
2024 |
|
|
2023 |
|
|
2022 |
|
|
2021 |
|
|
2020 |
|
|
Prior |
|
|
Revolving
Loans |
|
|
Revolving
Loans
Converted to
Term |
|
|
Total |
|
| Pass |
|
$ |
497,633 |
|
|
$ |
540,956 |
|
|
$ |
1,595,416 |
|
|
$ |
1,192,329 |
|
|
$ |
511,254 |
|
|
$ |
1,404,264 |
|
|
$ |
108,850 |
|
|
$ |
— |
|
|
$ |
5,850,702 |
|
| Special Mention |
|
|
— |
|
|
|
— |
|
|
|
2,881 |
|
|
|
— |
|
|
|
— |
|
|
|
— |
|
|
|
2,213 |
|
|
|
— |
|
|
|
5,094 |
|
| Substandard |
|
|
— |
|
|
|
459 |
|
|
|
468 |
|
|
|
7,690 |
|
|
|
70,889 |
|
|
|
64,084 |
|
|
|
494 |
|
|
|
— |
|
|
|
144,084 |
|
| Impaired |
|
|
— |
|
|
|
— |
|
|
|
4,885 |
|
|
|
1,114 |
|
|
|
— |
|
|
|
9,894 |
|
|
|
— |
|
|
|
— |
|
|
|
15,893 |
|
| Total |
|
$ |
497,633 |
|
|
$ |
541,415 |
|
|
$ |
1,603,650 |
|
|
$ |
1,201,133 |
|
|
$ |
582,143 |
|
|
$ |
1,478,242 |
|
|
$ |
111,557 |
|
|
$ |
— |
|
|
$ |
6,015,773 |
|
| % Criticized |
|
|
— |
% |
|
|
0.1 |
% |
|
|
0.5 |
% |
|
|
0.7 |
% |
|
|
12.2 |
% |
|
|
5.0 |
% |
|
|
2.4 |
% |
|
|
— |
% |
|
|
2.7 |
% |
| Gross charge-offs |
|
$ |
— |
|
|
$ |
— |
|
|
$ |
3 |
|
|
$ |
21 |
|
|
$ |
— |
|
|
$ |
2,479 |
|
|
$ |
— |
|
|
$ |
— |
|
|
$ |
2,503 |
|
| |
|
Consumer - Residential Mortgages |
|
| |
|
Period Originated: |
|
|
|
|
|
|
|
|
|
|
| (Dollars in thousands) |
|
2024 |
|
|
2023 |
|
|
2022 |
|
|
2021 |
|
|
2020 |
|
|
Prior |
|
|
Revolving
Loans |
|
|
Revolving
Loans
Converted to
Term |
|
|
Total |
|
| Pass |
|
$ |
1,356,015 |
|
|
$ |
1,477,090 |
|
|
$ |
1,991,600 |
|
|
$ |
1,545,259 |
|
|
$ |
992,426 |
|
|
$ |
1,734,512 |
|
|
$ |
1,069,608 |
|
|
$ |
1,320 |
|
|
$ |
10,167,830 |
|
| Special Mention |
|
|
101 |
|
|
|
790 |
|
|
|
— |
|
|
|
— |
|
|
|
— |
|
|
|
— |
|
|
|
— |
|
|
|
— |
|
|
|
891 |
|
| Substandard |
|
|
1,549 |
|
|
|
12,696 |
|
|
|
18,477 |
|
|
|
14,661 |
|
|
|
9,145 |
|
|
|
28,774 |
|
|
|
4,295 |
|
|
|
— |
|
|
|
89,597 |
|
| Impaired |
|
|
— |
|
|
|
— |
|
|
|
— |
|
|
|
3,979 |
|
|
|
1,675 |
|
|
|
— |
|
|
|
2,500 |
|
|
|
— |
|
|
|
8,154 |
|
| PCD (Loss) |
|
|
— |
|
|
|
— |
|
|
|
— |
|
|
|
— |
|
|
|
— |
|
|
|
1,411 |
|
|
|
— |
|
|
|
— |
|
|
|
1,411 |
|
| Total |
|
$ |
1,357,665 |
|
|
$ |
1,490,576 |
|
|
$ |
2,010,077 |
|
|
$ |
1,563,899 |
|
|
$ |
1,003,246 |
|
|
$ |
1,764,697 |
|
|
$ |
1,076,403 |
|
|
$ |
1,320 |
|
|
$ |
10,267,883 |
|
| % Criticized |
|
|
0.1 |
% |
|
|
0.9 |
% |
|
|
0.9 |
% |
|
|
1.2 |
% |
|
|
1.1 |
% |
|
|
1.7 |
% |
|
|
0.6 |
% |
|
|
— |
% |
|
|
1.0 |
% |
| Gross charge-offs |
|
$ |
10 |
|
|
$ |
325 |
|
|
$ |
559 |
|
|
$ |
430 |
|
|
$ |
81 |
|
|
$ |
749 |
|
|
$ |
1,007 |
|
|
$ |
— |
|
|
$ |
3,161 |
|
| |
|
Consumer - Other Consumer |
|
| |
|
Period Originated: |
|
|
|
|
|
|
|
|
|
|
| (Dollars in thousands) |
|
2024 |
|
|
2023 |
|
|
2022 |
|
|
2021 |
|
|
2020 |
|
|
Prior |
|
|
Revolving
Loans |
|
|
Revolving
Loans
Converted to
Term |
|
|
Total |
|
| Pass |
|
$ |
45,997 |
|
|
$ |
29,538 |
|
|
$ |
11,471 |
|
|
$ |
6,150 |
|
|
$ |
3,263 |
|
|
$ |
2,105 |
|
|
$ |
114,341 |
|
|
$ |
— |
|
|
$ |
212,865 |
|
| Substandard |
|
|
— |
|
|
|
97 |
|
|
|
48 |
|
|
|
6 |
|
|
|
— |
|
|
|
17 |
|
|
|
338 |
|
|
|
— |
|
|
|
506 |
|
| Total |
|
$ |
45,997 |
|
|
$ |
29,635 |
|
|
$ |
11,519 |
|
|
$ |
6,156 |
|
|
$ |
3,263 |
|
|
$ |
2,122 |
|
|
$ |
114,679 |
|
|
$ |
— |
|
|
$ |
213,371 |
|
| % Criticized |
|
|
— |
% |
|
|
0.3 |
% |
|
|
0.4 |
% |
|
|
0.1 |
% |
|
|
— |
% |
|
|
0.8 |
% |
|
|
0.3 |
% |
|
|
— |
% |
|
|
0.2 |
% |
| Gross charge-offs |
|
$ |
3,067 |
|
|
$ |
395 |
|
|
$ |
303 |
|
|
$ |
145 |
|
|
$ |
14 |
|
|
$ |
47 |
|
|
$ |
2,917 |
|
|
$ |
— |
|
|
$ |
6,888 |
|
The following tables provide credit quality indicators, including gross charge-offs, by class and period of origination (vintage) at December 31, 2023.
| |
|
Commercial and Industrial - Non-Real Estate |
|
| |
|
Period Originated: |
|
|
|
|
|
|
|
|
|
|
| (Dollars in thousands) |
|
2023 |
|
|
2022 |
|
|
2021 |
|
|
2020 |
|
|
2019 |
|
|
Prior |
|
|
Revolving
Loans |
|
|
Revolving
Loans
Converted to
Term |
|
|
Total |
|
| Pass |
|
$ |
1,211,573 |
|
|
$ |
1,425,415 |
|
|
$ |
1,069,614 |
|
|
$ |
279,689 |
|
|
$ |
228,086 |
|
|
$ |
610,891 |
|
|
$ |
3,583,696 |
|
|
$ |
41,845 |
|
|
$ |
8,450,809 |
|
| Special Mention |
|
|
— |
|
|
|
10,155 |
|
|
|
30,042 |
|
|
|
11,599 |
|
|
|
2,220 |
|
|
|
16,096 |
|
|
|
31,495 |
|
|
|
— |
|
|
|
101,607 |
|
| Substandard |
|
|
22,458 |
|
|
|
88,307 |
|
|
|
69,226 |
|
|
|
7,381 |
|
|
|
27,439 |
|
|
|
40,071 |
|
|
|
39,995 |
|
|
|
18 |
|
|
|
294,895 |
|
| Loss |
|
|
— |
|
|
|
— |
|
|
|
— |
|
|
|
— |
|
|
|
— |
|
|
|
13 |
|
|
|
— |
|
|
|
— |
|
|
|
13 |
|
| Impaired |
|
|
635 |
|
|
|
14,187 |
|
|
|
22,057 |
|
|
|
— |
|
|
|
— |
|
|
|
20,475 |
|
|
|
5,904 |
|
|
|
21,199 |
|
|
|
84,457 |
|
| PCD (Loss) |
|
|
— |
|
|
|
— |
|
|
|
— |
|
|
|
— |
|
|
|
— |
|
|
|
3,817 |
|
|
|
— |
|
|
|
— |
|
|
|
3,817 |
|
| Total |
|
$ |
1,234,666 |
|
|
$ |
1,538,064 |
|
|
$ |
1,190,939 |
|
|
$ |
298,669 |
|
|
$ |
257,745 |
|
|
$ |
691,363 |
|
|
$ |
3,661,090 |
|
|
$ |
63,062 |
|
|
$ |
8,935,598 |
|
| % Criticized |
|
|
1.9 |
% |
|
|
7.3 |
% |
|
|
10.2 |
% |
|
|
6.4 |
% |
|
|
11.5 |
% |
|
|
11.6 |
% |
|
|
2.1 |
% |
|
|
33.6 |
% |
|
|
5.4 |
% |
| Gross charge-offs |
|
$ |
6,064 |
|
|
$ |
539 |
|
|
$ |
21,038 |
|
|
$ |
6,103 |
|
|
$ |
980 |
|
|
$ |
9,746 |
|
|
$ |
27,931 |
|
|
$ |
— |
|
|
$ |
72,401 |
|
| |
|
Commercial and Industrial - Owner Occupied |
|
| |
|
Period Originated: |
|
|
|
|
|
|
|
|
|
|
| (Dollars in thousands) |
|
2023 |
|
|
2022 |
|
|
2021 |
|
|
2020 |
|
|
2019 |
|
|
Prior |
|
|
Revolving
Loans |
|
|
Revolving
Loans
Converted to
Term |
|
|
Total |
|
| Pass |
|
$ |
535,962 |
|
|
$ |
974,614 |
|
|
$ |
844,507 |
|
|
$ |
472,226 |
|
|
$ |
309,595 |
|
|
$ |
1,041,764 |
|
|
$ |
108,522 |
|
|
$ |
— |
|
|
$ |
4,287,190 |
|
| Special Mention |
|
|
6,066 |
|
|
|
5,637 |
|
|
|
— |
|
|
|
— |
|
|
|
845 |
|
|
|
17,036 |
|
|
|
2,825 |
|
|
|
— |
|
|
|
32,409 |
|
| Substandard |
|
|
747 |
|
|
|
1,893 |
|
|
|
3,584 |
|
|
|
2,647 |
|
|
|
5,431 |
|
|
|
12,686 |
|
|
|
82 |
|
|
|
— |
|
|
|
27,070 |
|
| Impaired |
|
|
— |
|
|
|
— |
|
|
|
— |
|
|
|
— |
|
|
|
— |
|
|
|
1,275 |
|
|
|
— |
|
|
|
— |
|
|
|
1,275 |
|
| PCD (Loss) |
|
|
— |
|
|
|
— |
|
|
|
— |
|
|
|
— |
|
|
|
1,116 |
|
|
|
— |
|
|
|
— |
|
|
|
— |
|
|
|
1,116 |
|
| Total |
|
$ |
542,775 |
|
|
$ |
982,144 |
|
|
$ |
848,091 |
|
|
$ |
474,873 |
|
|
$ |
316,987 |
|
|
$ |
1,072,761 |
|
|
$ |
111,429 |
|
|
$ |
— |
|
|
$ |
4,349,060 |
|
| % Criticized |
|
|
1.3 |
% |
|
|
0.8 |
% |
|
|
0.4 |
% |
|
|
0.6 |
% |
|
|
2.3 |
% |
|
|
2.9 |
% |
|
|
2.6 |
% |
|
|
— |
% |
|
|
1.4 |
% |
| Gross charge-offs |
|
$ |
— |
|
|
$ |
169 |
|
|
$ |
109 |
|
|
$ |
1 |
|
|
$ |
5 |
|
|
$ |
110 |
|
|
$ |
— |
|
|
$ |
— |
|
|
$ |
394 |
|
| |
|
Construction, Acquisition & Development |
|
| |
|
Period Originated: |
|
|
|
|
|
|
|
|
|
|
| (Dollars in thousands) |
|
2023 |
|
|
2022 |
|
|
2021 |
|
|
2020 |
|
|
2019 |
|
|
Prior |
|
|
Revolving
Loans |
|
|
Revolving
Loans
Converted to
Term |
|
|
Total |
|
| Pass |
|
$ |
984,843 |
|
|
$ |
1,644,676 |
|
|
$ |
906,293 |
|
|
$ |
147,645 |
|
|
$ |
65,953 |
|
|
$ |
47,211 |
|
|
$ |
97,930 |
|
|
$ |
— |
|
|
$ |
3,894,551 |
|
| Special Mention |
|
|
824 |
|
|
|
1,552 |
|
|
|
— |
|
|
|
— |
|
|
|
988 |
|
|
|
— |
|
|
|
— |
|
|
|
— |
|
|
|
3,364 |
|
| Substandard |
|
|
52 |
|
|
|
1,785 |
|
|
|
9,674 |
|
|
|
340 |
|
|
|
902 |
|
|
|
158 |
|
|
|
136 |
|
|
|
— |
|
|
|
13,047 |
|
| Total |
|
$ |
985,719 |
|
|
$ |
1,648,013 |
|
|
$ |
915,967 |
|
|
$ |
147,985 |
|
|
$ |
67,843 |
|
|
$ |
47,369 |
|
|
$ |
98,066 |
|
|
$ |
— |
|
|
$ |
3,910,962 |
|
| % Criticized |
|
|
0.1 |
% |
|
|
0.2 |
% |
|
|
1.1 |
% |
|
|
0.2 |
% |
|
|
2.8 |
% |
|
|
0.3 |
% |
|
|
0.1 |
% |
|
|
— |
% |
|
|
0.4 |
% |
| Gross charge-offs |
|
$ |
— |
|
|
$ |
28 |
|
|
$ |
600 |
|
|
$ |
2 |
|
|
$ |
— |
|
|
$ |
178 |
|
|
$ |
— |
|
|
$ |
— |
|
|
$ |
808 |
|
| |
|
Commercial Real Estate - Income Producing |
|
| |
|
Period Originated: |
|
|
|
|
|
|
|
|
|
|
| (Dollars in thousands) |
|
2023 |
|
|
2022 |
|
|
2021 |
|
|
2020 |
|
|
2019 |
|
|
Prior |
|
|
Revolving
Loans |
|
|
Revolving
Loans
Converted to
Term |
|
|
Total |
|
| Pass |
|
$ |
490,336 |
|
|
$ |
1,358,612 |
|
|
$ |
1,235,035 |
|
|
$ |
574,173 |
|
|
$ |
518,213 |
|
|
$ |
1,260,960 |
|
|
$ |
90,059 |
|
|
$ |
— |
|
|
$ |
5,527,388 |
|
| Special Mention |
|
|
— |
|
|
|
3,221 |
|
|
|
10,349 |
|
|
|
— |
|
|
|
6,051 |
|
|
|
4,106 |
|
|
|
— |
|
|
|
— |
|
|
|
23,727 |
|
| Substandard |
|
|
— |
|
|
|
24,989 |
|
|
|
6,400 |
|
|
|
35,063 |
|
|
|
34,158 |
|
|
|
69,607 |
|
|
|
— |
|
|
|
— |
|
|
|
170,217 |
|
| Impaired |
|
|
— |
|
|
|
— |
|
|
|
— |
|
|
|
— |
|
|
|
— |
|
|
|
15,539 |
|
|
|
— |
|
|
|
— |
|
|
|
15,539 |
|
| Total |
|
$ |
490,336 |
|
|
$ |
1,386,822 |
|
|
$ |
1,251,784 |
|
|
$ |
609,236 |
|
|
$ |
558,422 |
|
|
$ |
1,350,212 |
|
|
$ |
90,059 |
|
|
$ |
— |
|
|
$ |
5,736,871 |
|
| % Criticized |
|
|
— |
% |
|
|
2.0 |
% |
|
|
1.3 |
% |
|
|
5.8 |
% |
|
|
7.2 |
% |
|
|
6.6 |
% |
|
|
— |
% |
|
|
— |
% |
|
|
3.7 |
% |
| Gross charge-offs |
|
$ |
— |
|
|
$ |
— |
|
|
$ |
1 |
|
|
$ |
— |
|
|
$ |
— |
|
|
$ |
4,526 |
|
|
$ |
— |
|
|
$ |
— |
|
|
$ |
4,527 |
|
| |
|
Consumer - Residential Mortgages |
|
| |
|
Period Originated: |
|
|
|
|
|
|
|
|
|
|
| (Dollars in thousands) |
|
2023 |
|
|
2022 |
|
|
2021 |
|
|
2020 |
|
|
2019 |
|
|
Prior |
|
|
Revolving
Loans |
|
|
Revolving
Loans
Converted to
Term |
|
|
Total |
|
| Pass |
|
$ |
1,486,784 |
|
|
$ |
2,011,519 |
|
|
$ |
1,686,270 |
|
|
$ |
1,099,734 |
|
|
$ |
544,597 |
|
|
$ |
1,462,355 |
|
|
$ |
965,626 |
|
|
$ |
1,117 |
|
|
$ |
9,258,002 |
|
| Special Mention |
|
|
— |
|
|
|
— |
|
|
|
4,066 |
|
|
|
— |
|
|
|
— |
|
|
|
— |
|
|
|
— |
|
|
|
— |
|
|
|
4,066 |
|
| Substandard |
|
|
1,423 |
|
|
|
6,525 |
|
|
|
10,951 |
|
|
|
9,437 |
|
|
|
8,313 |
|
|
|
25,864 |
|
|
|
3,537 |
|
|
|
— |
|
|
|
66,050 |
|
| PCD (Loss) |
|
|
— |
|
|
|
— |
|
|
|
— |
|
|
|
— |
|
|
|
— |
|
|
|
1,574 |
|
|
|
— |
|
|
|
— |
|
|
|
1,574 |
|
| Total |
|
$ |
1,488,207 |
|
|
$ |
2,018,044 |
|
|
$ |
1,701,287 |
|
|
$ |
1,109,171 |
|
|
$ |
552,910 |
|
|
$ |
1,489,793 |
|
|
$ |
969,163 |
|
|
$ |
1,117 |
|
|
$ |
9,329,692 |
|
| % Criticized |
|
|
0.1 |
% |
|
|
0.3 |
% |
|
|
0.9 |
% |
|
|
0.9 |
% |
|
|
1.5 |
% |
|
|
1.8 |
% |
|
|
0.4 |
% |
|
|
— |
% |
|
|
0.8 |
% |
| Gross charge-offs |
|
$ |
8 |
|
|
$ |
380 |
|
|
$ |
483 |
|
|
$ |
168 |
|
|
$ |
83 |
|
|
$ |
591 |
|
|
$ |
551 |
|
|
$ |
— |
|
|
$ |
2,264 |
|
| |
|
Consumer - Other Consumer |
|
| |
|
Period Originated: |
|
|
|
|
|
|
|
|
|
|
| (Dollars in thousands) |
|
2023 |
|
|
2022 |
|
|
2021 |
|
|
2020 |
|
|
2019 |
|
|
Prior |
|
|
Revolving
Loans
|
|
|
Revolving
Loans
Converted to
Term |
|
|
Total |
|
| Pass |
|
$ |
57,877 |
|
|
$ |
25,060 |
|
|
$ |
14,080 |
|
|
$ |
8,026 |
|
|
$ |
3,667 |
|
|
$ |
2,050 |
|
|
$ |
123,607 |
|
|
$ |
— |
|
|
$ |
234,367 |
|
| Substandard |
|
|
— |
|
|
|
67 |
|
|
|
9 |
|
|
|
— |
|
|
|
38 |
|
|
|
— |
|
|
|
358 |
|
|
|
— |
|
|
|
472 |
|
| Total |
|
$ |
57,877 |
|
|
$ |
25,127 |
|
|
$ |
14,089 |
|
|
$ |
8,026 |
|
|
$ |
3,705 |
|
|
$ |
2,050 |
|
|
$ |
123,965 |
|
|
$ |
— |
|
|
$ |
234,839 |
|
| % Criticized |
|
|
— |
% |
|
|
0.3 |
% |
|
|
0.1 |
% |
|
|
— |
% |
|
|
1.0 |
% |
|
|
— |
% |
|
|
0.3 |
% |
|
|
— |
% |
|
|
0.2 |
% |
| Gross charge-offs |
|
$ |
2,780 |
|
|
$ |
584 |
|
|
$ |
277 |
|
|
$ |
210 |
|
|
$ |
89 |
|
|
$ |
58 |
|
|
$ |
2,680 |
|
|
$ |
— |
|
|
$ |
6,678 |
|
The Company’s collateral-dependent loans totaled $81.8 million and $107.8 million at December 31, 2024 and December 31, 2023, respectively.
Typically these loans are internally classified as Impaired and PCD Loss. At December 31, 2024, $8.7 million of the total were rated as doubtful. At December 31, 2023, none of these loans were classified as doubtful. At December 31, 2024, most of these
loans are within the non-real estate and income producing classes. Additionally, there were a smaller amount of these loans in the owner occupied, CAD, and residential mortgages classes. C&I loans are typically supported by collateral such as real
estate, receivables, equipment, inventory, or by an enterprise valuation. Loans within the CRE and Consumer segments are generally secured by commercial and residential real estate.
Loans of $1.0 million or greater are considered for specific provision when management has determined based on current information and events, it
is probable that the Company will be unable to collect all amounts due according to the contractual terms of the note and that the loan is collateral-dependent. At December 31, 2024 and December 31, 2023, $59.1 million and $85.3 million, respectively,
of collateral-dependent loans had a valuation allowance of $17.3 million and $41.7 million, respectively. The remaining balance of collateral-dependent loans of $22.7 million and $22.5 million at December 31, 2024 and December 31, 2023, respectively,
have sufficient collateral supporting the collection of all contractual principal and interest or were charged down to the underlying collateral’s fair value, less estimated selling costs. Therefore, such loans did not have an associated valuation
allowance.
NPLs consist of nonaccrual loans and leases. At December 31, 2024 and December 31, 2023, NPLs totaled $264.7 million and $216.1 million,
respectively. Within the NPL balance, $89.9 million of the December 31, 2024 balance and $49.6 million of the December 31, 2023 balance is covered by government guarantees from the SBA, FHA, VA or USDA.
The Company’s policy for all loan classifications provides that loans and leases are generally placed in nonaccrual status if, in management’s
opinion, payment in full of principal or interest is not expected, unless such loan or lease is both well-secured and in the process of collection.
The following table presents the amortized cost basis of loans on nonaccrual status by segment and class at the periods indicated:
| |
|
December 31, 2024 |
|
|
December 31, 2023 |
|
| |
|
|
|
|
Nonaccrual Loans |
|
|
|
|
|
Nonaccrual Loans |
|
| |
|
|
|
|
with No Related |
|
|
|
|
|
with No Related |
|
| (In thousands) |
|
Nonaccrual Loans |
|
|
Allowance |
|
|
Nonaccrual Loans |
|
|
Allowance |
|
| Commercial and industrial |
|
|
|
|
|
|
|
|
|
|
|
|
|
|
|
|
| Non-real estate |
|
$ |
145,115 |
|
|
$ |
2,944 |
|
|
$ |
131,559 |
|
|
$ |
11,267 |
|
| Owner occupied |
|
|
16,904 |
|
|
|
5,128 |
|
|
|
7,097 |
|
|
|
1,275 |
|
| Total commercial and industrial |
|
|
162,019 |
|
|
|
8,072 |
|
|
|
138,656 |
|
|
|
12,542 |
|
| Commercial real estate |
|
|
|
|
|
|
|
|
|
|
|
|
|
|
|
|
| Construction, acquisition and development |
|
|
8,600 |
|
|
|
66 |
|
|
|
1,859 |
|
|
|
— |
|
| Income producing |
|
|
18,542 |
|
|
|
6,569 |
|
|
|
17,485 |
|
|
|
4,416 |
|
| Total commercial real estate |
|
|
27,142 |
|
|
|
6,635 |
|
|
|
19,344 |
|
|
|
4,416 |
|
| Consumer |
|
|
|
|
|
|
|
|
|
|
|
|
|
|
|
|
| Residential mortgages |
|
|
75,287 |
|
|
|
3,979 |
|
|
|
57,881 |
|
|
|
— |
|
| Other consumer |
|
|
244 |
|
|
|
— |
|
|
|
260 |
|
|
|
— |
|
| Total consumer |
|
|
75,531 |
|
|
|
3,979 |
|
|
|
58,141 |
|
|
|
— |
|
| Total |
|
$ |
264,692 |
|
|
$ |
18,686 |
|
|
$ |
216,141 |
|
|
$ |
16,958 |
|
The following table presents the interest income recognized on loans on nonaccrual status by segment and class for the periods indicated:
| |
|
Year Ended December 31, |
|
| (In thousands) |
|
2024 |
|
|
2023 |
|
|
2022 |
|
| Commercial and industrial |
|
|
|
|
|
|
|
|
|
|
|
|
| Non-real estate |
|
$ |
2,828 |
|
|
$ |
863 |
|
|
$ |
710 |
|
| Owner occupied |
|
|
255 |
|
|
|
178 |
|
|
|
683 |
|
| Total commercial and industrial |
|
|
3,083 |
|
|
|
1,041 |
|
|
|
1,393 |
|
| Commercial real estate |
|
|
|
|
|
|
|
|
|
|
|
|
| Construction, acquisition and development |
|
|
100 |
|
|
|
53 |
|
|
|
133 |
|
| Income producing |
|
|
431 |
|
|
|
748 |
|
|
|
90 |
|
| Total commercial real estate |
|
|
531 |
|
|
|
801 |
|
|
|
223 |
|
| Consumer |
|
|
|
|
|
|
|
|
|
|
|
|
| Residential mortgages |
|
|
2,090 |
|
|
|
1,880 |
|
|
|
1,925 |
|
| Other consumer |
|
|
3 |
|
|
|
5 |
|
|
|
90 |
|
| Total consumer |
|
|
2,093 |
|
|
|
1,885 |
|
|
|
2,015 |
|
| Total |
|
$ |
5,707 |
|
|
$ |
3,727 |
|
|
$ |
3,631 |
|
In the normal course of business, management may grant concessions, which would not otherwise be considered, to borrowers that are experiencing
financial difficulty. Loans identified as meeting the criteria under ASC 310 are identified as financial difficulty modifications (FDM). Any modification, renewal or forbearance on loans assigned a rating of “Special Mention” or worse, and loans of any
rating which show evidence of financial difficulty is reviewed to determine whether the borrower is experiencing financial difficulty and if so, which terms of the loan were modified. If the borrower is experiencing financial difficulty and the loan is
modified via forgiveness of principal, reduction in interest rate to a rate below current market rates for issuance, payment extension or deferral for greater than six months (including extensions granted in the past 12 months), term or maturity date
extension, or combination of these specific modification terms, the modification requires disclosure.
Under the general loan modification guidance, a modification is treated as a new loan only if both of the following conditions are met: 1) the
terms of the new loan are at least as favorable to the lender as the terms for comparable loans to other customers with similar collection risks, and 2) modifications to the terms of the original loan are more than minor. If either condition is not
met, the modification is accounted for as the continuation of the old loan with any effect of the modification treated as a prospective adjustment to the loan’s effective interest rate. Modifications in scope for borrowers experiencing financial
difficulty may include principal forgiveness, other-than-insignificant payment delay, interest rate reduction, or a combination of modifications. During the year ended December 31, 2024, the most common concession related to term extensions. Other
concessions included principal forgiveness, payment deferrals, and interest rate reductions. At December 31, 2024, the Company has an outstanding unfunded commitment balance of $21.1 million to lend to five borrowers experiencing financial difficulty.
Upon determination by the Company that a modified loan (or portion of a loan) has subsequently been deemed uncollectible, the loan (or portion of
the loan) is charged off. The amortized cost basis of the loan is reduced by the uncollectible amount and the ACL is adjusted by this amount.
The following tables presents loans that were modified within the past twelve months for borrowers experiencing financial difficulty by segment
and class, as well as the percentage of these modified loans compared to overall loans in each segment and class, for the years ended December 31, 2024 and December 31, 2023:
| |
|
Year Ended December 31, 2024 |
|
| |
|
|
|
|
|
|
|
|
|
|
|
|
|
|
|
|
|
|
|
|
|
|
Combination |
|
|
|
|
| |
|
|
|
|
|
|
|
|
|
|
|
|
|
|
|
|
|
|
|
|
|
|
Term |
|
|
|
|
| |
|
|
|
|
|
|
|
Combination |
|
|
|
|
|
|
|
|
Combination |
|
|
Combination |
|
|
Extension, |
|
|
|
|
| |
|
|
|
|
|
|
|
Payment |
|
|
|
|
|
|
|
|
Interest Rate |
|
|
Term |
|
|
Payment |
|
|
|
|
| |
|
|
|
|
|
|
|
Deferral and |
|
|
|
|
|
Interest |
|
|
Reduction and |
|
|
Extension and |
|
|
Deferral and |
|
|
Percent of |
|
| |
|
Principal |
|
|
Payment |
|
|
Term |
|
|
Term |
|
|
Rate |
|
|
Payment |
|
|
Interest Rate |
|
|
Interest Rate |
|
|
Total Loan |
|
| (Dollars in thousands) |
|
Forgiveness |
|
|
Deferral |
|
|
Extension |
|
|
Extension |
|
|
Reduction |
|
|
Deferral |
|
|
Reduction |
|
|
Reduction |
|
|
Class |
|
| Commercial and industrial |
|
|
|
|
|
|
|
|
|
|
|
|
|
|
|
|
|
|
|
|
|
|
|
|
|
|
|
|
|
|
|
|
|
|
|
|
| Non-real estate |
|
$ |
12,865 |
|
|
$ |
13,100 |
|
|
$ |
6,463 |
|
|
$ |
66,110 |
|
|
$ |
— |
|
|
$ |
113 |
|
|
$ |
10,519 |
|
|
$ |
— |
|
|
|
1.26 |
% |
| Owner occupied |
|
|
— |
|
|
|
— |
|
|
|
— |
|
|
|
1,591 |
|
|
|
— |
|
|
|
— |
|
|
|
1,370 |
|
|
|
— |
|
|
|
0.06 |
% |
| Total commercial and industrial |
|
|
12,865 |
|
|
|
13,100 |
|
|
|
6,463 |
|
|
|
67,701 |
|
|
|
— |
|
|
|
113 |
|
|
|
11,889 |
|
|
|
— |
|
|
|
0.84 |
% |
| Commercial real estate |
|
|
|
|
|
|
|
|
|
|
|
|
|
|
|
|
|
|
|
|
|
|
|
|
|
|
|
|
|
|
|
|
|
|
|
|
| Construction, acquisition and development |
|
|
— |
|
|
|
— |
|
|
|
— |
|
|
|
— |
|
|
|
7 |
|
|
|
— |
|
|
|
— |
|
|
|
— |
|
|
|
— |
% |
| Income producing |
|
|
— |
|
|
|
— |
|
|
|
30,670 |
|
|
|
45,206 |
|
|
|
— |
|
|
|
— |
|
|
|
— |
|
|
|
13,373 |
|
|
|
1.48 |
% |
| Total commercial real estate |
|
|
— |
|
|
|
— |
|
|
|
30,670 |
|
|
|
45,206 |
|
|
|
7 |
|
|
|
— |
|
|
|
— |
|
|
|
13,373 |
|
|
|
0.90 |
% |
| Consumer |
|
|
|
|
|
|
|
|
|
|
|
|
|
|
|
|
|
|
|
|
|
|
|
|
|
|
|
|
|
|
|
|
|
|
|
|
| Residential mortgages |
|
|
— |
|
|
|
22 |
|
|
|
— |
|
|
|
202 |
|
|
|
178 |
|
|
|
100 |
|
|
|
400 |
|
|
|
— |
|
|
|
0.01 |
% |
| Other consumer |
|
|
— |
|
|
|
— |
|
|
|
19 |
|
|
|
— |
|
|
|
— |
|
|
|
— |
|
|
|
— |
|
|
|
— |
|
|
|
0.01 |
% |
| Total consumer |
|
|
— |
|
|
|
22 |
|
|
|
19 |
|
|
|
202 |
|
|
|
178 |
|
|
|
100 |
|
|
|
400 |
|
|
|
— |
|
|
|
0.01 |
% |
| Total loans and leases, net of unearned income |
|
$ |
12,865 |
|
|
$ |
13,122 |
|
|
$ |
37,152 |
|
|
$ |
113,109 |
|
|
$ |
185 |
|
|
$ |
213 |
|
|
$ |
12,289 |
|
|
$ |
13,373 |
|
|
|
0.60 |
% |
| |
|
Year Ended December 31, 2023 |
|
| |
|
|
|
|
|
|
|
|
|
|
Combination |
|
|
Combination |
|
|
Combination |
|
|
|
|
| |
|
|
|
|
|
|
|
|
|
|
Interest Rate |
|
|
Term |
|
|
Term |
|
|
|
|
| |
|
|
|
|
|
|
|
|
|
|
Reduction and |
|
|
Extension and |
|
|
Extension and |
|
|
Percent of |
|
| |
|
Payment |
|
|
Term |
|
|
Interest Rate |
|
|
Payment |
|
|
Interest Rate |
|
|
Payment |
|
|
Total Loan |
|
| (Dollars in thousands) |
|
Deferral |
|
|
Extension |
|
|
Reduction |
|
|
Deferral |
|
|
Reduction |
|
|
Deferral |
|
|
Class |
|
| Commercial and industrial |
|
|
|
|
|
|
|
|
|
|
|
|
|
|
|
|
|
|
|
|
|
|
|
|
|
|
|
|
| Non-real estate |
|
$ |
32,121 |
|
|
$ |
70,009 |
|
|
$ |
— |
|
|
$ |
— |
|
|
$ |
6,583 |
|
|
$ |
262 |
|
|
|
1.22 |
% |
| Owner occupied |
|
|
— |
|
|
|
40 |
|
|
|
— |
|
|
|
— |
|
|
|
— |
|
|
|
— |
|
|
|
— |
|
| Total commercial and industrial |
|
|
32,121 |
|
|
|
70,049 |
|
|
|
— |
|
|
|
— |
|
|
|
6,583 |
|
|
|
262 |
|
|
|
0.82 |
|
| Commercial real estate |
|
|
|
|
|
|
|
|
|
|
|
|
|
|
|
|
|
|
|
|
|
|
|
|
|
|
|
|
| Income producing |
|
|
1,520 |
|
|
|
27,774 |
|
|
|
— |
|
|
|
— |
|
|
|
769 |
|
|
|
— |
|
|
|
0.52 |
|
| Total commercial real estate |
|
|
1,520 |
|
|
|
27,774 |
|
|
|
— |
|
|
|
— |
|
|
|
769 |
|
|
|
— |
|
|
|
0.31 |
|
| Consumer |
|
|
|
|
|
|
|
|
|
|
|
|
|
|
|
|
|
|
|
|
|
|
|
|
|
|
|
|
| Residential mortgages |
|
|
42 |
|
|
|
139 |
|
|
|
299 |
|
|
|
37 |
|
|
|
331 |
|
|
|
— |
|
|
|
0.01 |
|
| Other consumer |
|
|
— |
|
|
|
11 |
|
|
|
— |
|
|
|
— |
|
|
|
— |
|
|
|
— |
|
|
|
— |
|
| Total consumer |
|
|
42 |
|
|
|
150 |
|
|
|
299 |
|
|
|
37 |
|
|
|
331 |
|
|
|
— |
|
|
|
0.01 |
|
| Total loans and leases, net of unearned income |
|
$ |
33,683 |
|
|
$ |
97,973 |
|
|
$ |
299 |
|
|
$ |
37 |
|
|
$ |
7,683 |
|
|
$ |
262 |
|
|
|
0.43 |
% |
The following table presents the financial effect of the loan modifications presented above for borrowers experiencing financial difficulty for the following periods:
| |
|
Year Ended December 31, 2024 |
|
|
Year Ended December 31, 2023 |
|
| |
|
|
|
|
Weighted-Average |
|
|
Weighted-Average |
|
|
Weighted-Average |
|
|
Weighted-Average |
|
| |
|
Principal |
|
|
Interest Rate |
|
|
Term Extension (in |
|
|
Interest Rate |
|
|
Term Extension (in |
|
| (Dollars in thousands) |
|
Forgiveness |
|
|
Reduction |
|
|
years) |
|
|
Reduction |
|
|
years) |
|
| Commercial and industrial |
|
|
|
|
|
|
|
|
|
|
|
|
|
|
|
|
|
|
|
|
| Non-real estate |
|
$ |
5,835 |
|
|
|
1.42 |
% |
|
|
1.23 |
|
|
|
0.92 |
% |
|
|
0.84 |
|
| Owner occupied |
|
|
— |
|
|
|
3.91 |
|
|
|
14.04 |
|
|
|
— |
|
|
|
5.04 |
|
| Commercial real estate |
|
|
|
|
|
|
|
|
|
|
|
|
|
|
|
|
|
|
|
|
| Construction, acquisition and development |
|
|
— |
|
|
|
2.00 |
|
|
|
— |
|
|
|
— |
|
|
|
— |
|
| Income producing |
|
|
— |
|
|
|
0.54 |
|
|
|
1.72 |
|
|
|
0.30 |
|
|
|
1.09 |
|
| Consumer |
|
|
|
|
|
|
|
|
|
|
|
|
|
|
|
|
|
|
|
|
| Residential mortgages |
|
|
— |
|
|
|
2.49 |
|
|
|
7.60 |
|
|
|
0.24 |
|
|
|
11.17 |
|
| Other consumer |
|
|
— |
|
|
|
3.69 |
|
|
|
2.18 |
|
|
|
3.25 |
|
|
|
1.42 |
|
The following table provides the amortized cost basis of loans that experienced a payment default during the period and were modified in the 12
months before default to borrowers experiencing financial difficulty:
| |
|
Year Ended December 31, 2024 |
|
| |
|
|
|
|
|
|
|
Combination Term |
|
| |
|
|
|
|
|
|
|
Extension and Interest |
|
| (In thousands) |
|
Payment Deferral |
|
|
Term Extension |
|
|
Rate Reduction |
|
| Commercial and industrial |
|
|
|
|
|
|
|
|
|
|
|
|
| Non-real estate |
|
$ |
164 |
|
|
$ |
— |
|
|
$ |
1,929 |
|
| Commercial real estate |
|
|
|
|
|
|
|
|
|
|
|
|
| Income producing |
|
|
— |
|
|
|
9,113 |
|
|
|
— |
|
| Consumer |
|
|
|
|
|
|
|
|
|
|
|
|
| Residential mortgages |
|
|
— |
|
|
|
— |
|
|
|
362 |
|
| Total modified |
|
$ |
164 |
|
|
$ |
9,113 |
|
|
$ |
2,291 |
|
The Company closely monitors the performance of the loans that are modified to borrowers experiencing financial difficulty to understand the
effectiveness of its modification efforts. Loans are considered to be in payment default at 90 or more days past due. The following table depicts the performance of loans that have been modified in the last 12 months:
| |
|
Payment Status (Amortized Cost Basis) at December 31, 2024 |
|
| (In thousands) |
|
Current |
|
|
30-89 Days Past Due |
|
|
90+ Days Past Due |
|
| Commercial and industrial |
|
|
|
|
|
|
|
|
|
|
|
|
| Non-real estate |
|
$ |
80,424 |
|
|
$ |
26,653 |
|
|
$ |
2,093 |
|
| Owner occupied |
|
|
2,961 |
|
|
|
— |
|
|
|
— |
|
| Commercial real estate |
|
|
|
|
|
|
|
|
|
|
|
|
| Construction, acquisition and development |
|
|
7 |
|
|
|
— |
|
|
|
— |
|
| Income producing |
|
|
89,249 |
|
|
|
— |
|
|
|
— |
|
| Consumer |
|
|
|
|
|
|
|
|
|
|
|
|
| Residential mortgages |
|
|
495 |
|
|
|
45 |
|
|
|
362 |
|
| Other consumer |
|
|
19 |
|
|
|
— |
|
|
|
— |
|
| Total |
|
$ |
173,155 |
|
|
$ |
26,698 |
|
|
$ |
2,455 |
|
NOTE 5. ALLOWANCE FOR CREDIT LOSSES
The following table summarizes the changes in the ACL for the periods indicated:
| |
|
Year Ended December 31, |
|
| (In thousands) |
|
2024 |
|
|
2023 |
|
|
2022 |
|
| Balance at beginning of year |
|
$ |
468,034 |
|
|
$ |
440,347 |
|
|
$ |
446,415 |
|
| Charge-offs |
|
|
(90,404 |
) |
|
|
(87,072 |
) |
|
|
(29,864 |
) |
| Recoveries |
|
|
12,163 |
|
|
|
14,504 |
|
|
|
29,913 |
|
| Initial allowance on PCD loans |
|
|
— |
|
|
|
— |
|
|
|
(8,117 |
) |
| Adoption of new ASU related to modified loans (1) |
|
|
— |
|
|
|
255 |
|
|
|
— |
|
| Provision for loan losses |
|
|
71,000 |
|
|
|
100,000 |
|
|
|
2,000 |
|
| Balance at end of year |
|
$ |
460,793 |
|
|
$ |
468,034 |
|
|
$ |
440,347 |
|
|
(1) |
Cadence adopted the new accounting guidance effective January 1, 2023, which eliminates the TDR recognition and measurement guidance via the modified retrospective transition method (ASU 2022-02). See Note 4 for
additional information. |
The following tables summarize the changes in the ACL by segment and class for the periods indicated:
| |
|
Year Ended December 31, 2024 |
|
| |
|
Beginning |
|
|
|
|
|
|
|
|
Provision |
|
|
|
|
| (In thousands) |
|
Balance |
|
|
Charge-offs |
|
|
Recoveries |
|
|
(Release) |
|
|
Ending Balance |
|
| Commercial and industrial |
|
|
|
|
|
|
|
|
|
|
|
|
|
|
|
|
|
|
|
|
| Non-real estate |
|
$ |
194,577 |
|
|
$ |
(76,694 |
) |
|
$ |
8,004 |
|
|
$ |
57,856 |
|
|
$ |
183,743 |
|
| Owner occupied |
|
|
31,445 |
|
|
|
(379 |
) |
|
|
511 |
|
|
|
3,600 |
|
|
|
35,177 |
|
| Total commercial and industrial |
|
|
226,022 |
|
|
|
(77,073 |
) |
|
|
8,515 |
|
|
|
61,456 |
|
|
|
218,920 |
|
| Commercial real estate |
|
|
|
|
|
|
|
|
|
|
|
|
|
|
|
|
|
|
|
|
| Construction, acquisition and development |
|
|
42,118 |
|
|
|
(779 |
) |
|
|
418 |
|
|
|
2,946 |
|
|
|
44,703 |
|
| Income producing |
|
|
69,209 |
|
|
|
(2,503 |
) |
|
|
447 |
|
|
|
(2,196 |
) |
|
|
64,957 |
|
| Total commercial real estate |
|
|
111,327 |
|
|
|
(3,282 |
) |
|
|
865 |
|
|
|
750 |
|
|
|
109,660 |
|
| Consumer |
|
|
|
|
|
|
|
|
|
|
|
|
|
|
|
|
|
|
|
|
| Residential mortgages |
|
|
124,851 |
|
|
|
(3,161 |
) |
|
|
1,234 |
|
|
|
2,540 |
|
|
|
125,464 |
|
| Other consumer |
|
|
5,834 |
|
|
|
(6,888 |
) |
|
|
1,549 |
|
|
|
6,254 |
|
|
|
6,749 |
|
| Total consumer |
|
|
130,685 |
|
|
|
(10,049 |
) |
|
|
2,783 |
|
|
|
8,794 |
|
|
|
132,213 |
|
| Total |
|
$ |
468,034 |
|
|
$ |
(90,404 |
) |
|
$ |
12,163 |
|
|
$ |
71,000 |
|
|
$ |
460,793 |
|
| |
|
Year Ended December 31, 2023 |
|
| |
|
|
|
|
|
|
|
|
|
|
Adoption of |
|
|
|
|
|
|
|
| |
|
|
|
|
|
|
|
|
|
|
new ASU for |
|
|
|
|
|
|
|
| |
|
Beginning |
|
|
|
|
|
|
|
|
modified |
|
|
Provision |
|
|
Ending |
|
| (In thousands) |
|
Balance |
|
|
Charge-offs |
|
|
Recoveries |
|
|
loans |
|
|
(Release) |
|
|
Balance |
|
| Commercial and industrial |
|
|
|
|
|
|
|
|
|
|
|
|
|
|
|
|
|
|
|
|
|
|
|
|
| Non-real estate |
|
$ |
147,669 |
|
|
$ |
(72,401 |
) |
|
$ |
7,541 |
|
|
$ |
256 |
|
|
$ |
111,512 |
|
|
$ |
194,577 |
|
| Owner occupied |
|
|
35,548 |
|
|
|
(394 |
) |
|
|
1,582 |
|
|
|
2 |
|
|
$ |
(5,293 |
) |
|
|
31,445 |
|
| Total commercial and industrial |
|
|
183,217 |
|
|
|
(72,795 |
) |
|
|
9,123 |
|
|
|
258 |
|
|
|
106,219 |
|
|
|
226,022 |
|
| Commercial real estate |
|
|
|
|
|
|
|
|
|
|
|
|
|
|
|
|
|
|
|
|
|
|
|
|
| Construction, acquisition and development |
|
|
68,902 |
|
|
|
(808 |
) |
|
|
622 |
|
|
|
— |
|
|
$ |
(26,598 |
) |
|
|
42,118 |
|
| Income producing |
|
|
74,727 |
|
|
|
(4,527 |
) |
|
|
1,071 |
|
|
|
(3 |
) |
|
$ |
(2,059 |
) |
|
|
69,209 |
|
| Total commercial real estate |
|
|
143,629 |
|
|
|
(5,335 |
) |
|
|
1,693 |
|
|
|
(3 |
) |
|
|
(28,657 |
) |
|
|
111,327 |
|
| Consumer |
|
|
|
|
|
|
|
|
|
|
|
|
|
|
|
|
|
|
|
|
|
|
|
|
| Residential mortgages |
|
|
106,142 |
|
|
|
(2,264 |
) |
|
|
2,000 |
|
|
|
— |
|
|
$ |
18,973 |
|
|
|
124,851 |
|
| Other consumer |
|
|
7,359 |
|
|
|
(6,678 |
) |
|
|
1,688 |
|
|
|
— |
|
|
$ |
3,465 |
|
|
|
5,834 |
|
| Total consumer |
|
|
113,501 |
|
|
|
(8,942 |
) |
|
|
3,688 |
|
|
|
— |
|
|
|
22,438 |
|
|
|
130,685 |
|
| Total |
|
$ |
440,347 |
|
|
$ |
(87,072 |
) |
|
$ |
14,504 |
|
|
$ |
255 |
|
|
$ |
100,000 |
|
|
$ |
468,034 |
|
| |
|
Year Ended December 31, 2022 |
|
| |
|
|
|
|
|
|
|
|
|
|
Initial ACL |
|
|
|
|
|
|
|
| |
|
Beginning |
|
|
|
|
|
|
|
|
on PCD |
|
|
|
|
|
Ending |
|
| (In thousands) |
|
Balance |
|
|
Charge-offs |
|
|
Recoveries |
|
|
Loans |
|
|
Provision |
|
|
Balance |
|
| Commercial and industrial |
|
|
|
|
|
|
|
|
|
|
|
|
|
|
|
|
|
|
|
|
|
|
|
|
| Non-real estate |
|
$ |
138,696 |
|
|
$ |
(17,874 |
) |
|
$ |
14,165 |
|
|
$ |
— |
|
|
$ |
12,682 |
|
|
$ |
147,669 |
|
| Owner occupied |
|
|
59,254 |
|
|
|
(824 |
) |
|
|
2,292 |
|
|
|
(551 |
) |
|
|
(24,623 |
) |
|
|
35,548 |
|
| Total commercial and industrial |
|
|
197,950 |
|
|
|
(18,698 |
) |
|
|
16,457 |
|
|
|
(551 |
) |
|
|
(11,941 |
) |
|
|
183,217 |
|
| Commercial real estate |
|
|
|
|
|
|
|
|
|
|
|
|
|
|
|
|
|
|
|
|
|
|
|
|
| Construction, acquisition and development |
|
|
52,530 |
|
|
|
(298 |
) |
|
|
4,352 |
|
|
|
— |
|
|
|
12,318 |
|
|
|
68,902 |
|
| Income producing |
|
|
98,327 |
|
|
|
(1,832 |
) |
|
|
3,521 |
|
|
|
(2,012 |
) |
|
|
(23,277 |
) |
|
|
74,727 |
|
| Total commercial real estate |
|
|
150,857 |
|
|
|
(2,130 |
) |
|
|
7,873 |
|
|
|
(2,012 |
) |
|
|
(10,959 |
) |
|
|
143,629 |
|
| Consumer |
|
|
|
|
|
|
|
|
|
|
|
|
|
|
|
|
|
|
|
|
|
|
|
|
| Residential mortgages |
|
|
85,734 |
|
|
|
(1,430 |
) |
|
|
3,017 |
|
|
|
(5,554 |
) |
|
|
24,375 |
|
|
|
106,142 |
|
| Other consumer |
|
|
11,874 |
|
|
|
(7,606 |
) |
|
|
2,566 |
|
|
|
— |
|
|
|
525 |
|
|
|
7,359 |
|
| Total consumer |
|
|
97,608 |
|
|
|
(9,036 |
) |
|
|
5,583 |
|
|
|
(5,554 |
) |
|
|
24,900 |
|
|
|
113,501 |
|
| Ending Balance |
|
$ |
446,415 |
|
|
$ |
(29,864 |
) |
|
$ |
29,913 |
|
|
$ |
(8,117 |
) |
|
$ |
2,000 |
|
|
$ |
440,347 |
|
The following table represents a roll forward of the reserve for unfunded commitments for the periods shown. The reserve for unfunded commitments
is classified in other liabilities in the consolidated balance sheets.
| |
|
Year Ended December 31, |
|
| (In thousands) |
|
2024 |
|
|
2023 |
|
|
2022 |
|
| Balance at beginning of period |
|
$ |
8,551 |
|
|
$ |
28,551 |
|
|
$ |
23,551 |
|
| (Reversal) provision for credit losses for unfunded commitments |
|
|
— |
|
|
|
(20,000 |
) |
|
|
5,000 |
|
| Balance at end of period |
|
$ |
8,551 |
|
|
$ |
8,551 |
|
|
$ |
28,551 |
|
The economic impact of inflation, higher interest rates, volatility in the financial markets, and the potential for a slowing economy poses
additional risk to borrowers and financial institutions. These factors add to the risk borrowers may experience difficulty in meeting repayment obligations, and the Company may experience losses or deterioration in performance in its loan portfolio.
The ACL estimate is impacted by both portfolio changes and changes in economic conditions experienced during the period. The unemployment rate has
the highest weighting within the Company’s credit risk modeling framework. Economic forecasts, which are obtained from multiple sources, provide upside, downside, and base case scenarios over an eight-quarter forecast horizon to establish a forecast
range. Management considers the scenarios and selects a blended scenario which, in management’s opinion, reflects likely economic conditions within that range. The Company recognizes that inflation, higher interest rates and a slowing economy may have
short-term, long-term, and regional impacts to the economy. In addition, qualitative factors such as changes in economic conditions, concentrations of risk, and changes in portfolio risk resulting from regulatory changes are considered in determining
the adequacy of the level of the ACL.
NOTE 6. PREMISES AND EQUIPMENT
A summary by asset classification at the periods indicated:
| |
|
Estimated Useful |
|
December 31, |
|
|
December 31, |
|
| (In thousands) |
|
Life (Years) |
|
2024 |
|
|
2023 |
|
| Land |
|
N/A |
|
$ |
140,792 |
|
|
$ |
140,771 |
|
| Buildings and improvements |
|
5-40 |
|
|
557,916 |
|
|
|
541,966 |
|
| Leasehold improvements |
|
5-39 |
|
|
46,608 |
|
|
|
39,875 |
|
| Equipment, furniture and fixtures |
|
3-20 |
|
|
363,985 |
|
|
|
342,362 |
|
| Computer software |
|
3-5 |
|
|
111,973 |
|
|
|
100,040 |
|
| Construction in progress |
|
N/A |
|
|
26,316 |
|
|
|
47,015 |
|
| Right of use - lease |
|
N/A |
|
|
204,071 |
|
|
|
199,973 |
|
| Subtotal |
|
|
|
|
1,451,661 |
|
|
|
1,412,002 |
|
| Accumulated depreciation and amortization |
|
|
|
|
668,205 |
|
|
|
609,869 |
|
| Premises and equipment, net |
|
|
|
$ |
783,456 |
|
|
$ |
802,133 |
|
Depreciation expense was $45.1 million, $44.4 million, and $42.8 million for the years ended December 31, 2024, 2023, and 2022, respectively.
Software amortization expense was $9.5 million, $9.8 million, and $9.5 million for the years ended December 31, 2024, 2023, and 2022,
respectively.
The Company leases various premises and equipment. At the inception of the contract, the Company determines if an arrangement is or contains a
lease and will recognize on the balance sheet a lease asset for its right to use the underlying asset and a lease liability for the corresponding lease obligation for contracts longer than a year. See Note 7 for additional disclosures related to our
lease obligations.
NOTE 7. LEASES
The Company leases various premises and equipment. At the inception of the contract, the Company determines if an arrangement is or contains a
lease and will recognize on the balance sheet a lease asset for its right to use the underlying asset and a lease liability for the corresponding lease obligation for contracts longer than a year. The Company does not have any commitments that would
meet the definition of a finance lease.
At December 31, 2024 and 2023, the weighted average remaining lease term for operating leases was 16.0 years and 16.2 years, respectively, and the
weighted average discount rate used in the measurement of operating lease liabilities was 3.7% and 3.5% at December 31, 2024 and 2023, respectively. Lease costs were as follows for the periods presented:
| |
|
Year Ended December 31, |
|
| (In thousands) |
|
2024 |
|
|
2023 |
|
|
2022 |
|
| Operating lease costs |
|
$ |
18,166 |
|
|
$ |
20,298 |
|
|
$ |
22,158 |
|
| Short-term lease costs |
|
|
139 |
|
|
|
108 |
|
|
|
39 |
|
| Variable lease costs |
|
|
— |
|
|
|
4 |
|
|
|
623 |
|
| Sublease income |
|
|
(741 |
) |
|
|
(1,011 |
) |
|
|
(1,123 |
) |
| Total operating lease costs |
|
$ |
17,564 |
|
|
$ |
19,399 |
|
|
$ |
21,697 |
|
There were no leveraged leases or lease transactions with related parties during the years ended December 31, 2024 and 2023. At December 31, 2024
and 2023, the Company had no leases that had not yet commenced.
For leases that may contain renewal options or options to extend the lease term, the Company is reasonably certain to do so, therefore, these
extended terms are included in our lease liability calculation. A maturity analysis of operating lease liabilities is included in the table below at December 31, 2024:
| (In thousands) |
|
Amount |
|
| 2025 |
|
$ |
17,740 |
|
| 2026 |
|
|
17,867 |
|
| 2027 |
|
|
17,071 |
|
| 2028 |
|
|
16,703 |
|
| 2029 |
|
|
16,462 |
|
| Thereafter |
|
|
165,367 |
|
| Total future minimum lease payments |
|
|
251,210 |
|
| Discount effect of cash flows |
|
|
63,412 |
|
| Present value of net future minimum lease payments |
|
$ |
187,798 |
|
At December 31, 2024 and 2023, the Company’s operating lease ROU assets were $167.4 million and $171.3 million, respectively, and ROU liabilities
were $188.0 million and $192.2 million, respectively.
NOTE 8. GOODWILL AND OTHER INTANGIBLE ASSETS
The following tables present the carrying amounts of goodwill assigned to each of the Company’s reporting units at December 31, 2024 and December
31, 2023. Refer to Note 19 for additional information on segments.
| (In thousands) |
|
December 31,
2024 |
|
|
December 31,
2023 |
|
| Corporate Banking |
|
$ |
401,742 |
|
|
$ |
401,742 |
|
| Community Banking |
|
|
918,354 |
|
|
|
918,354 |
|
| Mortgage |
|
|
19,652 |
|
|
|
19,652 |
|
| Banking Services |
|
|
27,175 |
|
|
|
28,037 |
|
| Total |
|
$ |
1,366,923 |
|
|
$ |
1,367,785 |
|
The Company’s policy is to assess goodwill for impairment at the reporting unit level on an annual basis or sooner if an event occurs or
circumstances change which indicate that the fair value of a reporting unit is below its carrying amount. Impairment is the condition that exists when the carrying amount of the reporting unit exceeds the fair value of that reporting unit. The
Company’s annual assessment date is during the Company’s fourth quarter. The Company’s annual goodwill impairment evaluation for 2024 was based on a qualitative assessment and indicated no events or circumstances that would have resulted in an
impairment of goodwill for its reporting units.
On May 17, 2024, the Company completed the sale of Cadence Business Solutions, its payroll processing business unit. The payroll processing unit
had previously been part of Cadence Insurance, Inc., prior to its sale in November 2023. The sale of the payroll processing business resulted in a $0.9 million decrease in goodwill for the Banking Services unit and a $1.1 million decrease in customer
relationship intangibles.
In the current economic environment, forecasting cash flows, credit losses and growth in addition to valuing the Company’s assets with any degree
of assurance is very difficult and subject to significant changes over very short periods of time. The Company’s policy is to update its analysis as circumstances change. As market conditions continue to be volatile and unpredictable, impairment of
goodwill related to the Company’s reporting units may be necessary in future periods.
The carrying value of other intangible assets was $83.2 million and $100.2 million at December 31, 2024 and December 31, 2023, respectively. The
core deposit intangible assets and the customer relationship intangibles are both amortized over an estimated useful life of ten years utilizing an accelerated method. The trade name is considered indefinite- lived and is not subject to amortization.
The following table, which excludes fully amortized intangibles, shows the gross carrying amount and accumulated amortization of the Company’s
other intangible assets at December 31, 2024 and December 31, 2023.
| |
|
December 31, 2024 |
|
|
December 31, 2023 |
|
| |
|
Gross |
|
|
|
|
|
Net |
|
|
Gross |
|
|
|
|
|
Net |
|
| |
|
Carrying |
|
|
Accumulated |
|
|
Carrying |
|
|
Carrying |
|
|
Accumulated |
|
|
Carrying |
|
| (In thousands) |
|
Amount |
|
|
Amortization |
|
|
Value |
|
|
Amount |
|
|
Amortization |
|
|
Value |
|
| Core deposit intangibles |
|
$ |
112,379 |
|
|
$ |
76,429 |
|
|
$ |
35,950 |
|
|
$ |
112,379 |
|
|
$ |
67,501 |
|
|
$ |
44,878 |
|
| Customer relationship intangibles |
|
|
48,250 |
|
|
|
26,518 |
|
|
|
21,732 |
|
|
|
49,349 |
|
|
|
19,544 |
|
|
|
29,805 |
|
| Trade names |
|
|
25,508 |
|
|
|
— |
|
|
|
25,508 |
|
|
|
25,508 |
|
|
|
— |
|
|
|
25,508 |
|
| Total other intangible assets |
|
$ |
186,137 |
|
|
$ |
102,947 |
|
|
$ |
83,190 |
|
|
$ |
187,236 |
|
|
$ |
87,045 |
|
|
$ |
100,191 |
|
The following table presents intangible asset amortization expense for the periods indicated.
| |
|
Year Ended December 31, |
|
| (In thousands) |
|
2024 |
|
|
2023 |
|
|
2022 |
|
| Core deposit intangibles |
|
$ |
8,928 |
|
|
$ |
10,812 |
|
|
$ |
9,408 |
|
| Customer relationship intangibles |
|
|
6,974 |
|
|
|
8,576 |
|
|
|
8,374 |
|
| Non-solicitation intangibles |
|
|
— |
|
|
|
— |
|
|
|
650 |
|
| Total intangible asset amortization expense |
|
$ |
15,902 |
|
|
$ |
19,388 |
|
|
$ |
18,432 |
|
The following table presents the estimated intangible asset amortization expense for the next five years.
| |
|
Core |
|
|
Customer |
|
|
|
|
| |
|
Deposit |
|
|
Relationship |
|
|
|
|
| (In thousands) |
|
Intangibles |
|
|
Intangibles |
|
|
Total |
|
| 2025 |
|
$ |
8,582 |
|
|
$ |
5,921 |
|
|
$ |
14,503 |
|
| 2026 |
|
|
8,005 |
|
|
|
4,981 |
|
|
|
12,986 |
|
| 2027 |
|
|
7,574 |
|
|
|
4,042 |
|
|
|
11,616 |
|
| 2028 |
|
|
5,231 |
|
|
|
3,102 |
|
|
|
8,333 |
|
| 2029 |
|
|
3,249 |
|
|
|
2,162 |
|
|
|
5,411 |
|
NOTE 9. TIME DEPOSITS AND BORROWINGS
Time deposits with a balance of $250,000 or more totaled $3.2 billion and $2.4 billion at December 31, 2024 and December 31, 2023, respectively.
At December 31, 2024, time deposits that will mature in under one year totaled $9.6 billion. For time deposits with a remaining maturity of more
than one year at December 31, 2024, the aggregate amount maturing in each of the following five years and thereafter is presented in the following table:
| (Dollars in thousands) |
|
Amount |
|
| 2026 |
|
$ |
308,487 |
|
| 2027 |
|
|
39,429 |
|
| 2028 |
|
|
32,507 |
|
| 2029 |
|
|
27,556 |
|
| 2030 |
|
|
69 |
|
| Thereafter |
|
|
114 |
|
| Total |
|
$ |
408,162 |
|
Borrowings with original maturities of one year or less are classified as short-term. The following tables present information relating to
short-term debt for the periods presented:
| |
|
December 31, 2024 |
|
| |
|
End of Period |
|
|
Year to Date Daily Average |
|
|
Maximum
Outstanding |
|
| (Dollars in thousands) |
|
Balance |
|
|
Interest
Rate
|
|
|
Balance |
|
|
Interest
Rate
|
|
|
at any
Month End
|
|
| Federal funds purchased |
|
$ |
— |
|
|
|
— |
% |
|
$ |
5,077 |
|
|
|
5.28 |
% |
|
$ |
— |
|
| Securities sold under agreement to repurchase and other |
|
|
23,616 |
|
|
|
4.10 |
|
|
|
81,092 |
|
|
|
4.76 |
|
|
|
267,792 |
|
| Bank Term Funding Program |
|
|
— |
|
|
|
— |
|
|
|
2,845,902 |
|
|
|
4.79 |
|
|
|
3,500,000 |
|
| Short-term FHLB advances |
|
|
— |
|
|
|
— |
|
|
|
2 |
|
|
|
5.74 |
|
|
|
— |
|
| Total |
|
$ |
23,616 |
|
|
|
|
|
|
$ |
2,932,073 |
|
|
|
|
|
|
$ |
3,767,792 |
|
| |
|
December 31, 2023 |
|
| |
|
End of Period |
|
|
Year to Date Daily Average |
|
|
Maximum
Outstanding |
|
| (Dollars in thousands) |
|
Balance |
|
|
Interest
Rate
|
|
|
Balance |
|
|
Interest
Rate
|
|
|
at any
Month End
|
|
| Federal funds purchased |
|
$ |
— |
|
|
|
— |
% |
|
$ |
29,361 |
|
|
|
4.91 |
% |
|
$ |
375,000 |
|
| Securities sold under agreement to repurchase and other |
|
|
451,516 |
|
|
|
4.29 |
|
|
|
770,777 |
|
|
|
4.04 |
|
|
|
862,589 |
|
| Bank Term Funding Program |
|
|
3,500,000 |
|
|
|
4.84 |
|
|
|
2,052,088 |
|
|
|
5.10 |
|
|
|
3,500,000 |
|
| Short-term FHLB advances |
|
|
— |
|
|
|
— |
|
|
|
1,389,759 |
|
|
|
4.91 |
|
|
|
5,700,228 |
|
| Total |
|
$ |
3,951,516 |
|
|
|
|
|
|
$ |
4,241,985 |
|
|
|
|
|
|
$ |
10,437,817 |
|
Federal funds purchased generally mature the day following the date of purchase. At December 31, 2024 and December 31, 2023, the Company had
established non-binding federal funds borrowing lines of credit with other banks aggregating $2.1 billion, for both periods. Additionally, the Company maintains access to the FRB discount window borrowings which generally mature within 90 days and are
collateralized by $2.1 billion in commercial, agriculture, and consumer loans pledged under a borrower-in-custody agreement at December 31, 2024. At December 31, 2024 and December 31, 2023, there were no borrowings from the FRB discount window.
Securities sold under repurchase agreements generally mature within one day from the date of sale. The Company monitors collateral levels on a
continuous basis and may be required to provide additional collateral based on the fair value of the underlying securities. Collateral pledged pursuant to these repurchase agreements can include MBS issued or guaranteed by U.S. agencies, U.S. Treasury
securities and U.S. government agency securities.
The BTFP was created by the Federal Reserve to support businesses and households by making additional funding available to eligible financial
institutions to help assure they have the ability to meet the needs of their depositors. The BTFP offered loans of up to one year in length to banks and other qualifying institutions pledging any collateral eligible for purchase by the FRB. The
collateral was valued at its par amount and consisted primarily of MBS and U.S. government agency securities. Cadence’s BTFP borrowing was paid off during the fourth quarter of 2024. The BTFP ceased making new loans in March 2024.
All borrowings from the FHLB are collateralized by commercial, construction, and real estate loans pledged under a blanket floating lien security
agreement with the FHLB of Dallas at December 31, 2024 and December 31, 2023. Under the terms of this agreement, the Company is required to maintain sufficient collateral to secure borrowings in an aggregate amount of the lesser of the book value
(i.e., unpaid principal balance), after applicable FHLB discounts, of the Company’s eligible commercial and residential loans pledged as collateral, or 35% of the Company’s assets. Loans totaling $24.4 billion and $22.9 billion at December 31, 2024 and
December 31, 2023, respectively, were pledged to the FHLB of Dallas. At December 31, 2024, the remaining borrowing availability totaled $13.0 billion. At December 31, 2024, there were no call features on long-term FHLB borrowings. Short-term FHLB
borrowings mature within one year following the date of the advance.
The FHLB of Dallas has also issued irrevocable letters of credit totaling $47.5 million at December 31, 2024 on behalf of our customers. Of the
total amount, $26.7 million expires on December 17, 2025 and $20.8 million expires on January 30, 2025.
The following table presents the details of the long-term and subordinated debt the Company has outstanding:
| (Dollars in thousands) |
|
December 31, 2024 |
|
|
December 31, 2023 |
|
| 4.850% advances from FHLB Dallas, due August 2, 2027 |
|
$ |
706 |
|
|
$ |
771 |
|
| 4.125% fixed to floating rate, subordinated notes, due November 20, 2029, callable on November 20, 2024 |
|
|
— |
|
|
|
283,159 |
|
| 7.250% subordinated notes, due June 28, 2029, callable on June 28, 2024 |
|
|
— |
|
|
|
35,000 |
|
| 4.750% subordinated notes, due June 30, 2029, callable on June 30, 2024 |
|
|
— |
|
|
|
79,352 |
|
| 6.250% subordinated notes, due June 28, 2029, callable on June 28, 2024 |
|
|
— |
|
|
|
25,000 |
|
| 5.000% fixed to floating rate, subordinated notes, due June 30, 2030, callable on June 30, 2025 |
|
|
10,000 |
|
|
|
10,000 |
|
| Purchase accounting adjustment, net of amortization |
|
|
— |
|
|
|
5,786 |
|
| Debt issue costs |
|
|
— |
|
|
|
(608 |
) |
| Total long-term borrowings |
|
$ |
10,706 |
|
|
$ |
438,460 |
|
During 2024, the Company repurchased $68.0 million of the $300 million Subordinated Notes due November 20, 2029, resulting in a $1.8 million gain
on the extinguishment of debt, and called the remaining $215.2 million of these Subordinated Notes. Also during 2024, the Company repurchased $0.5 million of our Subordinated Notes due June 2029 and called the remaining $138.9 million of each of the
Subordinated Notes due June 2029, resulting in a net gain on the extinguishment of debt of $4.7 million which was reported in other noninterest revenue in the consolidated statements of income.
Contractual annual principal payments on long-term debt for the next five years and thereafter are shown in the following table. These maturities
are based upon the amounts owed at December 31, 2024.
| (Dollars in thousands) |
|
FHLB Advances |
|
|
Subordinated Notes |
|
|
Total |
|
| 2025 |
|
$ |
61 |
|
|
$ |
— |
|
|
$ |
61 |
|
| 2026 |
|
|
40 |
|
|
|
— |
|
|
|
40 |
|
| 2027 |
|
|
605 |
|
|
|
— |
|
|
|
605 |
|
| 2028 |
|
|
— |
|
|
|
— |
|
|
|
— |
|
| 2029 |
|
|
— |
|
|
|
— |
|
|
|
— |
|
| Thereafter |
|
|
— |
|
|
|
10,000 |
|
|
|
10,000 |
|
| Total |
|
$ |
706 |
|
|
$ |
10,000 |
|
|
$ |
10,706 |
|
NOTE 10. PREFERRED STOCK
In November 2019, the Company completed its public offering of 6,900,000 shares of 5.50% Series A Non- Cumulative Perpetual Preferred Stock, par
value $0.01 per share, with a liquidation preference of $25 per share of Series A Preferred Stock (the “Series A Preferred Stock”), which represents $172.5 million in aggregate liquidation preference (the “Series A Preferred Stock Offering”). The
Company received net proceeds from the Series A Preferred Stock Offering, after deducting the underwriting discount and estimated expenses, of $167.5 million. Holders of the Series A Preferred Stock are entitled to receive, only when, as, and if
declared by the Company’s board of directors, non-cumulative cash dividends based upon the liquidation preference of $25 per share of Series A Preferred Stock, and no more, at a rate equal to 5.50% per annum, payable quarterly, in arrears, on February
20, May 20, August 20 and November 20 of each year. The Board of Directors declared total cash dividends of $1.375 per share of Series A Preferred Stock for a total of $9.5 million during years 2024, 2023, and 2022.
Series A Preferred Stock is not subject to any mandatory redemption, sinking fund or other similar provision. The Company may redeem shares of
Series A Preferred Stock at its option, subject to regulatory requirements, at a redemption price equal to $25 per share, plus any declared and unpaid dividends. In the event Series A Preferred Stock is redeemed at the liquidation amount, $5.5 million
in excess of the liquidation amount over the carrying amount will be recorded as a reduction to net income available to common shareholders.
NOTE 11. INCOME TAXES
The components of income tax expense (benefit) attributable to continuing operations were as follows for the years ended December 31, 2024, 2023
and 2022:
| (In thousands) |
|
2024 |
|
|
2023 |
|
|
2022 |
|
| Current: |
|
|
|
|
|
|
|
|
|
|
|
|
| Federal |
|
$ |
126,226 |
|
|
$ |
(2,355 |
) |
|
$ |
106,628 |
|
| State |
|
|
18,148 |
|
|
|
(3,131 |
) |
|
|
13,972 |
|
| Deferred: |
|
|
|
|
|
|
|
|
|
|
|
|
| Federal |
|
|
10,521 |
|
|
|
1,208 |
|
|
|
7,245 |
|
| State |
|
|
(2,302 |
) |
|
|
(316 |
) |
|
|
1,860 |
|
| Total |
|
$ |
152,593 |
|
|
$ |
(4,594 |
) |
|
$ |
129,705 |
|
The Company had income tax receivable (payable) of $18.5 million, $(10.0) million and $(0.5) million at December 31, 2024, 2023 and 2022,
respectively.
Income tax expense (benefit) on continuing operations differed from the amounts computed by applying the U.S. federal income tax rate of 21% to
income (loss) from continuing operations before income taxes resulting from the following:
| (In thousands) |
|
2024 |
|
|
2023 |
|
|
2022 |
|
| Tax expense (benefit) at statutory rates |
|
$ |
142,001 |
|
|
$ |
(191 |
) |
|
$ |
121,175 |
|
| Increase (decrease) in taxes resulting from: |
|
|
|
|
|
|
|
|
|
|
|
|
| State income taxes, net of federal tax benefit |
|
|
12,519 |
|
|
|
(2,723 |
) |
|
|
12,508 |
|
| Tax-exempt interest revenue |
|
|
(1,542 |
) |
|
|
(1,730 |
) |
|
|
(2,877 |
) |
| Tax-exempt earnings on life insurance |
|
|
(3,422 |
) |
|
|
(3,135 |
) |
|
|
(2,640 |
) |
| Deductible dividends paid on 401(k) plan |
|
|
(16 |
) |
|
|
(529 |
) |
|
|
(537 |
) |
| Goodwill writeoff |
|
|
181 |
|
|
|
— |
|
|
|
— |
|
| Tax rate change revaluation of deferreds |
|
|
— |
|
|
|
— |
|
|
|
2,470 |
|
| Excess salary disallowance |
|
|
5,544 |
|
|
|
4,855 |
|
|
|
3,672 |
|
| Tax credits |
|
|
(4,225 |
) |
|
|
(12,926 |
) |
|
|
(9,728 |
) |
| FDIC disallowance |
|
|
6,876 |
|
|
|
7,332 |
|
|
|
3,797 |
|
| Nondeductible merger costs |
|
|
— |
|
|
|
— |
|
|
|
129 |
|
| Meals and entertainment |
|
|
565 |
|
|
|
628 |
|
|
|
441 |
|
| Other, net |
|
|
(5,888 |
) |
|
|
3,825 |
|
|
|
1,295 |
|
| Total |
|
$ |
152,593 |
|
|
$ |
(4,594 |
) |
|
$ |
129,705 |
|
The tax effects of temporary differences that gave rise to significant portions of the deferred tax assets and deferred tax liabilities at
December 31, 2024 and 2023 were as follows:
| (In thousands) |
|
2024 |
|
|
2023 |
|
| Deferred tax assets: |
|
|
|
|
|
|
|
|
| Loans, principally due to allowance for credit losses |
|
$ |
112,244 |
|
|
$ |
114,341 |
|
| Other real estate owned |
|
|
267 |
|
|
|
2,217 |
|
| Loans, fair value adjustment |
|
|
3,130 |
|
|
|
5,953 |
|
| Securities, fair value adjustment |
|
|
4,720 |
|
|
|
5,137 |
|
| Accrued liabilities |
|
|
34,708 |
|
|
|
34,724 |
|
| Net operating loss carryforwards |
|
|
5,598 |
|
|
|
6,593 |
|
| Lease liability |
|
|
43,939 |
|
|
|
44,916 |
|
| Other |
|
|
5,001 |
|
|
|
3,007 |
|
| Unrealized net losses on available for sale-securities |
|
|
201,646 |
|
|
|
222,063 |
|
| Unrecognized pension expense |
|
|
13,886 |
|
|
|
14,291 |
|
| Total gross deferred tax assets |
|
|
425,139 |
|
|
|
453,242 |
|
| Less: valuation allowance |
|
|
564 |
|
|
|
615 |
|
| Deferred tax assets |
|
|
424,575 |
|
|
|
452,627 |
|
| Deferred tax liabilities: |
|
|
|
|
|
|
|
|
| Lease transactions |
|
$ |
1,313 |
|
|
$ |
1,511 |
|
| Employment benefits |
|
|
17,231 |
|
|
|
12,690 |
|
| Premises and equipment, principally due to differences in depreciation |
|
|
18,748 |
|
|
|
24,588 |
|
| Mortgage servicing rights |
|
|
26,917 |
|
|
|
25,134 |
|
| Intangible assets |
|
|
29,221 |
|
|
|
29,936 |
|
| Investments |
|
|
6,216 |
|
|
|
7,093 |
|
| Deferred net loan fees |
|
|
25,360 |
|
|
|
24,106 |
|
| Right of use asset |
|
|
39,170 |
|
|
|
40,200 |
|
| Other |
|
|
4,099 |
|
|
|
3,669 |
|
| Total gross deferred tax liabilities |
|
|
168,275 |
|
|
|
168,927 |
|
| Net deferred tax assets |
|
$ |
256,300 |
|
|
$ |
283,700 |
|
At December 31, 2024, the Company had a net deferred tax asset of $256.3 million, compared to $283.7 million at December 31, 2023. The changes to
gross deferred tax assets and liabilities during 2024 was primarily due to deferred tax adjustments related to the change in market value of available for sale securities.
Based upon the level of historical taxable income and projections for future taxable income over the periods in which deferred tax assets are
deductible, management believes it is more likely than not that the Company will realize the benefits of these deductible differences existing at December 31, 2024 with the exception of a state net operating loss carryforward that will not be realized
which resulted in a $0.6 million valuation allowance.
At December 31, 2024, the Company has federal net operating loss carryforwards of $23.7 million which will begin to expire in 2030. The Company
has state net operating loss carryforwards of $1.4 million which will begin to expire in 2030. The Company believes it is more likely than not the benefit from certain state net operating loss carryforwards will not be realized, and accordingly, has
established a pre-tax valuation allowance of $13.2 million, $0.6 million after tax, associated with those net operating losses at December 31, 2024.
The Company recognizes accrued interest related to unrecognized tax benefits and penalties as a component of other noninterest expense. The
Company accrued interest of $64 thousand in 2024, $143 thousand in 2023 and $214 thousand in 2022. The Company’s accrued interest and penalties on unrecognized tax benefits was $0.8 million and $0.7 million at December 31, 2024 and 2023, respectively.
Accrued interest and penalties are included in other liabilities.
At December 31, 2024 and 2023, the balance of unrecognized tax benefits, if recognized that would reduce the effective tax rate was $1.0 million
and $1.2 million, respectively. The Company does not anticipate a significant change to the total amount of unrecognized tax benefits within the next 12 months. The following table presents a summary of the beginning and ending amounts of unrecognized
income tax benefits:
| |
|
Years ended December 31, |
|
| (In thousands) |
|
2024 |
|
|
2023 |
|
|
2022 |
|
| Balance at January 1 |
|
$ |
1,242 |
|
|
$ |
3,077 |
|
|
$ |
1,441 |
|
| Additions based on income tax positions related to current year |
|
|
— |
|
|
|
— |
|
|
|
154 |
|
| Additions for income tax positions for prior years |
|
|
— |
|
|
|
— |
|
|
|
— |
|
| Additions from acquisition |
|
|
— |
|
|
|
— |
|
|
|
1,482 |
|
| Reductions for income tax positions of prior years |
|
|
(244 |
) |
|
|
— |
|
|
|
— |
|
| Statute of limitation expirations |
|
|
— |
|
|
|
— |
|
|
|
— |
|
| Settlements |
|
|
— |
|
|
|
(1,835 |
) |
|
|
— |
|
| Balance at December 31 |
|
$ |
998 |
|
|
$ |
1,242 |
|
|
$ |
3,077 |
|
Unrecognized state income tax benefits are not adjusted for the federal income tax impact.
The Company is subject to taxation in the United States and various states and local jurisdictions. The Company files a consolidated United States
federal return. Based on the laws of the applicable state where the Company conducts business operations, the Company and its applicable subsidiaries either file a consolidated, combined or separate return. The tax years that remain open for
examination for the Company’s major jurisdictions of the United States—Federal, Mississippi, Arkansas, Tennessee, Alabama, Louisiana, Texas, Georgia and Missouri—are 2021, 2022 and 2023.
In August 2022, the IRA of 2022 was signed into law to address inflation, healthcare costs, climate change and renewal energy incentives, among
other things. Included in the IRA of 2022 are provisions for the creation of a 15% CAMT that is effective for tax years beginning January 1, 2023 for corporations with an average annual adjusted financial statement income in excess of $1 billion. In
2024 and 2023, the Company was not subject to the 15% CAMT.
NOTE 12. PENSION AND OTHER POST RETIREMENT BENEFIT PLANS
The Basic Plan is a non-contributory defined benefit pension plan managed by a trustee covering substantially all full-time employees who have at
least one year of service, worked at least 1,000 hours and have attained the age of 18. For such employees hired prior to January 1, 2006, benefits were based on years of service and the employee’s compensation until January 1, 2017, at which time
benefits were based on a 2.5% cash balance formula. For such employees hired on or after January 1, 2006, benefits accrue based on a cash balance formula, effective January 1, 2012. The Company’s funding policy is to contribute to the Basic Plan the
amount that meets the minimum funding requirements set forth in the Employee Retirement Income Security Act of 1974, plus such additional amounts as the Company determines to be appropriate. The difference between the plan assets and projected benefit
obligation is included in other assets or other liabilities, as appropriate. Actuarial assumptions are evaluated periodically.
The Restoration Plan provides for the payment of retirement benefits to certain participants in the Basic Plan. The Restoration Plan is a
non-qualified plan that covers any employee whose benefit under the Basic Plan is limited by the provisions of the Internal Revenue Code of 1986, as amended (the “Code”), and any employee who elects to participate in the Cadence Frozen Deferred
Compensation Plan, which reduces the employee’s benefit under the Basic Plan. For employees hired prior to January 1, 2006, benefits were based on years of service and the employee’s compensation until January 1, 2017, at which time benefits were based
on a 2.5% cash balance formula. For such employees hired on or after January 1, 2006, benefits accrue based on a cash balance formula, effective January 1, 2012. The Supplemental Plan is a non-qualified defined benefit supplemental retirement plan for
certain key employees. Benefits commence when the employee retires and are payable over a period of ten years.
The Company measured benefit obligations using the most recent Pri-2012 mortality tables and MP-2021 mortality improvement scale in selecting
mortality assumptions at December 31, 2024. The Company uses a December 31 measurement date for its pension and other benefit plans.
In 2023, an amendment was made to the Basic Plan in conjunction with a special voluntary retirement offer specifically designed for long-term
participants in the Basic Plan. This amendment to provide enhanced pension benefit protection increased the Basic Plan’s liability by $5.1 million, which the Company recognized immediately as a one-time charge to expense during 2023.
A summary of the three defined benefit retirement plans at and for the years ended December 31, 2024, 2023 and 2022 follows:
| |
|
Pension Benefits |
|
| (In thousands) |
|
2024 |
|
|
2023 |
|
|
2022 |
|
| Change in benefit obligations: |
|
|
|
|
|
|
|
|
|
|
|
|
| Projected benefit obligations at beginning of year |
|
$ |
241,606 |
|
|
$ |
238,878 |
|
|
$ |
323,274 |
|
| Service cost |
|
|
7,627 |
|
|
|
9,840 |
|
|
|
10,439 |
|
| Interest cost |
|
|
11,765 |
|
|
|
12,191 |
|
|
|
7,278 |
|
| Actuarial (gain) loss |
|
|
6,026 |
|
|
|
15,387 |
|
|
|
(61,610 |
) |
| Benefits paid |
|
|
(10,612 |
) |
|
|
(11,691 |
) |
|
|
(10,510 |
) |
| Administrative expenses paid |
|
|
(2,058 |
) |
|
|
(1,319 |
) |
|
|
(1,033 |
) |
| Plan amendments |
|
|
— |
|
|
|
5,088 |
|
|
|
— |
|
| Settlements (1) |
|
|
(15,640 |
) |
|
|
(26,768 |
) |
|
|
(28,960 |
) |
| Projected benefit obligations at end of year |
|
$ |
238,714 |
|
|
$ |
241,606 |
|
|
$ |
238,878 |
|
| Change in plans’ assets: |
|
|
|
|
|
|
|
|
|
|
|
|
| Fair value of plans’ assets at beginning of year |
|
$ |
337,803 |
|
|
$ |
341,629 |
|
|
$ |
414,067 |
|
| Actual return on assets |
|
|
27,764 |
|
|
|
33,397 |
|
|
|
(34,384 |
) |
| Employer contributions |
|
|
4,170 |
|
|
|
2,555 |
|
|
|
2,449 |
|
| Benefits paid |
|
|
(10,612 |
) |
|
|
(11,691 |
) |
|
|
(10,510 |
) |
| Administrative expenses paid |
|
|
(2,058 |
) |
|
|
(1,319 |
) |
|
|
(1,033 |
) |
| Settlements (1) |
|
|
(15,640 |
) |
|
|
(26,768 |
) |
|
|
(28,960 |
) |
| Fair value of plans’ assets at end of year |
|
$ |
341,427 |
|
|
$ |
337,803 |
|
|
$ |
341,629 |
|
| Funded status: |
|
|
|
|
|
|
|
|
|
|
|
|
| Projected benefit obligations |
|
$ |
(238,714 |
) |
|
$ |
(241,606 |
) |
|
$ |
(238,878 |
) |
| Fair value of plans’ assets |
|
|
341,427 |
|
|
|
337,803 |
|
|
|
341,629 |
|
| Net amount recognized |
|
$ |
102,713 |
|
|
$ |
96,197 |
|
|
$ |
102,751 |
|
|
(1) |
The total lump sums paid during 2024, 2023, and 2022 were $15.6 million, $26.8 million, and $29.0 million, respectively, compared to a settlement threshold of $17.2 million, $19.6 million, and $14.8 million. As a
result, there was no charge recognized for 2024 and a charge of $11.8 million and $9.0 million were recognized for 2023 and 2022, respectively. |
The overall funded status of the plans improved slightly during 2024. The slight increase was the result of an increase in the fair value of the
plans’ assets as the actual returns on plan assets exceeded payments and settlements coupled with a decrease in the projected benefit obligation due to decreased interest cost and plan amendments.
The weighted-average interest crediting rates for both the Basic Plan and the Restoration Plan were 3.79% in 2024. The Supplemental Plan does not
have a minimum interest crediting rate.
Amounts recognized in the consolidated balance sheets consisted of:
| |
|
Pension Benefits |
|
| (In thousands) |
|
2024 |
|
|
2023 |
|
|
2022 |
|
| Prepaid benefit cost |
|
$ |
191,464 |
|
|
$ |
188,325 |
|
|
$ |
201,581 |
|
| Accrued benefit liability |
|
|
(29,963 |
) |
|
|
(31,625 |
) |
|
|
(31,800 |
) |
| Accumulated other comprehensive loss adjustment |
|
|
(58,788 |
) |
|
|
(60,503 |
) |
|
|
(67,030 |
) |
| Net amount recognized |
|
$ |
102,713 |
|
|
$ |
96,197 |
|
|
$ |
102,751 |
|
Pre-tax amounts recognized in accumulated other comprehensive loss consisted of:
| |
|
December 31, |
|
| (In thousands) |
|
2024 |
|
|
2023 |
|
| Net prior service benefit |
|
$ |
178 |
|
|
$ |
191 |
|
| Net actuarial loss |
|
|
58,610 |
|
|
|
60,312 |
|
| Total accumulated other comprehensive loss |
|
$ |
58,788 |
|
|
$ |
60,503 |
|
The components of net periodic benefit cost for the periods indicated were as follows:
| |
|
Year Ended December 31, |
|
| (In thousands) |
|
2024 |
|
|
2023 |
|
|
2022 |
|
| Service cost |
|
$ |
7,627 |
|
|
$ |
9,840 |
|
|
$ |
10,439 |
|
| Interest cost |
|
|
11,765 |
|
|
|
12,191 |
|
|
|
7,278 |
|
| Expected return on plan assets |
|
|
(22,966 |
) |
|
|
(21,969 |
) |
|
|
(23,003 |
) |
| Recognized prior service cost |
|
|
13 |
|
|
|
13 |
|
|
|
14 |
|
| Recognized net loss |
|
|
2,931 |
|
|
|
3,734 |
|
|
|
4,726 |
|
| Settlement loss |
|
|
— |
|
|
|
11,826 |
|
|
|
9,023 |
|
| Net periodic benefit (credit) cost (1) |
|
$ |
(630 |
) |
|
$ |
15,635 |
|
|
$ |
8,477 |
|
|
(1) |
While service cost is included in salaries and employee benefits, the other components of net periodic pension costs are included in other noninterest expense in the consolidated statements of income for the years
ended December 31, 2024, 2023, and 2022. |
The weighted-average assumptions used to determine benefit obligations at December 31, 2024 and 2023 were as follows:
| |
|
Basic Plan |
|
|
Restoration Plan |
|
|
Supplemental Plan |
|
| |
|
2024 |
|
|
2023 |
|
|
2024 |
|
|
2023 |
|
|
2024 |
|
|
2023 |
|
| Discount rate |
|
|
5.60 |
% |
|
|
5.29 |
% |
|
|
5.50 |
% |
|
|
5.22 |
% |
|
|
5.31 |
% |
|
|
5.05 |
% |
| Rate of compensation increase |
|
|
4.00 |
% |
|
|
4.00 |
% |
|
|
4.00 |
% |
|
|
4.00 |
% |
|
|
3.50 |
% |
|
|
3.00 |
% |
The weighted-average assumptions used to determine net periodic benefit cost for 2024, 2023 and 2022 were as follows:
| |
|
Basic Plan |
|
| |
|
2024 |
|
|
2023 |
|
|
2022 |
|
| Discount rate-service cost |
|
|
5.35 |
% |
|
|
5.65 |
% |
|
|
2.92 |
% |
| Discount rate-interest cost |
|
|
5.13 |
% |
|
|
5.13 |
% |
|
|
1.95 |
% |
| Rate of compensation increase |
|
|
4.00 |
% |
|
|
4.00 |
% |
|
|
4.00 |
% |
| Expected rate of return on plan assets |
|
|
7.00 |
% |
|
|
6.50 |
% |
|
|
6.00 |
% |
| |
|
Restoration Plan |
|
| |
|
2024 |
|
|
2023 |
|
|
2022 |
|
| Discount rate-service cost |
|
|
5.71 |
% |
|
|
5.53 |
% |
|
|
2.61 |
% |
| Discount rate-interest cost |
|
|
5.31 |
% |
|
|
5.30 |
% |
|
|
2.26 |
% |
| Rate of compensation increase |
|
|
4.00 |
% |
|
|
4.00 |
% |
|
|
4.00 |
% |
| Expected rate of return on plan assets |
|
|
N/A |
|
|
|
N/A |
|
|
|
N/A |
|
| |
|
Supplemental Plan |
|
| |
|
2024 |
|
|
2023 |
|
|
2022 |
|
| Discount rate-service cost |
|
|
5.75 |
% |
|
|
5.49 |
% |
|
|
2.24 |
% |
| Discount rate-interest cost |
|
|
5.02 |
% |
|
|
5.28 |
% |
|
|
1.62 |
% |
| Rate of compensation increase |
|
|
3.00 |
% |
|
|
3.00 |
% |
|
|
3.00 |
% |
| Expected rate of return on plan assets |
|
|
N/A |
|
|
|
N/A |
|
|
|
N/A |
|
The following table presents information related to the Restoration and Supplemental Plans that had accumulated benefit obligations in excess of
plan assets at December 31, 2024 and 2023:
| (In thousands) |
|
2024 |
|
|
2023 |
|
| Projected benefit obligation |
|
$ |
35,534 |
|
|
$ |
37,431 |
|
| Accumulated benefit obligation |
|
|
34,376 |
|
|
|
34,861 |
|
| Fair value of assets |
|
|
— |
|
|
|
— |
|
In selecting the expected long-term rate of return on assets used for the Basic Plan, the Company considered the average rate of earnings expected
on the funds invested or to be invested to provide for the benefits of the plan. This included considering the trust asset allocation and the expected returns likely to be earned over the life of the plan. This basis is consistent with the prior year.
The discount rate is the rate used to determine the present value of the Company’s future benefit obligations for its pension and other postretirement benefit plans.
Plan assets are managed on a total return basis to meet future obligations. Risk is managed through asset allocation, diversification, asset
valuation analysis and maintaining a long-term focus. Assets are invested in multiple asset classes including, but not limited to, domestic equities, international equities and fixed income securities. Factors considered for the Plan’s asset allocation
include, but are not limited to, the Plan’s funding status, long-term expected liabilities and expected long-term investment performance. To meet the Plan’s obligation, long-term returns take priority over short term market volatility and uncertainty.
The Plan asset allocation, diversification and long-term performance are evaluated by the Retirement Committee multiple times throughout each calendar year.
The Company’s pension plan weighted-average asset allocations at December 31, 2024 and 2023 and the Company’s target allocations for 2025, by
asset category, were as follows:
| |
|
Plan assets at December 31, |
|
|
Target for |
|
| Asset category: |
|
2024 |
|
|
2023 |
|
|
2025 |
|
| Equity securities |
|
|
49 |
% |
|
|
49 |
% |
|
33-60% |
|
| Debt securities |
|
|
47 |
% |
|
|
47 |
% |
|
40-67% |
|
| Cash and equivalents |
|
|
5 |
% |
|
|
4 |
% |
|
|
|
| Total |
|
|
100 |
% |
|
|
100 |
% |
|
|
|
Equity securities held in the Basic Plan included shares of the Company’s common stock with a fair value of $2.8 million (0.83% of total plan
assets) and $2.4 million (0.72% of total plan assets) at December 31, 2024 and 2023, respectively. An analysis by management is performed annually to determine whether the Company will make a contribution to the Basic Plan.
The following table presents information regarding expected future benefit payments, which reflect expected service, as appropriate:
| (In thousands) |
|
Pension
Benefits |
|
| Expected future benefit payments: |
|
|
|
|
| 2025 |
|
$ |
25,061 |
|
| 2026 |
|
|
25,577 |
|
| 2027 |
|
|
26,032 |
|
| 2028 |
|
|
25,515 |
|
| 2029 |
|
|
25,693 |
|
| 2030-2034 |
|
|
119,808 |
|
The following table presents the fair value of each major category of plan assets held in the Basic Plan at December 31, 2024 and 2023:
| |
|
Plan Assets |
|
| (In thousands) |
|
2024 |
|
|
2023 |
|
| Investments, at fair value: |
|
|
|
|
|
|
|
|
| Cash and cash equivalents |
|
$ |
11,459 |
|
|
$ |
7,822 |
|
| U.S. agency debt obligations |
|
|
20,549 |
|
|
|
13,679 |
|
| Mutual funds |
|
|
272,349 |
|
|
|
272,589 |
|
| U. S. government debt obligations |
|
|
6,880 |
|
|
|
5,895 |
|
| Common stock of Cadence Bank |
|
|
2,834 |
|
|
|
2,434 |
|
| Brokered certificates of deposit |
|
|
26,711 |
|
|
|
34,703 |
|
| Total investments, at fair value |
|
|
340,782 |
|
|
|
337,122 |
|
| Accrued interest and dividends |
|
|
645 |
|
|
|
681 |
|
| Fair value of plan assets |
|
$ |
341,427 |
|
|
$ |
337,803 |
|
Fair values are determined based on valuation techniques categorized as follows: Level 1 means the use of quoted prices for identical instruments
in active markets; Level 2 means the use of quoted prices for identical or similar instruments in markets that are not active or are directly or indirectly observable; Level 3 means the use of unobservable inputs. Quoted market prices, when available,
are used to value investments. Pension plan investments include funds which invest in various types of investment securities and in various companies within various markets. Investment securities are exposed to several risks, such as interest rate,
market and credit risks. Because of the level of risk associated with certain investment securities, it is at least reasonably possible that changes in the values of investment securities will occur in the near term and that such changes could
materially affect the amounts reported.
The following tables set forth the plan investments at fair value at December 31, 2024 and 2023:
| |
|
2024 |
|
| (In thousands) |
|
Level 1 |
|
|
Level 2 |
|
|
Level 3 |
|
|
Total |
|
| Cash and cash equivalents |
|
$ |
11,459 |
|
|
$ |
— |
|
|
$ |
— |
|
|
$ |
11,459 |
|
| U.S. agency debt obligations |
|
|
— |
|
|
|
20,549 |
|
|
|
— |
|
|
|
20,549 |
|
| U.S. government debt obligations |
|
|
— |
|
|
|
6,880 |
|
|
|
— |
|
|
|
6,880 |
|
| Mutual funds |
|
|
272,349 |
|
|
|
— |
|
|
|
— |
|
|
|
272,349 |
|
| Company common stock |
|
|
2,834 |
|
|
|
— |
|
|
|
— |
|
|
|
2,834 |
|
| Brokered certificates of deposit |
|
|
— |
|
|
|
26,711 |
|
|
|
— |
|
|
|
26,711 |
|
| Total |
|
$ |
286,642 |
|
|
$ |
54,140 |
|
|
$ |
— |
|
|
$ |
340,782 |
|
| |
|
2023 |
|
| (In thousands) |
|
Level 1 |
|
|
Level 2 |
|
|
Level 3 |
|
|
Total |
|
| Cash and cash equivalents |
|
$ |
7,822 |
|
|
$ |
— |
|
|
$ |
— |
|
|
$ |
7,822 |
|
| U.S. agency debt obligations |
|
|
— |
|
|
|
13,679 |
|
|
|
— |
|
|
|
13,679 |
|
| U.S. government debt obligations |
|
|
— |
|
|
|
5,895 |
|
|
|
— |
|
|
|
5,895 |
|
| Mutual funds |
|
|
272,589 |
|
|
|
— |
|
|
|
— |
|
|
|
272,589 |
|
| Company common stock |
|
|
2,434 |
|
|
|
— |
|
|
|
— |
|
|
|
2,434 |
|
| Brokered certificates of deposit |
|
|
— |
|
|
|
34,703 |
|
|
|
— |
|
|
|
34,703 |
|
| Total |
|
$ |
282,845 |
|
|
$ |
54,277 |
|
|
$ |
— |
|
|
$ |
337,122 |
|
The following investments represented 5% or more of the total plan asset value at December 31, 2024:
| (In thousands) |
|
2024 |
|
| John Hancock Discip Value Fund |
|
$ |
20,713 |
|
| John Hancock Discip Value Mid Cap Fund |
|
|
19,756 |
|
| Curasset Capital Management Core Bond Fund |
|
|
30,536 |
|
| Curasset Capital Management Limited Term Inc Fund |
|
|
38,021 |
|
| Pioneer Multi-Asset Ultrashort Inc Fund |
|
|
20,572 |
|
| First Eagle Global Fund Class R6 |
|
|
23,111 |
|
| JP Morgan Equity Income R6 |
|
|
24,873 |
|
| JP Morgan Strategic Income Opp Fund |
|
|
20,057 |
|
The Company has a defined contribution plan (commonly referred to as a “401(k) Plan”). Employees may contribute a portion of their compensation,
as set forth in the 401(k) Plan, subject to the limitations as established by the Code. Employee contributions (up to 5% of defined compensation) are matched dollar-for-dollar by the Company. Employer contributions were $21.2 million, $22.6 million,
and $21.4 million for 2024, 2023, and 2022, respectively.
NOTE 13. FAIR VALUE DISCLOSURES
Fair value is defined by U.S. GAAP as the price that would be received to sell an asset or paid to transfer a liability in an orderly transaction
between market participants at the measurement date. U.S. GAAP establishes a fair value hierarchy that prioritizes the inputs to valuation techniques used to measure fair value. This hierarchy requires the Company to maximize the use of observable
market data, when available, and to minimize the use of unobservable inputs when determining fair value. Each fair value measurement is placed into the proper level based on the lowest level of significant input. These levels are:
|
● |
Level 1: Valuation is based upon quoted prices for identical instruments traded in active markets. |
|
● |
Level 2: Valuation is based upon quoted prices for similar instruments in active markets, quoted prices for identical or similar instruments in markets that are not active, and model-based valuation
techniques for which all significant assumptions are observable in the market. |
|
● |
Level 3: Valuation is generated from model-based techniques that use significant assumptions not observable in the market. These unobservable assumptions reflect management’s estimates of assumptions that
market participants would use in pricing the asset or liability. Valuation techniques include use of option pricing models, discounted cash flow models, and similar techniques. |
Transfers between fair value levels are recognized at the end of the fiscal quarter in which the associated change in inputs occurs.
Determination of Fair Value
Fair values are based on the price that would be received to sell an asset or paid to transfer a liability in an orderly transaction between
market participants at the measurement date. The following describes the assumptions and methodologies used to estimate the fair value of financial instruments recorded at fair value in the consolidated balance sheets and for estimating the fair value
of financial instruments for which fair value is disclosed.
Available for sale securities and equity investments. AFS securities and equity investments (with readily determinable fair values) are
recorded at fair value on a recurring basis. AFS securities and equity investments that are traded on an active exchange are classified as Level 1. If quoted prices are not available, the Company obtains fair value measurements from an independent
pricing service. These fair value measurements consider observable market data that may include benchmark yield curves, reported trades, broker/dealer quotes, issuer spreads and credit information, among other inputs. These securities are classified as
Level 2.
Mortgage servicing rights. The Company records MSR at fair value on a recurring basis with subsequent remeasurement of MSR based on change
in fair value. An estimate of the fair value of the Company’s MSR is determined by utilizing assumptions about factors such as mortgage interest rates, discount rates, mortgage loan prepayment speeds, market trends and industry demand. All of the
Company’s MSR are classified as Level 3.
Derivative instruments. The Company’s derivatives that are traded on an active exchange are classified as Level 1. The majority of the
Company’s derivative instruments are measured at fair value based on modeling that utilizes observable market inputs for various interest rates published by leading third-party financial news and data providers. This is observable data that represents
the rates used by market participants for instruments entered into at that date; however, they are not based on actual transactions, so they are classified as Level 2. Derivative instruments that are measured at fair value based on either an
unobservable market price or a discounted cash flow valuation using the terms of a derivative agreement are classified as Level 3.
Loans held for sale. Loans held for sale are carried at fair value which is based on commitments outstanding from investors as well as
what secondary markets are currently offering for portfolios with similar characteristics. Therefore, loans held for sale are subjected to recurring fair value adjustments and are classified as Level 2. The Company obtains quotes, bids, or pricing
indications on all or part of these loans directly from the buyers. Premiums and discounts received or to be received on the quotes, bids or pricing indications are indicative of the fact that the cost is lower or higher than fair value.
Investments in limited partnerships. The fair value of certain investments in limited partnerships is estimated using the practical
expedient of net asset value. For other investments in limited partnerships that do not qualify for the practical expedient, we use a measurement alternative which measures these investments at cost, less any impairment, plus or minus any changes
resulting from observable price changes in orderly transactions for identical or similar investments of the same issuer. The Company classifies these investments in limited partnerships as Level 3.
SBA servicing assets. The fair value of the SBA servicing assets is estimated using the gross coupon less an assumed CSC. The Company
classifies SBA servicing assets as Level 3.
Other real estate owned and repossessed assets. OREO is carried at the lower of cost or fair value less estimated selling costs on an
ongoing basis and is subjected to nonrecurring fair value adjustments. Estimated fair value is determined on the basis of independent appraisals and other relevant factors. Appraisals that are not based on observable inputs or that require significant
adjustments or fair value measurements that are not based on third-party appraisals are considered to be based on significant unobservable inputs. The fair value of repossessed assets is determined using net orderly liquidation valuation on a
nonrecurring basis. The Company’s OREO and repossessed assets are classified as Level 3.
Collateral-dependent loans (impaired and purchase credit deteriorated (loss)). Collateral-dependent loans considered for specific reserve
are loans for which, based on current information and events, it is probable that the creditor will be unable to collect all amounts due according to the contractual terms of the loan agreement. Collateral-dependent loans include impaired loans and
classified purchased credit deteriorated (loss) loans (as defined by management). When a loan is collateral-dependent, the fair value of the loan is determined based on the fair value of the underlying collateral. All of the Company’s
collateral-dependent loans are classified as Level 3.
Assets and Liabilities Recorded at Fair Value on a Recurring Basis
The following tables present the balances of the assets and liabilities measured at fair value on a recurring basis:
| |
|
December 31, 2024 |
|
| (In thousands) |
|
Level 1 |
|
|
Level 2 |
|
|
Level 3 |
|
|
Total |
|
| Assets: |
|
|
|
|
|
|
|
|
|
|
|
|
|
|
|
|
| Available for sale securities |
|
$ |
— |
|
|
$ |
7,293,988 |
|
|
$ |
— |
|
|
$ |
7,293,988 |
|
| Equity investments |
|
|
21,678 |
|
|
|
— |
|
|
|
— |
|
|
|
21,678 |
|
| Mortgage servicing rights |
|
|
— |
|
|
|
— |
|
|
|
114,594 |
|
|
|
114,594 |
|
| Derivative instruments |
|
|
— |
|
|
|
32,021 |
|
|
|
1,310 |
|
|
|
33,331 |
|
| Loans held for sale |
|
|
— |
|
|
|
244,192 |
|
|
|
— |
|
|
|
244,192 |
|
| Investments in limited partnerships |
|
|
— |
|
|
|
— |
|
|
|
118,710 |
|
|
|
118,710 |
|
| SBA servicing rights |
|
|
— |
|
|
|
— |
|
|
|
5,785 |
|
|
|
5,785 |
|
| Total |
|
$ |
21,678 |
|
|
$ |
7,570,201 |
|
|
$ |
240,399 |
|
|
$ |
7,832,278 |
|
| Liabilities: |
|
|
|
|
|
|
|
|
|
|
|
|
|
|
|
|
| Derivative instruments |
|
$ |
3,085 |
|
|
$ |
45,573 |
|
|
$ |
15 |
|
|
$ |
48,673 |
|
| |
|
December 31, 2023 |
|
| (In thousands) |
|
Level 1 |
|
|
Level 2 |
|
|
Level 3 |
|
|
Total |
|
| Assets: |
|
|
|
|
|
|
|
|
|
|
|
|
| Available for sale securities |
|
$ |
— |
|
|
$ |
8,075,476 |
|
|
$ |
— |
|
|
$ |
8,075,476 |
|
| Equity investments |
|
|
22,108 |
|
|
|
— |
|
|
|
— |
|
|
|
22,108 |
|
| Mortgage servicing rights |
|
|
— |
|
|
|
— |
|
|
|
106,824 |
|
|
|
106,824 |
|
| Derivative instruments |
|
|
1,809 |
|
|
|
25,836 |
|
|
|
1,858 |
|
|
|
29,503 |
|
| Loans held for sale |
|
|
— |
|
|
|
186,301 |
|
|
|
— |
|
|
|
186,301 |
|
| Investments in limited partnerships |
|
|
— |
|
|
|
— |
|
|
|
94,998 |
|
|
|
94,998 |
|
| SBA servicing rights |
|
|
— |
|
|
|
— |
|
|
|
6,124 |
|
|
|
6,124 |
|
| Total |
|
$ |
23,917 |
|
|
$ |
8,287,613 |
|
|
$ |
209,804 |
|
|
$ |
8,521,334 |
|
| Liabilities: |
|
|
|
|
|
|
|
|
|
|
|
|
|
|
|
|
| Derivative instruments |
|
$ |
— |
|
|
$ |
44,294 |
|
|
$ |
10 |
|
|
$ |
44,304 |
|
Level 3 financial instruments typically include unobservable components but may also include some observable components that may be validated to
external sources. The table below includes a roll forward of the consolidated balance sheet amounts for the years ended December 31, 2024 and 2023, for changes in the fair value of financial instruments within Level 3 of the valuation hierarchy that
are recorded on a recurring basis. The gains or (losses) in the following table (which are reported in Other noninterest income in the consolidated statements of income) may include changes to fair value due in part to observable factors that may be
part of the valuation methodology.
| |
|
Year Ended December 31, 2024 |
|
| (In thousands) |
|
Mortgage
Servicing
Rights |
|
|
Investments
in Limited
Partnerships |
|
|
SBA
Servicing
Rights |
|
|
Mortgage Loan
Held-For-Sale
Interest Rate Lock
Commitments
(Assets and
Liabilities) |
|
| Balance at December 31, 2023 |
|
$ |
106,824 |
|
|
$ |
94,998 |
|
|
$ |
6,124 |
|
|
$ |
1,848 |
|
| Net (losses) gains |
|
|
(6,241 |
) |
|
|
11,822 |
|
|
|
(1,664 |
) |
|
|
(553 |
) |
| Additions |
|
|
14,011 |
|
|
|
— |
|
|
|
1,325 |
|
|
|
— |
|
| Contributions paid |
|
|
— |
|
|
|
27,079 |
|
|
|
— |
|
|
|
— |
|
| Distributions received |
|
|
— |
|
|
|
(15,189 |
) |
|
|
— |
|
|
|
— |
|
| Balance at December 31, 2024 |
|
$ |
114,594 |
|
|
$ |
118,710 |
|
|
$ |
5,785 |
|
|
$ |
1,295 |
|
| Net unrealized gains (losses) included in net income for the period related to assets and liabilities held at December 31, 2024 |
|
$ |
6,669 |
|
|
$ |
11,822 |
|
|
$ |
(1,664 |
) |
|
$ |
(553 |
) |
| |
|
Year Ended December 31, 2023 |
|
| (In thousands) |
|
Mortgage
Servicing
Rights |
|
|
Investments
in Limited
Partnerships |
|
|
SBA
Servicing
Rights |
|
|
Mortgage Loan
Held-For-Sale
Interest Rate Lock
Commitments
(Assets and
Liabilities) |
|
| Balance at December 31, 2022 |
|
$ |
109,744 |
|
|
$ |
67,533 |
|
|
$ |
5,585 |
|
|
$ |
425 |
|
| Net (losses) gains |
|
|
(12,996 |
) |
|
|
8,224 |
|
|
|
(1,227 |
) |
|
|
1,423 |
|
| Additions |
|
|
10,076 |
|
|
|
— |
|
|
|
1,766 |
|
|
|
— |
|
| Reclassifications |
|
|
— |
|
|
|
(1,120 |
) |
|
|
— |
|
|
|
— |
|
| Contributions paid |
|
|
— |
|
|
|
26,750 |
|
|
|
— |
|
|
|
— |
|
| Distributions received |
|
|
— |
|
|
|
(6,411 |
) |
|
|
— |
|
|
|
— |
|
| Other |
|
|
— |
|
|
|
22 |
|
|
|
— |
|
|
|
— |
|
| Balance at December 31, 2023 |
|
$ |
106,824 |
|
|
$ |
94,998 |
|
|
$ |
6,124 |
|
|
$ |
1,848 |
|
| Net unrealized (losses) gains included in net income for the period related to assets and liabilities held at December 31, 2023 |
|
$ |
(4,158 |
) |
|
$ |
8,224 |
|
|
$ |
(1,227 |
) |
|
$ |
1,423 |
|
Fair Value Option
The Company elected to measure commercial real estate loans held for sale and commercial and industrial loans held for sale under the fair value
option. Included in these loans are loans guaranteed by the SBA and loans related to syndications. The Company assumed the cost of these loans approximates their fair value due to the short term these instruments remain on the Company’s balance sheet.
The Company also elected to measure residential mortgage loans held for sale at fair value. The election allows for effective offset of the
changes in fair values of the loans and the derivative instruments used to hedge them. Included in the residential mortgage loans held for sale portfolio are certain previously sold GNMA loans. Under ASC 860-10-40, certain GNMA loans will not meet sale
criteria due to the conditional buyback option becoming unconditional once the delinquency criteria is met when they reach 90 or more days past due. The Company records these loans at fair value on the consolidated balance sheets with an offsetting
liability. The Company assumed the cost approximates the fair value. At December 31, 2024 and December 31, 2023, the fair value of the GNMA loans totaled $69.0 million and $56.5 million, respectively.
The following table summarizes the difference between the aggregate fair value and the aggregate unpaid principal balance of loans held for sale:
| |
|
December 31, 2024 |
|
|
December 31, 2023 |
|
| (In thousands) |
|
Aggregate
Fair Value |
|
|
Aggregate
Unpaid
Principal |
|
|
Aggregate
Fair Value
Less
Aggregate
Unpaid
Principal |
|
|
Aggregate
Fair Value |
|
|
Aggregate
Unpaid
Principal |
|
|
Aggregate
Fair Value
Less
Aggregate
Unpaid
Principal |
|
| Residential mortgage loans |
|
$ |
181,622 |
|
|
$ |
181,622 |
|
|
$ |
— |
|
|
$ |
157,631 |
|
|
$ |
156,175 |
|
|
$ |
1,456 |
|
| Commercial and industrial loans |
|
|
59,343 |
|
|
|
59,343 |
|
|
|
— |
|
|
|
28,464 |
|
|
|
25,807 |
|
|
|
2,657 |
|
| Commercial real estate loans |
|
|
3,227 |
|
|
|
3,227 |
|
|
|
— |
|
|
|
206 |
|
|
|
206 |
|
|
|
— |
|
| Total |
|
$ |
244,192 |
|
|
$ |
244,192 |
|
|
$ |
— |
|
|
$ |
186,301 |
|
|
$ |
182,188 |
|
|
$ |
4,113 |
|
Net gains and losses resulting from changes in fair value for residential mortgage loans held for sale are recorded in mortgage banking revenue in
the consolidated statements of income. For the years ended December 31, 2024 and 2023, the Company had net gains totaling $0.9 million and $2.1 million, respectively.
Net gains and losses resulting from changes in fair value for commercial and industrial loans and commercial real estate loans held for sale are
recorded in other noninterest revenue in the consolidated statements of income. For the years ended December 31, 2024 and 2023, the Company had net gains from the sale of these loans totaling $6.4 million and $4.8 million, respectively.
Assets and Liabilities Recorded at Fair Value on a Nonrecurring Basis
From time to time, the Company may be required to measure certain other financial assets at fair value on a nonrecurring basis in accordance with
GAAP. These adjustments to fair value usually result from the application of lower of cost or fair value accounting or write-downs of individual assets. The following tables present the balances of assets measured at fair value on a nonrecurring basis:
| |
|
December 31, 2024 |
|
| (In thousands) |
|
Level 1 |
|
|
Level 2 |
|
|
Level 3 |
|
|
Total |
|
| Assets: |
|
|
|
|
|
|
|
|
|
|
|
|
| Impaired loans, collateral-dependent(1) |
|
$ |
— |
|
|
$ |
— |
|
|
$ |
75,820 |
|
|
$ |
75,820 |
|
| Purchased credit deteriorated (loss) loans |
|
|
— |
|
|
|
— |
|
|
|
6,027 |
|
|
|
6,027 |
|
| Other real estate and repossessed assets |
|
|
— |
|
|
|
— |
|
|
|
5,754 |
|
|
|
5,754 |
|
|
(1) |
At December 31, 2024, impaired loans, collateral-dependent includes $8.7 million which were classified as doubtful. |
| |
|
December 31, 2023 |
|
| (In thousands) |
|
Level 1 |
|
|
Level 2 |
|
|
Level 3 |
|
|
Total |
|
| Assets: |
|
|
|
|
|
|
|
|
|
|
|
|
|
|
|
|
| Impaired loans, collateral-dependent |
|
$ |
— |
|
|
$ |
— |
|
|
$ |
101,271 |
|
|
$ |
101,271 |
|
| Purchased credit deteriorated (loss) loans |
|
|
— |
|
|
|
— |
|
|
|
6,507 |
|
|
|
6,507 |
|
| Other real estate and repossessed assets |
|
|
— |
|
|
|
— |
|
|
|
6,247 |
|
|
|
6,247 |
|
Unobservable Inputs
The following table presents the significant unobservable inputs used in Level 3 fair value measurements for financial assets measured at fair value on a recurring and
nonrecurring basis:
| |
|
Quantitative Information about Level 3 Fair Value Measurements |
|
| (In thousands) |
|
Carrying
Value |
|
|
Valuation
Methods |
|
Unobservable
Inputs |
|
Range |
|
|
Weighted
Average |
|
| December 31, 2024 |
|
|
|
|
|
|
|
|
|
|
|
|
|
|
|
|
| Measured at fair value on a recurring basis: |
|
|
|
|
|
|
|
|
|
|
|
|
|
|
|
|
| Mortgage servicing rights(1) |
|
$ |
114,594 |
|
|
Discounted cash flow |
|
Discount rate |
|
|
9.7% - 11.3% |
|
|
|
10.1% |
|
| |
|
|
|
|
|
|
|
Repayment speed (CPR) |
|
|
6.8 - 12.6 |
|
|
|
8.3 |
|
| |
|
|
|
|
|
|
|
Coupon interest rate |
|
|
3.2% - 7.9% |
|
|
|
4.2% |
|
| |
|
|
|
|
|
|
|
Remaining maturity (months) |
|
|
119 - 480 |
|
|
|
342 |
|
| |
|
|
|
|
|
|
|
Servicing fee (bps) |
|
|
19.0 bps-50.0 bps |
|
|
|
28.7 bps |
|
| Investments in limited partnerships |
|
|
118,710 |
|
|
Practical expedient |
|
Net asset value |
|
|
NM |
|
|
|
NM |
|
| SBA servicing rights(1) |
|
|
5,785 |
|
|
Coupon less contractual servicing cost |
|
Contractual servicing cost (bps) |
|
|
12.5 bps-40.0 bps |
|
|
|
26.3 bps |
|
| Mortgage loan held-for-sale interest rate lock commitments (assets and liabilities) |
|
|
1,295 |
|
|
Discounted cash flow |
|
Closing ratio |
|
|
10.0% - 100% |
|
|
|
46.8% |
|
| Measured at fair value on a nonrecurring basis: |
|
|
|
|
|
|
|
|
|
|
|
|
|
|
|
|
| Impaired loans, collateral- dependent(1) |
|
$ |
75,820 |
|
|
Appraised value, as adjusted |
|
Discount to fair value |
|
|
10% - 41% |
|
|
|
30.5% |
|
| Purchased credit deteriorated (loss) loans(1) |
|
|
6,027 |
|
|
Appraised value, as adjusted |
|
Discount to fair value |
|
|
10% - 30% |
|
|
|
24.7% |
|
| Other real estate and repossessed assets |
|
|
5,754 |
|
|
Appraised value, as adjusted |
|
Estimated closing costs |
|
|
7.0% |
|
|
|
7.0% |
|
| |
|
Quantitative Information about Level 3 Fair Value Measurements |
|
| (In thousands) |
|
Carrying
Value |
|
|
Valuation
Methods |
|
Unobservable
Inputs |
|
Range |
|
|
Weighted
Average |
|
| December 31, 2023 |
|
|
|
|
|
|
|
|
|
|
|
|
|
|
|
|
| Measured at fair value on a recurring basis: |
|
|
|
|
|
|
|
|
|
|
|
|
|
|
|
|
| Mortgage servicing rights(1) |
|
$ |
106,824 |
|
|
Discounted cash flow |
|
Discount rate |
|
|
9.8% - 16.0% |
|
|
|
10.3% |
|
| |
|
|
|
|
|
|
|
Repayment speed (CPR) |
|
|
6.4 - 100.0 |
|
|
|
8.1 |
|
| |
|
|
|
|
|
|
|
Coupon interest rate |
|
|
2.8% - 6.8% |
|
|
|
3.9% |
|
| |
|
|
|
|
|
|
|
Remaining maturity (months) |
|
|
119 - 480 |
|
|
|
338.8 |
|
| |
|
|
|
|
|
|
|
Servicing fee (bps) |
|
|
19.0 bps-50.0 bps |
|
|
|
28.6 bps |
|
| Investments in limited partnerships |
|
|
94,998 |
|
|
Practical expedient |
|
Net asset value |
|
|
NM |
|
|
|
NM |
|
| SBA servicing rights(1) |
|
|
6,124 |
|
|
Coupon less contractual servicing cost |
|
Contractual servicing cost (bps) |
|
|
12.5 bps-40.0 bps |
|
|
|
26.3 bps |
|
| Mortgage loan held-for-sale interest rate lock commitments (assets and liabilities) |
|
|
1,848 |
|
|
Discounted cash flow |
|
Closing ratio |
|
|
10.0% - 100% |
|
|
|
55.9% |
|
| Measured at fair value on a nonrecurring basis: |
|
|
|
|
|
|
|
|
|
|
|
|
|
|
|
|
| Impaired loans, collateral- dependent(1) |
|
$ |
101,271 |
|
|
Appraised value, as adjusted |
|
Discount to fair value |
|
|
0% - 90% |
|
|
|
29.2% |
|
|
Purchased credit deteriorated
(loss) loans(1)
|
|
|
6,507 |
|
|
Appraised value, as adjusted |
|
Discount to fair value |
|
|
10% - 30% |
|
|
|
24.6% |
|
| Other real estate and repossessed assets |
|
|
6,247 |
|
|
Appraised value, as adjusted |
|
Estimated closing costs |
|
|
7.0% |
|
|
|
7.0% |
|
|
(1) |
Weighted averages were calculated using the input attributed and the outstanding balance of the loan. |
Certain assets and liabilities subject to fair value disclosure requirements are not actively traded, requiring management to estimate the fair
value. These estimations necessarily require judgement to be applied to the reasonableness and relevancy of comparable market prices, expected future cash flows, and appropriate discount rates.
The short-term nature of certain assets and liabilities result in their carrying value approximating fair value. They include cash and due from
banks, interest bearing deposits with other banks and Federal funds sold, accrued interest receivable, non-time deposits, federal funds purchased, securities sold under agreement to repurchase, short-term BTFP borrowings and accrued interest payable.
The following tables present carrying and fair value information of financial instruments for the periods presented:
| |
|
December 31, 2024 |
|
| (In thousands) |
|
Carrying
Value |
|
|
Fair Value |
|
|
Level 1 |
|
|
Level 2 |
|
|
Level 3 |
|
| Assets: |
|
|
|
|
|
|
|
|
|
|
|
|
|
|
|
| Cash and due from banks |
|
$ |
624,884 |
|
|
$ |
624,884 |
|
|
$ |
624,884 |
|
|
$ |
— |
|
|
$ |
— |
|
| Interest bearing deposits with other banks and Federal funds sold |
|
|
1,106,692 |
|
|
|
1,106,692 |
|
|
|
1,106,692 |
|
|
|
— |
|
|
|
— |
|
| Available for sale securities and equity securities with readily determinable fair values |
|
|
7,315,666 |
|
|
|
7,315,666 |
|
|
|
21,678 |
|
|
|
7,293,988 |
|
|
|
— |
|
| Net loans and leases |
|
|
33,280,962 |
|
|
|
32,440,220 |
|
|
|
— |
|
|
|
— |
|
|
|
32,440,220 |
|
| Loans held for sale |
|
|
244,192 |
|
|
|
244,192 |
|
|
|
— |
|
|
|
244,192 |
|
|
|
— |
|
| Accrued interest receivable |
|
|
196,670 |
|
|
|
196,670 |
|
|
|
— |
|
|
|
26,239 |
|
|
|
170,431 |
|
| Mortgage servicing rights |
|
|
114,594 |
|
|
|
114,594 |
|
|
|
— |
|
|
|
— |
|
|
|
114,594 |
|
| Investments in limited partnerships |
|
|
118,710 |
|
|
|
118,710 |
|
|
|
— |
|
|
|
— |
|
|
|
118,710 |
|
| Other assets |
|
|
11,539 |
|
|
|
11,539 |
|
|
|
— |
|
|
|
— |
|
|
|
11,539 |
|
| |
|
|
|
|
|
|
|
|
|
|
|
|
|
|
|
|
|
|
|
|
| Liabilities: |
|
|
|
|
|
|
|
|
|
|
|
|
|
|
|
|
|
|
|
|
| Deposits |
|
$ |
40,496,201 |
|
|
$ |
40,495,193 |
|
|
$ |
— |
|
|
$ |
40,495,193 |
|
|
$ |
— |
|
| Federal funds purchased and securities sold under agreement to repurchase and other short-term borrowings |
|
|
23,616 |
|
|
|
23,616 |
|
|
|
23,616 |
|
|
|
— |
|
|
|
— |
|
| Accrued interest payable |
|
|
110,853 |
|
|
|
110,853 |
|
|
|
3 |
|
|
|
110,850 |
|
|
|
— |
|
| Subordinated and long-term borrowings |
|
|
10,706 |
|
|
|
10,570 |
|
|
|
— |
|
|
|
10,570 |
|
|
|
— |
|
| |
|
|
|
|
|
|
|
|
|
|
|
|
|
|
|
|
|
|
|
|
| Derivative instruments: |
|
|
|
|
|
|
|
|
|
|
|
|
|
|
|
|
|
|
|
|
| Assets: |
|
|
|
|
|
|
|
|
|
|
|
|
|
|
|
|
|
|
|
|
| Commercial loan interest rate contracts |
|
$ |
30,555 |
|
|
$ |
30,555 |
|
|
$ |
— |
|
|
$ |
30,555 |
|
|
$ |
— |
|
| Mortgage loan held-for-sale interest rate lock commitments |
|
|
1,310 |
|
|
|
1,310 |
|
|
|
— |
|
|
|
— |
|
|
|
1,310 |
|
| Mortgage loan forward sale commitments |
|
|
816 |
|
|
|
816 |
|
|
|
— |
|
|
|
816 |
|
|
|
— |
|
| Foreign exchange contracts |
|
|
650 |
|
|
|
650 |
|
|
|
— |
|
|
|
650 |
|
|
|
— |
|
| Liabilities: |
|
|
|
|
|
|
|
|
|
|
|
|
|
|
|
|
|
|
|
|
| Commercial loan interest rate contracts |
|
$ |
45,070 |
|
|
$ |
45,070 |
|
|
$ |
— |
|
|
$ |
45,070 |
|
|
$ |
— |
|
| Mortgage loan held-for-sale interest rate lock commitments |
|
|
15 |
|
|
|
15 |
|
|
|
— |
|
|
|
— |
|
|
|
15 |
|
| Futures, forwards and options |
|
|
3,085 |
|
|
|
3,085 |
|
|
|
3,085 |
|
|
|
— |
|
|
|
— |
|
| Mortgage loan forward sale commitments |
|
|
34 |
|
|
|
34 |
|
|
|
— |
|
|
|
34 |
|
|
|
— |
|
| Foreign exchange contracts |
|
|
469 |
|
|
|
469 |
|
|
|
— |
|
|
|
469 |
|
|
|
— |
|
| |
|
December 31, 2023 |
|
| |
|
Carrying |
|
|
Fair |
|
|
|
|
|
|
|
|
|
|
| (In thousands) |
|
Value |
|
|
Value |
|
|
Level 1 |
|
|
Level 2 |
|
|
Level 3 |
|
| Assets: |
|
|
|
|
|
|
|
|
|
|
|
|
|
|
|
|
|
|
|
|
| Cash and due from banks |
|
$ |
798,177 |
|
|
$ |
798,177 |
|
|
$ |
798,177 |
|
|
$ |
— |
|
|
$ |
— |
|
| Interest bearing deposits with other banks and Federal funds sold |
|
|
3,434,088 |
|
|
|
3,434,088 |
|
|
|
3,434,088 |
|
|
|
— |
|
|
|
— |
|
| Available for sale securities and equity securities with readily determinable fair values |
|
|
8,097,584 |
|
|
|
8,097,584 |
|
|
|
22,108 |
|
|
|
8,075,476 |
|
|
|
— |
|
| Net loans and leases |
|
|
32,028,988 |
|
|
|
30,933,473 |
|
|
|
— |
|
|
|
— |
|
|
|
30,933,473 |
|
| Loans held for sale |
|
|
186,301 |
|
|
|
186,301 |
|
|
|
— |
|
|
|
186,301 |
|
|
|
— |
|
| Accrued interest receivable |
|
|
198,680 |
|
|
|
198,680 |
|
|
|
— |
|
|
|
28,565 |
|
|
|
170,115 |
|
| Mortgage servicing rights |
|
|
106,824 |
|
|
|
106,824 |
|
|
|
— |
|
|
|
— |
|
|
|
106,824 |
|
| Investments in limited partnerships |
|
|
94,998 |
|
|
|
94,998 |
|
|
|
— |
|
|
|
— |
|
|
|
94,998 |
|
| Other assets |
|
|
12,371 |
|
|
|
12,371 |
|
|
|
— |
|
|
|
— |
|
|
|
12,371 |
|
| |
|
|
|
|
|
|
|
|
|
|
|
|
|
|
|
|
|
|
|
|
| Liabilities: |
|
|
|
|
|
|
|
|
|
|
|
|
|
|
|
|
|
|
|
|
| Deposits |
|
$ |
38,497,137 |
|
|
$ |
38,487,472 |
|
|
$ |
— |
|
|
$ |
38,487,472 |
|
|
$ |
— |
|
| Federal funds purchased and securities sold under agreement to repurchase and other short-term borrowings |
|
|
451,516 |
|
|
|
451,516 |
|
|
|
451,516 |
|
|
|
— |
|
|
|
— |
|
| Short-term BTFP borrowings |
|
|
3,500,000 |
|
|
|
3,500,000 |
|
|
|
3,500,000 |
|
|
|
— |
|
|
|
— |
|
| Accrued interest payable |
|
|
100,682 |
|
|
|
100,682 |
|
|
|
2,324 |
|
|
|
98,358 |
|
|
|
— |
|
| Subordinated and long-term borrowings |
|
|
438,460 |
|
|
|
411,651 |
|
|
|
— |
|
|
|
411,651 |
|
|
|
— |
|
| |
|
|
|
|
|
|
|
|
|
|
|
|
|
|
|
|
|
|
|
|
| Derivative instruments: |
|
|
|
|
|
|
|
|
|
|
|
|
|
|
|
|
|
|
|
|
| Assets: |
|
|
|
|
|
|
|
|
|
|
|
|
|
|
|
|
|
|
|
|
| Commercial loan interest rate contracts |
|
$ |
25,264 |
|
|
$ |
25,264 |
|
|
$ |
— |
|
|
$ |
25,264 |
|
|
$ |
— |
|
| Mortgage loan held-for-sale interest rate lock commitments |
|
|
1,858 |
|
|
|
1,858 |
|
|
|
— |
|
|
|
— |
|
|
|
1,858 |
|
| Futures, forwards and options |
|
|
1,809 |
|
|
|
1,809 |
|
|
|
1,809 |
|
|
|
— |
|
|
|
— |
|
| Mortgage loan forward sale commitments |
|
|
246 |
|
|
|
246 |
|
|
|
— |
|
|
|
246 |
|
|
|
— |
|
| Foreign exchange contracts |
|
|
326 |
|
|
|
326 |
|
|
|
— |
|
|
|
326 |
|
|
|
— |
|
| Liabilities: |
|
|
|
|
|
|
|
|
|
|
|
|
|
|
|
|
|
|
|
|
| Commercial loan interest rate contracts |
|
$ |
41,459 |
|
|
$ |
41,459 |
|
|
$ |
— |
|
|
$ |
41,459 |
|
|
$ |
— |
|
| Mortgage loan held-for-sale interest rate lock commitments |
|
|
10 |
|
|
|
10 |
|
|
|
— |
|
|
|
— |
|
|
|
10 |
|
| Mortgage loan forward sale commitments |
|
|
2,567 |
|
|
|
2,567 |
|
|
|
— |
|
|
|
2,567 |
|
|
|
— |
|
| Foreign exchange contracts |
|
|
268 |
|
|
|
268 |
|
|
|
— |
|
|
|
268 |
|
|
|
— |
|
Fair Value of Financial Instruments
GAAP requires that the Company disclose estimated fair values for its financial instruments. Fair value estimates, methods, and assumptions that
are used by the Company in estimating fair values of financial instruments that are not disclosed above are set forth below.
Cash and Cash Equivalents. The carrying amounts for cash and cash equivalents approximate fair values due to their immediate and
shorter-term maturities. Cash and equivalents include cash and amounts due from banks, including interest-bearing deposits with other banks.
Net Loans. Loans are valued on an individual basis, with consideration given to the loans’ underlying characteristics, including
account types, remaining terms, annual interest rates or coupons, interest types, accrual basis, timing of principal and interest payments, current market rates, and remaining balances. A discounted cash flow model is used to estimate the fair value of
the loans using assumptions for prepayments speeds, projected default probabilities by risk grade, and estimates of prevailing discount rates. The discounted cash flow approach models the projected cash flows, applying various assumptions regarding
interest and payment risks for the loans based on the loan types, payment types and fixed or variable interest rate classifications. Estimated fair values are disclosed through the application of the exit price notion. The assumptions used to estimate
fair value are intended to approximate those that a market participant would use in an orderly transaction on the measurement date. All of the Company’s loans and leases are classified as Level 3.
Accrued Interest Receivable and Payable. The carrying amounts for accrued interest receivable and accrued interest payable approximate
fair values due to their nature and are classified in the Level hierarchy according to their corresponding asset or liability.
Deposits. The fair values disclosed for demand deposits are, by definition, equal to the amount payable on demand at the reporting
date (that is, their carrying amounts). Fair values for time deposits are estimated using a discounted cash flow calculation that uses recent issuance rates over the prior three months and a market rate analysis of recent offering rates for retail
products. For wholesale products, brokered pricing offering rates were used. The Company’s deposits are classified as Level 2.
Borrowings. The carrying amounts for federal funds purchased and repurchase agreements approximate fair value because of their short-term
maturity and are classified as Level 1. Similarly, the carrying amounts for the Company’s fixed-term BTFP approximate fair value and were classified as Level 1. The fair value of the subordinated debentures was estimated using a discounted cash flow
calculation that uses recent issuance rates for similar notes offerings for similar sized issuers. FHLB borrowings and the subordinate notes are classified as Level 2.
Lending Commitments. The Company’s lending commitments are negotiated at prevailing market rates and are relatively short-term in
nature. As a matter of policy, the Company generally makes commitments for fixed-rate loans for relatively short periods of time. Therefore, the estimated value of the Company’s lending commitments approximates the carrying amount and is immaterial to
the financial statements. The Company’s lending commitments are classified as Level 2. The Company’s off-balance sheet commitments, which include letters of credit totaling $448.9 million and $450.7 million at December 31, 2024 and 2023, respectively,
are funded at current market rates at the date they are drawn upon. It is management’s opinion that the fair value of these commitments would approximate their carrying value, if drawn upon. See Note 21 for additional information regarding lending
commitments.
Limitations. The fair value estimates are determined as of a specific point in time utilizing various assumptions and estimates. The use
of assumptions and various valuation techniques, as well as the absence of secondary markets for certain financial instruments, will likely reduce the comparability of fair value disclosures between financial institutions. The fair values for loans
involve the use of various assumptions due to illiquidity in the market as of December 31, 2024 and 2023. These assumptions are considered to reflect inputs that market participants would use in transactions involving these instruments as of the
measurement date. The tables above only includes financial instruments of the Company, and, accordingly, the total of the fair value amounts does not represent, and should not be construed to represent, the underlying value of the Company.
NOTE 14. SHARE-BASED COMPENSATION
The Company’s Long-Term Equity Incentive Plan (“Incentive Plan”), Cadence Bank Equity Incentive Plan for Non-Employee Directors, 2021 Long-Term
Equity Incentive Plan and the Amended and Restated 2015 Omnibus Incentive Plan (the “2015 Plan” assumed from Legacy Cadence) permit the Company to grant to employees and directors various forms of share-based incentive compensation and were effective
during the years ended December 31, 2024, 2023, and 2022. On December 30, 2024, the Cadence Bank 2025 Long-Term Incentive Plan (“the 2025 Plan”) was approved by the shareholders. The 2025 Plan supersedes all four of the incentive plans previously
mentioned and is effective starting in fiscal year 2025. At December 31, 2024, 4.5 million shares were available for future grants of share-based compensation under the 2025 Plan.
The Company has primarily granted PSUs, RSUs and RSAs under the Incentive Plan. PSUs entitle the recipient to receive shares of the Company’s
common stock upon the achievement of performance goals that are specified in the award over a performance period. The recipient of PSUs is not treated as a shareholder of the Company and is not entitled to vote or receive dividends until the
performance conditions stated in the award are satisfied and the shares of stock are issued to the recipient. All PSUs vest over a three-year period and are valued at the fair value of the Company’s stock at the grant date based upon the estimated
number of shares expected to vest. In 2022, the Company incorporated a lattice model into the PSU valuation methodology to estimate the fair value of the portion of the award related to market conditions. RSUs entitle the recipient to receive the
shares once they are vested but with no voting rights until the shares are received. RSUs generally vest over three- to five-year periods and are eligible to receive dividend equivalents, which accrue and are paid upon vesting. RSAs entitle the
recipient to vote the shares of stock but the recipient does not receive the shares until they are fully vested. RSA grants vest over five- to seven-year periods and are entitled to receive dividends.
The following table summarizes the Company’s total share-based compensation expense and related estimated tax benefit for the periods indicated:
| |
|
Year Ended December 31, |
|
| (In thousands) |
|
2024 |
|
|
2023 |
|
|
2022 |
|
| Share-based compensation expense |
|
$ |
32,710 |
|
|
$ |
39,983 |
|
|
$ |
37,608 |
|
| Tax benefit |
|
|
8,651 |
|
|
|
9,198 |
|
|
|
7,755 |
|
Performance Stock Units
The following table summarizes the Company’s PSU activity for the periods indicated:
| |
|
Year Ended December 31, |
|
| |
|
2024 |
|
|
2023 |
|
| |
|
|
|
|
Weighted |
|
|
|
|
|
Weighted |
|
| |
|
|
|
|
Average Grant |
|
|
|
|
|
Average Grant |
|
| |
|
Shares |
|
|
Date Fair Value |
|
|
Shares |
|
|
Date Fair Value |
|
| Nonvested at beginning of period |
|
|
1,967,631 |
|
|
$ |
26.17 |
|
|
|
1,485,603 |
|
|
$ |
28.54 |
|
| Granted during the period |
|
|
323,293 |
|
|
|
30.26 |
|
|
|
597,979 |
|
|
|
20.39 |
|
| Vested during the period |
|
|
(807,684 |
) |
|
|
28.76 |
|
|
|
(41,453 |
) |
|
|
30.55 |
|
| Forfeited during the period |
|
|
(271,634 |
) |
|
|
27.04 |
|
|
|
(74,498 |
) |
|
|
24.51 |
|
| Nonvested at end of period |
|
|
1,211,606 |
|
|
$ |
25.34 |
|
|
|
1,967,631 |
|
|
$ |
26.17 |
|
The Company recorded $11.9 million, $13.6 million, and $10.6 million of compensation expense from continuing operations related to the PSUs
in 2024, 2023, and 2022, respectively. At December 31, 2024, there was $10.9 million of unrecognized compensation cost related to PSUs that is expected to be recognized over a weighted average period of 1.70 years.
Restricted Stock Units
The following table summarizes the Company’s RSU activity for the periods indicated:
| |
|
Year Ended December 31, |
|
| |
|
2024 |
|
|
2023 |
|
| |
|
|
|
|
Weighted |
|
|
|
|
|
Weighted |
|
| |
|
|
|
|
Average Grant |
|
|
|
|
|
Average Grant |
|
| |
|
Shares |
|
|
Date Fair Value |
|
|
Shares |
|
|
Date Fair Value |
|
| Nonvested at beginning of period |
|
|
3,055,824 |
|
|
$ |
25.19 |
|
|
|
2,435,802 |
|
|
$ |
28.53 |
|
| Granted during the period |
|
|
1,064,936 |
|
|
|
28.76 |
|
|
|
1,386,005 |
|
|
|
20.46 |
|
| Vested during the period |
|
|
(810,160 |
) |
|
|
28.12 |
|
|
|
(528,702 |
) |
|
|
28.06 |
|
| Forfeited during the period |
|
|
(246,709 |
) |
|
|
25.83 |
|
|
|
(237,281 |
) |
|
|
25.38 |
|
| Nonvested at end of period |
|
|
3,063,891 |
|
|
$ |
25.61 |
|
|
|
3,055,824 |
|
|
$ |
25.20 |
|
The Company recorded $19.9 million, $23.4 million, and $21.3 million of compensation expense from continuing operations related to the RSUs in
2024, 2023, and 2022, respectively. These amounts included $1.0 million, $1.2 million, and $1.5 million related to RSUs issued to the Company’s directors during 2024, 2023, and 2022, respectively. At December 31, 2024, there was $42.3 million of
unrecognized compensation cost related to RSUs that is expected to be recognized over a weighted average period of 2.48 years.
Restricted Stock Awards
The following table summarizes the Company’s RSA activity for the periods indicated:
| |
|
Year Ended December 31, |
|
| |
|
2024 |
|
|
2023 |
|
| |
|
Shares |
|
|
Weighted
Average Grant
Date Fair Value |
|
|
Shares |
|
|
Weighted
Average Grant
Date Fair Value |
|
| Nonvested at beginning of period |
|
|
526,868 |
|
|
$ |
28.14 |
|
|
|
1,055,307 |
|
|
$ |
29.47 |
|
| Vested during the period |
|
|
(248,213 |
) |
|
|
27.51 |
|
|
|
(441,765 |
) |
|
|
31.24 |
|
| Forfeited during the period |
|
|
(31,118 |
) |
|
|
29.01 |
|
|
|
(86,674 |
) |
|
|
28.49 |
|
| Nonvested at end of period |
|
|
247,537 |
|
|
$ |
28.67 |
|
|
|
526,868 |
|
|
$ |
28.14 |
|
The Company recorded $945 thousand, $2.4 million, and $5.1 million of compensation expense from continuing operations related to the RSAs in 2024,
2023, and 2022, respectively. At December 31, 2024, there was $682 thousand of unrecognized compensation cost related to RSAs that is expected to be recognized over a weighted average period of 1.09 years.
The following table presents information regarding the vesting of the Company’s nonvested share-based compensation grants outstanding at December
31, 2024:
| |
|
Number of Shares |
|
| Period Ending |
|
PSU |
|
|
RSU |
|
|
RSA |
|
| December 31, 2025 |
|
|
447,929 |
|
|
|
378,818 |
|
|
|
211,037 |
|
| December 31, 2026 |
|
|
510,306 |
|
|
|
1,611,263 |
|
|
|
— |
|
| December 31, 2027 |
|
|
253,371 |
|
|
|
695,920 |
|
|
|
36,500 |
|
| December 31, 2028 |
|
|
— |
|
|
|
361,701 |
|
|
|
— |
|
| December 31, 2029 and later |
|
|
— |
|
|
|
16,189 |
|
|
|
— |
|
| Total nonvested shares |
|
|
1,211,606 |
|
|
|
3,063,891 |
|
|
|
247,537 |
|
Stock Options
Key employees and directors of the Company may be granted stock options. Compensation expense is measured using estimates of fair value of all
share-based awards. No stock options were granted during 2024, 2023, and 2022. During 2024, 895,289 stock options were exercised with a weighted average exercise price of $27.47. The Company recorded no compensation expense related to the stock options
for 2024, 2023, and 2022. At December 31, 2024, there were no vested or unexpired options outstanding.
NOTE 15. EARNINGS PER SHARE AND DIVIDEND DATA
Basic and diluted EPS are calculated in accordance with ASC 260, Earnings Per Share. Basic EPS is computed by dividing net income
available to common shareholders by the weighted-average number of common shares outstanding for the period. Diluted EPS is computed using the weighted-average number of shares determined for the basic EPS computation plus the shares resulting from the
assumed exercise of all outstanding share-based awards using the treasury stock method. There were 62 thousand, 2.6 million, and 119 thousand antidilutive equity awards excluded from dilutive shares for the years ended December 31, 2024, 2023, and
2022, respectively. The antidilutive equity awards are based on the impact to continuing operations available to common shareholders and dictates whether the dilutive effect is considered for the remaining diluted calculations (diluted earnings per
common share from discontinued operations and diluted earnings per share).
The following table provides a reconciliation of the numerators and denominators of the basic and diluted EPS computations for the periods
indicated:
| |
|
Year Ended December 31, |
|
| (In thousands, except per share amounts) |
|
2024 |
|
|
2023 |
|
|
2022 |
|
| Income from continuing operations |
|
$ |
523,604 |
|
|
$ |
3,684 |
|
|
$ |
447,317 |
|
| Income from discontinued operations, net of income taxes |
|
|
— |
|
|
|
538,620 |
|
|
|
15,920 |
|
| Net income |
|
|
523,604 |
|
|
|
542,304 |
|
|
|
463,237 |
|
| Less: preferred dividends |
|
|
9,488 |
|
|
|
9,488 |
|
|
|
9,488 |
|
| Net income available to common shareholders |
|
$ |
514,116 |
|
|
$ |
532,816 |
|
|
$ |
453,749 |
|
| Net income (loss) from continuing operations available to common shareholders |
|
$ |
514,116 |
|
|
$ |
(5,804 |
) |
|
$ |
437,829 |
|
| |
|
|
|
|
|
|
|
|
|
|
|
|
| Weighted average common shares outstanding |
|
|
182,682 |
|
|
|
182,609 |
|
|
|
183,510 |
|
| Dilutive effect of stock compensation(1) |
|
|
2,910 |
|
|
|
— |
|
|
|
988 |
|
| Weighted average diluted common shares |
|
|
185,592 |
|
|
|
182,609 |
|
|
|
184,498 |
|
| |
|
|
|
|
|
|
|
|
|
|
|
|
| Basic earnings (loss) per common share from continuing operations |
|
$ |
2.81 |
|
|
$ |
(0.03 |
) |
|
$ |
2.39 |
|
| Basic earnings per common share from discontinued operations |
|
|
— |
|
|
|
2.95 |
|
|
|
0.09 |
|
| Basic earnings per common share |
|
|
2.81 |
|
|
|
2.92 |
|
|
|
2.47 |
|
| |
|
|
|
|
|
|
|
|
|
|
|
|
| Diluted earnings (loss) per common share from continuing operations (1) |
|
$ |
2.77 |
|
|
$ |
(0.03 |
) |
|
$ |
2.37 |
|
| Diluted earnings per common share from discontinued operations(1) |
|
|
— |
|
|
|
2.95 |
|
|
|
0.09 |
|
| Diluted earnings per common share (1) |
|
|
2.77 |
|
|
|
2.92 |
|
|
|
2.46 |
|
|
(1) |
1.7 million outstanding equity awards are excluded from consideration for the year ended December 31, 2023 due to a net loss from continuing operations attributable to common shareholders because the inclusion of
such awards would be antidilutive to net loss from continuing operations available to common shareholders. |
Dividends to shareholders are subject to approval by the applicable regulatory authorities.
NOTE 16. ACCUMULATED OTHER COMPREHENSIVE INCOME (LOSS) (“AOCI”)
Activity within the balances in accumulated other comprehensive income (loss) is shown in the following tables for the periods indicated:
| (In thousands) |
|
Unrealized loss on AFS
securities |
|
|
Pension and other
postretirement benefits |
|
|
Accumulated other
comprehensive loss |
|
| Balance at December 31, 2021 |
|
$ |
(75,565 |
) |
|
$ |
(63,804 |
) |
|
$ |
(139,369 |
) |
| Net change |
|
$ |
(1,096,907 |
) |
|
$ |
13,738 |
|
|
$ |
(1,083,169 |
) |
| Balance at December 31, 2022 |
|
$ |
(1,172,472 |
) |
|
$ |
(50,066 |
) |
|
$ |
(1,222,538 |
) |
| Net change |
|
$ |
455,723 |
|
|
$ |
4,986 |
|
|
$ |
460,709 |
|
| Balance at December 31, 2023 |
|
$ |
(716,749 |
) |
|
$ |
(45,080 |
) |
|
$ |
(761,829 |
) |
| Net change |
|
$ |
66,024 |
|
|
$ |
1,310 |
|
|
$ |
67,334 |
|
| Balance at December 31, 2024 |
|
$ |
(650,725 |
) |
|
$ |
(43,770 |
) |
|
$ |
(694,495 |
) |
NOTE 17. MORTGAGE SERVICING RIGHTS
The MSR, which are recognized as a separate asset on the date the corresponding mortgage loan is sold on a servicing retained basis, is recorded
at fair value as determined at each accounting period end. An estimate of the fair value of the Company’s MSR is determined utilizing assumptions such as mortgage interest rates, discount rates, mortgage loan prepayment speeds, market trends and
industry demand. Data and assumptions used in the fair value calculation related to the MSR were as follows:
| (Dollars in thousands) |
|
December 31, 2024 |
|
|
December 31, 2023 |
|
|
December 31, 2022 |
|
| Unpaid principal balance |
|
$ |
8,043,306 |
|
|
$ |
7,702,592 |
|
|
$ |
7,682,074 |
|
| Weighted-average prepayment speed (CPR) |
|
|
8.3 |
|
|
|
8.1 |
|
|
|
7.2 |
|
| Average discount rate (annual percentage) |
|
|
10.1 |
|
|
|
10.3 |
|
|
|
10.0 |
|
| Weighted-average coupon interest rate (percentage) |
|
|
4.2 |
|
|
|
3.9 |
|
|
|
3.6 |
|
| Weighted-average remaining maturity (months) |
|
|
342.3 |
|
|
|
338.8 |
|
|
|
335.0 |
|
| Weighted-average servicing fee (basis points) |
|
|
28.7 |
|
|
|
28.6 |
|
|
|
28.4 |
|
Because the valuation is determined by using discounted cash flow models, the primary risk inherent in valuing the MSR is the impact of
fluctuating interest rates on the estimated life of the servicing revenue stream. The use of different estimates or assumptions could produce different fair values. At December 31, 2024, 2023, and 2022, the Company had an economic hedge in place
designed to cover 75.1%, 73.1%, and 47.9% of the MSR interest rate risk, respectively (see Note 20 for additional information). The Company is susceptible to fluctuations in the fair value of its MSR in changing interest rate environments.
The following table summarizes activity relating to residential mortgage loans sold with servicing retained for the periods indicated:
| |
|
Year Ended December 31, |
|
| (In thousands) |
|
2024 |
|
|
2023 |
|
|
2022 |
|
| Residential mortgage loans sold with servicing retained |
|
$ |
1,093,169 |
|
|
$ |
746,144 |
|
|
|
1,141,053 |
|
| Pretax gains resulting from above loan sales |
|
|
14,991 |
|
|
|
12,184 |
|
|
|
30,845 |
|
The Company services a class of residential mortgages that are first lien loans secured by a primary residence or second home. The following table
presents changes in the fair value of the MSR related to the activity in this class for the periods indicated:
| |
|
Year Ended December 31, |
|
| (In thousands) |
|
2024 |
|
|
2023 |
|
|
2022 |
|
| Fair value, beginning of period |
|
$ |
106,824 |
|
|
$ |
109,744 |
|
|
$ |
69,552 |
|
| Originations of servicing assets |
|
|
14,011 |
|
|
|
10,076 |
|
|
|
16,289 |
|
| Changes in fair value: |
|
|
|
|
|
|
|
|
|
|
|
|
| Due to change in valuation inputs or assumptions(1) |
|
|
6,669 |
|
|
|
(4,158 |
) |
|
|
35,695 |
|
| Other changes in fair value(2) |
|
|
(12,910 |
) |
|
|
(8,838 |
) |
|
|
(11,792 |
) |
| Fair value, end of period |
|
$ |
114,594 |
|
|
$ |
106,824 |
|
|
$ |
109,744 |
|
|
(1) |
Primarily reflects changes in prepayment speeds and discount rate assumptions which are updated based on market interest rates. |
|
(2) |
Primarily reflects changes due to realized cash flows. |
All of the changes to the fair value of the MSR and the related economic hedge are recorded as part of mortgage banking revenue in the
consolidated statements of income. As part of mortgage banking revenue, the Company recorded contractual servicing fees of $21.3 million, $21.8 million, and $21.7 million, and late and other ancillary fees of $3.1 million, $2.8 million, and $2.4
million for the years ended December 31, 2024, 2023, and 2022 respectively.
NOTE 18. CAPITAL AND REGULATORY MATTERS
The Company is subject to various regulatory capital requirements administered by the federal and state banking agencies. Regulatory capital
ratios at December 31, 2024 and 2023 were calculated in accordance with the Basel III capital framework as well as the interagency final rule published on September 30, 2020 entitled “Revised Transition of the Current Expected Credit Losses Methodology
for Allowances.” Failure to meet minimum capital requirements can initiate certain mandatory and possibly additional discretionary actions by regulators that, if undertaken, could have a direct material adverse effect on the Company’s consolidated
financial statements. Under capital adequacy guidelines and the regulatory framework for prompt corrective action, the Company must meet specific capital guidelines that involve quantitative measures of the Company’s assets, liabilities and certain
off-balance sheet items as calculated under regulatory accounting practices. The Company’s capital amounts and classification are also subject to qualitative judgments by regulators about components, risk weightings and other factors. Quantitative
measures are established by regulation to ensure capital adequacy and require the Company to maintain minimum capital amounts and ratios.
Additionally, regulatory capital rules include a capital conservation buffer which the Company must maintain in addition to its minimum risk-based
capital requirements. This buffer applies to all three risk-based capital measurements (CET1, Tier 1 and total capital to risk-weighted assets). A financial institution with a conservation buffer of less than the required amount is subject to
limitations on capital distributions, including dividend payments, stock repurchases, and certain discretionary bonus payments to executive officers.
The actual capital amounts and ratios for the Company are presented in the following tables and as shown, exceed the thresholds necessary to be
considered “well capitalized.” Management believes that no events or changes have occurred subsequent to the indicated dates that would change this designation.
| |
|
December 31, 2024 |
|
|
December 31, 2023 |
|
| (Dollars in thousands) |
|
Amount |
|
|
Ratio |
|
|
Amount |
|
|
Ratio |
|
| Actual: |
|
|
|
|
|
|
|
|
|
|
|
|
|
|
|
|
| Common equity Tier 1 capital (to risk-weighted assets) |
|
$ |
4,693,487 |
|
|
|
12.35 |
% |
|
$ |
4,363,020 |
|
|
|
11.62 |
% |
| Tier 1 capital (to risk-weighted assets) |
|
|
4,860,480 |
|
|
|
12.79 |
|
|
|
4,530,013 |
|
|
|
12.06 |
|
| Total capital (to risk-weighted assets) |
|
|
5,306,647 |
|
|
|
13.97 |
|
|
|
5,377,324 |
|
|
|
14.32 |
|
| Tier 1 leverage capital (to average assets) |
|
|
4,860,480 |
|
|
|
10.41 |
|
|
|
4,530,013 |
|
|
|
9.30 |
|
| Minimum requirement(1): |
|
|
|
|
|
|
|
|
|
|
|
|
|
|
|
|
| Common equity Tier 1 capital (to risk-weighted assets) |
|
|
1,709,652 |
|
|
|
4.50 |
|
|
|
1,690,158 |
|
|
|
4.50 |
|
| Tier 1 capital (to risk-weighted assets) |
|
|
2,279,536 |
|
|
|
6.00 |
|
|
|
2,253,544 |
|
|
|
6.00 |
|
| Total capital (to risk-weighted assets) |
|
|
3,039,382 |
|
|
|
8.00 |
|
|
|
3,004,726 |
|
|
|
8.00 |
|
| Tier 1 leverage capital (to average assets) |
|
|
1,867,273 |
|
|
|
4.00 |
|
|
|
1,949,381 |
|
|
|
4.00 |
|
| Well capitalized requirement under prompt corrective action provisions: |
|
|
|
|
|
|
|
|
|
|
|
|
|
|
|
|
| Common equity Tier 1 capital (to risk-weighted assets) |
|
|
2,469,498 |
|
|
|
6.50 |
|
|
|
2,441,340 |
|
|
|
6.50 |
|
| Tier 1 capital (to risk-weighted assets) |
|
|
3,039,382 |
|
|
|
8.00 |
|
|
|
3,004,726 |
|
|
|
8.00 |
|
| Total capital (to risk-weighted assets) |
|
|
3,799,227 |
|
|
|
10.00 |
|
|
|
3,755,907 |
|
|
|
10.00 |
|
| Tier 1 leverage capital (to average assets) |
|
|
2,334,092 |
|
|
|
5.00 |
|
|
|
2,436,727 |
|
|
|
5.00 |
|
|
(1) |
The additional capital conservation buffer in effect was 2.5%. |
On December 13, 2023, the Company announced a share repurchase program whereby the Company may acquire up to an aggregate of 10,000,000 shares of
its common stock in the open market at prevailing market prices or in privately negotiated transactions during the period January 2, 2024 through December 31, 2024. At the time of expiration on December 31, 2024, 1,237,021 shares had been repurchased
under this program.
The extent and timing of any repurchases depends on market conditions and other corporate, legal and regulatory considerations. Repurchased shares
are held as authorized and unissued shares. These authorized but unissued shares are available for use in the Company’s stock compensation programs, other transactions, or for other corporate purposes as determined by the Company’s Board of Directors.
Federal and state banking laws and regulations and state corporate laws restrict the amount of dividends that the Company may declare and pay.
Under Mississippi law, the Company cannot pay any dividend on its common stock unless it has received written approval of the Commissioner of the MDBCF. The federal banking agencies have indicated that paying dividends that deplete a depository
institution’s capital base to an inadequate level would be an unsafe and unsound banking practice. The Federal Reserve must approve any dividend that exceeds the Company’s current year’s net income plus its retained net income from the prior two
calendar years.
NOTE 19. SEGMENT REPORTING
The Company determines operating segments based upon the services offered, the significance of those services to the Company’s financial condition
and operating results, and management’s regular review of the operating results of those services. The Company’s CODM is the Company’s CEO. The application and development of management reporting methodologies is a robust process and is subject to
periodic enhancements. As these enhancements are made, financial results presented by each reportable segment may be periodically revised. Cadence makes operating decisions based on the following operating segments, as described below.
|
● |
Corporate Banking segment focuses on C&I, business banking, and commercial real estate lending to clients in the geographic footprint. |
|
● |
Community Banking segment provides a broad range of banking services through the branch network to serve the needs of community businesses and individual consumers in the geographic footprint. |
|
● |
Mortgage segment includes mortgage banking activities of originating mortgage loans, selling mortgage loans in the secondary market and servicing the mortgage loans that are sold on a servicing retained basis. |
|
● |
Banking Services segment offers individuals, businesses, governmental institutions, and non-profit entities a wide range of solutions to help protect, grow, and transfer wealth. Offerings include credit-related
products, trust and investment management, asset management, retirement and savings solutions, estate planning and annuity products. |
|
● |
General Corporate and Other segment includes other activities not allocated to other aforementioned operating segments. Additionally, intercompany eliminations are included as they do not reflect normal operations of
the other segments The disaggregation of General Corporate and Other better defines the results from the individual segments due to the direct relationship of the internal support provided by the strategic business units within the Bank. |
The Insurance Agencies segment is included in discontinued operations for all periods presented in the consolidated statements of income and
consolidated balance sheets, where applicable. The Insurance Agencies segment provided service as agents in the sale of commercial lines of insurance and full lines of property and casualty, life, health, and employee benefit products and services. See
Note 2 for additional information about discontinued operations.
Results of continuing operations and selected financial information by operating segment for periods indicated are presented in the following
tables. The tables show total noninterest income segregated between contracts with customers within the scope of ASC 606, Revenue from Contracts with Customers, and those within the scope of other GAAP Topics. Additionally, with the adoption of ASU
2023-07, the tables show significant segment expenses within total noninterest expense used by the CODM to assess the performance of each segment.
| (In thousands) |
|
Corporate
Banking |
|
|
Community
Banking |
|
|
Mortgage |
|
|
Banking
Services |
|
|
General
Corporate
and Other |
|
|
Total
Continuing
Operations |
|
| Results of Continuing Operations |
|
|
|
|
|
|
|
|
|
|
|
|
|
|
|
|
|
|
|
|
|
|
|
|
| Year Ended December 31, 2024 |
|
|
|
|
|
|
|
|
|
|
|
|
|
|
|
|
|
|
|
|
|
|
|
|
| Net interest revenue |
|
$ |
458,411 |
|
|
$ |
1,101,546 |
|
|
$ |
96,039 |
|
|
$ |
41,157 |
|
|
$ |
(260,938 |
) |
|
$ |
1,436,215 |
|
| Provision (release) for credit losses |
|
|
35,928 |
|
|
|
10,580 |
|
|
|
12,058 |
|
|
|
(2,136 |
) |
|
|
14,570 |
|
|
|
71,000 |
|
| Net interest revenue after provision (release) for credit losses |
|
|
422,483 |
|
|
|
1,090,966 |
|
|
|
83,981 |
|
|
|
43,293 |
|
|
|
(275,508 |
) |
|
|
1,365,215 |
|
| Noninterest revenue |
|
|
|
|
|
|
|
|
|
|
|
|
|
|
|
|
|
|
|
|
|
|
|
|
| In Scope of Topic 606 |
|
|
|
|
|
|
|
|
|
|
|
|
|
|
|
|
|
|
|
|
|
|
|
|
| Trust and asset management income |
|
|
1,587 |
|
|
|
24 |
|
|
|
— |
|
|
|
49,826 |
|
|
|
(2,930 |
) |
|
|
48,507 |
|
| Investment advisory fees |
|
|
— |
|
|
|
— |
|
|
|
— |
|
|
|
33,852 |
|
|
|
(192 |
) |
|
|
33,660 |
|
| Other brokerage fees |
|
|
— |
|
|
|
— |
|
|
|
— |
|
|
|
6,251 |
|
|
|
— |
|
|
|
6,251 |
|
| Deposit service charges |
|
|
14,033 |
|
|
|
54,693 |
|
|
|
— |
|
|
|
4,047 |
|
|
|
724 |
|
|
|
73,497 |
|
| Credit card, debit card and merchant fees |
|
|
259 |
|
|
|
37,268 |
|
|
|
— |
|
|
|
7 |
|
|
|
12,711 |
|
|
|
50,245 |
|
| Total noninterest revenue (in-scope of Topic 606) |
|
|
15,879 |
|
|
|
91,985 |
|
|
|
— |
|
|
|
93,983 |
|
|
|
10,313 |
|
|
|
212,160 |
|
| Total noninterest revenue (out-of-scope of Topic 606) |
|
|
41,078 |
|
|
|
39,349 |
|
|
|
22,037 |
|
|
|
9,777 |
|
|
|
32,109 |
|
|
|
144,350 |
|
| Total noninterest revenue |
|
|
56,957 |
|
|
|
131,334 |
|
|
|
22,037 |
|
|
|
103,760 |
|
|
|
42,422 |
|
|
|
356,510 |
|
| Noninterest expense |
|
|
|
|
|
|
|
|
|
|
|
|
|
|
|
|
|
|
|
|
|
|
|
|
| Salaries and employee benefits |
|
|
84,589 |
|
|
|
232,446 |
|
|
|
23,932 |
|
|
|
54,029 |
|
|
|
214,311 |
|
|
|
609,307 |
|
| Occupancy and equipment |
|
|
4,256 |
|
|
|
72,939 |
|
|
|
4,285 |
|
|
|
3,249 |
|
|
|
29,446 |
|
|
|
114,175 |
|
| Data processing and software |
|
|
4,306 |
|
|
|
2,811 |
|
|
|
4,176 |
|
|
|
5,399 |
|
|
|
105,192 |
|
|
|
121,884 |
|
| Allocated overhead expenses |
|
|
98,168 |
|
|
|
250,727 |
|
|
|
30,523 |
|
|
|
15,774 |
|
|
|
(395,192 |
) |
|
|
— |
|
| Other segment items(1) |
|
|
32,489 |
|
|
|
47,126 |
|
|
|
13,399 |
|
|
|
19,201 |
|
|
|
87,947 |
|
|
|
200,162 |
|
| Total noninterest expense |
|
|
223,808 |
|
|
|
606,049 |
|
|
|
76,315 |
|
|
|
97,652 |
|
|
|
41,704 |
|
|
|
1,045,528 |
|
| Income (loss) from continuing operations before income taxes |
|
|
255,632 |
|
|
|
616,251 |
|
|
|
29,703 |
|
|
|
49,401 |
|
|
|
(274,790 |
) |
|
|
676,197 |
|
| Income tax expense (benefit) |
|
|
60,073 |
|
|
|
144,819 |
|
|
|
6,980 |
|
|
|
11,525 |
|
|
|
(70,804 |
) |
|
|
152,593 |
|
| Income (loss) from continuing operations |
|
$ |
195,559 |
|
|
$ |
471,432 |
|
|
$ |
22,723 |
|
|
$ |
37,876 |
|
|
$ |
(203,986 |
) |
|
$ |
523,604 |
|
| Selected Financial Information |
|
|
|
|
|
|
|
|
|
|
|
|
|
|
|
|
|
|
|
|
|
|
|
|
| Total assets at end of period |
|
$ |
11,701,718 |
|
|
$ |
17,422,937 |
|
|
$ |
5,825,080 |
|
|
$ |
1,104,128 |
|
|
$ |
10,965,327 |
|
|
$ |
47,019,190 |
|
|
(1) |
Other segment items for each reportable segment includes: |
|
● |
Corporate Banking —legal expenses, travel expenses and certain overhead expenses. |
|
● |
Community Banking—advertising, office supplies, ATM expenses, delivery expenses, professional and consulting fees, legal expenses, telecommunication and postage expenses, travel expenses, and certain overhead
expenses. |
|
● |
Mortgage—mortgage loan quality control and repurchase expenses, legal expenses, and certain overhead expenses. |
|
● |
Banking Services— amortization of intangibles, professional and consulting fees, legal expenses, and certain overhead expenses. |
|
● |
General, Corporate and Other— advertising, supplies, regulatory expenses, and certain other overhead expenses. |
| (In thousands) |
|
Corporate
Banking |
|
|
Community
Banking |
|
|
Mortgage |
|
|
Banking
Services |
|
|
General
Corporate
and Other |
|
|
Total
Continuing
Operations |
|
| Results of Continuing Operations |
|
|
|
|
|
|
|
|
|
|
|
|
|
|
|
|
|
|
|
|
|
|
|
|
| Year Ended December 31, 2023 |
|
|
|
|
|
|
|
|
|
|
|
|
|
|
|
|
|
|
|
|
|
|
|
|
| Net interest revenue |
|
$ |
493,091 |
|
|
$ |
1,276,606 |
|
|
$ |
82,549 |
|
|
$ |
47,482 |
|
|
$ |
(548,372 |
) |
|
$ |
1,351,356 |
|
| Provision (release) for credit losses |
|
|
63,735 |
|
|
|
9,949 |
|
|
|
7,325 |
|
|
|
719 |
|
|
|
(1,728 |
) |
|
|
80,000 |
|
| Net interest revenue after provision (release) for credit losses |
|
|
429,356 |
|
|
|
1,266,657 |
|
|
|
75,224 |
|
|
|
46,763 |
|
|
|
(546,644 |
) |
|
|
1,271,356 |
|
| Noninterest revenue |
|
|
|
|
|
|
|
|
|
|
|
|
|
|
|
|
|
|
|
|
|
|
|
|
| In Scope of Topic 606 |
|
|
|
|
|
|
|
|
|
|
|
|
|
|
|
|
|
|
|
|
|
|
|
|
| Trust and asset management income |
|
|
282 |
|
|
|
21 |
|
|
|
— |
|
|
|
45,077 |
|
|
|
(2,867 |
) |
|
|
42,513 |
|
| Investment advisory fees |
|
|
— |
|
|
|
— |
|
|
|
— |
|
|
|
31,713 |
|
|
|
(310 |
) |
|
|
31,403 |
|
| Other brokerage fees |
|
|
— |
|
|
|
— |
|
|
|
— |
|
|
|
5,397 |
|
|
|
— |
|
|
|
5,397 |
|
| Deposit service charges |
|
|
12,993 |
|
|
|
55,199 |
|
|
|
— |
|
|
|
1,529 |
|
|
|
(8,003 |
) |
|
|
61,718 |
|
| Credit card, debit card and merchant fees |
|
|
626 |
|
|
|
37,314 |
|
|
|
— |
|
|
|
18 |
|
|
|
11,826 |
|
|
|
49,784 |
|
| Total noninterest revenue (in-scope of Topic 606) |
|
|
13,901 |
|
|
|
92,534 |
|
|
|
— |
|
|
|
83,734 |
|
|
|
646 |
|
|
|
190,815 |
|
| Total noninterest revenue (out-of-scope of Topic 606) |
|
|
39,179 |
|
|
|
16,303 |
|
|
|
23,023 |
|
|
|
9,240 |
|
|
|
(394,903 |
) |
|
|
(307,158 |
) |
| Total noninterest revenue |
|
|
53,080 |
|
|
|
108,837 |
|
|
|
23,023 |
|
|
|
92,974 |
|
|
|
(394,257 |
) |
|
|
(116,343 |
) |
| Noninterest expense |
|
|
|
|
|
|
|
|
|
|
|
|
|
|
|
|
|
|
|
|
|
|
|
|
| Salaries and employee benefits |
|
|
87,453 |
|
|
|
246,474 |
|
|
|
26,299 |
|
|
|
53,147 |
|
|
|
221,349 |
|
|
|
634,722 |
|
| Occupancy and equipment |
|
|
4,313 |
|
|
|
71,754 |
|
|
|
4,392 |
|
|
|
3,307 |
|
|
|
27,206 |
|
|
|
110,972 |
|
| Data processing and software |
|
|
7,806 |
|
|
|
8,184 |
|
|
|
4,339 |
|
|
|
6,292 |
|
|
|
93,822 |
|
|
|
120,443 |
|
| Allocated overhead expenses |
|
|
91,190 |
|
|
|
237,153 |
|
|
|
27,513 |
|
|
|
10,950 |
|
|
|
(366,806 |
) |
|
|
— |
|
| Other segment items(1) |
|
|
32,586 |
|
|
|
42,223 |
|
|
|
15,252 |
|
|
|
18,969 |
|
|
|
180,756 |
|
|
|
289,786 |
|
| Total noninterest expense |
|
|
223,348 |
|
|
|
605,788 |
|
|
|
77,795 |
|
|
|
92,665 |
|
|
|
156,327 |
|
|
|
1,155,923 |
|
| Income (loss) from continuing operations |
|
|
|
|
|
|
|
|
|
|
|
|
|
|
|
|
|
|
|
|
|
|
|
|
| before income taxes |
|
|
259,088 |
|
|
|
769,706 |
|
|
|
20,452 |
|
|
|
47,072 |
|
|
|
(1,097,228 |
) |
|
|
(910 |
) |
| Income tax expense (benefit) |
|
|
60,886 |
|
|
|
180,881 |
|
|
|
4,806 |
|
|
|
11,041 |
|
|
|
(262,208 |
) |
|
|
(4,594 |
) |
| Income (loss) from continuing operations |
|
$ |
198,202 |
|
|
$ |
588,825 |
|
|
$ |
15,646 |
|
|
$ |
36,031 |
|
|
$ |
(835,020 |
) |
|
$ |
3,684 |
|
| Selected Financial Information |
|
|
|
|
|
|
|
|
|
|
|
|
|
|
|
|
|
|
|
|
|
|
|
|
| Total assets at end of period |
|
$ |
11,580,613 |
|
|
$ |
17,106,224 |
|
|
$ |
5,032,139 |
|
|
$ |
1,116,347 |
|
|
$ |
14,099,187 |
|
|
$ |
48,934,510 |
|
|
(1) |
Other segment items for each reportable segment includes: |
|
● |
Corporate Banking —legal expenses, travel expenses and certain overhead expenses. |
|
● |
Community Banking—advertising, office supplies, ATM expenses, delivery expenses, professional and consulting fees, legal expenses, telecommunication and postage expenses, travel expenses, and certain overhead
expenses. |
|
● |
Mortgage—mortgage loan quality control and repurchase expenses, legal expenses, and certain overhead expenses. |
|
● |
Banking Services— amortization of intangibles, professional and consulting fees, legal expenses, and certain overhead expenses. |
|
● |
General, Corporate, and Other— pension settlement expense, advertising, supplies, regulatory expenses, and certain other overhead expenses. |
| (In thousands) |
|
Corporate
Banking |
|
|
Community
Banking |
|
|
Mortgage |
|
|
Banking
Services |
|
|
General
Corporate and
Other |
|
|
Total
Continuing
Operations |
|
| Results of Continuing Operations |
|
|
|
|
|
|
|
|
|
|
|
|
|
|
|
|
|
|
|
|
|
|
|
|
| Year Ended December 31, 2022 |
|
|
|
|
|
|
|
|
|
|
|
|
|
|
|
|
|
|
|
|
|
|
|
|
| Net interest revenue |
|
$ |
411,695 |
|
|
$ |
755,056 |
|
|
$ |
61,036 |
|
|
$ |
31,074 |
|
|
$ |
92,430 |
|
|
$ |
1,351,291 |
|
| Provision (release) for credit losses |
|
|
47,981 |
|
|
|
(71,911 |
) |
|
|
26,582 |
|
|
|
(179 |
) |
|
|
4,527 |
|
|
|
7,000 |
|
| Net interest revenue after provision (release) for credit losses |
|
|
363,714 |
|
|
|
826,967 |
|
|
|
34,454 |
|
|
|
31,253 |
|
|
|
87,903 |
|
|
|
1,344,291 |
|
| Noninterest revenue |
|
|
|
|
|
|
|
|
|
|
|
|
|
|
|
|
|
|
|
|
|
|
|
|
| In Scope of Topic 606 |
|
|
|
|
|
|
|
|
|
|
|
|
|
|
|
|
|
|
|
|
|
|
|
|
| Trust and asset management income |
|
|
720 |
|
|
|
1 |
|
|
|
— |
|
|
|
40,619 |
|
|
|
(3,142 |
) |
|
|
38,198 |
|
| Investment advisory fees |
|
|
— |
|
|
|
— |
|
|
|
— |
|
|
|
28,830 |
|
|
|
(250 |
) |
|
|
28,580 |
|
| Other brokerage fees |
|
|
— |
|
|
|
— |
|
|
|
— |
|
|
|
10,800 |
|
|
|
— |
|
|
|
10,800 |
|
| Deposit service charges |
|
|
15,008 |
|
|
|
58,232 |
|
|
|
— |
|
|
|
1,661 |
|
|
|
(1,423 |
) |
|
|
73,478 |
|
| Credit card, debit card and merchant fees |
|
|
522 |
|
|
|
40,855 |
|
|
|
— |
|
|
|
18 |
|
|
|
16,765 |
|
|
|
58,160 |
|
| Total noninterest revenue (in-scope of Topic 606) |
|
|
16,250 |
|
|
|
99,088 |
|
|
|
— |
|
|
|
81,928 |
|
|
|
11,950 |
|
|
|
209,216 |
|
| Total noninterest revenue (out-of-scope of Topic 606) |
|
|
37,370 |
|
|
|
11,873 |
|
|
|
44,725 |
|
|
|
3,003 |
|
|
|
36,298 |
|
|
|
133,269 |
|
| Total noninterest revenue |
|
|
53,620 |
|
|
|
110,961 |
|
|
|
44,725 |
|
|
|
84,931 |
|
|
|
48,248 |
|
|
|
342,485 |
|
| Noninterest expense |
|
|
|
|
|
|
|
|
|
|
|
|
|
|
|
|
|
|
|
|
|
|
|
|
| Salaries and employee benefits |
|
|
77,468 |
|
|
|
249,372 |
|
|
|
31,091 |
|
|
|
50,704 |
|
|
|
226,208 |
|
|
|
634,843 |
|
| Occupancy and equipment |
|
|
4,077 |
|
|
|
73,179 |
|
|
|
4,190 |
|
|
|
3,613 |
|
|
|
29,401 |
|
|
|
114,460 |
|
| Data processing and software |
|
|
2,613 |
|
|
|
12,175 |
|
|
|
4,647 |
|
|
|
5,357 |
|
|
|
86,315 |
|
|
|
111,107 |
|
| Allocated overhead expenses |
|
|
100,668 |
|
|
|
221,592 |
|
|
|
24,068 |
|
|
|
11,447 |
|
|
|
(357,775 |
) |
|
|
— |
|
| Other segment items(1) |
|
|
16,618 |
|
|
|
30,117 |
|
|
|
11,853 |
|
|
|
16,117 |
|
|
|
174,639 |
|
|
|
249,344 |
|
| Total noninterest expense |
|
|
201,444 |
|
|
|
586,435 |
|
|
|
75,849 |
|
|
|
87,238 |
|
|
|
158,788 |
|
|
|
1,109,754 |
|
| Income (loss) from continuing operations before income taxes |
|
|
215,890 |
|
|
|
351,493 |
|
|
|
3,330 |
|
|
|
28,946 |
|
|
|
(22,637 |
) |
|
|
577,022 |
|
| Income tax expense (benefit) |
|
|
50,736 |
|
|
|
82,601 |
|
|
|
783 |
|
|
|
6,770 |
|
|
|
(11,185 |
) |
|
|
129,705 |
|
| Income (loss) from continuing operations |
|
$ |
165,154 |
|
|
$ |
268,892 |
|
|
$ |
2,547 |
|
|
$ |
22,176 |
|
|
$ |
(11,452 |
) |
|
$ |
447,317 |
|
| Selected Financial Information |
|
|
|
|
|
|
|
|
|
|
|
|
|
|
|
|
|
|
|
|
|
|
|
|
| Total assets at end of period |
|
$ |
10,392,175 |
|
|
$ |
16,972,114 |
|
|
$ |
4,249,490 |
|
|
$ |
1,001,097 |
|
|
$ |
16,038,538 |
|
|
$ |
48,653,414 |
|
|
(1) |
Other segment items for each reportable segment includes: |
|
● |
Corporate Banking —legal expenses, travel expenses and certain overhead expenses. |
|
● |
Community Banking—advertising, office supplies, ATM expenses, delivery expenses, professional and consulting fees, legal expenses, telecommunication and postage expenses, travel expenses, and certain overhead
expenses. |
|
● |
Mortgage—mortgage loan quality control and repurchase expenses, legal expenses, and certain overhead expenses. |
|
● |
Banking Services— amortization of intangibles, professional and consulting fees, legal expenses, and certain overhead expenses. |
|
● |
General, Corporate, and Other— pension settlement expense, advertising, supplies, regulatory expenses, and certain other overhead expenses. |
NOTE 20. DERIVATIVE INSTRUMENTS
The Company primarily uses derivatives to manage exposure to market risk, including interest rate risk, credit risk and foreign currency risk, and
to assist customers with their risk management objectives. Management may designate certain derivatives as hedging instruments in a qualifying hedge accounting relationship. The Company’s derivative instruments consist of economic hedges for which the
Company has elected not to apply hedge accounting and derivatives held for customer accommodation, or other purposes.
The fair value of derivative positions outstanding is included in other assets and other liabilities in the accompanying consolidated balance
sheets and in the net change in each of these financial statement line items in the operating section of the accompanying consolidated statements of cash flows. For derivatives not designated as hedging instruments or determined to be an ineffective
hedge under applicable accounting guidance, gains and losses due to changes in fair value are included in noninterest income and the operating section of the consolidated statements of cash flows. For derivatives designated as cash flow hedging
instruments, the entire change in the fair value related to the derivative instrument is recognized as a component of other comprehensive income and subsequently reclassified into interest income when the forecasted transaction affects income. At
December 31, 2024 and December 31, 2023, there were no derivatives designated under hedge accounting. The notional amounts and estimated fair values for the periods indicated were as follows:
| |
|
December 31, 2024 |
|
|
December 31, 2023 |
|
| |
|
|
|
|
Fair Value |
|
|
|
|
|
|
|
|
Fair Value |
|
|
|
|
| |
|
|
|
|
|
|
|
|
|
|
Weighted |
|
|
|
|
|
|
|
|
|
|
|
Weighted |
|
| |
|
|
|
|
|
|
|
|
|
|
Average |
|
|
|
|
|
|
|
|
|
|
|
Average |
|
| |
|
Notional |
|
|
Other |
|
|
Other |
|
|
Maturity |
|
|
Notional |
|
|
Other |
|
|
Other |
|
|
Maturity |
|
| (In thousands) |
|
Amount |
|
|
Assets |
|
|
Liabilities |
|
|
(years) |
|
|
Amount |
|
|
Assets |
|
|
Liabilities |
|
|
(years) |
|
| Commercial loan interest rate contracts |
|
$ |
3,781,868 |
|
|
$ |
30,555 |
|
|
$ |
45,070 |
|
|
|
4.2 |
|
|
$ |
2,682,401 |
|
|
$ |
25,264 |
|
|
$ |
41,459 |
|
|
|
4.5 |
|
| Mortgage loan held-for-sale interest rate lock commitments |
|
|
151,231 |
|
|
|
1,310 |
|
|
|
15 |
|
|
|
0.1 |
|
|
|
125,339 |
|
|
|
1,858 |
|
|
|
10 |
|
|
|
0.1 |
|
| Futures, forwards and options (used to hedge MSR, see Note 17) |
|
|
230,000 |
|
|
|
— |
|
|
|
3,085 |
|
|
|
0.2 |
|
|
|
147,000 |
|
|
|
1,809 |
|
|
|
— |
|
|
|
0.2 |
|
| Mortgage loan forward sale commitments |
|
|
179,000 |
|
|
|
816 |
|
|
|
34 |
|
|
|
0.1 |
|
|
|
235,323 |
|
|
|
246 |
|
|
|
2,567 |
|
|
|
0.1 |
|
| Foreign exchange contracts |
|
|
55,542 |
|
|
|
650 |
|
|
|
469 |
|
|
|
0.5 |
|
|
|
48,846 |
|
|
|
326 |
|
|
|
268 |
|
|
|
0.3 |
|
| Total derivatives |
|
$ |
4,397,641 |
|
|
$ |
33,331 |
|
|
$ |
48,673 |
|
|
|
|
|
|
$ |
3,238,909 |
|
|
$ |
29,503 |
|
|
$ |
44,304 |
|
|
|
|
|
The Company is party to collateral support agreements with certain derivative counterparties. Such agreements require that the Company maintain
collateral based on the fair values of derivative transactions. In the event of default by the Company, the counterparty would be entitled to the collateral. At December 31, 2024, and 2023, the Company was required to post $60.9 million and $56.8
million, respectively, in cash or qualifying securities as collateral for its derivative transactions. Of this, $60.9 million was included in interest bearing deposits with other banks at December 31, 2024. At December 31, 2023, $50.0 million was
included in interest bearing deposits with other banks and $6.8 million was included in other assets. In addition, the Company had recorded the obligation to return cash collateral provided by counterparties of $23.1 million and $16.3 million at
December 31, 2024, and 2023, respectively, within deposits on the Company’s consolidated balance sheet. Certain financial instruments, such as derivatives, may be eligible for offset in the consolidated balance sheet and/or subject to master netting
arrangements or similar agreements. The Company’s derivative transactions with upstream financial institution counterparties are generally executed under International Swaps and Derivative Association master agreements which include “right of set-off”
provisions. In such cases, there is generally a legally enforceable right to offset recognized amounts and there may be an intention to settle such amounts on a net basis. Nonetheless, the Company does not generally offset such financial instruments
for financial reporting purposes.
The Company enters into certain interest rate contracts on commercial loans, which include swaps, floors, caps and collars that are not designated
as hedging instruments. These derivative contracts relate to transactions in which the Company enters into an interest rate contract with a loan customer while at the same time entering into an offsetting interest rate contract with another financial
institution. In connection with each swap transaction, the Company agrees to pay interest to the customer on a notional amount at a variable interest rate and receive interest from the customer on a similar notional amount at a fixed interest rate. At
the same time, the Company agrees to pay another financial institution the same fixed interest rate on the same notional amount and receive the same variable interest rate on the same notional amount. The interest rate swap, floor, cap and collar
transactions allow the Company to manage its interest rate risk. Because the Company acts as an intermediary for its customers, changes in the fair value of the underlying derivative contracts generally offset and do not significantly impact the
Company’s consolidated statements of income. The Company is exposed to credit loss in the event of nonperformance by the parties to the interest rate contracts. However, the Company does not anticipate nonperformance by the counterparties. The
estimated fair value has been recorded as an asset and a corresponding liability in the accompanying consolidated balance sheets at December 31, 2024 and 2023.
The Company has both bought and sold credit protection in the form of participations on interest rate swaps (swap participations). These swap
participations, which meet the definition of credit derivatives, were entered into in the ordinary course of business to serve the credit needs of customers. Swap participations, whereby the Company has purchased credit protection, entitle the Company
to receive a payment from the counterparty if the customer fails to make payment on any amounts due to the Company upon early termination of the swap transaction. For contracts where the Company sold credit protection, the Company would be required to
make payment to the counterparty if the customer fails to make payment on any amounts due to the counterparty upon early termination of the swap transaction. Swap participation agreements where the Company is the beneficiary had notional values
totaling $205.1 million and $137.2 million at December 31, 2024 and 2023, respectively. Swap participation agreements where the Company is the guarantor had notional values totaling $443.0 million and $425.8 million at December 31, 2024 and 2023,
respectively.
The Company enters into interest rate lock commitments with customers in connection with residential mortgage loan applications for loans the
Company intends to sell. Additionally, the Company enters into mortgage loan forward sales commitments of MBS with investors to mitigate the effect of interest rate risk inherent in providing interest rate lock commitments to customers. Both the
interest rate lock commitments and mortgage loan forward sales commitments are considered derivatives under current accounting guidance and are required to be recorded at fair value. The fair value of these derivatives is recorded on the consolidated
balance sheets in other assets and other liabilities. The change in fair value of these instruments is recorded within mortgage banking revenue in the consolidated statements of income. For the years ended December 31, 2024, and 2023, mortgage loans
held for sale interest rate lock commitment and mortgage loan forward sales commitment gains totaled $0.9 million, $1.5 million, respectively, compared to losses incurred of $8.0 million during the year ended December 31, 2022.
The Company has an economic hedge in place on its MSR and uses various instruments (including but not limited to Treasury options, SOFR and TBA
futures and forwards) to mitigate the interest rate risk associated with the MSR. These hedging instruments are reported at fair value, with adjustments included as part of mortgage banking revenue in the consolidated statements of income. The market
value adjustment on MSR hedge totaled net losses of $9.9 million, $1.8 million and $15.5 million for the years ended December 31, 2024, 2023 and 2022, respectively. See Note 17 for additional information.
The Company enters into certain foreign currency exchange contracts on behalf of its clients to facilitate their risk management strategies, while
at the same time entering into offsetting foreign currency exchange contracts with another counterparty in order to minimize the Company’s foreign currency exchange risk. The contracts are short term in nature, and any gain or loss incurred at
settlement is recorded as other noninterest income. The fair value of these contracts is reported in other assets and other liabilities. Foreign exchange contract net gains totaled $3.9 million, $5.2 million and $4.7 million for the years ended
December 31, 2024, 2023 and 2022, respectively.
NOTE 21. COMMITMENTS AND CONTINGENT LIABILITIES
Mortgage Loans Serviced for Others
The Company services mortgage loans for other financial institutions that are not included as assets in the Company’s accompanying consolidated
financial statements. Included in the $8.0 billion and $7.7 billion of mortgage loans serviced for investors at December 31, 2024 and December 31, 2023, respectively, was $0.6 million and $1.0 million, respectively, of primary recourse servicing
pursuant to which the Company is responsible for any losses incurred in the event of nonperformance by the mortgagor. The Company’s exposure to credit loss in the event of such nonperformance is the unpaid principal balance at the time of default. This
exposure is limited by the underlying collateral, which consists of single family residences and either federal or private mortgage insurance.
Lending Commitments
The consolidated financial statements do not reflect various commitments and contingent liabilities which arise in the normal course of banking
business and involve elements of credit risk, interest rate risk, and liquidity risk. Such financial instruments are recorded when they are funded. At December 31, 2024 and December 31, 2023, these included $448.9 million and $450.7 million,
respectively, in letters of credit and $8.6 billion and $9.7 billion, respectively, in unfunded extensions of credit such as interim mortgage financing, construction credit, credit card, and revolving line of credit arrangements.
Commitments to extend credit and letters of credit include some exposure to credit loss in the event of nonperformance of the customer.
Commitments to extend credit are agreements to lend to a customer as long as there is no violation of any condition established in the contract. In addition, the Company has entered into certain contingent commitments to grant loans. Standby letters of
credit are conditional commitments issued to guarantee the performance of a customer to a third party. The credit policies and procedures for such commitments are the same as those used for lending activities. Because these instruments have fixed
maturity dates and because a number expire without being drawn upon, they generally do not present any significant liquidity risk. The Company did not realize significant credit losses from these commitments and arrangements during the years ended
December 31, 2024, 2023, and 2022.
Other Commitments
The Company makes investments in limited partnerships, including certain affordable housing partnerships for which it receives tax credits. At
December 31, 2024 and December 31, 2023, unfunded capital commitments totaled $277.4 million and $275.2 million, respectively. See Note 23 for more information.
Litigation
The nature of the Company’s business ordinarily results in certain types of claims, litigation, investigations, and other legal or administrative
cases and proceedings. Although the Company and its subsidiaries have policies and procedures to minimize legal noncompliance and the impact of claims and other proceedings, and endeavored to procure reasonable amounts of insurance coverage, litigation
and regulatory actions present an ongoing risk.
The Company and its subsidiaries engage in lines of business that are heavily regulated and involve a large volume of actual or potential
financial transactions with customers or applicants, and the Company is a public company with a large number of shareholders. From time to time, applicants, borrowers, customers, shareholders, former employees, service providers, and other third
parties have brought actions against the Company or its subsidiaries, in cases claiming substantial damages. Financial services companies are subject to risks arising from changing regulatory frameworks or expectations, regulatory investigations, class
action litigation, and, from time to time, the Company and its subsidiaries have such actions brought against them. The Company and its subsidiaries are also subject to enforcement actions by federal or state regulators, including the CFPB, the DOJ,
state attorneys general, and the Federal Reserve or MDBCF, which may be adversely impacted by ongoing litigation in which the Company is involved. Additionally, the Company is, and management expects it to be, engaged in a number of foreclosure
proceedings and other collection actions as part of its lending and leasing collections activities, which, from time to time, have resulted in counterclaims against the Company and its subsidiaries. Various legal proceedings have and may arise in the
future out of claims against entities to which the Company is a successor as a result of business combinations.
When and as the Company determines it has meritorious defenses to the claims asserted, it vigorously defends against such claims. The Company will
consider settlement of claims when, in management’s judgment and in consultation with counsel, it is in the best interests of the Company to do so.
The Company cannot predict with certainty the cost of defense, the cost of prosecution, or the ultimate outcome of litigation or other proceedings
filed by or against it, its subsidiaries and its directors, management or employees, including remedies or damage awards. On at least a quarterly basis, the Company assesses its liabilities and contingencies in connection with outstanding legal
proceedings as well as certain threatened claims (which are not considered incidental to the ordinary conduct of the Company’s business) utilizing the latest and most reliable information available. For matters where a loss is not probable or the
amount of the loss cannot be estimated, the Company will not make an accrual. For matters where it is probable the Company will incur a loss and the amount can be reasonably estimated, the Company will accrue for the loss. Once established, the accrual
is adjusted periodically to reflect any relevant developments. The actual cost of any such matters, however, may turn out to be substantially higher than the amount accrued. Further, the Company’s insurance policies have deductibles and coverage
limits, and such policies are unlikely to cover all costs and expenses related to the defense or prosecution of such legal proceedings or any losses arising therefrom.
Although the final outcome of any legal proceedings is inherently uncertain, based on the information available, advice of counsel and available
insurance coverage, if applicable, management believes that the litigation-related liability of $12.0 million accrued at December 31, 2024 is adequate and that any incremental change in potential liability arising from the Company’s legal proceedings
and threatened claims, including the matters described herein and those otherwise arising in the ordinary course of business, will not have a material adverse effect on the Company’s business or consolidated results of operations or financial
condition. It is possible, however, that future developments could result in an unfavorable outcome for or resolution of any one or more of the legal proceedings in which the Company or its subsidiaries are defendants, which may be material to the
Company’s business or consolidated results of operations or financial condition for a particular fiscal period or periods.
On August 30, 2021, Legacy Cadence Bank and the DOJ agreed to a settlement set forth in the consent order related to the investigation by the DOJ
of Legacy Cadence Bank’s fair lending program in Harris, Fort Bend, and Montgomery Counties located in Houston, Texas during the period between 2014 and 2016 (the “Consent Order”). The Consent Order was signed by the United States District Court for
the Northern District of Georgia, Atlanta Division, on August 31, 2021. Pursuant to Section 5.2(g) of the Agreement and Plan of Merger and Paragraph 50 of the Consent Order, Legacy BancorpSouth Bank approved the negotiated settlement, and subsequently,
the Company agreed to accept the obligations of the Consent Order. The Consent Order is in effect for five years. For additional information regarding the terms of this settlement and the Consent Order, see Legacy Cadence’s Current Report on Form 8-K
that was filed with the SEC on August 30, 2021.
NOTE 22. OTHER NONINTEREST INCOME AND EXPENSE
The following table details other noninterest income for the periods indicated:
| |
|
Year Ended December 31, |
|
| (In thousands) |
|
2024 |
|
|
2023 |
|
|
2022 |
|
| Credit related fees |
|
$ |
27,352 |
|
|
$ |
26,830 |
|
|
$ |
26,768 |
|
| Bank-owned life insurance |
|
|
17,716 |
|
|
|
16,294 |
|
|
|
15,594 |
|
| SBA income |
|
|
12,083 |
|
|
|
9,839 |
|
|
|
15,341 |
|
| Other miscellaneous income |
|
|
66,354 |
|
|
|
48,938 |
|
|
|
28,182 |
|
| Total other noninterest income |
|
$ |
123,505 |
|
|
$ |
101,901 |
|
|
$ |
85,885 |
|
The following table details other noninterest expense for the periods indicated:
| |
|
Year Ended December 31, |
|
| (In thousands) |
|
2024 |
|
|
2023 |
|
|
2022 |
|
| Advertising and public relations |
|
$ |
22,112 |
|
|
$ |
28,162 |
|
|
$ |
41,055 |
|
| Foreclosed property expense |
|
|
1,891 |
|
|
|
2,488 |
|
|
|
832 |
|
| Telecommunications |
|
|
5,857 |
|
|
|
5,775 |
|
|
|
6,617 |
|
| Travel and entertainment |
|
|
10,015 |
|
|
|
11,004 |
|
|
|
11,407 |
|
| Professional, consulting, and outsourcing |
|
|
16,124 |
|
|
|
19,892 |
|
|
|
13,424 |
|
| Legal expense |
|
|
12,279 |
|
|
|
20,093 |
|
|
|
5,350 |
|
| Postage and shipping |
|
|
7,128 |
|
|
|
8,443 |
|
|
|
7,868 |
|
| Other miscellaneous expense |
|
|
68,932 |
|
|
|
85,299 |
|
|
|
65,779 |
|
| Total other noninterest expense |
|
$ |
144,338 |
|
|
$ |
181,156 |
|
|
$ |
152,332 |
|
NOTE 23. VARIABLE INTEREST ENTITIES AND OTHER INVESTMENTS
Certain NMTC meet the qualifications for consolidation under ASC 810. Consolidation is applicable to this type of investment structure when the
entities owned by the tax credit investment fund, managing member, and limited partner of the sub-CDE, are under common control and the limited partner’s related party group has both the power and the obligation to absorb the significant benefits and
losses of the sub-CDE. Based on this, the limited partner, which is the Company, is the primary beneficiary of the sub-CDE (VIE) and therefore subject to consolidation. NMTC investment structures which include a managing member not affiliated with the
Company are not subject to consolidation.
At December 31, 2024 and December 31, 2023, the Company’s assets of the consolidated VIE that can be used only to settle obligations of the
consolidated VIE totaled $5.4 million and $6.5 million, respectively.
The Company is invested in several tax credit projects solely as a limited partner. At December 31, 2024 and December 31, 2023, the Company’s
maximum exposure to loss associated with these limited partnerships was limited to its investment. Most of the investments are in affordable housing projects. The partnerships have qualified to receive annual affordable housing federal tax credits that
are recognized as a reduction of current tax expense. The Company accounts for these investments and the related tax credits using either the effective yield method or the proportional amortization method, depending upon the date of the investment.
Under the effective yield method, the Company recognizes the tax credits as they are allocated and amortizes the initial costs of the investments to provide a constant effective yield over the period the tax credits are allocated. Under the
proportional amortization method, the Company amortizes the cost of the investment in proportion to the tax credits and other tax benefits received and recognizes the net investment performance in the income statement as a component of income tax
expense. The Company also has, to a lesser degree, investments in NMTC and historic tax credit projects. The Company has elected to account for the NMTC not subject to consolidation and historic tax credits using the flow-through method, which reduces
federal income taxes in the year in which the credit arises. At December 31, 2024 and December 31, 2023, the Company recorded total tax credit investments in other assets on its consolidated balance sheets of $387.3 million and $362.0 million,
respectively.
Through December 31, 2023, the amortization of the NMTC investments and historic tax credit investments was recorded in other noninterest income
on the Company’s consolidated statements of income. The Company adopted the provisions of ASU 2023-02 (see Note 1) as of January 1, 2024 and determined each investments’ eligibility for proportional amortization. For certain NMTC and HTC investments
that do not qualify for the proportional amortization method under ASU 2023-02, amortization related to these investments are recorded in other noninterest income in the Company’s consolidated statements of income. The Company recorded amortization of
$1.1 million for both the years ended December 31, 2024 and 2023, respectively. The cash flow activity related to these investments are presented in the net income (loss) line in the operating activities section of the consolidated statements of cash
flows.
For the investments that qualify for proportional amortization under ASU 2023-02, the Company recognized income tax credits and other income tax
benefits for the year ended December 31, 2024 of $37.7 million and $4.6 million, respectively. The total income tax benefits of $42.3 million are partially offset by $33.4 million of investment amortization recognized for the year ended December 31,
2024, for a net income tax benefit of $8.9 million. The Company recorded amortization for these income tax credits of $23.6 million for year ended December 31, 2023, which $5.9 million was reported in noninterest income in the consolidated statements
of income and $17.7 million was reported in income tax expense.
The cash flows related to the total income tax benefits are presented in the consolidated statements of cash flows. The net income tax benefit of
$8.9 million for the year ended December 31, 2024, was included in the net income (loss) line within operating activities. Investment amortization of $33.4 million for the year ended December 31, 2024, was included in the depreciation and amortization
line item, which was an adjustment to reconcile net income (loss) to cash provided by (used for) operating activities. The income tax credits and other income tax benefits of $42.3 million for the year ended December 31, 2024, was included in the net
change to other assets or liabilities line item, which was also an adjustment to reconcile net income (loss) to cash provided by (used for) operating activities.
Additionally, the Company has investments in other certain limited partnerships accounted for under the fair value practical expedient of NAV
totaling $118.7 million and $95.0 million at December 31, 2024 and December 31, 2023, respectively. Related to these assets recorded at fair value through net income, the Company recognized net gains of $11.9 million and $8.2 million for the years
ended December 31, 2024 and 2023, respectively. These investments are made primarily through various SBIC funds as a strategy to provide expansion and growth opportunities to small businesses and community development funds to help serve the credit
needs of the low- and moderate-income and underserved within our footprint. Of the total fair value of these limited partnerships, $15.8 million and $11.7 million related to real-estate funds at December 31, 2024 and December 31, 2023, respectively.
The remaining $102.9 million and $83.3 million are related to SBIC funds that concentrate in a variety of industries at December 31, 2024 and December 31, 2023, respectively. At December 31, 2024, unfunded commitments related to these investments were
$4.6 million and $97.3 million related to the real-estate funds and other SBIC funds, respectively. SBIC funds are generally structured to operate for approximately 10 years. During the life of each SBIC fund, partners can request to withdraw from the
fund, and subsequently receive the balance of their investment as the underlying assets are liquidated over the remaining life of the fund. The Company has no current plans to withdraw from any of its SBIC funds.
For other limited partnerships without readily determinable fair values that do not qualify for the practical expedient, Cadence elected the
measurement alternative to account for these investments at their cost minus impairment, plus or minus changes resulting from observable price changes in orderly transactions for the identical or a similar investment of the same issuer. These
investments totaled $2.6 million and $2.4 million at December 31, 2024 and December 31, 2023, respectively. Other limited partnerships accounted for under the equity method totaled $8.7 million and $9.8 million at December 31, 2024 and December 31,
2023, respectively.
A summary of the Company’s investments in limited partnerships is presented as of the following periods:
| (In thousands) |
|
December 31, 2024 |
|
|
December 31, 2023 |
|
| Tax credit investments (amortized cost) |
|
$ |
387,339 |
|
|
$ |
361,990 |
|
| Limited partnerships accounted for under the fair value practical expedient of NAV |
|
|
118,710 |
|
|
|
94,998 |
|
| Limited partnerships without readily determinable fair values that do not qualify for the practical expedient of NAV accounted for under the cost method |
|
|
2,586 |
|
|
|
2,417 |
|
| Limited partnerships required to be accounted for under the equity method |
|
|
8,664 |
|
|
|
9,785 |
|
| Total investments in limited partnerships |
|
$ |
517,299 |
|
|
$ |
469,190 |
|
For equity investments carried at cost using the measurement alternative, during the year ended and as of December 31, 2024, there were two
write-downs for impairment totaling $119 thousand. During the year ended and as of December 31, 2023, there were no downward or upward adjustments to these investments for impairments or price changes from observable transactions. The carrying amount
of these equity investments in limited partnerships measured under this measurement alternative for the specified periods are as follows:
| |
|
Year Ended December 31, |
|
| (In thousands) |
|
2024 |
|
|
2023 |
|
| Carrying value at the beginning of the year |
|
$ |
2,417 |
|
|
$ |
1,968 |
|
| Impairments |
|
|
(119 |
) |
|
|
— |
|
| Reclassifications |
|
|
272 |
|
|
|
1,800 |
|
| Distributions |
|
|
(1,007 |
) |
|
|
(1,559 |
) |
| Contributions |
|
|
1,023 |
|
|
|
208 |
|
| Carrying value at the end of the year |
|
$ |
2,586 |
|
|
$ |
2,417 |
|
ITEM 9. CHANGES IN AND DISAGREEMENTS WITH ACCOUNTANTS ON ACCOUNTING AND FINANCIAL DISCLOSURE.
None.
ITEM 9A. CONTROLS AND PROCEDURES.
CONCLUSION REGARDING THE EFFECTIVENESS OF DISCLOSURE CONTROLS AND PROCEDURES
The Company, with the participation of its management, including the Company’s Chief Executive Officer and Chief Financial Officer, carried out an
evaluation of the effectiveness of the design and operation of its disclosure controls and procedures (as defined in Rules 13a-15(e) and 15d-15(e) under the Exchange Act) as of the end of the period covered by this Report.
Based upon that evaluation, and as of the end of the period covered by this Report, the Company’s Chief Executive Officer and Chief Financial
Officer concluded that the Company’s disclosure controls and procedures were effective in ensuring that information required to be disclosed in its reports that the Company files or submits to the Federal Reserve under the Exchange Act is recorded,
processed, summarized and reported on a timely basis, and to ensure that such information is accumulated and communicated to the Company’s management, including its Chief Executive Officer and Chief Financial Officer, as appropriate, to allow timely
decisions regarding required disclosures.
Pursuant to Section 404 of the Sarbanes-Oxley Act, the Company has included a report of management’s assessment of the design and operating
effectiveness of its internal controls over financial reporting as part of this Report. The Company’s independent registered public accounting firm reported on the effectiveness of the Company’s internal control over financial reporting. Management’s
report and the independent registered public accounting firm’s report are included in Item 8 of this Report under the captions entitled “Management’s Report on Internal Control Over Financial Reporting” and “Report of Independent Registered Public
Accounting Firm.”
CHANGES IN INTERNAL CONTROL OVER FINANCIAL REPORTING
There have been no changes in the Company’s internal control over financial reporting that occurred during the three months ended December 31,
2024, covered by this Report that materially affected, or are reasonably likely to materially affect, the Company’s internal control over financial reporting.
ITEM 9B. OTHER INFORMATION.
Pursuant to Item 408(a) of Regulation S-K, none of the Company’s directors or executive officers adopted, terminated or modified a Rule 10b5-1
trading arrangement or a non-Rule 10b5-1 trading arrangement during the three months ended December 31, 2024.
ITEM 9C. DISCLOSURE REGARDING FOREIGN JURISDICTIONS THAT PREVENT INSPECTIONS.
None.
PART III
ITEM 10. DIRECTORS, EXECUTIVE OFFICERS AND CORPORATE GOVERNANCE.
INFORMATION ABOUT OUR EXECUTIVE OFFICERS
The required information is incorporated herein by reference to the information under the captions “Directors and Executive Officers” and “Board
of Directors, Committees and Governance” in our Proxy Statement for the Annual Meeting of Shareholders to be held on April 23, 2025 (the “2025 Proxy Statement”), to be filed pursuant to Regulation 14A under the Exchange Act within 120 days of our
fiscal year end according to instructions from the Company’s primary federal banking regulator.
MATERIAL CHANGES TO PROCEDURES BY WHICH SECURITY HOLDERS MAY RECOMMEND NOMINEES
The Company has not made any material changes to the procedures by which its shareholders may recommend nominees to the Company’s Board of
Directors since the date of the Company’s Definitive Proxy Statement for its 2024 Annual Meeting of Shareholders.
CERTAIN CORPORATE GOVERNANCE DOCUMENTS
The Company has adopted a Code of Business Conduct and Ethics that applies to its directors, officers, and employees. The Company has also adopted
Corporate Governance Principles for its Board of Directors. These documents, as well as the links to charters of the Audit Committee, Executive Compensation and Stock Incentive Committee and Nominating and Corporate Governance Committee of the Board of
Directors, are available on the Investor Relations page of the Company’s website at https://ir.cadencebank.com under the tabs “Corporate Governance - Governance Documents” and “- Board Committees,” or shareholders may request a free copy of these
documents from:
Cadence Bank
Attn: Corporate Secretary
One Mississippi Plaza
201 South Spring Street
Tupelo, Mississippi 38804
(662) 680-2000
The Company intends to disclose any amendments to its Code, or any waiver from a provision of the Code for the Company’s principal executive
officer and senior financial officers on the Company’s Investor Relations website in lieu of any filing of such information on Form 8-K.
The other information required by this Item 10 will be presented in, and is incorporated herein by reference to, Cadence’s Definitive Proxy
Statement for the 2025 Annual Meeting of Shareholders which will be filed with the Company’s primary federal banking regulator within 120 days of our fiscal year end.
ITEM 11. EXECUTIVE COMPENSATION.
The information required by this Item 11 will be presented in, and is incorporated herein by reference to, Cadence’s Definitive Proxy Statement
for the 2025 Annual Meeting of Shareholders which will be filed with the Company’s primary federal banking regulator within 120 days of our fiscal year end.
ITEM 12. SECURITY OWNERSHIP OF CERTAIN BENEFICIAL OWNERS AND MANAGEMENT AND RELATED STOCKHOLDER MATTERS.
The following table provides information at December 31, 2024 with respect to compensation plans (including individual compensation arrangements)
under which shares of Company common stock are authorized for issuance:
| Plan Category |
|
Number of Securities
to be Issued upon
Exercise of
Outstanding Options,
Warrants and Rights |
|
|
Weighted-Average
Exercise Price of
Outstanding Options,
Warrants and Rights |
|
|
Number of Securities
Remaining Available for
Future Issuance under
Equity Compensation
Plans (excluding securities
related to column (a)) |
|
| |
|
(a) |
|
|
(b) |
|
|
(c) |
|
| Equity compensation plans approved by shareholders (1) |
|
|
— |
|
|
|
— |
|
|
|
4,500,000 |
|
|
(1) |
Excludes 247,537 restricted shares that were nonvested, 3,063,891 restricted stock units that were nonvested and 1,211,606 performance shares that were unearned at December 31, 2024. During the year ended December
31, 2024, equity compensation plans approved by shareholders included the Cadence Bank Equity Incentive Plan for Non-employee Directors, the Cadence Bank Long-Term Equity Incentive Plan, the 2021 Long-Term Equity Incentive Plan and the Amended
and Restated 2015 Omnibus Incentive Plan. On December 30, 2024, the Cadence Bank 2025 Long-Term Incentive Plan (“the 2025 Plan”) was approved by the shareholders. The 2025 Plan supersedes all four of the incentive plans previously mentioned and
was effective on December 30, 2024. |
The other information required by this Item 12 will be presented in, and is incorporated herein by reference to, Cadence’s Definitive Proxy
Statement for the 2025 Annual Meeting of Shareholders which will be filed with the Company’s primary federal banking regulator within 120 days of December 31, 2024.
ITEM 13. CERTAIN RELATIONSHIPS AND RELATED TRANSACTIONS, AND DIRECTOR INDEPENDENCE.
The information required by this Item 13 will be presented in, and is incorporated herein by reference to Cadence’s Definitive Proxy Statement for
the 2025 Annual Meeting of Shareholders which will be filed with the Company’s primary federal banking regulator within 120 days of December 31, 2024.
ITEM 14. PRINCIPAL ACCOUNTANT FEES AND SERVICES.
The information required by this Item 14 will be presented in, and is incorporated herein by reference to Cadence’s Definitive Proxy Statement for
the 2025 Annual Meeting of Shareholders which will be filed with the Company’s primary federal banking regulator within 120 days of December 31, 2024.
PART IV
ITEM 15. EXHIBITS AND FINANCIAL STATEMENT SCHEDULES.
|
(a) |
The following documents are filed as part of this Annual Report on Form 10-K: |
l. Consolidated Financial Statements. Reference is made to Part II, Item 8, of this Annual Report on Form 10-K.
2. Consolidated Financial Statement Schedules. These schedules are omitted as the required information is inapplicable or the information is
presented in the consolidated financial statements or related notes.
3. Exhibits. The exhibits to this Annual Report on Form 10-K listed below have been included only with the copy of this report filed with the
federal banking regulators.
(2)
|
a) |
Agreement and Plan of Merger, dated as of April 12, 2021, and as amended on May 27, 2021, by and between BancorpSouth Bank and Cadence Bancorporation. (Filed as Annex A to the Company’s Definitive Proxy
Statement/Prospectus on Schedule 14A filed with the FDIC on July 7, 2021, and incorporated herein by reference thereto). |
|
b) |
Stock Purchase Agreement, dated as of October 24, 2023, by and among Cadence Bank, Cadence Insurance, Inc., Arthur J. Gallagher Risk Management Services, LLC and Arthur J. Gallagher & Co. (solely for purposes of
Section 12.16 thereof). (Filed as Exhibit 2.1 to the Company’s Current Report on Form 8-K filed with the FDIC on October 26, 2023, and incorporated herein by reference thereto). |
(3)
|
a) |
Second Amended and Restated Articles of Incorporation of the Company. (Filed as Exhibit 3.1 to the Company’s Current Report on Form 8-K filed with the Board of Governors of the Federal Reserve System on January 3,
2025, and incorporated herein by reference thereto). |
|
b) |
Second Amended and Restated Bylaws of the Company. (Filed as Exhibit 3.2 to the Company’s Current Report on Form 8-K filed with the Board of Governors of the Federal Reserve System on January 3, 2025, and
incorporated herein by reference thereto). |
(4)
|
a) |
Specimen Common Stock Certificate. (Filed as Exhibit 4.2 to the Company’s Current Report on Form 8-K filed with the FDIC on November 1, 2017, and incorporated herein by reference thereto). |
|
b) |
Form of Certificate Representing the Series A Preferred Stock. (Filed as Exhibit 4.1 to the Company’s Form 8-A filed with the FDIC on November 20, 2019, and incorporated herein by reference thereto). |
|
c) |
Fiscal and Paying Agency Agreement, dated November 20, 2019, between BancorpSouth Bank and U.S. Bank National Association. (Filed as Exhibit 4.2 to the Company’s Form 8-A filed with the FDIC on November 20, 2019, and
incorporated herein by reference thereto). |
|
d) |
Form of Global Subordinated Note, dated November 20, 2019, made by BancorpSouth Bank. (Filed as Exhibit 4.3 to the Company’s Form 8-A filed with the FDIC on November 20, 2019, and incorporated herein by reference
thereto). |
|
e) |
Description of the Company’s Capital Stock. (Filed as Exhibit 4(e) to the Company’s Form 10-K filed with the FDIC on February 27, 2020, and incorporated herein by reference thereto). |
(10)
|
a) |
BancorpSouth, Inc. Supplemental Executive Retirement Plan, as amended and restated. (Filed with the SEC as Exhibit 10(A) to the Company’s Annual Report on Form 10-K for the year ended December 31, 2008 (file number
1-12991) and incorporated herein by reference thereto). † |
|
b) |
Amendment to the BancorpSouth, Inc. Supplemental Executive Retirement Plan. (Filed with the SEC as Exhibit 10(a) to the Company’s Quarterly Report on Form 10-Q for the three months ended September 30, 2012 (file
number 1-12991) and incorporated herein by reference thereto). † |
|
c) |
Amended and Restated BancorpSouth Bank Long-Term Equity Incentive Plan. (Filed as Exhibit 10(c) to the Company’s Annual Report on Form 10-K for the year ended December 31, 2020 filed with the FDIC on February 25,
2021 and incorporated herein by reference thereto). † |
|
d) |
BancorpSouth, Inc. Amended and Restated Executive Performance Incentive Plan., effective January 1, 2020 (Filed as Exhibit 10(e) to the Company’s Annual Report on Form 10-K filed with the FDIC on February 27, 2020
and incorporated herein by reference thereto). † |
|
e) |
Form of Performance Share Award Agreement. (Filed as Exhibit 10.2 to the Company’s Current Report on Form 8-K filed with the SEC on March 7, 2007 (file number 1-12991) and incorporated herein by reference thereto). † |
|
f) |
Form of Long-Term Equity Incentive Plan Restricted Stock Agreement. (Filed with the SEC as Exhibit 10(E) to the Company’s Quarterly Report on Form 10-Q for the three months ended March 31, 2013 (file number 1-12991)
and incorporated herein by reference thereto). † |
|
g) |
Amended and Restated BancorpSouth Equity Incentive Plan for Non-Employee Directors. (Filed as Exhibit 10(g) to the Company’s Annual Report on Form 10-K for the year ended December 31, 2020 filed with the FDIC on
February 25, 2021 and incorporated herein by reference thereto). † |
|
h) |
Amendment to BancorpSouth, Inc. Long-Term Equity Incentive Plan. (Filed with the SEC as Exhibit 10(D) to the Company’s Annual Report on Form 10-K for the year ended December 31, 2014 (file number 1-12991) and
incorporated herein by reference thereto). † |
|
i) |
BancorpSouth, Inc. Restoration Plan, as amended and restated. (Filed with the SEC as Exhibit 10(F) to the Company’s Annual Report on Form 10-K for the year ended December 31, 2008 (file number 1-12991) and
incorporated herein by reference thereto). † |
|
j) |
BancorpSouth, Inc. Amended and Restated Deferred Compensation Plan. (Filed with the SEC as Exhibit 10(G) to the Company’s Annual Report on Form 10-K for the year ended December 31, 2008 (file number 1-12991) and
incorporated herein by reference thereto). † |
|
k) |
Description of Dividend Reinvestment Plan. (Filed with the SEC as the Company’s prospectus pursuant to Rule 424(b)(2) filed on January 5, 2004 (Registration No. 033-03009) and incorporated herein by reference
thereto). † |
|
l) |
Form of BancorpSouth Bank Change in Control Agreement. (Filed as Exhibit 10(t) to the Company’s Annual Report on Form 10-K filed with the FDIC on February 27, 2020). † |
|
m) |
BancorpSouth, Inc. Deferred Directors’ Fee Unfunded Plan, as amended and restated. (Filed with the SEC as Exhibit 10(U) to the Company’s Annual Report on Form 10-K for the year ended December 31, 2008 (file number
1-12991) and incorporated herein by reference thereto). † |
|
n) |
BancorpSouth Split Dollar Life Insurance Plan, as amended and restated. (Filed as Exhibit 10(gg) to the Company’s Annual Report on Form 10-K filed with the FDIC on February 26, 2018 and incorporated herein by
reference thereto). † |
|
o) |
Cadence Bank, N.A. Consent Order, dated August 30, 2021. (Filed as Exhibit 10(s) to the Company’s Annual Report on Form 10-K filed with the FDIC on February 25, 2022 and incorporated herein by reference thereto). |
|
p) |
Letter Agreement, dated as of April 12, 2021, by and between BancorpSouth Bank and James D. Rollins, III. (Filed as Exhibit 10.1 to the Company’s Current Report on Form 8-K filed with the FDIC on April 16, 2021 and
incorporated herein by reference thereto). † |
|
q) |
Letter Agreement, dated as of April 12, 2021, by and between BancorpSouth Bank and Chris A. Bagley. (Filed as Exhibit 10.2 to the Company’s Current Report on Form 8-K filed with the FDIC on April 16, 2021 and
incorporated herein by reference thereto). † |
|
r) |
Letter Agreement, dated as of April 12, 2021, by and between BancorpSouth Bank and Rudolph H. Holmes, IV. (Filed as Exhibit 10.4 to the Company’s Current Report on Form 8-K filed with the FDIC on April 16, 2021 and
incorporated herein by reference thereto). † |
|
s) |
Letter Agreement, dated as of April 12, 2021, by and between BancorpSouth Bank and Valerie C. Toalson. (Filed as Exhibit 10.5 to the Company’s Current Report on Form 8-K filed with the FDIC on April 16, 2021 and
incorporated herein by reference thereto). † |
|
t) |
Amendment to the BancorpSouth Amended and Restated Long-Term Equity Incentive Plan. (Filed as Exhibit 99.1 to the Company’s Current Report on Form 8-K filed with the FDIC on March 11, 2021). † |
|
u) |
BancorpSouth 2021 Long-Term Equity Incentive Plan. (Filed as Exhibit 10.1 to the Company’s Current Report on Form 8-K filed with the FDIC on April 30, 2021 and incorporated herein by reference thereto). † |
|
v) |
Form of Retention Award Agreement for Performance Units issued pursuant to the BancorpSouth Bank 2021 Long-Term Equity Incentive Plan. (Filed as Exhibit 10.1 to the Company’s Current Report on Form 8-K filed with the
FDIC on October 29, 2021 and incorporated herein by reference thereto). |
|
w) |
Form of Retention Award Agreement for Performance Units issued pursuant to the BancorpSouth Bank 2021 Long-Term Equity Incentive Plan. (Filed as Exhibit 10.2 to the Company’s Current Report on Form 8-K filed with the
FDIC on October 29, 2021 and incorporated herein by reference thereto). |
|
x) |
Retirement and Consulting Agreement, dated December 15, 2023, by and between Cadence Bank and Michael Meyer.(Filed as Exhibit 10(ac) to the Company’s Annual Report on Form 10-K filed with the FDIC on February 23,
2024, and incorporated herein by reference thereto). † |
|
y) |
Change in Control Agreement, effective January 1, 2024, by and between Cadence Bank and Edward H. Braddock. (Filed as Exhibit 10(ad) to the Company’s Annual Report on Form 10-K filed with the FDIC on February 23,
2024, and incorporated herein by reference thereto).† |
|
z) |
Cadence Bank 2025 Long-Term Incentive Plan. (Filed as Appendix B to the Company’s 2024 Notice of Special Meeting and Proxy Statement on Form DEF 14A filed with the Board of Governors of the Federal Reserve System on
November 19, 2024 and incorporated herein by reference thereto). |
|
(19) |
Cadence Bank Insider Trading Policy.* |
|
(21) |
Subsidiaries of the Registrant.* |
|
(31.1) |
Certification of the Chief Executive Officer of Cadence Bank pursuant to Rule 13a-14 or 15d-14 of the Securities Exchange Act of 1934, as amended, as adopted pursuant to Section 302 of the Sarbanes-Oxley Act of
2002.* |
|
(31.2) |
Certification of the Chief Financial Officer of Cadence Bank pursuant to Rule 13a-14 or 15d-14 of the Securities Exchange Act of 1934, as amended, as adopted pursuant to Section 302 of the Sarbanes-Oxley Act of
2002.* |
|
(32.1) |
Certification of the Chief Executive Officer of Cadence Bank pursuant to 18 U.S.C. Section 1350, as adopted pursuant to Section 906 of the Sarbanes-Oxley Act of 2002.** |
|
(32.2) |
Certification of the Chief Financial Officer of Cadence Bank pursuant to 18 U.S.C. Section 1350, as adopted pursuant to Section 906 of the Sarbanes-Oxley Act of 2002.** |
|
(97.1) |
Cadence Bank Clawback Policy. (Filed as Exhibit 97.1 to the Company’s Annual Report on Form 10-K filed with the FDIC on February 23, 2024, and incorporated herein by reference thereto). |
|
(b) |
Exhibits - See exhibit index included in Item 15(a)3 of this Annual Report on Form 10-K. |
|
(c) |
Financial Statement Schedules - See Item 15(a)2 of this Annual Report on Form 10-K. |
|
† |
Management contract or compensatory plan or arrangement. |
ITEM 16. FORM 10-K SUMMARY.
None.
SIGNATURES
Pursuant to the requirements of Section 13 or 15(d) of the Securities Exchange Act of 1934, the registrant has duly caused this report to be
signed on its behalf by the undersigned, thereunto duly authorized.
| |
|
CADENCE BANK |
| |
|
|
|
| DATE: |
February 21, 2025 |
By: |
/s/ James D. Rollins III |
| |
|
|
James D. Rollins III |
| |
|
|
Chief Executive Officer |
Pursuant to the requirements of the Securities Exchange Act of 1934, this report has been signed below by the following persons on behalf of the
registrant and in the capacities and on the dates indicated.
| /s/ James D. Rollins III |
|
Chief Executive Officer (Principal |
February 21, 2025 |
| James D. Rollins III |
|
Executive Officer) and Chairman |
|
| |
|
|
|
| /s/ Valerie C. Toalson |
|
Chief Financial Officer and |
February 21, 2025 |
| Valerie C. Toalson |
|
President - Banking Services |
|
| |
|
(Principal Accounting Officer) |
|
| |
|
|
|
| /s/ Fernando G. Araujo |
|
Director |
February 21, 2025 |
| Fernando G. Araujo |
|
|
|
| |
|
|
|
| /s/ Shannon A. Brown |
|
Director |
February 21, 2025 |
| Shannon A. Brown |
|
|
|
| |
|
|
|
| /s/ Deborah M. Cannon |
|
Director |
February 21, 2025 |
| Deborah M. Cannon |
|
|
|
| |
|
|
|
| /s/ Charlotte N. Corley |
|
Director |
February 21, 2025 |
| Charlotte N. Corley |
|
|
|
| |
|
|
|
| /s/ Joseph W. Evans |
|
Lead Independent Director |
February 21, 2025 |
| Joseph W. Evans |
|
|
|
| |
|
|
|
| /s/ Virginia A. Hepner |
|
Director |
February 21, 2025 |
| Virginia A. Hepner |
|
|
|
| |
|
|
|
| /s/ William G. Holliman |
|
Director |
February 21, 2025 |
| William G. Holliman |
|
|
|
| |
|
|
|
| /s/ Warren A. Hood Jr. |
|
Director |
February 21, 2025 |
| Warren A. Hood Jr. |
|
|
|
| |
|
|
|
| /s/ Keith J. Jackson |
|
Director |
February 21, 2025 |
| Keith J. Jackson |
|
|
|
| |
|
|
|
| /s/ Precious W. Owodunni |
|
Director |
February 21, 2025 |
| Precious W. Owodunni |
|
|
|
| |
|
|
|
| /s/ Alan W. Perry |
|
Director |
February 21, 2025 |
| Alan W. Perry |
|
|
|
| |
|
|
|
| /s/ Alice L. Rodriguez |
|
Director |
February 21, 2025 |
| Alice L. Rodriguez |
|
|
|
| |
|
|
|
| /s/ Marc J. Shapiro |
|
Director |
February 21, 2025 |
| Marc J. Shapiro |
|
|
|
| |
|
|
|
| /s/ Thomas R. Stanton |
|
Director |
February 21, 2025 |
| Thomas R. Stanton |
|
|
|
EXHIBIT 19
CADENCE BANK
INSIDER TRADING POLICY
Cadence Bank (the Company[1]) encourages its
directors, officers and employees to participate in the Company’s future by investing in the Company’s securities. However, you should be aware that you may be subject to substantial liability and penalties under federal securities laws for the
illegal use of material, nonpublic information in connection with the purchase or sale of the Company’s securities. You may also become subject to these penalties if you pass or “tip” material, nonpublic information to others, even if you don’t trade
in the Company’s securities or benefit from the trades of others.
These penalties could include criminal fines of, currently as much as $5,000,000, a civil penalty of up to three times the profit gained or the loss avoided from the illegal trade
and a prison term of up to 25 years. You could also be charged with wire or mail fraud. The penalties for the Company and its supervisory personnel, if they fail to take appropriate steps to prevent illegal insider trading, currently include a civil
penalty of up to the greater of $1,000,000 or three times the profit gained or loss avoided as a result of the violation and a criminal penalty of up to $25,000,000.
You should keep in mind that, in the event that your securities transactions become the subject of scrutiny, they will be viewed after-the-fact with the benefit of hindsight. As a
result, before engaging in any transaction, you should carefully consider how the Securities and Exchange Commission (SEC) and others might view your transaction in hindsight.
The Company has adopted this Policy to help avoid even the appearance of the illegal use of material, nonpublic information by anyone employed by or associated with the Company,
including its directors, officers, employees, “principal stockholders” or any other person who from time to time has access to material, nonpublic information regarding the Company by virtue of their position (collectively, Insiders). The restrictions
of this Policy on the use of material, nonpublic information also apply to Insiders’ immediate family members[2] and other persons living in Insiders’ households, and Insiders are responsible for compliance by these individuals with this Policy.
Please note that violations of the provisions of this Policy may be grounds for disciplinary action, including dismissal.
|
1. |
No Trading While in Possession of Material, Nonpublic Information.
|
If you possess any material, nonpublic information relating to the Company, then you may not trade in the Company’s securities (other than pursuant to a pre-approved trading plan
that complies with Rule 10b5-1 under the Securities Exchange Act of 1934, as amended (the Exchange Act), which is discussed below), or engage in any other action to take advantage of that information. “Securities” include not only stocks, bonds, notes
and debentures, but also options, warrants and similar instruments.
In addition, neither you nor any related person may communicate or “tip” any material, nonpublic information to others. For purposes of this Policy:
|
a. |
“Material” information is any information that a reasonable investor would consider important in a decision to buy, sell, or hold securities. Any information that could reasonably be expected to affect the price of the Company’s securities
should be considered material. Both positive and negative information may be material. Common examples of information that will frequently be regarded as material, include, but are not limited to the following:
|
|
(i) |
significant acquisitions;
|
|
(ii) |
matters involving significant new products or services;
|
|
(iii) |
matters relating to new financing;
|
|
(iv) |
gain or loss of a substantial vendor or customer;
|
|
(v) |
entering into a significant contract;
|
|
(vi) |
projections by a corporation’s officers of future earnings or losses;
|
|
(vii) |
significant write-down in assets or increases in reserves;
|
|
(viii) |
a pending or proposed merger or acquisition, or a tender offer or exchange offer;
|
|
(ix) |
information about a major joint venture;
|
|
(x) |
a significant sale of assets;
|
|
(xi) |
changes in dividend policies, the declaration of a stock split or the offering of additional securities;
|
|
(xii) |
impending bankruptcy or financial liquidity problems;
|
|
(xiii) |
changes in management;
|
|
(xiv) |
significant litigation;
|
|
(xv) |
significant cybersecurity incidents; or
|
|
(xvi) |
matters required to be disclosed on a Form 8-K.
|
|
b. |
“Nonpublic” information is information that is not generally available to the public. Whether information is generally available to the public is a question of fact.
|
It is improper for you to trade the Company’s securities before the public has had a reasonable opportunity to receive and consider a public announcement by the Company of
material, nonpublic information, including earnings releases. The Company believes that, as a rule of thumb, information about the Company will be generally known to the public once two full business days have elapsed from the date of its release by
public announcement or press release. Therefore, if you are aware of material, nonpublic information, you may not trade in the Company’s securities until the information has been available to the public for two full business days. For example, if a
public announcement or press release of material, nonpublic information is made or issued before the market opens on a Monday, you would not be permitted to trade until the following Wednesday. Likewise, if an announcement is made after the market
closes on a Friday, you would not be permitted to trade until the following Wednesday.
This Policy also applies to material, nonpublic information relating to any other company obtained in the course of employment or association with the Company.[3]
The restrictions in this Policy also apply to your transactions in the Company’s securities even after your employment or position with the Company has ceased. If you are in
possession of material, nonpublic information when your employment or position terminates, you may not trade in the Company’s securities until that information has become public or is no longer material.
Transactions that may be necessary or justifiable for independent reasons (such as the need to raise money for an emergency expenditure) are no exception to full compliance with
this Policy. Even the appearance of an improper transaction must be avoided to preserve the Company’s reputation for adhering to the highest standards of conduct.
|
2. |
Restrictions on Distribution of Information about the Company.
|
The Company is required under federal securities laws to avoid the selective disclosure of material, nonpublic information. You may not disclose information to anyone outside the
Company, including immediate family members, friends or acquaintances, other than in accordance with procedures established by the Company. You also may not discuss the Company or its business in or on an Internet “chat room,” message board, social
networking site or other similar forum under any circumstances.
|
3. |
Pre-Clearance of Trades by Executive Officers, Directors, and Certain Other Designated Insiders.
|
“Insiders” are those individuals in the Company’s leadership who are subject to blackout periods prior to earnings releases, or for other designated events. “Designated Insiders”
are a sub-group that includes those individuals on the Executive Management Committee, members of the Board of Directors, and the Company’s Chief Accounting Officer. An individual seeking confirmation of their status as either a Designated Insider or
an Insider should contact the Corporate Secretary.
To help avoid inadvertent violations and even the appearance of an improper transaction, Designated Insiders of the Company are subject to the Company’s pre-clearance procedures.
A Designated Insider(s) who desires to purchase, sell, gift or transfer the Company’s securities must so inform the Company’s Trading Approval Team in advance, and the transaction must be pre-cleared in advance by two members of the Trading Approval
Team, using the pre-clearing form, attached as Exhibit B to this Policy (the Pre-Clearing Form). The Trading Approval Team is comprised of the Chief Executive Officer, the Corporate Secretary and the Chief Legal Officer. No member of the Trading
Approval Team may pre-clear his or her own trade. For any transaction in the Company’s securities proposed by a member of the Company’s Executive Management Committee or the Board of Directors, one of the Trading Approval Team signatures must be from
the Chief Executive Officer. The Corporate Secretary shall be responsible for maintaining a record of all Pre-Clearing Forms submitted for approval. The Trading Approval Team is under no obligation to approve any trade submitted for pre-clearance.
Rule 10b5-1 under the Exchange Act provides a defense from insider trading liability if trades occur pursuant to a pre-arranged “trading plan” that meets specified conditions.
Any Designated Insider who wishes to implement a trading plan under Rule 10b5-1 must first pre-clear the plan with the Trading Approval Team using the Pre-Clearing Form, and any member of Executive Management Committee or the Board of Directors who
wishes to implement a Rule 10b5-1 trading plan must have their Pre-Clearing Form signed by the Chief Executive Officer as one of the members of the Trading Approval Team. The Company reserves the right, in its sole discretion, to determine not to
permit a Rule 10b5-1 trading plan for any or all of its Designated Insiders. Rule 10b5-1 trading plans are items which must be disclosed to the market for the Company, directors, and some officers. As required by Rule 10b5-1, you may enter into a
trading plan only when you are not in possession of material, nonpublic information, and there is a “cooling off” period between the date you adopt the plan and the date permitted for a “first trade” pursuant to the plan. In addition, you may not enter
into a trading plan during a blackout period. If you establish a trading plan, you must not exercise any subsequent discretion affecting the transactions, and if your broker or any other person exercises discretion in implementing the trades, you must
not influence his or her actions and he or she must not possess any material, nonpublic information at the time of the trades. Trading plans can be established for a single trade or a series of trades, but there are restrictions regarding the existence
of overlapping plans. Transactions effected pursuant to a pre-cleared trading plan will not require further pre-clearance at the time of the transaction if the plan specifies the dates, prices and amounts of the contemplated trades, or establishes a
formula for determining the dates, prices and amounts, in each case in full compliance with Rule 10b5-1.
Even if you are not an Insider, you are reminded that if you possess material, nonpublic information, you are still under the restrictions described elsewhere in this Policy.
|
4. |
“Blackout” Periods During Which Trading Should Not Occur.
|
Because of the potential materiality of the Company’s earnings results for each quarter, Insiders may not trade in the Company’s securities (other than pursuant to a pre-approved
trading plan that complies with Rule 10b5-1 under the Exchange Act) during the period that: (a) begins on the twenty-fifth day of the last month of a calendar quarter (March, June, September, December); and (b) ends after two full business days have
passed following the public release of the Company’s earnings information for that calendar quarter. The Company does not intend to pre-clear trades or pre-clear the implementation of a trading plan under Rule 10b5-1 by any Designated Insider occurring
during such periods.
Additionally, Designated Insiders of the Company may not trade in the publicly traded securities of the Company for any period of more than three consecutive business days during
which 50% or more of the participants or beneficiaries under all individual account plans (such as 401(k) plans) of the Company are restricted by the terms of such plans from purchasing, selling or otherwise acquiring or transferring an interest in any
equity security of the Company.
From time to time, an event may occur that is material to the Company and is known by only a few directors, officers and other employees. So long as the event remains material
and nonpublic, these Insiders may not trade in the Company’s securities. The existence of such an event-specific blackout will not be announced, other than to those aware of the event giving rise to the blackout. If, however, an Insider requests
permission to trade in the Company’s securities during an event-specific blackout, the Corporate Secretary will inform the requester of the existence of a restriction on trading without disclosing the reason for the blackout. Any person made aware of
the existence of an event-specific blackout should not disclose the existence of the blackout to any other person. Please note that the failure of the Corporate Secretary to designate a person as being subject to an event-specific blackout will not
relieve that person of the obligation not to trade while aware of material, nonpublic information.
|
5. |
Other Prohibited Transactions.
|
Because the Company believes that it is improper and inappropriate for any of its Insiders to engage in short-term or speculative transactions involving the Company’s securities,
except as provided below, Insiders are not permitted to engage in any of the following transactions with respect to the Company’s securities:
Short Sales. Short sales of the Company’s securities evidence an expectation on the part of the seller that the securities will decline in value, and therefore signal to
the market that the seller has no confidence in the Company or its short-term prospects. In addition, short sales may reduce the seller’s incentive to improve the Company’s performance. For these reasons, short sales of the Company’s securities by
Insiders are prohibited by this Policy. In addition, Section 16(c) of the Exchange Act prohibits officers and directors from engaging in short sales.
Puts, Calls and Other Derivative Securities. A transaction in options is, in effect, a bet on the short-term movement of the Company’s stock and therefore creates the
appearance that the director, officer or employee is trading based on inside information. Transactions in options also may focus the director’s, officer’s or employee’s attention on short-term performance at the expense of the Company’s long-term
objectives. Accordingly, this Policy prohibits transactions in puts, calls or other derivative securities, on an exchange or in any other organized market, by Insiders. Option positions arising from certain types of hedging transactions are governed by
the following paragraph captioned “Hedging Transactions.”
Hedging Transactions. Certain forms of hedging or monetization transactions, such as zero-cost collars and forward sale contracts, allow a person to lock in much of the
value of his or her stock holdings, often in exchange for all or part of the potential for upside appreciation in the stock. These transactions allow an individual to continue to own the covered securities, but without the full risks and rewards of
ownership. When that occurs, the individual utilizing such transactions may no longer have the same objectives as the Company’s other shareholders. Therefore, Insiders are prohibited from engaging in any such transactions.
Margin Transactions; Pledges. Securities held in a margin account may be sold by the broker without the customer’s consent if the customer fails to meet a margin call.
Similarly, securities pledged (or hypothecated) as collateral for a loan may be sold in foreclosure if the borrower defaults on the loan. Because a margin sale or foreclosure sale may occur at a time when the pledgor is aware of material, nonpublic
information, or otherwise is not permitted to trade in the Company’s securities, the following individuals affiliated with the Company are prohibited from holding the Company’s securities in a margin account or pledging securities of the Company as
collateral for a loan: (a) directors; (b) the Chief Executive Officer; (c) the Chief Financial Officer; (d) each other individual identified as a “Named Executive Officer” for at least one of the last three fiscal years reported in the “Summary
Compensation Table” in the most recent proxy statement filed by the Company; and (e) each other executive officer of the Company who files reports of ownership under Section 16 of the Exchange Act.
|
6. |
Exceptions for Certain Transactions Under Company Plans.
|
Stock Option Exercises. This Policy does not prohibit the exercise of a stock option granted under one of the Company’s stock option plans, or to the exercise of a tax
withholding right pursuant to which you elect to have the Company withhold shares subject to an option to satisfy tax withholding requirements. This Policy does apply, however, to any sale of the Company’s securities as part of a broker-assisted
cashless exercise of an option, or any other market sale for the purpose of generating the cash needed to pay the exercise price of an option. This Policy also applies to any sale of the Company’s common stock or other securities acquired upon exercise
of an option.
401(k) Plan. This Policy does not prohibit purchases of shares of the Company’s common stock through a Company stock fund offered through the Company’s 401(k) plan which
result from your periodic contribution of money to the 401(k) plan pursuant to your payroll deduction election. This Policy does apply, however, to certain elections you may make under the 401(k) plan, including: (a) an election to increase or decrease
the percentage of your periodic contributions that will be allocated to the Company stock fund; (b) an election to make an intra-plan transfer of an existing account balance into or out of the Company stock fund; (c) an election to borrow money against
your 401(k) plan account if the loan will result in a liquidation of some or all of your Company stock fund balance; and (d) your election to pre-pay a plan loan if the pre-payment will result in allocation of loan proceeds to the Company stock fund.
|
7. |
Section 16 Compliance.
|
Certain of the Company’s officers, directors and “principal stockholders” (as defined in the Exchange Act) have additional compliance requirements pursuant to Section 16 of the
Exchange Act, including the filing of Forms 3, 4 and 5 to report holdings and trades of the Company’s equity securities. Generally, if one of these Designated Insiders buys, sells, or gifts shares of the Company’s common stock, or is granted or
exercises options to purchase shares of the Company’s common stock, the Designated Insider must report the transaction to the Company’s federal regulators on a Form 4 within two business days of the date of the transaction. The Company’s Corporate
Secretary, in consultation with the Company’s legal counsel, would be pleased to assist these Insiders in preparing and filing Section 16 reports at the Designated Insiders’ request. Designated Insiders who are subject to the requirements of Section 16
should recognize, however, that they remain ultimately responsible for the correct and timely filing of their Section 16 reports, as well as their compliance with the other requirements and restrictions of Section 16. If a Designated Insider intends to
sell Company common stock, he or she must arrange for their broker to file a Form 144 if required.
To improve compliance with Section 16 reporting deadlines, the SEC requires public companies (including the Company) to report in their annual proxy statements the names of those
insiders subject to Section 16 reporting who failed to timely file Section 16 reports. In addition, the SEC has brought enforcement actions against corporate insiders in connection with the insiders’ failure to file Section 16 reports. Any person who
willfully fails to file a report which he or she knew was required under Section 16 or who willfully misrepresents information reported under Section 16 may be subject to criminal penalties (including imprisonment and fines), in addition to SEC
enforcement orders and possible civil liability.
To help ensure compliance with the requirements of Section 16, if any covered officer, director or principal stockholder is aware of any trades in the securities of the Company
which he or she has made but which have not been reported to the Company and/or to the federal regulators on a Form 4 or, at the end of a calendar year, a Form 5, please contact the Corporate Secretary of the Company so that the information may be
reported to the federal regulators.
|
8. |
Annual Certifications.
|
To help ensure continued compliance with this Policy, each employee must make an Annual Certification through the Company’s online training module that they have read and will
comply with this Policy (sample attached as Exhibit A).
If you have any questions regarding this Policy or any of the matters covered herein, please contact the Company’s Corporate Secretary, who may be reached by email at
corporate.secretary@cadencebank.com, or at Cadence Bank, 201 South Spring Street, Tupelo, Mississippi 38804.
|
[1] |
The term Company or the Bank means Cadence Bank and its subsidiaries and their affiliates.
|
|
[2] |
The term “immediate family member” of you or an Insider includes your or the Insider’s spouse, parents, step-parents, children, step-children, siblings, mothers and fathers-in-law, sons and
daughters-in-law, brothers and sisters-in-law, or anyone (other than domestic employees or tenants) who share your home or the Insider’s home. The term does not consider individuals who are no longer immediate family members as a result of
legal separation or divorce, or those who have died or become incapacitated.
|
|
[3] |
The SEC has also successfully prosecuted individuals for insider trading where the individual traded in the securities of a competitor based on inside information about its own company. These
insider-trading theories are akin to use of material non-public information for the purpose of exploiting or manipulating the market.
|
Exhibit A
CADENCE BANK
INSIDER TRADING POLICY
ANNUAL CERTIFICATION SAMPLE
|
a.
|
I have been provided with a copy of the Insider Trading Policy (the Policy) of Cadence Bank (the Company). I have read and understand the Policy. I understand that my failure to comply in all respects with the
Company’s policies, including the Policy, is the basis for disciplinary action, including termination of my employment or position with the Company.
|
|
b.
|
Since the date of my last certification, or such shorter period of time that I have been an employee of or associated with the Company, I have complied with the Policy.
|
|
c.
|
I will continue to comply with the Policy for as long as I am subject to the Policy.
|
Exhibit B
Pre-Clearance Approval Form
Pursuant to the Cadence Bank Insider Trading Policy, directors, executive officers and designated employees (“Designated Insiders”) of Cadence Bank and its subsidiaries (collectively, the “Company”) who have access to
material nonpublic information about the Company must comply with pre-clearance procedures and are subject to blackout periods. Regardless of whether pre-clearance is granted, you may not conduct a transaction if you are aware of any material nonpublic
information about the Company. If you have any questions, please contact Cathy Freeman, Corporate Secretary, to discuss. This policy and pre-clearance process also applies to gift transactions. In addition, the shareholder must contact their broker to
file a Form 144, if required, for any transaction involving a sale.
To obtain pre-clearance, please complete the information below, sign, scan and email a copy to Cathy Freeman (cathy.freeman@cadencebank.com), who will obtain signatures from two members of the Trading Approval Team
members within two business days and return a signed copy of this Pre-Clearance Approval Form to you.
|
Name:
|
|
|
|
Date: |
|
Registered Owner (if not held in your name):
|
|
|
|
|
| Planned Transaction: |
|
Purchase |
|
|
Exercise options and pay cash
|
|
|
Gift
|
|
Sale
|
|
|
Exercise options and sell stock
|
|
|
Entry into 10b5-1 Plan
|
|
Other:
|
|
|
|
|
|
|
|
Estimated Number of Shares or dollar amount of transaction:
|
|
|
If checked, Designated Insider certifies that there are no opposite-way transactions that occurred within the last six months; a Form 4 must be filed within 2 business days of
the purchase, sale, or gift; and, if a sale, Rule 144 must be observed (including filing a Form 144 if sale of more than 5,000 shares or $50,000 in three-month period).
|
|
Approval by Trading Approval Team Members:
|
| Transaction must occur by close of business on |
|
|
(the earlier of 10 business days after approval was granted and the first day of the next quarterly blackout period), unless notified by a member of the Trading Approval Team that the trading
window has been closed early.
EXHIBIT 21
SUBSIDIARIES OF THE REGISTRANT
|
Name
|
Jurisdiction of Incorporation/
Organization
|
Holder of Ownership Interests
|
|
Cadence Holdings, Inc.
|
Mississippi
|
Cadence Bank
|
|
Cadence Community Capital, LLC
|
Mississippi
|
Cadence Bank
|
|
Cadence Investor, LLC
|
Mississippi
|
Cadence Bank
|
|
Linscomb Wealth, Inc.
|
Texas
|
Cadence Bank
|
EXHIBIT 31.1
CADENCE BANK
CERTIFICATION PURSUANT TO RULE 13a-14 OR 15d-14 OF THE SECURITIES
EXCHANGE ACT OF 1934, AS AMENDED, AS ADOPTED PURSUANT TO
SECTION 302 OF THE SARBANES-OXLEY ACT OF 2002
I, James D. Rollins III, certify that:
1.
|
|
I have reviewed this annual report on Form 10-K (“this report”) of Cadence Bank;
|
2.
|
|
Based on my knowledge, this report does not contain any untrue statement of a material fact or omit to state a material fact necessary to make the statements made, in light of the circumstances under which such statements were made, not
misleading with respect to the period covered by this report;
|
3.
|
|
Based on my knowledge, the financial statements, and other financial information included in this report, fairly present in all material respects the financial condition, results of operations and cash flows of the registrant as of, and for,
the periods presented in this report;
|
4.
|
|
The registrant’s other certifying officer and I are responsible for establishing and maintaining disclosure controls and procedures (as defined in Exchange Act Rules 13a-15(e) and 15d-15(e)) and internal control over financial reporting (as
defined in Exchange Act Rules 13a-15(f) and 15d-15(f)) for the registrant and have:
|
(a) Designed such disclosure controls and procedures, or caused such disclosure controls and procedures to be designed under our supervision, to ensure that material
information relating to the registrant, including its consolidated subsidiaries, is made known to us by others within those entities, particularly during the period in which this report is being prepared;
(b) Designed such internal control over financial reporting, or caused such internal control over financial reporting to be designed under our supervision, to provide
reasonable assurance regarding the reliability of financial reporting and the preparation of financial statements for external purposes in accordance with generally accepted accounting principles;
(c) Evaluated the effectiveness of the registrant’s disclosure controls and procedures and presented in this report our conclusions about the effectiveness of the
disclosure controls and procedures, as of the end of the period covered by this report based on such evaluation; and
(d) Disclosed in this report any change in the registrant’s internal control over financial reporting that occurred during the registrant's most recent fiscal quarter
(the registrant’s fourth fiscal quarter in the case of an annual report) that has materially affected, or is reasonably likely to materially affect, the registrant’s internal control over financial reporting; and
5.
|
|
The registrant's other certifying officer and I have disclosed, based on our most recent evaluation of internal control over financial reporting, to the registrant's auditors and the audit committee of the registrant’s Board of Directors (or
persons performing the equivalent functions):
|
(a) All significant deficiencies and material weaknesses in the design or operation of internal control over financial reporting which are reasonably likely to
adversely affect the registrant's ability to record, process, summarize and report financial information; and
(b) Any fraud, whether or not material, that involves management or other employees who have a significant role in the registrant's internal control over financial
reporting.
Date: February 21, 2025
| |
/s/ James D. Rollins III
|
| |
James D. Rollins III
Chief Executive Officer
|
EXHIBIT 31.2
CADENCE BANK
CERTIFICATION PURSUANT TO RULE 13a-14 OR 15d-14 OF THE SECURITIES
EXCHANGE ACT OF 1934, AS AMENDED, AS ADOPTED PURSUANT TO
SECTION 302 OF THE SARBANES-OXLEY ACT OF 2002
I, Valerie C. Toalson, certify that:
1.
|
|
I have reviewed this annual report on Form 10-K (“this report”) of Cadence Bank;
|
2.
|
|
Based on my knowledge, this report does not contain any untrue statement of a material fact or omit to state a material fact necessary to make the statements made, in light of the circumstances under which such statements were made, not
misleading with respect to the period covered by this report;
|
3.
|
|
Based on my knowledge, the financial statements, and other financial information included in this report, fairly present in all material respects the financial condition, results of operations and cash flows of the registrant as of, and for,
the periods presented in this report;
|
4.
|
|
The registrant’s other certifying officer and I are responsible for establishing and maintaining disclosure controls and procedures (as defined in Exchange Act Rules 13a-15(e) and 15d-15(e)) and internal control over financial reporting (as
defined in Exchange Act Rules 13a-15(f) and 15d-15(f)) for the registrant and have:
|
(a) Designed such disclosure controls and procedures, or caused such disclosure controls and procedures to be designed under our supervision, to ensure that material
information relating to the registrant, including its consolidated subsidiaries, is made known to us by others within those entities, particularly during the period in which this report is being prepared;
(b) Designed such internal control over financial reporting, or caused such internal control over financial reporting to be designed under our supervision, to provide
reasonable assurance regarding the reliability of financial reporting and the preparation of financial statements for external purposes in accordance with generally accepted accounting principles;
(c) Evaluated the effectiveness of the registrant’s disclosure controls and procedures and presented in this report our conclusions about the effectiveness of the
disclosure controls and procedures, as of the end of the period covered by this report based on such evaluation; and
(d) Disclosed in this report any change in the registrant’s internal control over financial reporting that occurred during the registrant's most recent fiscal quarter
(the registrant’s fourth fiscal quarter in the case of an annual report) that has materially affected, or is reasonably likely to materially affect, the registrant’s internal control over financial reporting; and
5.
|
|
The registrant's other certifying officer and I have disclosed, based on our most recent evaluation of internal control over financial reporting, to the registrant's auditors and the audit committee of the registrant’s Board of Directors (or
persons performing the equivalent functions):
|
(a) All significant deficiencies and material weaknesses in the design or operation of internal control over financial reporting which are reasonably likely to
adversely affect the registrant's ability to record, process, summarize and report financial information; and
(b) Any fraud, whether or not material, that involves management or other employees who have a significant role in the registrant's internal control over financial
reporting.
Date: February 21, 2025
| |
/s/ Valerie C. Toalson
|
| |
Valerie C. Toalson
Chief Financial Officer and
President - Banking Services
(Principal Accounting Officer)
|
EXHIBIT 32.1
CADENCE BANK
CERTIFICATION PURSUANT TO
18 U.S.C. SECTION 1350,
AS ADOPTED PURSUANT TO
SECTION 906 OF THE SARBANES-OXLEY ACT OF 2002
In connection with this annual report on Form 10-K of Cadence Bank (the “Company”), for the year ended December 31, 2024, as filed with the Board of Governors of the Federal Reserve System on the date hereof (the
“Report”), I, James D. Rollins III, Chief Executive Officer of the Company, certify in my capacity as an executive officer of the Company, pursuant to 18 U.S.C. Sec. 1350, as adopted pursuant to Sec. 906 of the Sarbanes-Oxley Act of 2002, that to my
knowledge:
(1) The Report fully complies with the requirements of Section 13(a) or 15(d) of the Securities Exchange Act of 1934, as amended; and
(2) The information contained in the Report fairly presents, in all material respects, the financial condition and results of operations of the Company.
| February 21, 2025 |
/s/ James D. Rollins III
|
| |
James D. Rollins III
|
| |
Chief Executive Officer |
A signed original of this written statement required by Section 906 has been provided to the Company and will be retained by the Company and furnished to the Board of Governors of the Federal Reserve System or its staff upon request.
EXHIBIT 32.2
CADENCE BANK
CERTIFICATION PURSUANT TO
18 U.S.C. SECTION 1350,
AS ADOPTED PURSUANT TO
SECTION 906 OF THE SARBANES-OXLEY ACT OF 2002
In connection with this annual report on Form 10-K of Cadence Bank (the “Company”), for the year ended December 31, 2024, as filed with the Board of Governors of the Federal Reserve System on the date hereof (the
“Report”), I, Valerie C. Toalson, Chief Financial Officer of the Company, certify in my capacity as an executive officer of the Company, pursuant to 18 U.S.C. Sec. 1350, as adopted pursuant to Sec. 906 of the Sarbanes-Oxley Act of 2002, that to my
knowledge:
(1) The Report fully complies with the requirements of Section 13(a) or 15(d) of the Securities Exchange Act of 1934, as amended; and
(2) The information contained in the Report fairly presents, in all material respects, the financial condition and results of operations of the Company.
| February 21, 2025 |
/s/ Valerie C. Toalson
|
| |
Valerie C. Toalson
Chief Financial Officer and
President - Banking Services
(Principal Accounting Officer)
|
A signed original of this written statement required by Section 906 has been provided to the Company and will be retained by the Company and furnished to the Board of Governors of the Federal Reserve System or its staff upon request.
Exhibit 99.2
BOARD OF GOVERNORS OF THE
FEDERAL RESERVE SYSTEM
WASHINGTON, DC 20551
FORM 10-Q
(Mark One)
|
☒ |
QUARTERLY REPORT PURSUANT TO SECTION 13 OR 15(d) OF THE SECURITIES EXCHANGE ACT OF 1934 |
For the quarterly period ended March 31, 2025
OR
|
☐ |
TRANSITION REPORT PURSUANT TO SECTION 13 OR 15(d) OF THE SECURITIES EXCHANGE ACT OF 1934 |
For the transition period from ________________ to ________________
FDIC Certificate No. 11813
CADENCE BANK
(Exact name of registrant as specified in its charter)
| Mississippi |
|
| (State or other jurisdiction of incorporation or |
64-0117230 |
| organization) |
(I.R.S. Employer Identification No.) |
| |
|
| One Mississippi Plaza, 201 South Spring Street |
|
| |
38804 |
| Tupelo, Mississippi |
|
| (Address of principal executive offices) |
(Zip Code) |
Registrant’s telephone number, including area code: (662) 680-2000
Securities registered pursuant to Section 12(b) of the Act:
| Title of each class |
|
Trading Symbol(s) |
|
Name of each exchange on which registered |
| Common Stock, $2.50 par value per share |
|
CADE |
|
New York Stock Exchange |
| |
|
|
|
|
| 5.50% Series A Non-Cumulative Perpetual |
|
CADE PR A |
|
New York Stock Exchange |
| Preferred Stock, par value $0.01 per share |
|
|
|
|
Indicate by check mark whether the registrant: (1) has filed all reports required to be filed by Section 13
or 15(d) of the Securities Exchange Act of 1934 during the preceding 12 months (or for such shorter period that the registrant was required to file such reports), and (2) has been subject to such filing requirements for the past 90 days. Yes ☒ No
Indicate by check mark whether the registrant has submitted electronically every Interactive Data File
required to be submitted pursuant to Rule 405 of Regulation S-T (§232.405 of this chapter) during the preceding 12 months (or for such shorter period that the registrant was required to submit such files). Yes ☒ No
Indicate by check mark whether the registrant is a large accelerated filer, an accelerated filer, a
non-accelerated filer, a smaller reporting company, or an emerging growth company. See the definitions of “large accelerated filer,” “accelerated filer,” “smaller reporting company,” and “emerging growth company” in Rule 12b-2 of the Exchange Act.
| Large Accelerated Filer |
☒ |
Accelerated Filer |
☐ |
| Non-Accelerated Filer |
☐ |
Smaller Reporting Company |
☐ |
| |
|
Emerging Growth Company |
☐ |
If an emerging growth company, indicate by check mark if the registrant has elected not to use the extended transition
period for complying with any new or revised financial accounting standards provided pursuant to Section 13(a) of the Exchange Act. ☐
Indicate by check mark whether the registrant is a shell company (as defined in Rule 12b-2 of the Exchange Act). Yes ☐ No ☒
As of May 5, 2025, the registrant had outstanding 186,378,000 shares of common stock, par value $2.50 per share, and
6,900,000 shares of its 5.50% Series A Non-Cumulative Perpetual Preferred Stock, par value $0.01 per share.
TABLE OF CONTENTS
Glossary of Defined Terms
ACH - Automated Clearing House
ACL - Allowance for credit losses
AFS - Available for sale
AI - Artificial intelligence
ALM - Asset/liability management
ALCO - Asset/Liability Management Committee
AOCI - Accumulated other comprehensive income (loss)
ASC - Accounting Standards Codification
ASU - Accounting Standards Update
ATM - Automated teller machine
Basel III - Basel Committee’s 2010 Regulatory Capital Framework (Third Accord)
Basel Committee - Basel Committee on Banking Supervision
BHC Act - Bank Holding Company Act of 1956, as amended
Board - the Company’s Board of Directors
BOLI - Bank-owned life insurance
BTFP - Bank Term Funding Program
C&I - Commercial and industrial
CAD - Construction, acquisition and development
CAMT - Corporate alternative minimum tax rate
CDE - Community development entity
CECL - ASU 2016-13, Measurement of Credit Losses on Financial Instruments (“Current Expected Credit Losses”)
CEO - Chief Executive Officer
CET1 - Common Equity Tier 1
CFO - Chief Financial Officer
CFPB - Consumer Financial Protection Bureau
CIO - Chief Information Officer
CIS - Center for Internet Security
CISM - Certified Information Security Manager
CISO - Chief Information Security Officer
CISSP - Certified Information Systems Security Professional
Code - Code of Business Conduct and Ethics
CODM - Chief operating decision maker
Company - Cadence Bank and its subsidiaries
COO - Chief Operating Officer
COSO - Committee of Sponsoring Organizations of the Treadway Commission
COVID-19 - Coronavirus Disease 2019
CPR - Conditional Prepayment Rate
CRA - Community Reinvestment Act of 1977
CRE - Commercial real estate
CSC - Contractual servicing cost
DIF - Deposit Insurance Fund
DOJ - U.S. Department of Justice
EAP - Employee Assistance Program
EIR - Effective interest rate
EPS - Earnings per share
ESG - Environmental, Social and Governance
Exchange Act - Securities Exchange Act of 1934, as amended
EVE - Economic value of equity
FASB - Financial Accounting Standards Board
FCB - First Chatham Bank
FDI Act - Federal Deposit Insurance Act
FDIC - Federal Deposit Insurance Corporation
FDICIA - Federal Deposit Insurance Corporation Improvement Act of 1991
FDM - Financial difficulty modification
Federal Reserve - Board of Governors of the Federal Reserve System
FHA - Federal Housing Administration
FHLB - Federal Home Loan Bank
FHLMC - Federal Home Loan Mortgage Corporation
FinCEN - Financial Crimes Enforcement Network
FNMA - Federal National Mortgage Association
FRB - Federal Reserve Bank
FTE - Fully taxable equivalent
GAAP - Generally Accepted Accounting Principles in the United States
GNMA - Government National Mortgage Association
HTC - Historic tax credits
IRA of 2022 - Inflation Reduction Act of 2022
IRR - Interest rate risk
ITM - Interactive teller machine
MBS - Mortgage-backed securities
MDBCF - Mississippi Department of Banking and Consumer Finance
MSR - Mortgage servicing rights
NAV - Net asset value
NII - Net interest income
NM - Not meaningful
NMTC - New market tax credit
NPA - Nonperforming asset(s)
NPL - Nonperforming loan(s)
NSF - Nonsufficient funds
NYSE - New York Stock Exchange
OCC - Office of the Comptroller of the Currency
OREO - Other real estate owned
PCAOB - Public Company Accounting Oversight Board
PCD - Purchased credit deteriorated
Preferred Stock - 5.50% Series A Non-Cumulative Perpetual Preferred Stock, par value $0.01 per share, of the Company
PSU - Performance stock unit
ROU - Right of use
RSA - Restricted stock award
RSU - Restricted stock unit
SBA - Small Business Administration
SBIC - Small Business Investment Company
SEC - U.S. Securities and Exchange Commission
SNC - Shared National Credit
SOFR - Secured Overnight Financing Rate
TBA - To be announced
TDR - Troubled debt restructuring
USDA - U.S. Department of Agriculture
VA - U.S. Department of Veterans Affairs
VIE - Variable interest entity
CAUTIONARY NOTE REGARDING FORWARD LOOKING STATEMENTS
Certain statements made in this quarterly report on Form 10-Q (this “Report”) are not statements of historical fact and constitute
“forward-looking statements” within the meaning of Section 21E of the Exchange Act, and are subject to the safe harbor created thereby under the Private Securities Litigation Reform Act of 1995 as well as the “bespeaks caution” doctrine. These
statements are often, but not always, made through the use of words or phrases such as “anticipate,” “aspire,” “assume,” “believe,” “budget,” “contemplate,” “continue,” “could,” “estimate,” “expect,” “forecast,” “foresee,” “goal,” “hope,” “indicate,”
“intend,” “may,” “might,” “outlook,” “plan,” “project,” “projection,” “predict,” “prospect,” “potential,” “roadmap,” “seek,” “should,” “target,” “will,” and “would,” or the negative versions of those words, or other comparable words of a future or
forward-looking nature. These forward-looking statements may include, without limitation, discussions regarding general economic, interest rate, trade, real estate market, competitive, employment, and credit market conditions; our assets; business;
cash flows; financial condition; liquidity; prospects; results of operations and the Company’s ability to deploy capital into strategic and growth initiatives; deposit growth interest and fee-based revenue; capital resources; capital metrics;
efficiency ratio; valuation of mortgage servicing rights; mortgage production volume; net income; net interest revenue; non-interest revenue; net interest margin; interest expense; non-interest expense; earnings per share; interest rate sensitivity;
interest rate risk; balance sheet and liquidity management; off-balance sheet arrangements; fair value determinations; asset quality; credit quality; credit losses; provision and allowance for credit losses, impairments, charge-offs, recoveries and
changes in volume; investment securities portfolio yields and values; ability to manage the impact of pandemics and natural disasters; adoption and use of critical accounting policies; adoption and implementation of new accounting standards and their
effect on our financial results and our financial reporting; utilization of non-GAAP financial metrics; declaration and payment of dividends; ability to pay dividends or coupons on our Preferred Stock or our subordinated notes; mortgage and commission
revenue growth; implementation and execution of cost savings initiatives; ability to successfully litigate, resolve or otherwise dispense with threatened, ongoing and future litigation and administrative and investigatory matters; ability to
successfully complete pending or future acquisitions or divestitures; dispositions and other strategic growth opportunities and initiatives; ability to successfully integrate and manage acquisitions or divestitures; opportunities and efforts to grow
market share; reputation; ability to compete with other financial institutions; ability to recruit and retain key employees and personnel; access to capital markets; investment in other financial institutions; and ability to operate our regulatory
compliance programs in accordance with applicable law.
Forward-looking statements are based upon management’s expectations as well as certain assumptions and estimates made by, and information
available to, management at the time such statements were made. Forward-looking statements are not historical facts, are not guarantees of future results or performance and are subject to certain known and unknown risks, uncertainties and other factors
that are beyond our control and that may cause actual results to differ materially from those expressed in, or implied by, such forward-looking statements. These risks, uncertainties and other factors include, without limitation, general economic,
unemployment, credit market and real estate market conditions (including potential downturn, contraction and/or recession), and the effect of such conditions on the creditworthiness of borrowers, collateral values, the value of investment securities
and asset recovery values; the risks of changes in trade policy, in interest rates, and their effects on the level and composition of deposits, loan demand, loan repayment velocity, and the values of loan collateral, securities and interest sensitive
assets and liabilities; risks arising from market reactions to the banking environment in general, or to conditions or situations at specific banks; risks arising from perceived instability in the banking sector; the impact of inflation, the failure of
assumptions underlying the establishment of reserves for possible credit losses, fair value for loans and other real estate owned; changes in the prices, values and sales volumes of residential and commercial real estate, especially as they relate to
the value of collateral supporting the Company’s loans; uncertainties surrounding the impact of proposed tariffs (by or on the U.S.), including the potential negative impact to our loan portfolio and profitability, potential for increases in problem
loans, potential re-evaluation of credit markets and interest rates, lower equity valuation and potential slowdown in capital markets, reduced demand for U.S. exports, disruptions to supply chains, impacts from decreased international tourism,
decreased demand for other banking products and services and negative credit quality developments arising from the foregoing or other factors; the uncertain duration of trade conflicts; the magnitude of the impact that the proposed tariffs may have on
our customers’ businesses; a deterioration of the credit rating for U.S. long-term sovereign debt, actions that the U.S. government may take to avoid exceeding the debt ceiling, or uncertainties surrounding the debt ceiling and the federal budget; the
availability of and access to capital; possible downgrades in our credit ratings or outlook which could increase the costs or availability of funding from capital markets; the ability to attract new or retain existing deposits or to retain or grow
loans; potential delays or other problems in implementing and executing our growth, expansion and acquisition or divestment strategies, including delays in obtaining regulatory or other necessary approvals (including obtaining the approval of any
pending transactions), or the failure to realize any anticipated benefits or synergies from any acquisitions or growth strategies; the risks relating to the FCB Financial Corp. and Industry Bancshares, Inc. mergers including, without limitation: (i)
the diversion of management’s time on issues related to the mergers; (ii) unexpected transaction costs, including the costs of integrating operations; (iii) the risks that the businesses will not be integrated successfully or that such integration may
be more difficult, time-consuming or costly than expected; (iv) the potential failure to fully or timely realize expected revenues and revenue synergies, including as the result of revenues following the merger being lower than expected; (v) the risk
of deposit and customer attrition; any changes in deposit mix; (vi) unexpected operating and other costs, which may differ or change from expectations; (vii) the risks of customer and employee loss and business disruptions, including, without
limitation, as the result of difficulties in maintaining relationships with employees; (viii) increased competitive pressures and solicitations of customers by competitors; and (ix) the difficulties and risks inherent with entering new markets;
significant turbulence or a disruption in the capital or financial markets; the effect of a fall in stock market prices on our investment banking business and our fee income from our brokerage and wealth management businesses; the ability to grow
additional interest and fee income or to control noninterest expense; competitive factors and pricing pressures, including their effect on our net interest margin; changes in legal, financial and/or regulatory requirements (including those related to
share repurchases); recently enacted and potential legislation and regulatory actions and the costs and expenses to comply with new and/or existing legislation and regulatory actions, and any related rules and regulations; changes in U.S. Government
monetary, fiscal and trade policy, including any changes that may result from U.S. elections; special assessments or changes to regular assessments by banking regulators; possible adverse rulings, judgments, settlements and other outcomes of pending or
future litigation or government actions; the ability to keep pace with technological changes, including changes regarding generative artificial intelligence, maintaining cybersecurity and compliance with applicable cybersecurity regulatory
requirements; increased competition in the financial services industry, particularly from regional and national institutions, as well as from fintech companies, risks related to our reliance on third parties to provide key components of our business
infrastructure, including the risks related to disruptions in services provided by disputes with, or financial difficulties of a third-party vendor, the impact of failure in, or breach of, our operational or security systems or infrastructure, or those
of third parties with whom we do business, including as a result of cyber-attacks or an increase in the incidence or severity of fraud, illegal payments, security breaches or other illegal acts impacting us or our customers; natural disasters or acts
of war or terrorism; international or political instability (including the impacts related to or resulting from the proposed tariffs and international trade conflicts, Russia’s military action in Ukraine, or the Israel-Hamas war, including the
imposition of additional sanctions and export controls, as well as the broader impacts to financial markets and the global macroeconomic and geopolitical environments); risks and costs related to the scope and pace of related rulemaking activity;
impairment of our goodwill or other intangible assets; adoption of new accounting standards or changes in existing standards; and other factors described in “Part I, Item 1A. Risk Factors” in this Report or as detailed from time to time in the
Company’s press and news releases, reports and other filings we file with the federal banking regulators.
The Company faces risks from: possible adverse rulings, judgments, settlements or other outcomes of pending, ongoing and future
litigation, as well as governmental, administrative and investigatory matters; the impairment of the Company’s goodwill or other intangible assets; losses of key employees and personnel; the diversion of management’s attention from ongoing business
operations and opportunities; and the Company’s success in executing its business plans and strategies, and managing the risks involved in all of the foregoing.
Although the Company believes that the expectations reflected in these forward-looking statements are reasonable as of the date of this
Report, if one or more events related to these or other risks or uncertainties materialize, or if the Company’s underlying assumptions prove to be incorrect, actual results may prove to be materially different from the results expressed or implied by
the forward-looking statements. Accordingly, undue reliance should not be placed on any forward-looking statements. The forward-looking statements speak only as of the date of this Report, and the Company does not undertake any obligation to publicly
update or review any forward-looking statement, whether as a result of new information, future developments or otherwise, except as required by applicable law. New risks and uncertainties may emerge from time to time, and it is not possible for the
Company to predict their occurrence or how they will affect the Company. All written or oral forward-looking statements attributable to us are expressly qualified in their entirety by this section.
PART I—FINANCIAL INFORMATION
ITEM 1. FINANCIAL STATEMENTS.
Consolidated Balance Sheets
Cadence Bank and Subsidiaries
(Unaudited)
| (In thousands, except share and per share amounts) |
|
March 31, 2025 |
|
|
December 31, 2024 |
|
| ASSETS |
|
|
|
|
|
|
|
|
| Cash and due from banks |
|
$ |
578,513 |
|
|
$ |
624,884 |
|
| Interest bearing deposits with other banks and Federal funds sold |
|
|
988,787 |
|
|
|
1,106,692 |
|
| Total cash and cash equivalents |
|
|
1,567,300 |
|
|
|
1,731,576 |
|
| Available for sale securities, at fair value |
|
|
7,912,159 |
|
|
|
7,293,988 |
|
| Loans and leases, net of unearned income |
|
|
34,051,610 |
|
|
|
33,741,755 |
|
| Allowance for credit losses |
|
|
457,791 |
|
|
|
460,793 |
|
| Net loans and leases |
|
|
33,593,819 |
|
|
|
33,280,962 |
|
| Loans held for sale, at fair value |
|
|
220,441 |
|
|
|
244,192 |
|
| Premises and equipment, net |
|
|
780,963 |
|
|
|
783,456 |
|
| Goodwill |
|
|
1,366,923 |
|
|
|
1,366,923 |
|
| Other intangible assets, net |
|
|
79,522 |
|
|
|
83,190 |
|
| Bank-owned life insurance |
|
|
654,964 |
|
|
|
651,838 |
|
| Other assets |
|
|
1,567,203 |
|
|
|
1,583,065 |
|
| TOTAL ASSETS |
|
$ |
47,743,294 |
|
|
$ |
47,019,190 |
|
| LIABILITIES |
|
|
|
|
|
|
|
|
| Noninterest bearing demand deposits |
|
$ |
8,558,412 |
|
|
$ |
8,591,805 |
|
| Interest bearing demand and money market deposits |
|
|
19,221,356 |
|
|
|
19,345,114 |
|
| Savings |
|
|
2,626,901 |
|
|
|
2,588,406 |
|
| Time deposits |
|
|
9,929,059 |
|
|
|
9,970,876 |
|
| Total deposits |
|
|
40,335,728 |
|
|
|
40,496,201 |
|
| Securities sold under agreement to repurchase |
|
|
19,671 |
|
|
|
23,616 |
|
| Short-term FHLB borrowings |
|
|
235,000 |
|
|
|
— |
|
| Subordinated and long-term borrowings |
|
|
560,690 |
|
|
|
10,706 |
|
| Other liabilities |
|
|
873,664 |
|
|
|
918,984 |
|
| TOTAL LIABILITIES |
|
$ |
42,024,753 |
|
|
$ |
41,449,507 |
|
| SHAREHOLDERS’ EQUITY |
|
|
|
|
|
|
|
|
| Series A Non-Cumulative Perpetual Preferred stock, $0.01 par value per share; authorized - 500,000,000 shares; issued and outstanding - 6,900,000 shares for both periods presented |
|
$ |
166,993 |
|
|
$ |
166,993 |
|
| Common stock, $2.50 par value per share; authorized - 500,000,000 shares; issued and outstanding - 184,046,420 and 183,527,575 shares, respectively |
|
|
460,116 |
|
|
|
458,819 |
|
| Capital surplus |
|
|
2,736,799 |
|
|
|
2,742,913 |
|
| Accumulated other comprehensive loss |
|
|
(621,203 |
) |
|
|
(694,495 |
) |
| Retained earnings |
|
|
2,975,836 |
|
|
|
2,895,453 |
|
| TOTAL SHAREHOLDERS’ EQUITY |
|
|
5,718,541 |
|
|
|
5,569,683 |
|
| TOTAL LIABILITIES AND SHAREHOLDERS’ EQUITY |
|
$ |
47,743,294 |
|
|
$ |
47,019,190 |
|
See accompanying notes to the unaudited consolidated financial statements.
Consolidated Statements of Income
Cadence Bank and Subsidiaries
(Unaudited)
| |
|
Three Months Ended March 31, |
|
| (In thousands, except per share amounts) |
|
2025 |
|
|
2024 |
|
| INTEREST REVENUE: |
|
|
|
|
|
|
|
|
| Loans and leases |
|
$ |
530,050 |
|
|
$ |
528,940 |
|
| Available for sale securities: |
|
|
|
|
|
|
|
|
| Taxable |
|
|
53,232 |
|
|
|
63,405 |
|
| Tax-exempt |
|
|
629 |
|
|
|
687 |
|
| Loans held for sale |
|
|
1,449 |
|
|
|
1,184 |
|
| Short-term investments |
|
|
13,897 |
|
|
|
42,897 |
|
| Total interest revenue |
|
|
599,257 |
|
|
|
637,113 |
|
| INTEREST EXPENSE: |
|
|
|
|
|
|
|
|
| Interest bearing demand deposits and money market accounts |
|
|
128,831 |
|
|
|
149,403 |
|
| Savings |
|
|
3,644 |
|
|
|
3,801 |
|
| Time deposits |
|
|
100,900 |
|
|
|
80,670 |
|
| Federal funds purchased and securities sold under agreement to repurchase |
|
|
1,124 |
|
|
|
2,523 |
|
| Short-term borrowings |
|
|
317 |
|
|
|
42,109 |
|
| Subordinated and long-term borrowings |
|
|
1,289 |
|
|
|
4,699 |
|
| Total interest expense |
|
|
236,105 |
|
|
|
283,205 |
|
| Net interest revenue |
|
|
363,152 |
|
|
|
353,908 |
|
| Provision for credit losses |
|
|
20,000 |
|
|
|
22,000 |
|
| Net interest revenue, after provision for credit losses |
|
|
343,152 |
|
|
|
331,908 |
|
| NONINTEREST REVENUE: |
|
|
|
|
|
|
|
|
| Wealth management |
|
|
23,279 |
|
|
|
22,833 |
|
| Deposit service charges |
|
|
17,736 |
|
|
|
18,338 |
|
| Credit card, debit card and merchant fees |
|
|
11,989 |
|
|
|
12,162 |
|
| Mortgage banking |
|
|
6,638 |
|
|
|
6,443 |
|
| Security losses, net |
|
|
(9 |
) |
|
|
(9 |
) |
| Other |
|
|
25,754 |
|
|
|
24,019 |
|
| Total noninterest revenue |
|
|
85,387 |
|
|
|
83,786 |
|
| NONINTEREST EXPENSE: |
|
|
|
|
|
|
|
|
| Salaries and employee benefits |
|
|
152,972 |
|
|
|
156,650 |
|
| Occupancy and equipment |
|
|
28,477 |
|
|
|
28,640 |
|
| Data processing and software |
|
|
27,132 |
|
|
|
30,028 |
|
| Deposit insurance assessments |
|
|
8,643 |
|
|
|
8,414 |
|
| Amortization of intangibles |
|
|
3,668 |
|
|
|
4,066 |
|
| Merger expense |
|
|
315 |
|
|
|
— |
|
| Other |
|
|
38,142 |
|
|
|
35,409 |
|
| Total noninterest expense |
|
|
259,349 |
|
|
|
263,207 |
|
| Income before income taxes |
|
|
169,190 |
|
|
|
152,487 |
|
| Income tax expense |
|
|
35,968 |
|
|
|
35,509 |
|
| Net income |
|
$ |
133,222 |
|
|
$ |
116,978 |
|
| Less: preferred dividends |
|
|
2,372 |
|
|
|
2,372 |
|
| Net income available to common shareholders |
|
$ |
130,850 |
|
|
$ |
114,606 |
|
| |
|
|
|
|
|
|
|
|
| Basic earnings per common share |
|
$ |
0.71 |
|
|
$ |
0.63 |
|
| Diluted earnings per common share |
|
$ |
0.70 |
|
|
$ |
0.62 |
|
See accompanying notes to the unaudited consolidated financial statements.
Consolidated Statements of Comprehensive Income (Loss)
Cadence Bank and Subsidiaries
(Unaudited)
| |
|
Three Months Ended March 31, |
|
| (In thousands) |
|
2025 |
|
|
2024 |
|
| Net income |
|
$ |
133,222 |
|
|
$ |
116,978 |
|
| Other comprehensive income (loss), net of tax: |
|
|
|
|
|
|
|
|
| Unrealized gains (losses) on AFS securities: |
|
|
|
|
|
|
|
|
| Net unrealized gains (losses), net of income taxes of $(22,495) and $9,324 |
|
|
72,743 |
|
|
|
(30,149 |
) |
| Reclassification adjustment for net losses realized in net income, net of income taxes of $2 and $2 |
|
|
(7 |
) |
|
|
(7 |
) |
| Net change in unrealized gains (losses) on AFS securities, net of tax |
|
|
72,736 |
|
|
|
(30,156 |
) |
| Recognized employee benefit plan net periodic benefit cost, net of income taxes of $(171)and $(202) |
|
|
556 |
|
|
|
652 |
|
| Other comprehensive income (loss), net of tax |
|
|
73,292 |
|
|
|
(29,504 |
) |
| Comprehensive income |
|
$ |
206,514 |
|
|
$ |
87,474 |
|
See accompanying notes to the unaudited consolidated financial statements.
Consolidated Statements of Shareholders’ Equity
Cadence Bank and Subsidiaries
(Unaudited)
| |
|
|
|
|
|
|
|
|
|
|
|
|
|
|
|
|
Accumulated |
|
|
|
|
|
|
|
| |
|
|
|
|
|
|
|
|
|
|
|
|
|
|
|
|
Other |
|
|
|
|
|
Total |
|
| |
|
Preferred Stock |
|
|
Common Stock |
|
|
Capital |
|
|
Comprehensive |
|
|
Retained |
|
|
Shareholders’ |
|
| (In thousands, except share and per share amounts) |
|
Shares |
|
|
Amount |
|
|
Shares |
|
|
Amount |
|
|
Surplus |
|
|
(Loss) Income |
|
|
Earnings |
|
|
Equity |
|
| Balance at December 31, 2024 |
|
|
6,900,000 |
|
|
$ |
166,993 |
|
|
|
183,527,575 |
|
|
$ |
458,819 |
|
|
$ |
2,742,913 |
|
|
$ |
(694,495 |
) |
|
$ |
2,895,453 |
|
|
$ |
5,569,683 |
|
| Net income |
|
|
— |
|
|
|
— |
|
|
|
— |
|
|
|
— |
|
|
|
— |
|
|
|
— |
|
|
|
133,222 |
|
|
|
133,222 |
|
| Other comprehensive income, net of tax |
|
|
— |
|
|
|
— |
|
|
|
— |
|
|
|
— |
|
|
|
— |
|
|
|
73,292 |
|
|
|
— |
|
|
|
73,292 |
|
| Equity based compensation, net of forfeitures and shares withheld to cover taxes |
|
|
— |
|
|
|
— |
|
|
|
519,724 |
|
|
|
1,299 |
|
|
|
(6,087 |
) |
|
|
— |
|
|
|
— |
|
|
|
(4,788 |
) |
| Repurchase of stock, net of excise tax |
|
|
— |
|
|
|
— |
|
|
|
(879 |
) |
|
|
(2 |
) |
|
|
(27 |
) |
|
|
— |
|
|
|
— |
|
|
|
(29 |
) |
| Preferred dividends declared, $0.34 per share |
|
|
— |
|
|
|
— |
|
|
|
— |
|
|
|
— |
|
|
|
— |
|
|
|
— |
|
|
|
(2,372 |
) |
|
|
(2,372 |
) |
| Cash dividends declared, $0.275 per share |
|
|
— |
|
|
|
— |
|
|
|
— |
|
|
|
— |
|
|
|
— |
|
|
|
— |
|
|
|
(50,467 |
) |
|
|
(50,467 |
) |
| Balance at March 31, 2025 |
|
|
6,900,000 |
|
|
$ |
166,993 |
|
|
|
184,046,420 |
|
|
$ |
460,116 |
|
|
$ |
2,736,799 |
|
|
$ |
(621,203 |
) |
|
$ |
2,975,836 |
|
|
$ |
5,718,541 |
|
| |
|
|
|
|
|
|
|
|
|
|
|
|
|
|
|
|
Accumulated |
|
|
|
|
|
|
|
| |
|
|
|
|
|
|
|
|
|
|
|
|
|
|
|
|
Other |
|
|
|
|
|
Total |
|
| |
|
Preferred Stock |
|
|
Common Stock |
|
|
Capital |
|
|
Comprehensive |
|
|
Retained |
|
|
Shareholders’ |
|
| (In thousands, except share and per share amounts) |
|
Shares |
|
|
Amount |
|
|
Shares |
|
|
Amount |
|
|
Surplus |
|
|
(Loss) Income |
|
|
Earnings |
|
|
Equity |
|
| Balance at December 31, 2023 |
|
|
6,900,000 |
|
|
$ |
166,993 |
|
|
|
182,871,775 |
|
|
$ |
457,179 |
|
|
$ |
2,743,066 |
|
|
$ |
(761,829 |
) |
|
$ |
2,562,434 |
|
|
$ |
5,167,843 |
|
| Net income |
|
|
— |
|
|
|
— |
|
|
|
— |
|
|
|
— |
|
|
|
— |
|
|
|
— |
|
|
|
116,978 |
|
|
|
116,978 |
|
| Other comprehensive loss, net of tax |
|
|
— |
|
|
|
— |
|
|
|
— |
|
|
|
— |
|
|
|
— |
|
|
|
(29,504 |
) |
|
|
— |
|
|
|
(29,504 |
) |
| Equity based compensation, net of forfeitures and shares withheld to cover taxes |
|
|
— |
|
|
|
— |
|
|
|
467,143 |
|
|
|
1,168 |
|
|
|
(3,231 |
) |
|
|
— |
|
|
|
— |
|
|
|
(2,063 |
) |
| Repurchase of stock, net of excise tax |
|
|
— |
|
|
|
— |
|
|
|
(657,593 |
) |
|
|
(1,644 |
) |
|
|
(15,248 |
) |
|
|
— |
|
|
|
— |
|
|
|
(16,892 |
) |
| Preferred dividends declared, $0.34 per share |
|
|
— |
|
|
|
— |
|
|
|
— |
|
|
|
— |
|
|
|
— |
|
|
|
— |
|
|
|
(2,372 |
) |
|
|
(2,372 |
) |
| Cash dividends declared, $0.25 per share |
|
|
— |
|
|
|
— |
|
|
|
— |
|
|
|
— |
|
|
|
— |
|
|
|
— |
|
|
|
(45,598 |
) |
|
|
(45,598 |
) |
| Cumulative effect of change in accounting principle, net of tax, for ASU 2023-02 |
|
|
— |
|
|
|
— |
|
|
|
— |
|
|
|
— |
|
|
|
— |
|
|
|
— |
|
|
|
1,540 |
|
|
|
1,540 |
|
| Balance at March 31, 2024 |
|
|
6,900,000 |
|
|
$ |
166,993 |
|
|
|
182,681,325 |
|
|
$ |
456,703 |
|
|
$ |
2,724,587 |
|
|
$ |
(791,333 |
) |
|
$ |
2,632,982 |
|
|
$ |
5,189,932 |
|
See accompanying notes to the unaudited consolidated financial statements.
Consolidated Statements of Cash Flows
Cadence Bank and Subsidiaries
(Unaudited)
| |
|
Three Months Ended March 31, |
|
| (In thousands) |
|
2025 |
|
|
2024 |
|
| Operating Activities: |
|
|
|
|
|
|
|
|
| Net income |
|
$ |
133,222 |
|
|
$ |
116,978 |
|
| Adjustments to reconcile net income to net cash provided by operations: |
|
|
|
|
|
|
|
|
| Depreciation, amortization, and accretion |
|
|
21,162 |
|
|
|
56,554 |
|
| Deferred income tax expense |
|
|
14,188 |
|
|
|
12,798 |
|
| Provision for credit losses |
|
|
20,000 |
|
|
|
22,000 |
|
| Gain on sale of loans, net |
|
|
(5,611 |
) |
|
|
(4,486 |
) |
| Loss on sales of available for sale securities, net |
|
|
9 |
|
|
|
9 |
|
| Unrealized gain on limited partnerships, net |
|
|
(2,304 |
) |
|
|
(1,000 |
) |
| Gain on trading securities |
|
|
(27 |
) |
|
|
(10 |
) |
| Share-based compensation expense |
|
|
4,781 |
|
|
|
6,074 |
|
| Proceeds from payments and sales of loans held for sale |
|
|
291,869 |
|
|
|
280,316 |
|
| Origination of loans held for sale |
|
|
(265,631 |
) |
|
|
(265,545 |
) |
| Increase in accrued interest receivable |
|
|
(7,787 |
) |
|
|
(14,374 |
) |
| Increase in accrued interest payable |
|
|
29,785 |
|
|
|
47,527 |
|
| Purchases of trading securities |
|
|
(11,000 |
) |
|
|
(4,000 |
) |
| Proceeds from sales of trading securities |
|
|
11,027 |
|
|
|
4,010 |
|
| Net increase in prepaid pension asset |
|
|
(1,218 |
) |
|
|
(1,563 |
) |
| Decrease in other assets |
|
|
18,667 |
|
|
|
58,305 |
|
| (Decrease) increase in other liabilities |
|
|
(52,440 |
) |
|
|
47,537 |
|
| Other, net |
|
|
(10,159 |
) |
|
|
(2,411 |
) |
| Net cash provided by operating activities |
|
|
188,533 |
|
|
|
358,719 |
|
| Investing Activities: |
|
|
|
|
|
|
|
|
| Purchases of available for sale securities |
|
|
(788,568 |
) |
|
|
(689,341 |
) |
| Proceeds from maturities, calls, and payments of available for sale securities |
|
|
262,148 |
|
|
|
411,195 |
|
| Purchases of FRB and FHLB stock, net |
|
|
(29,469 |
) |
|
|
— |
|
| Increase in loans, net |
|
|
(324,357 |
) |
|
|
(421,170 |
) |
| Purchases of premises and equipment |
|
|
(11,181 |
) |
|
|
(35,092 |
) |
| Proceeds from sales of premises and equipment |
|
|
611 |
|
|
|
3,324 |
|
| Proceeds from disposition of foreclosed and repossessed property |
|
|
3,220 |
|
|
|
3,024 |
|
| Net death benefits received on bank owned life insurance |
|
|
6,185 |
|
|
|
143 |
|
| Purchases of tax credit investments |
|
|
(26,821 |
) |
|
|
(4,359 |
) |
| Purchases of limited partnership interests |
|
|
(7,021 |
) |
|
|
(8,980 |
) |
| Other, net |
|
|
2,242 |
|
|
|
2,513 |
|
| Net cash used in investing activities |
|
|
(913,011 |
) |
|
|
(738,743 |
) |
Consolidated Statements of Cash Flows (continued)
Cadence Bank and Subsidiaries
(Unaudited)
| |
|
Three Months Ended March 31, |
|
| (In thousands) |
|
2025 |
|
|
2024 |
|
| Financing Activities: |
|
|
|
|
|
|
|
|
| Decrease in deposits, net |
|
|
(160,460 |
) |
|
|
(376,834 |
) |
| Net change in securities sold under agreement to repurchase and federal funds purchased |
|
|
(3,945 |
) |
|
|
(357,126 |
) |
| Net change in short-term FHLB advances |
|
|
235,000 |
|
|
|
— |
|
| Long-term borrowings called, repurchased, or repaid |
|
|
— |
|
|
|
(7,876 |
) |
| Repayment of long-term FHLB advances |
|
|
(13 |
) |
|
|
— |
|
| Proceeds from long-term FHLB advances |
|
|
550,000 |
|
|
|
— |
|
| Repurchase of common stock |
|
|
(29 |
) |
|
|
(16,892 |
) |
| Cash dividends paid on common stock |
|
|
(50,462 |
) |
|
|
(45,530 |
) |
| Cash dividends paid on Preferred Stock |
|
|
(2,372 |
) |
|
|
(2,372 |
) |
| Cash paid for tax withholding on vested share-based compensation and other |
|
|
(7,517 |
) |
|
|
(8,137 |
) |
| Net cash provided by (used in) financing activities |
|
|
560,202 |
|
|
|
(814,767 |
) |
| Net decrease in cash and cash equivalents |
|
|
(164,276 |
) |
|
|
(1,194,791 |
) |
| Cash and cash equivalents at beginning of period |
|
|
1,731,576 |
|
|
|
4,232,265 |
|
| Cash and cash equivalents at end of period |
|
$ |
1,567,300 |
|
|
$ |
3,037,474 |
|
Supplemental Cash Flow Disclosures
Cadence Bank and Subsidiaries
(Unaudited)
| |
|
Three Months Ended March 31, |
|
| (In thousands) |
|
2025 |
|
|
2024 |
|
| Supplemental Disclosures |
|
|
|
|
|
|
|
|
| Cash paid during the period for: |
|
|
|
|
|
|
|
|
| Interest |
|
$ |
206,320 |
|
|
$ |
235,678 |
|
| Income tax (refund) payments, net |
|
|
(286 |
) |
|
|
4,839 |
|
| Cash paid for amounts included in lease liabilities |
|
|
4,540 |
|
|
|
4,656 |
|
| Non-cash investing activities, at fair value: |
|
|
|
|
|
|
|
|
| Acquisition of real estate and other assets in settlement of loans |
|
|
6,303 |
|
|
|
1,715 |
|
| Transfers of loans held for sale to loans |
|
|
1,274 |
|
|
|
461 |
|
| Right of use assets obtained (reduced) in exchange for new operating lease liabilities |
|
|
3,971 |
|
|
|
9,519 |
|
| Increase in funding obligations for certain tax credit investments |
|
|
1,701 |
|
|
|
7,800 |
|
See accompanying notes to unaudited consolidated financial statements.
Notes to Unaudited Consolidated Financial Statements
Cadence Bank and Subsidiaries
NOTE 1. SUMMARY OF SIGNIFICANT ACCOUNTING POLICIES
Basis of Presentation and Consolidation
The accompanying unaudited consolidated financial statements for the Company have been prepared in accordance with instructions to the SEC
Form 10-Q and Article 10 of Regulation S-X; therefore, they do not include all information and notes necessary for a fair presentation of financial position, results of operations, comprehensive income, and cash flows in conformity with GAAP. All
adjustments consisting of normally recurring accruals that, in the opinion of management, are necessary for a fair presentation of the consolidated financial position and results of operations for the periods covered by this report have been included.
These interim financial statements should be read in conjunction with our Annual Report on Form 10-K for the year ended December 31, 2024. Operating results for the period ended March 31, 2025, are not necessarily indicative of the results that may be
expected for the year ending December 31, 2025. The consolidated balance sheet at December 31, 2024 has been derived from the audited financial statements included in our Form 10-K for the year ended December 31, 2024.
The Company and its subsidiaries follow GAAP, including, where applicable, general practices within the banking industry. The consolidated
financial statements include the accounts of the Company and its subsidiaries. Significant intercompany accounts and transactions have been eliminated in consolidation. The assessment of whether or not the Company has a controlling interest (i.e., the
primary beneficiary) in a VIE is performed on an on-going basis. All equity investments in non-consolidated VIEs are included in “other assets” in the Company’s consolidated balance sheets (see Note 16 for more information).
Certain amounts reported in prior years have been reclassified to conform to the 2025 presentation. These reclassifications did not
materially impact the Company’s consolidated financial statements.
In accordance with GAAP, the Company’s management evaluated subsequent events for potential recognition or disclosure in the consolidated
financial statements through the date of the issuance of the consolidated financial statements.
Recent Accounting Pronouncements
ASU No. 2023-05
In August 2023, the FASB issued ASU No. 2023-05, Business Combinations—Joint Venture Formations (Subtopic 805-60): Recognition and Initial
Measurement. The ASU applies to the formation of entities that meet the definition of a joint venture (or a corporate joint venture) as defined in the FASB ASC Master Glossary. The amendments in the ASU require that a newly formed joint venture,
upon formation, would initially measure its assets and liabilities at fair value (with exceptions to fair value measurement that are consistent with the business combinations guidance). The ASU allows a joint venture to apply measurement period
guidance in accordance with ASC 805-10, allowing the amounts recognized upon formation to be adjusted for provisional items during the measurement period not to exceed one year from the formation date.
The ASU does not amend the definition of a joint venture, the existing guidance for the accounting by an equity method investor for its
investment in a joint venture, or the accounting by a joint venture for contributions received subsequent to formation.
The amendments are effective prospectively for all joint ventures with a formation date on or after January 1, 2025, and early adoption is
permitted. A joint venture that was formed before the effective date of the ASU may elect to apply the amendments retrospectively if it has sufficient information. There was no impact from this guidance on the Company’s consolidated financial
statements.
ASU No. 2023-08
In December 2023, the FASB issued ASU No. 2023-08, Intangibles—Goodwill and Other—Crypto Assets (Subtopic 350-60): Accounting for and
Disclosure of Crypto Assets. The amendments are intended to improve the accounting for certain crypto assets by requiring an entity to measure those crypto assets at fair value each reporting period with changes in fair value recognized in net
income. The amendments also improve the information provided to investors about an entity’s crypto asset holdings by requiring disclosure about significant holdings, contractual sale restrictions, and changes during the reporting period.
The amendments in the ASU are effective for fiscal years beginning after December 15, 2024, including interim periods within those fiscal
years. Early adoption is permitted for both interim and annual financial statements that have not yet been issued (or made available for issuance). If amendments are adopted in an interim period, they must be adopted as of the beginning of the fiscal
year that includes that interim period. There was no impact from this guidance on the Company’s consolidated financial statements.
ASU No. 2023-09
In December 2023, the FASB issued ASU No. 2023-09, Income Taxes (Topic 740): Improvements to Income Tax Disclosures. The ASU is
intended to improve the transparency of income tax disclosures by requiring (1) consistent categories and greater disaggregation of information in the rate reconciliation and (2) income taxes paid disaggregated by jurisdiction. It also includes certain
other amendments intended to improve the effectiveness of income tax disclosures.
The amendments in the ASU are effective for annual periods beginning after December 15, 2024. Early adoption is permitted for annual
financial statements that have not yet been issued or made available for issuance. As this guidance is solely disclosure related, there will be no quantitative impact to the Company’s consolidated financial statements.
ASU No. 2024-01
In March 2024, the FASB issued ASU No. 2024-01, Compensation--Stock Compensation (Topic 718): Scope Application of Profits Interest
and Similar Awards, which provides four cases illustrating the scope application of Topic 718 for profits interest awards. Determining whether a profits interest award should be accounted for as a share-based payment arrangement or other
compensation requires judgement based on the facts and circumstances of the specific transaction. The illustrative example includes four fact patterns to demonstrate how an entity would apply the scope guidance in Topic 718 to determine whether profits
interest awards should be accounted for in accordance with Topic 718.
The amendments in the ASU are effective for annual periods beginning after December 15, 2024, and interim periods within those annual
periods. Early adoption is permitted for both interim and annual financial statements that have not yet been issued or made available for issuance. The amendments should be applied either (1) retrospectively to all prior periods presented in the
financial statements or (2) prospectively to profits, interest, and similar awards grated or modified on or after the date at which the entity first applies the amendments. There was no impact from this guidance on the Company’s consolidated financial
statements.
ASU No. 2024-02
In March 2024, the FASB issued ASU No. 2024-02, Codification Improvements--Amendments to Remove References to the Concepts Statements, which
contains amendments that remove references to various Concepts Statements. In most instances, the references are extraneous and not required to understand or apply the guidance. In other instances, the references were used in prior Statements to
provide guidance in certain topical areas. Generally, the amendments are not intended to result in significant accounting change for most entities. However, the FASB recognized that changes to that guidance may result in accounting change for some
entities. Therefore, the FASB provided transition guidance for all the amendments in this Update.
These amendments are effective for public business entities for fiscal years beginning after December 15, 2024. Early application of the
amendments is permitted for all entities, for any fiscal year or interim period for which financial statements have not yet been issued (or made available for issuance). If an entity adopts the amendments in an interim period, it must adopt them as of
the beginning of the fiscal year that includes that interim period. There was no significant impact from this guidance on the Company’s consolidated financial statements.
ASU No. 2025-02
In March 2025, the FASB issued ASU No. 2025-02, Liabilities (Topic 405): Amendments to SEC Paragraphs Pursuant to SEC Staff Accounting
Bulletin No. 122 to remove SEC paragraphs pursuant to the issuance of the SEC Staff Accounting Bulletin No. 122. The amendments are effective immediately. There was no impact from this guidance on the Company’s consolidated financial statements.
Pending Accounting Pronouncements
ASU No. 2023-06
In October 2023, the FASB issued ASU No. 2023-06, Disclosure Improvements: Codification Amendments in Response to the SEC’s Disclosure Update
and Simplification Initiative, that incorporates certain SEC disclosure requirements into the FASB Accounting Standards Codification. The amendments in the ASU are expected to clarify or improve disclosure and presentation requirements of a
variety of Codification Topics, allow users to more easily compare entities subject to the SEC’s existing disclosures with those entities that were not previously subject to the requirements, and align the requirements in the Codification with the
SEC’s regulations.
The ASU modifies the disclosure or presentation requirements of a variety of Topics in the Codification. The requirements are relatively
narrow in nature. Some of the amendments represent clarifications to, or technical corrections of, the current requirements.
The effective date for each amendment will be the date on which the SEC removes that related disclosure from its rules. If by June 30,
2027, the SEC has not removed the related disclosure from its regulations, the amendments will be removed from the Codification and not become effective for any entity. As this guidance is solely disclosure related, the Company does not anticipate any
quantitative impact to the Company’s consolidated financial statements.
ASU No. 2024-03
In November 2024, the FASB issued ASU No. 2024-03, Income Statement—Reporting Comprehensive Income— Expense Disaggregation Disclosures
(Subtopic 220-40): Disaggregation of Income Statement Expenses, which requires disclosures in the note to the financial statements regarding specific expenses. The amendments do not change or remove existing disclosure requirements. The
amendments improve disclosure requirements through enhanced expense disaggregation.
The amendments require disclosures in each interim and annual reporting periods. The amendments are effective for fiscal year beginning after
December 15, 2026, and interim reporting periods beginning after December 15, 2027. Prospective adoption is required, however an entity may choose to adopt retrospectively. Early adoption is permitted. As this guidance is solely disclosure related, the
Company does not anticipate any quantitative impact to the Company’s consolidated financial statements.
ASU No. 2024-04
In November 2024, the FASB issued ASU No. 2024-04, Debt—Debt with Conversion and Other Options (Subtopic 470-20): Induced Conversions
of Convertible Debt Instruments, which clarifies requirements for determining whether certain settlements of convertible debt instruments, including convertible debt instruments with cash conversion features or convertible debt instruments that
are not currently convertible, should be accounted for as an induced conversion.
The amendments are effective for all entities for fiscal years beginning after December 15, 2025. Early adoption is permitted as of the
beginning of the annual reporting period for all entities that have adopted ASU 2020-06. If an entity adopts ASU No. 2024-04 in an interim reporting period, it should adopt it as of the beginning of the annual reporting period that includes that
interim reporting period. The Company does not anticipate any impact from this guidance on its consolidated financial statements.
ASU No. 2025-01
In January 2025, the FASB issued ASU No. 2025-01, Income Statement—Reporting Comprehensive Income—Expense Disaggregation Disclosures (Subtopic
220-40): Clarifying the Effective Date to clarify the interim effective date for ASU 2024-03 for entities that do not have an annual reporting period that ends on December 31. The amendments are effective for fiscal year beginning after December
15, 2026, and interim reporting periods beginning after December 15, 2027. Since Company’s fiscal year-end and the calendar year-end are the same, the Company does not anticipate that these amendments will have any effect on Company’s consolidated
financial statements.
NOTE 2. AVAILABLE FOR SALE SECURITIES AND EQUITY SECURITIES
The amortized cost, unrealized gains and losses, and estimated fair value of available for sale securities are presented in the following
tables:
| |
|
|
|
|
Gross |
|
|
Gross |
|
|
Estimated |
|
| |
|
Amortized |
|
|
Unrealized |
|
|
Unrealized |
|
|
Fair |
|
| (In thousands) |
|
Cost |
|
|
Gains |
|
|
Losses |
|
|
Value |
|
| March 31, 2025 |
|
|
|
|
|
|
|
|
|
|
|
|
|
|
|
|
| U.S. government agency securities |
|
$ |
309,829 |
|
|
$ |
14 |
|
|
$ |
35,558 |
|
|
$ |
274,285 |
|
| MBS issued or guaranteed by U.S. agencies |
|
|
|
|
|
|
|
|
|
|
|
|
|
|
|
|
| Residential pass-through: |
|
|
|
|
|
|
|
|
|
|
|
|
|
|
|
|
| Guaranteed by GNMA |
|
|
76,435 |
|
|
|
5 |
|
|
|
10,291 |
|
|
|
66,149 |
|
| Issued by FNMA and FHLMC |
|
|
4,593,159 |
|
|
|
24 |
|
|
|
568,505 |
|
|
|
4,024,678 |
|
| Other residential MBS |
|
|
1,583,432 |
|
|
|
9,437 |
|
|
|
27,941 |
|
|
|
1,564,928 |
|
| Commercial MBS |
|
|
1,569,695 |
|
|
|
1,621 |
|
|
|
84,791 |
|
|
|
1,486,525 |
|
| Total MBS |
|
|
7,822,721 |
|
|
|
11,087 |
|
|
|
691,528 |
|
|
|
7,142,280 |
|
| Obligations of states and political subdivisions |
|
|
166,754 |
|
|
|
9 |
|
|
|
36,941 |
|
|
|
129,822 |
|
| Corporate debt securities |
|
|
52,750 |
|
|
|
— |
|
|
|
4,328 |
|
|
|
48,422 |
|
| Foreign debt securities |
|
|
318,584 |
|
|
|
430 |
|
|
|
1,664 |
|
|
|
317,350 |
|
| Total available for sale securities |
|
$ |
8,670,638 |
|
|
$ |
11,540 |
|
|
$ |
770,019 |
|
|
$ |
7,912,159 |
|
| |
|
|
|
|
|
Gross |
|
|
Gross |
|
|
Estimated |
|
| |
|
Amortized |
|
|
Unrealized |
|
|
Unrealized |
|
|
Fair |
|
| (In thousands) |
|
Cost |
|
|
Gains |
|
|
Losses |
|
|
Value |
|
| December 31, 2024 |
|
|
|
|
|
|
|
|
|
|
|
|
|
|
|
|
| U.S. government agency securities |
|
$ |
321,454 |
|
|
$ |
20 |
|
|
$ |
40,243 |
|
|
$ |
281,231 |
|
| MBS issued or guaranteed by U.S. agencies |
|
|
|
|
|
|
|
|
|
|
|
|
|
|
|
|
| Residential pass-through: |
|
|
|
|
|
|
|
|
|
|
|
|
|
|
|
|
| Guaranteed by GNMA |
|
|
78,279 |
|
|
|
— |
|
|
|
11,698 |
|
|
|
66,581 |
|
| Issued by FNMA and FHLMC |
|
|
4,604,954 |
|
|
|
16 |
|
|
|
639,414 |
|
|
|
3,965,556 |
|
| Other residential MBS |
|
|
958,911 |
|
|
|
6,110 |
|
|
|
30,300 |
|
|
|
934,721 |
|
| Commercial MBS |
|
|
1,645,065 |
|
|
|
1,605 |
|
|
|
97,029 |
|
|
|
1,549,641 |
|
| Total MBS |
|
|
7,287,209 |
|
|
|
7,731 |
|
|
|
778,441 |
|
|
|
6,516,499 |
|
| Obligations of states and political subdivisions |
|
|
167,743 |
|
|
|
10 |
|
|
|
35,684 |
|
|
|
132,069 |
|
| Corporate debt securities |
|
|
52,751 |
|
|
|
— |
|
|
|
5,349 |
|
|
|
47,402 |
|
| Foreign debt securities |
|
|
318,539 |
|
|
|
443 |
|
|
|
2,195 |
|
|
|
316,787 |
|
| Total available for sale securities |
|
$ |
8,147,696 |
|
|
$ |
8,204 |
|
|
$ |
861,912 |
|
|
$ |
7,293,988 |
|
For available for sale securities, gross gains of $2 thousand and gross losses of $11 thousand were recognized during the three months
ended March 31, 2025 and 2024, respectively. There were no impairment charges related to credit losses included in gross realized losses for the three months ended March 31, 2025 and 2024.
Available for sale securities with a carrying value of $4.1 billion and $4.0 billion at March 31, 2025 and December 31, 2024,
respectively, were pledged to secure public and trust funds on deposit and for other purposes.
There were no securities held for trading or held-to-maturity at March 31, 2025 or December 31, 2024.
The amortized cost and estimated fair value of available for sale securities at March 31, 2025 by contractual maturity are shown below.
Actual maturities may differ from contractual maturities because borrowers may have the right to call or prepay obligations with or without call or prepayment penalties.
| |
|
Amortized |
|
|
Estimated |
|
| (In thousands) |
|
Cost |
|
|
Fair Value |
|
| Maturing in one year or less |
|
$ |
— |
|
|
$ |
— |
|
| Maturing after one year through five years |
|
|
107,067 |
|
|
|
104,937 |
|
| Maturing after five years through ten years |
|
|
510,404 |
|
|
|
488,415 |
|
| Maturing after ten years |
|
|
230,446 |
|
|
|
176,527 |
|
| Mortgage-backed securities |
|
|
7,822,721 |
|
|
|
7,142,280 |
|
| Total available for sale securities |
|
$ |
8,670,638 |
|
|
$ |
7,912,159 |
|
At March 31, 2025 and December 31, 2024, approximately 74.9% and 80.4% of securities were in an unrealized loss position, respectively. At
March 31, 2025, there were 870 securities in a loss position for more than twelve months, and 30 securities in a loss position for less than twelve months. At December 31, 2024, there were 871 securities in a loss position for more than twelve months,
and 33 securities in a loss position for less than twelve months. A summary of available for sale investments with continuous unrealized loss positions for which an allowance for credit losses has not been recorded is as follows:
| |
|
Less Than 12 Months |
|
|
12 Months or Longer |
|
| |
|
Fair |
|
|
Unrealized |
|
|
Fair |
|
|
Unrealized |
|
| (In thousands) |
|
Value |
|
|
Losses |
|
|
Value |
|
|
Losses |
|
| March 31, 2025 |
|
|
|
|
|
|
|
|
|
|
|
|
| U.S. government agency securities |
|
$ |
58,865 |
|
|
$ |
114 |
|
|
$ |
210,411 |
|
|
$ |
35,444 |
|
| MBS |
|
|
354,350 |
|
|
|
1,315 |
|
|
|
5,082,322 |
|
|
|
690,213 |
|
| Obligations of states and political subdivisions |
|
|
— |
|
|
|
— |
|
|
|
119,292 |
|
|
|
36,941 |
|
| Corporate debt securities |
|
|
7,632 |
|
|
|
2,368 |
|
|
|
38,791 |
|
|
|
1,960 |
|
| Foreign debt securities |
|
|
— |
|
|
|
— |
|
|
|
53,336 |
|
|
|
1,664 |
|
| Total |
|
$ |
420,847 |
|
|
$ |
3,797 |
|
|
$ |
5,504,152 |
|
|
$ |
766,222 |
|
| |
|
Less Than 12 Months |
|
|
12 Months or Longer |
|
| |
|
Fair |
|
|
Unrealized |
|
|
Fair |
|
|
Unrealized |
|
| (In thousands) |
|
Value |
|
|
Losses |
|
|
Value |
|
|
Losses |
|
| December 31, 2024 |
|
|
|
|
|
|
|
|
|
|
|
|
| U.S. government agency securities |
|
$ |
74,795 |
|
|
$ |
221 |
|
|
$ |
200,798 |
|
|
$ |
40,022 |
|
| MBS |
|
|
249,197 |
|
|
|
2,314 |
|
|
|
5,123,218 |
|
|
|
776,127 |
|
| Obligations of states and political subdivisions |
|
|
303 |
|
|
|
7 |
|
|
|
121,117 |
|
|
|
35,677 |
|
| Corporate debt securities |
|
|
7,474 |
|
|
|
2,527 |
|
|
|
37,928 |
|
|
|
2,822 |
|
| Foreign debt securities |
|
|
— |
|
|
|
— |
|
|
|
52,806 |
|
|
|
2,195 |
|
| Total |
|
$ |
331,769 |
|
|
$ |
5,069 |
|
|
$ |
5,535,867 |
|
|
$ |
856,843 |
|
Management evaluates available for sale securities in unrealized loss positions to determine whether the impairment is due to credit-related
factors or noncredit-related factors. Credit loss is defined as the difference between the present value of the cash flows expected to be collected and the amortized cost basis. Management believes that the unrealized losses detailed in the previous
tables are due to noncredit-related factors, such as changes in interest rates and other market conditions. Therefore, no allowance for credit losses was recorded related to these securities at March 31, 2025 or December 31, 2024. Additionally, as of
March 31, 2025 management had no intent to sell these securities until the full recovery of unrealized losses, which may not be until maturity, and it is more likely than not that the Company would not be required to sell the securities prior to
recovery of costs. The fair value is expected to recover as the securities approach their maturity date or repricing date or if market yields for such investments decline.
Reported in other assets in the accompanying consolidated balance sheets, equity investments with readily determinable fair values not held for
trading are recorded at fair value, with changes in fair value reported in net income. Additionally, the Company reports equity investments without readily determinable fair values in other assets in the accompanying consolidated balance sheets. These
investments include investments in the common stock of the FHLB of Dallas and the Federal Reserve Bank of St. Louis. The Company is required to own stock in the FHLB of Dallas for membership in the FHLB system and in relation to the level of FHLB
advances. The Company is also required to purchase and hold shares of capital stock in the Federal Reserve Bank of St. Louis for membership in the Federal Reserve System. The Company accounts for these investments as long-term assets and carries them
at cost. During the periods ended March 31, 2025 and December 31, 2024, there were no downward or upward adjustments to these investments for impairments or price changes from observable transactions.
| |
|
|
|
|
Gross |
|
|
Gross |
|
|
|
|
| |
|
|
|
|
Unrealized |
|
|
Unrealized |
|
|
Carrying |
|
| (In thousands) |
|
Cost |
|
|
Gains |
|
|
Losses |
|
|
Value |
|
| March 31, 2025 |
|
|
|
|
|
|
|
|
|
|
|
|
|
|
|
|
| Equity securities held at cost: |
|
|
|
|
|
|
|
|
|
|
|
|
|
|
|
|
| Federal Reserve Bank stock |
|
$ |
101,062 |
|
|
$ |
— |
|
|
$ |
— |
|
|
$ |
101,062 |
|
| Federal Home Loan Bank stock |
|
|
39,384 |
|
|
|
— |
|
|
|
— |
|
|
|
39,384 |
|
| Other equity securities |
|
|
20,582 |
|
|
|
— |
|
|
|
— |
|
|
|
20,582 |
|
| Total equity securities, held at cost |
|
$ |
161,028 |
|
|
$ |
— |
|
|
$ |
— |
|
|
$ |
161,028 |
|
| Equity securities held at fair value: |
|
|
|
|
|
|
|
|
|
|
|
|
|
|
|
|
| Farmer Mac stock |
|
$ |
49 |
|
|
$ |
515 |
|
|
$ |
— |
|
|
$ |
564 |
|
| Affordable Housing MBS Exchange Traded Fund |
|
|
24,994 |
|
|
|
— |
|
|
|
3,585 |
|
|
|
21,409 |
|
| Total equity securities, held at fair value |
|
$ |
25,043 |
|
|
$ |
515 |
|
|
$ |
3,585 |
|
|
$ |
21,973 |
|
| |
|
|
|
|
Gross |
|
|
Gross |
|
|
|
|
| |
|
|
|
|
Unrealized |
|
|
Unrealized |
|
|
Carrying |
|
| (In thousands) |
|
Cost |
|
|
Gains |
|
|
Losses |
|
|
Value |
|
| December 31, 2024 |
|
|
|
|
|
|
|
|
|
|
|
|
|
|
|
|
| Equity securities held at cost: |
|
|
|
|
|
|
|
|
|
|
|
|
|
|
|
|
| Federal Reserve Bank stock |
|
$ |
100,567 |
|
|
$ |
— |
|
|
$ |
— |
|
|
$ |
100,567 |
|
| Federal Home Loan Bank stock |
|
|
10,410 |
|
|
|
— |
|
|
|
— |
|
|
|
10,410 |
|
| Other equity securities |
|
|
20,582 |
|
|
|
— |
|
|
|
— |
|
|
|
20,582 |
|
| Total equity securities, held at cost |
|
$ |
131,559 |
|
|
$ |
— |
|
|
$ |
— |
|
|
$ |
131,559 |
|
| Equity securities held at fair value: |
|
|
|
|
|
|
|
|
|
|
|
|
|
|
|
|
| Farmer Mac stock |
|
$ |
49 |
|
|
$ |
543 |
|
|
$ |
— |
|
|
$ |
592 |
|
| Affordable Housing MBS Exchange Traded Fund |
|
|
24,994 |
|
|
|
— |
|
|
|
3,908 |
|
|
|
21,086 |
|
| Total equity securities, held at fair value |
|
$ |
25,043 |
|
|
$ |
543 |
|
|
$ |
3,908 |
|
|
$ |
21,678 |
|
NOTE 3. LOANS AND LEASES
The following table is a summary of our loan and lease portfolio aggregated by segment and class at the periods indicated:
| (In thousands) |
|
March 31, 2025 |
|
|
December 31, 2024 |
|
| Commercial and industrial |
|
|
|
|
|
|
|
|
| Non-real estate |
|
$ |
8,688,653 |
|
|
$ |
8,670,529 |
|
| Owner occupied |
|
|
4,667,477 |
|
|
|
4,665,015 |
|
| Total commercial and industrial |
|
|
13,356,130 |
|
|
|
13,335,544 |
|
| Commercial real estate |
|
|
|
|
|
|
|
|
| Construction, acquisition and development |
|
|
3,723,408 |
|
|
|
3,909,184 |
|
| Income producing |
|
|
6,268,456 |
|
|
|
6,015,773 |
|
| Total commercial real estate |
|
|
9,991,864 |
|
|
|
9,924,957 |
|
| Consumer |
|
|
|
|
|
|
|
|
| Residential mortgages |
|
|
10,498,320 |
|
|
|
10,267,883 |
|
| Other consumer |
|
|
205,296 |
|
|
|
213,371 |
|
| Total consumer |
|
|
10,703,616 |
|
|
|
10,481,254 |
|
| Total loans and leases, net of unearned income (1) |
|
$ |
34,051,610 |
|
|
$ |
33,741,755 |
|
|
(1) |
Total loans and leases are net of $16.4 million and $21.4 million of unearned income at March 31, 2025 and December 31, 2024, respectively. |
The Company engages in lending to consumers, small and medium-sized business enterprises, and government entities through its community
banking locations and to regional and national business enterprises through its corporate banking division. The bank acts as agent or participant in SNC and other financing arrangements with other financial institutions. Loans are issued generally to
finance home purchases and improvements, personal expenditures, business investment and operations, construction and development, and income producing properties. Loans are underwritten to be repaid primarily by available cash flow from personal
income, investment income, business operations, rental income, or the sale of developed or constructed properties. Collateral and personal guaranties of business owners are generally required as a condition of the financing arrangements and provide
additional cash flow and proceeds from asset sales of guarantors in the event primary sources of repayment are no longer sufficient.
While loans are structured to provide protection to the Company if borrowers are unable to repay as agreed, the Company recognizes there
are numerous risks that may result in deterioration of the repayment ability of borrowers and guarantors. These risks include failure of business operations due to economic, legal, market, logistical, weather, health, governmental and force majeure
events. Concentrations in the Company’s loan and lease portfolio also present credit risks. The impact of a slowing economy, inflation, higher interest rates, and labor and supply chain shortages, poses additional risk to borrowers and financial
institutions. As a result of these factors, there is risk for businesses to experience difficulty in meeting repayment obligations, and the Company may experience losses or deterioration in performance in its loan portfolio. For information regarding
nonaccrual policies, past-dues or delinquency status, and recognizing write-offs within ACL, refer to “Note 1 - Summary of Significant Accounting Policies” included in Part II., Item 8 of the Company’s Annual Report on Form 10-K for the year ended
December 31, 2024.
The Company has identified the following segments and classes of loans and leases with similar risk characteristics for measuring
expected credit losses:
Commercial and Industrial
Non-Real Estate – Commercial and industrial loans are loans and leases to finance business operations, equipment and
owner-occupied facilities for small and medium-sized enterprises, as well as larger corporate borrowers. These include both lines of credit and term loans which are amortized over the useful life of the assets financed. Personal and/or corporate
guarantees are generally obtained where available and prudent. This category also includes loans to finance agricultural production. The Company recognizes risk from economic cycles, commodity prices, pandemics, government regulation, supply-chain
disruptions, product innovations or obsolescence, operational errors, lawsuits, natural disasters, losses due to fraud, theft or embezzlement, loss of sponsor support, health or loss of key personnel or competitive situations may adversely affect the
scheduled repayment of business loans. In addition, risks in the agricultural sector including crop failures due to weather, insects and other blights, commodity prices, governmental intervention, lawsuits, labor or logistical disruptions.
Owner Occupied – Owner occupied loans include loans secured by business facilities to finance business operations, equipment and
owner-occupied facilities primarily for small and medium-sized enterprises. These include both lines of credit and term loans which are amortized over the useful life of the assets financed. Personal guarantees, if applicable, are generally required
for these loans. The Company recognizes that risk from economic cycles, pandemics, government regulation, supply-chain disruptions, product innovations or obsolescence, operational errors, lawsuits, natural disasters, losses due to theft or
embezzlement, health or loss of key personnel, or competitive situations may adversely affect the scheduled repayment of business loans.
Commercial Real Estate
Construction, Acquisition and Development – CAD loans include both loans and credit lines for the purpose of purchasing, carrying, and
developing land into residential subdivisions or various types of commercial developments, such as industrial, warehouse, retail, office, and multi-family. This category also includes loans and credit lines for construction of residential, multi-family
and commercial buildings. The Company generally engages in CAD lending primarily in local markets served by its branches. The Company recognizes that risks are inherent in the financing of real estate development and construction. These risks include
location, market conditions and price volatility, change in interest rates, demand for developed land, lots and buildings, desirability of features and styling of completed developments and buildings, competition from other developments and builders,
traffic patterns, remote work patterns, governmental jurisdiction, tax structure, availability of utilities, roads, public transportation and schools, availability of permanent financing for homebuyers, zoning, environmental restrictions, lawsuits,
economic and business cycle, labor, and reputation of the builder or developer.
Each CAD loan is underwritten to address: (i) the desirability of the project, its market viability and projected absorption period; (ii)
the creditworthiness of the borrower and the guarantor as to liquidity, cash flow and assets available to ensure performance of the loan; (iii) equity contribution to the project; (iv) the developer’s experience and success with similar projects; and
(v) the value of the collateral.
A substantial portion of CAD loans are secured by real estate in markets in which the Company is located. The Company’s loan policy generally
prohibits loans for the sole purpose of carrying interest reserves. Certain of the construction, acquisition and development loans were structured with interest-only terms. A portion of the residential mortgage and CRE portfolios were originated
through the permanent financing of construction, acquisition and development loans. Higher interest rates and the potential for slowing economic conditions could negatively impact borrowers’ and guarantors’ ability to repay their debt which would make
more of the Company’s loans collateral-dependent.
Income Producing – CRE loans include loans to finance income-producing commercial and multi-family properties. Lending in this category is
generally limited to properties located in the Company’s market area with only limited exposure to properties located elsewhere but owned by in-market borrowers. Loans in this category include loans for neighborhood retail centers, medical and
professional offices, single retail stores, industrials and apartments leased generally to local businesses and residents. The underwriting of these loans takes into consideration the occupancy and rental rates as well as the financial health of the
borrower. The Company’s exposure to national retail tenants is limited. The Company recognizes that risk from economic cycles, pandemics, government restrictions, delayed or missed rent payments, supply-chain disruptions, operational errors, lawsuits,
natural disasters, losses due to theft or embezzlement, health or loss of key personnel or competitive situations may adversely affect the scheduled repayment of business loans.
Consumer
Residential Mortgages – Residential mortgages are first or second-lien loans to consumers secured by a primary residence or second
home. This category includes traditional mortgages, home equity loans and revolving lines of credit. The loans are generally secured by properties located within the local market area of the community bank which originates and services the loan. These
loans are underwritten in accordance with the Company’s general loan policies and procedures which require, among other things, proper documentation of each borrower’s financial condition, satisfactory credit history, and property value. In addition to
loans originated through the Company’s branches, the Company originates and services residential mortgages sold in the secondary market which are underwritten and closed pursuant to investor and agency guidelines. At March 31, 2025 and December 31,
2024, residential mortgage loans in process of foreclosure totaled $21.1 million and $19.7 million, respectively. Additionally, the Company held $5.3 million and $4.4 million in foreclosed residential properties at March 31, 2025 and December 31, 2024,
respectively.
Other Consumer – Other consumer lending includes consumer credit cards as well as personal revolving lines of credit and
installment loans. The Company offers credit cards, primarily to its deposit and loan customers. Consumer installment loans generally includes term loans secured by automobiles, boats and recreational vehicles.
The Company recognizes there are risks in consumer lending which include interruptions in the borrower’s personal and investment income
due to loss of employment, market conditions, and general economic conditions, deterioration in the health and well-being of the borrower and family members, natural disasters, pandemics, lawsuits, losses, or inability to generate income due to injury,
accidents, theft, vandalism, or incarceration.
Credit Quality
The following tables provide details regarding the aging of the Company’s loan and lease portfolio, net of unearned income, at the periods
indicated:
| |
|
March 31, 2025 |
|
| |
|
|
|
|
|
|
|
|
|
|
|
|
|
|
|
|
|
|
|
90+ Days |
|
| |
|
30-59 |
|
|
60-89 |
|
|
|
|
|
|
|
|
|
|
|
Total |
|
|
Past Due |
|
| |
|
Days |
|
|
Days |
|
|
90+ Days |
|
|
Total |
|
|
|
|
|
Amortized |
|
|
still |
|
| (In thousands) |
|
Past Due |
|
|
Past Due |
|
|
Past Due |
|
|
Past Due |
|
|
Current |
|
|
Cost |
|
|
Accruing |
|
| Commercial and industrial |
|
|
|
|
|
|
|
|
|
|
|
|
|
|
|
|
|
|
|
|
|
|
|
|
|
|
|
|
| Non-real estate |
|
$ |
18,896 |
|
|
$ |
12,272 |
|
|
$ |
84,947 |
|
|
$ |
116,115 |
|
|
$ |
8,572,538 |
|
|
$ |
8,688,653 |
|
|
$ |
3,851 |
|
| Owner occupied |
|
|
8,592 |
|
|
|
8,029 |
|
|
|
18,021 |
|
|
|
34,642 |
|
|
|
4,632,835 |
|
|
|
4,667,477 |
|
|
|
1,094 |
|
| Total commercial and industrial |
|
|
27,488 |
|
|
|
20,301 |
|
|
|
102,968 |
|
|
|
150,757 |
|
|
|
13,205,373 |
|
|
|
13,356,130 |
|
|
|
4,945 |
|
| Commercial real estate |
|
|
|
|
|
|
|
|
|
|
|
|
|
|
|
|
|
|
|
|
|
|
|
|
|
|
|
|
| Construction, acquisition and development |
|
|
5,828 |
|
|
|
232 |
|
|
|
9,092 |
|
|
|
15,152 |
|
|
|
3,708,256 |
|
|
|
3,723,408 |
|
|
|
495 |
|
| Income producing |
|
|
7,026 |
|
|
|
893 |
|
|
|
7,088 |
|
|
|
15,007 |
|
|
|
6,253,449 |
|
|
|
6,268,456 |
|
|
|
— |
|
| Total commercial real estate |
|
|
12,854 |
|
|
|
1,125 |
|
|
|
16,180 |
|
|
|
30,159 |
|
|
|
9,961,705 |
|
|
|
9,991,864 |
|
|
|
495 |
|
| Consumer |
|
|
|
|
|
|
|
|
|
|
|
|
|
|
|
|
|
|
|
|
|
|
|
|
|
|
|
|
| Residential mortgages |
|
|
56,649 |
|
|
|
30,150 |
|
|
|
55,459 |
|
|
|
142,258 |
|
|
|
10,356,062 |
|
|
|
10,498,320 |
|
|
|
3,091 |
|
| Other consumer |
|
|
1,267 |
|
|
|
525 |
|
|
|
482 |
|
|
|
2,274 |
|
|
|
203,022 |
|
|
|
205,296 |
|
|
|
301 |
|
| Total consumer |
|
|
57,916 |
|
|
|
30,675 |
|
|
|
55,941 |
|
|
|
144,532 |
|
|
|
10,559,084 |
|
|
|
10,703,616 |
|
|
|
3,392 |
|
| Total |
|
$ |
98,258 |
|
|
$ |
52,101 |
|
|
$ |
175,089 |
|
|
$ |
325,448 |
|
|
$ |
33,726,162 |
|
|
$ |
34,051,610 |
|
|
$ |
8,832 |
|
| |
|
December 31, 2024 |
|
| |
|
|
|
|
|
|
|
|
|
|
|
|
|
|
|
|
|
|
|
90+ Days |
|
| |
|
30-59 |
|
|
60-89 |
|
|
|
|
|
|
|
|
|
|
|
Total |
|
|
Past Due |
|
| |
|
Days |
|
|
Days |
|
|
90+ Days |
|
|
Total |
|
|
|
|
|
Amortized |
|
|
Still |
|
| (In thousands) |
|
Past Due |
|
|
Past Due |
|
|
Past Due |
|
|
Past Due |
|
|
Current |
|
|
Cost |
|
|
Accruing |
|
| Commercial and industrial |
|
|
|
|
|
|
|
|
|
|
|
|
|
|
|
|
|
|
|
|
|
|
|
|
|
|
|
|
| Non-real estate |
|
$ |
13,443 |
|
|
$ |
28,379 |
|
|
$ |
101,873 |
|
|
$ |
143,695 |
|
|
$ |
8,526,834 |
|
|
$ |
8,670,529 |
|
|
$ |
8,115 |
|
| Owner occupied |
|
|
10,375 |
|
|
|
3,836 |
|
|
|
16,280 |
|
|
|
30,491 |
|
|
|
4,634,524 |
|
|
|
4,665,015 |
|
|
|
— |
|
| Total commercial and industrial |
|
|
23,818 |
|
|
|
32,215 |
|
|
|
118,153 |
|
|
|
174,186 |
|
|
|
13,161,358 |
|
|
|
13,335,544 |
|
|
|
8,115 |
|
| Commercial real estate |
|
|
|
|
|
|
|
|
|
|
|
|
|
|
|
|
|
|
|
|
|
|
|
|
|
|
|
|
| Construction, acquisition and development |
|
|
4,254 |
|
|
|
663 |
|
|
|
8,579 |
|
|
|
13,496 |
|
|
|
3,895,688 |
|
|
|
3,909,184 |
|
|
|
— |
|
| Income producing |
|
|
3,971 |
|
|
|
1,226 |
|
|
|
12,193 |
|
|
|
17,390 |
|
|
|
5,998,383 |
|
|
|
6,015,773 |
|
|
|
— |
|
| Total commercial real estate |
|
|
8,225 |
|
|
|
1,889 |
|
|
|
20,772 |
|
|
|
30,886 |
|
|
|
9,894,071 |
|
|
|
9,924,957 |
|
|
|
— |
|
| Consumer |
|
|
|
|
|
|
|
|
|
|
|
|
|
|
|
|
|
|
|
|
|
|
|
|
|
|
|
|
| Residential mortgages |
|
|
60,009 |
|
|
|
28,937 |
|
|
|
61,578 |
|
|
|
150,524 |
|
|
|
10,117,359 |
|
|
|
10,267,883 |
|
|
|
4,750 |
|
| Other consumer |
|
|
1,587 |
|
|
|
455 |
|
|
|
413 |
|
|
|
2,455 |
|
|
|
210,916 |
|
|
|
213,371 |
|
|
|
261 |
|
| Total consumer |
|
|
61,596 |
|
|
|
29,392 |
|
|
|
61,991 |
|
|
|
152,979 |
|
|
|
10,328,275 |
|
|
|
10,481,254 |
|
|
|
5,011 |
|
| Total |
|
$ |
93,639 |
|
|
$ |
63,496 |
|
|
$ |
200,916 |
|
|
$ |
358,051 |
|
|
$ |
33,383,704 |
|
|
$ |
33,741,755 |
|
|
$ |
13,126 |
|
The Company utilizes an internal loan classification system that is continually updated to grade loans
according to certain credit quality indicators. These credit quality indicators include, but are not limited to, recent credit performance, delinquency, liquidity, cash flows, debt coverage ratios, collateral type and loan-to-value ratio. The Company’s
internal loan classification system is compatible with classifications used by regulatory agencies. Loans may be classified as follows:
Pass: Loans which are performing as agreed with few or no signs of weakness. These loans show sufficient cash flow, capital
and collateral to repay the loan as agreed.
Special Mention: Loans where potential weaknesses have developed which could cause a more serious problem if not corrected.
Substandard: Loans where well-defined weaknesses exist that require corrective action to prevent further deterioration.
Loans are further characterized by the possibility that the Company will sustain some loss if the deficiencies are not corrected.
Doubtful: Loans having all the characteristics of Substandard and which have deteriorated to a point where collection and
liquidation in full is highly questionable.
Loss: Loans that are considered uncollectible or with limited possible recovery.
Impaired: An internal grade for individually analyzed collateral-dependent loans for which a specific provision has been
considered to address the unsupported exposure.
PCD (Loss): An internal grade for loans with evidence of deterioration of credit quality since origination that are
acquired, and for which it is probable, at acquisition, that the bank will be unable to collect all contractually required payments.
The following tables provide details of the Company’s loan and lease portfolio, net of unearned income,
by segment, class and internally assigned grade at the periods indicated:
| |
|
March 31, 2025 |
|
| (In thousands) |
|
Pass |
|
|
Special
Mention |
|
|
Substandard (1) |
|
|
Doubtful |
|
|
Impaired (1) |
|
|
PCD (Loss) |
|
|
Total |
|
| Commercial and industrial |
|
|
|
|
|
|
|
|
|
|
|
|
|
|
|
|
|
|
|
|
|
|
|
|
|
|
|
|
| Non-real estate |
|
$ |
8,234,513 |
|
|
$ |
108,903 |
|
|
$ |
317,012 |
|
|
$ |
8,556 |
|
|
$ |
16,227 |
|
|
$ |
3,442 |
|
|
$ |
8,688,653 |
|
| Owner occupied |
|
|
4,617,617 |
|
|
|
— |
|
|
|
38,174 |
|
|
|
— |
|
|
|
10,592 |
|
|
|
1,094 |
|
|
|
4,667,477 |
|
| Total commercial and industrial |
|
|
12,852,130 |
|
|
|
108,903 |
|
|
|
355,186 |
|
|
|
8,556 |
|
|
|
26,819 |
|
|
|
4,536 |
|
|
|
13,356,130 |
|
| Commercial real estate |
|
|
|
|
|
|
|
|
|
|
|
|
|
|
|
|
|
|
|
|
|
|
|
|
|
|
|
|
| Construction, acquisition and development |
|
|
3,710,504 |
|
|
|
— |
|
|
|
7,031 |
|
|
|
— |
|
|
|
5,873 |
|
|
|
— |
|
|
|
3,723,408 |
|
| Income producing |
|
|
6,078,353 |
|
|
|
39,412 |
|
|
|
144,159 |
|
|
|
— |
|
|
|
6,532 |
|
|
|
— |
|
|
|
6,268,456 |
|
| Total commercial real estate |
|
|
9,788,857 |
|
|
|
39,412 |
|
|
|
151,190 |
|
|
|
— |
|
|
|
12,405 |
|
|
|
— |
|
|
|
9,991,864 |
|
| Consumer |
|
|
|
|
|
|
|
|
|
|
|
|
|
|
|
|
|
|
|
|
|
|
|
|
|
|
|
|
| Residential mortgages |
|
|
10,392,396 |
|
|
|
— |
|
|
|
99,305 |
|
|
|
— |
|
|
|
5,208 |
|
|
|
1,411 |
|
|
|
10,498,320 |
|
| Other consumer |
|
|
204,701 |
|
|
|
— |
|
|
|
595 |
|
|
|
— |
|
|
|
— |
|
|
|
— |
|
|
|
205,296 |
|
| Total consumer |
|
|
10,597,097 |
|
|
|
— |
|
|
|
99,900 |
|
|
|
— |
|
|
|
5,208 |
|
|
|
1,411 |
|
|
|
10,703,616 |
|
| Total |
|
$ |
33,238,084 |
|
|
$ |
148,315 |
|
|
$ |
606,276 |
|
|
$ |
8,556 |
|
|
$ |
44,432 |
|
|
$ |
5,947 |
|
|
$ |
34,051,610 |
|
| |
|
|
|
|
|
|
|
|
|
|
|
|
|
|
|
|
|
|
|
|
|
|
|
|
|
|
|
|
|
(1) |
In the loan classifications above, $107.6 million of the substandard balance and $9.2 million of the impaired balance is covered by government guarantees from the SBA, FHA, VA and USDA. |
| |
|
December 31, 2024 |
|
| (In thousands) |
|
Pass |
|
|
Special
Mention |
|
|
Substandard (1) |
|
|
Doubtful |
|
|
Impaired (1) |
|
|
PCD (Loss) |
|
|
Total |
|
| Commercial and industrial |
|
|
|
|
|
|
|
|
|
|
|
|
|
|
|
|
|
|
|
|
|
|
|
|
|
|
|
|
| Non-real estate |
|
$ |
8,208,176 |
|
|
$ |
106,996 |
|
|
$ |
311,096 |
|
|
$ |
8,743 |
|
|
$ |
31,996 |
|
|
$ |
3,522 |
|
|
$ |
8,670,529 |
|
| Owner occupied |
|
|
4,610,775 |
|
|
|
815 |
|
|
|
41,363 |
|
|
|
— |
|
|
|
10,968 |
|
|
|
1,094 |
|
|
|
4,665,015 |
|
| Total commercial and industrial |
|
|
12,818,951 |
|
|
|
107,811 |
|
|
|
352,459 |
|
|
|
8,743 |
|
|
|
42,964 |
|
|
|
4,616 |
|
|
|
13,335,544 |
|
| Commercial real estate |
|
|
|
|
|
|
|
|
|
|
|
|
|
|
|
|
|
|
|
|
|
|
|
|
|
|
|
|
| Construction, acquisition and development |
|
|
3,896,856 |
|
|
|
— |
|
|
|
12,262 |
|
|
|
— |
|
|
|
66 |
|
|
|
— |
|
|
|
3,909,184 |
|
| Income producing |
|
|
5,850,702 |
|
|
|
5,094 |
|
|
|
144,084 |
|
|
|
— |
|
|
|
15,893 |
|
|
|
— |
|
|
|
6,015,773 |
|
| Total commercial real estate |
|
|
9,747,558 |
|
|
|
5,094 |
|
|
|
156,346 |
|
|
|
— |
|
|
|
15,959 |
|
|
|
— |
|
|
|
9,924,957 |
|
| Consumer |
|
|
|
|
|
|
|
|
|
|
|
|
|
|
|
|
|
|
|
|
|
|
|
|
|
|
|
|
| Residential mortgages |
|
|
10,167,830 |
|
|
|
891 |
|
|
|
89,597 |
|
|
|
— |
|
|
|
8,154 |
|
|
|
1,411 |
|
|
|
10,267,883 |
|
| Other consumer |
|
|
212,865 |
|
|
|
— |
|
|
|
506 |
|
|
|
— |
|
|
|
— |
|
|
|
— |
|
|
|
213,371 |
|
| Total consumer |
|
|
10,380,695 |
|
|
|
891 |
|
|
|
90,103 |
|
|
|
— |
|
|
|
8,154 |
|
|
|
1,411 |
|
|
|
10,481,254 |
|
| Total |
|
$ |
32,947,204 |
|
|
$ |
113,796 |
|
|
$ |
598,908 |
|
|
$ |
8,743 |
|
|
$ |
67,077 |
|
|
$ |
6,027 |
|
|
$ |
33,741,755 |
|
|
(1) |
In the loan classifications above, $99.0 million of the substandard balance and $11.1 million of the impaired balance is covered by government guarantees from the SBA, FHA, VA and USDA. |
The following tables provide credit quality indicators, including gross charge-offs, by class and period of origination (vintage) at March 31, 2025:
| |
|
Commercial and Industrial - Non-Real Estate |
|
| |
|
Period Originated: |
|
|
|
|
|
|
|
|
|
|
| |
|
|
|
|
|
|
|
|
|
|
|
|
|
|
|
|
|
|
|
|
|
|
Revolving |
|
|
|
|
| |
|
|
|
|
|
|
|
|
|
|
|
|
|
|
|
|
|
|
|
|
|
|
Loans |
|
|
|
|
| |
|
|
|
|
|
|
|
|
|
|
|
|
|
|
|
|
|
|
|
Revolving |
|
|
Converted to |
|
|
|
|
| (Dollars in thousands) |
|
2025 |
|
|
2024 |
|
|
2023 |
|
|
2022 |
|
|
2021 |
|
|
Prior |
|
|
Loans |
|
|
Term |
|
|
Total |
|
| Pass |
|
$ |
399,959 |
|
|
$ |
1,425,735 |
|
|
$ |
853,579 |
|
|
$ |
987,675 |
|
|
$ |
555,780 |
|
|
$ |
663,422 |
|
|
$ |
3,333,933 |
|
|
$ |
14,430 |
|
|
$ |
8,234,513 |
|
| Special Mention |
|
|
— |
|
|
|
5,972 |
|
|
|
10,803 |
|
|
|
210 |
|
|
|
32,067 |
|
|
|
18,345 |
|
|
|
41,506 |
|
|
|
— |
|
|
|
108,903 |
|
| Substandard |
|
|
1,263 |
|
|
|
16,779 |
|
|
|
71,669 |
|
|
|
54,468 |
|
|
|
40,413 |
|
|
|
34,874 |
|
|
|
88,526 |
|
|
|
9,020 |
|
|
|
317,012 |
|
| Doubtful |
|
|
— |
|
|
|
— |
|
|
|
— |
|
|
|
— |
|
|
|
8,556 |
|
|
|
— |
|
|
|
— |
|
|
|
— |
|
|
|
8,556 |
|
| Impaired |
|
|
— |
|
|
|
— |
|
|
|
1,446 |
|
|
|
2,695 |
|
|
|
8,664 |
|
|
|
— |
|
|
|
3,422 |
|
|
|
— |
|
|
|
16,227 |
|
| PCD (Loss) |
|
|
— |
|
|
|
— |
|
|
|
— |
|
|
|
— |
|
|
|
— |
|
|
|
3,442 |
|
|
|
— |
|
|
|
— |
|
|
|
3,442 |
|
| Total |
|
$ |
401,222 |
|
|
$ |
1,448,486 |
|
|
$ |
937,497 |
|
|
$ |
1,045,048 |
|
|
$ |
645,480 |
|
|
$ |
720,083 |
|
|
$ |
3,467,387 |
|
|
$ |
23,450 |
|
|
$ |
8,688,653 |
|
| % Criticized |
|
|
0.3 |
% |
|
|
1.6 |
% |
|
|
9.0 |
% |
|
|
5.5 |
% |
|
|
13.9 |
% |
|
|
7.9 |
% |
|
|
3.8 |
% |
|
|
38.5 |
% |
|
|
5.2 |
% |
| Gross charge-offs |
|
$ |
314 |
|
|
$ |
158 |
|
|
$ |
2,288 |
|
|
$ |
1,894 |
|
|
$ |
228 |
|
|
$ |
531 |
|
|
$ |
15,452 |
|
|
$ |
— |
|
|
$ |
20,865 |
|
| |
|
|
Commercial and Industrial - Owner Occupied |
|
| |
|
Period Originated: |
|
|
|
|
|
|
|
|
|
|
|
|
|
| |
|
|
|
|
|
|
|
|
|
|
|
|
|
|
|
|
|
|
|
|
|
|
|
|
|
|
|
|
|
Revolving |
|
|
|
|
|
| |
|
|
|
|
|
|
|
|
|
|
|
|
|
|
|
|
|
|
|
|
|
|
|
|
|
|
|
|
|
Loans |
|
|
|
|
|
| |
|
|
|
|
|
|
|
|
|
|
|
|
|
|
|
|
|
|
|
|
|
|
|
|
|
Revolving |
|
|
Converted to |
|
|
|
|
|
| (Dollars in thousands) |
|
2025 |
|
|
2024 |
|
|
2023 |
|
|
2022 |
|
|
2021 |
|
|
Prior |
|
|
Loans |
|
|
Term |
|
|
Total |
|
| Pass |
|
$ |
177,685 |
|
|
$ |
678,030 |
|
|
$ |
585,424 |
|
|
$ |
871,026 |
|
|
$ |
735,901 |
|
|
$ |
1,455,318 |
|
|
$ |
114,230 |
|
|
$ |
3 |
|
|
$ |
4,617,617 |
|
| Substandard |
|
|
— |
|
|
|
2,350 |
|
|
|
5,230 |
|
|
|
4,926 |
|
|
|
5,091 |
|
|
|
19,872 |
|
|
|
705 |
|
|
|
— |
|
|
|
38,174 |
|
| Impaired |
|
|
— |
|
|
|
394 |
|
|
|
2,331 |
|
|
|
5,799 |
|
|
|
793 |
|
|
|
1,275 |
|
|
|
— |
|
|
|
— |
|
|
|
10,592 |
|
| PCD (Loss) |
|
|
— |
|
|
|
— |
|
|
|
— |
|
|
|
— |
|
|
|
— |
|
|
|
1,094 |
|
|
|
— |
|
|
|
— |
|
|
|
1,094 |
|
| Total |
|
$ |
177,685 |
|
|
$ |
680,774 |
|
|
$ |
592,985 |
|
|
$ |
881,751 |
|
|
$ |
741,785 |
|
|
$ |
1,477,559 |
|
|
$ |
114,935 |
|
|
$ |
3 |
|
|
$ |
4,667,477 |
|
| % Criticized |
|
|
— |
% |
|
|
0.4 |
% |
|
|
1.3 |
% |
|
|
1.2 |
% |
|
|
0.8 |
% |
|
|
1.5 |
% |
|
|
0.6 |
% |
|
|
— |
% |
|
|
1.1 |
% |
| Gross charge-offs |
|
$ |
— |
|
|
$ |
— |
|
|
$ |
— |
|
|
$ |
99 |
|
|
$ |
261 |
|
|
$ |
59 |
|
|
$ |
— |
|
|
$ |
— |
|
|
$ |
419 |
|
| |
|
|
Construction, Acquisition, & Development |
|
| |
|
Period Originated: |
|
|
|
|
|
|
|
|
|
|
|
|
|
| |
|
|
|
|
|
|
|
|
|
|
|
|
|
|
|
|
|
|
|
|
|
|
|
|
|
|
|
|
|
Revolving |
|
|
|
|
|
| |
|
|
|
|
|
|
|
|
|
|
|
|
|
|
|
|
|
|
|
|
|
|
|
|
|
|
|
|
|
Loans |
|
|
|
|
|
| |
|
|
|
|
|
|
|
|
|
|
|
|
|
|
|
|
|
|
|
|
|
|
|
|
|
Revolving |
|
|
Converted to |
|
|
|
|
|
| (Dollars in thousands) |
|
2025 |
|
|
2024 |
|
|
2023 |
|
|
2022 |
|
|
2021 |
|
|
Prior |
|
|
Loans |
|
|
Term |
|
|
Total |
|
| Pass |
|
$ |
212,986 |
|
|
$ |
1,196,140 |
|
|
$ |
659,672 |
|
|
$ |
1,021,604 |
|
|
$ |
459,698 |
|
|
$ |
121,713 |
|
|
$ |
38,691 |
|
|
$ |
— |
|
|
$ |
3,710,504 |
|
| Substandard |
|
|
— |
|
|
|
555 |
|
|
|
2,442 |
|
|
|
2,956 |
|
|
|
435 |
|
|
|
551 |
|
|
|
92 |
|
|
|
— |
|
|
|
7,031 |
|
| Impaired |
|
|
— |
|
|
|
— |
|
|
|
— |
|
|
|
— |
|
|
|
5,807 |
|
|
|
66 |
|
|
|
— |
|
|
|
— |
|
|
|
5,873 |
|
| Total |
|
$ |
212,986 |
|
|
$ |
1,196,695 |
|
|
$ |
662,114 |
|
|
$ |
1,024,560 |
|
|
$ |
465,940 |
|
|
$ |
122,330 |
|
|
$ |
38,783 |
|
|
$ |
— |
|
|
$ |
3,723,408 |
|
| % Criticized |
|
|
— |
% |
|
|
— |
% |
|
|
0.4 |
% |
|
|
0.3 |
% |
|
|
1.3 |
% |
|
|
0.5 |
% |
|
|
0.2 |
% |
|
|
— |
% |
|
|
0.3 |
% |
| Gross charge-offs |
|
$ |
— |
|
|
$ |
— |
|
|
$ |
41 |
|
|
$ |
1 |
|
|
$ |
— |
|
|
$ |
— |
|
|
$ |
— |
|
|
$ |
— |
|
|
$ |
42 |
|
| |
|
|
Commercial Real Estate - Income Producing |
|
| |
|
Period Originated: |
|
|
|
|
|
|
|
|
|
|
|
|
|
| |
|
|
|
|
|
|
|
|
|
|
|
|
|
|
|
|
|
|
|
|
|
|
|
|
|
|
|
|
|
Revolving |
|
|
|
|
|
| |
|
|
|
|
|
|
|
|
|
|
|
|
|
|
|
|
|
|
|
|
|
|
|
|
|
|
|
|
|
Loans |
|
|
|
|
|
| |
|
|
|
|
|
|
|
|
|
|
|
|
|
|
|
|
|
|
|
|
|
|
|
|
|
Revolving |
|
|
Converted to |
|
|
|
|
|
| (Dollars in thousands) |
|
2025 |
|
|
2024 |
|
|
2023 |
|
|
2022 |
|
|
2021 |
|
|
Prior |
|
|
Loans |
|
|
Term |
|
|
Total |
|
| Pass |
|
$ |
124,515 |
|
|
$ |
506,646 |
|
|
$ |
559,259 |
|
|
$ |
1,794,376 |
|
|
$ |
1,174,937 |
|
|
$ |
1,793,141 |
|
|
$ |
125,479 |
|
|
$ |
— |
|
|
$ |
6,078,353 |
|
| Special Mention |
|
|
— |
|
|
|
— |
|
|
|
— |
|
|
|
— |
|
|
|
15,951 |
|
|
|
23,461 |
|
|
|
— |
|
|
|
— |
|
|
|
39,412 |
|
| Substandard |
|
|
— |
|
|
|
— |
|
|
|
211 |
|
|
|
688 |
|
|
|
6,823 |
|
|
|
133,699 |
|
|
|
2,738 |
|
|
|
— |
|
|
|
144,159 |
|
| Impaired |
|
|
— |
|
|
|
— |
|
|
|
— |
|
|
|
111 |
|
|
|
— |
|
|
|
6,421 |
|
|
|
— |
|
|
|
— |
|
|
|
6,532 |
|
| Total |
|
$ |
124,515 |
|
|
$ |
506,646 |
|
|
$ |
559,470 |
|
|
$ |
1,795,175 |
|
|
$ |
1,197,711 |
|
|
$ |
1,956,722 |
|
|
$ |
128,217 |
|
|
$ |
— |
|
|
$ |
6,268,456 |
|
| % Criticized |
|
|
— |
% |
|
|
— |
% |
|
|
— |
% |
|
|
— |
% |
|
|
1.9 |
% |
|
|
8.4 |
% |
|
|
2.1 |
% |
|
|
— |
% |
|
|
3.0 |
% |
| Gross charge-offs |
|
$ |
— |
|
|
$ |
— |
|
|
$ |
252 |
|
|
$ |
772 |
|
|
$ |
240 |
|
|
$ |
76 |
|
|
$ |
— |
|
|
$ |
— |
|
|
$ |
1,340 |
|
| |
|
|
Consumer - Residential Mortgages |
|
| |
|
Period Originated: |
|
|
|
|
|
|
|
|
|
|
|
|
|
| |
|
|
|
|
|
|
|
|
|
|
|
|
|
|
|
|
|
|
|
|
|
|
|
|
|
|
|
|
|
Revolving |
|
|
|
|
|
| |
|
|
|
|
|
|
|
|
|
|
|
|
|
|
|
|
|
|
|
|
|
|
|
|
|
|
|
|
|
Loans |
|
|
|
|
|
| |
|
|
|
|
|
|
|
|
|
|
|
|
|
|
|
|
|
|
|
|
|
|
|
|
|
Revolving |
|
|
Converted to |
|
|
|
|
|
| (Dollars in thousands) |
|
2025 |
|
|
2024 |
|
|
2023 |
|
|
2022 |
|
|
2021 |
|
|
Prior |
|
|
Loans |
|
|
Term |
|
|
Total |
|
| Pass |
|
$ |
372,018 |
|
|
$ |
1,343,514 |
|
|
$ |
1,472,860 |
|
|
$ |
1,965,782 |
|
|
$ |
1,502,659 |
|
|
$ |
2,635,652 |
|
|
$ |
1,099,248 |
|
|
$ |
663 |
|
|
$ |
10,392,396 |
|
| Substandard |
|
|
367 |
|
|
|
2,270 |
|
|
|
12,697 |
|
|
|
18,426 |
|
|
|
17,943 |
|
|
|
42,331 |
|
|
|
5,271 |
|
|
|
— |
|
|
|
99,305 |
|
| Impaired |
|
|
— |
|
|
|
— |
|
|
|
1,222 |
|
|
|
— |
|
|
|
1,303 |
|
|
|
2,683 |
|
|
|
— |
|
|
|
— |
|
|
|
5,208 |
|
| PCD (Loss) |
|
|
— |
|
|
|
— |
|
|
|
— |
|
|
|
— |
|
|
|
— |
|
|
|
1,411 |
|
|
|
— |
|
|
|
— |
|
|
|
1,411 |
|
| Total |
|
$ |
372,385 |
|
|
$ |
1,345,784 |
|
|
$ |
1,486,779 |
|
|
$ |
1,984,208 |
|
|
$ |
1,521,905 |
|
|
$ |
2,682,077 |
|
|
$ |
1,104,519 |
|
|
$ |
663 |
|
|
$ |
10,498,320 |
|
| % Criticized |
|
|
0.1 |
% |
|
|
0.2 |
% |
|
|
0.9 |
% |
|
|
0.9 |
% |
|
|
1.3 |
% |
|
|
1.7 |
% |
|
|
0.5 |
% |
|
|
— |
% |
|
|
1.0 |
% |
| Gross charge-offs |
|
$ |
— |
|
|
$ |
— |
|
|
$ |
55 |
|
|
$ |
1,076 |
|
|
$ |
2 |
|
|
$ |
71 |
|
|
$ |
92 |
|
|
$ |
— |
|
|
$ |
1,296 |
|
| |
|
|
Consumer - Other Consumer |
|
| |
|
Period Originated: |
|
|
|
|
|
|
|
|
|
|
|
|
|
| |
|
|
|
|
|
|
|
|
|
|
|
|
|
|
|
|
|
|
|
|
|
|
|
|
|
|
|
|
|
Revolving |
|
|
|
|
|
| |
|
|
|
|
|
|
|
|
|
|
|
|
|
|
|
|
|
|
|
|
|
|
|
|
|
|
|
|
|
Loans |
|
|
|
|
|
| |
|
|
|
|
|
|
|
|
|
|
|
|
|
|
|
|
|
|
|
|
|
|
|
|
|
Revolving |
|
|
Converted to |
|
|
|
|
|
| (Dollars in thousands) |
|
2025 |
|
|
2024 |
|
|
2023 |
|
|
2022 |
|
|
2021 |
|
|
Prior |
|
|
Loans |
|
|
Term |
|
|
Total |
|
| Pass |
|
$ |
15,793 |
|
|
$ |
36,480 |
|
|
$ |
24,895 |
|
|
$ |
9,045 |
|
|
$ |
4,960 |
|
|
$ |
4,293 |
|
|
$ |
109,235 |
|
|
$ |
— |
|
|
$ |
204,701 |
|
| Substandard |
|
|
— |
|
|
|
109 |
|
|
|
47 |
|
|
|
48 |
|
|
|
— |
|
|
|
30 |
|
|
|
361 |
|
|
|
— |
|
|
|
595 |
|
| Total |
|
$ |
15,793 |
|
|
$ |
36,589 |
|
|
$ |
24,942 |
|
|
$ |
9,093 |
|
|
$ |
4,960 |
|
|
$ |
4,323 |
|
|
$ |
109,596 |
|
|
$ |
— |
|
|
$ |
205,296 |
|
| % Criticized |
|
|
— |
% |
|
|
0.3 |
% |
|
|
0.2 |
% |
|
|
0.5 |
% |
|
|
— |
% |
|
|
0.7 |
% |
|
|
0.3 |
% |
|
|
— |
% |
|
|
0.3 |
% |
| Gross charge-offs |
|
$ |
767 |
|
|
$ |
139 |
|
|
$ |
71 |
|
|
$ |
29 |
|
|
$ |
6 |
|
|
$ |
10 |
|
|
$ |
744 |
|
|
$ |
— |
|
|
$ |
1,766 |
|
The following tables provide credit quality indicators, including gross charge-offs, by class and period of origination (vintage) at December 31, 2024.
| |
|
Commercial and Industrial - Non-Real Estate |
|
| |
|
Period Originated: |
|
|
|
|
|
|
|
|
|
|
| |
|
|
|
|
|
|
|
|
|
|
|
|
|
|
|
|
|
|
|
|
|
|
Revolving |
|
|
|
|
| |
|
|
|
|
|
|
|
|
|
|
|
|
|
|
|
|
|
|
|
|
|
|
Loans |
|
|
|
|
| |
|
|
|
|
|
|
|
|
|
|
|
|
|
|
|
|
|
|
|
Revolving |
|
|
Converted to |
|
|
|
|
| (Dollars in thousands) |
|
2024 |
|
|
2023 |
|
|
2022 |
|
|
2021 |
|
|
2020 |
|
|
Prior |
|
|
Loans |
|
|
Term |
|
|
Total |
|
| Pass |
|
$ |
1,361,684 |
|
|
$ |
926,422 |
|
|
$ |
1,036,579 |
|
|
$ |
695,625 |
|
|
$ |
209,100 |
|
|
$ |
563,337 |
|
|
$ |
3,397,031 |
|
|
$ |
18,398 |
|
|
$ |
8,208,176 |
|
| Special Mention |
|
|
13,242 |
|
|
|
10,942 |
|
|
|
— |
|
|
|
23,158 |
|
|
|
18,337 |
|
|
|
— |
|
|
|
41,317 |
|
|
|
— |
|
|
|
106,996 |
|
| Substandard |
|
|
8,855 |
|
|
|
49,842 |
|
|
|
70,136 |
|
|
|
43,832 |
|
|
|
12,370 |
|
|
|
27,648 |
|
|
|
75,638 |
|
|
|
22,775 |
|
|
|
311,096 |
|
| Doubtful |
|
|
— |
|
|
|
— |
|
|
|
— |
|
|
|
8,743 |
|
|
|
— |
|
|
|
— |
|
|
|
— |
|
|
|
— |
|
|
|
8,743 |
|
| Impaired |
|
|
— |
|
|
|
1,485 |
|
|
|
2,773 |
|
|
|
9,013 |
|
|
|
— |
|
|
|
— |
|
|
|
18,725 |
|
|
|
— |
|
|
|
31,996 |
|
| PCD (Loss) |
|
|
— |
|
|
|
— |
|
|
|
— |
|
|
|
— |
|
|
|
— |
|
|
|
3,522 |
|
|
|
— |
|
|
|
— |
|
|
|
3,522 |
|
| Total |
|
$ |
1,383,781 |
|
|
$ |
988,691 |
|
|
$ |
1,109,488 |
|
|
$ |
780,371 |
|
|
$ |
239,807 |
|
|
$ |
594,507 |
|
|
$ |
3,532,711 |
|
|
$ |
41,173 |
|
|
$ |
8,670,529 |
|
| % Criticized |
|
|
1.6 |
% |
|
|
6.3 |
% |
|
|
6.6 |
% |
|
|
10.9 |
% |
|
|
12.8 |
% |
|
|
5.2 |
% |
|
|
3.8 |
% |
|
|
55.3 |
% |
|
|
5.3 |
% |
| Gross charge-offs |
|
$ |
1,892 |
|
|
$ |
7,811 |
|
|
$ |
22,112 |
|
|
$ |
15,703 |
|
|
$ |
956 |
|
|
$ |
16,786 |
|
|
$ |
7,416 |
|
|
$ |
4,018 |
|
|
$ |
76,694 |
|
| |
|
Commercial and Industrial - Owner Occupied |
|
| |
|
Period Originated: |
|
|
|
|
|
|
|
|
|
|
| |
|
|
|
|
|
|
|
|
|
|
|
|
|
|
|
|
|
|
|
|
|
|
Revolving |
|
|
|
|
| |
|
|
|
|
|
|
|
|
|
|
|
|
|
|
|
|
|
|
|
|
|
|
Loans |
|
|
|
|
| |
|
|
|
|
|
|
|
|
|
|
|
|
|
|
|
|
|
|
|
Revolving |
|
|
Converted to |
|
|
|
|
| (Dollars in thousands) |
|
2024 |
|
|
2023 |
|
|
2022 |
|
|
2021 |
|
|
2020 |
|
|
Prior |
|
|
Loans |
|
|
Term |
|
|
Total |
|
| Pass |
|
$ |
704,999 |
|
|
$ |
607,548 |
|
|
$ |
893,114 |
|
|
$ |
756,156 |
|
|
$ |
402,671 |
|
|
$ |
1,122,908 |
|
|
$ |
123,149 |
|
|
$ |
230 |
|
|
$ |
4,610,775 |
|
| Special Mention |
|
|
— |
|
|
|
— |
|
|
|
— |
|
|
|
— |
|
|
|
815 |
|
|
|
— |
|
|
|
— |
|
|
|
— |
|
|
|
815 |
|
| Substandard |
|
|
2,249 |
|
|
|
5,616 |
|
|
|
6,638 |
|
|
|
5,204 |
|
|
|
2,057 |
|
|
|
18,889 |
|
|
|
710 |
|
|
|
— |
|
|
|
41,363 |
|
| Impaired |
|
|
394 |
|
|
|
2,335 |
|
|
|
5,911 |
|
|
|
1,053 |
|
|
|
— |
|
|
|
1,275 |
|
|
|
— |
|
|
|
— |
|
|
|
10,968 |
|
| PCD (Loss) |
|
|
— |
|
|
|
— |
|
|
|
— |
|
|
|
— |
|
|
|
— |
|
|
|
1,094 |
|
|
|
— |
|
|
|
— |
|
|
|
1,094 |
|
| Total |
|
$ |
707,642 |
|
|
$ |
615,499 |
|
|
$ |
905,663 |
|
|
$ |
762,413 |
|
|
$ |
405,543 |
|
|
$ |
1,144,166 |
|
|
$ |
123,859 |
|
|
$ |
230 |
|
|
$ |
4,665,015 |
|
| % Criticized |
|
|
0.4 |
% |
|
|
1.3 |
% |
|
|
1.4 |
% |
|
|
0.8 |
% |
|
|
0.7 |
% |
|
|
1.9 |
% |
|
|
0.6 |
% |
|
|
— |
% |
|
|
1.2 |
% |
| Gross charge-offs |
|
$ |
— |
|
|
$ |
1 |
|
|
$ |
263 |
|
|
$ |
6 |
|
|
$ |
41 |
|
|
$ |
67 |
|
|
$ |
1 |
|
|
$ |
— |
|
|
$ |
379 |
|
| |
|
Construction, Acquisition & Development |
|
| |
|
Period Originated: |
|
|
|
|
|
|
|
|
|
|
| |
|
|
|
|
|
|
|
|
|
|
|
|
|
|
|
|
|
|
|
|
|
|
Revolving |
|
|
|
|
| |
|
|
|
|
|
|
|
|
|
|
|
|
|
|
|
|
|
|
|
|
|
|
Loans |
|
|
|
|
| |
|
|
|
|
|
|
|
|
|
|
|
|
|
|
|
|
|
|
|
Revolving |
|
|
Converted to |
|
|
|
|
| (Dollars in thousands) |
|
2024 |
|
|
2023 |
|
|
2022 |
|
|
2021 |
|
|
2020 |
|
|
Prior |
|
|
Loans |
|
|
Term |
|
|
Total |
|
| Pass |
|
$ |
1,058,203 |
|
|
$ |
790,695 |
|
|
$ |
1,261,256 |
|
|
$ |
592,454 |
|
|
$ |
50,123 |
|
|
$ |
76,347 |
|
|
$ |
64,061 |
|
|
$ |
3,717 |
|
|
$ |
3,896,856 |
|
| Substandard |
|
|
264 |
|
|
|
2,032 |
|
|
|
3,514 |
|
|
|
5,889 |
|
|
|
304 |
|
|
|
259 |
|
|
|
— |
|
|
|
— |
|
|
|
12,262 |
|
| Impaired |
|
|
— |
|
|
|
— |
|
|
|
— |
|
|
|
— |
|
|
|
66 |
|
|
|
— |
|
|
|
— |
|
|
|
— |
|
|
|
66 |
|
| Total |
|
$ |
1,058,467 |
|
|
$ |
792,727 |
|
|
$ |
1,264,770 |
|
|
$ |
598,343 |
|
|
$ |
50,493 |
|
|
$ |
76,606 |
|
|
$ |
64,061 |
|
|
$ |
3,717 |
|
|
$ |
3,909,184 |
|
| % Criticized |
|
|
— |
% |
|
|
0.3 |
% |
|
|
0.3 |
% |
|
|
1.0 |
% |
|
|
0.7 |
% |
|
|
0.3 |
% |
|
|
— |
% |
|
|
— |
% |
|
|
0.3 |
% |
| Gross charge-offs |
|
$ |
— |
|
|
$ |
19 |
|
|
$ |
101 |
|
|
$ |
537 |
|
|
$ |
35 |
|
|
$ |
2 |
|
|
$ |
85 |
|
|
$ |
— |
|
|
$ |
779 |
|
| |
|
Commercial Real Estate - Income Producing |
|
| |
|
Period Originated: |
|
|
|
|
|
|
|
|
|
|
| |
|
|
|
|
|
|
|
|
|
|
|
|
|
|
|
|
|
|
|
|
|
|
Revolving |
|
|
|
|
| |
|
|
|
|
|
|
|
|
|
|
|
|
|
|
|
|
|
|
|
|
|
|
Loans |
|
|
|
|
| |
|
|
|
|
|
|
|
|
|
|
|
|
|
|
|
|
|
|
|
Revolving |
|
|
Converted to |
|
|
|
|
| (Dollars in thousands) |
|
2024 |
|
|
2023 |
|
|
2022 |
|
|
2021 |
|
|
2020 |
|
|
Prior |
|
|
Loans |
|
|
Term |
|
|
Total |
|
| Pass |
|
$ |
497,633 |
|
|
$ |
540,956 |
|
|
$ |
1,595,416 |
|
|
$ |
1,192,329 |
|
|
$ |
511,254 |
|
|
$ |
1,404,264 |
|
|
$ |
108,850 |
|
|
$ |
— |
|
|
$ |
5,850,702 |
|
| Special Mention |
|
|
— |
|
|
|
— |
|
|
|
2,881 |
|
|
|
— |
|
|
|
— |
|
|
|
— |
|
|
|
2,213 |
|
|
|
— |
|
|
|
5,094 |
|
| Substandard |
|
|
— |
|
|
|
459 |
|
|
|
468 |
|
|
|
7,690 |
|
|
|
70,889 |
|
|
|
64,084 |
|
|
|
494 |
|
|
|
— |
|
|
|
144,084 |
|
| Impaired |
|
|
— |
|
|
|
— |
|
|
|
4,885 |
|
|
|
1,114 |
|
|
|
— |
|
|
|
9,894 |
|
|
|
— |
|
|
|
— |
|
|
|
15,893 |
|
| Total |
|
$ |
497,633 |
|
|
$ |
541,415 |
|
|
$ |
1,603,650 |
|
|
$ |
1,201,133 |
|
|
$ |
582,143 |
|
|
$ |
1,478,242 |
|
|
$ |
111,557 |
|
|
$ |
— |
|
|
$ |
6,015,773 |
|
| % Criticized |
|
|
— |
% |
|
|
0.1 |
% |
|
|
0.5 |
% |
|
|
0.7 |
% |
|
|
12.2 |
% |
|
|
5.0 |
% |
|
|
2.4 |
% |
|
|
— |
% |
|
|
2.7 |
% |
| Gross charge-offs |
|
$ |
— |
|
|
$ |
— |
|
|
$ |
3 |
|
|
$ |
21 |
|
|
$ |
— |
|
|
$ |
2,479 |
|
|
$ |
— |
|
|
$ |
— |
|
|
$ |
2,503 |
|
| |
|
Consumer - Residential Mortgages |
|
| |
|
Period Originated: |
|
|
|
|
|
|
|
|
|
|
| |
|
|
|
|
|
|
|
|
|
|
|
|
|
|
|
|
|
|
|
|
|
|
Revolving |
|
|
|
|
| |
|
|
|
|
|
|
|
|
|
|
|
|
|
|
|
|
|
|
|
|
|
|
Loans |
|
|
|
|
| |
|
|
|
|
|
|
|
|
|
|
|
|
|
|
|
|
|
|
|
Revolving |
|
|
Converted to |
|
|
|
|
| (Dollars in thousands) |
|
2024 |
|
|
2023 |
|
|
2022 |
|
|
2021 |
|
|
2020 |
|
|
Prior |
|
|
Loans |
|
|
Term |
|
|
Total |
|
| Pass |
|
$ |
1,356,015 |
|
|
$ |
1,477,090 |
|
|
$ |
1,991,600 |
|
|
$ |
1,545,259 |
|
|
$ |
992,426 |
|
|
$ |
1,734,512 |
|
|
$ |
1,069,608 |
|
|
$ |
1,320 |
|
|
$ |
10,167,830 |
|
| Special Mention |
|
|
101 |
|
|
|
790 |
|
|
|
— |
|
|
|
— |
|
|
|
— |
|
|
|
— |
|
|
|
— |
|
|
|
— |
|
|
|
891 |
|
| Substandard |
|
|
1,549 |
|
|
|
12,696 |
|
|
|
18,477 |
|
|
|
14,661 |
|
|
|
9,145 |
|
|
|
28,774 |
|
|
|
4,295 |
|
|
|
— |
|
|
|
89,597 |
|
| Impaired |
|
|
— |
|
|
|
— |
|
|
|
— |
|
|
|
3,979 |
|
|
|
1,675 |
|
|
|
— |
|
|
|
2,500 |
|
|
|
— |
|
|
|
8,154 |
|
| PCD (Loss) |
|
|
— |
|
|
|
— |
|
|
|
— |
|
|
|
— |
|
|
|
— |
|
|
|
1,411 |
|
|
|
— |
|
|
|
— |
|
|
|
1,411 |
|
| Total |
|
$ |
1,357,665 |
|
|
$ |
1,490,576 |
|
|
$ |
2,010,077 |
|
|
$ |
1,563,899 |
|
|
$ |
1,003,246 |
|
|
$ |
1,764,697 |
|
|
$ |
1,076,403 |
|
|
$ |
1,320 |
|
|
$ |
10,267,883 |
|
| % Criticized |
|
|
0.1 |
% |
|
|
0.9 |
% |
|
|
0.9 |
% |
|
|
1.2 |
% |
|
|
1.1 |
% |
|
|
1.7 |
% |
|
|
0.6 |
% |
|
|
— |
% |
|
|
1.0 |
% |
| Gross charge-offs |
|
$ |
10 |
|
|
$ |
325 |
|
|
$ |
559 |
|
|
$ |
430 |
|
|
$ |
81 |
|
|
$ |
749 |
|
|
$ |
1,007 |
|
|
$ |
— |
|
|
$ |
3,161 |
|
| |
|
Consumer - Other Consumer |
|
| |
|
Period Originated: |
|
|
|
|
|
|
|
|
|
|
| |
|
|
|
|
|
|
|
|
|
|
|
|
|
|
|
|
|
|
|
|
|
|
Revolving |
|
|
|
|
| |
|
|
|
|
|
|
|
|
|
|
|
|
|
|
|
|
|
|
|
|
|
|
Loans |
|
|
|
|
| |
|
|
|
|
|
|
|
|
|
|
|
|
|
|
|
|
|
|
|
Revolving |
|
|
Converted to |
|
|
|
|
| (Dollars in thousands) |
|
2024 |
|
|
2023 |
|
|
2022 |
|
|
2021 |
|
|
2020 |
|
|
Prior |
|
|
Loans |
|
|
Term |
|
|
Total |
|
| Pass |
|
$ |
45,997 |
|
|
$ |
29,538 |
|
|
$ |
11,471 |
|
|
$ |
6,150 |
|
|
$ |
3,263 |
|
|
$ |
2,105 |
|
|
$ |
114,341 |
|
|
$ |
— |
|
|
$ |
212,865 |
|
| Substandard |
|
|
— |
|
|
|
97 |
|
|
|
48 |
|
|
|
6 |
|
|
|
— |
|
|
|
17 |
|
|
|
338 |
|
|
|
— |
|
|
|
506 |
|
| Total |
|
$ |
45,997 |
|
|
$ |
29,635 |
|
|
$ |
11,519 |
|
|
$ |
6,156 |
|
|
$ |
3,263 |
|
|
$ |
2,122 |
|
|
$ |
114,679 |
|
|
$ |
— |
|
|
$ |
213,371 |
|
| % Criticized |
|
|
— |
% |
|
|
0.3 |
% |
|
|
0.4 |
% |
|
|
0.1 |
% |
|
|
— |
% |
|
|
0.8 |
% |
|
|
0.3 |
% |
|
|
— |
% |
|
|
0.2 |
% |
| Gross charge-offs |
|
$ |
3,067 |
|
|
$ |
395 |
|
|
$ |
303 |
|
|
$ |
145 |
|
|
$ |
14 |
|
|
$ |
47 |
|
|
$ |
2,917 |
|
|
$ |
— |
|
|
$ |
6,888 |
|
The Company’s collateral-dependent loans totaled $58.9 million and $81.8 million at March 31, 2025 and December 31, 2024, respectively.
Typically these loans are internally classified as Impaired and PCD Loss. At March 31, 2025 and December 31, 2024, $8.6 million and $8.7 million, respectively, of these loans were classified as doubtful. At March 31, 2025, most of these loans are
within the non-real estate and owner occupied classes. Additionally, there were a smaller amount of these loans in the income producing, CAD, and residential mortgages classes. C&I loans are typically supported by collateral such as real estate,
receivables, equipment, inventory, or by an enterprise valuation. Loans within the CRE and Consumer segments are generally secured by commercial and residential real estate.
Loans of $1.0 million or greater are considered for specific provision when management has determined based on current information and
events, it is probable that the Company will be unable to collect all amounts due according to the contractual terms of the note and that the loan is collateral-dependent. At March 31, 2025 and December 31, 2024, $37.8 million and $59.1 million,
respectively, of collateral-dependent loans had a valuation allowance of $10.3 million and $17.3 million, respectively. The remaining balance of collateral-dependent loans of $21.1 million and $22.7 million at March 31, 2025 and December 31, 2024,
respectively, have sufficient collateral supporting the collection of all contractual principal and interest or were charged down to the underlying collateral’s fair value, less estimated selling costs. Therefore, such loans did not have an associated
valuation allowance.
NPLs consist of nonaccrual loans and leases. At March 31, 2025 and December 31, 2024, NPLs totaled $236.0 million and $264.7 million,
respectively. Within the NPL balance, $84.3 million of the March 31, 2025 balance and $89.9 million of the December 31, 2024 balance is covered by government guarantees from the SBA, FHA, VA or USDA.
The Company’s policy for all loan classifications provides that loans and leases are generally placed in nonaccrual status if, in
management’s opinion, payment in full of principal or interest is not expected, unless such loan or lease is both well-secured and in the process of collection.
The following table presents the amortized cost basis of loans on nonaccrual status by
segment and class at the periods indicated:
| |
|
March 31, 2025 |
|
|
December 31, 2024 |
|
| (In thousands) |
|
Nonaccrual Loans |
|
|
Nonaccrual Loans
with No Related
Allowance |
|
|
Nonaccrual Loans |
|
|
Nonaccrual Loans
with No Related
Allowance |
|
| Commercial and industrial |
|
|
|
|
|
|
|
|
|
|
|
|
|
|
|
|
| Non-real estate |
|
$ |
118,078 |
|
|
$ |
3,428 |
|
|
$ |
145,115 |
|
|
$ |
2,944 |
|
| Owner occupied |
|
|
18,988 |
|
|
|
5,292 |
|
|
|
16,904 |
|
|
|
5,128 |
|
| Total commercial and industrial |
|
|
137,066 |
|
|
|
8,720 |
|
|
|
162,019 |
|
|
|
8,072 |
|
| Commercial real estate |
|
|
|
|
|
|
|
|
|
|
|
|
|
|
|
|
| Construction, acquisition and development |
|
|
8,768 |
|
|
|
5,873 |
|
|
|
8,600 |
|
|
|
66 |
|
| Income producing |
|
|
8,021 |
|
|
|
2,338 |
|
|
|
18,542 |
|
|
|
6,569 |
|
| Total commercial real estate |
|
|
16,789 |
|
|
|
8,211 |
|
|
|
27,142 |
|
|
|
6,635 |
|
| Consumer |
|
|
|
|
|
|
|
|
|
|
|
|
|
|
|
|
| Residential mortgages |
|
|
81,803 |
|
|
|
174 |
|
|
|
75,287 |
|
|
|
3,979 |
|
| Other consumer |
|
|
294 |
|
|
|
— |
|
|
|
244 |
|
|
|
— |
|
| Total consumer |
|
|
82,097 |
|
|
|
174 |
|
|
|
75,531 |
|
|
|
3,979 |
|
| Total |
|
$ |
235,952 |
|
|
$ |
17,105 |
|
|
$ |
264,692 |
|
|
$ |
18,686 |
|
The following table presents the interest income recognized on loans on nonaccrual status by
segment and class for the periods indicated:
| |
|
Three Months Ended March 31, |
|
| (In thousands) |
|
2025 |
|
|
2024 |
|
| Commercial and industrial |
|
|
|
|
|
|
|
|
| Non-real estate |
|
$ |
447 |
|
|
$ |
597 |
|
| Owner occupied |
|
|
35 |
|
|
|
72 |
|
| Total commercial and industrial |
|
|
482 |
|
|
|
669 |
|
| Commercial real estate |
|
|
|
|
|
|
|
|
| Construction, acquisition and development |
|
|
19 |
|
|
|
21 |
|
| Income producing |
|
|
239 |
|
|
|
39 |
|
| Total commercial real estate |
|
|
258 |
|
|
|
60 |
|
| Consumer |
|
|
|
|
|
|
|
|
| Residential mortgages |
|
|
660 |
|
|
|
397 |
|
| Other consumer |
|
|
1 |
|
|
|
1 |
|
| Total consumer |
|
|
661 |
|
|
|
398 |
|
| Total |
|
$ |
1,401 |
|
|
$ |
1,127 |
|
In the normal course of business, management may grant concessions, which would not
otherwise be considered, to borrowers that are experiencing financial difficulty. Loans identified as meeting the criteria under ASC 310 are identified as financial difficulty modifications (FDM). Any modification, renewal or forbearance on loans
assigned a rating of “Special Mention” or worse, and loans of any rating which show evidence of financial difficulty is reviewed to determine whether the borrower is experiencing financial difficulty and if so, which terms of the loan were modified.
If the borrower is experiencing financial difficulty and the loan is modified via forgiveness of principal, reduction in interest rate to a rate below current market rates for issuance, payment extension or deferral for greater than six months
(including extensions granted in the past 12 months), term or maturity date extension, or combination of these specific modification terms, the modification requires disclosure.
Under the general loan modification guidance, a modification is treated
as a new loan only if both of the following conditions are met: 1) the terms of the new loan are at least as favorable to the lender as the terms for comparable loans to other customers with similar collection risks, and 2) modifications to the terms
of the original loan are more than minor. If either condition is not met, the modification is accounted for as the continuation of the old loan with any effect of the modification treated as a prospective adjustment to the loan’s effective interest
rate. Modifications in scope for borrowers experiencing financial difficulty may include principal forgiveness, other-than-insignificant payment delay, interest rate reduction, or a combination of modifications. During the three months ended March
31, 2025, the most common concessions were related to term extensions and interest rate reductions. Other concessions included payment deferrals. At March 31, 2025, the Company has an outstanding unfunded commitment balance of $1.1 million to lend to
one borrower experiencing financial difficulty.
Upon determination by the Company that a modified loan (or portion of a
loan) has subsequently been deemed uncollectible, the loan (or portion of the loan) is charged off. The amortized cost basis of the loan is reduced by the uncollectible amount and the ACL is adjusted by this amount.
The following tables presents loans that were modified within the past
three months for borrowers experiencing financial difficulty by segment and class, as well as the percentage of these modified loans compared to overall loans in each segment and class, for the three months ended March 31, 2025 and March 31, 2024:
| |
|
Three Months Ended March 31, 2025 |
|
| (Dollars in thousands) |
|
Payment Deferral |
|
|
Term Extension |
|
|
Combination
Interest Rate
Reduction and
Payment Deferral |
|
|
Combination
Term Extension
and Interest Rate
Reduction |
|
|
Percent of Total
Loan Class |
|
| Commercial and industrial |
|
|
|
|
|
|
|
|
|
|
|
|
|
|
|
|
|
|
|
|
| Non-real estate |
|
$ |
393 |
|
|
$ |
6,948 |
|
|
$ |
— |
|
|
$ |
36,529 |
|
|
|
0.50 |
% |
| Total commercial and industrial |
|
|
393 |
|
|
|
6,948 |
|
|
|
— |
|
|
|
36,529 |
|
|
|
0.33 |
% |
| Consumer |
|
|
|
|
|
|
|
|
|
|
|
|
|
|
|
|
|
|
|
|
| Residential mortgages |
|
|
284 |
|
|
|
— |
|
|
|
487 |
|
|
|
— |
|
|
|
0.01 |
% |
| Total consumer |
|
|
284 |
|
|
|
— |
|
|
|
487 |
|
|
|
— |
|
|
|
0.01 |
% |
| Total loans and leases, net of unearned income |
|
$ |
677 |
|
|
$ |
6,948 |
|
|
$ |
487 |
|
|
$ |
36,529 |
|
|
|
0.13 |
% |
| |
|
Three Months Ended March 31, 2024 |
|
| (Dollars in thousands) |
|
Principal
Forgiveness |
|
|
Term
Extension |
|
|
Interest Rate
Reduction |
|
|
Combination
Term
Extension and
Interest Rate
Reduction |
|
|
Combination Term
Extension,
Payment Deferral
and Interest Rate
Reduction |
|
|
Percent of Total
Loan Class |
|
| Commercial and industrial |
|
|
|
|
|
|
|
|
|
|
|
|
|
|
|
|
|
|
|
|
|
|
|
|
| Non-real estate |
|
$ |
13,614 |
|
|
$ |
21,432 |
|
|
$ |
— |
|
|
$ |
2,784 |
|
|
$ |
— |
|
|
|
0.41 |
% |
| Owner occupied |
|
|
— |
|
|
|
— |
|
|
|
— |
|
|
|
1,376 |
|
|
|
— |
|
|
|
0.03 |
|
| Total commercial and industrial |
|
|
13,614 |
|
|
|
21,432 |
|
|
|
— |
|
|
|
4,160 |
|
|
|
— |
|
|
|
0.29 |
|
| Commercial real estate |
|
|
|
|
|
|
|
|
|
|
|
|
|
|
|
|
|
|
|
|
|
|
|
|
| Income producing |
|
|
— |
|
|
|
1,981 |
|
|
|
— |
|
|
|
— |
|
|
|
12,786 |
|
|
|
0.26 |
|
| Total commercial real estate |
|
|
— |
|
|
|
1,981 |
|
|
|
— |
|
|
|
— |
|
|
|
12,786 |
|
|
|
0.15 |
|
| Consumer |
|
|
|
|
|
|
|
|
|
|
|
|
|
|
|
|
|
|
|
|
|
|
|
|
| Residential mortgages |
|
|
— |
|
|
|
128 |
|
|
|
116 |
|
|
|
612 |
|
|
|
— |
|
|
|
0.01 |
|
| Total consumer |
|
|
— |
|
|
|
128 |
|
|
|
116 |
|
|
|
612 |
|
|
|
— |
|
|
|
0.01 |
|
| Total loans and leases, net of unearned income |
|
$ |
13,614 |
|
|
$ |
23,541 |
|
|
$ |
116 |
|
|
$ |
4,772 |
|
|
$ |
12,786 |
|
|
|
0.17 |
% |
The following table presents the financial effect of the loan modifications presented above
for borrowers experiencing financial difficulty for the following periods:
| |
|
Three Months Ended March 31, 2025 |
|
|
Three Months Ended March 31, 2024 |
|
| (Dollars in thousands) |
|
Weighted-Average
Interest Rate
Reduction |
|
|
Weighted-Average
Term Extension (in
years) |
|
|
Principal
Forgiveness |
|
|
Weighted-
Average
Interest Rate
Reduction |
|
|
Weighted-
Average Term
Extension (in
years) |
|
| Commercial and industrial |
|
|
|
|
|
|
|
|
|
|
|
|
|
|
|
|
|
|
|
|
| Non-real estate |
|
|
2.01 |
% |
|
|
1.93 |
|
|
$ |
5,835 |
|
|
|
0.61 |
% |
|
|
1.56 |
|
| Commercial real estate |
|
|
|
|
|
|
|
|
|
|
|
|
|
|
|
|
|
|
|
|
| Income producing |
|
|
— |
|
|
|
— |
|
|
|
— |
|
|
|
0.54 |
|
|
|
1.37 |
|
| Consumer |
|
|
|
|
|
|
|
|
|
|
|
|
|
|
|
|
|
|
|
|
| Residential mortgages |
|
|
2.50 |
|
|
|
— |
|
|
|
— |
|
|
|
3.72 |
|
|
|
9.44 |
|
During the three months ended March 31, 2025, a C&I non-real estate
loan of $524 thousand defaulted that was previously modified in the prior 12 months by receiving a combination term extension and interest rate reduction.
The Company closely monitors the performance of the loans that are
modified to borrowers experiencing financial difficulty to understand the effectiveness of its modification efforts. Loans are considered to be in payment default at 90 or more days past due. The following table depicts the performance of loans that
have been modified in the last 12 months:
| |
|
Payment Status (Amortized Cost Basis) at March 31, 2025 |
|
| (In thousands) |
|
Current |
|
|
30-89 Days Past Due |
|
|
90+ Days Past Due |
|
| Commercial and industrial |
|
|
|
|
|
|
|
|
|
|
|
|
| Non-real estate |
|
$ |
78,434 |
|
|
$ |
749 |
|
|
$ |
524 |
|
| Owner occupied |
|
|
1,563 |
|
|
|
— |
|
|
|
— |
|
| Commercial real estate |
|
|
|
|
|
|
|
|
|
|
|
|
| Income producing |
|
|
75,584 |
|
|
|
— |
|
|
|
— |
|
| Consumer |
|
|
|
|
|
|
|
|
|
|
|
|
| Residential mortgages |
|
|
870 |
|
|
|
— |
|
|
|
— |
|
| Total |
|
$ |
156,451 |
|
|
$ |
749 |
|
|
$ |
524 |
|
NOTE 4. ALLOWANCE FOR CREDIT LOSSES
The following table summarizes the changes in the ACL for the periods
indicated:
| |
|
Three Months Ended March 31, |
|
| (In thousands) |
|
2025 |
|
|
2024 |
|
| Balance at beginning of period |
|
$ |
460,793 |
|
|
$ |
468,034 |
|
| Charge-offs |
|
|
(25,728 |
) |
|
|
(21,636 |
) |
| Recoveries |
|
|
2,726 |
|
|
|
2,177 |
|
| Provision for loan losses |
|
|
20,000 |
|
|
|
24,000 |
|
| Balance at end of period |
|
$ |
457,791 |
|
|
$ |
472,575 |
|
The following tables summarize the changes in the ACL by segment and class for the periods
indicated:
| |
|
Three Months Ended March 31, 2025 |
|
| (In thousands) |
|
Beginning
Balance |
|
|
Charge-offs |
|
|
Recoveries |
|
|
Provision
(Release) |
|
|
Ending Balance |
|
| Commercial and industrial |
|
|
|
|
|
|
|
|
|
|
|
|
|
|
|
|
|
|
|
|
| Non-real estate |
|
$ |
183,743 |
|
|
$ |
(20,865 |
) |
|
$ |
1,733 |
|
|
$ |
4,329 |
|
|
$ |
168,940 |
|
| Owner occupied |
|
|
35,177 |
|
|
|
(419 |
) |
|
|
89 |
|
|
|
(1,529 |
) |
|
|
33,318 |
|
| Total commercial and industrial |
|
|
218,920 |
|
|
|
(21,284 |
) |
|
|
1,822 |
|
|
|
2,800 |
|
|
|
202,258 |
|
| Commercial real estate |
|
|
|
|
|
|
|
|
|
|
|
|
|
|
|
|
|
|
|
|
| Construction, acquisition and development |
|
|
44,703 |
|
|
|
(42 |
) |
|
|
45 |
|
|
|
2,324 |
|
|
|
47,030 |
|
| Income producing |
|
|
64,957 |
|
|
|
(1,340 |
) |
|
|
38 |
|
|
|
2,990 |
|
|
|
66,645 |
|
| Total commercial real estate |
|
|
109,660 |
|
|
|
(1,382 |
) |
|
|
83 |
|
|
|
5,314 |
|
|
|
113,675 |
|
| Consumer |
|
|
|
|
|
|
|
|
|
|
|
|
|
|
|
|
|
|
|
|
| Residential mortgages |
|
|
125,464 |
|
|
|
(1,296 |
) |
|
|
398 |
|
|
|
10,237 |
|
|
|
134,803 |
|
| Other consumer |
|
|
6,749 |
|
|
|
(1,766 |
) |
|
|
423 |
|
|
|
1,649 |
|
|
|
7,055 |
|
| Total consumer |
|
|
132,213 |
|
|
|
(3,062 |
) |
|
|
821 |
|
|
|
11,886 |
|
|
|
141,858 |
|
| Total |
|
$ |
460,793 |
|
|
$ |
(25,728 |
) |
|
$ |
2,726 |
|
|
$ |
20,000 |
|
|
$ |
457,791 |
|
| |
|
Three Months Ended March 31, 2024 |
|
| (In thousands) |
|
Beginning
Balance |
|
|
Charge-offs |
|
|
Recoveries |
|
|
Provision
(Release) |
|
|
Ending
Balance |
|
| Commercial and industrial |
|
|
|
|
|
|
|
|
|
|
|
|
|
|
|
|
|
|
|
|
| Non-real estate |
|
$ |
194,577 |
|
|
$ |
(16,896 |
) |
|
$ |
1,234 |
|
|
$ |
29,684 |
|
|
$ |
208,599 |
|
| Owner occupied |
|
|
31,445 |
|
|
|
(101 |
) |
|
|
78 |
|
|
$ |
2,253 |
|
|
|
33,675 |
|
| Total commercial and industrial |
|
|
226,022 |
|
|
|
(16,997 |
) |
|
|
1,312 |
|
|
|
31,937 |
|
|
|
242,274 |
|
| Commercial real estate |
|
|
|
|
|
|
|
|
|
|
|
|
|
|
|
|
|
|
|
|
| Construction, acquisition and development |
|
|
42,118 |
|
|
|
(132 |
) |
|
|
112 |
|
|
$ |
(1,712 |
) |
|
|
40,386 |
|
| Income producing |
|
|
69,209 |
|
|
|
(2,112 |
) |
|
|
38 |
|
|
$ |
(4,413 |
) |
|
|
62,722 |
|
| Total commercial real estate |
|
|
111,327 |
|
|
|
(2,244 |
) |
|
|
150 |
|
|
|
(6,125 |
) |
|
|
103,108 |
|
| Consumer |
|
|
|
|
|
|
|
|
|
|
|
|
|
|
|
|
|
|
|
|
| Residential mortgages |
|
|
124,851 |
|
|
|
(595 |
) |
|
|
271 |
|
|
$ |
(3,063 |
) |
|
|
121,464 |
|
| Other consumer |
|
|
5,834 |
|
|
|
(1,800 |
) |
|
|
444 |
|
|
$ |
1,251 |
|
|
|
5,729 |
|
| Total consumer |
|
|
130,685 |
|
|
|
(2,395 |
) |
|
|
715 |
|
|
|
(1,812 |
) |
|
|
127,193 |
|
| Total |
|
$ |
468,034 |
|
|
$ |
(21,636 |
) |
|
$ |
2,177 |
|
|
$ |
24,000 |
|
|
$ |
472,575 |
|
The following table represents a roll forward of the reserve for unfunded commitments for the
periods shown. The reserve for unfunded commitments is classified in other liabilities in the consolidated balance sheets.
| |
|
Three Months Ended March 31, |
|
| (In thousands) |
|
2025 |
|
|
2024 |
|
| Balance at beginning of period |
|
$ |
8,551 |
|
|
$ |
8,551 |
|
| Provision (reversal) for credit losses for unfunded commitments |
|
|
— |
|
|
|
(2,000 |
) |
| Balance at end of period |
|
$ |
8,551 |
|
|
$ |
6,551 |
|
The economic impact of inflation, higher interest rates, volatility in
the financial markets, and the potential for a slowing economy poses additional risk to borrowers and financial institutions. These factors add to the risk borrowers may experience difficulty in meeting repayment obligations, and the Company may
experience losses or deterioration in performance in its loan portfolio.
The ACL estimate is impacted by both portfolio changes and changes in
economic conditions experienced during the period. The unemployment rate has the highest weighting within the Company’s credit risk modeling framework. Economic forecasts, which are obtained from multiple sources, provide upside, downside, and base
case scenarios over an eight-quarter forecast horizon to establish a forecast range. Management considers the scenarios and selects a blended scenario which, in management’s opinion, reflects likely economic conditions within that range. The Company
recognizes that inflation, higher interest rates and a slowing economy may have short-term, long-term, and regional impacts to the economy. In addition, qualitative factors such as changes in economic conditions, concentrations of risk, and changes
in portfolio risk resulting from regulatory changes are considered in determining the adequacy of the level of the ACL.
NOTE 5. BORROWINGS
Borrowings with original maturities of one year or less are classified
as short-term. The following tables present information relating to short-term debt for the periods presented:
| |
|
March 31, 2025 |
|
| |
|
End of Period |
|
|
Year to Date Daily Average |
|
|
Maximum
Outstanding |
|
| (Dollars in thousands) |
|
Balance |
|
|
Interest
Rate (1) |
|
|
Balance |
|
|
Interest
Rate (1) |
|
|
at any
Month End |
|
| Federal funds purchased |
|
$ |
— |
|
|
|
—% |
|
|
$ |
80,111 |
|
|
|
4.52 |
% |
|
$ |
300,000 |
|
| Securities sold under agreement to repurchase and other |
|
|
19,671 |
|
|
|
4.10 |
|
|
|
22,956 |
|
|
|
4.24 |
|
|
|
25,610 |
|
| Short-term FHLB advances |
|
|
235,000 |
|
|
|
4.36 |
|
|
|
28,278 |
|
|
|
4.43 |
|
|
|
235,000 |
|
| Total |
|
$ |
254,671 |
|
|
|
|
|
|
$ |
131,345 |
|
|
|
|
|
|
$ |
560,610 |
|
| |
|
December 31, 2024 |
|
| |
|
End of Period |
|
|
Year to Date Daily Average |
|
|
Maximum
Outstanding |
|
| (Dollars in thousands) |
|
Balance |
|
|
Interest
Rate |
|
|
Balance |
|
|
Interest
Rate |
|
|
at any
Month End |
|
| Federal funds purchased |
|
$ |
— |
|
|
|
—% |
|
|
$ |
5,077 |
|
|
|
5.28 |
% |
|
$ |
— |
|
| Securities sold under agreement to repurchase and other |
|
|
23,616 |
|
|
|
4.10 |
|
|
|
81,092 |
|
|
|
4.76 |
|
|
|
267,792 |
|
| Bank Term Funding Program |
|
|
— |
|
|
|
— |
|
|
|
2,845,902 |
|
|
|
4.79 |
|
|
|
3,500,000 |
|
| Short-term FHLB advances |
|
|
— |
|
|
|
— |
|
|
|
2 |
|
|
|
5.74 |
|
|
|
— |
|
| Total |
|
$ |
23,616 |
|
|
|
|
|
|
$ |
2,932,073 |
|
|
|
|
|
|
$ |
3,767,792 |
|
(1) Annualized
Federal funds purchased generally mature the day following the date of
purchase. At March 31, 2025 and December 31, 2024, the Company had established non-binding federal funds borrowing lines of credit with other banks aggregating $2.1 billion, for both periods. Additionally, the Company maintains access to the FRB
discount window borrowings which generally mature within 90 days and are collateralized by $2.1 billion in commercial, agriculture, and consumer loans pledged under a borrower-in-custody agreement at March 31, 2025. At March 31, 2025 and December 31,
2024, there were no borrowings from the FRB discount window.
Securities sold under repurchase agreements generally mature within one
day from the date of sale. The Company monitors collateral levels on a continuous basis and may be required to provide additional collateral based on the fair value of the underlying securities. Collateral pledged pursuant to these repurchase
agreements can include MBS issued or guaranteed by U.S. agencies, U.S. Treasury securities and U.S. government agency securities.
The BTFP was created by the Federal Reserve to support businesses and
households by making additional funding available to eligible financial institutions to help assure they have the ability to meet the needs of their depositors. The BTFP offered loans of up to one year in length to banks and other qualifying
institutions pledging any collateral eligible for purchase by the FRB. The collateral was valued at its par amount and consisted primarily of MBS and U.S. government agency securities. Cadence’s BTFP borrowing was paid off during the fourth quarter
of 2024. The BTFP ceased making new loans in March 2024.
As of March 31, 2025 and December 31, 2024, the Company had a balance of
$550.7 million and $706 thousand, respectively, of long-term advances from FHLB of Dallas. During the first quarter of 2025, the Company entered into $550.0 million long-term advances from FHLB of Dallas with various interest rates ranging from
4.082% to 4.219% and maturing beginning in September 2026 through March 2027. In addition, the Company had a balance of $10.0 million at both March 31, 2025 and December 31, 2024 of 5.000% fixed to floating rate subordinated notes callable on June
30, 2025.
All borrowings from the FHLB are collateralized by commercial,
construction, and real estate loans pledged under a blanket floating lien security agreement with the FHLB of Dallas. Under the terms of this agreement, the Company is required to maintain sufficient collateral to secure borrowings in an aggregate
amount of the lesser of the book value (i.e., unpaid principal balance), after applicable FHLB discounts, of the Company’s eligible commercial and residential loans pledged as collateral, or 35% of the Company’s assets. Loans totaling $24.7 billion
and $24.4 billion at March 31, 2025 and December 31, 2024, respectively, were pledged to the FHLB of Dallas. At March 31, 2025, the remaining borrowing availability totaled $12.5 billion. At March 31, 2025, there were no call features on long-term
FHLB borrowings. Short-term FHLB borrowings mature within one year following the date of the advance.
The FHLB of Dallas has also issued irrevocable letters of credit
totaling $47.5 million at March 31, 2025 on behalf of our customers. Of the total amount, $26.7 million expires on December 17, 2025 and $20.8 million expires on January 30, 2026.
NOTE 6. PENSION
The components of net periodic benefit cost (credit) for the periods
indicated were as follows:
| |
|
Three Months Ended March 31, |
|
| (In thousands) |
|
2025 |
|
|
2024 |
|
| Service cost |
|
$ |
2,330 |
|
|
$ |
1,907 |
|
| Interest cost |
|
|
2,963 |
|
|
|
2,941 |
|
| Expected return on plan assets |
|
|
(5,999 |
) |
|
|
(5,741 |
) |
| Recognized prior service cost |
|
|
3 |
|
|
|
3 |
|
| Recognized net loss |
|
|
724 |
|
|
|
733 |
|
| Net periodic benefit cost (credit) (1) |
|
$ |
21 |
|
|
$ |
(157 |
) |
|
(1) |
While service cost is included in salaries and employee benefits, the other components of net periodic pension costs (credit) are included in other noninterest expense in
the consolidated statements of income for the three months ended March 31, 2025 and 2024. |
NOTE 7. MORTGAGE SERVICING RIGHTS
The MSR, which are recognized as a separate asset on the date the
corresponding mortgage loan is sold on a servicing retained basis, is recorded at fair value as determined at each accounting period end and reported in other assets in the consolidated balance sheets. An estimate of the fair value of the Company’s
MSR is determined utilizing assumptions such as mortgage interest rates, discount rates, mortgage loan prepayment speeds, market trends and industry demand. Data and assumptions used in the fair value calculation related to the MSR were as follows:
| (Dollars in thousands) |
|
March 31, 2025 |
|
|
December 31, 2024 |
|
| Unpaid principal balance |
|
$ |
8,111,379 |
|
|
$ |
8,043,306 |
|
| Weighted-average prepayment speed (CPR) |
|
|
9.1 |
|
|
|
8.3 |
|
| Average discount rate (annual percentage) |
|
|
10.0 |
|
|
|
10.1 |
|
| Weighted-average coupon interest rate (percentage) |
|
|
4.3 |
|
|
|
4.2 |
|
| Weighted-average remaining maturity (months) |
|
|
285.3 |
|
|
|
285.7 |
|
| Weighted-average servicing fee (basis points) |
|
|
28.7 |
|
|
|
28.7 |
|
Because the valuation is determined by using discounted cash flow
models, the primary risk inherent in valuing the MSR is the impact of fluctuating interest rates on the estimated life of the servicing revenue stream. The use of different estimates or assumptions could produce different fair values. At March 31,
2025 and 2024, the Company had an economic hedge in place designed to cover 76.9% and 74.8% of the MSR interest rate risk, respectively. At December 31, 2024, the hedge covered 75.1% of the MSR
interest rate risk (see Note 14 for additional information). The Company is susceptible to fluctuations in the fair value of its MSR in changing interest rate environments.
The following table summarizes activity relating to residential mortgage loans sold with
servicing retained for the periods indicated:
| |
|
Three Months Ended March 31, |
|
| (In thousands) |
|
2025 |
|
|
2024 |
|
| Residential mortgage loans sold with servicing retained |
|
$ |
239,018 |
|
|
$ |
221,081 |
|
| Pretax gains resulting from above loan sales |
|
|
3,627 |
|
|
|
2,603 |
|
The Company services a class of residential mortgages that are first
lien loans secured by a primary residence or second home. The following table presents changes in the fair value of the MSR related to the activity in this class for the periods indicated:
| |
|
Three Months Ended March 31, |
|
| (In thousands) |
|
2025 |
|
|
2024 |
|
| Fair value, beginning of period |
|
$ |
114,594 |
|
|
$ |
106,824 |
|
| Originations of servicing assets |
|
|
2,796 |
|
|
|
2,736 |
|
| Changes in fair value: |
|
|
|
|
|
|
|
|
| Due to change in valuation inputs or assumptions(1) |
|
|
(4,447 |
) |
|
|
4,781 |
|
| Other changes in fair value(2) |
|
|
(1,974 |
) |
|
|
(2,656 |
) |
| Fair value, end of period |
|
$ |
110,969 |
|
|
$ |
111,685 |
|
|
(1) |
Primarily reflects changes in prepayment speeds and discount rate assumptions which are updated based on market interest rates. |
|
(2) |
Primarily reflects changes due to realized cash flows. |
All of the changes to the fair value of the MSR and the related economic
hedge are recorded as part of mortgage banking revenue in the consolidated statements of income. As part of mortgage banking revenue, the Company recorded contractual servicing fees of $5.7 million and $5.4 million, and late and other ancillary fees
of $829 thousand and $744 thousand for the three months ended March 31, 2025 and 2024, respectively.
NOTE 8. FAIR VALUE DISCLOSURES
See Note 13 to the consolidated financial statements of the Annual
Report on Form 10-K for the year ended December 31, 2024 for a description of valuation methodologies for assets and liabilities measured at fair value on a recurring and non-recurring basis.
Assets and Liabilities Recorded at Fair Value on a Recurring Basis
The following tables present the balances of the assets and liabilities
measured at fair value on a recurring basis:
| |
|
March 31, 2025 |
|
| (In thousands) |
|
Level 1 |
|
|
Level 2 |
|
|
Level 3 |
|
|
Total |
|
| Assets: |
|
|
|
|
|
|
|
|
|
|
|
|
| Available for sale securities |
|
$ |
— |
|
|
$ |
7,912,159 |
|
|
$ |
— |
|
|
$ |
7,912,159 |
|
| Equity investments |
|
|
21,973 |
|
|
|
— |
|
|
|
— |
|
|
|
21,973 |
|
| Mortgage servicing rights |
|
|
— |
|
|
|
— |
|
|
|
110,969 |
|
|
|
110,969 |
|
| Derivative instruments |
|
|
438 |
|
|
|
29,082 |
|
|
|
2,875 |
|
|
|
32,395 |
|
| Loans held for sale |
|
|
— |
|
|
|
220,441 |
|
|
|
— |
|
|
|
220,441 |
|
| Investments in limited partnerships |
|
|
— |
|
|
|
— |
|
|
|
125,665 |
|
|
|
125,665 |
|
| SBA servicing rights |
|
|
— |
|
|
|
— |
|
|
|
5,783 |
|
|
|
5,783 |
|
| Total |
|
$ |
22,411 |
|
|
$ |
8,161,682 |
|
|
$ |
245,292 |
|
|
$ |
8,429,385 |
|
| Liabilities: |
|
|
|
|
|
|
|
|
|
|
|
|
|
|
|
|
| Derivative instruments |
|
$ |
73 |
|
|
$ |
41,557 |
|
|
$ |
1 |
|
|
$ |
41,631 |
|
| |
|
December 31, 2024 |
|
| (In thousands) |
|
Level 1 |
|
|
Level 2 |
|
|
Level 3 |
|
|
Total |
|
| Assets: |
|
|
|
|
|
|
|
|
|
|
|
|
| Available for sale securities |
|
$ |
— |
|
|
$ |
7,293,988 |
|
|
$ |
— |
|
|
$ |
7,293,988 |
|
| Equity investments |
|
|
21,678 |
|
|
|
— |
|
|
|
— |
|
|
|
21,678 |
|
| Mortgage servicing rights |
|
|
— |
|
|
|
— |
|
|
|
114,594 |
|
|
|
114,594 |
|
| Derivative instruments |
|
|
— |
|
|
|
32,021 |
|
|
|
1,310 |
|
|
|
33,331 |
|
| Loans held for sale |
|
|
— |
|
|
|
244,192 |
|
|
|
— |
|
|
|
244,192 |
|
| Investments in limited partnerships |
|
|
— |
|
|
|
— |
|
|
|
118,710 |
|
|
|
118,710 |
|
| SBA servicing rights |
|
|
— |
|
|
|
— |
|
|
|
5,785 |
|
|
|
5,785 |
|
| Total |
|
$ |
21,678 |
|
|
$ |
7,570,201 |
|
|
$ |
240,399 |
|
|
$ |
7,832,278 |
|
| Liabilities: |
|
|
|
|
|
|
|
|
|
|
|
|
|
|
|
|
| Derivative instruments |
|
$ |
3,085 |
|
|
$ |
45,573 |
|
|
$ |
15 |
|
|
$ |
48,673 |
|
Level 3 financial instruments typically include unobservable components
but may also include some observable components that may be validated to external sources. The table below includes a roll forward of the consolidated balance sheet amounts for the three months ended March 31, 2025 and 2024 for changes in the fair
value of financial instruments within Level 3 of the valuation hierarchy that are recorded on a recurring basis. The gains or (losses) in the following table (which are reported in Other noninterest income in the consolidated statements of income)
may include changes to fair value due in part to observable factors that may be part of the valuation methodology.
| |
|
Three Months Ended March 31, 2025 |
|
| (In thousands) |
|
Mortgage
Servicing
Rights |
|
|
Investments
in Limited
Partnerships |
|
|
SBA
Servicing
Rights |
|
|
Mortgage Loan
Held-For-Sale
Interest Rate Lock
Commitments
(Assets and
Liabilities) |
|
| Balance at December 31, 2024 |
|
$ |
114,594 |
|
|
$ |
118,710 |
|
|
$ |
5,785 |
|
|
$ |
1,295 |
|
| Net (losses) gains |
|
|
(6,421 |
) |
|
|
2,344 |
|
|
|
(412 |
) |
|
|
1,579 |
|
| Additions |
|
|
2,796 |
|
|
|
— |
|
|
|
410 |
|
|
|
— |
|
| Contributions paid |
|
|
— |
|
|
|
6,842 |
|
|
|
— |
|
|
|
— |
|
| Distributions received |
|
|
— |
|
|
|
(2,231 |
) |
|
|
— |
|
|
|
— |
|
| Balance at March 31, 2025 |
|
$ |
110,969 |
|
|
$ |
125,665 |
|
|
$ |
5,783 |
|
|
$ |
2,874 |
|
| Net unrealized (losses) gains included in net income for the quarter relating to assets and liabilities held at March 31, 2025 |
|
$ |
(4,447 |
) |
|
$ |
2,344 |
|
|
$ |
(412 |
) |
|
$ |
1,579 |
|
| |
|
Three Months Ended March 31, 2024 |
|
| (In thousands) |
|
Mortgage
Servicing
Rights |
|
|
Investments
in Limited
Partnerships |
|
|
SBA
Servicing
Rights |
|
|
Mortgage Loan
Held-For-Sale
Interest Rate Lock
Commitments
(Assets and
Liabilities) |
|
| Balance at December 31, 2023 |
|
$ |
106,824 |
|
|
$ |
94,998 |
|
|
$ |
6,124 |
|
|
$ |
1,848 |
|
| Net gains (losses) |
|
|
2,125 |
|
|
|
1,000 |
|
|
|
(472 |
) |
|
|
732 |
|
| Additions |
|
|
2,736 |
|
|
|
— |
|
|
|
362 |
|
|
|
— |
|
| Contributions paid |
|
|
— |
|
|
|
8,210 |
|
|
|
— |
|
|
|
— |
|
| Distributions received |
|
|
— |
|
|
|
(2,695 |
) |
|
|
— |
|
|
|
— |
|
| Balance at March 31, 2024 |
|
$ |
111,685 |
|
|
$ |
101,513 |
|
|
$ |
6,014 |
|
|
$ |
2,580 |
|
| Net unrealized gains (losses) included in net income for the quarter relating to assets and liabilities held at March 31, 2024 |
|
$ |
4,781 |
|
|
$ |
1,000 |
|
|
$ |
(472 |
) |
|
$ |
732 |
|
Fair Value Option
The Company elected to measure commercial real estate loans held for
sale and commercial and industrial loans held for sale under the fair value option. Included in these loans are loans guaranteed by the SBA and loans related to syndications. The Company assumed the cost of these loans approximates their fair value
due to the short term these instruments remain on the Company’s balance sheet.
The Company also elected to measure residential mortgage loans held
for sale at fair value. The election allows for effective offset of the changes in fair values of the loans and the derivative instruments used to hedge them. Included in the residential mortgage loans held for sale portfolio are certain previously
sold GNMA loans. Under ASC 860-10-40, certain GNMA loans will not meet sale criteria due to the conditional buyback option becoming unconditional once the delinquency criteria is met when they reach 90 or more days past due. The Company records these
loans at fair value on the consolidated balance sheets with an offsetting liability. The Company assumed the cost approximates the fair value. At March 31, 2025 and December 31, 2024, the fair value of the GNMA loans totaled $66.1 million and $69.0
million, respectively.
The following table summarizes the difference between the aggregate fair value and the
aggregate unpaid principal balance of loans held for sale:
| |
|
March 31, 2025 |
|
|
December 31, 2024 |
|
| (In thousands) |
|
Aggregate
Fair Value |
|
|
Aggregate
Unpaid
Principal |
|
|
Aggregate
Fair Value
Less
Aggregate
Unpaid
Principal |
|
|
Aggregate
Fair Value |
|
|
Aggregate
Unpaid
Principal |
|
|
Aggregate
Fair Value
Less
Aggregate
Unpaid
Principal |
|
| Residential mortgage loans |
|
$ |
179,921 |
|
|
$ |
179,921 |
|
|
$ |
— |
|
|
$ |
181,622 |
|
|
$ |
181,622 |
|
|
$ |
— |
|
| Commercial and industrial loans |
|
|
36,242 |
|
|
|
36,242 |
|
|
|
— |
|
|
|
59,343 |
|
|
|
59,343 |
|
|
|
— |
|
| Commercial real estate loans |
|
|
4,278 |
|
|
|
4,278 |
|
|
|
— |
|
|
|
3,227 |
|
|
|
3,227 |
|
|
|
— |
|
| Total |
|
$ |
220,441 |
|
|
$ |
220,441 |
|
|
$ |
— |
|
|
$ |
244,192 |
|
|
$ |
244,192 |
|
|
$ |
— |
|
Net gains and losses resulting from changes in fair value for
residential mortgage loans held for sale are recorded in mortgage banking revenue in the consolidated statements of income. For the three months ended March 31, 2025 and 2024, the Company had net gains totaling $1.2 million and $1.8 million,
respectively.
Net gains and losses resulting from changes in fair value for commercial
and industrial loans and commercial real estate loans held for sale are recorded in other noninterest revenue in the consolidated statements of income. For the three months ended March 31, 2025 and 2024, the Company had net gains from the sale of
these loans totaling $2.0 million and $1.9 million, respectively.
Assets and Liabilities Recorded at Fair Value on a Nonrecurring Basis
From time to time, the Company may be required to measure certain
financial assets at fair value on a nonrecurring basis in accordance with GAAP. These adjustments to fair value usually result from the application of lower of cost or fair value accounting or write-downs of individual assets. The following tables
present the balances of assets measured at fair value on a nonrecurring basis:
| |
|
March 31, 2025 |
|
| (In thousands) |
|
Level 1 |
|
|
Level 2 |
|
|
Level 3 |
|
|
Total |
|
| Assets: |
|
|
|
|
|
|
|
|
|
|
|
|
| Impaired loans, collateral-dependent(1) |
|
$ |
— |
|
|
$ |
— |
|
|
$ |
52,988 |
|
|
$ |
52,988 |
|
| Purchased credit deteriorated (loss) loans |
|
|
— |
|
|
|
— |
|
|
|
5,947 |
|
|
|
5,947 |
|
| Other real estate and repossessed assets |
|
|
— |
|
|
|
— |
|
|
|
8,452 |
|
|
|
8,452 |
|
|
(1) |
At March 31, 2025, impaired loans, collateral-dependent includes $8.6 million which were classified as doubtful. |
| |
|
December 31, 2024 |
|
| (In thousands) |
|
Level 1 |
|
|
Level 2 |
|
|
Level 3 |
|
|
Total |
|
| Assets: |
|
|
|
|
|
|
|
|
|
|
|
|
| Impaired loans, collateral-dependent(1) |
|
$ |
— |
|
|
$ |
— |
|
|
$ |
75,820 |
|
|
$ |
75,820 |
|
| Purchased credit deteriorated (loss) loans |
|
|
— |
|
|
|
— |
|
|
|
6,027 |
|
|
|
6,027 |
|
| Other real estate and repossessed assets |
|
|
— |
|
|
|
— |
|
|
|
5,754 |
|
|
|
5,754 |
|
|
(1) |
At December 31, 2024, impaired loans, collateral-dependent includes $8.7 million which were classified as doubtful. |
Unobservable Inputs
The following table presents the significant unobservable inputs used in
Level 3 fair value measurements for financial assets measured at fair value on a recurring and nonrecurring basis:
| |
|
Quantitative Information about Level 3 Fair Value Measurements |
|
| (Dollars in thousands) |
|
Carrying
Value |
|
|
Valuation
Methods |
|
Unobservable
Inputs |
|
Range |
|
|
Weighted
Average |
|
| March 31, 2025 |
|
|
|
|
|
|
|
|
|
|
|
|
|
| Measured at fair value on a recurring basis: |
|
|
|
|
|
|
|
|
|
|
|
|
|
|
| Mortgage servicing rights(1) |
|
$ |
110,969 |
|
|
Discounted cash flow |
|
Discount rate |
|
9.5% - 11.1% |
|
|
10.0% |
|
| |
|
|
|
|
|
|
|
|
|
|
|
|
|
|
| |
|
|
|
|
|
|
|
Repayment speed
(CPR) |
|
6.9 - 14.1 |
|
|
9.0 |
|
| |
|
|
|
|
|
|
|
Coupon interest
rate |
|
3.2% - 7.9% |
|
|
4.3% |
|
| |
|
|
|
|
|
|
|
Remaining
maturity (months) |
|
68 - 401 |
|
|
285 |
|
| |
|
|
|
|
|
|
|
Servicing fee (bps) |
|
19.0 bps-50.0
bps |
|
|
28.7 bps |
|
| Investments in limited partnerships |
|
|
125,665 |
|
|
Practical
expedient |
|
Net asset value |
|
NM |
|
|
NM |
|
| SBA servicing rights(1) |
|
|
5,783 |
|
|
Coupon less
contractual
servicing cost |
|
Contractual
servicing
cost (bps) |
|
12.5 bps-40.0
bps |
|
|
26.3 bps |
|
| Mortgage loan held-for-sale interest rate lock commitments (assets and liabilities) |
|
|
2,874 |
|
|
Discounted cash
flow |
|
Closing ratio |
|
10.0% - 100% |
|
|
57.6% |
|
| Measured at fair value on a nonrecurring basis: |
|
|
|
|
|
|
|
|
|
|
|
|
|
|
| Impaired loans, collateral-dependent(1) |
|
$ |
52,988 |
|
|
Appraised value,
as adjusted |
|
Discount to fair
value |
|
10% - 61% |
|
|
35.5% |
|
| Purchased credit deteriorated (loss) loans(1) |
|
|
5,947 |
|
|
Appraised value,
as adjusted |
|
Discount to fair
value |
|
10% - 30% |
|
|
24.7% |
|
| Other real estate and repossessed assets |
|
|
8,452 |
|
|
Appraised value,
as adjusted |
|
Estimated closing
costs |
|
7.0% |
|
|
7.0% |
|
| |
|
Quantitative Information about Level 3 Fair Value Measurements |
|
| (Dollars in thousands) |
|
Carrying
Value |
|
|
Valuation
Methods |
|
Unobservable
Inputs |
|
Range |
|
|
Weighted
Average |
|
| December 31, 2024 |
|
|
|
|
|
|
|
|
|
|
|
|
|
| Measured at fair value on a recurring basis: |
|
|
|
|
|
|
|
|
|
|
|
|
|
|
| Mortgage servicing rights(1) |
|
$ |
114,594 |
|
|
Discounted cash flow |
|
Discount rate |
|
9.7% - 11.3% |
|
|
10.1% |
|
| |
|
|
|
|
|
|
|
Repayment
speed (CPR) |
|
6.8 - 12.6 |
|
|
8.3 |
|
| |
|
|
|
|
|
|
|
Coupon interest
rate |
|
3.2% - 7.9% |
|
|
4.2% |
|
| |
|
|
|
|
|
|
|
Remaining
maturity
(months) |
|
70 - 404 |
|
|
286 |
|
| |
|
|
|
|
|
|
|
Servicing fee
(bps) |
|
19.0 bps-50.0
bps |
|
|
28.7 bps |
|
| Investments in limited partnerships |
|
|
118,710 |
|
|
Practical expedient |
|
Net asset value |
|
NM |
|
|
NM |
|
| SBA servicing rights(1) |
|
|
5,785 |
|
|
Coupon less contractual
servicing cost |
|
Contractual
servicing cost
(bps) |
|
12.5 bps-40.0
bps |
|
|
26.3 bps |
|
| Mortgage loan held-for-sale interest rate lock commitments (assets and liabilities) |
|
|
1,295 |
|
|
Discounted cash flow |
|
Closing ratio |
|
10.0% - 100% |
|
|
46.8% |
|
| Measured at fair value on a nonrecurring basis: |
|
|
|
|
|
|
|
|
|
|
|
|
|
|
| Impaired loans, collateral-dependent(1) |
|
$ |
75,820 |
|
|
Appraised value, as
adjusted |
|
Discount to fair
value |
|
10% - 41% |
|
|
30.5% |
|
| Purchased credit deteriorated (loss) loans(1) |
|
|
6,027 |
|
|
Appraised value, as
adjusted |
|
Discount to fair
value |
|
10% - 30% |
|
|
24.7% |
|
| Other real estate and repossessed assets |
|
|
5,754 |
|
|
Appraised value, as
adjusted |
|
Estimated
closing costs |
|
7.0% |
|
|
7.0% |
|
|
(1) |
Weighted averages were calculated using the input attributed and the outstanding balance of the loan. |
Certain assets and liabilities subject to fair value disclosure
requirements are not actively traded, requiring management to estimate the fair value. These estimations necessarily require judgement to be applied to the reasonableness and relevancy of comparable market prices, expected future cash flows, and
appropriate discount rates.
The short-term nature of certain assets and liabilities result in their
carrying value approximating fair value. They include cash and due from banks, interest bearing deposits with other banks and Federal funds sold, accrued interest receivable, non-time deposits, federal funds purchased, securities sold under agreement
to repurchase, short-term FHLB borrowings and accrued interest payable.
The following tables present carrying and fair value information of financial instruments for the periods
presented:
| |
|
March 31, 2025 |
|
| (In thousands) |
|
Carrying
Value |
|
|
Fair Value |
|
|
Level 1 |
|
|
Level 2 |
|
|
Level 3 |
|
| Assets: |
|
|
|
|
|
|
|
|
|
|
|
|
|
|
|
| Cash and due from banks |
|
$ |
578,513 |
|
|
$ |
578,513 |
|
|
$ |
578,513 |
|
|
$ |
— |
|
|
$ |
— |
|
| Interest bearing deposits with other banks and Federal funds sold |
|
|
988,787 |
|
|
|
988,787 |
|
|
|
988,787 |
|
|
|
— |
|
|
|
— |
|
|
Available for sale securities and equity securities
with readily determinable fair values
|
|
|
7,934,132 |
|
|
|
7,934,132 |
|
|
|
21,973 |
|
|
|
7,912,159 |
|
|
|
— |
|
| Net loans and leases |
|
|
33,593,819 |
|
|
|
32,832,935 |
|
|
|
— |
|
|
|
— |
|
|
|
32,832,935 |
|
| Loans held for sale |
|
|
220,441 |
|
|
|
220,441 |
|
|
|
— |
|
|
|
220,441 |
|
|
|
— |
|
| Accrued interest receivable |
|
|
204,457 |
|
|
|
204,457 |
|
|
|
— |
|
|
|
28,130 |
|
|
|
176,327 |
|
| Mortgage servicing rights |
|
|
110,969 |
|
|
|
110,969 |
|
|
|
— |
|
|
|
— |
|
|
|
110,969 |
|
| Investments in limited partnerships |
|
|
125,665 |
|
|
|
125,665 |
|
|
|
— |
|
|
|
— |
|
|
|
125,665 |
|
| Other assets |
|
|
14,235 |
|
|
|
14,235 |
|
|
|
— |
|
|
|
— |
|
|
|
14,235 |
|
| |
|
|
|
|
|
|
|
|
|
|
|
|
|
|
|
|
|
|
|
|
| Liabilities: |
|
|
|
|
|
|
|
|
|
|
|
|
|
|
|
|
|
|
|
|
| Deposits |
|
$ |
40,335,728 |
|
|
$ |
40,332,683 |
|
|
$ |
— |
|
|
$ |
40,332,683 |
|
|
$ |
— |
|
| Federal funds purchased and securities sold under agreement to repurchase and other short-term borrowings |
|
|
19,671 |
|
|
|
19,671 |
|
|
|
19,671 |
|
|
|
— |
|
|
|
— |
|
| Short-term FHLB borrowings |
|
|
235,000 |
|
|
|
235,000 |
|
|
|
235,000 |
|
|
|
— |
|
|
|
— |
|
| Accrued interest payable |
|
|
140,637 |
|
|
|
140,637 |
|
|
|
1,471 |
|
|
|
139,166 |
|
|
|
— |
|
| Subordinated and long-term borrowings |
|
|
560,690 |
|
|
|
560,618 |
|
|
|
— |
|
|
|
560,618 |
|
|
|
— |
|
| |
|
|
|
|
|
|
|
|
|
|
|
|
|
|
|
|
|
|
|
|
| Derivative instruments: |
|
|
|
|
|
|
|
|
|
|
|
|
|
|
|
|
|
|
|
|
| Assets: |
|
|
|
|
|
|
|
|
|
|
|
|
|
|
|
|
|
|
|
|
| Commercial loan interest rate contracts |
|
$ |
28,675 |
|
|
$ |
28,675 |
|
|
$ |
— |
|
|
$ |
28,675 |
|
|
$ |
— |
|
| Mortgage loan held-for-sale interest rate lock commitments |
|
|
2,875 |
|
|
|
2,875 |
|
|
|
— |
|
|
|
— |
|
|
|
2,875 |
|
| Futures, forwards and options |
|
|
438 |
|
|
|
438 |
|
|
|
438 |
|
|
|
— |
|
|
|
— |
|
| Mortgage loan forward sale commitments |
|
|
6 |
|
|
|
6 |
|
|
|
— |
|
|
|
6 |
|
|
|
— |
|
| Foreign exchange contracts |
|
|
401 |
|
|
|
401 |
|
|
|
— |
|
|
|
401 |
|
|
|
— |
|
| Liabilities: |
|
|
|
|
|
|
|
|
|
|
|
|
|
|
|
|
|
|
|
|
| Commercial loan interest rate contracts |
|
$ |
40,181 |
|
|
$ |
40,181 |
|
|
$ |
— |
|
|
$ |
40,181 |
|
|
$ |
— |
|
| Mortgage loan held-for-sale interest rate lock commitments |
|
|
1 |
|
|
|
1 |
|
|
|
— |
|
|
|
— |
|
|
|
1 |
|
| Futures, forwards and options |
|
|
73 |
|
|
|
73 |
|
|
|
73 |
|
|
|
— |
|
|
|
— |
|
| Mortgage loan forward sale commitments |
|
|
1,147 |
|
|
|
1,147 |
|
|
|
— |
|
|
|
1,147 |
|
|
|
— |
|
| Foreign exchange contracts |
|
|
229 |
|
|
|
229 |
|
|
|
— |
|
|
|
229 |
|
|
|
— |
|
| |
|
December 31, 2024 |
|
| (In thousands) |
|
Carrying
Value |
|
|
Fair
Value |
|
|
Level 1 |
|
|
Level 2 |
|
|
Level 3 |
|
| Assets: |
|
|
|
|
|
|
|
|
|
|
|
|
|
|
|
| Cash and due from banks |
|
$ |
624,884 |
|
|
$ |
624,884 |
|
|
$ |
624,884 |
|
|
$ |
— |
|
|
$ |
— |
|
| Interest bearing deposits with other banks and Federal funds sold |
|
|
1,106,692 |
|
|
|
1,106,692 |
|
|
|
1,106,692 |
|
|
|
— |
|
|
|
— |
|
| Available for sale securities and equity securities with readily determinable fair values |
|
|
7,315,666 |
|
|
|
7,315,666 |
|
|
|
21,678 |
|
|
|
7,293,988 |
|
|
|
— |
|
| Net loans and leases |
|
|
33,280,962 |
|
|
|
32,440,220 |
|
|
|
— |
|
|
|
— |
|
|
|
32,440,220 |
|
| Loans held for sale |
|
|
244,192 |
|
|
|
244,192 |
|
|
|
— |
|
|
|
244,192 |
|
|
|
— |
|
| Accrued interest receivable |
|
|
196,670 |
|
|
|
196,670 |
|
|
|
— |
|
|
|
26,239 |
|
|
|
170,431 |
|
| Mortgage servicing rights |
|
|
114,594 |
|
|
|
114,594 |
|
|
|
— |
|
|
|
— |
|
|
|
114,594 |
|
| Investments in limited partnerships |
|
|
118,710 |
|
|
|
118,710 |
|
|
|
— |
|
|
|
— |
|
|
|
118,710 |
|
| Other assets |
|
|
11,539 |
|
|
|
11,539 |
|
|
|
— |
|
|
|
— |
|
|
|
11,539 |
|
| |
|
|
|
|
|
|
|
|
|
|
|
|
|
|
|
|
|
|
|
|
| Liabilities: |
|
|
|
|
|
|
|
|
|
|
|
|
|
|
|
|
|
|
|
|
| Deposits |
|
$ |
40,496,201 |
|
|
$ |
40,495,193 |
|
|
$ |
— |
|
|
$ |
40,495,193 |
|
|
$ |
— |
|
| Federal funds purchased and securities sold under agreement to repurchase and other short-term borrowings |
|
|
23,616 |
|
|
|
23,616 |
|
|
|
23,616 |
|
|
|
— |
|
|
|
— |
|
| Accrued interest payable |
|
|
110,853 |
|
|
|
110,853 |
|
|
|
3 |
|
|
|
110,850 |
|
|
|
— |
|
| Subordinated and long-term borrowings |
|
|
10,706 |
|
|
|
10,570 |
|
|
|
— |
|
|
|
10,570 |
|
|
|
— |
|
| |
|
|
|
|
|
|
|
|
|
|
|
|
|
|
|
|
|
|
|
|
| Derivative instruments: |
|
|
|
|
|
|
|
|
|
|
|
|
|
|
|
|
|
|
|
|
| Assets: |
|
|
|
|
|
|
|
|
|
|
|
|
|
|
|
|
|
|
|
|
| Commercial loan interest rate contracts |
|
$ |
30,555 |
|
|
$ |
30,555 |
|
|
$ |
— |
|
|
$ |
30,555 |
|
|
$ |
— |
|
| Mortgage loan held-for-sale interest rate lock commitments |
|
|
1,310 |
|
|
|
1,310 |
|
|
|
— |
|
|
|
— |
|
|
|
1,310 |
|
| Mortgage loan forward sale commitments |
|
|
816 |
|
|
|
816 |
|
|
|
— |
|
|
|
816 |
|
|
|
— |
|
| Foreign exchange contracts |
|
|
650 |
|
|
|
650 |
|
|
|
— |
|
|
|
650 |
|
|
|
— |
|
| Liabilities: |
|
|
|
|
|
|
|
|
|
|
|
|
|
|
|
|
|
|
|
|
| Commercial loan interest rate contracts |
|
$ |
45,070 |
|
|
$ |
45,070 |
|
|
$ |
— |
|
|
$ |
45,070 |
|
|
$ |
— |
|
| Mortgage loan held-for-sale interest rate lock commitments |
|
|
15 |
|
|
|
15 |
|
|
|
— |
|
|
|
— |
|
|
|
15 |
|
| Futures, forwards and options |
|
|
3,085 |
|
|
|
3,085 |
|
|
|
3,085 |
|
|
|
— |
|
|
|
— |
|
| Mortgage loan forward sale commitments |
|
|
34 |
|
|
|
34 |
|
|
|
— |
|
|
|
34 |
|
|
|
— |
|
| Foreign exchange contracts |
|
|
469 |
|
|
|
469 |
|
|
|
— |
|
|
|
469 |
|
|
|
— |
|
NOTE 9. SHARE-BASED COMPENSATION
The Company’s Long-Term Equity Incentive Plan (“Incentive Plan”),
Cadence Bank Equity Incentive Plan for Non- Employee Directors, 2021 Long-Term Equity Incentive Plan and the Amended and Restated 2015 Omnibus Incentive Plan (the “2015 Plan” assumed from Legacy Cadence) were effective during the year ended December
31, 2024, and allowed the Company to grant to employees and directors various forms of share-based incentive compensation. On December 30, 2024, the Cadence Bank 2025 Long-Term Incentive Plan (“the 2025 Plan”) was approved by the Company’s
shareholders. The 2025 Plan took effect as of December 30, 2024 and supersedes all four of the incentive plans previously mentioned.
The Company has primarily granted PSUs, RSUs and RSAs under its equity
incentive plans. PSUs entitle the recipient to receive shares of the Company’s common stock upon the achievement of performance goals that are specified in the award over a performance period. The recipient of PSUs is not treated as a shareholder of
the Company and is not entitled to vote or receive dividends until the performance conditions stated in the award are satisfied and the shares of stock are issued to the recipient. Dividend equivalents on the shares vested according to the
performance conditions are paid upon issuance of the stock. All PSUs vest over a three-year period and are valued at the fair value of the Company’s stock at the grant date based upon the estimated number of shares expected to vest determined
according to a lattice model. RSUs entitle the recipient to receive the shares once they are vested but with no voting rights until the shares are received. RSUs generally vest over four- to five-year periods and are eligible to receive dividend
equivalents, which accrue and are paid upon vesting. RSAs entitle the recipient to vote the shares of stock but the recipient does not receive the shares until they are fully vested. RSA grants vest over five- to seven-year periods and are entitled
to receive dividends.
For more information, see Note 14 to the consolidated financial statements to the Annual
Report on Form 10-K for the year ended December 31, 2024.
Performance Stock Units
The following table summarizes the Company’s PSU activity for the periods indicated:
| |
|
Three Months Ended March 31, |
|
| |
|
2025 |
|
|
2024 |
|
| |
|
Shares |
|
|
Weighted
Average Grant
Date Fair Value |
|
|
Shares |
|
|
Weighted
Average Grant
Date Fair Value |
|
| Nonvested at beginning of period |
|
|
1,211,606 |
|
|
$ |
25.34 |
|
|
|
1,967,631 |
|
|
$ |
26.17 |
|
| Granted during the period |
|
|
— |
|
|
|
— |
|
|
|
65,941 |
|
|
|
28.76 |
|
| Vested during the period |
|
|
(425,767 |
) |
|
|
27.98 |
|
|
|
(412,120 |
) |
|
|
28.76 |
|
| Forfeited during the period |
|
|
(23,600 |
) |
|
|
27.52 |
|
|
|
(14,772 |
) |
|
|
23.10 |
|
| Nonvested at end of period |
|
|
762,239 |
|
|
$ |
23.80 |
|
|
|
1,606,680 |
|
|
$ |
25.64 |
|
The Company recorded $197 thousand of compensation expense related to
the PSUs for the three months ended March 31, 2025, compared to $1.7 million for the three months ended March 31, 2024. At March 31, 2025, there was $9.8 million of unrecognized compensation cost related to PSUs that is expected to be recognized over
a weighted average period of 1.64 years.
Restricted Stock Units
The following table summarizes the Company’s RSU activity for the
periods indicated:
| |
|
Three Months Ended March 31, |
|
| |
|
2025 |
|
|
2024 |
|
| |
|
Shares |
|
|
Weighted
Average Grant
Date Fair Value |
|
|
Shares |
|
|
Weighted
Average Grant
Date Fair Value |
|
| Nonvested at beginning of period |
|
|
3,063,891 |
|
|
$ |
25.61 |
|
|
|
3,055,824 |
|
|
$ |
25.19 |
|
| Vested during the period |
|
|
(341,237 |
) |
|
|
20.54 |
|
|
|
(312,585 |
) |
|
|
28.69 |
|
| Forfeited during the period |
|
|
(26,773 |
) |
|
|
25.35 |
|
|
|
(61,220 |
) |
|
|
26.09 |
|
| Nonvested at end of period |
|
|
2,695,881 |
|
|
$ |
26.25 |
|
|
|
2,682,019 |
|
|
$ |
24.77 |
|
The Company recorded $4.3 million of compensation expense related to the
RSUs for both the three months ended March 31, 2025 and 2024. These amounts included $245 thousand and $287 thousand related to RSUs issued to the Company’s directors during the three months ended March 31, 2025 and 2024, respectively. At March 31,
2025, there was $37.3 million of unrecognized compensation cost related to RSUs that is expected to be recognized over a weighted average period of 2.49 years.
Restricted Stock Awards
The following table summarizes the Company’s RSA activity for the periods indicated:
| |
|
Three Months Ended March 31, |
|
| |
|
2025 |
|
|
2024 |
|
| |
|
Shares |
|
|
Weighted
Average Grant
Date Fair Value |
|
|
Shares |
|
|
Weighted
Average Grant
Date Fair Value |
|
| Nonvested at beginning of period |
|
|
247,537 |
|
|
$ |
28.67 |
|
|
|
526,868 |
|
|
$ |
28.14 |
|
| Vested during the period |
|
|
(2,922 |
) |
|
|
30.85 |
|
|
|
— |
|
|
|
— |
|
| Forfeited during the period |
|
|
(1,717 |
) |
|
|
31.47 |
|
|
|
(24,523 |
) |
|
|
28.54 |
|
| Nonvested at end of period |
|
|
242,898 |
|
|
$ |
28.62 |
|
|
|
502,345 |
|
|
$ |
28.12 |
|
The Company recorded $267 thousand of compensation expense related to
the RSAs for the three months ended March 31, 2025, compared to $38 thousand for the three months ended March 31, 2024. At March 31, 2025, there was $363 thousand of unrecognized compensation cost related to RSAs that is expected to be recognized
over a weighted average period of 1.38 years.
The following table presents information regarding the vesting of the
Company’s nonvested share-based compensation grants outstanding at March 31, 2025:
| |
|
|
Number of Shares |
|
| Period Ending |
|
|
PSU |
|
|
RSU |
|
|
RSA |
|
| December 31, 2025 |
|
|
— |
|
|
34,524 |
|
|
206,398 |
|
| December 31, 2026 |
|
|
508,868 |
|
|
1,599,012 |
|
|
— |
|
| December 31, 2027 |
|
|
253,371 |
|
|
688,660 |
|
|
36,500 |
|
| December 31, 2028 |
|
|
— |
|
|
357,496 |
|
|
— |
|
| December 31, 2029 and later |
|
|
— |
|
|
16,189 |
|
|
— |
|
| Total nonvested shares |
|
|
762,239 |
|
|
2,695,881 |
|
|
242,898 |
|
NOTE 10. EARNINGS PER SHARE AND DIVIDEND DATA
Basic and diluted EPS are calculated in accordance with ASC 260, Earnings
Per Share. Basic EPS is computed by dividing net income available to common shareholders by the weighted-average number of common shares outstanding for the period. Diluted EPS is computed using the weighted-average number of shares determined
for the basic EPS computation plus the shares resulting from the assumed exercise of all outstanding share-based awards using the treasury stock method. There were no antidilutive equity awards excluded from dilutive shares for the three months ended
March 31, 2025 and 0.1 million antidilutive equity awards excluded from dilutive shares for the three months ended March 31, 2024.
The following table provides a reconciliation of the numerators and denominators of the basic
and diluted EPS computations for the periods indicated:
| |
|
Three Months Ended March 31, |
|
| (In thousands, except per share amounts) |
|
2025 |
|
|
2024 |
|
| Net income |
|
$ |
133,222 |
|
|
$ |
116,978 |
|
| Less: preferred dividends |
|
|
2,372 |
|
|
|
2,372 |
|
| Net income available to common shareholders |
|
$ |
130,850 |
|
|
$ |
114,606 |
|
| |
|
|
|
|
|
|
|
|
| Weighted average common shares outstanding |
|
|
183,532 |
|
|
|
182,572 |
|
| Dilutive effect of stock compensation |
|
|
2,590 |
|
|
|
3,002 |
|
| Weighted average diluted common shares |
|
|
186,122 |
|
|
|
185,574 |
|
| |
|
|
|
|
|
|
|
|
| Basic earnings per common share |
|
$ |
0.71 |
|
|
$ |
0.63 |
|
| |
|
|
|
|
|
|
|
|
| Diluted earnings per common share |
|
$ |
0.70 |
|
|
$ |
0.62 |
|
Dividends to shareholders are subject to approval by the applicable regulatory authorities.
NOTE 11. ACCUMULATED OTHER COMPREHENSIVE INCOME (LOSS) (“AOCI”)
Activity within the balances in accumulated other comprehensive income (loss) is shown in the
following tables for the periods indicated:
| (In thousands) |
|
Unrealized loss on AFS
securities |
|
|
Pension and other
postretirement benefits |
|
|
Accumulated other
comprehensive loss |
|
| Balance at December 31, 2024 |
|
$ |
(650,725 |
) |
|
$ |
(43,770 |
) |
|
$ |
(694,495 |
) |
| Net change |
|
|
72,736 |
|
|
|
556 |
|
|
|
73,292 |
|
| Balance at March 31, 2025 |
|
$ |
(577,989 |
) |
|
$ |
(43,214 |
) |
|
$ |
(621,203 |
) |
| |
|
|
|
|
|
|
|
|
|
|
|
|
| Balance at December 31, 2023 |
|
$ |
(716,749 |
) |
|
$ |
(45,080 |
) |
|
$ |
(761,829 |
) |
| Net change |
|
|
(30,156 |
) |
|
|
652 |
|
|
|
(29,504 |
) |
| Balance at March 31, 2024 |
|
$ |
(746,905 |
) |
|
$ |
(44,428 |
) |
|
$ |
(791,333 |
) |
NOTE 12. CAPITAL AND REGULATORY MATTERS
The Company is subject to various regulatory capital requirements
administered by the federal and state banking agencies. Regulatory capital ratios at March 31, 2025 and December 31, 2024 were calculated in accordance with the Basel III capital framework as well as the interagency final rule published on September
30, 2020 entitled “Revised Transition of the Current Expected Credit Losses Methodology for Allowances.” Failure to meet minimum capital requirements can initiate certain mandatory and possibly additional discretionary actions by regulators that, if
undertaken, could have a direct material adverse effect on the Company’s consolidated financial statements. Under capital adequacy guidelines and the regulatory framework for prompt corrective action, the Company must meet specific capital guidelines
that involve quantitative measures of the Company’s assets, liabilities and certain off-balance sheet items as calculated under regulatory accounting practices. The Company’s capital amounts and classification are also subject to qualitative
judgments by regulators about components, risk weightings and other factors. Quantitative measures are established by regulation to ensure capital adequacy and require the Company to maintain minimum capital amounts and ratios.
Additionally, regulatory capital rules include a capital conservation
buffer which the Company must maintain in addition to its minimum risk-based capital requirements. This buffer applies to all three risk-based capital measurements (CET1, Tier 1 and total capital to risk-weighted assets). A financial institution with
a conservation buffer of less than the required amount is subject to limitations on capital distributions, including dividend payments, stock repurchases, and certain discretionary bonus payments to executive officers.
The actual capital amounts and ratios for the Company are presented in
the following tables and as shown, exceed the thresholds necessary to be considered “well capitalized.” Management believes that no events or changes have occurred subsequent to the indicated dates that would change this designation.
| |
|
March 31, 2025 |
|
|
December 31, 2024 |
|
| (Dollars in thousands) |
|
Amount |
|
|
Ratio |
|
|
Amount |
|
|
Ratio |
|
| Actual: |
|
|
|
|
|
|
|
|
|
|
|
|
| Common equity Tier 1 capital (to risk-weighted assets) |
|
$ |
4,750,291 |
|
|
|
12.44 |
% |
|
$ |
4,693,487 |
|
|
|
12.35 |
% |
| Tier 1 capital (to risk-weighted assets) |
|
|
4,917,284 |
|
|
|
12.88 |
|
|
|
4,860,480 |
|
|
|
12.79 |
|
| Total capital (to risk-weighted assets) |
|
|
5,390,674 |
|
|
|
14.12 |
|
|
|
5,306,647 |
|
|
|
13.97 |
|
| Tier 1 leverage capital (to average assets) |
|
|
4,917,284 |
|
|
|
10.56 |
|
|
|
4,860,480 |
|
|
|
10.41 |
|
| Minimum requirement(1): |
|
|
|
|
|
|
|
|
|
|
|
|
|
|
|
|
| Common equity Tier 1 capital (to risk-weighted assets) |
|
|
1,718,499 |
|
|
|
4.50 |
|
|
|
1,709,652 |
|
|
|
4.50 |
|
| Tier 1 capital (to risk-weighted assets) |
|
|
2,291,331 |
|
|
|
6.00 |
|
|
|
2,279,536 |
|
|
|
6.00 |
|
| Total capital (to risk-weighted assets) |
|
|
3,055,108 |
|
|
|
8.00 |
|
|
|
3,039,382 |
|
|
|
8.00 |
|
| Tier 1 leverage capital (to average assets) |
|
|
1,862,919 |
|
|
|
4.00 |
|
|
|
1,867,273 |
|
|
|
4.00 |
|
| Well capitalized requirement under prompt corrective action provisions: |
|
|
|
|
|
|
|
|
|
|
|
|
|
|
|
|
| Common equity Tier 1 capital (to risk-weighted assets) |
|
|
2,482,276 |
|
|
|
6.50 |
|
|
|
2,469,498 |
|
|
|
6.50 |
|
| Tier 1 capital (to risk-weighted assets) |
|
|
3,055,108 |
|
|
|
8.00 |
|
|
|
3,039,382 |
|
|
|
8.00 |
|
| Total capital (to risk-weighted assets) |
|
|
3,818,886 |
|
|
|
10.00 |
|
|
|
3,799,227 |
|
|
|
10.00 |
|
| Tier 1 leverage capital (to average assets) |
|
|
2,328,649 |
|
|
|
5.00 |
|
|
|
2,334,092 |
|
|
|
5.00 |
|
|
(1) |
The additional capital conservation buffer in effect was 2.5%. |
On April 25, 2025, the Company announced a share repurchase program
whereby the Company may acquire up to an aggregate of 10,000,000 shares of its common stock in the open market at prevailing market prices or in privately negotiated transactions. The repurchase program is subject to and will be effective upon
approval from the Federal Reserve and will expire on December 31, 2025.
The extent and timing of any repurchases depends on market conditions
and other corporate, legal and regulatory considerations. Repurchased shares are held as authorized and unissued shares. These authorized but unissued shares are available for use in the Company’s stock compensation programs, other transactions, or
for other corporate purposes as determined by the Company’s Board of Directors.
Federal and state banking laws and regulations and state corporate laws
restrict the amount of dividends that the Company may declare and pay. Under Mississippi law, the Company cannot pay any dividend on its common stock unless it has received written approval of the Commissioner of the MDBCF. The federal banking
agencies have indicated that paying dividends that deplete a depository institution’s capital base to an inadequate level would be an unsafe and unsound banking practice. The Federal Reserve must approve any dividend that exceeds the Company’s
current year’s net income plus its retained net income from the prior two calendar years.
NOTE 13. SEGMENT REPORTING
The Company determines operating segments based upon the services
offered, the significance of those services to the Company’s financial condition and operating results, and management’s regular review of the operating results of those services. The Company’s CODM is the Company’s CEO. The application and
development of management reporting methodologies is a robust process and is subject to periodic enhancements. As these enhancements are made, financial results presented by each reportable segment may be periodically revised. Cadence makes operating
decisions based on the following operating segments, as described below.
|
• |
Corporate Banking segment focuses on C&I, business banking, and commercial real estate lending to clients in the geographic footprint. |
|
• |
Community Banking segment provides a broad range of banking services through the branch network to serve the needs of community businesses and individual consumers in the
geographic footprint. |
|
• |
Mortgage segment includes mortgage banking activities of originating mortgage loans, selling mortgage loans in the secondary market and servicing the mortgage loans that
are sold on a servicing retained basis. |
|
• |
Banking Services segment offers individuals, businesses, governmental institutions, and non-profit entities a wide range of solutions to help protect, grow, and transfer
wealth. Offerings include credit-related products via Private Banking services, trust and investment management, asset management, retirement and savings solutions, estate planning and annuity products. |
|
• |
General Corporate and Other segment includes other activities not allocated to other aforementioned operating segments. Additionally, intercompany eliminations are
included as they do not reflect normal operations of the other segments. The disaggregation of General Corporate and Other better defines the results from the individual segments due to the direct relationship of the internal support provided
by the strategic business units within the Bank. |
Results of operations and selected financial information by operating
segment for periods indicated are presented in the following tables. The tables show total noninterest income segregated between contracts with customers within the scope of ASC 606, Revenue from Contracts with Customers, and those within the scope
of other GAAP Topics. Additionally, with the adoption of ASU 2023-07, the tables show significant segment expenses within total noninterest expense used by the CODM to assess the performance of each segment.
| (In thousands) |
|
Corporate Banking |
|
|
Community Banking |
|
|
Mortgage |
|
|
Banking Services |
|
|
General Corporate and Other |
|
|
Total |
|
| Results of Operations |
|
|
|
|
|
|
|
|
|
|
|
|
|
|
|
|
|
|
|
|
|
|
|
|
| Three Months Ended March 31, 2025 |
|
|
|
|
|
|
|
|
|
|
|
|
|
|
|
|
|
|
|
|
|
|
|
|
| Net interest revenue |
|
$ |
109,540 |
|
|
$ |
260,900 |
|
|
$ |
26,966 |
|
|
$ |
10,409 |
|
|
$ |
(44,663 |
) |
|
$ |
363,152 |
|
| Provision (release) for credit losses |
|
|
8,481 |
|
|
|
6,716 |
|
|
|
8,027 |
|
|
|
898 |
|
|
|
(4,122 |
) |
|
|
20,000 |
|
| Net interest revenue after provision (release) for credit losses |
|
|
101,059 |
|
|
|
254,184 |
|
|
|
18,939 |
|
|
|
9,511 |
|
|
|
(40,541 |
) |
|
|
343,152 |
|
| Noninterest revenue |
|
|
|
|
|
|
|
|
|
|
|
|
|
|
|
|
|
|
|
|
|
|
|
|
| In Scope of Topic 606 |
|
|
|
|
|
|
|
|
|
|
|
|
|
|
|
|
|
|
|
|
|
|
|
|
| Trust and asset management income |
|
|
316 |
|
|
|
4 |
|
|
|
— |
|
|
|
12,269 |
|
|
|
(766 |
) |
|
|
11,823 |
|
| Investment advisory fees |
|
|
— |
|
|
|
— |
|
|
|
— |
|
|
|
8,498 |
|
|
|
(44 |
) |
|
|
8,454 |
|
| Other brokerage fees |
|
|
— |
|
|
|
— |
|
|
|
— |
|
|
|
1,670 |
|
|
|
— |
|
|
|
1,670 |
|
| Deposit service charges |
|
|
3,959 |
|
|
|
13,963 |
|
|
|
— |
|
|
|
254 |
|
|
|
(440 |
) |
|
|
17,736 |
|
| Credit card, debit card and merchant fees |
|
|
1 |
|
|
|
8,864 |
|
|
|
— |
|
|
|
— |
|
|
|
3,124 |
|
|
|
11,989 |
|
| Total noninterest revenue (in-scope of Topic 606) |
|
|
4,276 |
|
|
|
22,831 |
|
|
|
— |
|
|
|
22,691 |
|
|
|
1,874 |
|
|
|
51,672 |
|
| Total noninterest revenue (out-of-scope of Topic 606) |
|
|
10,328 |
|
|
|
9,832 |
|
|
|
7,853 |
|
|
|
1,587 |
|
|
|
4,115 |
|
|
|
33,715 |
|
| Total noninterest revenue |
|
|
14,604 |
|
|
|
32,663 |
|
|
|
7,853 |
|
|
|
24,278 |
|
|
|
5,989 |
|
|
|
85,387 |
|
| Noninterest expense |
|
|
|
|
|
|
|
|
|
|
|
|
|
|
|
|
|
|
|
|
|
|
|
|
| Salaries and employee benefits |
|
|
21,765 |
|
|
|
61,352 |
|
|
|
5,801 |
|
|
|
13,474 |
|
|
|
50,580 |
|
|
|
152,972 |
|
| Occupancy and equipment |
|
|
323 |
|
|
|
19,680 |
|
|
|
407 |
|
|
|
317 |
|
|
|
7,750 |
|
|
|
28,477 |
|
| Data processing and software |
|
|
1,138 |
|
|
|
692 |
|
|
|
1,138 |
|
|
|
1,026 |
|
|
|
23,138 |
|
|
|
27,132 |
|
| Allocated overhead expenses |
|
|
19,575 |
|
|
|
65,808 |
|
|
|
5,930 |
|
|
|
3,980 |
|
|
|
(95,293 |
) |
|
|
— |
|
| Other segment items(1) |
|
|
9,900 |
|
|
|
8,764 |
|
|
|
5,064 |
|
|
|
4,373 |
|
|
|
22,667 |
|
|
|
50,768 |
|
| Total noninterest expense |
|
|
52,701 |
|
|
|
156,296 |
|
|
|
18,340 |
|
|
|
23,170 |
|
|
|
8,842 |
|
|
|
259,349 |
|
| Income (loss) before income taxes |
|
|
62,962 |
|
|
|
130,551 |
|
|
|
8,452 |
|
|
|
10,619 |
|
|
|
(43,394 |
) |
|
|
169,190 |
|
| Income tax expense (benefit) |
|
|
14,796 |
|
|
|
30,679 |
|
|
|
1,986 |
|
|
|
2,492 |
|
|
|
(13,985 |
) |
|
|
35,968 |
|
| Net income (loss) |
|
$ |
48,166 |
|
|
$ |
99,872 |
|
|
$ |
6,466 |
|
|
$ |
8,127 |
|
|
$ |
(29,409 |
) |
|
$ |
133,222 |
|
| Selected Financial Information |
|
|
|
|
|
|
|
|
|
|
|
|
|
|
|
|
|
|
|
|
|
|
|
|
| Total assets at end of period |
|
$ |
11,612,434 |
|
|
$ |
17,482,499 |
|
|
$ |
6,024,063 |
|
|
$ |
1,141,312 |
|
|
$ |
11,482,986 |
|
|
$ |
47,743,294 |
|
|
(1) |
Other segment items for each reportable segment includes: |
|
• |
Corporate Banking: legal expenses, travel expenses and certain overhead expenses. |
|
• |
Community Banking: advertising, office supplies, ATM expenses, delivery expenses, professional and consulting fees, legal expenses, telecommunication and postage
expenses, travel expenses, and certain overhead expenses. |
|
• |
Mortgage: loan quality control and loan repurchase expenses, legal expenses, and certain overhead expenses. |
|
• |
Banking Services: amortization of intangibles, professional and consulting fees, legal expenses, and certain overhead expenses. |
|
• |
General, Corporate and Other: advertising, supplies, regulatory expenses, and certain other overhead expenses. |
| (In thousands) |
|
Corporate Banking |
|
|
Community Banking |
|
|
Mortgage |
|
|
Banking Services |
|
|
General Corporate and Other |
|
|
Total |
|
| Results of Operations |
|
|
|
|
|
|
|
|
|
|
|
|
|
|
|
|
|
|
|
|
|
|
|
|
| Three Months Ended March 31, 2024 |
|
|
|
|
|
|
|
|
|
|
|
|
|
|
|
|
|
|
|
|
|
|
|
|
| Net interest revenue |
|
$ |
113,266 |
|
|
$ |
283,330 |
|
|
$ |
21,997 |
|
|
$ |
10,129 |
|
|
$ |
(74,814 |
) |
|
$ |
353,908 |
|
| Provision (release) for credit losses |
|
|
20,545 |
|
|
|
(2,564 |
) |
|
|
1,147 |
|
|
|
(694 |
) |
|
|
3,566 |
|
|
|
22,000 |
|
| Net interest revenue after provision (release) for credit losses |
|
|
92,721 |
|
|
|
285,894 |
|
|
|
20,850 |
|
|
|
10,823 |
|
|
|
(78,380 |
) |
|
|
331,908 |
|
| Noninterest revenue |
|
|
|
|
|
|
|
|
|
|
|
|
|
|
|
|
|
|
|
|
|
|
|
|
| In Scope of Topic 606 |
|
|
|
|
|
|
|
|
|
|
|
|
|
|
|
|
|
|
|
|
|
|
|
|
| Trust and asset management income |
|
|
266 |
|
|
|
4 |
|
|
|
— |
|
|
|
11,759 |
|
|
|
(707 |
) |
|
|
11,322 |
|
| Investment advisory fees |
|
|
— |
|
|
|
— |
|
|
|
— |
|
|
|
8,381 |
|
|
|
(45 |
) |
|
|
8,336 |
|
| Other brokerage fees |
|
|
— |
|
|
|
— |
|
|
|
— |
|
|
|
1,470 |
|
|
|
— |
|
|
|
1,470 |
|
| Deposit service charges |
|
|
3,296 |
|
|
|
13,591 |
|
|
|
— |
|
|
|
931 |
|
|
|
520 |
|
|
|
18,338 |
|
| Credit card, debit card and merchant fees |
|
|
160 |
|
|
|
9,001 |
|
|
|
— |
|
|
|
5 |
|
|
|
2,996 |
|
|
|
12,162 |
|
| Total noninterest revenue (in-scope of Topic 606) |
|
|
3,722 |
|
|
|
22,596 |
|
|
|
— |
|
|
|
22,546 |
|
|
|
2,764 |
|
|
|
51,628 |
|
| Total noninterest revenue (out-of-scope of Topic 606) |
|
|
9,825 |
|
|
|
9,265 |
|
|
|
7,574 |
|
|
|
3,714 |
|
|
|
1,780 |
|
|
|
32,158 |
|
| Total noninterest revenue |
|
|
13,547 |
|
|
|
31,861 |
|
|
|
7,574 |
|
|
|
26,260 |
|
|
|
4,544 |
|
|
|
83,786 |
|
| Noninterest expense |
|
|
|
|
|
|
|
|
|
|
|
|
|
|
|
|
|
|
|
|
|
|
|
|
| Salaries and employee benefits |
|
|
21,722 |
|
|
|
58,354 |
|
|
|
6,810 |
|
|
|
14,878 |
|
|
|
54,886 |
|
|
|
156,650 |
|
| Occupancy and equipment |
|
|
1,026 |
|
|
|
17,524 |
|
|
|
1,101 |
|
|
|
855 |
|
|
|
8,134 |
|
|
|
28,640 |
|
| Data processing and software |
|
|
911 |
|
|
|
441 |
|
|
|
996 |
|
|
|
1,346 |
|
|
|
26,334 |
|
|
|
30,028 |
|
| Allocated overhead expenses |
|
|
25,572 |
|
|
|
63,292 |
|
|
|
7,640 |
|
|
|
3,905 |
|
|
|
(100,409 |
) |
|
|
— |
|
| Other segment items(1) |
|
|
7,365 |
|
|
|
11,906 |
|
|
|
3,210 |
|
|
|
5,096 |
|
|
|
20,312 |
|
|
|
47,889 |
|
| Total noninterest expense |
|
|
56,596 |
|
|
|
151,517 |
|
|
|
19,757 |
|
|
|
26,080 |
|
|
|
9,257 |
|
|
|
263,207 |
|
| Income (loss) before income taxes |
|
|
49,672 |
|
|
|
166,238 |
|
|
|
8,667 |
|
|
|
11,003 |
|
|
|
(83,093 |
) |
|
|
152,487 |
|
| Income tax expense (benefit) |
|
|
11,673 |
|
|
|
39,066 |
|
|
|
2,037 |
|
|
|
2,583 |
|
|
|
(19,850 |
) |
|
|
35,509 |
|
| Net income (loss) |
|
$ |
37,999 |
|
|
$ |
127,172 |
|
|
$ |
6,630 |
|
|
$ |
8,420 |
|
|
$ |
(63,243 |
) |
|
$ |
116,978 |
|
| Selected Financial Information |
|
|
|
|
|
|
|
|
|
|
|
|
|
|
|
|
|
|
|
|
|
|
|
|
| Total assets at end of period |
|
$ |
11,738,934 |
|
|
$ |
16,999,654 |
|
|
$ |
5,101,542 |
|
|
$ |
1,156,941 |
|
|
$ |
13,316,792 |
|
|
$ |
48,313,863 |
|
|
(1) |
Other segment items for each reportable segment includes: |
|
• |
Corporate Banking: legal expenses, travel expenses and certain overhead expenses. |
|
• |
Community Banking: advertising, office supplies, ATM expenses, delivery expenses, professional and consulting fees, legal expenses, telecommunication and postage
expenses, travel expenses, and certain overhead expenses. |
|
• |
Mortgage: loan quality control and loan repurchase expenses, legal expenses, and certain overhead expenses. |
|
• |
Banking Services: amortization of intangibles, professional and consulting fees, legal expenses, and certain overhead expenses. |
|
• |
General, Corporate, and Other: advertising, supplies, regulatory expenses, and certain other overhead expenses. |
NOTE 14. DERIVATIVE INSTRUMENTS
The Company primarily uses derivatives to manage exposure to market
risk, including interest rate risk, credit risk and foreign currency risk, and to assist customers with their risk management objectives. Management may designate certain derivatives as hedging instruments in a qualifying hedge accounting
relationship. The Company’s derivative instruments consist of economic hedges for which the Company has elected not to apply hedge accounting and derivatives held for customer accommodation, or other purposes.
The fair value of derivative positions outstanding is included in other
assets and other liabilities in the accompanying consolidated balance sheets and in the net change in each of these financial statement line items in the operating section of the accompanying consolidated statements of cash flows. For derivatives not
designated as hedging instruments or determined to be an ineffective hedge under applicable accounting guidance, gains and losses due to changes in fair value are included in noninterest income and the operating section of the consolidated statements
of cash flows. For derivatives designated as cash flow hedging instruments, the entire change in the fair value related to the derivative instrument is recognized as a component of other comprehensive income and subsequently reclassified into
interest income when the forecasted transaction affects income. At March 31, 2025 and December 31, 2024, there were no derivatives designated under hedge accounting. The notional amounts and estimated fair values for the periods indicated were as
follows:
| |
|
March 31, 2025 |
|
|
December 31, 2024 |
|
| |
|
|
|
|
Fair Value |
|
|
|
|
|
|
|
|
Fair Value |
|
|
|
|
| (Dollars in thousands) |
|
Notional
Amount |
|
|
Other
Assets |
|
|
Other
Liabilities |
|
|
Weighted
Average
Maturity
(years) |
|
|
Notional
Amount |
|
|
Other
Assets |
|
|
Other
Liabilities |
|
|
Weighted
Average
Maturity
(years) |
|
| Commercial loan interest rate contracts |
|
$ |
3,862,600 |
|
|
$ |
28,675 |
|
|
$ |
40,181 |
|
|
|
4.2 |
|
|
$ |
3,781,868 |
|
|
$ |
30,555 |
|
|
$ |
45,070 |
|
|
|
4.2 |
|
| Mortgage loan held-for-sale interest rate lock commitments |
|
|
209,488 |
|
|
|
2,875 |
|
|
|
1 |
|
|
|
0.1 |
|
|
|
151,231 |
|
|
|
1,310 |
|
|
|
15 |
|
|
|
0.1 |
|
| Futures, forwards and options (used to hedge MSR, see Note 7) |
|
|
246,000 |
|
|
|
438 |
|
|
|
73 |
|
|
|
0.2 |
|
|
|
230,000 |
|
|
|
— |
|
|
|
3,085 |
|
|
|
0.2 |
|
| Mortgage loan forward sale commitments |
|
|
216,485 |
|
|
|
6 |
|
|
|
1,147 |
|
|
|
0.1 |
|
|
|
179,000 |
|
|
|
816 |
|
|
|
34 |
|
|
|
0.1 |
|
| Foreign exchange contracts |
|
|
55,037 |
|
|
|
401 |
|
|
|
229 |
|
|
|
0.4 |
|
|
|
55,542 |
|
|
|
650 |
|
|
|
469 |
|
|
|
0.5 |
|
| Total derivatives |
|
$ |
4,589,610 |
|
|
$ |
32,395 |
|
|
$ |
41,631 |
|
|
|
|
|
|
$ |
4,397,641 |
|
|
$ |
33,331 |
|
|
$ |
48,673 |
|
|
|
|
|
The Company is party to collateral support agreements with certain derivative
counterparties. Such agreements require that the Company maintain collateral based on the fair values of derivative transactions. In the event of default by the Company, the counterparty would be entitled to the collateral. At March 31, 2025, and
December 31, 2024, the Company was required to post $64.3 million and $60.9 million, respectively, in cash or qualifying securities as collateral for its derivative transactions, and these amounts were included in interest bearing deposits with other
banks for the periods indicated. In addition, the Company had recorded the obligation to return cash collateral provided by counterparties of $9.6 million and $23.1 million at March 31, 2025 and December 31, 2024, respectively, within deposits on the
Company’s consolidated balance sheet. Certain financial instruments, such as derivatives, may be eligible for offset in the consolidated balance sheet and/or subject to master netting arrangements or similar agreements. The Company’s derivative
transactions with upstream financial institution counterparties are generally executed under International Swaps and Derivative Association master agreements which include “right of set-off” provisions. In such cases, there is generally a legally
enforceable right to offset recognized amounts and there may be an intention to settle such amounts on a net basis. Nonetheless, the Company does not generally offset such financial instruments for financial reporting purposes.
The Company enters into certain interest rate contracts on commercial
loans, which include swaps, floors, caps and collars that are not designated as hedging instruments. These derivative contracts relate to transactions in which the Company enters into an interest rate contract with a loan customer while at the same
time entering into an offsetting interest rate contract with another financial institution. In connection with each swap transaction, the Company agrees to pay interest to the customer on a notional amount at a variable interest rate and receive
interest from the customer on a similar notional amount at a fixed interest rate. At the same time, the Company agrees to pay another financial institution the same fixed interest rate on the same notional amount and receive the same variable
interest rate on the same notional amount. The interest rate swap, floor, cap and collar transactions allow the Company to manage its interest rate risk. Because the Company acts as an intermediary for its customers, changes in the fair value of the
underlying derivative contracts generally offset and do not significantly impact the Company’s consolidated statements of income. The Company is exposed to credit loss in the event of nonperformance by the parties to the interest rate contracts.
However, the Company does not anticipate nonperformance by the counterparties. The estimated fair value has been recorded as an asset and a corresponding liability in the accompanying consolidated balance sheets at March 31, 2025 and December 31,
2024.
The Company has both bought and sold credit protection in the form of
participations on interest rate swaps (swap participations). These swap participations, which meet the definition of credit derivatives, were entered into in the ordinary course of business to serve the credit needs of customers. Swap participations,
whereby the Company has purchased credit protection, entitle the Company to receive a payment from the counterparty if the customer fails to make payment on any amounts due to the Company upon early termination of the swap transaction. For contracts
where the Company sold credit protection, the Company would be required to make payment to the counterparty if the customer fails to make payment on any amounts due to the counterparty upon early termination of the swap transaction. Swap
participation agreements where the Company is the beneficiary had notional values totaling $203.7 million and $205.1 million at March 31, 2025 and December 31, 2024, respectively. Swap participation agreements where the Company is the guarantor had
notional values totaling $454.7 million and $443.0 million at March 31, 2025 and December 31, 2024, respectively.
The Company enters into interest rate lock commitments with customers in
connection with residential mortgage loan applications for loans the Company intends to sell. Additionally, the Company enters into mortgage loan forward sales commitments of MBS with investors to mitigate the effect of interest rate risk inherent in
providing interest rate lock commitments to customers. Both the interest rate lock commitments and mortgage loan forward sales commitments are considered derivatives under current accounting guidance and are required to be recorded at fair value. The
fair value of these derivatives is recorded on the consolidated balance sheets in other assets and other liabilities. The change in fair value of these instruments is recorded within mortgage banking revenue in the consolidated statements of income.
For the three months ended March 31, 2025, and 2024, mortgage loans held for sale interest rate lock commitments and mortgage loan forward sales commitment gains totaled $1.2 million and $1.8 million, respectively.
The Company has an economic hedge in place on its MSR and uses various
instruments (including but not limited to Treasury options, SOFR and TBA futures and forwards) to mitigate the interest rate risk associated with the MSR. These hedging instruments are reported at fair value, with adjustments included as part of
mortgage banking revenue in the consolidated statements of income. The market value adjustment on MSR hedge totaled net gains of $3.3 million and net losses of $4.8 million for the three months ended March 31, 2025 and 2024, respectively. See Note 7
for additional information.
The Company enters into certain foreign currency exchange contracts on
behalf of its clients to facilitate their risk management strategies, while at the same time entering into offsetting foreign currency exchange contracts with another counterparty in order to minimize the Company’s foreign currency exchange risk. The
contracts are short term in nature, and any gain or loss incurred at settlement is recorded as other noninterest income. The fair value of these contracts is reported in other assets and other liabilities. Foreign exchange contract net gains totaled
$1.1 million and $0.9 million for the three months ended March 31, 2025 and 2024, respectively.
NOTE 15. COMMITMENTS AND CONTINGENT LIABILITIES
Mortgage Loans Serviced for Others
The Company services mortgage loans for other financial institutions
that are not included as assets in the Company’s accompanying consolidated financial statements. Included in the $8.1 billion and $8.0 billion of mortgage loans serviced for investors at March 31, 2025 and December 31, 2024, respectively, was $0.6
million of primary recourse servicing pursuant to which the Company is responsible for any losses incurred in the event of nonperformance by the mortgagor. The Company’s exposure to credit loss in the event of such nonperformance is the unpaid
principal balance at the time of default. This exposure is limited by the underlying collateral, which consists of single family residences and either federal or private mortgage insurance.
Lending Commitments
The consolidated financial statements do not reflect various commitments
and contingent liabilities which arise in the normal course of banking business and involve elements of credit risk, interest rate risk, and liquidity risk. Such financial instruments are recorded when they are funded. At March 31, 2025 and December
31, 2024, these included $467.6 million and $448.9 million, respectively, in letters of credit and $8.6 billion in unfunded extensions of credit such as interim mortgage financing, construction credit, credit card, and revolving line of credit
arrangements.
Commitments to extend credit and letters of credit include some exposure
to credit loss in the event of nonperformance of the customer. Commitments to extend credit are agreements to lend to a customer as long as there is no violation of any condition established in the contract. In addition, the Company has entered into
certain contingent commitments to grant loans. Standby letters of credit are conditional commitments issued to guarantee the performance of a customer to a third party. The credit policies and procedures for such commitments are the same as those
used for lending activities. Because these instruments have fixed maturity dates and because a number expire without being drawn upon, they generally do not present any significant liquidity risk. The Company did not realize significant credit losses
from these commitments and arrangements during the three months ended March 31, 2025 and 2024.
Other Commitments
The Company makes investments in limited
partnerships, including certain affordable housing partnerships for which it receives tax credits. At March 31, 2025 and December 31, 2024, unfunded capital commitments totaled $255.8 million and $277.4 million, respectively. See Note 16 for more
information.
Litigation
The nature of the Company’s business ordinarily
results in certain types of claims, litigation, investigations, and other legal or administrative cases and proceedings. Although the Company and its subsidiaries have policies and procedures to minimize legal noncompliance and the impact of claims
and other proceedings, and endeavored to procure reasonable amounts of insurance coverage, litigation and regulatory actions present an ongoing risk.
The Company and its subsidiaries engage in lines
of business that are heavily regulated and involve a large volume of actual or potential financial transactions with customers or applicants, and the Company is a public company with a large number of shareholders. From time to time, applicants,
borrowers, customers, shareholders, former employees, service providers, and other third parties have brought actions against the Company or its subsidiaries, in certain cases claiming substantial damages. Financial services companies are subject to
risks arising from changing regulatory frameworks or expectations, regulatory investigations, class action litigation, and, from time to time, the Company and its subsidiaries have such actions brought against them. The Company and its subsidiaries
are also subject to enforcement actions by federal or state regulators, including the Federal Reserve, the CFPB, the DOJ, state attorneys general, and the MDBCF, which may be adversely impacted by ongoing litigation in which the Company is involved.
Additionally, the Company is, and management expects it to be, engaged in a number of foreclosure proceedings and other collection actions as part of its lending and leasing collections activities, which, from time to time, have resulted in
counterclaims against the Company and its subsidiaries. Various legal proceedings have and may arise in the future out of claims against entities to which the Company is a successor as a result of business combinations.
When and as the Company determines it has
meritorious defenses to the claims asserted, it vigorously defends against such claims. The Company will consider settlement of claims when, in management’s judgment and in consultation with counsel, it is in the best interests of the Company to do
so.
The Company cannot predict with certainty the cost
of defense, the cost of prosecution, or the ultimate outcome of litigation or other proceedings filed by or against it, its subsidiaries and its directors, management or employees, including remedies or damage awards. On at least a quarterly basis,
the Company assesses its liabilities and contingencies in connection with outstanding legal proceedings as well as certain threatened claims (which are not considered incidental to the ordinary conduct of the Company’s business) utilizing the latest
and most reliable information available. For matters where a loss is not probable or the amount of the loss cannot be estimated, the Company will not make an accrual. For matters where it is probable the Company will incur a loss and the amount can
be reasonably estimated, the Company will accrue for the loss. Once established, the accrual is adjusted periodically to reflect any relevant developments. The actual cost of any such matters, however, may turn out to be substantially higher than the
amount accrued. Further, the Company’s insurance policies have deductibles and coverage limits, and such policies are unlikely to cover all costs and expenses related to the defense or prosecution of such legal proceedings or any losses arising
therefrom.
Although the final outcome of any legal
proceedings is inherently uncertain, based on the information available, advice of counsel and available insurance coverage, if applicable, management believes that the litigation-related liability of $7.5 million accrued at March 31, 2025 is
adequate and that any incremental change in potential liability arising from the Company’s legal proceedings and threatened claims, including the matters described herein and those otherwise arising in the ordinary course of business, will not have a
material adverse effect on the Company’s business or consolidated results of operations or financial condition. It is possible, however, that future developments could result in an unfavorable outcome for or resolution of any one or more of the legal
proceedings in which the Company or its subsidiaries are defendants, which may be material to the Company’s business or consolidated results of operations or financial condition for a particular fiscal period or periods.
On August 30, 2021, Legacy Cadence Bank and the
DOJ agreed to a settlement set forth in the consent order related to the investigation by the DOJ of Legacy Cadence Bank’s fair lending program in Harris, Fort Bend, and Montgomery Counties located in Houston, Texas during the period between 2014 and
2016 (the “Consent Order”). The Consent Order was signed by the United States District Court for the Northern District of Georgia, Atlanta Division, on August 31, 2021. Pursuant to Section 5.2(g) of the Agreement and Plan of Merger and Paragraph 50
of the Consent Order, Legacy BancorpSouth Bank approved the negotiated settlement, and subsequently, the Company agreed to accept the obligations of the Consent Order. The Consent Order is in effect for five years. For additional information
regarding the terms of this settlement and the Consent Order, see Legacy Cadence’s Current Report on Form 8-K that was filed with the SEC on August 30, 2021.
NOTE 16. VARIABLE INTEREST ENTITIES AND OTHER INVESTMENTS
Under ASC 810-10-65, a Company is deemed to be the
primary beneficiary and required to consolidate a VIE if it has a variable interest in the VIE that provides a controlling financial interest. The determination of whether a controlling financial interest exists is based on whether a single party has
both the power to direct the activities of the VIE that most significantly impact the VIE’s economic performance and the obligation to absorb the losses of the VIE or the right to receive benefits from the VIE that could potentially be significant to
the VIE. ASC 810-10-65 requires continual reconsideration of conclusions reached regarding which interest holder is a VIE’s primary beneficiary.
Certain NMTC meet the qualifications for
consolidation under ASC 810. Consolidation is applicable to this type of investment structure when the entities owned by the tax credit investment fund, managing member, and limited partner of the sub-CDE are under common control, and the
limited partner’s related party group has both the power and the obligation to absorb the significant benefits and losses of the sub-CDE. Based on this, the limited partner, which is the Company, is the primary beneficiary of the sub-CDE
(VIE) and therefore subject to consolidation. NMTC investment structures which include a managing member not affiliated with the Company are not subject to consolidation.
At March 31, 2025 and December 31, 2024, the
Company’s assets of the consolidated VIE that can be used only to settle obligations of the consolidated VIE totaled $5.1 million and $5.4 million, respectively.
The Company is invested in several tax credit
projects solely as a limited partner. At March 31, 2025 and December 31, 2024, the Company’s maximum exposure to loss associated with these limited partnerships was limited to its investment. Most of the investments are in affordable housing
projects. The partnerships have qualified to receive annual affordable housing federal tax credits that are recognized as a reduction of current tax expense. The Company accounts for these investments and the related tax credits using either the
effective yield method or the proportional amortization method, depending upon the date of the investment. Under the effective yield method, the Company recognizes the tax credits as they are allocated and amortizes the initial costs of the
investments to provide a constant effective yield over the period the tax credits are allocated. Under the proportional amortization method, the Company amortizes the cost of the investment in proportion to the tax credits and other tax benefits
received and recognizes the net investment performance in the income statement as a component of income tax expense. The Company also has, to a lesser degree, investments in NMTC and historic tax credit projects. The Company has elected to account
for the NMTC not subject to consolidation and historic tax credits using the flow-through method, which reduces federal income taxes in the year in which the credit arises. At March 31, 2025 and December 31, 2024, the Company recorded total tax
credit investments in other assets on its consolidated balance sheets of $378.4 million and $387.3 million, respectively.
The Company adopted the provisions of ASU 2023-02
as of January 1, 2024 and determined each investments’ eligibility for proportional amortization. For certain NMTC and HTC investments that do not qualify for the proportional amortization method under ASU 2023-02, amortization related to these
investments are recorded in other noninterest income in the Company’s consolidated statements of income. The Company recorded amortization of $0.3 million for both the three months ended March 31, 2025 and 2024. The cash flow activity related to
these investments are presented in the net income (loss) line in the operating activities section of the consolidated statements of cash flows.
For the investments that qualify for proportional
amortization under ASU 2023-02, the Company recognized income tax credits and other income tax benefits for the three months ended March 31, 2025 of $11.6 million and $1.5 million, respectively. The total income tax benefits of $13.1 million are
partially offset by $10.4 million of investment amortization recognized for the three months ended March 31, 2025, for a net income tax benefit of $2.7 million. For the three months ended March 31, 2024, the Company recognized income tax credits and
other income tax benefits of $10.2 million and $1.3 million, respectively. The total income tax benefits of $11.5 million are partially offset by $9.2 million of investment amortization recognized for the three months ended March 31, 2024, for a net
income tax benefit of $2.3 million.
The cash flows related to the total income tax
benefits are presented in the consolidated statements of cash flows. The net income tax benefit of $2.7 million for the three months ended March 31, 2025 was included in the net income (loss) line within operating activities. Investment amortization
of $10.4 million for the three months ended March 31, 2025, was included in the depreciation and amortization line item, which was an adjustment to reconcile net income (loss) to cash provided by (used for) operating activities. The income tax
credits and other income tax benefits of $13.1 million for the three months ended March 31, 2025 was included in the net change to other assets or liabilities line item, which was also an adjustment to reconcile net income (loss) to cash provided by
(used for) operating activities.
Additionally, the Company has investments in other certain limited
partnerships accounted for under the fair value practical expedient of NAV totaling $125.7 million and $118.7 million at March 31, 2025 and December 31, 2024, respectively. Related to these assets recorded at fair value through net income, the
Company recognized net gains of $2.3 million and $1.0 million for the three months ended March 31, 2025 and 2024, respectively. These investments are made primarily through various SBIC funds as a strategy to provide expansion and growth
opportunities to small businesses and community development funds to help serve the credit needs of the low- and moderate-income and underserved communities within our footprint. Of the total fair value of these limited partnerships, $16.7 million
and $15.8 million are related to real-estate funds at March 31, 2025 and December 31, 2024, respectively. The remaining $109.0 million and $102.9 million are related to SBIC funds that concentrate in a variety of industries at March 31, 2025 and
December 31, 2024, respectively. At March 31, 2025, unfunded commitments related to these investments were $4.1 million and $103.5 million related to the real-estate funds and other SBIC funds, respectively. SBIC funds are generally structured to
operate for approximately 10 years. During the life of each SBIC fund, partners can request to withdraw from the fund, and subsequently receive the balance of their investment as the underlying assets are liquidated over the remaining life of the
fund. The Company has no current plans to withdraw from any of its SBIC funds.
For other limited partnerships without readily
determinable fair values that do not qualify for the practical expedient, Cadence elected the measurement alternative to account for these investments at their cost minus impairment, plus or minus changes resulting from observable price changes in
orderly transactions for the identical or a similar investment of the same issuer. These investments totaled $2.7 million and $2.6 million at March 31, 2025 and December 31, 2024, respectively. Other limited partnerships accounted for under the
equity method totaled $8.7 million at both March 31, 2025 and December 31, 2024.
A summary of the Company’s investments in limited
partnerships is presented as of the following periods:
| (In thousands) |
|
March 31, 2025 |
|
|
December 31, 2024 |
|
| Tax credit investments (amortized cost) |
|
$ |
378,410 |
|
|
$ |
387,339 |
|
| Limited partnerships accounted for under the fair value practical expedient of NAV |
|
|
125,665 |
|
|
|
118,710 |
|
| Limited partnerships without readily determinable fair values that do not qualify for the practical expedient of NAV accounted for under the cost method |
|
|
2,714 |
|
|
|
2,586 |
|
| Limited partnerships required to be accounted for under the equity method |
|
|
8,664 |
|
|
|
8,664 |
|
| Total investments in limited partnerships |
|
$ |
515,453 |
|
|
$ |
517,299 |
|
For equity investments carried at cost using the
measurement alternative, during the three months ended March 31, 2025 there was one write-down for impairment of $40 thousand. During the three months ended March 31, 2024, there were no downward or upward adjustments to these investments for
impairments or price changes from observable transactions. The carrying amount of these equity investments in limited partnerships measured under this measurement alternative for the specified periods are as follows:
| |
|
Three Months Ended March 31, |
|
| (In thousands) |
|
2025 |
|
|
2024 |
|
| Carrying value at the beginning of the period |
|
$ |
2,586 |
|
|
$ |
2,417 |
|
| Impairments |
|
|
(40 |
) |
|
|
— |
|
| Distributions |
|
|
(12 |
) |
|
|
(55 |
) |
| Contributions |
|
|
180 |
|
|
|
770 |
|
| Carrying value at the end of the period |
|
$ |
2,714 |
|
|
$ |
3,132 |
|
NOTE 17. SUBSEQUENT EVENTS
Industry Bancshares, Inc.
On April 25, 2025, the Company entered into an
Agreement and Plan of Merger (the “Industry Merger Agreement”) with Cadence Opportunity, Inc., a wholly-owned subsidiary of the Company formed to effect the merger, and Industry Bancshares, Inc., the bank holding company for Bank of Brenham, National
Association, Citizens State Bank, Fayetteville Bank, Industry State Bank, The First National Bank of Bellville and The First National Bank of Shiner (collectively, the “Industry Banks”). Under the terms of the Industry Merger Agreement, the Industry
Banks ultimately will be merged with and into the Company, and the Company will, based upon Industry Bancshares’ equity capital at the closing of the transaction, pay between $20 million and $60 million in cash for all of Industry Bancshares’
outstanding common stock, subject to certain conditions and potential adjustments. At March 31, 2025, Industry had approximately $4.4 billion in total assets, $1.1 billion in total loans and $4.5 billion in total deposits. The Industry Merger
Agreement has been unanimously approved by the boards of directors of the Company and Industry Bancshares. In addition to regulatory and shareholder approvals and the satisfaction of other customary closing conditions, the closing of the transaction
is also conditioned upon Industry Bancshares’ equity capital meeting a certain minimum amount at closing.
FCB Financial Corp.
On May 1, 2025, the Company completed its
acquisition of FCB Financial Corp. (“FCB Financial”), the bank holding company for FCB (collectively referred to as “First Chatham”), pursuant to an Agreement and Plan of Merger dated January 22, 2025 by and between the Company and FCB Financial (the
“FCB Merger Agreement”). Upon the completion of the merger of FCB Financial with and into the Company, FCB, FCB Financials’ wholly-owned banking subsidiary, was merged with and into the Company. First Chatham is a Savannah, Georgia-based community
bank operating eight branches across the Greater Savannah Area. Under the terms of the FCB Merger Agreement, the Company issued 2.3 million shares of common stock and paid $23.1 million in cash for all outstanding shares of First Chatham. At March
31, 2025, First Chatham had approximately $605 million in total assets, total loans of $336 million, and $523 million in total deposits. The purchase price allocation and certain fair value measurements are not complete due to the timing of the
closing of the merger. Due to the recent closing, management remains in the early stages of reviewing the estimated fair values and evaluating the assumed tax positions of the merger.
ITEM 2. MANAGEMENT’S DISCUSSION AND ANALYSIS OF
FINANCIAL CONDITION AND RESULTS OF OPERATIONS.
OVERVIEW
The Company is a regional bank with corporate
offices in Houston, Texas and Tupelo, Mississippi with $47.7 billion in total assets at March 31, 2025. The Company has commercial banking operations in Alabama, Arkansas, Florida, Georgia, Louisiana, Mississippi, Missouri, Tennessee, and Texas. The
Company and its subsidiaries provide commercial banking, leasing, mortgage origination and servicing, brokerage, trust, and investment advisory services to corporate customers, local governments, individuals, and other financial institutions through
an extensive network of branches and offices.
Management’s discussion and analysis provides a
narrative discussion of the Company’s financial condition and results of operations. For a complete understanding of the following discussion, refer to the consolidated financial statements and related notes presented elsewhere in this Report.
Management’s discussion and analysis should also be read in conjunction with the risk factors included in Item 1A of this Report and those included in Item 1A of our Form 10-K for the year ended December 31, 2024, and the other reports we file with
the Federal Reserve. This discussion and analysis is based on reported financial information, and certain amounts for prior years have been reclassified to conform with the current financial statement presentation.
The financial condition and operating results of
the Company are heavily influenced by economic trends nationally and in the specific markets in which the Company’s subsidiaries provide financial services. Generally, the pressures of the national and regional economic cycle create a difficult
operating environment for the financial services industry. During such times, the Company is not immune to pressures and any economic downturn may have a negative impact on the Company and its customers in all of the markets it serves. Management
believes future weakness in the economic environment could adversely affect the strength of the credit quality of the Company’s assets. Therefore, management will continue to focus on early identification and resolution of credit issues.
The largest source of the Company’s revenue is
derived from its corporate and community banking operations. The financial condition and operating results of the Company are affected by the level and volatility of interest rates on loans, investment securities, deposits, and borrowed funds, and
the impact of economic downturns on loan demand, collateral values, and creditworthiness of existing borrowers. The financial services industry is highly competitive and heavily regulated. The Company’s success depends on its ability to compete
aggressively within its markets while maintaining sufficient asset quality and cost controls to generate net income.
The information that follows is provided to
enhance comparability of financial information between periods and to provide a better understanding of the Company’s operations.
Recent Developments
On January 22, 2025, the Company announced the
signing of a definitive merger agreement with FCB Financial Corp., the bank holding company for First Chatham Bank, (collectively referred to as “First Chatham”), pursuant to which First Chatham was merged with and into the Company, effective May 1,
2025. First Chatham is a Savannah, Georgia-based community bank operating eight branches across the Greater Savannah Area. Pursuant to the terms of the definitive merger agreement, the Company issued 2.3 million shares of common stock and paid $23.1
million in cash for all outstanding shares of FCB Financial Corp.
On April 25, 2025, at the Company’s special
meeting of shareholders, the holders of the Company’s Preferred Stock approved a proposal amending the Articles of Incorporation to permit stock repurchases for compliance purposes under Regulation H, which the Company is subject to as a result of
becoming a Fed member bank. On March 26, 2025, the Board declared a special cash dividend of $0.34375 per share of Preferred Stock payable on May 7, 2025, to the Preferred Stock shareholders of record as of April 30, 2025, that was conditioned on the
passage of the proposal at the special meeting.
On April 25, 2025, the Company entered into an Agreement and Plan of
Merger (the “Industry Merger Agreement”) with Cadence Opportunity, Inc., a wholly-owned subsidiary of the Company formed to effect the merger, and Industry Bancshares, Inc., the bank holding company for Bank of Brenham, National Association, Citizens
State Bank, Fayetteville Bank, Industry State Bank, The First National Bank of Bellville and The First National Bank of Shiner (collectively, the “Industry Banks”). Under the terms of the Industry Merger Agreement, the Industry Banks ultimately will
be merged with and into the Company, and the Company will, based upon Industry Bancshares’ equity capital at the closing of the transaction, pay between $20 million and $60 million in cash for all of Industry Bancshares’ outstanding common stock,
subject to certain conditions and potential adjustments. At March 31, 2025, Industry had approximately $4.4 billion in total assets, $1.1 billion in total loans and $4.5 billion in total deposits. The Industry Merger Agreement has been unanimously
approved by the boards of directors of the Company and Industry Bancshares. In addition to regulatory and shareholder approvals and the satisfaction of other customary closing conditions, the closing of the transaction is also conditioned upon
Industry Bancshares’ equity capital meeting a certain minimum amount at closing.
NON-GAAP FINANCIAL MEASURES AND RECONCILIATIONS
In addition to financial ratios based on measures
defined by GAAP, the Company has identified “total tangible shareholders’ equity,” “tangible common shareholders’ equity,” “total tangible common shareholders’ equity (excluding AOCI),” “total tangible assets,” “total tangible assets (excluding
AOCI),” “tangible shareholders’ equity to tangible assets,” “tangible common shareholders’ equity to tangible assets,” “tangible common shareholders’ equity to tangible assets (excluding AOCI),” “tangible common book value per share,” and “tangible
book value per common share (excluding AOCI)” as non-GAAP financial measures used when evaluating the performance of the Company.
|
● |
Total tangible shareholders’ equity is defined by the Company as total shareholders’ equity less
goodwill and other intangible assets, net. |
|
● |
Total tangible common shareholders’ equity is defined by the Company as total shareholders’ equity
less preferred stock, goodwill, and other intangible assets, net. |
|
● |
Total tangible common shareholders’ equity, excluding AOCI, is defined by the Company as total
shareholders’ equity less preferred stock, goodwill, other intangible assets, net, and AOCI. |
|
● |
Total tangible assets are defined by the Company as total assets less goodwill and other intangible
assets, net. |
|
● |
Total tangible assets, excluding AOCI, are defined by the Company as total assets less goodwill,
other intangible assets, net, and AOCI. |
|
● |
Tangible common book value per share is defined by the Company as tangible common shareholders’
equity divided by total shares of common stock outstanding. |
|
● |
Tangible book value per common share, excluding AOCI, is defined by the Company as tangible common
shareholders’ equity less AOCI divided by total shares of common stock outstanding. |
Management believes the ratios of tangible
shareholders’ equity to tangible assets, tangible common shareholders’ equity to tangible assets and tangible common shareholders’ equity to tangible assets (excluding AOCI) to be important to investors who are interested in evaluating the adequacy
of the Company’s capital levels. Management also believes that tangible common book value per share and tangible common book value per share (excluding AOCI) are important to investors who are interested in changes from period to period in book value
per share exclusive of changes in intangible assets.
The following table reconciles these non-GAAP financial measures as
presented above to GAAP financial measures as reflected in the Company’s consolidated financial statements for the periods indicated:
TABLE 1—NON-GAAP FINANCIAL MEASURES
| (Dollars in thousands, except per share amounts) |
|
March 31, 2025 |
|
|
December 31, 2024 |
|
|
March 31, 2024 |
|
| Total tangible assets, excluding AOCI |
|
|
|
|
|
|
|
|
|
|
|
|
| Total assets |
|
$ |
47,743,294 |
|
|
$ |
47,019,190 |
|
|
$ |
48,313,863 |
|
| Less: Goodwill |
|
|
1,366,923 |
|
|
|
1,366,923 |
|
|
|
1,367,785 |
|
| Other intangible assets, net |
|
|
79,522 |
|
|
|
83,190 |
|
|
|
96,126 |
|
| Total tangible assets |
|
$ |
46,296,849 |
|
|
$ |
45,569,077 |
|
|
$ |
46,849,952 |
|
| Less: AOCI |
|
|
(621,203 |
) |
|
|
(694,495 |
) |
|
|
(791,333 |
) |
| Total tangible assets, excluding AOCI |
|
$ |
46,918,052 |
|
|
$ |
46,263,572 |
|
|
$ |
47,641,285 |
|
| |
|
|
|
|
|
|
|
|
|
|
|
|
| Total tangible common shareholders’ equity, excluding AOCI |
|
|
|
|
|
|
|
|
|
|
|
|
| Total shareholders’ equity |
|
$ |
5,718,541 |
|
|
$ |
5,569,683 |
|
|
$ |
5,189,932 |
|
| Less: Goodwill |
|
|
1,366,923 |
|
|
|
1,366,923 |
|
|
|
1,367,785 |
|
| Other intangible assets, net |
|
|
79,522 |
|
|
|
83,190 |
|
|
|
96,126 |
|
| Total tangible shareholders’ equity |
|
$ |
4,272,096 |
|
|
$ |
4,119,570 |
|
|
$ |
3,726,021 |
|
| Less: Preferred stock |
|
|
166,993 |
|
|
|
166,993 |
|
|
|
166,993 |
|
| Total tangible common shareholders’ equity |
|
$ |
4,105,103 |
|
|
$ |
3,952,577 |
|
|
$ |
3,559,028 |
|
| Less: AOCI |
|
|
(621,203 |
) |
|
|
(694,495 |
) |
|
|
(791,333 |
) |
| Total tangible common shareholders’ equity, excluding AOCI |
|
$ |
4,726,306 |
|
|
$ |
4,647,072 |
|
|
$ |
4,350,361 |
|
| |
|
|
|
|
|
|
|
|
|
|
|
|
| Total common shares outstanding |
|
|
184,046,420 |
|
|
|
183,527,575 |
|
|
|
182,681,325 |
|
| |
|
|
|
|
|
|
|
|
|
|
|
|
| Tangible shareholders’ equity to tangible assets |
|
|
9.23 |
% |
|
|
9.04 |
% |
|
|
7.95 |
% |
| Tangible common shareholders’ equity to tangible assets |
|
|
8.87 |
% |
|
|
8.67 |
% |
|
|
7.60 |
% |
| Tangible common shareholders’ equity, excluding AOCI, to tangible assets, excluding AOCI |
|
|
10.07 |
% |
|
|
10.04 |
% |
|
|
9.13 |
% |
| Tangible common book value per share |
|
$ |
22.30 |
|
|
$ |
21.54 |
|
|
$ |
19.48 |
|
| Tangible book value per common share, excluding AOCI |
|
$ |
25.68 |
|
|
$ |
25.32 |
|
|
$ |
23.81 |
|
FINANCIAL HIGHLIGHTS
The following table presents financial highlights
for the periods indicated:
TABLE 2—FINANCIAL HIGHLIGHTS
| |
|
As of and For the Three Months Ended March 31, |
|
| |
|
2025 |
|
|
2024 |
|
| Common share data: |
|
|
|
|
|
|
|
|
| Basic earnings per share |
|
$ |
0.71 |
|
|
$ |
0.63 |
|
| Diluted earnings per share |
|
|
0.70 |
|
|
|
0.62 |
|
| Cash dividends per share |
|
|
0.275 |
|
|
|
0.250 |
|
| Book value per share |
|
|
30.16 |
|
|
|
27.50 |
|
| Tangible common book value per share (1) |
|
|
22.30 |
|
|
|
19.48 |
|
| Tangible book value per common share, excluding AOCI (1) |
|
|
25.68 |
|
|
|
23.81 |
|
| Dividend payout ratio |
|
|
39.29 |
% |
|
|
40.48 |
% |
| Financial Ratios: |
|
|
|
|
|
|
|
|
| Return on average assets (2) |
|
|
1.15 |
|
|
|
0.97 |
|
| Return on average shareholders’ equity (2) |
|
|
9.56 |
|
|
|
9.06 |
|
| Return on average common shareholders’ equity (2) |
|
|
9.68 |
|
|
|
9.17 |
|
| Total shareholders’ equity to total assets |
|
|
11.98 |
|
|
|
10.74 |
|
| Total common shareholders’ equity to total assets |
|
|
11.63 |
|
|
|
10.40 |
|
| Tangible common shareholders’ equity to tangible assets (1) |
|
|
8.87 |
|
|
|
7.60 |
|
| Tangible common shareholders’ equity, excluding AOCI, to tangible assets, excluding AOCI (1) |
|
|
10.07 |
|
|
|
9.13 |
|
| Net interest margin-FTE |
|
|
3.46 |
|
|
|
3.22 |
|
| Credit Quality Ratios: |
|
|
|
|
|
|
|
|
| Net charge-offs to average loans and leases (2) |
|
|
0.27 |
% |
|
|
0.24 |
% |
| Provision for credit losses to average loans and leases (2) |
|
|
0.24 |
|
|
|
0.27 |
|
| ACL to net loans and leases |
|
|
1.34 |
|
|
|
1.44 |
|
| ACL to NPL |
|
|
194.02 |
|
|
|
196.08 |
|
| ACL to NPA |
|
|
187.31 |
|
|
|
191.88 |
|
| NPL to net loans and leases |
|
|
0.69 |
|
|
|
0.73 |
|
| NPA to total assets |
|
|
0.51 |
|
|
|
0.51 |
|
| Capital Adequacy Ratios: |
|
|
|
|
|
|
|
|
| Common Equity Tier 1 capital |
|
|
12.44 |
% |
|
|
11.71 |
% |
| Tier 1 capital |
|
|
12.88 |
|
|
|
12.15 |
|
| Total capital |
|
|
14.12 |
|
|
|
14.49 |
|
| Tier 1 leverage capital |
|
|
10.56 |
|
|
|
9.46 |
|
|
(1) |
Non-GAAP financial measure. See “Non-GAAP Financial Measures and Reconciliations.” |
|
(2) |
Ratios are annualized. |
As of March 31, 2025, the federal funds rate held
steady at 4.5%. The Federal Reserve decided to hold interest rates steady, after it lowered interest rates by 100 basis points since the first quarter of 2024. There is a possibility for additional interest rate reductions in 2025, however, the
Federal Reserve continues to monitor relevant economic data and economic policy changes. The decreases in interest rates during the fourth quarter of 2024 have had an effect on both our balance sheet as well as our earnings. As seen in the following
sections, the increase in net interest revenue resulted from a lower cost on our interest-bearing liabilities, benefiting from declining deposit costs, and the payoffs of both the BTFP borrowings and the majority of our subordinated debt since the
second quarter of 2024. Total average interest-earning assets declined in the first quarter of 2025 as compared to the same period in 2024, as growth in average loans was offset by lower average investment securities and other investment balances as
the Company used cash flow from these investments to support the payoff the BTFP borrowings and subordinated debt. See “Net Interest Revenue” for further information.
The Company reported net income available to
common shareholders of $130.9 million for the three months ended March 31, 2025, compared to $114.6 million for the same period in 2024. Key factors contributing to the $16.3 million increase in net income available to common shareholders included:
(1) the increase in net interest revenue to $363.2 million for the first quarter of 2025 from $353.9 million for the same period in 2024; (2) the increase in noninterest revenue to $85.4 million for the first quarter of 2025 from $83.8 million for
the same period in 2024; and (3) the decrease in noninterest expense to $259.3 million in the first quarter of 2025 from $263.2 million in the first quarter of 2024. The Company recorded a provision for credit losses of $20.0 million and $22.0
million for three months ended March 31, 2025 and 2024, respectively.
Net interest revenue for the three months ended
March 31, 2025 increased $9.3 million, or 2.6%, to $363.2 million compared to $353.9 million for the same period in 2024. Total cost of interest-bearing liabilities declined 43 basis points to 2.97% for the first quarter of 2025 compared to 3.40% for
the first quarter of 2024, benefiting from declining deposit costs as well as the payoffs of both the BTFP borrowings and the majority of the subordinated debt. Interest expense decreased $47.1 million, or 16.6%, in the first quarter of 2025 compared
to the same period in 2024. Average earning assets declined $1.6 billion to $42.6 billion for the first quarter of 2025 compared to the first quarter of 2024, as growth in average loans of $1.2 billion was offset by lower average other investments
and investment securities balances as the Company used cash flow from these investments to support the payoffs of both the BTFP borrowings and subordinated debt. See Table 4 below for more information on yield/rate analysis.
The Company attempts to diversify its revenue
streams with noninterest revenue received from wealth management activities, mortgage banking operations, and other activities that generate fee income. Noninterest revenue for the three months ended March 31, 2025 was $85.4 million, compared to
$83.8 million for the same period in 2024. The primary contributor to the increase in noninterest revenue was the increase of $1.3 million in bank-owned life insurance income, primarily resulting from an increase in proceeds from death benefits
during the three months ended March 31, 2025. Other factors contributing to the increase included $0.5 million increase in trust and asset management income, partially offset by a $0.6 million decrease in deposit service charges. See “Noninterest
Revenue” below for more information.
Noninterest expense for the three months ended
March 31, 2025 decreased 1.5% to $259.3 million from $263.2 million for the same period in 2024. The decrease in noninterest expense in the first quarter of 2025 compared to the same period in 2024 was primarily a result of decreases in salaries and
employee benefits and data processing and software expenses, partially offset by increases in other noninterest expense. For the three months ended March 31, 2025, salaries and employee benefits decreased $3.7 million, or 2.3%, compared to the same
period in 2024 primarily due to an increase in deferred salaries from increased loan production in the first quarter of 2025, offset by increases in mortgage commission expense related to increased loan production. Increases in other noninterest
expense for the first quarter of 2025 compared to the same period in 2024 included increases in operational losses and various other miscellaneous expenses. See “Noninterest Expense” below for more information.
RESULTS OF OPERATIONS
The following is a summary of our results of
operations for the periods indicated:
TABLE 3—SUMMARY OF RESULTS OF OPERATIONS
| |
|
Three Months Ended March 31, |
|
| (In thousands) |
|
2025 |
|
|
2024 |
|
| Earnings Summary: |
|
|
|
|
|
|
|
|
| Interest revenue |
|
$ |
599,257 |
|
|
$ |
637,113 |
|
| Interest expense |
|
|
236,105 |
|
|
|
283,205 |
|
| Net interest revenue |
|
|
363,152 |
|
|
|
353,908 |
|
| Provision for credit losses |
|
|
20,000 |
|
|
|
22,000 |
|
| Net interest revenue, after provision for credit losses |
|
|
343,152 |
|
|
|
331,908 |
|
| Noninterest revenue |
|
|
85,387 |
|
|
|
83,786 |
|
| Noninterest expense |
|
|
259,349 |
|
|
|
263,207 |
|
| Income before income taxes |
|
|
169,190 |
|
|
|
152,487 |
|
| Income tax expense |
|
|
35,968 |
|
|
|
35,509 |
|
| Net income |
|
|
133,222 |
|
|
|
116,978 |
|
| Less: preferred dividends |
|
|
2,372 |
|
|
|
2,372 |
|
| Net income available to common shareholders |
|
$ |
130,850 |
|
|
$ |
114,606 |
|
Net Interest Revenue
Net interest revenue is the difference between
interest revenue earned on assets, such as loans, leases and securities, and interest expense paid on liabilities, such as deposits and borrowings, and continues to provide the Company with its principal source of revenue. Net interest revenue is
affected by the general level of interest rates, changes in interest rates and changes in the amount and composition of interest earning assets and interest bearing liabilities. One of the Company’s long-term objectives is to manage interest earning
assets and interest bearing liabilities to maximize net interest revenue, while balancing interest rate, credit and liquidity risk. Net interest margin is determined by dividing FTE net interest revenue by average earning assets. For purposes of the
following discussion, revenue from tax-exempt loans and investment securities have been adjusted to an FTE basis, using an effective tax rate of 21% for the three months ended March 31, 2025 and 2024.
The following table presents average interest
earning assets, average interest bearing liabilities, net interest revenue-FTE, net interest margin-FTE and net interest rate spread for each of the periods presented:
TABLE 4—CONSOLIDATED AVERAGE BALANCES AND YIELD/RATE ANALYSIS
| |
|
Three Months Ended March 31, |
|
| |
|
2025 |
|
|
2024 |
|
| (Dollars in thousands) |
|
Average
Balance |
|
|
Interest |
|
|
Yield/
Rate |
|
|
Average
Balance |
|
|
Interest |
|
|
Yield/
Rate |
|
| ASSETS |
|
|
|
|
|
|
|
|
|
|
|
|
|
|
|
|
|
|
| Loans and leases (net of unearned income) (1)(2) |
|
$ |
33,944,416 |
|
|
$ |
530,513 |
|
|
|
6.34 |
% |
|
$ |
32,737,574 |
|
|
$ |
529,393 |
|
|
|
6.50 |
% |
| Loans held for sale, at fair value |
|
|
115,261 |
|
|
|
1,449 |
|
|
|
5.10 |
|
|
|
72,356 |
|
|
|
1,184 |
|
|
|
6.58 |
|
| Available for sale securities, at fair value: |
|
|
|
|
|
|
|
|
|
|
|
|
|
|
|
|
|
|
|
|
|
|
|
|
| Taxable |
|
|
7,222,326 |
|
|
|
53,232 |
|
|
|
2.99 |
|
|
|
8,187,342 |
|
|
|
63,405 |
|
|
|
3.11 |
|
| Tax-exempt (3) |
|
|
79,846 |
|
|
|
796 |
|
|
|
4.04 |
|
|
|
82,366 |
|
|
|
870 |
|
|
|
4.25 |
|
| Other investments |
|
|
1,275,153 |
|
|
|
13,897 |
|
|
|
4.42 |
|
|
|
3,146,439 |
|
|
|
42,897 |
|
|
|
5.48 |
|
| Total interest earning assets and revenue |
|
|
42,637,002 |
|
|
|
599,887 |
|
|
|
5.71 |
% |
|
|
44,226,077 |
|
|
|
637,749 |
|
|
|
5.80 |
% |
| Other assets |
|
|
4,963,761 |
|
|
|
|
|
|
|
|
|
|
|
4,890,312 |
|
|
|
|
|
|
|
|
|
| Allowance for credit losses |
|
|
465,332 |
|
|
|
|
|
|
|
|
|
|
|
473,849 |
|
|
|
|
|
|
|
|
|
| Total |
|
$ |
47,135,431 |
|
|
|
|
|
|
|
|
|
|
$ |
48,642,540 |
|
|
|
|
|
|
|
|
|
| |
|
|
|
|
|
|
|
|
|
|
|
|
|
|
|
|
|
|
|
|
|
|
|
|
| LIABILITIES AND SHAREHOLDERS’ EQUITY |
|
|
|
|
|
|
|
|
|
|
|
|
|
|
|
|
|
|
|
|
|
|
|
|
| Deposits: |
|
|
|
|
|
|
|
|
|
|
|
|
|
|
|
|
|
|
|
|
|
|
|
|
| Interest bearing demand and money market |
|
$ |
19,428,376 |
|
|
$ |
128,831 |
|
|
|
2.69 |
% |
|
$ |
19,303,845 |
|
|
$ |
149,403 |
|
|
|
3.11 |
% |
| Savings |
|
|
2,607,366 |
|
|
|
3,644 |
|
|
|
0.57 |
|
|
|
2,696,452 |
|
|
|
3,801 |
|
|
|
0.57 |
|
| Time |
|
|
9,978,136 |
|
|
|
100,900 |
|
|
|
4.10 |
|
|
|
7,348,356 |
|
|
|
80,670 |
|
|
|
4.42 |
|
| Fed funds purchased, securities sold under agreement to repurchase and other |
|
|
103,067 |
|
|
|
1,132 |
|
|
|
4.45 |
|
|
|
209,348 |
|
|
|
2,528 |
|
|
|
4.86 |
|
| Short-term FHLB borrowings |
|
|
28,278 |
|
|
|
309 |
|
|
|
4.43 |
|
|
|
— |
|
|
|
— |
|
|
|
— |
|
| Short-term BTFP borrowings |
|
|
— |
|
|
|
— |
|
|
|
— |
|
|
|
3,500,000 |
|
|
|
42,104 |
|
|
|
4.84 |
|
| Subordinated and long-term borrowings |
|
|
129,030 |
|
|
|
1,289 |
|
|
|
4.05 |
|
|
|
434,579 |
|
|
|
4,699 |
|
|
|
4.35 |
|
| Total interest bearing liabilities and expense |
|
|
32,274,253 |
|
|
|
236,105 |
|
|
|
2.97 |
% |
|
|
33,492,580 |
|
|
|
283,205 |
|
|
|
3.40 |
% |
| Demand deposits - noninterest bearing |
|
|
8,339,414 |
|
|
|
|
|
|
|
|
|
|
|
9,072,619 |
|
|
|
|
|
|
|
|
|
| Other liabilities |
|
|
870,172 |
|
|
|
|
|
|
|
|
|
|
|
883,293 |
|
|
|
|
|
|
|
|
|
| Total liabilities |
|
|
41,483,839 |
|
|
|
|
|
|
|
|
|
|
|
43,448,492 |
|
|
|
|
|
|
|
|
|
| Shareholders’ equity |
|
|
5,651,592 |
|
|
|
|
|
|
|
|
|
|
|
5,194,048 |
|
|
|
|
|
|
|
|
|
| Total |
|
$ |
47,135,431 |
|
|
|
|
|
|
|
|
|
|
$ |
48,642,540 |
|
|
|
|
|
|
|
|
|
| Net interest revenue-FTE |
|
|
|
|
|
$ |
363,782 |
|
|
|
|
|
|
|
|
|
|
$ |
354,544 |
|
|
|
|
|
| Net interest margin-FTE |
|
|
|
|
|
|
|
|
|
|
3.46 |
% |
|
|
|
|
|
|
|
|
|
|
3.22 |
% |
| Net interest rate spread |
|
|
|
|
|
|
|
|
|
|
2.74 |
% |
|
|
|
|
|
|
|
|
|
|
2.40 |
% |
| Interest bearing liabilities to interest earning assets |
|
|
|
|
|
|
|
|
|
|
75.70 |
% |
|
|
|
|
|
|
|
|
|
|
75.73 |
% |
|
(1) |
Includes taxable equivalent adjustment to interest of $0.5 million and $0.4 million for the three months ended March 31, 2025 and 2024, respectively, using an effective
tax rate of 21% for all periods presented. |
|
(2) |
Nonaccrual loans are included in loans and leases (net of unearned income). Nonaccrual loans were $236.0 million and $241.0 million as of March 31, 2025 and 2024,
respectively. |
|
(3) |
Includes taxable equivalent adjustment to interest of $0.2 million for both the three months ended March 31, 2025 and 2024, using an effective tax rate of 21% for all
periods presented. |
Net interest revenue-FTE increased 2.6% to $363.8
million for the three months ended March 31, 2025, from $354.5 million for the same period in 2024. The increase in net interest revenue-FTE resulted from lower costs on interest-bearing liabilities benefiting from declining deposit costs and the
payoffs of both the BTFP borrowings and the majority of our subordinated debt since the first quarter of 2024. Average loans increased from 74.0% of average interest earning assets in the 2024 first quarter to 79.6% in the 2025 first quarter.
Interest revenue-FTE decreased 5.9% to $599.9
million for the three months ended March 31, 2025, from $637.7 million for the same period in 2024. The decrease in interest revenue-FTE for the three months ended March 31, 2025 was primarily a result of lower average investment securities and other
investment balances as the Company used cash flow from these investments to support the payoffs of both the BTFP borrowings and subordinated debt since the first quarter of 2024. Additionally, interest revenue-FTE included $2.6 million and $3.5
million in accretion related to the purchase discounts on acquired loans for the three months ended March 31, 2025 and 2024, respectively.
Interest expense decreased 16.6% to $236.1 million
for the three months ended March 31, 2025, compared to $283.2 million for the same period in 2024. The decrease in interest expense for the three months ended March 31, 2025 was primarily due to the total cost of interest-bearing liabilities
declining 43 basis points to 2.97% for the first quarter of 2025 compared to 3.40% for the first quarter of 2024, benefiting from declining deposit costs as well as the payoffs of both the BTFP borrowings and the majority of the subordinated debt
after the first quarter of 2024.
Net interest margin-FTE for the three months ended
March 31, 2025 was 3.46%, an increase of 24 basis points, from 3.22% for the same period in 2024. Net interest revenue-FTE may also be analyzed by segregating the yield/rate and volume components of interest revenue and interest expense. The table
below presents the components of our net interest revenue-FTE with the effect that the varying levels of interest-earning assets and interest-bearing liabilities and the applicable rates have had on changes in net interest revenue from the first
quarter of 2024 to the first quarter of 2025. The changes in net interest revenue-FTE due to both rate and volume have been allocated to volume and rate changes in proportion to the relationship of the absolute dollar amounts of the changes in each.
TABLE 5—RATE/VOLUME ANALYSIS
| |
|
First Quarter 2025 vs First Quarter 2024 |
|
| |
|
Net Interest Revenue |
|
|
Increase |
|
|
|
|
|
|
|
| (In thousands) |
|
2025 |
|
|
2024 |
|
|
(Decrease) |
|
|
Volume |
|
|
Rate |
|
| INTEREST REVENUE |
|
|
|
|
|
|
|
|
|
|
|
|
|
|
|
|
|
|
|
|
| Loans and leases, net of unearned income |
|
$ |
530,513 |
|
|
$ |
529,393 |
|
|
$ |
1,120 |
|
|
$ |
16,469 |
|
|
$ |
(15,349 |
) |
| Loans held for sale |
|
|
1,449 |
|
|
|
1,184 |
|
|
|
265 |
|
|
|
575 |
|
|
$ |
(310 |
) |
| Available for sale securities: |
|
|
|
|
|
|
|
|
|
|
|
|
|
|
|
|
|
|
|
|
| Taxable |
|
|
53,232 |
|
|
|
63,405 |
|
|
|
(10,173 |
) |
|
|
(7,580 |
) |
|
|
(2,593 |
) |
| Non-taxable |
|
|
796 |
|
|
|
870 |
|
|
|
(74 |
) |
|
|
(29 |
) |
|
|
(45 |
) |
| Other |
|
|
13,897 |
|
|
|
42,897 |
|
|
|
(29,000 |
) |
|
|
(21,868 |
) |
|
|
(7,132 |
) |
| Total interest revenue-FTE |
|
|
599,887 |
|
|
|
637,749 |
|
|
|
(37,862 |
) |
|
|
(12,432 |
) |
|
|
(25,430 |
) |
| |
|
|
|
|
|
|
|
|
|
|
|
|
|
|
|
|
|
|
|
|
| INTEREST EXPENSE |
|
|
|
|
|
|
|
|
|
|
|
|
|
|
|
|
|
|
|
|
| Demand deposits - interest bearing |
|
|
128,831 |
|
|
|
149,403 |
|
|
|
(20,572 |
) |
|
|
894 |
|
|
|
(21,466 |
) |
| Savings deposits |
|
|
3,644 |
|
|
|
3,801 |
|
|
|
(157 |
) |
|
|
(156 |
) |
|
|
(1 |
) |
| Time deposits |
|
|
100,900 |
|
|
|
80,670 |
|
|
|
20,230 |
|
|
|
26,374 |
|
|
|
(6,144 |
) |
| Fed funds purchased, securities sold under agreement to repurchase and other |
|
|
1,132 |
|
|
|
2,528 |
|
|
|
(1,396 |
) |
|
|
(1,200 |
) |
|
|
(196 |
) |
| Short-term FHLB borrowings |
|
|
309 |
|
|
|
— |
|
|
|
309 |
|
|
|
309 |
|
|
|
— |
|
| Short-term BTFP borrowings |
|
|
— |
|
|
|
42,104 |
|
|
|
(42,104 |
) |
|
|
(42,104 |
) |
|
|
— |
|
| Subordinated and long-term debt |
|
|
1,289 |
|
|
|
4,699 |
|
|
|
(3,410 |
) |
|
|
(3,108 |
) |
|
|
(302 |
) |
| Total interest expense |
|
|
236,105 |
|
|
|
283,205 |
|
|
|
(47,100 |
) |
|
|
(18,991 |
) |
|
|
(28,109 |
) |
| Net interest revenue-FTE |
|
$ |
363,782 |
|
|
$ |
354,544 |
|
|
$ |
9,238 |
|
|
$ |
6,559 |
|
|
$ |
2,679 |
|
Provision for Credit Losses and Allowance for Credit Losses (“ACL”)
An analysis of the ACL for loans for the periods indicated is provided in the following table:
TABLE 6—ACL
| |
|
|
|
|
|
|
| |
|
Three Months Ended March 31, |
|
| (In thousands) |
|
2025 |
|
|
2024 |
|
| Balance, beginning of period |
|
$ |
460,793 |
|
|
$ |
468,034 |
|
| Charge-offs: |
|
|
|
|
|
|
|
|
| Commercial and industrial |
|
|
|
|
|
|
|
|
| Non-real estate |
|
|
(20,865 |
) |
|
|
(16,896 |
) |
| Owner occupied |
|
|
(419 |
) |
|
|
(101 |
) |
| Total commercial and industrial |
|
|
(21,284 |
) |
|
|
(16,997 |
) |
| Commercial real estate |
|
|
|
|
|
|
|
|
| Construction, acquisition and development |
|
|
(42 |
) |
|
|
(132 |
) |
| Income producing |
|
|
(1,340 |
) |
|
|
(2,112 |
) |
| Total commercial real estate |
|
|
(1,382 |
) |
|
|
(2,244 |
) |
| Consumer |
|
|
|
|
|
|
|
|
| Residential mortgages |
|
|
(1,296 |
) |
|
|
(595 |
) |
| Other consumer |
|
|
(1,766 |
) |
|
|
(1,800 |
) |
| Total consumer |
|
|
(3,062 |
) |
|
|
(2,395 |
) |
| Total charge-offs |
|
|
(25,728 |
) |
|
|
(21,636 |
) |
| Recoveries: |
|
|
|
|
|
|
|
|
| Commercial and industrial |
|
|
|
|
|
|
|
|
| Non-real estate |
|
|
1,733 |
|
|
|
1,234 |
|
| Owner occupied |
|
|
89 |
|
|
|
78 |
|
| Total commercial and industrial |
|
|
1,822 |
|
|
|
1,312 |
|
| Commercial real estate |
|
|
|
|
|
|
|
|
| Construction, acquisition and development |
|
|
45 |
|
|
|
112 |
|
| Income producing |
|
|
38 |
|
|
|
38 |
|
| Total commercial real estate |
|
|
83 |
|
|
|
150 |
|
| Consumer |
|
|
|
|
|
|
|
|
| Residential mortgages |
|
|
398 |
|
|
|
271 |
|
| Other consumer |
|
|
423 |
|
|
|
444 |
|
| Total consumer |
|
|
821 |
|
|
|
715 |
|
| Total recoveries |
|
|
2,726 |
|
|
|
2,177 |
|
| Net charge-offs |
|
|
(23,002 |
) |
|
|
(19,459 |
) |
| Provision: |
|
|
|
|
|
|
|
|
| Provision for credit losses related to loans and leases (1) |
|
|
20,000 |
|
|
|
24,000 |
|
| Balance, end of period |
|
$ |
457,791 |
|
|
$ |
472,575 |
|
| |
|
|
|
|
|
|
|
|
| Loans and leases, net of unearned income - average |
|
$ |
33,944,416 |
|
|
$ |
32,737,574 |
|
| Loans and leases, net of unearned income - period end |
|
$ |
34,051,610 |
|
|
$ |
32,882,616 |
|
|
(1) |
Provision (reversal) for unfunded commitments was zero and $(2.0) million for three months ended March 31, 2025 and 2024, respectively. |
TABLE 7—ACL RELATED RATIOS
| |
|
Three Months Ended March 31, |
|
| |
|
2025 |
|
|
2024 |
|
| RATIOS |
|
|
|
|
|
|
| Provision for credit losses to average loans and leases, net of unearned income (1) |
|
|
0.24 |
% |
|
|
0.27 |
% |
| ACL to loans and leases, net of unearned income |
|
|
1.34 |
% |
|
|
1.44 |
% |
| Nonperforming loans to loans and leases, net of unearned income |
|
|
0.69 |
% |
|
|
0.73 |
% |
| ACL to nonperforming loans |
|
|
194.02 |
% |
|
|
196.08 |
% |
| |
|
|
|
|
|
|
|
|
| Net charge-offs to average loans and leases: (1) |
|
|
|
|
|
|
|
|
| Commercial and industrial |
|
|
|
|
|
|
|
|
| Non-real estate |
|
|
0.23 |
% |
|
|
0.19 |
% |
| Total commercial and industrial |
|
|
0.23 |
% |
|
|
0.19 |
% |
| Commercial real estate |
|
|
|
|
|
|
|
|
| Income producing |
|
|
0.02 |
% |
|
|
0.03 |
% |
| Total commercial real estate |
|
|
0.02 |
% |
|
|
0.03 |
% |
| Consumer |
|
|
|
|
|
|
|
|
| Other consumer |
|
|
0.02 |
% |
|
|
0.02 |
% |
| Total consumer |
|
|
0.02 |
% |
|
|
0.02 |
% |
| Total |
|
|
0.27 |
% |
|
|
0.24 |
% |
|
(1) |
Ratios are annualized. |
For the three months ended March 31, 2025 and 2024, net charge-offs totaled $23.0 million and $19.5 million,
respectively. As a percentage of average loans and leases, net charge-offs were 0.27% and 0.24% annualized for the three months ended March 31, 2025 and March 31, 2024, respectively. Net charge-offs for the three months ended March 31, 2025, were
primarily experienced in the commercial and industrial non-real estate loan class concentrated in one large credit, as well as a small number of SBA loans as they work through their resolution process; while net charge-offs for the same period in 2024
were primarily in the non-real estate and income producing categories.
The Company recorded $20.0 million in provision for credit losses ($20.0 million for loans and zero for
unfunded commitments) during the three months ended March 31, 2025, compared to $22.0 million ($24.0 million for loans and $(2.0) million for unfunded commitments) for the same period in 2024.
The ACL decreased $3.0 million to $457.8 million at March 31, 2025, from $460.8 million at December 31,
2024. This decrease was primarily seen in the commercial and industrial loan segment due to resolutions on some larger problem credits occurring during the year. The ACL to nonperforming loans decreased to 194.02% at March 31, 2025, from 196.08% at
March 31, 2024. For more information about the Company’s classified, nonperforming, purchased credit deteriorated, and impaired loans, see “Item 2. Management’s Discussion and Analysis of Financial Condition and Results of Operations – Financial
Condition – Loans and Leases” in Part I of this Report.
The breakdown of the ACL by loan and lease segment and class is based, in part, on evaluations of specific
loan and lease histories and the impact of forecasted economic conditions on the portfolio segments. Accordingly, because these conditions are subject to change, the allocation is not necessarily indicative of the breakdown of any future allowance for
credit losses. Several economic forecasts from external sources are used in the estimation and allocation of the ACL. The forecasts cover an eight-quarter forecast horizon to establish a forecast range and are based on upside, downside, and base case
scenarios. A blended scenario is selected by management to reflect the probable economic conditions within the range. As of March 31, 2025, the forecast was a mix of downside and base forecasts, weighted more heavily to a base forecast, which is
consistent with the first quarter of 2024 weighting. Due to the introduction of tariffs and other policy changes made by the U.S. government after forecasts were published, the Bank elected to increase the macroeconomic qualitative factor to account
for uncertainties not yet reflected in forecasts used by the Bank.
The Company recognizes that higher interest rates, inflation, and slower economic growth may have
short-term, long-term, and regional impacts to the economy. In addition, qualitative factors such as changes in economic conditions, concentrations of risk, and changes in portfolio risk resulting from regulatory changes are considered in determining
the adequacy of the level of the ACL (see Note 4 to the consolidated financial statements).
TABLE 8—ACL BY SEGMENT AND CLASS
| |
|
March 31, 2025 |
|
|
December 31, 2024 |
|
| (Dollars in thousands) |
|
ACL |
|
|
% of Loans in
Each Category
to Total Loans |
|
|
ACL |
|
|
% of Loans in
Each Category
to Total Loans |
|
| Commercial and industrial |
|
|
|
|
|
|
|
|
|
|
|
|
|
|
|
|
| Non-real estate |
|
$ |
168,940 |
|
|
|
25.5 |
% |
|
$ |
183,743 |
|
|
|
25.7 |
% |
| Owner occupied |
|
|
33,318 |
|
|
|
13.7 |
|
|
|
35,177 |
|
|
|
13.8 |
|
| Total commercial and industrial |
|
|
202,258 |
|
|
|
39.2 |
|
|
|
218,920 |
|
|
|
39.5 |
|
| Commercial real estate |
|
|
|
|
|
|
|
|
|
|
|
|
|
|
|
|
| Construction, acquisition and development |
|
|
47,030 |
|
|
|
10.9 |
|
|
|
44,703 |
|
|
|
11.6 |
|
| Income producing |
|
|
66,645 |
|
|
|
18.4 |
|
|
|
64,957 |
|
|
|
17.8 |
|
| Total commercial real estate |
|
|
113,675 |
|
|
|
29.3 |
|
|
|
109,660 |
|
|
|
29.4 |
|
| Consumer |
|
|
|
|
|
|
|
|
|
|
|
|
|
|
|
|
| Residential mortgages |
|
|
134,803 |
|
|
|
30.9 |
|
|
|
125,464 |
|
|
|
30.4 |
|
| Other consumer |
|
|
7,055 |
|
|
|
0.6 |
|
|
|
6,749 |
|
|
|
0.7 |
|
| Total consumer |
|
|
141,858 |
|
|
|
31.5 |
|
|
|
132,213 |
|
|
|
31.1 |
|
| Total |
|
$ |
457,791 |
|
|
|
100.0 |
% |
|
$ |
460,793 |
|
|
|
100.0 |
% |
Noninterest Revenue
The components of noninterest revenue for the periods indicated and the percentage change between the
periods are shown in the following table:
TABLE 9—NONINTEREST REVENUE
| |
|
Three Months Ended March 31, |
|
| (Dollars in thousands) |
|
2025 |
|
|
2024 |
|
|
% Change |
|
| Trust and asset management income (1) |
|
$ |
11,823 |
|
|
$ |
11,322 |
|
|
|
4.4 |
% |
| Investment advisory fees (1) |
|
|
8,454 |
|
|
|
8,336 |
|
|
|
1.4 |
|
| Brokerage and annuity fees (1) |
|
|
3,002 |
|
|
|
3,175 |
|
|
|
(5.4 |
) |
| Deposit service charges |
|
|
17,736 |
|
|
|
18,338 |
|
|
|
(3.3 |
) |
| Credit card, debit card and merchant fees |
|
|
11,989 |
|
|
|
12,162 |
|
|
|
(1.4 |
) |
| Mortgage banking, excluding MSR and MSR hedge market value adjustment (2) |
|
|
9,743 |
|
|
|
9,116 |
|
|
|
6.9 |
|
| MSR and MSR hedge market value adjustment (2) |
|
|
(3,105 |
) |
|
|
(2,673 |
) |
|
|
(16.2 |
) |
| Securities losses, net |
|
|
(9 |
) |
|
|
(9 |
) |
|
|
— |
|
| Bank-owned life insurance (3) |
|
|
5,202 |
|
|
|
3,946 |
|
|
|
31.8 |
|
| Credit related fees (3) |
|
|
6,076 |
|
|
|
6,207 |
|
|
|
(2.1 |
) |
| SBA income (3) |
|
|
3,562 |
|
|
|
3,299 |
|
|
|
8.0 |
|
| Other miscellaneous income (3) |
|
|
10,914 |
|
|
|
10,567 |
|
|
|
3.3 |
|
| Total noninterest revenue |
|
$ |
85,387 |
|
|
$ |
83,786 |
|
|
|
1.9 |
% |
|
(1) |
Included in wealth management revenue on the consolidated statements of income. |
|
(2) |
Included in mortgage banking revenue on the consolidated statements of income. |
|
(3) |
Included in other revenue on the consolidated statements of income. |
Noninterest revenue for the three months ended March 31, 2025 was $85.4 million, an increase of $1.6
million, or 1.9%, from the same period in 2024. The current year period experienced an increase of $1.3 million in bank-owned life insurance income. This increase primarily resulted from an increase in proceeds from death benefits during the current
year period.
Mortgage banking revenue typically fluctuates as mortgage interest rates change and is primarily
attributable to two activities - the origination and sale of new mortgage loans and the servicing of sold mortgage loans. Origination revenue is comprised of gains and losses from the sale of mortgage loans, origination fees, underwriting fees and
other fees associated with the origination of mortgage loans. For the three months ended March 31, 2025 and 2024, mortgage loan held for sale origination volumes totaled $235.4 million and $222.9 million, respectively, which produced origination
revenue of $3.4 million and $3.2 million, respectively. The increase in mortgage origination revenue also resulted from an increase of 0.7% in mortgage loans sold during the three months ended March 31, 2025 as compared to the three months ended March
31 2024.
Revenue from the mortgage servicing process includes fees from the actual servicing of mortgage loans. For
the three months ended March 31, 2025 and 2024, revenue from the servicing of mortgage loans was $6.3 million and $6.0 million, respectively.
The Company services a class of residential mortgages that are first lien loans secured by a primary
residence or second home. The MSR, which are recognized as a separate asset on the date the corresponding mortgage loan is sold on a servicing retained basis, is recorded at fair value as determined at each accounting period end. At March 31, 2025 and
March 31, 2024 the estimated fair value of the MSR was $111.0 million and $111.7 million, respectively.
The Company is susceptible to significant fluctuations in MSR fair value during changing interest rate
environments. The Company has an economic hedge in place on its MSR and uses various instruments (including but not limited to Treasury options, SOFR and TBA futures and forwards) to mitigate the interest rate risk associated with the MSR. These
hedging instruments are reported at fair value, with adjustments included as part of mortgage banking revenue in the consolidated statements of income. At March 31, 2025 and 2024, this economic hedge covered approximately 76.9% and 74.8%, respectively,
of the MSR interest rate risk. Reflecting this sensitivity to interest rates, the fair value of the MSR, including the hedge, experienced a decrease of $3.1 million for the three months ended March 31, 2025 and a decrease of $2.7 million during the
same period in 2024.
The following table presents the Company’s mortgage banking operations for the periods indicated:
TABLE 10— MORTGAGE BANKING OPERATIONS
| |
|
Three Months Ended March 31, |
|
| (Dollars in thousands) |
|
2025 |
|
|
2024 |
|
|
% Change |
|
| Production revenue: |
|
|
|
|
|
|
|
|
|
|
|
|
| Origination |
|
$ |
3,402 |
|
|
$ |
3,165 |
|
|
|
7.5 |
% |
| Servicing |
|
|
6,341 |
|
|
|
5,951 |
|
|
|
6.6 |
|
| Total origination and servicing revenue |
|
|
9,743 |
|
|
|
9,116 |
|
|
|
6.9 |
|
| MSR and hedge market value adjustment |
|
|
(3,105 |
) |
|
|
(2,673 |
) |
|
|
(16.2 |
) |
| Total mortgage banking revenue |
|
$ |
6,638 |
|
|
$ |
6,443 |
|
|
|
3.0 |
% |
| |
|
|
|
|
|
|
|
|
|
|
|
|
| Origination of mortgage loans held for sale |
|
$ |
235,406 |
|
|
$ |
222,876 |
|
|
|
5.6 |
% |
| Mortgage loans serviced at quarter-end |
|
|
8,111,379 |
|
|
|
7,764,936 |
|
|
|
4.5 |
|
Trust and asset management income, which consists of fee income from management of trust accounts, increased
4.4% during the first quarter of 2025 compared to the same period in 2024. The increase in the 2025 quarter arose from an increase of 4.9% in assets under management.
Deposit service charges, which consists primarily of corporate analysis charges, overdraft fees, and other
service related fees, decreased 3.3% during the first quarter of 2025 compared to the same period in 2024. The decrease resulted primarily from increased fee refund rates in both the corporate and consumer customer bases.
SBA income consists of gains and losses on the sale of SBA loans, servicing fees, and various fees related
to processing SBA loans. SBA income increased by 8.0% during the first quarter of 2025 compared to the same period in 2024 due to an increase of 5.4% in net gains on sales and an increase of 17.9% in SBA packaging fees.
Other miscellaneous income consists of various fees, gains and losses, and other revenue and increased 3.3%
in the first quarter of 2025 compared to same period in 2024, despite the 2024 inclusion of $1.7 million in payroll processing fees. This line of business was sold in May 2024. The lack of this income in the first quarter of 2025 was offset by an
increase of $1.0 million in dividend income due to holding the Federal Reserve Bank stock for the entire first quarter of 2025; an increase of $1.0 million in earnings from limited partnerships; and an increase of $0.4 million in tax credit allocation
fee income. These increases were partially offset by a decrease of $1.0 million in other miscellaneous income during the first quarter of 2025.
Noninterest Expense
The components of noninterest expense for the periods indicated and the percentage change between periods
are shown in the following table:
TABLE 11—NONINTEREST EXPENSE
| |
|
Three Months Ended March 31, |
|
| (Dollars in thousands) |
|
2025 |
|
|
2024 |
|
|
% Change |
|
| Salaries and employee benefits |
|
$ |
152,972 |
|
|
$ |
156,650 |
|
|
|
(2.3 |
)% |
| Occupancy and equipment |
|
|
28,477 |
|
|
|
28,640 |
|
|
|
(0.6 |
) |
| Data processing and software |
|
|
27,132 |
|
|
|
30,028 |
|
|
|
(9.6 |
) |
| Deposit insurance assessments |
|
|
8,643 |
|
|
|
8,414 |
|
|
|
2.7 |
|
| Amortization of intangibles |
|
|
3,668 |
|
|
|
4,066 |
|
|
|
(9.8 |
) |
| Merger expense |
|
|
315 |
|
|
|
— |
|
|
|
100.0 |
|
| Advertising and public relations (1) |
|
|
4,157 |
|
|
|
4,224 |
|
|
|
(1.6 |
) |
| Foreclosed property expense (1) |
|
|
864 |
|
|
|
268 |
|
|
|
NM |
|
| Telecommunications (1) |
|
|
1,512 |
|
|
|
1,545 |
|
|
|
(2.1 |
) |
| Travel and entertainment (1) |
|
|
2,436 |
|
|
|
2,236 |
|
|
|
9.0 |
|
| Professional, consulting and outsourcing (1) |
|
|
4,733 |
|
|
|
3,935 |
|
|
|
20.3 |
|
| Legal (1) |
|
|
3,559 |
|
|
|
3,682 |
|
|
|
(3.3 |
) |
| Postage and shipping (1) |
|
|
1,773 |
|
|
|
2,205 |
|
|
|
(19.6 |
) |
| Other miscellaneous expense (1) |
|
|
19,108 |
|
|
|
17,314 |
|
|
|
10.4 |
|
| Total noninterest expense |
|
$ |
259,349 |
|
|
$ |
263,207 |
|
|
|
(1.5 |
)% |
|
(1) |
Included in other expense on the consolidated statements of income. |
Noninterest expense for the three months ended March 31, 2025 was $259.3 million, a decrease of $3.9
million, or 1.5%, from the same period in 2024. Data processing and software expense decreased $2.9 million for the three months ended March 31, 2025 compared to the same period in 2024, driven by decreases in vendor costs and contract programming
expenses, partially offset by increases in software costs.
Other miscellaneous expense includes insurance expense, operational and fraud losses, supplies expense,
franchise and sales taxes, training and business development expenses, various regulatory fees, and various other expenses. This category increased $1.8 million for the three months ended March 31, 2025 compared to the same period in 2024, primarily
due to an increase of $2.8 million in operational losses. These increases were partially mitigated by a decrease in delivery related expenses of $0.9 million.
Salaries and employee benefits expense was the largest category of our noninterest expense. Salaries and
employee benefits decreased $3.7 million for the three months ended March 31, 2025 compared to the same period in 2024. The decrease was primarily attributable to increased deferred salaries from increased mortgage loan production in 2025 and a
favorable adjustment in the first quarter of 2025 to share based payment expense, partially offset by increases in mortgage commissions due to the increased mortgage loan production in the first quarter of 2025.
The components of salary and employee benefits expense for the periods indicated and the percentage change
between years are shown in the following table:
TABLE 12—SALARIES AND EMPLOYEE BENEFITS EXPENSE
| |
|
Three Months Ended March 31, |
|
| (Dollars in thousands) |
|
2025 |
|
|
2024 |
|
|
% Change |
|
| Regular salaries, net of deferred salaries |
|
$ |
94,890 |
|
|
$ |
98,623 |
|
|
|
(3.8 |
)% |
| Commissions and incentive compensation |
|
|
29,108 |
|
|
|
28,027 |
|
|
|
3.9 |
|
| Taxes and employee benefits |
|
|
28,974 |
|
|
|
30,000 |
|
|
|
(3.4 |
) |
| Total salaries and employee benefits |
|
$ |
152,972 |
|
|
$ |
156,650 |
|
|
|
(2.3 |
)% |
Income Taxes
The Company recorded an income tax expense of $36.0 million for the three months ended March 31, 2025,
compared to $35.5 million for the same period in 2024. The increase in tax expense in 2025 can be attributed to higher pre-tax income.
The effective tax rate was 21.3% for the three months ended March 31, 2025, compared to 23.3% for the same
period in 2024. The decrease in the effective tax rate was the result of increased tax credits and excess tax benefits from stock-based compensation.
In August 2022, the IRA of 2022 was signed into law to address inflation, healthcare costs, climate change
and renewal energy incentives, among other things. Included in the IRA of 2022 are provisions for the creation of a 15% CAMT that is effective for tax years beginning January 1, 2023 for corporations with an average annual adjusted financial statement
income in excess of $1 billion. Based on information available to date, we do not anticipate that the Company will be subject to the 15% CAMT in 2025, absent any further changes in law.
FINANCIAL CONDITION
The percentage of earning assets to total assets measures the effectiveness of management’s efforts to
invest available funds representing the most efficient and profitable uses. Earning assets at March 31, 2025 were $43.2 billion, or 90.4% of total assets, compared with $42.4 billion, or 90.1% of total assets, at December 31, 2024.
TABLE 13—FINANCIAL CONDITION SUMMARY
| (In thousands) |
|
As of and For the
Three Months Ended
March 31, 2025 |
|
|
As of and For the
Year Ended
December 31, 2024 |
|
| Period-End Balances: |
|
|
|
|
|
|
|
|
| Total assets |
|
$ |
47,743,294 |
|
|
$ |
47,019,190 |
|
| Available for sale securities, at fair value |
|
|
7,912,159 |
|
|
|
7,293,988 |
|
| Loans and leases, net of unearned income |
|
|
34,051,610 |
|
|
|
33,741,755 |
|
| Total deposits |
|
|
40,335,728 |
|
|
|
40,496,201 |
|
| Securities sold under agreement to repurchase |
|
|
19,671 |
|
|
|
23,616 |
|
| Short-term FHLB borrowings |
|
|
235,000 |
|
|
|
— |
|
| Subordinated and long-term borrowings |
|
|
560,690 |
|
|
|
10,706 |
|
| Total shareholders’ equity |
|
|
5,718,541 |
|
|
|
5,569,683 |
|
| Common shareholders’ equity |
|
|
5,551,548 |
|
|
|
5,402,690 |
|
| Average Balances: |
|
|
|
|
|
|
|
|
| Total assets |
|
|
47,135,431 |
|
|
|
47,973,279 |
|
| Available for sale securities, at fair value |
|
|
7,302,172 |
|
|
|
7,962,869 |
|
| Loans and leases, net of unearned income |
|
|
33,944,416 |
|
|
|
33,107,659 |
|
| Total deposits |
|
|
40,353,292 |
|
|
|
38,475,929 |
|
| Securities sold under agreement to repurchase |
|
|
22,956 |
|
|
|
81,092 |
|
| Federal funds purchased and short-term BTFP and FHLB borrowings |
|
|
108,389 |
|
|
|
2,850,981 |
|
| Subordinated and long-term borrowings |
|
|
129,030 |
|
|
|
306,396 |
|
| Total shareholders’ equity |
|
|
5,651,592 |
|
|
|
5,353,705 |
|
| Common shareholders’ equity |
|
|
5,484,599 |
|
|
|
5,186,712 |
|
Securities
The Company uses its securities portfolio as a source of revenue and liquidity, and to serve as collateral
to secure certain types of deposits and borrowings. These securities, which are available for possible sale, are recorded at fair value. The following table shows the carrying value of the Company’s AFS securities by investment category for the periods
indicated:
TABLE 14—AVAILABLE FOR SALE SECURITIES SUMMARY
| (In thousands) |
|
March 31, 2025 |
|
|
December 31, 2024 |
|
| Available for sale securities: |
|
|
|
|
|
|
|
|
| U.S. government agency securities |
|
$ |
274,285 |
|
|
$ |
281,231 |
|
| MBS issued or guaranteed by U.S. agencies |
|
|
|
|
|
|
|
|
| Residential pass-through: |
|
|
|
|
|
|
|
|
| Guaranteed by GNMA |
|
|
66,149 |
|
|
|
66,581 |
|
| Issued by FNMA and FHLMC |
|
|
4,024,678 |
|
|
|
3,965,556 |
|
| Other residential MBS |
|
|
1,564,928 |
|
|
|
934,721 |
|
| Commercial MBS |
|
|
1,486,525 |
|
|
|
1,549,641 |
|
| Total MBS |
|
|
7,142,280 |
|
|
|
6,516,499 |
|
| Obligations of states and political subdivisions |
|
|
129,822 |
|
|
|
132,069 |
|
| Corporate debt securities |
|
|
48,422 |
|
|
|
47,402 |
|
| Foreign debt securities |
|
|
317,350 |
|
|
|
316,787 |
|
| Total |
|
$ |
7,912,159 |
|
|
$ |
7,293,988 |
|
At March 31, 2025, the Company’s AFS securities totaled $7.9 billion compared to $7.3 billion at December
31, 2024. The increase of $618.2 million, or 8.5%, was primarily driven by the purchases of $788.6 million of higher yielding securities during the period. The increase was offset by the maturities and paydowns of $262.1 million of AFS securities
during the period.
Net unrealized losses on AFS securities at March 31, 2025 and December 31, 2024 totaled $758.5 million and
$853.7 million, respectively. At March 31, 2025, management believes that the unrealized losses are due to noncredit-related factors, such as changes in interest rates and other market conditions (see Note 2 to the unaudited consolidated financial
statements).
The following table shows the maturities and weighted average yields for the carrying value of the AFS
securities for the periods indicated:
TABLE 15—MATURITY DISTRIBUTION OF AFS SECURITIES
| |
|
Contractual Maturity |
|
| |
|
March 31, 2025 |
|
|
December 31, 2024 |
|
| (Dollars in thousands) |
|
Estimated
Fair Value |
|
|
Weighted
Average
Yield |
|
|
Estimated
Fair Value |
|
|
Weighted
Average
Yield |
|
| U.S. government agency securities: |
|
|
|
|
|
|
|
|
|
|
|
|
|
|
|
|
| Due in one to five years |
|
$ |
7,349 |
|
|
|
3.47 |
% |
|
$ |
8,364 |
|
|
|
3.76 |
% |
| Due in five to ten years |
|
|
196,900 |
|
|
|
3.73 |
|
|
|
204,624 |
|
|
|
4.10 |
|
| Due after ten years |
|
|
70,036 |
|
|
|
2.10 |
|
|
|
68,243 |
|
|
|
2.14 |
|
| U.S. government agency securities total |
|
|
274,285 |
|
|
|
3.31 |
|
|
|
281,231 |
|
|
|
3.62 |
|
| Obligations of states and political subdivisions: |
|
|
|
|
|
|
|
|
|
|
|
|
|
|
|
|
| Due in one to five years |
|
|
9,215 |
|
|
|
2.87 |
|
|
|
9,295 |
|
|
|
2.92 |
|
| Due in five to ten years |
|
|
15,866 |
|
|
|
2.21 |
|
|
|
15,563 |
|
|
|
2.22 |
|
| Due after ten years |
|
|
104,741 |
|
|
|
2.69 |
|
|
|
107,211 |
|
|
|
2.69 |
|
| Obligations of states and political subdivisions total |
|
|
129,822 |
|
|
|
2.65 |
|
|
|
132,069 |
|
|
|
2.66 |
|
| Corporate debt securities: |
|
|
|
|
|
|
|
|
|
|
|
|
|
|
|
|
| Due in five to ten years |
|
|
46,672 |
|
|
|
4.85 |
|
|
|
45,702 |
|
|
|
4.77 |
|
| Due after ten years |
|
|
1,750 |
|
|
|
4.50 |
|
|
|
1,700 |
|
|
|
4.50 |
|
| Corporate debt securities total |
|
|
48,422 |
|
|
|
4.83 |
|
|
|
47,402 |
|
|
|
4.76 |
|
| Foreign debt securities: |
|
|
|
|
|
|
|
|
|
|
|
|
|
|
|
|
| Due in one to five years |
|
|
88,373 |
|
|
|
3.24 |
|
|
|
87,855 |
|
|
|
3.36 |
|
| Due in five to ten years |
|
|
228,977 |
|
|
|
4.82 |
|
|
|
228,932 |
|
|
|
5.16 |
|
| Foreign debt securities total |
|
|
317,350 |
|
|
|
4.38 |
|
|
|
316,787 |
|
|
|
4.66 |
|
| |
|
|
|
|
|
|
|
|
|
|
|
|
|
|
|
|
| Total securities due in one to five years |
|
|
104,937 |
|
|
|
3.23 |
|
|
|
105,514 |
|
|
|
3.35 |
|
| Total securities due in five to ten years |
|
|
488,415 |
|
|
|
4.30 |
|
|
|
494,821 |
|
|
|
4.59 |
|
| Total securities due after ten years |
|
|
176,527 |
|
|
|
2.48 |
|
|
|
177,154 |
|
|
|
2.50 |
|
| MBS |
|
|
7,142,280 |
|
|
|
3.02 |
|
|
|
6,516,499 |
|
|
|
2.87 |
|
| Total estimated fair value |
|
$ |
7,912,159 |
|
|
|
3.09 |
% |
|
$ |
7,293,988 |
|
|
|
2.98 |
% |
The weighted average yields reported in Table 15 have been calculated using the average daily balance of the
related securities. The yields on tax-exempt obligations of states and political subdivisions have been adjusted to a taxable equivalent basis using a 21% tax rate.
Loans and Leases
The Company’s loans and leases held for investment portfolio represents the largest single component of the
Company’s earning asset base. Average loans and leases comprised 79.6% and 75.9% of average earning assets during the three months ended March 31, 2025 and the year ended December 31, 2024, respectively. The Company’s lending activities include both
commercial and consumer loans and leases. The Company has established systematic procedures for approving and monitoring loans and leases that vary depending on the size and nature of the loan or lease and applies these procedures in a disciplined
manner. The Company also acts as agent or participant in syndications and other financing arrangements with other financial institutions. The Company’s loans and leases are widely diversified by borrower and industry. Loans and leases, net of unearned
income, totaled $34.1 billion at March 31, 2025, representing a 0.9% increase from $33.7 billion at December 31, 2024.
The following table shows the composition of the Company’s loan and lease portfolio by segment and class at
the dates indicated:
TABLE 16—LOANS AND LEASES PORTFOLIO
| (In thousands) |
|
March 31, 2025 |
|
|
December 31, 2024 |
|
| Commercial and industrial |
|
|
|
|
|
|
|
|
| Non-real estate |
|
$ |
8,688,653 |
|
|
$ |
8,670,529 |
|
| Owner occupied |
|
|
4,667,477 |
|
|
|
4,665,015 |
|
| Total commercial and industrial |
|
|
13,356,130 |
|
|
|
13,335,544 |
|
| Commercial real estate |
|
|
|
|
|
|
|
|
| Construction, acquisition and development |
|
|
3,723,408 |
|
|
|
3,909,184 |
|
| Income producing |
|
|
6,268,456 |
|
|
|
6,015,773 |
|
| Total commercial real estate |
|
|
9,991,864 |
|
|
|
9,924,957 |
|
| Consumer |
|
|
|
|
|
|
|
|
| Residential mortgages |
|
|
10,498,320 |
|
|
|
10,267,883 |
|
| Other consumer |
|
|
205,296 |
|
|
|
213,371 |
|
| Total consumer |
|
|
10,703,616 |
|
|
|
10,481,254 |
|
| Total loans and leases, net of unearned income (1) |
|
$ |
34,051,610 |
|
|
$ |
33,741,755 |
|
|
(1) |
Total loans and leases are net of $16.4 million and $21.4 million of unearned income at March 31, 2025 and December 31, 2024, respectively. |
The following table shows the Company’s loan and lease portfolio by segment and class at the dates indicated
by geographical location.
TABLE 17—LOANS AND LEASES BY GEOGRAPHICAL LOCATION
| |
|
March 31, 2025 |
|
| |
|
|
|
| (In thousands) |
|
Alabama |
|
|
Arkansas |
|
|
Florida |
|
|
Georgia |
|
|
Louisiana |
|
|
Mississippi |
|
|
Missouri |
|
|
Tennessee |
|
|
Texas |
|
|
Other |
|
|
Total |
|
| Commercial and industrial |
|
|
|
|
|
|
|
|
|
|
|
|
|
|
|
|
|
|
|
|
|
|
|
|
|
|
|
|
|
|
|
|
|
|
|
|
|
|
|
|
|
|
|
|
| Non-real estate |
|
$ |
424,598 |
|
|
$ |
157,460 |
|
|
$ |
576,477 |
|
|
$ |
464,611 |
|
|
$ |
375,154 |
|
|
$ |
534,964 |
|
|
$ |
65,370 |
|
|
$ |
338,916 |
|
|
$ |
3,467,605 |
|
|
$ |
2,283,498 |
|
|
$ |
8,688,653 |
|
| Owner occupied |
|
|
338,752 |
|
|
|
244,335 |
|
|
|
306,890 |
|
|
|
429,592 |
|
|
|
294,980 |
|
|
|
590,076 |
|
|
|
99,197 |
|
|
|
159,241 |
|
|
|
1,766,119 |
|
|
|
438,295 |
|
|
|
4,667,477 |
|
| Total commercial and industrial |
|
|
763,350 |
|
|
|
401,795 |
|
|
|
883,367 |
|
|
|
894,203 |
|
|
|
670,134 |
|
|
|
1,125,040 |
|
|
|
164,567 |
|
|
|
498,157 |
|
|
|
5,233,724 |
|
|
|
2,721,793 |
|
|
|
13,356,130 |
|
| Commercial real estate |
|
|
|
|
|
|
|
|
|
|
|
|
|
|
|
|
|
|
|
|
|
|
|
|
|
|
|
|
|
|
|
|
|
|
|
|
|
|
|
|
|
|
|
|
| Construction, acquisition and development |
|
|
220,664 |
|
|
|
79,437 |
|
|
|
371,396 |
|
|
|
443,876 |
|
|
|
48,561 |
|
|
|
166,644 |
|
|
|
36,117 |
|
|
|
184,595 |
|
|
|
1,714,761 |
|
|
|
457,357 |
|
|
|
3,723,408 |
|
| Income producing |
|
|
434,990 |
|
|
|
258,337 |
|
|
|
544,896 |
|
|
|
783,768 |
|
|
|
226,924 |
|
|
|
423,200 |
|
|
|
215,550 |
|
|
|
315,125 |
|
|
|
2,323,475 |
|
|
|
742,191 |
|
|
|
6,268,456 |
|
| Total commercial real estate |
|
|
655,654 |
|
|
|
337,774 |
|
|
|
916,292 |
|
|
|
1,227,644 |
|
|
|
275,485 |
|
|
|
589,844 |
|
|
|
251,667 |
|
|
|
499,720 |
|
|
|
4,038,236 |
|
|
|
1,199,548 |
|
|
|
9,991,864 |
|
| Consumer |
|
|
|
|
|
|
|
|
|
|
|
|
|
|
|
|
|
|
|
|
|
|
|
|
|
|
|
|
|
|
|
|
|
|
|
|
|
|
|
|
|
|
|
|
| Residential mortgages |
|
|
1,309,478 |
|
|
|
430,005 |
|
|
|
719,379 |
|
|
|
455,027 |
|
|
|
484,751 |
|
|
|
1,221,895 |
|
|
|
226,051 |
|
|
|
821,297 |
|
|
|
4,571,649 |
|
|
|
258,788 |
|
|
|
10,498,320 |
|
| Other consumer |
|
|
25,579 |
|
|
|
17,844 |
|
|
|
4,776 |
|
|
|
7,982 |
|
|
|
10,486 |
|
|
|
83,368 |
|
|
|
1,246 |
|
|
|
15,557 |
|
|
|
33,872 |
|
|
|
4,586 |
|
|
|
205,296 |
|
| Total consumer |
|
|
1,335,057 |
|
|
|
447,849 |
|
|
|
724,155 |
|
|
|
463,009 |
|
|
|
495,237 |
|
|
|
1,305,263 |
|
|
|
227,297 |
|
|
|
836,854 |
|
|
|
4,605,521 |
|
|
|
263,374 |
|
|
|
10,703,616 |
|
| Total |
|
$ |
2,754,061 |
|
|
$ |
1,187,418 |
|
|
$ |
2,523,814 |
|
|
$ |
2,584,856 |
|
|
$ |
1,440,856 |
|
|
$ |
3,020,147 |
|
|
$ |
643,531 |
|
|
$ |
1,834,731 |
|
|
$ |
13,877,481 |
|
|
$ |
4,184,715 |
|
|
$ |
34,051,610 |
|
| |
|
December 31, 2024 |
|
| |
|
|
|
| (In thousands) |
|
Alabama |
|
|
Arkansas |
|
|
Florida |
|
|
Georgia |
|
|
Louisiana |
|
|
Mississippi |
|
|
Missouri |
|
|
Tennessee |
|
|
Texas |
|
|
Other |
|
|
Total |
|
| Commercial and industrial |
|
|
|
|
|
|
|
|
|
|
|
|
|
|
|
|
|
|
|
|
|
|
|
|
|
|
|
|
|
|
|
|
|
|
|
|
|
|
|
|
|
|
|
|
| Non-real estate |
|
$ |
413,359 |
|
|
$ |
169,534 |
|
|
$ |
532,224 |
|
|
$ |
446,812 |
|
|
$ |
371,543 |
|
|
$ |
536,651 |
|
|
$ |
64,846 |
|
|
$ |
399,346 |
|
|
$ |
3,478,755 |
|
|
$ |
2,257,459 |
|
|
$ |
8,670,529 |
|
| Owner occupied |
|
|
337,580 |
|
|
|
253,538 |
|
|
|
308,545 |
|
|
|
400,342 |
|
|
|
298,787 |
|
|
|
624,950 |
|
|
|
107,443 |
|
|
|
159,058 |
|
|
|
1,708,113 |
|
|
|
466,659 |
|
|
|
4,665,015 |
|
| Total commercial and industrial |
|
|
750,939 |
|
|
|
423,072 |
|
|
|
840,769 |
|
|
|
847,154 |
|
|
|
670,330 |
|
|
|
1,161,601 |
|
|
|
172,289 |
|
|
|
558,404 |
|
|
|
5,186,868 |
|
|
|
2,724,118 |
|
|
|
13,335,544 |
|
| Commercial real estate |
|
|
|
|
|
|
|
|
|
|
|
|
|
|
|
|
|
|
|
|
|
|
|
|
|
|
|
|
|
|
|
|
|
|
|
|
|
|
|
|
|
|
|
|
| Construction, acquisition and development |
|
|
230,810 |
|
|
|
65,358 |
|
|
|
438,173 |
|
|
|
543,249 |
|
|
|
36,194 |
|
|
|
169,336 |
|
|
|
45,690 |
|
|
|
180,566 |
|
|
|
1,656,715 |
|
|
|
543,093 |
|
|
|
3,909,184 |
|
| Income producing |
|
|
437,146 |
|
|
|
259,767 |
|
|
|
477,493 |
|
|
|
613,337 |
|
|
|
226,849 |
|
|
|
424,078 |
|
|
|
204,119 |
|
|
|
319,560 |
|
|
|
2,298,344 |
|
|
|
755,080 |
|
|
|
6,015,773 |
|
| Total commercial real estate |
|
|
667,956 |
|
|
|
325,125 |
|
|
|
915,666 |
|
|
|
1,156,586 |
|
|
|
263,043 |
|
|
|
593,414 |
|
|
|
249,809 |
|
|
|
500,126 |
|
|
|
3,955,059 |
|
|
|
1,298,173 |
|
|
|
9,924,957 |
|
| Consumer |
|
|
|
|
|
|
|
|
|
|
|
|
|
|
|
|
|
|
|
|
|
|
|
|
|
|
|
|
|
|
|
|
|
|
|
|
|
|
|
|
|
|
|
|
| Residential mortgages |
|
|
1,300,485 |
|
|
|
425,602 |
|
|
|
709,335 |
|
|
|
449,117 |
|
|
|
478,947 |
|
|
|
1,214,542 |
|
|
|
210,712 |
|
|
|
796,490 |
|
|
|
4,436,803 |
|
|
|
245,850 |
|
|
|
10,267,883 |
|
| Other consumer |
|
|
27,186 |
|
|
|
17,653 |
|
|
|
5,002 |
|
|
|
7,817 |
|
|
|
10,653 |
|
|
|
86,059 |
|
|
|
1,322 |
|
|
|
16,668 |
|
|
|
36,559 |
|
|
|
4,452 |
|
|
|
213,371 |
|
| Total consumer |
|
|
1,327,671 |
|
|
|
443,255 |
|
|
|
714,337 |
|
|
|
456,934 |
|
|
|
489,600 |
|
|
|
1,300,601 |
|
|
|
212,034 |
|
|
|
813,158 |
|
|
|
4,473,362 |
|
|
|
250,302 |
|
|
|
10,481,254 |
|
| Total |
|
$ |
2,746,566 |
|
|
$ |
1,191,452 |
|
|
$ |
2,470,772 |
|
|
$ |
2,460,674 |
|
|
$ |
1,422,973 |
|
|
$ |
3,055,616 |
|
|
$ |
634,132 |
|
|
$ |
1,871,688 |
|
|
$ |
13,615,289 |
|
|
$ |
4,272,593 |
|
|
$ |
33,741,755 |
|
Loans Acquired in Mergers and Acquisitions
In connection with past bank acquisitions, the Company acquired loans both with and without evidence of
credit quality deterioration since origination. Acquired loans are recorded at their fair value at the time of acquisition with no carryover from the acquired institution’s previously recorded allowance for credit losses.
The fair value for acquired loans recorded at the time of acquisition is based upon several factors including
the timing and payment of expected cash flows, as adjusted for estimated credit losses and prepayments, and then discounting these cash flows using comparable market rates. The resulting fair value adjustment is recorded in the form of a premium or
discount to the unpaid principal balance of each acquired loan. As it relates to acquired loans that, as of the date of acquisition, have experienced a more-than-insignificant deterioration in credit quality since origination (“PCD”), the net premium
or net discount is adjusted to reflect the Company’s ACL recorded for PCD loans at the time of acquisition, and the remaining fair value adjustment not related to credit is accreted or amortized into interest income over the remaining life of the loan.
As it relates to acquired loans not classified as PCD (“non-PCD”) loans, the credit loss and yield components of the fair value adjustment are aggregated, and the resulting net premium or net discount is accreted or amortized into interest income over
the remaining life of the loan. The Company records an ACL for non-PCD loans at the time of acquisition through provision expense, and therefore, no further adjustments are made to the net premium or net discount for non-PCD loans.
In addition, a grade is assigned to each loan during the valuation process. For acquired loans that are not
individually reviewed during the valuation process, such loans are assumed to have characteristics similar to the assigned rating of the acquired institution’s risk rating, adjusted for any estimated differences between the Company’s rating methodology
and the acquired institution’s risk rating methodology. Acquired loans that are individually evaluated at the acquisition date are assigned a specific reserve in the same manner as other loans individually evaluated and are assigned an internal grade
representing PCD with Loss Exposure.
The following is a discussion of the Company’s segments and classes of loans and leases:
Commercial and Industrial
Non-Real Estate – The Company engages in lending to small and medium-sized business enterprises and
government entities through its community banking locations and to regional and national business enterprises through its corporate banking division. C&I loans are loans and leases to finance business operations, equipment and owner-occupied
facilities. These include both lines of credit and term loans which are amortized over the useful life of the assets financed. Personal and/or corporate guarantees are generally obtained where available and prudent. Also included in this category are
loans to finance agricultural production. The Company recognizes that risk from economic cycles, commodity prices, pandemics, government regulation, supply-chain disruptions, product innovations or obsolescence, operational errors, lawsuits, natural
disasters, fraud, losses due to theft or embezzlement, loss of sponsor support, health or loss of key personnel, or competitive situations may adversely affect the scheduled repayment of business loans. In addition, risks in the agricultural sector
including crop failures due to weather, insects and other blights, commodity prices, governmental intervention, lawsuits, labor or logistical disruptions. Non-real estate loans increased 0.2% from December 31, 2024 to March 31, 2025.
Owner Occupied – Owner occupied loans include loans secured by
business facilities to finance business operations, equipment, agricultural land and owner-occupied facilities. These include both lines of credit and term loans which are amortized over the useful life of the assets financed. Personal
guarantees are generally obtained where available and prudent. The Company recognizes that risk from economic cycles, pandemics, government regulation, supply-chain disruptions, product innovations or obsolescence, operational errors, lawsuits, natural
disasters, losses due to theft or embezzlement, health or loss of key personnel, or competitive situations may adversely affect the scheduled repayment of business loans. Owner occupied loans increased 0.1% from December 31, 2024 to March 31, 2025.
Commercial Real Estate
Construction, Acquisition and Development – CAD loans include both term loans and credit lines for
construction of commercial, industrial, residential, and multi-family buildings and for purchasing, carrying, and developing land into residential subdivisions or various types of commercial developments, such as industrial, warehouse, retail, office,
and multi-family. The Company generally engages in construction and development lending primarily in markets served by its branches. The Company recognizes that risks are inherent in the financing of real estate development and construction. These
risks include location, market conditions and price volatility, changes in interest rates, demand for developed land, lots and buildings, desirability of features and styling of completed developments and buildings, competition from other developments
and builders, traffic patterns, remote work patterns, governmental jurisdiction, tax structure, availability of utilities, roads, public transportation and schools, availability of permanent financing for homebuyers, zoning, environmental restrictions,
lawsuits, economic and business cycle, or labor and reputation of the builder or developer. CAD loans decreased 4.8% from December 31, 2024 to March 31, 2025.
Each CAD loan is underwritten to address: (i) the desirability of the project, its market viability and
projected absorption period; (ii) the creditworthiness of the borrower and the guarantor, if applicable, as to liquidity, cash flow and assets available to ensure performance of the loan; (iii) equity contribution to the project; (iv) the developer’s
experience and success with similar projects; and (v) the value of the collateral.
Income Producing – Income producing loans include loans to finance income-producing commercial and
multi-family properties. Lending in this category is generally limited to properties located in the Company’s market area with only limited exposure to properties located elsewhere. Loans in this category include loans for neighborhood retail centers,
medical and professional offices, single retail stores, warehouses and apartments leased generally to local businesses and residents. The underwriting of these loans takes into consideration the occupancy and rental rates as well as the financial
health of the borrower. The Company’s exposure to national retail tenants is limited. The Company recognizes that risk from economic cycles, pandemics, delayed or missed rent payments, supply-chain disruptions, operational errors, lawsuits, natural
disasters, losses due to theft or embezzlement, health or loss of key personnel, or competitive situations may adversely affect the scheduled repayment of business loans. Income producing loans increased 4.2% from December 31, 2024 to March 31, 2025.
Consumer
Residential Mortgages – Consumer mortgages are first or second-lien loans to consumers secured by a
primary residence or second home. This category includes traditional mortgages and home equity loans and revolving lines of credit. The loans are generally secured by properties located primarily in markets served by the Company’s branches. These loans
are underwritten in accordance with the Company’s general loan policy and procedures which require, among other things, proper documentation of each borrower’s financial condition, satisfactory credit history, and property value. In addition to loans
originated for the Company’s portfolio, the Company originates and services consumer mortgages sold in the secondary market which are underwritten and closed pursuant to investor and agency guidelines. Residential mortgages increased 2.2% from December
31, 2024 to March 31, 2025.
Other Consumer – Other consumer lending includes consumer credit card accounts as well as personal
revolving lines of credit and installment loans. The Company offers credit cards primarily to its deposit and loan customers. Consumer installment loans include term loans of up to five years secured by automobiles, boats and recreational vehicles. The
Company recognizes that there are risks in consumer lending which include interruptions in the borrower’s personal and investment income due to loss of employment, market conditions, and general economic conditions, deterioration in the health and
well-being of the borrower and family members, natural disasters, pandemics, lawsuits, losses, or inability to generate income due to injury, accidents, theft, vandalism, or incarceration. Other consumer loans decreased 3.8% from December 31, 2024 to
March 31, 2025.
Selected Loan Maturity and Interest Rate Sensitivity
The maturity distribution of the Company’s loan portfolio is one factor in management’s evaluation of the
risk characteristics of the loan and lease portfolio. The interest rate sensitivity of the Company’s loan and lease portfolio is important in the management of net interest margin. The Company attempts to manage the relationship between the interest
rate sensitivity of its assets and liabilities to produce an effective interest differential that is not significantly impacted by changes in the level of interest rates (See - Quantitative and Qualitative Disclosures About Market Risk). The following
table shows the maturity distribution based on remaining maturities of the Company’s loan and lease portfolio and the interest rate sensitivity of the Company’s loans and leases maturing after one year at March 31, 2025:
TABLE 18—INTEREST RATE SENSITIVITY OF LOANS AND LEASES
| |
|
March 31, 2025 |
|
| |
|
|
|
|
|
|
|
|
|
|
|
|
|
Rate Structure for Loans
Maturing Over One Year |
|
| (In thousands) |
|
One Year
or Less |
|
|
Over One
Year through
Five Years |
|
|
Over Five
Years through
Fifteen Years |
|
|
Over Fifteen
Years |
|
|
Fixed
Interest Rate |
|
|
Variable
Interest Rate |
|
| Commercial and industrial |
|
|
|
|
|
|
|
|
|
|
|
|
|
|
|
|
|
|
|
|
|
|
|
|
| Non-real estate |
|
$ |
1,537,791 |
|
|
$ |
5,879,816 |
|
|
$ |
1,174,232 |
|
|
$ |
96,814 |
|
|
$ |
865,504 |
|
|
$ |
6,285,358 |
|
| Owner occupied |
|
|
271,509 |
|
|
|
1,068,752 |
|
|
|
1,833,940 |
|
|
|
1,493,276 |
|
|
|
1,514,683 |
|
|
|
2,881,285 |
|
| Total commercial and industrial |
|
|
1,809,300 |
|
|
|
6,948,568 |
|
|
|
3,008,172 |
|
|
|
1,590,090 |
|
|
|
2,380,187 |
|
|
|
9,166,643 |
|
| Commercial real estate |
|
|
|
|
|
|
|
|
|
|
|
|
|
|
|
|
|
|
|
|
|
|
|
|
| Construction, acquisition and development |
|
|
1,326,888 |
|
|
|
1,095,894 |
|
|
|
566,086 |
|
|
|
734,540 |
|
|
|
315,724 |
|
|
|
2,080,796 |
|
| Income producing |
|
|
1,064,431 |
|
|
|
1,685,532 |
|
|
|
1,093,141 |
|
|
|
2,425,352 |
|
|
|
817,409 |
|
|
|
4,386,616 |
|
| Total commercial real estate |
|
|
2,391,319 |
|
|
|
2,781,426 |
|
|
|
1,659,227 |
|
|
|
3,159,892 |
|
|
|
1,133,133 |
|
|
|
6,467,412 |
|
| Consumer |
|
|
|
|
|
|
|
|
|
|
|
|
|
|
|
|
|
|
|
|
|
|
|
|
| Residential mortgages |
|
|
213,677 |
|
|
|
220,032 |
|
|
|
1,077,393 |
|
|
|
8,987,218 |
|
|
|
3,845,285 |
|
|
|
6,439,358 |
|
| Other consumer |
|
|
36,169 |
|
|
|
158,953 |
|
|
|
9,492 |
|
|
|
682 |
|
|
|
76,694 |
|
|
|
92,433 |
|
| Total consumer |
|
|
249,846 |
|
|
|
378,985 |
|
|
|
1,086,885 |
|
|
|
8,987,900 |
|
|
|
3,921,979 |
|
|
|
6,531,791 |
|
| Total |
|
$ |
4,450,465 |
|
|
$ |
10,108,979 |
|
|
$ |
5,754,284 |
|
|
$ |
13,737,882 |
|
|
$ |
7,435,299 |
|
|
$ |
22,165,846 |
|
Loans Held-for-Sale
At March 31, 2025 and December 31, 2024, loans held for sale totaled $220.4 million and $244.2 million,
respectively. Included in loans held for sale are loans sold to GNMA with an option to repurchase totaling $66.1 million and $69.0 million at March 31, 2025 and December 31, 2024, respectively. The Company records the GNMA loans at fair value on the
consolidated balance sheets with a corresponding liability. GNMA optional repurchase programs allow financial institutions to buy back individual delinquent mortgage loans that meet certain criteria (90 days or more past due) from the securitized loan
pool for which the institution provides servicing. At the servicer’s option and without GNMA’s prior authorization, the servicer may repurchase such a delinquent loan for an amount equal to 100% of the remaining principal balance of the loan. Under ASC
860, this buyback option is considered a conditional option until the delinquency criteria are met, at which time the option becomes unconditional. When the Company is deemed to have regained effective control over these loans under the unconditional
buyback option, the loans can no longer be reported as sold and must be brought back onto the consolidated balance sheet as loans held for sale, regardless of whether the Company intends to exercise the buy-back option. These GNMA loans are not
included in the nonperforming loans totals (See Table 19).
Asset Quality
Nonperforming Assets
NPA consists of NPL, OREO, and other repossessed assets. The decrease from December 31, 2024 to March 31,
2025 in NPA was driven by the decrease of $28.7 million, or 10.9%, in nonaccrual loans and leases (See Tables 20 and 21). The majority of the decrease in nonaccrual loans and leases was located in the C&I non-real estate and CRE income producing
segments. The decrease was partially offset by the increase of $2.7 million, or 46.9%, in foreclosed OREO and other NPA. NPA were as follows as of each period presented:
TABLE 19—NONPERFORMING ASSETS
| (Dollars in thousands) |
|
March 31, 2025 |
|
|
December 31, 2024 |
|
| Total NPL(1) |
|
$ |
235,952 |
|
|
$ |
264,692 |
|
| Foreclosed OREO and other NPA |
|
|
8,452 |
|
|
|
5,754 |
|
| Total NPA |
|
$ |
244,404 |
|
|
$ |
270,446 |
|
| NPL to total loans and leases |
|
|
0.69 |
% |
|
|
0.78 |
% |
| NPA to total assets |
|
|
0.51 |
% |
|
|
0.58 |
% |
| |
|
|
|
|
|
|
|
|
| GNMA loans 90 or more days past due eligible for repurchase |
|
$ |
66,148 |
|
|
$ |
68,993 |
|
| |
|
|
|
|
|
|
|
|
| Government guaranteed portion of nonaccrual loans and leases covered by the SBA, FHA, VA or USDA |
|
$ |
84,339 |
|
|
$ |
89,906 |
|
| |
|
|
|
|
|
|
|
|
| Loans and leases 90+ days past due, still accruing |
|
$ |
8,832 |
|
|
$ |
13,126 |
|
|
(1) |
See Tables 20 and 21 for more information regarding NPL. |
Nonperforming Loans
NPL consist of nonaccrual loans and leases. The Company’s policy provides that loans and leases are
generally placed in nonaccrual status if, in management’s opinion, payment in full of principal or interest is not expected or payment of principal or interest is more than 90 days past due for commercial loans and 120 days past due for consumer loans,
unless the loan or lease is both well-secured and in the process of collection. NPL decreased 10.9% at March 31, 2025, compared to December 31, 2024. NPL as a percentage of net loans and leases decreased from 0.8% at December 31, 2024 to 0.7% at March
31, 2025. NPL trends decreased during the first quarter of 2025, primarily due to the charge-off of one asset-based lending credit as well as continued momentum in the resolution process related to SBA credits. With the current forecast, the Company
expects a moderate correlation between NPL trends and provision amounts.
Included in NPL at March 31, 2025 were loans of $51.3 million that are individually analyzed
collateral-dependent loans for which a specific provision has been considered to address the unsupported exposure. Collateral-dependent loans are typically assigned an internal rating of impaired or PCD (loss). However, additional risk ratings can be
used as needed to align with regulatory definitions. PCD (loss) represent loans with evidence of deterioration of credit quality since origination that are acquired, and for which it was probable, at acquisition, that the bank will be unable to collect
all contractually required payments. At March 31, 2025, $42.7 million of nonperforming collateral-dependent loans for which a specific provision has been considered were rated as impaired and $8.6 million were rated as doubtful. Nonperforming
collateral-dependent loans had a specific reserve of $9.8 million included in the total ACL of $457.8 million at March 31, 2025, and were net of $16.7 million in partial charge-downs previously taken on these impaired loans. At March 31, 2025, there
were no net partial charge-downs previously taken on PCD (loss) loans.
NPL at December 31, 2024 included $75.8 million of nonperforming collateral-dependent loans that had a
specific reserve of $16.9 million included in the ACL of $460.8 million at December 31, 2024, and were net of $1.9 million in partial charge-downs previously taken on these impaired loans. Included in the $75.8 million of nonperforming
collateral-dependent loans at December 31, 2024 were $67.1 million rated as impaired and $8.7 million rated as doubtful. At December 31, 2024, there were no net partial charge-downs previously taken on PCD (loss) loans.
The following table presents the Company’s NPL by geographical location at the dates indicated:
TABLE 20—NONPERFORMING LOANS AND LEASES BY GEOGRAPHICAL LOCATION
| |
|
March 31, 2025 |
|
|
December 31, 2024 |
|
| (Dollars in thousands) |
|
Amortized Cost |
|
|
Total NPL |
|
|
NPL as a % of Amortized Cost |
|
|
Amortized Cost |
|
|
Total NPL |
|
|
NPL as a % of Amortized Cost |
|
| Alabama |
|
$ |
2,754,061 |
|
|
$ |
22,974 |
|
|
|
0.83 |
% |
|
$ |
2,746,566 |
|
|
$ |
22,394 |
|
|
|
0.82 |
% |
| Arkansas |
|
|
1,187,418 |
|
|
|
3,625 |
|
|
|
0.31 |
|
|
|
1,191,452 |
|
|
|
2,292 |
|
|
|
0.19 |
|
| Florida |
|
|
2,523,814 |
|
|
|
20,417 |
|
|
|
0.81 |
|
|
|
2,470,772 |
|
|
|
30,380 |
|
|
|
1.23 |
|
| Georgia |
|
|
2,584,856 |
|
|
|
16,402 |
|
|
|
0.63 |
|
|
|
2,460,674 |
|
|
|
17,245 |
|
|
|
0.70 |
|
| Louisiana |
|
|
1,440,856 |
|
|
|
6,641 |
|
|
|
0.46 |
|
|
|
1,422,973 |
|
|
|
5,669 |
|
|
|
0.40 |
|
| Mississippi |
|
|
3,020,147 |
|
|
|
17,829 |
|
|
|
0.59 |
|
|
|
3,055,616 |
|
|
|
13,702 |
|
|
|
0.45 |
|
| Missouri |
|
|
643,531 |
|
|
|
3,425 |
|
|
|
0.53 |
|
|
|
634,132 |
|
|
|
3,359 |
|
|
|
0.53 |
|
| Tennessee |
|
|
1,834,731 |
|
|
|
19,171 |
|
|
|
1.04 |
|
|
|
1,871,688 |
|
|
|
17,672 |
|
|
|
0.94 |
|
| Texas |
|
|
13,877,481 |
|
|
|
65,110 |
|
|
|
0.47 |
|
|
|
13,615,289 |
|
|
|
69,985 |
|
|
|
0.51 |
|
| Other |
|
|
4,184,715 |
|
|
|
60,358 |
|
|
|
1.44 |
|
|
|
4,272,593 |
|
|
|
81,994 |
|
|
|
1.92 |
|
| Total |
|
$ |
34,051,610 |
|
|
$ |
235,952 |
|
|
|
0.69 |
% |
|
$ |
33,741,755 |
|
|
$ |
264,692 |
|
|
|
0.78 |
% |
The following table provides additional details related to the Company’s loan and lease portfolio and the
distribution of NPL by segment and class at the dates indicated:
TABLE 21—NONPERFORMING LOANS AND LEASES BY SEGMENT AND CLASS
| |
|
March 31, 2025 |
|
|
December 31, 2024 |
|
| (Dollars in thousands) |
|
Amortized Cost |
|
|
Total NPL |
|
|
NPL as a % of Amortized Cost |
|
|
Amortized Cost |
|
|
Total NPL |
|
|
NPL as a % of Amortized Cost |
|
| Commercial and industrial |
|
|
|
|
|
|
|
|
|
|
|
|
|
|
|
|
|
|
|
|
|
|
|
|
| Non-real estate |
|
$ |
8,688,653 |
|
|
$ |
118,078 |
|
|
|
1.36 |
% |
|
$ |
8,670,529 |
|
|
$ |
145,115 |
|
|
|
1.67 |
% |
| Owner occupied |
|
|
4,667,477 |
|
|
|
18,988 |
|
|
|
0.41 |
|
|
|
4,665,015 |
|
|
|
16,904 |
|
|
|
0.36 |
|
| Total commercial and industrial |
|
|
13,356,130 |
|
|
|
137,066 |
|
|
|
1.03 |
|
|
|
13,335,544 |
|
|
|
162,019 |
|
|
|
1.21 |
|
| Commercial real estate |
|
|
|
|
|
|
|
|
|
|
|
|
|
|
|
|
|
|
|
|
|
|
|
|
| Construction, acquisition and development |
|
|
3,723,408 |
|
|
|
8,768 |
|
|
|
0.24 |
|
|
|
3,909,184 |
|
|
|
8,600 |
|
|
|
0.22 |
|
| Income producing |
|
|
6,268,456 |
|
|
|
8,021 |
|
|
|
0.13 |
|
|
|
6,015,773 |
|
|
|
18,542 |
|
|
|
0.31 |
|
| Total commercial real estate |
|
|
9,991,864 |
|
|
|
16,789 |
|
|
|
0.17 |
|
|
|
9,924,957 |
|
|
|
27,142 |
|
|
|
0.27 |
|
| Consumer |
|
|
|
|
|
|
|
|
|
|
|
|
|
|
|
|
|
|
|
|
|
|
|
|
| Residential mortgages |
|
|
10,498,320 |
|
|
|
81,803 |
|
|
|
0.78 |
|
|
|
10,267,883 |
|
|
|
75,287 |
|
|
|
0.73 |
|
| Other consumer |
|
|
205,296 |
|
|
|
294 |
|
|
|
0.14 |
|
|
|
213,371 |
|
|
|
244 |
|
|
|
0.11 |
|
| Total consumer |
|
|
10,703,616 |
|
|
|
82,097 |
|
|
|
0.77 |
|
|
|
10,481,254 |
|
|
|
75,531 |
|
|
|
0.72 |
|
| Total |
|
$ |
34,051,610 |
|
|
$ |
235,952 |
|
|
|
0.69 |
% |
|
$ |
33,741,755 |
|
|
$ |
264,692 |
|
|
|
0.78 |
% |
The following table provides details regarding the aging of the Company’s NPL by segment and class at the
dates indicated:
TABLE 22—AGING OF NONACCRUAL LOANS AND LEASES
| |
|
March 31, 2025 |
|
| (In thousands) |
|
30-59 Days
Past Due |
|
|
60-89 Days
Past Due |
|
|
90+ Days
Past Due |
|
|
Total
Past Due |
|
|
Current |
|
|
Total
Nonaccrual |
|
| Commercial and industrial |
|
|
|
|
|
|
|
|
|
|
|
|
|
|
|
|
|
|
|
|
|
|
|
|
| Non-real estate |
|
$ |
2,320 |
|
|
$ |
1,064 |
|
|
$ |
81,095 |
|
|
$ |
84,479 |
|
|
$ |
33,599 |
|
|
$ |
118,078 |
|
| Owner occupied |
|
|
737 |
|
|
|
1,323 |
|
|
|
16,928 |
|
|
|
18,988 |
|
|
|
— |
|
|
|
18,988 |
|
| Total commercial and industrial |
|
|
3,057 |
|
|
|
2,387 |
|
|
|
98,023 |
|
|
|
103,467 |
|
|
|
33,599 |
|
|
|
137,066 |
|
| Commercial real estate |
|
|
|
|
|
|
|
|
|
|
|
|
|
|
|
|
|
|
|
|
|
|
|
|
| Construction, acquisition and development |
|
|
— |
|
|
|
— |
|
|
|
8,596 |
|
|
|
8,596 |
|
|
|
172 |
|
|
|
8,768 |
|
| Income producing |
|
|
111 |
|
|
|
— |
|
|
|
7,088 |
|
|
|
7,199 |
|
|
|
822 |
|
|
|
8,021 |
|
| Total commercial real estate |
|
|
111 |
|
|
|
— |
|
|
|
15,684 |
|
|
|
15,795 |
|
|
|
994 |
|
|
|
16,789 |
|
| Consumer |
|
|
|
|
|
|
|
|
|
|
|
|
|
|
|
|
|
|
|
|
|
|
|
|
| Residential mortgages |
|
|
6,103 |
|
|
|
8,931 |
|
|
|
52,368 |
|
|
|
67,402 |
|
|
|
14,401 |
|
|
|
81,803 |
|
| Other consumer |
|
|
11 |
|
|
|
31 |
|
|
|
182 |
|
|
|
224 |
|
|
|
70 |
|
|
|
294 |
|
| Total consumer |
|
|
6,114 |
|
|
|
8,962 |
|
|
|
52,550 |
|
|
|
67,626 |
|
|
|
14,471 |
|
|
|
82,097 |
|
| Total |
|
$ |
9,282 |
|
|
$ |
11,349 |
|
|
$ |
166,257 |
|
|
$ |
186,888 |
|
|
$ |
49,064 |
|
|
$ |
235,952 |
|
| |
|
December 31, 2024 |
|
| (In thousands) |
|
30-59 Days
Past Due |
|
|
60-89 Days
Past Due |
|
|
90+ Days
Past Due |
|
|
Total
Past Due |
|
|
Current |
|
|
Total
Nonaccrual |
|
| Commercial and industrial |
|
|
|
|
|
|
|
|
|
|
|
|
|
|
|
|
|
|
|
|
|
|
|
|
| Non-real estate |
|
$ |
1,943 |
|
|
$ |
357 |
|
|
$ |
93,758 |
|
|
$ |
96,058 |
|
|
$ |
49,057 |
|
|
$ |
145,115 |
|
| Owner occupied |
|
|
574 |
|
|
|
50 |
|
|
|
16,280 |
|
|
|
16,904 |
|
|
|
— |
|
|
|
16,904 |
|
| Total commercial and industrial |
|
|
2,517 |
|
|
|
407 |
|
|
|
110,038 |
|
|
|
112,962 |
|
|
|
49,057 |
|
|
|
162,019 |
|
| Commercial real estate |
|
|
|
|
|
|
|
|
|
|
|
|
|
|
|
|
|
|
|
|
|
|
|
|
| Construction, acquisition and development |
|
|
— |
|
|
|
21 |
|
|
|
8,579 |
|
|
|
8,600 |
|
|
|
— |
|
|
|
8,600 |
|
| Income producing |
|
|
— |
|
|
|
246 |
|
|
|
12,193 |
|
|
|
12,439 |
|
|
|
6,103 |
|
|
|
18,542 |
|
| Total commercial real estate |
|
|
— |
|
|
|
267 |
|
|
|
20,772 |
|
|
|
21,039 |
|
|
|
6,103 |
|
|
|
27,142 |
|
| Consumer |
|
|
|
|
|
|
|
|
|
|
|
|
|
|
|
|
|
|
|
|
|
|
|
|
| Residential mortgages |
|
|
5,379 |
|
|
|
7,656 |
|
|
|
56,829 |
|
|
|
69,864 |
|
|
|
5,423 |
|
|
|
75,287 |
|
| Other consumer |
|
|
13 |
|
|
|
28 |
|
|
|
153 |
|
|
|
194 |
|
|
|
50 |
|
|
|
244 |
|
| Total consumer |
|
|
5,392 |
|
|
|
7,684 |
|
|
|
56,982 |
|
|
|
70,058 |
|
|
|
5,473 |
|
|
|
75,531 |
|
| Total |
|
$ |
7,909 |
|
|
$ |
8,358 |
|
|
$ |
187,792 |
|
|
$ |
204,059 |
|
|
$ |
60,633 |
|
|
$ |
264,692 |
|
OREO and Repossessed Assets
OREO consists of properties acquired through foreclosure. Repossessed assets consist of non-real estate
assets acquired in partial or full settlement of loans. OREO and repossessed assets totaled $8.5 million and $5.8 million at March 31, 2025 and December 31, 2024, respectively. The increase of $2.7 million, or 46.9%, was primarily the result of
increased OREO activity during the three months ended March 31, 2025.
Because a portion of the Company’s NPL have been determined to be collateral-dependent, management expects
the resolution of a significant number of these loans may necessitate foreclosure proceedings resulting in further additions to OREO. At March 31, 2025, residential mortgages in process of foreclosure increased to $21.1 million compared to $19.7
million at December 31, 2024.
At the time of foreclosure, the fair value of the collateral for loans backed
by real estate is typically determined by an appraisal performed by a third-party appraiser holding professional certifications. Such appraisals are then reviewed and evaluated by the Company’s internal appraisal group. A market value appraisal using
a 180-360-day marketing period is typically ordered and the OREO is recorded at the time of foreclosure at its market value less estimated selling costs. For residential subdivisions that are not completed, the appraisals reflect the
uncompleted status of the subdivision.
Since OREO is carried at the lower of cost or fair value less estimated selling costs on an ongoing basis,
new appraisals are generally obtained on at least an annual basis and the OREO carrying values are adjusted accordingly. The type of appraisals typically used for these periodic reappraisals are “Restricted Use Appraisals,” meaning the appraisal is for
client use only. Other indications of fair value are also used to attempt to ensure that OREO is carried at fair value. These include listing the property with a broker and acceptance of an offer to purchase from a third-party. If an OREO property is
listed with a broker at an amount less than the current carrying value, the carrying value is adjusted to reflect the list price less estimated selling costs and if an offer to purchase is accepted at a price less than the current carrying value, the
carrying value is adjusted to reflect that sales price, less estimated selling costs. The majority of the properties in OREO are actively marketed using a combination of real estate brokers, bank staff who are familiar with the particular properties
and/or third parties.
Financial Difficulty Modifications
In March 2022, the FASB issued ASU No. 2022-02, eliminating the recognition and measurement guidance on TDRs
for creditors that have adopted ASC 326 and requiring them to make enhanced disclosures about loan modifications for borrowers experiencing financial difficulty. The guidance became effective for Cadence beginning January 1, 2023, and was adopted via
the modified retrospective transition method.
With the removal of the TDR accounting model, the general loan modification guidance in Subtopic 310-20 is
now applied to all loan modifications, including modifications made for borrowers experiencing financial difficulty. Under this guidance, a modification is treated as a new loan only if both: 1) the terms of the new loan are at least as favorable to
the lender as the terms for comparable loans to other customers with similar collection risks, and 2) modifications to the terms of the original loan are more than minor. If either condition is not met, the modification is accounted for as the
continuation of the old loan with any effect of the modification treated as a prospective adjustment to the loan’s effective interest rate. Modifications in scope for borrowers experiencing financial difficulty may include principal forgiveness,
other-than-insignificant payment delay, interest rate reduction, or a combination of modifications. During the three months ended March 31, 2025, the most common concessions were related to term extensions and interest rate reductions. Other
concessions included payment deferrals.
At March 31, 2025, loans that were modified within the past three months for borrowers experiencing
financial difficulty totaled $44.6 million, or 0.1%, of total loans and leases, net of unearned income. Loans are considered to be in payment default at 90 or more days past due for purposes of assessing modified loans for default. See Note 3 to the
consolidated financial statements for additional information for these loans.
Loan Concentrations
At March 31, 2025, the Company did not have any concentration of loans or leases in excess of 10% of total
loans and leases outstanding which were not otherwise disclosed as a category of loans or leases. Loan concentrations are considered to exist when there are amounts loaned to multiple borrowers engaged in similar activities which would cause them to be
similarly impacted by economic or other conditions. The Company conducts business in a geographically concentrated area and has a significant amount of loans secured by real estate to borrowers in varying activities and businesses but does not consider
these factors alone in identifying loan concentrations. The ability of the Company’s borrowers to repay loans is somewhat dependent upon the economic conditions prevailing in the Company’s market areas.
Internally Assigned Grades on Loans
The Company utilizes an internal loan classification system that is updated to perpetually grade loans
according to certain credit quality indicators. These credit quality indicators include, but are not limited to, recent credit performance, delinquency, liquidity, cash flows, debt coverage ratios, collateral type and loan-to-value ratio. See Note 3 to
the consolidated financial statements.
The following table provides details of the Company’s loan and lease portfolio by segment, class, and internally assigned
grade at the dates indicated:
TABLE 23—GRADES ON LOANS AND LEASES
| |
|
March 31, 2025 |
|
| (In thousands) |
|
Pass |
|
|
Special Mention |
|
|
Substandard (1) |
|
|
Doubtful |
|
|
Impaired (1) |
|
|
PCD (Loss) |
|
|
Total |
|
| Commercial and industrial |
|
|
|
|
|
|
|
|
|
|
|
|
|
|
|
|
|
|
|
|
|
|
|
|
|
|
|
|
| Non-real estate |
|
$ |
8,234,513 |
|
|
$ |
108,903 |
|
|
$ |
317,012 |
|
|
$ |
8,556 |
|
|
$ |
16,227 |
|
|
$ |
3,442 |
|
|
$ |
8,688,653 |
|
| Owner occupied |
|
|
4,617,617 |
|
|
|
— |
|
|
|
38,174 |
|
|
|
— |
|
|
|
10,592 |
|
|
|
1,094 |
|
|
|
4,667,477 |
|
| Total commercial and industrial |
|
|
12,852,130 |
|
|
|
108,903 |
|
|
|
355,186 |
|
|
|
8,556 |
|
|
|
26,819 |
|
|
|
4,536 |
|
|
|
13,356,130 |
|
| Commercial real estate |
|
|
|
|
|
|
|
|
|
|
|
|
|
|
|
|
|
|
|
|
|
|
|
|
|
|
|
|
| Construction, acquisition and development |
|
|
3,710,504 |
|
|
|
— |
|
|
|
7,031 |
|
|
|
— |
|
|
|
5,873 |
|
|
|
— |
|
|
|
3,723,408 |
|
| Income producing |
|
|
6,078,353 |
|
|
|
39,412 |
|
|
|
144,159 |
|
|
|
— |
|
|
|
6,532 |
|
|
|
— |
|
|
|
6,268,456 |
|
| Total commercial real estate |
|
|
9,788,857 |
|
|
|
39,412 |
|
|
|
151,190 |
|
|
|
— |
|
|
|
12,405 |
|
|
|
— |
|
|
|
9,991,864 |
|
| Consumer |
|
|
|
|
|
|
|
|
|
|
|
|
|
|
|
|
|
|
|
|
|
|
|
|
|
|
|
|
| Residential mortgages |
|
|
10,392,396 |
|
|
|
— |
|
|
|
99,305 |
|
|
|
— |
|
|
|
5,208 |
|
|
|
1,411 |
|
|
|
10,498,320 |
|
| Other consumer |
|
|
204,701 |
|
|
|
— |
|
|
|
595 |
|
|
|
— |
|
|
|
— |
|
|
|
— |
|
|
|
205,296 |
|
| Total consumer |
|
|
10,597,097 |
|
|
|
— |
|
|
|
99,900 |
|
|
|
— |
|
|
|
5,208 |
|
|
|
1,411 |
|
|
|
10,703,616 |
|
| Total |
|
$ |
33,238,084 |
|
|
$ |
148,315 |
|
|
$ |
606,276 |
|
|
$ |
8,556 |
|
|
$ |
44,432 |
|
|
$ |
5,947 |
|
|
$ |
34,051,610 |
|
|
(1) |
In the loan classifications above, $107.6 million of the substandard balance and $9.2 million of the impaired balance are covered by government guarantees from either
the SBA, FHA, VA and USDA. |
| |
|
December 31, 2024 |
|
| (In thousands) |
|
Pass |
|
|
Special Mention |
|
|
Substandard (1) |
|
|
Doubtful |
|
|
Impaired (1) |
|
|
PCD (Loss) |
|
|
Total |
|
| Commercial and industrial |
|
|
|
|
|
|
|
|
|
|
|
|
|
|
|
|
|
|
|
|
|
|
|
|
|
|
|
|
| Non-real estate |
|
$ |
8,208,176 |
|
|
$ |
106,996 |
|
|
$ |
311,096 |
|
|
$ |
8,743 |
|
|
$ |
31,996 |
|
|
$ |
3,522 |
|
|
$ |
8,670,529 |
|
| Owner occupied |
|
|
4,610,775 |
|
|
|
815 |
|
|
|
41,363 |
|
|
|
— |
|
|
|
10,968 |
|
|
|
1,094 |
|
|
|
4,665,015 |
|
| Total commercial and industrial |
|
|
12,818,951 |
|
|
|
107,811 |
|
|
|
352,459 |
|
|
|
8,743 |
|
|
|
42,964 |
|
|
|
4,616 |
|
|
|
13,335,544 |
|
| Commercial real estate |
|
|
|
|
|
|
|
|
|
|
|
|
|
|
|
|
|
|
|
|
|
|
|
|
|
|
|
|
| Construction, acquisition and development |
|
|
3,896,856 |
|
|
|
— |
|
|
|
12,262 |
|
|
|
— |
|
|
|
66 |
|
|
|
— |
|
|
|
3,909,184 |
|
| Income producing |
|
|
5,850,702 |
|
|
|
5,094 |
|
|
|
144,084 |
|
|
|
— |
|
|
|
15,893 |
|
|
|
— |
|
|
|
6,015,773 |
|
| Total commercial real estate |
|
|
9,747,558 |
|
|
|
5,094 |
|
|
|
156,346 |
|
|
|
— |
|
|
|
15,959 |
|
|
|
— |
|
|
|
9,924,957 |
|
| Consumer |
|
|
|
|
|
|
|
|
|
|
|
|
|
|
|
|
|
|
|
|
|
|
|
|
|
|
|
|
| Residential mortgages |
|
|
10,167,830 |
|
|
|
891 |
|
|
|
89,597 |
|
|
|
— |
|
|
|
8,154 |
|
|
|
1,411 |
|
|
|
10,267,883 |
|
| Other consumer |
|
|
212,865 |
|
|
|
— |
|
|
|
506 |
|
|
|
— |
|
|
|
— |
|
|
|
— |
|
|
|
213,371 |
|
| Total consumer |
|
|
10,380,695 |
|
|
|
891 |
|
|
|
90,103 |
|
|
|
— |
|
|
|
8,154 |
|
|
|
1,411 |
|
|
|
10,481,254 |
|
| Total |
|
$ |
32,947,204 |
|
|
$ |
113,796 |
|
|
$ |
598,908 |
|
|
$ |
8,743 |
|
|
$ |
67,077 |
|
|
$ |
6,027 |
|
|
$ |
33,741,755 |
|
|
(1) |
In the loan classifications above, $99.0 million of the substandard balance and $11.1 million of the impaired balance are covered by government guarantees from either
the SBA, FHA, VA and USDA. |
The following tables provides details regarding the aging of the Company’s loan and lease portfolio by internally assigned grade at the dates
indicated:
TABLE 24—AGING BY GRADE ON LOANS AND LEASES
| |
|
March 31, 2025 |
|
| (In thousands) |
|
Current |
|
|
30-59 Days Past Due |
|
|
60-89 Days Past Due |
|
|
90+ Days Past Due |
|
|
Total |
|
| Pass |
|
$ |
33,153,257 |
|
|
$ |
59,486 |
|
|
$ |
23,792 |
|
|
$ |
1,549 |
|
|
$ |
33,238,084 |
|
| Special Mention |
|
|
148,315 |
|
|
|
— |
|
|
|
— |
|
|
|
— |
|
|
|
148,315 |
|
| Substandard (1) |
|
|
401,284 |
|
|
|
35,223 |
|
|
|
27,553 |
|
|
|
142,216 |
|
|
|
606,276 |
|
| Doubtful |
|
|
8,556 |
|
|
|
— |
|
|
|
— |
|
|
|
— |
|
|
|
8,556 |
|
| Impaired (1) |
|
|
9,897 |
|
|
|
3,549 |
|
|
|
756 |
|
|
|
30,230 |
|
|
|
44,432 |
|
| PCD (Loss) |
|
|
4,853 |
|
|
|
— |
|
|
|
— |
|
|
|
1,094 |
|
|
|
5,947 |
|
| Total |
|
$ |
33,726,162 |
|
|
$ |
98,258 |
|
|
$ |
52,101 |
|
|
$ |
175,089 |
|
|
$ |
34,051,610 |
|
|
(1) |
In the loan classifications above, $107.6 million of the substandard balance and $9.2 million of the impaired balance are covered by government guarantees from either the SBA, FHA, VA and
USDA. |
| |
|
December 31, 2024 |
|
| (In thousands) |
|
Current |
|
|
30-59 Days Past Due |
|
|
60-89 Days Past Due |
|
|
90+ Days Past Due |
|
|
Total |
|
| Pass |
|
$ |
32,857,689 |
|
|
$ |
65,955 |
|
|
$ |
22,789 |
|
|
$ |
771 |
|
|
$ |
32,947,204 |
|
| Special Mention |
|
|
113,796 |
|
|
|
— |
|
|
|
— |
|
|
|
— |
|
|
|
113,796 |
|
| Substandard (1) |
|
|
368,636 |
|
|
|
24,685 |
|
|
|
40,707 |
|
|
|
164,880 |
|
|
|
598,908 |
|
| Doubtful |
|
|
8,743 |
|
|
|
— |
|
|
|
— |
|
|
|
— |
|
|
|
8,743 |
|
| Impaired (1) |
|
|
29,908 |
|
|
|
1,904 |
|
|
|
— |
|
|
|
35,265 |
|
|
|
67,077 |
|
| PCD (Loss) |
|
|
4,932 |
|
|
|
1,095 |
|
|
|
— |
|
|
|
— |
|
|
|
6,027 |
|
| Total |
|
$ |
33,383,704 |
|
|
$ |
93,639 |
|
|
$ |
63,496 |
|
|
$ |
200,916 |
|
|
$ |
33,741,755 |
|
|
(1) |
In the loan classifications above, $99.0 million of the substandard balance and $11.1 million of the impaired balance is covered by government guarantees from the SBA,
FHA, VA and USDA. |
At March 31, 2025, loans in pass, special mention, and substandard grade categories increased while loans
in doubtful, impaired, and PCD (loss) grade categories decreased compared to December 31, 2024. Pass loans increased $290.9 million, or 0.9%, compared to December 31, 2024. The increase in pass was seen across all loan categories except for decreases
in CAD and other consumer loans. Special mention loans increased $34.5 million, or 30.3%, compared to December 31, 2024. The increase in special mention was driven primarily by an increase in CRE income producing loans, somewhat offset by a slight
decrease in C&I owner occupied loans and residential mortgages. Substandard loans increased $7.4 million, or 1.2%, at March 31, 2025 compared to December 31, 2024. The increase in substandard was mainly driven by the increase in residential
mortgages and C&I non-real estate loans, somewhat offset by a slight decrease in CAD and C&I owner occupied loans. Impaired loans decreased $22.6 million, or 33.8%, at March 31, 2025 compared to December 31, 2024. The decrease in impaired was
primarily driven by a decrease in C&I non-real estate and CRE income producing loans, slightly offset by an increase in CAD loans. The decrease in impaired is due to the charge-off of one large asset-based lending credit as well as continued
momentum in the resolution process related to SBA credits. The Company has maintained stable credit results while continuing to grow loans. Of total loans and leases, 99.0% were current on their contractual payments at March 31, 2025.
Collateral for some of the Company’s loans and leases is subject to fair value estimates that can
fluctuate with market conditions and other external factors. In addition, while the Company has certain underwriting obligations related to such estimates, the estimates of some real property and other collateral are dependent upon third-party
independent appraisers employed as independent contractors of the Company.
Deposits
Deposits originating within the communities served by the Company continue to be the Company’s primary
source of funding its earning assets. The Company has been able to compete effectively for deposits in its primary market areas, while continuing to manage the exposure to higher interest rates. The distribution and market share of deposits by type of
deposit and by type of depositor are important considerations in the Company’s assessment of the stability of its funding sources and its access to additional funds. Furthermore, management shifts the mix and maturity of the deposits depending on
economic conditions and loan and investment policies in an attempt, within set policies, to minimize cost and maximize net interest margin.
The following table presents the Company’s deposits and the percentage change between the periods indicated:
TABLE 25—SUMMARY OF DEPOSITS
| (Dollars in thousands) |
|
March 31, 2025 |
|
|
December 31, 2024 |
|
|
% Change |
|
| Noninterest bearing demand deposits |
|
$ |
8,558,412 |
|
|
$ |
8,591,805 |
|
|
|
(0.4 |
)% |
| Interest bearing demand and money market deposits |
|
|
19,221,356 |
|
|
|
19,345,114 |
|
|
|
(0.6 |
) |
| Savings |
|
|
2,626,901 |
|
|
|
2,588,406 |
|
|
|
1.5 |
|
| Time deposits |
|
|
9,929,059 |
|
|
|
9,970,876 |
|
|
|
(0.4 |
) |
| Total deposits |
|
$ |
40,335,728 |
|
|
$ |
40,496,201 |
|
|
|
(0.4 |
)% |
Total deposits experienced a decrease of 0.4% at March 31, 2025, compared to December 31, 2024 due to
decreases in core customer deposits (which excludes brokered deposits and public funds) and brokered deposits, partially offset by an increase in public funds. Brokered deposits were $1.9 billion at March 31, 2025, a decrease of $199.4 million, or
9.53%, compared to December 31, 2024. This decrease is primarily the result of the Company’s decision to lower the brokered deposit levels in favor of short and long term FHLB borrowings. Core customer deposit balances were $34.3 billion at March 31,
2025, a decrease of $8.1 million, or 0.02%, compared to December 31, 2024. This decrease is primarily the result of normal seasonal fluctuations. Total public funds balances were $4.2 billion at March 31, 2025, an increase of $47.2 million, or 1.15%,
compared to December 31, 2024. This increase primarily resulted from normal seasonal inflows. Noninterest bearing demand deposits decreased $33.4 million, or 0.4%, at March 31, 2025 compared to December 31, 2024. Time deposits decreased $41.8 million,
or 0.4%, at March 31, 2025 compared to December 31, 2024 due in part to a decrease of $66.0 million in brokered time deposits offset by an increase of $20.9 million in core customer and public funds time deposits.
The following table presents the classification of the Company’s deposits on an average basis for each of
the periods indicated:
TABLE 26—AVERAGE BALANCE AND YIELD ON DEPOSITS
| |
|
Three Months Ended March 31, |
|
| |
|
2025 |
|
|
2024 |
|
| (Dollars in thousands) |
|
Average
Amount |
|
|
Average
Rate |
|
|
Average
Amount |
|
|
Average
Rate |
|
| Noninterest bearing demand deposits |
|
$ |
8,339,414 |
|
|
|
— |
% |
|
$ |
9,072,619 |
|
|
|
— |
% |
| Interest bearing demand deposits |
|
|
19,428,376 |
|
|
|
2.69 |
|
|
|
19,303,845 |
|
|
|
3.11 |
|
| Savings |
|
|
2,607,366 |
|
|
|
0.57 |
|
|
|
2,696,452 |
|
|
|
0.57 |
|
| Time |
|
|
9,978,136 |
|
|
|
4.10 |
|
|
|
7,348,356 |
|
|
|
4.42 |
|
| Total deposits |
|
$ |
40,353,292 |
|
|
|
|
|
|
$ |
38,421,272 |
|
|
|
|
|
Uninsured deposits are defined as the portion of deposit accounts in U.S. offices that exceed the FDIC
insurance limit and amounts in any other uninsured investment or deposit account that are classified as deposits and are not subject to any federal or state deposit insurance regimes. The uninsured portion of public funds owned by municipal and state
government entities are collateralized by the Company with investment securities and custodial letters of credit from the FHLB of Dallas. The following table segregates our deposits by deposit insurance categories.
TABLE 27—ESTIMATED TOTAL INSURED AND UNINSURED DEPOSITS
| (In thousands) |
|
March 31, 2025 |
|
|
December 31, 2024 |
|
| FDIC insured |
|
$ |
25,690,310 |
|
|
$ |
25,840,309 |
|
| Collateralized (uninsured) |
|
|
3,949,975 |
|
|
|
3,901,677 |
|
| Uninsured (excluding collateralized) |
|
|
10,695,443 |
|
|
|
10,754,215 |
|
| Total deposits |
|
$ |
40,335,728 |
|
|
$ |
40,496,201 |
|
The Company’s estimated uninsured time deposits at March 31, 2025 had maturities as follows:
TABLE 28—MATURITY OF UNINSURED TIME DEPOSITS
| (In thousands) |
|
Amount |
|
| Three months or less |
|
$ |
652,684 |
|
| Over three months through six months |
|
|
499,137 |
|
| Over six months through twelve months |
|
|
549,926 |
|
| Over 12 months |
|
|
69,125 |
|
| Total |
|
$ |
1,770,872 |
|
Borrowings
Short-term Borrowings
The Company has several types of available short-term borrowing arrangements including Federal funds
purchased, securities sold under agreements to repurchase, short-term FHLB borrowings and the Federal Reserve discount window. Federal funds purchased are unsecured lines, while the rest of these types of borrowings are collateralized by investment
securities and loans. At March 31, 2025 and December 31, 2024, the Company had total short-term borrowings of $254.7 million with a weighted average interest rate of 4.34% and $23.6 million with a weighted average interest rate of 4.10%, respectively.
Cadence’s BTFP borrowing was paid off during the fourth quarter of 2024. See Note 5 to the Company’s consolidated financial statements for additional details.
Long-term Borrowings
During the first quarter of 2025, the Company entered into $550.0 million long-term advances from FHLB of
Dallas with various interest rates ranging from 4.082% to 4.219% with maturities beginning in September 2026 through March 2027. In addition, the Company had a balance of $10.0 million at both March 31, 2025 and December 31, 2024 of 5.000% fixed to
floating rate subordinated notes callable on June 30, 2025. The following is a summary of our long-term borrowings at the dates indicated:
TABLE 29—LONG-TERM BORROWINGS
| (In thousands) |
|
March 31, 2025 |
|
|
December 31, 2024 |
|
| Advances from FHLB of Dallas |
|
$ |
550,690 |
|
|
$ |
706 |
|
| 5.000% fixed to floating rate, subordinated notes, due June 30, 2030, callable on June 30, 2025 |
|
|
10,000 |
|
|
|
10,000 |
|
| Total long-term borrowings |
|
$ |
560,690 |
|
|
$ |
10,706 |
|
Under the terms of the blanket floating lien security agreement with FHLB of Dallas, the Company is required
to maintain sufficient collateral to secure borrowings. At March 31, 2025, the remaining borrowing availability totaled $12.5 billion. At March 31, 2025, there were no call features on long-term FHLB borrowings. See Note 5 to the Company’s consolidated
financial statements for additional details.
Liquidity and Capital Resources
Liquidity
One of the Company’s goals is to maintain adequate funds to meet increases in loan demand or any potential
increase in the normal level of deposit withdrawals. This goal is accomplished primarily by generating cash from the Company’s operating activities and maintaining sufficient short-term liquid assets. These sources, coupled with a stable core deposit
base and a historical experience in the capital markets, allow the Company to fund earning assets and maintain the availability of funds. Management believes that the Company’s traditional sources of maturing loans and investment securities, sales of
loans held for sale, cash from operating activities and a strong base of core deposits are adequate to meet the Company’s liquidity needs for normal operations over both the short-term and the long-term.
The following table summarizes the Company’s cash and cash equivalents as of the following dates:
TABLE 30—CASH AND CASH EQUIVALENTS
| (Dollars in thousands) |
|
March 31, 2025 |
|
|
December 31, 2024 |
|
| Cash and cash equivalents |
|
$ |
1,567,300 |
|
|
$ |
1,731,576 |
|
| Cash and cash equivalents as a percentage of: |
|
|
|
|
|
|
|
|
| Loans and lease, net |
|
|
4.6 |
% |
|
|
5.1 |
% |
| Total earning assets |
|
|
3.6 |
|
|
|
4.1 |
|
| Total assets |
|
|
3.3 |
|
|
|
3.7 |
|
| Total deposits |
|
|
3.9 |
|
|
|
4.3 |
|
| Total uninsured deposits |
|
|
10.7 |
|
|
|
11.8 |
|
To provide additional liquidity as needed, the Company utilizes short-term financing through the purchase of
federal funds, securities sold under agreements to repurchase, borrowings at the FHLB and through the Federal Reserve discount window.
The Company had the following sources of contingent liquidity available at March 31, 2025:
TABLE 31—CASH AND SOURCES OF CONTINGENT LIQUIDITY
| (In thousands) |
|
Amount |
|
| Cash and cash equivalents |
|
$ |
1,567,300 |
|
| Unpledged investment securities (at par) (1) |
|
|
4,303,845 |
|
| Secured lines of credit availability at the FHLB and Federal Reserve |
|
|
14,298,873 |
|
| Unsecured Federal funds lines availability |
|
|
2,086,000 |
|
| Total |
|
$ |
22,256,018 |
|
|
(1) |
The fair value of unpledged investment securities was $4.0 billion at March 31, 2025. |
At March 31, 2025, the Company had irrevocable letters of credit issued by the FHLB totaling $47.5 million
which were used on behalf of our customers.
The ability of the Company to obtain funding from these or other sources
could be negatively affected should the Company experience a substantial deterioration in its financial condition or its debt rating or should the availability of short-term funding become restricted as a result of the disruption in the financial
markets. Management does not anticipate any short-or long-term changes to its liquidity strategies and believes that the Company has ample sources to meet any liquidity challenges that may arise. The Company has sound and robust risk management
practices that include an active ALCO to analyze and manage the Company’s liquidity and interest rate risk (See - Quantitative and Qualitative Disclosures About Market Risk).
Other Liquidity Considerations
The Company’s operating lease obligations represent short and long-term operating lease and rental payments
for facilities, certain software and data processing and other equipment. Purchase obligations represent obligations to purchase goods and services that are legally binding and enforceable on the Company and that specify all significant terms,
including: fixed or minimum quantities to be purchased; fixed, minimum or variable price provisions; and the approximate timing of the transaction.
In the ordinary course of business, the Company enters into various off-balance sheet commitments and other
arrangements to extend credit that are not reflected on the consolidated balance sheets of the Company. The business purpose of these off-balance sheet commitments is the routine extension of credit. The Company also faces the risk of deteriorating
credit quality of borrowers to whom a commitment to extend credit has been made; however, no significant credit losses are expected from these commitments and arrangements. At March 31, 2025, letters of credit totaled $467.6 million and unfunded
extensions of credit totaled $8.6 billion (see Note 15 to the consolidated financial statement for more information). At March 31, 2025, the Company maintained a reserve for unfunded commitments of $8.6 million included in other liabilities.
Cash Flow Sources and Uses
Cash equivalents include cash and amounts due from banks, including interest bearing deposits with other
banks. At March 31, 2025, cash and cash equivalents totaled $1.6 billion compared to $1.7 billion at December 31, 2024. The ratio of cash and cash equivalents to total assets was 3.3% at March 31, 2025 compared to 3.7% at December 31, 2024.
During the three months ended March 31, 2025, operating activities provided $188.5 million in cash, investing
activities used $913.0 million in cash, and financing activities provided $560.2 million in cash. Primary uses of funds in investing activities during the first quarter of 2025 were net funding of loans of $324.4 million and purchases of AFS securities
$788.6 million. These items were partially offset by proceeds from maturities, calls and payments of AFS securities of $262.1 million. During the three months ended March 31, 2025, financing activities provided $560.2 million, which primarily resulted
from proceeds of $550.0 million in long-term FHLB advances and of $235.0 million in short-term FHLB advances. These items were partially offset by a decrease of $160.5 million in deposits and common and Preferred Stock dividends of $52.8 million.
Regulatory Capital
Regulatory capital at March 31, 2025 and December 31, 2024 was calculated in accordance with standards
established by the federal banking agencies as well as the interagency final rule published on September 30, 2020 entitled “Revised Transition of the Current Expected Credit Losses Methodology for Allowances.” Failure to meet minimum capital
requirements can initiate certain mandatory and possibly additional discretionary actions by regulators that, if undertaken, could have a direct material adverse effect on the Company’s consolidated financial statements. Under capital adequacy
guidelines and the regulatory framework for prompt corrective action, the Company must meet specific capital guidelines that involve quantitative measures of the Company’s assets, liabilities and certain off-balance sheet items as calculated under
regulatory accounting practices. The Company’s capital amounts and classification are also subject to qualitative judgments by regulators about components, risk weightings and other factors. Quantitative measures are established by regulation to ensure
capital adequacy and require the Company to maintain minimum capital amounts and ratios.
Additionally, regulatory capital rules include a capital conservation buffer of 2.5% which the Company must
maintain on top of its minimum risk-based capital requirements. This buffer applies to all three risk-based capital measurements (CET1, Tier 1 and total capital to risk-weighted assets). A financial institution with a conservation buffer of less than
the required amount is subject to limitations on capital distributions, including dividend payments and stock repurchases, and certain discretionary bonus payments to executive officers.
Capital amounts and ratios for the Company at March 31, 2025 and December 31, 2024, are presented in the
following table and as shown, exceed the thresholds necessary to be considered “well capitalized.” Management believes that no events or changes have occurred subsequent to the indicated dates that would change this designation.
TABLE 32—REGULATORY CAPITAL
| |
|
March 31, 2025 |
|
|
December 31, 2024 |
|
| (Dollars in thousands) |
|
Amount |
|
|
Ratio |
|
|
Amount |
|
|
Ratio |
|
| Common equity Tier 1 capital (to risk-weighted assets) |
|
$ |
4,750,291 |
|
|
|
12.44 |
% |
|
$ |
4,693,487 |
|
|
|
12.35 |
% |
| Tier 1 capital (to risk-weighted assets) |
|
|
4,917,284 |
|
|
|
12.88 |
|
|
|
4,860,480 |
|
|
|
12.79 |
|
| Total capital (to risk-weighted assets) |
|
|
5,390,674 |
|
|
|
14.12 |
|
|
|
5,306,647 |
|
|
|
13.97 |
|
| Tier 1 leverage capital (to average assets) |
|
|
4,917,284 |
|
|
|
10.56 |
|
|
|
4,860,480 |
|
|
|
10.41 |
|
Uses of Capital
Subject to pre-approval from the Federal Reserve and MDBCF, the Company may pursue acquisitions of
depository institutions and businesses closely related to banking that further the Company’s business strategies. Management anticipates that consideration for any transactions would include shares of the Company’s common stock, cash or a combination
thereof.
On April 25, 2025, the Company announced a share repurchase program whereby the Company may acquire up to an
aggregate of 10,000,000 shares of its common stock. The repurchase program is subject to and will be effective upon approval from the Federal Reserve, and will expire on December 31, 2025. Under the share repurchase program, Cadence’s shares may be
purchased periodically in open market transactions at prevailing market prices, in privately negotiated transactions, or by other means in accordance with federal securities laws. Repurchased shares are held as authorized but unissued shares available
for use in connection with the Company’s stock compensation programs, other transactions, or for other corporate purposes as determined by the Company’s Board of Directors.
During the first quarter of 2025, the Company increased the common stock dividend to $0.275 per share.
Impact of Inflation
The consolidated financial statements and related consolidated financial data presented herein have been
prepared in accordance with GAAP and practices within the banking industry which require the measurement of financial position and operating results in terms of historical dollars without considering the changes in the relative purchasing power of
money over time due to inflation. The effect of inflation on a financial institution differs from the effect on other types of businesses. While a financial institution’s operating expenses are affected by general inflation, the asset and liability
structure of a financial institution consists largely of monetary items. Monetary items, such as cash, investments, loans, deposits, and borrowings, are those assets and liabilities which are or will be converted into a fixed number of dollars
regardless of changes in prices. As a result, changes in interest rates can be more impactful to a financial institution’s performance than general inflation. Inflation may also have impacts on the Company’s customers, businesses and consumers and
their ability or willingness to invest, save or spend, and perhaps on their ability to repay loans. As such, there would likely be impacts on the general appetite for banking products and the credit health to the Company’s customers. See Part 1, Item
1.A., Risk Factors, of the Company’s Annual Report on Form 10-K for the year ended December 31, 2024, for additional information regarding the risks of inflation.
Certain Litigation and Other Contingencies
The nature of the Company’s business ordinarily results in certain types of claims, litigation,
investigations, and other legal or administrative cases and proceedings. Although the Company and its subsidiaries have policies and procedures to minimize legal noncompliance and the impact of claims and other proceedings and endeavored to procure
reasonable amounts of insurance coverage, litigation and regulatory actions present an ongoing risk.
The Company and its subsidiaries engage in lines of business that are heavily
regulated and involve a large volume of actual or potential financial transactions with customers or applicants, and the Company is a public company with a large number of shareholders. From time to time, applicants, borrowers, customers,
shareholders, former employees, service providers, and other third parties have brought actions against the Company or its subsidiaries, in cases claiming substantial damages. Financial services companies are subject to risks arising from changing
regulatory frameworks or expectations, regulatory investigations, class action litigation, and, from time to time, the Company and its subsidiaries have such actions brought against them. The Company and its subsidiaries are also subject to
enforcement actions by federal or state regulators, including the Federal Reserve, the CFPB, the DOJ, state attorneys general, and the MDBCF, which may be adversely impacted by ongoing litigation in which the Company is involved.
Additionally, the Company is, and management expects it to be, engaged in a number of foreclosure proceedings and other collection actions as part of its lending and leasing collections activities, which, from time to time, have resulted in
counterclaims against the Company and its subsidiaries. Various legal proceedings have and may arise in the future out of claims against entities to which the Company is a successor as a result of business combinations.
When and as the Company determines it has meritorious defenses to the claims asserted, it vigorously defends
against such claims. The Company will consider settlement of claims when, in management’s judgment and in consultation with counsel, it is in the best interests of the Company to do so.
The Company cannot predict with certainty the cost of defense, the cost of prosecution, or the ultimate
outcome of litigation or other proceedings filed by or against it, its subsidiaries and its directors, management or employees, including remedies or damage awards. On at least a quarterly basis, the Company assesses its liabilities and contingencies
in connection with outstanding legal proceedings as well as certain threatened claims (which are not considered incidental to the ordinary conduct of the Company’s business) utilizing the latest and most reliable information available. For matters
where a loss is not probable or the amount of the loss cannot be estimated, the Company will not accrue. For matters where it is probable the Company will incur a loss and the amount can be reasonably estimated, the Company establishes an accrual for
the loss. Once established, the accrual is adjusted periodically to reflect any relevant developments. The actual cost of any such matters, however, may turn out to be substantially higher than the amount accrued. Further, the Company’s insurance
policies have deductibles and coverage limits, and such policies are unlikely to cover all costs and expenses related to the defense or prosecution of such legal proceedings or any losses arising therefrom.
Although the final outcome of any legal proceedings is inherently uncertain, based on the information
available, advice of counsel and available insurance coverage, if applicable, management believes that the litigation-related liability of $7.5 million accrued at March 31, 2025 is adequate and that any incremental change in potential liability arising
from the Company’s legal proceedings and threatened claims, including the matters described herein and those otherwise arising in the ordinary course of business, will not have a material adverse effect on the Company’s business or consolidated results
of operations or financial condition. It is possible, however, that future developments could result in an unfavorable outcome for, or resolution of any one or more of the legal proceedings in which the Company or its subsidiaries are defendants, which
may be material to the Company’s business or consolidated results of operations or financial condition for a particular fiscal period or periods.
On August 30, 2021, Legacy Cadence and the DOJ agreed to a settlement set forth in the consent order related
to the investigation by the DOJ of Legacy Cadence Bank’s fair lending program in Harris, Fort Bend, and Montgomery Counties located in Houston, Texas during the period between 2014 and 2016 (the “Consent Order”). The Consent Order was signed by the
United States District Court for the Northern District of Georgia, Atlanta Division, on August 31, 2021. Pursuant to Section 5.2(g) of the Agreement and Plan of Merger and Paragraph 50 of the Consent Order, Legacy BancorpSouth Bank approved the
negotiated settlement, and subsequently, the Company agreed to accept the obligations of the Consent Order. The Consent Order is in effect for five years. For additional information regarding the terms of this settlement and the Consent Order, see
Legacy Cadence Bancorporation’s Current Report on Form 8-K that was filed with the SEC on August 30, 2021.
Recent Pronouncements
Refer to Note 1 “Summary of Significant Accounting Policies” in the consolidated financial statements for a
discussion of accounting standards currently effective for 2025 and relevant accounting standards that have been issued but are not currently effective.
CRITICAL ACCOUNTING ESTIMATES
During the three months ended March 31, 2025, there were no material changes in the Company’s critical
accounting policies and no significant changes in the application of critical accounting policies as presented in the Company’s Annual Report on Form 10-K for the year ended December 31, 2024.
The consolidated financial statements have been prepared in conformity with GAAP and practices within the
banking industry which require management to make estimates and assumptions about future events. Estimates are based on historical experience and on various other assumptions that are believed to be reasonable under the circumstances, and the resulting
estimates form the basis for making judgments about the carrying values of certain assets and liabilities not readily apparent from other sources. Actual results could differ significantly from those estimates.
ITEM 3. QUANTITATIVE AND QUALITATIVE DISCLOSURES ABOUT MARKET RISK.
Interest Rate Risk Management
Market risk reflects the risk of economic loss resulting from changes in interest rates and other relevant
market prices. This risk of loss can be reflected in either reduced potential net interest revenue in future periods or diminished market values of financial assets. The Company’s market risk arises primarily from IRR that is inherent in its lending,
investment and deposit taking activities.
The main causes of IRR are the differing structural characteristics of our assets, liabilities and
off-balance sheet obligations and their cumulative net reaction to changing interest rates. These structural characteristics include timing differences in maturity or repricing and the effect of embedded options such as loan prepayments, securities
prepayments and calls, interest rate caps, floors, collars, and deposit withdrawal options. In addition to these sources of IRR, basis risk results from differences in the spreads between various market interest rates and changes in the slope of the
yield curve can contribute to additional IRR.
We evaluate IRR and develop guidelines regarding balance sheet composition and re-pricing, funding sources
and pricing, and off-balance sheet commitments that aim to moderate IRR. We use financial simulation models that reflect various interest rate scenarios and the related impact on NII and EVE over specified periods of time. NII is a shorter-term
indicator while EVE is a longer-term indicator of IRR. We refer to this process as ALM.
The primary objective of ALM is to manage interest rate risk within a desired risk tolerance for potential
fluctuations in NII and EVE throughout different interest rate cycles, which we aim to achieve through management of interest rate sensitive earning assets and liabilities. In general, we seek to maintain a desired risk tolerance with asset and
liability balances within maturity and repricing characteristics to limit our exposure to acceptable earnings volatility and changes in the value of assets and liabilities as interest rates fluctuate over time. Adjustments to maturity categories can be
accomplished either by lengthening or shortening the duration of an individual asset or liability category, or externally with interest rate derivative contracts, such as interest rate swaps, caps, collars, and floors. See “—Interest Rate Exposure”
below for a more detailed discussion of our various derivative positions.
Our ALM strategy is formulated and monitored by our ALCO in accordance with policies approved by the Board
of Directors. ALCO meets regularly to review, among other things, the sensitivity of our assets and liabilities to interest rate changes, the book and market values of assets and liabilities, unrealized gains and losses, recent purchase and sale
activity, maturities of securities and borrowings, and projected future transactions. ALCO also establishes and approves pricing and funding strategies with respect to overall asset and liability composition. ALCO reports regularly to our Risk
Committee of the Board of Directors.
Financial simulation models are the primary tools we use to measure IRR exposures. These simulation models
incorporate all of our earning assets and liabilities. By examining a range of hypothetical deterministic interest rate scenarios, these models provide management with information regarding the potential impact on NII and EVE caused by changes in
interest rates.
The models simulate the cash flows and accounting accruals generated by the financial instruments on our
balance sheet, as well as the cash flows generated by the new business that we anticipate over a 60-month forecast horizon. However, past the 36-month mark, the growth of the balances is static in the forecast. Numerous assumptions are made in the
modeling process, including balance sheet composition, re-pricing, a combination of market data and internal historical experiences, and maturity characteristics of existing and new business. These assumptions are reviewed regularly. Additionally, loan
and investment prepayments, administered rate account elasticity, and other option risks are considered as well as the uncertainty surrounding future customer behavior. Because our modeling is limited by the predictive power of historical data and
current assumptions, and because our balance sheet will be actively managed in the event of a change in interest rates, simulation results, including those discussed in “—Interest Rate Exposure” immediately below, are not intended as a forecast of the
actual effect of a change in market interest rates on our NII or EVE, or indicative of management’s expectations of actual results in the event of a fluctuation in market interest rates; however, these results are used to help measure the potential
risks related to IRR.
Interest Rate Exposure
Based upon the current interest rate environment at March 31, 2025, our simulation model projects our
sensitivity to an instantaneous increase or decrease in interest rates over a one-year period as follows:
TABLE 33—INTEREST RATE SENSITIVITY
| |
|
Increase (Decrease) |
|
| (Dollars in millions) |
|
Net Interest Income |
|
|
Economic Value of Equity |
|
| Change (in Basis Points) in Interest Rates (12-Month Projection) |
|
Amount |
|
|
Percent |
|
|
Amount |
|
|
Percent |
|
| + 200 BP |
|
$ |
43 |
|
|
|
2.7 |
% |
|
$ |
(771 |
) |
|
|
(9.8 |
)% |
| + 100 BP |
|
|
23 |
|
|
|
1.4 |
|
|
|
(375 |
) |
|
|
(4.8 |
) |
| - 100 BP |
|
|
(26 |
) |
|
|
(1.6 |
) |
|
|
286 |
|
|
|
3.6 |
|
| - 200 BP |
|
|
(60 |
) |
|
|
(3.8 |
) |
|
|
442 |
|
|
|
5.6 |
|
Both the NII and EVE simulations include assumptions regarding balances, asset prepayment speeds, deposit
and borrowings repricing and runoff and interest rate relationships among balances that management believes to be reasonable for the various interest rate environments. Differences in actual occurrences from these assumptions may change our market risk
exposure.
See “Table 15 – Maturity Distribution of AFS Securities” that shows the maturities and weighted average
yields for the carrying value of the available for sale securities as of March 31, 2025, and “Table 18 – Interest Rate Sensitivity of Loans and Leases” that shows the maturity distribution based on remaining maturities of the Company’s loan and lease
portfolio and the interest rate sensitivity of the Company’s loans and leases maturing after one year at March 31, 2025.
Derivative Positions
Overview. Our Board of Directors has authorized the ALCO to utilize financial futures, forward
sales, options, interest rate swaps, caps, collars, and floors, and other instruments to the extent appropriate, in accordance with regulations and our internal policy. From time to time, we expect to use interest rate swaps, caps, collars, and floors
as macro hedges against inherent rate sensitivity in our assets and our liabilities to synthetically alter the maturities or re-pricing characteristics of assets or liabilities to reduce imbalances.
We currently engage in only the following types of hedges: (1) those which enable us to transfer the
interest rate risk exposure involved in our daily business activities; and (2) those which serve to alter the market risk inherent in our investment portfolio, mortgage pipeline, mortgage servicing rights, or liabilities and thus help us to manage
earnings and market value volatility within approved risk tolerances.
The following is a discussion of our current derivative positions related to IRR.
Interest Rate Lock Commitments. In the ordinary course of business, the Company enters into certain
commitments with customers in connection with residential mortgage loan applications for loans the Company intends to sell. Such commitments are considered derivatives under current accounting guidance and are required to be recorded at fair value. The
change in fair value of these instruments is reflected currently in the mortgage banking revenue of the consolidated statements of income. The fair value of these derivatives is recorded on the consolidated balance sheets in other assets and other
liabilities.
Forward Sales Commitments. The Company enters into forward sales commitments of MBS with investors
to mitigate the effect of the interest rate risk inherent in providing interest rate lock commitments to customers. During the period from commitment date to closing date, the Company is subject to the risk that market rates of interest may change. In
an effort to mitigate such risk, forward delivery sales commitments, under which the Company agrees to deliver certain MBS, are established. These commitments are non-hedging derivatives in accordance with current accounting guidance and recorded at
fair value, with changes in fair value reflected currently in the mortgage banking revenue of the consolidated statements of income. The fair value of these derivatives is recorded on the consolidated balance sheets in other assets and other
liabilities.
Mortgage Servicing Right Hedges. The value of our MSR is dependent on changes in market interest
rates. In order to mitigate the effects of changes in rates on the value of our MSR, the Company has used various instruments (including but not limited to Treasury options, Treasury, SOFR and TBA futures and forwards, swap futures, etc.) as economic
hedges.
Agreements Not Designated as Hedging Derivatives. The Company enters into interest rate swap, floor,
cap and collar agreements on commercial loans with customers to meet the financing needs and interest rate risk management needs of its customers. At the same time, the Company enters into offsetting interest rate swap agreements with a financial
institution in order to minimize the Company’s interest rate risk. These interest rate agreements are non-hedging derivatives and are recorded at fair value with changes in fair value reflected in noninterest income. The fair value of these derivatives
is recorded on the consolidated balance sheets in other assets and other liabilities.
See Note 14 to the consolidated financial statements for additional information regarding our derivative
financial instruments.
ITEM 4. CONTROLS AND PROCEDURES.
CONCLUSION REGARDING THE EFFECTIVENESS OF DISCLOSURE CONTROLS AND PROCEDURES
The Company, with the participation of its management, including the Company’s Chief Executive Officer and
Chief Financial Officer, carried out an evaluation of the effectiveness of the design and operation of its disclosure controls and procedures (as defined in Rules 13a-15(e) and 15d-15(e) under the Exchange Act) as of the end of the period covered by
this Report.
Based upon that evaluation, and as of the end of the period covered by this Report, the Company’s Chief
Executive Officer and Chief Financial Officer concluded that the Company’s disclosure controls and procedures were effective in ensuring that information required to be disclosed in its reports that the Company files or submits to the Federal Reserve
under the Exchange Act is recorded, processed, summarized and reported on a timely basis, and to ensure that such information is accumulated and communicated to the Company’s management, including its Chief Executive Officer and Chief Financial
Officer, as appropriate, to allow timely decisions regarding required disclosures.
CHANGES IN INTERNAL CONTROL OVER FINANCIAL REPORTING
There have been no changes in the Company’s internal control over financial reporting that occurred during
the three months ended March 31, 2025, covered by this Report that materially affected, or are reasonably likely to materially affect, the Company’s internal control over financial reporting.
PART II—OTHER INFORMATION
Item 1. Legal Proceedings.
The information in response to this item is incorporated herein by reference to “Note 15 - Commitments and
Contingent Liabilities” in the notes to unaudited consolidated financial statements included in Part I., Item 1. “Financial Statements” of this Report. Also, see Part I. Item II. “Financial Condition - Certain Litigation and Other Contingencies.”
Item 1A. Risk Factors.
There have been no material changes to our risk factors previously disclosed under Part I, Item 1A. of our
Annual Report on Form 10-K for the year ended December 31, 2024.
Item 2. Unregistered Sales of Equity Securities and Use of Proceeds.
Issuer Purchases of Equity Securities
| For the Month Ended |
|
|
Total Number
of Shares
Purchased(1) |
|
|
Average Price
Paid per Share |
|
|
Total Number of
Shares Purchased
as Part of Publicly
Announced Plans
or Programs |
|
|
Maximum Number
of Shares that May
Yet Be Purchased
Under the Plans
or Programs |
|
| January 31, 2025 |
|
|
|
286 |
|
|
$ |
34.45 |
|
|
|
— |
|
|
|
— |
|
| February 28, 2025 |
|
|
|
557 |
|
|
|
34.33 |
|
|
|
— |
|
|
|
— |
|
| March 31, 2025 |
|
|
|
36 |
|
|
|
30.37 |
|
|
|
— |
|
|
|
— |
|
| Total |
|
|
|
879 |
|
|
$ |
34.21 |
|
|
|
|
|
|
|
|
|
|
(1) |
This column includes shares redeemed from employees for tax withholding purposes for stock compensation. |
Item 3. Defaults Upon Senior Securities.
None.
Item 4. Mine Safety Disclosures.
None.
Item 5. Other Information.
Pursuant to Item 408(a) of Regulation S-K, none of the Company’s directors or executive officers adopted,
terminated or modified a Rule 10b5-1 trading arrangement or a non-Rule 10b5-1 trading arrangement during the three months ended March 31, 2025.
Item 6. Exhibits.
(3)
|
a) |
Second Amended and Restated Articles of Incorporation of the Company. (Filed as Exhibit 3.1 to the Company’s Current Report on Form 8-K filed with the Board of Governors of the Federal Reserve
System on January 3, 2025 and incorporated herein by reference thereto). |
|
b) |
Second Amended and Restated Bylaws of the Company. (Filed as Exhibit 3.2 to the Company’s Current Report on Form 8-K filed with the Board of Governors of the Federal Reserve System on January 3,
2025 and incorporated herein by reference thereto). |
|
(31.1) |
Certification of the Chief Executive Officer of Cadence Bank pursuant to Rule 13a-14 or 15d-14 of the Securities Exchange Act of 1934, as amended, as adopted pursuant to Section 302 of the Sarbanes-Oxley Act of
2002.* |
|
(31.2) |
Certification of the Chief Financial Officer of Cadence Bank pursuant to Rule 13a-14 or 15d-14 of the Securities Exchange Act of 1934, as amended, as adopted pursuant to Section 302 of the
Sarbanes-Oxley Act of 2002.* |
|
(32.1) |
Certification of the Chief Executive Officer of Cadence Bank pursuant to 18 U.S.C. Section 1350, as adopted pursuant to Section 906 of the Sarbanes-Oxley Act of 2002.** |
|
(32.2) |
Certification of the Chief Financial Officer of Cadence Bank pursuant to 18 U.S.C. Section 1350, as adopted pursuant to Section 906 of the Sarbanes-Oxley Act of 2002.** |
SIGNATURES
Pursuant to the requirements of Section 13 or 15(d) of the Securities Exchange Act of 1934, the registrant has duly caused this
report to be signed on its behalf by the undersigned, thereunto duly authorized.
| |
CADENCE BANK |
| |
|
| DATE: May 9, 2025 |
By: /s/ Valerie C. Toalson |
| |
Valerie C. Toalson |
| |
Chief Financial Officer and President - Banking Services |
92
CADENCE BANK
CERTIFICATION PURSUANT TO RULE 13a-14 OR 15d-14 OF THE SECURITIES
EXCHANGE ACT OF 1934, AS AMENDED, AS ADOPTED PURSUANT TO
SECTION 302 OF THE SARBANES-OXLEY ACT OF 2002
I, James D. Rollins III, certify that:
|
1. |
I have reviewed this quarterly report on Form 10-Q (“this report”) of Cadence Bank;
|
|
2. |
Based on my knowledge, this report does not contain any untrue statement of a material fact or omit to state a material fact necessary to make the statements made, in
light of the circumstances under which such statements were made, not misleading with respect to the period covered by this report;
|
|
3. |
Based on my knowledge, the financial statements, and other financial information included in this report, fairly present in all material respects the financial condition,
results of operations and cash flows of the registrant as of, and for, the periods presented in this report;
|
|
4. |
The registrant’s other certifying officer and I are responsible for establishing and maintaining disclosure controls and procedures (as defined in Exchange Act Rules
13a-15(e) and 15d-15(e)) and internal control over financial reporting (as defined in Exchange Act Rules 13a-15(f) and 15d-15(f)) for the registrant and have:
|
(a) Designed such disclosure controls and procedures, or caused such disclosure controls and procedures to be designed under our supervision,
to ensure that material information relating to the registrant, including its consolidated subsidiaries, is made known to us by others within those entities, particularly during the period in which this report is being prepared;
(b) Designed such internal control over financial reporting, or caused such internal control over financial reporting to be designed under our supervision, to provide reasonable
assurance regarding the reliability of financial reporting and the preparation of financial statements for external purposes in accordance with generally accepted accounting principles;
(c) Evaluated the effectiveness of the registrant’s disclosure controls and procedures and presented in this report our conclusions about the
effectiveness of the disclosure controls and procedures, as of the end of the period covered by this report based on such evaluation; and
(d) Disclosed in this report any change in the registrant’s internal control over financial reporting that occurred during the registrant’s most recent fiscal quarter (the
registrant’s fourth fiscal quarter in the case of an annual report) that has materially affected, or is reasonably likely to materially affect, the registrant’s internal control over financial reporting; and
|
5. |
The registrant’s other certifying officer and I have disclosed, based on our most recent evaluation of internal control over financial reporting, to the registrant’s
auditors and the audit committee of the registrant’s Board of Directors (or persons performing the equivalent functions):
|
(a) All significant deficiencies and material weaknesses in the design or operation of internal control over financial reporting which are reasonably likely to adversely affect the
registrant’s ability to record, process, summarize and report financial information; and
(b) Any fraud, whether or not material, that involves management or other employees who have a significant role in the registrant’s internal
control over financial reporting.
Date: May 9, 2025
|
|
/s/ James D. Rollins III
|
|
|
James D. Rollins III
|
|
|
Chief Executive Officer |
|
|
|
93
EXHIBIT 31.2
CADENCE BANK
CERTIFICATION PURSUANT TO RULE 13a-14 OR 15d-14 OF THE SECURITIES
EXCHANGE ACT OF 1934, AS AMENDED, AS ADOPTED PURSUANT TO
SECTION 302 OF THE SARBANES-OXLEY ACT OF 2002
I, Valerie C. Toalson, certify that:
|
1. |
I have reviewed this quarterly report on Form 10-Q (“this report”) of Cadence Bank;
|
|
2. |
Based on my knowledge, this report does not contain any untrue statement of a material fact or omit to state a material fact necessary to make the statements made, in
light of the circumstances under which such statements were made, not misleading with respect to the period covered by this report;
|
|
3. |
Based on my knowledge, the financial statements, and other financial information included in this report, fairly present in all material respects the financial condition,
results of operations and cash flows of the registrant as of, and for, the periods presented in this report;
|
|
4. |
The registrant’s other certifying officer and I are responsible for establishing and maintaining disclosure controls and procedures (as defined in Exchange Act Rules
13a-15(e) and 15d-15(e)) and internal control over financial reporting (as defined in Exchange Act Rules 13a-15(f) and 15d-15(f)) for the registrant and have:
|
(a) Designed such disclosure controls and procedures, or caused such disclosure controls and procedures to be designed under our supervision,
to ensure that material information relating to the registrant, including its consolidated subsidiaries, is made known to us by others within those entities, particularly during the period in which this report is being prepared;
(b) Designed such internal control over financial reporting, or caused such internal control over financial reporting to be designed under our supervision, to provide reasonable
assurance regarding the reliability of financial reporting and the preparation of financial statements for external purposes in accordance with generally accepted accounting principles;
(c) Evaluated the effectiveness of the registrant’s disclosure controls and procedures and presented in this report our conclusions about the
effectiveness of the disclosure controls and procedures, as of the end of the period covered by this report based on such evaluation; and
(d) Disclosed in this report any change in the registrant’s internal control over financial reporting that occurred during the registrant’s most recent fiscal quarter (the
registrant’s fourth fiscal quarter in the case of an annual report) that has materially affected, or is reasonably likely to materially affect, the registrant’s internal control over financial reporting; and
|
5. |
The registrant’s other certifying officer and I have disclosed, based on our most recent evaluation of internal control over financial reporting, to the registrant’s
auditors and the audit committee of the registrant’s Board of Directors (or persons performing the equivalent functions):
|
(a) All significant deficiencies and material weaknesses in the design or operation of internal control over financial reporting which are reasonably likely to adversely affect the
registrant’s ability to record, process, summarize and report financial information; and
(b) Any fraud, whether or not material, that involves management or other employees who have a significant role in the registrant’s internal
control over financial reporting.
Date: May 9, 2025
|
|
/s/ Valerie C. Toalson
|
|
|
Valerie C. Toalson |
|
|
Chief Financial Officer and
President - Banking Services
(Principal Accounting Officer)
|
|
|
|
94
EXHIBIT 32.1
CADENCE BANK
CERTIFICATION PURSUANT TO
18 U.S.C. SECTION 1350,
AS ADOPTED PURSUANT TO
SECTION 906 OF THE SARBANES-OXLEY ACT OF 2002
In connection with this quarterly report on Form 10-Q of Cadence Bank (the “Company”), for the three-months
ended March 31, 2025, as filed with the Board of Governors of the Federal Reserve System on the date hereof (the “Report”), I, James D. Rollins III, Chief Executive Officer of the Company, certify in my capacity as an executive officer of the Company,
pursuant to 18 U.S.C. § 1350, as adopted pursuant to § 906 of the Sarbanes-Oxley Act of 2002, that to my knowledge:
(1) The Report fully complies with the requirements of Section 13(a) or 15(d) of the Securities Exchange Act of 1934, as amended; and
(2) The information contained in the Report fairly presents, in all material respects, the financial condition and results of
operations of the Company.
| May 9, 2025 |
/s/ James D.
Rollins III |
|
|
James D. Rollins III
|
|
|
Chief Executive Officer |
A signed original of this written statement required by Section 906 has been provided to the Company and will be
retained by the Company and furnished to the Board of Governors of the Federal Reserve System or its staff upon request.
95
EXHIBIT 32.2
CADENCE BANK
CERTIFICATION PURSUANT TO
18 U.S.C. SECTION 1350,
AS ADOPTED PURSUANT TO
SECTION 906 OF THE SARBANES-OXLEY ACT OF 2002
In connection with this quarterly report on Form 10-Q of Cadence Bank (the “Company”), for the
three-months ended March 31, 2025, as filed with the Board of Governors of the Federal Reserve System on the date hereof (the “Report”), I, Valerie C. Toalson, Chief Financial Officer of the Company, certify in my capacity as an executive officer of
the Company, pursuant to 18 U.S.C. § 1350, as adopted pursuant to § 906 of the Sarbanes-Oxley Act of 2002, that to my knowledge:
(1) The Report fully complies with the requirements of Section 13(a) or 15(d) of the Securities Exchange Act of 1934, as amended; and
(2) The information contained in the Report fairly
presents, in all material respects, the financial condition and results of operations of the Company.
May 9, 2025
|
/s/ Valerie C. Toalson
|
|
|
Valerie C. Toalson |
|
|
Chief Financial Officer and
President - Banking Services
(Principal Accounting Officer)
|
|
|
|
A signed original of this written statement required by Section 906 has been provided to the Company and will be
retained by the Company and furnished to the Board of Governors of the Federal Reserve System or its staff upon request.
96
Exhibit 99.3
BOARD OF GOVERNORS OF THE FEDERAL RESERVE SYSTEM
WASHINGTON, DC 20551
FORM 10-Q
(Mark One)
| ☒ |
QUARTERLY REPORT PURSUANT TO SECTION 13 OR 15(d) OF THE SECURITIES EXCHANGE ACT OF 1934
|
For the quarterly period ended June 30, 2025
OR
| ☐ |
TRANSITION REPORT PURSUANT TO SECTION 13 OR 15(d) OF THE SECURITIES EXCHANGE ACT OF 1934
|
For the transition period from to
FDIC Certificate No. 11813
CADENCE BANK
(Exact name of registrant as specified in its charter)
|
|
|
64-0117230
|
|
(State or other jurisdiction of incorporation or organization)
|
|
(I.R.S. Employer Identification No.)
|
|
|
|
|
| One Mississippi Plaza, 201 South Spring Street |
|
|
| |
|
|
| Tupelo, Mississippi |
|
38804 |
| (Address of principal executive offices) |
|
(Zip Code)
|
Registrant’s telephone number, including area code: (662) 680-2000
Securities registered pursuant to Section 12(b) of the Act:
|
Title of each class
|
|
Trading Symbol(s)
|
|
Name of each exchange on which registered
|
|
Common Stock, $2.50 par value per share
|
|
CADE
|
|
New York Stock Exchange
|
|
|
|
|
|
|
| 5.50% Series A Non-Cumulative Perpetual Preferred Stock, par value $0.01 per share |
|
CADE PR A |
|
New York Stock Exchange
|
Indicate by check mark whether the registrant: (1) has filed all reports required to be filed by Section 13 or 15(d) of the Securities Exchange Act of 1934 during the preceding 12 months (or for such shorter
period that the registrant was required to file such reports), and (2) has been subject to such filing requirements for the past 90 days. Yes ☒ No
Indicate by check mark whether the registrant has submitted electronically every Interactive Data File required to be submitted pursuant to Rule 405 of Regulation S-T (§232.405 of this chapter) during the
preceding 12 months (or for such shorter period that the registrant was required to submit such files). Yes ☒ No
Indicate by check mark whether the registrant is a large accelerated filer, an accelerated filer, a non-accelerated filer, a smaller reporting company, or an emerging growth company. See the definitions of “large
accelerated filer,” “accelerated filer,” “smaller reporting company,” and “emerging growth company” in Rule 12b-2 of the Exchange Act.
|
Large Accelerated Filer
|
⌧
|
Accelerated Filer
|
☐
|
|
Non-Accelerated Filer
|
☐
|
Smaller Reporting Company
|
☐
|
| |
|
Emerging Growth Company
|
☐
|
If an emerging growth company, indicate by check mark if the registrant has elected not to use the extended transition period for complying with any new or revised financial accounting standards provided pursuant to Section 13(a) of the
Exchange Act. ☐
Indicate by check mark whether the registrant is a shell company (as defined in Rule 12b-2 of the Exchange Act). Yes ☐ No ⌧
As of August 4, 2025, the registrant had outstanding 186,307,016 shares of common stock, par value $2.50 per share, and 6,900,000 shares of its 5.50% Series A Non-Cumulative Perpetual Preferred Stock, par value $0.01 per share.
TABLE OF CONTENTS
| |
Page |
|
Glossary of Defined Terms
|
3 |
|
Cautionary Note Regarding Forward Looking Statements
|
5 |
|
Part I. Financial Information
|
7 |
|
Item 1. Financial Statements
|
7
|
|
Consolidated Balance Sheets (unaudited)
|
7
|
|
Consolidated Statements of Income (unaudited)
|
8
|
|
Consolidated Statements of Comprehensive Income (Loss) (unaudited)
|
9
|
|
Consolidated Statements of Shareholders’ Equity (unaudited)
|
10
|
|
Consolidated Statements of Cash Flows (unaudited)
|
11
|
|
Notes to Unaudited Consolidated Financial Statements
|
13
|
|
Item 2. Management's Discussion and Analysis of Financial Condition and Results of Operations
|
63 |
|
Overview
|
63 |
|
Non-GAAP Financial Measures and Reconciliations
|
64 |
|
Financial Highlights
|
66 |
|
Results of Operations
|
68 |
|
Financial Condition
|
80 |
|
Critical Accounting Estimates
|
99 |
|
Item 3. Quantitative and Qualitative Disclosures About Market Risk
|
100 |
|
Item 4. Controls and Procedures
|
102 |
|
Part II. Other Information
|
103 |
|
Item 1. Legal Proceedings
|
103 |
|
Item 1A. Risk Factors
|
103 |
|
Item 2. Unregistered Sales of Equity Securities and Use of Proceeds
|
103 |
|
Item 3. Defaults Upon Senior Securities
|
103 |
|
Item 4. Mine Safety Disclosures
|
103 |
|
Item 5. Other Information
|
103 |
|
Item 6. Exhibits
|
104 |
|
Signatures
|
105
|
Glossary of Defined Terms
ACH - Automated Clearing House
ACL - Allowance for credit losses
AFS - Available for sale
AI - Artificial intelligence
ALM - Asset/liability management
ALCO - Asset/Liability Management Committee
AOCI - Accumulated other comprehensive income (loss)
ASC - Accounting Standards Codification
ASU - Accounting Standards Update ATM - Automated teller machine
Basel III - Basel Committee's 2010 Regulatory Capital Framework (Third Accord)
Basel Committee - Basel Committee on Banking Supervision
BHC Act - Bank Holding Company Act of 1956, as amended
Board - the Company’s Board of Directors
BOLI - Bank-owned life insurance
BTFP - Bank Term Funding Program
C&I - Commercial and industrial
CAD - Construction, acquisition and development
CAMT - Corporate alternative minimum tax rate
CDE - Community development entity
CECL - ASU 2016-13, Measurement of Credit Losses on Financial Instruments ("Current Expected Credit Losses")
CEO - Chief Executive Officer
CET1 - Common Equity Tier 1
CFO - Chief Financial Officer
CFPB - Consumer Financial Protection Bureau
CIO - Chief Information Officer
CIS - Center for Internet Security
CISM - Certified Information Security Manager
CISO - Chief Information Security Officer
CISSP - Certified Information Systems Security Professional
Code - Code of Business Conduct and Ethics
CODM - Chief operating decision maker
Company - Cadence Bank and its subsidiaries
COO - Chief Operating Officer
COSO - Committee of Sponsoring Organizations of the Treadway Commission
CPR - Conditional Prepayment Rate
CRA - Community Reinvestment Act of 1977
CRE - Commercial real estate
CSC - Contractual servicing cost
DIF - Deposit Insurance Fund
DOJ - U.S. Department of Justice
EAP - Employee Assistance Program
EIR - Effective interest rate
EPS - Earnings per share
ESG - Environmental, Social and Governance
Exchange Act - Securities Exchange Act of 1934, as amended
EVE - Economic value of equity
FASB - Financial Accounting Standards Board
FCB - First Chatham Bank
FDI Act - Federal Deposit Insurance Act
FDIC - Federal Deposit Insurance Corporation
FDICIA - Federal Deposit Insurance Corporation Improvement Act of 1991
FDM - Financial difficulty modification
Federal Reserve - Board of Governors of the Federal Reserve System
FHA - Federal Housing Administration
FHLB - Federal Home Loan Bank
FHLMC - Federal Home Loan Mortgage Corporation
FinCEN - Financial Crimes Enforcement Network
FNMA - Federal National Mortgage Association
FRB - Federal Reserve Bank
FTE - Fully taxable equivalent
GAAP - Generally Accepted Accounting Principles in the United States
GNMA - Government National Mortgage Association
HTC - Historic tax credits
IRA of 2022 - Inflation Reduction Act of 2022
IRR - Interest rate risk
ITM - Interactive teller machine
LTV - Loan to value
MBS - Mortgage-backed securities
MDBCF - Mississippi Department of Banking and Consumer Finance
MSR - Mortgage servicing rights
NAV - Net asset value
NII - Net interest income
NM - Not meaningful
NMTC - New market tax credit
NPA - Nonperforming asset(s)
NPL - Nonperforming loan(s)
NSF - Nonsufficient funds
NYSE - New York Stock Exchange
OBBB - One Big Beautiful Bill
OCC - Office of the Comptroller of the Currency
OREO - Other real estate owned
PCAOB - Public Company Accounting Oversight Board
PCD - Purchased credit deteriorated
Preferred Stock - 5.50% Series A Non-Cumulative Perpetual Preferred Stock, par value $0.01 per share, of the Company
PSU - Performance stock unit
ROU - Right of use
RSA - Restricted stock award RSU - Restricted stock unit
SBA - Small Business Administration
SBIC - Small Business Investment Company
SEC - U.S. Securities and Exchange Commission
SNC - Shared National Credit
SOFR - Secured Overnight Financing Rate
TBA - To be announced
TCJA - Tax Cuts and Jobs Act of 2017
TDR - Troubled debt restructuring
USDA - U.S. Department of Agriculture
VA - U.S. Department of Veterans Affairs
VIE - Variable interest entity
YTD - Year to date
CAUTIONARY NOTE REGARDING FORWARD LOOKING STATEMENTS
Certain statements made in this quarterly report on Form 10-Q (this “Report”) are not statements of historical fact and constitute “forward-looking statements” within the meaning of Section 21E
of the Exchange Act and are subject to the safe harbor created thereby under the Private Securities Litigation Reform Act of 1995 as well as the “bespeaks caution” doctrine. These statements are often, but not always, made through the use of
words or phrases such as “anticipate,” “aspire,” “assume,” “believe,” “budget,” “contemplate,” “continue,” “could,” “estimate,” “expect,” “forecast,” “foresee,” “goal,” “hope,” “indicate,” “intend,” “may,” “might,” “outlook,” “plan,” “project,”
“projection,” “predict,” “prospect,” “potential,” “roadmap,” “seek,” “should,” “target,” “will,” and “would,” or the negative versions of those words, or other comparable words of a future or forward-looking nature. These forward-looking
statements may include, without limitation, discussions regarding general economic, interest rate, trade, real estate market, competitive, employment, and credit market conditions; our assets; business; cash flows; financial condition;
liquidity; prospects; results of operations and the Company’s ability to deploy capital into strategic and growth initiatives; deposit growth interest and fee-based revenue; capital resources; capital metrics; efficiency ratio; valuation of
mortgage servicing rights; mortgage production volume; net income; net interest revenue; non-interest revenue; net interest margin; interest expense; non-interest expense; earnings per share; interest rate sensitivity; interest rate risk;
balance sheet and liquidity management; off-balance sheet arrangements; fair value determinations; asset quality; credit quality; credit losses; provision and allowance for credit losses, impairments, charge-offs, recoveries and changes in
volume; investment securities portfolio yields and values; ability to manage the impact of natural disasters; adoption and use of critical accounting policies; adoption and implementation of new accounting standards and their effect on our
financial results and our financial reporting; utilization of non-GAAP financial metrics; declaration and payment of dividends; ability to pay dividends or coupons on our Preferred Stock or our subordinated notes; mortgage and commission
revenue growth; implementation and execution of cost savings initiatives; ability to successfully litigate, resolve or otherwise dispense with threatened, ongoing and future litigation and administrative and investigatory matters; ability to
successfully complete pending or future acquisitions or divestitures; dispositions and other strategic growth opportunities and initiatives; ability to successfully integrate and manage acquisitions or divestitures; opportunities and efforts to
grow market share; reputation; ability to compete with other financial institutions; ability to recruit and retain key employees and personnel; access to capital markets; investment in other financial institutions; and ability to operate our
regulatory compliance programs in accordance with applicable law.
Forward-looking statements are based upon management’s expectations as well as certain assumptions and estimates made by, and information available to, management at the time such statements
were made. Forward-looking statements are not historical facts, are not guarantees of future results or performance and are subject to certain known and unknown risks, uncertainties and other factors that are beyond our control and that may
cause actual results to differ materially from those expressed in, or implied by, such forward-looking statements. These risks, uncertainties and other factors include, without limitation, general economic, unemployment, credit market and real
estate market conditions (including potential downturn, contraction and/or recession), and the effect of such conditions on the creditworthiness of borrowers, collateral values, the value of investment securities and asset recovery values; the
risks of changes in trade policy, in interest rates, and their effects on the level and composition of deposits, loan demand, loan repayment velocity, and the values of loan collateral, securities and interest sensitive assets and liabilities;
risks arising from market reactions to the banking environment in general, or to conditions or situations at specific banks; risks arising from perceived instability in the banking sector; the impact of inflation, the failure of assumptions
underlying the establishment of reserves for possible credit losses, fair value for loans and other real estate owned; changes in the prices, values and sales volumes of residential and commercial real estate, especially as they relate to the
value of collateral supporting the Company’s loans; uncertainties surrounding the impact of proposed tariffs (by or on the U.S.), including the potential negative impact to our loan portfolio and profitability, potential for increases in
problem loans, potential re-evaluation of credit markets and interest rates, lower equity valuation and potential slowdown in capital markets, reduced demand for U.S. exports, disruptions to supply chains, impacts from decreased international
tourism, decreased demand for other banking products and services and negative credit quality developments arising from the foregoing or other factors; the uncertain duration of trade conflicts; the magnitude of the impact that the proposed
tariffs may have on our customers’ businesses; a deterioration of the credit rating for U.S. long-term sovereign debt, actions that the U.S. government may take to avoid exceeding the debt ceiling, or uncertainties surrounding the debt ceiling
and the federal budget; the availability of and access to capital; possible downgrades in our credit ratings or outlook which could increase the costs or availability of funding from capital markets; the ability to attract new or retain
existing deposits or to retain or grow loans; potential delays or other problems in implementing and executing our growth, expansion and acquisition or divestment strategies, including delays in obtaining regulatory or other necessary approvals
(including obtaining the approval of any pending transactions), or the failure to realize any anticipated benefits or synergies from any acquisitions or growth strategies; the risks relating to the acquisitions of FCB Financial Corp. and
Industry Bancshares, Inc. including, without limitation: (i) the diversion of management's time on issues related to integration efforts; (ii) unexpected transaction costs, including the costs of integrating operations; (iii) the risks that the
businesses will not be integrated successfully or that such integration may be more difficult, time-consuming or costly than expected; (iv) the potential failure to fully or timely realize expected revenues and revenue synergies, including as
the result of revenues following the merger being lower than expected; (v) the risk of deposit and customer attrition; any changes in deposit mix; (vi) unexpected operating and other costs, which may differ or change from expectations; (vii)
the risks of customer and employee loss and business disruptions, including, without limitation, as the result of difficulties in maintaining relationships with employees; (viii) increased competitive pressures and solicitations of customers by
competitors; and (ix) the difficulties and risks inherent with entering new markets; significant turbulence or a disruption in the capital or financial markets; the effect of a fall in stock market prices on our investment banking business and
our fee income from our brokerage and wealth management businesses; the ability to grow additional interest and fee income or to control noninterest expense; competitive factors and pricing pressures, including their effect on our net interest
margin; changes in legal, financial and/or regulatory requirements (including those related to share repurchases); recently enacted and potential legislation and regulatory actions and the costs and expenses to comply with new and/or existing
legislation and regulatory actions, and any related rules and regulations; changes in U.S. Government monetary, fiscal and trade policy, including any changes that may result from U.S. elections; special assessments or changes to regular
assessments by banking regulators; possible adverse rulings, judgments, settlements and other outcomes of pending or future litigation or government actions; the ability to keep pace with technological changes, including changes regarding
generative artificial intelligence, maintaining cybersecurity and compliance with applicable cybersecurity regulatory requirements; increased competition in the financial services industry, particularly from regional and national institutions,
as well as from fintech companies, risks related to our reliance on third parties to provide key components of our business infrastructure, including the risks related to disruptions in services provided by disputes with, or financial
difficulties of a third-party vendor, the impact of failure in, or breach of, our operational or security systems or infrastructure, or those of third parties with whom we do business, including as a result of cyber-attacks or an increase in
the incidence or severity of fraud, illegal payments, security breaches or other illegal acts impacting us or our customers; natural disasters or acts of war or terrorism; international or political instability (including the impacts related to
or resulting from the proposed tariffs and international trade conflicts, Russia’s military action in Ukraine, or the Israel-Hamas war, including the imposition of additional sanctions and export controls, as well as the broader impacts to
financial markets and the global macroeconomic and geopolitical environments); risks and costs related to the scope and pace of related rulemaking activity; impairment of our goodwill or other intangible assets; adoption of new accounting
standards or changes in existing standards; and other factors described in “Part I, Item 1A. Risk Factors” in this Report or as detailed from time to time in the Company’s press and news releases, reports and other filings we file with the
federal banking regulators.
The Company faces risks from: possible adverse rulings, judgments, settlements or other outcomes of pending, ongoing and future litigation, as well as governmental, administrative and
investigatory matters; the impairment of the Company’s goodwill or other intangible assets; losses of key employees and personnel; the diversion of management’s attention from ongoing business operations and opportunities; and the Company’s
success in executing its business plans and strategies, and managing the risks involved in all of the foregoing.
Although the Company believes that the expectations reflected in these forward-looking statements are reasonable as of the date of this Report, if one or more events related to these or other
risks or uncertainties materialize, or if the Company’s underlying assumptions prove to be incorrect, actual results may prove to be materially different from the results expressed or implied by the forward-looking statements. Accordingly,
undue reliance should not be placed on any forward-looking statements. The forward-looking statements speak only as of the date of this Report, and the Company does not undertake any obligation to publicly update or review any forward-looking
statement, whether as a result of new information, future developments or otherwise, except as required by applicable law. New risks and uncertainties may emerge from time to time, and it is not possible for the Company to predict their
occurrence or how they will affect the Company. All written or oral forward-looking statements attributable to us are expressly qualified in their entirety by this section.
PART I—FINANCIAL INFORMATION
| ITEM 1. |
FINANCIAL STATEMENTS.
|
Consolidated Balance Sheets
Cadence Bank and Subsidiaries
(Unaudited)
|
(In thousands, except share and per share amounts)
|
|
June 30, 2025
|
|
|
December 31, 2024
|
|
|
ASSETS
|
|
|
|
|
|
|
|
Cash and due from banks
|
|
$
|
710,679
|
|
|
$
|
624,884
|
|
|
Interest bearing deposits with other banks and Federal funds sold
|
|
|
825,878
|
|
|
|
1,106,692
|
|
|
Total cash and cash equivalents
|
|
|
1,536,557
|
|
|
|
1,731,576
|
|
|
Available for sale securities, at fair value
|
|
|
8,837,400
|
|
|
|
7,293,988
|
|
|
Loans and leases, net of unearned income
|
|
|
35,465,181
|
|
|
|
33,741,755
|
|
|
Allowance for credit losses
|
|
|
474,651
|
|
|
|
460,793
|
|
|
Net loans and leases
|
|
|
34,990,530
|
|
|
|
33,280,962
|
|
|
Loans held for sale, at fair value
|
|
|
272,059
|
|
|
|
244,192
|
|
|
Premises and equipment, net
|
|
|
806,879
|
|
|
|
783,456
|
|
|
Goodwill
|
|
|
1,387,990
|
|
|
|
1,366,923
|
|
|
Other intangible assets, net
|
|
|
87,814
|
|
|
|
83,190
|
|
|
Bank-owned life insurance
|
|
|
671,813
|
|
|
|
651,838
|
|
|
Other assets
|
|
|
1,787,798
|
|
|
|
1,583,065
|
|
|
TOTAL ASSETS
|
|
$
|
50,378,840
|
|
|
$
|
47,019,190
|
|
|
LIABILITIES
|
|
|
|
|
|
|
|
|
|
Noninterest bearing demand deposits
|
|
$
|
9,154,050
|
|
|
$
|
8,591,805
|
|
|
Interest bearing demand and money market deposits
|
|
|
18,936,579
|
|
|
|
19,345,114
|
|
|
Savings
|
|
|
2,641,482
|
|
|
|
2,588,406
|
|
|
Time deposits
|
|
|
9,761,407
|
|
|
|
9,970,876
|
|
|
Total deposits
|
|
|
40,493,518
|
|
|
|
40,496,201
|
|
|
Securities sold under agreement to repurchase
|
|
|
21,225
|
|
|
|
23,616
|
|
|
Short-term FHLB borrowings
|
|
|
1,575,000
|
|
|
|
—
|
|
|
Subordinated and long-term borrowings
|
|
|
1,430,674
|
|
|
|
10,706
|
|
|
Other liabilities
|
|
|
942,140
|
|
|
|
918,984
|
|
|
TOTAL LIABILITIES
|
|
|
44,462,557
|
|
|
|
41,449,507
|
|
|
SHAREHOLDERS' EQUITY
|
|
|
|
|
|
|
|
|
|
Series A Non-Cumulative Perpetual Preferred stock, $0.01 par value per share; authorized - 500,000,000 shares; issued and outstanding - 6,900,000 shares for both periods presented
|
|
|
166,993
|
|
|
|
166,993
|
|
|
Common stock, $2.50 par value per share; authorized - 500,000,000 shares; issued and outstanding - 186,307,016 and 183,527,575 shares, respectively
|
|
|
465,768
|
|
|
|
458,819
|
|
|
Capital surplus
|
|
|
2,805,171
|
|
|
|
2,742,913
|
|
|
Accumulated other comprehensive loss
|
|
|
(576,157
|
)
|
|
|
(694,495
|
)
|
|
Retained earnings
|
|
|
3,054,508
|
|
|
|
2,895,453
|
|
|
TOTAL SHAREHOLDERS' EQUITY
|
|
|
5,916,283
|
|
|
|
5,569,683
|
|
|
TOTAL LIABILITIES AND SHAREHOLDERS' EQUITY
|
|
$
|
50,378,840
|
|
|
$
|
47,019,190
|
|
See accompanying notes to the unaudited consolidated financial statements.
Consolidated Statements of Income
Cadence Bank and Subsidiaries
(Unaudited)
| |
|
Three Months Ended June 30, |
|
|
Six Months Ended June 30, |
|
|
(In thousands, except per share amounts)
|
|
2025
|
|
|
2024
|
|
|
2025
|
|
|
2024
|
|
|
INTEREST REVENUE:
|
|
|
|
|
|
|
|
|
|
|
|
|
|
Loans and leases
|
|
$
|
549,691
|
|
|
$
|
539,685
|
|
|
$
|
1,079,741
|
|
|
$
|
1,068,624
|
|
|
Available for sale securities:
|
|
|
|
|
|
|
|
|
|
|
|
|
|
|
|
|
|
Taxable
|
|
|
72,355
|
|
|
|
62,852
|
|
|
|
125,587
|
|
|
|
126,257
|
|
|
Tax-exempt
|
|
|
634
|
|
|
|
638
|
|
|
|
1,263
|
|
|
|
1,325
|
|
|
Loans held for sale
|
|
|
1,736
|
|
|
|
1,652
|
|
|
|
3,185
|
|
|
|
2,837
|
|
|
Short-term investments
|
|
|
11,183
|
|
|
|
37,383
|
|
|
|
25,080
|
|
|
|
80,280
|
|
|
Total interest revenue
|
|
|
635,599
|
|
|
|
642,210
|
|
|
|
1,234,856
|
|
|
|
1,279,323
|
|
|
INTEREST EXPENSE:
|
|
|
|
|
|
|
|
|
|
|
|
|
|
|
|
|
|
Interest bearing demand deposits and money market
|
|
|
|
|
accounts
|
|
|
125,874
|
|
|
|
146,279
|
|
|
|
254,705
|
|
|
|
295,682
|
|
|
Savings
|
|
|
3,747
|
|
|
|
3,743
|
|
|
|
7,391
|
|
|
|
7,544
|
|
|
Time deposits
|
|
|
98,721
|
|
|
|
89,173
|
|
|
|
199,621
|
|
|
|
169,842
|
|
|
Federal funds purchased and securities sold under
|
|
|
|
|
agreement to repurchase
|
|
|
2,939
|
|
|
|
724
|
|
|
|
4,063
|
|
|
|
3,247
|
|
|
Short-term borrowings
|
|
|
12,594
|
|
|
|
41,544
|
|
|
|
12,911
|
|
|
|
83,653
|
|
|
Subordinated and long-term borrowings
|
|
|
13,584
|
|
|
|
4,429
|
|
|
|
14,873
|
|
|
|
9,129
|
|
|
Total interest expense
|
|
|
257,459
|
|
|
|
285,892
|
|
|
|
493,564
|
|
|
|
569,097
|
|
|
Net interest revenue
|
|
|
378,140
|
|
|
|
356,318
|
|
|
|
741,292
|
|
|
|
710,226
|
|
|
Provision for credit losses
|
|
|
31,000
|
|
|
|
22,000
|
|
|
|
51,000
|
|
|
|
44,000
|
|
|
Net interest revenue, after provision for credit losses
|
|
|
347,140
|
|
|
|
334,318
|
|
|
|
690,292
|
|
|
|
666,226
|
|
|
NONINTEREST REVENUE:
|
|
|
|
|
|
|
|
|
|
|
|
|
|
|
|
|
|
Wealth management
|
|
|
25,298
|
|
|
|
24,006
|
|
|
|
48,577
|
|
|
|
46,839
|
|
|
Deposit service charges
|
|
|
18,061
|
|
|
|
17,652
|
|
|
|
35,797
|
|
|
|
35,989
|
|
|
Credit card, debit card and merchant fees
|
|
|
12,972
|
|
|
|
12,770
|
|
|
|
24,961
|
|
|
|
24,932
|
|
|
Mortgage banking
|
|
|
8,711
|
|
|
|
6,173
|
|
|
|
15,349
|
|
|
|
12,616
|
|
|
Security losses, net
|
|
|
—
|
|
|
|
(4
|
)
|
|
|
(9
|
)
|
|
|
(12
|
)
|
|
Other
|
|
|
33,139
|
|
|
|
40,061
|
|
|
|
58,893
|
|
|
|
64,080
|
|
|
Total noninterest revenue
|
|
|
98,181
|
|
|
|
100,658
|
|
|
|
183,568
|
|
|
|
184,444
|
|
|
NONINTEREST EXPENSE:
|
|
|
|
|
|
|
|
|
|
|
|
|
|
|
|
|
|
Salaries and employee benefits
|
|
|
157,340
|
|
|
|
148,038
|
|
|
|
310,312
|
|
|
|
304,689
|
|
|
Occupancy and equipment
|
|
|
30,039
|
|
|
|
29,367
|
|
|
|
58,516
|
|
|
|
58,007
|
|
|
Data processing and software
|
|
|
30,701
|
|
|
|
29,467
|
|
|
|
57,833
|
|
|
|
59,494
|
|
|
Deposit insurance assessments
|
|
|
8,571
|
|
|
|
15,741
|
|
|
|
17,214
|
|
|
|
24,156
|
|
|
Amortization of intangibles
|
|
|
4,046
|
|
|
|
3,999
|
|
|
|
7,714
|
|
|
|
8,065
|
|
|
Merger expense
|
|
|
2,179
|
|
|
|
—
|
|
|
|
2,494
|
|
|
|
—
|
|
|
Other
|
|
|
39,987
|
|
|
|
30,085
|
|
|
|
78,129
|
|
|
|
65,493
|
|
|
Total noninterest expense
|
|
|
272,863
|
|
|
|
256,697
|
|
|
|
532,212
|
|
|
|
519,904
|
|
|
Income before income taxes
|
|
|
172,458
|
|
|
|
178,279
|
|
|
|
341,648
|
|
|
|
330,766
|
|
|
Income tax expense
|
|
|
37,813
|
|
|
|
40,807
|
|
|
|
73,781
|
|
|
|
76,316
|
|
|
Net income
|
|
$
|
134,645
|
|
|
$
|
137,472
|
|
|
|
267,867
|
|
|
|
254,450
|
|
|
Less: preferred dividends
|
|
|
4,744
|
|
|
|
2,372
|
|
|
|
7,116
|
|
|
|
4,744
|
|
|
Net income available to common shareholders
|
|
$
|
129,901
|
|
|
$
|
135,100
|
|
|
$
|
260,751
|
|
|
$
|
249,706
|
|
|
Basic earnings per common share
|
|
$
|
0.70
|
|
|
$
|
0.74
|
|
|
$
|
1.41
|
|
|
$
|
1.37
|
|
|
Diluted earnings per common share
|
|
$
|
0.69
|
|
|
$
|
0.73
|
|
|
$
|
1.40
|
|
|
$
|
1.35
|
|
See accompanying notes to the unaudited consolidated financial statements.
Consolidated Statements of Comprehensive Income (Loss)
Cadence Bank and Subsidiaries
(Unaudited)
| |
|
Three Months Ended June 30, |
|
|
Six Months Ended June 30, |
|
|
(In thousands)
|
|
2025
|
|
|
2024
|
|
|
2025
|
|
|
2024
|
|
|
Net income
|
|
$
|
134,645
|
|
|
$ |
137,472
|
|
|
$
|
267,867 $
|
|
|
|
254,450
|
|
|
Other comprehensive income (loss), net of tax:
|
|
|
|
|
|
|
|
|
|
|
|
|
|
|
|
|
|
Unrealized gains (losses) on AFS securities:
|
|
|
|
|
|
|
|
|
|
|
|
|
|
|
|
|
Net unrealized gains (losses), net of income taxes of $(13,758), $(2,598), $(36,254), and $6,725
|
|
|
44,491
|
|
|
|
8,402
|
|
|
|
117,234
|
|
|
|
(21,748
|
)
|
|
Reclassification adjustment for net losses realized in net income, net of income taxes of $0, $1, $2, and $3
|
|
|
—
|
|
|
|
(3
|
)
|
|
|
(7
|
)
|
|
|
(9
|
)
|
|
Net change in unrealized gains (losses) on AFS securities, net of tax
|
|
|
44,491
|
|
|
|
8,399
|
|
|
|
117,227
|
|
|
|
(21,757
|
)
|
|
Recognized employee benefit plan net periodic benefit cost, net of income taxes of $(173), $(146), $(344), and $(348)
|
|
|
555
|
|
|
|
472
|
|
|
|
1,111
|
|
|
|
1,124
|
|
|
Other comprehensive income (loss), net of tax
|
|
|
45,046
|
|
|
|
8,871
|
|
|
|
118,338
|
|
|
|
(20,633
|
)
|
|
Comprehensive income
|
|
$
|
179,691
|
|
|
$
|
146,343
|
|
|
$
|
386,205
|
|
|
$
|
233,817
|
|
See accompanying notes to the unaudited consolidated financial statements.
Consolidated Statements of Shareholders' Equity
Cadence Bank and Subsidiaries
(Unaudited)
| |
|
|
|
Preferred Stock |
|
|
|
Common Stock |
|
|
|
Capital
Surplus
|
|
|
|
Accumulated
Other
Comprehensive
(Loss) Income
|
|
|
|
Retained
Earnings
|
|
|
|
Total
Shareholders'
Equity
|
|
|
(In thousands, except share and per share amounts)
|
|
|
|
Shares |
|
|
|
Amount |
|
|
|
Shares |
|
|
|
Amount |
|
|
|
|
|
|
|
|
|
|
|
|
|
|
Balance at December 31, 2024
|
|
|
|
6,900,000
|
|
|
$
|
166,993
|
|
|
|
183,527,575
|
|
|
$
|
458,819
|
|
|
$ |
2,742,913 |
|
|
$ |
(694,495 |
) |
|
$ |
2,895,453 |
|
|
$ |
5,569,683 |
|
|
Net income
|
|
|
|
—
|
|
|
|
—
|
|
|
|
—
|
|
|
|
—
|
|
|
|
—
|
|
|
|
—
|
|
|
|
133,222
|
|
|
|
133,222
|
|
|
Other comprehensive income, net of tax
|
|
|
|
—
|
|
|
|
—
|
|
|
|
—
|
|
|
|
—
|
|
|
|
—
|
|
|
|
73,292
|
|
|
|
—
|
|
|
|
73,292
|
|
Equity based compensation, net of forfeitures and shares withheld to cover taxes
|
|
|
|
—
|
|
|
|
—
|
|
|
|
|
|
|
|
1,299
|
|
|
|
(6,087
|
)
|
|
|
—
|
|
|
|
— |
|
|
|
(4,788
|
)
|
|
Repurchase of stock, net of excise tax
|
|
|
|
—
|
|
|
|
—
|
|
|
|
(879
|
)
|
|
|
(2
|
)
|
|
|
(27
|
)
|
|
|
—
|
|
|
|
—
|
|
|
|
(29
|
)
|
|
Preferred dividends declared, $0.34 per share
|
|
|
|
—
|
|
|
|
—
|
|
|
|
—
|
|
|
|
—
|
|
|
|
—
|
|
|
|
—
|
|
|
|
(2,372
|
)
|
|
|
(2,372
|
)
|
|
Cash dividends declared, $0.275 per share
|
|
|
|
—
|
|
|
|
—
|
|
|
|
—
|
|
|
|
—
|
|
|
|
—
|
|
|
|
—
|
|
|
|
(50,467
|
)
|
|
|
(50,467
|
)
|
|
Balance at March 31, 2025
|
|
|
|
6,900,000
|
|
|
$
|
166,993
|
|
|
|
184,046,420
|
|
|
$
|
460,116
|
|
|
$
|
2,736,799 |
|
|
$
|
(621,203
|
)
|
|
$
|
2,975,836 |
|
|
$
|
5,718,541
|
|
|
Net income
|
|
|
|
—
|
|
|
|
—
|
|
|
|
—
|
|
|
|
—
|
|
|
|
—
|
|
|
|
—
|
|
|
|
134,645
|
|
|
|
134,645
|
|
|
Other comprehensive income, net of tax
|
|
|
|
—
|
|
|
|
—
|
|
|
|
—
|
|
|
|
—
|
|
|
|
—
|
|
|
|
45,046
|
|
|
|
—
|
|
|
|
45,046
|
|
|
Equity based compensation, net of forfeitures and shares withheld to cover taxes
|
|
|
|
—
|
|
|
|
—
|
|
|
|
32,255
|
|
|
|
82
|
|
|
|
8,937 |
|
|
|
—
|
|
|
|
— |
|
|
|
9,019
|
|
|
Repurchase of stock, net of excise tax
|
|
|
|
—
|
|
|
|
—
|
|
|
|
(71,409
|
)
|
|
|
(179
|
)
|
|
|
(2,107
|
)
|
|
|
—
|
|
|
|
—
|
|
|
|
(2,286
|
)
|
|
Issuance of stock in conjunction with acquisitions
|
|
|
|
—
|
|
|
|
—
|
|
|
|
2,299,750
|
|
|
|
5,749
|
|
|
|
61,542
|
|
|
|
—
|
|
|
|
—
|
|
|
|
67,291
|
|
|
Preferred dividends declared, $0.69 per share
|
|
|
|
—
|
|
|
|
—
|
|
|
|
—
|
|
|
|
—
|
|
|
|
—
|
|
|
|
—
|
|
|
|
(4,744
|
)
|
|
|
(4,744
|
)
|
|
Cash dividends declared, $0.275 per share
|
|
|
|
—
|
|
|
|
—
|
|
|
|
—
|
|
|
|
—
|
|
|
|
—
|
|
|
|
—
|
|
|
|
(51,229
|
)
|
|
|
(51,229
|
)
|
|
Balance at June 30, 2025
|
|
|
|
6,900,000
|
|
|
$ |
166,993 |
|
|
|
186,307,016
|
|
|
$ |
465,768 |
|
|
$ |
2,805,171 |
|
|
$ |
(576,157 |
) |
|
$ |
3,054,508 |
|
|
$
|
5,916,283
|
|
| |
|
|
|
Preferred Stock |
|
|
|
Common Stock |
|
|
|
Capital
Surplus
|
|
|
|
Accumulated
Other
Comprehensive
(Loss) Income
|
|
|
|
Retained
Earnings
|
|
|
|
Total
Shareholders'
Equity
|
|
|
(In thousands, except share and per share amounts)
|
|
|
|
Shares |
|
|
|
Amount |
|
|
|
Shares |
|
|
|
Amount |
|
|
|
|
|
|
|
|
|
|
|
|
|
|
Balance at December 31, 2023
|
|
|
|
6,900,000
|
|
|
$
|
166,993
|
|
|
|
182,871,775
|
|
|
$
|
|
|
|
$ |
2,743,066
|
|
|
$ |
(761,829
|
) |
|
$ |
2,562,434
|
|
|
$ |
5,167,843
|
|
|
Net income
|
|
|
|
—
|
|
|
|
—
|
|
|
|
—
|
|
|
|
—
|
|
|
|
—
|
|
|
|
—
|
|
|
|
116,978
|
|
|
|
116,978
|
|
|
Other comprehensive loss, net of tax
|
|
|
|
—
|
|
|
|
—
|
|
|
|
—
|
|
|
|
—
|
|
|
|
—
|
|
|
|
|
|
|
|
—
|
|
|
|
(29,504)
|
|
Equity based compensation, net of forfeitures and shares withheld to cover taxes
|
|
|
|
—
|
|
|
|
—
|
|
|
|
|
|
|
|
1,168
|
|
|
|
(3,231
|
)
|
|
|
—
|
|
|
|
— |
|
|
|
(2,063
|
)
|
|
Repurchase of stock, net of excise tax
|
|
|
|
—
|
|
|
|
—
|
|
|
|
(657,593
|
)
|
|
|
(1,644
|
)
|
|
|
(15,248
|
)
|
|
|
—
|
|
|
|
—
|
|
|
|
(16,892
|
)
|
|
Preferred dividends declared, $0.34 per share
|
|
|
|
—
|
|
|
|
—
|
|
|
|
—
|
|
|
|
—
|
|
|
|
—
|
|
|
|
—
|
|
|
|
(2,372
|
)
|
|
|
(2,372
|
)
|
|
Cash dividends declared, $0.25 per share
|
|
|
|
—
|
|
|
|
—
|
|
|
|
—
|
|
|
|
—
|
|
|
|
—
|
|
|
|
—
|
|
|
|
(45,598
|
)
|
|
|
(45,598
|
)
|
|
Cumulative effect of change in accounting principle, net of tax, for ASU 2023-02
|
|
|
|
—
|
|
|
|
—
|
|
|
|
—
|
|
|
|
—
|
|
|
|
—
|
|
|
|
—
|
|
|
|
1,540
|
|
|
|
1,540
|
|
|
Balance at March 31, 2024
|
|
|
|
6,900,000
|
|
|
$
|
166,993
|
|
|
|
|
|
|
$
|
456,703
|
|
|
$
|
2,724,587 |
|
|
$
|
(791,333
|
)
|
|
$
|
2,632,982 |
|
|
$
|
5,189,932
|
|
|
Net income
|
|
|
|
—
|
|
|
|
—
|
|
|
|
—
|
|
|
|
—
|
|
|
|
—
|
|
|
|
—
|
|
|
|
|
|
|
|
137,472
|
|
|
Other comprehensive income, net of tax
|
|
|
|
—
|
|
|
|
—
|
|
|
|
—
|
|
|
|
—
|
|
|
|
—
|
|
|
|
|
|
|
|
—
|
|
|
|
|
|
|
Equity based compensation, net of forfeitures and shares withheld to cover taxes
|
|
|
|
—
|
|
|
|
—
|
|
|
|
|
|
|
|
211 |
|
|
|
8,486
|
|
|
|
—
|
|
|
|
— |
|
|
|
8,697
|
|
|
Repurchase of stock, net of excise tax
|
|
|
|
—
|
|
|
|
—
|
|
|
|
|
)
|
|
|
(838
|
)
|
|
|
(8,417
|
)
|
|
|
—
|
|
|
|
—
|
|
|
|
(9,255
|
)
|
|
Preferred dividends declared, $0.34 per share
|
|
|
|
—
|
|
|
|
—
|
|
|
|
—
|
|
|
|
—
|
|
|
|
—
|
|
|
|
—
|
|
|
|
(2,372
|
)
|
|
|
(2,372
|
)
|
|
Cash dividends declared, $0.25 per share
|
|
|
|
—
|
|
|
|
—
|
|
|
|
—
|
|
|
|
—
|
|
|
|
—
|
|
|
|
—
|
|
|
|
(45,587
|
)
|
|
|
(45,587
|
)
|
|
Balance at June 30, 2024
|
|
|
|
6,900,000
|
|
|
$ |
166,993 |
|
|
|
|
|
|
$ |
456,076
|
|
|
$ |
2,724,656
|
|
|
$ |
(782,462
|
) |
|
$ |
2,722,495 |
|
|
$
|
5,287,758
|
|
See accompanying notes to the unaudited consolidated financial statements.
Consolidated Statements of Cash Flows
Cadence Bank and Subsidiaries
(Unaudited)
| |
|
Six Months Ended June 30, |
|
|
(In thousands)
|
|
2025
|
|
|
2024
|
|
|
Operating Activities:
|
|
|
|
|
|
|
|
Net income
|
|
$
|
267,867
|
|
|
$
|
254,450
|
|
|
Adjustments to reconcile net income to net cash provided by operations:
|
|
|
|
|
|
|
|
|
|
Depreciation, amortization, and accretion
|
|
|
45,290
|
|
|
|
108,304
|
|
|
Deferred income tax expense
|
|
|
10,106
|
|
|
|
10,173
|
|
|
Provision for credit losses
|
|
|
51,000
|
|
|
|
44,000
|
|
|
Gain on sale of loans, net
|
|
|
(13,061
|
)
|
|
|
(10,734
|
)
|
|
Gain on disposition of businesses
|
|
|
—
|
|
|
|
(14,980
|
)
|
|
Loss on sales of available for sale securities, net
|
|
|
9
|
|
|
|
12
|
|
|
Unrealized gain on limited partnerships, net
|
|
|
(4,757
|
)
|
|
|
(5,391
|
)
|
|
Gain on trading securities
|
|
|
(27
|
)
|
|
|
(10
|
)
|
|
Share-based compensation expense
|
|
|
13,823
|
|
|
|
16,055
|
|
|
Proceeds from payments and sales of loans held for sale
|
|
|
664,943
|
|
|
|
574,877
|
|
|
Origination of loans held for sale
|
|
|
(653,577
|
)
|
|
|
(578,067
|
)
|
|
Increase in accrued interest receivable
|
|
|
(15,334
|
)
|
|
|
(9,005
|
)
|
|
Increase in accrued interest payable
|
|
|
37,765
|
|
|
|
95,146
|
|
|
Purchases of trading securities
|
|
|
(11,000
|
)
|
|
|
(4,000
|
)
|
|
Proceeds from sales of trading securities
|
|
|
11,027
|
|
|
|
4,010
|
|
|
Net increase in prepaid pension asset
|
|
|
(2,437
|
)
|
|
|
(2,892
|
)
|
|
(Increase) decrease in other assets
|
|
|
(52,065
|
)
|
|
|
16,410
|
|
|
Increase in other liabilities
|
|
|
203
|
|
|
|
51,118
|
|
|
Other, net
|
|
|
(17,741
|
)
|
|
|
(7,415
|
)
|
|
Net cash provided by operating activities
|
|
|
332,034
|
|
|
|
542,061
|
|
| |
|
|
|
|
|
|
|
|
|
Investing Activities:
|
|
|
|
|
|
|
|
|
|
Net cash received from business acquisition
|
|
|
119,397
|
|
|
|
—
|
|
|
Proceeds from disposition of business, net of cash transferred
|
|
|
—
|
|
|
|
15,308
|
|
|
Purchases of available for sale securities
|
|
|
(2,042,209
|
)
|
|
|
(751,846
|
)
|
|
Proceeds from sales of available for sale securities
|
|
|
45,603
|
|
|
|
4,000
|
|
|
Proceeds from maturities, calls, and payments of available for sale securities
|
|
|
644,056
|
|
|
|
858,952
|
|
|
(Purchases of) proceeds from sales of FRB and FHLB stock, net
|
|
|
(134,164
|
)
|
|
|
3,259
|
|
|
Increase in loans, net
|
|
|
(1,404,166
|
)
|
|
|
(927,845
|
)
|
|
Purchases of premises and equipment
|
|
|
(34,070
|
)
|
|
|
(48,643
|
)
|
|
Proceeds from sales of premises and equipment
|
|
|
3,339
|
|
|
|
14,850
|
|
|
Proceeds from disposition of foreclosed and repossessed property
|
|
|
4,829
|
|
|
|
4,779
|
|
|
Proceeds from sales of loans transferred to held for sale
|
|
|
—
|
|
|
|
36,317
|
|
|
Net death benefits received on bank owned life insurance
|
|
|
13,616
|
|
|
|
514
|
|
|
Purchases of tax credit investments
|
|
|
(66,244
|
)
|
|
|
(28,795
|
)
|
|
Purchases of limited partnership interests
|
|
|
(15,875
|
)
|
|
|
(16,007
|
)
|
|
Other, net
|
|
|
5,718
|
|
|
|
6,843
|
|
|
Net cash used in investing activities
|
|
|
(2,860,170
|
)
|
|
|
(828,314
|
)
|
Consolidated Statements of Cash Flows (continued)
Cadence Bank and Subsidiaries
(Unaudited)
| |
|
Six Months Ended June 30,
|
|
|
(In thousands)
|
|
2025
|
|
|
2024
|
|
|
Financing Activities:
|
|
|
|
|
|
|
|
Decrease in deposits, net
|
|
|
(526,415
|
)
|
|
|
(638,323
|
)
|
|
Net change in securities sold under agreement to repurchase and federal funds purchased
|
|
|
(2,391
|
)
|
|
|
(396,482
|
)
|
|
Net change in short-term FHLB advances
|
|
|
1,575,000
|
|
|
|
—
|
|
|
Long-term borrowings called, repurchased, or repaid
|
|
|
(22,330
|
)
|
|
|
(168,351
|
)
|
|
Repayment of long-term FHLB advances
|
|
|
(26
|
)
|
|
|
—
|
|
|
Proceeds from long-term FHLB advances
|
|
|
1,430,000
|
|
|
|
—
|
|
|
Repurchase of common stock
|
|
|
(2,315
|
)
|
|
|
(26,147
|
)
|
|
Cash dividends paid on common stock
|
|
|
(101,748
|
)
|
|
|
(91,186
|
)
|
|
Cash dividends paid on preferred stock
|
|
|
(7,116
|
)
|
|
|
(4,744
|
)
|
|
Cash paid for tax withholding on vested share-based compensation and other
|
|
|
(9,542
|
)
|
|
|
(10,244
|
)
|
|
Net cash provided by (used in) financing activities
|
|
|
2,333,117
|
|
|
|
(1,335,477
|
)
|
|
Net decrease in cash and cash equivalents
|
|
|
(195,019
|
)
|
|
|
(1,621,730
|
)
|
|
Cash and cash equivalents at beginning of period
|
|
|
1,731,576
|
|
|
|
4,232,265
|
|
|
Cash and cash equivalents at end of period
|
|
$
|
1,536,557
|
|
|
$
|
2,610,535
|
|
Supplemental Cash Flow Disclosures
Cadence Bank and Subsidiaries
(Unaudited)
| |
|
Six Months Ended June 30,
|
|
|
(In thousands)
|
|
2025
|
|
|
2024
|
|
|
Supplemental Disclosures
|
|
|
|
|
|
|
|
Cash paid during the period for:
|
|
|
|
|
|
|
|
Interest
|
|
$
|
455,799
|
|
|
$
|
473,952
|
|
|
Income tax payments, net
|
|
|
20,617
|
|
|
|
82,528
|
|
|
Cash paid for amounts included in lease liabilities
|
|
|
9,047
|
|
|
|
8,925
|
|
|
Non-cash investing and financing activities, at fair value:
|
|
|
|
|
|
|
|
|
|
Acquisition of real estate and other assets in settlement of loans
|
|
|
13,566
|
|
|
|
3,240
|
|
|
Transfers of loans held for sale to loans
|
|
|
6,032
|
|
|
|
2,901
|
|
|
Transfers of loans to loans held for sale
|
|
|
38,038
|
|
|
|
39,038
|
|
|
Right of use assets obtained in exchange for new operating lease liabilities
|
|
|
13,713
|
|
|
|
9,347
|
|
|
Increase in funding obligations for certain tax credit investments
|
|
|
36,728
|
|
|
|
10,201
|
|
See accompanying notes to unaudited consolidated financial statements.
Notes to Unaudited Consolidated Financial Statements
Cadence Bank and Subsidiaries
NOTE 1. SUMMARY OF SIGNIFICANT ACCOUNTING POLICIES
Basis of Presentation and Consolidation
The accompanying unaudited consolidated financial statements for the Company have been prepared in accordance with instructions to the SEC Form 10-Q and Article 10 of Regulation S-X; therefore,
they do not include all information and notes necessary for a fair presentation of financial position, results of operations, comprehensive income, and cash flows in conformity with GAAP. All adjustments consisting of normally recurring
accruals that, in the opinion of management, are necessary for a fair presentation of the consolidated financial position and results of operations for the periods covered by this report have been included. These interim financial statements
should be read in conjunction with our Annual Report on Form 10-K for the year ended December 31, 2024. Operating results for the period ended June 30, 2025, are not necessarily indicative of the results that may be expected for the year ending
December 31, 2025. The consolidated balance sheet at December 31, 2024 has been derived from the audited financial statements included in our Form 10-K for the year ended December 31, 2024.
The Company and its subsidiaries follow GAAP, including, where applicable, general practices within the banking industry. The consolidated financial statements include the accounts of the
Company and its subsidiaries. Significant intercompany accounts and transactions have been eliminated in consolidation. The assessment of whether or not the Company has a controlling interest (i.e., the primary beneficiary) in a VIE is
performed on an on-going basis. All equity investments in non-consolidated VIEs are included in “other assets” in the Company’s consolidated balance sheets (see Note 17 for more information).
Certain amounts reported in prior years have been reclassified to conform to the 2025 presentation. These reclassifications did not materially impact the Company’s consolidated financial
statements.
In accordance with GAAP, the Company’s management evaluated subsequent events for potential recognition or disclosure in the consolidated financial statements through the date of the issuance
of the consolidated financial statements (See Note 18 for more information).
Recent Accounting Pronouncements
ASU No. 2023-05
In August 2023, the FASB issued ASU No. 2023-05, Business Combinations—Joint Venture Formations (Subtopic 805-60): Recognition and Initial Measurement. The
ASU applies to the formation of entities that meet the definition of a joint venture (or a corporate joint venture) as defined in the FASB ASC Master Glossary. The amendments in the ASU require that a newly formed joint venture, upon formation,
would initially measure its assets and liabilities at fair value (with exceptions to fair value measurement that are consistent with the business combinations guidance). The ASU allows a joint venture to apply measurement period guidance in
accordance with ASC 805-10, allowing the amounts recognized upon formation to be adjusted for provisional items during the measurement period not to exceed one year from the formation date.
The ASU does not amend the definition of a joint venture, the existing guidance for the accounting by an equity method investor for its investment in a joint venture, or the accounting by a
joint venture for contributions received subsequent to formation.
The amendments are effective prospectively for all joint ventures with a formation date on or after January 1, 2025, and early adoption is permitted. A joint venture that was formed before the
effective date of the ASU may elect to apply the amendments retrospectively if it has sufficient information. There was no impact from this guidance on the Company’s consolidated financial statements.
ASU No. 2023-08
In December 2023, the FASB issued ASU No. 2023-08, Intangibles—Goodwill and Other—Crypto Assets (Subtopic 350-60): Accounting for and Disclosure of Crypto
Assets. The amendments are intended to improve the accounting for certain crypto assets by requiring an entity to measure those crypto assets at fair value each reporting period with changes in fair value recognized in net income. The
amendments also improve the information provided to investors about an entity’s crypto asset holdings by requiring disclosure about significant holdings, contractual sale restrictions, and changes during the reporting period.
The amendments in the ASU are effective for fiscal years beginning after December 15, 2024, including interim periods within those fiscal years. Early adoption is permitted for both interim and
annual financial statements that have not yet been issued (or made available for issuance). If amendments are adopted in an interim period, they must be adopted as of the beginning of the fiscal year that includes that interim period. There was
no impact from this guidance on the Company’s consolidated financial statements.
ASU No. 2023-09
In December 2023, the FASB issued ASU No. 2023-09, Income Taxes (Topic 740): Improvements to Income Tax Disclosures. The ASU is intended to improve
the transparency of income tax disclosures by requiring (1) consistent categories and greater disaggregation of information in the rate reconciliation and (2) income taxes paid disaggregated by jurisdiction. It also includes certain other
amendments intended to improve the effectiveness of income tax disclosures.
The amendments in the ASU are effective for annual periods beginning after December 15, 2024. Early adoption is permitted for annual financial statements that have not yet been issued or made
available for issuance. As this guidance is solely disclosure related, there will be no quantitative impact to the Company’s consolidated financial statements.
ASU No. 2024-01
In March 2024, the FASB issued ASU No. 2024-01, Compensation--Stock Compensation (Topic 718): Scope Application of Profits Interest and Similar Awards, which
provides four cases illustrating the scope application of Topic 718 for profits interest awards. Determining whether a profits interest award should be accounted for as a share-based payment arrangement or other compensation requires judgement
based on the facts and circumstances of the specific transaction. The illustrative example includes four fact patterns to demonstrate how an entity would apply the scope guidance in Topic 718 to determine whether profits interest awards should
be accounted for in accordance with Topic 718.
The amendments in the ASU are effective for annual periods beginning after December 15, 2024, and interim periods within those annual periods. Early adoption is permitted for both interim and
annual financial statements that have not yet been issued or made available for issuance. The amendments should be applied either (1) retrospectively to all prior periods presented in the financial statements or (2) prospectively to profits,
interest, and similar awards grated or modified on or after the date at which the entity first applies the amendments. There was no impact from this guidance on the Company’s consolidated financial statements.
ASU No. 2024-02
In March 2024, the FASB issued ASU No. 2024-02, Codification Improvements--Amendments to Remove References to the Concepts Statements, which contains
amendments that remove references to various Concepts Statements. In most instances, the references are extraneous and not required to understand or apply the guidance. In other instances, the references were used in prior Statements to provide
guidance in certain topical areas. Generally, the amendments are not intended to result in significant accounting change for most entities. However, the FASB recognized that changes to that guidance may result in accounting change for some
entities. Therefore, the FASB provided transition guidance for all the amendments in this Update.
These amendments are effective for public business entities for fiscal years beginning after December 15, 2024. Early application of the amendments is permitted for all entities, for any fiscal
year or interim period for which financial statements have not yet been issued (or made available for issuance). If an entity adopts the amendments in an interim period, it must adopt them as of the beginning of the fiscal year that includes
that interim period. There was no significant impact from this guidance on the Company’s consolidated financial statements.
ASU No. 2025-02
In March 2025, the FASB issued ASU No. 2025-02, Liabilities (Topic 405): Amendments to SEC Paragraphs Pursuant to SEC Staff Accounting Bulletin No. 122 to
remove SEC paragraphs pursuant to the issuance of the SEC Staff Accounting Bulletin No. 122, Accounting for Obligations To Safeguard Crypto-Assets an Entity Holds for Its Platform Users. The amendments are effective immediately. There was no
impact from this guidance on the Company’s consolidated financial statements.
Pending Accounting Pronouncements
ASU No. 2023-06
In October 2023, the FASB issued ASU No. 2023-06, Disclosure Improvements: Codification Amendments in Response to the SEC’s Disclosure Update and
Simplification Initiative, that incorporates certain SEC disclosure requirements into the FASB Accounting Standards Codification. The amendments in the ASU are expected to clarify or improve disclosure and presentation requirements of
a variety of Codification Topics, allow users to more easily compare entities subject to the SEC’s existing disclosures with those entities that were not previously subject to the requirements, and align the requirements in the Codification
with the SEC’s regulations.
The ASU modifies the disclosure or presentation requirements of a variety of Topics in the Codification. The requirements are relatively narrow in nature. Some of the amendments represent
clarifications to, or technical corrections of, the current requirements.
The effective date for each amendment will be the date on which the SEC removes that related disclosure from its rules. If by June 30, 2027, the SEC has not removed the related disclosure from
its regulations, the amendments will be removed from the Codification and not become effective for any entity. As this guidance is solely disclosure related, the Company does not anticipate any quantitative impact to the Company’s consolidated
financial statements.
ASU No. 2024-03
In November 2024, the FASB issued ASU No. 2024-03, Income Statement—Reporting Comprehensive Income—Expense Disaggregation Disclosures (Subtopic 220-40):
Disaggregation of Income Statement Expenses, which requires disclosures in the note to the financial statements regarding specific expenses. The amendments do not change or remove existing disclosure requirements. The amendments
improve disclosure requirements through enhanced expense disaggregation.
The amendments require disclosures in each interim and annual reporting periods. The amendments are effective for fiscal year beginning after December 15, 2026, and interim reporting periods
beginning after December 15, 2027. Prospective adoption is required, however an entity may choose to adopt retrospectively. Early adoption is permitted. As this guidance is solely disclosure related, the Company does not anticipate any
quantitative impact to the Company’s consolidated financial statements.
ASU No. 2024-04
In November 2024, the FASB issued ASU No. 2024-04, Debt—Debt with Conversion and Other Options (Subtopic 470-20): Induced Conversions of Convertible Debt
Instruments, which clarifies requirements for determining whether certain settlements of convertible debt instruments, including convertible debt instruments with cash conversion features or convertible debt instruments that are not
currently convertible, should be accounted for as an induced conversion.
The amendments are effective for all entities for fiscal years beginning after December 15, 2025. Early adoption is permitted as of the beginning of the annual reporting period for all entities
that have adopted ASU 2020-06. If an entity adopts ASU No. 2024-04 in an interim reporting period, it should adopt it as of the beginning of the annual reporting period that includes that interim reporting period. The Company does not
anticipate any impact from this guidance on its consolidated financial statements.
ASU No. 2025-01
In January 2025, the FASB issued ASU No. 2025-01, Income Statement—Reporting Comprehensive Income—Expense Disaggregation Disclosures (Subtopic 220-40):
Clarifying the Effective Date to clarify the interim effective date for ASU 2024-03 for entities that do not have an annual reporting period that ends on December 31. The amendments are effective for fiscal year beginning after
December 15, 2026, and interim reporting periods beginning after December 15, 2027. Since Company’s fiscal year-end and the calendar year-end are the same, the Company does not anticipate that these amendments will have any effect on Company’s
consolidated financial statements.
ASU No. 2025-03
In May, the FASB issued ASU No. 2025-03, Business Combinations (Topic 805) and Consolidation (Topic 810): Determining the Accounting Acquirer in the
Acquisition of a Variable Interest Entity to clarify the guidance to determine the accounting acquirer for transactions in which the legal acquiree is a VIE that meets the definition of a business. The amendments are effective
for fiscal years beginning after December 15, 2026. Early adoption is permitted in reporting periods in which financial statements have not been issued. If the amendment are adopted in an interim period, they should be adopted as of the
beginning the interim period or annual period. The amendments should be applied on a prospective basis to transactions whose closing dates occurs after adoption of the amendments. The Company does not anticipate that these amendments will
have any effect on Company’s consolidated financial statements.
ASU No. 2025-04
In May, the FASB issued ASU No. 2025-04, Compensation—Stock Compensation (Topic 718) and Revenue from Contracts with Customers (Topic 606):
Clarifications to Share-Based Consideration Payable to a Customer to clarify the timing to recognize revenue for entities that offer share-based consideration to customers to incentivize the customers to purchase its goods or
services. The amendments are effective for the fiscal period beginning after December 15, 2026, and interim reporting periods within those annual periods. Early adoption is permitted in an interim or annual period in which financial
statements have not yet been issued. If an entity adopts the amendments in an interim reporting period, it should adopt it as of the beginning of the annual period that includes that interim reporting period. The Company does not
anticipate that these amendments will have any effect on Company’s consolidated financial statements.
NOTE 2. BUSINESS COMBINATIONS
FCB Financial Corp.
On May 1, 2025, the Company completed its acquisition of FCB Financial Corp. (“FCB Financial”), the bank holding company for FCB (collectively referred to as “First Chatham”), pursuant to
an Agreement and Plan of Merger dated January 22, 2025 by and between the Company and FCB Financial (the “FCB Merger Agreement”). Upon the completion of the merger of FCB Financial with and into the Company, FCB, FCB Financials’
wholly-owned banking subsidiary, was merged with and into the Company. First Chatham was a Savannah, Georgia-based community bank operating eight branches across the Greater Savannah Area. Under the terms of the FCB Merger Agreement, the
Company issued 2.3 million shares of common stock and paid $23.1 million in cash for all outstanding shares of First Chatham. The purchase price allocation and certain fair value measurements, as well as the evaluation of the tax
positions of the merger, remain in the early stages of management’s review due to the timing of the closing of the merger and are subject to potential changes.
The following table presents the amounts recorded on the consolidated balance sheet on the acquisition date of May 1, 2025 for First Chatham, showing the estimated fair value as adjusted
during the measurement period (in thousands):
Fair Value of Assets Acquired:
|
Cash and cash equivalents
|
|
$
|
142,506
|
|
|
Available for sale securities
|
|
|
45,603
|
|
|
Loans and leases
|
|
|
382,608
|
|
|
Allowance for credit losses
|
|
|
(8,075
|
)
|
|
Premises and equipment
|
|
|
13,741
|
|
|
Other intangible assets, net
|
|
|
12,338
|
|
|
Other assets
|
|
|
24,068
|
|
|
Total Fair Value of Assets Acquired
|
|
$
|
612,789
|
|
|
Fair Value of Liabilities Assumed:
|
|
|
|
|
|
Deposits
|
|
$
|
523,595
|
|
|
Junior subordinated debt
|
|
|
12,330
|
|
|
Other liabilities
|
|
|
7,532
|
|
|
Total Fair Value of Liabilities Assumed
|
|
$
|
543,457
|
|
|
Fair Value of Net Assets Acquired
|
|
$
|
69,332
|
|
|
Consideration Paid:
|
|
|
|
|
|
Market value of common stock
|
|
|
67,291
|
|
|
Total cash paid
|
|
|
23,109
|
|
|
Total Consideration Paid
|
|
$
|
90,400
|
|
|
Goodwill
|
|
$
|
21,068
|
|
The following is a description of the methods used to estimate the fair values of significant assets acquired and liabilities assumed above.
Cash and cash equivalents: The carrying amount of these assets is a reasonable estimate of fair value based on the short-term nature of these
assets.
Securities available for sale: Fair values for securities were based on sales prices of the securities shortly after the merger’s close date.
Loans: Fair values for loans were estimated based on a discounted cash flow methodology (income approach) that considered factors including loan
type and related collateral, classification status, remaining term of the loan (in months), fixed or variable interest rate, past delinquencies, timing of principal and interest payments, current market rates, LTV, and current discount
rates. The discount rate did not include an explicit factor for credit losses, as it was included as a reduction to the estimated cash flows. Large loans were specifically reviewed to evaluate credit risk. Additionally, PCD loans that
were determined to have more-than-insignificant deterioration were generally identified by the delinquency status, risk rating changes, credit rating, accruing status or other indicators of credit deterioration since origination. Loans
were valued individually although multiple inputs were applied to loans with similar characteristics as appropriate. These factors resulted in an $8.9 million fair value net discount to loans, which will be accreted over the remaining
life of each loan. The book value of the acquired loans was $387.3 million.
Allowance for Credit Losses: The ACL of $8.1 million was recorded on the identified PCD loans in accordance with ASC 326. An ACL of $4.2 million
was recorded on non-PCD loans and reported as provision expense during the three months ended June 30, 2025.
While there were significant similarities in the application of ASC 326 by Cadence and First Chatham, steps were taken by management to align the First Chatham process to ensure that the
ACL reported at the time of the First Chatham merger in the table above and in all subsequent reporting periods is consistent with the ACL policies as outlined in Note 1 – Summary of Significant Accounting Policies to the consolidated
financial statements of the Annual Report on Form 10-K for the year ended December 31, 2024, and Note 5 – Allowance for Credit Losses. These steps included conforming certain First Chatham assumptions (e.g., the reasonable and supportable
forecast of future economic conditions and the reasonable and supportable forecast period, among others) to that of Cadence.
Intangible assets: Core deposit intangible asset represents the value of the relationships with deposit clients. The fair value for the core
deposit intangible asset was estimated based on a discounted cash flow methodology that gave appropriate consideration to expected client attrition rates, net maintenance cost of the deposit base, alternative costs of funds, and the
interest costs associated with the client deposits. The core deposit intangible asset is being amortized over its estimated useful life of approximately ten years utilizing an accelerated method.
ROU Assets and Lease Liabilities: ROU assets and lease liabilities were measured using a methodology that involved estimating the future rental
payments over the remaining lease term with discounting using a fully-collateralized discount rate. The lease term was determined for individual leases based on management’s assessment of the probability of exercising existing renewal
options. Adjustments for any off-market terms in a lease were also discounted and applied to the balance of the lease asset.
Premises: Land and buildings held for use were valued at appraised values, which reflect considerations of recent disposition values for similar
property types with adjustments for characteristics of individual properties.
Deposits: The fair values used for the demand and savings deposits by definition equal the amount payable on demand at the acquisition date. Fair
values for time deposits were estimated using a discounted cash flow analysis applying the prevailing market interest rates currently offered to the contractual interest rates on such time deposits.
Borrowings: The fair value of the junior subordinated debentures were estimated using a discounted cash flow calculation. The valuation took into
consideration comparable market rates and management’s execution of the call option in the first available period. The finalization of these analyses through the measurement period is not expected to significantly impact the income
statement.
The following table presents certain unaudited pro forma information for the results of operations for the six months ended June 30, 2024 and 2025, as if First Chatham had been acquired
on January 1, 2024. The pro forma results combine the historical results of First Chatham into the Company’s consolidated income statements including the impact of certain acquisition accounting adjustments including loan discount
accretion, investment securities discount accretion, intangible assets amortization and deposit premium accretion. The pro forma results have been prepared for comparative purposes only and are not necessarily indicative of what would
have occurred had the acquisition taken place on January 1, 2024. No assumptions have been applied to the pro forma results of operations regarding possible revenue enhancements, provision for credit losses, expense efficiencies or asset
dispositions.
| |
|
Six Months Ended June 30, |
|
| |
|
2025
|
|
|
2024
|
|
|
(In thousands)
|
|
Pro Forma
|
|
|
Pro Forma
|
|
|
Total revenues (net interest income and noninterest income)
|
|
$
|
937,178
|
|
|
$
|
916,652
|
|
|
Net income
|
|
$
|
265,868
|
|
|
$
|
259,629
|
|
Revenues and earnings of the acquired company since the acquisition date have not been disclosed as it is not practicable since First Chatham was merged into the Company and separate
financial information is not available or considered material.
FCB merger-related expenses of $1.7 million incurred during 2025 are recorded in the consolidated income statement and include incremental costs related to the closing of the
transactions, including legal, accounting and auditing, investment banker fees, certain employment related costs, travel, printing, supplies, and other costs.
NOTE 3. AVAILABLE FOR SALE SECURITIES AND EQUITY SECURITIES
The amortized cost, unrealized gains and losses, and estimated fair value of available for sale securities are presented in the following tables:
|
(In thousands)
|
|
Amortized Cost
|
|
|
Gross Unrealized Gains
|
|
|
Gross Unrealized Losses
|
|
|
Estimated
Fair
Value
|
|
|
June 30, 2025
|
|
|
|
|
|
|
|
|
|
|
|
|
|
U.S. government agency securities
|
|
$
|
301,322
|
|
|
$
|
119
|
|
|
$
|
34,536
|
|
|
$
|
266,905
|
|
|
MBS issued or guaranteed by U.S. agencies
|
|
|
|
|
|
|
|
|
|
|
|
|
|
|
|
|
|
Residential pass-through:
|
|
|
|
|
|
|
|
|
|
|
|
|
|
|
|
|
|
Guaranteed by GNMA
|
|
|
74,511
|
|
|
|
12
|
|
|
|
10,059
|
|
|
|
64,464
|
|
|
Issued by FNMA and FHLMC
|
|
|
4,697,771
|
|
|
|
1,438
|
|
|
|
532,893
|
|
|
|
4,166,316
|
|
|
Other residential MBS
|
|
|
2,398,533
|
|
|
|
18,301
|
|
|
|
27,772
|
|
|
|
2,389,062
|
|
|
Commercial MBS
|
|
|
1,530,014
|
|
|
|
1,824
|
|
|
|
76,200
|
|
|
|
1,455,638
|
|
|
Total MBS
|
|
|
8,700,829
|
|
|
|
21,575
|
|
|
|
646,924
|
|
|
|
8,075,480
|
|
|
Obligations of states and political subdivisions
|
|
|
166,093
|
|
|
|
9
|
|
|
|
34,767
|
|
|
|
131,335
|
|
|
Corporate debt securities
|
|
|
50,750
|
|
|
|
—
|
|
|
|
4,751
|
|
|
|
45,999
|
|
|
Foreign debt securities
|
|
|
318,635
|
|
|
|
368
|
|
|
|
1,322
|
|
|
|
317,681
|
|
|
Total available for sale securities
|
|
$
|
9,537,629
|
|
|
$
|
22,071
|
|
|
$
|
722,300
|
|
|
$
|
8,837,400
|
|
|
(In thousands)
|
|
Amortized
Cost
|
|
|
Gross Unrealized Gains
|
|
|
Gross Unrealized Losses
|
|
|
Estimated
Fair
Value
|
|
|
December 31, 2024
|
|
|
|
|
|
|
|
|
|
|
|
|
|
U.S. government agency securities
|
|
$
|
321,454
|
|
|
$
|
20
|
|
|
$
|
40,243
|
|
|
$
|
281,231
|
|
|
MBS issued or guaranteed by U.S. agencies
|
|
|
|
|
|
|
|
|
|
|
|
|
|
|
|
|
|
Residential pass-through:
|
|
|
|
|
|
|
|
|
|
|
|
|
|
|
|
|
|
Guaranteed by GNMA
|
|
|
78,279
|
|
|
|
—
|
|
|
|
11,698
|
|
|
|
66,581
|
|
|
Issued by FNMA and FHLMC
|
|
|
4,604,954
|
|
|
|
16
|
|
|
|
639,414
|
|
|
|
3,965,556
|
|
|
Other residential MBS
|
|
|
958,911
|
|
|
|
6,110
|
|
|
|
30,300
|
|
|
|
934,721
|
|
|
Commercial MBS
|
|
|
1,645,065
|
|
|
|
1,605
|
|
|
|
97,029
|
|
|
|
1,549,641
|
|
|
Total MBS
|
|
|
7,287,209
|
|
|
|
7,731
|
|
|
|
778,441
|
|
|
|
6,516,499
|
|
|
Obligations of states and political subdivisions
|
|
|
167,743
|
|
|
|
10
|
|
|
|
35,684
|
|
|
|
132,069
|
|
|
Corporate debt securities
|
|
|
52,751
|
|
|
|
—
|
|
|
|
5,349
|
|
|
|
47,402
|
|
|
Foreign debt securities
|
|
|
318,539
|
|
|
|
443
|
|
|
|
2,195
|
|
|
|
316,787
|
|
|
Total available for sale securities
|
|
$
|
8,147,696
|
|
|
$
|
8,204
|
|
|
$
|
861,912
|
|
|
$
|
7,293,988
|
|
For the three months ended June 30, 2025, gross gains of $2 thousand and gross losses of $2 thousand were recognized for available for sale securities, compared to gross gains of $1
thousand and gross losses of $5 thousand for the same period in 2024. There were no impairment charges related to credit losses included in gross realized losses for the three months ended June 30, 2025 and 2024.
For the six months ended June 30, 2025, gross gains of $3 thousand and gross losses of $12 thousand were recognized for available for sale securities, compared to gross gains of $3
thousand and gross losses of $15 thousand for the same period in 2024. There were no impairment charges related to credit losses included in gross realized losses for the six months ended June 30, 2025 and 2024.
Available for sale securities with a carrying value of $3.8 billion and $4.0 billion at June 30, 2025 and December 31, 2024, respectively, were pledged to secure public and trust funds
on deposit and for other purposes.
There were no securities held for trading or held-to-maturity at June 30, 2025 or December 31, 2024.
The amortized cost and estimated fair value of available for sale securities at June 30, 2025 by contractual maturity are shown below. Actual maturities may differ from contractual
maturities because borrowers may have the right to call or prepay obligations with or without call or prepayment penalties.
|
(In thousands)
|
|
Amortized
Cost
|
|
|
Estimated
Fair Value
|
|
|
Maturing in one year or less
|
|
$
|
—
|
|
|
$
|
—
|
|
|
Maturing after one year through five years
|
|
|
106,686
|
|
|
|
104,996
|
|
|
Maturing after five years through ten years
|
|
|
500,107
|
|
|
|
479,196
|
|
|
Maturing after ten years
|
|
|
230,007
|
|
|
|
177,728
|
|
|
Mortgage-backed securities
|
|
|
8,700,829
|
|
|
|
8,075,480
|
|
|
Total available for sale securities
|
|
$
|
9,537,629
|
|
|
$
|
8,837,400
|
|
At June 30, 2025 and December 31, 2024, approximately 67.1% and 80.4% of securities were in an unrealized loss position, respectively. At June 30, 2025, there were 864 securities in a
loss position for more than twelve months, and 24 securities in a loss position for less than twelve months. At December 31, 2024, there were 871 securities in a loss position for more than twelve months, and 33 securities in a loss
position for less than twelve months. A summary of available for sale investments with continuous unrealized loss positions for which an allowance for credit losses has not been recorded is as follows:
| |
|
Less Than 12 Months
|
|
|
12 Months or Longer
|
|
|
(In thousands)
|
|
Fair
Value
|
|
|
Unrealized Losses
|
|
|
Fair
Value
|
|
|
Unrealized Losses
|
|
|
June 30, 2025
|
|
|
|
|
|
|
|
|
|
|
|
|
|
U.S. government agency securities
|
|
$
|
22,736
|
|
|
$
|
60
|
|
|
$
|
206,310
|
|
|
$
|
34,476
|
|
|
MBS
|
|
|
554,460
|
|
|
|
2,308
|
|
|
|
4,926,499
|
|
|
|
644,616
|
|
|
Obligations of states and political subdivisions
|
|
|
—
|
|
|
|
—
|
|
|
|
120,948
|
|
|
|
34,767
|
|
|
Corporate debt securities
|
|
|
—
|
|
|
|
—
|
|
|
|
44,000
|
|
|
|
4,751
|
|
|
Foreign debt securities
|
|
|
—
|
|
|
|
—
|
|
|
|
53,678
|
|
|
|
1,322
|
|
|
Total
|
|
$
|
577,196
|
|
|
$
|
2,368
|
|
|
$
|
5,351,435
|
|
|
$
|
719,932
|
|
| |
|
Less Than 12 Months
|
|
|
12 Months or Longer
|
|
|
(In thousands)
|
|
Fair
Value
|
|
|
Unrealized Losses
|
|
|
Fair
Value
|
|
|
Unrealized Losses
|
|
|
December 31, 2024
|
|
|
|
|
|
|
|
|
|
|
|
|
|
U.S. government agency securities
|
|
$
|
74,795
|
|
|
$
|
221
|
|
|
$
|
200,798
|
|
|
$
|
40,022
|
|
|
MBS
|
|
|
249,197
|
|
|
|
2,314
|
|
|
|
5,123,218
|
|
|
|
776,127
|
|
|
Obligations of states and political subdivisions
|
|
|
303
|
|
|
|
7
|
|
|
|
121,117
|
|
|
|
35,677
|
|
|
Corporate debt securities
|
|
|
7,474
|
|
|
|
2,527
|
|
|
|
37,928
|
|
|
|
2,822
|
|
|
Foreign debt securities
|
|
|
—
|
|
|
|
—
|
|
|
|
52,806
|
|
|
|
2,195
|
|
|
Total
|
|
$
|
331,769
|
|
|
$
|
5,069
|
|
|
$
|
5,535,867
|
|
|
$
|
856,843
|
|
Management evaluates available for sale securities in unrealized loss positions to determine whether the impairment is attributable to credit-related factors or noncredit-related
factors. Credit loss is defined as the difference between the present value of the cash flows expected to be collected and the amortized cost basis. Management believes that the unrealized losses detailed in the previous tables are
due to noncredit-related factors, such as changes in interest rates and other market conditions. Therefore, no allowance for credit losses was recorded related to these securities at June 30, 2025 or December 31, 2024. Additionally,
as of June 30, 2025 management had no intent to sell these securities, and it is more likely than not that the Company would not be required to sell the securities prior to recovery of costs. The fair value of these securities is
expected to recover as they approach their maturity date or repricing date or if market yields for such investments decline.
Reported in other assets in the accompanying consolidated balance sheets, equity investments with readily determinable fair values not held for trading are recorded at fair value,
with changes in fair value reported in net income. Additionally, the Company reports equity investments without readily determinable fair values in other assets in the accompanying consolidated balance sheets. These investments
include investments in the common stock of the FHLB of Dallas and the FRB of St. Louis. The Company is required to own stock in the FHLB of Dallas for membership in the FHLB system and in relation to the level of FHLB advances. The
Company is also required to purchase and hold shares of capital stock in the FRB of St. Louis for membership in the Federal Reserve System. The Company accounts for these investments as long-term assets and carries them at cost.
During the periods ended June 30, 2025 and December 31, 2024, there were no downward or upward adjustments to these investments for impairments or price changes from observable transactions.
|
(In thousands)
|
|
Cost
|
|
|
Gross Unrealized Gains
|
|
|
Gross Unrealized Losses
|
|
|
Carrying Value
|
|
|
June 30, 2025
|
|
|
|
|
|
|
|
|
|
|
|
|
|
Equity securities held at cost:
|
|
|
|
|
|
|
|
|
|
|
|
|
|
FRB stock
|
|
$
|
102,379
|
|
|
$
|
—
|
|
|
$
|
—
|
|
|
$
|
102,379
|
|
|
FHLB stock
|
|
|
142,762
|
|
|
|
—
|
|
|
|
—
|
|
|
|
142,762
|
|
|
Other equity securities
|
|
|
20,582
|
|
|
|
—
|
|
|
|
—
|
|
|
|
20,582
|
|
|
Total equity securities, held at cost
|
|
$
|
265,723
|
|
|
$
|
—
|
|
|
$
|
—
|
|
|
$
|
265,723
|
|
|
Equity securities held at fair value:
|
|
|
|
|
|
|
|
|
|
|
|
|
|
|
|
|
|
Farmer Mac stock
|
|
$
|
49
|
|
|
$
|
531
|
|
|
$
|
—
|
|
|
$
|
580
|
|
|
Affordable Housing MBS Exchange Traded Fund
|
|
|
24,994
|
|
|
|
—
|
|
|
|
3,609
|
|
|
|
21,385
|
|
|
Total equity securities, held at fair value
|
|
$
|
25,043
|
|
|
$
|
531
|
|
|
$
|
3,609
|
|
|
$
|
21,965
|
|
|
(In thousands)
|
|
Cost
|
|
|
Gross Unrealized Gains
|
|
|
Gross Unrealized Losses
|
|
|
Carrying Value
|
|
|
December 31, 2024
|
|
|
|
|
|
|
|
|
|
|
|
|
|
Equity securities held at cost:
|
|
|
|
|
|
|
|
|
|
|
|
|
|
FRB stock
|
|
$
|
100,567
|
|
|
$
|
—
|
|
|
$
|
—
|
|
|
$
|
100,567
|
|
|
FHLB stock
|
|
|
10,410
|
|
|
|
—
|
|
|
|
—
|
|
|
|
10,410
|
|
|
Other equity securities
|
|
|
20,582
|
|
|
|
—
|
|
|
|
—
|
|
|
|
20,582
|
|
|
Total equity securities, held at cost
|
|
$
|
131,559
|
|
|
$
|
—
|
|
|
$
|
—
|
|
|
$
|
131,559
|
|
|
Equity securities held at fair value:
|
|
|
|
|
|
|
|
|
|
|
|
|
|
|
|
|
|
Farmer Mac stock
|
|
$
|
49
|
|
|
$
|
543
|
|
|
$
|
—
|
|
|
$
|
592
|
|
|
Affordable Housing MBS Exchange Traded Fund
|
|
|
24,994
|
|
|
|
—
|
|
|
|
3,908
|
|
|
|
21,086
|
|
|
Total equity securities, held at fair value
|
|
$
|
25,043
|
|
|
$
|
543
|
|
|
$
|
3,908
|
|
|
$
|
21,678
|
|
NOTE 4. LOANS AND LEASES
The following table is a summary of our loan and lease portfolio aggregated by segment and class at the periods indicated:
|
(In thousands)
|
|
June 30, 2025
|
|
|
December 31, 2024
|
|
|
Commercial and industrial
|
|
|
|
|
|
|
|
Non-real estate
|
|
$
|
9,049,094
|
|
|
$
|
8,670,529
|
|
|
Owner occupied
|
|
|
4,762,408
|
|
|
|
4,665,015
|
|
|
Total commercial and industrial
|
|
|
13,811,502
|
|
|
|
13,335,544
|
|
|
Commercial real estate
|
|
|
Construction, acquisition and development
|
|
|
3,464,124
|
|
|
|
3,909,184
|
|
|
Income producing
|
|
|
7,025,539
|
|
|
|
6,015,773
|
|
|
Total commercial real estate
|
|
|
10,489,663
|
|
|
|
9,924,957
|
|
|
Consumer
|
|
|
Residential mortgages
|
|
|
10,951,618
|
|
|
|
10,267,883
|
|
|
Other consumer
|
|
|
212,398
|
|
|
|
213,371
|
|
|
Total consumer
|
|
|
11,164,016
|
|
|
|
10,481,254
|
|
|
Total loans and leases, net of unearned income (1) (2)
|
|
$
|
35,465,181
|
|
|
$
|
33,741,755
|
|
| (1) |
Total loans and leases are net of $23.9 million and $21.4 million of unearned income at June 30, 2025 and December 31, 2024, respectively.
|
| (2) |
Total loans and leases include $382.6 million of FCB loans acquired on May 1, 2025. See Note 2 for additional details.
|
The Company engages in lending to consumers, small and medium-sized business enterprises, and government entities through its community banking locations and to regional and national
business enterprises through its corporate banking division. The bank acts as agent or participant in SNC and other financing arrangements with other financial institutions. Loans are issued generally to finance home purchases and
improvements, personal expenditures, business investment and operations, construction and development, and income producing properties. Loans are underwritten to be repaid primarily by available cash flow from personal income, investment
income, business operations, rental income, or the sale of developed or constructed properties. Collateral and personal guaranties of business owners are generally required as a condition of the financing arrangements and provide
additional cash flow and proceeds from asset sales of guarantors in the event primary sources of repayment are no longer sufficient.
While loans are structured to provide protection to the Company if borrowers are unable to repay as agreed, the Company recognizes there are numerous risks that may result in
deterioration of the repayment ability of borrowers and guarantors. These risks include failure of business operations due to economic, legal, market, logistical, weather, health, governmental and force
majeure events. Concentrations in the Company’s loan and lease portfolio also present credit risks. The impact of a slowing economy, inflation, higher interest rates, and labor and supply chain shortages, poses additional risk
to borrowers and financial institutions. As a result of these factors, there is risk for businesses to experience difficulty in meeting repayment obligations, and the Company may experience losses or deterioration in performance in its
loan portfolio. For information regarding nonaccrual policies, past-dues or delinquency status, and recognizing write-offs within ACL, refer to “Note 1 - Summary of Significant Accounting Policies” included in Part II., Item 8 of the
Company’s Annual Report on Form 10-K for the year ended December 31, 2024.
The Company has identified the following segments and classes of loans and leases with similar risk characteristics for measuring expected credit losses:
Commercial and Industrial
Non-Real Estate – Commercial and industrial loans are loans and leases to finance business operations, equipment and owner-occupied facilities
for small and medium-sized enterprises, as well as larger corporate borrowers. These include both lines of credit and term loans which are amortized over the useful life of the assets financed. Personal and/or corporate guarantees are
generally obtained where available and prudent. This category also includes loans to finance agricultural production. The Company recognizes risk from economic cycles, commodity prices, government regulation, supply-chain disruptions,
product innovations or obsolescence, operational errors, lawsuits, natural disasters, losses due to fraud, theft or embezzlement, loss of sponsor support, health or loss of key personnel or competitive situations may adversely affect the
scheduled repayment of business loans. In addition, risks in the agricultural sector including crop failures due to weather, insects and other blights, commodity prices, governmental intervention, lawsuits, labor or logistical
disruptions.
Owner Occupied – Owner occupied loans include loans secured by business facilities to finance business operations, equipment and owner-occupied
facilities primarily for small and medium-sized enterprises. These include both lines of credit and term loans which are amortized over the useful life of the assets financed. Personal guarantees, if applicable, are generally required for
these loans. The Company recognizes that risk from economic cycles, government regulation, supply-chain disruptions, product innovations or obsolescence, operational errors, lawsuits, natural disasters, losses due to theft or
embezzlement, health or loss of key personnel, or competitive situations may adversely affect the scheduled repayment of business loans.
Commercial Real Estate
Construction, Acquisition and Development – CAD loans include both loans and credit lines for the purpose of purchasing, carrying, and developing
land into residential subdivisions or various types of commercial developments, such as industrial, warehouse, retail, office, and multi-family. This category also includes loans and credit lines for construction of residential,
multi-family and commercial buildings. The Company generally engages in CAD lending primarily in local markets served by its branches. The Company recognizes that risks are inherent in the financing of real estate development and
construction. These risks include location, market conditions and price volatility, change in interest rates, demand for developed land, lots and buildings, desirability of features and styling of completed developments and buildings,
competition from other developments and builders, traffic patterns, remote work patterns, governmental jurisdiction, tax structure, availability of utilities, roads, public transportation and schools, availability of permanent financing
for homebuyers, zoning, environmental restrictions, lawsuits, economic and business cycle, labor, and reputation of the builder or developer.
Each CAD loan is underwritten to address: (i) the desirability of the project, its market viability and projected absorption period; (ii) the creditworthiness of the borrower and the
guarantor as to liquidity, cash flow and assets available to ensure performance of the loan; (iii) equity contribution to the project; (iv) the developer’s experience and success with similar projects; and (v) the value of the collateral.
A substantial portion of CAD loans are secured by real estate in markets in which the Company is located. The Company’s loan policy generally prohibits loans for the sole purpose of
carrying interest reserves. Certain of the construction, acquisition and development loans were structured with interest-only terms. A portion of the residential mortgage and CRE portfolios were originated through the permanent financing
of construction, acquisition and development loans. Higher interest rates and the potential for slowing economic conditions could negatively impact borrowers’ and guarantors’ ability to repay their debt which would make more of the
Company’s loans collateral-dependent.
Income Producing – CRE loans include loans to finance income-producing commercial and multi-family properties. Lending in this category is
generally limited to properties located in the Company’s market area with only limited exposure to properties located elsewhere but owned by in-market borrowers. Loans in this category include loans for neighborhood retail centers,
medical and professional offices, single retail stores, industrials and apartments leased generally to local businesses and residents. The underwriting of these loans takes into consideration the occupancy and rental rates as well as the
financial health of the borrower. The Company’s exposure to national retail tenants is limited. The Company recognizes that risk from economic cycles, government restrictions, delayed or missed rent payments, supply-chain disruptions,
operational errors, lawsuits, natural disasters, losses due to theft or embezzlement, health or loss of key personnel or competitive situations may adversely affect the scheduled repayment of business loans.
Consumer
Residential Mortgages – Residential mortgages are first or second-lien loans to consumers secured by a primary residence or second home. This
category includes traditional mortgages, home equity loans and revolving lines of credit. The loans are generally secured by properties located within the local market area of the community bank which originates and services the loan.
These loans are underwritten in accordance with the Company’s general loan policies and procedures which require, among other things, proper documentation of each borrower’s financial condition, satisfactory credit history, and property
value. In addition to loans originated through the Company’s branches, the Company originates and services residential mortgages sold in the secondary market which are underwritten and closed pursuant to investor and agency guidelines. At
June 30, 2025 and December 31, 2024, residential mortgage loans in process of foreclosure totaled $14.4 million and $19.7 million, respectively. Additionally, the Company held $6.9 million and $4.4 million in foreclosed residential
properties at June 30, 2025 and December 31, 2024, respectively.
Other Consumer – Other consumer lending includes consumer credit cards as well as personal revolving lines of credit and installment loans. The
Company offers credit cards, primarily to its deposit and loan customers. Consumer installment loans generally includes term loans secured by automobiles, boats and recreational vehicles.
The Company recognizes there are risks in consumer lending which include interruptions in the borrower’s personal and investment income due to loss of employment, market conditions, and
general economic conditions, deterioration in the health and well-being of the borrower and family members, natural disasters, lawsuits, losses, or inability to generate income due to injury, accidents, theft, vandalism, or
incarceration.
Credit Quality
The following tables provide details regarding the aging of the Company’s loan and lease portfolio, net of unearned income, at the periods indicated:
| |
|
June 30, 2025 |
|
|
(In thousands)
|
|
30-59
Days
Past Due
|
|
|
60-89
Days
Past Due
|
|
|
90+ Days Past Due
|
|
|
Total
Past Due
|
|
|
Current
|
|
|
Total
Amortized Cost
|
|
|
90+ Days
Past Due
still
Accruing
|
|
| Commercial and industrial |
|
|
|
|
|
|
|
|
|
|
|
|
|
|
|
|
|
|
|
|
|
|
Non-real estate
|
|
$ |
49,057 |
|
|
$
|
7,917
|
|
|
$
|
82,264
|
|
|
$
|
139,238
|
|
|
$
|
8,909,856
|
|
|
$
|
9,049,094
|
|
|
$
|
798
|
|
|
Owner occupied
|
|
|
5,910 |
|
|
|
2,018
|
|
|
|
13,656
|
|
|
|
21,584
|
|
|
|
4,740,824
|
|
|
|
4,762,408
|
|
|
|
139
|
|
|
Total commercial and industrial
|
|
|
54,967 |
|
|
|
9,935
|
|
|
|
95,920
|
|
|
|
160,822
|
|
|
|
13,650,680
|
|
|
|
13,811,502
|
|
|
|
937
|
|
| Commercial real estate |
|
|
|
|
|
|
|
|
|
|
|
|
|
|
|
|
|
|
|
|
|
|
|
|
|
|
|
|
|
Construction, acquisition and development
|
|
|
13,619 |
|
|
|
290
|
|
|
|
8,508
|
|
|
|
22,417
|
|
|
|
3,441,707
|
|
|
|
3,464,124
|
|
|
|
25
|
|
|
Income producing
|
|
|
7,669 |
|
|
|
368
|
|
|
|
4,260
|
|
|
|
12,297
|
|
|
|
7,013,242
|
|
|
|
7,025,539
|
|
|
|
—
|
|
|
Total commercial real estate
|
|
|
21,288 |
|
|
|
658
|
|
|
|
12,768
|
|
|
|
34,714
|
|
|
|
10,454,949
|
|
|
|
10,489,663
|
|
|
|
25
|
|
| Consumer |
|
|
|
|
|
|
|
|
|
|
|
|
|
|
|
|
|
|
|
|
|
|
|
|
|
|
|
|
|
Residential mortgages
|
|
|
72,213 |
|
|
|
37,220
|
|
|
|
52,300
|
|
|
|
161,733
|
|
|
|
10,789,885
|
|
|
|
10,951,618
|
|
|
|
3,933
|
|
|
Other consumer
|
|
|
1,033 |
|
|
|
440 |
|
|
|
544 |
|
|
|
2,017 |
|
|
|
210,381 |
|
|
|
212,398 |
|
|
|
313 |
|
|
Total consumer
|
|
|
73,246
|
|
|
|
37,660
|
|
|
|
52,844
|
|
|
|
163,750
|
|
|
|
11,000,266
|
|
|
|
11,164,016
|
|
|
|
4,246
|
|
|
Total
|
|
$ |
149,501 |
|
|
$
|
48,253
|
|
|
$ |
161,532 |
|
|
$ |
359,286 |
|
|
$ |
35,105,895 |
|
|
$ |
35,465,181 |
|
|
$
|
5,208
|
|
| |
|
December 31, 2024 |
|
|
(In thousands)
|
|
30-59
Days
Past Due
|
|
|
60-89
Days
Past Due
|
|
|
90+ Days
Past Due
|
|
|
Total
Past Due
|
|
|
Current
|
|
|
Total Amortized Cost
|
|
|
90+ Days
Past Due
still
Accruing
|
|
| |
|
|
|
|
|
|
|
|
|
|
|
|
|
|
|
|
|
|
|
|
|
|
Commercial and industrial
|
|
|
|
|
|
|
|
|
|
|
|
|
|
|
|
|
|
|
|
|
|
|
Non-real estate
|
|
$
|
13,443
|
|
|
$
|
28,379
|
|
|
$
|
101,873
|
|
|
$
|
143,695
|
|
|
$
|
8,526,834
|
|
|
$
|
8,670,529
|
|
|
$
|
8,115
|
|
|
Owner occupied
|
|
|
10,375
|
|
|
|
3,836
|
|
|
|
16,280
|
|
|
|
30,491
|
|
|
|
4,634,524
|
|
|
|
4,665,015
|
|
|
|
—
|
|
|
Total commercial and industrial
|
|
|
23,818
|
|
|
|
32,215
|
|
|
|
118,153
|
|
|
|
174,186
|
|
|
|
13,161,358
|
|
|
|
13,335,544
|
|
|
|
8,115
|
|
Commercial real estate
|
|
|
|
|
|
|
|
|
|
|
|
|
|
|
|
|
|
|
|
|
|
|
|
|
|
|
|
|
|
Construction, acquisition and development
|
|
|
4,254
|
|
|
|
663
|
|
|
|
8,579
|
|
|
|
13,496
|
|
|
|
3,895,688
|
|
|
|
3,909,184
|
|
|
|
—
|
|
|
Income producing
|
|
|
3,971
|
|
|
|
1,226
|
|
|
|
12,193
|
|
|
|
17,390
|
|
|
|
5,998,383
|
|
|
|
6,015,773
|
|
|
|
—
|
|
|
Total commercial real estate
|
|
|
8,225
|
|
|
|
1,889
|
|
|
|
20,772
|
|
|
|
30,886
|
|
|
|
9,894,071
|
|
|
|
9,924,957
|
|
|
|
—
|
|
| Consumer |
|
|
|
|
|
|
|
|
|
|
|
|
|
|
|
|
|
|
|
|
|
|
|
|
|
|
|
|
|
Residential mortgages
|
|
|
60,009
|
|
|
|
28,937
|
|
|
|
61,578
|
|
|
|
150,524
|
|
|
|
10,117,359
|
|
|
|
10,267,883
|
|
|
|
4,750
|
|
|
Other consumer
|
|
|
1,587
|
|
|
|
455
|
|
|
|
413
|
|
|
|
2,455
|
|
|
|
210,916
|
|
|
|
213,371
|
|
|
|
261
|
|
|
Total consumer
|
|
|
61,596
|
|
|
|
29,392
|
|
|
|
61,991
|
|
|
|
152,979
|
|
|
|
10,328,275
|
|
|
|
10,481,254
|
|
|
|
5,011
|
|
Total
|
|
$
|
93,639
|
|
|
$
|
63,496
|
|
|
$
|
200,916
|
|
|
$
|
358,051
|
|
|
$
|
33,383,704
|
|
|
$
|
33,741,755
|
|
|
$
|
13,126
|
|
The Company utilizes an internal loan classification system that is continually updated to grade loans according to certain credit quality indicators. These credit quality indicators
include, but are not limited to, recent credit performance, delinquency, liquidity, cash flows, debt coverage ratios, collateral type and loan-to-value ratio. The Company’s internal loan classification system is compatible with
classifications used by regulatory agencies. Loans may be classified as follows:
Pass: Loans which are performing as agreed with few or no signs of weakness. These loans show sufficient cash flow, capital and collateral to repay the loan as agreed.
Special Mention: Loans where potential weaknesses have developed which could cause a more serious problem if not corrected.
Substandard: Loans where well-defined weaknesses exist that require corrective action to prevent further deterioration. Loans are further characterized by the possibility that the Company
will sustain some loss if the deficiencies are not corrected.
Doubtful: Loans having all the characteristics of Substandard and which have deteriorated to a point where collection and liquidation in full is highly questionable.
Loss: Loans that are considered uncollectible or with limited possible recovery.
Impaired: An internal grade for individually analyzed collateral-dependent loans for which a specific provision has been considered to address the unsupported exposure.
PCD (Loss): An internal grade for loans with evidence of deterioration of credit quality since origination that are acquired, and for which it is probable, at acquisition, that the bank
will be unable to collect all contractually required payments.
The following tables provide details of the Company’s loan and lease portfolio, net of unearned income, by segment, class and internally assigned grade at the periods indicated:
| |
|
June 30, 2025 |
|
|
(In thousands)
|
|
Pass
|
|
|
Special Mention (1)
|
|
|
Substandard (1)
|
|
|
Doubtful
|
|
|
Impaired (1)
|
|
|
PCD (Loss) (1)
|
|
|
Total
|
|
|
Commercial and industrial
|
|
|
|
|
|
|
|
|
|
|
|
|
|
|
|
|
|
|
|
|
|
|
Non-real estate
|
|
$ |
8,516,718 |
|
|
$
|
157,279
|
|
|
$
|
344,254
|
|
|
$
|
8,369
|
|
|
$
|
19,112
|
|
|
$
|
3,362
|
|
|
$
|
9,049,094
|
|
|
Owner occupied
|
|
|
4,719,527 |
|
|
|
7,886
|
|
|
|
28,021
|
|
|
|
—
|
|
|
|
6,974
|
|
|
|
—
|
|
|
|
4,762,408
|
|
|
Total commercial and industrial
|
|
|
13,236,245 |
|
|
|
165,165
|
|
|
|
372,275
|
|
|
|
8,369
|
|
|
|
26,086
|
|
|
|
3,362
|
|
|
|
13,811,502
|
|
|
Commercial real estate
|
|
|
|
|
|
|
|
|
|
|
|
|
|
|
|
|
|
|
|
|
|
|
|
|
|
|
|
|
|
Construction, acquisition and development
|
|
|
3,452,247
|
|
|
|
1,634
|
|
|
|
4,400
|
|
|
|
—
|
|
|
|
5,843
|
|
|
|
—
|
|
|
|
3,464,124
|
|
|
Income producing
|
|
|
6,776,961
|
|
|
|
53,088
|
|
|
|
188,979
|
|
|
|
—
|
|
|
|
2,218
|
|
|
|
4,293
|
|
|
|
7,025,539
|
|
|
Total commercial real estate
|
|
|
10,229,208
|
|
|
|
54,722
|
|
|
|
193,379
|
|
|
|
—
|
|
|
|
8,061
|
|
|
|
4,293
|
|
|
|
10,489,663
|
|
|
Consumer
|
|
|
|
|
|
|
|
|
|
|
|
|
|
|
|
|
|
|
|
|
|
|
|
|
|
|
|
|
|
Residential mortgages
|
|
|
10,847,867
|
|
|
|
9,008
|
|
|
|
89,257
|
|
|
|
—
|
|
|
|
4,075 |
|
|
|
1,411
|
|
|
|
10,951,618
|
|
|
Other consumer
|
|
|
211,722
|
|
|
|
—
|
|
|
|
676
|
|
|
|
—
|
|
|
|
— |
|
|
|
—
|
|
|
|
212,398
|
|
|
Total consumer
|
|
|
11,059,589
|
|
|
|
9,008
|
|
|
|
89,933
|
|
|
|
—
|
|
|
|
4,075 |
|
|
|
1,411
|
|
|
|
11,164,016
|
|
|
Total
|
|
$ |
34,525,042 |
|
|
$ |
228,895 |
|
|
$ |
655,587 |
|
|
$ |
8,369 |
|
|
$ |
38,222 |
|
|
$
|
9,066 |
|
|
$ |
35,465,181 |
|
|
(1)
|
In the loan classifications above, $7.9 million of the special mention balance, $106.0 million of the substandard balance, $8.3 million of the impaired balance, and $3.5 million of the PCD (Loss) balance are covered by
government guarantees from either the SBA, FHA, VA and USDA.
|
| |
|
December 31, 2024
|
|
| (In thousands) |
|
Pass
|
|
|
Special
Mention
|
|
|
Substandard (1) |
|
|
Doubtful |
|
|
Impaired (1) |
|
|
PCD (Loss)
|
|
|
Total |
|
|
Commercial and industrial
|
|
|
|
|
|
|
|
|
|
|
|
|
|
|
|
|
|
|
|
|
|
|
Non-real estate
|
|
$
|
8,208,176
|
|
|
$
|
106,996
|
|
|
$
|
311,096
|
|
|
$
|
8,743
|
|
|
$
|
31,996
|
|
|
$
|
3,522
|
|
|
$
|
8,670,529
|
|
|
Owner occupied
|
|
|
4,610,775
|
|
|
|
815
|
|
|
|
41,363
|
|
|
|
—
|
|
|
|
10,968
|
|
|
|
1,094
|
|
|
|
4,665,015
|
|
|
Total commercial and industrial
|
|
|
12,818,951
|
|
|
|
107,811
|
|
|
|
352,459
|
|
|
|
8,743
|
|
|
|
42,964
|
|
|
|
4,616
|
|
|
|
13,335,544
|
|
|
Commercial real estate
|
|
|
|
|
|
|
|
|
|
|
|
|
|
|
|
|
|
|
|
|
|
|
|
|
|
|
|
|
|
Construction, acquisition and development
|
|
|
3,896,856
|
|
|
|
—
|
|
|
|
12,262
|
|
|
|
—
|
|
|
|
66
|
|
|
|
—
|
|
|
|
3,909,184
|
|
|
Income producing
|
|
|
5,850,702
|
|
|
|
5,094
|
|
|
|
144,084
|
|
|
|
—
|
|
|
|
15,893
|
|
|
|
—
|
|
|
|
6,015,773
|
|
|
Total commercial real estate
|
|
|
9,747,558
|
|
|
|
5,094
|
|
|
|
156,346
|
|
|
|
—
|
|
|
|
15,959
|
|
|
|
—
|
|
|
|
9,924,957
|
|
|
Consumer
|
|
|
|
|
|
|
|
|
|
|
|
|
|
|
|
|
|
|
|
|
|
|
|
|
|
|
|
|
|
Residential mortgages
|
|
|
10,167,830
|
|
|
|
891
|
|
|
|
89,597
|
|
|
|
—
|
|
|
|
8,154
|
|
|
|
1,411
|
|
|
|
10,267,883
|
|
|
Other consumer
|
|
|
212,865
|
|
|
|
—
|
|
|
|
506
|
|
|
|
—
|
|
|
|
—
|
|
|
|
—
|
|
|
|
213,371
|
|
|
Total consumer
|
|
|
10,380,695
|
|
|
|
891
|
|
|
|
90,103
|
|
|
|
—
|
|
|
|
8,154
|
|
|
|
1,411
|
|
|
|
10,481,254
|
|
|
Total
|
|
$
|
32,947,204
|
|
|
$
|
113,796
|
|
|
$
|
598,908
|
|
|
$
|
8,743
|
|
|
$
|
67,077
|
|
|
$
|
6,027
|
|
|
$
|
33,741,755
|
|
| (1) |
In the loan classifications above, $99.0 million of the substandard balance and $11.1 million of the impaired balance is covered by government guarantees from the SBA, FHA, VA and USDA.
|
The following tables provide credit quality indicators, including gross charge-offs, by class and period of origination (vintage) at June 30, 2025:
| |
|
Commercial and Industrial - Non-Real Estate
|
|
| |
|
Period Originated:
|
|
|
|
|
|
|
|
|
|
|
(Dollars in thousands)
|
|
2025
|
|
|
2024 |
|
|
2023
|
|
|
2022
|
|
|
2021
|
|
|
Prior
|
|
|
Revolving
Loans
|
|
|
Revolving
Loans
Converted
to Term
|
|
|
Total |
|
|
Pass
|
|
$
|
922,953
|
|
|
$
|
1,446,350
|
|
|
$
|
814,425
|
|
|
$
|
835,925
|
|
|
$
|
473,333
|
|
|
$
|
674,667
|
|
|
$
|
3,345,475
|
|
|
$
|
3,590
|
|
|
$
|
8,516,718
|
|
|
Special Mention
|
|
|
884
|
|
|
|
9,571
|
|
|
|
17,077
|
|
|
|
5,011
|
|
|
|
61,815
|
|
|
|
32,072
|
|
|
|
30,849
|
|
|
|
—
|
|
|
|
157,279
|
|
|
Substandard
|
|
|
1,216
|
|
|
|
19,020
|
|
|
|
66,393
|
|
|
|
52,077
|
|
|
|
48,032
|
|
|
|
46,504
|
|
|
|
84,790
|
|
|
|
26,222
|
|
|
|
344,254
|
|
|
Doubtful
|
|
|
—
|
|
|
|
—
|
|
|
|
—
|
|
|
|
—
|
|
|
|
8,369
|
|
|
|
—
|
|
|
|
—
|
|
|
|
—
|
|
|
|
8,369
|
|
|
Impaired
|
|
|
—
|
|
|
|
—
|
|
|
|
—
|
|
|
|
500
|
|
|
|
8,128
|
|
|
|
—
|
|
|
|
10,484
|
|
|
|
—
|
|
|
|
19,112
|
|
|
PCD (Loss)
|
|
|
—
|
|
|
|
—
|
|
|
|
—
|
|
|
|
—
|
|
|
|
—
|
|
|
|
3,362
|
|
|
|
—
|
|
|
|
—
|
|
|
|
3,362
|
|
|
Total
|
|
$
|
925,053
|
|
|
$
|
1,474,941
|
|
|
$
|
897,895
|
|
|
$
|
893,513
|
|
|
$
|
599,677
|
|
|
$
|
756,605
|
|
|
$
|
3,471,598
|
|
|
$
|
29,812
|
|
|
$
|
9,049,094
|
|
|
% Criticized
|
|
|
0.2
|
%
|
|
|
1.9
|
%
|
|
|
9.3
|
%
|
|
|
6.4
|
%
|
|
|
21.1
|
%
|
|
|
10.8
|
%
|
|
|
3.6
|
%
|
|
|
88.0
|
%
|
|
|
5.9
|
%
|
|
Gross charge-offs YTD
|
|
$
|
527
|
|
|
$
|
425
|
|
|
$
|
3,173
|
|
|
$
|
7,462
|
|
|
$
|
436
|
|
|
$
|
1,068
|
|
|
$
|
24,640
|
|
|
$
|
—
|
|
|
$
|
37,731
|
|
| |
|
Commercial and Industrial - Owner Occupied |
|
| |
|
Period Originated: |
|
|
|
|
|
|
|
|
|
|
(Dollars in thousands)
|
|
2025 |
|
|
2024
|
|
|
2023 |
|
|
2022
|
|
|
2021
|
|
|
Prior |
|
|
|
|
|
Revolving
Loans
Converted to
Term
|
|
|
Total |
|
|
Pass
|
|
$
|
383,921
|
|
|
$
|
636,180
|
|
|
$
|
598,103
|
|
|
$
|
874,236
|
|
|
$
|
710,843
|
|
|
$
|
1,390,891
|
|
|
$
|
125,353
|
|
|
$
|
—
|
|
|
$
|
4,719,527
|
|
|
Special Mention
|
|
|
1,029
|
|
|
|
550
|
|
|
|
802
|
|
|
|
2,164
|
|
|
|
714
|
|
|
|
2,627
|
|
|
|
—
|
|
|
|
—
|
|
|
|
7,886
|
|
|
Substandard
|
|
|
65
|
|
|
|
3,081
|
|
|
|
2,386
|
|
|
|
3,902
|
|
|
|
3,913
|
|
|
|
14,419
|
|
|
|
255
|
|
|
|
—
|
|
|
|
28,021
|
|
|
Impaired
|
|
|
—
|
|
|
|
—
|
|
|
|
2,319
|
|
|
|
3,380
|
|
|
|
—
|
|
|
|
1,275
|
|
|
|
—
|
|
|
|
—
|
|
|
|
6,974
|
|
|
Total
|
|
$
|
385,015
|
|
|
$
|
639,811
|
|
|
$
|
603,610
|
|
|
$
|
883,682
|
|
|
$
|
715,470
|
|
|
$
|
1,409,212
|
|
|
$
|
125,608
|
|
|
$
|
—
|
|
|
$
|
4,762,408
|
|
|
% Criticized
|
|
|
0.3
|
%
|
|
|
0.6
|
%
|
|
|
0.9
|
%
|
|
|
1.1
|
%
|
|
|
0.6
|
%
|
|
|
1.3
|
%
|
|
|
0.2
|
%
|
|
|
—
|
%
|
|
|
0.9
|
%
|
|
Gross charge-offs YTD
|
|
$
|
—
|
|
|
$
|
394
|
|
|
$
|
799
|
|
|
$
|
99
|
|
|
$
|
260
|
|
|
$
|
59
|
|
|
$
|
89
|
|
|
$
|
—
|
|
|
$
|
1,700
|
|
| |
|
Commercial Real Estate - Construction, Acquisition, & Development
|
|
| |
|
Period Originated: |
|
|
|
|
|
|
|
|
|
|
| (Dollars in thousands) |
|
2025 |
|
|
2024 |
|
|
2023 |
|
|
2022 |
|
|
2021 |
|
|
Prior |
|
|
|
|
|
Revolving
Loans
Converted to
Term
|
|
|
Total |
|
|
Pass
|
|
$
|
589,148
|
|
|
$
|
1,146,563
|
|
|
$
|
449,097
|
|
|
$
|
725,385
|
|
|
$
|
374,920
|
|
|
$
|
119,101
|
|
|
$
|
48,033
|
|
|
$
|
—
|
|
|
$
|
3,452,247
|
|
|
Special Mention
|
|
|
—
|
|
|
|
1,035
|
|
|
|
174
|
|
|
|
205
|
|
|
|
19
|
|
|
|
201
|
|
|
|
—
|
|
|
|
—
|
|
|
|
1,634
|
|
|
Substandard
|
|
|
—
|
|
|
|
1,114
|
|
|
|
2,027
|
|
|
|
482
|
|
|
|
10
|
|
|
|
593
|
|
|
|
174
|
|
|
|
—
|
|
|
|
4,400
|
|
|
Impaired
|
|
|
—
|
|
|
|
—
|
|
|
|
—
|
|
|
|
—
|
|
|
|
5,777
|
|
|
|
66
|
|
|
|
—
|
|
|
|
—
|
|
|
|
5,843
|
|
|
Total
|
|
$
|
589,148
|
|
|
$
|
1,148,712
|
|
|
$
|
451,298
|
|
|
$
|
726,072
|
|
|
$
|
380,726
|
|
|
$
|
119,961
|
|
|
$
|
48,207
|
|
|
$
|
—
|
|
|
$
|
3,464,124
|
|
|
% Criticized
|
|
|
—
|
%
|
|
|
0.2
|
%
|
|
|
0.5
|
%
|
|
|
0.1
|
%
|
|
|
1.5
|
%
|
|
|
0.7
|
%
|
|
|
0.4
|
%
|
|
|
—
|
%
|
|
|
0.3
|
%
|
|
Gross charge-offs YTD
|
|
$
|
—
|
|
|
$
|
—
|
|
|
$
|
147
|
|
|
$
|
190
|
|
|
$
|
—
|
|
|
$
|
—
|
|
|
$
|
—
|
|
|
$
|
—
|
|
|
$
|
337
|
|
| |
|
Commercial Real Estate - Income Producing
|
|
| |
|
Period Originated: |
|
|
|
|
|
|
|
|
|
|
(Dollars in thousands)
|
|
2025 |
|
|
2024 |
|
|
2023 |
|
|
2022
|
|
|
2021
|
|
|
Prior
|
|
|
Revolving
Loans
|
|
|
Revolving
Loans
Converted to
Term
|
|
|
Total |
|
|
Pass
|
|
$
|
458,394
|
|
|
$
|
632,547
|
|
|
$
|
641,103
|
|
|
$
|
2,019,720
|
|
|
$
|
1,167,784
|
|
|
$
|
1,719,422
|
|
|
$
|
137,991
|
|
|
$
|
—
|
|
|
$
|
6,776,961
|
|
|
Special Mention
|
|
|
—
|
|
|
|
—
|
|
|
|
1,921
|
|
|
|
35,289
|
|
|
|
15,160
|
|
|
|
718
|
|
|
|
—
|
|
|
|
—
|
|
|
|
53,088
|
|
|
Substandard
|
|
|
—
|
|
|
|
—
|
|
|
|
1,383
|
|
|
|
3,938
|
|
|
|
23,453
|
|
|
|
160,045
|
|
|
|
160
|
|
|
|
—
|
|
|
|
188,979
|
|
|
Impaired
|
|
|
—
|
|
|
|
—
|
|
|
|
—
|
|
|
|
—
|
|
|
|
—
|
|
|
|
2,218
|
|
|
|
—
|
|
|
|
—
|
|
|
|
2,218
|
|
|
PCD (Loss)
|
|
|
—
|
|
|
|
—
|
|
|
|
—
|
|
|
|
4,293
|
|
|
|
—
|
|
|
|
—
|
|
|
|
—
|
|
|
|
—
|
|
|
|
4,293
|
|
|
Total
|
|
$
|
458,394
|
|
|
$
|
632,547
|
|
|
$
|
644,407
|
|
|
$
|
2,063,240
|
|
|
$
|
1,206,397
|
|
|
$
|
1,882,403
|
|
|
$
|
138,151
|
|
|
$
|
—
|
|
|
$
|
7,025,539
|
|
|
% Criticized
|
|
|
—
|
%
|
|
|
—
|
%
|
|
|
0.5
|
%
|
|
|
2.1
|
%
|
|
|
3.2
|
%
|
|
|
8.7
|
%
|
|
|
0.1
|
%
|
|
|
—
|
%
|
|
|
3.5
|
%
|
|
Gross charge-offs YTD
|
|
$
|
—
|
|
|
$
|
—
|
|
|
$
|
252
|
|
|
$
|
662
|
|
|
$
|
240
|
|
|
$
|
3,631
|
|
|
$
|
—
|
|
|
$
|
—
|
|
|
$
|
4,785
|
|
| |
|
Consumer - Residential Mortgages
|
|
| |
|
Period Originated: |
|
|
|
|
|
|
|
|
|
|
| (Dollars in thousands) |
|
2025
|
|
|
2024
|
|
|
2023
|
|
|
2022 |
|
|
2021
|
|
|
Prior
|
|
|
Revolving
Loans
|
|
|
Revolving
Loans
Converted to
Term
|
|
|
Total |
|
|
Pass
|
|
$
|
945,749
|
|
|
$
|
1,337,190
|
|
|
$
|
1,464,185
|
|
|
$
|
1,924,223
|
|
|
$
|
1,461,028
|
|
|
$
|
2,536,343
|
|
|
$
|
1,177,948
|
|
|
$
|
1,201
|
|
|
$
|
10,847,867
|
|
|
Special Mention
|
|
|
945
|
|
|
|
483
|
|
|
|
950
|
|
|
|
3,037
|
|
|
|
813
|
|
|
|
2,570
|
|
|
|
210
|
|
|
|
—
|
|
|
|
9,008
|
|
|
Substandard
|
|
|
42
|
|
|
|
1,467
|
|
|
|
10,376
|
|
|
|
16,462
|
|
|
|
16,333
|
|
|
|
40,785
|
|
|
|
3,792
|
|
|
|
—
|
|
|
|
89,257
|
|
|
Impaired
|
|
|
—
|
|
|
|
—
|
|
|
|
1,222
|
|
|
|
—
|
|
|
|
174
|
|
|
|
2,679
|
|
|
|
—
|
|
|
|
—
|
|
|
|
4,075
|
|
|
PCD (Loss)
|
|
|
—
|
|
|
|
—
|
|
|
|
—
|
|
|
|
—
|
|
|
|
—
|
|
|
|
1,411
|
|
|
|
—
|
|
|
|
—
|
|
|
|
1,411
|
|
|
Total
|
|
$
|
946,736
|
|
|
$
|
1,339,140
|
|
|
$
|
1,476,733
|
|
|
$
|
1,943,722
|
|
|
$
|
1,478,348
|
|
|
$
|
2,583,788
|
|
|
$
|
1,181,950
|
|
|
$
|
1,201
|
|
|
$
|
10,951,618
|
|
|
% Criticized
|
|
|
0.1
|
%
|
|
|
0.1
|
%
|
|
|
0.8
|
%
|
|
|
1.0
|
%
|
|
|
1.2
|
%
|
|
|
1.8
|
%
|
|
|
0.3
|
%
|
|
|
—
|
%
|
|
|
0.9
|
%
|
|
Gross charge-offs YTD
|
|
$
|
—
|
|
|
$
|
78
|
|
|
$
|
234
|
|
|
$
|
1,514
|
|
|
$
|
645
|
|
|
$
|
402
|
|
|
$
|
367
|
|
|
$
|
—
|
|
|
$
|
3,240
|
|
| |
|
Consumer - Other Consumer
|
|
| |
|
Period Originated: |
|
|
|
|
|
|
|
|
|
| (Dollars in thousands) |
|
2025 |
|
|
2024 |
|
|
2023 |
|
|
2022 |
|
|
2021 |
|
|
Prior |
|
|
Revolving
Loans
|
|
|
Revolving
Loans
Converted to
Term
|
|
|
Total |
|
|
Pass
|
|
$
|
33,199
|
|
|
$
|
30,926
|
|
|
$
|
20,764
|
|
|
$
|
7,071
|
|
|
$
|
4,069
|
|
|
$
|
3,715
|
|
|
$
|
111,978
|
|
|
$
|
—
|
|
|
$
|
211,722
|
|
|
Substandard
|
|
|
—
|
|
|
|
129
|
|
|
|
193
|
|
|
|
2
|
|
|
|
29
|
|
|
|
5
|
|
|
|
318
|
|
|
|
—
|
|
|
|
676
|
|
|
Total
|
|
$
|
33,199
|
|
|
$
|
31,055
|
|
|
$
|
20,957
|
|
|
$
|
7,073
|
|
|
$
|
4,098
|
|
|
$
|
3,720
|
|
|
$
|
112,296
|
|
|
$
|
—
|
|
|
$
|
212,398
|
|
|
% Criticized
|
|
|
—
|
%
|
|
|
0.4
|
%
|
|
|
0.9
|
%
|
|
|
—
|
%
|
|
|
0.7
|
%
|
|
|
0.1
|
%
|
|
|
0.3
|
%
|
|
|
—
|
%
|
|
|
0.3
|
%
|
|
Gross charge-offs YTD
|
|
$
|
1,296
|
|
|
$
|
207
|
|
|
$
|
120
|
|
|
$
|
76
|
|
|
$
|
7
|
|
|
$
|
52
|
|
|
$
|
1,502
|
|
|
$
|
—
|
|
|
$
|
3,260
|
|
The following tables provide credit quality indicators, including gross charge-offs, by class and period of origination (vintage) at December 31, 2024.
| |
|
Commercial and Industrial - Non-Real Estate
|
|
| |
|
Period Originated: |
|
|
|
|
|
|
|
|
|
|
(Dollars in thousands)
|
|
2024 |
|
|
2023 |
|
|
2022 |
|
|
2021 |
|
|
2020 |
|
|
Prior |
|
|
Revolving
Loans
|
|
|
Revolving
Loans
Converted to
Term
|
|
|
Total |
|
|
Pass
|
|
$
|
1,361,684
|
|
|
$
|
926,422
|
|
|
$
|
1,036,579
|
|
|
$
|
695,625
|
|
|
$
|
209,100
|
|
|
$
|
563,337
|
|
|
$
|
3,397,031
|
|
|
$
|
18,398
|
|
|
$
|
8,208,176
|
|
|
Special Mention
|
|
|
13,242
|
|
|
|
10,942
|
|
|
|
—
|
|
|
|
23,158
|
|
|
|
18,337
|
|
|
|
—
|
|
|
|
41,317
|
|
|
|
—
|
|
|
|
106,996
|
|
|
Substandard
|
|
|
8,855
|
|
|
|
49,842
|
|
|
|
70,136
|
|
|
|
43,832
|
|
|
|
12,370
|
|
|
|
27,648
|
|
|
|
75,638
|
|
|
|
22,775
|
|
|
|
311,096
|
|
|
Doubtful
|
|
|
—
|
|
|
|
—
|
|
|
|
—
|
|
|
|
8,743
|
|
|
|
—
|
|
|
|
—
|
|
|
|
—
|
|
|
|
—
|
|
|
|
8,743
|
|
|
Impaired
|
|
|
—
|
|
|
|
1,485
|
|
|
|
2,773
|
|
|
|
9,013
|
|
|
|
—
|
|
|
|
—
|
|
|
|
18,725
|
|
|
|
—
|
|
|
|
31,996
|
|
|
PCD (Loss)
|
|
|
—
|
|
|
|
—
|
|
|
|
—
|
|
|
|
—
|
|
|
|
—
|
|
|
|
3,522
|
|
|
|
—
|
|
|
|
—
|
|
|
|
3,522
|
|
|
Total
|
|
$
|
1,383,781
|
|
|
$
|
988,691
|
|
|
$
|
1,109,488
|
|
|
$
|
780,371
|
|
|
$
|
239,807
|
|
|
$
|
594,507
|
|
|
$
|
3,532,711
|
|
|
$
|
41,173
|
|
|
$
|
8,670,529
|
|
|
% Criticized
|
|
|
1.6
|
%
|
|
|
6.3
|
%
|
|
|
6.6
|
%
|
|
|
10.9
|
%
|
|
|
12.8
|
%
|
|
|
5.2
|
%
|
|
|
3.8
|
%
|
|
|
55.3
|
%
|
|
|
5.3
|
%
|
|
Gross charge-offs YTD
|
|
$
|
1,892
|
|
|
$
|
7,811
|
|
|
$
|
22,112
|
|
|
$
|
15,703
|
|
|
$
|
956
|
|
|
$
|
16,786
|
|
|
$
|
7,416
|
|
|
$
|
4,018
|
|
|
$
|
76,694
|
|
| |
|
Commercial and Industrial - Owner Occupied
|
|
| |
|
Period Originated: |
|
|
|
|
|
|
|
|
|
|
| (Dollars in thousands) |
|
2024
|
|
|
2023
|
|
|
2022
|
|
|
2021 |
|
|
2020
|
|
|
Prior
|
|
|
Revolving
Loans
|
|
|
Revolving
Loans
Converted to
Term
|
|
|
Total |
|
|
Pass
|
|
$
|
704,999
|
|
|
$
|
607,548
|
|
|
$
|
893,114
|
|
|
$
|
756,156
|
|
|
$
|
402,671
|
|
|
$
|
1,122,908
|
|
|
$
|
123,149
|
|
|
$
|
230
|
|
|
$
|
4,610,775
|
|
|
Special Mention
|
|
|
—
|
|
|
|
—
|
|
|
|
—
|
|
|
|
—
|
|
|
|
815
|
|
|
|
—
|
|
|
|
—
|
|
|
|
—
|
|
|
|
815
|
|
|
Substandard
|
|
|
2,249
|
|
|
|
5,616
|
|
|
|
6,638
|
|
|
|
5,204
|
|
|
|
2,057
|
|
|
|
18,889
|
|
|
|
710
|
|
|
|
—
|
|
|
|
41,363
|
|
|
Impaired
|
|
|
394
|
|
|
|
2,335
|
|
|
|
5,911
|
|
|
|
1,053
|
|
|
|
—
|
|
|
|
1,275
|
|
|
|
—
|
|
|
|
—
|
|
|
|
10,968
|
|
|
PCD (Loss)
|
|
|
—
|
|
|
|
—
|
|
|
|
—
|
|
|
|
—
|
|
|
|
—
|
|
|
|
1,094
|
|
|
|
—
|
|
|
|
—
|
|
|
|
1,094
|
|
|
Total
|
|
$
|
707,642
|
|
|
$
|
615,499
|
|
|
$
|
905,663
|
|
|
$
|
762,413
|
|
|
$
|
405,543
|
|
|
$
|
1,144,166
|
|
|
$
|
123,859
|
|
|
$
|
230
|
|
|
$
|
4,665,015
|
|
|
% Criticized
|
|
|
0.4
|
%
|
|
|
1.3
|
%
|
|
|
1.4
|
%
|
|
|
0.8
|
%
|
|
|
0.7
|
%
|
|
|
1.9
|
%
|
|
|
0.6
|
%
|
|
|
—
|
%
|
|
|
1.2
|
%
|
|
Gross charge-offs YTD
|
|
$
|
—
|
|
|
$
|
1
|
|
|
$
|
263
|
|
|
$
|
6
|
|
|
$
|
41
|
|
|
$
|
67
|
|
|
$
|
1
|
|
|
$
|
—
|
|
|
$
|
379
|
|
| |
|
Commercial Real Estate - Construction, Acquisition & Development
|
|
| |
|
Period Originated: |
|
|
|
|
|
|
|
|
|
|
|
(Dollars in thousands)
|
|
2024 |
|
|
2023 |
|
|
2022 |
|
|
2021 |
|
|
2020 |
|
|
Prior |
|
|
Revolving
Loans
|
|
|
Revolving
Loans
Converted to
Term
|
|
|
Total |
|
|
Pass
|
|
$
|
1,058,203
|
|
|
$
|
790,695
|
|
|
$
|
1,261,256
|
|
|
$
|
592,454
|
|
|
$
|
50,123
|
|
|
$
|
76,347
|
|
|
$
|
64,061
|
|
|
$
|
3,717
|
|
|
$
|
3,896,856
|
|
|
Substandard
|
|
|
264
|
|
|
|
2,032
|
|
|
|
3,514
|
|
|
|
5,889
|
|
|
|
304
|
|
|
|
259
|
|
|
|
—
|
|
|
|
—
|
|
|
|
12,262
|
|
|
Impaired
|
|
|
—
|
|
|
|
—
|
|
|
|
—
|
|
|
|
—
|
|
|
|
66
|
|
|
|
—
|
|
|
|
—
|
|
|
|
—
|
|
|
|
66
|
|
|
Total
|
|
$
|
1,058,467
|
|
|
$
|
792,727
|
|
|
$
|
1,264,770
|
|
|
$
|
598,343
|
|
|
$
|
50,493
|
|
|
$
|
76,606
|
|
|
$
|
64,061
|
|
|
$
|
3,717
|
|
|
$
|
3,909,184
|
|
|
% Criticized
|
|
|
—
|
%
|
|
|
0.3
|
%
|
|
|
0.3
|
%
|
|
|
1.0
|
%
|
|
|
0.7
|
%
|
|
|
0.3
|
%
|
|
|
—
|
%
|
|
|
—
|
%
|
|
|
0.3
|
%
|
|
Gross charge-offs YTD
|
|
$
|
—
|
|
|
$
|
19
|
|
|
$
|
101
|
|
|
$
|
537
|
|
|
$
|
35
|
|
|
$
|
2
|
|
|
$
|
85
|
|
|
$
|
—
|
|
|
$
|
779
|
|
| |
|
Commercial Real Estate - Income Producing
|
|
| |
|
Period Originated: |
|
|
|
|
|
|
|
|
|
|
| (Dollars in thousands) |
|
2024 |
|
|
2023 |
|
|
2022
|
|
|
2021
|
|
|
2020
|
|
|
Prior |
|
|
Revolving
Loans
|
|
|
Revolving
Loans
Converted to
Term
|
|
|
Total |
|
|
Pass
|
|
$
|
497,633
|
|
|
$
|
540,956
|
|
|
$
|
1,595,416
|
|
|
$
|
1,192,329
|
|
|
$
|
511,254
|
|
|
$
|
1,404,264
|
|
|
$
|
108,850
|
|
|
$
|
—
|
|
|
$
|
5,850,702
|
|
|
Special Mention
|
|
|
—
|
|
|
|
—
|
|
|
|
2,881
|
|
|
|
—
|
|
|
|
—
|
|
|
|
—
|
|
|
|
2,213
|
|
|
|
—
|
|
|
|
5,094
|
|
|
Substandard
|
|
|
—
|
|
|
|
459
|
|
|
|
468
|
|
|
|
7,690
|
|
|
|
70,889
|
|
|
|
64,084
|
|
|
|
494
|
|
|
|
—
|
|
|
|
144,084
|
|
|
Impaired
|
|
|
—
|
|
|
|
—
|
|
|
|
4,885
|
|
|
|
1,114
|
|
|
|
—
|
|
|
|
9,894
|
|
|
|
—
|
|
|
|
—
|
|
|
|
15,893
|
|
|
Total
|
|
$
|
497,633
|
|
|
$
|
541,415
|
|
|
$
|
1,603,650
|
|
|
$
|
1,201,133
|
|
|
$
|
582,143
|
|
|
$
|
1,478,242
|
|
|
$
|
111,557
|
|
|
$
|
—
|
|
|
$
|
6,015,773
|
|
|
% Criticized
|
|
|
—
|
%
|
|
|
0.1
|
%
|
|
|
0.5
|
%
|
|
|
0.7
|
%
|
|
|
12.2
|
%
|
|
|
5.0
|
%
|
|
|
2.4
|
%
|
|
|
—
|
%
|
|
|
2.7
|
%
|
|
Gross charge-offs YTD
|
|
$
|
—
|
|
|
$
|
—
|
|
|
$
|
3
|
|
|
$
|
21
|
|
|
$
|
—
|
|
|
$
|
2,479
|
|
|
$
|
—
|
|
|
$
|
—
|
|
|
$
|
2,503
|
|
|
|
Consumer - Residential Mortgages
|
|
| |
|
Period Originated: |
|
|
|
|
|
|
|
|
|
|
| (Dollars in thousands) |
|
2024
|
|
|
2023 |
|
|
2022 |
|
|
2021
|
|
|
2020
|
|
|
Prior
|
|
|
Revolving
Loans
|
|
|
Revolving
Loans
Converted to
Term
|
|
|
Total |
|
|
Pass
|
|
$
|
1,356,015
|
|
|
$
|
1,477,090
|
|
|
$
|
1,991,600
|
|
|
$
|
1,545,259
|
|
|
$
|
992,426
|
|
|
$
|
1,734,512
|
|
|
$
|
1,069,608
|
|
|
$
|
1,320
|
|
|
$
|
10,167,830
|
|
|
Special Mention
|
|
|
101
|
|
|
|
790
|
|
|
|
—
|
|
|
|
—
|
|
|
|
—
|
|
|
|
—
|
|
|
|
—
|
|
|
|
—
|
|
|
|
891
|
|
|
Substandard
|
|
|
1,549
|
|
|
|
12,696
|
|
|
|
18,477
|
|
|
|
14,661
|
|
|
|
9,145
|
|
|
|
28,774
|
|
|
|
4,295
|
|
|
|
—
|
|
|
|
89,597
|
|
|
Impaired
|
|
|
—
|
|
|
|
—
|
|
|
|
—
|
|
|
|
3,979
|
|
|
|
1,675
|
|
|
|
—
|
|
|
|
2,500
|
|
|
|
—
|
|
|
|
8,154
|
|
|
PCD (Loss)
|
|
|
—
|
|
|
|
—
|
|
|
|
—
|
|
|
|
—
|
|
|
|
—
|
|
|
|
1,411
|
|
|
|
—
|
|
|
|
—
|
|
|
|
1,411
|
|
|
Total
|
|
$
|
1,357,665
|
|
|
$
|
1,490,576
|
|
|
$
|
2,010,077
|
|
|
$
|
1,563,899
|
|
|
$
|
1,003,246
|
|
|
$
|
1,764,697
|
|
|
$
|
1,076,403
|
|
|
$
|
1,320
|
|
|
$
|
10,267,883
|
|
|
% Criticized
|
|
|
0.1
|
%
|
|
|
0.9
|
%
|
|
|
0.9
|
%
|
|
|
1.2
|
%
|
|
|
1.1
|
%
|
|
|
1.7
|
%
|
|
|
0.6
|
%
|
|
|
—
|
%
|
|
|
1.0
|
%
|
|
Gross charge-offs YTD
|
|
$
|
10
|
|
|
$
|
325
|
|
|
$
|
559
|
|
|
$
|
430
|
|
|
$
|
81
|
|
|
$
|
749
|
|
|
$
|
1,007
|
|
|
$
|
—
|
|
|
$
|
3,161
|
|
| |
|
Consumer - Other Consumer
|
|
| |
|
Period Originated: |
|
|
|
|
|
|
|
|
|
|
|
|
|
|
(Dollars in thousands)
|
|
2024 |
|
|
2023 |
|
|
2022 |
|
|
2021 |
|
|
2020 |
|
|
Prior |
|
|
Revolving
Loans
|
|
|
Revolving
Loans
Converted to
Term
|
|
|
Total |
|
|
Pass
|
|
$
|
45,997
|
|
|
$
|
29,538
|
|
|
$
|
11,471
|
|
|
$
|
6,150
|
|
|
$
|
3,263
|
|
|
$
|
2,105
|
|
|
$
|
114,341
|
|
|
$
|
—
|
|
|
$
|
212,865
|
|
|
Substandard
|
|
|
—
|
|
|
|
97
|
|
|
|
48
|
|
|
|
6
|
|
|
|
—
|
|
|
|
17
|
|
|
|
338
|
|
|
|
—
|
|
|
|
506
|
|
|
Total
|
|
$
|
45,997
|
|
|
$
|
29,635
|
|
|
$
|
11,519
|
|
|
$
|
6,156
|
|
|
$
|
3,263
|
|
|
$
|
2,122
|
|
|
$
|
114,679
|
|
|
$
|
—
|
|
|
$
|
213,371
|
|
|
% Criticized
|
|
|
—
|
%
|
|
|
0.3
|
%
|
|
|
0.4
|
%
|
|
|
0.1
|
%
|
|
|
—
|
%
|
|
|
0.8
|
%
|
|
|
0.3
|
%
|
|
|
—
|
%
|
|
|
0.2
|
%
|
|
Gross charge-offs YTD
|
|
$
|
3,067
|
|
|
$
|
395
|
|
|
$
|
303
|
|
|
$
|
145
|
|
|
$
|
14
|
|
|
$
|
47
|
|
|
$
|
2,917
|
|
|
$
|
—
|
|
|
$
|
6,888
|
|
The Company’s collateral-dependent loans totaled $55.7 million and $81.8 million at June 30, 2025 and December 31, 2024, respectively. Typically these loans are internally
classified as “Impaired” and “PCD Loss.” At June 30, 2025 and December 31, 2024, $8.4 million and $8.7 million, respectively, of these loans were classified as doubtful. At June 30, 2025, most of these loans are within the
non-real estate class. Additionally, there were smaller amounts of these loans in the owner occupied, income producing, CAD, and residential mortgages classes. C&I loans are typically supported by collateral such as real
estate, receivables, equipment, inventory, or by an enterprise valuation. Loans within the CRE and Consumer segments are generally secured by commercial and residential real estate.
Loans of $1.5 million or greater are considered for specific provision when management has determined based on current information and events, it is probable that the Company
will be unable to collect all amounts due according to the contractual terms of the note and that the loan is collateral-dependent. At June 30, 2025 and December 31, 2024, $42.2 million and $59.1 million, respectively, of
collateral-dependent loans had a valuation allowance of $11.9 million and $17.3 million, respectively. The remaining balance of collateral-dependent loans of $13.5 million and $22.7 million at June 30, 2025 and December 31,
2024, respectively, have sufficient collateral supporting the collection of all contractual principal and interest or were charged down to the underlying collateral’s fair value, less estimated selling costs. Therefore, such
loans did not have an associated valuation allowance.
NPLs consist of nonaccrual loans and leases. At June 30, 2025 and December 31, 2024, NPLs totaled $231.2 million and $264.7 million, respectively. Within the NPL balance,
$94.0 million of the June 30, 2025 balance and $89.9 million of the December 31, 2024 balance is covered by government guarantees from the SBA, FHA, VA or USDA.
The Company’s policy for all loan classifications provides that loans and leases are generally placed in nonaccrual status if, in management’s opinion, payment in full of
principal or interest is not expected, unless such loan or lease is both well-secured and in the process of collection.
The following table presents the amortized cost basis of loans on nonaccrual status by segment and class at the periods indicated:
|
|
June 30, 2025
|
|
|
December 31, 2024
|
|
| |
|
|
|
|
|
|
|
|
|
|
|
|
|
(In thousands)
|
|
Nonaccrual Loans
|
|
|
Nonaccrual Loans
Allowance
|
|
|
Nonaccrual Loans
|
|
|
Nonaccrual Loans
Allowance
|
|
|
Commercial and industrial
|
|
|
|
|
|
|
|
|
|
|
|
|
|
Non-real estate
|
|
$
|
123,960
|
|
|
$
|
1,162
|
|
|
$
|
145,115
|
|
|
$
|
2,944
|
|
|
Owner occupied
|
|
|
18,158
|
|
|
|
1,212
|
|
|
|
16,904
|
|
|
|
5,128
|
|
|
Total commercial and industrial
|
|
|
142,118
|
|
|
|
2,374
|
|
|
|
162,019
|
|
|
|
8,072
|
|
|
Commercial real estate
|
|
|
|
|
|
|
|
|
|
|
|
|
|
|
|
|
|
Construction, acquisition and development
|
|
|
9,307
|
|
|
|
5,843
|
|
|
|
8,600
|
|
|
|
66
|
|
|
Income producing
|
|
|
4,379
|
|
|
|
2,219
|
|
|
|
18,542
|
|
|
|
6,569
|
|
|
Total commercial real estate
|
|
|
13,686
|
|
|
|
8,062
|
|
|
|
27,142
|
|
|
|
6,635
|
|
|
Consumer
|
|
|
|
|
|
|
|
|
|
|
|
|
|
|
|
|
|
Residential mortgages
|
|
|
75,076
|
|
|
|
174
|
|
|
|
75,287
|
|
|
|
3,979
|
|
|
Other consumer
|
|
|
363
|
|
|
|
—
|
|
|
|
244
|
|
|
|
—
|
|
|
Total consumer
|
|
|
75,439
|
|
|
|
174
|
|
|
|
75,531
|
|
|
|
3,979
|
|
|
Total
|
|
$
|
231,243
|
|
|
$
|
10,610
|
|
|
$
|
264,692
|
|
|
$
|
18,686
|
|
The following table presents the interest income recognized on loans on nonaccrual status by segment and class for the periods indicated:
| |
|
Three Months Ended June 30,
|
|
|
Six Months Ended June 30,
|
|
|
(In thousands)
|
|
2025
|
|
|
2024
|
|
|
2025
|
|
|
2024
|
|
|
Commercial and industrial
|
|
|
|
|
|
|
|
|
|
|
|
|
|
Non-real estate
|
|
$
|
745
|
|
|
$
|
583
|
|
|
$
|
1,192
|
|
|
$
|
1,180
|
|
|
Owner occupied
|
|
|
318
|
|
|
|
65
|
|
|
|
353
|
|
|
|
137
|
|
|
Total commercial and industrial
|
|
|
1,063
|
|
|
|
648
|
|
|
|
1,545
|
|
|
|
1,317
|
|
|
Commercial real estate
|
|
|
|
|
|
|
|
|
Construction, acquisition and development
|
|
|
13
|
|
|
|
25
|
|
|
|
32
|
|
|
|
46
|
|
|
Income producing
|
|
|
58
|
|
|
|
25
|
|
|
|
297
|
|
|
|
65
|
|
|
Total commercial real estate
|
|
|
71
|
|
|
|
50
|
|
|
|
329
|
|
|
|
111
|
|
|
Consumer
|
|
|
|
|
|
|
|
|
|
|
|
|
|
|
|
|
|
Residential mortgages
|
|
|
499
|
|
|
|
543
|
|
|
|
1,159
|
|
|
|
941
|
|
|
Other consumer
|
|
|
11
|
|
|
|
1
|
|
|
|
12
|
|
|
|
1
|
|
|
Total consumer
|
|
|
510
|
|
|
|
544
|
|
|
|
1,171
|
|
|
|
942
|
|
|
Total
|
|
$
|
1,644
|
|
|
$
|
1,242
|
|
|
$
|
3,045
|
|
|
$
|
2,370
|
|
In the ordinary course of business, management may grant concessions, which would not otherwise be considered, to borrowers that are experiencing financial difficulty. Loans
identified as meeting the criteria under ASC 310 are identified as FDM. Any modification, renewal or forbearance on loans assigned a rating of “Special Mention” or worse, and loans of any rating which show evidence of financial
difficulty is reviewed to determine whether the borrower is experiencing financial difficulty and if so, which terms of the loan were modified. If the borrower is experiencing financial difficulty and the loan is modified via
forgiveness of principal, reduction in interest rate to a rate below current market rates for issuance, payment extension or deferral for greater than six months (including extensions granted in the past 12 months), term or maturity
date extension, or combination of these specific modification terms, the modification requires disclosure.
Under general loan modification guidance, a modification is treated as a new loan only if both of the following conditions are met: 1) the terms of the new loan are at least as
favorable to the lender as the terms for comparable loans to other customers with similar collection risks, and 2) modifications to the terms of the original loan are more than minor. If either condition is not met, the modification
is accounted for as the continuation of the old loan with any effect of the modification treated as a prospective adjustment to the loan’s EIR. Modifications in scope for borrowers experiencing financial difficulty may include
principal forgiveness, other-than-insignificant payment delay, interest rate reduction, or a combination of modifications. During the six months ended June 30, 2025, the most common individual concessions were related to term
extensions and payment deferrals. Other concessions included interest rate reductions. At June 30, 2025, the Company has an outstanding unfunded commitment balance of $16.3 million to lend to three borrowers experiencing financial
difficulty.
Upon determination by the Company that a modified loan (or portion of a loan) has subsequently been deemed uncollectible, the loan (or portion of the loan) is charged off. The
amortized cost basis of the loan is reduced by the uncollectible amount and the ACL is adjusted by this amount.
The following tables presents loans that were modified within the past three and six months for borrowers experiencing financial difficulty by segment and class, as well as the
percentage of these modified loans compared to overall loans in each segment and class, for the three and six months ended June 30, 2025 and June 30, 2024:
|
|
Three Months Ended June 30, 2025
|
|
| (Dollars in thousands) |
|
Payment Deferral
|
|
|
Term
Extension
|
|
|
Interest Rate Reduction
|
|
|
Combination Interest Rate Reduction and Payment Deferral |
|
|
Combination
Term Extension
and Interest
Rate Reduction
|
|
|
Percent of
Total Loan
Class
|
|
| |
|
|
|
|
|
|
|
|
|
|
|
|
|
|
|
|
|
|
|
Commercial and industrial
|
|
|
|
|
|
|
|
|
|
|
|
|
|
|
|
|
|
|
|
Non-real estate
|
|
$
|
17,991
|
|
|
$
|
19,458
|
|
|
$
|
265
|
|
|
$
|
175
|
|
|
$
|
4,114
|
|
|
|
0.46
|
%
|
|
Owner occupied
|
|
|
856
|
|
|
|
—
|
|
|
|
—
|
|
|
|
—
|
|
|
|
—
|
|
|
|
0.02
|
%
|
|
Total commercial and industrial
|
|
|
18,847
|
|
|
|
19,458
|
|
|
|
265
|
|
|
|
175
|
|
|
|
4,114
|
|
|
|
0.31
|
%
|
|
Total loans and leases, net of unearned income
|
|
$
|
18,847
|
|
|
$
|
19,458
|
|
|
$
|
265
|
|
|
$
|
175
|
|
|
$
|
4,114
|
|
|
|
0.12
|
%
|
| |
|
Three Months Ended June 30, 2024
|
|
| (Dollars in thousands) |
|
Payment Deferral
and Term Extension
|
|
|
Term
Extension
|
|
|
Interest Rate Reduction
|
|
|
Combination
Interest Rate
Reduction and
Payment Deferral
|
|
|
Combination
Term Extension
and Interest
Rate Reduction
|
|
|
Percent of
Total Loan
Class
|
|
| Commercial and industrial |
|
|
|
|
|
|
|
|
|
|
|
|
|
|
|
|
|
|
|
|
|
|
|
|
|
Non-real estate
|
|
$
|
6,996
|
|
|
$
|
12,035
|
|
|
$
|
—
|
|
|
$
|
117
|
|
|
$
|
5,480
|
|
|
|
0.27
|
%
|
|
Owner occupied
|
|
|
—
|
|
|
|
1,588
|
|
|
|
—
|
|
|
|
—
|
|
|
|
—
|
|
|
|
0.24
|
%
|
|
Total commercial and industrial
|
|
|
6,966
|
|
|
|
13,623
|
|
|
|
|
|
|
|
117
|
|
|
|
5,480
|
|
|
|
0.19
|
%
|
|
Commercial real estate
|
|
|
|
|
|
|
|
|
|
|
|
|
|
|
|
|
|
|
|
|
|
|
|
|
|
Income producing
|
|
|
— |
|
|
|
43,967
|
|
|
|
—
|
|
|
|
—
|
|
|
|
—
|
|
|
|
0.75
|
%
|
|
Total commercial real estate
|
|
|
— |
|
|
|
43,967
|
|
|
|
—
|
|
|
|
—
|
|
|
|
—
|
|
|
|
0.45
|
%
|
|
|
|
|
|
|
|
|
|
|
|
|
|
|
|
|
|
|
|
|
|
|
|
|
|
|
|
Residential mortgages
|
|
|
— |
|
|
|
85 |
|
|
|
65 |
|
|
|
100 |
|
|
|
—
|
|
|
|
— |
%
|
|
Other consumer
|
|
|
20 |
|
|
|
— |
|
|
|
— |
|
|
|
— |
|
|
|
—
|
|
|
|
0.01 |
%
|
|
|
|
|
20 |
|
|
|
85 |
|
|
|
65
|
|
|
|
100 |
|
|
|
—
|
|
|
|
— |
%
|
|
Total loans and leases, net of unearned
income
|
|
$
|
6,986 |
|
|
$
|
57,675 |
|
|
$
|
65
|
|
|
$
|
217
|
|
|
$
|
5,480
|
|
|
|
0.21 |
%
|
| |
|
Six Months Ended June 30, 2025 |
|
| (Dollars in thousands) |
|
Payment Deferral
|
|
|
Term
Extension
|
|
|
Interest Rate Reduction
|
|
|
Combination
Interest Rate
Reduction and
Payment Deferral
|
|
|
Combination
Term Extension
and Interest
Rate Reduction
|
|
|
Percent of
Total Loan
Class
|
|
|
Commercial and industrial
|
|
|
|
|
|
|
|
|
|
|
|
|
|
|
|
|
|
|
|
Non-real estate
|
|
$
|
18,375
|
|
|
$
|
26,414
|
|
|
$
|
265
|
|
|
$
|
175
|
|
|
$
|
40,599
|
|
|
|
0.95
|
%
|
|
Owner occupied
|
|
|
856
|
|
|
|
—
|
|
|
|
—
|
|
|
|
—
|
|
|
|
—
|
|
|
|
0.02
|
%
|
|
Total commercial and industrial
|
|
|
19,231
|
|
|
|
26,414
|
|
|
|
265
|
|
|
|
175
|
|
|
|
40,599
|
|
|
|
0.63
|
%
|
|
Consumer
|
|
|
|
|
|
|
|
|
|
|
|
|
|
|
|
|
|
|
|
|
|
|
|
|
|
Residential mortgages
|
|
|
284 |
|
|
|
—
|
|
|
|
—
|
|
|
|
486
|
|
|
|
—
|
|
|
|
0.01
|
%
|
|
Total consumer
|
|
|
284 |
|
|
|
—
|
|
|
|
—
|
|
|
|
486
|
|
|
|
—
|
|
|
|
0.01
|
%
|
Total loans and leases, net of unearned income
|
|
$ |
19,515 |
|
|
$
|
26,414
|
|
|
$
|
265
|
|
|
$
|
661
|
|
|
$
|
40,599
|
|
|
|
0.25
|
%
|
| |
|
Six Months Ended June 30, 2024 |
|
|
(Dollars in thousands)
|
|
Principal
Forgiveness
|
|
|
Payment
Deferral and
Term
Extension
|
|
|
Term
Extension
|
|
|
Interest
Rate
Reduction
|
|
|
Combination
Interest Rate
Reduction
and Payment
Deferral
|
|
|
Combination
Term
Extension and
|
|
|
Combination Term Extension,
Payment Deferral and
Interest Rate
Reduction
|
|
|
|
|
|
Commercial and industrial
|
|
|
|
|
|
|
|
|
|
|
|
|
|
|
|
|
|
|
|
|
|
|
|
|
|
Non-real estate
|
|
$ |
13,546 |
|
|
$
|
6,966
|
|
|
$
|
23,142
|
|
|
$
|
—
|
|
|
$
|
117
|
|
|
$
|
8,252
|
|
|
$
|
—
|
|
|
|
0.57
|
%
|
|
Owner occupied
|
|
|
— |
|
|
|
—
|
|
|
|
1,588
|
|
|
|
—
|
|
|
|
—
|
|
|
|
1,370
|
|
|
|
—
|
|
|
|
0.07
|
|
|
Total commercial and industrial
|
|
|
13,546 |
|
|
|
6,966
|
|
|
|
24,730
|
|
|
|
—
|
|
|
|
117
|
|
|
|
9,622
|
|
|
|
—
|
|
|
|
0.40
|
|
|
Commercial real estate
|
|
|
|
|
|
|
|
|
|
|
|
|
|
|
|
|
|
|
|
|
|
|
|
|
|
|
|
|
|
|
|
|
|
Income producing
|
|
|
— |
|
|
|
—
|
|
|
|
45,927
|
|
|
|
—
|
|
|
|
—
|
|
|
|
—
|
|
|
|
12,786
|
|
|
|
1.00
|
|
|
Total commercial real estate
|
|
|
— |
|
|
|
—
|
|
|
|
45,927
|
|
|
|
—
|
|
|
|
—
|
|
|
|
—
|
|
|
|
12,786
|
|
|
|
0.60
|
|
|
Consumer
|
|
|
|
|
|
|
|
|
|
|
|
|
|
|
|
|
|
|
|
|
|
|
|
|
|
|
|
|
|
|
|
|
|
Residential mortgages
|
|
|
— |
|
|
|
—
|
|
|
|
210
|
|
|
|
180
|
|
|
|
100
|
|
|
|
611
|
|
|
|
—
|
|
|
|
0.01
|
|
|
Other consumer
|
|
|
— |
|
|
|
20
|
|
|
|
—
|
|
|
|
—
|
|
|
|
—
|
|
|
|
—
|
|
|
|
—
|
|
|
|
0.01
|
|
|
Total consumer
|
|
|
|
|
|
|
20
|
|
|
|
210
|
|
|
|
180
|
|
|
|
100
|
|
|
|
611
|
|
|
|
—
|
|
|
|
0.01
|
|
|
Total loans and leases, net of unearned income
|
|
$ |
13,546 |
|
|
$
|
6,986
|
|
|
$
|
70,867
|
|
|
$
|
180
|
|
|
$
|
217
|
|
|
$
|
10,233
|
|
|
$
|
12,786
|
|
|
|
0.34
|
%
|
The following table presents the financial effect of the loan modifications presented above for borrowers experiencing financial difficulty for the following periods:
|
|
Three Months Ended June 30, 2025
|
|
|
Three Months Ended June 30, 2024 |
|
|
|
Weighted-
Average Interest
Rate Reduction
|
|
|
Weighted-
Average Term Extension (in
years)
|
|
|
Weighted-
Average Interest
Rate Reduction
|
|
|
Weighted-
Average Term Extension (in
years)
|
|
|
Commercial and industrial
|
|
|
|
|
|
|
|
|
|
|
|
|
|
Non-real estate
|
|
|
4.19
|
%
|
|
|
2.43
|
|
|
|
2.39
|
%
|
|
|
1.14
|
|
|
Owner occupied
|
|
|
—
|
|
|
|
—
|
|
|
|
—
|
|
|
|
10.76
|
|
|
Commercial real estate
|
|
|
|
|
|
|
|
|
|
|
|
|
|
|
|
|
|
Income producing
|
|
|
—
|
|
|
|
—
|
|
|
|
—
|
|
|
|
1.24
|
|
|
Consumer
|
|
|
|
|
|
|
|
|
|
|
|
|
|
|
|
|
|
Residential mortgages
|
|
|
—
|
|
|
|
—
|
|
|
|
—
|
|
|
|
0.21
|
|
|
Other consumer
|
|
|
—
|
|
|
|
—
|
|
|
|
3.69
|
|
|
|
2.18
|
|
|
|
Six Months Ended June 30, 2025 |
|
|
Six Months Ended June 30, 2024 |
|
| (Dollars in thousands) |
|
Weighted-Average
Interest Rate
Reduction
|
|
|
Weighted-Average Term Extension (in years)
|
|
|
Principal Forgiveness
|
|
|
Weighted-
Average
Interest Rate Reduction
|
|
|
Weighted-
Average Term Extension (in
years)
|
|
|
Commercial and industrial
|
|
|
|
|
|
|
|
|
|
|
|
|
|
|
|
|
Non-real estate
|
|
|
2.25
|
%
|
|
|
2.11
|
|
|
$
|
5,835
|
|
|
|
1.17
|
%
|
|
|
1.19
|
|
|
Owner occupied
|
|
|
—
|
|
|
|
—
|
|
|
|
—
|
|
|
|
3.91
|
|
|
|
14.13
|
|
|
Commercial real estate
|
|
|
|
|
|
|
|
|
|
|
|
|
|
|
|
|
|
|
|
|
|
Income producing
|
|
|
—
|
|
|
|
—
|
|
|
|
—
|
|
|
|
0.54
|
|
|
|
1.27
|
|
|
Consumer
|
|
|
|
|
|
|
|
|
|
|
|
|
|
|
|
|
|
|
|
|
|
Residential mortgages
|
|
|
2.50
|
|
|
|
—
|
|
|
|
—
|
|
|
|
3.04
|
|
|
|
8.49
|
|
|
Other consumer
|
|
|
—
|
|
|
|
—
|
|
|
|
—
|
|
|
|
3.69
|
|
|
|
2.18
|
|
During the three and six months ended June 30, 2025, three C&I non-real estate loans totaling $1.1 million had a payment default that was previously modified in the prior 12
months by receiving a combination term extension and interest rate reduction.
The Company closely monitors the performance of the loans that are modified to borrowers experiencing financial difficulty to understand the effectiveness of its modification
efforts. Loans are considered to be in payment default at 90 or more days past due. The following table depicts the performance of loans that have been modified in the last 12 months:
| |
Payment Status (Amortized Cost Basis) at June 30, 2025
|
|
|
(In thousands)
|
|
Current
|
|
|
30-89 Days Past Due
|
|
|
90+ Days Past Due
|
|
|
Commercial and industrial
|
|
|
|
|
|
|
|
|
|
|
Non-real estate
|
|
$
|
65,037
|
|
|
$
|
34,641
|
|
|
$
|
1,078
|
|
|
Owner occupied
|
|
|
—
|
|
|
|
856
|
|
|
|
—
|
|
| Commercial real estate |
|
|
|
|
|
|
|
|
|
|
|
|
|
Income producing
|
|
|
66,352 |
|
|
|
— |
|
|
|
— |
|
| Consumer |
|
|
|
|
|
|
|
|
|
|
|
|
|
Residential mortgages
|
|
|
770
|
|
|
|
— |
|
|
|
— |
|
Total
|
|
$ |
132,159 |
|
|
$ |
35,497 |
|
|
$ |
1,078 |
|
NOTE 5. ALLOWANCE FOR CREDIT LOSSES
The following table summarizes the changes in the ACL for the periods indicated:
| |
|
Three Months Ended June 30, |
|
|
Six Months Ended June 30, |
|
|
(In thousands)
|
|
2025
|
|
|
2024
|
|
|
2025
|
|
|
2024
|
|
|
Balance at beginning of period
|
|
$
|
457,791
|
|
|
$
|
472,575
|
|
|
$
|
460,793
|
|
|
$
|
468,034
|
|
|
Charge-offs
|
|
|
(25,325
|
)
|
|
|
(26,283
|
)
|
|
|
(51,053
|
)
|
|
|
(47,919
|
)
|
|
Recoveries
|
|
|
4,110
|
|
|
|
3,730
|
|
|
|
6,836
|
|
|
|
5,907
|
|
|
Initial allowance on PCD loans
|
|
|
8,075
|
|
|
|
—
|
|
|
|
8,075
|
|
|
|
—
|
|
|
Provision for loan losses
|
|
|
30,000
|
|
|
|
20,000
|
|
|
|
50,000
|
|
|
|
44,000
|
|
|
Balance at end of period
|
|
$
|
474,651
|
|
|
$
|
470,022
|
|
|
$
|
474,651
|
|
|
$
|
470,022
|
|
The following tables summarize the changes in the ACL by segment and class for the periods indicated:
| |
|
Three Months Ended June 30, 2025 |
|
|
(In thousands)
|
|
Beginning Balance
|
|
|
Initial Allowance on PCD loans
|
|
|
Charge-offs
|
|
|
Recoveries
|
|
|
Provision (Release) |
|
|
Ending Balance |
|
|
Commercial and industrial
|
|
|
|
|
|
|
|
|
|
|
|
|
|
|
|
|
|
|
|
Non-real estate
|
|
$ |
168,940 |
|
|
$
|
1,209
|
|
|
$
|
(16,866
|
)
|
|
$
|
2,905
|
|
|
$
|
6,183
|
|
|
$
|
162,371
|
|
|
Owner occupied
|
|
|
33,318 |
|
|
|
2,277
|
|
|
|
(1,281
|
)
|
|
|
286
|
|
|
|
7,799
|
|
|
|
42,399
|
|
|
Total commercial and industrial
|
|
|
202,258 |
|
|
|
3,486
|
|
|
|
(18,147
|
)
|
|
|
3,191
|
|
|
|
13,982
|
|
|
|
204,770
|
|
Commercial real estate
|
|
|
|
|
|
|
|
|
|
|
|
|
|
|
|
|
|
|
|
|
|
|
|
|
|
Construction, acquisition and development
|
|
|
47,030
|
|
|
|
267
|
|
|
|
(295
|
)
|
|
|
60
|
|
|
|
2,018
|
|
|
|
49,080
|
|
|
Income producing
|
|
|
66,645
|
|
|
|
4,067
|
|
|
|
(3,445
|
)
|
|
|
50
|
|
|
|
17,049
|
|
|
|
84,366
|
|
|
Total commercial real estate
|
|
|
113,675
|
|
|
|
4,334
|
|
|
|
(3,740
|
)
|
|
|
110
|
|
|
|
19,067
|
|
|
|
133,446
|
|
|
Consumer
|
|
|
|
|
|
|
|
|
|
|
|
|
|
|
|
|
|
|
|
|
|
|
|
|
|
Residential mortgages
|
|
|
134,803
|
|
|
|
246
|
|
|
|
(1,944
|
)
|
|
|
383
|
|
|
|
(4,662
|
)
|
|
|
128,826
|
|
|
Other consumer
|
|
|
7,055
|
|
|
|
9
|
|
|
|
(1,494
|
)
|
|
|
426
|
|
|
|
1,613
|
|
|
|
7,609
|
|
|
Total consumer
|
|
|
141,858
|
|
|
|
255
|
|
|
|
(3,438
|
)
|
|
|
809
|
|
|
|
(3,049
|
)
|
|
|
136,435
|
|
|
Total
|
|
$
|
457,791
|
|
|
$
|
8,075
|
|
|
$
|
(25,325
|
)
|
|
$
|
4,110
|
|
|
$
|
30,000
|
|
|
$
|
474,651
|
|
| |
|
Six Months Ended June 30, 2025 |
|
|
(In thousands)
|
|
Beginning Balance
|
|
|
Initial Allowance on PCD loans
|
|
|
Charge-offs
|
|
|
Recoveries
|
|
|
Provision (Release)
|
|
|
Ending
Balance
|
|
|
Commercial and industrial
|
|
|
|
|
|
|
|
|
|
|
|
|
|
|
|
|
|
|
|
Non-real estate
|
|
$
|
183,743
|
|
|
$
|
1,209
|
|
|
$
|
(37,731
|
)
|
|
$
|
4,638
|
|
|
$
|
10,512
|
|
|
$
|
162,371
|
|
|
Owner occupied
|
|
|
35,177
|
|
|
|
2,277
|
|
|
|
(1,700
|
)
|
|
|
375
|
|
|
|
6,270
|
|
|
|
42,399
|
|
Total commercial and industrial
|
|
|
218,920
|
|
|
|
3,486
|
|
|
|
(39,431
|
)
|
|
|
5,013
|
|
|
|
16,782
|
|
|
|
204,770
|
|
|
Commercial real estate
|
|
|
|
|
|
|
|
|
|
|
|
|
|
|
|
|
|
|
|
|
|
|
|
|
|
Construction, acquisition and development
|
|
|
44,703
|
|
|
|
267
|
|
|
|
(337
|
)
|
|
|
105
|
|
|
|
4,342
|
|
|
|
49,080
|
|
|
Income producing
|
|
|
64,957
|
|
|
|
4,067
|
|
|
|
(4,785
|
)
|
|
|
88
|
|
|
|
20,039
|
|
|
|
84,366
|
|
|
Total commercial real estate
|
|
|
109,660
|
|
|
|
4,334
|
|
|
|
(5,122
|
)
|
|
|
193
|
|
|
|
24,381
|
|
|
|
133,446
|
|
|
Consumer
|
|
|
|
|
|
|
|
|
|
|
|
|
|
|
|
|
|
|
|
|
|
|
|
|
|
Residential mortgages
|
|
|
125,464
|
|
|
|
246
|
|
|
|
(3,240
|
)
|
|
|
781
|
|
|
|
5,575
|
|
|
|
128,826
|
|
|
Other consumer
|
|
|
6,749
|
|
|
|
9
|
|
|
|
(3,260
|
)
|
|
|
849
|
|
|
|
3,262
|
|
|
|
7,609
|
|
|
Total consumer
|
|
|
132,213
|
|
|
|
255
|
|
|
|
(6,500
|
)
|
|
|
1,630
|
|
|
|
8,837
|
|
|
|
136,435
|
|
|
Total
|
|
$
|
460,793
|
|
|
$
|
8,075
|
|
|
$
|
(51,053
|
)
|
|
$
|
6,836
|
|
|
$
|
50,000
|
|
|
$
|
474,651
|
|
| |
|
Three Months Ended June 30, 2024
|
|
|
(In thousands)
|
|
Beginning Balance
|
|
|
Charge-offs
|
|
|
Recoveries
|
|
|
Provision (Release)
|
|
|
Ending
Balance
|
|
|
Commercial and industrial
|
|
|
|
|
|
|
|
|
|
|
|
|
|
|
|
|
Non-real estate
|
|
$ |
208,599 |
|
|
$
|
(23,140
|
)
|
|
$
|
2,868
|
|
|
$
|
10,469
|
|
|
$
|
198,796
|
|
|
Owner occupied
|
|
|
33,675 |
|
|
|
(200
|
)
|
|
|
75
|
|
|
$
|
675
|
|
|
|
34,225
|
|
|
Total commercial and industrial
|
|
|
242,274 |
|
|
|
(23,340
|
)
|
|
|
2,943
|
|
|
|
11,144
|
|
|
|
233,021
|
|
|
Commercial real estate
|
|
|
|
|
|
|
|
|
|
|
|
|
|
|
|
|
|
|
|
|
|
Construction, acquisition and development
|
|
|
40,386
|
|
|
|
(405
|
)
|
|
|
70
|
|
|
$
|
(5,407
|
)
|
|
|
34,644
|
|
|
Income producing
|
|
|
62,722
|
|
|
|
(244
|
)
|
|
|
31
|
|
|
$
|
770
|
|
|
|
63,279
|
|
|
Total commercial real estate
|
|
|
103,108
|
|
|
|
(649
|
)
|
|
|
101
|
|
|
|
(4,637
|
)
|
|
|
97,923
|
|
|
Consumer
|
|
|
|
|
|
|
|
|
|
|
|
|
|
|
|
|
|
|
|
|
|
Residential mortgages
|
|
|
121,464
|
|
|
|
(708
|
)
|
|
|
291
|
|
|
$
|
12,046
|
|
|
|
133,093
|
|
|
Other consumer
|
|
|
5,729
|
|
|
|
(1,586
|
)
|
|
|
395
|
|
|
$
|
1,447
|
|
|
|
5,985
|
|
|
Total consumer
|
|
|
127,193
|
|
|
|
(2,294
|
)
|
|
|
686
|
|
|
|
13,493
|
|
|
|
139,078
|
|
|
Total
|
|
$
|
472,575
|
|
|
$
|
(26,283
|
)
|
|
$
|
3,730
|
|
|
$
|
20,000
|
|
|
$
|
470,022
|
|
| |
|
Six Months Ended June 30, 2024
|
|
| (In thousands) |
|
Beginning Balance |
|
|
Charge-offs |
|
|
Recoveries |
|
|
Provision |
|
|
Ending
Balance
|
|
| Commercial and industrial |
|
|
|
|
|
|
|
|
|
|
|
|
|
|
|
|
|
|
|
|
|
Non-real estate
|
|
$
|
194,577
|
|
|
$
|
(40,036
|
)
|
|
$
|
4,102
|
|
|
$
|
40,153
|
|
|
$
|
198,796
|
|
|
Owner occupied
|
|
|
31,445
|
|
|
|
(301
|
)
|
|
|
153
|
|
|
$
|
2,928
|
|
|
|
34,225
|
|
|
Total commercial and industrial
|
|
|
226,022
|
|
|
|
(40,337
|
)
|
|
|
4,255
|
|
|
|
43,081
|
|
|
|
233,021
|
|
|
Commercial real estate
|
|
|
|
|
|
|
|
|
|
|
|
|
|
|
|
|
|
|
|
|
|
Construction, acquisition and development
|
|
|
42,118
|
|
|
|
(537
|
)
|
|
|
182
|
|
|
$
|
(7,119
|
)
|
|
|
34,644
|
|
|
Income producing
|
|
|
69,209
|
|
|
|
(2,356
|
)
|
|
|
69
|
|
|
$
|
(3,643
|
)
|
|
|
63,279
|
|
|
Total commercial real estate
|
|
|
111,327
|
|
|
|
(2,893
|
)
|
|
|
251
|
|
|
|
(10,762
|
)
|
|
|
97,923
|
|
|
Consumer
|
|
|
|
|
|
|
|
|
|
|
|
|
|
|
|
|
|
|
|
|
|
Residential mortgages
|
|
|
124,851
|
|
|
|
(1,303
|
)
|
|
|
562
|
|
|
$
|
8,983
|
|
|
|
133,093
|
|
|
Other consumer
|
|
|
5,834
|
|
|
|
(3,386
|
)
|
|
|
839
|
|
|
$
|
2,698
|
|
|
|
5,985
|
|
|
Total consumer
|
|
|
130,685
|
|
|
|
(4,689
|
)
|
|
|
1,401
|
|
|
|
11,681
|
|
|
|
139,078
|
|
|
Total
|
|
$
|
468,034
|
|
|
$
|
(47,919
|
)
|
|
$
|
5,907
|
|
|
$
|
44,000
|
|
|
$
|
470,022
|
|
The following table represents a roll forward of the reserve for unfunded commitments for the periods shown. The reserve for unfunded commitments is classified in other liabilities in the consolidated
balance sheets.
| |
|
Three Months Ended June 30, |
|
|
Six Months Ended June 30, |
|
|
(In thousands)
|
|
2025
|
|
|
2024
|
|
|
2025
|
|
|
2024
|
|
|
Balance at beginning of period
|
|
$
|
8,551
|
|
|
$
|
6,551
|
|
|
$
|
8,551
|
|
|
$
|
8,551
|
|
|
Provision for credit losses for unfunded commitments
|
|
|
1,000
|
|
|
|
2,000
|
|
|
|
1,000
|
|
|
|
—
|
|
|
Balance at end of period
|
|
$
|
9,551
|
|
|
$
|
8,551
|
|
|
$
|
9,551
|
|
|
$ |
8,551
|
|
The economic impact of persistent inflation, higher interest rates, volatility in the financial markets, and the potential for a slowing economy poses additional risk to borrowers
and financial institutions. These factors add to the risk borrowers may experience difficulty in meeting repayment obligations, and the Company may experience losses or deterioration in the performance of its loan portfolio.
The ACL estimate is impacted by both loan portfolio changes and prevailing economic conditions during the reporting period. The unemployment rate has the highest weighting within the
Company’s credit risk modeling framework. Economic forecasts, which are obtained from multiple sources, provide upside, downside, and base case scenarios over an eight-quarter forecast horizon to establish a forecast range. Management
considers the scenarios and selects a blended scenario which, in management’s opinion, reflects likely economic conditions within that range. The Company recognizes that inflation, higher interest rates and a slowing economy may have
short-term, long-term, and regional impacts to the economy. In addition, qualitative factors such as changes in economic conditions, concentrations of risk, and changes in portfolio risk resulting from regulatory changes are
considered in determining the adequacy of the level of the ACL.
NOTE 6. BORROWINGS
Borrowings with original maturities of one year or less are classified as short-term. The following tables present information relating to short-term debt for the periods presented:
| |
|
June 30, 2025 |
|
| |
|
End of Period |
|
|
Year to Date Daily Average |
|
|
Maximum Outstanding
at any
Month End
|
|
|
(Dollars in thousands)
|
|
Balance
|
|
|
Interest
Rate
|
|
|
Balance
|
|
|
Interest
Rate (1)
|
|
|
|
|
Federal funds purchased
|
|
$
|
—
|
|
|
|
—
|
%
|
|
$
|
163,812
|
|
|
|
4.48
|
%
|
|
$
|
375,000
|
|
|
Securities sold under agreement to repurchase and other
|
|
|
21,225
|
|
|
|
4.35
|
|
|
|
20,715
|
|
|
|
4.14
|
|
|
|
25,610
|
|
|
Short-term FHLB advances
|
|
|
1,575,000
|
|
|
|
4.30
|
|
|
|
603,812
|
|
|
|
4.31
|
|
|
|
1,575,000
|
|
|
Total
|
|
$
|
1,596,225
|
|
|
|
|
|
|
$
|
788,339
|
|
|
|
|
|
|
$
|
1,975,610
|
|
| |
|
December 31, 2024
|
|
| |
|
End of Period
|
|
|
Year to Date Daily Average
|
|
|
Maximum Outstanding
at any
Month End
|
|
|
(Dollars in thousands)
|
|
Balance
|
|
|
Interest
Rate
|
|
|
Balance
|
|
|
Interest
Rate
|
|
|
Federal funds purchased
|
|
$
|
—
|
|
|
|
—
|
%
|
|
$
|
5,077
|
|
|
|
5.28
|
%
|
|
$
|
—
|
|
|
Securities sold under agreement to repurchase and other
|
|
|
23,616
|
|
|
|
4.10
|
|
|
|
81,092
|
|
|
|
4.76
|
|
|
|
267,792
|
|
|
Bank Term Funding Program
|
|
|
—
|
|
|
|
—
|
|
|
|
2,845,902
|
|
|
|
4.79
|
|
|
|
3,500,000
|
|
|
Short-term FHLB advances
|
|
|
—
|
|
|
|
—
|
|
|
|
2
|
|
|
|
5.74
|
|
|
|
—
|
|
|
Total
|
|
$
|
23,616
|
|
|
|
|
|
|
$
|
2,932,073
|
|
|
|
|
|
|
$
|
3,767,792
|
|
Federal funds purchased generally mature the business day following the date of purchase. At June 30, 2025 and December 31, 2024, the Company had established non-binding federal funds
borrowing lines of credit with other banks aggregating $2.1 billion, for both periods. Additionally, the Company maintains access to the FRB discount window borrowings which generally mature within 90 days and are collateralized by
$2.0 billion in commercial, agriculture, and consumer loans pledged under a borrower-in-custody agreement as of June 30, 2025. At June 30, 2025 and December 31, 2024, there were no borrowings from the FRB discount window.
Securities sold under repurchase agreements generally mature within one day from the date of sale. The Company monitors collateral levels on a continuous basis and may be required to
provide additional collateral based on the fair value of the underlying securities. Collateral pledged pursuant to these repurchase agreements can include MBS issued or guaranteed by
U.S. agencies, U.S. Treasury securities and U.S. government agency securities.
The BTFP was created by the Federal Reserve to support businesses and households by making additional funding available to eligible financial institutions to help assure they have the
ability to meet the needs of their depositors. The BTFP offered loans of up to one year in length to banks and other qualifying institutions pledging any collateral eligible for purchase by the FRB. The collateral was valued at its
par amount and consisted primarily of MBS and U.S. government agency securities. Cadence’s BTFP borrowing was paid off during the fourth quarter of 2024. The BTFP ceased making new loans in March 2024.
As of June 30, 2025 and December 31, 2024, the Company had a balance of $1.4 billion and $706 thousand, respectively, of long-term advances from the FHLB of Dallas. During the first
half of 2025, the Company entered into $1.4 billion of long-term advances from the FHLB of Dallas with various interest rates ranging from 3.897% to 4.219% with maturities beginning in September 2026 through April 2027. In addition,
the Company obtained $12.4 million of junior subordinated debt in the First Chatham acquisition. This FCB subordinated debt as well as $10.0 million of 5.000% fixed to floating rate subordinated notes were paid off in June 2025.
All borrowings from the FHLB are collateralized by commercial and residential real estate loans pledged under a blanket floating lien security agreement with the FHLB of Dallas. Under
the terms of this agreement, the Company is required to maintain sufficient collateral to secure borrowings in an aggregate amount of the lesser of the book value (i.e., unpaid principal balance), after applicable FHLB discounts, of
the Company’s eligible commercial and residential real estate loans pledged as collateral, or 35% of the Company’s assets. Loans totaling $25.8 billion and $24.4 billion at June 30, 2025 and December 31, 2024, respectively, were
pledged to the FHLB of Dallas. At June 30, 2025, the remaining borrowing availability totaled $10.1 billion. At June 30, 2025, there were no call features on long-term FHLB borrowings. Short-term FHLB borrowings mature within one year
following the date of the advance.
The FHLB of Dallas has also issued irrevocable letters of credit totaling $47.5 million at June 30, 2025 on behalf of our customers. Of the total amount, $26.7 million expires on
December 17, 2025 and $20.8 million expires on January 30, 2026.
NOTE 7. PENSION
The components of net periodic benefit cost (credit) for the periods indicated were as follows:
| |
|
Three Months Ended June 30,
|
|
|
Six Months Ended June 30, |
|
|
(In thousands)
|
|
2025
|
|
|
2024
|
|
|
2025
|
|
|
2024
|
|
|
Service cost
|
|
$
|
2,330
|
|
|
$
|
1,907
|
|
|
$
|
4,660
|
|
|
$
|
3,814
|
|
|
Interest cost
|
|
|
2,963
|
|
|
|
2,941
|
|
|
|
5,926
|
|
|
|
5,882
|
|
|
Expected return on plan assets
|
|
|
(5,999
|
)
|
|
|
(5,741
|
)
|
|
|
(11,998
|
)
|
|
|
(11,482
|
)
|
|
Recognized prior service cost
|
|
|
4
|
|
|
|
3
|
|
|
|
7
|
|
|
|
6
|
|
|
Recognized net loss
|
|
|
724
|
|
|
|
733
|
|
|
|
1,448
|
|
|
|
1,466
|
|
|
Net periodic benefit cost (credit) (1)
|
|
$
|
22
|
|
|
$
|
(157
|
)
|
|
$
|
43
|
|
|
$
|
(314
|
)
|
|
(1)
|
While service cost is included in salaries and employee benefits, the other components of net periodic pension costs (credit) are included in other noninterest expense in the unaudited
consolidated statements of income for the three and six months ended June 30, 2025 and 2024.
|
NOTE 8. MORTGAGE SERVICING RIGHTS
The MSR, which are recognized as a separate asset on the date the corresponding mortgage loan is sold on a servicing retained basis, is recorded at fair value as determined at each
accounting period end and reported in other assets in the consolidated balance sheets. An estimate of the fair value of the Company’s MSR is determined utilizing assumptions such as mortgage interest rates, discount rates, mortgage
loan prepayment speeds, market trends and industry demand. Data and assumptions used in the fair value calculation related to the MSR were as follows:
|
(Dollars in thousands)
|
|
June 30, 2025
|
|
|
December 31, 2024
|
|
|
Unpaid principal balance
|
|
$
|
8,216,970
|
|
|
$
|
8,043,306
|
|
|
Weighted-average prepayment speed (CPR)
|
|
|
9.4
|
|
|
|
8.3
|
|
|
Average discount rate (annual percentage)
|
|
|
9.8
|
|
|
|
10.1
|
|
|
Weighted-average coupon interest rate (percentage)
|
|
|
4.4
|
|
|
|
4.2
|
|
|
Weighted-average remaining maturity (months)
|
|
|
285.5
|
|
|
|
285.7
|
|
|
Weighted-average servicing fee (basis points)
|
|
|
28.7
|
|
|
|
28.7
|
|
Because the valuation is determined by using discounted cash flow models, the primary risk inherent in valuing the MSR is the impact of fluctuating interest rates on the estimated
life of the servicing revenue stream. The use of different estimates or assumptions could produce different fair values. At June 30, 2025 and 2024, the Company had an economic hedge in place designed to cover 75.1% and 75.3% of the
MSR interest rate risk, respectively. At December 31, 2024, the hedge covered 75.1% of the MSR interest rate risk (see Note 15 for additional information). The Company is susceptible to fluctuations in the fair value of its MSR in
changing interest rate environments.
The following table summarizes activity relating to residential mortgage loans sold with servicing retained for the periods indicated:
| |
|
Three Months Ended June 30, |
|
|
Six Months Ended June 30, |
|
| (In thousands) |
|
2025
|
|
|
2024 |
|
|
2025 |
|
|
2024 |
|
|
Residential mortgage loans sold with servicing retained
|
|
$
|
328,439
|
|
|
$
|
269,205
|
|
|
$
|
567,457
|
|
|
$
|
490,287
|
|
|
Pretax gains resulting from above loan sales
|
|
|
4,663
|
|
|
|
5,371
|
|
|
|
8,290
|
|
|
|
7,974
|
|
The Company services a class of residential mortgages that are first lien loans secured by a primary residence or second home. The following table presents changes in the fair value
of the MSR related to the activity in this class for the periods indicated:
| |
|
Six Months Ended June 30, |
|
|
(In thousands)
|
|
2025
|
|
|
2024 |
|
|
Fair value, beginning of period
|
|
$
|
114,594
|
|
|
$
|
106,824
|
|
|
Originations of servicing assets
|
|
|
6,528
|
|
|
|
6,423
|
|
|
Changes in fair value:
|
|
|
|
|
|
|
|
|
|
Due to change in valuation inputs or assumptions(1)
|
|
|
(6,915
|
)
|
|
|
5,708
|
|
|
Other changes in fair value(2)
|
|
|
(2,583
|
)
|
|
$
|
(5,360
|
)
|
|
Fair value, end of period
|
|
$
|
111,624
|
|
|
$
|
113,595
|
|
| (1) |
Primarily reflects changes in prepayment speeds and discount rate assumptions which are updated based on market interest rates.
|
| (2) |
Primarily reflects changes due to realized cash flows.
|
All of the changes to the fair value of the MSR and the related economic hedge are recorded as part of mortgage banking revenue in the consolidated statements of income. As part of
mortgage banking revenue, the Company recorded contractual servicing fees of $5.7 million and $5.3 million, and late and other ancillary fees of $1.2 million and $734 thousand for the three months ended June 30, 2025 and 2024,
respectively. Additionally, the Company recorded contractual servicing fees of $11.4 million and $10.7 million, and late and other ancillary fees of $2.0 million and $1.5 million for the six months ended June 30, 2025 and 2024,
respectively.
NOTE 9. FAIR VALUE DISCLOSURES
See Note 13 to the consolidated financial statements of the Annual Report on Form 10-K for the year ended December 31, 2024 for a description of valuation methodologies for assets and
liabilities measured at fair value on a recurring and non-recurring basis.
Assets and Liabilities Recorded at Fair Value on a Recurring Basis
The following tables present the balances of the assets and liabilities measured at fair value on a recurring basis:
| |
|
June 30, 2025 |
|
|
(In thousands)
|
|
Level 1
|
|
|
Level 2
|
|
|
Level 3
|
|
|
Total
|
|
|
Assets:
|
|
|
|
|
|
|
|
|
|
|
|
|
|
Available for sale securities
|
|
$
|
—
|
|
|
$
|
8,837,400
|
|
|
$
|
—
|
|
|
$
|
8,837,400
|
|
|
Equity investments
|
|
|
21,965
|
|
|
|
—
|
|
|
|
—
|
|
|
|
21,965
|
|
|
Mortgage servicing rights
|
|
|
—
|
|
|
|
—
|
|
|
|
111,624
|
|
|
|
111,624
|
|
|
Derivative instruments
|
|
|
2,993
|
|
|
|
33,366
|
|
|
|
3,890
|
|
|
|
40,249
|
|
|
Loans held for sale
|
|
|
—
|
|
|
|
272,059
|
|
|
|
—
|
|
|
|
272,059
|
|
|
Investments in limited partnerships
|
|
|
—
|
|
|
|
—
|
|
|
|
133,197
|
|
|
|
133,197
|
|
|
SBA/USDA servicing rights
|
|
|
—
|
|
|
|
—
|
|
|
|
10,214
|
|
|
|
10,214
|
|
|
Total
|
|
$
|
24,958
|
|
|
$
|
9,142,825
|
|
|
$
|
258,925
|
|
|
$
|
9,426,708
|
|
|
Liabilities:
|
|
|
|
|
|
|
|
|
|
|
|
|
|
|
|
|
|
Derivative instruments
|
|
$
|
—
|
|
|
$
|
44,602
|
|
|
$
|
—
|
|
|
$
|
44,602
|
|
| |
|
December 31, 2024
|
|
|
(In thousands)
|
|
Level 1
|
|
|
Level 2
|
|
|
Level 3
|
|
|
Total
|
|
|
Assets:
|
|
|
|
|
|
|
|
|
|
|
|
|
|
Available for sale securities
|
|
$
|
—
|
|
|
$
|
7,293,988
|
|
|
$
|
—
|
|
|
$
|
7,293,988
|
|
|
Equity investments
|
|
|
21,678
|
|
|
|
—
|
|
|
|
—
|
|
|
|
21,678
|
|
|
Mortgage servicing rights
|
|
|
—
|
|
|
|
—
|
|
|
|
114,594
|
|
|
|
114,594
|
|
|
Derivative instruments
|
|
|
—
|
|
|
|
32,021
|
|
|
|
1,310
|
|
|
|
33,331
|
|
|
Loans held for sale
|
|
|
—
|
|
|
|
244,192
|
|
|
|
—
|
|
|
|
244,192
|
|
|
Investments in limited partnerships
|
|
|
—
|
|
|
|
—
|
|
|
|
118,710
|
|
|
|
118,710
|
|
|
SBA servicing rights
|
|
|
—
|
|
|
|
—
|
|
|
|
5,785
|
|
|
|
5,785
|
|
|
Total
|
|
$
|
21,678
|
|
|
$
|
7,570,201
|
|
|
$
|
240,399
|
|
|
$
|
7,832,278
|
|
|
Liabilities:
|
|
|
|
|
|
|
|
|
|
|
|
|
|
|
|
|
|
Derivative instruments
|
|
$
|
3,085
|
|
|
$
|
45,573
|
|
|
$
|
15
|
|
|
$
|
48,673
|
|
Level 3 financial instruments typically include unobservable components but may also include some observable components that may be validated against external sources. The table below
includes a roll forward of the consolidated balance sheet amounts for the three and six months ended June 30, 2025 and 2024, for changes in the fair value of financial instruments classified within Level 3 of the valuation hierarchy
that are recorded on a recurring basis. The gains or (losses) in the following table (which are reported in Other noninterest income in the consolidated statements of income) may include changes to fair value due, in part, to
observable factors that may be part of the valuation methodology.
| |
|
Three Months Ended June 30, 2025 |
|
(In thousands)
|
|
Mortgage
Servicing
Rights
|
|
|
Investments
in Limited Partnerships
|
|
|
SBA/
USDA
Servicing
Rights
|
|
|
Mortgage Loan
Held-For-Sale
Interest Rate Lock
Commitments
(Assets and
Liabilities)
|
|
|
Balance at March 31, 2025
|
|
$
|
110,969
|
|
|
$
|
125,665
|
|
|
$
|
5,783
|
|
|
$
|
2,874
|
|
|
Acquired in a business combination
|
|
|
—
|
|
|
|
—
|
|
|
|
4,783
|
|
|
|
—
|
|
|
Net (losses) gains
|
|
|
(3,077
|
)
|
|
|
2,142
|
|
|
|
(889
|
)
|
|
|
1,016
|
|
|
Additions
|
|
|
3,732
|
|
|
|
—
|
|
|
|
537
|
|
|
|
—
|
|
|
Contributions paid
|
|
|
—
|
|
|
|
8,330
|
|
|
|
—
|
|
|
|
—
|
|
|
Distributions received
|
|
|
—
|
|
|
|
(2,940
|
)
|
|
|
—
|
|
|
|
—
|
|
|
Balance at June 30, 2025
|
|
$
|
111,624
|
|
|
$
|
133,197
|
|
|
$
|
10,214
|
|
|
$
|
3,890
|
|
|
Net unrealized (losses) gains included in net income for the quarter relating to assets and liabilities held at June 30, 2025
|
|
$
|
(2,468
|
)
|
|
$
|
2,142
|
|
|
$
|
(889
|
)
|
|
$
|
1,016
|
|
| |
|
Three Months Ended June 30, 2024
|
|
|
(In thousands)
|
|
Mortgage
Servicing
Rights
|
|
|
Investments
in Limited Partnerships
|
|
|
SBA
Servicing
Rights
|
|
|
Mortgage Loan
Held-For-Sale
Interest Rate Lock
Commitments
(Assets and
Liabilities)
|
|
|
Balance at March 31, 2024
|
|
$
|
111,685
|
|
|
$
|
101,513
|
|
|
$
|
6,014
|
|
|
$
|
2,580
|
|
|
Net (losses) gains
|
|
|
(1,777
|
)
|
|
|
4,975
|
|
|
|
(319
|
)
|
|
|
(191
|
)
|
|
Additions
|
|
|
3,687
|
|
|
|
—
|
|
|
|
235
|
|
|
|
—
|
|
|
Contributions paid
|
|
|
—
|
|
|
|
7,027
|
|
|
|
—
|
|
|
|
—
|
|
|
Distributions received
|
|
|
—
|
|
|
|
(3,976
|
)
|
|
|
—
|
|
|
|
—
|
|
|
Balance at June 30, 2024
|
|
$
|
113,595
|
|
|
$
|
109,539
|
|
|
$
|
5,930
|
|
|
$
|
2,389
|
|
|
Net unrealized gains (losses) included in net income for the quarter relating to assets and liabilities held at June 30, 2024
|
|
$
|
927
|
|
|
$
|
4,975
|
|
|
$
|
(319
|
)
|
|
$
|
(191
|
)
|
| |
|
Six Months Ended June 30, 2025 |
|
| (In thousands) |
|
Mortgage
Servicing
Rights
|
|
|
Investments in Limited
Partnerships
|
|
|
SBA/
USDA
Servicing
Rights
|
|
|
Mortgage Loan
Held-For-Sale
Interest Rate Lock
Commitments
(Assets and
Liabilities)
|
|
|
Balance at December 31, 2024
|
|
$
|
114,594
|
|
|
$
|
118,710
|
|
|
$
|
5,785
|
|
|
$
|
1,295
|
|
|
Acquired in a business combination
|
|
|
—
|
|
|
|
—
|
|
|
|
4,783
|
|
|
|
—
|
|
|
Net (losses) gains
|
|
|
(9,498
|
)
|
|
|
4,486
|
|
|
|
(1,301
|
)
|
|
|
2,595
|
|
|
Additions
|
|
|
6,528
|
|
|
|
—
|
|
|
|
947
|
|
|
|
—
|
|
|
Contributions paid
|
|
|
—
|
|
|
|
15,172
|
|
|
|
—
|
|
|
|
—
|
|
|
Distributions received
|
|
|
—
|
|
|
|
(5,171
|
)
|
|
|
—
|
|
|
|
—
|
|
|
Balance at June 30, 2025
|
|
$
|
111,624
|
|
|
$
|
133,197
|
|
|
$
|
10,214
|
|
|
$
|
3,890
|
|
|
Net unrealized (losses) gains included in net income for the period related to assets and liabilities held at June 30, 2025
|
|
$
|
(6,915
|
)
|
|
$
|
4,486
|
|
|
$
|
(1,301
|
)
|
|
$
|
2,595
|
|
|
|
Six Months Ended June 30, 2024 |
|
| (In thousands) |
|
Mortgage
Servicing
Rights
|
|
|
Investments
in Limited
Partnerships
|
|
|
SBA
Servicing
Rights
|
|
|
Mortgage Loan
Held-For-Sale
Interest Rate Lock
Commitments
(Assets and
Liabilities)
|
|
|
Balance at December 31, 2023
|
|
$
|
106,824
|
|
|
$
|
94,998
|
|
|
$
|
6,124
|
|
|
$
|
1,848
|
|
|
Net gains (losses)
|
|
|
348
|
|
|
|
5,975
|
|
|
|
(791
|
)
|
|
|
541
|
|
|
Additions
|
|
|
6,423
|
|
|
|
—
|
|
|
|
597
|
|
|
|
—
|
|
|
Contributions paid
|
|
|
—
|
|
|
|
15,237
|
|
|
|
—
|
|
|
|
—
|
|
|
Distributions received
|
|
|
—
|
|
|
|
(6,671
|
)
|
|
|
—
|
|
|
|
—
|
|
|
Balance at June 30, 2024
|
|
$
|
113,595
|
|
|
$
|
109,539
|
|
|
$
|
5,930
|
|
|
$
|
2,389
|
|
|
Net unrealized gains (losses) included in net income for the period related to assets and liabilities held at June 30, 2024
|
|
$
|
5,708
|
|
|
$
|
5,975
|
|
|
$
|
(791
|
)
|
|
$
|
541
|
|
Fair Value Option
The Company elected to measure commercial real estate loans held for sale and commercial and industrial loans held for sale under the fair value option. Included in these loans are
loans guaranteed by the SBA and loans related to syndications. Due to the short duration that these instruments remain on the balance sheet, the Company assumes that cost approximates fair value.
The Company also elected to measure residential mortgage loans held for sale at fair value. The election allows for effective offset of the changes in fair values of the loans and
the derivative instruments used to hedge them. Included in the residential mortgage loans held for sale portfolio are certain previously sold GNMA loans. Under ASC 860-10-40, certain GNMA loans will not meet sale criteria due to the
conditional buyback option becoming unconditional - typically when loans become 90 or more days delinquent. The Company records these loans at fair value on the consolidated balance sheets with an offsetting liability. The Company
assumed the cost approximates the fair value. At June 30, 2025 and December 31, 2024, the fair value of the GNMA loans totaled $62.9 million and $69.0 million, respectively.
The following table summarizes the difference between the aggregate fair value and the aggregate unpaid principal balance of loans held for sale:
|
|
|
June 30, 2025
|
|
|
December 31, 2024 |
|
|
(In thousands)
|
|
Aggregate
Fair Value
|
|
|
Aggregate
Unpaid
Principal
|
|
|
Aggregate
Fair Value
Less
Aggregate
Unpaid
Principal
|
|
|
Aggregate
Fair Value
|
|
|
Aggregate
Unpaid
Principal
|
|
|
Aggregate
Fair Value
Less
Aggregate
Unpaid
Principal
|
|
|
Residential mortgage loans
|
|
$
|
201,590
|
|
|
$
|
201,590
|
|
|
$
|
—
|
|
|
$ |
181,622 |
|
|
$
|
181,622
|
|
|
$
|
—
|
|
|
Commercial and industrial loans
|
|
|
57,295
|
|
|
|
57,295
|
|
|
|
—
|
|
|
|
59,343 |
|
|
|
59,343
|
|
|
|
—
|
|
|
Commercial real estate loans
|
|
|
13,174
|
|
|
|
13,174
|
|
|
|
—
|
|
|
|
3,227 |
|
|
|
3,227
|
|
|
|
—
|
|
|
Total
|
|
$
|
272,059
|
|
|
$
|
272,059
|
|
|
$
|
—
|
|
|
$ |
244,192 |
|
|
$
|
244,192
|
|
|
$
|
—
|
|
Net gains and losses resulting from changes in fair value for residential mortgage loans held for sale are recorded in mortgage banking revenue in the consolidated statements of
income. For the three months ended June 30, 2025 and 2024, the Company had net gains of $1.5 million and net losses of $0.2 million, respectively. For the six months ended June 30, 2025 and 2024, the Company had net gains totaling
$2.7 million and $1.6 million, respectively.
Net gains and losses resulting from changes in fair value for commercial and industrial loans and commercial real estate loans held for sale are recorded in other noninterest
revenue in the consolidated statements of income. For the three months ended June 30, 2025 and 2024, the Company had net gains from the sale of these loans totaling $2.8 million and $0.9 million, respectively. For the six months
ended June 30, 2025 and 2024, the Company had net gains from the sale of these loans totaling $4.8 million and $2.8 million, respectively.
Assets and Liabilities Recorded at Fair Value o a Nonrecurring Basis
From time to time, the Company may be required to measure certain financial assets at fair value on a nonrecurring basis in accordance with GAAP. These
adjustments to fair value usually result from the application of lower of cost or fair value accounting or from write-downs of individual assets. The following tables present the balances of assets measured at fair value on a
nonrecurring basis:
|
|
|
|
June 30, 2025 |
|
|
(In thousands)
|
|
|
Level 1
|
|
|
|
Level 2
|
|
|
|
Level 3
|
|
|
|
Total
|
|
|
Assets:
|
|
|
|
|
|
|
|
|
|
|
|
|
|
|
|
|
|
Impaired loans, collateral-dependent(1)
|
|
$
|
—
|
|
|
$
|
—
|
|
|
$
|
46,591
|
|
|
$
|
46,591
|
|
|
PCD (loss) loans
|
|
|
—
|
|
|
|
—
|
|
|
|
9,066
|
|
|
|
9,066
|
|
|
Other real estate and repossessed assets
|
|
|
—
|
|
|
|
—
|
|
|
|
15,599
|
|
|
|
15,599
|
|
|
(1)
|
At June 30, 2025, impaired loans, collateral-dependent includes $8.4 million which were classified as doubtful.
|
|
|
|
December 31, 2024
|
|
|
(In thousands)
|
|
|
Level 1
|
|
|
|
Level 2
|
|
|
|
Level 3
|
|
|
|
Total
|
|
|
Assets:
|
|
|
|
|
|
|
|
|
|
|
|
|
|
|
|
|
|
Impaired loans, collateral-dependent(1)
|
|
$
|
—
|
|
|
$
|
—
|
|
|
$
|
75,820
|
|
|
$
|
75,820
|
|
|
PCD (loss) loans
|
|
|
—
|
|
|
|
—
|
|
|
|
6,027
|
|
|
|
6,027
|
|
|
Other real estate and repossessed assets
|
|
|
—
|
|
|
|
—
|
|
|
|
5,754
|
|
|
|
5,754
|
|
|
(1)
|
At December 31, 2024, impaired loans, collateral-dependent includes $8.7 million which were classified as doubtful.
|
Unobservable Inputs
The following table presents the significant unobservable inputs used in Level 3 fair value measurements for financial assets measured at fair value on a recurring and
nonrecurring basis:
|
|
Quantitative Information about Level 3 Fair Value Measurements |
|
|
(Dollars in thousands)
|
|
Carrying
Value
|
|
Valuation
Methods
|
|
Unobservable
Inputs
|
|
|
Range
|
|
|
|
Weighted Average
|
|
|
June 30, 2025
|
|
|
|
|
|
|
|
|
|
|
|
|
|
|
|
Measured at fair value on a recurring basis:
|
|
|
|
|
|
|
|
|
|
|
|
|
|
|
|
Mortgage servicing rights(1)
|
|
$
|
111,624
|
|
Discounted cash flow
|
|
Discount rate
|
|
|
9.4% - 11.0
|
%
|
|
|
9.8
|
%
|
|
|
|
|
|
|
|
|
Repayment speed (CPR)
|
|
|
6.9 - 20.3
|
|
|
|
9.3
|
|
|
|
|
|
|
|
|
|
Coupon interest rate
|
|
|
3.3% - 6.3
|
%
|
|
|
4.4
|
%
|
|
|
|
|
|
|
|
|
Remaining maturity (months)
|
|
|
73 - 399
|
|
|
|
286
|
|
|
|
|
|
|
|
|
|
Servicing fee (bps)
|
|
|
19.0 bps-38.3 bps
|
|
|
|
28.7 bps
|
|
|
Investments in limited partnerships
|
|
|
133,197
|
|
Practical
expedient
|
|
Net asset value
|
|
|
NM
|
|
|
|
NM
|
|
|
SBA/USDA servicing rights(1)
|
|
|
10,214
|
|
Coupon less
contractual
servicing cost
|
|
Contractual
servicing
cost (bps)
|
|
|
12.5 bps-40.0 bps
|
|
|
|
26.3 bps
|
|
Mortgage loan held-for-sale interest
rate lock commitments (assets and liabilities)
|
|
|
3,890
|
|
Discounted cash flow
|
|
Closing ratio
|
|
|
10.0% - 100
|
%
|
|
|
61.6
|
%
|
|
Measured at fair value on a nonrecurring basis:
|
|
|
|
|
|
|
|
|
|
|
|
|
|
|
|
|
Impaired loans, collateral-dependent(1)
|
|
$
|
46,591
|
|
Appraised value, as adjusted
|
|
Discount to fair value
|
|
|
10% - 78
|
%
|
|
|
48.0
|
%
|
|
PCD (loss) loans(1)
|
|
|
9,066
|
|
Appraised value, as adjusted
|
|
Discount to fair value
|
|
|
10% - 30
|
%
|
|
|
24.5
|
%
|
|
Other real estate and repossessed assets
|
|
|
15,599
|
|
Appraised value, as adjusted
|
|
Estimated closing costs
|
|
|
7.0
|
%
|
|
|
7.0
|
%
|
| |
|
Quantitative Information about Level 3 Fair Value
Measurements
|
|
| |
|
Carrying Value
|
|
Valuation
Methods
|
|
Unobservable
Inputs
|
|
|
Range
|
|
|
Weighted Average
|
|
|
(Dollars in thousands)
|
|
|
|
|
|
|
|
|
|
|
|
|
|
|
December 31, 2024
|
|
|
|
|
|
|
|
|
|
|
|
|
|
|
Measured at fair value on a recurring basis:
|
|
|
|
|
|
|
|
|
|
|
|
|
|
|
Mortgage servicing rights(1)
|
|
$
|
114,594
|
|
Discounted cash flow
|
|
Discount rate
|
|
|
9.7% - 11.3
|
%
|
|
10.1
|
%
|
|
|
|
|
|
|
|
|
Repayment speed (CPR)
|
|
|
6.8 - 12.6
|
|
|
8.3
|
|
|
|
|
|
|
|
|
|
Coupon interest rate
|
|
|
3.2% - 7.9
|
%
|
|
4.2
|
%
|
|
|
|
|
|
|
|
|
Remaining maturity
(months)
|
|
|
70 - 404
|
|
|
286
|
|
|
|
|
|
|
|
|
Servicing fee (bps)
|
|
|
19.0 bps-50.0 bps
|
|
|
28.7 bps
|
|
|
Investments in limited partnerships
|
|
|
118,710
|
|
Practical expedient
|
|
Net asset value
|
|
|
NM
|
|
|
NM
|
|
|
SBA servicing rights(1)
|
|
|
5,785
|
|
Coupon less contractual servicing cost
|
|
Contractual servicing cost (bps)
|
|
|
12.5 bps-40.0 bps
|
|
|
26.3 bps
|
|
|
Mortgage loan held-for-sale interest rate lock commitments (assets and liabilities)
|
|
|
1,295
|
|
Discounted cash flow
|
|
Closing ratio
|
|
|
10.0% - 100
|
%
|
|
46.8
|
%
|
|
Measured at fair value on a nonrecurring basis:
|
|
|
|
|
|
|
|
|
|
|
|
|
|
|
|
Impaired loans, collateral-dependent(1)
|
|
$
|
75,820
|
|
Appraised value, as adjusted
|
|
Discount to fair value
|
|
|
10% - 41
|
%
|
|
30.5
|
%
|
|
PCD (loss) loans(1)
|
|
|
6,027
|
|
Appraised value, as adjusted
|
|
Discount to fair value
|
|
|
10% - 30
|
%
|
|
24.7
|
%
|
|
Other real estate and repossessed assets
|
|
|
5,754
|
|
Appraised value, as adjusted
|
|
Estimated closing costs
|
|
|
7.0
|
%
|
|
7.0
|
%
|
|
(1)
|
Weighted averages were calculated using the input attributed and the outstanding balance of the loan.
|
Certain assets and liabilities subject to fair value disclosure requirements are not actively traded, requiring management to estimate the fair value. These
estimations necessarily require judgement to be applied to the reasonableness and relevancy of comparable market prices, expected future cash flows, and appropriate discount rates.
The short-term nature of certain assets and liabilities result in their carrying value approximating fair value. They include cash and due from banks, interest bearing deposits
with other banks and Federal funds sold, accrued interest receivable, non-time deposits, federal funds purchased, securities sold under agreement to repurchase, short-term and long-term FHLB borrowings and accrued interest
payable.
The following tables present carrying and fair value information of financial instruments for the periods presented:
| |
|
|
|
|
(In thousands)
|
|
Carrying
Value
|
|
|
Fair Value
|
|
|
Level 1
|
|
|
Level 2
|
|
|
Level 3
|
|
|
Assets:
|
|
|
|
|
|
|
|
|
|
|
|
|
|
|
|
|
Cash and due from banks
|
|
$
|
710,679
|
|
|
$
|
710,679
|
|
|
$
|
710,679
|
|
|
$
|
—
|
|
|
$
|
—
|
|
|
Interest bearing deposits with other banks and Federal funds sold
|
|
|
825,878
|
|
|
|
825,878
|
|
|
|
825,878
|
|
|
|
—
|
|
|
|
—
|
|
|
Available for sale securities and equity securities with readily determinable fair values
|
|
|
8,859,365
|
|
|
|
8,859,365
|
|
|
|
21,965
|
|
|
|
8,837,400
|
|
|
|
—
|
|
|
Net loans and leases
|
|
|
34,990,530
|
|
|
|
34,292,631
|
|
|
|
—
|
|
|
|
—
|
|
|
|
34,292,631
|
|
|
Loans held for sale
|
|
|
272,059
|
|
|
|
272,059
|
|
|
|
—
|
|
|
|
272,059
|
|
|
|
—
|
|
|
Accrued interest receivable
|
|
|
212,004
|
|
|
|
212,004
|
|
|
|
—
|
|
|
|
30,429
|
|
|
|
181,575
|
|
|
Mortgage servicing rights
|
|
|
111,624
|
|
|
|
111,624
|
|
|
|
—
|
|
|
|
—
|
|
|
|
111,624
|
|
|
Investments in limited partnerships
|
|
|
133,197
|
|
|
|
133,197
|
|
|
|
—
|
|
|
|
—
|
|
|
|
133,197
|
|
|
Other assets
|
|
|
25,813
|
|
|
|
25,813
|
|
|
|
—
|
|
|
|
—
|
|
|
|
25,813
|
|
|
|
|
|
|
|
|
|
|
|
|
|
|
|
|
|
|
|
|
|
|
|
|
Liabilities:
|
|
|
|
|
|
|
|
|
|
|
|
|
|
|
|
|
|
|
|
|
|
Deposits
|
|
$
|
40,493,518
|
|
|
$
|
40,490,511
|
|
|
$
|
—
|
|
|
$
|
40,490,511
|
|
|
$
|
—
|
|
|
Federal funds purchased and securities sold under agreement to repurchase and other short-term borrowings
|
|
|
21,225
|
|
|
|
21,225
|
|
|
|
21,225
|
|
|
|
—
|
|
|
|
—
|
|
|
Short-term FHLB borrowings
|
|
|
1,575,000
|
|
|
|
1,575,000
|
|
|
|
1,575,000
|
|
|
|
—
|
|
|
|
—
|
|
|
Accrued interest payable
|
|
|
148,618
|
|
|
|
148,618
|
|
|
|
9,439
|
|
|
|
139,179
|
|
|
|
—
|
|
|
Subordinated and long-term borrowings
|
|
|
1,430,674
|
|
|
|
1,430,674
|
|
|
|
1,430,674
|
|
|
|
—
|
|
|
|
—
|
|
|
|
|
|
|
|
|
|
|
|
|
|
|
|
|
|
|
|
|
|
|
|
|
Derivative instruments:
|
|
|
|
|
|
|
|
|
|
|
|
|
|
|
|
|
|
|
|
|
|
Assets:
|
|
|
|
|
|
|
|
|
|
|
|
|
|
|
|
|
|
|
|
|
|
Commercial loan interest rate contracts
|
|
$
|
32,166
|
|
|
$
|
32,166
|
|
|
$
|
—
|
|
|
$
|
32,166
|
|
|
$
|
—
|
|
|
Mortgage loan held-for-sale interest rate lock commitments
|
|
|
3,890
|
|
|
|
3,890
|
|
|
|
—
|
|
|
|
—
|
|
|
|
3,890
|
|
|
Futures, forwards and options
|
|
|
2,993
|
|
|
|
2,993
|
|
|
|
2,993
|
|
|
|
—
|
|
|
|
—
|
|
|
Foreign exchange contracts
|
|
|
1,200
|
|
|
|
1,200
|
|
|
|
—
|
|
|
|
1,200
|
|
|
|
—
|
|
|
Liabilities:
|
|
|
|
|
|
|
|
|
|
|
|
|
|
|
|
|
|
|
|
|
|
Commercial loan interest rate contracts
|
|
$
|
41,802
|
|
|
$
|
41,802
|
|
|
$
|
—
|
|
|
$
|
41,802
|
|
|
$
|
—
|
|
|
Mortgage loan forward sale commitments
|
|
|
1,767
|
|
|
|
1,767
|
|
|
|
—
|
|
|
|
1,767
|
|
|
|
—
|
|
|
Foreign exchange contracts
|
|
|
1,033
|
|
|
|
1,033
|
|
|
|
—
|
|
|
|
1,033
|
|
|
|
—
|
|
|
|
|
|
| |
|
Carrying
Value
|
|
|
|
|
|
Level 1
|
|
|
Level 2
|
|
|
Level 3
|
|
|
(In thousands)
|
|
|
|
|
|
|
|
|
|
|
|
|
|
|
|
|
Assets:
|
|
|
|
|
|
|
|
|
|
|
|
|
|
|
|
|
Cash and due from banks
|
|
$
|
624,884
|
|
|
$
|
624,884
|
|
|
$
|
624,884
|
|
|
$
|
—
|
|
|
$
|
—
|
|
|
Interest bearing deposits with other banks and Federal funds sold
|
|
|
1,106,692
|
|
|
|
1,106,692
|
|
|
|
1,106,692
|
|
|
|
—
|
|
|
|
—
|
|
|
Available for sale securities and equity securities with readily determinable fair values
|
|
|
7,315,666
|
|
|
|
7,315,666
|
|
|
|
21,678
|
|
|
|
7,293,988
|
|
|
|
—
|
|
|
Net loans and leases
|
|
|
33,280,962
|
|
|
|
32,440,220
|
|
|
|
—
|
|
|
|
—
|
|
|
|
32,440,220
|
|
|
Loans held for sale
|
|
|
244,192
|
|
|
|
244,192
|
|
|
|
—
|
|
|
|
244,192
|
|
|
|
—
|
|
|
Accrued interest receivable
|
|
|
196,670
|
|
|
|
196,670
|
|
|
|
—
|
|
|
|
26,239
|
|
|
|
170,431
|
|
|
Mortgage servicing rights
|
|
|
114,594
|
|
|
|
114,594
|
|
|
|
—
|
|
|
|
—
|
|
|
|
114,594
|
|
|
Investments in limited partnerships
|
|
|
118,710
|
|
|
|
118,710
|
|
|
|
—
|
|
|
|
—
|
|
|
|
118,710
|
|
|
Other assets
|
|
|
11,539
|
|
|
|
11,539
|
|
|
|
—
|
|
|
|
—
|
|
|
|
11,539
|
|
|
|
|
|
|
|
|
|
|
|
|
|
|
|
|
|
|
|
|
|
|
|
|
Liabilities:
|
|
|
|
|
|
|
|
|
|
|
|
|
|
|
|
|
|
|
|
|
|
Deposits
|
|
$
|
40,496,201
|
|
|
$
|
40,495,193
|
|
|
$
|
—
|
|
|
$
|
40,495,193
|
|
|
$
|
—
|
|
|
Federal funds purchased and securities sold under agreement to repurchase and other short-term borrowings
|
|
|
23,616
|
|
|
|
23,616
|
|
|
|
23,616
|
|
|
|
—
|
|
|
|
—
|
|
|
Accrued interest payable
|
|
|
110,853
|
|
|
|
110,853
|
|
|
|
3
|
|
|
|
110,850
|
|
|
|
—
|
|
|
Subordinated and long-term borrowings
|
|
|
10,706
|
|
|
|
10,570 |
|
|
|
— |
|
|
|
10,570 |
|
|
|
— |
|
|
Derivative instruments:
|
|
|
|
|
|
|
|
|
|
|
|
|
|
|
|
|
|
|
|
|
|
Assets:
|
|
|
|
|
|
|
|
|
|
|
|
|
|
|
|
|
|
|
|
|
|
Commercial loan interest rate contracts
|
|
$ |
30,555
|
|
|
$ |
30,555
|
|
|
$ |
— |
|
|
$ |
30,555
|
|
|
$ |
— |
|
|
Mortgage loan held-for-sale interest rate lock commitments
|
|
|
1,310
|
|
|
|
1,310
|
|
|
|
— |
|
|
|
— |
|
|
|
1,310
|
|
|
Mortgage loan forward sale commitments
|
|
|
816
|
|
|
|
816
|
|
|
|
— |
|
|
|
816
|
|
|
|
— |
|
|
Foreign exchange contracts
|
|
|
650
|
|
|
|
650
|
|
|
|
— |
|
|
|
650
|
|
|
|
— |
|
|
Liabilities:
|
|
|
|
|
|
|
|
|
|
|
|
|
|
|
|
|
|
|
|
|
|
Commercial loan interest rate contracts
|
|
$ |
45,070
|
|
|
$
|
45,070
|
|
|
$ |
— |
|
|
$ |
45,070
|
|
|
$ |
—
|
|
|
Mortgage loan held-for-sale interest rate lock commitments
|
|
|
|
|
|
|
|
|
|
|
3,085
|
|
|
|
— |
|
|
|
15 |
|
|
Futures, forwards and options
|
|
|
3,085
|
|
|
|
3,085
|
|
|
|
— |
|
|
|
—
|
|
|
|
— |
|
|
Mortgage loan forward sale commitments
|
|
|
34
|
|
|
|
34
|
|
|
|
— |
|
|
|
34 |
|
|
|
— |
|
|
Foreign exchange contracts
|
|
|
469
|
|
|
|
469
|
|
|
|
— |
|
|
|
469 |
|
|
|
— |
|
NOTE 10. SHARE-BASED COMPENSATION
The Company’s Long-Term Equity Incentive Plan (“Incentive Plan”), Cadence Bank Equity Incentive Plan for Non Employee Directors, 2021 Long-Term Equity
Incentive Plan and the Amended and Restated 2015 Omnibus Incentive Plan (the “2015 Plan” assumed from Legacy Cadence) were effective during the year ended December 31, 2024, and allowed the Company to grant to employees and
directors various forms of share-based incentive compensation. On December 30, 2024, the Cadence Bank 2025 Long-Term Incentive Plan (“the 2025 Plan”) was approved by the Company’s shareholders. The 2025 Plan took effect as of
December 30, 2024 and supersedes all four of the incentive plans previously mentioned.
The Company has primarily granted PSUs, RSUs and RSAs under its equity incentive plans. PSUs entitle the recipient to receive shares of the Company’s common
stock upon the achievement of performance goals that are specified in the award over a performance period. The recipient of PSUs is not treated as a shareholder of the Company and is not entitled to vote or receive dividends until
the performance conditions stated in the award are satisfied and the shares of stock are issued to the recipient. Dividend equivalents on the shares vested according to the performance conditions are paid upon issuance of the
stock. All PSUs vest over a three-year period and are valued at the fair value of the Company’s stock at the grant date based upon the estimated number of shares expected to vest through the application of a lattice model. RSUs
entitle the recipient to receive the shares once they are vested but with no voting rights until the shares are received. RSUs generally vest over four- to five-year periods and are eligible to receive dividend equivalents, which
accrue and are paid upon vesting. RSAs entitle the recipient to vote the shares of stock but the recipient does not receive the shares until they are fully vested. RSA grants vest over five- to seven-year periods and are entitled
to receive dividends.
For more information, see Note 14 to the consolidated financial statements to the Annual Report on Form 10-K for the year ended December 31, 2024.
Performance Stock Units
The following table summarizes the Company’s PSU activity for the periods indicated:
| |
|
Six Months Ended June 30,
|
|
| |
|
2025
|
|
|
2024
|
|
|
|
|
Shares |
|
|
Weighted
Average Grant
Date Fair Value
|
|
|
Shares |
|
|
Weighted
Average Grant
Date Fair Value
|
|
|
Nonvested at beginning of period
|
|
|
1,211,606 |
|
|
$ |
25.34
|
|
|
|
1,967,631 |
|
|
$
|
26.17
|
|
|
Granted during the period
|
|
|
264,729 |
|
|
|
30.64
|
|
|
|
323,293 |
|
|
|
30.26
|
|
|
Vested during the period
|
|
|
(425,767 |
) |
|
|
27.98
|
|
|
|
(444,448 |
) |
|
|
28.76
|
|
|
Forfeited during the period
|
|
|
(33,305 |
) |
|
|
26.93
|
|
|
|
(92,884 |
) |
|
|
24.53
|
|
|
Nonvested at end of period
|
|
|
1,017,263
|
|
|
$ |
25.56
|
|
|
|
1,753,592
|
|
|
$ |
26.36
|
|
The Company recorded $2.9 million and $3.1 million of compensation expense related to the PSUs for the three and six months ended June 30, 2025, respectively,
compared to $4.6 million and $6.4 million for the three and six months ended June 30, 2024, respectively. At June 30, 2025, there was $16.0 million of unrecognized compensation cost related to PSUs that is expected to be
recognized over a weighted average period of 2.05 years.
Restricted Stock Units
The following table summarizes the Company’s RSU activity for the periods indicated:
| |
|
Six Months Ended June 30,
|
|
| |
|
2025
|
|
|
2024
|
|
|
|
|
Shares |
|
|
Weighted
Average Grant
Date Fair Value
|
|
|
Shares |
|
|
Weighted
Average Grant
Date Fair Value
|
|
|
Nonvested at beginning of period
|
|
|
3,063,891
|
|
|
$ |
25.61 |
|
|
|
3,055,824 |
|
|
$
|
25.19 |
|
|
Granted during the period
|
|
|
989,660 |
|
|
|
|
|
|
|
1,021,847 |
|
|
|
|
|
|
Vested during the period
|
|
|
(375,761 |
) |
|
|
21.24
|
|
|
|
(385,808 |
) |
|
|
27.43
|
|
|
Forfeited during the period
|
|
|
(83,529 |
) |
|
|
26.77
|
|
|
|
(180,637 |
) |
|
|
25.82
|
|
|
Nonvested at end of period
|
|
|
3,594,261 |
|
|
$ |
27.35
|
|
|
|
3,511,226
|
|
|
$ |
25.94 |
|
The Company recorded $6.0 million and $10.3 million of compensation expense related to the RSUs for the three and six months ended June 30, 2025,
respectively, compared to $5.1 million and $9.4 million for the three and six months ended June 30, 2024, respectively. These amounts included $255 thousand and $500 thousand related to RSUs issued to the Company’s directors
during the three and six months ended June 30, 2025, respectively, compared to $245 thousand and $532 thousand for the three and six months ended June 30, 2024, respectively. At June 30, 2025, there was $59.7 million of
unrecognized compensation cost related to RSUs that is expected to be recognized over a weighted average period of 2.91 years.
Restricted Stock Awards
The following table summarizes the Company’s RSA activity for the periods indicated:
| |
|
Six Months Ended June 30,
|
|
| |
|
2025
|
|
|
2024
|
|
|
|
|
Shares |
|
|
Weighted
Average Grant
Date Fair Value
|
|
|
Shares |
|
|
Weighted
Average Grant
Date Fair Value
|
|
|
Nonvested at beginning of period
|
|
|
247,537 |
|
|
$ |
28.67 |
|
|
|
526,868 |
|
|
$
|
28.14 |
|
|
Vested during the period
|
|
|
(209,170 |
) |
|
|
|
|
|
|
(247,336 |
) |
|
|
27.49
|
|
|
Forfeited during the period
|
|
|
(1,867 |
) |
|
|
31.48
|
|
|
|
(29,371 |
) |
|
|
|
|
|
Nonvested at end of period
|
|
|
36,500 |
|
|
$ |
18.79
|
|
|
|
250,161 |
|
|
$ |
28.70 |
|
The Company recorded $165 thousand and $432 thousand of compensation expense related to the RSAs for the three and six months ended June 30, 2025,
respectively, compared to $293 thousand and $331 thousand for the three and six months ended June 30, 2024, respectively. At June 30, 2025, there was $193 thousand of unrecognized compensation cost related to RSAs that is
expected to be recognized over a weighted average period of 1.92 years.
The following table presents information regarding the vesting of the Company’s nonvested share-based compensation grants outstanding at June 30, 2025:
| |
|
Number of Shares
|
|
|
Period Ending
|
|
|
PSU
|
|
|
|
RSU
|
|
|
|
RSA
|
|
|
December 31, 2026
|
|
|
504,002
|
|
|
|
1,618,638
|
|
|
|
—
|
|
|
December 31, 2027
|
|
|
249,768
|
|
|
|
987,152
|
|
|
|
36,500
|
|
|
December 31, 2028
|
|
|
263,493
|
|
|
|
662,227
|
|
|
|
—
|
|
|
December 31, 2029 and later
|
|
|
—
|
|
|
|
326,244
|
|
|
|
—
|
|
|
Total nonvested shares
|
|
|
1,017,263
|
|
|
|
3,594,261
|
|
|
|
36,500
|
|
NOTE 11. EARNINGS PER SHARE AND DIVIDEND DATA
Basic and diluted EPS are calculated in accordance with ASC 260, Earnings Per Share. Basic EPS is computed by
dividing net income available to common shareholders by the weighted-average number of common shares outstanding for the period. Diluted EPS is computed using the weighted-average number of shares determined for the basic EPS
computation plus the shares resulting from the assumed exercise of all outstanding share-based awards using the treasury stock method. There were 444 and 129,978 antidilutive equity awards excluded from dilutive shares for the
three months ended June 30, 2025 and 2024, respectively. There were 222 and 124,419 antidilutive equity awards excluded from dilutive shares for six months ended June 30, 2025 and 2024, respectively.
The following table provides a reconciliation of the numerators and denominators of the basic and diluted EPS computations for the periods indicated:
| |
|
|
Three Months Ended June 30,
|
|
|
|
Six Months Ended June 30,
|
|
|
(In thousands, except per share amounts)
|
|
|
2025
|
|
|
|
2024
|
|
|
|
2025
|
|
|
|
2024
|
|
|
Net income
|
|
$
|
134,645
|
|
|
$
|
137,472
|
|
|
$ |
267,867 1
|
|
|
$ |
254,450
|
|
|
Less: preferred dividends
|
|
|
4,744
|
|
|
|
2,372
|
|
|
|
7,116 2
|
|
|
|
4,744
|
|
|
Net income available to common shareholders
|
|
$
|
129,901
|
|
|
$
|
135,100
|
|
|
$
|
260,751
|
|
|
$
|
249,706
|
|
|
|
|
|
|
|
|
|
|
|
|
|
|
|
|
|
|
|
Weighted average common shares outstanding
|
|
|
185,575
|
|
|
|
182,647
|
|
|
|
184,559
|
|
|
|
182,610
|
|
|
Dilutive effect of stock compensation
|
|
|
2,068
|
|
|
|
2,614
|
|
|
|
2,329
|
|
|
|
2,808
|
|
|
Weighted average diluted common shares
|
|
|
187,643
|
|
|
|
185,261
|
|
|
|
186,888
|
|
|
|
185,418
|
|
|
|
|
|
|
|
|
|
|
|
|
|
|
|
|
|
|
|
Basic earnings per common share
|
|
$
|
0.70
|
|
|
$
|
0.74
|
|
|
|
1.41
|
|
|
|
1.37
|
|
|
|
|
|
|
|
|
|
|
|
|
|
|
|
|
|
|
|
Diluted earnings per common share
|
|
$
|
0.69
|
|
|
$
|
0.73
|
|
|
|
1.40
|
|
|
|
1.35
|
|
Dividends to shareholders are subject to approval by the applicable regulatory authorities.
NOTE 12. ACCUMULATED OTHER COMPREHENSIVE INCOME (LOSS) (“AOCI”)
Activity within the balances in accumulated other comprehensive income (loss) is shown in the following tables for the periods indicated:
(In thousands)
|
|
|
Unrealized loss on AFS
securities
|
|
|
|
|
Pension and other
postretirement benefits
|
|
|
|
|
Accumulated other
comprehensive loss
|
|
|
Balance at March 31, 2025
|
|
$
|
(577,989
|
) |
|
|
$ |
(43,214
|
)
|
|
|
$
|
(621,203
|
)
|
|
Net change
|
|
|
44,491
|
|
|
|
|
555
|
|
|
|
|
45,046
|
|
|
Balance at June 30, 2025
|
|
$
|
(533,498
|
) |
|
|
$ |
(42,659
|
)
|
|
|
$ |
(576,157
|
)
|
|
|
|
|
|
|
|
|
|
|
|
|
|
|
|
|
|
Balance at March 31, 2024
|
|
$
|
(746,905
|
) |
|
|
$ |
(44,428
|
)
|
|
|
$ |
(791,333
|
)
|
|
Net change
|
|
|
8,399
|
|
|
|
|
472
|
|
|
|
|
8,871
|
|
|
Balance at June 30, 2024
|
|
$
|
(738,506
|
) |
|
|
$ |
(43,956
|
)
|
|
|
$ |
(782,462
|
)
|
|
|
|
|
|
|
|
|
|
|
|
|
|
|
|
|
|
Balance at December 31, 2024
|
|
$
|
(650,725
|
) |
|
|
$ |
(43,770
|
)
|
|
|
$ |
(694,495
|
)
|
|
Net change
|
|
|
117,227
|
|
|
|
|
1,111
|
|
|
|
|
118,338
|
|
|
Balance at June 30, 2025
|
|
$
|
(533,498
|
) |
|
|
$ |
(42,659
|
)
|
|
|
$ |
(576,157
|
)
|
|
|
|
|
|
|
|
|
|
|
|
|
|
|
|
|
|
Balance at December 31, 2023
|
|
$
|
(716,749
|
) |
|
|
$ |
(45,080
|
)
|
|
|
$ |
(761,829
|
)
|
|
Net change
|
|
|
(21,757
|
) |
|
|
|
1,124
|
|
|
|
|
(20,633
|
)
|
|
Balance at June 30, 2024
|
|
$
|
(738,506
|
) |
|
|
$ |
(43,956
|
)
|
|
|
$ |
(782,462
|
)
|
NOTE 13. CAPITAL AND REGULATORY MATTERS
The Company is subject to various regulatory capital requirements administered by the federal and state banking agencies. Regulatory capital ratios at June
30, 2025 and December 31, 2024 were calculated in accordance with the Basel III capital framework as well as the interagency final rule published on September 30, 2020 entitled “Revised Transition of the Current Expected Credit
Losses Methodology for Allowances.” Failure to meet minimum capital requirements can initiate certain mandatory and possibly additional discretionary actions by regulators that, if undertaken, could have a direct material adverse
effect on the Company’s consolidated financial statements. Under capital adequacy guidelines and the regulatory framework for prompt corrective action, the Company must meet specific capital guidelines that involve quantitative
measures of the Company’s assets, liabilities and certain off-balance sheet items as calculated under regulatory accounting practices. The Company’s capital amounts and classification are also subject to qualitative judgments by
regulators about components, risk weightings and other factors. Quantitative measures are established by regulation to ensure capital adequacy and require the Company to maintain minimum capital amounts and ratios.
Additionally, regulatory capital rules include a capital conservation buffer which the Company must maintain in addition to its minimum risk-based capital requirements. This buffer applies to all three
risk-based capital measurements (CET1, Tier 1 and total capital to risk-weighted assets). A financial institution with a conservation buffer of less than the required amount is subject to limitations on capital distributions,
including dividend payments, stock repurchases, and certain discretionary bonus payments to executive officers.
The actual capital amounts and ratios for the Company are presented in the following tables and as shown, exceed the thresholds necessary to be considered “well capitalized.” Management believes that no
events or changes have occurred subsequent to the indicated dates that would change this designation.
| |
|
June 30, 2025 |
|
|
December 31, 2024 |
|
|
(Dollars in thousands)
|
|
Amount
|
|
|
Ratio
|
|
|
Amount
|
|
|
Ratio
|
|
|
Actual:
|
|
|
|
|
|
|
|
|
|
|
|
|
|
Common equity Tier 1 capital (to risk-weighted assets)
|
|
$
|
4,871,652
|
|
|
|
12.18
|
%
|
|
$
|
4,693,487
|
|
|
|
12.35
|
%
|
|
Tier 1 capital (to risk-weighted assets)
|
|
|
5,038,645
|
|
|
|
12.60
|
|
|
|
4,860,480
|
|
|
|
12.79
|
|
|
Total capital (to risk-weighted assets)
|
|
|
5,515,711
|
|
|
|
13.79
|
|
|
|
5,306,647
|
|
|
|
13.97
|
|
|
Tier 1 leverage capital (to average assets)
|
|
|
5,038,645
|
|
|
|
10.35
|
|
|
|
4,860,480
|
|
|
|
10.41
|
|
|
Minimum requirement(1):
|
|
|
|
|
|
|
|
|
|
|
|
|
|
|
|
|
|
Common equity Tier 1 capital (to risk-weighted assets)
|
|
|
1,799,711
|
|
|
|
4.50
|
|
|
|
1,709,652
|
|
|
|
4.50
|
|
|
Tier 1 capital (to risk-weighted assets)
|
|
|
2,399,615
|
|
|
|
6.00
|
|
|
|
2,279,536
|
|
|
|
6.00
|
|
|
Total capital (to risk-weighted assets)
|
|
|
3,199,486
|
|
|
|
8.00
|
|
|
|
3,039,382
|
|
|
|
8.00
|
|
|
Tier 1 leverage capital (to average assets)
|
|
|
1,948,042
|
|
|
|
4.00
|
|
|
|
1,867,273
|
|
|
|
4.00
|
|
|
Well capitalized requirement under prompt corrective action provisions:
|
|
|
|
|
|
|
|
|
|
|
|
|
|
|
|
|
|
Common equity Tier 1 capital (to risk-weighted assets)
|
|
|
2,599,582
|
|
|
|
6.50
|
|
|
|
2,469,498
|
|
|
|
6.50
|
|
|
Tier 1 capital (to risk-weighted assets)
|
|
|
3,199,486
|
|
|
|
8.00
|
|
|
|
3,039,382
|
|
|
|
8.00
|
|
|
Total capital (to risk-weighted assets)
|
|
|
3,999,358
|
|
|
|
10.00
|
|
|
|
3,799,227
|
|
|
|
10.00
|
|
|
Tier 1 leverage capital (to average assets)
|
|
|
2,435,053
|
|
|
|
5.00
|
|
|
|
2,334,092
|
|
|
|
5.00
|
|
|
(1)
|
The additional capital conservation buffer in effect was 2.5%.
|
On April 25, 2025, the Company announced a share repurchase program whereby the Company may acquire up to an aggregate of 10,000,000 shares of its common stock in the open market at prevailing market
prices or in privately negotiated transactions. No shares had been purchased by the Company under this repurchase program as of June 30, 2025.
The extent and timing of any repurchases depends on market conditions and other corporate, legal and regulatory considerations. Repurchased shares are held as authorized and unissued shares. These
authorized but unissued shares are available for use in the Company’s stock compensation programs, other transactions, or for other corporate purposes as determined by the Company’s Board of Directors.
Federal and state banking laws and regulations and state corporate laws restrict the amount of dividends that the Company may declare and pay. Under Mississippi law, the Company cannot pay any dividend on
its common stock unless it has received written approval of the Commissioner of the MDBCF. The federal banking agencies have indicated that paying dividends that deplete a depository institution’s capital base to an inadequate level
would be an unsafe and unsound banking practice. The Federal Reserve must approve any dividend that exceeds the Company’s current year’s net income plus its retained net income from the prior two calendar years.
NOTE 14. SEGMENT REPORTING
The Company determines operating segments based upon the services offered, the significance of those services to the Company's financial condition and operating results, and management's regular review of
the operating results of those services. The Company’s CODM is the Company’s CEO. The application and development of management reporting methodologies is a robust process and is subject to periodic enhancements. As these enhancements
are made, financial results presented by each reportable segment may be periodically revised. Cadence makes operating decisions based on the following operating segments, as described below.
|
• |
Corporate Banking segment focuses on C&I, business banking, and commercial real estate lending to clients in the geographic footprint.
|
|
• |
Community Banking segment provides a broad range of banking services through the branch network to serve the needs of community businesses and individual consumers in the geographic footprint.
|
|
• |
Mortgage segment includes mortgage banking activities of originating mortgage loans, selling mortgage loans in the secondary market and servicing the mortgage loans that are sold on a servicing retained basis.
|
|
• |
Banking Services segment offers individuals, businesses, governmental institutions, and non-profit entities a wide range of solutions to help protect, grow, and transfer wealth. Offerings include credit-related products
via Private Banking services, trust and investment management, asset management, retirement and savings solutions, estate planning and annuity products.
|
|
• |
General Corporate and Other segment includes other activities not allocated to other aforementioned operating segments. Additionally, intercompany eliminations are included as they do not reflect normal operations of the
other segments. The disaggregation of General Corporate and Other better defines the results from the individual segments due to the direct relationship of the internal support provided by the strategic business units within
the Bank.
|
Results of operations and selected financial information by operating segment for periods indicated are presented in the following tables. The tables show total noninterest income segregated between
contracts with customers within the scope of ASC 606, Revenue from Contracts with Customers, and those within the scope of other GAAP Topics. Additionally, with the adoption of ASU 2023-07, the tables show significant segment
expenses within total noninterest expense used by the CODM to assess the performance of each segment.
Results of operations and selected financial information by operating segment for periods indicated are presented in the following tables. Also, the tables show total noninterest income segregated
between contracts with customers within the scope of ASC 606, Revenue from Contracts with Customers, and those within the scope of other GAAP Topics.
|
(In thousands)
|
|
Corporate Banking
|
|
|
Community Banking
|
|
|
Mortgage
|
|
|
Banking Services
|
|
|
General
Corporate
and Other
|
|
|
Total
|
|
|
Results of Operations
|
|
|
|
|
|
|
|
|
|
|
|
|
|
|
|
|
|
|
|
Three Months Ended June 30, 2025
|
|
|
|
|
|
|
|
|
|
|
|
|
|
|
|
|
|
|
|
Net interest revenue
|
|
$
|
108,846
|
|
|
$
|
264,214
|
|
|
$
|
28,621
|
|
|
$
|
10,460
|
|
|
$
|
(34,001
|
)
|
|
$
|
378,140
|
|
|
Provision (release) for credit losses
|
|
|
10,231
|
|
|
|
23,793
|
|
|
|
2,691
|
|
|
|
814
|
|
|
|
(6,529
|
)
|
|
|
31,000
|
|
|
Net interest revenue after provision (release) for credit losses
|
|
|
98,615
|
|
|
|
240,421
|
|
|
|
25,930
|
|
|
|
9,646
|
|
|
|
(27,472
|
)
|
|
|
347,140
|
|
|
Noninterest revenue
|
|
|
|
|
|
|
|
|
|
|
|
|
|
|
|
|
|
|
|
|
|
|
|
|
|
In Scope of Topic 606
|
|
|
|
|
|
|
|
|
|
|
|
|
|
|
|
|
|
|
|
|
|
|
|
|
|
Trust and asset management income
|
|
|
167
|
|
|
|
4
|
|
|
|
—
|
|
|
|
13,821
|
|
|
|
(765
|
)
|
|
|
13,227
|
|
|
Investment advisory fees
|
|
|
—
|
|
|
|
—
|
|
|
|
—
|
|
|
|
9,048
|
|
|
|
(78
|
)
|
|
|
8,970
|
|
|
Other brokerage fees
|
|
|
—
|
|
|
|
—
|
|
|
|
—
|
|
|
|
1,633
|
|
|
|
—
|
|
|
|
1,633
|
|
|
Deposit service charges
|
|
|
4,141
|
|
|
|
13,556
|
|
|
|
—
|
|
|
|
223
|
|
|
|
141
|
|
|
|
18,061
|
|
|
Credit card, debit card and merchant fees
|
|
|
1
|
|
|
|
—
|
|
|
|
—
|
|
|
|
—
|
|
|
|
12,971
|
|
|
|
12,972
|
|
|
Total noninterest revenue (in-scope of Topic 606)
|
|
|
4,309
|
|
|
|
13,560
|
|
|
|
—
|
|
|
|
24,725
|
|
|
|
12,269
|
|
|
|
54,863
|
|
|
Total noninterest revenue (out-of-scope of Topic 606)
|
|
|
14,392
|
|
|
|
20,326
|
|
|
|
9,940
|
|
|
|
1,715
|
|
|
|
(3,055
|
)
|
|
|
43,318
|
|
|
Total noninterest revenue
|
|
|
18,701
|
|
|
|
33,886
|
|
|
|
9,940
|
|
|
|
26,440
|
|
|
|
9,214
|
|
|
|
98,181
|
|
|
Noninterest expense
|
|
|
|
|
|
|
|
|
|
|
|
|
|
|
|
|
|
|
|
|
|
|
|
|
|
Salaries and employee benefits
|
|
|
22,592
|
|
|
|
61,190
|
|
|
|
5,810
|
|
|
|
13,093
|
|
|
|
54,655
|
|
|
|
157,340
|
|
|
Occupancy and equipment
|
|
|
332
|
|
|
|
19,540
|
|
|
|
418
|
|
|
|
306
|
|
|
|
9,443
|
|
|
|
30,039
|
|
|
Data processing and software
|
|
|
774
|
|
|
|
478
|
|
|
|
1,311
|
|
|
|
1,750
|
|
|
|
26,388
|
|
|
|
30,701
|
|
|
Allocated overhead expenses
|
|
|
21,202
|
|
|
|
73,262
|
|
|
|
6,940
|
|
|
|
4,364
|
|
|
|
(105,768
|
)
|
|
|
—
|
|
|
Other segment items(1)
|
|
|
7,476
|
|
|
|
10,188
|
|
|
|
3,976
|
|
|
|
4,471
|
|
|
|
28,672
|
|
|
|
54,783
|
|
|
Total noninterest expense
|
|
|
52,376
|
|
|
|
164,658
|
|
|
|
18,455
|
|
|
|
23,984
|
|
|
|
13,390
|
|
|
|
272,863
|
|
|
Income (loss) before income taxes
|
|
|
64,940
|
|
|
|
109,649
|
|
|
|
17,415
|
|
|
|
12,102
|
|
|
|
(31,648
|
)
|
|
|
172,458
|
|
|
Income tax expense (benefit)
|
|
|
15,261
|
|
|
|
25,767
|
|
|
|
4,093
|
|
|
|
2,821
|
|
|
|
(10,129
|
)
|
|
|
37,813
|
|
|
Net income (loss)
|
|
$
|
49,679
|
|
|
$
|
83,882
|
|
|
$
|
13,322
|
|
|
$
|
9,281
|
|
|
$
|
(21,519
|
)
|
|
$
|
134,645
|
|
|
Selected Financial Information
|
|
|
|
|
|
|
|
|
|
|
|
|
|
|
|
|
|
|
|
|
|
|
|
|
|
Total assets at end of period
|
|
$
|
12,007,032
|
|
|
$
|
17,906,415
|
|
|
$
|
6,416,671
|
|
|
$
|
1,264,077
|
|
|
$
|
12,784,645
|
|
|
$
|
50,378,840
|
|
|
(1)
|
Other segment items for each reportable segment includes:
|
|
• |
Corporate Banking: legal expenses, travel expenses and certain overhead expenses.
|
|
• |
Community Banking: advertising, office supplies, ATM expenses, delivery expenses, professional and consulting fees, legal expenses, telecommunication and postage expenses, travel
expenses, and certain overhead expenses.
|
|
• |
Mortgage: loan quality control and loan repurchase expenses, legal expenses, and certain overhead expenses.
|
|
• |
Banking Services: amortization of intangibles, professional and consulting fees, legal expenses, and certain overhead expenses.
|
|
• |
General, Corporate and Other: advertising, supplies, regulatory expenses, and certain other overhead expenses.
|
|
(In thousands)
|
|
Corporate Banking
|
|
|
Community Banking
|
|
|
Mortgage
|
|
|
Banking Services
|
|
|
General
Corporate
and Other
|
|
|
Total
|
|
|
Results of Operations
|
|
|
|
|
|
|
|
|
|
|
|
|
|
|
|
|
|
|
|
Three Months Ended June 30, 2024
|
|
|
|
|
|
|
|
|
|
|
|
|
|
|
|
|
|
|
|
Net interest revenue
|
|
$
|
111,148
|
|
|
$
|
274,603
|
|
|
$
|
23,028
|
|
|
$
|
9,921
|
|
|
$
|
(62,382
|
)
|
|
$
|
356,318
|
|
|
Provision (release) for credit losses
|
|
|
16,385
|
|
|
|
(1,880
|
)
|
|
|
7,531
|
|
|
|
(59
|
)
|
|
|
23
|
|
|
|
22,000
|
|
|
Net interest revenue after provision (release) for credit losses
|
|
|
94,763
|
|
|
|
276,483
|
|
|
|
15,497
|
|
|
|
9,980
|
|
|
|
(62,405
|
)
|
|
|
334,318
|
|
|
Noninterest revenue
|
|
|
|
|
|
|
|
|
|
|
|
|
|
|
|
|
|
|
|
|
|
|
|
|
|
In Scope of Topic 606
|
|
|
|
|
|
|
|
|
|
|
|
|
|
|
|
|
|
|
|
|
|
|
|
|
|
Trust and asset management income
|
|
|
378
|
|
|
|
4
|
|
|
|
—
|
|
|
|
13,003
|
|
|
|
(740
|
)
|
|
|
12,645
|
|
|
Investment advisory fees
|
|
|
—
|
|
|
|
—
|
|
|
|
—
|
|
|
|
8,230
|
|
|
|
(50
|
)
|
|
|
8,180
|
|
|
Other brokerage fees
|
|
|
—
|
|
|
|
—
|
|
|
|
—
|
|
|
|
1,514
|
|
|
|
1
|
|
|
|
1,515
|
|
|
Deposit service charges
|
|
|
3,405
|
|
|
|
13,299
|
|
|
|
—
|
|
|
|
950
|
|
|
|
(2
|
)
|
|
|
17,652
|
|
|
Credit card, debit card and merchant fees
|
|
|
146
|
|
|
|
9,504
|
|
|
|
—
|
|
|
|
4
|
|
|
|
3,116
|
|
|
|
12,770
|
|
|
Total noninterest revenue (in-scope of Topic 606)
|
|
|
3,929
|
|
|
|
22,807
|
|
|
|
—
|
|
|
|
23,701
|
|
|
|
2,325
|
|
|
|
52,762
|
|
|
Total noninterest revenue (out-of-scope of Topic 606)
|
|
|
7,547
|
|
|
|
9,347
|
|
|
|
7,358
|
|
|
|
2,751
|
|
|
|
20,893
|
|
|
|
47,896
|
|
|
Total noninterest revenue
|
|
|
11,476
|
|
|
|
32,154
|
|
|
|
7,358
|
|
|
|
26,452
|
|
|
|
23,218
|
|
|
|
100,658
|
|
|
Noninterest expense
|
|
|
|
|
|
|
|
|
|
|
|
|
|
|
|
|
|
|
|
|
|
|
|
|
|
Salaries and employee benefits
|
|
|
19,894
|
|
|
|
56,676
|
|
|
|
5,567
|
|
|
|
12,867
|
|
|
|
53,034
|
|
|
|
148,038
|
|
|
Occupancy and equipment
|
|
|
1,016
|
|
|
|
19,374
|
|
|
|
1,092
|
|
|
|
832
|
|
|
|
7,053
|
|
|
|
29,367
|
|
|
Data processing and software
|
|
|
766
|
|
|
|
441
|
|
|
|
968
|
|
|
|
1,786
|
|
|
|
25,506
|
|
|
|
29,467
|
|
|
Allocated overhead expenses
|
|
|
22,413
|
|
|
|
59,362
|
|
|
|
6,859
|
|
|
|
3,743
|
|
|
|
(92,377
|
)
|
|
|
—
|
|
|
Other segment items(1)
|
|
|
9,725
|
|
|
|
10,989
|
|
|
|
3,121
|
|
|
|
4,692
|
|
|
|
21,298
|
|
|
|
49,825
|
|
|
Total noninterest expense
|
|
|
53,814
|
|
|
|
146,842
|
|
|
|
17,607
|
|
|
|
23,920
|
|
|
|
14,514
|
|
|
|
256,697
|
|
|
Income (loss) before income taxes
|
|
|
52,425
|
|
|
|
161,795
|
|
|
|
5,248
|
|
|
|
12,512
|
|
|
|
(53,701
|
)
|
|
|
178,279
|
|
|
Income tax expense (benefit)
|
|
|
12,320
|
|
|
|
38,022
|
|
|
|
1,233
|
|
|
|
2,925
|
|
|
|
(13,693
|
)
|
|
|
40,807
|
|
|
Net income (loss)
|
|
$
|
40,105
|
|
|
$
|
123,773
|
|
|
$
|
4,015
|
|
|
$
|
9,587
|
|
|
$
|
(40,008
|
)
|
|
$
|
137,472
|
|
|
Selected Financial Information
|
|
|
|
|
|
|
|
|
|
|
|
|
|
|
|
|
|
|
|
|
|
|
|
|
|
Total assets at end of period
|
|
$
|
11,775,671
|
|
|
$
|
17,068,177
|
|
|
$
|
5,331,570
|
|
|
$
|
1,123,239
|
|
|
$
|
12,685,421
|
|
|
$
|
47,984,078
|
|
|
(1)
|
Other segment items for each reportable segment includes:
|
|
• |
Corporate Banking: legal expenses, travel expenses and certain overhead expenses.
|
|
• |
Community Banking: advertising, office supplies, ATM expenses, delivery expenses, professional and consulting fees, legal expenses, telecommunication and postage expenses, travel
expenses, and certain overhead expenses.
|
|
• |
Mortgage: loan quality control and loan repurchase expenses, legal expenses, and certain overhead expenses.
|
|
• |
Banking Services: amortization of intangibles, professional and consulting fees, legal expenses, and certain overhead expenses.
|
|
• |
General, Corporate and Other: advertising, supplies, regulatory expenses, and certain other overhead expenses.
|
|
(In thousands)
|
|
Corporate Banking
|
|
|
Community Banking
|
|
|
Mortgage
|
|
|
Banking Services
|
|
|
General
Corporate
and Other
|
|
|
Total
|
|
|
Results of Operations
|
|
|
|
|
|
|
|
|
|
|
|
|
|
|
|
|
|
|
|
Six Months Ended June 30, 2025
|
|
|
|
|
|
|
|
|
|
|
|
|
|
|
|
|
|
|
|
Net interest revenue
|
|
$
|
218,386
|
|
|
$
|
525,092
|
|
|
$
|
55,587
|
|
|
$
|
20,869
|
|
|
$
|
(78,642
|
)
|
|
$
|
741,292
|
|
|
Provision (release) for credit losses
|
|
|
18,712
|
|
|
|
30,509
|
|
|
|
10,718
|
|
|
|
1,711
|
|
|
|
(10,650
|
)
|
|
|
51,000
|
|
|
Net interest revenue after provision (release) for credit losses
|
|
|
199,674
|
|
|
|
494,583
|
|
|
|
44,869
|
|
|
|
19,158
|
|
|
|
(67,992
|
)
|
|
|
690,292
|
|
|
Noninterest revenue
|
|
|
|
|
|
|
|
|
|
|
|
|
|
|
|
|
|
|
|
|
|
|
|
|
|
In Scope of Topic 606
|
|
|
|
|
|
|
|
|
|
|
|
|
|
|
|
|
|
|
|
|
|
|
|
|
|
Trust and asset management income
|
|
|
483
|
|
|
|
8
|
|
|
|
—
|
|
|
|
26,091
|
|
|
|
(1,532
|
)
|
|
|
25,050
|
|
|
Investment advisory fees
|
|
|
—
|
|
|
|
—
|
|
|
|
—
|
|
|
|
17,546
|
|
|
|
(122
|
)
|
|
|
17,424
|
|
|
Other brokerage fees
|
|
|
—
|
|
|
|
—
|
|
|
|
—
|
|
|
|
3,303
|
|
|
|
—
|
|
|
|
3,303
|
|
|
Deposit service charges
|
|
|
8,100
|
|
|
|
27,520
|
|
|
|
—
|
|
|
|
477
|
|
|
|
(300
|
)
|
|
|
35,797
|
|
|
Credit card, debit card and merchant fees
|
|
|
2
|
|
|
|
8,623
|
|
|
|
—
|
|
|
|
—
|
|
|
|
16,336
|
|
|
|
24,961
|
|
|
Total noninterest revenue (in-scope of Topic 606)
|
|
|
8,585
|
|
|
|
36,151
|
|
|
|
—
|
|
|
|
47,417
|
|
|
|
14,382
|
|
|
|
106,535
|
|
|
Total noninterest revenue (out-of-scope of Topic 606)
|
|
|
24,720
|
|
|
|
30,397
|
|
|
|
17,793
|
|
|
|
3,301
|
|
|
|
822
|
|
|
|
77,033
|
|
|
Total noninterest revenue
|
|
|
33,305
|
|
|
|
66,548
|
|
|
|
17,793
|
|
|
|
50,718
|
|
|
|
15,204
|
|
|
|
183,568
|
|
|
Noninterest expense
|
|
|
|
|
|
|
|
|
|
|
|
|
|
|
|
|
|
|
|
|
|
|
|
|
|
Salaries and employee benefits
|
|
|
44,357
|
|
|
|
122,542
|
|
|
|
11,612
|
|
|
|
26,567
|
|
|
|
105,234
|
|
|
|
310,312
|
|
|
Occupancy and equipment
|
|
|
655
|
|
|
|
39,220
|
|
|
|
825
|
|
|
|
623
|
|
|
|
17,193
|
|
|
|
58,516
|
|
|
Data processing and software
|
|
|
1,912
|
|
|
|
1,171
|
|
|
|
2,449
|
|
|
|
2,776
|
|
|
|
49,525
|
|
|
|
57,833
|
|
|
Allocated overhead expenses
|
|
|
40,777
|
|
|
|
139,070
|
|
|
|
12,869
|
|
|
|
8,344
|
|
|
|
(201,060
|
)
|
|
|
—
|
|
|
Other segment items(1)
|
|
|
17,376
|
|
|
|
18,952
|
|
|
|
9,040
|
|
|
|
8,844
|
|
|
|
51,339
|
|
|
|
105,551
|
|
|
Total noninterest expense
|
|
|
105,077
|
|
|
|
320,955
|
|
|
|
36,795
|
|
|
|
47,154
|
|
|
|
22,231
|
|
|
|
532,212
|
|
|
Income (loss) before income taxes
|
|
|
127,902
|
|
|
|
240,176
|
|
|
|
25,867
|
|
|
|
22,722
|
|
|
|
(75,019
|
)
|
|
|
341,648
|
|
|
Income tax expense (benefit)
|
|
|
30,057
|
|
|
|
56,441
|
|
|
|
6,079
|
|
|
|
5,313
|
|
|
|
(24,109
|
)
|
|
|
73,781
|
|
|
Net income (loss)
|
|
$
|
97,845
|
|
|
$
|
183,735
|
|
|
$
|
19,788
|
|
|
$
|
17,409
|
|
|
$
|
(50,910
|
)
|
|
$
|
267,867
|
|
|
Selected Financial Information
|
|
|
|
|
|
|
|
|
|
|
|
|
|
|
|
|
|
|
|
|
|
|
|
|
|
Total assets at end of period
|
|
$
|
12,007,032
|
|
|
$
|
17,906,415
|
|
|
$
|
6,416,671
|
|
|
$
|
1,264,077
|
|
|
$
|
12,784,645
|
|
|
$
|
50,378,840
|
|
|
(1)
|
Other segment items for each reportable segment includes:
|
|
• |
Corporate Banking: legal expenses, travel expenses and certain overhead expenses.
|
|
• |
Community Banking: advertising, office supplies, ATM expenses, delivery expenses, professional and consulting fees, legal expenses, telecommunication and postage expenses, travel
expenses, and certain overhead expenses.
|
|
• |
Mortgage: loan quality control and loan repurchase expenses, legal expenses, and certain overhead expenses.
|
|
• |
Banking Services: amortization of intangibles, professional and consulting fees, legal expenses, and certain overhead expenses.
|
|
• |
General, Corporate and Other: advertising, supplies, regulatory expenses, and certain other overhead expenses.
|
|
(In thousands)
|
|
Corporate Banking
|
|
|
Community Banking
|
|
|
Mortgage
|
|
|
Banking Services
|
|
|
General
Corporate
and Other
|
|
|
Total
|
|
|
Results of Operations
|
|
|
|
|
|
|
|
|
|
|
|
|
|
|
|
|
|
|
|
Six Months Ended June 30, 2024
|
|
|
|
|
|
|
|
|
|
|
|
|
|
|
|
|
|
|
|
Net interest revenue
|
|
$
|
224,416
|
|
|
$
|
557,933
|
|
|
$
|
45,025
|
|
|
$
|
20,050
|
|
|
$
|
(137,198
|
)
|
|
$
|
710,226
|
|
|
Provision (release) for credit losses
|
|
|
36,929
|
|
|
|
(4,443
|
)
|
|
|
8,678
|
|
|
|
(753
|
)
|
|
|
3,589
|
|
|
|
44,000
|
|
|
Net interest revenue after provision (release) for credit losses
|
|
|
187,487
|
|
|
|
562,376
|
|
|
|
36,347
|
|
|
|
20,803
|
|
|
|
(140,787
|
)
|
|
|
666,226
|
|
|
Noninterest revenue
|
|
|
|
|
|
|
|
|
|
|
|
|
|
|
|
|
|
|
|
|
|
|
|
|
|
In Scope of Topic 606
|
|
|
|
|
|
|
|
|
|
|
|
|
|
|
|
|
|
|
|
|
|
|
|
|
|
Trust and asset management income
|
|
|
644
|
|
|
|
7
|
|
|
|
—
|
|
|
|
24,762
|
|
|
|
(1,446
|
)
|
|
|
23,967
|
|
|
Investment advisory fees
|
|
|
—
|
|
|
|
—
|
|
|
|
—
|
|
|
|
16,611
|
|
|
|
(94
|
)
|
|
|
16,517
|
|
|
Other brokerage fees
|
|
|
—
|
|
|
|
—
|
|
|
|
—
|
|
|
|
2,984
|
|
|
|
—
|
|
|
|
2,984
|
|
|
Deposit service charges
|
|
|
6,702
|
|
|
|
26,890
|
|
|
|
—
|
|
|
|
1,881
|
|
|
|
516
|
|
|
|
35,989
|
|
|
Credit card, debit card and merchant fees
|
|
|
306
|
|
|
|
18,505
|
|
|
|
—
|
|
|
|
8
|
|
|
|
6,113
|
|
|
|
24,932
|
|
|
Total noninterest revenue (in-scope of Topic 606)
|
|
|
7,652
|
|
|
|
45,402
|
|
|
|
—
|
|
|
|
46,246
|
|
|
|
5,089
|
|
|
|
104,389
|
|
|
Total noninterest revenue (out-of-scope of Topic 606)
|
|
|
17,371
|
|
|
|
18,614
|
|
|
|
14,932
|
|
|
|
6,465
|
|
|
|
22,673
|
|
|
|
80,055
|
|
|
Total noninterest revenue
|
|
|
25,023
|
|
|
|
64,016
|
|
|
|
14,932
|
|
|
|
52,711
|
|
|
|
27,762
|
|
|
|
184,444
|
|
|
Noninterest expense
|
|
|
|
|
|
|
|
|
|
|
|
|
|
|
|
|
|
|
|
|
|
|
|
|
|
Salaries and employee benefits
|
|
|
41,616
|
|
|
|
115,030
|
|
|
|
12,378
|
|
|
|
27,745
|
|
|
|
107,920
|
|
|
|
304,689
|
|
|
Occupancy and equipment
|
|
|
2,042
|
|
|
|
36,898
|
|
|
|
2,193
|
|
|
|
1,687
|
|
|
|
15,187
|
|
|
|
58,007
|
|
|
Data processing and software
|
|
|
1,677
|
|
|
|
882
|
|
|
|
1,965
|
|
|
|
3,131
|
|
|
|
51,839
|
|
|
|
59,494
|
|
|
Allocated overhead expenses
|
|
|
47,986
|
|
|
|
122,653
|
|
|
|
14,499
|
|
|
|
7,648
|
|
|
|
(192,786
|
)
|
|
|
—
|
|
|
Other segment items(1)
|
|
|
17,089
|
|
|
|
22,896
|
|
|
|
6,329
|
|
|
|
9,964
|
|
|
|
41,436
|
|
|
|
97,714
|
|
|
Total noninterest expense
|
|
|
110,410
|
|
|
|
298,359
|
|
|
|
37,364
|
|
|
|
50,175
|
|
|
|
23,596
|
|
|
|
519,904
|
|
|
Income (loss) before income taxes
|
|
|
102,100
|
|
|
|
328,033
|
|
|
|
13,915
|
|
|
|
23,339
|
|
|
|
(136,621
|
)
|
|
|
330,766
|
|
|
Income tax expense (benefit)
|
|
|
23,993
|
|
|
|
77,088
|
|
|
|
3,270
|
|
|
|
5,467
|
|
|
|
(33,502
|
)
|
|
|
76,316
|
|
|
Net income (loss)
|
|
$
|
78,107
|
|
|
$
|
250,945
|
|
|
$
|
10,645
|
|
|
$
|
17,872
|
|
|
$
|
(103,119
|
)
|
|
$
|
254,450
|
|
|
Selected Financial Information
|
|
|
|
|
|
|
|
|
|
|
|
|
|
|
|
|
|
|
|
|
|
|
|
|
|
Total assets at end of period
|
|
$
|
11,775,671
|
|
|
$
|
17,068,177
|
|
|
$
|
5,331,570
|
|
|
$
|
1,123,239
|
|
|
$
|
12,685,421
|
|
|
$
|
47,984,078
|
|
|
(1)
|
Other segment items for each reportable segment includes:
|
|
• |
Corporate Banking: legal expenses, travel expenses and certain overhead expenses.
|
|
• |
Community Banking: advertising, office supplies, ATM expenses, delivery expenses, professional and consulting fees, legal expenses, telecommunication and postage expenses, travel
expenses, and certain overhead expenses.
|
|
• |
Mortgage: loan quality control and loan repurchase expenses, legal expenses, and certain overhead expenses.
|
|
• |
Banking Services: amortization of intangibles, professional and consulting fees, legal expenses, and certain overhead expenses.
|
|
• |
General, Corporate, and Other: advertising, supplies, regulatory expenses, and certain other overhead expenses.
|
NOTE 15. DERIVATIVE INSTRUMENTS
The Company primarily uses derivatives to manage exposure to market risk, including interest rate risk, credit risk and foreign currency risk, and to assist customers with their risk management
objectives. Management may designate certain derivatives as hedging instruments in a qualifying hedge accounting relationship. The Company’s derivative instruments consist of economic hedges for which the Company has elected not to
apply hedge accounting and derivatives held for customer accommodation, or other purposes.
The fair value of outstanding derivative positions is included in other assets and other liabilities in the accompanying consolidated balance sheets and in the net change in each of these financial
statement line items in the operating section of the accompanying consolidated statements of cash flows. For derivatives not designated as hedging instruments or determined to be an ineffective hedge under applicable accounting
guidance, gains and losses due to changes in fair value are included in noninterest income and the operating section of the consolidated statements of cash flows. For derivatives designated as cash flow hedging instruments, the
entire change in the fair value related to the derivative instrument is recognized as a component of other comprehensive income and subsequently reclassified into interest income when the forecasted transaction affects income. At
June 30, 2025 and December 31, 2024, there were no derivatives designated under hedge accounting. The notional amounts and estimated fair values for the periods indicated were as follows:
| |
|
June 30, 2025 |
|
|
December 31, 2024
|
|
| |
|
|
|
|
Fair Value
|
|
|
|
|
|
|
|
|
Fair Value |
|
|
|
|
|
(Dollars in thousands)
|
|
Notional Amount
|
|
|
Other Assets
|
|
|
Other Liabilities
|
|
|
Weighted
Average
Maturity
(years)
|
|
|
Notional Amount
|
|
|
Other Assets
|
|
|
Other Liabilities
|
|
|
Weighted
Average
Maturity
(years)
|
|
|
Commercial loan interest rate contracts
|
|
$
|
4,205,221
|
|
|
$
|
32,166
|
|
|
$
|
41,802
|
|
|
|
4.3
|
|
|
$
|
3,781,868
|
|
|
$
|
30,555
|
|
|
$
|
45,070
|
|
|
|
4.2
|
|
|
Mortgage loan held-for-sale interest rate lock commitments
|
|
|
210,457
|
|
|
|
3,890
|
|
|
|
—
|
|
|
|
0.1
|
|
|
|
151,231
|
|
|
|
1,310
|
|
|
|
15
|
|
|
|
0.1
|
|
|
Futures, forwards and options (used to hedge MSR, see Note 8)
|
|
|
228,000
|
|
|
|
2,993
|
|
|
|
—
|
|
|
|
0.2
|
|
|
|
230,000
|
|
|
|
—
|
|
|
|
3,085
|
|
|
|
0.2
|
|
|
Mortgage loan forward sale commitments
|
|
|
228,442
|
|
|
|
—
|
|
|
|
1,767
|
|
|
|
0.1
|
|
|
|
179,000
|
|
|
|
816
|
|
|
|
34
|
|
|
|
0.1
|
|
|
Foreign exchange contracts
|
|
|
64,758
|
|
|
|
1,200
|
|
|
|
1,033
|
|
|
|
0.3
|
|
|
|
55,542
|
|
|
|
650
|
|
|
|
469
|
|
|
|
0.5
|
|
|
Total derivatives
|
|
$
|
4,936,878 |
|
|
$
|
40,249 |
|
|
$
|
44,602
|
|
|
|
|
|
|
$
|
4,397,641
|
|
|
$
|
33,331
|
|
|
$
|
48,673
|
|
|
|
|
|
The Company is party to collateral support agreements with certain derivative counterparties. Such agreements require that the Company maintain collateral based on the fair values of derivative
transactions. In the event of default by the Company, the counterparty would be entitled to the collateral. At June 30, 2025, and December 31, 2024, the Company was required to post $68.1 million and $60.9 million, respectively, in
cash or qualifying securities as collateral for its derivative transactions, and these amounts were included in interest bearing deposits with other banks for the periods indicated. In addition, the Company had recorded the
obligation to return cash collateral provided by counterparties of $3.6 million and $23.1 million at June 30, 2025 and December 31, 2024, respectively, within deposits on the Company’s consolidated balance sheet. Certain financial
instruments, such as derivatives, may be eligible for offset in the consolidated balance sheet and/or subject to master netting arrangements or similar agreements. The Company’s derivative transactions with upstream financial
institution counterparties are generally executed under International Swaps and Derivative Association master agreements which include “right of set-off” provisions. In such cases, there is generally a legally enforceable right to
offset recognized amounts and there may be an intention to settle such amounts on a net basis. Nonetheless, the Company does not generally offset such financial instruments for financial reporting purposes.
The Company enters into certain interest rate contracts on commercial loans, which include swaps, floors, caps and collars that are not designated as hedging instruments. These derivative contracts
relate to transactions in which the Company enters into an interest rate contract with a loan customer while at the same time entering into an offsetting interest rate contract with another financial institution. In connection with
each swap transaction, the Company agrees to pay interest to the customer on a notional amount at a variable interest rate and receive interest from the customer on a similar notional amount at a fixed interest rate. At the same
time, the Company agrees to pay another financial institution the same fixed interest rate on the same notional amount and receive the same variable interest rate on the same notional amount. The interest rate swap, floor, cap and
collar transactions allow the Company to manage its IRR. Because the Company acts as an intermediary for its customers, changes in the fair value of the underlying derivative contracts generally offset and do not significantly
impact the Company’s consolidated statements of income. The Company is exposed to credit loss in the event of nonperformance by the parties to the interest rate contracts. However, the Company does not anticipate nonperformance by
the counterparties. At June 30, 2025 and December 31, 2024, the estimated fair value recorded in other assets on the consolidated balance sheets totaled $32.3 million and $30.6 million, respectively. The corresponding fair value
recorded in other liabilities in the accompanying consolidated balance sheets totaled $41.8 million and $45.1 million at June 30, 2025 and December 31, 2024.
The Company has both bought and sold credit protection in the form of participations on interest rate swaps (swap participations). These swap participations, which meet the definition of credit
derivatives, were entered into in the ordinary course of business to serve the credit needs of customers. Swap participations, whereby the Company has purchased credit protection, entitle the Company to receive a payment from the
counterparty if the customer fails to make payment on any amounts due to the Company upon early termination of the swap transaction. For contracts where the Company sold credit protection, the Company would be required to make
payment to the counterparty if the customer fails to make payment on any amounts due to the counterparty upon early termination of the swap transaction. Swap participation agreements where the Company is the beneficiary had notional
values totaling $212.1 million and $205.1 million at June 30, 2025 and December 31, 2024, respectively. Swap participation agreements where the Company is the guarantor had notional values totaling $469.4 million and $443.0 million
at June 30, 2025 and December 31, 2024, respectively.
The Company enters into interest rate lock commitments with customers in connection with residential mortgage loan applications for loans the Company intends to sell. Additionally, the Company enters into
mortgage loan forward sales commitments of MBS with investors to mitigate the effect of IRR inherent in providing interest rate lock commitments to customers. Both the interest rate lock commitments and mortgage loan forward sales
commitments are considered derivatives under current accounting guidance and are required to be recorded at fair value. The fair value of these derivatives is recorded on the consolidated balance sheets in other assets and other
liabilities. The change in fair value of these instruments is recorded within mortgage banking revenue in the consolidated statements of income. For the three months ended June 30, 2025 and 2024, mortgage loans held for sale interest
rate lock commitments and mortgage loan forward sales commitments totaled $1.5 million in gains compared to $0.2 million in losses, respectively. For the six months ended June 30, 2025 and 2024, mortgage loans held for sale interest
rate lock commitments and mortgage loan forward sales commitment gains totaled $2.7 million and $1.6 million, respectively.
The Company has an economic hedge in place on its MSR and uses various instruments (including but not limited to Treasury options, SOFR and TBA futures and forwards) to mitigate the IRR associated with
the MSR. These hedging instruments are reported at fair value, with adjustments included as part of mortgage banking revenue in the consolidated statements of income. For the three months ended June 30, 2025 and 2024, the market value
adjustment on MSR hedge totaled
$1.1 million in net gains compared to $1.9 million in net losses, respectively. For the six months ended June 30, 2025 and 2024, the market value adjustment on MSR hedge totaled $4.4 million in net gains
million compared to $6.7 million in net losses, respectively. See Note 8 for additional information.
The Company enters into certain foreign currency exchange contracts on behalf of its clients to facilitate their risk management strategies, while at the same time entering into offsetting foreign
currency exchange contracts with another counterparty in order to minimize the Company’s foreign currency exchange risk. The contracts are short term in nature, and any gain or loss incurred at settlement is recorded in other
noninterest income. The fair value of these contracts is reported in other assets and other liabilities. Foreign exchange contract net gains totaled $1.2 million and $1.0 million for the three months ended June 30, 2025 and 2024,
respectively, and net gains of $2.2 million and $1.8 million for the six months ended June 30, 2025 and 2024, respectively.
NOTE 16. COMMITMENTS AND CONTINGENT LIABILITIES
Mortgage Loans Serviced for Others
The Company services mortgage loans for other financial institutions that are not included as assets in the Company’s accompanying consolidated financial statements. Included in the $8.2 billion and $8.0
billion of mortgage loans serviced for investors at June 30, 2025 and December 31, 2024, respectively, was $0.6 million of primary recourse servicing pursuant to which the Company is responsible for any losses incurred in the event of
nonperformance by the mortgagor. The Company's exposure to credit loss in the event of such nonperformance is the unpaid principal balance at the time of default. This exposure is limited by the underlying collateral, which consists
of single family residences and either federal or private mortgage insurance.
Lending Commitments
The consolidated financial statements do not reflect various commitments and contingent liabilities which arise in the ordinary course of business in the banking industry and involve elements of credit
risk, IRR, and liquidity risk. Such financial instruments are recorded when they are funded. At June 30, 2025 and December 31, 2024, these included $467.3 million and $448.9 million, respectively, in letters of credit and $9.1 billion
and $8.6 billion, respectively, in unfunded extensions of credit such as interim mortgage financing, construction credit, credit card, and revolving line of credit arrangements.
Commitments to extend credit and letters of credit include some exposure to credit loss in the event of nonperformance of the customer. Commitments to extend credit are agreements to lend to a customer as
long as there is no violation of any condition established in the contract. In addition, the Company has entered into certain contingent commitments to grant loans. Standby letters of credit are conditional commitments issued to
guarantee the performance of a customer to a third party. The credit policies and procedures for such commitments are the same as those used for lending activities. Because these instruments have fixed maturity dates and because a
number expire without being drawn upon, they generally do not present any significant liquidity risk. The Company did not realize significant credit losses from these commitments and arrangements during the three and six months ended
June 30, 2025 and 2024.
Other Commitments
The Company makes investments in limited partnerships, including certain affordable housing partnerships for which it receives tax credits. At June 30, 2025 and December 31, 2024,
unfunded capital commitments totaled $266.5 million and $277.4 million, respectively. See Note 17 for more information.
Litigation
The nature of the Company’s business ordinarily results in certain types of claims, litigation, investigations, and other legal or administrative cases and proceedings. Although the Company and its
subsidiaries have policies and procedures to minimize legal noncompliance and the impact of claims and other proceedings, and endeavored to procure reasonable insurance coverage, litigation and regulatory actions remain an ongoing
risk.
The Company and its subsidiaries engage in lines of business that are heavily regulated and involve a large volume of actual or potential financial transactions with customers or applicants, and the
Company is a public company with a large number of shareholders. From time to time, applicants, borrowers, customers, shareholders, former employees, service providers, and other third parties have brought actions against the Company
or its subsidiaries, in certain cases claiming substantial damages. Financial services companies are subject to risks arising from changing regulatory frameworks or expectations, regulatory investigations, class action litigation,
and, from time to time, the Company and its subsidiaries have such actions brought against them. The Company and its subsidiaries are also subject to enforcement actions by federal or state regulators, including the Federal Reserve,
the CFPB, the DOJ, state attorneys general, and the MDBCF, which may be adversely impacted by ongoing litigation in which the Company is involved. Additionally, the Company is, and management expects it to be, engaged in a number of
foreclosure proceedings and other collection actions as part of its lending and leasing collections activities, which, from time to time, have resulted in counterclaims against the Company and its subsidiaries. Various legal
proceedings have and may arise in the future out of claims against entities to which the Company is a successor as a result of business combinations.
When and as the Company determines it has meritorious defenses to the claims asserted, it vigorously defends against such claims. The Company will consider settlement of claims when, in management’s
judgment and in consultation with counsel, it is in the best interests of the Company to do so.
The Company cannot predict with certainty the cost of defense, the cost of prosecution, or the ultimate outcome of litigation or other proceedings filed by or against it, its subsidiaries and its
directors, management or employees, including remedies or damage awards. On at least a quarterly basis, the Company assesses its liabilities and contingencies in connection with outstanding legal proceedings as well as certain
threatened claims (which are not considered incidental to the ordinary conduct of the Company’s business) utilizing the latest and most reliable information available. For matters where a loss is not probable or the amount of the loss
cannot be estimated, the Company will not make an accrual. For matters where it is probable the Company will incur a loss and the amount can be reasonably estimated, the Company will accrue for the loss. Once established, the accrual
is adjusted periodically to reflect any relevant developments. The actual cost of any such matters, however, may turn out to be substantially higher than the amount accrued. Further, the Company’s insurance policies have deductibles
and coverage limits, and such policies are unlikely to cover all costs and expenses related to the defense or prosecution of such legal proceedings or any losses arising therefrom.
Although the final outcome of any legal proceedings is inherently uncertain, based on the information available, advice of counsel and available insurance coverage, if applicable, management believes that
the litigation-related liability of $11.6 million accrued at June 30, 2025 is adequate and that any incremental change in potential liability arising from the Company’s legal proceedings and threatened claims, including the matters
described herein and those otherwise arising in the ordinary course of business, will not have a material adverse effect on the Company’s business or consolidated results of operations or financial condition. It is possible, however,
that future developments could result in an unfavorable outcome for or resolution of any one or more of the legal proceedings in which the Company or its subsidiaries are defendants, which may be material to the Company’s business or
consolidated results of operations or financial condition for a particular fiscal period or periods.
On August 30, 2021, Legacy Cadence Bank and the DOJ agreed to a settlement set forth in the consent order related to the investigation by the DOJ of Legacy Cadence Bank’s fair lending
program in Harris, Fort Bend, and Montgomery Counties located in Houston, Texas during the period between 2014 and 2016 (the “Consent Order”). The Consent Order was signed by the United States District Court for the Northern District
of Georgia, Atlanta Division, on August 31, 2021. Pursuant to Section 5.2(g) of the Agreement and Plan of Merger and Paragraph 50 of the Consent Order, Legacy BancorpSouth Bank approved the negotiated settlement, and subsequently, the
Company agreed to accept the obligations of the Consent Order. At the request of the DOJ, the court terminated the Consent Order on May 29, 2025. For additional information regarding the terms of this settlement and the Consent Order,
see Legacy Cadence’s Current Report on Form 8-K that was filed with the SEC on August 30, 2021.
NOTE 17. VARIABLE INTEREST ENTITIES AND OTHER INVESTMENTS
Under ASC 810-10-65, a company is deemed to be the primary beneficiary and required to consolidate a VIE if it has a variable interest in the VIE that provides a controlling financial interest. The
determination of whether a controlling financial interest exists is based on whether a single party has both the power to direct the activities of the VIE that most significantly impact the VIE’s economic performance and the
obligation to absorb the losses of the VIE or the right to receive benefits from the VIE that could potentially be significant to the VIE. ASC 810-10-65 requires continual reconsideration of conclusions reached regarding which
interest holder is a VIE’s primary beneficiary.
Certain NMTC meet the qualifications for consolidation under ASC 810. Consolidation is applicable to this type of investment structure when the entities owned by the tax credit investment fund, managing
member, and limited partner of the sub-CDE are under common control, and the limited partner’s related party group has both the power and the obligation to absorb the
significant benefits and losses of the sub-CDE. Based on this, the limited partner, which is the Company, is the primary beneficiary of the sub-CDE (VIE) and therefore subject to consolidation. NMTC investment structures which include a managing member not affiliated with the Company are not subject to consolidation.
At June 30, 2025 and December 31, 2024, the Company’s assets of the consolidated VIE that can be used only to settle obligations of the consolidated VIE totaled $4.7 million and $5.4 million,
respectively.
The Company is invested in several tax credit projects solely as a limited partner. At June 30, 2025 and December 31, 2024, the Company’s maximum exposure to loss associated with these limited
partnerships was limited to its investment. Most of the investments are in affordable housing projects. The partnerships have qualified to receive annual affordable housing federal tax credits that are recognized as a reduction of
current tax expense. The Company accounts for these investments and the related tax credits using either the effective yield method or the proportional amortization method, depending upon the date of the investment. Under the
effective yield method, the Company recognizes the tax credits as they are allocated and amortizes the initial costs of the investments to provide a constant effective yield over the period the tax credits are allocated. Under the
proportional amortization method, the Company amortizes the cost of the investment in proportion to the tax credits and other tax benefits received and recognizes the net investment performance in the income statement as a component
of income tax expense. The Company also has, to a lesser degree, investments in NMTC and historic tax credit projects. The Company has elected to account for the NMTC not subject to consolidation and HTC using the flow-through method,
which reduces federal income taxes in the year in which the credit arises. At June 30, 2025 and December 31, 2024, the Company recorded total tax credit investments in other assets on its consolidated balance sheets of $403.2 million
and $387.3 million, respectively.
The Company adopted the provisions of ASU 2023-02 as of January 1, 2024 and determined each investments’ eligibility for proportional amortization. For certain NMTC and HTC investments that do not qualify
for the proportional amortization method under ASU 2023-02, amortization related to these investments are recorded in other noninterest income in the Company’s consolidated statements of income. The Company recorded amortization of
$0.3 million for both the three months ended June 30, 2025 and 2024, and recorded amortization of $0.7 million and $0.6 million for the six months ended June 30, 2025 and 2024, respectively. The cash flow activity related to these
investments are presented in the net income (loss) line in the operating activities section of the consolidated statements of cash flows.
For the investments that qualify for proportional amortization under ASU 2023-02, the Company recognized income tax credits and other income tax benefits for the three months ended June 30, 2025 of $11.6
million and $1.3 million, respectively. The total income tax benefits of $12.9 million are partially offset by $10.2 million of investment amortization recognized for the three months ended June 30, 2025, for a net income tax benefit
of $2.7 million. For the three months ended June 30, 2024, the Company recognized income tax credits and other income tax benefits of $9.4 million and $1.2 million, respectively. The total income tax benefits of $10.6 million are
partially offset by $8.4 million of investment amortization recognized for the three months ended June 30, 2024, for a net income tax benefit of $2.2 million.
For the investments that qualify for proportional amortization under ASU 2023-02, the Company recognized income tax credits and other income tax benefits for the six months ended June 30, 2025 of $23.2
million and $2.8 million, respectively. The total income tax benefits of $26.0 million are partially offset by $20.6 million of investment amortization recognized for the six months ended June 30, 2025, for a net income tax benefit of
$5.4 million. For the six months ended June 30, 2024, the Company recognized income tax credits and other income tax benefits of $19.6 million and $2.5 million, respectively. The total income tax benefits of $22.1 million are
partially offset by $17.6 million of investment amortization recognized for the six months ended June 30, 2024, for a net income tax benefit of $4.5 million.
The cash flows related to the total income tax benefits are presented in the consolidated statements of cash flows. The net income tax benefit of $5.4 million for the six months ended
June 30, 2025 was included in the net income (loss) line within operating activities. Investment amortization of $20.6 million for the six months ended June 30, 2025, was included in the depreciation and amortization line item, which
was an adjustment to reconcile net income (loss) to cash provided by (used for) operating activities. The income tax credits and other income tax benefits of $26.0 million for the six months ended June 30, 2025 was included in the net
change to other assets or liabilities line item, which was also an adjustment to reconcile net income (loss) to cash provided by (used for) operating activities.
Additionally, the Company has investments in other certain limited partnerships accounted for under the fair value practical expedient of NAV totaling $133.2 million and $118.7 million
at June 30, 2025 and December 31, 2024, respectively. Related to assets recorded at fair value through net income, the Company recognized net gains of $4.5 million and $6.0 million for the six months ended June 30, 2025 and 2024,
respectively. These investments are made primarily through various SBIC funds as a strategy to provide expansion and growth opportunities to small businesses and community development funds to help serve the credit needs of the low- and
moderate-income and underserved communities within our footprint. Of the total fair value of these limited partnerships, $20.0 million and $15.8 million are related to real-estate funds at June 30, 2025 and December 31, 2024,
respectively. The remaining $113.2 million and $102.9 million are related to SBIC funds that concentrate in a variety of industries at June 30, 2025 and December 31, 2024, respectively. At June 30, 2025, unfunded commitments related to
these investments were $11.1 million and $111.8 million related to the real-estate funds and other SBIC funds, respectively. SBIC funds are generally structured to operate for approximately 10 years. During the life of each SBIC fund,
partners can request to withdraw from the fund, and subsequently receive the balance of their investment as the underlying assets are liquidated over the remaining life of the fund. The Company has no current plans to withdraw from any
of its SBIC funds.
For other limited partnerships without readily determinable fair values that do not qualify for the practical expedient, Cadence elected the measurement alternative to account for these
investments at their cost minus impairment, plus or minus changes resulting from observable price changes in orderly transactions for the identical or a similar investment of the same issuer. These investments totaled $2.8 million and
$2.6 million at June 30, 2025 and December 31, 2024, respectively. Other limited partnerships accounted for under the equity method totaled $8.8 million and $8.7 million at June 30, 2025 and December 31, 2024, respectively.
A summary of the Company’s investments in limited partnerships is presented as of the following periods:
|
(In thousands)
|
|
June 30, 2025
|
|
|
December 31, 2024
|
|
|
Tax credit investments (amortized cost)
|
|
$
|
403,197
|
|
|
$
|
387,339
|
|
|
Limited partnerships accounted for under the fair value practical expedient of NAV
|
|
|
133,197
|
|
|
|
118,710
|
|
|
Limited partnerships without readily determinable fair values that do not qualify for the practical expedient of NAV accounted for under the cost method
|
|
|
2,842
|
|
|
|
2,586
|
|
|
Limited partnerships required to be accounted for under the equity method
|
|
|
8,836
|
|
|
|
8,664
|
|
|
Total investments in limited partnerships
|
|
$
|
548,072
|
|
|
$
|
517,299
|
|
For equity investments carried at cost using the measurement alternative, during the three months ended June 30, 2025, there was one write-down for impairment of $8 thousand. During the
six months ended and as of June 30, 2025, there were two write-downs for impairment that totaled $48 thousand. During the three and six months ended and as of June 30, 2024, there was a write-down for impairment of $83 thousand. The
carrying amount of these equity investments in limited partnerships measured under this measurement alternative for the specified periods are as follows:
| |
Six Months Ended June 30, |
|
(In thousands)
|
2025 |
|
|
2024
|
|
|
Carrying value at the beginning of the period
|
$
|
2,586
|
|
|
$
|
2,417
|
|
|
Impairments
|
|
(48
|
)
|
|
|
(83
|
)
|
|
Reclassifications
|
|
—
|
|
|
|
107
|
|
|
Distributions
|
|
(400
|
)
|
|
|
(260
|
)
|
|
Contributions
|
|
704
|
|
|
|
770
|
|
|
Carrying value at the end of the period
|
$
|
2,842
|
|
|
$
|
2,951
|
|
NOTE 18. SUBSEQUENT EVENTS
On July 1, 2025, the Company completed its acquisition of Industry Bancshares, Inc. (“Industry”), the bank holding company for Bank of Brenham, Citizens State Bank, Fayetteville Bank,
Industry State Bank, The First National Bank of Bellville and The First National Bank of Shiner (collectively, the “Industry Banks”), pursuant to an Agreement and Plan of Merger (the “Merger Agreement”) dated April 25, 2025. Under the
terms of the Merger Agreement, the Industry Banks were merged with and into the Company with the Company being the surviving entity. The Company paid $20 million in cash to Industry’s shareholders. Industry Bancshares reported $4.1
billion in total assets, $1.1 billion in total loans, $2.5 billion in securities and $4.3 billion in total deposits as of June 30, 2025 (unaudited). The purchase price allocation and certain fair value measurements, as well as the
evaluation of the tax positions of the merger, remain in the early stages of management’s review due to the timing of the closing of the merger.
Additionally on July 1, 2025, $1.9 billion of securities acquired from Industry were sold with $1.0 billion of the proceeds redeployed in purchased securities with higher average
earning yields and the remainder deployed to paydown wholesale funding.
| ITEM 2. |
MANAGEMENT’S DISCUSSION AND ANALYSIS OF FINANCIAL CONDITION AND RESULTS OF OPERATIONS.
|
OVERVIEW
The Company is a regional bank with corporate offices in Houston, Texas and Tupelo, Mississippi with $50.4 billion in total assets at June 30, 2025. The Company has commercial banking
operations in Alabama, Arkansas, Florida, Georgia, Louisiana, Mississippi, Missouri, Tennessee, and Texas. The Company and its subsidiaries provide commercial banking, leasing, mortgage origination and servicing, brokerage, trust, and
investment advisory services to corporate customers, local governments, individuals, and other financial institutions through an extensive network of branches and offices.
Management’s discussion and analysis provides a narrative discussion of the Company’s financial condition and results of operations. For a complete understanding of the following
discussion, refer to the consolidated financial statements and related notes presented elsewhere in this Report. Management’s discussion and analysis should also be read in conjunction with the risk factors included in Item 1A of this
Report and those included in Item 1A of our Form 10-K for the year ended December 31, 2024, and the other reports we file with the Federal Reserve. This discussion and analysis is based on reported financial information, and certain
amounts for prior years have been reclassified to conform with the current financial statement presentation.
The financial condition and operating results of the Company are heavily influenced by economic trends nationally and in the specific markets in which the Company’s subsidiaries provide
financial services. Generally, the pressures of the national and regional economic cycle create a difficult operating environment for the financial services industry. During such times, the Company is not immune to pressures and any
economic downturn may have a negative impact on the Company and its customers in all of the markets it serves. Management believes future weakness in the economic environment could adversely affect the strength of the credit quality of
the Company's assets. Therefore, management will continue to focus on early identification and resolution of credit issues.
The largest source of the Company’s revenue is derived from its corporate and community banking operations. The financial condition and operating results of the Company are affected by
the level and volatility of interest rates on loans, investment securities, deposits, and borrowed funds, and the impact of economic downturns on loan demand, collateral values, and creditworthiness of existing borrowers. The financial
services industry is highly competitive and heavily regulated. The Company’s success depends on its ability to compete aggressively within its markets while maintaining sufficient asset quality and cost controls to generate net income.
The information that follows is provided to enhance comparability of financial information between periods and to provide a better understanding of the Company’s operations.
Recent Developments
On January 22, 2025, the Company announced the signing of a definitive merger agreement with FCB Financial Corp., the bank holding company for First Chatham Bank (collectively referred
to as “First Chatham”), pursuant to which First Chatham was merged with and into the Company, effective May 1, 2025. First Chatham was a Savannah, Georgia-based community bank operating eight branches across the Greater Savannah Area.
Pursuant to the terms of the definitive merger agreement, the Company issued 2.3 million shares of common stock and paid $23.1 million in cash for all outstanding shares of FCB Financial Corp.
On April 25, 2025, at the Company’s special meeting of shareholders, the holders of the Company’s Preferred Stock approved a proposal amending the Articles of Incorporation to permit
stock repurchases for compliance purposes under Regulation H, which the Company is subject to as a result of becoming a Federal Reserve member bank. On March 26, 2025, the Board declared a special cash dividend of $0.34375 per share of
Preferred Stock payable on May 7, 2025, to the Preferred Stock shareholders of record as of April 30, 2025, that was conditioned on the passage of the proposal at the special meeting.
On July 1, 2025 the Company completed its acquisition of Industry Bancshares, Inc. (“Industry”), the bank holding company for Bank of Brenham, National Association, Citizens State Bank,
Fayetteville Bank, Industry State Bank, The First National Bank of Bellville and The First National Bank of Shiner (collectively, the “Industry Banks”), pursuant to an Agreement and Plan of Merger (the “Merger Agreement”) dated April
25, 2025. Under the terms of the Merger Agreement, the Industry Banks were merged with and into the Company. The Company paid $20 million in cash to Industry’s shareholders. Industry Bancshares reported $4.1 billion in total assets,
$1.1 billion in total loans, $2.5 billion in securities, and $4.3 billion in total deposits as of June 30, 2025 (unaudited).
On July 23, 2025, the Company’s Board of Directors declared quarterly cash dividends of $0.275 per share of common stock and $0.34375 per share of Preferred Stock. The common stock
dividend is payable on October 1, 2025 to shareholders of record at the close of business on September 15, 2025. The preferred stock dividend is payable on August 20, 2025 to shareholders of record at the close of business on August 5,
2025.
NON-GAAP FINANCIAL MEASURES AND RECONCILIATIONS
In addition to financial ratios based on measures defined by GAAP, the Company has identified “total tangible shareholders’ equity,” “total tangible common shareholders’ equity,” “total
tangible common shareholders’ equity (excluding AOCI),” “total tangible assets,” “total tangible assets (excluding AOCI),” “tangible shareholders’ equity to tangible assets,” “tangible common shareholders’ equity to tangible assets,”
“tangible common shareholders’ equity to tangible assets (excluding AOCI),” “tangible common book value per share,” and “tangible book value per common share (excluding AOCI)” as non-GAAP financial measures used when evaluating the
performance of the Company.
|
• |
Total tangible shareholders’ equity is defined by the Company as total shareholders’ equity less goodwill and other intangible assets, net.
|
|
• |
Total tangible common shareholders' equity is defined by the Company as total shareholders' equity less preferred stock, goodwill, and other intangible assets, net.
|
|
• |
Total tangible common shareholders' equity, excluding AOCI, is defined by the Company as total shareholders' equity less preferred stock, goodwill, other intangible assets, net, and AOCI.
|
|
• |
Total tangible assets are defined by the Company as total assets less goodwill and other intangible assets, net.
|
|
• |
Total tangible assets, excluding AOCI, are defined by the Company as total assets less goodwill, other intangible assets, net, and AOCI.
|
|
• |
Tangible common book value per share is defined by the Company as tangible common shareholders’ equity divided by total shares of common stock outstanding.
|
|
• |
Tangible book value per common share, excluding AOCI, is defined by the Company as tangible common shareholders' equity less AOCI divided by total shares of common stock outstanding.
|
Management believes the ratios of tangible shareholders’ equity to tangible assets, tangible common shareholders’ equity to tangible assets and tangible common shareholders’ equity to
tangible assets (excluding AOCI) to be important to investors who are interested in evaluating the adequacy of the Company’s capital levels. Management also believes that tangible common book value per share and tangible common book
value per share (excluding AOCI) are important to investors who are interested in changes from period to period in book value per share exclusive of changes in intangible assets.
The following table reconciles these non-GAAP financial measures as presented above to GAAP financial measures as reflected in the Company’s consolidated financial statements for the
periods indicated:
TABLE 1—NON-GAAP FINANCIAL MEASURES
|
(Dollars in thousands, except per share amounts)
|
|
June 30, 2025
|
|
|
December 31, 2024
|
|
|
June 30, 2024
|
|
|
Total tangible assets, excluding AOCI
|
|
|
|
|
|
|
|
|
|
|
Total assets
|
|
$
|
50,378,840
|
|
|
$
|
47,019,190
|
|
|
$
|
47,984,078
|
|
|
Less: Goodwill
|
|
|
1,387,990
|
|
|
|
1,366,923
|
|
|
|
1,366,923
|
|
|
Other intangible assets, net
|
|
|
87,814
|
|
|
|
83,190
|
|
|
|
91,027
|
|
|
Total tangible assets
|
|
$
|
48,903,036
|
|
|
$
|
45,569,077
|
|
|
$
|
46,526,128
|
|
|
Less: AOCI
|
|
|
(576,157
|
)
|
|
|
(694,495
|
)
|
|
|
(782,462
|
)
|
|
Total tangible assets, excluding AOCI
|
|
$
|
49,479,193
|
|
|
$
|
46,263,572
|
|
|
$
|
47,308,590
|
|
| |
|
|
|
|
|
|
|
|
|
|
|
|
|
Total tangible common shareholders' equity, excluding AOCI
|
|
|
|
|
Total shareholders' equity
|
|
$
|
5,916,283
|
|
|
$
|
5,569,683
|
|
|
$
|
5,287,758
|
|
|
Less: Goodwill
|
|
|
1,387,990
|
|
|
|
1,366,923
|
|
|
|
1,366,923
|
|
|
Other intangible assets, net
|
|
|
87,814
|
|
|
|
83,190
|
|
|
|
91,027
|
|
|
Total tangible shareholders' equity
|
|
$
|
4,440,479
|
|
|
$
|
4,119,570
|
|
|
$
|
3,829,808
|
|
|
Less: Preferred stock
|
|
|
166,993
|
|
|
|
166,993
|
|
|
|
166,993
|
|
|
Total tangible common shareholders' equity
|
|
$
|
4,273,486
|
|
|
$
|
3,952,577
|
|
|
$
|
3,662,815
|
|
|
Less: AOCI
|
|
|
(576,157
|
)
|
|
|
(694,495
|
)
|
|
|
(782,462
|
)
|
|
Total tangible common shareholders' equity, excluding AOCI
|
|
$
|
4,849,643
|
|
|
$
|
4,647,072
|
|
|
$
|
4,445,277
|
|
| |
|
|
|
|
|
|
|
|
|
|
|
|
|
Total common shares outstanding
|
|
|
186,307,016
|
|
|
|
183,527,575
|
|
|
|
182,430,427
|
|
| |
|
|
|
|
|
|
|
|
|
|
|
|
|
Tangible shareholders' equity to tangible assets
|
|
|
9.08
|
%
|
|
|
9.04
|
%
|
|
|
8.23
|
%
|
|
Tangible common shareholders' equity to tangible assets
|
|
|
8.74
|
%
|
|
|
8.67
|
%
|
|
|
7.87
|
%
|
|
Tangible common shareholders' equity, excluding AOCI, to tangible assets, excluding AOCI
|
|
|
9.80
|
%
|
|
|
10.04
|
%
|
|
|
9.40
|
%
|
|
Tangible common book value per share
|
|
$
|
22.94
|
|
|
$
|
21.54
|
|
|
$
|
20.08
|
|
|
Tangible book value per common share, excluding AOCI
|
|
$
|
26.03
|
|
|
$
|
25.32
|
|
|
$
|
24.37
|
|
FINANCIAL HIGHLIGHTS
The following table presents financial highlights for the periods indicated:
TABLE 2—FINANCIAL HIGHLIGHTS
| |
|
As of and For the Three
Months Ended June 30,
|
|
|
As of and For the Six
Months Ended June 30,
|
|
| |
|
2025
|
|
|
2024
|
|
|
2025
|
|
|
2024
|
|
|
Common share data:
|
|
|
|
|
|
|
|
|
|
|
|
|
|
Basic earnings per share
|
|
$
|
0.70
|
|
|
$
|
0.74
|
|
|
$
|
1.41
|
|
|
$
|
1.37
|
|
|
Diluted earnings per share
|
|
|
0.69
|
|
|
|
0.73
|
|
|
|
1.40
|
|
|
|
1.35
|
|
|
Cash dividends per share
|
|
|
0.275
|
|
|
|
0.250
|
|
|
|
0.55
|
|
|
|
0.50
|
|
|
Book value per share
|
|
|
30.86
|
|
|
|
28.07
|
|
|
|
30.86
|
|
|
|
28.07
|
|
|
Tangible common book value per share (1)
|
|
|
22.94
|
|
|
|
20.08
|
|
|
|
22.94
|
|
|
|
20.08
|
|
|
Tangible book value per common share, excluding AOCI (1)
|
|
|
26.03
|
|
|
|
24.37
|
|
|
|
26.03
|
|
|
|
24.37
|
|
|
Dividend payout ratio
|
|
|
39.86
|
%
|
|
|
34.25
|
%
|
|
|
39.29
|
%
|
|
|
37.04
|
%
|
|
Financial Ratios:
|
|
|
|
|
|
|
|
|
|
|
|
|
|
|
|
|
|
Return on average assets (2)
|
|
|
1.09
|
|
|
|
1.15
|
|
|
|
1.12
|
|
|
|
1.06
|
|
|
Return on average shareholders' equity (2)
|
|
|
9.27
|
|
|
|
10.62
|
|
|
|
9.41
|
|
|
|
9.84
|
|
|
Return on average common shareholders' equity (2)
|
|
|
9.21
|
|
|
|
10.78
|
|
|
|
9.44
|
|
|
|
9.98
|
|
|
Total shareholders' equity to total assets
|
|
|
11.74
|
|
|
|
11.02
|
|
|
|
11.74
|
|
|
|
11.02
|
|
|
Total common shareholders' equity to total assets
|
|
|
11.41
|
|
|
|
10.67
|
|
|
|
11.41
|
|
|
|
10.67
|
|
|
Tangible common shareholders' equity to tangible assets (1)
|
|
|
8.74
|
|
|
|
7.87
|
|
|
|
8.74
|
|
|
|
7.87
|
|
|
Tangible common shareholders' equity, excluding AOCI, to tangible assets, excluding AOCI (1)
|
|
|
9.80
|
|
|
|
9.40
|
|
|
|
9.80
|
|
|
|
9.40
|
|
|
Net interest margin-FTE
|
|
|
3.40
|
|
|
|
3.27
|
|
|
|
3.43
|
|
|
|
3.25
|
|
|
Credit Quality Ratios:
|
|
|
|
|
|
|
|
|
|
|
|
|
|
|
|
|
|
Net charge-offs to average loans and leases (2)
|
|
|
0.24
|
%
|
|
|
0.28
|
%
|
|
|
0.26
|
%
|
|
|
0.26
|
%
|
|
Provision for credit losses to average loans and leases (2)
|
|
|
0.36
|
|
|
|
0.27
|
|
|
|
0.30
|
|
|
|
0.27
|
|
|
ACL to net loans and leases
|
|
|
1.34
|
|
|
|
1.41
|
|
|
|
1.34
|
|
|
|
1.41
|
|
|
ACL to NPL
|
|
|
205.26
|
|
|
|
216.85
|
|
|
|
205.26
|
|
|
|
216.85
|
|
|
ACL to NPA
|
|
|
192.29
|
|
|
|
212.16
|
|
|
|
192.29
|
|
|
|
212.16
|
|
|
NPL to net loans and leases
|
|
|
0.65
|
|
|
|
0.65
|
|
|
|
0.65
|
|
|
|
0.65
|
|
|
NPA to total assets
|
|
|
0.49
|
|
|
|
0.46
|
|
|
|
0.49
|
|
|
|
0.46
|
|
|
Capital Adequacy Ratios:
|
|
|
|
|
|
|
|
|
|
|
|
|
|
|
|
|
|
Common Equity Tier 1 capital
|
|
|
12.18
|
%
|
|
|
11.90
|
%
|
|
|
12.18
|
%
|
|
|
11.90
|
%
|
|
Tier 1 capital
|
|
|
12.60
|
|
|
|
12.34
|
|
|
|
12.60
|
|
|
|
12.34
|
|
|
Total capital
|
|
|
13.79
|
|
|
|
14.23
|
|
|
|
13.79
|
|
|
|
14.23
|
|
|
Tier 1 leverage capital
|
|
|
10.35
|
|
|
|
9.73
|
|
|
|
10.35
|
|
|
|
9.73
|
|
| (1) |
Non-GAAP financial measure. See “Non-GAAP Financial Measures and Reconciliations.”
|
| (2) |
Ratios are annualized.
|
As of June 30, 2025, the federal funds rate held steady at 4.5%. The Federal Reserve continued to hold interest rates steady, after it lowered interest rates by 100 basis points during
the second half of 2024. Additional interest rate reductions may occur during the second half of 2025 as the Federal Reserve continues to monitor relevant economic data and the effects of recently enacted tariffs. The decreases in
interest rates during the fourth quarter of 2024 have had an effect on both our balance sheet as well as our earnings. As seen in the following sections, the increase in net interest revenue resulted from a lower cost on our
interest-bearing liabilities, benefiting from declining deposit costs, and the payoffs of both the BTFP borrowings and our subordinated debt in 2024. Total average interest-earning assets increased in the second quarter of 2025 as
compared to the same period in 2024, with growth in average loans and investment securities partially offset by lower average other investment balances as the Company used cash flow from these investments to support the payoff of
borrowings. See “Net Interest Revenue” for further information.
The Company reported net income available to common shareholders of $129.9 million for the three months ended June 30, 2025, compared to $135.1 million for the same period in 2024. Key
factors contributing to the $5.2 million decrease in net income available to common shareholders included: (1) an increase in noninterest expense of $16.2 million in the second quarter of 2025; (2) a decrease in noninterest revenue of
$2.5 million for the second quarter of 2025; and (3) an increase in net interest revenue of $21.8 million for the second quarter of 2025. The Company recorded provisions for credit losses of $31.0 million and $22.0 million for three
months ended June 30, 2025 and 2024, respectively.
Net income available to common shareholders of $260.8 million was reported for the six months ended June 30, 2025, compared to $249.7 million for the same period in 2024. Key factors
contributing to the $11.1 million increase in net income available to common shareholders included: (1) an increase in net interest revenue of $31.1 million for the six months ended June 30, 2025; (2) a decrease in noninterest revenue
of $0.9 million for the six months ended June 30, 2025; and (3) an increase in noninterest expense of $12.3 million for the six months ended June 30, 2025. The Company recorded provisions for credit losses of $51.0 million and $44.0
million for six months ended June 30, 2025 and 2024, respectively.
Net interest revenue for the three months ended June 30, 2025 increased $21.8 million, or 6.1%. Total cost of interest-bearing liabilities declined 43 basis points to 3.02% for the
second quarter of 2025 compared to the second quarter of 2024, benefiting from declining deposit costs as well as the payoffs of both the BTFP borrowings and the subordinated debt. Interest expense decreased $28.4 million, or 9.9%, in
the second quarter of 2025 compared to the same period in 2024. Average earning assets increased $0.9 billion in the second quarter of 2025 compared to the second quarter of 2024, as growth in average loans of $1.8 billion and
investment securities balances was offset by lower average other investments and as the Company used cash flow from these investments to support the payoffs of both the BTFP borrowings and subordinated debt. With the completion of the
FCB acquisition in the second quarter of 2025, FCB contributed $567.8 million of interest-earning assets and $383.2 million of interest-bearing liabilities. See Table 4 below for more information on yield/rate analysis.
Net interest revenue for the six months ended June 30, 2025 increased $31.1 million, or 4.4%. Total cost of interest-bearing liabilities declined 43 basis points to 3.00% for the six
months ended June 30, 2025 compared to the same period in 2024, benefiting from declining deposit costs as well as the payoffs of both the BTFP borrowings and the subordinated debt. Interest expense decreased $75.5 million, or 13.3%,
for the six months ended June 30, 2025 compared to the same period in 2024. See Table 4 below for more information on yield/rate analysis.
Noninterest revenue for the three months ended June 30, 2025, was $98.2 million, a decrease of $2.5 million, or 2.5%, from the same period in 2024. Noninterest revenue for the six
months ended June 30, 2025, was $183.6 million, a decrease of $0.9 million, or 0.5%, from the same period in 2024. The decrease in the second quarter of 2025 compared to the second quarter of 2024 resulted from a decrease in other
miscellaneous income, which was partially offset by increases in mortgage banking revenue, credit related fees, bank owned life insurance income, SBA income, and wealth management revenue. See “Noninterest Revenue” below for more
information.
Noninterest expense for the three months ended June 30, 2025 increased 2.4% to $272.9 million from $256.7 million for the same period in 2024. Noninterest expense for the six months
ended June 30, 2025 increased 2.4% to $532.2 million from $519.9 million for the same period in 2024. The quarter over quarter and year over year increases were primarily a result of increases in salaries and employee benefits, legal
expense, and merger expense, which were partially offset by a decrease in deposit insurance assessments. See “Noninterest Expense” below for more information.
RESULTS OF OPERATIONS
The following is a summary of our results of operations for the periods indicated:
TABLE 3—SUMMARY OF RESULTS OF OPERATIONS
| |
|
Three Months Ended June 30, |
|
|
Six Months Ended June 30, |
|
|
(In thousands)
|
|
2025
|
|
|
2024
|
|
|
2025
|
|
|
2024
|
|
|
Earnings Summary:
|
|
|
|
|
|
|
|
|
|
|
|
|
|
Interest revenue
|
|
$
|
635,599
|
|
|
$
|
642,210
|
|
|
$
|
1,234,856
|
|
|
$
|
1,279,323
|
|
|
Interest expense
|
|
|
257,459
|
|
|
|
285,892
|
|
|
|
493,564
|
|
|
|
569,097
|
|
|
Net interest revenue
|
|
|
378,140
|
|
|
|
356,318
|
|
|
|
741,292
|
|
|
|
710,226
|
|
|
Provision for credit losses
|
|
|
31,000
|
|
|
|
22,000
|
|
|
|
51,000
|
|
|
|
44,000
|
|
|
Net interest revenue, after provision for credit losses
|
|
|
347,140
|
|
|
|
334,318
|
|
|
|
690,292
|
|
|
|
666,226
|
|
|
Noninterest revenue
|
|
|
98,181
|
|
|
|
100,658
|
|
|
|
183,568
|
|
|
|
184,444
|
|
|
Noninterest expense
|
|
|
272,863
|
|
|
|
256,697
|
|
|
|
532,212
|
|
|
|
519,904
|
|
|
Income before income taxes
|
|
|
172,458
|
|
|
|
178,279
|
|
|
|
341,648
|
|
|
|
330,766
|
|
|
Income tax expense
|
|
|
37,813
|
|
|
|
40,807
|
|
|
|
73,781
|
|
|
|
76,316
|
|
|
Net income
|
|
|
134,645
|
|
|
|
137,472
|
|
|
|
267,867
|
|
|
|
254,450
|
|
|
Less: preferred dividends
|
|
|
4,744
|
|
|
|
2,372
|
|
|
|
7,116
|
|
|
|
4,744
|
|
|
Net income available to common shareholders
|
|
$
|
129,901
|
|
|
$
|
135,100
|
|
|
$
|
260,751
|
|
|
$
|
249,706
|
|
Net Interest Revenue
Net interest revenue is the difference between interest revenue earned on assets, such as loans, leases and securities, and interest expense paid on liabilities, such as deposits and
borrowings, and continues to provide the Company with its principal source of revenue. Net interest revenue is affected by the general level of interest rates, changes in interest rates and changes in the amount and composition of
interest earning assets and interest bearing liabilities. One of the Company’s long-term objectives is to manage interest earning assets and interest bearing liabilities to maximize net interest revenue, while balancing interest rate,
credit and liquidity risk. Net interest margin is determined by dividing FTE net interest revenue by average earning assets. For purposes of the following discussion, revenue from tax-exempt loans and investment securities have been
adjusted to an FTE basis, using an effective tax rate of 21% for the three and six months ended June 30, 2025 and 2024.
The following table presents average interest earning assets, average interest bearing liabilities, net interest revenue-FTE, net interest margin-FTE and net interest rate spread for
each of the periods presented:
TABLE 4—CONSOLIDATED AVERAGE BALANCES AND YIELD/RATE ANALYSIS
| |
|
Three Months Ended June 30,
|
|
| |
|
2025
|
|
|
2024
|
|
|
(Dollars in thousands)
|
|
Average
Balance
|
|
|
Interest
|
|
|
Yield/
Rate
|
|
|
Average
Balance
|
|
|
Interest
|
|
|
Yield/
Rate
|
|
|
ASSETS
|
|
|
|
|
|
|
|
|
|
|
|
|
|
|
|
|
|
|
|
Loans and leases (net of unearned income) (1)(2)
|
|
$
|
34,762,808
|
|
|
$
|
550,159
|
|
|
|
6.35
|
%
|
|
$
|
32,945,526
|
|
|
$
|
540,160
|
|
|
|
6.59
|
%
|
|
Loans held for sale, at fair value
|
|
|
146,191
|
|
|
|
1,736
|
|
|
|
4.76
|
|
|
|
114,359
|
|
|
|
1,652
|
|
|
|
5.81
|
|
|
Available for sale securities, at fair value:
|
|
|
|
|
|
|
|
|
|
|
|
|
|
|
|
|
|
|
|
|
|
|
|
|
|
Taxable
|
|
|
8,736,627
|
|
|
|
72,355
|
|
|
|
3.32
|
|
|
|
7,954,865
|
|
|
|
62,852
|
|
|
|
3.18
|
|
|
Tax-exempt (3)
|
|
|
77,836
|
|
|
|
803
|
|
|
|
4.14
|
|
|
|
78,687
|
|
|
|
807
|
|
|
|
4.12
|
|
|
Other investments
|
|
|
1,017,815
|
|
|
|
11,183
|
|
|
|
4.41
|
|
|
|
2,758,385
|
|
|
|
37,383
|
|
|
|
5.45
|
|
|
Total interest earning assets and revenue
|
|
|
44,741,277
|
|
|
|
636,236
|
|
|
|
5.70
|
%
|
|
|
43,851,822
|
|
|
|
642,854
|
|
|
|
5.90
|
%
|
|
Other assets
|
|
|
5,082,940
|
|
|
|
|
|
|
|
|
|
|
|
4,816,078
|
|
|
|
|
|
|
|
|
|
|
Allowance for credit losses
|
|
|
467,521
|
|
|
|
|
|
|
|
|
|
|
|
475,181
|
|
|
|
|
|
|
|
|
|
|
Total
|
|
$
|
49,356,696
|
|
|
|
|
|
|
|
|
|
|
$
|
48,192,719
|
|
|
|
|
|
|
|
|
|
| |
|
|
|
|
|
|
|
|
|
|
|
|
|
|
|
|
|
|
|
LIABILITIES AND SHAREHOLDERS' EQUITY
|
|
|
|
|
|
|
|
|
|
|
|
|
|
|
|
|
|
|
|
Deposits:
|
|
|
|
|
|
|
|
|
|
|
|
|
|
|
|
|
|
|
|
Interest bearing demand and money market
|
|
$
|
18,799,895
|
|
|
$
|
125,874
|
|
|
|
2.69
|
%
|
|
$
|
18,770,093
|
|
|
$
|
146,279
|
|
|
|
3.13
|
%
|
|
Savings
|
|
|
2,646,190
|
|
|
|
3,747
|
|
|
|
0.57
|
|
|
|
2,652,019
|
|
|
|
3,743
|
|
|
|
0.57
|
|
|
Time
|
|
|
9,956,973
|
|
|
|
98,721
|
|
|
|
3.98
|
|
|
|
7,920,946
|
|
|
|
89,173
|
|
|
|
4.53
|
|
|
Fed funds purchased, securities sold under
|
|
|
|
|
|
|
|
|
|
|
|
|
|
|
|
|
|
|
|
|
|
|
|
|
|
agreement to repurchase and other
|
|
|
265,092
|
|
|
|
2,939
|
|
|
|
4.45
|
|
|
|
65,821
|
|
|
|
732
|
|
|
|
4.47
|
|
|
Short-term FHLB borrowings
|
|
|
1,173,022
|
|
|
|
12,594
|
|
|
|
4.31
|
|
|
|
—
|
|
|
|
—
|
|
|
|
—
|
|
|
Short-term BTFP borrowings
|
|
|
—
|
|
|
|
—
|
|
|
|
—
|
|
|
|
3,500,000
|
|
|
|
41,536
|
|
|
|
4.77
|
|
|
Subordinated and long-term borrowings
|
|
|
1,338,059
|
|
|
|
13,584
|
|
|
|
4.07
|
|
|
|
404,231
|
|
|
|
4,429
|
|
|
|
4.41
|
|
|
Total interest bearing liabilities and expense
|
|
|
34,179,231
|
|
|
|
257,459
|
|
|
|
3.02
|
%
|
|
|
33,313,110
|
|
|
|
285,892
|
|
|
|
3.45
|
%
|
|
Demand deposits - noninterest bearing
|
|
|
8,494,542
|
|
|
|
|
|
|
|
|
|
|
|
8,757,029
|
|
|
|
|
|
|
|
|
|
|
Other liabilities
|
|
|
855,842
|
|
|
|
|
|
|
|
|
|
|
|
915,326
|
|
|
|
|
|
|
|
|
|
|
Total liabilities
|
|
|
43,529,615
|
|
|
|
|
|
|
|
|
|
|
|
42,985,465
|
|
|
|
|
|
|
|
|
|
|
Shareholders' equity
|
|
|
5,827,081
|
|
|
|
|
|
|
|
|
|
|
|
5,207,254
|
|
|
|
|
|
|
|
|
|
|
Total
|
|
$
|
49,356,696
|
|
|
|
|
|
|
|
|
|
|
$
|
48,192,719
|
|
|
|
|
|
|
|
|
|
|
Net interest revenue-FTE
|
|
|
|
|
|
$
|
378,777
|
|
|
|
|
|
|
|
|
|
|
$
|
356,962
|
|
|
|
|
|
|
Net interest margin-FTE
|
|
|
|
|
|
|
|
|
|
|
3.40
|
%
|
|
|
|
|
|
|
|
|
|
|
3.27
|
%
|
|
Net interest rate spread
|
|
|
|
|
|
|
|
|
|
|
2.68
|
%
|
|
|
|
|
|
|
|
|
|
|
2.45
|
%
|
|
Interest bearing liabilities to interest earning assets
|
|
|
|
|
|
|
|
|
|
|
76.39
|
%
|
|
|
|
|
|
|
|
|
|
|
75.97
|
%
|
| (1) |
Includes taxable equivalent adjustment to interest of $0.5 million for both the three months ended June 30, 2025 and 2024, respectively, using an effective tax rate of 21% for all periods presented.
|
| (2) |
Nonaccrual loans are included in loans and leases (net of unearned income). Nonaccrual loans were $231.2 million and $216.7 million as of June 30, 2025 and 2024, respectively.
|
| (3) |
Includes taxable equivalent adjustment to interest of $0.2 million for both the three months ended June 30, 2025 and 2024, using an effective tax rate of 21% for all periods presented.
|
Net interest revenue-FTE increased 6.1% to $378.8 million for the three months ended June 30, 2025, from $357.0 million for the same period in 2024. The increase in net interest
revenue-FTE resulted from lower costs on interest-bearing liabilities benefiting from declining deposit costs and the payoffs of both the BTFP borrowings and our subordinated debt since the second quarter of 2024. Average loans
increased from 75.1% of average interest earning assets in the 2024 second quarter to 77.7% in the 2025 second quarter.
Interest revenue-FTE decreased 1.0% to $636.2 million for the three months ended June 30, 2025, from $642.9 million for the same period in 2024. The decrease in interest revenue-FTE for
the three months ended June 30, 2025 was primarily a result of lower average other investment balances as the Company used cash flow from these investments to support the payoffs of both the BTFP borrowings and subordinated debt since
the second quarter of 2024. This decrease was offset by higher average loans and investment securities during the second quarter of 2025. Additionally, interest revenue-FTE included $2.6 million and $3.0 million in accretion related to
the purchase discounts on acquired loans for the three months ended June 30, 2025 and 2024, respectively.
Interest expense decreased 9.9% to $257.5 million for the three months ended June 30, 2025, compared to $285.9 million for the same period in 2024. The decrease in interest expense for
the three months ended June 30, 2025 was primarily due to the total cost of interest-bearing liabilities declining 43 basis points to 3.02% for the second quarter of 2025 compared to 3.45% for the second quarter of 2024, benefiting from
declining deposit costs as well as the payoffs of both the BTFP borrowings and the subordinated debt after the second quarter of 2024.
Net interest margin-FTE for the three months ended June 30, 2025 was 3.40%, an increase of 13 basis points, from 3.27% for the same period in 2024. Net interest revenue-FTE may also be
analyzed by segregating the yield/rate and volume components of interest revenue and interest expense. The table below presents the components of our net interest revenue-FTE with the effect that the varying levels of interest-earning
assets and interest-bearing liabilities and the applicable rates have had on changes in net interest revenue from the second quarter of 2024 to the second quarter of 2025. The changes in net interest revenue-FTE due to both rate and
volume have been allocated to volume and rate changes in proportion to the relationship of the absolute dollar amounts of the changes in each.
TABLE 5—RATE/VOLUME ANALYSIS
| |
|
Second Quarter 2025 vs Second Quarter 2024
|
|
| |
|
Net Interest Revenue
|
|
|
Increase
|
|
|
|
|
|
|
|
|
(In thousands)
|
|
2025
|
|
|
2024
|
|
|
(Decrease)
|
|
|
Volume
|
|
|
Rate
|
|
|
INTEREST REVENUE
|
|
|
|
|
|
|
|
|
|
|
|
|
|
|
|
|
Loans and leases, net of unearned income
|
|
$
|
550,159
|
|
|
$
|
540,160
|
|
|
$
|
9,999
|
|
|
$
|
17,319
|
|
|
$
|
(7,320
|
)
|
|
Loans held for sale
|
|
|
1,736
|
|
|
|
1,652
|
|
|
|
84
|
|
|
|
203
|
|
|
|
(119
|
)
|
|
Available for sale securities:
|
|
|
|
|
|
|
|
|
|
|
|
|
|
|
|
|
|
|
|
|
|
Taxable
|
|
|
72,355
|
|
|
|
62,852
|
|
|
|
9,503
|
|
|
|
8,504
|
|
|
|
999
|
|
|
Non-taxable
|
|
|
803
|
|
|
|
807
|
|
|
|
(4
|
)
|
|
|
(5
|
)
|
|
|
1
|
|
|
Other investments
|
|
|
11,183
|
|
|
|
37,383
|
|
|
|
(26,200
|
)
|
|
|
(24,321
|
)
|
|
|
(1,879
|
)
|
|
Total interest revenue-FTE
|
|
|
636,236
|
|
|
|
642,854
|
|
|
|
(6,618
|
)
|
|
|
1,700
|
|
|
|
(8,318
|
)
|
| |
|
|
|
|
|
|
|
|
|
|
|
|
|
|
|
|
|
|
|
|
|
INTEREST EXPENSE
|
|
|
|
|
|
|
|
|
|
|
|
|
|
|
|
|
|
|
|
|
|
Demand deposits - interest bearing
|
|
|
125,874
|
|
|
|
146,279
|
|
|
|
(20,405
|
)
|
|
|
(405
|
)
|
|
|
(20,000
|
)
|
|
Savings deposits
|
|
|
3,747
|
|
|
|
3,743
|
|
|
|
4
|
|
|
|
3
|
|
|
|
1
|
|
|
Time deposits
|
|
|
98,721
|
|
|
|
89,173
|
|
|
|
9,548
|
|
|
|
13,466
|
|
|
|
(3,918
|
)
|
|
Fed funds purchased, securities sold under agreement to repurchase and other
|
|
|
2,939
|
|
|
|
732
|
|
|
|
2,207
|
|
|
|
2,208
|
|
|
|
(1
|
)
|
|
Short-term FHLB borrowings
|
|
|
12,594
|
|
|
|
—
|
|
|
|
12,594
|
|
|
|
12,594
|
|
|
|
—
|
|
|
Short-term BTFP borrowings
|
|
|
—
|
|
|
|
41,536
|
|
|
|
(41,536
|
)
|
|
|
(41,536
|
)
|
|
|
—
|
|
|
Subordinated and long-term debt
|
|
|
13,584
|
|
|
|
4,429
|
|
|
|
9,155
|
|
|
|
9,249
|
|
|
|
(94
|
)
|
|
Total interest expense
|
|
|
257,459
|
|
|
|
285,892
|
|
|
|
(28,433
|
)
|
|
|
(4,421
|
)
|
|
|
(24,012
|
)
|
|
Net interest revenue-FTE
|
|
$
|
378,777
|
|
|
$
|
356,962
|
|
|
$
|
21,815
|
|
|
$
|
6,121
|
|
|
$
|
15,694
|
|
The following table presents average interest earning assets, average interest bearing liabilities, net interest revenue-FTE, net interest margin-FTE and net interest
rate spread for each of the periods presented:
| |
|
Six Months Ended June 30,
|
|
| |
|
2025
|
|
|
2024
|
|
|
(Dollars in thousands)
|
|
Average Balance
|
|
|
Interest
|
|
|
Yield/
Rate
|
|
|
Average
Balance
|
|
|
Interest
|
|
|
Yield/
Rate
|
|
|
ASSETS
|
|
|
|
|
|
|
|
|
|
|
|
|
|
|
|
|
|
|
|
Loans and leases (net of unearned income) (1)(2)
|
|
$
|
34,355,873
|
|
|
$
|
1,080,672
|
|
|
|
6.34
|
%
|
|
$
|
32,841,550
|
|
|
$
|
1,069,552
|
|
|
|
6.55
|
%
|
|
Loans held for sale, at fair value
|
|
|
130,812
|
|
|
|
3,185
|
|
|
|
4.91
|
|
|
|
93,358
|
|
|
|
2,837
|
|
|
|
6.11
|
|
|
Available for sale securities, at fair value:
|
|
|
|
|
|
|
|
|
|
|
|
|
|
|
|
|
|
|
|
|
|
|
|
|
|
Taxable
|
|
|
7,983,659
|
|
|
|
125,587
|
|
|
|
3.17
|
|
|
|
8,071,103
|
|
|
|
126,257
|
|
|
|
3.15
|
|
|
Tax-exempt (3)
|
|
|
78,836
|
|
|
|
1,599
|
|
|
|
4.09
|
|
|
|
80,527
|
|
|
|
1,677
|
|
|
|
4.19
|
|
|
Other investments
|
|
|
1,145,773
|
|
|
|
25,080
|
|
|
|
4.41
|
|
|
|
2,952,412
|
|
|
|
80,280
|
|
|
|
5.47
|
|
|
Total interest earning assets and revenue
|
|
|
43,694,953
|
|
|
|
1,236,123
|
|
|
|
5.70
|
%
|
|
|
44,038,950
|
|
|
|
1,280,603
|
|
|
|
5.85
|
%
|
|
Other assets
|
|
|
5,023,679
|
|
|
|
|
|
|
|
|
|
|
|
4,853,195
|
|
|
|
|
|
|
|
|
|
|
Allowance for credit losses
|
|
|
466,433
|
|
|
|
|
|
|
|
|
|
|
|
474,515
|
|
|
|
|
|
|
|
|
|
|
Total
|
|
$
|
48,252,199
|
|
|
|
|
|
|
|
|
|
|
$
|
48,417,630
|
|
|
|
|
|
|
|
|
|
|
|
|
|
|
|
|
|
|
|
|
|
|
|
|
|
|
|
|
|
|
|
|
|
|
|
|
LIABILITIES AND SHAREHOLDERS' EQUITY
|
|
|
|
|
|
|
|
|
|
|
|
|
|
|
|
|
|
|
|
|
|
|
|
|
|
Deposits:
|
|
|
|
|
|
|
|
|
|
|
|
|
|
|
|
|
|
|
|
|
|
|
|
|
|
Interest bearing demand and money market
|
|
$
|
19,112,399
|
|
|
$
|
254,705
|
|
|
|
2.69
|
%
|
|
$
|
19,036,969
|
|
|
$
|
295,682
|
|
|
|
3.12
|
%
|
|
Savings
|
|
|
2,626,885
|
|
|
|
7,391
|
|
|
|
0.57
|
|
|
|
2,674,236
|
|
|
|
7,544
|
|
|
|
0.57
|
|
|
Time
|
|
|
9,967,496
|
|
|
|
199,621
|
|
|
|
4.04
|
|
|
|
7,634,651
|
|
|
|
169,842
|
|
|
|
4.47
|
|
|
Fed funds purchased, securities sold under agreement to repurchase and other
|
|
|
184,527
|
|
|
|
4,071
|
|
|
|
4.45
|
|
|
|
137,585
|
|
|
|
3,260
|
|
|
|
4.76
|
|
|
Short-term FHLB borrowings
|
|
|
603,812
|
|
|
|
12,903
|
|
|
|
4.31
|
|
|
|
—
|
|
|
|
—
|
|
|
|
—
|
|
|
Short-term BTFP borrowings
|
|
|
—
|
|
|
|
—
|
|
|
|
—
|
|
|
|
3,500,000
|
|
|
|
83,640
|
|
|
|
4.81
|
|
|
Subordinated and long-term borrowings
|
|
|
736,885
|
|
|
|
14,873
|
|
|
|
4.07
|
|
|
|
419,405
|
|
|
|
9,129
|
|
|
|
4.38
|
|
|
Total interest bearing liabilities and expense
|
|
|
33,232,004
|
|
|
|
493,564
|
|
|
|
3.00
|
%
|
|
|
33,402,846
|
|
|
|
569,097
|
|
|
|
3.43
|
%
|
|
Demand deposits - noninterest bearing
|
|
|
8,417,406
|
|
|
|
|
|
|
|
|
|
|
|
8,914,824
|
|
|
|
|
|
|
|
|
|
|
Other liabilities
|
|
|
862,968
|
|
|
|
|
|
|
|
|
|
|
|
899,309
|
|
|
|
|
|
|
|
|
|
|
Total liabilities
|
|
|
42,512,378
|
|
|
|
|
|
|
|
|
|
|
|
43,216,979
|
|
|
|
|
|
|
|
|
|
|
Shareholders' equity
|
|
|
5,739,821
|
|
|
|
|
|
|
|
|
|
|
|
5,200,651
|
|
|
|
|
|
|
|
|
|
|
Total
|
|
$
|
48,252,199
|
|
|
|
|
|
|
|
|
|
|
$
|
48,417,630
|
|
|
|
|
|
|
|
|
|
|
Net interest revenue-FTE
|
|
|
|
|
|
$
|
742,559
|
|
|
|
|
|
|
|
|
|
|
$
|
711,506
|
|
|
|
|
|
|
Net interest margin-FTE
|
|
|
|
|
|
|
|
|
|
|
3.43
|
%
|
|
|
|
|
|
|
|
|
|
|
3.25
|
%
|
|
Net interest rate spread
|
|
|
|
|
|
|
|
|
|
|
2.70
|
%
|
|
|
|
|
|
|
|
|
|
|
2.42
|
%
|
|
Interest bearing liabilities to interest earning assets
|
|
|
|
|
|
|
|
|
|
|
76.05
|
%
|
|
|
|
|
|
|
|
|
|
|
75.85
|
%
|
| (1) |
Includes taxable equivalent adjustment to interest of $0.9 million for both the six months ended June 30, 2025 and 2024, respectively, using an effective tax rate of 21% for all periods presented.
|
| (2) |
Nonaccrual loans are included in loans and leases (net of unearned income). Nonaccrual loans were $231.2 million and $216.7 million as of June 30, 2025 and 2024, respectively. At June 30, 2024,
nonaccrual loans did not include nonaccrual loans held for sale of $2.7 million.
|
| (3) |
Includes taxable equivalent adjustment to interest of $0.3 million and $0.4 million for the six months ended June 30, 2025 and 2024, respectively, using an effective tax rate of 21% for all periods
presented.
|
Net interest revenue-FTE increased 4.4% to $742.6 million for the six months ended June 30, 2025 compared to the same period in 2024. The increase in net interest
revenue-FTE resulted from lower costs on interest-bearing liabilities benefiting from declining deposit costs and the payoffs of both the BTFP borrowings and our subordinated debt. Average loans increased from 74.6% of average interest
earning assets in 2024 to 78.6% in 2025.
Interest revenue-FTE decreased 3.5% to $1.2 billion for the six months ended June 30, 2025, from $1.3 billion during the same period in 2024. The decrease in interest
revenue-FTE for the six months ended June 30, 2025 was primarily driven by a reduction in average balances of other investments and investment securities, as the Company used cash flow from these investments to support the payoffs of both the
BTFP borrowings and subordinated debt. Additionally, interest revenue-FTE included $5.2 million and $6.5 million in accretion related to the purchase discounts on acquired loans for the six months ended June 30, 2025 and 2024, respectively.
Interest expense decreased 13.3% to $493.6 million for the six months ended June 30, 2025, compared to $569.1 million for the same period in 2024. The decrease in
interest expense for the six months ended June 30, 2025 was primarily a result of the total cost of average interest-bearing liabilities declining 43 basis points to 3.00% for 2025, compared to 3.43% for the same period in 2024, benefiting
from declining deposit costs as well as the payoffs of both the BTFP borrowings and the subordinated debt.
Net interest margin-FTE for the six months ended June 30, 2025 was 3.43%, an increase of 18 basis points, from 3.25% for the same period in 2024. Net interest revenue-FTE
may also be analyzed by segregating the yield/rate and volume components of interest revenue and interest expense. The table below presents the components of our net interest revenue-FTE with the effect that the varying levels of
interest-earning assets and interest-bearing liabilities and the applicable rates have had on changes in net interest revenue from the first half of 2024 to the first half of 2025. The changes in net interest revenue-FTE due to both rate and
volume have been allocated to volume and rate changes in proportion to the relationship of the absolute dollar amounts of the changes in each.
| |
|
Six Months Ended June 30, 2025 vs Six Months Ended June 30, 2024
|
|
| |
|
Net Interest Revenue
|
|
|
Increase
|
|
|
|
|
|
|
|
|
(In thousands)
|
|
2025
|
|
|
2024
|
|
|
(Decrease)
|
|
|
Volume
|
|
|
Rate
|
|
|
INTEREST REVENUE
|
|
|
|
|
|
|
|
|
|
|
|
|
|
|
|
|
Loans and leases, net of unearned income
|
|
$
|
1,080,672
|
|
|
$
|
1,069,552
|
|
|
$
|
11,120
|
|
|
$
|
46,500
|
|
|
$
|
(35,380
|
)
|
|
Loans held for sale
|
|
|
3,185
|
|
|
|
2,837
|
|
|
|
348
|
|
|
|
980
|
|
|
|
(632
|
)
|
|
Available for sale securities:
|
|
|
|
|
|
|
|
|
|
|
|
|
|
|
|
|
|
|
|
|
|
Taxable
|
|
|
125,587
|
|
|
|
126,257
|
|
|
|
(670
|
)
|
|
|
(1,568
|
)
|
|
|
898
|
|
|
Non-taxable
|
|
|
1,599
|
|
|
|
1,677
|
|
|
|
(78
|
)
|
|
|
(37
|
)
|
|
|
(41
|
)
|
|
Other investments
|
|
|
25,080
|
|
|
|
80,280
|
|
|
|
(55,200
|
)
|
|
|
(41,977
|
)
|
|
|
(13,223
|
)
|
|
Total interest revenue-FTE
|
|
|
1,236,123
|
|
|
|
1,280,603
|
|
|
|
(44,480
|
)
|
|
|
3,898
|
|
|
|
(48,378
|
)
|
| |
|
|
|
|
|
|
|
|
|
|
|
|
|
|
|
|
|
|
|
|
|
INTEREST EXPENSE
|
|
|
|
|
|
|
|
|
|
|
|
|
|
|
|
|
|
|
|
|
|
Demand deposits - interest bearing
|
|
|
254,705
|
|
|
|
295,682
|
|
|
|
(40,977
|
)
|
|
|
1,141
|
|
|
|
(42,118
|
)
|
|
Savings deposits
|
|
|
7,391
|
|
|
|
7,544
|
|
|
|
(153
|
)
|
|
|
(154
|
)
|
|
|
1
|
|
|
Time deposits
|
|
|
199,621
|
|
|
|
169,842
|
|
|
|
29,779
|
|
|
|
47,579
|
|
|
|
(17,800
|
)
|
|
Fed funds purchased, securities sold under agreement to repurchase and other
|
|
|
4,071
|
|
|
|
3,260
|
|
|
|
811
|
|
|
|
1,040
|
|
|
|
(229
|
)
|
|
Short-term FHLB borrowings
|
|
|
12,903
|
|
|
|
—
|
|
|
|
12,903
|
|
|
|
12,903
|
|
|
|
—
|
|
|
Short-term BTFP borrowings
|
|
|
—
|
|
|
|
83,640
|
|
|
|
(83,640
|
)
|
|
|
(83,640
|
)
|
|
|
—
|
|
|
Subordinated and long-term debt
|
|
|
14,873
|
|
|
|
9,129
|
|
|
|
5,744
|
|
|
|
6,426
|
|
|
|
(682
|
)
|
|
Total interest expense
|
|
|
493,564
|
|
|
|
569,097
|
|
|
|
(75,533
|
)
|
|
|
(14,705
|
)
|
|
|
(60,828
|
)
|
|
Net interest revenue-FTE
|
|
$
|
742,559
|
|
|
$
|
711,506
|
|
|
$
|
31,053
|
|
|
$
|
18,603
|
|
|
$
|
12,450
|
|
Provision for Credit Losses and Allowance for Credit Losses (“ACL”)
An analysis of the ACL for loans for the periods indicated is provided in the following table:
TABLE 6—ACL
|
|
|
Three Months Ended June 30,
|
|
|
Six Months Ended June 30,
|
|
|
(In thousands)
|
|
2025
|
|
|
2024
|
|
|
2025
|
|
|
2024
|
|
|
Balance, beginning of period
|
|
$
|
457,791
|
|
|
$
|
472,575
|
|
|
$
|
460,793
|
|
|
$
|
468,034
|
|
|
Charge-offs:
|
|
|
|
|
|
|
|
|
|
|
|
|
|
|
|
|
|
Commercial and industrial
|
|
|
|
|
|
|
|
|
|
|
|
|
|
|
|
|
|
Non-real estate
|
|
|
(16,866
|
)
|
|
|
(23,140
|
)
|
|
|
(37,731
|
)
|
|
|
(40,036
|
)
|
|
Owner occupied
|
|
|
(1,281
|
)
|
|
|
(200
|
)
|
|
|
(1,700
|
)
|
|
|
(301
|
)
|
|
Total commercial and industrial
|
|
|
(18,147
|
)
|
|
|
(23,340
|
)
|
|
|
(39,431
|
)
|
|
|
(40,337
|
)
|
|
Commercial real estate
|
|
|
|
|
|
|
|
|
|
|
|
|
|
|
|
|
|
Construction, acquisition and development
|
|
|
(295
|
)
|
|
|
(405
|
)
|
|
|
(337
|
)
|
|
|
(537
|
)
|
|
Income producing
|
|
|
(3,445
|
)
|
|
|
(244
|
)
|
|
|
(4,785
|
)
|
|
|
(2,356
|
)
|
|
Total commercial real estate
|
|
|
(3,740
|
)
|
|
|
(649
|
)
|
|
|
(5,122
|
)
|
|
|
(2,893
|
)
|
|
Consumer
|
|
|
|
|
|
|
|
|
|
|
|
|
|
|
|
|
|
Residential mortgages
|
|
|
(1,944
|
)
|
|
|
(708
|
)
|
|
|
(3,240
|
)
|
|
|
(1,303
|
)
|
|
Other consumer
|
|
|
(1,494
|
)
|
|
|
(1,586
|
)
|
|
|
(3,260
|
)
|
|
|
(3,386
|
)
|
|
Total consumer
|
|
|
(3,438
|
)
|
|
|
(2,294
|
)
|
|
|
(6,500
|
)
|
|
|
(4,689
|
)
|
|
Total charge-offs
|
|
|
(25,325
|
)
|
|
|
(26,283
|
)
|
|
|
(51,053
|
)
|
|
|
(47,919
|
)
|
|
Recoveries:
|
|
|
|
|
|
|
|
|
|
|
|
|
|
|
|
|
|
Commercial and industrial
|
|
|
|
|
|
|
|
|
|
|
|
|
|
|
|
|
|
Non-real estate
|
|
|
2,905
|
|
|
|
2,868
|
|
|
|
4,638
|
|
|
|
4,102
|
|
|
Owner occupied
|
|
|
286
|
|
|
|
75
|
|
|
|
375
|
|
|
|
153
|
|
|
Total commercial and industrial
|
|
|
3,191
|
|
|
|
2,943
|
|
|
|
5,013
|
|
|
|
4,255
|
|
|
Commercial real estate
|
|
|
|
|
|
|
|
|
|
|
|
|
|
|
|
|
|
Construction, acquisition and development
|
|
|
60
|
|
|
|
70
|
|
|
|
105
|
|
|
|
182
|
|
|
Income producing
|
|
|
50
|
|
|
|
31
|
|
|
|
88
|
|
|
|
69
|
|
|
Total commercial real estate
|
|
|
110
|
|
|
|
101
|
|
|
|
193
|
|
|
|
251
|
|
|
Consumer
|
|
|
|
|
|
|
|
|
|
|
|
|
|
|
|
|
|
Residential mortgages
|
|
|
383
|
|
|
|
291
|
|
|
|
781
|
|
|
|
562
|
|
|
Other consumer
|
|
|
426
|
|
|
|
395
|
|
|
|
849
|
|
|
|
839
|
|
|
Total consumer
|
|
|
809
|
|
|
|
686
|
|
|
|
1,630
|
|
|
|
1,401
|
|
|
Total recoveries
|
|
|
4,110
|
|
|
|
3,730
|
|
|
|
6,836
|
|
|
|
5,907
|
|
|
Net charge-offs
|
|
|
(21,215
|
)
|
|
|
(22,553
|
)
|
|
|
(44,217
|
)
|
|
|
(42,012
|
)
|
|
Initial allowance on PCD loans
|
|
|
8,075
|
|
|
|
—
|
|
|
|
8,075
|
|
|
|
—
|
|
| |
|
|
|
|
|
|
|
|
|
|
|
|
|
|
|
|
|
Provision:
|
|
|
|
|
|
|
|
|
|
|
|
|
|
|
|
|
|
Initial provision for acquired non-PCD loans
|
|
|
4,152
|
|
|
|
—
|
|
|
|
4,152 |
|
|
|
—
|
|
|
Provision for credit losses related to loans and leases (1)
|
|
|
25,848
|
|
|
|
20,000
|
|
|
|
45,848
|
|
|
|
44,000
|
|
|
Balance, end of period
|
|
$
|
474,651
|
|
|
$
|
470,022
|
|
|
$
|
474,651
|
|
|
$
|
470,022
|
|
|
|
|
|
|
|
|
|
|
|
|
|
|
|
|
|
|
|
|
Loans and leases, net of unearned income - average
|
|
$
|
34,762,808
|
|
|
$
|
32,945,526
|
|
|
$
|
34,355,873
|
|
|
$
|
32,841,550
|
|
|
Loans and leases, net of unearned income - period end
|
|
$
|
35,465,181
|
|
|
$
|
33,312,773
|
|
|
$
|
35,465,181
|
|
|
$
|
33,312,773
|
|
| (1) |
Provision for unfunded commitments was $1.0 million and $2.0 million for the three months ended June 30, 2025 and 2024, respectively, and $1.0 million and zero for the six months ended June 30, 2025 and 2024, respectively.
|
TABLE 7—ACL RELATED RATIOS
| |
|
Three Months Ended June 30,
|
|
|
Six Months Ended June 30,
|
|
| |
|
2025
|
|
|
2024
|
|
|
2025
|
|
|
2024
|
|
|
RATIOS
|
|
|
|
|
|
|
|
|
|
|
|
|
|
Provision for credit losses to average loans and leases, net of unearned income (1)
|
|
|
0.36
|
%
|
|
|
0.27
|
%
|
|
|
0.30
|
%
|
|
|
0.27
|
%
|
|
ACL to loans and leases, net of unearned income
|
|
|
1.34
|
%
|
|
|
1.41
|
%
|
|
|
1.34
|
%
|
|
|
1.41
|
%
|
|
NPL to loans and leases, net of unearned income
|
|
|
0.65
|
%
|
|
|
0.65
|
%
|
|
|
0.65
|
%
|
|
|
0.65
|
%
|
|
ACL to NPL
|
|
|
205.26
|
%
|
|
|
216.85
|
%
|
|
|
205.26
|
%
|
|
|
216.85
|
%
|
|
|
|
|
|
|
|
|
|
|
|
|
|
|
|
|
|
|
|
Net charge-offs to average loans and leases: (1)
|
|
|
|
|
|
|
|
|
|
|
|
|
|
|
|
|
|
Commercial and industrial
|
|
|
|
|
|
|
|
|
|
|
|
|
|
|
|
|
|
Non-real estate
|
|
|
0.16
|
%
|
|
|
0.25
|
%
|
|
|
0.19
|
%
|
|
|
0.22
|
%
|
|
Owner occupied
|
|
|
0.01
|
%
|
|
|
—
|
%
|
|
|
0.01
|
%
|
|
|
—
|
%
|
|
Total commercial and industrial
|
|
|
0.17
|
%
|
|
|
0.25
|
%
|
|
|
0.20
|
%
|
|
|
0.22
|
%
|
|
Commercial real estate
|
|
|
|
|
|
|
|
|
|
|
|
|
|
|
|
|
|
Construction, acquisition and development
|
|
|
—
|
%
|
|
|
0.01
|
%
|
|
|
—
|
%
|
|
|
—
|
%
|
|
Income producing
|
|
|
0.04
|
%
|
|
|
—
|
%
|
|
|
0.03
|
%
|
|
|
0.02
|
%
|
|
Total commercial real estate
|
|
|
0.04
|
%
|
|
|
0.01
|
%
|
|
|
0.03
|
%
|
|
|
0.02
|
%
|
|
Consumer
|
|
|
Residential mortgages
|
|
|
0.02
|
%
|
|
|
0.01
|
%
|
|
|
0.02
|
%
|
|
|
—
|
%
|
|
Other consumer
|
|
|
0.01
|
%
|
|
|
0.01
|
%
|
|
|
0.01
|
%
|
|
|
0.02
|
%
|
|
Total consumer
|
|
|
0.03
|
%
|
|
|
0.02
|
%
|
|
|
0.03
|
%
|
|
|
0.02
|
%
|
|
Total
|
|
|
0.24
|
%
|
|
|
0.28
|
%
|
|
|
0.26
|
%
|
|
|
0.26
|
%
|
|
(1)
|
Ratios are annualized.
|
For the three months ended June 30, 2025 and 2024, net charge-offs totaled $21.2 million and $22.6 million, respectively. As a percentage of average loans and leases, net
charge-offs were 0.24% and 0.28% annualized for the three months ended June 30, 2025 and 2024, respectively. Net charge-offs for the three months ended June 30, 2025, were mainly experienced in the commercial and industrial non-real estate
loan class concentrated in one credit; while net charge-offs for the same period in 2024 were also primarily in the non-real estate class.
For the six months ended June 30, 2025 and 2024, net charge-offs totaled $44.2 million and $42.0 million, respectively. As a percentage of average loans and leases, net
charge-offs were both 0.26% annualized for the six months ended June 30, 2025 and 2024, respectively. Net charge-offs for the six months ended June 30, 2025, were mainly experienced in the commercial and industrial non-real estate loan class
concentrated in two credits, as well as a small number of SBA loans in the resolution process; while net charge-offs for the same period in 2024 were also primarily in the non-real estate class.
The Company recorded $31.0 million in provision for credit losses ($30.0 million for loans and $1.0 million for unfunded commitments) during the three months ended June
30, 2025, compared to $22.0 million ($20.0 million for loans and $2.0 million for unfunded commitments) for the same period in 2024. Provision for credit losses of $4.2 million was recorded on non-PCD loans acquired through the FCB
acquisition during the second quarter of 2025.
The Company recorded $51.0 million in provision for credit losses ($50.0 million for loans and $1.0 million for unfunded commitments) during the six months ended June 30,
2025, compared to $44.0 million ($44.0 million for loans and zero for unfunded commitments) for the same period in 2024.
The ACL increased $13.9 million to $474.7 million at June 30, 2025, from $460.8 million at December 31, 2024. This increase included $8.1 million related to PCD loans
acquired through the FCB acquisition with the remainder of the increase primarily seen in the CRE loan segment. The ACL to NPL decreased to 205.26% at June 30, 2025, from 216.85% at June 30, 2024. For more information about the Company’s
classified, nonperforming, PCD, and impaired loans, see “Item 2. Management’s Discussion and Analysis of Financial Condition and Results of Operations – Financial Condition – Loans and Leases” in Part I of this Report.
The breakdown of the ACL by loan and lease segment and class is based, in part, on evaluations of specific loan and lease histories and the impact of forecasted economic
conditions on the portfolio segments. Accordingly, because these conditions are subject to change, the allocation is not necessarily indicative of the breakdown of any future allowance for credit losses. Several economic forecasts from
external sources are used in the estimation and allocation of the ACL. The forecasts cover an eight-quarter forecast horizon to establish a forecast range and are based on upside, downside, and base case scenarios. A blended scenario is
selected by management to reflect the probable economic conditions within the range. During the six months ended June 30, 2025, the forecast was a mix of downside and base forecasts, weighted more heavily to a base forecast, which is
consistent with the weighting in first half of 2024.
The Company recognizes that higher interest rates, inflation, and slower economic growth may have short-term, long-term, and regional impacts to the economy. In addition,
qualitative factors such as changes in economic conditions, concentrations of risk, and changes in portfolio risk resulting from regulatory changes are considered in determining the adequacy of the level of the ACL (see Note 5 to the
consolidated financial statements).
TABLE 8—ACL BY SEGMENT AND CLASS
| |
|
June 30, 2025
|
|
|
December 31, 2024
|
|
|
(Dollars in thousands)
|
|
ACL |
|
|
|
% of Loans in
Each Category
to Total Loans
|
|
|
ACL |
|
|
|
% of Loans in
Each Category
to Total Loans
|
|
|
Commercial and industrial
|
|
|
|
|
|
|
|
|
|
|
|
|
|
Non-real estate
|
|
$
|
162,371
|
|
|
|
25.5
|
%
|
|
$
|
183,743
|
|
|
|
25.7
|
%
|
|
Owner occupied
|
|
|
42,399
|
|
|
|
13.4
|
|
|
|
35,177
|
|
|
|
13.8
|
|
|
Total commercial and industrial
|
|
|
204,770
|
|
|
|
38.9
|
|
|
|
218,920
|
|
|
|
39.5
|
|
|
Commercial real estate
|
|
|
|
|
|
|
|
|
|
|
|
|
|
|
|
|
|
Construction, acquisition and development
|
|
|
49,080
|
|
|
|
9.8
|
|
|
|
44,703
|
|
|
|
11.6
|
|
|
Income producing
|
|
|
84,366
|
|
|
|
19.8
|
|
|
|
64,957
|
|
|
|
17.8
|
|
|
Total commercial real estate
|
|
|
133,446
|
|
|
|
29.6
|
|
|
|
109,660
|
|
|
|
29.4
|
|
|
Consumer
|
|
|
|
|
|
|
|
|
|
|
|
|
|
|
|
|
|
Residential mortgages
|
|
|
128,826
|
|
|
|
30.9
|
|
|
|
125,464
|
|
|
|
30.4
|
|
|
Other consumer
|
|
|
7,609
|
|
|
|
0.6
|
|
|
|
6,749
|
|
|
|
0.7
|
|
|
Total consumer
|
|
|
136,435
|
|
|
|
31.5
|
|
|
|
132,213
|
|
|
|
31.1
|
|
|
Total
|
|
$
|
474,651
|
|
|
|
100.0
|
%
|
|
$
|
460,793
|
|
|
|
100.0
|
%
|
Noninterest Revenue
The Company attempts to diversify its revenue streams with noninterest revenue received from wealth management activities, mortgage banking operations, and other activities that generate fee
income. The components of noninterest revenue for the periods indicated and the percentage change between the periods are shown in the following table:
TABLE 9—NONINTEREST REVENUE
| |
|
Three Months Ended June 30,
|
|
|
Six Months Ended June 30,
|
|
|
(Dollars in thousands)
|
|
2025
|
|
|
2024
|
|
|
% Change
|
|
|
2025
|
|
|
2024
|
|
|
% Change
|
|
|
Trust and asset management income (1)
|
|
$
|
13,227
|
|
|
$
|
12,645
|
|
|
|
4.6
|
%
|
|
$ |
25,050
|
|
|
$
|
23,967
|
|
|
|
4.5
|
%
|
|
Investment advisory fees (1)
|
|
|
8,970
|
|
|
|
8,180
|
|
|
|
9.7
|
|
|
|
17,424
|
|
|
|
16,517
|
|
|
|
5.5
|
|
|
Brokerage and annuity fees (1)
|
|
|
3,101
|
|
|
|
3,181
|
|
|
|
(2.5
|
)
|
|
|
6,103
|
|
|
|
6,355
|
|
|
|
(4.0
|
)
|
|
Deposit service charges
|
|
|
18,061
|
|
|
|
17,652
|
|
|
|
2.3
|
|
|
|
35,797
|
|
|
|
35,989
|
|
|
|
(0.5
|
)
|
|
Credit card, debit card and merchant fees
|
|
|
12,972
|
|
|
|
12,770
|
|
|
|
1.6
|
|
|
|
24,961
|
|
|
|
24,932
|
|
|
|
0.1
|
|
|
Mortgage banking, excluding MSR and MSR hedge market value adjustment (2)
|
|
|
10,734
|
|
|
|
9,875
|
|
|
|
8.7
|
|
|
|
20,477
|
|
|
|
18,991
|
|
|
|
7.8
|
|
|
MSR and MSR hedge market value adjustment(2)
|
|
|
(2,023
|
)
|
|
|
(3,702
|
)
|
|
|
45.4
|
|
|
|
(5,128
|
)
|
|
|
(6,375
|
)
|
|
|
19.6
|
|
|
Securities losses, net
|
|
|
—
|
|
|
|
(4
|
)
|
|
|
—
|
|
|
|
(9
|
)
|
|
|
(12
|
)
|
|
|
25.0
|
|
|
Bank-owned life insurance (3)
|
|
|
6,812
|
|
|
|
4,370
|
|
|
|
55.9
|
|
|
|
12,014
|
|
|
|
8,316
|
|
|
|
44.5
|
|
|
Credit related fees (3)
|
|
|
8,091
|
|
|
|
5,091
|
|
|
|
58.9
|
|
|
|
14,167
|
|
|
|
11,299
|
|
|
|
25.4
|
|
|
SBA income (3)
|
|
|
4,272
|
|
|
|
2,235
|
|
|
|
91.1
|
|
|
|
7,834
|
|
|
|
5,534
|
|
|
|
41.6
|
|
|
Other miscellaneous income (3)
|
|
|
13,964
|
|
|
|
28,365
|
|
|
|
(50.8
|
)
|
|
|
24,878
|
|
|
|
38,931
|
|
|
|
(36.1
|
)
|
|
Total noninterest revenue
|
|
$
|
98,181
|
|
|
$
|
100,658
|
|
|
|
(2.5
|
)%
|
|
$
|
183,568
|
|
|
$
|
184,444
|
|
|
|
(0.5
|
)%
|
| (1) |
Included in wealth management revenue on the consolidated statements of income.
|
| (2) |
Included in mortgage banking revenue on the consolidated statements of income.
|
| (3) |
Included in other revenue on the consolidated statements of income.
|
Noninterest revenue for the three months ended June 30, 2025, was $98.2 million, a decrease of $2.5 million, or 2.5%, from the same period in 2024. Noninterest revenue
for the six months ended June 30, 2025, was $183.6 million, a decrease of $0.9 million, or 0.5%, from the same period in 2024. The decrease in the second quarter of 2025 compared to the second quarter of 2024 resulted from a decrease in other
miscellaneous income partially offset by increases in mortgage banking revenue, credit related fees, BOLI income, SBA income, and wealth management revenue.
Trust and asset management income, which consists of fee income from management of trust accounts, increased 4.6% during the second quarter of 2025 compared to the same
period in 2024, and increased 4.5% during the six months ended June 30, 2025, compared to the same period in 2024. The increase in the 2025 quarter arose from an increase of 4.9% in assets under management.
Deposit service charges, which consist primarily of corporate analysis charges, overdraft fees, and other service related fees, increased 2.3% during the second quarter
of 2025 compared to the same period in 2024. The increase resulted primarily from an increase of 5.2% in corporate analysis charges.
Mortgage banking revenue typically fluctuates as mortgage interest rates change and is primarily attributable to two activities - (1) the origination and sale of new
mortgage loans and (2) the servicing of sold mortgage loans. Origination revenue is comprised of gains and losses from the sale of mortgage loans, origination fees, underwriting fees and other fees associated with the origination of mortgage
loans. For the three months ended June 30, 2025 and 2024, mortgage loan held for sale origination volumes totaled $351.3 million and $299.6 million, respectively, which produced origination revenue of $4.4 million and $4.0 million,
respectively. The increase in mortgage origination revenue also resulted from an increase of 16.3% in mortgage loans sold during the three months ended June 30, 2025 as compared to the three months ended June 30, 2024.
For the six months ended June 30, 2025 and 2024, mortgage loan held for sale origination volumes totaled $586.7 million and $522.4 million, respectively, which produced
origination revenue of $7.8 million and $7.1 million, respectively. The increase in mortgage origination revenue resulted from a 9.2% increase in loans sold during the six months ended June 30, 2025, due to the same factors impacting the
comparative three months periods noted previously.
Revenue from the mortgage servicing process includes fees from the actual servicing of mortgage loans. For the three months ended June 30, 2025 and 2024, servicing
revenue was $6.4 million and $5.9 million, respectively. For the six months ended June 30, 2025 and 2024, servicing revenue was $12.7 million and $11.9 million, respectively. The quarterly and YTD growth in servicing revenue is primarily
attributable to the 5.0% growth in the servicing portfolio from June 30, 2024, to June 30, 2025.
The Company services a class of residential mortgages that are first lien loans secured by a primary residence or second home. The MSR, which are recognized as a separate
asset on the date the corresponding mortgage loan is sold on a servicing retained basis, is recorded at fair value as determined at each accounting period end. At June 30, 2025 and June 30, 2024, the estimated fair value of the MSR was $111.6
million and $113.6 million, respectively.
The Company is susceptible to significant fluctuations in MSR fair value during changing interest rate environments. The Company has an economic hedge in place on its MSR
and uses various instruments (including but not limited to Treasury options, SOFR and TBA futures and forwards) to mitigate the IRR associated with the MSR. These hedging instruments are reported at fair value, with adjustments included as
part of mortgage banking revenue in the consolidated statements of income. At June 30, 2025 and 2024, this economic hedge covered approximately 75.1% and 75.3%, respectively, of the MSR interest rate risk. Reflecting this sensitivity to
interest rates, the fair value of the MSR, including the hedge, experienced a decrease of $2.0 million for the three months ended June 30, 2025 and a decrease of $3.7 million during the same period in 2024. For the six months ended June 30,
2025 and 2024, the fair value of the MSR, including the hedge, decreased $5.1 million and $6.4 million, respectively.
The following table presents the Company’s mortgage banking operations for the periods indicated:
TABLE 10— MORTGAGE BANKING OPERATIONS
| |
|
Three Months Ended June 30,
|
|
|
Six Months Ended June 30,
|
|
|
(Dollars in thousands)
|
|
2025
|
|
|
2024
|
|
|
% Change
|
|
|
2025
|
|
|
2024
|
|
|
% Change
|
|
|
Production revenue:
|
|
|
|
|
|
|
|
|
|
|
|
|
|
|
|
|
|
|
|
Origination
|
|
$
|
4,362
|
|
|
$
|
3,976
|
|
|
|
9.7
|
%
|
|
$
|
7,765
|
|
|
$
|
7,141
|
|
|
|
8.7
|
%
|
|
Servicing
|
|
|
6,372
|
|
|
|
5,899
|
|
|
|
8.0
|
|
|
|
12,712
|
|
|
|
11,850
|
|
|
|
7.3
|
|
|
Total origination and servicing revenue
|
|
|
10,734
|
|
|
|
9,875
|
|
|
|
8.7
|
|
|
|
20,477
|
|
|
|
18,991
|
|
|
|
7.8
|
|
|
MSR and hedge market value adjustment
|
|
|
(2,023
|
)
|
|
|
(3,702
|
)
|
|
|
45.4
|
|
|
|
(5,128
|
)
|
|
|
(6,375
|
)
|
|
|
19.6
|
|
|
Total mortgage banking revenue
|
|
$
|
8,711
|
|
|
$
|
6,173
|
|
|
|
41.1
|
%
|
|
$
|
15,349
|
|
|
$
|
12,616
|
|
|
|
21.7
|
%
|
|
|
|
|
|
|
|
|
|
|
|
|
|
|
|
|
|
|
|
|
|
|
|
|
|
|
|
Origination of mortgage loans held for sale
|
|
$
|
351,319
|
|
|
$
|
299,552
|
|
|
|
17.3
|
%
|
|
$
|
586,725
|
|
|
$
|
522,428
|
|
|
|
12.3
|
%
|
|
Mortgage loans serviced at quarter-end
|
|
$ |
8,216,970
|
|
|
$ |
7,824,895
|
|
|
|
5.0
|
% |
|
$ |
8,216,970
|
|
|
$ |
7,824,895
|
|
|
|
5.0
|
% |
BOLI income consists of death benefits and earnings on the cash surrender value. For the second quarter of 2025 and the six months ended June 30, 2025, BOLI income increased $2.4 million and
$3.7 million, respectively, from the comparable periods in 2024. These increases resulted primarily from increases in death benefits received.
Credit related fees consist of interest rate swap income, letter of credit fees, unused line fees, and arrangement fees. For the second quarter of 2025, and the six months ended June 30,
2025, credit related fees increased 58.9% and 25.4%, respectively, from the comparable periods in 2024. The primary drivers of these increases were increases in swap derivative income and in arrangement fees.
SBA income consists of gains and losses on the sale of SBA loans, servicing fees, and various fees related to processing SBA loans. SBA income increased 91.1% during the second quarter of
2025 compared to the same period in 2024 and increased 41.6% during the six months ended June 30, 2025, compared to the same periods in 2024. The increases incurred during the 2025 periods are due to increases of $26.6 million and $32.2
million in SBA loans sold during the quarter and YTD periods ended June 30, 2025, respectively. The second quarter 2025 sales increase was favorably impacted by the addition of FCB’s SBA business.
Other miscellaneous income consists of various fees, gains and losses, and other revenue. For the second quarter of 2025, and the six months ended June 30, 2025, other miscellaneous income
decreased 50.8% and 36.1%, respectively, from the comparable periods in 2024. These decreases were primarily driven by the gain of $15.0 million on sales of businesses that occurred in second quarter 2024.
Noninterest Expense
The components of noninterest expense for the periods indicated and the percentage change between periods are shown in the following table:
TABLE 11—NONINTEREST EXPENSE
| |
|
Three Months Ended June 30,
|
|
|
Six Months Ended June 30,
|
|
|
(Dollars in thousands)
|
|
2025
|
|
|
2024
|
|
|
% Change
|
|
|
2025
|
|
|
2024
|
|
|
% Change
|
|
|
Salaries and employee benefits
|
|
$
|
157,340
|
|
|
$
|
148,038
|
|
|
|
6.3
|
%
|
|
$
|
310,312
|
|
|
$
|
304,689
|
|
|
|
1.8
|
%
|
|
Occupancy and equipment
|
|
|
30,039
|
|
|
|
29,367
|
|
|
|
2.3
|
|
|
|
58,516
|
|
|
|
58,007
|
|
|
|
0.9
|
|
|
Data processing and software
|
|
|
30,701
|
|
|
|
29,467
|
|
|
|
4.2
|
|
|
|
57,833
|
|
|
|
59,494
|
|
|
|
(2.8
|
)
|
|
Deposit insurance assessments
|
|
|
8,571
|
|
|
|
15,741
|
|
|
|
(45.5
|
)
|
|
|
17,214
|
|
|
|
24,156
|
|
|
|
(28.7
|
)
|
|
Amortization of intangibles
|
|
|
4,046
|
|
|
|
3,999
|
|
|
|
1.2
|
|
|
|
7,714
|
|
|
|
8,065
|
|
|
|
(4.4
|
)
|
|
Merger expense
|
|
|
2,179
|
|
|
|
—
|
|
|
|
100.0
|
|
|
|
2,494
|
|
|
|
—
|
|
|
|
100.0
|
|
|
Advertising and public relations (1)
|
|
|
7,304
|
|
|
|
6,537
|
|
|
|
11.7
|
|
|
|
11,461
|
|
|
|
10,760
|
|
|
|
6.5
|
|
|
Foreclosed property expense (1)
|
|
|
757
|
|
|
|
515
|
|
|
|
46.9
|
|
|
|
1,621
|
|
|
|
783
|
|
|
|
107.1
|
|
|
Telecommunications (1)
|
|
|
1,330
|
|
|
|
1,441
|
|
|
|
(7.7
|
)
|
|
|
2,842
|
|
|
|
2,985
|
|
|
|
(4.8
|
)
|
|
Travel and entertainment (1)
|
|
|
2,829
|
|
|
|
2,549
|
|
|
|
11.0
|
|
|
|
5,266
|
|
|
|
4,785
|
|
|
|
10.1
|
|
|
Professional, consulting and outsourcing (1)
|
|
|
4,043
|
|
|
|
3,534
|
|
|
|
14.4
|
|
|
|
8,775
|
|
|
|
7,469
|
|
|
|
17.5
|
|
|
Legal (1)
|
|
|
8,111
|
|
|
|
758
|
|
|
NM
|
|
|
|
11,669
|
|
|
|
4,440
|
|
|
|
162.8
|
|
|
Postage and shipping (1)
|
|
|
1,797
|
|
|
|
1,622
|
|
|
|
10.8
|
|
|
|
3,571
|
|
|
|
3,827
|
|
|
|
(6.7
|
)
|
|
Other miscellaneous expense (1)
|
|
|
13,816
|
|
|
|
13,129
|
|
|
|
5.2
|
|
|
|
32,924
|
|
|
|
30,444
|
|
|
|
8.1
|
|
|
Total noninterest expense
|
|
$
|
272,863
|
|
|
$
|
256,697
|
|
|
|
6.3
|
%
|
|
$
|
532,212
|
|
|
$
|
519,904
|
|
|
|
2.4
|
%
|
| (1) |
Included in other expense on the consolidated statements of income.
|
Noninterest expense for the three months ended June 30, 2025, was $272.9 million, an increase of $16.2 million, or 6.3%, from the same period in 2024. Noninterest expense for the six months
ended June 30, 2025, was $532.2 million, an increase of $12.3 million, or 2.4%, from the same period in 2024. Both the quarter over quarter increase and the year over year increase primarily resulted from increases in salaries and employee
benefits and increases in legal expenses, partially offset by a decrease in deposit insurance assessments.
Salaries and employee benefits expense was the largest category of our noninterest expense. Salaries and employee benefits increased $9.3 million for the three months ended June 30, 2025, and increased $5.6
million for the six months ended June 30, 2025, compared to the same periods in 2024. The increases resulted primarily from the addition of First Chatham in the second quarter of 2025, an increase in commissions expense associated with strong
fee revenue performance and increased payroll taxes attributable to increased salaries, commissions, and incentive payments.
The components of salary and employee benefits expense for the periods indicated and the percentage change between periods are shown in the following table:
TABLE 12—SALARIES AND EMPLOYEE BENEFITS EXPENSE
| |
|
Three Months Ended June 30,
|
|
|
Six Months Ended June 30,
|
|
|
(Dollars in thousands)
|
|
2025
|
|
|
2024
|
|
|
% Change
|
|
|
2025
|
|
|
2024
|
|
|
% Change
|
|
|
Regular salaries, net of deferred salaries
|
|
$
|
90,885
|
|
|
$
|
89,486
|
|
|
|
1.6
|
%
|
|
$
|
185,775
|
|
|
$
|
188,109
|
|
|
|
(1.2
|
)%
|
|
Commissions and incentive compensation
|
|
|
38,450
|
|
|
|
33,553
|
|
|
|
14.6
|
|
|
|
67,558
|
|
|
|
61,581
|
|
|
|
9.7
|
|
|
Taxes and employee benefits
|
|
|
28,005
|
|
|
|
24,999
|
|
|
|
12.0
|
|
|
|
56,979
|
|
|
|
54,999
|
|
|
|
3.6
|
|
|
Total salaries and employee benefits
|
|
$
|
157,340
|
|
|
$
|
148,038
|
|
|
|
6.3
|
%
|
|
$
|
310,312
|
|
|
$
|
304,689
|
|
|
|
1.8
|
%
|
Deposit insurance assessments consist of amounts paid to the FDIC for deposit insurance which consist of both regular quarterly assessments and special assessments that are implemented by the
FDIC to increase the level of the DIF. Deposit insurance premiums decreased $7.2 million for the three months ended June 30, 2025, and decreased $6.9 million for the six months ended June 30, 2025, compared to the same periods in 2024. The
quarter over quarter and year over year decreases are attributable to the 2024 adjustments to the FDIC special assessment that did not repeat in 2025.
Merger expenses consists of one-time expenses related to the acquisition of another business. Merger expenses increased $2.2 million for the three months ended June 30, 2025, and increased $2.5
million for the six months ended June 30, 2025, compared to the same periods in 2024. These increases were incurred due to the recent mergers with FCB Financial and Industry.
Legal expenses consist of legal fees paid to external attorneys and accruals for the settlement of various legal matters that arise in the ordinary course of business. Legal fees increased $7.4
million for the three months ended June 30, 2025, and increased $7.2 million for the six months ended June 30, 2025, compared to the same periods in 2024. The increases resulted primarily from increases of $5.6 million and $4.7 million in legal
settlements for the quarterly and year-to-date 2025 periods, respectively.
Income Taxes
The Company recorded an income tax expense of $37.8 million for the three months ended June 30, 2025, compared to $40.8 million for the same period in 2024. The decrease in tax expense in 2025
can be attributed to a reduction of excess salary disallowance.
The Company recorded an income tax expense of $73.8 million for the six months ended June 30, 2025, compared to $76.3 million for the same period in 2024. The decrease in tax expense in 2025
can be attributed to a reduction of excess salary disallowance.
The effective tax rate was 21.9% and 21.6% for the three and six months ended June 30, 2025, respectively, compared to 22.9% and 23.1% for the same periods in 2024. The decrease in the
effective tax rate was the result of a reduction of excess salary disallowance and excess tax benefits from stock-based compensation.
In August 2022, the IRA of 2022 was signed into law to address inflation, healthcare costs, climate change and renewal energy incentives, among other things. Included in the IRA of 2022 are
provisions for the creation of a 15% CAMT that is effective for tax years beginning January 1, 2023 for corporations with an average annual adjusted financial statement income in excess of $1 billion. Based on information available to date, we
do not anticipate that the Company will be subject to the 15% CAMT in 2025, absent any further changes in law.
In July 2025, the OBBB Act was signed into law which both extended many soon to expire provisions of the TCJA and made several additional changes to the Internal Revenue Code. The Company is
currently evaluating the impact the new law may have on its consolidated financial statements.
FINANCIAL CONDITION
The percentage of earning assets to total assets measures the effectiveness of management’s efforts to invest available funds representing the most efficient and profitable uses. Earning assets
at June 30, 2025 were $45.4 billion, or 90.1% of total assets, compared with $42.4 billion, or 90.1% of total assets, at December 31, 2024.
TABLE 13—FINANCIAL CONDITION SUMMARY
|
(In thousands)
|
|
|
As of and For the
Six Months Ended
June 30, 2025
|
|
|
|
As of and For the
Year Ended
December 31, 2024
|
|
|
Period-End Balances:
|
|
|
|
|
Total assets
|
|
$
|
50,378,840
|
|
|
$
|
47,019,190
|
|
|
Available for sale securities, at fair value
|
|
|
8,837,400
|
|
|
|
7,293,988
|
|
|
Loans and leases, net of unearned income
|
|
|
35,465,181
|
|
|
|
33,741,755
|
|
|
Total deposits
|
|
|
40,493,518
|
|
|
|
40,496,201
|
|
|
Securities sold under agreement to repurchase
|
|
|
21,225
|
|
|
|
23,616
|
|
|
Short-term FHLB borrowings
|
|
|
1,575,000
|
|
|
|
—
|
|
|
Subordinated and long-term borrowings
|
|
|
1,430,674
|
|
|
|
10,706
|
|
|
Total shareholders' equity
|
|
|
5,916,283
|
|
|
|
5,569,683
|
|
|
Common shareholders' equity
|
|
|
5,749,290
|
|
|
|
5,402,690
|
|
|
Average Balances:
|
|
|
|
|
|
|
|
|
|
Total assets
|
|
|
48,252,199
|
|
|
|
47,973,279
|
|
|
Available for sale securities, at fair value
|
|
|
8,062,495
|
|
|
|
7,962,869
|
|
|
Loans and leases, net of unearned income
|
|
|
34,355,873
|
|
|
|
33,107,659
|
|
|
Total deposits
|
|
|
40,124,186
|
|
|
|
38,475,929
|
|
|
Securities sold under agreement to repurchase
|
|
|
20,715
|
|
|
|
81,092
|
|
|
Federal funds purchased and short-term BTFP and FHLB borrowings
|
|
|
767,624
|
|
|
|
2,850,981
|
|
|
Subordinated and long-term borrowings
|
|
|
736,885
|
|
|
|
306,396
|
|
|
Total shareholders' equity
|
|
|
5,739,821
|
|
|
|
5,353,705
|
|
|
Common shareholders' equity
|
|
|
5,572,828
|
|
|
|
5,186,712
|
|
Securities
The Company uses its securities portfolio as a source of revenue and liquidity, and to serve as collateral to secure certain types of deposits and borrowings. These securities, which are
available for possible sale, are recorded at fair value. The following table shows the carrying value of the Company’s AFS securities by investment category for the periods indicated:
TABLE 14—AVAILABLE FOR SALE SECURITIES SUMMARY
|
(In thousands)
|
|
June 30, 2025
|
|
|
December 31, 2024
|
|
|
Available for sale securities:
|
|
|
|
|
|
|
|
U.S. government agency securities
|
|
$
|
266,905
|
|
|
$
|
281,231
|
|
|
MBS issued or guaranteed by U.S. agencies
|
|
|
|
|
|
|
|
|
|
Residential pass-through:
|
|
|
|
|
|
|
|
|
|
Guaranteed by GNMA
|
|
|
64,464
|
|
|
|
66,581
|
|
|
Issued by FNMA and FHLMC
|
|
|
4,166,316
|
|
|
|
3,965,556
|
|
|
Other residential MBS
|
|
|
2,389,062
|
|
|
|
934,721
|
|
|
Commercial MBS
|
|
|
1,455,638
|
|
|
|
1,549,641
|
|
|
Total MBS
|
|
|
8,075,480
|
|
|
|
6,516,499
|
|
|
Obligations of states and political subdivisions
|
|
|
131,335
|
|
|
|
132,069
|
|
|
Corporate debt securities
|
|
|
45,999
|
|
|
|
47,402
|
|
|
Foreign debt securities
|
|
|
317,681
|
|
|
|
316,787
|
|
|
Total
|
|
$
|
8,837,400
|
|
|
$
|
7,293,988
|
|
At June 30, 2025, the Company’s AFS securities totaled $8.8 billion compared to $7.3 billion at December 31, 2024. The increase of $1.5 billion, or 21.2%, was
primarily driven by the purchases of $2.0 billion of higher yielding securities during the period. The increase was offset by the maturities and paydowns of $644.1 million and the sale of $45.6 million of AFS securities during the six
month period.
Net unrealized losses on AFS securities at June 30, 2025 and December 31, 2024 totaled $700.2 million and $853.7 million, respectively. At June 30, 2025, management
believes that the unrealized losses are due to noncredit-related factors, such as changes in interest rates and other market conditions (see Note 3 to these unaudited consolidated financial statements).
The following table shows the maturities and weighted average yields for the carrying value of the AFS securities for the periods indicated:
TABLE 15—MATURITY DISTRIBUTION OF AFS SECURITIES
| |
|
June 30, 2025
|
|
|
December 31, 2024
|
|
| |
|
Estimated
Fair Value
|
|
|
Weighted
Average
Yield
|
|
|
Estimated
Fair Value
|
|
|
Weighted
Average
Yield
|
|
|
(Dollars in thousands)
|
|
|
|
|
|
|
|
|
|
|
|
|
|
U.S. government agency securities:
|
|
|
|
|
|
|
|
|
|
|
|
|
|
Due in one to five years
|
|
$
|
7,057
|
|
|
|
3.39
|
%
|
|
$
|
8,364
|
|
|
|
3.76
|
%
|
|
Due in five to ten years
|
|
|
190,089
|
|
|
|
3.65
|
|
|
|
204,624
|
|
|
|
4.10
|
|
|
Due after ten years
|
|
|
69,759
|
|
|
|
2.10
|
|
|
|
68,243
|
|
|
|
2.14
|
|
|
U.S. government agency securities total
|
|
|
266,905
|
|
|
|
3.24
|
|
|
|
281,231
|
|
|
|
3.62
|
|
|
Obligations of states and political subdivisions:
|
|
|
|
|
|
|
|
|
|
|
|
|
|
|
|
|
|
Due in one to five years
|
|
|
9,227
|
|
|
|
2.89
|
|
|
|
9,295
|
|
|
|
2.92
|
|
|
Due in five to ten years
|
|
|
15,913
|
|
|
|
2.18
|
|
|
|
15,563
|
|
|
|
2.22
|
|
|
Due after ten years
|
|
|
106,195
|
|
|
|
2.70
|
|
|
|
107,211
|
|
|
|
2.69
|
|
|
Obligations of states and political subdivisions total
|
|
|
131,335
|
|
|
|
2.65
|
|
|
|
132,069
|
|
|
|
2.66
|
|
|
Corporate debt securities:
|
|
|
|
|
|
|
|
|
|
|
|
|
|
|
|
|
|
Due in five to ten years
|
|
|
44,225
|
|
|
|
4.76
|
|
|
|
45,702
|
|
|
|
4.77
|
|
|
Due after ten years
|
|
|
1,774
|
|
|
|
4.50
|
|
|
|
1,700
|
|
|
|
4.50
|
|
|
Corporate debt securities total
|
|
|
45,999
|
|
|
|
4.75
|
|
|
|
47,402
|
|
|
|
4.76
|
|
|
Foreign debt securities:
|
|
|
|
|
|
|
|
|
|
|
|
|
|
|
|
|
|
Due in one to five years
|
|
|
88,712
|
|
|
|
3.19
|
|
|
|
87,855
|
|
|
|
3.36
|
|
|
Due in five to ten years
|
|
|
228,969
|
|
|
|
4.79
|
|
|
|
228,932
|
|
|
|
5.16
|
|
|
Foreign debt securities total
|
|
|
317,681
|
|
|
|
4.34
|
|
|
|
316,787
|
|
|
|
4.66
|
|
| |
|
|
|
|
|
|
|
|
|
|
|
|
|
|
|
|
|
Total securities due in one to five years
|
|
|
104,996
|
|
|
|
3.18
|
|
|
|
105,514
|
|
|
|
3.35
|
|
|
Total securities due in five to ten years
|
|
|
479,196
|
|
|
|
4.25
|
|
|
|
494,821
|
|
|
|
4.59
|
|
|
Total securities due after ten years
|
|
|
177,728
|
|
|
|
2.48
|
|
|
|
177,154
|
|
|
|
2.50
|
|
|
MBS
|
|
|
8,075,480
|
|
|
|
3.41
|
|
|
|
6,516,499
|
|
|
|
2.87
|
|
|
Total estimated fair value
|
|
$
|
8,837,400
|
|
|
|
3.43
|
%
|
|
$
|
7,293,988
|
|
|
|
2.98
|
%
|
The weighted average yields reported in Table 15 have been calculated using the average daily balance of the related securities. The yields
on tax-exempt obligations of states and political subdivisions have been adjusted to a taxable equivalent basis using a 21% tax rate.
Loans and Leases
The Company’s loans and leases held for investment portfolio represents the largest single component of the Company’s earning asset base. Average loans and leases
comprised 78.6% and 75.9% of average earning assets during the six months ended June 30, 2025 and the year ended December 31, 2024, respectively. The Company’s lending activities include both commercial and consumer loans and leases. The
Company has established systematic procedures for approving and monitoring loans and leases that vary depending on the size and nature of the loan or lease and applies these procedures in a disciplined manner. The Company also acts as
agent or participant in syndications and other financing arrangements with other financial institutions. The Company’s loans and leases are widely diversified by borrower and industry. Loans and leases, net of unearned income, totaled
$35.5 billion at June 30, 2025, representing a 5.1% increase from $33.7 billion at December 31, 2024.
The following table shows the composition of the Company’s loan and lease portfolio by segment and class at the dates indicated:
TABLE 16—LOANS AND LEASES PORTFOLIO
|
(In thousands)
|
|
June 30, 2025
|
|
|
December 31, 2024
|
|
|
Commercial and industrial
|
|
|
|
|
|
|
|
Non-real estate
|
|
$
|
9,049,094
|
|
|
$
|
8,670,529
|
|
|
Owner occupied
|
|
|
4,762,408
|
|
|
|
4,665,015
|
|
|
Total commercial and industrial
|
|
|
13,811,502
|
|
|
|
13,335,544
|
|
|
Commercial real estate
|
|
|
|
|
|
|
|
|
|
Construction, acquisition and development
|
|
|
3,464,124
|
|
|
|
3,909,184
|
|
|
Income producing
|
|
|
7,025,539
|
|
|
|
6,015,773
|
|
|
Total commercial real estate
|
|
|
10,489,663
|
|
|
|
9,924,957
|
|
|
Consumer
|
|
|
|
|
|
|
|
|
|
Residential mortgages
|
|
|
10,951,618
|
|
|
|
10,267,883
|
|
|
Other consumer
|
|
|
212,398
|
|
|
|
213,371
|
|
|
Total consumer
|
|
|
11,164,016
|
|
|
|
10,481,254
|
|
|
Total loans and leases, net of unearned income (1) (2)
|
|
$
|
35,465,181
|
|
|
$
|
33,741,755
|
|
| (1) |
Total loans and leases are net of $23.9 million and $21.4 million of unearned income at June 30, 2025 and December 31, 2024, respectively.
|
| (2) |
Total loans and leases include $382.6 million of FCB loans acquired on May 1, 2025. See Note 2 to the unaudited consolidated financial statements for additional details.
|
The following table shows the Company’s loan and lease portfolio by segment and class at the dates indicated by geographical location.
TABLE 17—LOANS AND LEASES BY GEOGRAPHICAL LOCATION
| |
|
June 30, 2025
|
|
|
(In thousands)
|
|
Alabama
|
|
|
Arkansas
|
|
|
Florida
|
|
|
Georgia
|
|
|
Louisiana
|
|
|
Mississippi
|
|
|
Missouri
|
|
|
Tennessee
|
|
|
Texas
|
|
|
Other
|
|
|
Total
|
|
|
Commercial and industrial
|
|
|
|
|
|
|
|
|
|
|
|
|
|
|
|
|
|
|
|
|
|
|
|
|
|
|
|
|
|
|
|
|
|
|
Non-real estate
|
|
$
|
461,841
|
|
|
$
|
150,416
|
|
|
$
|
578,930
|
|
|
$
|
463,910
|
|
|
$
|
380,995
|
|
|
$
|
566,433
|
|
|
$
|
73,659
|
|
|
$
|
335,082
|
|
|
$
|
3,560,172
|
|
|
$
|
2,477,656
|
|
|
$
|
9,049,094
|
|
|
Owner occupied
|
|
|
327,424
|
|
|
|
247,534
|
|
|
|
306,486
|
|
|
|
412,620
|
|
|
|
288,772
|
|
|
|
591,957
|
|
|
|
99,690
|
|
|
|
157,107
|
|
|
|
1,861,471
|
|
|
|
469,347
|
|
|
|
4,762,408
|
|
|
Total commercial and industrial
|
|
|
789,265
|
|
|
|
397,950
|
|
|
|
885,416
|
|
|
|
876,530
|
|
|
|
669,767
|
|
|
|
1,158,390
|
|
|
|
173,349
|
|
|
|
492,189
|
|
|
|
5,421,643
|
|
|
|
2,947,003
|
|
|
|
13,811,502
|
|
|
Commercial real estate
|
|
|
|
|
|
|
|
|
|
|
|
|
|
|
|
|
|
|
|
|
|
|
|
|
|
|
|
|
|
|
|
|
|
|
|
|
|
|
|
|
|
|
|
|
|
Construction, acquisition and development
|
|
|
223,889
|
|
|
|
67,466
|
|
|
|
234,381
|
|
|
|
359,066
|
|
|
|
60,759
|
|
|
|
167,989
|
|
|
|
39,054
|
|
|
|
179,527
|
|
|
|
1,671,287
|
|
|
|
460,706
|
|
|
|
3,464,124
|
|
|
Income producing
|
|
|
475,388
|
|
|
|
278,193
|
|
|
|
673,011
|
|
|
|
1,021,286
|
|
|
|
229,432
|
|
|
|
415,358
|
|
|
|
220,172
|
|
|
|
327,886
|
|
|
|
2,459,308
|
|
|
|
925,505
|
|
|
|
7,025,539
|
|
|
Total commercial real estate
|
|
|
699,277
|
|
|
|
345,659
|
|
|
|
907,392
|
|
|
|
1,380,352
|
|
|
|
290,191
|
|
|
|
583,347
|
|
|
|
259,226
|
|
|
|
507,413
|
|
|
|
4,130,595
|
|
|
|
1,386,211
|
|
|
|
10,489,663
|
|
|
Consumer
|
|
|
|
|
|
|
|
|
|
|
|
|
|
|
|
|
|
|
|
|
|
|
|
|
|
|
|
|
|
|
|
|
|
|
|
|
|
|
|
|
|
|
|
|
|
Residential mortgages
|
|
|
1,324,421
|
|
|
|
451,893
|
|
|
|
720,256
|
|
|
|
526,537
|
|
|
|
494,173
|
|
|
|
1,253,916
|
|
|
|
231,680
|
|
|
|
864,729
|
|
|
|
4,816,298
|
|
|
|
267,715
|
|
|
|
10,951,618
|
|
|
Other consumer
|
|
|
27,540
|
|
|
|
18,585
|
|
|
|
5,066
|
|
|
|
9,182
|
|
|
|
10,739
|
|
|
|
84,064
|
|
|
|
1,353
|
|
|
|
16,712
|
|
|
|
33,853
|
|
|
|
5,304
|
|
|
|
212,398
|
|
|
Total consumer
|
|
|
1,351,961
|
|
|
|
470,478
|
|
|
|
725,322
|
|
|
|
535,719
|
|
|
|
504,912
|
|
|
|
1,337,980
|
|
|
|
233,033
|
|
|
|
881,441
|
|
|
|
4,850,151
|
|
|
|
273,019
|
|
|
|
11,164,016
|
|
|
Total
|
|
$
|
2,840,503
|
|
|
$
|
1,214,087
|
|
|
$
|
2,518,130
|
|
|
$
|
2,792,601
|
|
|
$
|
1,464,870
|
|
|
$
|
3,079,717
|
|
|
$
|
665,608
|
|
|
$
|
1,881,043
|
|
|
$
|
14,402,389
|
|
|
$
|
4,606,233
|
|
|
$
|
35,465,181
|
|
| |
|
December 31, 2024
|
|
|
(In thousands)
|
|
Alabama
|
|
|
Arkansas
|
|
|
Florida
|
|
|
Georgia
|
|
|
Louisiana
|
|
|
Mississippi
|
|
|
Missouri
|
|
|
Tennessee
|
|
|
Texas
|
|
|
Other
|
|
|
Total
|
|
|
Commercial and industrial
|
|
|
|
|
|
|
|
|
|
|
|
|
|
|
|
|
|
|
|
|
|
|
|
|
|
|
|
|
|
|
|
|
|
|
Non-real estate
|
|
$
|
413,359
|
|
|
$
|
169,534
|
|
|
$
|
532,224
|
|
|
$
|
446,812
|
|
|
$
|
371,543
|
|
|
$
|
536,651
|
|
|
$
|
64,846
|
|
|
$
|
399,346
|
|
|
$
|
3,478,755
|
|
|
$
|
2,257,459
|
|
|
$
|
8,670,529
|
|
|
Owner occupied
|
|
|
337,580
|
|
|
|
253,538
|
|
|
|
308,545
|
|
|
|
400,342
|
|
|
|
298,787
|
|
|
|
624,950
|
|
|
|
107,443
|
|
|
|
159,058
|
|
|
|
1,708,113
|
|
|
|
466,659
|
|
|
|
4,665,015
|
|
|
Total commercial and industrial
|
|
|
750,939
|
|
|
|
423,072
|
|
|
|
840,769
|
|
|
|
847,154
|
|
|
|
670,330
|
|
|
|
1,161,601
|
|
|
|
172,289
|
|
|
|
558,404
|
|
|
|
5,186,868
|
|
|
|
2,724,118
|
|
|
|
13,335,544
|
|
|
Commercial real estate
|
|
|
|
|
|
|
|
|
|
|
|
|
|
|
|
|
|
|
|
|
|
|
|
|
|
|
|
|
|
|
|
|
|
|
|
|
|
|
|
|
|
|
|
|
|
Construction, acquisition and development
|
|
|
230,810
|
|
|
|
65,358
|
|
|
|
438,173
|
|
|
|
543,249
|
|
|
|
36,194
|
|
|
|
169,336
|
|
|
|
45,690
|
|
|
|
180,566
|
|
|
|
1,656,715
|
|
|
|
543,093
|
|
|
|
3,909,184
|
|
|
Income producing
|
|
|
437,146
|
|
|
|
259,767
|
|
|
|
477,493
|
|
|
|
613,337
|
|
|
|
226,849
|
|
|
|
424,078
|
|
|
|
204,119
|
|
|
|
319,560
|
|
|
|
2,298,344
|
|
|
|
755,080
|
|
|
|
6,015,773
|
|
|
Total commercial real estate
|
|
|
667,956
|
|
|
|
325,125
|
|
|
|
915,666
|
|
|
|
1,156,586
|
|
|
|
263,043
|
|
|
|
593,414
|
|
|
|
249,809
|
|
|
|
500,126
|
|
|
|
3,955,059
|
|
|
|
1,298,173
|
|
|
|
9,924,957
|
|
|
Consumer
|
|
|
|
|
|
|
|
|
|
|
|
|
|
|
|
|
|
|
|
|
|
|
|
|
|
|
|
|
|
|
|
|
|
|
|
|
|
|
|
|
|
|
|
|
|
Residential mortgages
|
|
|
1,300,485
|
|
|
|
425,602
|
|
|
|
709,335
|
|
|
|
449,117
|
|
|
|
478,947
|
|
|
|
1,214,542
|
|
|
|
210,712
|
|
|
|
796,490
|
|
|
|
4,436,803
|
|
|
|
245,850
|
|
|
|
10,267,883
|
|
|
Other consumer
|
|
|
27,186
|
|
|
|
17,653
|
|
|
|
5,002
|
|
|
|
7,817
|
|
|
|
10,653
|
|
|
|
86,059
|
|
|
|
1,322
|
|
|
|
16,668
|
|
|
|
36,559
|
|
|
|
4,452
|
|
|
|
213,371
|
|
|
Total consumer
|
|
|
1,327,671
|
|
|
|
443,255
|
|
|
|
714,337
|
|
|
|
456,934
|
|
|
|
489,600
|
|
|
|
1,300,601
|
|
|
|
212,034
|
|
|
|
813,158
|
|
|
|
4,473,362
|
|
|
|
250,302
|
|
|
|
10,481,254
|
|
|
Total
|
|
$
|
2,746,566
|
|
|
$
|
1,191,452
|
|
|
$
|
2,470,772
|
|
|
$
|
2,460,674
|
|
|
$
|
1,422,973
|
|
|
$
|
3,055,616
|
|
|
$
|
634,132
|
|
|
$
|
1,871,688
|
|
|
$
|
13,615,289
|
|
|
$
|
4,272,593
|
|
|
$
|
33,741,755
|
|
Loans Acquired in Mergers and Acquisitions
In connection with past bank acquisitions, the Company acquired loans both with and without evidence of credit quality deterioration since origination. Acquired loans
are recorded at their fair value at the time of acquisition with no carryover from the acquired institution’s previously recorded ACL.
Fair values for loans were estimated based on a discounted cash flow methodology (income approach) that considered factors including loan type and related collateral,
classification status, remaining term of the loan (in months), fixed or variable interest rate, past delinquencies, timing of principal and interest payments, current market rates, LTV, and current discount rates. The discount rate did
not include an explicit factor for credit losses, as it was included as a reduction to the estimated cash flows. Large loans were specifically reviewed to evaluate credit risk. The resulting fair value adjustment is recorded in the form
of a premium or discount to the unpaid principal balance of each acquired loan. As it relates to acquired loans that, as of the date of acquisition, have experienced a more-than-insignificant deterioration in credit quality since
origination (“PCD”), the net premium or net discount is adjusted to reflect the Company’s ACL recorded for PCD loans at the time of acquisition, and the remaining fair value adjustment not related to credit is accreted or amortized into
interest income over the remaining life of the loan. As it relates to acquired loans not classified as PCD (“non-PCD”) loans, the credit loss and yield components of the fair value adjustment are aggregated, and the resulting net premium
or net discount is accreted or amortized into interest income over the remaining life of the loan. The Company records an ACL for non-PCD loans at the time of acquisition through provision expense, and therefore, no further adjustments
are made to the net premium or net discount for non-PCD loans. For the three and six months ended June 30, 2025, the Company’s ACL recorded for acquired PCD and non-PCD loans was $8.1 million and $4.2 million, respectively, due to the FCB
acquisition. The book value of the acquired loans was $387.3 million.
In addition, a grade is assigned to each loan during the valuation process. For acquired loans that are not individually reviewed during the valuation process, such
loans are assumed to have characteristics similar to the assigned rating of the acquired institution’s risk rating, adjusted for any estimated differences between the Company’s rating methodology and the acquired institution’s risk rating
methodology. Acquired loans that are individually evaluated at the acquisition date are assigned a specific reserve in the same manner as other loans individually evaluated and are assigned an internal grade representing PCD with Loss
Exposure.
The following is a discussion of the Company’s segments and classes of loans and leases:
Commercial and Industrial
Non-Real Estate – The Company engages in lending to small and medium-sized business enterprises and government entities
through its community banking locations and to regional and national business enterprises through its corporate banking division. C&I loans are loans and leases to finance business operations, equipment and owner-occupied facilities.
These include both lines of credit and term loans which are amortized over the useful life of the assets financed. Personal and/or corporate guarantees are generally obtained where available and prudent. Also included in this category are
loans to finance agricultural production. The Company recognizes that risk from economic cycles, commodity prices, government regulation, supply-chain disruptions, product innovations or obsolescence, operational errors, lawsuits, natural
disasters, fraud, losses due to theft or embezzlement, loss of sponsor support, health or loss of key personnel, or competitive situations may adversely affect the scheduled repayment of business loans. In addition, risks in the
agricultural sector including crop failures due to weather, insects and other blights, commodity prices, governmental intervention, lawsuits, labor or logistical disruptions. Non-real estate loans increased 4.4% from December 31, 2024 to
June 30, 2025.
Owner Occupied – Owner occupied loans include loans secured by business facilities
to finance business operations, equipment, agricultural land and owner-occupied facilities. These include both lines of credit and term loans which are amortized over the useful life of the assets financed. Personal guarantees are
generally obtained where available and prudent. The Company recognizes that risk from economic cycles, government regulation, supply-chain disruptions, product innovations or obsolescence, operational errors, lawsuits, natural disasters,
losses due to theft or embezzlement, health or loss of key personnel, or competitive situations may adversely affect the scheduled repayment of business loans. Owner occupied loans increased 2.1% from December 31, 2024 to June 30, 2025.
Commercial Real Estate
Construction, Acquisition and Development – CAD loans include both term loans and credit lines for construction of
commercial, industrial, residential, and multi-family buildings and for purchasing, carrying, and developing land into residential subdivisions or various types of commercial developments, such as industrial, warehouse, retail, office,
and multi-family. The Company generally engages in construction and development lending primarily in markets served by its branches. The Company recognizes that risks are inherent in the financing of real estate development and
construction. These risks include location, market conditions and price volatility, changes in interest rates, demand for developed land, lots and buildings, desirability of features and styling of completed developments and buildings,
competition from other developments and builders, traffic patterns, remote work patterns, governmental jurisdiction, tax structure, availability of utilities, roads, public transportation and schools, availability of permanent financing
for homebuyers, zoning, environmental restrictions, lawsuits, economic and business cycle, or labor and reputation of the builder or developer. CAD loans decreased 11.4% from December 31, 2024 to June 30, 2025.
Each CAD loan is underwritten to address: (i) the desirability of the project, its market viability and projected absorption period; (ii) the credit worthiness of the
borrower and the guarantor, if applicable, as to liquidity, cash flow and assets available to ensure performance of the loan; (iii) equity contribution to the project; (iv) the developer’s experience and success with similar projects; and
(ev) the value of the collateral.
Income Producing – Income producing loans include loans to finance income-producing
commercial and multi-family properties. Lending in this category is generally limited to properties located in the Company’s market area with only limited exposure to properties located elsewhere. Loans in this category include loans for
neighborhood retail centers, medical and professional offices, single retail stores, warehouses and apartments leased generally to local businesses and residents. The underwriting of these loans takes into consideration the occupancy and
rental rates as well as the financial health of the borrower. The Company’s exposure to national retail tenants is limited. The Company recognizes that risk from economic cycles, delayed or missed rent payments, supply-chain disruptions,
operational errors, lawsuits, natural disasters, losses due to theft or embezzlement, health or loss of key personnel, or competitive situations may adversely affect the scheduled repayment of business loans. Income producing loans
increased 16.8% from December 31, 2024 to June 30, 2025.
Consumer
Residential Mortgages – Consumer mortgages are first or second-lien loans to
consumers secured by a primary residence or second home. This category includes traditional mortgages and home equity loans and revolving lines of credit. The loans are generally secured by properties located primarily in markets served
by the Company’s branches. These loans are underwritten in accordance with the Company’s general loan policy and procedures which require, among other things, proper documentation of each borrower’s financial condition, satisfactory
credit history, and property value. In addition to loans originated for the Company’s portfolio, the Company originates and services consumer mortgages sold in the secondary market which are underwritten and closed pursuant to investor
and agency guidelines. Residential mortgages increased 6.7% from December 31, 2024 to June 30, 2025.
Other Consumer – Other consumer lending includes consumer credit card accounts as
well as personal revolving lines of credit and installment loans. The Company offers credit cards primarily to its deposit and loan customers. Consumer installment loans include term loans of up to five years secured by automobiles, boats
and recreational vehicles. The Company recognizes that there are risks in consumer lending, which include interruptions in the borrower’s personal and investment income due to loss of employment, market conditions, and general economic
conditions, deterioration in the health and well being of the borrower and family members, natural disasters, lawsuits, losses, or inability to generate income due to injury, accidents, theft, vandalism, or incarceration. Other consumer
loans decreased 0.5% from December 31, 2024 to June 30, 2025.
Selected Loan Maturity and Interest Rate Sensitivity
The maturity distribution of the Company’s loan portfolio is one factor in management’s evaluation of the risk characteristics of the loan and lease portfolio. The
interest rate sensitivity of the Company’s loan and lease portfolio is important in the management of net interest margin. The Company attempts to manage the relationship between the interest rate sensitivity of its assets and liabilities
to produce an effective interest differential that is not significantly impacted by changes in the level of interest rates (See - Quantitative and Qualitative Disclosures About Market Risk). The following table shows the maturity
distribution based on remaining maturities of the Company’s loan and lease portfolio and the interest rate sensitivity of the Company’s loans and leases maturing after one year at June 30, 2025:
TABLE 18—INTEREST RATE SENSITIVITY OF LOANS AND LEASES
|
|
June 30,2025
|
|
|
|
|
|
|
|
|
|
|
|
|
|
|
|
Rate Structure for Loans
Maturing Over One Year
|
|
|
(In thousands)
|
|
One Year
or Less
|
|
|
Over One
Year through
Five Years
|
|
|
Over Five
Years through
Fifteen Years
|
|
|
Over Fifteen
Years
|
|
|
Fixed
Interest Rate
|
|
|
Variable
Interest Rate
|
|
|
Commercial and industrial
|
|
|
|
|
|
|
|
|
|
|
|
|
|
|
|
|
|
|
|
Non-real estate
|
|
$
|
1,719,741
|
|
|
$
|
5,913,609
|
|
|
$
|
1,338,048
|
|
|
$
|
77,696
|
|
|
$
|
880,636
|
|
|
$
|
6,448,717
|
|
|
Owner occupied
|
|
|
273,756
|
|
|
|
1,073,928
|
|
|
|
1,808,322
|
|
|
|
1,606,402
|
|
|
|
1,450,607
|
|
|
|
3,038,045
|
|
|
Total commercial and industrial
|
|
|
1,993,497
|
|
|
|
6,987,537
|
|
|
|
3,146,370
|
|
|
|
1,684,098
|
|
|
|
2,331,243
|
|
|
|
9,486,762
|
|
|
Commercial real estate
|
|
|
|
|
|
|
|
|
|
|
|
|
|
|
|
|
|
|
|
|
|
|
|
|
|
Construction, acquisition and development
|
|
|
1,321,746
|
|
|
|
788,888
|
|
|
|
592,584
|
|
|
|
760,906
|
|
|
|
285,510
|
|
|
|
1,856,868
|
|
|
Income producing
|
|
|
1,479,529
|
|
|
|
1,878,945
|
|
|
|
1,096,863
|
|
|
|
2,570,202
|
|
|
|
926,291
|
|
|
|
4,619,719
|
|
|
Total commercial real estate
|
|
|
2,801,275
|
|
|
|
2,667,833
|
|
|
|
1,689,447
|
|
|
|
3,331,108
|
|
|
|
1,211,801
|
|
|
|
6,476,587
|
|
|
Consumer
|
|
|
|
|
|
|
|
|
|
|
|
|
|
|
|
|
|
|
|
|
|
|
|
|
|
Residential mortgages
|
|
|
179,330
|
|
|
|
260,963
|
|
|
|
1,076,198
|
|
|
|
9,435,127
|
|
|
|
4,156,462
|
|
|
|
6,615,826
|
|
|
Other consumer
|
|
|
39,262
|
|
|
|
161,183
|
|
|
|
11,279
|
|
|
|
674
|
|
|
|
78,447
|
|
|
|
94,689
|
|
|
Total consumer
|
|
|
218,592
|
|
|
|
422,146
|
|
|
|
1,087,477
|
|
|
|
9,435,801
|
|
|
|
4,234,909
|
|
|
|
6,710,515
|
|
|
Total
|
|
$
|
5,013,364
|
|
|
$
|
10,077,516
|
|
|
$
|
5,923,294
|
|
|
$
|
14,451,007
|
|
|
$
|
7,777,953
|
|
|
$
|
22,673,864
|
|
Loans Held-for-Sale
At June 30, 2025 and December 31, 2024, loans held for sale totaled $272.1 million and $244.2 million, respectively. Included
in loans held for sale are loans sold to GNMA with an option to repurchase, totaling $62.9 million and $69.0 million at June 30, 2025 and December 31, 2024, respectively. The Company records the GNMA loans at fair value on the
consolidated balance sheets with a corresponding liability. GNMA optional repurchase programs allow financial institutions to buy back individual delinquent mortgage loans that meet certain criteria (90 days or more past due) from the
securitized loan pool for which the institution provides servicing. At the servicer’s option and without GNMA’s prior authorization, the servicer may repurchase such a delinquent loan for an amount equal to 100% of the remaining principal
balance of the loan. Under ASC 860, this buyback option is considered a conditional option until the delinquency criteria are met, at which time the option becomes unconditional. When the Company is deemed to have regained effective
control over these loans under the unconditional buyback option, the loans can no longer be reported as sold and must be brought back onto the consolidated balance sheet as loans held for sale, regardless of whether the Company intends to
exercise the buy-back option. These GNMA loans are not included in the NPL totals (See Table 19).
Asset Quality
Nonperforming Assets
NPA consists of NPL, OREO, and other repossessed assets. The decrease from December 31, 2024 to June 30, 2025 in NPA was driven by the decrease of $33.4 million, or
12.6%, in nonaccrual loans and leases (See Tables 20 and 21). The majority of the decrease in nonaccrual loans and leases was located in the C&I non-real estate and CRE income producing segments. The decrease was partially offset by
the increase of $9.8 million, or 171.1%, in foreclosed OREO and other NPA. NPA were as follows as of each period presented:
TABLE 19—NONPERFORMING ASSETS
|
(Dollars in thousands)
|
|
June 30, 2025
|
|
|
December 31, 2024
|
|
|
Total NPL(1)
|
|
$
|
231,243
|
|
|
$
|
264,692
|
|
|
Foreclosed OREO and other NPA
|
|
|
15,599
|
|
|
|
5,754
|
|
|
Total NPA
|
|
$
|
246,842
|
|
|
$
|
270,446
|
|
|
NPL to total loans and leases
|
|
|
0.65
|
%
|
|
|
0.78
|
%
|
|
NPA to total assets
|
|
|
0.49
|
%
|
|
|
0.58
|
%
|
|
|
|
|
|
|
|
|
|
|
|
GNMA loans 90 or more days past due eligible for repurchase
|
|
$
|
62,947
|
|
|
$
|
68,993
|
|
|
|
|
|
|
|
|
|
|
|
|
Government guaranteed portion of nonaccrual loans and leases covered by the SBA, FHA, VA or USDA
|
|
$
|
94,046
|
|
|
$
|
89,906
|
|
|
|
|
|
|
|
|
|
|
|
|
Loans and leases 90+ days past due, still accruing
|
|
$
|
5,208
|
|
|
$
|
13,126
|
|
| (1) |
See Tables 20 and 21 for more information regarding NPL.
|
Nonperforming Loans
NPL consist of nonaccrual loans and leases. The Company’s policy provides that loans and leases are generally placed in nonaccrual status if, in management’s
opinion, payment in full of principal or interest is not expected or payment of principal or interest is more than 90 days past due for commercial loans and 120 days past due for consumer loans, unless the loan or lease is both
well-secured and in the process of collection. NPL decreased 12.6% at June 30, 2025, compared to December 31, 2024. NPL as a percentage of net loans and leases decreased from 0.8% at December 31, 2024 to 0.7% at June 30, 2025. NPL
trends decreased during the first half of 2025, primarily due to the charge-off of two asset-based lending credits. With the current forecast, the Company expects a moderate correlation between NPL trends and provision amounts.
Included in NPL at June 30, 2025 were loans of $44.9 million that are individually analyzed collateral-dependent loans for which a specific provision has been
considered to address the unsupported exposure. Collateral-dependent loans are typically assigned an internal rating of impaired or PCD (loss). However, additional risk ratings can be used as needed to align with regulatory definitions.
PCD (loss) represent loans with evidence of deterioration of credit quality since origination that are acquired, and for which it was probable, at acquisition, that the bank will be unable to collect all contractually required payments.
At June 30, 2025, $36.5 million of nonperforming collateral-dependent loans for which a specific provision has been considered were rated as impaired and $8.4 million were rated as doubtful. Nonperforming collateral-dependent loans had
a specific reserve of $11.0 million included in the total ACL of $474.7 million at June 30, 2025, and were net of $23.7 million in partial charge-downs previously taken on these impaired loans. At June 30, 2025, there were no net
partial charge-downs previously taken on PCD (loss) loans.
NPL at December 31, 2024 included $75.8 million of nonperforming collateral-dependent loans that had a specific reserve of $16.9 million included in the ACL of
$460.8 million at December 31, 2024, and were net of $1.9 million in partial charge-downs previously taken on these impaired loans. Included in the $75.8 million of nonperforming collateral-dependent loans at December 31, 2024 were
$67.1 million rated as impaired and $8.7 million rated as doubtful. At December 31, 2024, there were no net partial charge-downs previously taken on PCD (loss) loans.
The following table presents the Company’s NPL by geographical location at the dates indicated:
TABLE 20—NONPERFORMING LOANS AND LEASES BY GEOGRAPHICAL LOCATION
| |
|
June 30, 2025
|
|
|
December 31, 2024
|
|
|
(Dollars in thousands)
|
|
Amortized Cost
|
|
|
Total NPL
|
|
|
NPL as a
% of
Amortized Cost
|
|
|
Amortized Cost
|
|
|
Total NPL
|
|
|
NPL as a
% of
Amortized Cost
|
|
|
Alabama
|
|
$
|
2,840,503
|
|
|
$
|
24,349
|
|
|
|
0.86
|
%
|
|
$
|
2,746,566
|
|
|
$
|
22,394
|
|
|
|
0.82
|
%
|
|
Arkansas
|
|
|
1,214,087
|
|
|
|
5,066
|
|
|
|
0.42
|
|
|
|
1,191,452
|
|
|
|
2,292
|
|
|
|
0.19
|
|
|
Florida
|
|
|
2,518,130
|
|
|
|
16,210
|
|
|
|
0.64
|
|
|
|
2,470,772
|
|
|
|
30,380
|
|
|
|
1.23
|
|
|
Georgia
|
|
|
2,792,601
|
|
|
|
14,153
|
|
|
|
0.51
|
|
|
|
2,460,674
|
|
|
|
17,245
|
|
|
|
0.70
|
|
|
Louisiana
|
|
|
1,464,870
|
|
|
|
3,468
|
|
|
|
0.24
|
|
|
|
1,422,973
|
|
|
|
5,669
|
|
|
|
0.40
|
|
|
Mississippi
|
|
|
3,079,717
|
|
|
|
15,281
|
|
|
|
0.50
|
|
|
|
3,055,616
|
|
|
|
13,702
|
|
|
|
0.45
|
|
|
Missouri
|
|
|
665,608
|
|
|
|
2,701
|
|
|
|
0.41
|
|
|
|
634,132
|
|
|
|
3,359
|
|
|
|
0.53
|
|
|
Tennessee
|
|
|
1,881,043
|
|
|
|
19,227
|
|
|
|
1.02
|
|
|
|
1,871,688
|
|
|
|
17,672
|
|
|
|
0.94
|
|
|
Texas
|
|
|
14,402,389
|
|
|
|
66,067
|
|
|
|
0.46
|
|
|
|
13,615,289
|
|
|
|
69,985
|
|
|
|
0.51
|
|
|
Other
|
|
|
4,606,233
|
|
|
|
64,721
|
|
|
|
1.41
|
|
|
|
4,272,593
|
|
|
|
81,994
|
|
|
|
1.92
|
|
|
Total
|
|
$
|
35,465,181
|
|
|
$
|
231,243
|
|
|
|
0.65
|
%
|
|
$
|
33,741,755
|
|
|
$
|
264,692
|
|
|
|
0.78
|
%
|
The following table provides additional details related to the Company’s loan and lease portfolio and the distribution of NPL by segment and class at the dates
indicated:
TABLE 21—NONPERFORMING LOANS AND LEASES BY SEGMENT AND CLASS
| |
|
June 30, 2025
|
|
|
December 31, 2024
|
|
|
(Dollars in thousands)
|
|
Amortized Cost
|
|
|
Total NPL
|
|
|
NPL as a
% of
Amortized Cost
|
|
|
Amortized Cost
|
|
|
Total NPL
|
|
|
NPL as a
% of
Amortized Cost
|
|
|
Commercial and industrial
|
|
|
|
|
|
|
|
|
|
|
|
|
|
|
|
|
|
|
|
Non-real estate
|
|
$
|
9,049,094
|
|
|
$
|
123,960
|
|
|
|
1.37
|
%
|
|
$
|
8,670,529
|
|
|
$
|
145,115
|
|
|
|
1.67
|
%
|
|
Owner occupied
|
|
|
4,762,408
|
|
|
|
18,158
|
|
|
|
0.38
|
|
|
|
4,665,015
|
|
|
|
16,904
|
|
|
|
0.36
|
|
|
Total commercial and industrial
|
|
|
13,811,502
|
|
|
|
142,118
|
|
|
|
1.03
|
|
|
|
13,335,544
|
|
|
|
162,019
|
|
|
|
1.21
|
|
|
Commercial real estate
|
|
|
|
|
|
|
|
|
|
|
|
|
|
|
|
|
|
|
|
|
|
|
|
|
|
Construction, acquisition and development
|
|
|
3,464,124
|
|
|
|
9,307
|
|
|
|
0.27
|
|
|
|
3,909,184
|
|
|
|
8,600
|
|
|
|
0.22
|
|
|
Income producing
|
|
|
7,025,539
|
|
|
|
4,379
|
|
|
|
0.06
|
|
|
|
6,015,773
|
|
|
|
18,542
|
|
|
|
0.31
|
|
|
Total commercial real estate
|
|
|
10,489,663
|
|
|
|
13,686
|
|
|
|
0.13
|
|
|
|
9,924,957
|
|
|
|
27,142
|
|
|
|
0.27
|
|
|
Consumer
|
|
|
|
|
|
|
|
|
|
|
|
|
|
|
|
|
|
|
|
|
|
|
|
|
|
Residential mortgages
|
|
|
10,951,618
|
|
|
|
75,076
|
|
|
|
0.69
|
|
|
|
10,267,883
|
|
|
|
75,287
|
|
|
|
0.73
|
|
|
Other consumer
|
|
|
212,398
|
|
|
|
363
|
|
|
|
0.17
|
|
|
|
213,371
|
|
|
|
244
|
|
|
|
0.11
|
|
|
Total consumer
|
|
|
11,164,016
|
|
|
|
75,439
|
|
|
|
0.68
|
|
|
|
10,481,254
|
|
|
|
75,531
|
|
|
|
0.72
|
|
|
Total
|
|
$
|
35,465,181
|
|
|
$
|
231,243
|
|
|
|
0.65
|
%
|
|
$
|
33,741,755
|
|
|
$
|
264,692
|
|
|
|
0.78
|
%
|
The following table provides details regarding the aging of the Company’s NPL by segment and class at the dates indicated:
TABLE 22—AGING OF NONACCRUAL LOANS AND LEASES
| |
|
June 30, 2025 |
|
|
(In thousands)
|
|
30-59 Days
Past Due
|
|
|
60-89 Days
Past Due
|
|
|
90+ Days
Past Due
|
|
|
Total
Past Due
|
|
|
Current
|
|
|
Total
Nonaccrual
|
|
|
Commercial and industrial
|
|
|
|
|
|
|
|
|
|
|
|
|
|
|
|
|
|
|
|
Non-real estate
|
|
$ |
1,161 |
|
|
$
|
193
|
|
|
$
|
81,467
|
|
|
$
|
82,821
|
|
|
$
|
41,139
|
|
|
$
|
123,960
|
|
|
Owner occupied
|
|
|
1,510 |
|
|
|
103
|
|
|
|
13,517
|
|
|
|
15,130
|
|
|
|
3,028
|
|
|
|
18,158
|
|
|
Total commercial and industrial
|
|
|
2,671 |
|
|
|
296
|
|
|
|
94,984
|
|
|
|
97,951
|
|
|
|
44,167
|
|
|
|
142,118
|
|
|
Commercial real estate
|
|
|
|
|
|
|
|
|
|
|
|
|
|
|
|
|
|
|
|
|
|
|
|
|
|
Construction, acquisition and development
|
|
|
—
|
|
|
|
290
|
|
|
|
8,483
|
|
|
|
8,773
|
|
|
|
534
|
|
|
|
9,307
|
|
|
Income producing
|
|
|
—
|
|
|
|
118
|
|
|
|
4,261
|
|
|
|
4,379
|
|
|
|
—
|
|
|
|
4,379
|
|
|
Total commercial real estate
|
|
|
—
|
|
|
|
408
|
|
|
|
12,744
|
|
|
|
13,152
|
|
|
|
534
|
|
|
|
13,686
|
|
|
Consumer
|
|
|
|
|
|
|
|
|
|
|
|
|
|
|
|
|
|
|
|
|
|
|
|
|
|
Residential mortgages
|
|
|
8,177
|
|
|
|
8,238
|
|
|
|
48,367
|
|
|
|
64,782
|
|
|
|
10,294
|
|
|
|
75,076
|
|
|
Other consumer
|
|
|
46
|
|
|
|
22
|
|
|
|
231
|
|
|
|
299
|
|
|
|
64
|
|
|
|
363
|
|
|
Total consumer
|
|
|
8,223
|
|
|
|
8,260
|
|
|
|
48,598
|
|
|
|
65,081
|
|
|
|
10,358
|
|
|
|
75,439
|
|
|
Total
|
|
$
|
10,894
|
|
|
$
|
8,964
|
|
|
$
|
156,326
|
|
|
$
|
176,184
|
|
|
$
|
55,059
|
|
|
$
|
231,243
|
|
|
|
December 31, 2024 |
|
|
(In thousands)
|
|
30-59 Days
Past Due
|
|
|
60-89 Days
Past Due
|
|
|
90+ Days
Past Due
|
|
|
Total
Past Due
|
|
|
Current
|
|
|
Total
Nonaccrual
|
|
|
Commercial and industrial
|
|
|
|
|
|
|
|
|
|
|
|
|
|
|
|
|
|
|
|
Non-real estate
|
|
$
|
1,943
|
|
|
$
|
357
|
|
|
$
|
93,758
|
|
|
$
|
96,058
|
|
|
$
|
49,057
|
|
|
$
|
145,115
|
|
|
Owner occupied
|
|
|
574
|
|
|
|
50
|
|
|
|
16,280
|
|
|
|
16,904
|
|
|
|
—
|
|
|
|
16,904
|
|
|
Total commercial and industrial
|
|
|
2,517
|
|
|
|
407
|
|
|
|
110,038
|
|
|
|
112,962
|
|
|
|
49,057
|
|
|
|
162,019
|
|
|
Commercial real estate
|
|
|
|
|
|
|
|
|
|
|
|
|
|
|
|
|
|
|
|
|
|
|
|
|
|
Construction, acquisition and development
|
|
|
—
|
|
|
|
21
|
|
|
|
8,579
|
|
|
|
8,600
|
|
|
|
—
|
|
|
|
8,600
|
|
|
Income producing
|
|
|
—
|
|
|
|
246
|
|
|
|
12,193
|
|
|
|
12,439
|
|
|
|
6,103
|
|
|
|
18,542
|
|
|
Total commercial real estate
|
|
|
—
|
|
|
|
267
|
|
|
|
20,772
|
|
|
|
21,039
|
|
|
|
6,103
|
|
|
|
27,142
|
|
|
Consumer
|
|
|
|
|
|
|
|
|
|
|
|
|
|
|
|
|
|
|
|
|
|
|
|
|
|
Residential mortgages
|
|
|
5,379
|
|
|
|
7,656
|
|
|
|
56,829
|
|
|
|
69,864
|
|
|
|
5,423
|
|
|
|
75,287
|
|
|
Other consumer
|
|
|
13
|
|
|
|
28
|
|
|
|
153
|
|
|
|
194
|
|
|
|
50
|
|
|
|
244
|
|
|
Total consumer
|
|
|
5,392
|
|
|
|
7,684
|
|
|
|
56,982
|
|
|
|
70,058
|
|
|
|
5,473
|
|
|
|
75,531
|
|
|
Total
|
|
$
|
7,909
|
|
|
$
|
8,358
|
|
|
$
|
187,792
|
|
|
$
|
204,059
|
|
|
$
|
60,633
|
|
|
$
|
264,692
|
|
OREO and Repossessed Assets
OREO consists of properties acquired through foreclosure. Repossessed assets consist of non-real estate assets acquired in partial or full settlement of loans. OREO
and repossessed assets totaled $15.6 million and $5.8 million at June 30, 2025 and December 31, 2024, respectively. The increase of $9.8 million, or 171.1%, was primarily the result of increased OREO activity of $13.6 million, and the FCB
acquisition of $1.6 million, partially offset by sales of $4.8 million during the six months ended June 30, 2025. The main types of OREO acquired during the period were CRE and residential mortgages.
Because a portion of the Company’s NPL have been determined to be collateral-dependent, management expects the resolution of a significant number of these loans may
necessitate foreclosure proceedings resulting in further additions to OREO. At June 30, 2025, residential mortgages in process of foreclosure increased to $14.4 million compared to $19.7 million at December 31, 2024.
At the time of foreclosure, the fair value of the collateral for loans backed by real estate is typically determined by an appraisal performed by a third-party
appraiser holding professional certifications. Such appraisals are then reviewed and evaluated by the Company’s internal appraisal group. A market value appraisal using a 180-360-day marketing period is typically ordered and the OREO is
recorded at the time of foreclosure at its market value less estimated selling costs. For residential subdivisions that are not completed, the appraisals reflect the uncompleted status of the subdivision.
Since OREO is carried at the lower of cost or fair value less estimated selling costs on an ongoing basis, new appraisals are generally obtained on at least an annual
basis and the OREO carrying values are adjusted accordingly. The type of appraisals typically used for these periodic reappraisals are “Restricted Use Appraisals,” meaning the appraisal is for client use only. Other indications of fair
value are also used to attempt to ensure that OREO is carried at fair value. These include listing the property with a broker and acceptance of an offer to purchase from a third-party. If an OREO property is listed with a broker at an
amount less than the current carrying value, the carrying value is adjusted to reflect the list price less estimated selling costs and if an offer to purchase is accepted at a price less than the current carrying value, the carrying value
is adjusted to reflect that sales price, less estimated selling costs. The majority of the properties in OREO are actively marketed using a combination of real estate brokers, bank staff who are familiar with the particular properties
and/or third parties.
Financial Difficulty Modifications
In March 2022, the FASB issued ASU No. 2022-02, eliminating the recognition and measurement guidance on TDRs for creditors that have adopted ASC 326 and requiring
them to make enhanced disclosures about loan modifications for borrowers experiencing financial difficulty. The guidance became effective for Cadence beginning January 1, 2023, and was adopted via the modified retrospective transition
method.
With the removal of the TDR accounting model, the general loan modification guidance in Subtopic 310-20 is now applied to all loan modifications, including
modifications made for borrowers experiencing financial difficulty. Under this guidance, a modification is treated as a new loan only if both: 1) the terms of the new loan are at least as favorable to the lender as the terms for
comparable loans to other customers with similar collection risks, and 2) modifications to the terms of the original loan are more than minor. If either condition is not met, the modification is accounted for as the continuation of the
old loan with any effect of the modification treated as a prospective adjustment to the loan’s EIR. Modifications in scope for borrowers experiencing financial difficulty may include principal forgiveness, other-than-insignificant payment
delay, interest rate reduction, or a combination of modifications. During the six months ended June 30, 2025, the most common individual concessions were related to term extensions and payment deferrals. Other concessions included
interest rate reductions.
At June 30, 2025, loans that were modified within the past six months for borrowers experiencing financial difficulty totaled $87.5 million, or 0.3%, of total loans
and leases, net of unearned income. Loans are considered to be in payment default at 90 or more days past due for purposes of assessing modified loans for default. See Note 4 to the consolidated financial statements for additional
information for these loans.
Loan Concentrations
At June 30, 2025, the Company did not have any concentration of loans or leases in excess of 10% of total loans and leases outstanding which were not otherwise
disclosed as a category of loans or leases. Loan concentrations are considered to exist when there are amounts loaned to multiple borrowers engaged in similar activities which would cause them to be similarly impacted by economic or other
conditions. The Company conducts business in a geographically concentrated area and has a significant amount of loans secured by real estate to borrowers in varying activities and businesses but does not consider these factors alone in
identifying loan concentrations. The ability of the Company’s borrowers to repay loans is somewhat dependent upon the economic conditions prevailing in the Company’s market areas.
Internally Assigned Grades on Loans
The Company utilizes an internal loan classification system that is updated to perpetually grade loans according to certain credit quality indicators. These credit
quality indicators include, but are not limited to, recent credit performance, delinquency, liquidity, cash flows, debt coverage ratios, collateral type and loan-to-value ratio. See Note 4 to the consolidated financial statements.
The following table provides details of the Company’s loan and lease portfolio by segment, class, and internally assigned grade at the dates indicated:
TABLE 23—GRADES ON LOANS AND LEASES
| |
|
June 30, 2025 |
|
|
(In thousands)
|
|
Pass |
|
|
Special
Mention (1)
|
|
|
Substandard (1) |
|
|
Doubtful |
|
|
Impaired (1) |
|
|
PCD (Loss) (1) |
|
|
Total |
|
|
Commercial and industrial
|
|
|
|
|
|
|
|
|
|
|
|
|
|
|
|
|
|
|
|
|
|
|
Non-real estate
|
|
$
|
8,516,718
|
|
|
$
|
157,279
|
|
|
$
|
344,254
|
|
|
$
|
8,369
|
|
|
$
|
19,112
|
|
|
$
|
3,362
|
|
|
$
|
9,049,094
|
|
|
Owner occupied
|
|
|
4,719,527
|
|
|
|
7,886
|
|
|
|
28,021
|
|
|
|
—
|
|
|
|
6,974
|
|
|
|
—
|
|
|
|
4,762,408
|
|
|
Total commercial and industrial
|
|
|
13,236,245
|
|
|
|
165,165
|
|
|
|
372,275
|
|
|
|
8,369
|
|
|
|
26,086
|
|
|
|
3,362
|
|
|
|
13,811,502
|
|
|
Commercial real estate
|
|
|
|
|
|
|
|
|
|
|
|
|
|
|
|
|
|
|
|
|
|
|
|
|
|
|
|
|
|
Construction, acquisition and development
|
|
|
3,452,247
|
|
|
|
1,634
|
|
|
|
4,400
|
|
|
|
—
|
|
|
|
5,843
|
|
|
|
—
|
|
|
|
3,464,124
|
|
|
Income producing
|
|
|
6,776,961
|
|
|
|
53,088
|
|
|
|
188,979
|
|
|
|
—
|
|
|
|
2,218
|
|
|
|
4,293
|
|
|
|
7,025,539
|
|
|
Total commercial real estate
|
|
|
10,229,208
|
|
|
|
54,722
|
|
|
|
193,379
|
|
|
|
—
|
|
|
|
8,061
|
|
|
|
4,293
|
|
|
|
10,489,663
|
|
|
Consumer
|
|
|
|
|
|
|
|
|
|
|
|
|
|
|
|
|
|
|
|
|
|
|
|
|
|
|
|
|
|
Residential mortgages
|
|
|
10,847,867
|
|
|
|
9,008
|
|
|
|
89,257
|
|
|
|
—
|
|
|
|
4,075
|
|
|
|
1,411
|
|
|
|
10,951,618
|
|
|
Other consumer
|
|
|
211,722
|
|
|
|
—
|
|
|
|
676
|
|
|
|
—
|
|
|
|
—
|
|
|
|
—
|
|
|
|
212,398
|
|
|
Total consumer
|
|
|
11,059,589
|
|
|
|
9,008
|
|
|
|
89,933
|
|
|
|
—
|
|
|
|
4,075
|
|
|
|
1,411
|
|
|
|
11,164,016
|
|
|
Total
|
|
$
|
34,525,042
|
|
|
$
|
228,895
|
|
|
$
|
655,587
|
|
|
$
|
8,369
|
|
|
$
|
38,222
|
|
|
$
|
9,066
|
|
|
$
|
35,465,181
|
|
|
(1)
|
In the loan classifications above, $7.9 million of the special mention balance, $106.0 million of the substandard balance, $8.3 million of the impaired balance, and $3.5 million of the PCD (Loss)
balance are covered by government guarantees from either the SBA, FHA, VA and USDA.
|
| |
|
December 31, 2024
|
|
|
(In thousands)
|
|
Pass |
|
|
Special
Mention (1)
|
|
|
Substandard (1) |
|
|
Doubtful |
|
|
Impaired (1) |
|
|
PCD (Loss) (1) |
|
|
Total |
|
|
Commercial and industrial
|
|
|
|
|
|
|
|
|
|
|
|
|
|
|
|
|
|
|
|
|
|
|
Non-real estate
|
|
$
|
8,208,176
|
|
|
$
|
106,996
|
|
|
$
|
311,096
|
|
|
$
|
8,743
|
|
|
$
|
31,996
|
|
|
$
|
3,522
|
|
|
$
|
8,670,529
|
|
|
Owner occupied
|
|
|
4,610,775
|
|
|
|
815
|
|
|
|
41,363
|
|
|
|
—
|
|
|
|
10,968
|
|
|
|
1,094
|
|
|
|
4,665,015
|
|
|
Total commercial and industrial
|
|
|
12,818,951
|
|
|
|
107,811
|
|
|
|
352,459
|
|
|
|
8,743
|
|
|
|
42,964
|
|
|
|
4,616
|
|
|
|
13,335,544
|
|
|
Commercial real estate
|
|
|
|
|
|
|
|
|
|
|
|
|
|
|
|
|
|
|
|
|
|
|
|
|
|
|
|
|
|
Construction, acquisition and development
|
|
|
3,896,856
|
|
|
|
—
|
|
|
|
12,262
|
|
|
|
—
|
|
|
|
66
|
|
|
|
—
|
|
|
|
3,909,184
|
|
|
Income producing
|
|
|
5,850,702
|
|
|
|
5,094
|
|
|
|
144,084
|
|
|
|
—
|
|
|
|
15,893
|
|
|
|
—
|
|
|
|
6,015,773
|
|
|
Total commercial real estate
|
|
|
9,747,558
|
|
|
|
5,094
|
|
|
|
156,346
|
|
|
|
—
|
|
|
|
15,959
|
|
|
|
—
|
|
|
|
9,924,957
|
|
|
Consumer
|
|
|
|
|
|
|
|
|
|
|
|
|
|
|
|
|
|
|
|
|
|
|
|
|
|
|
|
|
|
Residential mortgages
|
|
|
10,167,830
|
|
|
|
891
|
|
|
|
89,597
|
|
|
|
—
|
|
|
|
8,154
|
|
|
|
1,411
|
|
|
|
10,267,883
|
|
|
Other consumer
|
|
|
212,865
|
|
|
|
—
|
|
|
|
506
|
|
|
|
—
|
|
|
|
—
|
|
|
|
—
|
|
|
|
213,371
|
|
|
Total consumer
|
|
|
10,380,695
|
|
|
|
891
|
|
|
|
90,103
|
|
|
|
—
|
|
|
|
8,154
|
|
|
|
1,411
|
|
|
|
10,481,254
|
|
|
Total
|
|
$
|
32,947,204
|
|
|
$
|
113,796
|
|
|
$
|
598,908
|
|
|
$
|
8,743
|
|
|
$
|
67,077
|
|
|
$
|
6,027
|
|
|
$
|
33,741,755
|
|
|
(1)
|
In the loan classifications above, $99.0 million of the substandard balance and $11.1 million of the impaired balance are covered by government guarantees from either the SBA, FHA, VA and USDA.
|
The following tables provides details regarding the aging of the Company’s loan and lease portfolio by internally assigned grade at the dates indicated:
TABLE 24—AGING BY GRADE ON LOANS AND LEASES
| |
|
|
June 30, 2025
|
|
|
(In thousands)
|
|
|
Current
|
|
|
|
30-59 Days
|
|
|
|
60-89 Days
|
|
|
|
90+ Days
|
|
|
|
Total
|
|
|
Pass
|
|
$
|
34,415,582
|
|
|
$
|
82,990
|
|
|
$
|
26,007
|
|
|
$
|
463
|
|
|
$
|
34,525,042
|
|
|
Special Mention (1)
|
|
|
226,291
|
|
|
|
2,604
|
|
|
|
—
|
|
|
|
—
|
|
|
|
228,895
|
|
|
Substandard (1)
|
|
|
433,463
|
|
|
|
62,922
|
|
|
|
19,178
|
|
|
|
140,024
|
|
|
|
655,587
|
|
|
Doubtful
|
|
|
8,369
|
|
|
|
—
|
|
|
|
—
|
|
|
|
—
|
|
|
|
8,369
|
|
|
Impaired (1)
|
|
|
14,535
|
|
|
|
985
|
|
|
|
1,657
|
|
|
|
21,045
|
|
|
|
38,222
|
|
|
PCD (Loss) (1)
|
|
|
7,655
|
|
|
|
—
|
|
|
|
1,411
|
|
|
|
—
|
|
|
|
9,066
|
|
|
Total
|
|
$
|
35,105,895
|
|
|
$
|
149,501
|
|
|
$
|
48,253
|
|
|
$
|
161,532
|
|
|
$
|
35,465,181
|
|
|
(1)
|
In the loan classifications above, $7.9 million of the special mention balance, $106.0 million of the substandard balance, $8.3 million of the impaired balance, and $3.5 million of the PCD
(Loss) balance are covered by government guarantees from either the SBA, FHA, VA and USDA.
|
| |
|
|
December 31, 2024
|
|
|
(In thousands)
|
|
|
Current
|
|
|
|
30-59 Days
|
|
|
|
60-89 Days
|
|
|
|
90+ Days
|
|
|
|
Total
|
|
|
Pass
|
|
$
|
32,857,689
|
|
|
$
|
65,955
|
|
|
$
|
22,789
|
|
|
$
|
771
|
|
|
$
|
32,947,204
|
|
|
Special Mention
|
|
|
113,796
|
|
|
|
—
|
|
|
|
—
|
|
|
|
—
|
|
|
|
113,796
|
|
|
Substandard (1)
|
|
|
368,636
|
|
|
|
24,685
|
|
|
|
40,707
|
|
|
|
164,880
|
|
|
|
598,908
|
|
|
Doubtful
|
|
|
8,743
|
|
|
|
—
|
|
|
|
—
|
|
|
|
—
|
|
|
|
8,743
|
|
|
Impaired (1)
|
|
|
29,908
|
|
|
|
1,904
|
|
|
|
—
|
|
|
|
35,265
|
|
|
|
67,077
|
|
|
PCD (Loss)
|
|
|
4,932
|
|
|
|
1,095
|
|
|
|
—
|
|
|
|
—
|
|
|
|
6,027
|
|
|
Total
|
|
$
|
33,383,704
|
|
|
$
|
93,639
|
|
|
$
|
63,496
|
|
|
$
|
200,916
|
|
|
$
|
33,741,755
|
|
| (1) |
In the loan classifications above, $99.0 million of the substandard balance and $11.1 million of the impaired balance is covered by government guarantees from the SBA, FHA, VA and USDA.
|
At June 30, 2025, loans in pass, special mention, substandard, and PCD (loss) grade categories increased while loans in doubtful and impaired grade
categories decreased compared to December 31, 2024. Pass loans increased $1.6 billion, or 4.8%, compared to December 31, 2024. The increase in pass was seen across all loan categories except for decreases in CAD and other consumer loans.
Special mention loans increased $115.1 million, or 101.1%, compared to December 31, 2024. The increase in special mention was mainly driven by increases in C&I non-real estate and CRE income producing loans. Substandard loans
increased $56.7 million, or 9.5%, at June 30, 2025 compared to December 31, 2024. The increase in substandard was mainly driven by the increase in C&I non-real estate and CRE income producing loans, somewhat offset by a slight
decrease in CAD and C&I owner occupied loans. PCD (loss) loans increased $3.0 million, or 50.4%, compared to December 31, 2024. The increase in PCD (loss) was driven by the FCB acquisition, which included $4.3 million in PCD (loss)
loans, somewhat offset by a decrease in C&I owner occupied loans. Impaired loans decreased $28.9 million, or 43.0%, at June 30, 2025 compared to December 31, 2024. The decrease in impaired was primarily driven by a decrease in C&I
non-real estate and CRE income producing loans, slightly offset by an increase in CAD loans. The Company has maintained stable credit results while continuing to grow loans. Of total loans and leases, 99.0% were current on their
contractual payments at June 30, 2025.
Collateral for some of the Company’s loans and leases is subject to fair value estimates that can fluctuate with market conditions and other external
factors. In addition, while the Company has certain underwriting obligations related to such estimates, the estimates of some real property and other collateral are dependent upon third-party independent appraisers employed as independent
contractors of the Company.
Deposits
Deposits originating within the communities served by the Company continue to be the Company’s primary source of funding its earning assets. The Company has been able to compete effectively
for deposits in its primary market areas, while continuing to manage the exposure to higher interest rates. The distribution and market share of deposits by type of deposit and by type of depositor are important considerations in the
Company's assessment of the stability of its funding sources and its access to additional funds. Furthermore, management shifts the mix and maturity of the deposits depending on economic conditions and loan and investment policies in an
attempt, within set policies, to minimize cost and maximize net interest margin.
The following table presents the Company’s deposits and the percentage change between the periods indicated:
TABLE 25—SUMMARY OF DEPOSITS
|
(Dollars in thousands)
|
|
June 30, 2025
|
|
|
December 31, 2024
|
|
|
% Change
|
|
|
Noninterest bearing demand deposits
|
|
$
|
9,154,050
|
|
|
$
|
8,591,805
|
|
|
|
6.5
|
%
|
|
Interest bearing demand and money market deposits
|
|
|
18,936,579
|
|
|
|
19,345,114
|
|
|
|
(2.1
|
)
|
|
Savings
|
|
|
2,641,482
|
|
|
|
2,588,406
|
|
|
|
2.1
|
|
|
Time deposits
|
|
|
9,761,407
|
|
|
|
9,970,876
|
|
|
|
(2.1
|
)
|
|
Total deposits
|
|
$
|
40,493,518
|
|
|
$
|
40,496,201
|
|
|
|
—
|
%
|
Total deposits experienced a decrease of $2.7 million at June 30, 2025, compared to December 31, 2024 due to decreases in brokered deposits and public funds, partially offset by an increase
in core customer deposits (which excludes brokered deposits and public funds). Brokered deposits were $1.5 billion at June 30, 2025, a decrease of $636.0 million, or 30.4%, compared to December 31, 2024. This decrease is primarily the result
of the Company’s decision to lower the brokered deposit levels in favor of short and long term FHLB borrowings. Total public funds balances were $3.8 billion at June 30, 2025, a decrease of $254.0 million, or 6.2%, compared to December 31,
2024. This decrease is primarily the result of the seasonality of cash collections and disbursements by the various municipalities. Core customer deposit balances were $35.2 billion at June 30, 2025, an increase of $887.5 million, or 2.6%,
compared to December 31, 2024. This increase was primarily due to the acquisition of FCB, which added $523.6 million of deposits in the second quarter of 2025. See Note 2 for further details. Noninterest bearing demand deposits increased
$562.2 million, or 6.5%, at June 30, 2025 compared to December 31, 2024. Time deposits decreased $209.5 million, or 2.1%, at June 30, 2025 compared to December 31, 2024 due in part to a decrease of $449.8 million in brokered time deposits
offset by an increase of $228.5 million in core customer and public funds time deposits.
The following table presents the classification of the Company’s deposits on an average basis for each of the periods indicated:
TABLE 26—AVERAGE BALANCE AND YIELD ON DEPOSITS
| |
|
Three Months Ended June 30,
|
|
| |
|
2025
|
|
|
2024
|
|
|
(Dollars in thousands)
|
|
Average
Amount
|
|
|
Average
Rate
|
|
|
Average
Amount
|
|
|
Average
Rate
|
|
|
Noninterest bearing demand deposits
|
|
$
|
8,494,542
|
|
|
|
—
|
%
|
|
$
|
8,757,029
|
|
|
|
—
|
%
|
|
Interest bearing demand deposits
|
|
|
18,799,895
|
|
|
|
2.69
|
|
|
|
18,770,093
|
|
|
|
3.13
|
|
|
Savings
|
|
|
2,646,190
|
|
|
|
0.57
|
|
|
|
2,652,019
|
|
|
|
0.57
|
|
|
Time
|
|
|
9,956,973
|
|
|
|
3.98
|
|
|
|
7,920,946
|
|
|
|
4.53
|
|
|
Total deposits
|
|
$
|
39,897,600
|
|
|
|
|
|
|
$
|
38,100,087
|
|
|
|
|
|
| |
|
Six Months Ended June 30,
|
|
| |
|
2025 |
|
|
2024
|
|
|
(Dollars in thousands)
|
|
Average
Amount
|
|
|
Average
Rate
|
|
|
Average
Amount
|
|
|
Average
Rate
|
|
|
Noninterest bearing demand deposits
|
|
$
|
8,417,406
|
|
|
|
—
|
%
|
|
$
|
8,914,824
|
|
|
|
—
|
%
|
|
Interest bearing demand deposits
|
|
|
19,112,399
|
|
|
|
2.69
|
|
|
|
19,036,969
|
|
|
|
3.12
|
|
|
Savings
|
|
|
2,626,885
|
|
|
|
0.57
|
|
|
|
2,674,236
|
|
|
|
0.57
|
|
|
Time
|
|
|
9,967,496
|
|
|
|
4.04
|
|
|
|
7,634,651
|
|
|
|
4.47
|
|
|
Total deposits
|
|
$
|
40,124,186
|
|
|
|
|
|
|
$
|
38,260,680
|
|
|
|
|
|
Uninsured deposits are defined as the portion of deposit accounts in U.S. offices that exceed the FDIC insurance limit and amounts in any other uninsured investment or deposit account that
are classified as deposits and are not subject to any federal or state deposit insurance regimes. The uninsured portion of public funds owned by municipal and state government entities are collateralized by the Company with investment
securities and custodial letters of credit from the FHLB of Dallas. The following table segregates our deposits by deposit insurance categories.
TABLE 27—ESTIMATED TOTAL INSURED AND UNINSURED DEPOSITS
|
(In thousands)
|
|
June 30, 2025
|
|
|
December 31, 2024
|
|
|
FDIC insured
|
|
$
|
25,434,979
|
|
|
$
|
25,840,309
|
|
|
Collateralized (uninsured)
|
|
|
3,666,174
|
|
|
|
3,901,677
|
|
|
Uninsured (excluding collateralized)
|
|
|
11,392,365
|
|
|
|
10,754,215
|
|
|
Total deposits
|
|
$
|
40,493,518
|
|
|
$
|
40,496,201
|
|
The Company’s estimated uninsured time deposits at June 30, 2025 had maturities as follows:
TABLE 28—MATURITY OF UNINSURED TIME DEPOSITS
|
(In thousands)
|
|
Amount
|
|
|
Three months or less
|
|
$
|
507,555
|
|
|
Over three months through six months
|
|
|
679,513
|
|
|
Over six months through twelve months
|
|
|
570,699
|
|
|
Over twelve months
|
|
|
93,678
|
|
|
Total
|
|
$
|
1,851,445
|
|
Short-term Borrowings
The Company has several types of available short-term borrowing arrangements including Federal funds purchased, securities sold under agreements to repurchase, short-term FHLB borrowings and
the Federal Reserve discount window. Federal funds purchased are unsecured lines, while the rest of these types of borrowings are collateralized by investment securities and loans. At June 30, 2025 and December 31, 2024, the Company had total
short-term borrowings of $1.6 billion with a weighted average interest rate of 4.30% and $23.6 million with a weighted average interest rate of 4.10%, respectively. Cadence’s BTFP borrowing was paid off during the fourth quarter of 2024. See
Note 6 to the Company’s consolidated financial statements for additional details.
Long-term Borrowings
During the first half of 2025, the Company entered into $1.4 billion long-term advances from FHLB of Dallas with various interest rates ranging from 3.897% to 4.219% and maturing beginning
in September 2026 through April 2027. In addition, the Company assumed $12.4 million of junior subordinated debt included in the First Chatham Bank acquisition. All the FCB subordinated debt assumed as well as the $10.0 million of 5.000%
fixed to floating rate subordinated notes were paid off in June 2025. The following is a summary of our long-term borrowings at the dates indicated:
TABLE 29—LONG-TERM BORROWINGS
|
(In thousands)
|
|
June 30, 2025
|
|
|
December 31, 2024
|
|
|
Advances from FHLB of Dallas
|
|
$
|
1,430,674
|
|
|
$
|
706
|
|
|
5.000% fixed to floating rate, subordinated notes, due June 30, 2030, callable on June 30, 2025
|
|
|
—
|
|
|
|
10,000
|
|
|
Total subordinated and long-term borrowings
|
|
$
|
1,430,674
|
|
|
$
|
10,706
|
|
Under the terms of the blanket floating lien security agreement with FHLB of Dallas, the Company is required to maintain sufficient collateral to secure borrowings. At June 30, 2025, the
remaining borrowing availability totaled $10.1 billion. At June 30, 2025, there were no call features on long-term FHLB borrowings. See Note 6 to the Company’s consolidated financial statements for additional details.
Liquidity and Capital Resources
Liquidity
One of the Company's goals is to maintain adequate funds to meet increases in loan demand or any potential increase in the normal level of deposit withdrawals. This goal is accomplished
primarily by generating cash from the Company’s operating activities and maintaining sufficient short-term liquid assets. These sources, coupled with a stable core deposit base and a historical experience in the capital markets, allow the
Company to fund earning assets and maintain the availability of funds. Management believes that the Company’s traditional sources of maturing loans and investment securities, sales of loans held for sale, cash from operating activities and
a strong base of core deposits are adequate to meet the Company’s liquidity needs for normal operations over both the short-term and the long-term.
The following table summarizes the Company’s cash and cash equivalents as of the following dates:
TABLE 30—CASH AND CASH EQUIVALENTS
|
(Dollars in thousands)
|
|
June 30, 2025
|
|
|
December 31, 2024
|
|
|
Cash and cash equivalents
|
|
$
|
1,536,557
|
|
|
$
|
1,731,576
|
|
|
Cash and cash equivalents as a percentage of:
|
|
|
|
|
|
|
|
|
|
Loans and lease, net
|
|
|
4.3
|
%
|
|
|
5.1
|
%
|
|
Total earning assets
|
|
|
3.4
|
|
|
|
4.1
|
|
|
Total assets
|
|
|
3.1
|
|
|
|
3.7
|
|
|
Total deposits
|
|
|
3.8
|
|
|
|
4.3
|
|
|
Total uninsured deposits
|
|
|
10.2
|
|
|
|
11.8
|
|
To provide additional liquidity as needed, the Company utilizes short-term financing through the purchase of federal funds, securities sold under agreements to repurchase, borrowings at the
FHLB and through the Federal Reserve discount window.
The Company had the following sources of contingent liquidity available at June 30, 2025:
TABLE 31—CASH AND SOURCES OF CONTINGENT LIQUIDITY
|
(In thousands)
|
|
Amount
|
|
|
Cash and cash equivalents
|
|
$
|
1,536,557
|
|
|
Unpledged investment securities (at par) (1)
|
|
|
5,645,071
|
|
|
Secured lines of credit availability at the FHLB and Federal Reserve
|
|
|
11,937,753
|
|
|
Unsecured Federal funds lines availability
|
|
|
2,089,000
|
|
|
Total
|
|
$
|
21,208,381
|
|
|
(1)
|
The fair value of unpledged investment securities was $5.3 billion at June 30, 2025.
|
At June 30, 2025, the Company had irrevocable letters of credit issued by the FHLB totaling $47.5 million which were used on behalf of the Company’s customers.
The ability of the Company to obtain funding from these or other sources could be negatively affected should the Company experience a substantial deterioration in its financial condition or
its debt rating or should the availability of short-term funding become restricted as a result of the disruption in the financial markets. Management does not anticipate any short-or long-term changes to its liquidity strategies and
believes that the Company has ample sources to meet any liquidity challenges that may arise. The Company has sound and robust risk management practices that include an active ALCO to analyze and manage the Company’s liquidity and IRR (See -
Quantitative and Qualitative Disclosures About Market Risk).
Other Liquidity Considerations
The Company’s operating lease obligations represent short and long-term operating lease and rental payments for facilities, certain software and data processing and other equipment.
Purchase obligations represent obligations to purchase goods and services that are legally binding and enforceable on the Company and that specify all significant terms, including: fixed or minimum quantities to be purchased; fixed, minimum
or variable price provisions; and the approximate timing of the transaction.
In the ordinary course of business, the Company enters into various off-balance sheet commitments and other arrangements to extend credit that are not reflected on the consolidated balance
sheets of the Company. The business purpose of these off-balance sheet commitments is the routine extension of credit. The Company also faces the risk of deteriorating credit quality of borrowers to whom a commitment to extend credit has
been made; however, no significant credit losses are expected from these commitments and arrangements. At June 30, 2025, letters of credit totaled $467.3 million and unfunded extensions of credit totaled $9.1 billion (see Note 16 to the
consolidated financial statement for more information). At June 30, 2025, the Company maintained a reserve for unfunded commitments of $9.6 million included in other liabilities.
Cash Flow Sources and Uses
Cash equivalents include cash and amounts due from banks, including interest bearing deposits with other banks. At June 30, 2025, cash and cash equivalents totaled $1.5 billion compared to
$1.7 billion at December 31, 2024. The ratio of cash and cash equivalents to total assets was 3.1% at June 30, 2025 compared to 3.7% at December 31, 2024.
During the six months ended June 30, 2025, operating activities provided $332.0 million in cash, investing activities used $2.9 billion in cash, and financing activities provided $2.3
billion in cash. Primary uses of funds in investing activities during the first half of 2025 were net funding of loans of $1.4 billion and purchases of AFS securities $2.0 billion. These items were partially offset by proceeds from
maturities, calls and payments of AFS securities of $644.1 million. During the six months ended June 30, 2025, financing activities provided $2.3 billion, which primarily resulted from proceeds of $1.4 billion in long-term FHLB advances and
of $1.6 billion in short-term FHLB advances. These items were partially offset by a decrease of $526.4 million in deposits and common and preferred stock dividends of $108.9 million.
Regulatory Capital
Regulatory capital at June 30, 2025 and December 31, 2024 was calculated in accordance with standards established by the federal banking agencies as well as the interagency final rule
published on September 30, 2020 entitled “Revised Transition of the Current Expected Credit Losses Methodology for Allowances.” Failure to meet minimum capital requirements can initiate certain mandatory and possibly additional
discretionary actions by regulators that, if undertaken, could have a direct material adverse effect on the Company’s consolidated financial statements. Under capital adequacy guidelines and the regulatory framework for prompt corrective
action, the Company must meet specific capital guidelines that involve quantitative measures of the Company’s assets, liabilities and certain off-balance sheet items as calculated under regulatory accounting practices. The Company’s capital
amounts and classification are also subject to qualitative judgments by regulators about components, risk weightings and other factors. Quantitative measures are established by regulation to ensure capital adequacy and require the Company
to maintain minimum capital amounts and ratios.
Additionally, regulatory capital rules include a capital conservation buffer of 2.5% which the Company must maintain on top of its minimum risk-based capital requirements. This buffer
applies to all three risk-based capital measurements (CET1, Tier 1 and total capital to risk-weighted assets). A financial institution with a conservation buffer of less than the required amount is subject to limitations on capital
distributions, including dividend payments and stock repurchases, and certain discretionary bonus payments to executive officers.
Capital amounts and ratios for the Company at June 30, 2025 and December 31, 2024, are presented in the following table and as shown, exceed the thresholds necessary to be considered “well
capitalized.” Management believes that no events or changes have occurred subsequent to the indicated dates that would change this designation.
TABLE 32—REGULATORY CAPITAL
|
|
June 30, 2025
|
|
|
December 31, 2024
|
|
|
(Dollars in thousands)
|
|
Amount
|
|
|
Ratio
|
|
|
Amount
|
|
|
Ratio
|
|
|
Common equity Tier 1 capital (to risk-weighted assets)
|
|
$
|
4,871,652
|
|
|
|
12.18
|
%
|
|
$
|
4,693,487
|
|
|
|
12.35
|
%
|
|
Tier 1 capital (to risk-weighted assets)
|
|
|
5,038,645
|
|
|
|
12.60
|
|
|
|
4,860,480
|
|
|
|
12.79
|
|
|
Total capital (to risk-weighted assets)
|
|
|
5,515,711
|
|
|
|
13.79
|
|
|
|
5,306,647
|
|
|
|
13.97
|
|
|
Tier 1 leverage capital (to average assets)
|
|
|
5,038,645
|
|
|
|
10.35
|
|
|
|
4,860,480
|
|
|
|
10.41
|
|
Uses of Capital
Subject to pre-approval from the Federal Reserve and MDBCF, the Company may pursue acquisitions of depository institutions and businesses closely related to banking that further the
Company’s business strategies. Management anticipates that consideration for any transactions would include shares of the Company’s common stock, cash or a combination thereof.
On April 25, 2025, the Company announced a share repurchase program whereby the Company may acquire up to an aggregate of 10,000,000 shares of its common stock. The share repurchase program
became effective on May 28, 2025, and will expire on December 31, 2025. Under the share repurchase program, shares of the Company’s common stock may be purchased periodically in open market transactions at prevailing market prices, in
privately negotiated transactions, or by other means in accordance with federal securities laws. Repurchased shares are held as authorized but unissued shares available for use in connection with the Company’s stock compensation programs,
other transactions, or for other corporate purposes as determined by the Company’s Board of Directors. Through June 30, 2025, the Company did not repurchase any shares under this program.
On May 1, 2025, the Company completed the merger with FCB Financial Corp., the bank holding company for First Chatham Bank (collectively referred to as “First Chatham”). Under the terms of
the definitive merger agreement, the Company issued approximately 2.3 million shares of common stock plus $23.1 million in cash for all outstanding shares of First Chatham. See Note 2 to the Company’s consolidated financial statements for
additional details.
During the first quarter of 2025, the Company increased the common stock dividend to $0.275 per share. Additionally, during the second quarter of 2025 the Company paid a special cash
dividend of $0.34375 per share of preferred stock.
Impact of Inflation
The consolidated financial statements and related consolidated financial data presented herein have been prepared in accordance with GAAP and practices within the banking industry which
require the measurement of financial position and operating results in terms of historical dollars without considering the changes in the relative purchasing power of money over time due to inflation. The effect of inflation on a financial
institution differs from the effect on other types of businesses. While a financial institution’s operating expenses are affected by general inflation, the asset and liability structure of a financial institution consists largely of
monetary items. Monetary items, such as cash, investments, loans, deposits, and borrowings, are those assets and liabilities which are or will be converted into a fixed number of dollars regardless of changes in prices. As a result, changes
in interest rates can be more impactful to a financial institution’s performance than general inflation. Inflation may also have impacts on the Company’s customers, businesses and consumers and their ability or willingness to invest, save
or spend, and perhaps on their ability to repay loans. As such, there would likely be impacts on the general appetite for banking products and the credit health to the Company’s customers. See Part 1, Item 1.A., Risk Factors, of the
Company’s Annual Report on Form 10-K for the year ended December 31, 2024, for additional information regarding the risks of inflation.
Certain Litigation and Other Contingencies
The nature of the Company’s business ordinarily results in certain types of claims, litigation, investigations, and other legal or administrative cases and proceedings. Although the Company
and its subsidiaries have policies and procedures to minimize legal noncompliance and the impact of claims and other proceedings and endeavored to procure reasonable amounts of insurance coverage, litigation and regulatory actions present
an ongoing risk.
The Company and its subsidiaries engage in lines of business that are heavily regulated and involve a large volume of actual or potential financial transactions with customers or
applicants, and the Company is a public company with a large number of shareholders. From time to time, applicants, borrowers, customers, shareholders, former employees, service providers, and other third parties have brought actions
against the Company or its subsidiaries, in cases claiming substantial damages. Financial services companies are subject to risks arising from changing regulatory frameworks or expectations, regulatory investigations, class action
litigation, and, from time to time, the Company and its subsidiaries have such actions brought against them. The Company and its subsidiaries are also subject to enforcement actions by federal or state regulators, including the Federal
Reserve, the CFPB, the DOJ, state attorneys general, and the MDBCF, which may be adversely impacted by ongoing litigation in which the Company is involved. Additionally, the Company is, and management expects it to be, engaged in a number
of foreclosure proceedings and other collection actions as part of its lending and leasing collections activities, which, from time to time, have resulted in counterclaims against the Company and its subsidiaries. Various legal proceedings
have and may arise in the future out of claims against entities to which the Company is a successor as a result of business combinations.
When and as the Company determines it has meritorious defenses to the claims asserted, it vigorously defends against such claims. The Company will consider settlement of claims when, in
management’s judgment and in consultation with counsel, it is in the best interests of the Company to do so.
The Company cannot predict with certainty the cost of defense, the cost of prosecution, or the ultimate outcome of litigation or other proceedings filed by or against it, its subsidiaries
and its directors, management or employees, including remedies or damage awards. On at least a quarterly basis, the Company assesses its liabilities and contingencies in connection with outstanding legal proceedings as well as certain
threatened claims (which are not considered incidental to the ordinary conduct of the Company’s business) utilizing the latest and most reliable information available. For matters where a loss is not probable or the amount of the loss
cannot be estimated, the Company will not accrue. For matters where it is probable the Company will incur a loss and the amount can be reasonably estimated, the Company establishes an accrual for the loss. Once established, the accrual is
adjusted periodically to reflect any relevant developments. The actual cost of any such matters, however, may turn out to be substantially higher than the amount accrued. Further, the Company’s insurance policies have deductibles and
coverage limits, and such policies are unlikely to cover all costs and expenses related to the defense or prosecution of such legal proceedings or any losses arising therefrom.
Although the final outcome of any legal proceedings is inherently uncertain, based on the information available, advice of counsel and available insurance coverage, if applicable,
management believes that the litigation-related liability of $11.6 million accrued at June 30, 2025 is adequate and that any incremental change in potential liability arising from the Company’s legal proceedings and threatened claims,
including the matters described herein and those otherwise arising in the ordinary course of business, will not have a material adverse effect on the Company’s business or consolidated results of operations or financial condition. It is
possible, however, that future developments could result in an unfavorable outcome for, or resolution of any one or more of the legal proceedings in which the Company or its subsidiaries are defendants, which may be material to the
Company’s business or consolidated results of operations or financial condition for a particular fiscal period or periods.
On August 30, 2021, Legacy Cadence and the DOJ agreed to a settlement set forth in the consent order related to the investigation by the DOJ of Legacy Cadence Bank’s fair lending program in
Harris, Fort Bend, and Montgomery Counties located in Houston, Texas during the period between 2014 and 2016 (the “Consent Order”). The Consent Order was signed by the United States District Court for the Northern District of Georgia,
Atlanta Division, on August 31, 2021. Pursuant to Section 5.2(g) of the Agreement and Plan of Merger and Paragraph 50 of the Consent Order, Legacy BancorpSouth Bank approved the negotiated settlement, and subsequently, the Company agreed to
accept the obligations of the Consent Order. At the request of the DOJ, the court terminated the Consent Order on May 29, 2025. For additional information regarding the terms of this settlement and the Consent Order, see Legacy Cadence
Bancorporation’s Current Report on Form 8-K that was filed with the SEC on August 30, 2021.
Recent Pronouncements
Refer to Note 1 “Summary of Significant Accounting Policies” in the consolidated financial statements for a discussion of accounting standards currently effective for 2025 and relevant
accounting standards that have been issued but are not currently effective.
CRITICAL ACCOUNTING ESTIMATES
During the three months ended June 30, 2025, there were no material changes in the Company’s critical accounting policies and no significant changes in the application of critical
accounting policies as presented in the Company’s Annual Report on Form 10-K for the year ended December 31, 2024.
The consolidated financial statements have been prepared in conformity with GAAP and practices within the banking industry which require management to make estimates and assumptions about
future events. Estimates are based on historical experience and on various other assumptions that are believed to be reasonable under the circumstances, and the resulting estimates form the basis for making judgments about the carrying
values of certain assets and liabilities not readily apparent from other sources. Actual results could differ significantly from those estimates.
| ITEM 3. |
QUANTITATIVE AND QUALITATIVE DISCLOSURES ABOUT MARKET RISK.
|
Interest Rate Risk Management
Market risk reflects the risk of economic loss resulting from changes in interest rates and other relevant market prices. This risk of loss can be reflected in either reduced potential net
interest revenue in future periods or diminished market values of financial assets. The Company’s market risk arises primarily from IRR that is inherent in its lending, investment and deposit taking activities.
The main causes of IRR are the differing structural characteristics of our assets, liabilities and off-balance sheet obligations and their cumulative net reaction to changing interest
rates. These structural characteristics include timing differences in maturity or repricing and the effect of embedded options such as loan prepayments, securities prepayments and calls, interest rate caps, floors, collars, and deposit
withdrawal options. In addition to these sources of IRR, basis risk results from differences in the spreads between various market interest rates and changes in the slope of the yield curve can contribute to additional IRR.
We evaluate IRR and develop guidelines regarding balance sheet composition and re-pricing, funding sources and pricing, and off-balance sheet commitments that aim to moderate IRR. We use
financial simulation models that reflect various interest rate scenarios and the related impact on NII and EVE over specified periods of time. NII is a shorter-term indicator while EVE is a longer-term indicator of IRR. We refer to this
process as ALM.
The primary objective of ALM is to manage IRR within a desired risk tolerance for potential fluctuations in NII and EVE throughout different interest rate cycles, which we aim to achieve
through management of interest rate sensitive earning assets and liabilities. In general, we seek to maintain a desired risk tolerance with asset and liability balances within maturity and repricing characteristics to limit our exposure to
acceptable earnings volatility and changes in the value of assets and liabilities as interest rates fluctuate over time. Adjustments to maturity categories can be accomplished either by lengthening or shortening the duration of an
individual asset or liability category, or externally with interest rate derivative contracts, such as interest rate swaps, caps, collars, and floors. See “—Interest Rate Exposure” below for a more detailed discussion of our various
derivative positions.
Our ALM strategy is formulated and monitored by our ALCO in accordance with policies approved by the Board of Directors. ALCO meets regularly to review, among other things, the sensitivity
of our assets and liabilities to interest rate changes, the book and market values of assets and liabilities, unrealized gains and losses, recent purchase and sale activity, maturities of securities and borrowings, and projected future
transactions. ALCO also establishes and approves pricing and funding strategies with respect to overall asset and liability composition. ALCO reports regularly to our Risk Committee of the Board of Directors.
Financial simulation models are the primary tools we use to measure IRR exposures. These simulation models incorporate all of our earning assets and liabilities. By examining a range of
hypothetical deterministic interest rate scenarios, these models provide management with information regarding the potential impact on NII and EVE caused by changes in interest rates.
The models simulate the cash flows and accounting accruals generated by the financial instruments on our balance sheet, as well as the cash flows generated by the new business that we
anticipate over a 60-month forecast horizon. However, past the 36-month mark, the growth of the balances is static in the forecast. Numerous assumptions are made in the modeling process, including balance sheet composition, re-pricing, a
combination of market data and internal historical experiences, and maturity characteristics of existing and new business. These assumptions are reviewed regularly. Additionally, loan and investment prepayments, administered rate account
elasticity, and other option risks are considered as well as the uncertainty surrounding future customer behavior. Because our modeling is limited by the predictive power of historical data and current assumptions, and because our balance
sheet will be actively managed in the event of a change in interest rates, simulation results, including those discussed in “—Interest Rate Exposure” immediately below, are not intended as a forecast of the actual effect of a change in
market interest rates on our NII or EVE, or indicative of management’s expectations of actual results in the event of a fluctuation in market interest rates; however, these results are used to help measure the potential risks related to
IRR.
Interest Rate Exposure
Based upon the current interest rate environment at June 30, 2025, our simulation model projects our sensitivity to an instantaneous increase or decrease in interest rates over a one-year
period as follows:
TABLE 33—INTEREST RATE SENSITIVITY
| |
|
Increase (Decrease)
|
|
|
(Dollars in millions)
|
|
Net Interest Income
|
|
|
Economic Value of Equity
|
|
|
Change (in Basis Points) in Interest Rates (12-Month Projection)
|
|
Amount
|
|
|
Percent
|
|
|
Amount
|
|
|
Percent
|
|
|
+ 200 BP
|
|
$
|
61
|
|
|
|
3.5
|
%
|
|
$
|
(911
|
)
|
|
|
(11.4
|
)%
|
|
+ 100 BP
|
|
|
33
|
|
|
|
1.9
|
|
|
|
(444
|
)
|
|
|
(5.6
|
)
|
|
- 100 BP
|
|
|
(37
|
)
|
|
|
(2.1
|
)
|
|
|
333
|
|
|
|
4.2
|
|
|
- 200 BP
|
|
|
(85
|
)
|
|
|
(4.8
|
)
|
|
|
500
|
|
|
|
6.3
|
|
Both the NII and EVE simulations include assumptions regarding balances, asset prepayment speeds, deposit and borrowings repricing and runoff and interest rate relationships among balances
that management believes to be reasonable for the various interest rate environments. Differences in actual occurrences from these assumptions may change our market risk exposure.
See “Table 15 – Maturity Distribution of AFS Securities” that shows the maturities and weighted average yields for the carrying value of the available for sale securities as of June 30,
2025, and “Table 18 – Interest Rate Sensitivity of Loans and Leases” that shows the maturity distribution based on remaining maturities of the Company’s loan and lease portfolio and the interest rate sensitivity of the Company’s loans and
leases maturing after one year at June 30, 2025.
Derivative Positions
Overview. Our Board of Directors has authorized the ALCO to utilize financial futures, forward sales, options, interest rate
swaps, caps, collars, and floors, and other instruments to the extent appropriate, in accordance with regulations and our internal policy. From time to time, we expect to use interest rate swaps, caps, collars, and floors as macro hedges
against inherent rate sensitivity in our assets and our liabilities to synthetically alter the maturities or re-pricing characteristics of assets or liabilities to reduce imbalances.
We currently engage in only the following types of hedges: (1) those which enable us to transfer the IRR exposure involved in our daily business activities; and (2) those which serve to
alter the market risk inherent in our investment portfolio, mortgage pipeline, MSR, or liabilities and thus help us to manage earnings and market value volatility within approved risk tolerances.
The following is a discussion of our current derivative positions related to IRR.
Interest Rate Lock Commitments. In the ordinary course of business, the Company enters into certain commitments with customers in connection with
residential mortgage loan applications for loans the Company intends to sell. Such commitments are considered derivatives under current accounting guidance and are required to be recorded at fair value. The change in fair value of these
instruments is reflected currently in the mortgage banking revenue of the consolidated statements of income. The fair value of these derivatives is recorded on the consolidated balance sheets in other assets and other liabilities.
Forward Sales Commitments. The Company enters into forward sales commitments of MBS with investors to mitigate the effect of the IRR inherent in
providing interest rate lock commitments to customers. During the period from commitment date to closing date, the Company is subject to the risk that market rates of interest may change. In an effort to mitigate such risk, forward delivery
sales commitments, under which the Company agrees to deliver certain MBS, are established. These commitments are non-hedging derivatives in accordance with current accounting guidance and recorded at fair value, with changes in fair value
reflected currently in the mortgage banking revenue of the consolidated statements of income. The fair value of these derivatives is recorded on the consolidated balance sheets in other assets and other liabilities.
Mortgage Servicing Right Hedges. The value of our MSR is dependent on changes in market interest rates. In order to mitigate the effects of changes
in rates on the value of our MSR, the Company has used various instruments (including but not limited to Treasury options, Treasury, SOFR and TBA futures and forwards, swap futures, etc.) as economic hedges.
Agreements Not Designated as Hedging Derivatives. The Company enters into interest rate swap, floor, cap and collar agreements on commercial loans
with customers to meet the financing needs and IRR management needs of its customers. At the same time, the Company enters into offsetting interest rate swap agreements with a financial institution in order to minimize the Company’s IRR.
These interest rate agreements are non-hedging derivatives and are recorded at fair value with changes in fair value reflected in noninterest income. The fair value of these derivatives is recorded on the consolidated balance sheets in
other assets and other liabilities.
See Note 15 to the consolidated financial statements for additional information regarding our derivative financial instruments.
| ITEM 4. |
CONTROLS AND PROCEDURES.
|
CONCLUSION REGARDING THE EFFECTIVENESS OF DISCLOSURE CONTROLS AND PROCEDURES
The Company, with the participation of its management, including the Company’s CEO and CFO, carried out an evaluation of the effectiveness of the design and operation of its disclosure
controls and procedures (as defined in Rules 13a-15(e) and 15d-15(e) under the Exchange Act) as of the end of the period covered by this Report.
Based upon that evaluation, and as of the end of the period covered by this Report, the Company’s Chief Executive Officer and Chief Financial Officer concluded that the Company’s disclosure
controls and procedures were effective in ensuring that information required to be disclosed in its reports that the Company files or submits to the Federal Reserve under the Exchange Act is recorded, processed, summarized and reported on a
timely basis, and to ensure that such information is accumulated and communicated to the Company’s management, including its CEO and CFO, as appropriate, to allow timely decisions regarding required disclosures.
CHANGES IN INTERNAL CONTROL OVER FINANCIAL REPORTING
The Company is working to integrate FCB into its overall internal control over financial reporting processes. Except for changes made in connection with this integration of FCB, there have
been no changes in the Company’s internal control over financial reporting that occurred during the three months ended June 30, 2025, covered by this Report that materially affected, or are reasonably likely to materially affect, the
Company’s internal control over financial reporting.
PART II—OTHER INFORMATION
| Item 1. |
Legal Proceedings.
|
The information in response to this item is incorporated herein by reference to “Note 16 - Commitments and Contingent Liabilities” in the notes to unaudited consolidated financial statements included in Part
I., Item 1. “Financial Statements” of this Report. Also, see Part I. Item II. “Financial Condition - Certain Litigation and Other Contingencies.”
There have been no material changes to our risk factors previously disclosed under Part I, Item 1A. of our Annual Report on Form 10-K for the year ended December 31, 2024.
| Item 2. |
Unregistered Sales of Equity Securities and Use of Proceeds.
|
During the period commencing January 1, 2025 and ending June 30, 2025, the Company issued 989,660 RSUs and issued 264,729 PSUs under the 2025 Long-Term Incentive Plan to eligible directors, officers, and
employees of the Company for services rendered to the Company. The Company did not receive any cash consideration in connection with these grants, and these securities were exempt from registration under the Securities Act of 1933, as
amended, pursuant to Section (3)(a)(2) thereof because the sales involved securities issued by a bank.
Issuer Purchases of Equity Securities
|
For the Month Ended
|
|
Total Number
of Shares
Purchased (1)
|
|
|
Average Price
Paid per Share
|
|
|
Total Number of
Shares Purchased
as Part of Publicly
Announced Plans
or Programs (2)
|
|
|
Maximum Number
of Shares that May
Yet Be Purchased
Under the Plans
or Programs (2)
|
|
| |
|
|
|
|
|
|
|
|
|
|
|
|
|
April 30, 2025
|
|
|
426
|
|
|
$
|
26.43
|
|
|
|
—
|
|
|
|
10,000,000
|
|
|
May 31, 2025
|
|
|
70,983
|
|
|
|
32.03
|
|
|
|
—
|
|
|
|
10,000,000
|
|
|
June 30, 2025
|
|
|
—
|
|
|
|
—
|
|
|
|
—
|
|
|
|
10,000,000
|
|
|
Total
|
|
|
71,409
|
|
|
$ |
32.00
|
|
|
|
|
|
|
|
|
|
| (1) |
This column consists of shares redeemed from employees for tax withholding purposes for stock compensation.
|
| (2) |
On April 25, 2025, the Company announced a share repurchase program whereby the Company may acquire up to an aggregate of 10,000,000 shares of its common stock. The share repurchase program became effective on May 28, 2025, and
will expire on December 31, 2025. Under the share repurchase program, Cadence's shares may be purchased periodically in open market transactions at prevailing market prices, in privately negotiated transactions, or by other means in
accordance with federal securities laws. Repurchased shares are held as authorized but unissued shares available for use in connection with the Company’s stock compensation programs, other transactions, or for other corporate
purposes as determined by the Company’s Board of Directors. Through June 30, 2025, the Company did not repurchase any shares under this program.
|
| Item 3. |
Defaults Upon Senior Securities.
|
None.
| Item 4. |
Mine Safety Disclosures.
|
None.
| Item 5. |
Other Information.
|
Pursuant to Item 408(a) of Regulation S-K, none of the Company's directors or executive officers adopted, terminated or modified a Rule 10b5-1 trading arrangement or a non-Rule 10b5-1 trading arrangement during
the three months ended June 30, 2025.
(3)
|
a) |
Second Amended and Restated Articles of Incorporation of the Company. (Filed as Exhibit 3.1 to the Company’s Current Report on Form 8-K filed with the Board of Governors of the Federal Reserve System on January 3, 2025 and
incorporated herein by reference thereto).
|
|
b) |
Second Amended and Restated Bylaws of the Company. (Filed as Exhibit 3.2 to the Company’s Current Report on Form 8-K filed with the Board of Governors of the Federal Reserve System on January 3, 2025 and incorporated herein by
reference thereto).
|
|
(31.1) |
Certification of the Chief Executive Officer of Cadence Bank pursuant to Rule 13a-14 or 15d-14 of the Securities Exchange Act of 1934, as amended, as adopted pursuant to Section 302 of the Sarbanes-Oxley Act of 2002.*
|
|
|
|
|
(31.2) |
Certification of the Chief Financial Officer of Cadence Bank pursuant to Rule 13a-14 or 15d-14 of the Securities Exchange Act of 1934, as amended, as adopted pursuant to Section 302 of the Sarbanes-Oxley Act of 2002.*
|
|
|
|
|
(32.1) |
Certification of the Chief Executive Officer of Cadence Bank pursuant to 18 U.S.C. Section 1350, as adopted pursuant to Section 906 of the Sarbanes-Oxley Act of 2002.**
|
|
|
|
|
(32.2) |
Certification of the Chief Financial Officer of Cadence Bank pursuant to 18 U.S.C. Section 1350, as adopted pursuant to Section 906 of the Sarbanes-Oxley Act of 2002.**
|
SIGNATURES
Pursuant to the requirements of Section 13 or 15(d) of the Securities Exchange Act of 1934, the registrant has duly caused this report to be signed on its behalf by the undersigned,
thereunto duly authorized.
| |
|
CADENCE BANK
|
| |
|
|
|
|
DATE:
|
August 8, 2025
|
By: |
/s/ Valerie C. Toalson
|
| |
|
|
Valerie C. Toalson
|
| |
|
|
Chief Financial Officer and President - Banking Services
|
105
EXHIBIT 31.1
CADENCE BANK
CERTIFICATION PURSUANT TO RULE 13a-14 OR 15d-14 OF THE SECURITIES
EXCHANGE ACT OF 1934, AS AMENDED, AS ADOPTED PURSUANT TO
SECTION 302 OF THE SARBANES-OXLEY ACT OF 2002
I, James D. Rollins III, certify that:
|
1. |
I have reviewed this quarterly report on Form 10-Q (“this report”) of Cadence Bank;
|
|
2. |
Based on my knowledge, this report does not contain any untrue statement of a material fact or omit to state a material fact necessary to make the statements
made, in light of the circumstances under which such statements were made, not misleading with respect to the period covered by this report;
|
|
3. |
Based on my knowledge, the financial statements, and other financial information included in this report, fairly present in all material respects the
financial condition, results of operations and cash flows of the registrant as of, and for, the periods presented in this report;
|
|
4. |
The registrant’s other certifying officer and I are responsible for establishing and maintaining disclosure controls and procedures (as defined in Exchange
Act Rules 13a-15(e) and 15d-15(e)) and internal control over financial reporting (as defined in Exchange Act Rules 13a-15(f) and 15d-15(f)) for the registrant and have:
|
(a) Designed such disclosure controls and procedures, or caused such disclosure controls and procedures to be designed under our
supervision, to ensure that material information relating to the registrant, including its consolidated subsidiaries, is made known to us by others within those entities, particularly during the period in which this report is being
prepared;
(b) Designed such internal control over financial reporting, or caused such internal control over financial reporting to be designed under our supervision, to provide
reasonable assurance regarding the reliability of financial reporting and the preparation of financial statements for external purposes in accordance with generally accepted accounting principles;
(c) Evaluated the effectiveness of the registrant’s disclosure controls and procedures and presented in this report our conclusions
about the effectiveness of the disclosure controls and procedures, as of the end of the period covered by this report based on such evaluation; and
(d) Disclosed in this report any change in the registrant’s internal control over financial reporting that occurred during the registrant’s most recent fiscal quarter (the
registrant’s fourth fiscal quarter in the case of an annual report) that has materially affected, or is reasonably likely to materially affect, the registrant’s internal control over financial reporting; and
|
5. |
The registrant’s other certifying officer and I have disclosed, based on our most recent evaluation of internal control over financial reporting, to the
registrant’s auditors and the audit committee of the registrant’s Board of Directors (or persons performing the equivalent functions):
|
(a) All significant deficiencies and material weaknesses in the design or operation of internal control over financial reporting which are reasonably likely to adversely
affect the registrant’s ability to record, process, summarize and report financial information; and
(b) Any fraud, whether or not material, that involves management or other employees who have a significant role in the registrant’s
internal control over financial reporting.
Date: August 8, 2025
|
|
/s/ James D. Rollins III
|
|
|
James D. Rollins III |
|
|
Chief Executive Officer |
|
|
|
106
EXHIBIT 31.2
CADENCE BANK
CERTIFICATION PURSUANT TO RULE 13a-14 OR 15d-14 OF THE SECURITIES
EXCHANGE ACT OF 1934, AS AMENDED, AS ADOPTED PURSUANT TO
SECTION 302 OF THE SARBANES-OXLEY ACT OF 2002
I, Valerie C. Toalson, certify that:
|
1. |
I have reviewed this quarterly report on Form 10-Q (“this report”) of Cadence Bank;
|
|
2. |
Based on my knowledge, this report does not contain any untrue statement of a material fact or omit to state a material fact necessary to make the statements
made, in light of the circumstances under which such statements were made, not misleading with respect to the period covered by this report;
|
|
3. |
Based on my knowledge, the financial statements, and other financial information included in this report, fairly present in all material respects the
financial condition, results of operations and cash flows of the registrant as of, and for, the periods presented in this report;
|
|
4. |
The registrant’s other certifying officer and I are responsible for establishing and maintaining disclosure controls and procedures (as defined in Exchange
Act Rules 13a-15(e) and 15d-15(e)) and internal control over financial reporting (as defined in Exchange Act Rules 13a-15(f) and 15d-15(f)) for the registrant and have:
|
(a) Designed such disclosure controls and procedures, or caused such disclosure controls and procedures to be designed under our
supervision, to ensure that material information relating to the registrant, including its consolidated subsidiaries, is made known to us by others within those entities, particularly during the period in which this report is being
prepared;
(b) Designed such internal control over financial reporting, or caused such internal control over financial reporting to be designed under our supervision, to provide
reasonable assurance regarding the reliability of financial reporting and the preparation of financial statements for external purposes in accordance with generally accepted accounting principles;
(c) Evaluated the effectiveness of the registrant’s disclosure controls and procedures and presented in this report our conclusions
about the effectiveness of the disclosure controls and procedures, as of the end of the period covered by this report based on such evaluation; and
(d) Disclosed in this report any change in the registrant’s internal control over financial reporting that occurred during the registrant’s most recent fiscal quarter (the
registrant’s fourth fiscal quarter in the case of an annual report) that has materially affected, or is reasonably likely to materially affect, the registrant’s internal control over financial reporting; and
|
5. |
The registrant’s other certifying officer and I have disclosed, based on our most recent evaluation of internal control over financial reporting, to the
registrant’s auditors and the audit committee of the registrant’s Board of Directors (or persons performing the equivalent functions):
|
(a) All significant deficiencies and material weaknesses in the design or operation of internal control over financial reporting which are reasonably likely to adversely
affect the registrant’s ability to record, process, summarize and report financial information; and
(b) Any fraud, whether or not material, that involves management or other employees who have a significant role in the registrant’s
internal control over financial reporting.
Date: August 8, 2025
|
|
/s/ Valerie C. Toalson
|
|
|
Valerie C. Toalson |
|
|
Chief Financial Officer and
President - Banking Services
(Principal Accounting Officer)
|
|
|
|
107
EXHIBIT 32.1
CADENCE BANK
CERTIFICATION PURSUANT TO
18 U.S.C. SECTION 1350,
AS ADOPTED PURSUANT TO
SECTION 906 OF THE SARBANES-OXLEY ACT OF 2002
In connection with this quarterly report on Form 10-Q of Cadence Bank (the “Company”), for the
three-months ended June 30, 2025, as filed with the Board of Governors of the Federal Reserve System on the date hereof (the “Report”), I, James D. Rollins III, Chief Executive Officer of the Company, certify in my capacity as an executive
officer of the Company, pursuant to 18 U.S.C. § 1350, as adopted pursuant to § 906 of the Sarbanes-Oxley Act of 2002, that to my knowledge:
(1) The Report fully complies with the requirements of Section 13(a) or 15(d) of the Securities Exchange Act of 1934, as
amended; and
(2) The information contained in the Report fairly presents, in all material respects, the financial condition and results of
operations of the Company.
| August 8, 2025 |
/s/
James D. Rollins III |
|
|
James D. Rollins III
|
|
|
Chief Executive Officer |
A signed original of this written statement required by Section 906 has been provided to the Company and
will be retained by the Company and furnished to the Board of Governors of the Federal Reserve System or its staff upon request.
108
EXHIBIT 32.2
CADENCE BANK
CERTIFICATION PURSUANT TO
18 U.S.C. SECTION 1350,
AS ADOPTED PURSUANT TO
SECTION 906 OF THE SARBANES-OXLEY ACT OF 2002
In connection with this quarterly report on Form 10-Q of Cadence Bank (the “Company”), for the
three-months ended June 30, 2025, as filed with the Board of Governors of the Federal Reserve System on the date hereof (the “Report”), I, Valerie C. Toalson, Chief Financial Officer of the Company, certify in my capacity as an executive
officer of the Company, pursuant to 18 U.S.C. § 1350, as adopted pursuant to § 906 of the Sarbanes-Oxley Act of 2002, that to my knowledge:
(1) The Report fully complies with the requirements of Section 13(a) or 15(d) of the Securities Exchange Act of 1934, as
amended; and
(2) The information contained in the Report
fairly presents, in all material respects, the financial condition and results of operations of the Company.
August 8, 2025
|
/s/ Valerie C. Toalson
|
|
|
Valerie C. Toalson |
|
|
Chief Financial Officer and
President - Banking Services
(Principal Accounting Officer)
|
|
|
|
A signed original of this written statement required by Section 906 has been provided to the Company and
will be retained by the Company and furnished to the Board of Governors of the Federal Reserve System or its staff upon request.
109
Exhibit 99.4
BOARD OF GOVERNORS OF THE
FEDERAL RESERVE SYSTEM
WASHINGTON, DC 20551
FORM 10-Q
(Mark One)
|
x |
QUARTERLY REPORT PURSUANT TO SECTION 13 OR 15(d) OF THE SECURITIES EXCHANGE ACT OF 1934 |
For the quarterly period ended September 30, 2025
OR
|
¨ |
TRANSITION REPORT PURSUANT TO SECTION 13 OR 15(d) OF THE SECURITIES EXCHANGE ACT OF 1934 |
For the transition period from to
FDIC Certificate No. 11813
CADENCE BANK
(Exact name of registrant as specified in its charter)
| Mississippi |
|
64-0117230 |
|
(State or other jurisdiction of incorporation or
organization)
|
|
(I.R.S. Employer Identification No.)
|
| |
|
|
| One Mississippi Plaza, 201 South Spring Street |
|
|
| Tupelo, Mississippi |
|
38804 |
| (Address of principal executive offices) |
|
(Zip Code) |
Registrant’s telephone number, including area code: (662) 680-2000
Securities registered pursuant to Section 12(b) of the Act:
| Title of each class |
|
Trading Symbol(s) |
|
Name of each exchange on which registered |
| Common Stock, $2.50 par value per share |
|
CADE |
|
New York Stock Exchange |
| |
|
|
|
|
| 5.50% Series A Non-Cumulative Perpetual Preferred Stock, par value $0.01 per share |
|
CADE PR A |
|
New York Stock Exchange |
Indicate by check mark whether the registrant: (1) has filed all reports required to be filed by Section 13
or 15(d) of the Securities Exchange Act of 1934 during the preceding 12 months (or for such shorter period that the registrant was required to file such reports), and (2) has been subject to such filing requirements for the past 90 days. Yes x No ¨
Indicate by check mark whether the registrant has submitted electronically every Interactive Data File
required to be submitted pursuant to Rule 405 of Regulation S-T (§232.405 of this chapter) during the preceding 12 months (or for such shorter period that the registrant was required to
submit such files). Yes x No ¨
Indicate by check mark whether the registrant is a large accelerated filer, an accelerated filer, a
non-accelerated filer, a smaller reporting company, or an emerging growth company. See the definitions of “large accelerated filer,” “accelerated filer,” “smaller reporting company,” and “emerging growth company” in Rule 12b-2 of the Exchange Act.
| Large Accelerated Filer |
x |
Accelerated Filer |
¨ |
| Non-Accelerated Filer |
¨ |
Smaller Reporting Company |
¨ |
| |
|
Emerging Growth Company |
¨ |
If an emerging growth company, indicate by check mark if the registrant has elected not to use the extended
transition period for complying with any new or revised financial accounting standards provided pursuant to Section 13(a) of the Exchange Act. ¨
Indicate by check mark whether the registrant is a shell company (as defined in Rule 12b-2 of the Exchange
Act). Yes ¨ No x
As of November 3, 2025, the registrant had outstanding 186,307,016 shares of common stock, par value $2.50 per share, and 6,900,000 shares of its 5.50% Series A
Non-Cumulative Perpetual Preferred Stock, par value $0.01 per share.
TABLE OF CONTENTS
Glossary of Defined Terms
ACH - Automated Clearing House
ACL - Allowance for credit losses
AFS - Available for sale
AI - Artificial intelligence
ALM - Asset/liability management
ALCO - Asset/Liability Management Committee
AOCI - Accumulated other comprehensive income (loss)
ASC - Accounting Standards Codification
ASU - Accounting Standards Update
ATM - Automated teller machine
Basel III - Basel Committee's 2010 Regulatory Capital Framework (Third Accord)
Basel Committee - Basel Committee on Banking Supervision
BHC Act - Bank Holding Company Act of 1956, as amended
Board - the Company’s Board of Directors
BOLI - Bank-owned life insurance
BTFP - Bank Term Funding Program
C&I - Commercial and industrial
CAD - Construction, acquisition and development
CAMT - Corporate alternative minimum tax rate
CDE - Community development entity
CECL - ASU 2016-13, Measurement of Credit Losses on Financial Instruments ("Current Expected Credit Losses")
CEO - Chief Executive Officer
CET1 - Common Equity Tier 1
CFO - Chief Financial Officer
CFPB - Consumer Financial Protection Bureau
CIO - Chief Information Officer
CIS - Center for Internet Security
CISM - Certified Information Security Manager
CISO - Chief Information Security Officer
CISSP - Certified Information Systems Security Professional
Code - Code of Business Conduct and Ethics
CODM - Chief operating decision maker
Company - Cadence Bank and its subsidiaries
COO - Chief Operating Officer
COSO - Committee of Sponsoring Organizations of the Treadway Commission
CPR - Conditional Prepayment Rate
CRA - Community Reinvestment Act of 1977
CRE - Commercial real estate
CSC - Contractual servicing cost
DIF - Deposit Insurance Fund
DOJ - U.S. Department of Justice
EAP - Employee Assistance Program
EIR - Effective interest rate
EPS - Earnings per share
ESG - Environmental, Social and Governance
Exchange Act - Securities Exchange Act of 1934, as amended
EVE - Economic value of equity
FASB - Financial Accounting Standards Board
FCB - First Chatham Bank
FDI Act - Federal Deposit Insurance Act
FDIC - Federal Deposit Insurance Corporation
FDICIA - Federal Deposit Insurance Corporation Improvement Act of 1991
FDM - Financial difficulty modification
Federal Reserve - Board of Governors of the Federal Reserve System
FHA - Federal Housing Administration
FHLB - Federal Home Loan Bank
FHLMC - Federal Home Loan Mortgage Corporation
FinCEN - Financial Crimes Enforcement Network
FNMA - Federal National Mortgage Association
FRB - Federal Reserve Bank
FTE - Fully taxable equivalent
GAAP - Generally Accepted Accounting Principles in the United States
GNMA - Government National Mortgage Association
HTC - Historic tax credits
IBS - Industry Bancshares, Inc.
IRA of 2022 - Inflation Reduction Act of 2022
IRR - Interest rate risk
ITM - Interactive teller machine
LTV - Loan to value
MBS - Mortgage-backed securities
MDBCF - Mississippi Department of Banking and Consumer Finance
MSR - Mortgage servicing rights
NAV - Net asset value
NII - Net interest income
NM - Not meaningful
NMTC - New market tax credit
NPA - Nonperforming asset(s)
NPL - Nonperforming loan(s)
NSF - Nonsufficient funds
NYSE - New York Stock Exchange
OBBB - One Big Beautiful Bill
OCC - Office of the Comptroller of the Currency
OIS - Overnight Index Swap
OREO - Other real estate owned
PCAOB - Public Company Accounting Oversight Board
PCD - Purchased credit deteriorated
Preferred Stock - 5.50% Series A Non-Cumulative Perpetual Preferred Stock, par value $0.01 per share, of the Company
PSU - Performance stock unit
ROU - Right of use
RSA - Restricted stock award
RSU - Restricted stock unit
SBA - Small Business Administration
SBIC - Small Business Investment Company
SEC - U.S. Securities and Exchange Commission
SNC - Shared National Credit
SOFR - Secured Overnight Financing Rate
TBA - To be announced
TCJA - Tax Cuts and Jobs Act of 2017
TDR - Troubled debt restructuring
USDA - U.S. Department of Agriculture
VA - U.S. Department of Veterans Affairs
VIE - Variable interest entity
YTD - Year to date
CAUTIONARY NOTE REGARDING FORWARD LOOKING STATEMENTS
Certain statements made in this quarterly report on Form 10-Q (this “Report”) are not statements of historical fact and constitute
“forward-looking statements” within the meaning of Section 21E of the Exchange Act and are subject to the safe harbor created thereby under the Private Securities Litigation Reform Act of 1995 as well as the “bespeaks caution” doctrine. These
statements are often, but not always, made through the use of words or phrases such as “anticipate,” “aspire,” “assume,” “believe,” “budget,” “contemplate,” “continue,” “could,” “estimate,” “expect,” “forecast,” “foresee,” “goal,” “hope,” “indicate,”
“intend,” “may,” “might,” “outlook,” “plan,” “project,” “projection,” “predict,” “prospect,” “potential,” “roadmap,” “seek,” “should,” “target,” “will,” and “would,” or the negative versions of those words, or other comparable words of a future or
forward-looking nature. These forward-looking statements may include, without limitation, discussions regarding general economic, interest rate, trade, real estate market, competitive, employment, and credit market conditions; our assets; business;
cash flows; financial condition; liquidity; prospects; results of operations and the Company’s ability to deploy capital into strategic and growth initiatives; deposit growth interest and fee-based revenue; capital resources; capital metrics;
efficiency ratio; valuation of mortgage servicing rights; mortgage production volume; net income; net interest revenue; non-interest revenue; net interest margin; interest expense; non-interest expense; earnings per share; interest rate sensitivity;
interest rate risk; balance sheet and liquidity management; off-balance sheet arrangements; fair value determinations; asset quality; credit quality; credit losses; provision and allowance for credit losses, impairments, charge-offs, recoveries and
changes in volume; investment securities portfolio yields and values; ability to manage the impact of natural disasters; adoption and use of critical accounting policies; adoption and implementation of new accounting standards and their effect on our
financial results and our financial reporting; utilization of non-GAAP financial metrics; declaration and payment of dividends; ability to pay dividends or coupons on our Preferred Stock or our subordinated notes; mortgage and commission revenue
growth; implementation and execution of cost savings initiatives; ability to successfully litigate, resolve or otherwise dispense with threatened, ongoing and future litigation and administrative and investigatory matters; ability to successfully
complete pending or future acquisitions or divestitures; dispositions and other strategic growth opportunities and initiatives; ability to successfully integrate and manage acquisitions or divestitures; opportunities and efforts to grow market share;
reputation; ability to compete with other financial institutions; ability to recruit and retain key employees and personnel; access to capital markets; investment in other financial institutions; and ability to operate our regulatory compliance
programs in accordance with applicable law.
Forward-looking statements are based upon management’s expectations as well as certain assumptions and estimates made by, and information
available to, management at the time such statements were made. Forward-looking statements are not historical facts, are not guarantees of future results or performance and are subject to certain known and unknown risks, uncertainties and other factors
that are beyond our control and that may cause actual results to differ materially from those expressed in, or implied by, such forward-looking statements. These risks, uncertainties and other factors include, without limitation, general economic,
unemployment, credit market and real estate market conditions (including potential downturn, contraction and/or recession), and the effect of such conditions on the creditworthiness of borrowers, collateral values, the value of investment securities
and asset recovery values; the risks of changes in trade policy, in interest rates, and their effects on the level and composition of deposits, loan demand, loan repayment velocity, and the values of loan collateral, securities and interest sensitive
assets and liabilities; risks arising from market reactions to the banking environment in general, or to conditions or situations at specific banks; risks arising from perceived instability in the banking sector; the impact of inflation, the failure of
assumptions underlying the establishment of reserves for possible credit losses, fair value for loans and other real estate owned; changes in the prices, values and sales volumes of residential and commercial real estate, especially as they relate to
the value of collateral supporting the Company’s loans; uncertainties surrounding the impact of proposed tariffs (by or on the U.S.), including the potential negative impact to our loan portfolio and profitability, potential for increases in problem
loans, potential re-evaluation of credit markets and interest rates, lower equity valuation and potential slowdown in capital markets, reduced demand for U.S. exports, disruptions to supply chains, impacts from decreased international tourism,
decreased demand for other banking products and services and negative credit quality developments arising from the foregoing or other factors; the uncertain duration of trade conflicts; the magnitude of the impact that the proposed tariffs may have on
our customers’ businesses; a deterioration of the credit rating for U.S. long-term sovereign debt, actions that the U.S. government may take to avoid exceeding the debt ceiling, or uncertainties surrounding the debt ceiling and the federal budget; the
availability of and access to capital; possible downgrades in our credit ratings or outlook which could increase the costs or availability of funding from capital markets; the ability to attract new or retain existing deposits or to retain or grow
loans; potential delays or other problems in implementing and executing our growth, expansion and acquisition or divestment strategies, including delays in obtaining regulatory or other necessary approvals (including obtaining the approval of any
pending transactions), or the failure to realize any anticipated benefits or synergies from any acquisitions or growth strategies; the risks relating to the acquisitions of FCB Financial Corp. and Industry Bancshares, Inc. including, without
limitation: (i) the diversion of management's time on issues related to integration efforts; (ii) unexpected transaction costs, including the costs of integrating operations; (iii) the risks that the businesses will not be integrated successfully or
that such integration may be more difficult, time-consuming or costly than expected; (iv) the potential failure to fully or timely realize expected revenues and revenue synergies, including as the result of revenues following the merger being lower
than expected; (v) the risk of deposit and customer attrition; any changes in deposit mix; (vi) unexpected operating and other costs, which may differ or change from expectations; (vii) the risks of customer and employee loss and business disruptions,
including, without limitation, as the result of difficulties in maintaining relationships with employees; (viii) increased competitive pressures and solicitations of customers by competitors; and (ix) the difficulties and risks inherent with entering
new markets; risks related to the proposed merger with Huntington (as defined below), including, without limitation: (i) the occurrence of any event, change or other circumstances that could give rise to the right of one or both of the parties to
terminate the merger agreement between Huntington and the Company, (ii) the outcome of any legal proceedings that may be instituted against Huntington or the Company, (iii) delays in completing the merger, (iv) the failure to obtain necessary
regulatory approvals (and the risk that such approvals may result in the imposition of conditions that could adversely affect the combined company or the expected benefits of the merger); (v) the failure to obtain the requisite vote of Huntington’s or
the Company’s shareholders or to satisfy any of the other conditions to the merger on a timely basis or at all; (vi) the possibility that the anticipated benefits of the merger are not realized when expected or at all, including as a result of the
impact of, or problems arising from, the integration of the two companies or as a result of the strength of the economy and competitive factors in the areas where Huntington and the Company do business; (vii) the possibility that the merger may be more
expensive to complete than anticipated, including as a result of unexpected factors or events; diversion of management’s attention from ongoing business operations and opportunities; (viii) potential adverse reactions or changes to business, customer
or employee relationships, including those resulting from the announcement or completion of the merger; (ix) the ability to complete the merger and integration of Huntington and the Company successfully; (x) the dilution caused by Huntington’s issuance
of additional shares of its capital stock in connection with the merger; (xi) changes in policies and standards for regulatory review of bank mergers; (xii) the ability of Huntington and the Company to meet expectations regarding the timing, completion
and accounting and tax treatment of the transaction; and (xiii) other factors that may affect the future results of Huntington and the Company; significant turbulence or a disruption in the capital or financial markets; the effect of a fall in stock
market prices on our investment banking business and our fee income from our brokerage and wealth management businesses; the ability to grow additional interest and fee income or to control noninterest expense; competitive factors and pricing
pressures, including their effect on our net interest margin; changes in legal, financial and/or regulatory requirements (including those related to share repurchases); recently enacted and potential legislation and regulatory actions and the costs and
expenses to comply with new and/or existing legislation and regulatory actions, and any related rules and regulations; changes in U.S. Government monetary, fiscal and trade policy, including any changes that may result from U.S. elections; special
assessments or changes to regular assessments by banking regulators; possible adverse rulings, judgments, settlements and other outcomes of pending or future litigation or government actions; the ability to keep pace with technological changes,
including changes regarding generative artificial intelligence, maintaining cybersecurity and compliance with applicable cybersecurity regulatory requirements; increased competition in the financial services industry, particularly from regional and
national institutions, as well as from fintech companies, risks related to our reliance on third parties to provide key components of our business infrastructure, including the risks related to disruptions in services provided by disputes with, or
financial difficulties of a third-party vendor, the impact of failure in, or breach of, our operational or security systems or infrastructure, or those of third parties with whom we do business, including as a result of cyber-attacks or an increase in
the incidence or severity of fraud, illegal payments, security breaches or other illegal acts impacting us or our customers; natural disasters or acts of war or terrorism; international or political instability (including the impacts related to or
resulting from the proposed tariffs and international trade conflicts, Russia’s military action in Ukraine, or the Israel-Hamas war, including the imposition of additional sanctions and export controls, as well as the broader impacts to financial
markets and the global macroeconomic and geopolitical environments); risks and costs related to the scope and pace of related rulemaking activity; impairment of our goodwill or other intangible assets; adoption of new accounting standards or changes in
existing standards; and other factors described in “Part I, Item 1A. Risk Factors” in this Report or as detailed from time to time in the Company’s press and news releases, reports and other filings we file with the federal banking regulators.
The Company faces risks from: possible adverse rulings, judgments, settlements or other outcomes of pending, ongoing and future litigation, as well as governmental,
administrative and investigatory matters; the impairment of the Company’s goodwill or other intangible assets; losses of key employees and personnel; the diversion of management’s attention from ongoing business operations and opportunities; and the
Company’s success in executing its business plans and strategies, and managing the risks involved in all of the foregoing.
Although the Company believes that the expectations reflected in these forward-looking statements are reasonable as of the date of this Report, if one or more events
related to these or other risks or uncertainties materialize, or if the Company’s underlying assumptions prove to be incorrect, actual results may prove to be materially different from the results expressed or implied by the forward-looking statements.
Accordingly, undue reliance should not be placed on any forward-looking statements. The forward-looking statements speak only as of the date of this Report, and the Company does not undertake any obligation to publicly update or review any
forward-looking statement, whether as a result of new information, future developments or otherwise, except as required by applicable law. New risks and uncertainties may emerge from time to time, and it is not possible for the Company to predict their
occurrence or how they will affect the Company. All written or oral forward-looking statements attributable to us are expressly qualified in their entirety by this section.
PART I—FINANCIAL INFORMATION
ITEM 1. FINANCIAL STATEMENTS.
Consolidated Balance Sheets
Cadence Bank and Subsidiaries
(Unaudited)
| (In thousands, except share and per share amounts) |
|
September 30, 2025 |
|
|
December 31, 2024 |
|
| ASSETS |
| Cash and due from banks |
|
$ |
839,841 |
|
|
$ |
624,884 |
|
| Interest bearing deposits with other banks and Federal funds sold |
|
|
1,049,332 |
|
|
|
1,106,692 |
|
| Total cash and cash equivalents |
|
|
1,889,173 |
|
|
|
1,731,576 |
|
| Available for sale securities, at fair value |
|
|
9,616,389 |
|
|
|
7,293,988 |
|
| Loans and leases, net of unearned income |
|
|
36,801,836 |
|
|
|
33,741,755 |
|
| Allowance for credit losses |
|
|
496,199 |
|
|
|
460,793 |
|
| Net loans and leases |
|
|
36,305,637 |
|
|
|
33,280,962 |
|
| Loans held for sale, at fair value |
|
|
261,680 |
|
|
|
244,192 |
|
| Premises and equipment, net |
|
|
855,275 |
|
|
|
783,456 |
|
| Goodwill |
|
|
1,515,771 |
|
|
|
1,366,923 |
|
| Other intangible assets, net |
|
|
149,039 |
|
|
|
83,190 |
|
| Bank-owned life insurance |
|
|
768,887 |
|
|
|
651,838 |
|
| Other assets |
|
|
1,920,501 |
|
|
|
1,583,065 |
|
| TOTAL ASSETS |
|
$ |
53,282,352 |
|
|
$ |
47,019,190 |
|
| LIABILITIES |
| Noninterest bearing demand deposits |
|
$ |
9,036,907 |
|
|
$ |
8,591,805 |
|
| Interest bearing demand and money market deposits |
|
|
20,518,436 |
|
|
|
19,345,114 |
|
| Savings |
|
|
3,095,622 |
|
|
|
2,588,406 |
|
| Time deposits |
|
|
11,270,491 |
|
|
|
9,970,876 |
|
| Total deposits |
|
|
43,921,456 |
|
|
|
40,496,201 |
|
| Securities sold under agreement to repurchase |
|
|
29,532 |
|
|
|
23,616 |
|
| Short-term FHLB borrowings |
|
|
925,000 |
|
|
|
— |
|
| Subordinated and long-term borrowings |
|
|
1,330,657 |
|
|
|
10,706 |
|
| Other liabilities |
|
|
992,611 |
|
|
|
918,984 |
|
| TOTAL LIABILITIES |
|
|
47,199,256 |
|
|
|
41,449,507 |
|
| SHAREHOLDERS' EQUITY |
| Series A Non-Cumulative Perpetual Preferred stock, $0.01 par value per share; authorized - 500,000,000 shares; issued and outstanding - 6,900,000 shares for both periods presented |
|
|
166,993 |
|
|
|
166,993 |
|
| Common stock, $2.50 par value per share; authorized - 500,000,000 shares; issued and outstanding - 186,307,016 and 183,527,575 shares, respectively |
|
|
465,768 |
|
|
|
458,819 |
|
| Capital surplus |
|
|
2,813,356 |
|
|
|
2,742,913 |
|
| Accumulated other comprehensive loss |
|
|
(493,782 |
) |
|
|
(694,495 |
) |
| Retained earnings |
|
|
3,130,761 |
|
|
|
2,895,453 |
|
| TOTAL SHAREHOLDERS' EQUITY |
|
|
6,083,096 |
|
|
|
5,569,683 |
|
| TOTAL LIABILITIES AND SHAREHOLDERS' EQUITY |
|
$ |
53,282,352 |
|
|
$ |
47,019,190 |
|
See accompanying notes to the unaudited consolidated financial statements.
Consolidated Statements of Income
Cadence Bank and Subsidiaries
(Unaudited)
| |
|
Three Months Ended
September 30,
|
|
|
Nine Months Ended
September 30,
|
|
| (In thousands, except per share amounts) |
|
2025 |
|
|
2024 |
|
|
2025 |
|
|
2024 |
|
| INTEREST REVENUE: |
|
|
|
|
|
|
|
|
|
|
|
|
|
|
|
|
| Loans and leases |
|
$ |
588,570 |
|
|
$ |
555,862 |
|
|
$ |
1,668,311 |
|
|
$ |
1,624,487 |
|
| Available for sale securities: |
|
|
|
|
|
|
|
|
|
|
|
|
|
|
|
|
| Taxable |
|
|
86,144 |
|
|
|
59,732 |
|
|
|
211,731 |
|
|
|
185,989 |
|
| Tax-exempt |
|
|
5,952 |
|
|
|
638 |
|
|
|
7,215 |
|
|
|
1,963 |
|
| Loans held for sale |
|
|
1,758 |
|
|
|
1,630 |
|
|
|
4,943 |
|
|
|
4,467 |
|
| Short-term investments |
|
|
22,219 |
|
|
|
29,851 |
|
|
|
47,299 |
|
|
|
110,130 |
|
| Total interest revenue |
|
|
704,643 |
|
|
|
647,713 |
|
|
|
1,939,499 |
|
|
|
1,927,036 |
|
| INTEREST EXPENSE: |
|
|
|
|
|
|
|
|
|
|
|
|
|
|
|
|
| Interest bearing demand deposits and money market accounts |
|
|
136,105 |
|
|
|
142,179 |
|
|
|
390,810 |
|
|
|
437,861 |
|
| Savings |
|
|
5,378 |
|
|
|
3,695 |
|
|
|
12,769 |
|
|
|
11,238 |
|
| Time deposits |
|
|
112,720 |
|
|
|
94,944 |
|
|
|
312,341 |
|
|
|
264,786 |
|
| Federal funds purchased and securities sold under agreement to repurchase |
|
|
818 |
|
|
|
561 |
|
|
|
4,881 |
|
|
|
3,808 |
|
| Short-term borrowings |
|
|
11,807 |
|
|
|
42,003 |
|
|
|
24,718 |
|
|
|
125,656 |
|
| Subordinated and long-term borrowings |
|
|
14,088 |
|
|
|
2,873 |
|
|
|
28,961 |
|
|
|
12,003 |
|
| Total interest expense |
|
|
280,916 |
|
|
|
286,255 |
|
|
|
774,480 |
|
|
|
855,352 |
|
| Net interest revenue |
|
|
423,727 |
|
|
|
361,458 |
|
|
|
1,165,019 |
|
|
|
1,071,684 |
|
| Provision for credit losses |
|
|
32,000 |
|
|
|
12,000 |
|
|
|
83,000 |
|
|
|
56,000 |
|
| Net interest revenue, after provision for credit losses |
|
|
391,727 |
|
|
|
349,458 |
|
|
|
1,082,019 |
|
|
|
1,015,684 |
|
| NONINTEREST REVENUE: |
|
|
|
|
|
|
|
|
|
|
|
|
|
|
|
|
| Wealth management |
|
|
24,515 |
|
|
|
24,110 |
|
|
|
73,092 |
|
|
|
70,949 |
|
| Deposit service charges |
|
|
19,047 |
|
|
|
18,814 |
|
|
|
54,844 |
|
|
|
54,803 |
|
| Credit card, debit card and merchant fees |
|
|
13,484 |
|
|
|
12,649 |
|
|
|
38,445 |
|
|
|
37,581 |
|
| Mortgage banking |
|
|
4,469 |
|
|
|
1,133 |
|
|
|
19,818 |
|
|
|
13,749 |
|
| Security gains (losses), net |
|
|
4,311 |
|
|
|
(2,947 |
) |
|
|
4,302 |
|
|
|
(2,960 |
) |
| Other |
|
|
27,652 |
|
|
|
32,142 |
|
|
|
86,545 |
|
|
|
96,223 |
|
| Total noninterest revenue |
|
|
93,478 |
|
|
|
85,901 |
|
|
|
277,046 |
|
|
|
270,345 |
|
| NONINTEREST EXPENSE: |
|
|
|
|
|
|
|
|
|
|
|
|
|
|
|
|
| Salaries and employee benefits |
|
|
173,485 |
|
|
|
152,237 |
|
|
|
483,797 |
|
|
|
456,926 |
|
| Occupancy and equipment |
|
|
31,892 |
|
|
|
28,894 |
|
|
|
90,408 |
|
|
|
86,901 |
|
| Data processing and software |
|
|
36,120 |
|
|
|
29,164 |
|
|
|
93,953 |
|
|
|
88,658 |
|
| Deposit insurance assessments |
|
|
10,037 |
|
|
|
7,481 |
|
|
|
27,251 |
|
|
|
31,637 |
|
| Amortization of intangibles |
|
|
7,539 |
|
|
|
3,933 |
|
|
|
15,253 |
|
|
|
11,998 |
|
| Merger expense |
|
|
19,789 |
|
|
|
— |
|
|
|
22,283 |
|
|
|
— |
|
| Other |
|
|
41,384 |
|
|
|
37,729 |
|
|
|
119,513 |
|
|
|
103,223 |
|
| Total noninterest expense |
|
|
320,246 |
|
|
|
259,438 |
|
|
|
852,458 |
|
|
|
779,343 |
|
| Income before income taxes |
|
|
164,959 |
|
|
|
175,921 |
|
|
|
506,607 |
|
|
|
506,686 |
|
| Income tax expense |
|
|
35,110 |
|
|
|
39,482 |
|
|
|
108,891 |
|
|
|
115,797 |
|
| Net income |
|
$ |
129,849 |
|
|
$ |
136,439 |
|
|
|
397,716 |
|
|
|
390,889 |
|
| Less: preferred dividends |
|
|
2,372 |
|
|
|
2,372 |
|
|
|
9,488 |
|
|
|
7,116 |
|
| Net income available to common shareholders |
|
$ |
127,477 |
|
|
$ |
134,067 |
|
|
$ |
388,228 |
|
|
$ |
383,773 |
|
| |
|
|
|
|
|
|
|
|
|
|
|
|
|
|
|
|
| Basic earnings per common share |
|
$ |
0.68 |
|
|
$ |
0.74 |
|
|
$ |
2.10 |
|
|
$ |
2.10 |
|
| Diluted earnings per common share |
|
$ |
0.67 |
|
|
$ |
0.72 |
|
|
$ |
2.07 |
|
|
$ |
2.07 |
|
See accompanying notes to the unaudited consolidated financial statements.
Consolidated Statements of Comprehensive Income
Cadence Bank and Subsidiaries
(Unaudited)
| |
|
Three Months Ended
September 30,
|
|
|
Nine Months Ended
September 30,
|
|
| (In thousands) |
|
2025 |
|
|
2024 |
|
|
2025 |
|
|
2024 |
|
| Net income |
|
$ |
129,849 |
|
|
$ |
136,439 |
|
|
$ |
397,716 |
|
|
$ |
390,889 |
|
| Other comprehensive income, net of tax: |
| Unrealized gains on AFS securities: |
|
|
|
|
|
|
|
|
|
|
|
|
|
|
|
|
| Net unrealized gains, net of income taxes of $(24,284), $(59,934), $(60,538), and $(53,209), respectively |
|
|
78,526 |
|
|
|
193,808 |
|
|
|
195,760 |
|
|
|
172,061 |
|
Reclassification adjustment for net gains (losses) realized
in net income, net of income taxes of $(1,018), $696,
$(1,016), and $699, respectively |
|
|
3,293 |
|
|
|
(2,251 |
) |
|
|
3,286 |
|
|
|
(2,261 |
) |
| Net change in unrealized gains on AFS securities, net of tax |
|
|
81,819 |
|
|
|
191,557 |
|
|
|
199,046 |
|
|
|
169,800 |
|
| Recognized employee benefit plan net periodic benefit cost, net of income taxes of $(171), $(173), $(515), and $(521), respectively |
|
|
556 |
|
|
|
563 |
|
|
|
1,667 |
|
|
|
1,687 |
|
| Other comprehensive income, net of tax |
|
|
82,375 |
|
|
|
192,120 |
|
|
|
200,713 |
|
|
|
171,487 |
|
| Comprehensive income |
|
$ |
212,224 |
|
|
$ |
328,559 |
|
|
$ |
598,429 |
|
|
$ |
562,376 |
|
See accompanying notes to the unaudited consolidated financial statements.
Consolidated Statements of Shareholders' Equity
Cadence Bank and Subsidiaries
(Unaudited)
| |
|
Preferred Stock |
|
|
Common Stock |
|
|
Capital |
|
|
Accumulated
Other
Comprehensive
|
|
|
Retained |
|
|
Total
Shareholders'
|
|
| (In thousands, except share and per share amounts) |
|
Shares |
|
|
Amount |
|
|
Shares |
|
|
Amount |
|
|
Surplus
|
|
|
(Loss) Income
|
|
|
Earnings
|
|
|
Equity
|
|
| Balance at December 31, 2024 |
|
|
6,900,000 |
|
|
$ |
166,993 |
|
|
|
183,527,575 |
|
|
$ |
458,819 |
|
|
$ |
2,742,913 |
|
|
$ |
(694,495 |
) |
|
$ |
2,895,453 |
|
|
$ |
5,569,683 |
|
| Net income |
|
|
— |
|
|
|
— |
|
|
|
— |
|
|
|
— |
|
|
|
— |
|
|
|
— |
|
|
|
133,222 |
|
|
|
133,222 |
|
| Other comprehensive income, net of tax |
|
|
— |
|
|
|
— |
|
|
|
— |
|
|
|
— |
|
|
|
— |
|
|
|
73,292 |
|
|
|
— |
|
|
|
73,292 |
|
| Equity based compensation, net of forfeitures and shares withheld to cover taxes |
|
|
— |
|
|
|
— |
|
|
|
519,724 |
|
|
|
1,299 |
|
|
|
(6,087 |
) |
|
|
— |
|
|
|
— |
|
|
|
(4,788 |
) |
| Repurchase of stock, net of excise tax |
|
|
— |
|
|
|
— |
|
|
|
(879 |
) |
|
|
(2 |
) |
|
|
(27 |
) |
|
|
— |
|
|
|
— |
|
|
|
(29 |
) |
| Preferred dividends declared, $0.34 per share |
|
|
— |
|
|
|
— |
|
|
|
— |
|
|
|
— |
|
|
|
— |
|
|
|
— |
|
|
|
(2,372 |
) |
|
|
(2,372 |
) |
| Cash dividends declared, $0.275 per share |
|
|
— |
|
|
|
— |
|
|
|
— |
|
|
|
— |
|
|
|
— |
|
|
|
— |
|
|
|
(50,467 |
) |
|
|
(50,467 |
) |
| Balance at March 31, 2025 |
|
|
6,900,000 |
|
|
$ |
166,993 |
|
|
|
184,046,420 |
|
|
$ |
460,116 |
|
|
$ |
2,736,799 |
|
|
$ |
(621,203 |
) |
|
$ |
2,975,836 |
|
|
$ |
5,718,541 |
|
| Net income |
|
|
— |
|
|
|
— |
|
|
|
— |
|
|
|
— |
|
|
|
— |
|
|
|
— |
|
|
|
134,645 |
|
|
|
134,645 |
|
| Other comprehensive income, net of tax |
|
|
— |
|
|
|
— |
|
|
|
— |
|
|
|
— |
|
|
|
— |
|
|
|
45,046 |
|
|
|
— |
|
|
|
45,046 |
|
| Equity based compensation, net of forfeitures and shares withheld to cover taxes |
|
|
— |
|
|
|
— |
|
|
|
32,255 |
|
|
|
82 |
|
|
|
8,937 |
|
|
|
— |
|
|
|
— |
|
|
|
9,019 |
|
| Repurchase of stock, net of excise tax |
|
|
— |
|
|
|
— |
|
|
|
(71,409 |
) |
|
|
(179 |
) |
|
|
(2,107 |
) |
|
|
— |
|
|
|
— |
|
|
|
(2,286 |
) |
| Issuance of stock in conjunction with acquisitions |
|
|
— |
|
|
|
— |
|
|
|
2,299,750 |
|
|
|
5,749 |
|
|
|
61,542 |
|
|
|
— |
|
|
|
— |
|
|
|
67,291 |
|
| Preferred dividends declared, $0.69 per share |
|
|
— |
|
|
|
— |
|
|
|
— |
|
|
|
— |
|
|
|
— |
|
|
|
— |
|
|
|
(4,744 |
) |
|
|
(4,744 |
) |
| Cash dividends declared, $0.275 per share |
|
|
— |
|
|
|
— |
|
|
|
— |
|
|
|
— |
|
|
|
— |
|
|
|
— |
|
|
|
(51,229 |
) |
|
|
(51,229 |
) |
| Balance at June 30, 2025 |
|
|
6,900,000 |
|
|
$ |
166,993 |
|
|
|
186,307,016 |
|
|
$ |
465,768 |
|
|
$ |
2,805,171 |
|
|
$ |
(576,157 |
) |
|
$ |
3,054,508 |
|
|
$ |
5,916,283 |
|
| Net income |
|
|
— |
|
|
|
— |
|
|
|
— |
|
|
|
— |
|
|
|
— |
|
|
|
— |
|
|
|
129,849 |
|
|
|
129,849 |
|
| Other comprehensive income, net of tax |
|
|
— |
|
|
|
— |
|
|
|
— |
|
|
|
— |
|
|
|
— |
|
|
|
82,375 |
|
|
|
— |
|
|
|
82,375 |
|
| Equity based compensation, net of forfeitures and shares withheld to cover taxes |
|
|
— |
|
|
|
— |
|
|
|
— |
|
|
|
— |
|
|
|
8,185 |
|
|
|
— |
|
|
|
— |
|
|
|
8,185 |
|
| Preferred dividends declared, $0.34 per share |
|
|
— |
|
|
|
— |
|
|
|
— |
|
|
|
— |
|
|
|
— |
|
|
|
— |
|
|
|
(2,372 |
) |
|
|
(2,372 |
) |
| Cash dividends declared, $0.275 per share |
|
|
— |
|
|
|
— |
|
|
|
— |
|
|
|
— |
|
|
|
— |
|
|
|
— |
|
|
|
(51,224 |
) |
|
|
(51,224 |
) |
| Balance at September 30, 2025 |
|
|
6,900,000 |
|
|
$ |
166,993 |
|
|
|
186,307,016 |
|
|
$ |
465,768 |
|
|
$ |
2,813,356 |
|
|
$ |
(493,782 |
) |
|
$ |
3,130,761 |
|
|
$ |
6,083,096 |
|
Consolidated Statements of Shareholders' Equity (continued)
Cadence Bank and Subsidiaries
(Unaudited)
| |
|
Preferred Stock |
|
|
Common Stock |
|
|
Capital |
|
|
Accumulated
Other
Comprehensive
|
|
|
Retained |
|
|
Total
Shareholders'
|
|
| (In thousands, except share and per share amounts) |
|
Shares |
|
|
Amount |
|
|
Shares |
|
|
Amount |
|
|
Surplus
|
|
|
(Loss) Income
|
|
|
Earnings
|
|
|
Equity
|
|
| Balance at December 31, 2023 |
|
|
6,900,000 |
|
|
$ |
166,993 |
|
|
|
182,871,775 |
|
|
$ |
457,179 |
|
|
$ |
2,743,066 |
|
|
$ |
(761,829 |
) |
|
$ |
2,562,434 |
|
|
$ |
5,167,843 |
|
| Net income |
|
|
— |
|
|
|
— |
|
|
|
— |
|
|
|
— |
|
|
|
— |
|
|
|
— |
|
|
|
116,978 |
|
|
|
116,978 |
|
| Other comprehensive loss, net of tax |
|
|
— |
|
|
|
— |
|
|
|
— |
|
|
|
— |
|
|
|
— |
|
|
|
(29,504 |
) |
|
|
— |
|
|
|
(29,504 |
) |
| Equity based compensation, net of forfeitures and shares withheld to cover taxes |
|
|
— |
|
|
|
— |
|
|
|
467,143 |
|
|
|
1,168 |
|
|
|
(3,231 |
) |
|
|
— |
|
|
|
— |
|
|
|
(2,063 |
) |
| Repurchase of stock, net of excise tax |
|
|
— |
|
|
|
— |
|
|
|
(657,593 |
) |
|
|
(1,644 |
) |
|
|
(15,248 |
) |
|
|
— |
|
|
|
— |
|
|
|
(16,892 |
) |
| Preferred dividends declared, $0.34 per share |
|
|
— |
|
|
|
— |
|
|
|
— |
|
|
|
— |
|
|
|
— |
|
|
|
— |
|
|
|
(2,372 |
) |
|
|
(2,372 |
) |
| Cash dividends declared, $0.25 per share |
|
|
— |
|
|
|
— |
|
|
|
— |
|
|
|
— |
|
|
|
— |
|
|
|
— |
|
|
|
(45,598 |
) |
|
|
(45,598 |
) |
| Cumulative effect of change in accounting principle, net of tax, for ASU 2023-02 |
|
|
— |
|
|
|
— |
|
|
|
— |
|
|
|
— |
|
|
|
— |
|
|
|
— |
|
|
|
1,540 |
|
|
|
1,540 |
|
| Balance at March 31, 2024 |
|
|
6,900,000 |
|
|
$ |
166,993 |
|
|
|
182,681,325 |
|
|
$ |
456,703 |
|
|
$ |
2,724,587 |
|
|
$ |
(791,333 |
) |
|
$ |
2,632,982 |
|
|
$ |
5,189,932 |
|
| Net income |
|
|
— |
|
|
|
— |
|
|
|
— |
|
|
|
— |
|
|
|
— |
|
|
|
— |
|
|
|
137,472 |
|
|
|
137,472 |
|
| Other comprehensive income, net of tax |
|
|
— |
|
|
|
— |
|
|
|
— |
|
|
|
— |
|
|
|
— |
|
|
|
8,871 |
|
|
|
— |
|
|
|
8,871 |
|
| Equity based compensation, net of forfeitures and shares withheld to cover taxes |
|
|
— |
|
|
|
— |
|
|
|
84,153 |
|
|
|
211 |
|
|
|
8,486 |
|
|
|
— |
|
|
|
— |
|
|
|
8,697 |
|
| Repurchase of stock, net of excise tax |
|
|
— |
|
|
|
— |
|
|
|
(335,051 |
) |
|
|
(838 |
) |
|
|
(8,417 |
) |
|
|
— |
|
|
|
— |
|
|
|
(9,255 |
) |
| Preferred dividends declared, $0.34 per share |
|
|
— |
|
|
|
— |
|
|
|
— |
|
|
|
— |
|
|
|
— |
|
|
|
— |
|
|
|
(2,372 |
) |
|
|
(2,372 |
) |
| Cash dividends declared, $0.25 per share |
|
|
— |
|
|
|
— |
|
|
|
— |
|
|
|
— |
|
|
|
— |
|
|
|
— |
|
|
|
(45,587 |
) |
|
|
(45,587 |
) |
| Balance at June 30, 2024 |
|
|
6,900,000 |
|
|
$ |
166,993 |
|
|
|
182,430,427 |
|
|
$ |
456,076 |
|
|
$ |
2,724,656 |
|
|
$ |
(782,462 |
) |
|
$ |
2,722,495 |
|
|
$ |
5,287,758 |
|
| Net income |
|
|
— |
|
|
|
— |
|
|
|
— |
|
|
|
— |
|
|
|
— |
|
|
|
— |
|
|
|
136,439 |
|
|
|
136,439 |
|
| Other comprehensive income, net of tax |
|
|
— |
|
|
|
— |
|
|
|
— |
|
|
|
— |
|
|
|
— |
|
|
|
192,120 |
|
|
|
— |
|
|
|
192,120 |
|
| Equity based compensation, net of forfeitures and shares withheld to cover taxes |
|
|
— |
|
|
|
— |
|
|
|
1,281 |
|
|
|
3 |
|
|
|
8,075 |
|
|
|
— |
|
|
|
— |
|
|
|
8,078 |
|
| Exercise of stock options |
|
|
— |
|
|
|
— |
|
|
|
206,829 |
|
|
|
517 |
|
|
|
5,210 |
|
|
|
— |
|
|
|
— |
|
|
|
5,727 |
|
| Repurchase of stock, net of excise tax |
|
|
— |
|
|
|
— |
|
|
|
(323,395 |
) |
|
|
(808 |
) |
|
|
(8,501 |
) |
|
|
— |
|
|
|
— |
|
|
|
(9,309 |
) |
| Preferred dividends declared, $0.34 per share |
|
|
— |
|
|
|
— |
|
|
|
— |
|
|
|
— |
|
|
|
— |
|
|
|
— |
|
|
|
(2,372 |
) |
|
|
(2,372 |
) |
| Cash dividends declared, $0.25 per share |
|
|
— |
|
|
|
— |
|
|
|
— |
|
|
|
— |
|
|
|
— |
|
|
|
— |
|
|
|
(45,578 |
) |
|
|
(45,578 |
) |
| Balance at September 30, 2024 |
|
|
6,900,000 |
|
|
$ |
166,993 |
|
|
|
182,315,142 |
|
|
$ |
455,788 |
|
|
$ |
2,729,440 |
|
|
$ |
(590,342 |
) |
|
$ |
2,810,984 |
|
|
$ |
5,572,863 |
|
See accompanying notes to the unaudited consolidated financial statements.
Consolidated Statements of Cash Flows
Cadence Bank and Subsidiaries
(Unaudited)
| |
|
Nine Months Ended September 30, |
|
| (In thousands) |
|
2025 |
|
|
2024 |
|
| Operating Activities: |
| Net income |
|
$ |
397,716 |
|
|
$
|
390,889 |
|
| Adjustments to reconcile net income to net cash provided by operations: |
| Depreciation, amortization, and accretion |
|
|
69,288 |
|
|
|
157,180 |
|
| Deferred income tax expense |
|
|
130,746 |
|
|
|
13,859 |
|
| Provision for credit losses |
|
|
83,000 |
|
|
|
56,000 |
|
| Gain on sale of loans, net |
|
|
(21,276 |
) |
|
|
(16,262 |
) |
| Gain on disposition of businesses |
|
|
— |
|
|
|
(14,980 |
) |
| (Gain) loss on sales of available for sale securities, net |
|
|
(4,302 |
) |
|
|
2,960 |
|
| Unrealized gain on limited partnerships, net |
|
|
(8,026 |
) |
|
|
(8,664 |
) |
| Gain on trading securities |
|
|
(45 |
) |
|
|
(10 |
) |
| Share-based compensation expense |
|
|
23,192 |
|
|
|
25,490 |
|
| Proceeds from payments and sales of loans held for sale |
|
|
1,075,381 |
|
|
|
899,810 |
|
| Origination of loans held for sale |
|
|
(1,036,194 |
) |
|
|
(893,394 |
) |
| Increase in accrued interest receivable |
|
|
(19,721 |
) |
|
|
(10,389 |
) |
| Increase in accrued interest payable |
|
|
36,343 |
|
|
|
140,839 |
|
| Purchases of trading securities |
|
|
(18,000 |
) |
|
|
(4,000 |
) |
| Proceeds from sales of trading securities |
|
|
18,045 |
|
|
|
4,010 |
|
| Net increase in prepaid pension asset |
|
|
(3,655 |
) |
|
|
(4,337 |
) |
| (Increase) decrease in other assets |
|
|
(131,300 |
) |
|
|
43,950 |
|
| (Decrease) increase in other liabilities |
|
|
(45,897 |
) |
|
|
29,938 |
|
| Other, net |
|
|
(18,976 |
) |
|
|
(14,365 |
) |
| Net cash provided by operating activities |
|
|
526,319 |
|
|
|
798,524 |
|
| Investing Activities: |
| Net cash received from business acquisitions |
|
|
503,838 |
|
|
|
— |
|
| Proceeds from disposition of business, net of cash transferred |
|
|
— |
|
|
|
15,308 |
|
| Purchases of available for sale securities |
|
|
(3,627,434 |
) |
|
|
(751,846 |
) |
| Proceeds from sales of available for sale securities |
|
|
3,070,117 |
|
|
|
15,059 |
|
| Proceeds from maturities, calls, and payments of available for sale securities |
|
|
1,002,993 |
|
|
|
1,168,339 |
|
| Loss on fair value hedge termination |
|
|
4,290 |
|
|
|
— |
|
| (Purchases of) proceeds from sales of FRB and FHLB stock, net |
|
|
(118,831 |
) |
|
|
3,078 |
|
| Increase in loans, net |
|
|
(1,728,241 |
) |
|
|
(979,536 |
) |
| Purchases of premises and equipment |
|
|
(54,904 |
) |
|
|
(58,253 |
) |
| Proceeds from sales of premises and equipment |
|
|
4,524 |
|
|
|
16,995 |
|
| Proceeds from disposition of foreclosed and repossessed property |
|
|
10,180 |
|
|
|
6,626 |
|
| Proceeds from sales of loans transferred to held for sale |
|
|
— |
|
|
|
58,253 |
|
| Net death benefits received on bank owned life insurance |
|
|
13,603 |
|
|
|
3,014 |
|
| Purchases of tax credit investments |
|
|
(92,237 |
) |
|
|
(50,156 |
) |
| Purchases of limited partnership interests |
|
|
(22,839 |
) |
|
|
(22,236 |
) |
| Other, net |
|
|
8,795 |
|
|
|
10,850 |
|
| Net cash used in investing activities |
|
|
(1,026,146 |
) |
|
|
(564,505 |
) |
Consolidated Statements of Cash Flows (continued)
Cadence Bank and Subsidiaries
(Unaudited)
| |
|
Nine Months Ended September 30, |
|
| (In thousands) |
|
2025 |
|
|
2024 |
|
| Financing Activities: |
| (Decrease) increase in deposits, net |
|
|
(1,406,796 |
) |
|
|
347,455 |
|
Net change in securities sold under agreement to repurchase and federal funds
purchased |
|
|
5,916 |
|
|
|
(434,552 |
) |
| Net change in short-term FHLB advances |
|
|
825,000 |
|
|
|
— |
|
| Long-term borrowings called, repurchased, or repaid |
|
|
(22,330 |
) |
|
|
(207,364 |
) |
| Repayment of long-term FHLB advances |
|
|
(39 |
) |
|
|
— |
|
| Proceeds from long-term FHLB advances |
|
|
1,430,000 |
|
|
|
— |
|
| Exercise of stock options |
|
|
— |
|
|
|
5,727 |
|
| Repurchase of common stock |
|
|
(2,315 |
) |
|
|
(35,456 |
) |
| Cash dividends paid on common stock |
|
|
(152,972 |
) |
|
|
(136,764 |
) |
| Cash dividends paid on preferred stock |
|
|
(9,488 |
) |
|
|
(7,116 |
) |
| Cash paid for tax withholding on vested share-based compensation and other |
|
|
(9,552 |
) |
|
|
(10,088 |
) |
| Net cash provided by (used in) financing activities |
|
|
657,424 |
|
|
|
(478,158 |
) |
| Net increase (decrease) in cash and cash equivalents |
|
|
157,597 |
|
|
|
(244,139 |
) |
| Cash and cash equivalents at beginning of period |
|
|
1,731,576 |
|
|
|
4,232,265 |
|
| Cash and cash equivalents at end of period |
|
$ |
1,889,173 |
|
|
$ |
3,988,126 |
|
| |
|
|
|
|
|
|
|
|
| Supplemental Disclosures |
| Cash paid during the period for: |
| Interest |
|
$ |
715,146 |
|
|
$
|
714,514 |
|
| Income tax payments, net |
|
|
28,155 |
|
|
|
112,425 |
|
| Cash paid for amounts included in lease liabilities |
|
|
13,679 |
|
|
|
13,345 |
|
| Non-cash investing and financing activities, at fair value: |
| Acquisition of real estate and other assets in settlement of loans |
|
|
20,135 |
|
|
|
5,813 |
|
| Transfers of loans held for sale to loans |
|
|
7,590 |
|
|
|
5,802 |
|
| Transfers of loans to loans held for sale |
|
|
38,038 |
|
|
|
60,974 |
|
| Right of use assets obtained in exchange for new operating lease liabilities |
|
|
8,845 |
|
|
|
6,542 |
|
| Increase in funding obligations for certain tax credit investments |
|
|
96,784 |
|
|
|
26,455 |
|
See accompanying notes to unaudited consolidated financial statements.
Notes to Unaudited Consolidated Financial Statements
Cadence Bank and Subsidiaries
NOTE 1. SUMMARY OF SIGNIFICANT ACCOUNTING POLICIES
Basis of Presentation and Consolidation
The accompanying unaudited consolidated financial statements for the Company have been prepared in accordance with instructions to the SEC Form
10-Q and Article 10 of Regulation S-X; therefore, they do not include all information and notes necessary for a fair presentation of financial position, results of operations, comprehensive income, and cash flows in conformity with GAAP. All
adjustments consisting of normally recurring accruals that, in the opinion of management, are necessary for a fair presentation of the consolidated financial position and results of operations for the periods covered by this report have been included.
These interim financial statements should be read in conjunction with our Annual Report on Form 10-K for the year ended December 31, 2024. Operating results for the period ended September 30, 2025, are not necessarily indicative of the results that may
be expected for the year ending December 31, 2025. The consolidated balance sheet at December 31, 2024 has been derived from the audited financial statements included in our Form 10-K for the year ended December 31, 2024.
The Company and its subsidiaries follow GAAP, including, where applicable, general practices within the banking industry. The consolidated
financial statements include the accounts of the Company and its subsidiaries. Significant intercompany accounts and transactions have been eliminated in consolidation. The assessment of whether or not the Company has a controlling interest (i.e., the
primary beneficiary) in a VIE is performed on an on-going basis. All equity investments in non-consolidated VIEs are included in “other assets” in the Company’s consolidated balance sheets (see Note 17 for more information).
Certain amounts reported in prior years have been reclassified to conform to the 2025 presentation. These reclassifications did not materially
impact the Company’s consolidated financial statements.
In accordance with GAAP, the Company’s management evaluated subsequent events for potential recognition or disclosure in the consolidated
financial statements through the date of the issuance of the consolidated financial statements (See Note 18 for more information).
Recent Accounting Pronouncements
ASU No. 2023-05
In August 2023, the FASB issued ASU No. 2023-05, Business Combinations—Joint Venture Formations (Subtopic 805-60): Recognition and Initial
Measurement. The ASU applies to the formation of entities that meet the definition of a joint venture (or a corporate joint venture) as defined in the FASB ASC Master Glossary. The amendments in the ASU require that a newly formed joint venture,
upon formation, would initially measure its assets and liabilities at fair value (with exceptions to fair value measurement that are consistent with the business combinations guidance). The ASU allows a joint venture to apply measurement period
guidance in accordance with ASC 805-10, allowing the amounts recognized upon formation to be adjusted for provisional items during the measurement period not to exceed one year from the formation date.
The ASU does not amend the definition of a joint venture, the existing guidance for the accounting by an equity method investor for its investment
in a joint venture, or the accounting by a joint venture for contributions received subsequent to formation.
The amendments are effective prospectively for all joint ventures with a formation date on or after January 1, 2025, and early adoption is
permitted. A joint venture that was formed before the effective date of the ASU may elect to apply the amendments retrospectively if it has sufficient information. There was no impact from this guidance on the Company’s consolidated financial
statements.
ASU No. 2023-08
In December 2023, the FASB issued ASU No. 2023-08, Intangibles—Goodwill and Other—Crypto Assets (Subtopic 350-60): Accounting for and
Disclosure of Crypto Assets. The amendments are intended to improve the accounting for certain crypto assets by requiring an entity to measure those crypto assets at fair value each reporting period with changes in fair value recognized in net
income. The amendments also improve the information provided to investors about an entity’s crypto asset holdings by requiring disclosure about significant holdings, contractual sale restrictions, and changes during the reporting period.
The amendments in the ASU are effective for fiscal years beginning after December 15, 2024, including interim periods within those fiscal years.
Early adoption is permitted for both interim and annual financial statements that have not yet been issued (or made available for issuance). If amendments are adopted in an interim period, they must be adopted as of the beginning of the fiscal year
that includes that interim period. There was no impact from this guidance on the Company’s consolidated financial statements.
ASU No. 2023-09
In December 2023, the FASB issued ASU No. 2023-09, Income Taxes (Topic 740): Improvements to Income Tax Disclosures. The ASU is intended
to improve the transparency of income tax disclosures by requiring (1) consistent categories and greater disaggregation of information in the rate reconciliation and (2) income taxes paid disaggregated by jurisdiction. It also includes certain other
amendments intended to improve the effectiveness of income tax disclosures.
The amendments in the ASU are effective for annual periods beginning after December 15, 2024. Early adoption is permitted for annual financial
statements that have not yet been issued or made available for issuance. As this guidance is solely disclosure related, there will be no quantitative impact to the Company’s consolidated financial statements.
ASU No. 2024-01
In March 2024, the FASB issued ASU No. 2024-01, Compensation—Stock Compensation (Topic 718): Scope Application of Profits Interest and Similar
Awards, which provides four cases illustrating the scope application of Topic 718 for profits interest awards. Determining whether a profits interest award should be accounted for as a share-based payment arrangement or other compensation
requires judgment based on the facts and circumstances of the specific transaction. The illustrative example includes four fact patterns to demonstrate how an entity would apply the scope guidance in Topic 718 to determine whether profits interest
awards should be accounted for in accordance with Topic 718.
The amendments in the ASU are effective for annual periods beginning after December 15, 2024, and interim periods within those annual periods.
Early adoption is permitted for both interim and annual financial statements that have not yet been issued or made available for issuance. The amendments should be applied either (1) retrospectively to all prior periods presented in the financial
statements or (2) prospectively to profits, interest, and similar awards grated or modified on or after the date at which the entity first applies the amendments. There was no impact from this guidance on the Company’s consolidated financial
statements.
ASU No. 2024-02
In March 2024, the FASB issued ASU No. 2024-02, Codification Improvements—Amendments to Remove References to the Concepts Statements,
which contains amendments that remove references to various Concepts Statements. In most instances, the references are extraneous and not required to understand or apply the guidance. In other instances, the references were used in prior Statements to
provide guidance in certain topical areas. Generally, the amendments are not intended to result in significant accounting change for most entities. However, the FASB recognized that changes to that guidance may result in accounting change for some
entities. Therefore, the FASB provided transition guidance for all the amendments in this Update.
These amendments are effective for public business entities for fiscal years beginning after December 15, 2024. Early application of the
amendments is permitted for all entities, for any fiscal year or interim period for which financial statements have not yet been issued (or made available for issuance). If an entity adopts the amendments in an interim period, it must adopt them as of
the beginning of the fiscal year that includes that interim period. There was no significant impact from this guidance on the Company’s consolidated financial statements.
ASU No. 2025-02
In March 2025, the FASB issued ASU No. 2025-02, Liabilities (Topic 405): Amendments to SEC Paragraphs Pursuant to SEC Staff Accounting
Bulletin No. 122 to remove SEC paragraphs pursuant to the issuance of the SEC Staff Accounting Bulletin No. 122, Accounting for Obligations To Safeguard Crypto-Assets an Entity Holds for Its Platform Users. The amendments are effective
immediately. There was no impact from this guidance on the Company’s consolidated financial statements.
Pending Accounting Pronouncements
ASU No. 2023-06
In October 2023, the FASB issued ASU No. 2023-06, Disclosure Improvements: Codification Amendments in Response to the SEC’s Disclosure Update
and Simplification Initiative, that incorporates certain SEC disclosure requirements into the FASB ASC. The amendments in the ASU are expected to clarify or improve disclosure and presentation requirements of a variety of Codification Topics,
allow users to more easily compare entities subject to the SEC’s existing disclosures with those entities that were not previously subject to the requirements, and align the requirements in the Codification with the SEC’s regulations.
The ASU modifies the disclosure or presentation requirements of a variety of Topics in the Codification. The requirements are relatively narrow in
nature. Some of the amendments represent clarifications to, or technical corrections of, the current requirements.
The effective date for each amendment will be the date on which the SEC removes that related disclosure from its rules. If by June 30, 2027, the
SEC has not removed the related disclosure from its regulations, the amendments will be removed from the Codification and not become effective for any entity. As this guidance is solely disclosure related, the Company does not anticipate any
quantitative impact to the Company’s consolidated financial statements.
ASU No. 2024-03
In November 2024, the FASB issued ASU No. 2024-03, Income Statement—Reporting Comprehensive Income— Expense Disaggregation Disclosures
(Subtopic 220-40): Disaggregation of Income Statement Expenses, which requires disclosures in the note to the financial statements regarding specific expenses. The amendments do not change or remove existing disclosure requirements. The
amendments improve disclosure requirements through enhanced expense disaggregation.
The amendments require disclosures in each interim and annual reporting periods. The amendments are effective for fiscal year beginning after
December 15, 2026, and interim reporting periods beginning after December 15, 2027. Prospective adoption is required, however an entity may choose to adopt retrospectively. Early adoption is permitted. As this guidance is solely disclosure related, the
Company does not anticipate any quantitative impact to the Company’s consolidated financial statements.
ASU No. 2024-04
In November 2024, the FASB issued ASU No. 2024-04, Debt—Debt with Conversion and Other Options (Subtopic 470-20): Induced Conversions of
Convertible Debt Instruments, which clarifies requirements for determining whether certain settlements of convertible debt instruments, including convertible debt instruments with cash conversion features or convertible debt instruments that are
not currently convertible, should be accounted for as an induced conversion.
The amendments are effective for all entities for fiscal years beginning after December 15, 2025. Early adoption is permitted as of the beginning
of the annual reporting period for all entities that have adopted ASU 2020-06. If an entity adopts ASU No. 2024-04 in an interim reporting period, it should adopt it as of the beginning of the annual reporting period that includes that interim
reporting period. The Company does not anticipate any impact from this guidance on its consolidated financial statements.
ASU No. 2025-01
In January 2025, the FASB issued ASU No. 2025-01, Income Statement—Reporting Comprehensive Income—Expense Disaggregation Disclosures (Subtopic
220-40): Clarifying the Effective Date to clarify the interim effective date for ASU 2024-03 for entities that do not have an annual reporting period that ends on December 31. The amendments are effective for fiscal year beginning after December
15, 2026, and interim reporting periods beginning after December 15, 2027. Since Company’s fiscal year-end and the calendar year-end are the same, the Company does not anticipate that these amendments will have any effect on Company’s consolidated
financial statements.
ASU No. 2025-03
In May, the FASB issued ASU No. 2025-03, Business Combinations (Topic 805) and Consolidation (Topic 810): Determining the Accounting Acquirer
in the Acquisition of a Variable Interest Entity to clarify the guidance to determine the accounting acquirer for transactions in which the legal acquiree is a VIE that meets the definition of a business. The amendments are effective for fiscal
years beginning after December 15, 2026. Early adoption is permitted in reporting periods in which financial statements have not been issued. If the amendment are adopted in an interim period, they should be adopted as of the beginning the interim
period or annual period. The amendments should be applied on a prospective basis to transactions whose closing dates occurs after adoption of the amendments. The Company does not anticipate that these amendments will have any effect on Company’s
consolidated financial statements.
ASU No. 2025-04
In May, the FASB issued ASU No. 2025-04, Compensation—Stock Compensation (Topic 718) and Revenue from Contracts with Customers (Topic 606):
Clarifications to Share-Based Consideration Payable to a Customer to clarify the timing to recognize revenue for entities that offer share-based consideration to customers to incentivize the customers to purchase its goods or services. The
amendments are effective for the fiscal period beginning after December 15, 2026, and interim reporting periods within those annual periods. Early adoption is permitted in an interim or annual period in which financial statements have not yet been
issued. If an entity adopts the amendments in an interim reporting period, it should adopt it as of the beginning of the annual period that includes that interim reporting period. The Company does not anticipate that these amendments will have any
effect on Company’s consolidated financial statements.
ASU No. 2025-05
In July, FASB issued ASU No. 2025-05, Financial Instruments—Credit Losses (Topic 326): Measurement of Credit Losses for Accounts Receivable
and Contract Assets which provides a practical expedient for estimating credit losses on certain assets and a policy election for entities other than public entities who adopt the practical expedient. The practical expedient allows all entities
to assume that current conditions as of the balance sheet date will persist through the reasonable and supportable forecast period for eligible assets. The amendments are effective for the fiscal period beginning after December 15, 2025, and interim
reporting periods within those annual periods. Early adoption is permitted. An entity should apply the amendments prospectively to estimates of expected credit losses on asset balances after the date of adoption. The Company does not anticipate that
these amendments will have a material effect on Company’s consolidated financial statements.
ASU No. 2025-06
In September, FASB issued ASU No. 2025-06, Intangibles—Goodwill and Other— Internal-Use Software (Subtopic 350-40): Targeted Improvements to
the Accounting for Internal-Use Software to improve the usefulness of the guidance by removing references to project stages so that the guidance is neutral to various software development methods. The ASU requires that an entity should capitalize
software costs when both: Management has authorized and committed to funding the software project; and it is probable that the project will be completed and the software will be used to perform the function intended (referred to as the
“probable-to-complete recognition threshold”). In evaluating the probable-to-complete recognition threshold, an entity is required to consider whether there is significant uncertainty associated with the development activities of the software.
The amendments are effective for all entities for fiscal periods beginning after December 15, 2027. Early adoption is permitted as of the
beginning of an annual fiscal period. Transition can be done using the prospective method, the modified transition approach or retrospectively. The Company is still evaluating the effects on the Company’s consolidated financial statements.
ASU No. 2025-07
In September, FASB issued ASU No. 2025-07, Derivatives and Hedging (Topic 815) and Revenue from Contracts with Customers (Topic 606):
Derivatives Scope Refinements and Scope Clarification for Share-Based Noncash Consideration from a Customer in a Revenue Contract to clarify two issues in ASC 815 and ASC 606. In the first issue clarified, the ASU provides a scope exception for
certain contracts with underlyings that are based on the operations or activities of one of the parties to the contract. The second issue clarified is the applicability of ASC Topic 606 and its interaction with other ASC Topics in the accounting for
share-based noncash consideration received from a customer for the transfer of goods or services.
This amendments are effective for fiscal beginning after December 15, 2026. Early adoption is permitted. The Company does not anticipate that
these amendments will have any effect on Company’s consolidated financial statements.
NOTE 2. BUSINESS COMBINATIONS
FCB Financial Corp.
On May 1, 2025, the Company completed its acquisition of FCB Financial Corp. (“FCB Financial”), the bank holding company for FCB (collectively
referred to as “First Chatham”), pursuant to an Agreement and Plan of Merger dated January 22, 2025 by and between the Company and FCB Financial (the “FCB Merger Agreement”). Upon the completion of the merger of FCB Financial with and into the Company,
FCB, FCB Financials’ wholly-owned banking subsidiary, was merged with and into the Company. First Chatham was a Savannah, Georgia-based community bank operating eight branches across the Greater Savannah Area. Under the terms of the FCB Merger
Agreement, the Company issued 2.3 million shares of common stock and paid $23.1 million in cash for all outstanding shares of First Chatham. The purchase price allocation and certain fair value measurements, as well as the evaluation of the tax
positions of the merger, are currently under management’s review and are subject to potential changes.
The following table presents the amounts recorded on the consolidated balance sheet on the acquisition date of May 1, 2025 for First Chatham,
showing the estimated fair value as adjusted during the measurement period (in thousands):
| Fair Value of Assets Acquired: |
|
|
|
| Cash and cash equivalents |
|
$ |
142,506 |
|
| Available for sale securities |
|
|
45,603 |
|
| Loans and leases |
|
|
382,608 |
|
| Allowance for credit losses |
|
|
(8,075 |
) |
| Premises and equipment |
|
|
13,741 |
|
| Other intangible assets, net |
|
|
12,338 |
|
| Other assets |
|
|
24,068 |
|
| Total Fair Value of Assets Acquired |
|
$ |
612,789 |
|
| Fair Value of Liabilities Assumed: |
|
|
|
|
| Deposits |
|
$ |
523,595 |
|
| Junior subordinated debt |
|
|
12,330 |
|
| Other liabilities |
|
|
9,165 |
|
| Total Fair Value of Liabilities Assumed |
|
$ |
545,090 |
|
| Fair Value of Net Assets Acquired |
|
$ |
67,699 |
|
| Consideration Paid: |
|
|
|
|
| Market value of common stock |
|
|
67,291 |
|
| Total cash paid |
|
|
23,109 |
|
| Total Consideration Paid |
|
$ |
90,400 |
|
| Goodwill |
|
$ |
22,701 |
|
Industry Bancshares, Inc.
On July 1, 2025, the Company completed its acquisition of IBS, the bank holding company for Bank of Brenham, Citizens State Bank, Fayetteville
Bank, Industry State Bank, The First National Bank of Bellville and The First National Bank of Shiner (collectively, the “Industry Banks”), pursuant to an Agreement and Plan of Merger (the “IBS Merger Agreement”) dated April 25, 2025. Under the terms
of the IBS Merger Agreement, IBS and the Industry Banks were merged with and into the Company with the Company being the surviving entity. The Company paid $20 million in cash for all outstanding shares of IBS. The purchase price allocation and certain
fair value measurements, as well as the evaluation of the tax positions of the merger, are under management’s review due to the timing of the closing of the mergers.
During the third quarter of 2025, the $2.5 billion of securities acquired in the IBS transaction were sold, with the proceeds redeployed to
purchase securities with higher average earning yields and the remainder deployed to paydown wholesale funding. The Company incurred losses of $4.3 million on the termination of fair value hedges related to the IBS securities portfolio, which was
reported in other noninterest revenue in the consolidated statements of income. This loss was offset by the $4.3 million related net gain on securities sales, which is shown separately in the consolidated statements of income.
The following table presents the amounts recorded on the consolidated balance sheet on the acquisition date of July 1, 2025 for IBS, showing the
estimated fair value as adjusted during the measurement period (in thousands):
| Fair Value of Assets Acquired: |
|
|
|
| Cash and cash equivalents |
|
$ |
404,441 |
|
| Available for sale securities |
|
|
2,467,885 |
|
| Loans and leases |
|
|
1,025,783 |
|
| Allowance for credit losses |
|
|
(15,149 |
) |
| Premises and equipment |
|
|
52,038 |
|
| Other intangible assets, net |
|
|
68,764 |
|
| Other assets |
|
|
251,571 |
|
| Total Fair Value of Assets Acquired |
|
$ |
4,255,333 |
|
| Fair Value of Liabilities Assumed: |
|
|
|
|
| Deposits |
|
$ |
4,307,490 |
|
| Other liabilities |
|
|
53,990 |
|
| Total Fair Value of Liabilities Assumed |
|
|
4,361,480 |
|
| Fair Value of Net Liabilities Assumed |
|
|
(106,147 |
) |
| Cash Consideration Paid |
|
|
20,000 |
|
| Goodwill |
|
$ |
126,147 |
|
The following is a description of the methods used to estimate the fair values of significant assets acquired and liabilities assumed above.
Cash and cash equivalents: The carrying amount of these assets is a reasonable estimate of fair value based on the short-term nature of
these assets.
Securities available for sale: Fair values for securities were based on sales prices of the securities shortly after the merger’s close
date.
Loans: Fair values for loans were estimated based on a discounted cash flow methodology (income approach) that considered factors including
loan type and related collateral, classification status, remaining term of the loan (in months), fixed or variable interest rate, past delinquencies, timing of principal and interest payments, current market rates, LTV, and current discount rates. The
discount rate did not include an explicit factor for credit losses, as it was included as a reduction to the estimated cash flows. Large loans were specifically reviewed to evaluate credit risk. Additionally, PCD loans that were determined to have
more-than-insignificant deterioration were generally identified by the delinquency status, risk rating changes, credit rating, accruing status or other indicators of credit deterioration since origination. Loans were valued individually although
multiple inputs and assumptions were applied to loans with similar characteristics as appropriate. These factors resulted in an $8.9 million and $27.6 million fair value net discount to loans for First Chatham and IBS, respectively, which will be
accreted over the remaining life of each loan. The book value of the acquired loans was $387.3 million and $1.1 billion for First Chatham and IBS, respectively.
Allowance for Credit Losses: ACL of $8.1 million and $15.1 million was recorded on the identified PCD loans in accordance with ASC 326 for
First Chatham and IBS, respectively. An ACL of $4.2 million was recorded on non-PCD loans and reported as provision expense during the three months ended June 30, 2025 for First Chatham. An ACL of $5.5 million was recorded on non-PCD loans and reported
as provision expense during the three months ended September 30, 2025 for IBS.
While there were significant similarities in the application of ASC 326 by the Company, First Chatham and IBS, steps were taken by management to
align the First Chatham and IBS processes to ensure that the ACL reported at the time of the First Chatham and IBS mergers in the tables above and in all subsequent reporting periods is consistent with the ACL policies as outlined in Note 1 – Summary
of Significant Accounting Policies to the consolidated financial statements of the Annual Report on Form 10-K for the year ended December 31, 2024, and Note 5 – Allowance for Credit Losses. These steps included conforming certain First Chatham and IBS
assumptions (e.g., the reasonable and supportable forecast of future economic conditions and the reasonable and supportable forecast period, among others) to that of the Company.
Intangible assets: Core deposit intangible asset represents the value of the relationships with deposit clients. The fair value for the
core deposit intangible asset was estimated based on a discounted cash flow methodology that gave appropriate consideration to expected client attrition rates, net maintenance cost of the deposit base, alternative costs of funds, and the interest costs
associated with the client deposits. The core deposit intangible asset is being amortized over its estimated useful life of approximately ten years utilizing an accelerated method.
ROU Assets and Lease Liabilities: ROU assets and lease liabilities were measured using a methodology that involved estimating the future
rental payments over the remaining lease term with discounting using a fully-collateralized discount rate. The lease term was determined for individual leases based on management’s assessment of the probability of exercising existing renewal options.
Adjustments for any off-market terms in a lease were also discounted and applied to the balance of the lease asset.
Premises: Land and buildings held for use were valued at appraised values, which reflect considerations of recent disposition values for
similar property types with adjustments for characteristics of individual properties.
Deposits: The fair values used for the demand and savings deposits by definition equal the amount payable on demand at the acquisition
date. Fair values for time deposits were estimated using a discounted cash flow analysis applying the prevailing market interest rates currently offered to the contractual interest rates on such time deposits.
Borrowings: The fair value of the junior subordinated debentures acquired from First Chatham were estimated using a discounted cash flow
calculation. The valuation took into consideration comparable market rates and management’s execution of the call option in the first available period. The finalization of these analyses through the measurement period is not expected to significantly
impact the income statement.
The following table presents certain unaudited pro forma information for the results of operations for the nine months ended September 30, 2024
and 2025, as if First Chatham and IBS had been acquired on January 1, 2024. The pro forma results combine the historical results of First Chatham and IBS into the Company’s consolidated income statements including the impact of certain acquisition
accounting adjustments including loan discount accretion, investment securities discount and premium accretion, intangible assets amortization and deposit premium accretion. The pro forma results have been prepared for comparative purposes only and are
not necessarily indicative of what would have occurred had the acquisition taken place on January 1, 2024. No assumptions have been applied to the pro forma results of operations regarding possible revenue enhancements, provision for credit losses,
expense efficiencies or asset dispositions.
| |
|
Nine Months Ended September 30, |
|
| |
|
2025 |
|
|
2024 |
|
| (In thousands) |
|
Pro Forma |
|
|
Pro Forma |
|
| Total revenues (net interest income and noninterest income) |
|
$ |
1,495,283 |
|
|
$ |
1,434,552 |
|
| Net income |
|
$ |
384,615 |
|
|
$ |
385,938 |
|
Revenues and earnings of the acquired companies since the acquisition date have not been disclosed as it is not practicable since First Chatham
and IBS were merged into the Company and separate financial information is not available nor considered material.
FCB and IBS merger-related expenses of $8.9 million and $22.3 million, respectively, incurred during 2025 are recorded in the consolidated income
statement and include costs incurred to complete the acquisitions, as well as incremental costs related to the closing of the transactions, including legal, accounting and auditing, investment banker fees, certain employment related costs, travel,
printing, supplies, and other costs.
NOTE 3. AVAILABLE FOR SALE SECURITIES AND EQUITY SECURITIES
The amortized cost, unrealized gains and losses, and estimated fair value of AFS securities are presented in the following tables:
| (In thousands) |
|
Amortized
Cost |
|
|
Gross
Unrealized
Gains |
|
|
Gross
Unrealized
Losses
|
|
|
Estimated
Fair
Value |
|
| September 30, 2025 |
|
|
|
|
|
|
|
|
|
|
|
|
|
|
|
|
| U.S. government agency securities |
|
$ |
285,438 |
|
|
$ |
14 |
|
|
$ |
30,774 |
|
|
$ |
254,678 |
|
| MBS issued or guaranteed by U.S. agencies |
|
|
|
|
|
|
|
|
|
|
|
|
|
|
|
|
| Residential pass-through: |
|
|
|
|
|
|
|
|
|
|
|
|
|
|
|
|
| Guaranteed by GNMA |
|
|
72,784 |
|
|
|
19 |
|
|
|
9,047 |
|
|
|
63,756 |
|
| Issued by FNMA and FHLMC |
|
|
5,321,884 |
|
|
|
8,398 |
|
|
|
467,146 |
|
|
|
4,863,136 |
|
| Other residential MBS |
|
|
2,746,343 |
|
|
|
21,281 |
|
|
|
24,925 |
|
|
|
2,742,699 |
|
| Commercial MBS |
|
|
1,523,630 |
|
|
|
3,062 |
|
|
|
59,814 |
|
|
|
1,466,878 |
|
| Total MBS |
|
|
9,664,641 |
|
|
|
32,760 |
|
|
|
560,932 |
|
|
|
9,136,469 |
|
| Obligations of states and political subdivisions |
|
|
156,387 |
|
|
|
11 |
|
|
|
30,920 |
|
|
|
125,478 |
|
| Corporate debt securities |
|
|
33,000 |
|
|
|
— |
|
|
|
3,297 |
|
|
|
29,703 |
|
| Foreign debt securities |
|
|
70,031 |
|
|
|
44 |
|
|
|
14 |
|
|
|
70,061 |
|
| Total available for sale securities |
|
$ |
10,209,497 |
|
|
$ |
32,829 |
|
|
$ |
625,937 |
|
|
$ |
9,616,389 |
|
| (In thousands) |
|
Amortized
Cost |
|
|
Gross
Unrealized
Gains |
|
|
Gross
Unrealized
Losses |
|
|
Estimated
Fair
Value |
|
| December 31, 2024 |
|
|
|
|
|
|
|
|
|
|
|
|
|
|
|
|
| U.S. government agency securities |
|
$ |
321,454 |
|
|
$ |
20 |
|
|
$ |
40,243 |
|
|
$ |
281,231 |
|
| MBS issued or guaranteed by U.S. agencies |
|
|
|
|
|
|
|
|
|
|
|
|
|
|
|
|
| Residential pass-through: |
|
|
|
|
|
|
|
|
|
|
|
|
|
|
|
|
| Guaranteed by GNMA |
|
|
78,279 |
|
|
|
— |
|
|
|
11,698 |
|
|
|
66,581 |
|
| Issued by FNMA and FHLMC |
|
|
4,604,954 |
|
|
|
16 |
|
|
|
639,414 |
|
|
|
3,965,556 |
|
| Other residential MBS |
|
|
958,911 |
|
|
|
6,110 |
|
|
|
30,300 |
|
|
|
934,721 |
|
| Commercial MBS |
|
|
1,645,065 |
|
|
|
1,605 |
|
|
|
97,029 |
|
|
|
1,549,641 |
|
| Total MBS |
|
|
7,287,209 |
|
|
|
7,731 |
|
|
|
778,441 |
|
|
|
6,516,499 |
|
| Obligations of states and political subdivisions |
|
|
167,743 |
|
|
|
10 |
|
|
|
35,684 |
|
|
|
132,069 |
|
| Corporate debt securities |
|
|
52,751 |
|
|
|
— |
|
|
|
5,349 |
|
|
|
47,402 |
|
| Foreign debt securities |
|
|
318,539 |
|
|
|
443 |
|
|
|
2,195 |
|
|
|
316,787 |
|
| Total available for sale securities |
|
$ |
8,147,696 |
|
|
$ |
8,204 |
|
|
$ |
861,912 |
|
|
$ |
7,293,988 |
|
For the three months ended September 30, 2025, gross gains of $17.5 million and gross losses of $13.2 million were recognized for AFS securities,
compared to gross gains of $2 thousand and gross losses of $2.9 million for the same period in 2024. There were no impairment charges related to credit losses included in gross realized losses for the three months ended September 30, 2025 and 2024.
For the nine months ended September 30, 2025, gross gains of $17.5 million and gross losses of $13.2 million were recognized for AFS securities,
compared to gross gains of $5 thousand and gross losses of $3.0 million for the same period in 2024. There were no impairment charges related to credit losses included in gross realized losses for the nine months ended September 30, 2025 and 2024.
During the three and nine months ended September 30, 2025, the Company incurred losses of $4.3 million on the termination of fair value hedges
related to the IBS securities portfolio, which was reported in other noninterest revenue in the consolidated statements of income. This loss was offset by the $4.3 million related net gain on securities sales, which is shown separately in the
consolidated statements of income.
AFS securities with a carrying value of $5.2 billion and $4.0 billion at September 30, 2025 and December 31, 2024, respectively, were pledged to
secure public and trust funds on deposit and for other purposes.
There were no securities held for trading or held-to-maturity at September 30, 2025 or December 31, 2024.
The amortized cost and estimated fair value of AFS securities at September 30, 2025 by contractual maturity are shown below. Actual maturities may
differ from contractual maturities because borrowers may have the right to call or prepay obligations with or without call or prepayment penalties.
| (In thousands) |
|
Amortized
Cost |
|
|
Estimated
Fair Value |
|
| Maturing in one year or less |
|
$ |
— |
|
|
$ |
— |
|
| Maturing after one year through five years |
|
|
14,964 |
|
|
|
14,634 |
|
| Maturing after five years through ten years |
|
|
306,659 |
|
|
|
288,915 |
|
| Maturing after ten years |
|
|
223,233 |
|
|
|
176,371 |
|
| Mortgage-backed securities |
|
|
9,664,641 |
|
|
|
9,136,469 |
|
| Total available for sale securities |
|
$ |
10,209,497 |
|
|
$ |
9,616,389 |
|
At September 30, 2025 and December 31, 2024, approximately 61.1% and 80.4% of the fair value of securities were in an unrealized loss position,
respectively. At September 30, 2025, there were 836 securities in a loss position for more than twelve months, and 33 securities in a loss position for less than twelve months. At December 31, 2024, there were 871 securities in a loss position for more
than twelve months, and 33 securities in a loss position for less than twelve months. A summary of AFS investments with continuous unrealized loss positions for which an ACL has not been recorded is as follows:
| |
|
Less Than 12 Months |
|
|
12 Months or Longer |
|
| (In thousands) |
|
Fair
Value |
|
|
Unrealized
Losses |
|
|
Fair
Value |
|
|
Unrealized
Losses |
|
| September 30, 2025 |
|
|
|
|
|
|
|
|
|
|
|
|
|
|
|
|
| U.S. government agency securities |
|
$ |
30,780 |
|
|
$ |
159 |
|
|
$ |
198,933 |
|
|
$ |
30,615 |
|
| MBS |
|
|
777,782 |
|
|
|
3,155 |
|
|
|
4,705,194 |
|
|
|
557,777 |
|
| Obligations of states and political subdivisions |
|
|
— |
|
|
|
— |
|
|
|
121,939 |
|
|
|
30,920 |
|
| Corporate debt securities |
|
|
— |
|
|
|
— |
|
|
|
24,703 |
|
|
|
3,297 |
|
| Foreign debt securities |
|
|
20,017 |
|
|
|
14 |
|
|
|
— |
|
|
|
— |
|
| Total |
|
$ |
828,579 |
|
|
$ |
3,328 |
|
|
$ |
5,050,769 |
|
|
$ |
622,609 |
|
| |
|
Less Than 12 Months |
|
|
12 Months or Longer |
|
| (In thousands) |
|
Fair
Value |
|
|
Unrealized
Losses |
|
|
Fair
Value |
|
|
Unrealized
Losses |
|
| December 31, 2024 |
|
|
|
|
|
|
|
|
|
|
|
|
|
|
|
|
| U.S. government agency securities |
|
$ |
74,795 |
|
|
$ |
221 |
|
|
$ |
200,798 |
|
|
$ |
40,022 |
|
| MBS |
|
|
249,197 |
|
|
|
2,314 |
|
|
|
5,123,218 |
|
|
|
776,127 |
|
| Obligations of states and political subdivisions |
|
|
303 |
|
|
|
7 |
|
|
|
121,117 |
|
|
|
35,677 |
|
| Corporate debt securities |
|
|
7,474 |
|
|
|
2,527 |
|
|
|
37,928 |
|
|
|
2,822 |
|
| Foreign debt securities |
|
|
— |
|
|
|
— |
|
|
|
52,806 |
|
|
|
2,195 |
|
| Total |
|
$ |
331,769 |
|
|
$ |
5,069 |
|
|
$ |
5,535,867 |
|
|
$ |
856,843 |
|
Management evaluates AFS securities in unrealized loss positions to determine whether the impairment is attributable to credit-related factors or
noncredit-related factors. Credit loss is defined as the difference between the present value of the cash flows expected to be collected and the amortized cost basis. Management believes that the unrealized losses detailed in the previous tables are
due to noncredit-related factors, such as changes in interest rates and other market conditions. Therefore, no ACL was recorded related to these securities at September 30, 2025 or December 31, 2024. Additionally, as of September 30, 2025 management
had no intent to sell these securities, and it is more likely than not that the Company would not be required to sell the securities prior to recovery of costs. The fair value of these securities is expected to recover as they approach their maturity
date or repricing date or if market yields for such investments decline.
Reported in other assets in the accompanying consolidated balance sheets, equity investments with readily determinable fair values not held for
trading are recorded at fair value, with changes in fair value reported in net income. Additionally, the Company reports equity investments without readily determinable fair values in other assets in the accompanying consolidated balance sheets. These
investments include investments in the common stock of the FHLB of Dallas and the FRB of St. Louis. The Company is required to own stock in the FHLB of Dallas for membership in the FHLB system and in relation to the level of FHLB advances. The Company
is also required to purchase and hold shares of capital stock in the FRB of St. Louis for membership in the Federal Reserve System. The Company accounts for these investments as long-term assets and carries them at cost. During the periods ended
September 30, 2025 and December 31, 2024, there were no downward or upward adjustments to these investments for impairments or price changes from observable transactions.
| (In thousands) |
|
Cost |
|
|
Gross
Unrealized
Gains |
|
|
Gross
Unrealized
Losses |
|
|
Carrying
Value |
|
| September 30, 2025 |
|
|
|
|
|
|
|
|
|
|
|
|
|
|
|
|
| Equity securities held at cost: |
|
|
|
|
|
|
|
|
|
|
|
|
|
|
|
|
| FRB stock |
|
$ |
106,619 |
|
|
$ |
— |
|
|
$ |
— |
|
|
$ |
106,619 |
|
| FHLB stock |
|
|
123,189 |
|
|
|
— |
|
|
|
— |
|
|
|
123,189 |
|
| Other equity securities |
|
|
20,818 |
|
|
|
— |
|
|
|
— |
|
|
|
20,818 |
|
| Total equity securities, held at cost |
|
$ |
250,626 |
|
|
$ |
— |
|
|
$ |
— |
|
|
$ |
250,626 |
|
| Equity securities held at fair value: |
|
|
|
|
|
|
|
|
|
|
|
|
|
|
|
|
| Farmer Mac stock |
|
$ |
49 |
|
|
$ |
572 |
|
|
$ |
— |
|
|
$ |
621 |
|
| Community Development Fund |
|
|
20,000 |
|
|
|
— |
|
|
|
66 |
|
|
|
19,934 |
|
| Total equity securities, held at fair value |
|
$ |
20,049 |
|
|
$ |
572 |
|
|
$ |
66 |
|
|
$ |
20,555 |
|
| (In thousands) |
|
Cost |
|
|
Gross
Unrealized
Gains |
|
|
Gross
Unrealized Losses |
|
|
Carrying
Value |
|
| December 31, 2024 |
|
|
|
|
|
|
|
|
|
|
|
|
|
|
|
|
| Equity securities held at cost: |
|
|
|
|
|
|
|
|
|
|
|
|
|
|
|
|
| FRB stock |
|
$ |
100,567 |
|
|
$ |
— |
|
|
$ |
— |
|
|
$ |
100,567 |
|
| FHLB stock |
|
|
10,410 |
|
|
|
— |
|
|
|
— |
|
|
|
10,410 |
|
| Other equity securities |
|
|
20,582 |
|
|
|
— |
|
|
|
— |
|
|
|
20,582 |
|
| Total equity securities, held at cost |
|
$ |
131,559 |
|
|
$ |
— |
|
|
$ |
— |
|
|
$ |
131,559 |
|
| Equity securities held at fair value: |
|
|
|
|
|
|
|
|
|
|
|
|
|
|
|
|
| Farmer Mac stock |
|
$ |
49 |
|
|
$ |
543 |
|
|
$ |
— |
|
|
$ |
592 |
|
| Affordable Housing MBS Exchange Traded Fund |
|
|
24,994 |
|
|
|
— |
|
|
|
3,908 |
|
|
|
21,086 |
|
| Total equity securities, held at fair value |
|
$ |
25,043 |
|
|
$ |
543 |
|
|
$ |
3,908 |
|
|
$ |
21,678 |
|
NOTE 4. LOANS AND LEASES
The following table is a summary of our loan and lease portfolio aggregated by segment and class at the periods indicated:
| (In thousands) |
|
September 30, 2025 |
|
|
December 31, 2024 |
|
| Commercial and industrial |
|
|
|
|
|
|
|
|
| Non-real estate |
|
$ |
9,239,690 |
|
|
$ |
8,670,529 |
|
| Owner occupied |
|
|
5,291,566 |
|
|
|
4,665,015 |
|
| Total commercial and industrial |
|
|
14,531,256 |
|
|
|
13,335,544 |
|
| Commercial real estate |
|
|
|
|
|
|
|
|
| Construction, acquisition and development |
|
|
3,338,413 |
|
|
|
3,909,184 |
|
| Income producing |
|
|
7,071,911 |
|
|
|
6,015,773 |
|
| Total commercial real estate |
|
|
10,410,324 |
|
|
|
9,924,957 |
|
| Consumer |
|
|
|
|
|
|
|
|
| Residential mortgages |
|
|
11,604,742 |
|
|
|
10,267,883 |
|
| Other consumer |
|
|
255,514 |
|
|
|
213,371 |
|
| Total consumer |
|
|
11,860,256 |
|
|
|
10,481,254 |
|
| Total loans and leases, net of unearned income (1) (2) |
|
$ |
36,801,836 |
|
|
$ |
33,741,755 |
|
|
(1) |
Total loans and leases are net of $49.4 million and $21.4 million of unearned income at September 30, 2025 and December 31, 2024, respectively. |
|
(2) |
Total loans and leases include $382.6 million of FCB loans acquired on May 1, 2025 and $1.0 billion of IBS loans acquired on July 1, 2025. See Note 2 for additional details. |
The Company engages in lending to consumers, small and medium-sized business enterprises, and government entities through its community banking
locations and to regional and national business enterprises through its corporate banking division. The bank acts as agent or participant in SNC and other financing arrangements with other financial institutions. Loans are issued generally to finance
home purchases and improvements, personal expenditures, business investment and operations, construction and development, and income producing properties. Loans are underwritten to be repaid primarily by available cash flow from personal income,
investment income, business operations, rental income, or the sale of developed or constructed properties. Collateral and personal guaranties of business owners are generally required as a condition of the financing arrangements and provide additional
cash flow and proceeds from asset sales of guarantors in the event primary sources of repayment are no longer sufficient.
While loans are structured to provide protection to the Company if borrowers are unable to repay as agreed, the Company recognizes there are
numerous risks that may result in deterioration of the repayment ability of borrowers and guarantors. These risks include failure of business operations due to economic, legal, market, logistical, weather, health, governmental and force majeure
events. Concentrations in the Company’s loan and lease portfolio also present credit risks. The impact of a slowing economy, persistent inflation, changes in interest rates, and labor and supply chain shortages, poses additional risk to borrowers and
financial institutions. As a result of these factors, there is risk for businesses to experience difficulty in meeting repayment obligations, and the Company may experience losses or deterioration in performance in its loan portfolio. For information
regarding nonaccrual policies, past-dues or delinquency status, and recognizing write-offs within ACL, refer to “Note 1 - Summary of Significant Accounting Policies” included in Part II., Item 8 of the Company’s Annual Report on Form 10-K for the year
ended December 31, 2024.
The Company has identified the following segments and classes of loans and leases with similar risk characteristics for measuring expected credit
losses:
Commercial and Industrial
Non-Real Estate – C&I loans are loans and leases to finance business operations, equipment and owner-occupied facilities for small and
medium-sized enterprises, as well as larger corporate borrowers. These include both lines of credit and term loans which are amortized over the useful life of the assets financed. Personal and/or corporate guarantees are generally obtained where
available and prudent. This category also includes loans to finance agricultural production. The Company recognizes risk from economic cycles, commodity prices, government regulation, supply-chain disruptions, product innovations or obsolescence,
operational errors, lawsuits, natural disasters, losses due to fraud, theft or embezzlement, loss of sponsor support, health or loss of key personnel or competitive situations may adversely affect the scheduled repayment of business loans. In addition,
risks in the agricultural sector including crop failures due to weather, insects and other blights, commodity prices, governmental intervention, lawsuits, labor or logistical disruptions.
Owner Occupied – Owner occupied loans include loans secured by business facilities to finance business operations, equipment and
owner-occupied facilities primarily for small and medium-sized enterprises. These include both lines of credit and term loans which are amortized over the useful life of the assets financed. Personal guarantees, if applicable, are generally required
for these loans. The Company recognizes that risk from economic cycles, government regulation, supply-chain disruptions, product innovations or obsolescence, operational errors, lawsuits, natural disasters, losses due to theft or embezzlement, health
or loss of key personnel, or competitive situations may adversely affect the scheduled repayment of business loans.
Commercial Real Estate
Construction, Acquisition and Development – CAD loans include both loans and credit lines for the purpose of purchasing, carrying, and
developing land into residential subdivisions or various types of commercial developments, such as industrial, warehouse, retail, office, and multi-family. This category also includes loans and credit lines for construction of residential, multi-family
and commercial buildings. The Company generally engages in CAD lending primarily in local markets served by its branches. The Company recognizes that risks are inherent in the financing of real estate development and construction. These risks include
location, market conditions and price volatility, change in interest rates, demand for developed land, lots and buildings, desirability of features and styling of completed developments and buildings, competition from other developments and builders,
traffic patterns, remote work patterns, governmental jurisdiction, tax structure, availability of utilities, roads, public transportation and schools, availability of permanent financing for homebuyers, zoning, environmental restrictions, lawsuits,
economic and business cycle, labor, and reputation of the builder or developer.
Each CAD loan is underwritten to address: (i) the desirability of the project, its market viability and projected absorption period; (ii) the
creditworthiness of the borrower and the guarantor as to liquidity, cash flow and assets available to ensure performance of the loan; (iii) equity contribution to the project; (iv) the developer’s experience and success with similar projects; and (v)
the value of the collateral.
A substantial portion of CAD loans are secured by real estate in markets in which the Company is located. The Company’s loan policy generally
prohibits loans for the sole purpose of carrying interest reserves. Certain of the construction, acquisition and development loans were structured with interest-only terms. A portion of the residential mortgage and CRE portfolios were originated
through the permanent financing of construction, acquisition and development loans. Changes in interest rates and the potential for slowing economic conditions could negatively impact borrowers’ and guarantors’ ability to repay their debt, which would
make more of the Company’s loans collateral-dependent.
Income Producing – CRE loans include loans to finance income-producing commercial and multi-family properties. Lending in this category is
generally limited to properties located in the Company’s market area with only limited exposure to properties located elsewhere but owned by in-market borrowers. Loans in this category include loans for neighborhood retail centers, medical and
professional offices, single retail stores, industrials and apartments leased generally to local businesses and residents. The underwriting of these loans takes into consideration the occupancy and rental rates as well as the financial health of the
borrower. The Company’s exposure to national retail tenants is limited. The Company recognizes that risk from economic cycles, government restrictions, delayed or missed rent payments, supply-chain disruptions, operational errors, lawsuits, natural
disasters, losses due to theft or embezzlement, health or loss of key personnel or competitive situations may adversely affect the scheduled repayment of business loans.
Consumer
Residential Mortgages – Residential mortgages are first or second-lien loans to consumers secured by a primary residence or second home.
This category includes traditional mortgages, home equity loans and revolving lines of credit. The loans are generally secured by properties located within the local market area of the community bank which originates and services the loan. These loans
are underwritten in accordance with the Company’s general loan policies and procedures which require, among other things, proper documentation of each borrower’s financial condition, satisfactory credit history, and property value. In addition to loans
originated through the Company’s branches, the Company originates and services residential mortgages sold in the secondary market which are underwritten and closed pursuant to investor and agency guidelines. At September 30, 2025 and December 31, 2024,
residential mortgage loans in process of foreclosure totaled $20.2 million and $19.7 million, respectively. Additionally, the Company held $8.4 million and $4.4 million in foreclosed residential properties at September 30, 2025 and December 31, 2024,
respectively.
Other Consumer – Other consumer lending includes consumer credit cards as well as personal revolving lines of credit and installment loans.
The Company offers credit cards, primarily to its deposit and loan customers. Consumer installment loans generally includes term loans secured by automobiles, boats and recreational vehicles.
The Company recognizes there are risks in consumer lending which include interruptions in the borrower’s personal and investment income due to
loss of employment, market conditions, and general economic conditions, deterioration in the health and well-being of the borrower and family members, natural disasters, lawsuits, losses, or inability to generate income due to injury, accidents, theft,
vandalism, or incarceration.
Credit Quality
The following tables provide details regarding the aging of the Company’s loan and lease portfolio, net of unearned income, at the periods
indicated:
| |
|
September 30, 2025 |
|
| (In thousands) |
|
30-59
Days
Past Due |
|
|
60-89
Days
Past Due |
|
|
90+ Days
Past Due |
|
|
Total
Past Due |
|
|
Current |
|
|
Total
Amortized
Cost |
|
|
90+ Days
Past Due
still
Accruing |
|
| Commercial and industrial |
|
|
|
|
|
|
|
|
|
|
|
|
|
|
|
|
|
|
|
|
|
|
|
|
|
|
|
|
| Non-real estate |
|
$ |
13,256 |
|
|
$ |
26,104 |
|
|
$ |
83,604 |
|
|
$ |
122,964 |
|
|
$ |
9,116,726 |
|
|
$ |
9,239,690 |
|
|
$ |
39,667 |
|
| Owner occupied |
|
|
3,684 |
|
|
|
4,054 |
|
|
|
17,748 |
|
|
|
25,486 |
|
|
|
5,266,080 |
|
|
|
5,291,566 |
|
|
|
129 |
|
| Total commercial and industrial |
|
|
16,940 |
|
|
|
30,158 |
|
|
|
101,352 |
|
|
|
148,450 |
|
|
|
14,382,806 |
|
|
|
14,531,256 |
|
|
|
39,796 |
|
| Commercial real estate |
|
|
|
|
|
|
|
|
|
|
|
|
|
|
|
|
|
|
|
|
|
|
|
|
|
|
|
|
| Construction, acquisition and development |
|
|
3,104 |
|
|
|
708 |
|
|
|
1,462 |
|
|
|
5,274 |
|
|
|
3,333,139 |
|
|
|
3,338,413 |
|
|
|
— |
|
| Income producing |
|
|
2,466 |
|
|
|
3,004 |
|
|
|
4,905 |
|
|
|
10,375 |
|
|
|
7,061,536 |
|
|
|
7,071,911 |
|
|
|
— |
|
| Total commercial real estate |
|
|
5,570 |
|
|
|
3,712 |
|
|
|
6,367 |
|
|
|
15,649 |
|
|
|
10,394,675 |
|
|
|
10,410,324 |
|
|
|
— |
|
| Consumer |
|
|
|
|
|
|
|
|
|
|
|
|
|
|
|
|
|
|
|
|
|
|
|
|
|
|
|
|
| Residential mortgages |
|
|
78,183 |
|
|
|
37,268 |
|
|
|
57,672 |
|
|
|
173,123 |
|
|
|
11,431,619 |
|
|
|
11,604,742 |
|
|
|
2,568 |
|
| Other consumer |
|
|
1,855 |
|
|
|
569 |
|
|
|
445 |
|
|
|
2,869 |
|
|
|
252,645 |
|
|
|
255,514 |
|
|
|
234 |
|
| Total consumer |
|
|
80,038 |
|
|
|
37,837 |
|
|
|
58,117 |
|
|
|
175,992 |
|
|
|
11,684,264 |
|
|
|
11,860,256 |
|
|
|
2,802 |
|
| Total |
|
$ |
102,548 |
|
|
$ |
71,707 |
|
|
$ |
165,836 |
|
|
$ |
340,091 |
|
|
$ |
36,461,745 |
|
|
$ |
36,801,836 |
|
|
$ |
42,598 |
|
| |
|
December 31, 2024 |
|
| (In thousands) |
|
30-59
Days
Past Due |
|
|
60-89
Days
Past Due |
|
|
90+ Days
Past Due |
|
|
Total
Past Due |
|
|
Current |
|
|
Total
Amortized
Cost |
|
|
90+ Days
Past Due
still
Accruing |
|
| Commercial and industrial |
|
|
|
|
|
|
|
|
|
|
|
|
|
|
|
|
|
|
|
|
|
|
|
|
|
|
|
|
| Non-real estate |
|
$ |
13,443 |
|
|
$ |
28,379 |
|
|
$ |
101,873 |
|
|
$ |
143,695 |
|
|
$ |
8,526,834 |
|
|
$ |
8,670,529 |
|
|
$ |
8,115 |
|
| Owner occupied |
|
|
10,375 |
|
|
|
3,836 |
|
|
|
16,280 |
|
|
|
30,491 |
|
|
|
4,634,524 |
|
|
|
4,665,015 |
|
|
|
— |
|
| Total commercial and industrial |
|
|
23,818 |
|
|
|
32,215 |
|
|
|
118,153 |
|
|
|
174,186 |
|
|
|
13,161,358 |
|
|
|
13,335,544 |
|
|
|
8,115 |
|
| Commercial real estate |
|
|
|
|
|
|
|
|
|
|
|
|
|
|
|
|
|
|
|
|
|
|
|
|
|
|
|
|
| Construction, acquisition and development |
|
|
4,254 |
|
|
|
663 |
|
|
|
8,579 |
|
|
|
13,496 |
|
|
|
3,895,688 |
|
|
|
3,909,184 |
|
|
|
— |
|
| Income producing |
|
|
3,971 |
|
|
|
1,226 |
|
|
|
12,193 |
|
|
|
17,390 |
|
|
|
5,998,383 |
|
|
|
6,015,773 |
|
|
|
— |
|
| Total commercial real estate |
|
|
8,225 |
|
|
|
1,889 |
|
|
|
20,772 |
|
|
|
30,886 |
|
|
|
9,894,071 |
|
|
|
9,924,957 |
|
|
|
— |
|
| Consumer |
|
|
|
|
|
|
|
|
|
|
|
|
|
|
|
|
|
|
|
|
|
|
|
|
|
|
|
|
| Residential mortgages |
|
|
60,009 |
|
|
|
28,937 |
|
|
|
61,578 |
|
|
|
150,524 |
|
|
|
10,117,359 |
|
|
|
10,267,883 |
|
|
|
4,750 |
|
| Other consumer |
|
|
1,587 |
|
|
|
455 |
|
|
|
413 |
|
|
|
2,455 |
|
|
|
210,916 |
|
|
|
213,371 |
|
|
|
261 |
|
| Total consumer |
|
|
61,596 |
|
|
|
29,392 |
|
|
|
61,991 |
|
|
|
152,979 |
|
|
|
10,328,275 |
|
|
|
10,481,254 |
|
|
|
5,011 |
|
| Total |
|
$ |
93,639 |
|
|
$ |
63,496 |
|
|
$ |
200,916 |
|
|
$ |
358,051 |
|
|
$ |
33,383,704 |
|
|
$ |
33,741,755 |
|
|
$ |
13,126 |
|
The Company utilizes an internal loan classification system that is continually updated to grade loans according to certain credit quality
indicators. These credit quality indicators include, but are not limited to, recent credit performance, delinquency, liquidity, cash flows, debt coverage ratios, collateral type and loan-to-value ratio. The Company’s internal loan classification system
is compatible with classifications used by regulatory agencies. Loans may be classified as follows:
Pass: Loans which are performing as agreed with few or no signs of weakness. These loans show sufficient cash flow, capital and collateral
to repay the loan as agreed.
Special Mention: Loans where potential weaknesses have developed which could cause a more serious problem if not corrected.
Substandard: Loans where well-defined weaknesses exist that require corrective action to prevent further deterioration. Loans are further
characterized by the possibility that the Company will sustain some loss if the deficiencies are not corrected.
Doubtful: Loans having all the characteristics of Substandard and which have deteriorated to a point where collection and liquidation in
full is highly questionable.
Loss: Loans that are considered uncollectible or with limited possible recovery.
Impaired: An internal grade for individually analyzed collateral-dependent loans for which a specific provision has been considered to
address the unsupported exposure.
PCD (Loss): An internal grade for loans with evidence of deterioration of credit quality since origination that are acquired, and for which
it is probable, at acquisition, that the bank will be unable to collect all contractually required payments.
The following tables provide details of the Company’s loan and lease portfolio, net of unearned income, by segment, class and internally assigned
grade at the periods indicated:
| |
|
September 30, 2025 |
|
| (In thousands) |
|
Pass |
|
|
Special
Mention (1)
|
|
|
Substandard (1) |
|
|
Doubtful |
|
|
Impaired (1) |
|
|
PCD (Loss) |
|
|
Total |
|
| Commercial and industrial |
|
|
|
|
|
|
|
|
|
|
|
|
|
|
|
|
|
|
|
|
|
|
|
|
|
|
|
|
| Non-real estate |
|
$ |
8,733,898 |
|
|
$ |
154,131 |
|
|
$ |
296,848 |
|
|
$ |
8,183 |
|
|
$ |
31,373 |
|
|
$ |
15,257 |
|
|
$ |
9,239,690 |
|
| Owner occupied |
|
|
5,217,614 |
|
|
|
15,251 |
|
|
|
53,587 |
|
|
|
— |
|
|
|
4,641 |
|
|
|
473 |
|
|
|
5,291,566 |
|
| Total commercial and industrial |
|
|
13,951,512 |
|
|
|
169,382 |
|
|
|
350,435 |
|
|
|
8,183 |
|
|
|
36,014 |
|
|
|
15,730 |
|
|
|
14,531,256 |
|
| Commercial real estate |
|
|
|
|
|
|
|
|
|
|
|
|
|
|
|
|
|
|
|
|
|
|
|
|
|
|
|
|
Construction, acquisition and
development |
|
|
3,307,750 |
|
|
|
27,265 |
|
|
|
3,332 |
|
|
|
— |
|
|
|
66 |
|
|
|
— |
|
|
|
3,338,413 |
|
| Income producing |
|
|
6,802,210 |
|
|
|
98,974 |
|
|
|
169,090 |
|
|
|
— |
|
|
|
862 |
|
|
|
775 |
|
|
|
7,071,911 |
|
| Total commercial real estate |
|
|
10,109,960 |
|
|
|
126,239 |
|
|
|
172,422 |
|
|
|
— |
|
|
|
928 |
|
|
|
775 |
|
|
|
10,410,324 |
|
| Consumer |
|
|
|
|
|
|
|
|
|
|
|
|
|
|
|
|
|
|
|
|
|
|
|
|
|
|
|
|
| Residential mortgages |
|
|
11,486,319 |
|
|
|
9,167 |
|
|
|
105,076 |
|
|
|
— |
|
|
|
2,836 |
|
|
|
1,344 |
|
|
|
11,604,742 |
|
| Other consumer |
|
|
254,917 |
|
|
|
— |
|
|
|
597 |
|
|
|
— |
|
|
|
— |
|
|
|
— |
|
|
|
255,514 |
|
| Total consumer |
|
|
11,741,236 |
|
|
|
9,167 |
|
|
|
105,673 |
|
|
|
— |
|
|
|
2,836 |
|
|
|
1,344 |
|
|
|
11,860,256 |
|
| Total |
|
$ |
35,802,708 |
|
|
$ |
304,788 |
|
|
$ |
628,530 |
|
|
$ |
8,183 |
|
|
$ |
39,778 |
|
|
$ |
17,849 |
|
|
$ |
36,801,836 |
|
|
(1) |
In the loan classifications above, $8.7 million of the special mention balance, $64.8 million of the substandard balance, and $3.4 million of the impaired balance are covered by government guarantees from either the
SBA, FHA, VA or USDA. |
| |
|
December 31, 2024 |
|
| (In thousands) |
|
Pass |
|
|
Special
Mention |
|
|
Substandard (1) |
|
|
Doubtful |
|
|
Impaired (1) |
|
|
PCD (Loss) |
|
|
Total |
|
| Commercial and industrial |
|
|
|
|
|
|
|
|
|
|
|
|
|
|
|
|
|
|
|
|
|
|
|
|
|
|
|
|
| Non-real estate |
|
$ |
8,208,176 |
|
|
$ |
106,996 |
|
|
$ |
311,096 |
|
|
$ |
8,743 |
|
|
$ |
31,996 |
|
|
$ |
3,522 |
|
|
$ |
8,670,529 |
|
| Owner occupied |
|
|
4,610,775 |
|
|
|
815 |
|
|
|
41,363 |
|
|
|
— |
|
|
|
10,968 |
|
|
|
1,094 |
|
|
|
4,665,015 |
|
| Total commercial and industrial |
|
|
12,818,951 |
|
|
|
107,811 |
|
|
|
352,459 |
|
|
|
8,743 |
|
|
|
42,964 |
|
|
|
4,616 |
|
|
|
13,335,544 |
|
| Commercial real estate |
|
|
|
|
|
|
|
|
|
|
|
|
|
|
|
|
|
|
|
|
|
|
|
|
|
|
|
|
Construction, acquisition and
development |
|
|
3,896,856 |
|
|
|
— |
|
|
|
12,262 |
|
|
|
— |
|
|
|
66 |
|
|
|
— |
|
|
|
3,909,184 |
|
| Income producing |
|
|
5,850,702 |
|
|
|
5,094 |
|
|
|
144,084 |
|
|
|
— |
|
|
|
15,893 |
|
|
|
— |
|
|
|
6,015,773 |
|
| Total commercial real estate |
|
|
9,747,558 |
|
|
|
5,094 |
|
|
|
156,346 |
|
|
|
— |
|
|
|
15,959 |
|
|
|
— |
|
|
|
9,924,957 |
|
| Consumer |
|
|
|
|
|
|
|
|
|
|
|
|
|
|
|
|
|
|
|
|
|
|
|
|
|
|
|
|
| Residential mortgages |
|
|
10,167,830 |
|
|
|
891 |
|
|
|
89,597 |
|
|
|
— |
|
|
|
8,154 |
|
|
|
1,411 |
|
|
|
10,267,883 |
|
| Other consumer |
|
|
212,865 |
|
|
|
— |
|
|
|
506 |
|
|
|
— |
|
|
|
— |
|
|
|
— |
|
|
|
213,371 |
|
| Total consumer |
|
|
10,380,695 |
|
|
|
891 |
|
|
|
90,103 |
|
|
|
— |
|
|
|
8,154 |
|
|
|
1,411 |
|
|
|
10,481,254 |
|
| Total |
|
$ |
32,947,204 |
|
|
$ |
113,796 |
|
|
$ |
598,908 |
|
|
$ |
8,743 |
|
|
$ |
67,077 |
|
|
$ |
6,027 |
|
|
$ |
33,741,755 |
|
|
(1) |
In the loan classifications above, $99.0 million of the substandard balance and $11.1 million of the impaired balance is covered by government guarantees from the SBA, FHA, VA or USDA. |
The following tables provide credit quality indicators, including gross charge-offs, by class and period of origination (vintage) at September 30,
2025:
| |
|
Commercial and Industrial - Non-Real Estate |
|
| |
|
Period Originated: |
|
|
|
|
|
|
|
|
|
|
| (Dollars in thousands) |
|
2025 |
|
|
2024 |
|
|
2023 |
|
|
2022 |
|
|
2021 |
|
|
Prior |
|
|
Revolving
Loans
|
|
|
Revolving
Loans
Converted
to Term |
|
|
Total |
|
| Pass |
|
$ |
1,235,733 |
|
|
$ |
1,453,603 |
|
|
$ |
788,762 |
|
|
$ |
793,754 |
|
|
$ |
481,694 |
|
|
$ |
692,483 |
|
|
$ |
3,274,635 |
|
|
$ |
13,234 |
|
|
$ |
8,733,898 |
|
| Special Mention |
|
|
1,369 |
|
|
|
3,994 |
|
|
|
18,662 |
|
|
|
19,847 |
|
|
|
43,489 |
|
|
|
31,184 |
|
|
|
35,586 |
|
|
|
— |
|
|
|
154,131 |
|
| Substandard |
|
|
3,221 |
|
|
|
17,234 |
|
|
|
66,832 |
|
|
|
33,513 |
|
|
|
32,637 |
|
|
|
41,001 |
|
|
|
102,410 |
|
|
|
— |
|
|
|
296,848 |
|
| Doubtful |
|
|
— |
|
|
|
— |
|
|
|
— |
|
|
|
— |
|
|
|
8,183 |
|
|
|
— |
|
|
|
— |
|
|
|
— |
|
|
|
8,183 |
|
| Impaired |
|
|
— |
|
|
|
— |
|
|
|
— |
|
|
|
493 |
|
|
|
13,579 |
|
|
|
— |
|
|
|
17,301 |
|
|
|
— |
|
|
|
31,373 |
|
| PCD (Loss) |
|
|
4,925 |
|
|
|
7,006 |
|
|
|
— |
|
|
|
— |
|
|
|
— |
|
|
|
3,326 |
|
|
|
— |
|
|
|
— |
|
|
|
15,257 |
|
| Total |
|
$ |
1,245,248 |
|
|
$ |
1,481,837 |
|
|
$ |
874,256 |
|
|
$ |
847,607 |
|
|
$ |
579,582 |
|
|
$ |
767,994 |
|
|
$ |
3,429,932 |
|
|
$ |
13,234 |
|
|
$ |
9,239,690 |
|
| % Criticized |
|
|
0.8 |
% |
|
|
1.9 |
% |
|
|
9.8 |
% |
|
|
6.4 |
% |
|
|
16.9 |
% |
|
|
9.8 |
% |
|
|
4.5 |
% |
|
|
— |
% |
|
|
5.5 |
% |
| Gross charge-offs YTD |
|
$ |
940 |
|
|
$ |
1,928 |
|
|
$ |
7,467 |
|
|
$ |
11,580 |
|
|
$ |
1,703 |
|
|
$ |
2,679 |
|
|
$ |
33,224 |
|
|
$ |
— |
|
|
$ |
59,521 |
|
| |
|
Commercial and Industrial - Owner Occupied |
|
| |
|
Period Originated: |
|
|
|
|
|
|
|
|
|
|
| (Dollars in thousands) |
|
2025 |
|
|
2024 |
|
|
2023 |
|
|
2022 |
|
|
2021 |
|
|
Prior |
|
|
Revolving
Loans |
|
|
Revolving
Loans
Converted
to Term |
|
|
Total |
|
| Pass |
|
$ |
643,891 |
|
|
$ |
662,982 |
|
|
$ |
673,004 |
|
|
$ |
958,530 |
|
|
$ |
738,202 |
|
|
$ |
1,408,328 |
|
|
$ |
132,380 |
|
|
$ |
297 |
|
|
$ |
5,217,614 |
|
| Special Mention |
|
|
1,826 |
|
|
|
1,172 |
|
|
|
1,076 |
|
|
|
4,116 |
|
|
|
3,088 |
|
|
|
3,973 |
|
|
|
— |
|
|
|
— |
|
|
|
15,251 |
|
| Substandard |
|
|
315 |
|
|
|
4,174 |
|
|
|
20,664 |
|
|
|
8,104 |
|
|
|
3,566 |
|
|
|
15,753 |
|
|
|
1,011 |
|
|
|
— |
|
|
|
53,587 |
|
| Impaired |
|
|
— |
|
|
|
— |
|
|
|
1,282 |
|
|
|
3,359 |
|
|
|
— |
|
|
|
— |
|
|
|
— |
|
|
|
— |
|
|
|
4,641 |
|
| PCD (Loss) |
|
|
— |
|
|
|
473 |
|
|
|
— |
|
|
|
— |
|
|
|
— |
|
|
|
— |
|
|
|
— |
|
|
|
— |
|
|
|
473 |
|
| Total |
|
$ |
646,032 |
|
|
$ |
668,801 |
|
|
$ |
696,026 |
|
|
$ |
974,109 |
|
|
$ |
744,856 |
|
|
$ |
1,428,054 |
|
|
$ |
133,391 |
|
|
$ |
297 |
|
|
$ |
5,291,566 |
|
| % Criticized |
|
|
0.3 |
% |
|
|
0.9 |
% |
|
|
3.3 |
% |
|
|
1.6 |
% |
|
|
0.9 |
% |
|
|
1.4 |
% |
|
|
0.8 |
% |
|
|
— |
% |
|
|
1.4 |
% |
| Gross charge-offs YTD |
|
$ |
— |
|
|
$ |
394 |
|
|
$ |
799 |
|
|
$ |
99 |
|
|
$ |
260 |
|
|
$ |
593 |
|
|
$ |
89 |
|
|
$ |
— |
|
|
$ |
2,234 |
|
| |
|
Commercial Real Estate - Construction, Acquisition, & Development |
|
| |
|
Period Originated: |
|
|
|
|
|
|
|
|
|
|
| (Dollars in thousands) |
|
2025 |
|
|
2024 |
|
|
2023 |
|
|
2022 |
|
|
2021 |
|
|
Prior |
|
|
Revolving
Loans |
|
|
Revolving
Loans
Converted
to Term |
|
|
Total |
|
| Pass |
|
$ |
972,021 |
|
|
$ |
972,003 |
|
|
$ |
358,250 |
|
|
$ |
588,997 |
|
|
$ |
285,037 |
|
|
$ |
96,610 |
|
|
$ |
34,832 |
|
|
$ |
— |
|
|
$ |
3,307,750 |
|
| Special Mention |
|
|
— |
|
|
|
— |
|
|
|
— |
|
|
|
216 |
|
|
|
26,849 |
|
|
|
200 |
|
|
|
— |
|
|
|
— |
|
|
|
27,265 |
|
| Substandard |
|
|
— |
|
|
|
1,300 |
|
|
|
882 |
|
|
|
120 |
|
|
|
532 |
|
|
|
431 |
|
|
|
67 |
|
|
|
— |
|
|
|
3,332 |
|
| Impaired |
|
|
— |
|
|
|
— |
|
|
|
— |
|
|
|
— |
|
|
|
— |
|
|
|
66 |
|
|
|
— |
|
|
|
— |
|
|
|
66 |
|
| Total |
|
$ |
972,021 |
|
|
$ |
973,303 |
|
|
$ |
359,132 |
|
|
$ |
589,333 |
|
|
$ |
312,418 |
|
|
$ |
97,307 |
|
|
$ |
34,899 |
|
|
$ |
— |
|
|
$ |
3,338,413 |
|
| % Criticized |
|
|
— |
% |
|
|
0.1 |
% |
|
|
0.2 |
% |
|
|
0.1 |
% |
|
|
8.8 |
% |
|
|
0.7 |
% |
|
|
0.2 |
% |
|
|
— |
% |
|
|
0.9 |
% |
| Gross charge-offs YTD |
|
$ |
— |
|
|
$ |
— |
|
|
$ |
205 |
|
|
$ |
225 |
|
|
$ |
124 |
|
|
$ |
— |
|
|
$ |
174 |
|
|
$ |
— |
|
|
$ |
728 |
|
| |
|
Commercial Real Estate - Income Producing |
|
| |
|
Period Originated: |
|
|
|
|
|
|
|
|
|
|
| (Dollars in thousands) |
|
2025 |
|
|
2024 |
|
|
2023 |
|
|
2022 |
|
|
2021 |
|
|
Prior |
|
|
Revolving
Loans |
|
|
Revolving
Loans
Converted
to Term |
|
|
Total |
|
| Pass |
|
$ |
728,433 |
|
|
$ |
696,699 |
|
|
$ |
612,327 |
|
|
$ |
1,886,337 |
|
|
$ |
1,149,951 |
|
|
$ |
1,626,367 |
|
|
$ |
102,096 |
|
|
$ |
— |
|
|
$ |
6,802,210 |
|
| Special Mention |
|
|
177 |
|
|
|
479 |
|
|
|
1,938 |
|
|
|
34,561 |
|
|
|
35,454 |
|
|
|
26,365 |
|
|
|
— |
|
|
|
— |
|
|
|
98,974 |
|
| Substandard |
|
|
— |
|
|
|
451 |
|
|
|
1,564 |
|
|
|
3,934 |
|
|
|
18,719 |
|
|
|
144,133 |
|
|
|
289 |
|
|
|
— |
|
|
|
169,090 |
|
| Impaired |
|
|
— |
|
|
|
— |
|
|
|
— |
|
|
|
— |
|
|
|
— |
|
|
|
862 |
|
|
|
— |
|
|
|
— |
|
|
|
862 |
|
| PCD (Loss) |
|
|
— |
|
|
|
— |
|
|
|
— |
|
|
|
775 |
|
|
|
— |
|
|
|
— |
|
|
|
— |
|
|
|
— |
|
|
|
775 |
|
| Total |
|
$ |
728,610 |
|
|
$ |
697,629 |
|
|
$ |
615,829 |
|
|
$ |
1,925,607 |
|
|
$ |
1,204,124 |
|
|
$ |
1,797,727 |
|
|
$ |
102,385 |
|
|
$ |
— |
|
|
$ |
7,071,911 |
|
| % Criticized |
|
|
— |
% |
|
|
0.1 |
% |
|
|
0.6 |
% |
|
|
2.0 |
% |
|
|
4.5 |
% |
|
|
9.5 |
% |
|
|
0.3 |
% |
|
|
— |
% |
|
|
3.8 |
% |
| Gross charge-offs YTD |
|
$ |
— |
|
|
$ |
— |
|
|
$ |
252 |
|
|
$ |
662 |
|
|
$ |
240 |
|
|
$ |
3,631 |
|
|
$ |
— |
|
|
$ |
— |
|
|
$ |
4,785 |
|
| |
|
Consumer - Residential Mortgages |
|
| |
|
Period Originated: |
|
|
|
|
|
|
|
|
|
|
| (Dollars in thousands) |
|
2025 |
|
|
2024 |
|
|
2023 |
|
|
2022 |
|
|
2021 |
|
|
Prior |
|
|
Revolving
Loans |
|
|
Revolving
Loans
Converted
to Term |
|
|
Total |
|
| Pass |
|
$ |
1,418,780 |
|
|
$ |
1,400,945 |
|
|
$ |
1,481,580 |
|
|
$ |
1,950,449 |
|
|
$ |
1,468,374 |
|
|
$ |
2,540,330 |
|
|
$ |
1,223,810 |
|
|
$ |
2,051 |
|
|
$ |
11,486,319 |
|
| Special Mention |
|
|
1,149 |
|
|
|
1,680 |
|
|
|
1,091 |
|
|
|
1,167 |
|
|
|
466 |
|
|
|
2,968 |
|
|
|
646 |
|
|
|
— |
|
|
|
9,167 |
|
| Substandard |
|
|
1,407 |
|
|
|
4,142 |
|
|
|
11,874 |
|
|
|
19,552 |
|
|
|
17,448 |
|
|
|
47,138 |
|
|
|
3,515 |
|
|
|
— |
|
|
|
105,076 |
|
| Impaired |
|
|
— |
|
|
|
— |
|
|
|
— |
|
|
|
— |
|
|
|
174 |
|
|
|
2,662 |
|
|
|
— |
|
|
|
— |
|
|
|
2,836 |
|
| PCD (Loss) |
|
|
— |
|
|
|
— |
|
|
|
— |
|
|
|
— |
|
|
|
— |
|
|
|
1,344 |
|
|
|
— |
|
|
|
— |
|
|
|
1,344 |
|
| Total |
|
$ |
1,421,336 |
|
|
$ |
1,406,767 |
|
|
$ |
1,494,545 |
|
|
$ |
1,971,168 |
|
|
$ |
1,486,462 |
|
|
$ |
2,594,442 |
|
|
$ |
1,227,971 |
|
|
$ |
2,051 |
|
|
$ |
11,604,742 |
|
| % Criticized |
|
|
0.2 |
% |
|
|
0.4 |
% |
|
|
0.9 |
% |
|
|
1.1 |
% |
|
|
1.2 |
% |
|
|
2.1 |
% |
|
|
0.3 |
% |
|
|
—% |
|
|
|
1.0 |
% |
| Gross charge-offs YTD |
|
$ |
3 |
|
|
$ |
140 |
|
|
$ |
374 |
|
|
$ |
1,788 |
|
|
$ |
840 |
|
|
$ |
617 |
|
|
$ |
1,412 |
|
|
$ |
— |
|
|
$ |
5,174 |
|
| |
|
Consumer - Other Consumer |
|
| |
|
Period Originated: |
|
|
|
|
|
|
|
|
|
|
| (Dollars in thousands) |
|
2025 |
|
|
2024 |
|
|
2023 |
|
|
2022 |
|
|
2021 |
|
|
Prior |
|
|
Revolving
Loans |
|
|
Revolving
Loans
Converted
to Term |
|
|
Total |
|
| Pass |
|
$ |
59,730 |
|
|
$ |
37,784 |
|
|
$ |
24,079 |
|
|
$ |
9,704 |
|
|
$ |
5,103 |
|
|
$ |
5,794 |
|
|
$ |
112,723 |
|
|
$ |
— |
|
|
$ |
254,917 |
|
| Substandard |
|
|
— |
|
|
|
153 |
|
|
|
83 |
|
|
|
12 |
|
|
|
40 |
|
|
|
3 |
|
|
|
306 |
|
|
|
— |
|
|
|
597 |
|
| Total |
|
$ |
59,730 |
|
|
$ |
37,937 |
|
|
$ |
24,162 |
|
|
$ |
9,716 |
|
|
$ |
5,143 |
|
|
$ |
5,797 |
|
|
$ |
113,029 |
|
|
$ |
— |
|
|
$ |
255,514 |
|
| % Criticized |
|
|
— |
% |
|
|
0.4 |
% |
|
|
0.3 |
% |
|
|
0.1 |
% |
|
|
0.8 |
% |
|
|
0.1 |
% |
|
|
0.3 |
% |
|
|
— |
% |
|
|
0.2 |
% |
| Gross charge-offs YTD |
|
$ |
2,001 |
|
|
$ |
385 |
|
|
$ |
182 |
|
|
$ |
77 |
|
|
$ |
14 |
|
|
$ |
59 |
|
|
$ |
2,261 |
|
|
$ |
— |
|
|
$ |
4,979 |
|
The following tables provide credit quality indicators, including gross charge-offs, by class and period of origination (vintage) at December 31,
2024.
| |
|
Commercial and Industrial - Non-Real Estate |
|
| |
|
Period Originated: |
|
|
|
|
|
|
|
|
|
|
| (Dollars in thousands) |
|
2024 |
|
|
2023 |
|
|
2022 |
|
|
2021 |
|
|
2020 |
|
|
Prior |
|
|
Revolving
Loans |
|
|
Revolving
Loans
Converted
to Term |
|
|
Total |
|
| Pass |
|
$ |
1,361,684 |
|
|
$ |
926,422 |
|
|
$ |
1,036,579 |
|
|
$ |
695,625 |
|
|
$ |
209,100 |
|
|
$ |
563,337 |
|
|
$ |
3,397,031 |
|
|
$ |
18,398 |
|
|
$ |
8,208,176 |
|
| Special Mention |
|
|
13,242 |
|
|
|
10,942 |
|
|
|
— |
|
|
|
23,158 |
|
|
|
18,337 |
|
|
|
— |
|
|
|
41,317 |
|
|
|
— |
|
|
|
106,996 |
|
| Substandard |
|
|
8,855 |
|
|
|
49,842 |
|
|
|
70,136 |
|
|
|
43,832 |
|
|
|
12,370 |
|
|
|
27,648 |
|
|
|
75,638 |
|
|
|
22,775 |
|
|
|
311,096 |
|
| Doubtful |
|
|
— |
|
|
|
— |
|
|
|
— |
|
|
|
8,743 |
|
|
|
— |
|
|
|
— |
|
|
|
— |
|
|
|
— |
|
|
|
8,743 |
|
| Impaired |
|
|
— |
|
|
|
1,485 |
|
|
|
2,773 |
|
|
|
9,013 |
|
|
|
— |
|
|
|
— |
|
|
|
18,725 |
|
|
|
— |
|
|
|
31,996 |
|
| PCD (Loss) |
|
|
— |
|
|
|
— |
|
|
|
— |
|
|
|
— |
|
|
|
— |
|
|
|
3,522 |
|
|
|
— |
|
|
|
— |
|
|
|
3,522 |
|
| Total |
|
$ |
1,383,781 |
|
|
$ |
988,691 |
|
|
$ |
1,109,488 |
|
|
$ |
780,371 |
|
|
$ |
239,807 |
|
|
$ |
594,507 |
|
|
$ |
3,532,711 |
|
|
$ |
41,173 |
|
|
$ |
8,670,529 |
|
| % Criticized |
|
|
1.6 |
% |
|
|
6.3 |
% |
|
|
6.6 |
% |
|
|
10.9 |
% |
|
|
12.8 |
% |
|
|
5.2 |
% |
|
|
3.8 |
% |
|
|
55.3 |
% |
|
|
5.3 |
% |
| Gross charge-offs YTD |
|
$ |
1,892 |
|
|
$ |
7,811 |
|
|
$ |
22,112 |
|
|
$ |
15,703 |
|
|
$ |
956 |
|
|
$ |
16,786 |
|
|
$ |
7,416 |
|
|
$ |
4,018 |
|
|
$ |
76,694 |
|
| |
|
Commercial and Industrial - Owner Occupied |
|
| |
|
Period Originated: |
|
|
|
|
|
|
|
|
|
|
| (Dollars in thousands) |
|
2024 |
|
|
2023 |
|
|
2022 |
|
|
2021 |
|
|
2020 |
|
|
Prior |
|
|
Revolving
Loans
|
|
|
Revolving
Loans
Converted to
Term
|
|
|
Total |
|
| Pass |
|
$ |
704,999 |
|
|
$ |
607,548 |
|
|
$ |
893,114 |
|
|
$ |
756,156 |
|
|
$ |
402,671 |
|
|
$ |
1,122,908 |
|
|
$ |
123,149 |
|
|
$ |
230 |
|
|
$ |
4,610,775 |
|
| Special Mention |
|
|
— |
|
|
|
— |
|
|
|
— |
|
|
|
— |
|
|
|
815 |
|
|
|
— |
|
|
|
— |
|
|
|
— |
|
|
|
815 |
|
| Substandard |
|
|
2,249 |
|
|
|
5,616 |
|
|
|
6,638 |
|
|
|
5,204 |
|
|
|
2,057 |
|
|
|
18,889 |
|
|
|
710 |
|
|
|
— |
|
|
|
41,363 |
|
| Impaired |
|
|
394 |
|
|
|
2,335 |
|
|
|
5,911 |
|
|
|
1,053 |
|
|
|
— |
|
|
|
1,275 |
|
|
|
— |
|
|
|
— |
|
|
|
10,968 |
|
| PCD (Loss) |
|
|
— |
|
|
|
— |
|
|
|
— |
|
|
|
— |
|
|
|
— |
|
|
|
1,094 |
|
|
|
— |
|
|
|
— |
|
|
|
1,094 |
|
| Total |
|
$ |
707,642 |
|
|
$ |
615,499 |
|
|
$ |
905,663 |
|
|
$ |
762,413 |
|
|
$ |
405,543 |
|
|
$ |
1,144,166 |
|
|
$ |
123,859 |
|
|
$ |
230 |
|
|
$ |
4,665,015 |
|
| % Criticized |
|
|
0.4 |
% |
|
|
1.3 |
% |
|
|
1.4 |
% |
|
|
0.8 |
% |
|
|
0.7 |
% |
|
|
1.9 |
% |
|
|
0.6 |
% |
|
|
— |
% |
|
|
1.2 |
% |
| Gross charge-offs YTD |
|
$ |
— |
|
|
$ |
1 |
|
|
$ |
263 |
|
|
$ |
6 |
|
|
$ |
41 |
|
|
$ |
67 |
|
|
$ |
1 |
|
|
$ |
— |
|
|
$ |
379 |
|
| |
|
Commercial Real Estate - Construction, Acquisition & Development |
|
| |
|
Period Originated: |
|
|
|
|
|
|
|
|
|
|
| (Dollars in thousands) |
|
2024 |
|
|
2023 |
|
|
2022 |
|
|
2021 |
|
|
2020 |
|
|
Prior |
|
|
Revolving
Loans |
|
|
Revolving
Loans
Converted
to Term |
|
|
Total |
|
| Pass |
|
$ |
1,058,203 |
|
|
$ |
790,695 |
|
|
$ |
1,261,256 |
|
|
$ |
592,454 |
|
|
$ |
50,123 |
|
|
$
|
76,347 |
|
|
$ |
64,061 |
|
|
$ |
3,717 |
|
|
$ |
3,896,856 |
|
| Substandard |
|
|
264 |
|
|
|
2,032 |
|
|
|
3,514 |
|
|
|
5,889 |
|
|
|
304 |
|
|
|
259 |
|
|
|
— |
|
|
|
— |
|
|
|
12,262 |
|
| Impaired |
|
|
— |
|
|
|
— |
|
|
|
— |
|
|
|
— |
|
|
|
66 |
|
|
|
— |
|
|
|
— |
|
|
|
— |
|
|
|
66 |
|
| Total |
|
$ |
1,058,467 |
|
|
$ |
792,727 |
|
|
$ |
1,264,770 |
|
|
$ |
598,343 |
|
|
$ |
50,493 |
|
|
$ |
76,606 |
|
|
$ |
64,061 |
|
|
$ |
3,717 |
|
|
$ |
3,909,184 |
|
| % Criticized |
|
|
— |
% |
|
|
0.3 |
% |
|
|
0.3 |
% |
|
|
1.0 |
% |
|
|
0.7 |
% |
|
|
0.3 |
% |
|
|
—% |
|
|
|
— |
% |
|
|
0.3 |
% |
| Gross charge-offs YTD |
|
$ |
— |
|
|
$ |
19 |
|
|
$ |
101 |
|
|
$ |
537 |
|
|
$ |
35 |
|
|
$ |
2 |
|
|
$ |
85 |
|
|
$ |
— |
|
|
$ |
779 |
|
| |
|
Commercial Real Estate - Income Producing |
|
| |
|
Period Originated: |
|
|
|
|
|
|
|
|
|
|
| (Dollars in thousands) |
|
2024 |
|
|
2023 |
|
|
2022 |
|
|
2021 |
|
|
2020 |
|
|
Prior |
|
|
Revolving
Loans |
|
|
Revolving
Loans
Converted
to Term |
|
|
Total |
|
| Pass |
|
$ |
497,633 |
|
|
$ |
540,956 |
|
|
$ |
1,595,416 |
|
|
$ |
1,192,329 |
|
|
$ |
511,254 |
|
|
$ |
1,404,264 |
|
|
$ |
108,850 |
|
|
$ |
— |
|
|
$ |
5,850,702 |
|
| Special Mention |
|
|
— |
|
|
|
— |
|
|
|
2,881 |
|
|
|
— |
|
|
|
— |
|
|
|
— |
|
|
|
2,213 |
|
|
|
— |
|
|
|
5,094 |
|
| Substandard |
|
|
— |
|
|
|
459 |
|
|
|
468 |
|
|
|
7,690 |
|
|
|
70,889 |
|
|
|
64,084 |
|
|
|
494 |
|
|
|
— |
|
|
|
144,084 |
|
| Impaired |
|
|
— |
|
|
|
— |
|
|
|
4,885 |
|
|
|
1,114 |
|
|
|
— |
|
|
|
9,894 |
|
|
|
— |
|
|
|
— |
|
|
|
15,893 |
|
| Total |
|
$ |
497,633 |
|
|
$ |
541,415 |
|
|
$ |
1,603,650 |
|
|
$ |
1,201,133 |
|
|
$ |
582,143 |
|
|
$ |
1,478,242 |
|
|
$ |
111,557 |
|
|
$ |
— |
|
|
$ |
6,015,773 |
|
| % Criticized |
|
|
— |
% |
|
|
0.1 |
% |
|
|
0.5 |
% |
|
|
0.7 |
% |
|
|
12.2 |
% |
|
|
5.0 |
% |
|
|
2.4 |
% |
|
|
— |
% |
|
|
2.7 |
% |
| Gross charge-offs YTD |
|
$ |
— |
|
|
$ |
— |
|
|
$ |
3 |
|
|
$ |
21 |
|
|
$ |
— |
|
|
$ |
2,479 |
|
|
$ |
— |
|
|
$ |
— |
|
|
$ |
2,503 |
|
| |
|
Consumer - Residential Mortgages |
|
| |
|
Period Originated: |
|
|
|
|
|
|
|
|
|
|
| (Dollars in thousands) |
|
2024 |
|
|
2023 |
|
|
2022 |
|
|
2021 |
|
|
2020 |
|
|
Prior |
|
|
Revolving
Loans |
|
|
Revolving
Loans
Converted
to Term |
|
|
Total |
|
| Pass |
|
$ |
1,356,015 |
|
|
$ |
1,477,090 |
|
|
$ |
1,991,600 |
|
|
$ |
1,545,259 |
|
|
$ |
992,426 |
|
|
$ |
1,734,512 |
|
|
$ |
1,069,608 |
|
|
$ |
1,320 |
|
|
$ |
10,167,830 |
|
| Special Mention |
|
|
101 |
|
|
|
790 |
|
|
|
— |
|
|
|
— |
|
|
|
— |
|
|
|
— |
|
|
|
— |
|
|
|
— |
|
|
|
891 |
|
| Substandard |
|
|
1,549 |
|
|
|
12,696 |
|
|
|
18,477 |
|
|
|
14,661 |
|
|
|
9,145 |
|
|
|
28,774 |
|
|
|
4,295 |
|
|
|
— |
|
|
|
89,597 |
|
| Impaired |
|
|
— |
|
|
|
— |
|
|
|
— |
|
|
|
3,979 |
|
|
|
1,675 |
|
|
|
— |
|
|
|
2,500 |
|
|
|
— |
|
|
|
8,154 |
|
| PCD (Loss) |
|
|
— |
|
|
|
— |
|
|
|
— |
|
|
|
— |
|
|
|
— |
|
|
|
1,411 |
|
|
|
— |
|
|
|
— |
|
|
|
1,411 |
|
| Total |
|
$ |
1,357,665 |
|
|
$ |
1,490,576 |
|
|
$ |
2,010,077 |
|
|
$ |
1,563,899 |
|
|
$ |
1,003,246 |
|
|
$ |
1,764,697 |
|
|
$ |
1,076,403 |
|
|
$ |
1,320 |
|
|
$ |
10,267,883 |
|
| % Criticized |
|
|
0.1 |
% |
|
|
0.9 |
% |
|
|
0.9 |
% |
|
|
1.2 |
% |
|
|
1.1 |
% |
|
|
1.7 |
% |
|
|
0.6 |
% |
|
|
— |
% |
|
|
1.0 |
% |
| Gross charge-offs YTD |
|
$ |
10 |
|
|
$ |
325 |
|
|
$ |
559 |
|
|
$ |
430 |
|
|
$ |
81 |
|
|
$ |
749 |
|
|
$ |
1,007 |
|
|
$ |
— |
|
|
$ |
3,161 |
|
| |
|
Consumer - Other Consumer |
|
| |
|
Period Originated: |
|
|
|
|
|
|
|
|
|
|
| (Dollars in thousands) |
|
2024 |
|
|
2023 |
|
|
2022 |
|
|
2021 |
|
|
2020 |
|
|
Prior |
|
|
Revolving
Loans
|
|
|
Revolving
Loans
Converted to
Term
|
|
|
Total |
|
| Pass |
|
$ |
45,997 |
|
|
$ |
29,538 |
|
|
$ |
11,471 |
|
|
$ |
6,150 |
|
|
$ |
3,263 |
|
|
$ |
2,105 |
|
|
$ |
114,341 |
|
|
$ |
— |
|
|
$ |
212,865 |
|
| Substandard |
|
|
— |
|
|
|
97 |
|
|
|
48 |
|
|
|
6 |
|
|
|
— |
|
|
|
17 |
|
|
|
338 |
|
|
|
— |
|
|
|
506 |
|
| Total |
|
$ |
45,997 |
|
|
$ |
29,635 |
|
|
$ |
11,519 |
|
|
$ |
6,156 |
|
|
$ |
3,263 |
|
|
$ |
2,122 |
|
|
$ |
114,679 |
|
|
$ |
— |
|
|
$ |
213,371 |
|
| % Criticized |
|
|
— |
% |
|
|
0.3 |
% |
|
|
0.4 |
% |
|
|
0.1 |
% |
|
|
— |
% |
|
|
0.8 |
% |
|
|
0.3 |
% |
|
|
— |
% |
|
|
0.2 |
% |
| Gross charge-offs YTD |
|
$ |
3,067 |
|
|
$ |
395 |
|
|
$ |
303 |
|
|
$ |
145 |
|
|
$ |
14 |
|
|
$ |
47 |
|
|
$ |
2,917 |
|
|
$ |
— |
|
|
$ |
6,888 |
|
The Company’s collateral-dependent loans totaled $65.8 million and $81.8 million at September 30, 2025 and December 31, 2024, respectively.
Typically these loans are internally classified as “Impaired” and “PCD Loss.” At September 30, 2025 and December 31, 2024, $8.2 million and $8.7 million, respectively, of these loans were classified as doubtful. At September 30, 2025, most of these
loans are within the non-real estate class. Additionally, there were smaller amounts of these loans in the owner occupied, income producing, CAD, and residential mortgages classes. C&I loans are typically supported by collateral such as real
estate, receivables, equipment, inventory, or by an enterprise valuation. Loans within the CRE and Consumer segments are generally secured by commercial and residential real estate.
Loans of $1.5 million or greater are considered for specific provision when management has determined based on current information and events, it
is probable that the Company will be unable to collect all amounts due according to the contractual terms of the note and that the loan is collateral-dependent. At September 30, 2025 and December 31, 2024, $58.5 million and $59.1 million, respectively,
of collateral-dependent loans had a valuation allowance of $30.0 million and $17.3 million, respectively. The remaining balance of collateral-dependent loans of $7.3 million and $22.7 million at September 30, 2025 and December 31, 2024, respectively,
have sufficient collateral supporting the collection of all contractual principal and interest or were charged down to the underlying collateral’s fair value, less estimated selling costs. Therefore, such loans did not have an associated valuation
allowance.
NPLs consist of nonaccrual loans and leases. At September 30, 2025 and December 31, 2024, NPLs totaled $249.8 million and $264.7 million,
respectively. Within the NPL balance, $45.4 million of the September 30, 2025 balance and $89.9 million of the December 31, 2024 balance is covered by government guarantees from the SBA, FHA, VA or USDA.
The Company’s policy for all loan classifications provides that loans and leases are generally placed in nonaccrual status if, in management’s
opinion, payment in full of principal or interest is not expected, unless such loan or lease is both well-secured and in the process of collection.
The following table presents the amortized cost basis of loans on nonaccrual status by segment and class at the periods indicated:
| |
|
September 30, 2025 |
|
|
December 31, 2024 |
|
| (In thousands) |
|
Nonaccrual Loans (1) |
|
|
Nonaccrual Loans
with No Related
Allowance |
|
|
Nonaccrual Loans |
|
|
Nonaccrual Loans
with No Related
Allowance |
|
| Commercial and industrial |
|
|
|
|
|
|
|
|
|
|
|
|
|
|
|
|
| Non-real estate |
|
$ |
83,090 |
|
|
$ |
1,256 |
|
|
$ |
145,115 |
|
|
$ |
2,944 |
|
| Owner occupied |
|
|
20,067 |
|
|
|
— |
|
|
|
16,904 |
|
|
|
5,128 |
|
| Total commercial and industrial |
|
|
103,157 |
|
|
|
1,256 |
|
|
|
162,019 |
|
|
|
8,072 |
|
| Commercial real estate |
|
|
|
|
|
|
|
|
|
|
|
|
|
|
|
|
| Construction, acquisition and development |
|
|
2,099 |
|
|
|
66 |
|
|
|
8,600 |
|
|
|
66 |
|
| Income producing |
|
|
50,595 |
|
|
|
862 |
|
|
|
18,542 |
|
|
|
6,569 |
|
| Total commercial real estate |
|
|
52,694 |
|
|
|
928 |
|
|
|
27,142 |
|
|
|
6,635 |
|
| Consumer |
|
|
|
|
|
|
|
|
|
|
|
|
|
|
|
|
| Residential mortgages |
|
|
93,608 |
|
|
|
174 |
|
|
|
75,287 |
|
|
|
3,979 |
|
| Other consumer |
|
|
363 |
|
|
|
— |
|
|
|
244 |
|
|
|
— |
|
| Total consumer |
|
|
93,971 |
|
|
|
174 |
|
|
|
75,531 |
|
|
|
3,979 |
|
| Total |
|
$ |
249,822 |
|
|
$ |
2,358 |
|
|
$ |
264,692 |
|
|
$ |
18,686 |
|
|
(1) |
At September 30, 2025, NPL does not include NPL held for sale of $0.3 million. |
The following table presents the interest income recognized on loans on nonaccrual status by segment and class for the periods indicated:
| |
|
Three Months Ended September 30, |
|
|
Nine Months Ended September 30, |
|
| (In thousands) |
|
2025 |
|
|
2024 |
|
|
2025 |
|
|
2024 |
|
| Commercial and industrial |
|
|
|
|
|
|
|
|
|
|
|
|
|
|
|
|
| Non-real estate |
|
$ |
413 |
|
|
$ |
765 |
|
|
$ |
1,605 |
|
|
$ |
1,945 |
|
| Owner occupied |
|
|
323 |
|
|
|
67 |
|
|
|
676 |
|
|
|
204 |
|
| Total commercial and industrial |
|
|
736 |
|
|
|
832 |
|
|
|
2,281 |
|
|
|
2,149 |
|
| Commercial real estate |
|
|
|
|
|
|
|
|
|
|
|
|
|
|
|
|
| Construction, acquisition and development |
|
|
44 |
|
|
|
17 |
|
|
|
76 |
|
|
|
63 |
|
| Income producing |
|
|
755 |
|
|
|
258 |
|
|
|
1,052 |
|
|
|
323 |
|
| Total commercial real estate |
|
|
799 |
|
|
|
275 |
|
|
|
1,128 |
|
|
|
386 |
|
| Consumer |
|
|
|
|
|
|
|
|
|
|
|
|
|
|
|
|
| Residential mortgages |
|
|
823 |
|
|
|
525 |
|
|
|
1,982 |
|
|
|
1,466 |
|
| Other consumer |
|
|
8 |
|
|
|
1 |
|
|
|
20 |
|
|
|
2 |
|
| Total consumer |
|
|
831 |
|
|
|
526 |
|
|
|
2,002 |
|
|
|
1,468 |
|
| Total |
|
$ |
2,366 |
|
|
$ |
1,633 |
|
|
$ |
5,411 |
|
|
$ |
4,003 |
|
In the ordinary course of business, management may grant concessions, which would not otherwise be considered, to borrowers that are experiencing
financial difficulty. Loans identified as meeting the criteria under ASC 310 are identified as FDM. Any modification, renewal or forbearance on loans assigned a rating of “Special Mention” or worse, and loans of any rating which show evidence of
financial difficulty is reviewed to determine whether the borrower is experiencing financial difficulty and if so, which terms of the loan were modified. If the borrower is experiencing financial difficulty and the loan is modified via forgiveness of
principal, reduction in interest rate to a rate below current market rates for issuance, payment extension or deferral for greater than six months (including extensions granted in the past 12 months), term or maturity date extension, or combination of
these specific modification terms, the modification requires disclosure.
Under general loan modification guidance, a modification is treated as a new loan only if both of the following conditions are met: 1) the terms
of the new loan are at least as favorable to the lender as the terms for comparable loans to other customers with similar collection risks, and 2) modifications to the terms of the original loan are more than minor. If either condition is not met, the
modification is accounted for as the continuation of the old loan with any effect of the modification treated as a prospective adjustment to the loan’s EIR. Modifications in scope for borrowers experiencing financial difficulty may include principal
forgiveness, other-than-insignificant payment delay, interest rate reduction, or a combination of modifications. During the nine months ended September 30, 2025, the most common individual concessions were related to term extensions and payment
deferrals. Other concessions included interest rate reductions. At September 30, 2025, the Company has an outstanding unfunded commitment balance of $5.8 million to lend to four borrowers experiencing financial difficulty.
Upon determination by the Company that a modified loan (or portion of a loan) has subsequently been deemed uncollectible, the loan (or portion of
the loan) is charged off. The amortized cost basis of the loan is reduced by the uncollectible amount and the ACL is adjusted by this amount.
The following tables presents loans that were modified within the past three and nine months for borrowers experiencing financial difficulty by
segment and class, as well as the percentage of these modified loans compared to overall loans in each segment and class, for the three and nine months ended September 30, 2025 and September 30, 2024:
| |
|
Three Months Ended September 30, 2025 |
|
| (Dollars in thousands) |
|
Payment
Deferral |
|
|
Combination
Payment
Deferral and
Term Extension |
|
|
Term
Extension |
|
|
Combination
Interest Rate
Reduction and
Payment
Deferral |
|
|
Combination
Term Extension
and Interest
Rate Reduction |
|
|
Percent of
Total Loan
Class |
|
| Commercial and industrial |
|
|
|
|
|
|
|
|
|
|
|
|
|
|
|
|
|
|
|
|
|
|
|
|
| Non-real estate |
|
$ |
3,601 |
|
|
$ |
20,795 |
|
|
$ |
22,890 |
|
|
$ |
189 |
|
|
$ |
726 |
|
|
|
0.52 |
% |
| Owner occupied |
|
|
— |
|
|
|
— |
|
|
|
— |
|
|
|
— |
|
|
|
2,114 |
|
|
|
0.04 |
% |
| Total commercial and industrial |
|
|
3,601 |
|
|
|
20,795 |
|
|
|
22,890 |
|
|
|
189 |
|
|
|
2,840 |
|
|
|
0.35 |
% |
| Commercial real estate |
|
|
|
|
|
|
|
|
|
|
|
|
|
|
|
|
|
|
|
|
|
|
|
|
| Income producing |
|
|
40,383 |
|
|
|
— |
|
|
|
— |
|
|
|
— |
|
|
|
— |
|
|
|
0.57 |
% |
| Total commercial real estate |
|
|
40,383 |
|
|
|
— |
|
|
|
— |
|
|
|
— |
|
|
|
— |
|
|
|
0.39 |
% |
| Consumer |
|
|
|
|
|
|
|
|
|
|
|
|
|
|
|
|
|
|
|
|
|
|
|
|
| Residential mortgages |
|
|
71 |
|
|
|
— |
|
|
|
760 |
|
|
|
— |
|
|
|
— |
|
|
|
0.01 |
% |
| Total consumer |
|
|
71 |
|
|
|
— |
|
|
|
760 |
|
|
|
— |
|
|
|
— |
|
|
|
0.01 |
% |
| Total loans and leases, net of unearned income |
|
$ |
44,055 |
|
|
$ |
20,795 |
|
|
$ |
23,650 |
|
|
$ |
189 |
|
|
$ |
2,840 |
|
|
|
0.25 |
% |
| |
|
Three Months Ended September 30, 2024 |
|
| (Dollars in thousands) |
|
Payment
Deferral |
|
|
Combination
Payment
Deferral and
Term Extension
|
|
|
Term
Extension |
|
|
Interest Rate
Reduction |
|
|
Combination
Term Extension
and Interest
Rate Reduction |
|
|
Percent of
Total Loan
Class |
|
| Commercial and industrial |
|
|
|
|
|
|
|
|
|
|
|
|
|
|
|
|
|
|
|
|
|
|
|
|
| Non-real estate |
|
$ |
450 |
|
|
$ |
— |
|
|
$ |
32,860 |
|
|
$ |
15,043 |
|
|
$ |
6,044 |
|
|
|
0.63 |
% |
| Total commercial and industrial |
|
|
450 |
|
|
|
— |
|
|
|
32,860 |
|
|
|
15,043 |
|
|
|
6,044 |
|
|
|
0.41 |
% |
| Commercial real estate |
|
|
|
|
|
|
|
|
|
|
|
|
|
|
|
|
|
|
|
|
|
|
|
|
| Income producing |
|
|
— |
|
|
|
30,654 |
|
|
|
36,288 |
|
|
|
— |
|
|
|
— |
|
|
|
1.12 |
% |
| Total commercial real estate |
|
|
— |
|
|
|
30,654 |
|
|
|
36,288 |
|
|
|
— |
|
|
|
— |
|
|
|
0.68 |
% |
| Consumer |
|
|
|
|
|
|
|
|
|
|
|
|
|
|
|
|
|
|
|
|
|
|
|
|
| Residential mortgages |
|
|
— |
|
|
|
— |
|
|
|
— |
|
|
|
— |
|
|
|
25 |
|
|
|
— |
% |
| Total consumer |
|
|
— |
|
|
|
— |
|
|
|
— |
|
|
|
— |
|
|
|
25 |
|
|
|
— |
% |
| Total loans and leases, net of unearned income |
|
$ |
450 |
|
|
$ |
30,654 |
|
|
$ |
69,148 |
|
|
$ |
15,043 |
|
|
$ |
6,069 |
|
|
|
0.36 |
% |
| |
|
Nine Months Ended September 30, 2025 |
|
| (Dollars in thousands) |
|
Payment
Deferral |
|
|
Combination
Payment
Deferral and
Term
Extension |
|
|
Term
Extension |
|
|
Interest Rate
Reduction |
|
|
Combination
Interest Rate
Reduction and
Payment
Deferral |
|
|
Combination
Term
Extension and
Interest Rate
Reduction |
|
|
Percent of
Total Loan
Class |
|
| Commercial and industrial |
|
|
|
|
|
|
|
|
|
|
|
|
|
|
|
|
|
|
|
|
|
|
|
|
|
|
|
|
| Non-real estate |
|
$ |
11,889 |
|
|
$ |
20,795 |
|
|
$ |
48,356 |
|
|
$ |
260 |
|
|
$ |
357 |
|
|
$ |
41,250 |
|
|
|
1.33 |
% |
| Owner occupied |
|
|
— |
|
|
|
— |
|
|
|
— |
|
|
|
— |
|
|
|
— |
|
|
|
2,114 |
|
|
|
0.04 |
% |
| Total commercial and industrial |
|
|
11,889 |
|
|
|
20,795 |
|
|
|
48,356 |
|
|
|
260 |
|
|
|
357 |
|
|
|
43,364 |
|
|
|
0.86 |
% |
| Commercial real estate |
|
|
|
|
|
|
|
|
|
|
|
|
|
|
|
|
|
|
|
|
|
|
|
|
|
|
|
|
| Income producing |
|
|
40,383 |
|
|
|
— |
|
|
|
— |
|
|
|
— |
|
|
|
— |
|
|
|
— |
|
|
|
0.57 |
% |
| Total commercial real estate |
|
|
40,383 |
|
|
|
— |
|
|
|
— |
|
|
|
— |
|
|
|
— |
|
|
|
— |
|
|
|
0.39 |
% |
| Consumer |
|
|
|
|
|
|
|
|
|
|
|
|
|
|
|
|
|
|
|
|
|
|
|
|
|
|
|
|
| Residential mortgages |
|
|
353 |
|
|
|
— |
|
|
|
760 |
|
|
|
— |
|
|
|
467 |
|
|
|
— |
|
|
|
0.01 |
% |
| Total consumer |
|
|
353 |
|
|
|
— |
|
|
|
760 |
|
|
|
— |
|
|
|
467 |
|
|
|
— |
|
|
|
0.01 |
% |
| Total loans and leases, net of unearned income |
|
$ |
52,625 |
|
|
$ |
20,795 |
|
|
$ |
49,116 |
|
|
$ |
260 |
|
|
$ |
824 |
|
|
$ |
43,364 |
|
|
|
0.45 |
% |
| |
|
Nine Months Ended September 30, 2024 |
|
| (Dollars in thousands) |
|
Principal
Forgiveness |
|
|
Payment
Deferral |
|
|
Combination
Payment
Deferral and
Term
Extension |
|
|
Term
Extension |
|
|
Interest
Rate
Reduction |
|
|
Combination
Interest Rate
Reduction and
Payment Deferral |
|
|
Combination
Term
Extension
and Interest
Rate
Reduction |
|
|
Combination
Term
Extension,
Payment
Deferral and
Interest Rate
Reduction |
|
|
Percent of
Total Loan
Class |
|
| Commercial and industrial |
|
|
|
|
|
|
|
|
|
|
|
|
|
|
|
|
|
|
|
|
|
|
|
|
|
|
|
|
|
|
|
|
|
|
|
|
| Non-real estate |
|
$ |
13,163 |
|
|
$ |
450 |
|
|
$ |
6,686 |
|
|
$ |
56,932 |
|
|
$ |
15,043 |
|
|
$ |
115 |
|
|
$ |
13,878 |
|
|
$ |
— |
|
|
|
1.22 |
% |
| Owner occupied |
|
|
— |
|
|
|
— |
|
|
|
— |
|
|
|
1,582 |
|
|
|
— |
|
|
|
— |
|
|
|
1,370 |
|
|
|
— |
|
|
|
0.06 |
% |
| Total commercial and industrial |
|
|
13,163 |
|
|
|
450 |
|
|
|
6,686 |
|
|
|
58,514 |
|
|
|
15,043 |
|
|
|
115 |
|
|
|
15,248 |
|
|
|
— |
|
|
|
0.82 |
% |
| Commercial real estate |
| Income producing |
|
|
— |
|
|
|
— |
|
|
|
30,654 |
|
|
|
45,512 |
|
|
|
— |
|
|
|
— |
|
|
|
— |
|
|
|
12,786 |
|
|
|
1.49 |
% |
| Total commercial real estate |
|
|
— |
|
|
|
— |
|
|
|
30,654 |
|
|
|
45,512 |
|
|
|
— |
|
|
|
— |
|
|
|
— |
|
|
|
12,786 |
|
|
|
0.90 |
% |
| Consumer |
| Residential mortgages |
|
|
— |
|
|
|
— |
|
|
|
— |
|
|
|
208 |
|
|
|
179 |
|
|
|
100 |
|
|
|
636 |
|
|
|
— |
|
|
|
0.01 |
% |
| Other consumer |
|
|
— |
|
|
|
— |
|
|
|
20 |
|
|
|
— |
|
|
|
— |
|
|
|
— |
|
|
|
— |
|
|
|
— |
|
|
|
0.01 |
% |
| Total consumer |
|
|
— |
|
|
|
— |
|
|
|
20 |
|
|
|
208 |
|
|
|
179 |
|
|
|
100 |
|
|
|
636 |
|
|
|
— |
|
|
|
0.01 |
% |
| Total loans and leases, net of unearned income |
|
$ |
13,163 |
|
|
$ |
450 |
|
|
$ |
37,360 |
|
|
$ |
104,234 |
|
|
$ |
15,222 |
|
|
$ |
215 |
|
|
$ |
15,884 |
|
|
$ |
12,786 |
|
|
|
0.60 |
% |
The following table presents the financial effect of the loan modifications presented above for borrowers experiencing financial difficulty for
the following periods:
| |
|
Three Months Ended September 30, 2025 |
|
|
Three Months Ended September 30, 2024 |
|
| |
|
Weighted-Average
Interest Rate
Reduction |
|
|
Weighted- Average
Term Extension
(in years) |
|
|
Weighted-Average
Interest Rate
Reduction |
|
|
Weighted-Average
Term Extension
(in years) |
|
| Commercial and industrial |
|
|
|
|
|
|
|
|
|
|
|
|
|
|
|
|
| Non-real estate |
|
|
2.76 |
% |
|
|
0.79 |
|
|
|
1.12 |
% |
|
|
1.32 |
|
| Owner occupied |
|
|
4.43 |
|
|
|
6.00 |
|
|
|
— |
|
|
|
— |
|
| Commercial real estate |
|
|
|
|
|
|
|
|
|
|
|
|
|
|
|
|
| Income producing |
|
|
— |
|
|
|
— |
|
|
|
— |
|
|
|
1.73 |
|
| Consumer |
|
|
|
|
|
|
|
|
|
|
|
|
|
|
|
|
| Residential mortgages |
|
|
— |
|
|
|
3.95 |
|
|
|
2.00 |
|
|
|
5.00 |
|
| |
|
Nine Months Ended September 30, 2025 |
|
|
Nine Months Ended September 30, 2024 |
|
| (Dollars in thousands) |
|
Weighted-Average
Interest Rate
Reduction |
|
|
Weighted-Average
Term Extension
(in years) |
|
|
Principal
Forgiveness |
|
|
Weighted-Average
Interest Rate
Reduction |
|
|
Weighted-Average
Term Extension
(in years) |
|
| Commercial and industrial |
|
|
|
|
|
|
|
|
|
|
|
|
|
|
|
|
|
|
|
|
| Non-real estate |
|
|
2.26 |
% |
|
|
1.58 |
|
|
$ |
5,835 |
|
|
|
1.14 |
% |
|
|
1.24 |
|
| Owner occupied |
|
|
4.43 |
|
|
|
6.00 |
|
|
|
— |
|
|
|
3.91 |
|
|
|
14.11 |
|
| Commercial real estate |
|
|
|
|
|
|
|
|
|
|
|
|
|
|
|
|
|
|
|
|
| Income producing |
|
|
— |
|
|
|
— |
|
|
|
— |
|
|
|
0.54 |
|
|
|
1.72 |
|
| Consumer |
|
|
|
|
|
|
|
|
|
|
|
|
|
|
|
|
|
|
|
|
| Residential mortgages |
|
|
2.50 |
|
|
|
3.95 |
|
|
|
— |
|
|
|
3.01 |
|
|
|
8.40 |
|
| Other consumer |
|
|
— |
|
|
|
— |
|
|
|
— |
|
|
|
3.69 |
|
|
|
2.18 |
|
During the three and nine months ended September 30, 2025, ten C&I non-real estate loans totaling $34.9 million had a payment default that was
previously modified in the prior 12 months. Of the $34.9 million, $34.7 million was by receiving a combination term extension and interest rate reduction and $0.2 million was by an interest rate reduction.
The Company closely monitors the performance of the loans that are modified to borrowers experiencing financial difficulty to understand the
effectiveness of its modification efforts. Loans are considered to be in payment default at 90 or more days past due. The following table depicts the performance of loans that have been modified in the last 12 months:
| |
|
Payment Status (Amortized Cost Basis) at September 30, 2025 |
|
| (In thousands) |
|
Current |
|
|
30-89 Days Past Due |
|
|
90+ Days Past Due |
|
| Commercial and industrial |
|
|
|
|
|
|
|
|
|
|
|
|
| Non-real estate |
|
$ |
87,109 |
|
|
$ |
14,050 |
|
|
$ |
34,938 |
|
| Owner occupied |
|
|
2,113 |
|
|
|
— |
|
|
|
— |
|
| Commercial real estate |
|
|
|
|
|
|
|
|
|
|
|
|
| Income producing |
|
|
40,383 |
|
|
|
— |
|
|
|
— |
|
| Consumer |
|
|
|
|
|
|
|
|
|
|
|
|
| Residential mortgages |
|
|
1,581 |
|
|
|
— |
|
|
|
— |
|
| Total |
|
$ |
131,186 |
|
|
$ |
14,050 |
|
|
$ |
34,938 |
|
NOTE 5. ALLOWANCE FOR CREDIT LOSSES
The following table summarizes the changes in the ACL for the periods indicated:
| |
|
Three Months Ended September 30, |
|
|
Nine Months Ended September 30, |
|
| (In thousands) |
|
2025 |
|
|
2024 |
|
|
2025 |
|
|
2024 |
|
| Balance at beginning of period |
|
$ |
474,651 |
|
|
$ |
470,022 |
|
|
$ |
460,793 |
|
|
$ |
468,034 |
|
| Charge-offs |
|
|
(26,368 |
) |
|
|
(24,523 |
) |
|
|
(77,421 |
) |
|
|
(72,442 |
) |
| Recoveries |
|
|
2,767 |
|
|
|
2,360 |
|
|
|
9,603 |
|
|
|
8,267 |
|
| Initial allowance on PCD loans |
|
|
15,149 |
|
|
|
— |
|
|
|
23,224 |
|
|
|
— |
|
| Provision for loan losses |
|
|
30,000 |
|
|
|
13,000 |
|
|
|
80,000 |
|
|
|
57,000 |
|
| Balance at end of period |
|
$ |
496,199 |
|
|
$ |
460,859 |
|
|
$ |
496,199 |
|
|
$ |
460,859 |
|
The following tables summarize the changes in the ACL by segment and class for the periods indicated:
| |
|
Three Months Ended September 30, 2025 |
|
| (In thousands) |
|
Beginning
Balance |
|
|
Initial
Allowance on
PCD loans |
|
|
Charge-offs |
|
|
Recoveries |
|
|
Provision
(Release) |
|
|
Ending
Balance |
|
| Commercial and industrial |
|
|
|
|
|
|
|
|
|
|
|
|
|
|
|
|
|
|
|
|
|
|
|
|
| Non-real estate |
|
$ |
162,371 |
|
|
$ |
10,995 |
|
|
$ |
(21,790 |
) |
|
$ |
1,748 |
|
|
$ |
41,187 |
|
|
$ |
194,511 |
|
| Owner occupied |
|
|
42,399 |
|
|
|
3,281 |
|
|
|
(534 |
) |
|
|
64 |
|
|
|
5,966 |
|
|
|
51,176 |
|
| Total commercial and industrial |
|
|
204,770 |
|
|
|
14,276 |
|
|
|
(22,324 |
) |
|
|
1,812 |
|
|
|
47,153 |
|
|
|
245,687 |
|
| Commercial real estate |
|
|
|
|
|
|
|
|
|
|
|
|
|
|
|
|
|
|
|
|
|
|
|
|
Construction, acquisition and
development |
|
|
49,080 |
|
|
|
111 |
|
|
|
(391 |
) |
|
|
56 |
|
|
|
(9,466 |
) |
|
|
39,390 |
|
| Income producing |
|
|
84,366 |
|
|
|
192 |
|
|
|
— |
|
|
|
73 |
|
|
|
(17,378 |
) |
|
|
67,253 |
|
| Total commercial real estate |
|
|
133,446 |
|
|
|
303 |
|
|
|
(391 |
) |
|
|
129 |
|
|
|
(26,844 |
) |
|
|
106,643 |
|
| Consumer |
|
|
|
|
|
|
|
|
|
|
|
|
|
|
|
|
|
|
|
|
|
|
|
|
| Residential mortgages |
|
|
128,826 |
|
|
|
480 |
|
|
|
(1,934 |
) |
|
|
344 |
|
|
|
8,231 |
|
|
|
135,947 |
|
| Other consumer |
|
|
7,609 |
|
|
|
90 |
|
|
|
(1,719 |
) |
|
|
482 |
|
|
|
1,460 |
|
|
|
7,922 |
|
| Total consumer |
|
|
136,435 |
|
|
|
570 |
|
|
|
(3,653 |
) |
|
|
826 |
|
|
|
9,691 |
|
|
|
143,869 |
|
| Total |
|
$ |
474,651 |
|
|
$ |
15,149 |
|
|
$ |
(26,368 |
) |
|
$ |
2,767 |
|
|
$ |
30,000 |
|
|
$ |
496,199 |
|
| |
|
Nine Months Ended September 30, 2025 |
|
| (In thousands) |
|
Beginning
Balance |
|
|
Initial
Allowance on
PCD loans |
|
|
Charge-offs |
|
|
Recoveries |
|
|
Provision
(Release) |
|
|
Ending
Balance |
|
| Commercial and industrial |
|
|
|
|
|
|
|
|
|
|
|
|
|
|
|
|
|
|
|
|
|
|
|
|
| Non-real estate |
|
$ |
183,743 |
|
|
$ |
12,204 |
|
|
$ |
(59,521 |
) |
|
$ |
6,386 |
|
|
$ |
51,699 |
|
|
$ |
194,511 |
|
| Owner occupied |
|
|
35,177 |
|
|
|
5,558 |
|
|
|
(2,234 |
) |
|
|
439 |
|
|
|
12,236 |
|
|
|
51,176 |
|
| Total commercial and industrial |
|
|
218,920 |
|
|
|
17,762 |
|
|
|
(61,755 |
) |
|
|
6,825 |
|
|
|
63,935 |
|
|
|
245,687 |
|
| Commercial real estate |
|
|
|
|
|
|
|
|
|
|
|
|
|
|
|
|
|
|
|
|
|
|
|
|
Construction, acquisition and
development |
|
|
44,703 |
|
|
|
378 |
|
|
|
(728 |
) |
|
|
161 |
|
|
|
(5,124 |
) |
|
|
39,390 |
|
| Income producing |
|
|
64,957 |
|
|
|
4,259 |
|
|
|
(4,785 |
) |
|
|
161 |
|
|
|
2,661 |
|
|
|
67,253 |
|
| Total commercial real estate |
|
|
109,660 |
|
|
|
4,637 |
|
|
|
(5,513 |
) |
|
|
322 |
|
|
|
(2,463 |
) |
|
|
106,643 |
|
| Consumer |
|
|
|
|
|
|
|
|
|
|
|
|
|
|
|
|
|
|
|
|
|
|
|
|
| Residential mortgages |
|
|
125,464 |
|
|
|
726 |
|
|
|
(5,174 |
) |
|
|
1,125 |
|
|
|
13,806 |
|
|
|
135,947 |
|
| Other consumer |
|
|
6,749 |
|
|
|
99 |
|
|
|
(4,979 |
) |
|
|
1,331 |
|
|
|
4,722 |
|
|
|
7,922 |
|
| Total consumer |
|
|
132,213 |
|
|
|
825 |
|
|
|
(10,153 |
) |
|
|
2,456 |
|
|
|
18,528 |
|
|
|
143,869 |
|
| Total |
|
$ |
460,793 |
|
|
$ |
23,224 |
|
|
$ |
(77,421 |
) |
|
$ |
9,603 |
|
|
$ |
80,000 |
|
|
$ |
496,199 |
|
| |
|
Three Months Ended September 30, 2024 |
|
| (In thousands) |
|
Beginning
Balance |
|
|
Charge-offs |
|
|
Recoveries |
|
|
Provision
(Release) |
|
|
Ending
Balance |
|
| Commercial and industrial |
|
|
|
|
|
|
|
|
|
|
|
|
|
|
|
|
|
|
|
|
| Non-real estate |
|
$ |
198,796 |
|
|
$ |
(21,544 |
) |
|
$ |
1,382 |
|
|
$ |
10,894 |
|
|
$ |
189,528 |
|
| Owner occupied |
|
|
34,225 |
|
|
|
(76 |
) |
|
|
265 |
|
|
$ |
(1,926 |
) |
|
|
32,488 |
|
| Total commercial and industrial |
|
|
233,021 |
|
|
|
(21,620 |
) |
|
|
1,647 |
|
|
|
8,968 |
|
|
|
222,016 |
|
| Commercial real estate |
|
|
|
|
|
|
|
|
|
|
|
|
|
|
|
|
|
|
|
|
| Construction, acquisition and development |
|
|
34,644 |
|
|
|
(222 |
) |
|
|
36 |
|
|
$ |
2,107 |
|
|
|
36,565 |
|
| Income producing |
|
|
63,279 |
|
|
|
— |
|
|
|
29 |
|
|
$ |
(1,146 |
) |
|
|
62,162 |
|
| Total commercial real estate |
|
|
97,923 |
|
|
|
(222 |
) |
|
|
65 |
|
|
|
961 |
|
|
|
98,727 |
|
| Consumer |
|
|
|
|
|
|
|
|
|
|
|
|
|
|
|
|
|
|
|
|
| Residential mortgages |
|
|
133,093 |
|
|
|
(880 |
) |
|
|
288 |
|
|
$ |
1,361 |
|
|
|
133,862 |
|
| Other consumer |
|
|
5,985 |
|
|
|
(1,801 |
) |
|
|
360 |
|
|
$ |
1,710 |
|
|
|
6,254 |
|
| Total consumer |
|
|
139,078 |
|
|
|
(2,681 |
) |
|
|
648 |
|
|
|
3,071 |
|
|
|
140,116 |
|
| Total |
|
$ |
470,022 |
|
|
$ |
(24,523 |
) |
|
$ |
2,360 |
|
|
$ |
13,000 |
|
|
$ |
460,859 |
|
| |
|
Nine Months Ended September 30, 2024 |
|
| (In thousands) |
|
Beginning
Balance |
|
|
Charge-offs |
|
|
Recoveries |
|
|
Provision
(Release) |
|
|
Ending
Balance |
|
| Commercial and industrial |
|
|
|
|
|
|
|
|
|
|
|
|
|
|
|
|
|
|
|
|
| Non-real estate |
|
$ |
194,577 |
|
|
$ |
(61,580 |
) |
|
$ |
5,484 |
|
|
$ |
51,047 |
|
|
$ |
189,528 |
|
| Owner occupied |
|
|
31,445 |
|
|
|
(377 |
) |
|
|
418 |
|
|
$ |
1,002 |
|
|
|
32,488 |
|
| Total commercial and industrial |
|
|
226,022 |
|
|
|
(61,957 |
) |
|
|
5,902 |
|
|
|
52,049 |
|
|
|
222,016 |
|
| Commercial real estate |
|
|
|
|
|
|
|
|
|
|
|
|
|
|
|
|
|
|
|
|
| Construction, acquisition and development |
|
|
42,118 |
|
|
|
(759 |
) |
|
|
218 |
|
|
$ |
(5,012 |
) |
|
|
36,565 |
|
| Income producing |
|
|
69,209 |
|
|
|
(2,356 |
) |
|
|
98 |
|
|
$ |
(4,789 |
) |
|
|
62,162 |
|
| Total commercial real estate |
|
|
111,327 |
|
|
|
(3,115 |
) |
|
|
316 |
|
|
|
(9,801 |
) |
|
|
98,727 |
|
| Consumer |
|
|
|
|
|
|
|
|
|
|
|
|
|
|
|
|
|
|
|
|
| Residential mortgages |
|
|
124,851 |
|
|
|
(2,183 |
) |
|
|
850 |
|
|
$ |
10,344 |
|
|
|
133,862 |
|
| Other consumer |
|
|
5,834 |
|
|
|
(5,187 |
) |
|
|
1,199 |
|
|
$ |
4,408 |
|
|
|
6,254 |
|
| Total consumer |
|
|
130,685 |
|
|
|
(7,370 |
) |
|
|
2,049 |
|
|
|
14,752 |
|
|
|
140,116 |
|
| Total |
|
$ |
468,034 |
|
|
$ |
(72,442 |
) |
|
$ |
8,267 |
|
|
$ |
57,000 |
|
|
$ |
460,859 |
|
The following table represents a roll forward of the reserve for unfunded commitments for the periods shown. The reserve for unfunded commitments
is classified in other liabilities in the consolidated balance sheets.
| |
|
Three Months Ended September 30, |
|
|
Nine Months Ended September 30, |
|
| (In thousands) |
|
2025 |
|
|
2024 |
|
|
2025 |
|
|
2024 |
|
| Balance at beginning of period |
|
$ |
9,551 |
|
|
$ |
8,551 |
|
|
$ |
8,551 |
|
|
$ |
8,551 |
|
| Provision (reversal) for credit losses for unfunded commitments |
|
|
2,000 |
|
|
|
(1,000 |
) |
|
|
3,000 |
|
|
|
(1,000 |
) |
| Balance at end of period |
|
$ |
11,551 |
|
|
$ |
7,551 |
|
|
$ |
11,551 |
|
|
$ |
7,551 |
|
The economic impact of persistent inflation, higher interest rates, volatility in the financial markets, and the potential for a slowing economy
poses additional risk to borrowers and financial institutions. These factors add to the risk borrowers may experience difficulty in meeting repayment obligations, and the Company may experience losses or deterioration in the performance of its loan
portfolio.
The ACL estimate is impacted by both loan portfolio changes and prevailing economic conditions during the reporting period. The unemployment rate
has the highest weighting within the Company’s credit risk modeling framework. Economic forecasts, which are obtained from multiple sources, provide upside, downside, and base case scenarios over an eight-quarter forecast horizon to establish a
forecast range. Management considers the scenarios and selects a blended scenario which, in management’s opinion, reflects likely economic conditions within that range. The Company recognizes that persistent inflation, changes in interest rates and a
slowing economy may have short-term, long-term, and regional impacts to the economy. In addition, qualitative factors such as changes in economic conditions, concentrations of risk, and changes in portfolio risk resulting from regulatory changes are
considered in determining the adequacy of the level of the ACL.
NOTE 6. BORROWINGS
Borrowings with original maturities of one year or less are classified as short-term. The following tables present information relating to
short-term debt for the periods presented:
| |
|
September 30, 2025 |
|
| |
|
End of Period |
|
|
Year to Date Daily Average |
|
|
Maximum
Outstanding |
|
| (Dollars in thousands) |
|
Balance |
|
|
Interest
Rate |
|
|
Balance |
|
|
Interest
Rate (1)
|
|
|
at any
Month End |
|
| Federal funds purchased |
|
$ |
— |
|
|
|
— |
% |
|
$ |
124,872 |
|
|
|
4.49 |
% |
|
$ |
375,000 |
|
| Securities sold under agreement to repurchase and other |
|
|
29,532 |
|
|
|
4.15 |
|
|
|
21,887 |
|
|
|
4.20 |
|
|
|
29,532 |
|
| Short-term FHLB advances |
|
|
925,000 |
|
|
|
4.16 |
|
|
|
762,238 |
|
|
|
4.33 |
|
|
|
1,575,000 |
|
| Total |
|
$ |
954,532 |
|
|
|
|
|
|
$ |
908,997 |
|
|
|
|
|
|
$ |
1,979,532 |
|
| |
|
December 31, 2024 |
|
| |
|
End of Period |
|
|
Year to Date Daily Average |
|
|
Maximum
Outstanding |
|
| (Dollars in thousands) |
|
Balance |
|
|
Interest
Rate |
|
|
Balance |
|
|
Interest
Rate |
|
|
at any
Month End |
|
| Federal funds purchased |
|
$ |
— |
|
|
|
— |
% |
|
$ |
5,077 |
|
|
|
5.28 |
% |
|
$ |
— |
|
| Securities sold under agreement to repurchase |
|
|
|
|
|
|
|
|
|
|
|
|
|
|
|
|
|
|
|
|
| and other |
|
|
23,616 |
|
|
|
4.10 |
|
|
|
81,092 |
|
|
|
4.76 |
|
|
|
267,792 |
|
| Bank Term Funding Program |
|
|
— |
|
|
|
— |
|
|
|
2,845,902 |
|
|
|
4.79 |
|
|
|
3,500,000 |
|
| Short-term FHLB advances |
|
|
— |
|
|
|
— |
|
|
|
2 |
|
|
|
5.74 |
|
|
|
— |
|
| Total |
|
$ |
23,616 |
|
|
|
|
|
|
$ |
2,932,073 |
|
|
|
|
|
|
$ |
3,767,792 |
|
Federal funds purchased generally mature the business day following the date of purchase. At September 30, 2025 and December 31, 2024, the Company
had established non-binding federal funds borrowing lines of credit with other banks aggregating $2.1 billion, for both periods. Additionally, the Company maintains access to the FRB discount window borrowings which generally mature within 90 days and
are collateralized by $2.1 billion in commercial, agriculture, and consumer loans pledged under a borrower-in-custody agreement as of September 30, 2025. At September 30, 2025 and December 31, 2024, there were no borrowings from the FRB discount
window.
Securities sold under repurchase agreements generally mature within one day from the date of sale. The Company monitors collateral levels on a
continuous basis and may be required to provide additional collateral based on the fair value of the underlying securities. Collateral pledged pursuant to these repurchase agreements can include MBS issued or guaranteed by U.S. agencies, U.S. Treasury
securities and U.S. government agency securities.
The BTFP was created by the Federal Reserve to support businesses and households by making additional funding available to eligible financial
institutions to help assure they have the ability to meet the needs of their depositors. The BTFP offered loans of up to one year in length to banks and other qualifying institutions pledging any collateral eligible for purchase by the FRB. The
collateral was valued at its par amount and consisted primarily of MBS and U.S. government agency securities. Cadence’s BTFP borrowing was paid off during the fourth quarter of 2024. The BTFP ceased making new loans in March 2024.
As of September 30, 2025 and December 31, 2024, the Company had a balance of $1.3 billion and $706 thousand, respectively, of long-term advances
from the FHLB of Dallas. During the nine months ended September 30, 2025, the Company entered into $1.3 billion of long-term advances from the FHLB of Dallas with various interest rates ranging from 3.897% to 4.219% with maturities beginning in October
2026 through April 2027. In addition, the Company obtained $12.4 million of junior subordinated debt in the First Chatham acquisition. This FCB subordinated debt as well as $10.0 million of 5.000% fixed to floating rate subordinated notes were paid off
in June 2025.
All borrowings from the FHLB are collateralized by commercial and residential real estate loans pledged under a blanket floating lien security
agreement with the FHLB of Dallas. Under the terms of this agreement, the Company is required to maintain sufficient collateral to secure borrowings in an aggregate amount of the lesser of the book value (i.e., unpaid principal balance), after
applicable FHLB discounts, of the Company’s eligible commercial and residential real estate loans pledged as collateral, or 35% of the Company’s assets. Loans totaling $26.8 billion and $24.4 billion at September 30, 2025 and December 31, 2024,
respectively, were pledged to the FHLB of Dallas. At September 30, 2025, the remaining borrowing availability totaled $11.5 billion. At September 30, 2025, there were no call features on long-term FHLB borrowings. Shortterm FHLB borrowings mature
within one year following the date of the advance.
The FHLB of Dallas has also issued irrevocable letters of credit totaling $47.5 million at September 30, 2025 on behalf of our customers. Of the
total amount, $26.7 million expires on December 17, 2025 and $20.8 million expires on January 30, 2026.
NOTE 7. PENSION
The components of net periodic benefit cost (credit) for the periods indicated were as follows:
| |
|
Three Months Ended September 30, |
|
|
Nine Months Ended September 30, |
|
| (In thousands) |
|
2025 |
|
|
2024 |
|
|
2025 |
|
|
2024 |
|
| Service cost |
|
$ |
2,330 |
|
|
$ |
1,907 |
|
|
$ |
6,990 |
|
|
$ |
5,721 |
|
| Interest cost |
|
|
2,963 |
|
|
|
2,941 |
|
|
|
8,889 |
|
|
|
8,823 |
|
| Expected return on plan assets |
|
|
(5,999 |
) |
|
|
(5,741 |
) |
|
|
(17,997 |
) |
|
|
(17,223 |
) |
| Recognized prior service cost |
|
|
3 |
|
|
|
3 |
|
|
|
10 |
|
|
|
9 |
|
| Recognized net loss |
|
|
724 |
|
|
|
733 |
|
|
|
2,172 |
|
|
|
2,199 |
|
| Net periodic benefit cost (credit) (1) |
|
$ |
21 |
|
|
$ |
(157 |
) |
|
$ |
64 |
|
|
$ |
(471 |
) |
|
(1) |
While service cost is included in salaries and employee benefits, the other components of net periodic pension costs (credit) are included in other noninterest expense in the unaudited consolidated statements of
income for the three and nine months ended September 30, 2025 and 2024. |
NOTE 8. MORTGAGE SERVICING RIGHTS
The MSR, which are recognized as a separate asset on the date the corresponding mortgage loan is sold on a servicing retained basis, is recorded
at fair value as determined at each accounting period end and reported in other assets in the consolidated balance sheets. An estimate of the fair value of the Company’s MSR is determined utilizing assumptions such as mortgage interest rates, discount
rates, mortgage loan prepayment speeds, market trends and industry demand. Data and assumptions used in the fair value calculation related to the MSR were as follows:
| (Dollars in thousands) |
|
September 30, 2025 |
|
|
December 31, 2024 |
|
| Unpaid principal balance |
|
$ |
8,346,802 |
|
|
$ |
8,043,306 |
|
| Weighted-average prepayment speed (CPR) |
|
|
9.8 |
|
|
|
8.3 |
|
| Average discount rate (annual percentage) |
|
|
9.8 |
|
|
|
10.1 |
|
| Weighted-average coupon interest rate (percentage) |
|
|
4.5 |
|
|
|
4.2 |
|
| Weighted-average remaining maturity (months) |
|
|
285.8 |
|
|
|
285.7 |
|
| Weighted-average servicing fee (basis points) |
|
|
28.7 |
|
|
|
28.7 |
|
Because the valuation is determined by using discounted cash flow models, the primary risk inherent in valuing the MSR is the impact of
fluctuating interest rates on the estimated life of the servicing revenue stream. The use of different estimates or assumptions could produce different fair values. At September 30, 2025 and 2024, the Company had an economic hedge in place designed to
cover 75.6% and 75.0% of the MSR IRR, respectively. At December 31, 2024, the hedge covered 75.1% of the MSR IRR (see Note 15 for additional information). The Company is susceptible to fluctuations in the fair value of its MSR in changing interest rate
environments.
The following table summarizes activity relating to residential mortgage loans sold with servicing retained for the periods indicated:
| |
|
Three Months Ended September 30, |
|
|
Nine Months Ended September 30, |
|
| (In thousands) |
|
2025 |
|
|
2024 |
|
|
2025 |
|
|
2024 |
|
| Residential mortgage loans sold with |
|
|
|
|
|
|
|
|
|
|
|
|
|
|
|
|
| servicing retained |
|
$ |
351,235 |
|
|
$ |
296,894 |
|
|
$ |
918,692 |
|
|
$ |
787,180 |
|
| Pretax gains resulting from above loan sales |
|
|
6,545 |
|
|
|
3,962 |
|
|
|
14,835 |
|
|
|
11,936 |
|
The Company services a class of residential mortgages that are first lien loans secured by a primary residence or second home. The following table
presents changes in the fair value of the MSR related to the activity in this class for the periods indicated:
| |
|
Nine Months Ended September 30, |
|
| (In thousands) |
|
2025 |
|
|
2024 |
|
| Fair value, beginning of period |
|
$ |
114,594 |
|
|
$ |
106,824 |
|
| Originations of servicing assets |
|
|
10,372 |
|
|
|
9,784 |
|
| Changes in fair value: |
|
|
|
|
|
|
|
|
| Due to change in valuation inputs or assumptions(1) |
|
|
(8,169 |
) |
|
|
(2,524 |
) |
| Other changes in fair value(2) |
|
|
(6,302 |
) |
|
|
(9,193 |
) |
| Fair value, end of period |
|
$ |
110,495 |
|
|
$ |
104,891 |
|
|
(1) |
Primarily reflects changes in prepayment speeds and discount rate assumptions which are updated based on market interest rates. |
|
(2) |
Primarily reflects changes due to realized cash flows. |
All of the changes to the fair value of the MSR and the related economic hedge are recorded as part of mortgage banking revenue in the
consolidated statements of income. As part of mortgage banking revenue, the Company recorded contractual servicing fees of $5.7 million and $5.4 million, and late and other ancillary fees of $1.2 million and $785 thousand for the three months ended
September 30, 2025 and 2024, respectively. Additionally, the Company recorded contractual servicing fees of $17.0 million and $16.0 million, and late and other ancillary fees of $3.2 million and $2.3 million for the nine months ended September 30, 2025
and 2024, respectively.
NOTE 9. FAIR VALUE DISCLOSURES
See Note 13 to the consolidated financial statements of the Annual Report on Form 10-K for the year ended December 31, 2024 for a description of
valuation methodologies for assets and liabilities measured at fair value on a recurring and non-recurring basis.
Assets and Liabilities Recorded at Fair Value on a Recurring Basis
The following tables present the balances of the assets and liabilities measured at fair value on a recurring basis:
| |
|
September 30, 2025 |
|
| (In thousands) |
|
Level 1 |
|
|
Level 2 |
|
|
Level 3 |
|
|
Total |
|
| Assets: |
|
|
|
|
|
|
|
|
|
|
|
|
|
|
|
|
| Available for sale securities |
|
$ |
— |
|
|
$ |
9,616,389 |
|
|
$ |
— |
|
|
$ |
9,616,389 |
|
| Equity investments |
|
|
20,555 |
|
|
|
— |
|
|
|
— |
|
|
|
20,555 |
|
| Mortgage servicing rights |
|
|
— |
|
|
|
— |
|
|
|
110,495 |
|
|
|
110,495 |
|
| Derivative instruments |
|
|
134 |
|
|
|
31,728 |
|
|
|
2,285 |
|
|
|
34,147 |
|
| Loans held for sale |
|
|
— |
|
|
|
261,680 |
|
|
|
— |
|
|
|
261,680 |
|
| Investments in limited partnerships |
|
|
— |
|
|
|
— |
|
|
|
158,092 |
|
|
|
158,092 |
|
| SBA/USDA servicing rights |
|
|
— |
|
|
|
— |
|
|
|
9,254 |
|
|
|
9,254 |
|
| Total |
|
$ |
20,689 |
|
|
$ |
9,909,797 |
|
|
$ |
280,126 |
|
|
$ |
10,210,612 |
|
| Liabilities: |
|
|
|
|
|
|
|
|
|
|
|
|
|
|
|
|
| Derivative instruments |
|
$ |
1,758 |
|
|
$ |
40,778 |
|
|
$ |
— |
|
|
$ |
42,536 |
|
| |
|
December 31, 2024 |
|
| (In thousands) |
|
Level 1 |
|
|
Level 2 |
|
|
Level 3 |
|
|
Total |
|
| Assets: |
|
|
|
|
|
|
|
|
|
|
|
|
|
|
|
|
| Available for sale securities |
|
$ |
— |
|
|
$ |
7,293,988 |
|
|
$ |
— |
|
|
$ |
7,293,988 |
|
| Equity investments |
|
|
21,678 |
|
|
|
— |
|
|
|
— |
|
|
|
21,678 |
|
| Mortgage servicing rights |
|
|
— |
|
|
|
— |
|
|
|
114,594 |
|
|
|
114,594 |
|
| Derivative instruments |
|
|
— |
|
|
|
32,021 |
|
|
|
1,310 |
|
|
|
33,331 |
|
| Loans held for sale |
|
|
— |
|
|
|
244,192 |
|
|
|
— |
|
|
|
244,192 |
|
| Investments in limited partnerships |
|
|
— |
|
|
|
— |
|
|
|
118,710 |
|
|
|
118,710 |
|
| SBA servicing rights |
|
|
— |
|
|
|
— |
|
|
|
5,785 |
|
|
|
5,785 |
|
| Total |
|
$ |
21,678 |
|
|
$ |
7,570,201 |
|
|
$ |
240,399 |
|
|
$ |
7,832,278 |
|
| Liabilities: |
|
|
|
|
|
|
|
|
|
|
|
|
|
|
|
|
| Derivative instruments |
|
$ |
3,085 |
|
|
$ |
45,573 |
|
|
$ |
15 |
|
|
$ |
48,673 |
|
Level 3 financial instruments typically include unobservable components but may also include some observable components that may be validated
against external sources. The table below includes a roll forward of the consolidated balance sheet amounts for the three and nine months ended September 30, 2025 and 2024, for changes in the fair value of financial instruments classified within Level
3 of the valuation hierarchy that are recorded on a recurring basis. The gains or (losses) in the following table (which are reported in Other noninterest income in the consolidated statements of income) may include changes to fair value due, in part,
to observable factors that may be part of the valuation methodology.
| |
|
Three Months Ended September 30, 2025 |
|
| (In thousands) |
|
Mortgage
Servicing
Rights |
|
|
Investments
in Limited
Partnerships |
|
|
SBA/
USDA
Servicing
Rights |
|
|
Mortgage Loan
Held-For-Sale
Interest Rate Lock
Commitments
(Assets and
Liabilities) |
|
| Balance at June 30, 2025 |
|
$ |
111,624 |
|
|
$ |
133,197 |
|
|
$ |
10,214 |
|
|
$ |
3,890 |
|
| Acquired in a business combination |
|
|
— |
|
|
|
16,516 |
|
|
|
— |
|
|
|
— |
|
| Net (losses) gains |
|
|
(4,973 |
) |
|
|
3,212 |
|
|
|
(1,377 |
) |
|
|
(1,605 |
) |
| Additions |
|
|
3,844 |
|
|
|
— |
|
|
|
417 |
|
|
|
— |
|
| Contributions paid |
|
|
— |
|
|
|
6,964 |
|
|
|
— |
|
|
|
— |
|
| Distributions received |
|
|
— |
|
|
|
(1,797 |
) |
|
|
— |
|
|
|
— |
|
| Balance at September 30, 2025 |
|
$ |
110,495 |
|
|
$ |
158,092 |
|
|
$ |
9,254 |
|
|
$ |
2,285 |
|
| Net unrealized (losses) gains included in net income for the quarter relating to assets and liabilities held at September 30, 2025 |
|
$ |
(1,254 |
) |
|
$ |
3,212 |
|
|
$ |
(1,377 |
) |
|
$ |
(1,605 |
) |
| |
|
Three Months Ended September 30, 2024 |
|
| (In thousands) |
|
Mortgage
Servicing
Rights |
|
|
Investments
in Limited
Partnerships |
|
|
SBA
Servicing
Rights |
|
|
Mortgage Loan
Held-For-Sale
Interest Rate Lock
Commitments
(Assets and
Liabilities) |
|
| Balance at June 30, 2024 |
|
$ |
113,595 |
|
|
$ |
109,539 |
|
|
$ |
5,930 |
|
|
$ |
2,389 |
|
| Net (losses) gains |
|
|
(12,065 |
) |
|
|
3,637 |
|
|
|
(425 |
) |
|
|
292 |
|
| Additions |
|
|
3,361 |
|
|
|
— |
|
|
|
312 |
|
|
|
— |
|
| Contributions paid |
|
|
— |
|
|
|
6,228 |
|
|
|
— |
|
|
|
— |
|
| Distributions received |
|
|
— |
|
|
|
(3,756 |
) |
|
|
— |
|
|
|
— |
|
| Balance at September 30, 2024 |
|
$ |
104,891 |
|
|
$ |
115,648 |
|
|
$ |
5,817 |
|
|
$ |
2,681 |
|
| Net unrealized (losses) gains included in net income for the quarter relating to assets and liabilities held at September 30, 2024 |
|
$ |
(8,232 |
) |
|
$ |
3,637 |
|
|
$ |
(425 |
) |
|
$ |
292 |
|
| |
|
Nine Months Ended September 30, 2025 |
|
| (In thousands) |
|
Mortgage
Servicing
Rights |
|
|
Investments
in Limited
Partnerships |
|
|
SBA/
USDA
Servicing
Rights |
|
|
Mortgage Loan
Held-For-Sale
Interest Rate Lock
Commitments
(Assets and
Liabilities) |
|
| Balance at December 31, 2024 |
|
$ |
114,594 |
|
|
$ |
118,710 |
|
|
$ |
5,785 |
|
|
$ |
1,295 |
|
| Acquired in a business combination |
|
|
— |
|
|
|
16,516 |
|
|
|
4,783 |
|
|
|
— |
|
| Net (losses) gains |
|
|
(14,471 |
) |
|
|
7,698 |
|
|
|
(2,678 |
) |
|
|
990 |
|
| Additions |
|
|
10,372 |
|
|
|
— |
|
|
|
1,364 |
|
|
|
— |
|
| Contributions paid |
|
|
— |
|
|
|
22,136 |
|
|
|
— |
|
|
|
— |
|
| Distributions received |
|
|
— |
|
|
|
(6,968 |
) |
|
|
— |
|
|
|
— |
|
| Balance at September 30, 2025 |
|
$ |
110,495 |
|
|
$ |
158,092 |
|
|
$ |
9,254 |
|
|
$ |
2,285 |
|
| Net unrealized (losses) gains included in net income for the period related to assets and liabilities held at September 30, 2025 |
|
$ |
(8,169 |
) |
|
$ |
7,698 |
|
|
$ |
(2,678 |
) |
|
$ |
990 |
|
| |
|
Nine Months Ended September 30, 2024 |
|
| (In thousands) |
|
Mortgage
Servicing
Rights |
|
|
Investments
in Limited
Partnerships |
|
|
SBA
Servicing
Rights |
|
|
Mortgage Loan
Held-For-Sale
Interest Rate Lock
Commitments
(Assets and
Liabilities) |
|
| Balance at December 31, 2023 |
|
$ |
106,824 |
|
|
$ |
94,998 |
|
|
$ |
6,124 |
|
|
$ |
1,848 |
|
| Net (losses) gains |
|
|
(11,717 |
) |
|
|
9,612 |
|
|
|
(1,216 |
) |
|
|
833 |
|
| Additions |
|
|
9,784 |
|
|
|
— |
|
|
|
909 |
|
|
|
— |
|
| Contributions paid |
|
|
— |
|
|
|
21,465 |
|
|
|
— |
|
|
|
— |
|
| Distributions received |
|
|
— |
|
|
|
(10,427 |
) |
|
|
— |
|
|
|
— |
|
| Balance at September 30, 2024 |
|
$ |
104,891 |
|
|
$ |
115,648 |
|
|
$ |
5,817 |
|
|
$ |
2,681 |
|
| Net unrealized (losses) gains included in net income for the period related to assets and liabilities held at September 30, 2024 |
|
$ |
(2,524 |
) |
|
$ |
9,612 |
|
|
$ |
(1,216 |
) |
|
$ |
833 |
|
Fair Value Option
The Company elected to measure commercial real estate loans held for sale and C&I loans held for sale under the fair value option. Included in
these loans are loans guaranteed by the SBA and loans related to syndications. Due to the short duration that these instruments remain on the balance sheet, the Company assumes that cost approximates fair value.
The Company also elected to measure residential mortgage loans held for sale at fair value. The election allows for effective offset of the
changes in fair values of the loans and the derivative instruments used to hedge them. Included in the residential mortgage loans held for sale portfolio are certain previously sold GNMA loans. Under ASC 860-10-40, certain GNMA loans will not meet sale
criteria due to the conditional buyback option becoming unconditional - typically when loans become 90 or more days delinquent. The Company records these loans at fair value on the consolidated balance sheets with an offsetting liability. The Company
assumed the cost approximates the fair value. At September 30, 2025 and December 31, 2024, the fair value of the GNMA loans totaled $73.7 million and $69.0 million, respectively.
The following table summarizes the difference between the aggregate fair value and the aggregate unpaid principal balance of loans held for sale:
| |
|
September 30, 2025 |
|
|
December 31, 2024 |
|
| (In thousands) |
|
Aggregate
Fair Value |
|
|
Aggregate
Unpaid
Principal |
|
|
Aggregate
Fair Value
Less
Aggregate
Unpaid
Principal |
|
|
Aggregate
Fair Value |
|
|
Aggregate
Unpaid
Principal |
|
|
Aggregate
Fair Value
Less
Aggregate
Unpaid
Principal |
|
| Residential mortgage loans |
|
$ |
194,858 |
|
|
$ |
194,858 |
|
|
$ |
— |
|
|
$ |
181,622 |
|
|
$ |
181,622 |
|
|
$ |
— |
|
| Commercial and industrial loans |
|
|
61,472 |
|
|
|
61,475 |
|
|
|
(3 |
) |
|
|
59,343 |
|
|
|
59,343 |
|
|
|
— |
|
| Commercial real estate loans |
|
|
5,350 |
|
|
|
5,350 |
|
|
|
— |
|
|
|
3,227 |
|
|
|
3,227 |
|
|
|
— |
|
| Total |
|
$ |
261,680 |
|
|
$ |
261,683 |
|
|
$ |
(3 |
) |
|
$ |
244,192 |
|
|
$ |
244,192 |
|
|
$ |
— |
|
Net gains and losses resulting from changes in fair value for residential mortgage loans held for sale are recorded in mortgage banking revenue in
the consolidated statements of income. For the three months ended September 30, 2025 and 2024, the Company had net losses totaling $1.7 million and $11 thousand, respectively. For the nine months ended September 30, 2025 and 2024, the Company had net
gains totaling $1.0 million and $1.6 million, respectively.
Net gains and losses resulting from changes in fair value for C&I loans and CRE loans held for sale are recorded in other noninterest revenue
in the consolidated statements of income. For the three months ended September 30, 2025 and 2024, the Company had net gains from the sale of these loans totaling $2.6 million and $1.6 million, respectively. For the nine months ended September 30, 2025
and 2024, the Company had net gains from the sale of these loans totaling $7.4 million and $4.3 million, respectively.
Assets and Liabilities Recorded at Fair Value on a Nonrecurring Basis
From time to time, the Company may be required to measure certain financial assets at fair value on a nonrecurring basis in accordance with GAAP.
These adjustments to fair value usually result from the application of lower of cost or fair value accounting or from write-downs of individual assets. The following tables present the balances of assets measured at fair value on a nonrecurring basis:
| |
|
September 30, 2025 |
|
| (In thousands) |
|
Level 1 |
|
|
Level 2 |
|
|
Level 3 |
|
|
Total |
|
| Assets: |
|
|
|
|
|
|
|
|
|
|
|
|
|
|
|
|
| Impaired loans, collateral-dependent(1) |
|
$ |
— |
|
|
$ |
— |
|
|
$ |
47,961 |
|
|
$ |
47,961 |
|
| PCD (loss) loans |
|
|
— |
|
|
|
— |
|
|
|
17,849 |
|
|
|
17,849 |
|
| Other real estate and repossessed assets |
|
|
— |
|
|
|
— |
|
|
|
16,250 |
|
|
|
16,250 |
|
|
(1) |
At September 30, 2025, impaired loans, collateral-dependent includes $8.2 million which were classified as doubtful. |
| |
|
December 31, 2024 |
|
| (In thousands) |
|
Level 1 |
|
|
Level 2 |
|
|
Level 3 |
|
|
Total |
|
| Assets: |
|
|
|
|
|
|
|
|
|
|
|
|
|
|
|
|
| Impaired loans, collateral-dependent(1) |
|
$ |
— |
|
|
$ |
— |
|
|
$ |
75,820 |
|
|
$ |
75,820 |
|
| PCD (loss) loans |
|
|
— |
|
|
|
— |
|
|
|
6,027 |
|
|
|
6,027 |
|
| Other real estate and repossessed assets |
|
|
— |
|
|
|
— |
|
|
|
5,754 |
|
|
|
5,754 |
|
|
(1) |
At December 31, 2024, impaired loans, collateral-dependent includes $8.7 million which were classified as doubtful. |
Unobservable Inputs
The following table presents the significant unobservable inputs used in Level 3 fair value measurements for financial assets measured at fair
value on a recurring and nonrecurring basis:
| |
|
Quantitative Information about Level 3 Fair Value Measurements |
| (Dollars in thousands) |
|
Carrying
Value |
|
|
Valuation
Methods |
|
Unobservable
Inputs |
|
Range |
|
Weighted
Average |
| September 30, 2025 |
|
|
|
|
|
|
|
|
|
|
|
|
| Measured at fair value on a recurring basis: |
|
|
|
|
|
|
|
|
|
|
|
|
| Mortgage servicing rights(1) |
|
$ |
110,495 |
|
|
Discounted cash flow |
|
Discount rate |
|
9.3% - 10.9% |
|
9.8% |
| |
|
|
|
|
|
|
|
Repayment speed (CPR) |
|
7.0 - 20.3 |
|
9.7 |
| |
|
|
|
|
|
|
|
Coupon interest rate |
|
3.4% - 6.3% |
|
4.5% |
| |
|
|
|
|
|
|
|
Remaining maturity (months) |
|
75 - 310 |
|
286 |
| |
|
|
|
|
|
|
|
Servicing fee (bps) |
|
19.0 bps-39.2 bps |
|
28.7 bps |
| Investments in limited partnerships |
|
|
158,092 |
|
|
Practical expedient |
|
Net asset value |
|
NM |
|
NM |
| SBA/USDA servicing rights(1) |
|
|
9,254 |
|
|
Coupon less contractual servicing cost |
|
Contractual servicing cost (bps) |
|
12.5 bps-40.0 bps |
|
26.3 bps |
| Mortgage loan held-for-sale interest rate lock commitments (assets and liabilities) |
|
|
2,285 |
|
|
Discounted cash flow |
|
Closing ratio |
|
10.0% - 100% |
|
61.1% |
| Measured at fair value on a nonrecurring basis: |
|
|
|
|
|
|
|
|
|
|
|
|
| Impaired loans, collateral- dependent(1) |
|
$ |
47,961 |
|
|
Appraised value, as adjusted |
|
Discount to fair value |
|
10% - 78% |
|
51.2% |
| PCD (loss) loans(1) |
|
|
17,849 |
|
|
Appraised value, as adjusted |
|
Discount to fair value |
|
10% - 30% |
|
27.0% |
| Other real estate and repossessed assets |
|
|
16,250 |
|
|
Appraised value, as adjusted |
|
Estimated closing costs |
|
7.0% |
|
7.0% |
| |
|
Quantitative Information about Level 3 Fair Value Measurements |
| (Dollars in thousands) |
|
Carrying
Value |
|
|
Valuation
Methods |
|
Unobservable
Inputs |
|
Range |
|
Weighted
Average |
| December 31, 2024 |
|
|
|
|
|
|
|
|
|
|
|
|
| Measured at fair value on a recurring basis: |
|
|
|
|
|
|
|
|
|
|
|
|
| Mortgage servicing rights(1) |
|
$ |
114,594 |
|
|
Discounted cash flow |
|
Discount rate |
|
9.7% - 11.3% |
|
10.1% |
| |
|
|
|
|
|
|
|
Repayment speed (CPR) |
|
6.8 - 12.6 |
|
8.3 |
| |
|
|
|
|
|
|
|
Coupon interest rate |
|
3.2% - 7.9% |
|
4.2% |
| |
|
|
|
|
|
|
|
Remaining maturity (months) |
|
70 - 404 |
|
286 |
| |
|
|
|
|
|
|
|
Servicing fee (bps) |
|
19.0 bps-50.0 bps |
|
28.7 bps |
| Investments in limited partnerships |
|
|
118,710 |
|
|
Practical expedient |
|
Net asset value |
|
NM |
|
NM |
| SBA servicing rights(1) |
|
|
5,785 |
|
|
Coupon less contractual servicing cost |
|
Contractual servicing cost (bps) |
|
12.5 bps-40.0 bps |
|
26.3 bps |
| Mortgage loan held-for-sale interest rate lock commitments (assets and liabilities) |
|
|
1,295 |
|
|
Discounted cash flow |
|
Closing ratio |
|
10.0% - 100% |
|
46.8% |
| Measured at fair value on a nonrecurring basis: |
|
|
|
|
|
|
|
|
|
|
|
|
| Impaired loans, collateral- dependent(1) |
|
$ |
75,820 |
|
|
Appraised value, as adjusted |
|
Discount to fair value |
|
10% - 41% |
|
30.5% |
| PCD (loss) loans(1) |
|
|
6,027 |
|
|
Appraised value, as adjusted |
|
Discount to fair value |
|
10% - 30% |
|
24.7% |
| Other real estate and repossessed assets |
|
|
5,754 |
|
|
Appraised value, as adjusted |
|
Estimated closing costs |
|
7.0% |
|
7.0% |
|
(1) |
Weighted averages were calculated using the input attributed and the outstanding balance of the loan. |
Certain assets and liabilities subject to fair value disclosure requirements are not actively traded, requiring management to estimate the fair
value. These estimations necessarily require judgment to be applied to the reasonableness and relevancy of comparable market prices, expected future cash flows, and appropriate discount rates.
The short-term nature of certain assets and liabilities result in their carrying value approximating fair value. They include cash and due from
banks, interest bearing deposits with other banks and Federal funds sold, accrued interest receivable, non-time deposits, federal funds purchased, securities sold under agreement to repurchase, short-term and long-term FHLB borrowings and accrued
interest payable.
The following tables present carrying and fair value information of financial instruments for the periods presented:
| |
|
September 30, 2025 |
|
| |
|
Carrying |
|
|
|
|
|
|
|
|
|
|
|
|
|
| (In thousands) |
|
Value |
|
|
Fair Value |
|
|
Level 1 |
|
|
Level 2 |
|
|
Level 3 |
|
| Assets: |
|
|
|
|
|
|
|
|
|
|
|
|
|
|
|
|
|
|
|
|
| Cash and due from banks |
|
$ |
839,841 |
|
|
$ |
839,841 |
|
|
$ |
839,841 |
|
|
$ |
— |
|
|
$ |
— |
|
| Interest bearing deposits with other banks and Federal funds sold |
|
|
1,049,332 |
|
|
|
1,049,332 |
|
|
|
1,049,332 |
|
|
|
— |
|
|
|
— |
|
| Available for sale securities and equity securities with readily determinable fair values |
|
|
9,636,944 |
|
|
|
9,636,944 |
|
|
|
20,555 |
|
|
|
9,616,389 |
|
|
|
— |
|
| Net loans and leases |
|
|
36,305,637 |
|
|
|
35,747,929 |
|
|
|
— |
|
|
|
— |
|
|
|
35,747,929 |
|
| Loans held for sale |
|
|
261,680 |
|
|
|
261,680 |
|
|
|
— |
|
|
|
261,680 |
|
|
|
— |
|
| Accrued interest receivable |
|
|
216,391 |
|
|
|
216,391 |
|
|
|
— |
|
|
|
33,931 |
|
|
|
182,460 |
|
| Mortgage servicing rights |
|
|
110,495 |
|
|
|
110,495 |
|
|
|
— |
|
|
|
— |
|
|
|
110,495 |
|
| Investments in limited partnerships |
|
|
158,092 |
|
|
|
158,092 |
|
|
|
— |
|
|
|
— |
|
|
|
158,092 |
|
| Other assets |
|
|
25,504 |
|
|
|
25,504 |
|
|
|
— |
|
|
|
— |
|
|
|
25,504 |
|
| |
|
|
|
|
|
|
|
|
|
|
|
|
|
|
|
|
|
|
|
|
| Liabilities: |
|
|
|
|
|
|
|
|
|
|
|
|
|
|
|
|
|
|
|
|
| Deposits |
|
$ |
43,921,456 |
|
|
$ |
43,923,824 |
|
|
$ |
— |
|
|
$ |
43,923,824 |
|
|
$ |
— |
|
| Federal funds purchased and securities sold under agreement to repurchase and other short-term borrowings |
|
|
29,532 |
|
|
|
29,532 |
|
|
|
29,532 |
|
|
|
— |
|
|
|
— |
|
| Short-term FHLB borrowings |
|
|
925,000 |
|
|
|
925,000 |
|
|
|
925,000 |
|
|
|
— |
|
|
|
— |
|
| Accrued interest payable |
|
|
170,188 |
|
|
|
170,188 |
|
|
|
7,680 |
|
|
|
162,508 |
|
|
|
— |
|
| Subordinated and long-term borrowings |
|
|
1,330,657 |
|
|
|
1,330,657 |
|
|
|
1,330,657 |
|
|
|
— |
|
|
|
— |
|
| |
|
|
|
|
|
|
|
|
|
|
|
|
|
|
|
|
|
|
|
|
| Derivative instruments: |
|
|
|
|
|
|
|
|
|
|
|
|
|
|
|
|
|
|
|
|
| Assets: |
|
|
|
|
|
|
|
|
|
|
|
|
|
|
|
|
|
|
|
|
| Commercial loan interest rate contracts |
|
$ |
30,707 |
|
|
$ |
30,707 |
|
|
$ |
— |
|
|
$ |
30,707 |
|
|
$ |
— |
|
| Mortgage loan held-for-sale interest rate lock commitments |
|
|
2,285 |
|
|
|
2,285 |
|
|
|
— |
|
|
|
— |
|
|
|
2,285 |
|
| Futures, forwards and options |
|
|
134 |
|
|
|
134 |
|
|
|
134 |
|
|
|
— |
|
|
|
— |
|
| Mortgage loan forward sale commitments |
|
|
214 |
|
|
|
214 |
|
|
|
— |
|
|
|
214 |
|
|
|
— |
|
| Foreign exchange contracts |
|
|
807 |
|
|
|
807 |
|
|
|
— |
|
|
|
807 |
|
|
|
— |
|
| Liabilities: |
|
|
|
|
|
|
|
|
|
|
|
|
|
|
|
|
|
|
|
|
| Commercial loan interest rate contracts |
|
$ |
39,188 |
|
|
$ |
39,188 |
|
|
$ |
— |
|
|
$ |
39,188 |
|
|
$ |
— |
|
| Futures, forwards and options |
|
|
1,758 |
|
|
|
1,758 |
|
|
|
1,758 |
|
|
|
— |
|
|
|
— |
|
| Mortgage loan forward sale commitments |
|
|
954 |
|
|
|
954 |
|
|
|
— |
|
|
|
954 |
|
|
|
— |
|
| Foreign exchange contracts |
|
|
636 |
|
|
|
636 |
|
|
|
— |
|
|
|
636 |
|
|
|
— |
|
| |
|
December 31, 2024 |
|
| (In thousands) |
|
Carrying
Value |
|
|
Fair
Value |
|
|
Level 1 |
|
|
Level 2 |
|
|
Level 3 |
|
| Assets: |
|
|
|
|
|
|
|
|
|
|
|
|
|
|
|
|
|
|
|
|
| Cash and due from banks |
|
$ |
624,884 |
|
|
$ |
624,884 |
|
|
$ |
624,884 |
|
|
$ |
— |
|
|
$ |
— |
|
| Interest bearing deposits with other banks and Federal funds sold |
|
|
1,106,692 |
|
|
|
1,106,692 |
|
|
|
1,106,692 |
|
|
|
— |
|
|
|
— |
|
| Available for sale securities and equity securities with readily determinable fair values |
|
|
7,315,666 |
|
|
|
7,315,666 |
|
|
|
21,678 |
|
|
|
7,293,988 |
|
|
|
— |
|
| Net loans and leases |
|
|
33,280,962 |
|
|
|
32,440,220 |
|
|
|
— |
|
|
|
— |
|
|
|
32,440,220 |
|
| Loans held for sale |
|
|
244,192 |
|
|
|
244,192 |
|
|
|
— |
|
|
|
244,192 |
|
|
|
— |
|
| Accrued interest receivable |
|
|
196,670 |
|
|
|
196,670 |
|
|
|
— |
|
|
|
26,239 |
|
|
|
170,431 |
|
| Mortgage servicing rights |
|
|
114,594 |
|
|
|
114,594 |
|
|
|
— |
|
|
|
— |
|
|
|
114,594 |
|
| Investments in limited partnerships |
|
|
118,710 |
|
|
|
118,710 |
|
|
|
— |
|
|
|
— |
|
|
|
118,710 |
|
| Other assets |
|
|
11,539 |
|
|
|
11,539 |
|
|
|
— |
|
|
|
— |
|
|
|
11,539 |
|
| |
|
|
|
|
|
|
|
|
|
|
|
|
|
|
|
|
|
|
|
|
| Liabilities: |
|
|
|
|
|
|
|
|
|
|
|
|
|
|
|
|
|
|
|
|
| Deposits |
|
$ |
40,496,201 |
|
|
$ |
40,495,193 |
|
|
$ |
— |
|
|
$ |
40,495,193 |
|
|
$ |
— |
|
| Federal funds purchased and securities sold under agreement to repurchase and other short-term borrowings |
|
|
23,616 |
|
|
|
23,616 |
|
|
|
23,616 |
|
|
|
— |
|
|
|
— |
|
| Accrued interest payable |
|
|
110,853 |
|
|
|
110,853 |
|
|
|
3 |
|
|
|
110,850 |
|
|
|
— |
|
| Subordinated and long-term borrowings |
|
|
10,706 |
|
|
|
10,570 |
|
|
|
— |
|
|
|
10,570 |
|
|
|
— |
|
| |
|
|
|
|
|
|
|
|
|
|
|
|
|
|
|
|
|
|
|
|
| Derivative instruments: |
|
|
|
|
|
|
|
|
|
|
|
|
|
|
|
|
|
|
|
|
| Assets: |
|
|
|
|
|
|
|
|
|
|
|
|
|
|
|
|
|
|
|
|
| Commercial loan interest rate contracts |
|
$ |
30,555 |
|
|
$ |
30,555 |
|
|
$ |
— |
|
|
$ |
30,555 |
|
|
$ |
— |
|
| Mortgage loan held-for-sale interest rate lock commitments |
|
|
1,310 |
|
|
|
1,310 |
|
|
|
— |
|
|
|
— |
|
|
|
1,310 |
|
| Mortgage loan forward sale commitments |
|
|
816 |
|
|
|
816 |
|
|
|
— |
|
|
|
816 |
|
|
|
— |
|
| Foreign exchange contracts |
|
|
650 |
|
|
|
650 |
|
|
|
— |
|
|
|
650 |
|
|
|
— |
|
| Liabilities: |
|
|
|
|
|
|
|
|
|
|
|
|
|
|
|
|
|
|
|
|
| Commercial loan interest rate contracts |
|
$ |
45,070 |
|
|
$ |
45,070 |
|
|
$ |
— |
|
|
$ |
45,070 |
|
|
$ |
— |
|
| Mortgage loan held-for-sale interest rate lock commitments |
|
|
15 |
|
|
|
15 |
|
|
|
— |
|
|
|
— |
|
|
|
15 |
|
| Futures, forwards and options |
|
|
3,085 |
|
|
|
3,085 |
|
|
|
3,085 |
|
|
|
— |
|
|
|
— |
|
| Mortgage loan forward sale commitments |
|
|
34 |
|
|
|
34 |
|
|
|
— |
|
|
|
34 |
|
|
|
— |
|
| Foreign exchange contracts |
|
|
469 |
|
|
|
469 |
|
|
|
— |
|
|
|
469 |
|
|
|
— |
|
NOTE 10. SHARE-BASED COMPENSATION
The Company’s Long-Term Equity Incentive Plan (“Incentive Plan”), Cadence Bank Equity Incentive Plan for NonEmployee Directors, 2021 Long-Term
Equity Incentive Plan and the Amended and Restated 2015 Omnibus Incentive Plan (the “2015 Plan” assumed from Legacy Cadence) were effective during the year ended December 31, 2024, and allowed the Company to grant to employees and directors various
forms of share-based incentive compensation. On December 30, 2024, the Cadence Bank 2025 Long-Term Incentive Plan (“the 2025 Plan”) was approved by the Company’s shareholders. The 2025 Plan took effect as of December 30, 2024 and supersedes all four of
the incentive plans previously mentioned.
The Company has primarily granted PSUs, RSUs and RSAs under its equity incentive plans. PSUs entitle the recipient to receive shares of the
Company’s common stock upon the achievement of performance goals that are specified in the award over a performance period. The recipient of PSUs is not treated as a shareholder of the Company and is not entitled to vote or receive dividends until the
performance conditions stated in the award are satisfied and the shares of stock are issued to the recipient. Dividend equivalents on the shares vested according to the performance conditions are paid upon issuance of the stock. All PSUs vest over a
three-year period and are valued at the fair value of the Company’s stock at the grant date based upon the estimated number of shares expected to vest through the application of a lattice model. RSUs entitle the recipient to receive the shares once
they are vested but with no voting rights until the shares are received. RSUs generally vest over four- to five-year periods and are eligible to receive dividend equivalents, which accrue and are paid upon vesting. RSAs entitle the recipient to vote
the shares of stock but the recipient does not receive the shares until they are fully vested. RSA grants vest over five- to seven-year periods and are entitled to receive dividends.
For more information, see Note 14 to the consolidated financial statements to the Annual Report on Form 10-K for the year ended December 31, 2024.
Performance Stock Units
The following table summarizes the Company’s PSU activity for the periods indicated:
| |
|
Nine Months Ended September 30, |
|
| |
|
2025 |
|
|
2024 |
|
| |
|
Shares |
|
|
Weighted
Average Grant
Date Fair Value |
|
|
Shares |
|
|
Weighted
Average Grant
Date Fair Value |
|
| Nonvested at beginning of period |
|
|
1,211,606 |
|
|
$ |
25.34 |
|
|
|
1,967,631 |
|
|
$ |
26.17 |
|
| Granted during the period |
|
|
264,729 |
|
|
|
30.64 |
|
|
|
323,293 |
|
|
|
30.26 |
|
| Vested during the period |
|
|
(425,767 |
) |
|
|
27.98 |
|
|
|
(444,448 |
) |
|
|
28.76 |
|
| Forfeited during the period |
|
|
(35,793 |
) |
|
|
26.48 |
|
|
|
(103,826 |
) |
|
|
24.42 |
|
| Nonvested at end of period |
|
|
1,014,775 |
|
|
$ |
25.58 |
|
|
|
1,742,650 |
|
|
$ |
26.37 |
|
The Company recorded $2.9 million and $5.9 million of compensation expense related to the PSUs for the three and nine months ended September 30,
2025, respectively, compared to $3.6 million and $10.0 million for the three and nine months ended September 30, 2024, respectively. At September 30, 2025, there was $13.9 million of unrecognized compensation cost related to PSUs that is expected to be
recognized over a weighted average period of 1.86 years.
Restricted Stock Units
The following table summarizes the Company’s RSU activity for the periods indicated:
| |
|
Nine Months Ended September 30, |
|
| |
|
2025 |
|
|
2024 |
|
| |
|
Shares |
|
|
Weighted
Average Grant
Date Fair Value |
|
|
Shares |
|
|
Weighted
Average Grant
Date Fair Value |
|
| Nonvested at beginning of period |
|
|
3,063,891 |
|
|
$ |
25.61 |
|
|
|
3,055,824 |
|
|
$ |
25.19 |
|
| Granted during the period |
|
|
1,021,299 |
|
|
|
30.47 |
|
|
|
1,031,231 |
|
|
|
28.70 |
|
| Vested during the period |
|
|
(375,761 |
) |
|
|
21.24 |
|
|
|
(387,558 |
) |
|
|
27.43 |
|
| Forfeited during the period |
|
|
(114,923 |
) |
|
|
27.01 |
|
|
|
(225,737 |
) |
|
|
25.87 |
|
| Nonvested at end of period |
|
|
3,594,506 |
|
|
$ |
27.40 |
|
|
|
3,473,760 |
|
|
$ |
25.94 |
|
The Company recorded $6.5 million and $16.8 million of compensation expense related to the RSUs for the three and nine months ended September 30,
2025, respectively, compared to $5.5 million and $14.9 million for the three and nine months ended September 30, 2024, respectively. These amounts included $294 thousand and $794 thousand related to RSUs issued to the Company’s directors during the
three and nine months ended September 30, 2025, respectively, compared to $250 thousand and $783 thousand for the three and nine months ended September 30, 2024, respectively. At September 30, 2025, there was $53.6 million of unrecognized compensation
cost related to RSUs that is expected to be recognized over a weighted average period of 2.74 years.
Restricted Stock Awards
The following table summarizes the Company’s RSA activity for the periods indicated:
| |
|
Nine Months Ended September 30, |
|
| |
|
2025 |
|
|
2024 |
|
| |
|
Shares |
|
|
Weighted
Average Grant
Date Fair Value |
|
|
Shares |
|
|
Weighted
Average Grant
Date Fair Value |
|
| Nonvested at beginning of period |
|
|
247,537 |
|
|
$ |
28.67 |
|
|
|
526,868 |
|
|
$ |
28.14 |
|
| Vested during the period |
|
|
(209,170 |
) |
|
|
30.36 |
|
|
|
(247,336 |
) |
|
|
27.49 |
|
| Forfeited during the period |
|
|
(1,867 |
) |
|
|
31.48 |
|
|
|
(29,371 |
) |
|
|
28.86 |
|
| Nonvested at end of period |
|
|
36,500 |
|
|
$ |
18.79 |
|
|
|
250,161 |
|
|
$ |
28.70 |
|
The Company recorded $26 thousand and $457 thousand of compensation expense related to the RSAs for the three and nine months ended September 30,
2025, respectively, compared to $332 thousand and $663 thousand for the three and nine months ended September 30, 2024, respectively. At September 30, 2025, there was $167 thousand of unrecognized compensation cost related to RSAs that is expected to
be recognized over a weighted average period of 1.67 years.
The following table presents information regarding the vesting of the Company’s nonvested share-based compensation grants outstanding at September
30, 2025:
| |
|
Number of Shares |
|
| Period Ending |
|
PSU |
|
|
RSU |
|
|
RSA |
|
| December 31, 2026 |
|
|
501,514 |
|
|
|
1,606,833 |
|
|
|
— |
|
| December 31, 2027 |
|
|
249,768 |
|
|
|
990,335 |
|
|
|
36,500 |
|
| December 31, 2028 |
|
|
263,493 |
|
|
|
664,329 |
|
|
|
— |
|
| December 31, 2029 and later |
|
|
— |
|
|
|
333,009 |
|
|
|
— |
|
| Total nonvested shares |
|
|
1,014,775 |
|
|
|
3,594,506 |
|
|
|
36,500 |
|
NOTE 11. EARNINGS PER SHARE AND DIVIDEND DATA
Basic and diluted EPS are calculated in accordance with ASC 260, Earnings Per Share. Basic EPS is computed by dividing net income available
to common shareholders by the weighted-average number of common shares outstanding for the period. Diluted EPS is computed using the weighted-average number of shares determined for the basic EPS computation plus the shares resulting from the assumed
exercise of all outstanding share-based awards using the treasury stock method. For both the three months ended September 30, 2025 and 2024, no antidilutive equity awards were excluded from dilutive shares. For the nine months ended September 30, 2025,
148 antidilutive equity awards were excluded from dilutive shares, compared to 83 thousand for the nine months ended September 30, 2024.
The following table provides a reconciliation of the numerators and denominators of the basic and diluted EPS computations for the periods
indicated:
| |
|
Three Months Ended September 30, |
|
|
Nine Months Ended September 30, |
|
| (In thousands, except per share amounts) |
|
2025 |
|
|
2024 |
|
|
2025 |
|
|
2024 |
|
| Net income |
|
$ |
129,849 |
|
|
$ |
136,439 |
|
|
|
397,716 |
|
|
|
390,889 |
|
| Less: preferred dividends |
|
|
2,372 |
|
|
|
2,372 |
|
|
|
9,488 |
|
|
|
7,116 |
|
| Net income available to common shareholders |
|
$ |
127,477 |
|
|
$ |
134,067 |
|
|
$ |
388,228 |
|
|
$ |
383,773 |
|
| |
|
|
|
|
|
|
|
|
|
|
|
|
|
|
|
|
| Weighted average common shares outstanding |
|
|
186,307 |
|
|
|
182,390 |
|
|
|
185,148 |
|
|
|
182,536 |
|
| Dilutive effect of stock compensation |
|
|
2,746 |
|
|
|
3,106 |
|
|
|
2,468 |
|
|
|
2,907 |
|
| Weighted average diluted common shares |
|
|
189,053 |
|
|
|
185,496 |
|
|
|
187,616 |
|
|
|
185,443 |
|
| |
|
|
|
|
|
|
|
|
|
|
|
|
|
|
|
|
| Basic earnings per common share |
|
$ |
0.68 |
|
|
$ |
0.74 |
|
|
|
2.10 |
|
|
|
2.10 |
|
| |
|
|
|
|
|
|
|
|
|
|
|
|
|
|
|
|
| Diluted earnings per common share |
|
$ |
0.67 |
|
|
$ |
0.72 |
|
|
|
2.07 |
|
|
|
2.07 |
|
Dividends to shareholders are subject to approval by the applicable regulatory authorities.
NOTE 12. ACCUMULATED OTHER COMPREHENSIVE INCOME (LOSS) (“AOCI”)
Activity within the balances in AOCI (loss) is shown in the following tables for the periods indicated:
| (In thousands) |
|
Unrealized loss on AFS
securities |
|
|
Pension and other
postretirement benefits |
|
|
Accumulated other
comprehensive loss |
|
| Balance at June 30, 2025 |
|
$ |
(533,498 |
) |
|
$ |
(42,659 |
) |
|
$ |
(576,157 |
) |
| Net change |
|
|
81,819 |
|
|
|
556 |
|
|
|
82,375 |
|
| Balance at September 30, 2025 |
|
$ |
(451,679 |
) |
|
$ |
(42,103 |
) |
|
$ |
(493,782 |
) |
| |
|
|
|
|
|
|
|
|
|
|
|
|
| Balance at June 30, 2024 |
|
$ |
(738,506 |
) |
|
$ |
(43,956 |
) |
|
$ |
(782,462 |
) |
| Net change |
|
|
191,557 |
|
|
|
563 |
|
|
|
192,120 |
|
| Balance at September 30, 2024 |
|
$ |
(546,949 |
) |
|
$ |
(43,393 |
) |
|
$ |
(590,342 |
) |
| |
|
|
|
|
|
|
|
|
|
|
|
|
| Balance at December 31, 2024 |
|
$ |
(650,725 |
) |
|
$ |
(43,770 |
) |
|
$ |
(694,495 |
) |
| Net change |
|
|
199,046 |
|
|
|
1,667 |
|
|
|
200,713 |
|
| Balance at September 30, 2025 |
|
$ |
(451,679 |
) |
|
$ |
(42,103 |
) |
|
$ |
(493,782 |
) |
| |
|
|
|
|
|
|
|
|
|
|
|
|
| Balance at December 31, 2023 |
|
$ |
(716,749 |
) |
|
$ |
(45,080 |
) |
|
$ |
(761,829 |
) |
| Net change |
|
|
169,800 |
|
|
|
1,687 |
|
|
|
171,487 |
|
| Balance at September 30, 2024 |
|
$ |
(546,949 |
) |
|
$ |
(43,393 |
) |
|
$ |
(590,342 |
) |
NOTE 13. CAPITAL AND REGULATORY MATTERS
The Company is subject to various regulatory capital requirements administered by the federal and state banking agencies. Regulatory capital ratios
at September 30, 2025 and December 31, 2024 were calculated in accordance with the Basel III capital framework as well as the interagency final rule published on September 30, 2020 entitled “Revised Transition of the Current Expected Credit Losses
Methodology for Allowances.” Failure to meet minimum capital requirements can initiate certain mandatory and possibly additional discretionary actions by regulators that, if undertaken, could have a direct material adverse effect on the Company’s
consolidated financial statements. Under capital adequacy guidelines and the regulatory framework for prompt corrective action, the Company must meet specific capital guidelines that involve quantitative measures of the Company’s assets, liabilities
and certain off-balance sheet items as calculated under regulatory accounting practices. The Company’s capital amounts and classification are also subject to qualitative judgments by regulators about components, risk weightings and other factors.
Quantitative measures are established by regulation to ensure capital adequacy and require the Company to maintain minimum capital amounts and ratios.
Additionally, regulatory capital rules include a capital conservation buffer which the Company must maintain in addition to its minimum risk-based
capital requirements. This buffer applies to all three risk-based capital measurements (CET1, Tier 1 and total capital to risk-weighted assets). A financial institution with a conservation buffer of less than the required amount is subject to
limitations on capital distributions, including dividend payments, stock repurchases, and certain discretionary bonus payments to executive officers.
The actual capital amounts and ratios for the Company are presented in the following tables and as shown, exceed the thresholds necessary to be
considered “well capitalized.” Management believes that no events or changes have occurred subsequent to the indicated dates that would change this designation.
| |
|
September 30, 2025 |
|
|
December 31, 2024 |
|
| (Dollars in thousands) |
|
Amount |
|
|
Ratio |
|
|
Amount |
|
|
Ratio |
|
| Actual: |
|
|
|
|
|
|
|
|
|
|
|
|
| Common equity Tier 1 capital (to risk-weighted assets) |
|
$ |
4,772,204 |
|
|
|
11.51 |
% |
|
$ |
4,693,487 |
|
|
|
12.35 |
% |
| Tier 1 capital (to risk-weighted assets) |
|
|
4,939,197 |
|
|
|
11.91 |
|
|
|
4,860,480 |
|
|
|
12.79 |
|
| Total capital (to risk-weighted assets) |
|
|
5,429,072 |
|
|
|
13.09 |
|
|
|
5,306,647 |
|
|
|
13.97 |
|
| Tier 1 leverage capital (to average assets) |
|
|
4,939,197 |
|
|
|
9.24 |
|
|
|
4,860,480 |
|
|
|
10.41 |
|
| Minimum requirement(1): |
|
|
|
|
|
|
|
|
|
|
|
|
|
|
|
|
| Common equity Tier 1 capital (to risk-weighted assets) |
|
|
1,865,811 |
|
|
|
4.50 |
|
|
|
1,709,652 |
|
|
|
4.50 |
|
| Tier 1 capital (to risk-weighted assets) |
|
|
2,487,748 |
|
|
|
6.00 |
|
|
|
2,279,536 |
|
|
|
6.00 |
|
| Total capital (to risk-weighted assets) |
|
|
3,316,998 |
|
|
|
8.00 |
|
|
|
3,039,382 |
|
|
|
8.00 |
|
| Tier 1 leverage capital (to average assets) |
|
|
2,137,927 |
|
|
|
4.00 |
|
|
|
1,867,273 |
|
|
|
4.00 |
|
| Well capitalized requirement under prompt corrective action provisions: |
|
|
|
|
|
|
|
|
|
|
|
|
|
|
|
|
| Common equity Tier 1 capital (to risk-weighted assets) |
|
|
2,695,061 |
|
|
|
6.50 |
|
|
|
2,469,498 |
|
|
|
6.50 |
|
| Tier 1 capital (to risk-weighted assets) |
|
|
3,316,998 |
|
|
|
8.00 |
|
|
|
3,039,382 |
|
|
|
8.00 |
|
| Total capital (to risk-weighted assets) |
|
|
4,146,247 |
|
|
|
10.00 |
|
|
|
3,799,227 |
|
|
|
10.00 |
|
| Tier 1 leverage capital (to average assets) |
|
|
2,672,408 |
|
|
|
5.00 |
|
|
|
2,334,092 |
|
|
|
5.00 |
|
|
(1) |
The additional capital conservation buffer in effect was 2.5%. |
On April 25, 2025, the Company announced a share repurchase program whereby the Company may acquire up to an aggregate of 10,000,000 shares of its
common stock in the open market at prevailing market prices or in privately negotiated transactions. No shares had been purchased by the Company under this repurchase program as of September 30, 2025.
The extent and timing of any repurchases depends on market conditions and other corporate, legal and regulatory considerations. Repurchased shares
are held as authorized and unissued shares. These authorized but unissued shares are available for use in the Company’s stock compensation programs, other transactions, or for other corporate purposes as determined by the Company’s Board of Directors.
Federal and state banking laws and regulations and state corporate laws restrict the amount of dividends that the Company may declare and pay.
Under Mississippi law, the Company cannot pay any dividend on its common stock unless it has received written approval of the Commissioner of the MDBCF. The federal banking agencies have indicated that paying dividends that deplete a depository
institution’s capital base to an inadequate level would be an unsafe and unsound banking practice. The Federal Reserve must approve any dividend that exceeds the Company’s current year’s net income plus its retained net income from the prior two
calendar years.
NOTE 14. SEGMENT REPORTING
The Company determines operating segments based upon the services offered, the significance of those services to the Company's financial condition
and operating results, and management's regular review of the operating results of those services. The Company’s CODM is the Company’s CEO. The application and development of management reporting methodologies is a robust process and is subject to
periodic enhancements. As these enhancements are made, financial results presented by each reportable segment may be periodically revised. Cadence makes operating decisions based on the following operating segments, as described below.
|
· |
Corporate Banking segment focuses on C&I, business banking, and CRE lending to clients in the geographic footprint. |
|
· |
Community Banking segment provides a broad range of banking services through the branch network to serve the needs of community businesses and individual
consumers in the geographic footprint. |
|
· |
Mortgage segment includes mortgage banking activities of originating mortgage loans, selling mortgage loans in the secondary market and servicing the mortgage
loans that are sold on a servicing retained basis. |
|
· |
Banking Services segment offers individuals, businesses, governmental institutions, and non-profit entities a wide range of solutions to help protect, grow,
and transfer wealth. Offerings include credit-related products via Private Banking services, trust and investment management, asset management, retirement and savings solutions, estate planning and annuity products. |
| |
|
|
|
· |
General Corporate and Other segment includes other activities not allocated to other aforementioned operating segments. Additionally, intercompany eliminations
are included as they do not reflect normal operations of the other segments. The disaggregation of General Corporate and Other better defines the results from the individual segments due to the direct relationship of the internal support
provided by the strategic business units within the Bank. |
Results of operations and selected financial information by operating segment for periods indicated are presented in the following tables. The
tables show total noninterest income segregated between contracts with customers within the scope of ASC 606, Revenue from Contracts with Customers, and those within the scope of other GAAP Topics. Additionally, with the adoption of ASU
2023-07, the tables show significant segment expenses within total noninterest expense used by the CODM to assess the performance of each segment.
Results of operations and selected financial information by operating segment for periods indicated are presented in the following tables. Also,
the tables show total noninterest income segregated between contracts with customers within the scope of ASC 606, Revenue from Contracts with Customers, and those within the scope of other GAAP Topics.
| (In thousands) |
|
Corporate
Banking |
|
|
Community
Banking |
|
|
Mortgage |
|
|
Banking
Services |
|
|
General
Corporate
and Other |
|
|
Total |
|
| Results of Operations |
|
|
|
|
|
|
|
|
|
|
|
|
|
|
|
|
|
|
|
|
|
|
|
|
| Three Months Ended September 30, 2025 |
|
|
|
|
|
|
|
|
|
|
|
|
|
|
|
|
|
|
|
|
|
|
|
|
| Net interest revenue |
|
$ |
115,255 |
|
|
$ |
292,175 |
|
|
$ |
31,998 |
|
|
$ |
12,026 |
|
|
$ |
(27,727 |
) |
|
$ |
423,727 |
|
| Provision (release) for credit losses |
|
|
26,385 |
|
|
|
16,501 |
|
|
|
829 |
|
|
|
155 |
|
|
|
(11,870 |
) |
|
|
32,000 |
|
Net interest revenue after provision (release) for
credit losses |
|
|
88,870 |
|
|
|
275,674 |
|
|
|
31,169 |
|
|
|
11,871 |
|
|
|
(15,857 |
) |
|
|
391,727 |
|
| Noninterest revenue |
|
|
|
|
|
|
|
|
|
|
|
|
|
|
|
|
|
|
|
|
|
|
|
|
| In Scope of Topic 606 |
|
|
|
|
|
|
|
|
|
|
|
|
|
|
|
|
|
|
|
|
|
|
|
|
| Trust and asset management income |
|
|
89 |
|
|
|
19 |
|
|
|
— |
|
|
|
12,582 |
|
|
|
(742 |
) |
|
|
11,948 |
|
| Investment advisory fees |
|
|
— |
|
|
|
— |
|
|
|
— |
|
|
|
9,393 |
|
|
|
(79 |
) |
|
|
9,314 |
|
| Other brokerage fees |
|
|
— |
|
|
|
22 |
|
|
|
— |
|
|
|
1,607 |
|
|
|
— |
|
|
|
1,629 |
|
| Deposit service charges |
|
|
3,700 |
|
|
|
14,970 |
|
|
|
— |
|
|
|
214 |
|
|
|
163 |
|
|
|
19,047 |
|
| Credit card, debit card and merchant fees |
|
|
1 |
|
|
|
217 |
|
|
|
— |
|
|
|
— |
|
|
|
13,266 |
|
|
|
13,484 |
|
| Total noninterest revenue (in-scope of Topic 606) |
|
|
3,790 |
|
|
|
15,228 |
|
|
|
— |
|
|
|
23,796 |
|
|
|
12,608 |
|
|
|
55,422 |
|
| Total noninterest revenue (out-of-scope of Topic 606) |
|
|
12,563
|
|
|
|
21,694
|
|
|
|
5,597
|
|
|
|
1,73
|
|
|
|
(3,591
|
) |
|
|
38,056
|
|
| Total noninterest revenue |
|
|
16,353 |
|
|
|
36,922 |
|
|
|
5,597 |
|
|
|
25,589 |
|
|
|
9,017 |
|
|
|
93,478 |
|
| Noninterest expense |
|
|
|
|
|
|
|
|
|
|
|
|
|
|
|
|
|
|
|
|
|
|
|
|
| Salaries and employee benefits |
|
|
23,427 |
|
|
|
63,950 |
|
|
|
6,324 |
|
|
|
13,548 |
|
|
|
66,236 |
|
|
|
173,485 |
|
| Occupancy and equipment |
|
|
304 |
|
|
|
21,892 |
|
|
|
368 |
|
|
|
187 |
|
|
|
9,141 |
|
|
|
31,892 |
|
| Data processing and software |
|
|
970 |
|
|
|
1,418 |
|
|
|
1,168 |
|
|
|
1,101 |
|
|
|
31,463 |
|
|
|
36,120 |
|
| Allocated overhead expenses |
|
|
22,021 |
|
|
|
82,823 |
|
|
|
7,286 |
|
|
|
4,601 |
|
|
|
(116,731 |
) |
|
|
— |
|
| Other segment items(1) |
|
|
9,435 |
|
|
|
11,850 |
|
|
|
4,498 |
|
|
|
4,601 |
|
|
|
48,365 |
|
|
|
78,749 |
|
| Total noninterest expense |
|
|
56,157 |
|
|
|
181,933 |
|
|
|
19,644 |
|
|
|
24,038 |
|
|
|
38,474 |
|
|
|
320,246 |
|
| Income (loss) before income taxes |
|
|
49,066 |
|
|
|
130,663 |
|
|
|
17,122 |
|
|
|
13,422 |
|
|
|
(45,314 |
) |
|
|
164,959 |
|
| Income tax expense (benefit) |
|
|
11,540 |
|
|
|
30,739 |
|
|
|
4,027 |
|
|
|
3,145 |
|
|
|
(14,341 |
) |
|
|
35,110 |
|
| Net income (loss) |
|
$ |
37,526 |
|
|
$ |
99,924 |
|
|
$ |
13,095 |
|
|
$ |
10,277 |
|
|
$ |
(30,973 |
) |
|
$ |
129,849 |
|
| Selected Financial Information |
|
|
|
|
|
|
|
|
|
|
|
|
|
|
|
|
|
|
|
|
|
|
|
|
| Total assets at end of period |
|
$ |
12,084,856 |
|
|
$ |
19,507,088 |
|
|
$ |
6,647,025 |
|
|
$ |
1,267,426 |
|
|
$ |
13,775,957 |
|
|
$ |
53,282,352 |
|
| (In thousands) |
|
Corporate
Banking |
|
|
Community
Banking |
|
|
Mortgage |
|
|
Banking
Services |
|
|
General
Corporate
and Other |
|
|
Total |
|
|
|
| Results of Operations |
|
|
|
|
|
|
|
|
|
|
|
|
|
|
|
|
|
|
|
|
|
|
|
|
| Three Months Ended September 30, 2024 |
|
|
|
|
|
|
|
|
|
|
|
|
|
|
|
|
|
|
|
|
|
|
|
|
| Net interest revenue |
|
$ |
117,902 |
|
|
$ |
274,871 |
|
|
$ |
23,938 |
|
|
$ |
9,426 |
|
|
$ |
(64,679 |
) |
|
$ |
361,458 |
|
| Provision (release) for credit losses |
|
|
1,537 |
|
|
|
3,642 |
|
|
|
2,884 |
|
|
|
(867 |
) |
|
|
4,804 |
|
|
|
12,000 |
|
Net interest revenue after provision (release) for
credit losses |
|
|
116,365 |
|
|
|
271,229 |
|
|
|
21,054 |
|
|
|
10,293 |
|
|
|
(69,483 |
) |
|
|
349,458 |
|
| Noninterest revenue |
| In Scope of Topic 606 |
| Trust and asset management income |
|
|
588 |
|
|
|
7 |
|
|
|
— |
|
|
|
12,197 |
|
|
|
(737 |
) |
|
|
12,055 |
|
| Investment advisory fees |
|
|
— |
|
|
|
— |
|
|
|
— |
|
|
|
8,679 |
|
|
|
(38 |
) |
|
|
8,641 |
|
| Other brokerage fees |
|
|
— |
|
|
|
— |
|
|
|
— |
|
|
|
1,567 |
|
|
|
— |
|
|
|
1,567 |
|
| Deposit service charges |
|
|
3,560 |
|
|
|
13,873 |
|
|
|
— |
|
|
|
1,131 |
|
|
|
250 |
|
|
|
18,814 |
|
| Credit card, debit card and merchant fees |
|
|
— |
|
|
|
9,331 |
|
|
|
— |
|
|
|
— |
|
|
|
3,318 |
|
|
|
12,649 |
|
| Total noninterest revenue (in-scope of Topic 606) |
|
|
4,148 |
|
|
|
23,211 |
|
|
|
— |
|
|
|
23,574 |
|
|
|
2,793 |
|
|
|
53,726 |
|
| Total noninterest revenue (out-of-scope of Topic 606) |
|
|
10,120
|
|
|
|
10,499
|
|
|
|
2,339
|
|
|
|
1,993
|
|
|
|
7,224
|
|
|
|
32,175
|
|
| Total noninterest revenue |
|
|
14,268 |
|
|
|
33,710 |
|
|
|
2,339 |
|
|
|
25,567 |
|
|
|
10,017 |
|
|
|
85,901 |
|
| Noninterest expense |
| Salaries and employee benefits |
|
|
20,945 |
|
|
|
58,403 |
|
|
|
6,283 |
|
|
|
12,706 |
|
|
|
53,900 |
|
|
|
152,237 |
|
| Occupancy and equipment |
|
|
1,154 |
|
|
|
18,848 |
|
|
|
1,044 |
|
|
|
784 |
|
|
|
7,064 |
|
|
|
28,894 |
|
| Data processing and software |
|
|
1,291 |
|
|
|
1,135 |
|
|
|
1,080 |
|
|
|
1,300 |
|
|
|
24,358 |
|
|
|
29,164 |
|
| Allocated overhead expenses |
|
|
24,378 |
|
|
|
63,141 |
|
|
|
7,577 |
|
|
|
3,899 |
|
|
|
(98,995 |
) |
|
|
— |
|
| Other segment items(1) |
|
|
7,201 |
|
|
|
12,313 |
|
|
|
3,329 |
|
|
|
4,550 |
|
|
|
21,750 |
|
|
|
49,143 |
|
| Total noninterest expense |
|
|
54,969 |
|
|
|
153,840 |
|
|
|
19,313 |
|
|
|
23,239 |
|
|
|
8,077 |
|
|
|
259,438 |
|
| Income (loss) before income taxes |
|
|
75,664 |
|
|
|
151,099 |
|
|
|
4,080 |
|
|
|
12,621 |
|
|
|
(67,543 |
) |
|
|
175,921 |
|
| Income tax expense (benefit) |
|
|
17,770 |
|
|
|
35,520 |
|
|
|
959 |
|
|
|
2,953 |
|
|
|
(17,720 |
) |
|
|
39,482 |
|
| Net income (loss) |
|
$ |
57,894 |
|
|
$ |
115,579 |
|
|
$ |
3,121 |
|
|
$ |
9,668 |
|
|
$ |
(49,823 |
) |
|
$ |
136,439 |
|
| Selected Financial Information |
|
|
|
|
|
|
|
|
|
|
|
|
|
|
|
|
|
|
|
|
|
|
|
|
| Total assets at end of period |
|
$ |
11,615,930 |
|
|
$ |
17,292,396 |
|
|
$ |
5,504,256 |
|
|
$ |
1,099,441 |
|
|
$ |
13,692,910 |
|
|
$ |
49,204,933 |
|
| (In thousands) |
|
Corporate
Banking |
|
|
Community
Banking |
|
|
Mortgage |
|
|
Banking
Services |
|
|
General
Corporate
and Other |
|
|
Total |
|
| Results of Operations |
|
|
|
|
|
|
|
|
|
|
|
|
|
|
|
|
|
|
|
|
|
|
|
|
| Nine Months Ended September 30, 2025 |
|
|
|
|
|
|
|
|
|
|
|
|
|
|
|
|
|
|
|
|
|
|
|
|
| Net interest revenue |
|
$ |
333,641 |
|
|
$ |
817,266 |
|
|
$ |
87,585 |
|
|
$ |
32,895 |
|
|
$ |
(106,368 |
) |
|
$ |
1,165,019 |
|
| Provision (release) for credit losses |
|
|
45,097 |
|
|
|
47,010 |
|
|
|
11,547 |
|
|
|
1,866 |
|
|
|
(22,520 |
) |
|
|
83,000 |
|
| Net interest revenue after provision (release) for credit losses |
|
|
288,544 |
|
|
|
770,256 |
|
|
|
76,038 |
|
|
|
31,029 |
|
|
|
(83,848 |
) |
|
|
1,082,019 |
|
| Noninterest revenue |
|
|
|
|
|
|
|
|
|
|
|
|
|
|
|
|
|
|
|
|
|
|
|
|
| In Scope of Topic 606 |
|
|
|
|
|
|
|
|
|
|
|
|
|
|
|
|
|
|
|
|
|
|
|
|
| Trust and asset management income |
|
|
573 |
|
|
|
27 |
|
|
|
— |
|
|
|
38,672 |
|
|
|
(2,274 |
) |
|
|
36,998 |
|
| Investment advisory fees |
|
|
— |
|
|
|
— |
|
|
|
— |
|
|
|
26,939 |
|
|
|
(201 |
) |
|
|
26,738 |
|
| Other brokerage fees |
|
|
— |
|
|
|
22 |
|
|
|
— |
|
|
|
4,910 |
|
|
|
— |
|
|
|
4,932 |
|
| Deposit service charges |
|
|
11,800 |
|
|
|
42,490 |
|
|
|
— |
|
|
|
691 |
|
|
|
(137 |
) |
|
|
54,844 |
|
| Credit card, debit card and merchant fees |
|
|
3 |
|
|
|
8,840 |
|
|
|
— |
|
|
|
— |
|
|
|
29,602 |
|
|
|
38,445 |
|
| Total noninterest revenue (in-scope of Topic 606) |
|
|
12,376 |
|
|
|
51,379 |
|
|
|
— |
|
|
|
71,212 |
|
|
|
26,990 |
|
|
|
161,957 |
|
| Total noninterest revenue (out-of-scope of Topic 606) |
|
|
37,282 |
|
|
|
52,092 |
|
|
|
23,390 |
|
|
|
5,095 |
|
|
|
(2,770 |
) |
|
|
115,089 |
|
| Total noninterest revenue |
|
|
49,658 |
|
|
|
103,471 |
|
|
|
23,390 |
|
|
|
76,307 |
|
|
|
24,220 |
|
|
|
277,046 |
|
| Noninterest expense |
|
|
|
|
|
|
|
|
|
|
|
|
|
|
|
|
|
|
|
|
|
|
|
|
| Salaries and employee benefits |
|
|
67,784 |
|
|
|
186,492 |
|
|
|
17,935 |
|
|
|
40,115 |
|
|
|
171,471 |
|
|
|
483,797 |
|
| Occupancy and equipment |
|
|
959 |
|
|
|
61,113 |
|
|
|
1,193 |
|
|
|
810 |
|
|
|
26,333 |
|
|
|
90,408 |
|
| Data processing and software |
|
|
2,882 |
|
|
|
2,589 |
|
|
|
3,617 |
|
|
|
3,877 |
|
|
|
80,988 |
|
|
|
93,953 |
|
| Allocated overhead expenses |
|
|
62,799 |
|
|
|
221,893 |
|
|
|
20,155 |
|
|
|
12,945 |
|
|
|
(317,792 |
) |
|
|
— |
|
| Other segment items(1) |
|
|
26,810 |
|
|
|
30,800 |
|
|
|
13,539 |
|
|
|
13,436 |
|
|
|
99,715 |
|
|
|
184,300 |
|
| Total noninterest expense |
|
|
161,234 |
|
|
|
502,887 |
|
|
|
56,439 |
|
|
|
71,183 |
|
|
|
60,715 |
|
|
|
852,458 |
|
| Income (loss) before income taxes |
|
|
176,968 |
|
|
|
370,840 |
|
|
|
42,989 |
|
|
|
36,153 |
|
|
|
(120,343 |
) |
|
|
506,607 |
|
| Income tax expense (benefit) |
|
|
41,597 |
|
|
|
87,180 |
|
|
|
10,106 |
|
|
|
8,461 |
|
|
|
(38,453 |
) |
|
|
108,891 |
|
| Net income (loss) |
|
$ |
135,371 |
|
|
$ |
283,660 |
|
|
$ |
32,883 |
|
|
$ |
27,692 |
|
|
$ |
(81,890 |
) |
|
$ |
397,716 |
|
| Selected Financial Information |
|
|
|
|
|
|
|
|
|
|
|
|
|
|
|
|
|
|
|
|
|
|
|
|
| Total assets at end of period |
|
$ |
12,084,856 |
|
|
$ |
19,507,088 |
|
|
$ |
6,647,025 |
|
|
$ |
1,267,426 |
|
|
$ |
13,775,957 |
|
|
$ |
53,282,352 |
|
| (In thousands) |
|
Corporate
Banking |
|
|
Community
Banking |
|
|
Mortgage |
|
|
Banking
Services |
|
|
General
Corporate
and Other |
|
|
Total |
|
| Results of Operations |
|
|
|
|
|
|
|
|
|
|
|
|
|
|
|
|
|
|
|
|
|
|
|
|
| Nine Months Ended September 30, 2024 |
|
|
|
|
|
|
|
|
|
|
|
|
|
|
|
|
|
|
|
|
|
|
|
|
| Net interest revenue |
|
$ |
342,312 |
|
|
$ |
832,804 |
|
|
$ |
68,962 |
|
|
$ |
29,477 |
|
|
$ |
(201,871 |
) |
|
$ |
1,071,684 |
|
| Provision (release) for credit losses |
|
|
38,466 |
|
|
|
(801 |
) |
|
|
11,561 |
|
|
|
(1,620 |
) |
|
|
8,394 |
|
|
|
56,000 |
|
| Net interest revenue after provision (release) for credit losses |
|
|
303,846 |
|
|
|
833,605 |
|
|
|
57,401 |
|
|
|
31,097 |
|
|
|
(210,265 |
) |
|
|
1,015,684 |
|
| Noninterest revenue |
|
|
|
|
|
|
|
|
|
|
|
|
|
|
|
|
|
|
|
|
|
|
|
|
| In Scope of Topic 606 |
|
|
|
|
|
|
|
|
|
|
|
|
|
|
|
|
|
|
|
|
|
|
|
|
| Trust and asset management income |
|
|
1,233 |
|
|
|
14 |
|
|
|
— |
|
|
|
36,958 |
|
|
|
(2,182 |
) |
|
|
36,023 |
|
| Investment advisory fees |
|
|
— |
|
|
|
— |
|
|
|
— |
|
|
|
25,290 |
|
|
|
(133 |
) |
|
|
25,157 |
|
| Other brokerage fees |
|
|
— |
|
|
|
— |
|
|
|
— |
|
|
|
4,551 |
|
|
|
— |
|
|
|
4,551 |
|
| Deposit service charges |
|
|
10,262 |
|
|
|
40,763 |
|
|
|
— |
|
|
|
3,011 |
|
|
|
767 |
|
|
|
54,803 |
|
| Credit card, debit card and merchant fees |
|
|
259 |
|
|
|
27,885 |
|
|
|
— |
|
|
|
7 |
|
|
|
9,430 |
|
|
|
37,581 |
|
| Total noninterest revenue (in-scope of Topic 606) |
|
|
11,754 |
|
|
|
68,662 |
|
|
|
— |
|
|
|
69,817 |
|
|
|
7,882 |
|
|
|
158,115 |
|
| Total noninterest revenue (out-of-scope of Topic 606) |
|
|
27,489 |
|
|
|
29,112 |
|
|
|
17,271 |
|
|
|
8,460 |
|
|
|
29,898 |
|
|
|
112,230 |
|
| Total noninterest revenue |
|
|
39,243 |
|
|
|
97,774 |
|
|
|
17,271 |
|
|
|
78,277 |
|
|
|
37,780 |
|
|
|
270,345 |
|
| Noninterest expense |
|
|
|
|
|
|
|
|
|
|
|
|
|
|
|
|
|
|
|
|
|
|
|
|
| Salaries and employee benefits |
|
|
62,561 |
|
|
|
173,434 |
|
|
|
18,660 |
|
|
|
40,451 |
|
|
|
161,820 |
|
|
|
456,926 |
|
| Occupancy and equipment |
|
|
3,196 |
|
|
|
55,746 |
|
|
|
3,236 |
|
|
|
2,471 |
|
|
|
22,252 |
|
|
|
86,901 |
|
| Data processing and software |
|
|
2,968 |
|
|
|
2,017 |
|
|
|
3,045 |
|
|
|
4,431 |
|
|
|
76,197 |
|
|
|
88,658 |
|
| Allocated overhead expenses |
|
|
72,364 |
|
|
|
185,795 |
|
|
|
22,076 |
|
|
|
11,548 |
|
|
|
(291,783 |
) |
|
|
— |
|
| Other segment items(1) |
|
|
24,290 |
|
|
|
35,206 |
|
|
|
9,661 |
|
|
|
14,291 |
|
|
|
63,410 |
|
|
|
146,858 |
|
| Total noninterest expense |
|
|
165,379 |
|
|
|
452,198 |
|
|
|
56,678 |
|
|
|
73,192 |
|
|
|
31,896 |
|
|
|
779,343 |
|
| Income (loss) before income taxes |
|
|
177,710 |
|
|
|
479,181 |
|
|
|
17,994 |
|
|
|
36,182 |
|
|
|
(204,381 |
) |
|
|
506,686 |
|
| Income tax expense (benefit) |
|
|
41,762 |
|
|
|
112,607 |
|
|
|
4,229 |
|
|
|
8,472 |
|
|
|
(51,273 |
) |
|
|
115,797 |
|
| Net income (loss) |
|
$ |
135,948 |
|
|
$ |
366,574 |
|
|
$ |
13,765 |
|
|
$ |
27,710 |
|
|
$ |
(153,108 |
) |
|
$ |
390,889 |
|
| Selected Financial Information |
|
|
|
|
|
|
|
|
|
|
|
|
|
|
|
|
|
|
|
|
|
|
|
|
| Total assets at end of period |
|
$ |
11,615,930 |
|
|
$ |
17,292,396 |
|
|
$ |
5,504,256 |
|
|
$ |
1,099,441 |
|
|
$ |
13,692,910 |
|
|
$ |
49,204,933 |
|
|
(1) |
Other segment items for each reportable segment includes: |
|
· |
Corporate Banking: legal expenses, travel expenses and certain overhead expenses. |
|
· |
Community Banking: advertising, office supplies, ATM expenses, delivery expenses, professional and consulting fees, legal expenses, telecommunication
and postage expenses, travel expenses, and certain overhead expenses. |
|
· |
Mortgage: loan quality control and loan repurchase expenses, legal expenses, and certain overhead expenses. |
|
· |
Banking Services: amortization of intangibles, professional and consulting fees, legal expenses, and certain overhead expenses. |
|
· |
General, Corporate, and Other: advertising, supplies, regulatory expenses, and certain other overhead expenses. |
NOTE 15. DERIVATIVE INSTRUMENTS
The Company primarily uses derivatives to manage exposure to market risk, including IRR, credit risk and foreign currency risk, and to assist
customers with their risk management objectives. During the third quarter of 2025, management designated certain derivatives as hedging instruments in a qualifying fair value hedge relationship to modify the repricing characteristics of certain
portions of the Company’s AFS securities portfolio. The Company’s other derivative instruments consist of economic hedges for which the Company has elected not to apply hedge accounting and derivatives held for customer accommodation, or other
purposes. Based on adherence to the Company’s credit standards and the presence of the netting, collateral or settlement provisions, the Company believes that the credit risk inherent in these contracts was not material as of September 30, 2025.
The fair value of outstanding derivative positions is included in other assets and other liabilities in the accompanying consolidated balance
sheets and in the net change in each of these financial statement line items in the operating section of the accompanying consolidated statements of cash flows. For derivatives not designated as hedging instruments or determined to be an ineffective
hedge under applicable accounting guidance, gains and losses due to changes in fair value are included in noninterest income and the operating section of the consolidated statements of cash flows. For derivatives designated as fair value hedging
instruments, the entire change in the fair value related to the derivative instrument is recognized as a component of interest income. At September 30, 2025 and December 31, 2024, there were no derivatives designated under hedge accounting. The
notional amounts and estimated fair values for the periods indicated were as follows:
| |
|
September 30, 2025 |
|
|
December 31, 2024 |
|
| |
|
|
|
|
Fair Value |
|
|
Weighted
Average |
|
|
|
|
|
Fair Value |
|
|
Weighted
Average |
|
| (Dollars in thousands) |
|
Notional
Amount |
|
|
Other
Assets |
|
|
Other
Liabilities |
|
|
Maturity
(years) |
|
|
Notional
Amount |
|
|
Other
Assets |
|
|
Other
Liabilities |
|
|
Maturity
(years) |
|
| Derivatives not designated as hedges: |
|
|
|
|
|
|
|
|
|
|
|
|
|
|
|
|
|
|
|
|
|
|
|
|
| Commercial loan interest rate contracts |
|
|
4,491,479 |
|
|
|
30,707 |
|
|
|
39,188 |
|
|
|
4.3 |
|
|
|
3,781,868 |
|
|
|
30,555 |
|
|
|
45,070 |
|
|
|
4.2 |
|
| Mortgage loan held-for-sale interest rate lock commitments |
|
|
176,425 |
|
|
|
2,285 |
|
|
|
— |
|
|
|
0.1 |
|
|
|
151,231 |
|
|
|
1,310 |
|
|
|
15 |
|
|
|
0.1 |
|
| Futures, forwards and options (used to hedge MSR, see Note 8) |
|
|
293,000 |
|
|
|
134 |
|
|
|
1,758 |
|
|
|
0.2 |
|
|
|
230,000 |
|
|
|
— |
|
|
|
3,085 |
|
|
|
0.2 |
|
| Mortgage loan forward sale commitments |
|
|
238,834 |
|
|
|
214 |
|
|
|
954 |
|
|
|
0.1 |
|
|
|
179,000 |
|
|
|
816 |
|
|
|
34 |
|
|
|
0.1 |
|
| Foreign exchange contracts |
|
|
67,478 |
|
|
|
807 |
|
|
|
636 |
|
|
|
0.2 |
|
|
|
55,542 |
|
|
|
650 |
|
|
|
469 |
|
|
|
0.5 |
|
| Total derivatives |
|
$ |
5,267,216 |
|
|
$ |
34,147 |
|
|
$ |
42,536 |
|
|
|
|
|
|
$ |
4,397,641 |
|
|
$ |
33,331 |
|
|
$ |
48,673 |
|
|
|
|
|
The Company engages in balance sheet hedging activity, principally for asset and liability management purposes. Balance sheet hedging activity is
sometimes arranged to qualify for hedge accounting treatment that is accounted for as either fair value hedges or cash flow hedges. The Company did not record any cash flow hedging activity for any period presented.
In the third quarter of 2025, the Company executed interest rate swaps totaling $553 million in notional value, designating the contracts in fair
values hedges to hedge changes in the fair value of the acquired AFS securities portfolio from IBS (see Note 2) attributable to fluctuations in the SOFR OIS swap rate. The swaps were designated in accordance with the portfolio layer method described in
ASU 2022-01, Derivatives and Hedging (Topic 815): Fair Value Hedging—Portfolio Layer Method. The portfolio layer method allows the Company to designate as the hedged item a stated amount of assets that are not expected to be affected by
prepayments, defaults, or other factors affecting the timing and amount of cash flows. All hedged AFS securities were sold and the Company terminated the interest rate swaps and unwound the hedging relationship in the third quarter of 2025.
For a fair value hedge, the gain or loss on the derivative, as well as the offsetting loss or gain on the hedged item attributable to the hedged
risk, are recognized in current earnings as fair values change. Net losses on interest rate swap agreements accounted for under fair value hedging designations totaled $4.3 million for the three and nine months ended September 30, 2025. There were no
interest rate swap agreements designated as a fair value hedge in 2024.
Adjustments to interest income were recorded for the amounts related to terminated hedges reclassified from AOCI. The net amounts resulted in an
increase to interest income of $0.3 million for the three and nine months ended September 30, 2025, respectfully. There were no such adjustments recorded for the three or the nine months ended September 30, 2024.
The following table summarizes the impact on interest income related to the fair value hedges:
| |
|
For the three and nine months
ended September 30, 2025 |
|
| (Dollars in thousands) |
|
|
|
|
| Amounts related to interest settlements |
|
$ |
507 |
|
| Recognized on hedged items |
|
$ |
(226 |
) |
| Net income recognized (1) |
|
$ |
281 |
|
|
(1) |
Reported as an adjustment to interest income on AFS securities in the Consolidated Statements of Income |
The Company is party to collateral support agreements with certain derivative counterparties. Such agreements require that the Company maintain
collateral based on the fair values of derivative transactions. In the event of default by the Company, the counterparty would be entitled to the collateral. At September 30, 2025, and December 31, 2024, the Company was required to post $27.1 million
and $60.9 million, respectively, in cash or qualifying securities as collateral for its derivative transactions, and these amounts were included in interest bearing deposits with other banks for the periods indicated. In addition, the Company had
recorded the obligation to return cash collateral provided by counterparties of $1.2 million and $23.1 million at September 30, 2025 and December 31, 2024, respectively, within deposits on the Company’s consolidated balance sheet. Certain financial
instruments, such as derivatives, may be eligible for offset in the consolidated balance sheet and/or subject to master netting arrangements or similar agreements. The Company’s derivative transactions with upstream financial institution counterparties
are generally executed under International Swaps and Derivative Association master agreements which include “right of set-off” provisions. In such cases, there is generally a legally enforceable right to offset recognized amounts and there may be an
intention to settle such amounts on a net basis. Nonetheless, the Company does not generally offset such financial instruments for financial reporting purposes.
The Company enters into certain interest rate contracts on commercial loans, which include swaps, floors, caps and collars that are not designated
as hedging instruments. These derivative contracts relate to transactions in which the Company enters into an interest rate contract with a loan customer while at the same time entering into an offsetting interest rate contract with another financial
institution. In connection with each swap transaction, the Company agrees to pay interest to the customer on a notional amount at a variable interest rate and receive interest from the customer on a similar notional amount at a fixed interest rate. At
the same time, the Company agrees to pay another financial institution the same fixed interest rate on the same notional amount and receive the same variable interest rate on the same notional amount. The interest rate swap, floor, cap and collar
transactions allow the Company to manage its IRR. Because the Company acts as an intermediary for its customers, changes in the fair value of the underlying derivative contracts generally offset and do not significantly impact the Company’s
consolidated statements of income. The Company is exposed to credit loss in the event of nonperformance by the parties to the interest rate contracts. However, the Company does not anticipate nonperformance by the counterparties. At September 30, 2025
and December 31, 2024, the estimated fair value recorded in other assets on the consolidated balance sheets totaled $30.7 million and $30.6 million, respectively. The corresponding fair value recorded in other liabilities in the accompanying
consolidated balance sheets totaled $39.2 million and $45.1 million at September 30, 2025 and December 31, 2024.
The Company has both bought and sold credit protection in the form of participations on interest rate swaps (swap participations). These swap
participations, which meet the definition of credit derivatives, were entered into in the ordinary course of business to serve the credit needs of customers. Swap participations, whereby the Company has purchased credit protection, entitle the Company
to receive a payment from the counterparty if the customer fails to make payment on any amounts due to the Company upon early termination of the swap transaction. For contracts where the Company sold credit protection, the Company would be required to
make payment to the counterparty if the customer fails to make payment on any amounts due to the counterparty upon early termination of the swap transaction. Swap participation agreements where the Company is the beneficiary had notional values
totaling $210.7 million and $205.1 million at September 30, 2025 and December 31, 2024, respectively. Swap participation agreements where the Company is the guarantor had notional values totaling $472.9 million and $443.0 million at September 30, 2025
and December 31, 2024, respectively.
The Company enters into interest rate lock commitments with customers in connection with residential mortgage loan applications for loans the
Company intends to sell. Additionally, the Company enters into mortgage loan forward sales commitments of MBS with investors to mitigate the effect of IRR inherent in providing interest rate lock commitments to customers. Both the interest rate lock
commitments and mortgage loan forward sales commitments are considered derivatives under current accounting guidance and are required to be recorded at fair value. The fair value of these derivatives is recorded on the consolidated balance sheets in
other assets and other liabilities. The change in fair value of these instruments is recorded within mortgage banking revenue in the consolidated statements of income. For the three months ended September 30, 2025 and 2024, mortgage loans held for sale
interest rate lock commitments and mortgage loan forward sales commitment losses totaled $1.7 million and $11 thousand, respectively. For the nine months ended September 30, 2025, and 2024, mortgage loans held for sale interest rate lock commitments
and mortgage loan forward sales commitment gains totaled $1.0 million and $1.6 million, respectively.
The Company has an economic hedge in place on its MSR and uses various instruments (including but not limited to Treasury options, SOFR and TBA
futures and forwards) to mitigate the IRR associated with the MSR. These hedging instruments are reported at fair value, with adjustments included as part of mortgage banking revenue in the consolidated statements of income. For the three months ended
September 30, 2025 and 2024, the market value adjustment on MSR hedge totaled net gains of $0.2 million and $5.0 million, respectively. For the nine months ended September 30, 2025 and 2024, the market value adjustment on MSR hedge totaled net gains of
$4.6 million and net losses of $1.7 million, respectively. See Note 8 for additional information.
The Company enters into certain foreign currency exchange contracts on behalf of its clients to facilitate their risk management strategies, while
at the same time entering into offsetting foreign currency exchange contracts with another counterparty in order to minimize the Company’s foreign currency exchange risk. The contracts are short term in nature, and any gain or loss incurred at
settlement is recorded as other noninterest income. The fair value of these contracts is reported in other assets and other liabilities. Foreign exchange contract net gains totaled $1.1 million for the three months ended September 30, 2025 and 2024,
respectively, and net gains totaled $3.4 million and $2.9 million for the nine months ended September 30, 2025 and 2024, respectively.
NOTE 16. COMMITMENTS AND CONTINGENT LIABILITIES
Mortgage Loans Serviced for Others
The Company services mortgage loans for other financial institutions that are not included as assets in the Company’s accompanying consolidated
financial statements. Included in the $8.3 billion and $8.0 billion of mortgage loans serviced for investors at September 30, 2025 and December 31, 2024, respectively, was $0.5 million and $0.6 million, respectively, of primary recourse servicing
pursuant to which the Company is responsible for any losses incurred in the event of nonperformance by the mortgagor. The Company's exposure to credit loss in the event of such nonperformance is the unpaid principal balance at the time of default. This
exposure is limited by the underlying collateral, which consists of single family residences and either federal or private mortgage insurance.
Lending Commitments
The consolidated financial statements do not reflect various commitments and contingent liabilities which arise in the ordinary course of business
in the banking industry and involve elements of credit risk, IRR, and liquidity risk. Such financial instruments are recorded when they are funded. At September 30, 2025 and December 31, 2024, these included $423.5 million and $448.9 million,
respectively, in letters of credit and $9.2 billion and $8.6 billion, respectively, in unfunded extensions of credit such as interim mortgage financing, construction credit, credit card, and revolving line of credit arrangements.
Commitments to extend credit and letters of credit include some exposure to credit loss in the event of nonperformance of the customer. Commitments
to extend credit are agreements to lend to a customer as long as there is no violation of any condition established in the contract. In addition, the Company has entered into certain contingent commitments to grant loans. Standby letters of credit are
conditional commitments issued to guarantee the performance of a customer to a third party. The credit policies and procedures for such commitments are the same as those used for lending activities. Because these instruments have fixed maturity dates
and because a number expire without being drawn upon, they generally do not present any significant liquidity risk. The Company did not realize significant credit losses from these commitments and arrangements during the three and nine months ended
September 30, 2025 and 2024.
Other Commitments
The Company makes investments in limited partnerships, including certain affordable housing partnerships for which it receives tax credits. At
September 30, 2025 and December 31, 2024, unfunded capital commitments totaled $322.4 million and $277.4 million, respectively. See Note 17 for more information.
Litigation
The nature of the Company’s business ordinarily results in certain types of claims, litigation, investigations, and other legal or administrative
cases and proceedings. Although the Company and its subsidiaries have policies and procedures to minimize legal noncompliance and the impact of claims and other proceedings, and endeavored to procure reasonable insurance coverage, litigation and
regulatory actions remain an ongoing risk.
The Company and its subsidiaries engage in lines of business that are heavily regulated and involve a large volume of actual or potential financial
transactions with customers or applicants, and the Company is a public company with a large number of shareholders. From time to time, applicants, borrowers, customers, shareholders, former employees, service providers, and other third parties have
brought actions against the Company or its subsidiaries, in certain cases claiming substantial damages. Financial services companies are subject to risks arising from changing regulatory frameworks or expectations, regulatory investigations, class
action litigation, and, from time to time, the Company and its subsidiaries have such actions brought against them. The Company and its subsidiaries are also subject to enforcement actions by federal or state regulators, including the Federal Reserve,
the CFPB, the DOJ, state attorneys general, and the MDBCF, which may be adversely impacted by ongoing litigation in which the Company is involved. Additionally, the Company is, and management expects it to be, engaged in a number of foreclosure
proceedings and other collection actions as part of its lending and leasing collections activities, which, from time to time, have resulted in counterclaims against the Company and its subsidiaries. Various legal proceedings have and may arise in the
future out of claims against entities to which the Company is a successor as a result of business combinations.
When and as the Company determines it has meritorious defenses to the claims asserted, it vigorously defends against such claims. The Company will
consider settlement of claims when, in management’s judgment and in consultation with counsel, it is in the best interests of the Company to do so.
The Company cannot predict with certainty the cost of defense, the cost of prosecution, or the ultimate outcome of litigation or other proceedings
filed by or against it, its subsidiaries and its directors, management or employees, including remedies or damage awards. On at least a quarterly basis, the Company assesses its liabilities and contingencies in connection with outstanding legal
proceedings as well as certain threatened claims (which are not considered incidental to the ordinary conduct of the Company’s business) utilizing the latest and most reliable information available. For matters where a loss is not probable or the
amount of the loss cannot be estimated, the Company will not make an accrual. For matters where it is probable the Company will incur a loss and the amount can be reasonably estimated, the Company will accrue for the loss. Once established, the accrual
is adjusted periodically to reflect any relevant developments. The actual cost of any such matters, however, may turn out to be substantially higher than the amount accrued. Further, the Company’s insurance policies have deductibles and coverage
limits, and such policies are unlikely to cover all costs and expenses related to the defense or prosecution of such legal proceedings or any losses arising therefrom.
Although the final outcome of any legal proceedings is inherently uncertain, based on the information available, advice of counsel and available
insurance coverage, if applicable, management believes that the litigation-related liability of $0.3 million accrued at September 30, 2025 is adequate and that any incremental change in potential liability arising from the Company’s legal proceedings
and threatened claims, including the matters described herein and those otherwise arising in the ordinary course of business, will not have a material adverse effect on the Company’s business or consolidated results of operations or financial
condition. It is possible, however, that future developments could result in an unfavorable outcome for or resolution of any one or more of the legal proceedings in which the Company or its subsidiaries are defendants, which may be material to the
Company’s business or consolidated results of operations or financial condition for a particular fiscal period or periods.
NOTE 17. VARIABLE INTEREST ENTITIES AND OTHER INVESTMENTS
Under ASC 810-10-65, a company is deemed to be the primary beneficiary and required to consolidate a VIE if it has a variable interest in the VIE
that provides a controlling financial interest. The determination of whether a controlling financial interest exists is based on whether a single party has both the power to direct the activities of the VIE that most significantly impact the VIE’s
economic performance and the obligation to absorb the losses of the VIE or the right to receive benefits from the VIE that could potentially be significant to the VIE. ASC 810-10-65 requires continual reconsideration of conclusions reached regarding
which interest holder is a VIE’s primary beneficiary.
Certain NMTC meet the qualifications for consolidation under ASC 810. Consolidation is applicable to this type of investment structure when the
entities owned by the tax credit investment fund, managing member, and limited partner of the sub-CDE are under common control, and the limited partner’s related party group has both the power and the obligation to absorb the significant benefits and
losses of the sub-CDE. Based on this, the limited partner, which is the Company, is the primary beneficiary of the sub-CDE (VIE) and therefore subject to consolidation. NMTC investment structures which include a managing member not affiliated with the
Company are not subject to consolidation.
At September 30, 2025 and December 31, 2024, the Company’s assets of the consolidated VIE that can be used only to settle obligations of the
consolidated VIE totaled $4.4 million and $5.4 million, respectively.
The Company is invested in several tax credit projects solely as a limited partner. At September 30, 2025 and December 31, 2024, the Company’s
maximum exposure to loss associated with these limited partnerships was limited to its investment. Most of the investments are in affordable housing projects. The partnerships have qualified to receive annual affordable housing federal tax credits that
are recognized as a reduction of current tax expense. The Company accounts for these investments and the related tax credits using either the effective yield method or the proportional amortization method, depending upon the date of the investment.
Under the effective yield method, the Company recognizes the tax credits as they are allocated and amortizes the initial costs of the investments to provide a constant effective yield over the period the tax credits are allocated. Under the
proportional amortization method, the Company amortizes the cost of the investment in proportion to the tax credits and other tax benefits received and recognizes the net investment performance in the income statement as a component of income tax
expense. The Company also has, to a lesser degree, investments in NMTC and historic tax credit projects. The Company has elected to account for the NMTC not subject to consolidation and HTC using the flowthrough method, which reduces federal income
taxes in the year in which the credit arises. At September 30, 2025 and December 31, 2024, the Company recorded total tax credit investments in other assets on its consolidated balance sheets of $452.7 million and $387.3 million, respectively.
The Company adopted the provisions of ASU 2023-02 as of January 1, 2024 and determined each investments’ eligibility for proportional amortization.
For certain NMTC and HTC investments that do not qualify for the proportional amortization method under ASU 2023-02, amortization related to these investments are recorded in other noninterest income in the Company’s consolidated statements of income.
The Company recorded amortization of $0.3 million for both the three months ended September 30, 2025 and 2024, and recorded amortization of $1.0 million and $0.8 million for the nine months ended September 30, 2025 and 2024, respectively. The cash flow
activity related to these investments are presented in the net income (loss) line in the operating activities section of the consolidated statements of cash flows.
For the investments that qualify for proportional amortization under ASU 2023-02, the Company recognized income tax credits and other income tax
benefits for the three months ended September 30, 2025 of $13.7 million and $1.4 million, respectively. The total income tax benefits of $15.1 million are partially offset by $12.0 million of investment amortization recognized for the three months
ended September 30, 2025, for a net income tax benefit of $3.1 million. For the three months ended September 30, 2024, the Company recognized income tax credits and other income tax benefits of $10.1 million and $1.2 million, respectively. The total
income tax benefits of $11.3 million are partially offset by $8.9 million of investment amortization recognized for the three months ended September 30, 2024, for a net income tax benefit of $2.4 million.
For the investments that qualify for proportional amortization under ASU 2023-02, the Company recognized income tax credits and other income tax
benefits for the nine months ended September 30, 2025 of $36.9 million and $4.2 million, respectively. The total income tax benefits of $41.1 million are partially offset by $32.6 million of investment amortization recognized for the nine months ended
September 30, 2025, for a net income tax benefit of $8.5 million. For the nine months ended September 30, 2024, the Company recognized income tax credits and other income tax benefits of $29.7 million and $3.6 million, respectively. The total income
tax benefits of $33.3 million are partially offset by $26.5 million of investment amortization recognized for the nine months ended September 30, 2024, for a net income tax benefit of $6.8 million.
The cash flows related to the total income tax benefits are presented in the consolidated statements of cash flows. The net income tax benefit of
$8.5 million for the nine months ended September 30, 2025 was included in the net income (loss) line within operating activities. Investment amortization of $32.6 million for the nine months ended September 30, 2025, was included in the depreciation
and amortization line item, which was an adjustment to reconcile net income (loss) to cash provided by (used for) operating activities. The income tax credits and other income tax benefits of $41.1 million for the nine months ended September 30, 2025
was included in the net change to other assets or liabilities line item, which was also an adjustment to reconcile net income (loss) to cash provided by (used for) operating activities.
Additionally, the Company has investments in other certain limited partnerships accounted for under the fair value practical expedient of NAV
totaling $158.1 million and $118.7 million at September 30, 2025 and December 31, 2024, respectively. Related to assets recorded at fair value through net income, the Company recognized net gains of $3.2 million and $3.6 million for the three months
ended September 30, 2025 and 2024, respectively. The Company recognized net gains of $7.7 million and $9.6 million for the nine months ended September 30, 2025 and 2024 respectively. These investments are made primarily through various SBIC funds as a
strategy to provide expansion and growth opportunities to small businesses and community development funds to help serve the credit needs of the low- and moderate-income and underserved communities within our footprint. Of the total fair value of these
limited partnerships, $21.0 million and $15.8 million are related to real-estate funds at September 30, 2025 and December 31, 2024, respectively. The remaining $137.1 million and $102.9 million are related to SBIC funds that concentrate in a variety of
industries at September 30, 2025 and December 31, 2024, respectively. At September 30, 2025, unfunded commitments related to these investments were $10.3 million and $134.5 million related to the real-estate funds and other SBIC funds, respectively.
SBIC funds are generally structured to operate for approximately 10 years. During the life of each SBIC fund, partners can request to withdraw from the fund, and subsequently receive the balance of their investment as the underlying assets are
liquidated over the remaining life of the fund. As of September 30, 2025, the Company identified approximately $39.7 million of funds in which it plans to sell all of its position, or a portion thereof, at the carrying value of the investment and,
therefore, does not anticipate recognizing a gain or loss on the sale. The Company intends to complete the sale by December 31, 2025.
For other limited partnerships without readily determinable fair values that do not qualify for the practical expedient, Cadence elected the
measurement alternative to account for these investments at their cost minus impairment, plus or minus changes resulting from observable price changes in orderly transactions for the identical or a similar investment of the same issuer. These
investments totaled $2.9 million and $2.6 million at September 30, 2025 and December 31, 2024, respectively. Other limited partnerships accounted for under the equity method totaled $8.7 million at both September 30, 2025 and December 31, 2024.
A summary of the Company’s investments in limited partnerships is presented as of the following periods:
| (In thousands) |
|
September 30, 2025 |
|
|
December 31, 2024 |
|
| Tax credit investments (amortized cost) |
|
$ |
452,673 |
|
|
$ |
387,339 |
|
| Limited partnerships accounted for under the fair value practical expedient of NAV |
|
|
158,092 |
|
|
|
118,710 |
|
| Limited partnerships without readily determinable fair values that do not qualify for the practical expedient of NAV accounted for under the cost method |
|
|
2,913 |
|
|
|
2,586 |
|
| Limited partnerships required to be accounted for under the equity method |
|
|
8,729 |
|
|
|
8,664 |
|
| Total investments in limited partnerships |
|
$ |
622,407 |
|
|
$ |
517,299 |
|
For equity investments carried at cost using the measurement alternative, during the three months ended September 30, 2025, there was a write-down
for impairment of $2 thousand. During the nine months ended and as of September 30, 2025, the write-downs for impairment totaled $50 thousand. During the three months ended September 30, 2024, there were no downward or upward adjustments to these
investments for impairments or price changes from observable transactions. During the nine months ended September 30, 2024, there was one write-down for impairment of $83 thousand. The carrying amount of these equity investments in limited partnerships
measured under this measurement alternative for the specified periods are as follows:
| |
|
Nine Months Ended September 30, |
|
| (In thousands) |
|
2025 |
|
|
2024 |
|
| Carrying value at the beginning of the period |
|
$ |
2,586 |
|
|
$ |
2,417 |
|
| Impairments |
|
|
(50 |
) |
|
|
(83 |
) |
| Reclassifications |
|
|
165 |
|
|
|
264 |
|
| Distributions |
|
|
(492 |
) |
|
|
(521 |
) |
| Contributions |
|
|
704 |
|
|
|
770 |
|
| Carrying value at the end of the period |
|
$ |
2,913 |
|
|
$ |
2,847 |
|
NOTE 18. SUBSEQUENT EVENTS
On October 26, 2025, the Company entered into an Agreement and Plan of Merger (the “Merger Agreement”) with Huntington Bancshares Incorporated, a
Maryland corporation (“Huntington”), and The Huntington National Bank, a national bank and a wholly owned subsidiary of Huntington (“Huntington National Bank”), pursuant to which, upon the terms and subject to the conditions set forth therein, the
Company will merge with and into Huntington National Bank, with Huntington National Bank continuing as the surviving bank. Under the terms of the Merger Agreement, Huntington will issue 2.475 shares of Huntington common stock for each outstanding share
of Company common stock in a 100% stock transaction. Based on the closing price of Huntington's common stock of $16.07 and the Company’s common stock of $36.49, each as of October 24, 2025, the consideration implies $39.77 per Company common share and
an aggregate transaction value of $7.4 billion. The transaction is expected to close in the first quarter of 2026, subject to regulatory and shareholder approvals and other customary closing conditions.
ITEM 2. MANAGEMENT’S DISCUSSION AND ANALYSIS OF FINANCIAL CONDITION AND RESULTS OF OPERATIONS.
OVERVIEW
The Company is a regional bank with corporate offices in Houston, Texas and Tupelo, Mississippi with $53.3 billion in total assets at September 30,
2025. The Company has commercial banking operations in Alabama, Arkansas, Florida, Georgia, Louisiana, Mississippi, Missouri, Tennessee, and Texas. The Company and its subsidiaries provide commercial banking, leasing, mortgage origination and
servicing, brokerage, trust, and investment advisory services to corporate customers, local governments, individuals, and other financial institutions through an extensive network of branches and offices.
Management’s discussion and analysis provides a narrative discussion of the Company’s financial condition and results of operations. For a complete
understanding of the following discussion, refer to the consolidated financial statements and related notes presented elsewhere in this Report. Management’s discussion and analysis should also be read in conjunction with the risk factors included in
Item 1A of this Report and those included in Item 1A of our Form 10-K for the year ended December 31, 2024, and the other reports we file with the Federal Reserve. This discussion and analysis is based on reported financial information, and certain
amounts for prior years have been reclassified to conform with the current financial statement presentation.
The financial condition and operating results of the Company are heavily influenced by economic trends nationally and in the specific markets in
which the Company’s subsidiaries provide financial services. Generally, the pressures of the national and regional economic cycle create a difficult operating environment for the financial services industry. During such times, the Company is not immune
to pressures and any economic downturn may have a negative impact on the Company and its customers in all of the markets it serves. Management believes future weakness in the economic environment could adversely affect the strength of the credit
quality of the Company's assets. Therefore, management will continue to focus on early identification and resolution of credit issues.
The largest source of the Company’s revenue is derived from its corporate and community banking operations. The financial condition and operating
results of the Company are affected by the level and volatility of interest rates on loans, investment securities, deposits, and borrowed funds, and the impact of economic downturns on loan demand, collateral values, and creditworthiness of existing
borrowers. The financial services industry is highly competitive and heavily regulated. The Company’s success depends on its ability to compete aggressively within its markets while maintaining sufficient asset quality and cost controls to generate net
income.
The information that follows is provided to enhance comparability of financial information between periods and to provide a better understanding of
the Company’s operations.
Recent Developments
On January 22, 2025, the Company announced the signing of a definitive merger agreement with FCB Financial Corp., the bank holding company for FCB
(collectively referred to as “First Chatham”), pursuant to which First Chatham was merged with and into the Company, effective May 1, 2025. First Chatham was a Savannah, Georgia-based community bank operating eight branches across the Greater Savannah
Area. Pursuant to the terms of the definitive merger agreement, the Company issued 2.3 million shares of common stock and paid $23.1 million in cash for all outstanding shares of FCB Financial Corp.
On April 25, 2025, at the Company’s special meeting of shareholders, the holders of the Company’s Preferred Stock approved a proposal amending the
Articles of Incorporation to permit stock repurchases for compliance purposes under Regulation H, which the Company is subject to as a result of becoming a Federal Reserve member bank. On March 26, 2025, the Board declared a special cash dividend of
$0.34375 per share of Preferred Stock payable on May 7, 2025, to the Preferred Stock shareholders of record as of April 30, 2025, that was conditioned on the passage of the proposal at the special meeting.
On July 1, 2025 the Company completed its acquisition of IBS, the bank holding company for Bank of Brenham, National Association, Citizens State
Bank, Fayetteville Bank, Industry State Bank, The First National Bank of Bellville and The First National Bank of Shiner (collectively, the “Industry Banks”), pursuant to an Agreement and Plan of Merger (the “IBS Merger Agreement”) dated April 25,
2025. Under the terms of the IBS Merger Agreement, IBS and the Industry Banks were merged with and into the Company. Founded in 1911 and headquartered in Industry, Texas, IBS operated 27 full-service branches across Central and Southeast Texas. The
Company paid $20 million in cash to IBS’s shareholders.
During the third quarter of 2025, the $2.5 billion of securities acquired in the IBS transaction were sold, with the proceeds redeployed to
purchase securities with higher average earning yields and the remainder deployed to paydown wholesale funding. The Company incurred losses of $4.3 million on the termination of fair value hedges related to the IBS securities portfolio, which was
reported in other noninterest revenue in the consolidated statements of income. This loss was offset by the $4.3 million related net gain on securities sales, which is shown separately in the consolidated statements of income.
On July 23, 2025, the Board declared quarterly cash dividends of $0.275 per share of common stock and $0.34375 per share of Preferred Stock. The
common stock dividend was payable on October 1, 2025 to shareholders of record at the close of business on September 15, 2025. The preferred stock dividend was payable on August 20, 2025 to shareholders of record at the close of business on August 5,
2025.
On October 26, 2025, the Company entered into an Agreement and Plan of Merger (the “Merger Agreement”) with Huntington Bancshares Incorporated, a
Maryland corporation (“Huntington”), and The Huntington National Bank, a national bank and a wholly owned subsidiary of Huntington (“Huntington National Bank”),pursuant to which, upon the terms and subject to the conditions set forth therein,the
Company will merge with and into Huntington National Bank, with Huntington National Bank continuing as the surviving bank. Under the terms of the Merger Agreement, Huntington will issue 2.475 shares of Huntington common stock for each outstanding share
of Company common stock in a 100% stock transaction. Based on the closing price of Huntington's common stock of $16.07 and the Company’s common stock of $36.49, each as of October 24, 2025, the consideration implies $39.77 per Company common share and
an aggregate transaction value of $7.4 billion. The transaction is expected to close in the first quarter of 2026, subject to regulatory and shareholder approvals and other customary closing conditions.
NON-GAAP FINANCIAL MEASURES AND RECONCILIATIONS
In addition to financial ratios based on measures defined by GAAP, the Company has identified “total tangible shareholders’ equity,” “total
tangible common shareholders’ equity,” “total tangible common shareholders’ equity (excluding AOCI),” “total tangible assets,” “total tangible assets (excluding AOCI),” “tangible shareholders’ equity to tangible assets,” “tangible common shareholders’
equity to tangible assets,” “tangible common shareholders’ equity to tangible assets (excluding AOCI),” “tangible common book value per share,” and “tangible book value per common share (excluding AOCI)” as nonGAAP financial measures used when
evaluating the performance of the Company.
|
· |
Total tangible shareholders’ equity is defined by the Company as total shareholders’ equity less goodwill and other intangible assets, net. |
|
· |
Total tangible common shareholders' equity is defined by the Company as total shareholders' equity less preferred stock, goodwill, and other intangible assets,
net. |
|
· |
Total tangible common shareholders' equity, excluding AOCI, is defined by the Company as total shareholders' equity less preferred stock, goodwill, other
intangible assets, net, and AOCI. |
|
· |
Total tangible assets are defined by the Company as total assets less goodwill and other intangible assets, net. |
|
· |
Total tangible assets, excluding AOCI, are defined by the Company as total assets less goodwill, other intangible assets, net, and AOCI. |
|
· |
Tangible common book value per share is defined by the Company as tangible common shareholders’ equity divided by total shares of common stock outstanding. |
|
· |
Tangible book value per common share, excluding AOCI, is defined by the Company as tangible common shareholders' equity less AOCI divided by total shares of
common stock outstanding. |
Management believes the ratios of tangible shareholders’ equity to tangible assets, tangible common shareholders’ equity to tangible assets and
tangible common shareholders’ equity to tangible assets (excluding AOCI) to be important to investors who are interested in evaluating the adequacy of the Company’s capital levels. Management also believes that tangible common book value per share and
tangible common book value per share (excluding AOCI) are important to investors who are interested in changes from period to period in book value per share exclusive of changes in intangible assets.
The following table reconciles these non-GAAP financial measures as presented above to GAAP financial measures as reflected in the Company’s consolidated financial
statements for the periods indicated:
TABLE 1—NON-GAAP FINANCIAL MEASURES
| (Dollars in thousands, except per share amounts) |
|
September 30, 2025 |
|
|
December 31, 2024 |
|
|
September 30, 2024 |
|
| Total tangible assets, excluding AOCI |
|
|
|
|
|
|
|
|
|
|
|
|
| Total assets |
|
$ |
53,282,352 |
|
|
$ |
47,019,190 |
|
|
$ |
49,204,933 |
|
| Less: Goodwill |
|
|
1,515,771 |
|
|
|
1,366,923 |
|
|
|
1,366,923 |
|
| Other intangible assets, net |
|
|
149,039 |
|
|
|
83,190 |
|
|
|
87,094 |
|
| Total tangible assets |
|
$ |
51,617,542 |
|
|
$ |
45,569,077 |
|
|
$ |
47,750,916 |
|
| Less: AOCI |
|
|
(493,782 |
) |
|
|
(694,495 |
) |
|
|
(590,342 |
) |
| Total tangible assets, excluding AOCI |
|
$ |
52,111,324 |
|
|
$ |
46,263,572 |
|
|
$ |
48,341,258 |
|
| |
|
|
|
|
|
|
|
|
|
|
|
|
| Total tangible common shareholders' equity, excluding AOCI |
|
|
|
|
|
|
|
|
|
|
|
|
| Total shareholders' equity |
|
$ |
6,083,096 |
|
|
$ |
5,569,683 |
|
|
$ |
5,572,863 |
|
| Less: Goodwill |
|
|
1,515,771 |
|
|
|
1,366,923 |
|
|
|
1,366,923 |
|
| Other intangible assets, net |
|
|
149,039 |
|
|
|
83,190 |
|
|
|
87,094 |
|
| Total tangible shareholders' equity |
|
$ |
4,418,286 |
|
|
$ |
4,119,570 |
|
|
$ |
4,118,846 |
|
| Less: Preferred stock |
|
|
166,993 |
|
|
|
166,993 |
|
|
|
166,993 |
|
| Total tangible common shareholders' equity |
|
$ |
4,251,293 |
|
|
$ |
3,952,577 |
|
|
$ |
3,951,853 |
|
| Less: AOCI |
|
|
(493,782 |
) |
|
|
(694,495 |
) |
|
|
(590,342 |
) |
| Total tangible common shareholders' equity, excluding AOCI |
|
$ |
4,745,075 |
|
|
$ |
4,647,072 |
|
|
$ |
4,542,195 |
|
| |
|
|
|
|
|
|
|
|
|
|
|
|
| Total common shares outstanding |
|
|
186,307,016 |
|
|
|
183,527,575 |
|
|
|
182,315,142 |
|
| |
|
|
|
|
|
|
|
|
|
|
|
|
| Tangible shareholders' equity to tangible assets |
|
|
8.56 |
% |
|
|
9.04 |
% |
|
|
8.63 |
% |
| Tangible common shareholders' equity to tangible assets |
|
|
8.24 |
% |
|
|
8.67 |
% |
|
|
8.28 |
% |
| Tangible common shareholders' equity, excluding AOCI, to tangible assets, excluding AOCI |
|
|
9.11 |
% |
|
|
10.04 |
% |
|
|
9.40 |
% |
| Tangible common book value per share |
|
$ |
22.82 |
|
|
$ |
21.54 |
|
|
$ |
21.68 |
|
| Tangible book value per common share, excluding AOCI |
|
$ |
25.47 |
|
|
$ |
25.32 |
|
|
$ |
24.91 |
|
FINANCIAL HIGHLIGHTS
The following table presents financial highlights for the periods indicated:
TABLE 2—FINANCIAL HIGHLIGHTS
| |
|
As of and For the Three
Months Ended September 30, |
|
|
As of and For the Nine
Months Ended September 30, |
|
| |
|
2025 |
|
|
2024 |
|
|
2025 |
|
|
2024 |
|
| Common share data: |
|
|
|
|
|
|
|
|
|
|
|
|
| Basic earnings per share |
|
$ |
0.68 |
|
|
$ |
0.74 |
|
|
$ |
2.10 |
|
|
$ |
2.10 |
|
| Diluted earnings per share |
|
|
0.67 |
|
|
|
0.72 |
|
|
|
2.07 |
|
|
|
2.07 |
|
| Cash dividends per share |
|
|
0.275 |
|
|
|
0.250 |
|
|
|
0.825 |
|
|
|
0.750 |
|
| Book value per share |
|
|
31.75 |
|
|
|
29.65 |
|
|
|
31.75 |
|
|
|
29.65 |
|
| Tangible common book value per share (1) |
|
|
22.82 |
|
|
|
21.68 |
|
|
|
22.82 |
|
|
|
21.68 |
|
| Tangible book value per common share, excluding AOCI (1) |
|
|
25.47 |
|
|
|
24.91 |
|
|
|
25.47 |
|
|
|
24.91 |
|
| Dividend payout ratio |
|
|
41.04 |
% |
|
|
34.72 |
% |
|
|
39.86 |
% |
|
|
36.23 |
% |
| Financial Ratios: |
|
|
|
|
|
|
|
|
|
|
|
|
|
|
|
|
| Return on average assets (2) |
|
|
0.95 |
|
|
|
1.14 |
|
|
|
1.06 |
|
|
|
1.08 |
|
| Return on average shareholders' equity (2) |
|
|
8.61 |
|
|
|
10.01 |
|
|
|
9.13 |
|
|
|
9.90 |
|
| Return on average common shareholders' equity (2) |
|
|
8.70 |
|
|
|
10.15 |
|
|
|
9.18 |
|
|
|
10.04 |
|
| Total shareholders' equity to total assets |
|
|
11.42 |
|
|
|
11.33 |
|
|
|
11.42 |
|
|
|
11.33 |
|
| Total common shareholders' equity to total assets |
|
|
11.10 |
|
|
|
10.99 |
|
|
|
11.10 |
|
|
|
10.99 |
|
| Tangible common shareholders' equity to tangible assets (1) |
|
|
8.24 |
|
|
|
8.28 |
|
|
|
8.24 |
|
|
|
8.28 |
|
| Tangible common shareholders' equity, excluding AOCI, to tangible assets, excluding AOCI (1) |
|
|
9.11 |
|
|
|
9.40 |
|
|
|
9.11 |
|
|
|
9.40 |
|
| Net interest margin-FTE |
|
|
3.46 |
|
|
|
3.31 |
|
|
|
3.44 |
|
|
|
3.27 |
|
| Credit Quality Ratios: |
|
|
|
|
|
|
|
|
|
|
|
|
|
|
|
|
| Net charge-offs to average loans and leases (2) |
|
|
0.26 |
% |
|
|
0.26 |
% |
|
|
0.26 |
% |
|
|
0.26 |
% |
| Provision for credit losses to average loans and leases (2) |
|
|
0.35 |
|
|
|
0.14 |
|
|
|
0.32 |
|
|
|
0.23 |
|
| ACL to net loans and leases |
|
|
1.35 |
|
|
|
1.38 |
|
|
|
1.35 |
|
|
|
1.38 |
|
| ACL to NPL |
|
|
198.62 |
|
|
|
168.84 |
|
|
|
198.62 |
|
|
|
168.84 |
|
| ACL to NPA |
|
|
186.49 |
|
|
|
165.59 |
|
|
|
186.49 |
|
|
|
165.59 |
|
| NPL to net loans and leases |
|
|
0.68 |
|
|
|
0.82 |
|
|
|
0.68 |
|
|
|
0.82 |
|
| NPA to total assets |
|
|
0.50 |
|
|
|
0.57 |
|
|
|
0.50 |
|
|
|
0.57 |
|
| Capital Adequacy Ratios: |
|
|
|
|
|
|
|
|
|
|
|
|
|
|
|
|
| Common Equity Tier 1 capital |
|
|
11.51 |
% |
|
|
12.25 |
% |
|
|
11.51 |
% |
|
|
12.25 |
% |
| Tier 1 capital |
|
|
11.91 |
|
|
|
12.70 |
|
|
|
11.91 |
|
|
|
12.70 |
|
| Total capital |
|
|
13.09 |
|
|
|
14.46 |
|
|
|
13.09 |
|
|
|
14.46 |
|
| Tier 1 leverage capital |
|
|
9.24 |
|
|
|
10.05 |
|
|
|
9.24 |
|
|
|
10.05 |
|
|
(1) |
Non-GAAP financial measure. See “Non-GAAP Financial Measures and Reconciliations.” |
|
(2) |
Ratios are annualized. |
As of September 30, 2025, the target range for the federal funds rate was 4.00% to 4.25%. In September 2025, the Federal Reserve lowered interest
rates by 25 basis points, followed by an additional rate cut of 25 basis points by the Federal Reserve on October 29, 2025. This marks its second consecutive rate reduction since December 2024. This October 2025 reduction brings the target range for
the federal funds rate to 3.75% to 4.00%. An additional interest rate reduction may occur later in the fourth quarter of 2025, as the Federal Reserve continues to monitor relevant economic data and the effects of the impact of enacted tariffs. The
decreases in interest rates during the fourth quarter of 2024 and the third quarter of 2025 have had an effect on both our balance sheet as well as our earnings. As seen in the following sections, the increase in net interest revenue resulted from a
lower cost on our interest-bearing liabilities, benefiting from declining deposit costs, and the payoff of both the BTFP borrowings and our subordinated debt in 2024. Total average interest-earning assets increased in the third quarter of 2025 as
compared to the same period in 2024, with growth in average loans and investment securities that were partially offset by lower average other investment balances as the Company used proceeds from the sale of IBS securities to purchase securities with
higher average earning yields and the deployed the remainder to paydown wholesale funding. See “Net Interest Revenue” for further information.
The Company reported net income available to common shareholders of $127.5 million for the three months ended September 30, 2025, compared to
$134.1 million for the same period in 2024. Key factors contributing to the $6.6 million decrease in net income available to common shareholders included: (1) an increase in noninterest expense of $60.8 million in the third quarter of 2025; (2) an
increase in net interest revenue of $62.3 million for the third quarter of 2025; and (3) an increase in noninterest revenue of $7.6 million for the third quarter of 2025. The Company recorded provisions for credit losses of $32.0 million and $12.0
million for three months ended September 30, 2025 and 2024, respectively.
Net income available to common shareholders of $388.2 million was reported for the nine months ended September 30, 2025, compared to $383.8 million
for the same period in 2024. Key factors contributing to the $4.4 million increase in net income available to common shareholders included: (1) an increase in net interest revenue of $93.3 million for the nine months ended September 30, 2025; (2) an
increase in noninterest revenue of $6.7 million for the nine months ended September 30, 2025; and (3) an increase in noninterest expense of $73.1 million for the nine months ended September 30, 2025. The Company recorded provisions for credit losses of
$83.0 million and $56.0 million for nine months ended September 30, 2025 and 2024, respectively.
Net interest revenue for the three months ended September 30, 2025 increased $62.3 million, or 17.2%. Total cost of interest-bearing liabilities
declined 49 basis points to 2.98% for the third quarter of 2025 compared to the third quarter of 2024, benefiting from declining deposit costs as well as the payoffs of both the BTFP borrowings and the subordinated debt. Interest expense decreased $5.3
million, or 1.9%, in the third quarter of 2025 compared to the same period in 2024. Average earning assets increased $5.3 billion in the third quarter of 2025 compared to the third quarter of 2024. The primary drivers in the increase were growth in
average loans balance of $3.3 billion and growth in investment securities balances. A portion of the proceeds from the sale of the IBS securities portfolio was redeployed to purchase securities with higher average earning yields. Average other
investments were lowered as the Company used the remainder of the proceeds from the previously mentioned IBS securities sale to paydown wholesale funding. With the completion of the IBS acquisition in the third quarter of 2025, IBS contributed $3.9
billion of interest-earning assets and $3.7 billion of interest-bearing liabilities. See Table 4 below for more information on yield/rate analysis.
Net interest revenue for the nine months ended September 30, 2025 increased $93.3 million, or 8.7%. Total cost of interest-bearing liabilities
declined 45 basis points to 2.99% for the nine months ended September 30, 2025 compared to the same period in 2024, benefiting from declining deposit costs as well as the payoff of both the BTFP borrowings and the subordinated debt. Interest expense
decreased $80.9 million, or 9.5%, for the nine months ended September 30, 2025 compared to the same period in 2024. See Table 4 below for more information on yield/rate analysis.
Noninterest revenue for the three months ended September 30, 2025, was $93.5 million, an increase of $7.6 million, or 8.8%, from the same period in
2024. Noninterest revenue for the nine months ended September 30, 2025, was $277.0 million, an increase of $6.7 million, or 2.5%, from the same period in 2024. The increase in the third quarter of 2025 compared to the third quarter of 2024 resulted
from increases in securities gains (losses), mortgage banking income, partially offset by a decrease in other miscellaneous income. The increase for the nine months ended September 30, 2025, compared to the same period of 2024 resulted from increases
in mortgage banking income, securities gains (losses), BOLI income, credit related fees, and SBA income. These increases were partially offset by a decrease in other miscellaneous income. See “Noninterest Revenue” below for more information.
Noninterest expense for the three months ended September 30, 2025 increased 23.4% to $320.2 million from $259.4 million for the same period in
2024. Noninterest expense for the nine months ended September 30, 2025 increased 9.4% to $852.5 million from $779.3 million for the same period in 2024. The quarter over quarter and year over year increases were primarily a result of increases in
salaries and employee benefits, merger expense, data processing and software, amortization of intangibles and legal expense, which were partially offset by a decrease in deposit insurance assessments for the year over year comparable periods. See
“Noninterest Expense” below for more information.
RESULTS OF OPERATIONS
The following is a summary of our results of operations for the periods indicated:
TABLE 3—SUMMARY OF RESULTS OF OPERATIONS
| |
|
Three Months Ended
September 30, |
|
|
Nine Months Ended
September 30, |
|
| (In thousands) |
|
2025 |
|
|
2024 |
|
|
2025 |
|
|
2024 |
|
| Earnings Summary: |
|
|
|
|
|
|
|
|
|
|
|
|
|
|
|
|
| Interest revenue |
|
$ |
704,643 |
|
|
$ |
647,713 |
|
|
$ |
1,939,499 |
|
|
$ |
1,927,036 |
|
| Interest expense |
|
|
280,916 |
|
|
|
286,255 |
|
|
|
774,480 |
|
|
|
855,352 |
|
| Net interest revenue |
|
|
423,727 |
|
|
|
361,458 |
|
|
|
1,165,019 |
|
|
|
1,071,684 |
|
| Provision for credit losses |
|
|
32,000 |
|
|
|
12,000 |
|
|
|
83,000 |
|
|
|
56,000 |
|
| Net interest revenue, after provision for credit losses |
|
|
391,727 |
|
|
|
349,458 |
|
|
|
1,082,019 |
|
|
|
1,015,684 |
|
| Noninterest revenue |
|
|
93,478 |
|
|
|
85,901 |
|
|
|
277,046 |
|
|
|
270,345 |
|
| Noninterest expense |
|
|
320,246 |
|
|
|
259,438 |
|
|
|
852,458 |
|
|
|
779,343 |
|
| Income before income taxes |
|
|
164,959 |
|
|
|
175,921 |
|
|
|
506,607 |
|
|
|
506,686 |
|
| Income tax expense |
|
|
35,110 |
|
|
|
39,482 |
|
|
|
108,891 |
|
|
|
115,797 |
|
| Net income |
|
|
129,849 |
|
|
|
136,439 |
|
|
|
397,716 |
|
|
|
390,889 |
|
| Less: preferred dividends |
|
|
2,372 |
|
|
|
2,372 |
|
|
|
9,488 |
|
|
|
7,116 |
|
| Net income available to common shareholders |
|
$ |
127,477 |
|
|
$ |
134,067 |
|
|
$ |
388,228 |
|
|
$ |
383,773 |
|
Net Interest Revenue
Net interest revenue is the difference between interest revenue earned on assets, such as loans, leases and securities, and interest expense paid
on liabilities, such as deposits and borrowings, and continues to provide the Company with its principal source of revenue. Net interest revenue is affected by the general level of interest rates, changes in interest rates and changes in the amount and
composition of interest earning assets and interest bearing liabilities. One of the Company’s longterm objectives is to manage interest earning assets and interest bearing liabilities to maximize net interest revenue, while balancing interest rate,
credit and liquidity risk. Net interest margin is determined by dividing FTE net interest revenue by average earning assets. For purposes of the following discussion, revenue from tax-exempt loans and investment securities have been adjusted to an FTE
basis, using an effective tax rate of 21% for the three and nine months ended September 30, 2025 and 2024.
The following table presents average interest earning assets, average interest bearing liabilities, net interest revenue- FTE, net interest
margin-FTE and net interest rate spread for each of the periods presented:
TABLE 4—CONSOLIDATED AVERAGE BALANCES AND YIELD/RATE ANALYSIS
| |
|
Three Months Ended September 30, |
|
| |
|
2025 |
|
|
2024 |
|
| |
|
Average |
|
|
|
|
|
Yield/ |
|
|
Average |
|
|
|
|
|
Yield/ |
|
| (Dollars in thousands) |
|
Balance |
|
|
Interest |
|
|
Rate |
|
|
Balance |
|
|
Interest |
|
|
Rate |
|
| ASSETS |
|
|
|
|
|
|
|
|
|
|
|
|
|
|
|
|
|
|
|
|
|
|
|
|
| Loans and leases (net of unearned income) (1)(2) |
|
$ |
36,623,037 |
|
|
$ |
589,056 |
|
|
|
6.38 |
% |
|
$ |
33,279,819 |
|
|
$ |
556,386 |
|
|
|
6.66 |
% |
| Loans held for sale, at fair value |
|
|
167,634 |
|
|
|
1,758 |
|
|
|
4.16 |
|
|
|
134,313 |
|
|
|
1,630 |
|
|
|
4.83 |
|
| Available for sale securities, at fair value: |
|
|
|
|
|
|
|
|
|
|
|
|
|
|
|
|
|
|
|
|
|
|
|
|
| Taxable |
|
|
9,644,752 |
|
|
|
86,144 |
|
|
|
3.54 |
|
|
|
7,834,596 |
|
|
|
59,732 |
|
|
|
3.03 |
|
| Tax-exempt (3) |
|
|
526,501 |
|
|
|
7,534 |
|
|
|
5.68 |
|
|
|
81,040 |
|
|
|
808 |
|
|
|
3.97 |
|
| Other investments |
|
|
1,845,618 |
|
|
|
22,219 |
|
|
|
4.78 |
|
|
|
2,210,277 |
|
|
|
29,851 |
|
|
|
5.37 |
|
| Total interest earning assets and revenue |
|
|
48,807,542 |
|
|
|
706,711 |
|
|
|
5.74 |
% |
|
|
43,540,045 |
|
|
|
648,407 |
|
|
|
5.92 |
% |
| Other assets |
|
|
6,026,491 |
|
|
|
|
|
|
|
|
|
|
|
4,733,851 |
|
|
|
|
|
|
|
|
|
| Allowance for credit losses |
|
|
481,059 |
|
|
|
|
|
|
|
|
|
|
|
469,919 |
|
|
|
|
|
|
|
|
|
| Total |
|
$ |
54,352,974 |
|
|
|
|
|
|
|
|
|
|
$ |
47,803,977 |
|
|
|
|
|
|
|
|
|
| |
|
|
|
|
|
|
|
|
|
|
|
|
|
|
|
|
|
|
|
|
|
|
|
|
| LIABILITIES AND SHAREHOLDERS' EQUITY |
|
|
|
|
|
|
|
|
|
|
|
|
|
|
|
|
|
|
|
|
|
|
|
|
| Deposits: |
|
|
|
|
|
|
|
|
|
|
|
|
|
|
|
|
|
|
|
|
|
|
|
|
| Interest bearing demand and money market |
|
$ |
20,264,338 |
|
|
$ |
136,105 |
|
|
|
2.66 |
% |
|
$ |
18,043,686 |
|
|
$ |
142,179 |
|
|
|
3.13 |
% |
| Savings |
|
|
3,143,880 |
|
|
|
5,378 |
|
|
|
0.68 |
|
|
|
2,584,761 |
|
|
|
3,695 |
|
|
|
0.57 |
|
| Time |
|
|
11,410,274 |
|
|
|
112,720 |
|
|
|
3.92 |
|
|
|
8,389,472 |
|
|
|
94,944 |
|
|
|
4.50 |
|
| Fed funds purchased, securities sold under agreement to repurchase and other |
|
|
72,454 |
|
|
|
818 |
|
|
|
4.48 |
|
|
|
44,582 |
|
|
|
572 |
|
|
|
5.10 |
|
| Short-term FHLB borrowings |
|
|
1,073,924 |
|
|
|
11,807 |
|
|
|
4.36 |
|
|
|
11 |
|
|
|
— |
|
|
|
— |
|
| Short-term BTFP borrowings |
|
|
— |
|
|
|
— |
|
|
|
— |
|
|
|
3,500,000 |
|
|
|
41,992 |
|
|
|
4.77 |
|
| Subordinated and long-term borrowings |
|
|
1,429,577 |
|
|
|
14,088 |
|
|
|
3.91 |
|
|
|
265,790 |
|
|
|
2,873 |
|
|
|
4.30 |
|
| Total interest bearing liabilities and expense |
|
|
37,394,447 |
|
|
|
280,916 |
|
|
|
2.98 |
% |
|
|
32,828,302 |
|
|
|
286,255 |
|
|
|
3.47 |
% |
| Demand deposits - noninterest bearing |
|
|
10,040,670 |
|
|
|
|
|
|
|
|
|
|
|
8,616,534 |
|
|
|
|
|
|
|
|
|
| Other liabilities |
|
|
935,740 |
|
|
|
|
|
|
|
|
|
|
|
938,315 |
|
|
|
|
|
|
|
|
|
| Total liabilities |
|
|
48,370,857 |
|
|
|
|
|
|
|
|
|
|
|
42,383,151 |
|
|
|
|
|
|
|
|
|
| Shareholders' equity |
|
|
5,982,117 |
|
|
|
|
|
|
|
|
|
|
|
5,420,826 |
|
|
|
|
|
|
|
|
|
| Total |
|
$ |
54,352,974 |
|
|
|
|
|
|
|
|
|
|
$ |
47,803,977 |
|
|
|
|
|
|
|
|
|
| Net interest revenue-FTE |
|
|
|
|
|
$ |
425,795 |
|
|
|
|
|
|
|
|
|
|
$ |
362,152 |
|
|
|
|
|
| Net interest margin-FTE |
|
|
|
|
|
|
|
|
|
|
3.46 |
% |
|
|
|
|
|
|
|
|
|
|
3.31 |
% |
| Net interest rate spread |
|
|
|
|
|
|
|
|
|
|
2.76 |
% |
|
|
|
|
|
|
|
|
|
|
2.45 |
% |
| Interest bearing liabilities to interest earning assets |
|
|
|
|
|
|
|
|
|
|
76.62 |
% |
|
|
|
|
|
|
|
|
|
|
75.40 |
% |
|
(1) |
Includes taxable equivalent adjustment to interest of $0.5 million for both the three months ended September 30, 2025 and 2024, respectively, using an effective tax rate of 21% for all periods presented. |
|
(2) |
Nonaccrual loans are included in loans and leases (net of unearned income). Nonaccrual loans were $249.8 million and $273.0 million as of September 30, 2025 and 2024, respectively. |
|
(3) |
Includes taxable equivalent adjustment to interest of $1.6 million and $0.2 million for the three months ended September 30, 2025 and 2024, respectively, using an effective tax rate of 21% for all periods presented. |
Net interest revenue-FTE increased 17.6% to $425.8 million for the three months ended September 30, 2025, from $362.2 million for the same period
in 2024. The increase in net interest revenue-FTE resulted from lower costs on interestbearing liabilities benefiting from declining deposit costs and the payoff of both the BTFP borrowings and our subordinated debt since the third quarter of 2024.
Average loans and leases, net of unearned income decreased from 76.4% of average interest earning assets in the 2024 third quarter to 75.0% in the 2025 third quarter.
Interest revenue-FTE increased 9.0% to $706.7 million for the three months ended September 30, 2025, from $648.4 million for the same period in
2024. The increase in interest revenue-FTE for the three months ended September 30, 2025 was primarily a result of higher average loan and investment securities balances and improved securities yields as a result of the restructuring related to the IBS
securities portfolio during the third quarter of 2025. This increase was offset by lower average other investment balances as the Company used cash flow from these investments to support the payoffs of both the BTFP borrowings and subordinated debt
since the third quarter of 2024. Additionally, interest revenue-FTE included $5.5 million and $3.0 million in accretion related to the purchase discounts on acquired loans for the three months ended September 30, 2025 and 2024, respectively.
Interest expense decreased 1.9% to $280.9 million for the three months ended September 30, 2025, compared to $286.3 million for the same period in
2024. The decrease in interest expense for the three months ended September 30, 2025 was primarily due to the total cost of interest-bearing liabilities declining 49 basis points to 2.98% for the third quarter of 2025 compared to 3.47% for the third
quarter of 2024, benefiting from declining deposit costs as well as the payoffs of both the BTFP borrowings and the subordinated debt after the third quarter of 2024.
Net interest margin-FTE for the three months ended September 30, 2025 was 3.46%, an increase of 15 basis points, from 3.31% for the same period in
2024. Net interest revenue-FTE may also be analyzed by segregating the yield/rate and volume components of interest revenue and interest expense. The table below presents the components of our net interest revenue-FTE with the effect that the varying
levels of interest-earning assets and interest-bearing liabilities and the applicable rates have had on changes in net interest revenue from the third quarter of 2024 to the third quarter of 2025. The changes in net interest revenue-FTE due to both
rate and volume have been allocated to volume and rate changes in proportion to the relationship of the absolute dollar amounts of the changes in each.
TABLE 5—RATE/VOLUME ANALYSIS
| |
|
Third Quarter 2025 vs Third Quarter 2024 |
|
| |
|
Net Interest Revenue |
|
|
Increase |
|
|
|
|
| (In thousands) |
|
2025 |
|
|
2024 |
|
|
(Decrease) |
|
|
Volume |
|
|
Rate |
|
| INTEREST REVENUE |
|
|
|
|
|
|
|
|
|
|
|
|
|
|
|
|
|
|
|
|
| Loans and leases, net of unearned income |
|
$ |
589,056 |
|
|
$ |
556,386 |
|
|
$ |
32,670 |
|
|
$ |
40,246 |
|
|
$ |
(7,576 |
) |
| Loans held for sale |
|
|
1,758 |
|
|
|
1,630 |
|
|
|
128 |
|
|
|
212 |
|
|
|
(84 |
) |
| Available for sale securities: |
|
|
|
|
|
|
|
|
|
|
|
|
|
|
|
|
|
|
|
|
| Taxable |
|
|
86,144 |
|
|
|
59,732 |
|
|
|
26,412 |
|
|
|
22,261 |
|
|
|
4,151 |
|
| Non-taxable |
|
|
7,534 |
|
|
|
808 |
|
|
|
6,726 |
|
|
|
6,594 |
|
|
|
132 |
|
| Other investments |
|
|
22,219 |
|
|
|
29,851 |
|
|
|
(7,632 |
) |
|
|
(6,510 |
) |
|
|
(1,122 |
) |
| Total interest revenue-FTE |
|
|
706,711 |
|
|
|
648,407 |
|
|
|
58,304 |
|
|
|
62,802 |
|
|
|
(4,498 |
) |
| |
|
|
|
|
|
|
|
|
|
|
|
|
|
|
|
|
|
|
|
|
| INTEREST EXPENSE |
|
|
|
|
|
|
|
|
|
|
|
|
|
|
|
|
|
|
|
|
| Demand deposits - interest bearing |
|
|
136,105 |
|
|
|
142,179 |
|
|
|
(6,074 |
) |
|
|
3,621 |
|
|
|
(9,695 |
) |
| Savings deposits |
|
|
5,378 |
|
|
|
3,695 |
|
|
|
1,683 |
|
|
|
1,370 |
|
|
|
313 |
|
| Time deposits |
|
|
112,720 |
|
|
|
94,944 |
|
|
|
17,776 |
|
|
|
21,993 |
|
|
|
(4,217 |
) |
| Fed funds purchased, securities sold under agreement to repurchase and other |
|
|
818 |
|
|
|
572 |
|
|
|
246 |
|
|
|
268 |
|
|
|
(22 |
) |
| Short-term FHLB borrowings |
|
|
11,807 |
|
|
|
— |
|
|
|
11,807 |
|
|
|
11,807 |
|
|
|
— |
|
| Short-term BTFP borrowings |
|
|
— |
|
|
|
41,992 |
|
|
|
(41,992 |
) |
|
|
(41,992 |
) |
|
|
— |
|
| Subordinated and long-term debt |
|
|
14,088 |
|
|
|
2,873 |
|
|
|
11,215 |
|
|
|
11,288 |
|
|
|
(73 |
) |
| Total interest expense |
|
|
280,916 |
|
|
|
286,255 |
|
|
|
(5,339 |
) |
|
|
8,355 |
|
|
|
(13,694 |
) |
| Net interest revenue-FTE |
|
$ |
425,795 |
|
|
$ |
362,152 |
|
|
$ |
63,643 |
|
|
$ |
54,447 |
|
|
$ |
9,196 |
|
The following table presents average interest earning assets, average interest bearing liabilities, net interest revenue- FTE, net interest
margin-FTE and net interest rate spread for each of the periods presented:
| |
|
Nine Months Ended September 30, |
|
| |
|
2025 |
|
|
2024 |
|
| (Dollars in thousands) |
|
Average
Balance |
|
|
Interest |
|
|
Yield/
Rate |
|
|
Average
Balance |
|
|
Interest |
|
|
Yield/
Rate |
|
| ASSETS |
|
|
|
|
|
|
|
|
|
|
|
|
|
|
|
|
|
|
|
|
|
|
|
|
| Loans and leases (net of unearned income) (1)(2) |
|
$ |
35,119,899 |
|
|
$ |
1,669,728 |
|
|
|
6.36 |
% |
|
$ |
32,988,706 |
|
|
$ |
1,625,939 |
|
|
|
6.58 |
% |
| Loans held for sale, at fair value |
|
|
143,221 |
|
|
|
4,943 |
|
|
|
4.61 |
|
|
|
107,109 |
|
|
|
4,467 |
|
|
|
5.57 |
|
| Available for sale securities, at fair value: |
|
|
|
|
|
|
|
|
|
|
|
|
|
|
|
|
|
|
|
|
|
|
|
|
| Taxable |
|
|
8,543,442 |
|
|
|
211,731 |
|
|
|
3.31 |
|
|
|
7,991,692 |
|
|
|
185,989 |
|
|
|
3.11 |
|
| Tax-exempt (3) |
|
|
229,697 |
|
|
|
9,133 |
|
|
|
5.32 |
|
|
|
80,699 |
|
|
|
2,485 |
|
|
|
4.11 |
|
| Other investments |
|
|
1,381,618 |
|
|
|
47,299 |
|
|
|
4.58 |
|
|
|
2,703,228 |
|
|
|
110,130 |
|
|
|
5.44 |
|
| Total interest earning assets and revenue |
|
|
45,417,877 |
|
|
|
1,942,834 |
|
|
|
5.72 |
% |
|
|
43,871,434 |
|
|
|
1,929,010 |
|
|
|
5.87 |
% |
| Other assets |
|
|
5,361,623 |
|
|
|
|
|
|
|
|
|
|
|
4,813,124 |
|
|
|
|
|
|
|
|
|
| Allowance for credit losses |
|
|
471,362 |
|
|
|
|
|
|
|
|
|
|
|
472,972 |
|
|
|
|
|
|
|
|
|
| Total |
|
$ |
50,308,138 |
|
|
|
|
|
|
|
|
|
|
$ |
48,211,586 |
|
|
|
|
|
|
|
|
|
| |
|
|
|
|
|
|
|
|
|
|
|
|
|
|
|
|
|
|
|
|
|
|
|
|
| LIABILITIES AND SHAREHOLDERS' EQUITY |
|
|
|
|
|
|
|
|
|
|
|
|
|
|
|
|
|
|
|
|
|
|
|
|
| Deposits: |
|
|
|
|
|
|
|
|
|
|
|
|
|
|
|
|
|
|
|
|
|
|
|
|
| Interest bearing demand and money market |
|
$ |
19,500,598 |
|
|
$ |
390,810 |
|
|
|
2.68 |
% |
|
$ |
18,703,458 |
|
|
$ |
437,861 |
|
|
|
3.13 |
% |
| Savings |
|
|
2,801,111 |
|
|
|
12,769 |
|
|
|
0.61 |
|
|
|
2,644,193 |
|
|
|
11,238 |
|
|
|
0.57 |
|
| Time |
|
|
10,453,707 |
|
|
|
312,341 |
|
|
|
3.99 |
|
|
|
7,888,094 |
|
|
|
264,786 |
|
|
|
4.48 |
|
| Fed funds purchased, securities sold under agreement to repurchase and other |
|
|
146,759 |
|
|
|
4,889 |
|
|
|
4.45 |
|
|
|
106,357 |
|
|
|
3,832 |
|
|
|
4.81 |
|
| Short-term FHLB borrowings |
|
|
762,238 |
|
|
|
24,710 |
|
|
|
4.33 |
|
|
|
4 |
|
|
|
— |
|
|
|
— |
|
| Short-term BTFP borrowings |
|
|
— |
|
|
|
— |
|
|
|
— |
|
|
|
3,500,000 |
|
|
|
125,632 |
|
|
|
4.79 |
|
| Subordinated and long-term borrowings |
|
|
970,319 |
|
|
|
28,961 |
|
|
|
3.99 |
|
|
|
367,826 |
|
|
|
12,003 |
|
|
|
4.36 |
|
| Total interest bearing liabilities and expense |
|
|
34,634,732 |
|
|
|
774,480 |
|
|
|
2.99 |
% |
|
|
33,209,932 |
|
|
|
855,352 |
|
|
|
3.44 |
% |
| Demand deposits - noninterest bearing |
|
|
8,964,440 |
|
|
|
|
|
|
|
|
|
|
|
8,814,668 |
|
|
|
|
|
|
|
|
|
| Other liabilities |
|
|
887,492 |
|
|
|
|
|
|
|
|
|
|
|
912,407 |
|
|
|
|
|
|
|
|
|
| Total liabilities |
|
|
44,486,664 |
|
|
|
|
|
|
|
|
|
|
|
42,937,007 |
|
|
|
|
|
|
|
|
|
| Shareholders' equity |
|
|
5,821,474 |
|
|
|
|
|
|
|
|
|
|
|
5,274,579 |
|
|
|
|
|
|
|
|
|
| Total |
|
$ |
50,308,138 |
|
|
|
|
|
|
|
|
|
|
$ |
48,211,586 |
|
|
|
|
|
|
|
|
|
| Net interest revenue-FTE |
|
|
|
|
|
$ |
1,168,354 |
|
|
|
|
|
|
|
|
|
|
$ |
1,073,658 |
|
|
|
|
|
| Net interest margin-FTE |
|
|
|
|
|
|
|
|
|
|
3.44 |
% |
|
|
|
|
|
|
|
|
|
|
3.27 |
% |
| Net interest rate spread |
|
|
|
|
|
|
|
|
|
|
2.73 |
% |
|
|
|
|
|
|
|
|
|
|
2.43 |
% |
| Interest bearing liabilities to interest earning assets |
|
|
|
|
|
|
|
|
|
|
76.26 |
% |
|
|
|
|
|
|
|
|
|
|
75.70 |
% |
|
(1) |
Includes taxable equivalent adjustment to interest of $1.4 million and $1.5 million for the nine months ended September 30, 2025 and 2024, respectively, using an effective tax rate of 21% for all periods presented. |
|
(2) |
Nonaccrual loans are included in loans and leases (net of unearned income). Nonaccrual loans were $249.8 million and $273.0 million as of September 30, 2025 and 2024, respectively. |
|
(3) |
Includes taxable equivalent adjustment to interest of $1.9 million and $0.5 million for the nine months ended September 30, 2025 and 2024, respectively, using an effective tax rate of 21% for all periods presented. |
Net interest revenue-FTE increased 8.8% to $1.2 billion for the nine months ended September 30, 2025, compared to $1.1 billion for the same period
in 2024. The increase in net interest revenue-FTE resulted from lower costs on interest-bearing liabilities benefiting from declining deposit costs and the payoffs of both the BTFP borrowings and our subordinated debt. Average loans increased from
75.2% of average interest earning assets in 2024 to 77.3% in 2025.
Interest revenue-FTE was flat at $1.9 billion for each of the nine months ended September 30, 2025, and 2024. The slight increase in interest
revenue-FTE for the nine months ended September 30, 2025 was primarily driven by higher average loans and investment securities including improved securities yields as a result of the restructuring related to the IBS securities portfolio during the
third quarter of 2025. This increase was offset by lower average other investment balances as the Company used cash flow from these investments to support the payoffs of both the BTFP borrowings and subordinated debt. Additionally, interest revenue-FTE
included $10.7 million and $9.5 million in accretion related to the purchase discounts on acquired loans for the nine months ended September 30, 2025 and 2024, respectively.
Interest expense decreased 9.5% to $774.5 million for the nine months ended September 30, 2025, compared to $855.4 million for the same period in
2024. The decrease in interest expense for the nine months ended September 30, 2025 was primarily a result of the total cost of average interest-bearing liabilities declining 45 basis points to 2.99% for 2025, compared to 3.44% for the same period in
2024, benefiting from declining deposit costs as well as the payoffs of both the BTFP borrowings and the subordinated debt.
Net interest margin-FTE for the nine months ended September 30, 2025 was 3.44%, an increase of 17 basis points, from 3.27% for the same period in
2024. Net interest revenue-FTE may also be analyzed by segregating the yield/rate and volume components of interest revenue and interest expense. The table below presents the components of our net interest revenue-FTE with the effect that the varying
levels of interest-earning assets and interest-bearing liabilities and the applicable rates have had on changes in net interest revenue from the nine months ended September 30, 2024 to the nine months ended September 30, 2025. The changes in net
interest revenue-FTE due to both rate and volume have been allocated to volume and rate changes in proportion to the relationship of the absolute dollar amounts of the changes in each.
| |
|
Nine Months Ended September 30, 2025 vs Nine Months Ended September 30, 2024 |
|
| |
|
Net Interest Revenue |
|
|
Increase |
|
|
|
|
|
|
|
| (In thousands) |
|
2025 |
|
|
2024 |
|
|
(Decrease) |
|
|
Volume |
|
|
Rate |
|
| INTEREST REVENUE |
|
|
|
|
|
|
|
|
|
|
|
|
|
|
|
|
|
|
|
|
| Loans and leases, net of unearned income |
|
$ |
1,669,728 |
|
|
$ |
1,625,939 |
|
|
$ |
43,789 |
|
|
$ |
76,988 |
|
|
$ |
(33,199 |
) |
| Loans held for sale |
|
|
4,943 |
|
|
|
4,467 |
|
|
|
476 |
|
|
|
989 |
|
|
|
(513 |
) |
| Available for sale securities: |
|
|
|
|
|
|
|
|
|
|
|
|
|
|
|
|
|
|
|
|
| Taxable |
|
|
211,731 |
|
|
|
185,989 |
|
|
|
25,742 |
|
|
|
13,174 |
|
|
|
12,568 |
|
| Non-taxable |
|
|
9,133 |
|
|
|
2,485 |
|
|
|
6,648 |
|
|
|
5,739 |
|
|
|
909 |
|
| Other investments |
|
|
47,299 |
|
|
|
110,130 |
|
|
|
(62,831 |
) |
|
|
(47,418 |
) |
|
|
(15,413 |
) |
| Total interest revenue-FTE |
|
|
1,942,834 |
|
|
|
1,929,010 |
|
|
|
13,824 |
|
|
|
49,471 |
|
|
|
(35,647 |
) |
| INTEREST EXPENSE |
|
|
|
|
|
|
|
|
|
|
|
|
|
|
|
|
|
|
|
|
| Demand deposits - interest bearing |
|
|
390,810 |
|
|
|
437,861 |
|
|
|
(47,051 |
) |
|
|
8,256 |
|
|
|
(55,307 |
) |
| Savings deposits |
|
|
12,769 |
|
|
|
11,238 |
|
|
|
1,531 |
|
|
|
684 |
|
|
|
847 |
|
| Time deposits |
|
|
312,341 |
|
|
|
264,786 |
|
|
|
47,555 |
|
|
|
64,267 |
|
|
|
(16,712 |
) |
| Fed funds purchased, securities sold under agreement |
|
|
|
|
|
|
|
|
|
|
|
|
|
|
|
|
|
|
|
|
| to repurchase and other |
|
|
4,889 |
|
|
|
3,832 |
|
|
|
1,057 |
|
|
|
1,200 |
|
|
|
(143 |
) |
| Short-term FHLB borrowings |
|
|
24,710 |
|
|
|
— |
|
|
|
24,710 |
|
|
|
24,710 |
|
|
|
— |
|
| Short-term BTFP borrowings |
|
|
— |
|
|
|
125,632 |
|
|
|
(125,632 |
) |
|
|
(125,632 |
) |
|
|
— |
|
| Subordinated and long-term debt |
|
|
28,961 |
|
|
|
12,003 |
|
|
|
16,958 |
|
|
|
17,404 |
|
|
|
(446 |
) |
| Total interest expense |
|
|
774,480 |
|
|
|
855,352 |
|
|
|
(80,872 |
) |
|
|
(9,112 |
) |
|
|
(71,760 |
) |
| Net interest revenue-FTE |
|
$ |
1,168,354 |
|
|
$ |
1,073,658 |
|
|
$ |
94,696 |
|
|
$ |
58,583 |
|
|
$ |
36,113 |
|
Provision for Credit Losses and Allowance for Credit Losses
An analysis of the ACL for loans for the periods indicated is provided in the following table:
TABLE 6—ACL
| |
|
Three Months Ended September 30, |
|
|
Nine Months Ended September 30, |
|
| (In thousands) |
|
2025 |
|
|
2024 |
|
|
2025 |
|
|
2024 |
|
| Balance, beginning of period |
|
$ |
474,651 |
|
|
$ |
470,022 |
|
|
$ |
460,793 |
|
|
$ |
468,034 |
|
| Charge-offs: |
|
|
|
|
|
|
|
|
|
|
|
|
|
|
|
|
| Commercial and industrial |
|
|
|
|
|
|
|
|
|
|
|
|
|
|
|
|
| Non-real estate |
|
|
(21,790 |
) |
|
|
(21,544 |
) |
|
|
(59,521 |
) |
|
|
(61,580 |
) |
| Owner occupied |
|
|
(534 |
) |
|
|
(76 |
) |
|
|
(2,234 |
) |
|
|
(377 |
) |
| Total commercial and industrial |
|
|
(22,324 |
) |
|
|
(21,620 |
) |
|
|
(61,755 |
) |
|
|
(61,957 |
) |
| Commercial real estate |
|
|
|
|
|
|
|
|
|
|
|
|
|
|
|
|
| Construction, acquisition and development |
|
|
(391 |
) |
|
|
(222 |
) |
|
|
(728 |
) |
|
|
(759 |
) |
| Income producing |
|
|
— |
|
|
|
— |
|
|
|
(4,785 |
) |
|
|
(2,356 |
) |
| Total commercial real estate |
|
|
(391 |
) |
|
|
(222 |
) |
|
|
(5,513 |
) |
|
|
(3,115 |
) |
| Consumer |
|
|
|
|
|
|
|
|
|
|
|
|
|
|
|
|
| Residential mortgages |
|
|
(1,934 |
) |
|
|
(880 |
) |
|
|
(5,174 |
) |
|
|
(2,183 |
) |
| Other consumer |
|
|
(1,719 |
) |
|
|
(1,801 |
) |
|
|
(4,979 |
) |
|
|
(5,187 |
) |
| Total consumer |
|
|
(3,653 |
) |
|
|
(2,681 |
) |
|
|
(10,153 |
) |
|
|
(7,370 |
) |
| Total charge-offs |
|
|
(26,368 |
) |
|
|
(24,523 |
) |
|
|
(77,421 |
) |
|
|
(72,442 |
) |
| Recoveries: |
|
|
|
|
|
|
|
|
|
|
|
|
|
|
|
|
| Commercial and industrial |
|
|
|
|
|
|
|
|
|
|
|
|
|
|
|
|
| Non-real estate |
|
|
1,748 |
|
|
|
1,382 |
|
|
|
6,386 |
|
|
|
5,484 |
|
| Owner occupied |
|
|
64 |
|
|
|
265 |
|
|
|
439 |
|
|
|
418 |
|
| Total commercial and industrial |
|
|
1,812 |
|
|
|
1,647 |
|
|
|
6,825 |
|
|
|
5,902 |
|
| Commercial real estate |
|
|
|
|
|
|
|
|
|
|
|
|
|
|
|
|
| Construction, acquisition and development |
|
|
56 |
|
|
|
36 |
|
|
|
161 |
|
|
|
218 |
|
| Income producing |
|
|
73 |
|
|
|
29 |
|
|
|
161 |
|
|
|
98 |
|
| Total commercial real estate |
|
|
129 |
|
|
|
65 |
|
|
|
322 |
|
|
|
316 |
|
| Consumer |
|
|
|
|
|
|
|
|
|
|
|
|
|
|
|
|
| Residential mortgages |
|
|
344 |
|
|
|
288 |
|
|
|
1,125 |
|
|
|
850 |
|
| Other consumer |
|
|
482 |
|
|
|
360 |
|
|
|
1,331 |
|
|
|
1,199 |
|
| Total consumer |
|
|
826 |
|
|
|
648 |
|
|
|
2,456 |
|
|
|
2,049 |
|
| Total recoveries |
|
|
2,767 |
|
|
|
2,360 |
|
|
|
9,603 |
|
|
|
8,267 |
|
| Net charge-offs |
|
|
(23,601 |
) |
|
|
(22,163 |
) |
|
|
(67,818 |
) |
|
|
(64,175 |
) |
| Initial allowance on PCD loans |
|
|
15,149 |
|
|
|
— |
|
|
|
23,224 |
|
|
|
— |
|
| |
|
|
|
|
|
|
|
|
|
|
|
|
|
|
|
|
| Provision: |
|
|
|
|
|
|
|
|
|
|
|
|
|
|
|
|
| Initial provision for acquired non-PCD loans |
|
|
5,519 |
|
|
|
— |
|
|
|
9,671 |
|
|
|
— |
|
| Provision for credit losses related to loans and leases (1) |
|
|
24,481 |
|
|
|
13,000 |
|
|
|
70,329 |
|
|
|
57,000 |
|
| Balance, end of period |
|
$ |
496,199 |
|
|
$ |
460,859 |
|
|
$ |
496,199 |
|
|
$ |
460,859 |
|
| |
|
|
|
|
|
|
|
|
|
|
|
|
|
|
|
|
| Loans and leases, net of unearned income – average |
|
$ |
36,623,037 |
|
|
$ |
33,279,819 |
|
|
$ |
35,119,899 |
|
|
$ |
32,988,706 |
|
| Loans and leases, net of unearned income - period end |
|
$ |
36,801,836 |
|
|
$ |
33,303,972 |
|
|
$ |
36,801,836 |
|
|
$ |
33,303,972 |
|
|
(1) |
Provision (reversal) for unfunded commitments were $2.0 million and $(1.0) million for the three months ended September 30, 2025 and 2024, respectively, and $3.0 million and $(1.0) million for the nine months ended September 30, 2025 and 2024,
respectively. |
TABLE 7—ACL RELATED RATIOS
| |
|
Three Months Ended September 30, |
|
|
Nine Months Ended September 30, |
|
| |
|
2025 |
|
|
2024 |
|
|
2025 |
|
|
2024 |
|
| RATIOS |
|
|
|
|
|
|
|
|
|
|
|
|
|
|
|
|
| Provision for credit losses to average loans and leases, net of unearned income (1) |
|
|
0.35 |
% |
|
|
0.14 |
% |
|
|
0.32 |
% |
|
|
0.23 |
% |
| ACL to loans and leases, net of unearned income |
|
|
1.35 |
% |
|
|
1.38 |
% |
|
|
1.35 |
% |
|
|
1.38 |
% |
| NPL to loans and leases, net of unearned income |
|
|
0.68 |
% |
|
|
0.82 |
% |
|
|
0.68 |
% |
|
|
0.82 |
% |
| ACL to NPL |
|
|
198.62 |
% |
|
|
168.84 |
% |
|
|
198.62 |
% |
|
|
168.84 |
% |
| Net charge-offs to average loans and leases: (1) |
|
|
|
|
|
|
|
|
|
|
|
|
|
|
|
|
| Commercial and industrial |
|
|
|
|
|
|
|
|
|
|
|
|
|
|
|
|
| Non-real estate |
|
|
0.22 |
% |
|
|
0.24 |
% |
|
|
0.20 |
% |
|
|
0.23 |
% |
| Owner occupied |
|
|
0.01 |
% |
|
|
— |
% |
|
|
0.01 |
% |
|
|
— |
% |
| Total commercial and industrial |
|
|
0.23 |
% |
|
|
0.24 |
% |
|
|
0.21 |
% |
|
|
0.23 |
% |
| Commercial real estate |
|
|
|
|
|
|
|
|
|
|
|
|
|
|
|
|
| Construction, acquisition and development |
|
|
— |
% |
|
|
— |
% |
|
|
— |
% |
|
|
— |
% |
| Income producing |
|
|
— |
% |
|
|
— |
% |
|
|
0.02 |
% |
|
|
0.01 |
% |
| Total commercial real estate |
|
|
— |
% |
|
|
— |
% |
|
|
0.02 |
% |
|
|
0.01 |
% |
| Consumer |
|
|
|
|
|
|
|
|
|
|
|
|
|
|
|
|
| Residential mortgages |
|
|
0.02 |
% |
|
|
— |
% |
|
|
0.02 |
% |
|
|
— |
% |
| Other consumer |
|
|
0.01 |
% |
|
|
0.02 |
% |
|
|
0.01 |
% |
|
|
0.02 |
% |
| Total consumer |
|
|
0.03 |
% |
|
|
0.02 |
% |
|
|
0.03 |
% |
|
|
0.02 |
% |
| Total |
|
|
0.26 |
% |
|
|
0.26 |
% |
|
|
0.26 |
% |
|
|
0.26 |
% |
|
(1) |
Ratios are annualized. |
For the three months ended September 30, 2025 and 2024, net charge-offs totaled $23.6 million and $22.2 million, respectively. As a percentage of
average loans and leases, net charge-offs were 0.26% annualized for both the three months ended September 30, 2025 and 2024. Net charge-offs for the three months ended September 30, 2025, were mainly experienced in the C&I non-real estate loan
class concentrated in one credit; as well as a number of SBA loans in the resolution process. Net charge-offs for the same period in 2024 were also primarily in the non-real estate class.
For the nine months ended September 30, 2025 and 2024, net charge-offs totaled $67.8 million and $64.2 million, respectively. As a percentage of
average loans and leases, net charge-offs were 0.26% annualized for both the nine months ended September 30, 2025 and 2024. Net charge-offs for the nine months ended September 30, 2025, were mainly experienced in the C&I non-real estate loan class
concentrated in three credits, as well as a number of SBA loans in the resolution process; Net charge-offs for the same period in 2024 were also primarily in the non-real estate class.
The Company recorded $32.0 million in provision for credit losses ($30.0 million for loans and $2.0 million for unfunded commitments) during the
three months ended September 30, 2025, compared to $12.0 million ($13.0 million for loans and $(1.0) million for unfunded commitments) for the same period in 2024.
The Company recorded $83.0 million in provision for credit losses ($80.0 million for loans and $3.0 million for unfunded commitments) during the
nine months ended September 30, 2025, compared to $56.0 million ($57.0 million for loans and $(1.0) million for unfunded commitments) for the same period in 2024.
The ACL increased $35.4 million to $496.2 million at September 30, 2025, from $460.8 million at December 31, 2024. This increase included $23.2
million related to PCD loans acquired through the FCB and IBS acquisitions with the remainder of the increase primarily seen in the C&I and consumer loan segments. The ACL to NPL increased to 198.62% at September 30, 2025, from 168.84% at September
30, 2024. For more information about the Company’s classified, nonperforming, PCD, and impaired loans, see “Item 2. Management’s Discussion and Analysis of Financial Condition and Results of Operations – Financial Condition – Loans and Leases” in Part
I of this Report.
The breakdown of the ACL by loan and lease segment and class is based, in part, on evaluations of specific loan and lease histories and the impact
of forecasted economic conditions on the portfolio segments. Accordingly, because these conditions are subject to change, the allocation is not necessarily indicative of the breakdown of any future ACL. Several economic forecasts from external sources
are used in the estimation and allocation of the ACL. The forecasts cover an eightquarter forecast horizon to establish a forecast range and are based on upside, downside, and base case scenarios. A blended scenario is selected by management to reflect
the probable economic conditions within the range. During the nine months ended September 30, 2025, the forecast was a mix of downside and base forecasts, weighted more heavily to a base forecast, which is consistent with the weighting during the same
period in 2024.
The Company recognizes that changes in interest rates, persistent inflation, and slower economic growth may have short-term, long-term, and
regional impacts to the economy. In addition, qualitative factors such as changes in economic conditions, concentrations of risk, and changes in portfolio risk resulting from regulatory changes are considered in determining the adequacy of the level of
the ACL (see Note 5 to the consolidated financial statements).
TABLE 8—ACL BY SEGMENT AND CLASS
| |
|
September 30, 2025 |
|
|
December 31, 2024 |
|
| (Dollars in thousands) |
|
ACL |
|
|
% of Loans in
Each Category
to Total Loans
|
|
|
ACL |
|
|
% of Loans in
Each Category
to Total Loans |
|
| Commercial and industrial |
|
|
|
|
|
|
|
|
|
|
|
|
|
|
|
|
| Non-real estate |
|
$ |
194,511 |
|
|
|
25.1 |
% |
|
$ |
183,743 |
|
|
|
25.7 |
% |
| Owner occupied |
|
|
51,176 |
|
|
|
14.4 |
|
|
|
35,177 |
|
|
|
13.8 |
|
| Total commercial and industrial |
|
|
245,687 |
|
|
|
39.5 |
|
|
|
218,920 |
|
|
|
39.5 |
|
| Commercial real estate |
|
|
|
|
|
|
|
|
|
|
|
|
|
|
|
|
| Construction, acquisition and development |
|
|
39,390 |
|
|
|
9.1 |
|
|
|
44,703 |
|
|
|
11.6 |
|
| Income producing |
|
|
67,253 |
|
|
|
19.2 |
|
|
|
64,957 |
|
|
|
17.8 |
|
| Total commercial real estate |
|
|
106,643 |
|
|
|
28.3 |
|
|
|
109,660 |
|
|
|
29.4 |
|
| Consumer |
|
|
|
|
|
|
|
|
|
|
|
|
|
|
|
|
| Residential mortgages |
|
|
135,947 |
|
|
|
31.5 |
|
|
|
125,464 |
|
|
|
30.4 |
|
| Other consumer |
|
|
7,922 |
|
|
|
0.7 |
|
|
|
6,749 |
|
|
|
0.7 |
|
| Total consumer |
|
|
143,869 |
|
|
|
32.2 |
|
|
|
132,213 |
|
|
|
31.1 |
|
| Total |
|
$ |
496,199 |
|
|
|
100.0 |
% |
|
$ |
460,793 |
|
|
|
100.0 |
% |
Noninterest Revenue
The Company attempts to diversify its revenue streams with noninterest revenue received from wealth management activities, mortgage banking
operations, and other activities that generate fee income. The components of noninterest revenue for the periods indicated and the percentage change between the periods are shown in the following table:
TABLE 9—NONINTEREST REVENUE
| |
|
Three Months Ended September 30, |
|
|
Nine Months Ended September 30, |
|
| (Dollars in thousands) |
|
2025 |
|
|
2024 |
|
|
% Change |
|
|
2025 |
|
|
2024 |
|
|
% Change |
|
| Trust and asset management income (1) |
|
$ |
11,948 |
|
|
$ |
12,055 |
|
|
|
(0.9 |
)% |
|
|
36,998 |
|
|
$ |
36,023 |
|
|
|
2.7 |
% |
| Investment advisory fees (1) |
|
|
9,314 |
|
|
|
8,641 |
|
|
|
7.8 |
|
|
|
26,738 |
|
|
|
25,157 |
|
|
|
6.3 |
|
| Brokerage and annuity fees (1) |
|
|
3,253 |
|
|
|
3,414 |
|
|
|
(4.7 |
) |
|
|
9,356 |
|
|
|
9,769 |
|
|
|
(4.2 |
) |
| Deposit service charges |
|
|
19,047 |
|
|
|
18,814 |
|
|
|
1.2 |
|
|
|
54,844 |
|
|
|
54,803 |
|
|
|
0.1 |
|
| Credit card, debit card and merchant fees |
|
|
13,484 |
|
|
|
12,649 |
|
|
|
6.6 |
|
|
|
38,445 |
|
|
|
37,581 |
|
|
|
2.3 |
|
| Mortgage banking, excluding MSR and MSR hedge market value adjustment (2) |
|
|
9,208 |
|
|
|
8,171 |
|
|
|
12.7 |
|
|
|
29,685 |
|
|
|
27,162 |
|
|
|
9.3 |
|
| MSR and MSR hedge market value adjustment (2) |
|
|
(4,739 |
) |
|
|
(7,038 |
) |
|
|
32.7 |
|
|
|
(9,867 |
) |
|
|
(13,413 |
) |
|
|
26.4 |
|
| Securities gains (losses), net |
|
|
4,311 |
|
|
|
(2,947 |
) |
|
|
NM |
|
|
|
4,302 |
|
|
|
(2,960 |
) |
|
|
NM |
|
| Bank-owned life insurance (3) |
|
|
5,093 |
|
|
|
4,353 |
|
|
|
17.0 |
|
|
|
17,107 |
|
|
|
12,670 |
|
|
|
35.0 |
|
| Credit related fees (3) |
|
|
7,752 |
|
|
|
7,066 |
|
|
|
9.7 |
|
|
|
21,919 |
|
|
|
18,365 |
|
|
|
19.4 |
|
| SBA income (3) |
|
|
3,394 |
|
|
|
3,008 |
|
|
|
12.8 |
|
|
|
11,228 |
|
|
|
8,542 |
|
|
|
31.4 |
|
| Other miscellaneous income (3) |
|
|
11,413 |
|
|
|
17,715 |
|
|
|
(35.6 |
) |
|
|
36,291 |
|
|
|
56,646 |
|
|
|
(35.9 |
) |
| Total noninterest revenue |
|
$ |
93,478 |
|
|
$ |
85,901 |
|
|
|
8.8 |
% |
|
$ |
277,046 |
|
|
$ |
270,345 |
|
|
|
2.5 |
% |
|
(1) |
Included in wealth management revenue on the consolidated statements of income. |
|
(2) |
Included in mortgage banking revenue on the consolidated statements of income. |
|
(3) |
Included in other noninterest revenue on the consolidated statements of income. |
Noninterest revenue for the three months ended September 30, 2025, was $93.5 million, an increase of $7.6 million, or 8.8%, from the same period in
2024. Noninterest revenue for the nine months ended September 30, 2025, was $277.0 million, an increase of $6.7 million, or 2.5%, from the same period in 2024. The increase in the third quarter of 2025 compared to the third quarter of 2024 resulted
from increases in mortgage banking income and securities gains, partially offset by a decrease in other miscellaneous income. The increase for the nine months ended September 30, 2025, compared to the same period of 2024 resulted from increases in
mortgage banking income, securities gains (losses), BOLI income, credit related fees, and SBA income. These increases were partially offset by a decrease in other miscellaneous income.
Trust and asset management income, which consists of fee income from management of trust accounts, decreased 0.9% during the third quarter of 2025
compared to the same period in 2024, and increased 2.7% during the nine months ended September 30, 2025, compared to the same period in 2024. The decrease in the 2025 quarter arose from a decrease of 1.6% in assets under management.
Deposit service charges, which consist primarily of corporate analysis charges, overdraft fees, and other deposit service related fees, increased
1.2% during the third quarter of 2025 compared to the same period in 2024. The increase resulted primarily from an increase of 10.8% in NSF fees, driven by the IBS acquisition, partially offset by a decrease of 7.3% in corporate analysis charges.
Mortgage banking revenue typically fluctuates as mortgage interest rates change and is primarily attributable to two activities: (1) the
origination and sale of new mortgage loans and (2) the servicing of sold mortgage loans. Origination revenue is comprised of gains and losses from the sale of mortgage loans, origination fees, underwriting fees and other fees associated with the
origination of mortgage loans. For the three months ended September 30, 2025 and 2024, mortgage loan held for sale origination volumes totaled $332.0 million and $298.6 million, respectively, which produced origination revenue of $2.8 million and $2.1
million, respectively. The increase in mortgage origination revenue also resulted from an increase of 15.7% in mortgage loans sold during the three months ended September 30, 2025, as compared to the three months ended September 30, 2024.
For the nine months ended September 30, 2025 and 2024, mortgage loan held for sale origination volumes totaled $920.0 million and $821.0 million,
respectively, which produced origination revenue of $10.5 million and $9.3 million, respectively. The increase in mortgage origination revenue resulted from a 11.6% increase in loans sold during the comparative nine month periods, due to the same
factors impacting the comparative three months periods noted previously.
Revenue from the mortgage servicing process includes fees from the actual servicing of mortgage loans. For the three months ended September 30,
2025 and 2024, servicing revenue was $6.5 million and $6.0 million, respectively. For the nine months ended September 30, 2025 and 2024, servicing revenue was $19.2 million and $17.9 million, respectively. The quarterly and year-to-date growth in
servicing revenue is primarily attributable to the 5.3% growth in the servicing portfolio from September 30, 2024, to September 30, 2025.
The Company services a class of residential mortgages that are first lien loans secured by a primary residence or second home. The MSR, which are
recognized as a separate asset on the date the corresponding mortgage loan is sold on a servicing retained basis, is recorded at fair value as determined at each accounting period end. At September 30, 2025 and September 30, 2024, the estimated fair
value of the MSR was $110.5 million and $104.9 million, respectively.
The Company is susceptible to significant fluctuations in MSR fair value during changing interest rate environments. The Company has an economic
hedge in place on its MSR and uses various instruments (including but not limited to Treasury options, SOFR and TBA futures and forwards) to mitigate the IRR associated with the MSR. These hedging instruments are reported at fair value, with
adjustments included as part of mortgage banking revenue in the consolidated statements of income. At September 30, 2025 and 2024, this economic hedge covered approximately 75.6% and 75.0%, respectively, of the MSR IRR. Reflecting this sensitivity to
interest rates, the fair value of the MSR, including the hedge, experienced a decrease of $4.7 million for the three months ended September 30, 2025 and a decrease of $7.0 million during the same period in 2024. For the nine months ended September 30,
2025 and 2024, the fair value of the MSR, including the hedge, decreased $9.9 million and $13.4 million, respectively.
The following table presents the Company’s mortgage banking operations for the periods indicated:
TABLE 10— MORTGAGE BANKING OPERATIONS
| |
|
Three Months Ended September 30, |
|
|
Nine Months Ended September 30, |
|
| (Dollars in thousands) |
|
2025 |
|
|
2024 |
|
|
% Change |
|
|
2025 |
|
|
2024 |
|
|
% Change |
|
| Production revenue: |
|
|
|
|
|
|
|
|
|
|
|
|
|
|
|
|
|
|
|
|
|
|
|
|
| Origination |
|
$ |
2,753 |
|
|
$ |
2,145 |
|
|
|
28.3 |
% |
|
$ |
10,517 |
$ |
|
|
9,286 |
|
|
|
13.3 |
% |
| Servicing |
|
|
6,455 |
|
|
|
6,026 |
|
|
|
7.1 |
|
|
|
19,168 |
|
|
|
17,876 |
|
|
|
7.2 |
|
| Total origination and servicing revenue |
|
|
9,208 |
|
|
|
8,171 |
|
|
|
12.7 |
|
|
|
29,685 |
|
|
|
27,162 |
|
|
|
9.3 |
|
| MSR and hedge market value adjustment |
|
|
(4,739 |
) |
|
|
(7,038 |
) |
|
|
32.7 |
|
|
|
(9,867 |
) |
|
|
(13,413 |
) |
|
|
26.4 |
|
| Total mortgage banking revenue |
|
$ |
4,469 |
|
|
$ |
1,133 |
|
|
|
294.4 |
% |
|
$ |
19,818 |
$ |
|
|
13,749 |
|
|
|
44.1 |
% |
| |
|
|
|
|
|
|
|
|
|
|
|
|
|
|
|
|
|
|
|
|
|
|
|
|
| Origination of mortgage loans held for sale |
|
$ |
332,029 |
|
|
$ |
298,608 |
|
|
|
11.2 |
% |
|
$ |
920,028 |
$ |
|
|
821,036 |
|
|
|
12.1 |
% |
| Mortgage loans serviced at quarter-end |
|
|
8,346,802 |
|
|
|
7,927,028 |
|
|
|
5.3 |
|
|
|
8,346,802 7 |
|
|
|
,927,028 |
|
|
|
5.3 |
|
BOLI income consists of death benefits and earnings on the cash surrender value. For the third quarter of 2025 and the nine months ended September
30, 2025, BOLI income increased $0.7 million and $4.4 million, respectively, from the comparable periods in 2024. The quarterly increase resulted primarily from an increase in the earnings on the cash surrender value through the addition of IBS and the
year-to-date increase resulted primarily from an increase in death benefits received during the nine months ended September 30, 2025.
Credit related fees consist of interest rate swap income, letter of credit fees, unused line fees, and arrangement fees. For the third quarter of
2025 and the nine months ended September 30, 2025, credit related fees increased 9.7% and 19.4%, respectively, from the comparable periods in 2024. The primary drivers of the quarterly increase were increases in letter of credit fees and unused line
fees. The primary drivers of the year-to-date increase were increases in arrangement fees, unused line fees and swap income.
SBA income consists of gains and losses on the sale of SBA loans, servicing fees, and various fees related to processing SBA loans. SBA income
increased 12.8% during the third quarter of 2025 compared to the same period in 2024 and increased 31.4% during the nine months ended September 30, 2025, compared to the same period in 2024. The increases incurred during the 2025 periods are due to
increases of $22.2 million and $54.4 million in SBA loans sold during the quarter and year-to-date periods ended September 30, 2025, respectively. The third quarter and year-to-date 2025 sales increases were favorably impacted by the addition of FCB’s
SBA business.
Other miscellaneous income consists of various fees, gains and losses, and other revenue. For the third quarter of 2025 and the nine months ended
September 30, 2025, other miscellaneous income decreased 35.6% and 35.9%, respectively, from the comparable periods in 2024. The quarterly decrease was primarily driven by the loss of $4.3 million on the termination of fair value hedges related to the
IBS securities portfolio. The year-to-date decrease was primarily driven by the gain of $15.0 million on sales of businesses that occurred in second quarter 2024 and the hedge termination loss referred to earlier.
Noninterest Expense
The components of noninterest expense for the periods indicated and the percentage change between periods are shown in the following table:
TABLE 11—NONINTEREST EXPENSE
| |
|
Three Months Ended September 30, |
|
|
Nine Months Ended September 30, |
|
| (Dollars in thousands) |
|
2025 |
|
|
2024 |
|
|
% Change |
|
|
2025 |
|
|
2024 |
|
|
% Change |
|
| Salaries and employee benefits |
|
$ |
173,485 |
|
|
$ |
152,237 |
|
|
|
14.0 |
% |
|
$ |
483,797 |
|
|
$ |
456,926 |
|
|
|
5.9 |
% |
| Occupancy and equipment |
|
|
31,892 |
|
|
|
28,894 |
|
|
|
10.4 |
|
|
|
90,408 |
|
|
|
86,901 |
|
|
|
4.0 |
|
| Data processing and software |
|
|
36,120 |
|
|
|
29,164 |
|
|
|
23.9 |
|
|
|
93,953 |
|
|
|
88,658 |
|
|
|
6.0 |
|
| Deposit insurance assessments |
|
|
10,037 |
|
|
|
7,481 |
|
|
|
34.2 |
|
|
|
27,251 |
|
|
|
31,637 |
|
|
|
(13.9 |
) |
| Amortization of intangibles |
|
|
7,539 |
|
|
|
3,933 |
|
|
|
91.7 |
|
|
|
15,253 |
|
|
|
11,998 |
|
|
|
27.1 |
|
| Merger expense |
|
|
19,789 |
|
|
|
— |
|
|
|
NM |
|
|
|
22,283 |
|
|
|
— |
|
|
|
NM |
|
| Advertising and public relations (1) |
|
|
6,939 |
|
|
|
5,481 |
|
|
|
26.6 |
|
|
|
18,400 |
|
|
|
16,241 |
|
|
|
13.3 |
|
| Foreclosed property expense (1) |
|
|
1,294 |
|
|
|
486 |
|
|
|
166.3 |
|
|
|
2,915 |
|
|
|
1,269 |
|
|
|
129.7 |
|
| Telecommunications (1) |
|
|
1,520 |
|
|
|
1,513 |
|
|
|
0.5 |
|
|
|
4,362 |
|
|
|
4,498 |
|
|
|
(3.0 |
) |
| Travel and entertainment (1) |
|
|
3,004 |
|
|
|
2,612 |
|
|
|
15.0 |
|
|
|
8,271 |
|
|
|
7,397 |
|
|
|
11.8 |
|
| Professional, consulting and outsourcing (1) |
|
|
3,025 |
|
|
|
4,115 |
|
|
|
(26.5 |
) |
|
|
11,801 |
|
|
|
11,584 |
|
|
|
1.9 |
|
| Legal (1) |
|
|
4,463 |
|
|
|
3,664 |
|
|
|
21.8 |
|
|
|
16,133 |
|
|
|
8,104 |
|
|
|
99.1 |
|
| Postage and shipping (1) |
|
|
2,026 |
|
|
|
1,677 |
|
|
|
20.8 |
|
|
|
5,597 |
|
|
|
5,504 |
|
|
|
1.7 |
|
| Other miscellaneous expense (1) |
|
|
19,113 |
|
|
|
18,181 |
|
|
|
5.1 |
|
|
|
52,034 |
|
|
|
48,626 |
|
|
|
7.0 |
|
| Total noninterest expense |
|
$ |
320,246 |
|
|
$ |
259,438 |
|
|
|
23.4 |
% |
|
$ |
852,458 |
|
|
$ |
779,343 |
|
|
|
9.4 |
% |
|
(1) |
Included in other expense on the consolidated statements of income. |
Noninterest expense for the three months ended September 30, 2025, was $320.2 million, an increase of $60.8 million, or 23.4%, from the same period
in 2024. Noninterest expense for the nine months ended September 30, 2025, was $852.5 million, an increase of $73.1 million, or 9.4%, from the same period in 2024. The quarter over quarter increase primarily resulted from increases in salaries and
employee benefits, merger expense, data processing and software and amortization of intangibles. The year over year increase primarily resulted from the quarterly drivers previously discussed and increases in legal expense, partially offset by a
decrease in deposit insurance assessments.
Salaries and employee benefits expense was the largest category of our noninterest expense. Salaries and employee benefits increased $21.2 million
for the three months ended September 30, 2025, and increased $26.9 million for the nine months ended September 30, 2025, compared to the same periods in 2024. The increases resulted primarily from the addition of IBS and a full quarter’s impact of
First Chatham in the third quarter of 2025, the Company’s annual merit increase effective July 1, 2025, an increase in commissions expense associated with strong fee revenue performance and increased payroll taxes attributable to increased salaries,
commissions, and incentive payments.
The components of salary and employee benefits expense for the periods indicated and the percentage change between periods are shown in the
following table:
TABLE 12—SALARIES AND EMPLOYEE BENEFITS EXPENSE
| |
|
Three Months Ended September 30, |
|
|
Nine Months Ended September 30, |
|
| (Dollars in thousands) |
|
2025 |
|
|
2024 |
|
|
% Change |
|
|
2025 |
|
|
2024 |
|
|
% Change |
|
| Regular salaries, net of deferred salaries |
|
$ |
104,577 |
|
|
$ |
93,287 |
|
|
|
12.1 |
% |
|
$ |
290,351 |
|
|
$ |
281,395 |
|
|
|
3.2 |
% |
| Commissions and incentive compensation |
|
|
39,204 |
|
|
|
33,053 |
|
|
|
18.6 |
|
|
|
106,763 |
|
|
|
94,634 |
|
|
|
12.8 |
|
| Taxes and employee benefits |
|
|
29,704 |
|
|
|
25,897 |
|
|
|
14.7 |
|
|
|
86,683 |
|
|
|
80,897 |
|
|
|
7.2 |
|
| Total salaries and employee benefits |
|
$ |
173,485 |
|
|
$ |
152,237 |
|
|
|
14.0 |
% |
|
$ |
483,797 |
|
|
$ |
456,926 |
|
|
|
5.9 |
% |
Deposit insurance assessments consist of amounts paid to the FDIC for deposit insurance which consist of both regular quarterly assessments and
special assessments that are implemented by the FDIC to increase the level of the DIF. Deposit insurance premiums increased $2.6 million for the three months ended September 30, 2025, and decreased $4.4 million for the nine months ended September 30,
2025, compared to the same periods in 2024. The quarter over quarter increase was related to the IBS and First Chatham mergers. The year over year decrease is attributable to the 2024 adjustments to the FDIC special assessment.
Merger expense consists of one-time expenses related to the acquisition of another business. Merger expenses increased $19.8 million for the three
months ended September 30, 2025, and increased $22.3 million for the nine months ended September 30, 2025, compared to the same periods in 2024. These increases were incurred due to the recent mergers with First Chatham and IBS.
Data processing and software expenses increased $7.0 million for the three months ended September 30, 2025 and increased $5.3 million for the nine
months ended September 30, 2025, compared to the same periods in 2024. The quarterly and year over year increases were related to the IBS and First Chatham mergers and other technology investments.
Amortization of intangibles increased $3.6 million for the three months ended September 30, 2025 and increased $3.3 million for the nine months
ended September 30, 2025, compared to the same periods in 2024. These quarterly and year-to-date increases were due to the core deposit intangible amortization recorded related to the First Chatham and IBS acquisitions.
Legal expenses consist of legal fees paid to external attorneys and accruals for the settlement of various legal matters that arise in the ordinary
course of business. Legal expenses increased $0.8 million for the three months ended September 30, 2025, and increased $8.0 million for the nine months ended September 30, 2025, compared to the same periods in 2024. The quarter-to-date increase
resulted primarily from increases in legal fees. The year-to-date increase resulted primarily from increases of $4.7 million in legal settlements and $3.3 million in legal fees for the year-to-date 2025 period.
Income Taxes
The Company recorded an income tax expense of $35.1 million for the three months ended September 30, 2025, compared to $39.5 million for the same
period in 2024. The decrease in tax expense in 2025 can be attributed to a reduction of excess salary disallowance and an increase in tax credit benefits.
The Company recorded an income tax expense of $108.9 million for the nine months ended September 30, 2025, compared to $115.8 million for the same
period in 2024. The decrease in tax expense in 2025 can be attributed to a reduction of excess salary disallowance and an increase in tax credit benefits.
The effective tax rate was 21.3% and 21.5% for the three and nine months ended September 30, 2025, respectively, compared to 22.4% and 22.9% for
the same periods in 2024. The decrease in the effective tax rate was the result of a reduction of excess salary disallowance, an increase in tax credit benefits, and excess tax benefits from stock based compensation.
In August 2022, the IRA of 2022 was signed into law to address inflation, healthcare costs, climate change and renewal energy incentives, among
other things. Included in the IRA of 2022 are provisions for the creation of a 15% CAMT that is effective for tax years beginning January 1, 2023 for corporations with an average annual adjusted financial statement income in excess of $1 billion. Based
on information available to date, we do not anticipate that the Company will be subject to the 15% CAMT in 2025, absent any further changes in law.
In July 2025, the OBBB Act was signed into law which both extended many soon to expire provisions of the TCJA and made several additional changes
to the Internal Revenue Code. Based on information available to date, the new law has had no material impact to the Company’s consolidated financial statements.
FINANCIAL CONDITION
The percentage of earning assets to total assets measures the effectiveness of management’s efforts to invest available funds representing the most
efficient and profitable uses. Earning assets at September 30, 2025 were $47.7 billion, or 89.6% of total assets, compared with $42.4 billion, or 90.1% of total assets, at December 31, 2024.
TABLE 13—FINANCIAL CONDITION SUMMARY
| (In thousands) |
|
As of and For the
Nine Months Ended
September 30, 2025 |
|
|
As of and For the
Year Ended
December 31, 2024 |
|
| Period-End Balances: |
|
|
|
|
|
|
|
|
| Total assets |
|
$ |
53,282,352 |
|
|
$ |
47,019,190 |
|
| Available for sale securities, at fair value |
|
|
9,616,389 |
|
|
|
7,293,988 |
|
| Loans and leases, net of unearned income |
|
|
36,801,836 |
|
|
|
33,741,755 |
|
| Total deposits |
|
|
43,921,456 |
|
|
|
40,496,201 |
|
| Securities sold under agreement to repurchase |
|
|
29,532 |
|
|
|
23,616 |
|
| Short-term FHLB borrowings |
|
|
925,000 |
|
|
|
— |
|
| Subordinated and long-term borrowings |
|
|
1,330,657 |
|
|
|
10,706 |
|
| Total shareholders' equity |
|
|
6,083,096 |
|
|
|
5,569,683 |
|
| Common shareholders' equity |
|
|
5,916,103 |
|
|
|
5,402,690 |
|
| Average Balances: |
|
|
|
|
|
|
|
|
| Total assets |
|
|
50,308,138 |
|
|
|
47,973,279 |
|
| Available for sale securities, at fair value |
|
|
8,773,139 |
|
|
|
7,962,869 |
|
| Loans and leases, net of unearned income |
|
|
35,119,899 |
|
|
|
33,107,659 |
|
| Total deposits |
|
|
41,719,856 |
|
|
|
38,475,929 |
|
| Federal funds purchased |
|
|
124,872 |
|
|
|
5,077 |
|
| Securities sold under agreement to repurchase |
|
|
21,887 |
|
|
|
81,091 |
|
| Short-term BTFP and FHLB borrowings |
|
|
762,238 |
|
|
|
2,845,904 |
|
| Subordinated and long-term borrowings |
|
|
970,319 |
|
|
|
306,396 |
|
| Total shareholders' equity |
|
|
5,821,474 |
|
|
|
5,353,705 |
|
| Common shareholders' equity |
|
|
5,654,481 |
|
|
|
5,186,712 |
|
Securities
The Company uses its securities portfolio as a source of revenue and liquidity, and to serve as collateral to secure certain types of deposits and
borrowings. These securities, which are available for possible sale, are recorded at fair value. The following table shows the carrying value of the Company’s AFS securities by investment category for the periods indicated:
TABLE 14—AVAILABLE FOR SALE SECURITIES SUMMARY
| (In thousands) |
|
September 30, 2025 |
|
|
December 31, 2024 |
|
| Available for sale securities: |
|
|
|
|
|
|
|
|
| U.S. government agency securities |
|
$ |
254,678 |
|
|
$ |
281,231 |
|
| MBS issued or guaranteed by U.S. agencies |
|
|
|
|
|
|
|
|
| Residential pass-through: |
|
|
|
|
|
|
|
|
| Guaranteed by GNMA |
|
|
63,756 |
|
|
|
66,581 |
|
| Issued by FNMA and FHLMC |
|
|
4,863,136 |
|
|
|
3,965,556 |
|
| Other residential MBS |
|
|
2,742,699 |
|
|
|
934,721 |
|
| Commercial MBS |
|
|
1,466,878 |
|
|
|
1,549,641 |
|
| Total MBS |
|
|
9,136,469 |
|
|
|
6,516,499 |
|
| Obligations of states and political subdivisions |
|
|
125,478 |
|
|
|
132,069 |
|
| Corporate debt securities |
|
|
29,703 |
|
|
|
47,402 |
|
| Foreign debt securities |
|
|
70,061 |
|
|
|
316,787 |
|
| Total |
|
$ |
9,616,389 |
|
|
$ |
7,293,988 |
|
At September 30, 2025, the Company’s AFS securities totaled $9.6 billion compared to $7.3 billion at December 31, 2024. The increase of $2.3
billion, or 31.8%, was primarily driven by the purchases of $3.6 billion of higher yielding securities and the acquisition of $2.5 billion in securities from the IBS merger. The increase was offset by the maturities and paydowns of $1.0 billion and the
sale of $3.1 billion of AFS securities during the nine month period.
Net unrealized losses on AFS securities at September 30, 2025 and December 31, 2024 totaled $593.1 million and $853.7 million, respectively. At
September 30, 2025, management believes that the unrealized losses are due to noncredit- related factors, such as changes in interest rates and other market conditions (see Note 3 to the unaudited consolidated financial statements).
The following table shows the maturities and weighted average yields for the carrying value of the AFS securities for the periods indicated:
TABLE 15—MATURITY DISTRIBUTION OF AFS SECURITIES
| |
|
September 30, 2025 |
|
|
December 31, 2024 |
|
| (Dollars in thousands) |
|
Estimated
Fair Value |
|
|
Weighted
Average
Yield |
|
|
Estimated
Fair Value |
|
|
Weighted
Average
Yield |
|
| U.S. government agency securities: |
|
|
|
|
|
|
|
|
|
|
|
|
|
|
|
|
| Due in one to five years |
|
$ |
8,204 |
|
|
|
3.53 |
% |
|
$ |
8,364 |
|
|
|
3.76 |
% |
| Due in five to ten years |
|
|
174,751 |
|
|
|
3.59 |
|
|
|
204,624 |
|
|
|
4.10 |
|
| Due after ten years |
|
|
71,723 |
|
|
|
2.10 |
|
|
|
68,243 |
|
|
|
2.14 |
|
| U.S. government agency securities total |
|
|
254,678 |
|
|
|
3.17 |
|
|
|
281,231 |
|
|
|
3.62 |
|
| Obligations of states and political subdivisions: |
|
|
|
|
|
|
|
|
|
|
|
|
|
|
|
|
| Due in one to five years |
|
|
6,430 |
|
|
|
2.66 |
|
|
|
9,295 |
|
|
|
2.92 |
|
| Due in five to ten years |
|
|
16,128 |
|
|
|
2.17 |
|
|
|
15,563 |
|
|
|
2.22 |
|
| Due after ten years |
|
|
102,920 |
|
|
|
2.71 |
|
|
|
107,211 |
|
|
|
2.69 |
|
| Obligations of states and political subdivisions total |
|
|
125,478 |
|
|
|
2.64 |
|
|
|
132,069 |
|
|
|
2.66 |
|
| Corporate debt securities: |
|
|
|
|
|
|
|
|
|
|
|
|
|
|
|
|
| Due in five to ten years |
|
|
27,975 |
|
|
|
4.34 |
|
|
|
45,702 |
|
|
|
4.77 |
|
| Due after ten years |
|
|
1,728 |
|
|
|
4.50 |
|
|
|
1,700 |
|
|
|
4.50 |
|
| Corporate debt securities total |
|
|
29,703 |
|
|
|
4.35 |
|
|
|
47,402 |
|
|
|
4.76 |
|
| Foreign debt securities: |
|
|
|
|
|
|
|
|
|
|
|
|
|
|
|
|
| Due in one to five years |
|
|
— |
|
|
|
— |
|
|
|
87,855 |
|
|
|
3.36 |
|
| Due in five to ten years |
|
|
70,061 |
|
|
|
4.65 |
|
|
|
228,932 |
|
|
|
5.16 |
|
| Foreign debt securities total |
|
|
70,061 |
|
|
|
4.65 |
|
|
|
316,787 |
|
|
|
4.66 |
|
| |
|
|
|
|
|
|
|
|
|
|
|
|
|
|
|
|
| Total securities due in one to five years |
|
|
14,634 |
|
|
|
3.15 |
|
|
|
105,514 |
|
|
|
3.35 |
|
| Total securities due in five to ten years |
|
|
288,915 |
|
|
|
3.84 |
|
|
|
494,821 |
|
|
|
4.59 |
|
| Total securities due after ten years |
|
|
176,371 |
|
|
|
2.48 |
|
|
|
177,154 |
|
|
|
2.50 |
|
| MBS |
|
|
9,136,469 |
|
|
|
3.69 |
|
|
|
6,516,499 |
|
|
|
2.87 |
|
| Total estimated fair value |
|
$ |
9,616,389 |
|
|
|
3.68 |
% |
|
$ |
7,293,988 |
|
|
|
2.98 |
% |
The weighted average yields reported in Table 15 have been calculated using the end of quarter balances of the related securities. The yields on tax-exempt obligations
of states and political subdivisions have been adjusted to a taxable equivalent basis using a 21% tax rate.
Loans and Leases
The Company’s loans and leases held for investment portfolio represents the largest single component of the Company’s earning asset base. Average
loans and leases comprised 77.3% and 75.9% of average earning assets during the nine months ended September 30, 2025 and the year ended December 31, 2024, respectively. The Company’s lending activities include both commercial and consumer loans and
leases. The Company has established systematic procedures for approving and monitoring loans and leases that vary depending on the size and nature of the loan or lease and applies these procedures in a disciplined manner. The Company also acts as agent
or participant in syndications and other financing arrangements with other financial institutions. The Company’s loans and leases are widely diversified by borrower and industry. Loans and leases, net of unearned income, totaled $36.8 billion at
September 30, 2025, representing a 9.1% increase from $33.7 billion at December 31, 2024.
The following table shows the composition of the Company’s loan and lease portfolio by segment and class at the dates indicated:
TABLE 16—LOANS AND LEASES PORTFOLIO
| (In thousands) |
|
September 30, 2025 |
|
|
December 31, 2024 |
|
| Commercial and industrial |
|
|
|
|
|
|
|
|
| Non-real estate |
|
$ |
9,239,690 |
|
|
$ |
8,670,529 |
|
| Owner occupied |
|
|
5,291,566 |
|
|
|
4,665,015 |
|
| Total commercial and industrial |
|
|
14,531,256 |
|
|
|
13,335,544 |
|
| Commercial real estate |
|
|
|
|
|
|
|
|
| Construction, acquisition and development |
|
|
3,338,413 |
|
|
|
3,909,184 |
|
| Income producing |
|
|
7,071,911 |
|
|
|
6,015,773 |
|
| Total commercial real estate |
|
|
10,410,324 |
|
|
|
9,924,957 |
|
| Consumer |
|
|
|
|
|
|
|
|
| Residential mortgages |
|
|
11,604,742 |
|
|
|
10,267,883 |
|
| Other consumer |
|
|
255,514 |
|
|
|
213,371 |
|
| Total consumer |
|
|
11,860,256 |
|
|
|
10,481,254 |
|
| Total loans and leases, net of unearned income (1) (2) |
|
$ |
36,801,836 |
|
|
$ |
33,741,755 |
|
|
(1) |
Total loans and leases are net of $49.4 million and $21.4 million of unearned income at September 30, 2025 and December 31, 2024, respectively. |
|
(2) |
Total loans and leases include $382.6 million of FCB loans acquired on May 1, 2025 and $1.0 billion of IBS loans acquired on July 1, 2025. See Note 2 for additional details. |
The following table shows the Company’s loan and lease portfolio by segment and class at the dates indicated by geographical location.
TABLE 17—LOANS AND LEASES BY GEOGRAPHICAL LOCATION
| |
|
September 30, 2025 |
|
| (In thousands) |
|
Alabama |
|
|
Arkansas |
|
|
Florida |
|
|
Georgia |
|
|
Louisiana |
|
|
Mississippi |
|
|
Missouri |
|
|
Tennessee |
|
|
Texas |
|
|
Other |
|
|
Total |
|
| Commercial and industrial |
|
|
|
|
|
|
|
|
|
|
|
|
|
|
|
|
|
|
|
|
|
|
|
|
|
|
|
|
|
|
|
|
|
|
|
|
|
|
|
|
|
|
|
|
| Non-real estate |
|
$ |
462,300 |
|
|
$ |
175,539 |
|
|
$ |
550,774 |
|
|
$ |
478,906 |
|
|
$ |
371,130 |
|
|
$ |
582,184 |
|
|
$ |
73,942 |
|
|
$ |
311,110 |
|
|
$ |
3,815,423 |
|
|
$ |
2,418,382 |
|
|
$ |
9,239,690 |
|
| Owner occupied |
|
|
321,662 |
|
|
|
257,437 |
|
|
|
332,609 |
|
|
|
456,553 |
|
|
|
296,228 |
|
|
|
589,168 |
|
|
|
99,740 |
|
|
|
161,689 |
|
|
|
2,229,387 |
|
|
|
547,093 |
|
|
|
5,291,566 |
|
| Total commercial and industrial |
|
|
783,962 |
|
|
|
432,976 |
|
|
|
883,383 |
|
|
|
935,459 |
|
|
|
667,358 |
|
|
|
1,171,352 |
|
|
|
173,682 |
|
|
|
472,799 |
|
|
|
6,044,810 |
|
|
|
2,965,475 |
|
|
|
14,531,256 |
|
| Commercial real estate |
|
|
|
|
|
|
|
|
|
|
|
|
|
|
|
|
|
|
|
|
|
|
|
|
|
|
|
|
|
|
|
|
|
|
|
|
|
|
|
|
|
|
|
|
| Construction, acquisition and development |
|
|
212,199 |
|
|
|
74,828 |
|
|
|
161,397 |
|
|
|
343,712 |
|
|
|
63,750 |
|
|
|
173,564 |
|
|
|
40,826 |
|
|
|
145,668 |
|
|
|
1,689,811 |
|
|
|
432,658 |
|
|
|
3,338,413 |
|
| Income producing |
|
|
450,073 |
|
|
|
266,511 |
|
|
|
678,157 |
|
|
|
992,713 |
|
|
|
231,125 |
|
|
|
406,276 |
|
|
|
222,229 |
|
|
|
341,344 |
|
|
|
2,566,690 |
|
|
|
916,793 |
|
|
|
7,071,911 |
|
| Total commercial real estate |
|
|
662,272 |
|
|
|
341,339 |
|
|
|
839,554 |
|
|
|
1,336,425 |
|
|
|
294,875 |
|
|
|
579,840 |
|
|
|
263,055 |
|
|
|
487,012 |
|
|
|
4,256,501 |
|
|
|
1,349,451 |
|
|
|
10,410,324 |
|
| Consumer |
|
|
|
|
|
|
|
|
|
|
|
|
|
|
|
|
|
|
|
|
|
|
|
|
|
|
|
|
|
|
|
|
|
|
|
|
|
|
|
|
|
|
|
|
| Residential mortgages |
|
|
1,357,455 |
|
|
|
457,332 |
|
|
|
733,156 |
|
|
|
535,352 |
|
|
|
504,138 |
|
|
|
1,270,904 |
|
|
|
230,107 |
|
|
|
906,977 |
|
|
|
5,345,855 |
|
|
|
263,466 |
|
|
|
11,604,742 |
|
| Other consumer |
|
|
28,584 |
|
|
|
18,555 |
|
|
|
5,723 |
|
|
|
8,981 |
|
|
|
10,225 |
|
|
|
82,164 |
|
|
|
1,400 |
|
|
|
16,397 |
|
|
|
77,447 |
|
|
|
6,038 |
|
|
|
255,514 |
|
| Total consumer |
|
|
1,386,039 |
|
|
|
475,887 |
|
|
|
738,879 |
|
|
|
544,333 |
|
|
|
514,363 |
|
|
|
1,353,068 |
|
|
|
231,507 |
|
|
|
923,374 |
|
|
|
5,423,302 |
|
|
|
269,504 |
|
|
|
11,860,256 |
|
| Total |
|
$ |
2,832,273 |
|
|
$ |
1,250,202 |
|
|
$ |
2,461,816 |
|
|
$ |
2,816,217 |
|
|
$ |
1,476,596 |
|
|
$ |
3,104,260 |
|
|
$ |
668,244 |
|
|
$ |
1,883,185 |
|
|
$ |
15,724,613 |
|
|
$ |
4,584,430 |
|
|
$ |
36,801,836 |
|
| |
|
December 31, 2024 |
|
| (In thousands) |
|
Alabama |
|
|
Arkansas |
|
|
Florida |
|
|
Georgia |
|
|
Louisiana |
|
|
Mississippi |
|
|
Missouri |
|
|
Tennessee |
|
|
Texas |
|
|
Other |
|
|
Total |
|
| Commercial and industrial |
|
|
|
|
|
|
|
|
|
|
|
|
|
|
|
|
|
|
|
|
|
|
|
|
|
|
|
|
|
|
|
|
|
|
|
|
|
|
|
|
|
|
|
|
| Non-real estate |
|
$ |
413,359 |
|
|
$ |
169,534 |
|
|
$ |
532,224 |
|
|
$ |
446,812 |
|
|
$ |
371,543 |
|
|
$ |
536,651 |
|
|
$ |
64,846 |
|
|
$ |
399,346 |
|
|
$ |
3,478,755 |
|
|
$ |
2,257,459 |
|
|
$ |
8,670,529 |
|
| Owner occupied |
|
|
337,580 |
|
|
|
253,538 |
|
|
|
308,545 |
|
|
|
400,342 |
|
|
|
298,787 |
|
|
|
624,950 |
|
|
|
107,443 |
|
|
|
159,058 |
|
|
|
1,708,113 |
|
|
|
466,659 |
|
|
|
4,665,015 |
|
| Total commercial and industrial |
|
|
750,939 |
|
|
|
423,072 |
|
|
|
840,769 |
|
|
|
847,154 |
|
|
|
670,330 |
|
|
|
1,161,601 |
|
|
|
172,289 |
|
|
|
558,404 |
|
|
|
5,186,868 |
|
|
|
2,724,118 |
|
|
|
13,335,544 |
|
| Commercial real estate |
|
|
|
|
|
|
|
|
|
|
|
|
|
|
|
|
|
|
|
|
|
|
|
|
|
|
|
|
|
|
|
|
|
|
|
|
|
|
|
|
|
|
|
|
| Construction, acquisition and development |
|
|
230,810 |
|
|
|
65,358 |
|
|
|
438,173 |
|
|
|
543,249 |
|
|
|
36,194 |
|
|
|
169,336 |
|
|
|
45,690 |
|
|
|
180,566 |
|
|
|
1,656,715 |
|
|
|
543,093 |
|
|
|
3,909,184 |
|
| Income producing |
|
|
437,146 |
|
|
|
259,767 |
|
|
|
477,493 |
|
|
|
613,337 |
|
|
|
226,849 |
|
|
|
424,078 |
|
|
|
204,119 |
|
|
|
319,560 |
|
|
|
2,298,344 |
|
|
|
755,080 |
|
|
|
6,015,773 |
|
| Total commercial real estate |
|
|
667,956 |
|
|
|
325,125 |
|
|
|
915,666 |
|
|
|
1,156,586 |
|
|
|
263,043 |
|
|
|
593,414 |
|
|
|
249,809 |
|
|
|
500,126 |
|
|
|
3,955,059 |
|
|
|
1,298,173 |
|
|
|
9,924,957 |
|
| Consumer |
|
|
|
|
|
|
|
|
|
|
|
|
|
|
|
|
|
|
|
|
|
|
|
|
|
|
|
|
|
|
|
|
|
|
|
|
|
|
|
|
|
|
|
|
| Residential mortgages |
|
|
1,300,485 |
|
|
|
425,602 |
|
|
|
709,335 |
|
|
|
449,117 |
|
|
|
478,947 |
|
|
|
1,214,542 |
|
|
|
210,712 |
|
|
|
796,490 |
|
|
|
4,436,803 |
|
|
|
245,850 |
|
|
|
10,267,883 |
|
| Other consumer |
|
|
27,186 |
|
|
|
17,653 |
|
|
|
5,002 |
|
|
|
7,817 |
|
|
|
10,653 |
|
|
|
86,059 |
|
|
|
1,322 |
|
|
|
16,668 |
|
|
|
36,559 |
|
|
|
4,452 |
|
|
|
213,371 |
|
| Total consumer |
|
|
1,327,671 |
|
|
|
443,255 |
|
|
|
714,337 |
|
|
|
456,934 |
|
|
|
489,600 |
|
|
|
1,300,601 |
|
|
|
212,034 |
|
|
|
813,158 |
|
|
|
4,473,362 |
|
|
|
250,302 |
|
|
|
10,481,254 |
|
| Total |
|
$ |
2,746,566 |
|
|
$ |
1,191,452 |
|
|
$ |
2,470,772 |
|
|
$ |
2,460,674 |
|
|
$ |
1,422,973 |
|
|
$ |
3,055,616 |
|
|
$ |
634,132 |
|
|
$ |
1,871,688 |
|
|
$ |
13,615,289 |
|
|
$ |
4,272,593 |
|
|
$ |
33,741,755 |
|
Loans Acquired in Mergers and Acquisitions
In connection with past bank acquisitions, the Company acquired loans both with and without evidence of credit quality deterioration since
origination. Acquired loans are recorded at their fair value at the time of acquisition with no carryover from the acquired institution’s previously recorded ACL.
Fair values for loans were estimated based on a discounted cash flow methodology (income approach) that considered factors including loan type and
related collateral, classification status, remaining term of the loan (in months), fixed or variable interest rate, past delinquencies, timing of principal and interest payments, current market rates, LTV, and current discount rates. The discount rate
did not include an explicit factor for credit losses, as it was included as a reduction to the estimated cash flows. Large loans were specifically reviewed to evaluate credit risk. The resulting fair value adjustment is recorded in the form of a
premium or discount to the unpaid principal balance of each acquired loan. As it relates to acquired loans that, as of the date of acquisition, have experienced a more-than-insignificant deterioration in credit quality since origination (“PCD”), the
net premium or net discount is adjusted to reflect the Company’s ACL recorded for PCD loans at the time of acquisition, and the remaining fair value adjustment not related to credit is accreted or amortized into interest income over the remaining life
of the loan. As it relates to acquired loans not classified as PCD (“non-PCD”) loans, the credit loss and yield components of the fair value adjustment are aggregated, and the resulting net premium or net discount is accreted or amortized into interest
income over the remaining life of the loan. The Company records an ACL for non-PCD loans at the time of acquisition through provision expense, and therefore, no further adjustments are made to the net premium or net discount for non-PCD loans. For the
three months ended September 30, 2025, the Company’s ACL recorded for acquired PCD and non-PCD loans was $15.1 million and $5.5 million, respectively, due to the IBS acquisition. For the nine months ended September 30, 2025, the Company’s ACL recorded
for acquired PCD and non-PCD loans was $23.2 million and $9.7 million, respectively, due to the FCB and IBS acquisitions. The book value of the acquired loans was $387.3 million and $1.1 billion for FCB and IBS, respectively.
In addition, a grade is assigned to each loan during the valuation process. For acquired loans that are not individually reviewed during the
valuation process, such loans are assumed to have characteristics similar to the assigned rating of the acquired institution’s risk rating, adjusted for any estimated differences between the Company’s rating methodology and the acquired institution’s
risk rating methodology. Acquired loans that are individually evaluated at the acquisition date are assigned a specific reserve in the same manner as other loans individually evaluated and are assigned an internal grade representing PCD with Loss
Exposure.
The following is a discussion of the Company’s segments and classes of loans and leases:
Commercial and Industrial
Non-Real Estate – The Company engages in lending to small and medium-sized business enterprises and government entities through its community banking locations
and to regional and national business enterprises through its corporate banking division. C&I loans are loans and leases to finance business operations, equipment and owner-occupied facilities. These include both lines of credit and term loans
which are amortized over the useful life of the assets financed. Personal and/or corporate guarantees are generally obtained where available and prudent. Also included in this category are loans to finance agricultural production. The Company
recognizes that risk from economic cycles, commodity prices, government regulation, supply-chain disruptions, product innovations or obsolescence, operational errors, lawsuits, natural disasters, fraud, losses due to theft or 87 embezzlement, loss of
sponsor support, health or loss of key personnel, or competitive situations may adversely affect the scheduled repayment of business loans. In addition, risks in the agricultural sector including crop failures due to weather, insects and other blights,
commodity prices, governmental intervention, lawsuits, labor or logistical disruptions. Non-real estate loans increased 6.6% from December 31, 2024 to September 30, 2025.
Owner Occupied – Owner occupied loans include loans secured by business facilities to finance business operations, equipment, agricultural
land and owner-occupied facilities. These include both lines of credit and term loans which are amortized over the useful life of the assets financed. Personal guarantees are generally obtained where available and prudent. The Company recognizes that
risk from economic cycles, government regulation, supply-chain disruptions, product innovations or obsolescence, operational errors, lawsuits, natural disasters, losses due to theft or embezzlement, health or loss of key personnel, or competitive
situations may adversely affect the scheduled repayment of business loans. Owner occupied loans increased 13.4% from December 31, 2024 to September 30, 2025.
Commercial Real Estate
Construction, Acquisition and Development – CAD loans include both term loans and credit lines for construction of commercial, industrial,
residential, and multi-family buildings and for purchasing, carrying, and developing land into residential subdivisions or various types of commercial developments, such as industrial, warehouse, retail, office, and multi-family. The Company generally
engages in construction and development lending primarily in markets served by its branches. The Company recognizes that risks are inherent in the financing of real estate development and construction. These risks include location, market conditions
and price volatility, changes in interest rates, demand for developed land, lots and buildings, desirability of features and styling of completed developments and buildings, competition from other developments and builders, traffic patterns, remote
work patterns, governmental jurisdiction, tax structure, availability of utilities, roads, public transportation and schools, availability of permanent financing for homebuyers, zoning, environmental restrictions, lawsuits, economic and business cycle,
or labor and reputation of the builder or developer. CAD loans decreased 14.6% from December 31, 2024 to September 30, 2025.
Each CAD loan is underwritten to address: (i) the desirability of the project, its market viability and projected absorption period; (ii) the
creditworthiness of the borrower and the guarantor, if applicable, as to liquidity, cash flow and assets available to ensure performance of the loan; (iii) equity contribution to the project; (iv) the developer’s experience and success with similar
projects; and (v) the value of the collateral.
Income Producing – Income producing loans include loans to finance income-producing commercial and multi-family properties. Lending in this
category is generally limited to properties located in the Company’s market area with only limited exposure to properties located elsewhere. Loans in this category include loans for neighborhood retail centers, medical and professional offices, single
retail stores, warehouses and apartments leased generally to local businesses and residents. The underwriting of these loans takes into consideration the occupancy and rental rates as well as the financial health of the borrower. The Company’s exposure
to national retail tenants is limited. The Company recognizes that risk from economic cycles, delayed or missed rent payments, supply-chain disruptions, operational errors, lawsuits, natural disasters, losses due to theft or embezzlement, health or
loss of key personnel, or competitive situations may adversely affect the scheduled repayment of business loans. Income producing loans increased 17.6% from December 31, 2024 to September 30, 2025.
Consumer
Residential Mortgages – Consumer mortgages are first or second-lien loans to consumers secured by a primary residence or second home. This
category includes traditional mortgages and home equity loans and revolving lines of credit. The loans are generally secured by properties located primarily in markets served by the Company’s branches. These loans are underwritten in accordance with
the Company’s general loan policy and procedures which require, among other things, proper documentation of each borrower’s financial condition, satisfactory credit history, and property value. In addition to loans originated for the Company’s
portfolio, the Company originates and services consumer mortgages sold in the secondary market which are underwritten and closed pursuant to investor and agency guidelines. Residential mortgages increased 13.0% from December 31, 2024 to September 30,
2025.
Other Consumer – Other consumer lending includes consumer credit card accounts as well as personal revolving lines of credit and installment
loans. The Company offers credit cards primarily to its deposit and loan customers. Consumer installment loans include term loans of up to five years secured by automobiles, boats and recreational vehicles. The Company recognizes that there are risks
in consumer lending, which include interruptions in the borrower’s personal and investment income due to loss of employment, market conditions, and general economic conditions, deterioration in the health and wellbeing of the borrower and family
members, natural disasters, lawsuits, losses, or inability to generate income due to injury, accidents, theft, vandalism, or incarceration. Other consumer loans increased 19.8% from December 31, 2024 to September 30, 2025.
Selected Loan Maturity and Interest Rate Sensitivity
The maturity distribution of the Company’s loan portfolio is one factor in management’s evaluation of the risk characteristics of the loan and
lease portfolio. The interest rate sensitivity of the Company’s loan and lease portfolio is important in the management of net interest margin. The Company attempts to manage the relationship between the interest rate sensitivity of its assets and
liabilities to produce an effective interest differential that is not significantly impacted by changes in the level of interest rates (See - Quantitative and Qualitative Disclosures About Market Risk). The following table shows the maturity
distribution based on remaining maturities of the Company’s loan and lease portfolio and the interest rate sensitivity of the Company’s loans and leases maturing after one year at September 30, 2025:
TABLE 18—INTEREST RATE SENSITIVITY OF LOANS AND LEASES
| |
|
September 30, 2025 |
|
| |
|
|
|
|
Over One |
|
|
Over Five |
|
|
|
|
|
Rate Structure for Loans
Maturing Over One Year |
|
| (In thousands) |
|
One Year
or Less |
|
|
Year through
Five Years |
|
|
Years through
Fifteen Years |
|
|
Over Fifteen
Years |
|
|
Fixed
Interest Rate |
|
|
Variable
Interest Rate |
|
| Commercial and industrial |
|
|
|
|
|
|
|
|
|
|
|
|
|
|
|
|
|
|
|
|
|
|
|
|
| Non-real estate |
|
$ |
1,833,637 |
|
|
$ |
5,940,259 |
|
|
$ |
1,394,296 |
|
|
$ |
71,498 |
|
|
$ |
970,330 |
|
|
$ |
6,435,723 |
|
| Owner occupied |
|
|
287,014 |
|
|
|
1,380,618 |
|
|
|
1,895,209 |
|
|
|
1,728,725 |
|
|
|
1,638,750 |
|
|
|
3,365,802 |
|
| Total commercial and industrial |
|
|
2,120,651 |
|
|
|
7,320,877 |
|
|
|
3,289,505 |
|
|
|
1,800,223 |
|
|
|
2,609,080 |
|
|
|
9,801,525 |
|
| Commercial real estate |
|
|
|
|
|
|
|
|
|
|
|
|
|
|
|
|
|
|
|
|
|
|
|
|
| Construction, acquisition and development |
|
|
1,171,664 |
|
|
|
799,753 |
|
|
|
612,197 |
|
|
|
754,799 |
|
|
|
284,044 |
|
|
|
1,882,705 |
|
| Income producing |
|
|
1,568,769 |
|
|
|
1,817,637 |
|
|
|
1,084,975 |
|
|
|
2,600,530 |
|
|
|
929,330 |
|
|
|
4,573,812 |
|
| Total commercial real estate |
|
|
2,740,433 |
|
|
|
2,617,390 |
|
|
|
1,697,172 |
|
|
|
3,355,329 |
|
|
|
1,213,374 |
|
|
|
6,456,517 |
|
| Consumer |
|
|
|
|
|
|
|
|
|
|
|
|
|
|
|
|
|
|
|
|
|
|
|
|
| Residential mortgages |
|
|
156,492 |
|
|
|
400,306 |
|
|
|
1,217,077 |
|
|
|
9,830,867 |
|
|
|
4,312,110 |
|
|
|
7,136,140 |
|
| Other consumer |
|
|
61,321 |
|
|
|
181,990 |
|
|
|
11,521 |
|
|
|
682 |
|
|
|
100,690 |
|
|
|
93,503 |
|
| Total consumer |
|
|
217,813 |
|
|
|
582,296 |
|
|
|
1,228,598 |
|
|
|
9,831,549 |
|
|
|
4,412,800 |
|
|
|
7,229,643 |
|
| Total |
|
$ |
5,078,897 |
|
|
$ |
10,520,563 |
|
|
$ |
6,215,275 |
|
|
$ |
14,987,101 |
|
|
$ |
8,235,254 |
|
|
$ |
23,487,685 |
|
Loans Held-for-Sale
At September 30, 2025 and December 31, 2024, loans held for sale totaled $261.7 million and $244.2 million, respectively. Included in loans held
for sale are loans sold to GNMA with an option to repurchase, totaling $73.7 million and $69.0 million at September 30, 2025 and December 31, 2024, respectively. The Company records the GNMA loans at fair value on the consolidated balance sheets with a
corresponding liability. GNMA optional repurchase programs allow financial institutions to buy back individual delinquent mortgage loans that meet certain criteria (90 days or more past due) from the securitized loan pool for which the institution
provides servicing. At the servicer’s option and without GNMA’s prior authorization, the servicer may repurchase such a delinquent loan for an amount equal to 100% of the remaining principal balance of the loan. Under ASC 860, this buyback option is
considered a conditional option until the delinquency criteria are met, at which time the option becomes unconditional. When the Company is deemed to have regained effective control over these loans under the unconditional buyback option, the loans can
no longer be reported as sold and must be brought back onto the consolidated balance sheet as loans held for sale, regardless of whether the Company intends to exercise the buy-back option. These GNMA loans are not included in the NPL totals (See Table
19).
Asset Quality
Nonperforming Assets
NPA consists of NPL, OREO, and other repossessed assets. The decrease from December 31, 2024 to September 30, 2025 in NPA was driven by the
decrease of $14.9 million, or 5.6%, in nonaccrual loans and leases (See Tables 20 and 21). The majority of the decrease in nonaccrual loans and leases was located in the C&I non-real estate segment. The decrease was partially offset by the increase
of $10.5 million, or 182.4%, in foreclosed OREO and other NPA. NPA were as follows as of each period presented:
TABLE 19—NONPERFORMING ASSETS
| (Dollars in thousands) |
|
September 30, 2025 |
|
|
December 31, 2024 |
|
| Total NPL(1) (2) |
|
$ |
249,822 |
|
|
$ |
264,692 |
|
| Foreclosed OREO and other NPA |
|
|
16,250 |
|
|
|
5,754 |
|
| Total NPA |
|
$ |
266,072 |
|
|
$ |
270,446 |
|
| NPL to total loans and leases |
|
|
0.68 |
% |
|
|
0.78 |
% |
| NPA to total assets |
|
|
0.50 |
% |
|
|
0.58 |
% |
| |
|
|
|
|
|
|
|
|
| GNMA loans 90 or more days past due eligible for repurchase |
|
$ |
73,676 |
|
|
$ |
68,993 |
|
| |
|
|
|
|
|
|
|
|
| Government guaranteed portion of nonaccrual loans and leases covered by the SBA, FHA, VA or USDA |
|
$ |
45,401 |
|
|
$ |
89,906 |
|
| |
|
|
|
|
|
|
|
|
| Loans and leases 90+ days past due, still accruing |
|
$ |
42,598 |
|
|
$ |
13,126 |
|
(1) See Tables 20 and 21 for more information regarding NPL.
(2) At September 30, 2025, NPL does not include NPL held for sale of $0.3 million.
Nonperforming Loans
NPL consist of nonaccrual loans and leases. The Company’s policy provides that loans and leases are generally placed in nonaccrual status if, in
management’s opinion, payment in full of principal or interest is not expected or payment of principal or interest is more than 90 days past due for commercial loans and 120 days past due for consumer loans, unless the loan or lease is both
well-secured and in the process of collection. NPL decreased 5.6% at September 30, 2025, compared to December 31, 2024. NPL as a percentage of net loans and leases decreased from 0.8% at December 31, 2024 to 0.7% at September 30, 2025. NPL trends
decreased primarily due to the charge-off of two asset-based lending credits and SBA charge- offs. With the current forecast, the Company expects a moderate correlation between NPL trends and provision amounts.
Included in NPL at September 30, 2025 were loans of $48.0 million that are individually analyzed collateral-dependent loans for which a specific
provision has been considered to address the unsupported exposure. Collateral-dependent loans are typically assigned an internal rating of impaired or PCD (loss). However, additional risk ratings can be used as needed to align with regulatory
definitions. PCD (loss) represent loans with evidence of deterioration of credit quality since origination that are acquired, and for which it was probable, at acquisition, that the bank will be unable to collect all contractually required payments. At
September 30, 2025, $39.8 million of nonperforming collateral-dependent loans for which a specific provision has been considered were rated as impaired and $8.2 million were rated as doubtful. Nonperforming collateral-dependent loans had a specific
reserve of $22.4 million included in the total ACL of $496.2 million at September 30, 2025, and were net of $31.7 million in partial charge-downs previously taken on these impaired loans. At September 30, 2025, there were no net partial charge-downs
previously taken on PCD (loss) loans.
NPL at December 31, 2024 included $75.8 million of nonperforming collateral-dependent loans that had a specific reserve of $16.9 million included
in the ACL of $460.8 million at December 31, 2024, and were net of $1.9 million in partial charge-downs previously taken on these impaired loans. Included in the $75.8 million of nonperforming collateral-dependent loans at December 31, 2024 were $67.1
million rated as impaired and $8.7 million rated as doubtful. At December 31, 2024, there were no net partial charge-downs previously taken on PCD (loss) loans.
The following table presents the Company’s NPL by geographical location at the dates indicated:
TABLE 20—NONPERFORMING LOANS AND LEASES BY GEOGRAPHICAL LOCATION
| |
|
September 30, 2025 |
|
|
December 31, 2024 |
|
| (Dollars in thousands) |
|
Amortized Cost |
|
|
Total NPL (1) |
|
|
NPL as a
% of
Amortized Cost |
|
|
Amortized Cost |
|
|
Total NPL |
|
|
NPL as a
% of
Amortized Cost |
|
| Alabama |
|
$ |
2,832,273 |
|
|
$ |
27,319 |
|
|
|
0.96 |
% |
|
$ |
2,746,566 |
|
|
$ |
22,394 |
|
|
|
0.82 |
% |
| Arkansas |
|
|
1,250,202 |
|
|
|
5,235 |
|
|
|
0.42 |
|
|
|
1,191,452 |
|
|
|
2,292 |
|
|
|
0.19 |
|
| Florida |
|
|
2,461,816 |
|
|
|
16,787 |
|
|
|
0.68 |
|
|
|
2,470,772 |
|
|
|
30,380 |
|
|
|
1.23 |
|
| Georgia |
|
|
2,816,217 |
|
|
|
18,144 |
|
|
|
0.64 |
|
|
|
2,460,674 |
|
|
|
17,245 |
|
|
|
0.70 |
|
| Louisiana |
|
|
1,476,596 |
|
|
|
4,694 |
|
|
|
0.32 |
|
|
|
1,422,973 |
|
|
|
5,669 |
|
|
|
0.40 |
|
| Mississippi |
|
|
3,104,260 |
|
|
|
19,481 |
|
|
|
0.63 |
|
|
|
3,055,616 |
|
|
|
13,702 |
|
|
|
0.45 |
|
| Missouri |
|
|
668,244 |
|
|
|
2,499 |
|
|
|
0.37 |
|
|
|
634,132 |
|
|
|
3,359 |
|
|
|
0.53 |
|
| Tennessee |
|
|
1,883,185 |
|
|
|
17,981 |
|
|
|
0.95 |
|
|
|
1,871,688 |
|
|
|
17,672 |
|
|
|
0.94 |
|
| Texas |
|
|
15,724,613 |
|
|
|
112,607 |
|
|
|
0.72 |
|
|
|
13,615,289 |
|
|
|
69,985 |
|
|
|
0.51 |
|
| Other |
|
|
4,584,430 |
|
|
|
25,075 |
|
|
|
0.55 |
|
|
|
4,272,593 |
|
|
|
81,994 |
|
|
|
1.92 |
|
| Total |
|
$ |
36,801,836 |
|
|
$ |
249,822 |
|
|
|
0.68 |
% |
|
$ |
33,741,755 |
|
|
$ |
264,692 |
|
|
|
0.78 |
% |
|
(1) |
At September 30, 2025, NPL does not include NPL held for sale of $0.3 million. |
The following table provides additional details related to the Company’s loan and lease portfolio and the distribution of NPL by segment and class
at the dates indicated:
TABLE 21—NONPERFORMING LOANS AND LEASES BY SEGMENT AND CLASS
| |
|
September 30, 2025 |
|
|
December 31, 2024 |
|
| (Dollars in thousands) |
|
Amortized Cost |
|
|
Total NPL (1) |
|
|
NPL as a
% of
Amortized Cost |
|
|
Amortized Cost |
|
|
Total NPL |
|
|
NPL as a
% of
Amortized Cost |
|
| Commercial and industrial |
|
|
|
|
|
|
|
|
|
|
|
|
|
|
|
|
|
|
|
|
|
|
|
|
| Non-real estate |
|
$ |
9,239,690 |
|
|
$ |
83,090 |
|
|
|
0.90 |
% |
|
$ |
8,670,529 |
|
|
$ |
145,115 |
|
|
|
1.67 |
% |
| Owner occupied |
|
|
5,291,566 |
|
|
|
20,067 |
|
|
|
0.38 |
|
|
|
4,665,015 |
|
|
|
16,904 |
|
|
|
0.36 |
|
| Total commercial and industrial |
|
|
14,531,256 |
|
|
|
103,157 |
|
|
|
0.71 |
|
|
|
13,335,544 |
|
|
|
162,019 |
|
|
|
1.21 |
|
| Commercial real estate |
|
|
|
|
|
|
|
|
|
|
|
|
|
|
|
|
|
|
|
|
|
|
|
|
| Construction, acquisition and development |
|
|
3,338,413 |
|
|
|
2,099 |
|
|
|
0.06 |
|
|
|
3,909,184 |
|
|
|
8,600 |
|
|
|
0.22 |
|
| Income producing |
|
|
7,071,911 |
|
|
|
50,595 |
|
|
|
0.72 |
|
|
|
6,015,773 |
|
|
|
18,542 |
|
|
|
0.31 |
|
| Total commercial real estate |
|
|
10,410,324 |
|
|
|
52,694 |
|
|
|
0.51 |
|
|
|
9,924,957 |
|
|
|
27,142 |
|
|
|
0.27 |
|
| Consumer |
|
|
|
|
|
|
|
|
|
|
|
|
|
|
|
|
|
|
|
|
|
|
|
|
| Residential mortgages |
|
|
11,604,742 |
|
|
|
93,608 |
|
|
|
0.81 |
|
|
|
10,267,883 |
|
|
|
75,287 |
|
|
|
0.73 |
|
| Other consumer |
|
|
255,514 |
|
|
|
363 |
|
|
|
0.14 |
|
|
|
213,371 |
|
|
|
244 |
|
|
|
0.11 |
|
| Total consumer |
|
|
11,860,256 |
|
|
|
93,971 |
|
|
|
0.79 |
|
|
|
10,481,254 |
|
|
|
75,531 |
|
|
|
0.72 |
|
| Total |
|
$ |
36,801,836 |
|
|
$ |
249,822 |
|
|
|
0.68 |
% |
|
$ |
33,741,755 |
|
|
$ |
264,692 |
|
|
|
0.78 |
% |
|
(1) |
At September 30, 2025, NPL does not include NPL held for sale of $0.3 million. |
The following table provides details regarding the aging of the Company’s NPL by segment and class at the dates indicated:
TABLE 22—AGING OF NONACCRUAL LOANS AND LEASES
| |
|
September 30, 2025 |
|
| (In thousands) |
|
30-59 Days
Past Due |
|
|
60-89 Days
Past Due |
|
|
90+ Days
Past Due |
|
|
Total
Past Due |
|
|
Current |
|
|
Total
Nonaccrual (1)
|
|
| Commercial and industrial |
|
|
|
|
|
|
|
|
|
|
|
|
|
|
|
|
|
|
|
|
|
|
|
|
| Non-real estate |
|
$ |
235 |
|
|
$ |
12,913 |
|
|
$ |
43,937 |
|
|
$ |
57,085 |
|
|
$ |
26,005 |
|
|
$ |
83,090 |
|
| Owner occupied |
|
|
1,136 |
|
|
|
394 |
|
|
|
17,618 |
|
|
|
19,148 |
|
|
|
919 |
|
|
|
20,067 |
|
| Total commercial and industrial |
|
|
1,371 |
|
|
|
13,307 |
|
|
|
61,555 |
|
|
|
76,233 |
|
|
|
26,924 |
|
|
|
103,157 |
|
| Commercial real estate |
|
|
|
|
|
|
|
|
|
|
|
|
|
|
|
|
|
|
|
|
|
|
|
|
|
Construction, acquisition and development
|
|
|
143 |
|
|
|
289 |
|
|
|
1,462 |
|
|
|
1,894 |
|
|
|
205 |
|
|
|
2,099 |
|
| Income producing |
|
|
1,212 |
|
|
|
2,961 |
|
|
|
4,905 |
|
|
|
9,078 |
|
|
|
41,517 |
|
|
|
50,595 |
|
| Total commercial real estate |
|
|
1,355 |
|
|
|
3,250 |
|
|
|
6,367 |
|
|
|
10,972 |
|
|
|
41,722 |
|
|
|
52,694 |
|
| Consumer |
|
|
|
|
|
|
|
|
|
|
|
|
|
|
|
|
|
|
|
|
|
|
|
|
| Residential mortgages |
|
|
8,968 |
|
|
|
9,407 |
|
|
|
55,104 |
|
|
|
73,479 |
|
|
|
20,129 |
|
|
|
93,608 |
|
| Other consumer |
|
|
29 |
|
|
|
13 |
|
|
|
211 |
|
|
|
253 |
|
|
|
110 |
|
|
|
363 |
|
| Total consumer |
|
|
8,997 |
|
|
|
9,420 |
|
|
|
55,315 |
|
|
|
73,732 |
|
|
|
20,239 |
|
|
|
93,971 |
|
| Total |
|
$ |
11,723 |
|
|
$ |
25,977 |
|
|
$ |
123,237 |
|
|
$ |
160,937 |
|
|
$ |
88,885 |
|
|
$ |
249,822 |
|
|
(1) |
At September 30, 2025, NPL does not include NPL held for sale of $0.3 million. |
| |
|
December 31, 2024 |
|
| (In thousands) |
|
30-59 Days
Past Due |
|
|
60-89 Days
Past Due |
|
|
90+ Days
Past Due |
|
|
Total
Past Due |
|
|
Current |
|
|
Total
Nonaccrual |
|
| Commercial and industrial |
|
|
|
|
|
|
|
|
|
|
|
|
|
|
|
|
|
|
|
|
|
|
|
|
| Non-real estate |
|
$ |
1,943 |
|
|
$ |
357 |
|
|
$ |
93,758 |
|
|
$ |
96,058 |
|
|
$ |
49,057 |
|
|
$ |
145,115 |
|
| Owner occupied |
|
|
574 |
|
|
|
50 |
|
|
|
16,280 |
|
|
|
16,904 |
|
|
|
— |
|
|
|
16,904 |
|
| Total commercial and industrial |
|
|
2,517 |
|
|
|
407 |
|
|
|
110,038 |
|
|
|
112,962 |
|
|
|
49,057 |
|
|
|
162,019 |
|
| Commercial real estate |
|
|
|
|
|
|
|
|
|
|
|
|
|
|
|
|
|
|
|
|
|
|
|
|
|
Construction, acquisition and development
|
|
|
— |
|
|
|
21 |
|
|
|
8,579 |
|
|
|
8,600 |
|
|
|
— |
|
|
|
8,600 |
|
| Income producing |
|
|
— |
|
|
|
246 |
|
|
|
12,193 |
|
|
|
12,439 |
|
|
|
6,103 |
|
|
|
18,542 |
|
| Total commercial real estate |
|
|
— |
|
|
|
267 |
|
|
|
20,772 |
|
|
|
21,039 |
|
|
|
6,103 |
|
|
|
27,142 |
|
| Consumer |
|
|
|
|
|
|
|
|
|
|
|
|
|
|
|
|
|
|
|
|
|
|
|
|
| Residential mortgages |
|
|
5,379 |
|
|
|
7,656 |
|
|
|
56,829 |
|
|
|
69,864 |
|
|
|
5,423 |
|
|
|
75,287 |
|
| Other consumer |
|
|
13 |
|
|
|
28 |
|
|
|
153 |
|
|
|
194 |
|
|
|
50 |
|
|
|
244 |
|
| Total consumer |
|
|
5,392 |
|
|
|
7,684 |
|
|
|
56,982 |
|
|
|
70,058 |
|
|
|
5,473 |
|
|
|
75,531 |
|
| Total |
|
$ |
7,909 |
|
|
$ |
8,358 |
|
|
$ |
187,792 |
|
|
$ |
204,059 |
|
|
$ |
60,633 |
|
|
$ |
264,692 |
|
OREO and Repossessed Assets
OREO consists of properties acquired through foreclosure. Repossessed assets consist of non-real estate assets acquired in partial or full
settlement of loans. OREO and repossessed assets totaled $16.3 million and $5.8 million at September 30, 2025 and December 31, 2024, respectively. The increase of $10.5 million, or 182.4%, was primarily the result of increased foreclosure activity of
$20.1 million, and the FCB acquisition of $1.6 million, partially offset by sales of $10.8 million during the nine months ended September 30, 2025. The main types of OREO acquired during the period were CRE and residential mortgages.
Because a portion of the Company’s NPL have been determined to be collateral-dependent, management expects the resolution of a significant number
of these loans may necessitate foreclosure proceedings resulting in further additions to OREO. At September 30, 2025, residential mortgages in process of foreclosure increased to $20.2 million compared to $19.7 million at December 31, 2024.
At the time of foreclosure, the fair value of the collateral for loans backed by real estate is typically determined by an appraisal performed by a
third-party appraiser holding professional certifications. Such appraisals are then reviewed and evaluated by the Company’s internal appraisal group. A market value appraisal using a 180-360-day marketing period is typically ordered and the OREO is
recorded at the time of foreclosure at its market value less estimated selling costs. For residential subdivisions that are not completed, the appraisals reflect the uncompleted status of the subdivision.
Since OREO is carried at the lower of cost or fair value less estimated selling costs on an ongoing basis, new appraisals are generally obtained on
at least an annual basis and the OREO carrying values are adjusted accordingly. The type of appraisals typically used for these periodic reappraisals are “Restricted Use Appraisals,” meaning the appraisal is for client use only. Other indications of
fair value are also used to attempt to ensure that OREO is carried at fair value. These include listing the property with a broker and acceptance of an offer to purchase from a third-party. If an OREO property is listed with a broker at an amount less
than the current carrying value, the carrying value is adjusted to reflect the list price less estimated selling costs and if an offer to purchase is accepted at a price less than the current carrying value, the carrying value is adjusted to reflect
that sales price, less estimated selling costs. The majority of the properties in OREO are actively marketed using a combination of real estate brokers, bank staff who are familiar with the particular properties and/or third parties.
Financial Difficulty Modifications
In March 2022, the FASB issued ASU No. 2022-02, eliminating the recognition and measurement guidance on TDRs for creditors that have adopted ASC
326 and requiring them to make enhanced disclosures about loan modifications for borrowers experiencing financial difficulty. The guidance became effective for Cadence beginning January 1, 2023, and was adopted via the modified retrospective transition
method.
With the removal of the TDR accounting model, the general loan modification guidance in Subtopic 310-20 is now applied to all loan modifications,
including modifications made for borrowers experiencing financial difficulty. Under this guidance, a modification is treated as a new loan only if both: 1) the terms of the new loan are at least as favorable to the lender as the terms for comparable
loans to other customers with similar collection risks, and 2) modifications to the terms of the original loan are more than minor. If either condition is not met, the modification is accounted for as the continuation of the old loan with any effect of
the modification treated as a prospective adjustment to the loan’s EIR. Modifications in scope for borrowers experiencing financial difficulty may include principal forgiveness, other-than-insignificant payment delay, interest rate reduction, or a
combination of modifications. During the nine months ended September 30, 2025, the most common individual concessions were related to term extensions and payment deferrals. Other concessions included interest rate reductions.
At September 30, 2025, loans that were modified within the past nine months for borrowers experiencing financial difficulty totaled $167.0 million,
or 0.5%, of total loans and leases, net of unearned income. Loans are considered to be in payment default at 90 or more days past due for purposes of assessing modified loans for default. See Note 4 to the consolidated financial statements for
additional information for these loans.
Loan Concentrations
At September 30, 2025, the Company did not have any concentration of loans or leases in excess of 10% of total loans and leases outstanding which
were not otherwise disclosed as a category of loans or leases. Loan concentrations are considered to exist when there are amounts loaned to multiple borrowers engaged in similar activities which would cause them to be similarly impacted by economic or
other conditions. The Company conducts business in a geographically concentrated area and has a significant amount of loans secured by real estate to borrowers in varying activities and businesses but does not consider these factors alone in
identifying loan concentrations. The ability of the Company’s borrowers to repay loans is somewhat dependent upon the economic conditions prevailing in the Company’s market areas.
Internally Assigned Grades on Loans
The Company utilizes an internal loan classification system that is updated to perpetually grade loans according to certain credit quality
indicators. These credit quality indicators include, but are not limited to, recent credit performance, delinquency, liquidity, cash flows, debt coverage ratios, collateral type and loan-to-value ratio. See Note 4 to the consolidated financial
statements.
The following table provides details of the Company’s loan and lease portfolio by segment, class, and internally assigned grade at the dates
indicated:
TABLE 23—GRADES ON LOANS AND LEASES
| |
|
September 30, 2025 |
|
| (In thousands) |
|
Pass |
|
|
Special
Mention (1)
|
|
|
Substandard (1) |
|
|
Doubtful |
|
|
Impaired (1) |
|
|
PCD (Loss) |
|
|
Total |
|
| Commercial and industrial |
|
|
|
|
|
|
|
|
|
|
|
|
|
|
|
|
|
|
|
|
|
|
|
|
|
|
|
|
| Non-real estate |
|
$ |
8,733,898 |
|
|
$ |
154,131 |
|
|
$ |
296,848 |
|
|
$ |
8,183 |
|
|
$ |
31,373 |
|
|
$ |
15,257 |
|
|
$ |
9,239,690 |
|
| Owner occupied |
|
|
5,217,614 |
|
|
|
15,251 |
|
|
|
53,587 |
|
|
|
— |
|
|
|
4,641 |
|
|
|
473 |
|
|
|
5,291,566 |
|
| Total commercial and industrial |
|
|
13,951,512 |
|
|
|
169,382 |
|
|
|
350,435 |
|
|
|
8,183 |
|
|
|
36,014 |
|
|
|
15,730 |
|
|
|
14,531,256 |
|
| Commercial real estate |
|
|
|
|
|
|
|
|
|
|
|
|
|
|
|
|
|
|
|
|
|
|
|
|
|
|
|
|
| Construction, acquisition and development |
|
|
3,307,750 |
|
|
|
27,265 |
|
|
|
3,332 |
|
|
|
— |
|
|
|
66 |
|
|
|
— |
|
|
|
3,338,413 |
|
| Income producing |
|
|
6,802,210 |
|
|
|
98,974 |
|
|
|
169,090 |
|
|
|
— |
|
|
|
862 |
|
|
|
775 |
|
|
|
7,071,911 |
|
| Total commercial real estate |
|
|
10,109,960 |
|
|
|
126,239 |
|
|
|
172,422 |
|
|
|
— |
|
|
|
928 |
|
|
|
775 |
|
|
|
10,410,324 |
|
| Consumer |
|
|
|
|
|
|
|
|
|
|
|
|
|
|
|
|
|
|
|
|
|
|
|
|
|
|
|
|
| Residential mortgages |
|
|
11,486,319 |
|
|
|
9,167 |
|
|
|
105,076 |
|
|
|
— |
|
|
|
2,836 |
|
|
|
1,344 |
|
|
|
11,604,742 |
|
| Other consumer |
|
|
254,917 |
|
|
|
— |
|
|
|
597 |
|
|
|
— |
|
|
|
— |
|
|
|
— |
|
|
|
255,514 |
|
| Total consumer |
|
|
11,741,236 |
|
|
|
9,167 |
|
|
|
105,673 |
|
|
|
— |
|
|
|
2,836 |
|
|
|
1,344 |
|
|
|
11,860,256 |
|
| Total |
|
$ |
35,802,708 |
|
|
$ |
304,788 |
|
|
$ |
628,530 |
|
|
$ |
8,183 |
|
|
$ |
39,778 |
|
|
$ |
17,849 |
|
|
$ |
36,801,836 |
|
|
(1) |
In the loan classifications above, $8.7 million of the special mention balance, $64.8 million of the substandard balance, and $3.4 million of the impaired balance are covered by government guarantees from either the SBA, FHA, VA or USDA. |
| |
|
December 31, 2024 |
|
| |
|
|
|
|
Special |
|
|
|
|
|
|
|
|
|
|
|
|
|
|
|
|
| (In thousands) |
|
Pass |
|
|
Mention |
|
|
Substandard (1) |
|
|
Doubtful |
|
|
Impaired (1) |
|
|
PCD (Loss) |
|
|
Total |
|
| Commercial and industrial |
|
|
|
|
|
|
|
|
|
|
|
|
|
|
|
|
|
|
|
|
|
|
|
|
|
|
|
|
| Non-real estate |
|
$ |
8,208,176 |
|
|
$ |
106,996 |
|
|
$ |
311,096 |
|
|
$ |
8,743 |
|
|
$ |
31,996 |
|
|
$ |
3,522 |
|
|
$ |
8,670,529 |
|
| Owner occupied |
|
|
4,610,775 |
|
|
|
815 |
|
|
|
41,363 |
|
|
|
— |
|
|
|
10,968 |
|
|
|
1,094 |
|
|
|
4,665,015 |
|
| Total commercial and industrial |
|
|
12,818,951 |
|
|
|
107,811 |
|
|
|
352,459 |
|
|
|
8,743 |
|
|
|
42,964 |
|
|
|
4,616 |
|
|
|
13,335,544 |
|
| Commercial real estate |
|
|
|
|
|
|
|
|
|
|
|
|
|
|
|
|
|
|
|
|
|
|
|
|
|
|
|
|
| Construction, acquisition and development |
|
|
3,896,856 |
|
|
|
— |
|
|
|
12,262 |
|
|
|
— |
|
|
|
66 |
|
|
|
— |
|
|
|
3,909,184 |
|
| Income producing |
|
|
5,850,702 |
|
|
|
5,094 |
|
|
|
144,084 |
|
|
|
— |
|
|
|
15,893 |
|
|
|
— |
|
|
|
6,015,773 |
|
| Total commercial real estate |
|
|
9,747,558 |
|
|
|
5,094 |
|
|
|
156,346 |
|
|
|
— |
|
|
|
15,959 |
|
|
|
— |
|
|
|
9,924,957 |
|
| Consumer |
|
|
|
|
|
|
|
|
|
|
|
|
|
|
|
|
|
|
|
|
|
|
|
|
|
|
|
|
| Residential mortgages |
|
|
10,167,830 |
|
|
|
891 |
|
|
|
89,597 |
|
|
|
— |
|
|
|
8,154 |
|
|
|
1,411 |
|
|
|
10,267,883 |
|
| Other consumer |
|
|
212,865 |
|
|
|
— |
|
|
|
506 |
|
|
|
— |
|
|
|
— |
|
|
|
— |
|
|
|
213,371 |
|
| Total consumer |
|
|
10,380,695 |
|
|
|
891 |
|
|
|
90,103 |
|
|
|
— |
|
|
|
8,154 |
|
|
|
1,411 |
|
|
|
10,481,254 |
|
| Total |
|
$ |
32,947,204 |
|
|
$ |
113,796 |
|
|
$ |
598,908 |
|
|
$ |
8,743 |
|
|
$ |
67,077 |
|
|
$ |
6,027 |
|
|
$ |
33,741,755 |
|
|
(1) |
In the loan classifications above, $99.0 million of the substandard balance and $11.1 million of the impaired balance are covered by government guarantees from either the SBA, FHA, VA or USDA. |
The following tables provides details regarding the aging of the Company’s loan and lease portfolio by internally assigned grade at the dates indicated:
TABLE 24—AGING BY GRADE ON LOANS AND LEASES
| |
|
September 30, 2025 |
|
| (In thousands) |
|
Current |
|
|
30-59 Days
Past Due |
|
|
60-89 Days
Past Due |
|
|
90+ Days
Past Due |
|
|
Total |
|
| Pass |
|
$ |
35,686,971 |
|
|
$ |
73,947 |
|
|
$ |
41,571 |
|
|
$ |
219 |
|
|
$ |
35,802,708 |
|
| Special Mention (1) |
|
|
303,389 |
|
|
|
1,399 |
|
|
|
— |
|
|
|
— |
|
|
|
304,788 |
|
| Substandard (1) |
|
|
428,370 |
|
|
|
27,202 |
|
|
|
17,500 |
|
|
|
155,458 |
|
|
|
628,530 |
|
| Doubtful |
|
|
8,183 |
|
|
|
— |
|
|
|
— |
|
|
|
— |
|
|
|
8,183 |
|
| Impaired (1) |
|
|
16,983 |
|
|
|
— |
|
|
|
12,636 |
|
|
|
10,159 |
|
|
|
39,778 |
|
| PCD (Loss) |
|
|
17,849 |
|
|
|
— |
|
|
|
— |
|
|
|
— |
|
|
|
17,849 |
|
| Total |
|
$ |
36,461,745 |
|
|
$ |
102,548 |
|
|
$ |
71,707 |
|
|
$ |
165,836 |
|
|
$ |
36,801,836 |
|
|
(1) |
In the loan classifications above, $8.7 million of the special mention balance, $64.8 million of the substandard balance, and $3.4 million of the impaired balance are covered by government guarantees from either the SBA, FHA, VA or USDA. |
| |
|
December 31, 2024 |
|
| |
|
|
|
|
30-59 Days |
|
|
60-89 Days |
|
|
90+ Days |
|
|
|
|
| (In thousands) |
|
Current |
|
|
Past Due |
|
|
Past Due |
|
|
Past Due |
|
|
Total |
|
| Pass |
|
$ |
32,857,689 |
|
|
$ |
65,955 |
|
|
$ |
22,789 |
|
|
$ |
771 |
|
|
$ |
32,947,204 |
|
| Special Mention |
|
|
113,796 |
|
|
|
— |
|
|
|
— |
|
|
|
— |
|
|
|
113,796 |
|
| Substandard (1) |
|
|
368,636 |
|
|
|
24,685 |
|
|
|
40,707 |
|
|
|
164,880 |
|
|
|
598,908 |
|
| Doubtful |
|
|
8,743 |
|
|
|
— |
|
|
|
— |
|
|
|
— |
|
|
|
8,743 |
|
| Impaired (1) |
|
|
29,908 |
|
|
|
1,904 |
|
|
|
— |
|
|
|
35,265 |
|
|
|
67,077 |
|
| PCD (Loss) |
|
|
4,932 |
|
|
|
1,095 |
|
|
|
— |
|
|
|
— |
|
|
|
6,027 |
|
| Total |
|
$ |
33,383,704 |
|
|
$ |
93,639 |
|
|
$ |
63,496 |
|
|
$ |
200,916 |
|
|
$ |
33,741,755 |
|
|
(1) |
In the loan classifications above, $99.0 million of the substandard balance and $11.1 million of the impaired balance is covered by government guarantees from the SBA, FHA, VA or USDA. |
At September 30, 2025, loans in pass, special mention, substandard, and PCD (loss) grade categories increased while loans in doubtful and impaired
grade categories decreased compared to December 31, 2024. Pass loans increased $2.9 billion, or 8.7%, compared to December 31, 2024. The increase in pass was seen across all loan categories except for a decrease in CAD loans. Special mention loans
increased $191.0 million, or 167.8%, compared to December 31, 2024. The increase in special mention was mainly driven by increases in C&I non-real estate and CRE income producing loans. Substandard loans increased $29.6 million, or 4.9%, at
September 30, 2025 compared to December 31, 2024. The increase in substandard was mainly driven by the increase in CRE income producing loans, somewhat offset by a slight decrease in CAD and C&I non-real estate loans. PCD (loss) loans increased
$11.8 million, or 196.2%, compared to December 31, 2024. The increase in PCD (loss) was driven by the FCB and IBS acquisitions, somewhat offset by a decrease in C&I owner occupied loans. Impaired loans decreased $27.3 million, or 40.7%, at
September 30, 2025 compared to December 31, 2024. The decrease in impaired was primarily driven by decreases in C&I owner occupied and CRE income producing loans. The Company has maintained stable credit results while continuing to grow loans. Of
total loans and leases, 99.1% were current on their contractual payments at September 30, 2025.
Collateral for some of the Company’s loans and leases is subject to fair value estimates that can fluctuate with market conditions and other
external factors. In addition, while the Company has certain underwriting obligations related to such estimates, the estimates of some real property and other collateral are dependent upon third-party independent appraisers employed as independent
contractors of the Company.
Deposits
Deposits originating within the communities served by the Company continue to be the Company’s primary source of funding its earning assets. The
Company has been able to compete effectively for deposits in its primary market areas, while continuing to manage the exposure to changes in interest rates. The distribution and market share of deposits by type of deposit and by type of depositor are
important considerations in the Company's assessment of the stability of its funding sources and its access to additional funds. Furthermore, management shifts the mix and maturity of the deposits depending on economic conditions and loan and
investment policies in an attempt, within set policies, to minimize cost and maximize net interest margin.
The following table presents the Company’s deposits and the percentage change between the periods indicated:
TABLE 25—SUMMARY OF DEPOSITS
| (Dollars in thousands) |
|
September 30, 2025 |
|
|
December 31, 2024 |
|
|
% Change |
|
| Noninterest bearing demand deposits |
|
$ |
9,036,907 |
|
|
$ |
8,591,805 |
|
|
|
5.2 |
% |
| Interest bearing demand and money market deposits |
|
|
20,518,436 |
|
|
|
19,345,114 |
|
|
|
6.1 |
|
| Savings |
|
|
3,095,622 |
|
|
|
2,588,406 |
|
|
|
19.6 |
|
| Time deposits |
|
|
11,270,491 |
|
|
|
9,970,876 |
|
|
|
13.0 |
|
| Total deposits |
|
$ |
43,921,456 |
|
|
$ |
40,496,201 |
|
|
|
8.5 |
% |
Total deposits experienced an increase of $3.4 billion at September 30, 2025, compared to December 31, 2024 due to increases in core customer
deposits (which excludes brokered deposits and public funds) and public funds, partially offset by a decrease in brokered deposits. Core customer deposit balances were $38.3 billion at September 30, 2025, an increase of $4.0 billion, or 11.6%, compared
to December 31, 2024. This increase was primarily due to the acquisition of FCB and IBS, which added $523.6 million and $4.3 billion of deposits, respectively, during the nine months ended September 30, 2025. See Note 2 for further details. Total
public funds balances were $4.5 billion at September 30, 2025, an increase of $349.5 million, or 8.5%, compared to December 31, 2024. This increase was also primarily the result of the acquisitions in the second and third quarters of 2025. Brokered
deposits were $1.2 billion at September 30, 2025, a decrease of $898.2 million, or 42.9%, compared to December 31, 2024. Noninterest bearing demand deposits increased $445.1 million, or 5.2%, at September 30, 2025 compared to December 31, 2024. Time
deposits increased $1.3 billion, or 13.0%, at September 30, 2025 compared to December 31, 2024 due in part to an increase of $1.9 billion in time deposits assumed from IBS.
The following table presents the classification of the Company’s deposits on an average basis for each of the periods indicated:
TABLE 26—AVERAGE BALANCE AND YIELD ON DEPOSITS
| |
|
Three Months Ended September 30, |
|
| |
|
2025 |
|
|
2024 |
|
| (Dollars in thousands) |
|
Average
Amount |
|
|
Average
Rate |
|
|
Average
Amount |
|
|
Average
Rate |
|
| Noninterest bearing demand deposits |
|
$ |
10,040,670 |
|
|
|
— |
% |
|
$ |
8,616,534 |
|
|
|
— |
% |
| Interest bearing demand deposits |
|
|
20,264,338 |
|
|
|
2.66 |
|
|
|
18,043,686 |
|
|
|
3.13 |
|
| Savings |
|
|
3,143,880 |
|
|
|
0.68 |
|
|
|
2,584,761 |
|
|
|
0.57 |
|
| Time |
|
|
11,410,274 |
|
|
|
3.92 |
|
|
|
8,389,472 |
|
|
|
4.50 |
|
| Total deposits |
|
$ |
44,859,162 |
|
|
|
|
|
|
$ |
37,634,453 |
|
|
|
|
|
| |
|
Nine Months Ended September 30, |
|
| |
|
2025 |
|
|
2024 |
|
| (Dollars in thousands) |
|
Average
Amount |
|
|
Average
Rate |
|
|
Average
Amount |
|
|
Average
Rate |
|
| Noninterest bearing demand deposits |
|
$ |
8,964,440 |
|
|
|
— |
% |
|
$ |
8,814,668 |
|
|
|
— |
% |
| Interest bearing demand deposits |
|
|
19,500,598 |
|
|
|
2.68 |
|
|
|
18,703,458 |
|
|
|
3.13 |
|
| Savings |
|
|
2,801,111 |
|
|
|
0.61 |
|
|
|
2,644,193 |
|
|
|
0.57 |
|
| Time |
|
|
10,453,707 |
|
|
|
3.99 |
|
|
|
7,888,094 |
|
|
|
4.48 |
|
| Total deposits |
|
$ |
41,719,856 |
|
|
|
|
|
|
$ |
38,050,413 |
|
|
|
|
|
Uninsured deposits are defined as the portion of deposit accounts in U.S. offices that exceed the FDIC insurance limit and amounts in any other
uninsured investment or deposit account that are classified as deposits and are not subject to any federal or state deposit insurance regimes. The uninsured portion of public funds owned by municipal and state government entities are collateralized by
the Company with investment securities and custodial letters of credit from the FHLB of Dallas. The following table segregates our deposits by deposit insurance categories.
TABLE 27—ESTIMATED TOTAL INSURED AND UNINSURED DEPOSITS
| (In thousands) |
|
September 30, 2025 |
|
|
December 31, 2024 |
|
| FDIC insured |
|
$ |
27,585,387 |
|
|
$ |
25,840,309 |
|
| Collateralized (uninsured) |
|
|
4,210,051 |
|
|
|
3,901,677 |
|
| Uninsured (excluding collateralized) |
|
|
12,126,018 |
|
|
|
10,754,215 |
|
| Total deposits |
|
$ |
43,921,456 |
|
|
$ |
40,496,201 |
|
The Company’s estimated uninsured time deposits at September 30, 2025 had maturities as follows:
TABLE 28—MATURITY OF UNINSURED TIME DEPOSITS
| (In thousands) |
|
Amount |
|
| Three months or less |
|
$ |
701,541 |
|
| Over three months through six months |
|
|
579,909 |
|
| Over six months through twelve months |
|
|
573,440 |
|
| Over twelve months |
|
|
93,961 |
|
| Total |
|
$ |
1,948,851 |
|
Borrowings
Short-term Borrowings
The Company has several types of available short-term borrowing arrangements including Federal funds purchased, securities sold under agreements to
repurchase, short-term FHLB borrowings and the Federal Reserve discount window. Federal funds purchased are unsecured lines, while the rest of these types of borrowings are collateralized by investment securities and loans. At September 30, 2025 and
December 31, 2024, the Company had total short-term borrowings of $954.5 million with a weighted average interest rate of 4.16% and $23.6 million with a weighted average interest rate of 4.10%, respectively. Cadence’s BTFP borrowing was paid off during
the fourth quarter of 2024. See Note 6 to the Company’s consolidated financial statements for additional details.
Long-term Borrowings
During the nine months ended September 30, 2025, the Company entered into $1.3 billion of long-term advances from FHLB of Dallas with various
interest rates ranging from 3.897% to 4.219% with maturities beginning in October 2026 through April 2027. In addition, the Company assumed $12.4 million of junior subordinated debt included in the FCB acquisition. All the FCB subordinated debt assumed
as well as the $10.0 million of 5.000% fixed to floating rate subordinated notes were paid off in June 2025. The following is a summary of our long-term borrowings at the dates indicated:
TABLE 29—LONG-TERM BORROWINGS
| (In thousands) |
|
September 30, 2025 |
|
|
December 31, 2024 |
|
| Advances from FHLB of Dallas |
|
$ |
1,330,657 |
|
|
$ |
706 |
|
| 5.000% fixed to floating rate, subordinated notes, due June 30, 2030, callable on June 30, 2025 |
|
|
— |
|
|
|
10,000 |
|
| Total subordinated and long-term borrowings |
|
$ |
1,330,657 |
|
|
$ |
10,706 |
|
Under the terms of the blanket floating lien security agreement with FHLB of Dallas, the Company is required to maintain sufficient collateral to
secure borrowings. At September 30, 2025, the remaining borrowing availability totaled $11.5 billion. At September 30, 2025, there were no call features on long-term FHLB borrowings. See Note 6 to the Company’s consolidated financial statements for
additional details.
Liquidity and Capital Resources
Liquidity
One of the Company's goals is to maintain adequate funds to meet increases in loan demand or any potential increase in the normal level of deposit
withdrawals. This goal is accomplished primarily by generating cash from the Company’s operating activities and maintaining sufficient short-term liquid assets. These sources, coupled with a stable core deposit base and a historical experience in the
capital markets, allow the Company to fund earning assets and maintain the availability of funds. Management believes that the Company’s traditional sources of maturing loans and investment securities, sales of loans held for sale, cash from operating
activities and a strong base of core deposits are adequate to meet the Company’s liquidity needs for normal operations over both the short-term and the long-term.
The following table summarizes the Company’s cash and cash equivalents as of the following dates:
TABLE 30—CASH AND CASH EQUIVALENTS
| (Dollars in thousands) |
|
September 30, 2025 |
|
|
December 31, 2024 |
|
| Cash and cash equivalents |
|
$ |
1,889,173 |
|
|
$ |
1,731,576 |
|
| Cash and cash equivalents as a percentage of: |
|
|
|
|
|
|
|
|
| Loans and lease, net |
|
|
5.1 |
% |
|
|
5.1 |
% |
| Total earning assets |
|
|
4.0 |
|
|
|
4.1 |
|
| Total assets |
|
|
3.5 |
|
|
|
3.7 |
|
| Total deposits |
|
|
4.3 |
|
|
|
4.3 |
|
| Total uninsured deposits |
|
|
11.6 |
|
|
|
11.8 |
|
To provide additional liquidity as needed, the Company utilizes short-term financing through the purchase of federal funds, securities sold under
agreements to repurchase, borrowings at the FHLB and through the Federal Reserve discount window.
The Company had the following sources of contingent liquidity available at September 30, 2025:
TABLE 31—CASH AND SOURCES OF CONTINGENT LIQUIDITY
| (In thousands) |
|
Amount |
|
| Cash and cash equivalents |
|
$ |
1,889,173 |
|
| Unpledged investment securities (at par) (1) |
|
|
4,927,561 |
|
| Secured lines of credit availability at the FHLB and Federal Reserve |
|
|
13,290,021 |
|
| Unsecured Federal funds lines availability |
|
|
2,139,000 |
|
| Total |
|
$ |
22,245,755 |
|
|
(1) |
The fair value of unpledged investment securities was $4.7 billion at September 30, 2025. |
At September 30, 2025, the Company had irrevocable letters of credit issued by the FHLB totaling $47.5 million which were used on behalf of the
Company’s customers.
The ability of the Company to obtain funding from these or other sources could be negatively affected should the Company experience a substantial
deterioration in its financial condition or its debt rating or should the availability of shortterm funding become restricted as a result of the disruption in the financial markets. Management does not anticipate any short- or long-term changes to its
liquidity strategies and believes that the Company has ample sources to meet any liquidity challenges that may arise. The Company has sound and robust risk management practices that include an active ALCO to analyze and manage the Company’s liquidity
and IRR (See - Quantitative and Qualitative Disclosures About Market Risk).
Other Liquidity Considerations
The Company’s operating lease obligations represent short and long-term operating lease and rental payments for facilities, certain software and
data processing and other equipment. Purchase obligations represent obligations to purchase goods and services that are legally binding and enforceable on the Company and that specify all significant terms, including: fixed or minimum quantities to be
purchased; fixed, minimum or variable price provisions; and the approximate timing of the transaction.
In the ordinary course of business, the Company enters into various off-balance sheet commitments and other arrangements to extend credit that are
not reflected on the consolidated balance sheets of the Company. The business purpose of these off-balance sheet commitments is the routine extension of credit. The Company also faces the risk of deteriorating credit quality of borrowers to whom a
commitment to extend credit has been made; however, no significant credit losses are expected from these commitments and arrangements. At September 30, 2025, letters of credit totaled $423.5 million and unfunded extensions of credit totaled $9.2
billion (see Note 16 to the consolidated financial statement for more information). At September 30, 2025, the Company maintained a reserve for unfunded commitments of $11.6 million included in other liabilities.
Cash Flow Sources and Uses
Cash equivalents include cash and amounts due from banks, including interest bearing deposits with other banks. At September 30, 2025, cash and
cash equivalents totaled $1.9 billion compared to $1.7 billion at December 31, 2024. The ratio of cash and cash equivalents to total assets was 3.5% at September 30, 2025 compared to 3.7% at December 31, 2024.
During the nine months ended September 30, 2025, operating activities provided $526.3 million in cash, investing activities used $1.0 billion in
cash, and financing activities provided $657.4 million in cash. Primary uses of funds in investing activities during the nine months ended September 30, 2025 were net funding of loans of $1.7 billion, somewhat offset by the acquisition of cash from FCB
and IBS of $503.8 million. These items were partially offset by proceeds from maturities, calls and payments of AFS securities of $1.0 billion and proceeds from sales of AFS of $3.1 billion. During the nine months ended September 30, 2025, financing
activities provided $657.4 million, which primarily resulted from proceeds of $1.4 billion in long-term FHLB advances and of $825.0 million in short-term FHLB advances. These items were partially offset by a decrease of $1.4 billion in deposits and
common and preferred stock dividends of $162.5 million.
Regulatory Capital
Regulatory capital at September 30, 2025 and December 31, 2024 was calculated in accordance with standards established by the federal banking
agencies as well as the interagency final rule published on September 30, 2020 entitled “Revised Transition of the Current Expected Credit Losses Methodology for Allowances.” Failure to meet minimum capital requirements can initiate certain mandatory
and possibly additional discretionary actions by regulators that, if undertaken, could have a direct material adverse effect on the Company’s consolidated financial statements. Under capital adequacy guidelines and the regulatory framework for prompt
corrective action, the Company must meet specific capital guidelines that involve quantitative measures of the Company’s assets, liabilities and certain off-balance sheet items as calculated under regulatory accounting practices. The Company’s capital
amounts and classification are also subject to qualitative judgments by regulators about components, risk weightings and other factors. Quantitative measures are established by regulation to ensure capital adequacy and require the Company to maintain
minimum capital amounts and ratios.
Additionally, regulatory capital rules include a capital conservation buffer of 2.5% which the Company must maintain on top of its minimum
risk-based capital requirements. This buffer applies to all three risk-based capital measurements (CET1, Tier 1 and total capital to risk-weighted assets). A financial institution with a conservation buffer of less than the required amount is subject
to limitations on capital distributions, including dividend payments and stock repurchases, and certain discretionary bonus payments to executive officers.
Capital amounts and ratios for the Company at September 30, 2025 and December 31, 2024, are presented in the following table and as shown, exceed
the thresholds necessary to be considered “well capitalized.” Management believes that no events or changes have occurred subsequent to the indicated dates that would change this designation.
TABLE 32—REGULATORY CAPITAL
| |
|
September 30, 2025 |
|
|
December 31, 2024 |
|
| (Dollars in thousands) |
|
Amount |
|
|
Ratio |
|
|
Amount |
|
|
Ratio |
|
| Common equity Tier 1 capital (to risk-weighted assets) |
|
$ |
4,772,204 |
|
|
|
11.51 |
% |
|
$ |
4,693,487 |
|
|
|
12.35 |
% |
| Tier 1 capital (to risk-weighted assets) |
|
|
4,939,197 |
|
|
|
11.91 |
|
|
|
4,860,480 |
|
|
|
12.79 |
|
| Total capital (to risk-weighted assets) |
|
|
5,429,072 |
|
|
|
13.09 |
|
|
|
5,306,647 |
|
|
|
13.97 |
|
| Tier 1 leverage capital (to average assets) |
|
|
4,939,197 |
|
|
|
9.24 |
|
|
|
4,860,480 |
|
|
|
10.41 |
|
Uses of Capital
Subject to pre-approval from the Federal Reserve and MDBCF, the Company may pursue acquisitions of depository institutions and businesses closely
related to banking that further the Company’s business strategies. Management anticipates that consideration for any transactions would include shares of the Company’s common stock, cash or a combination thereof.
On April 25, 2025, the Company announced a share repurchase program whereby the Company may acquire up to an aggregate of 10,000,000 shares of its
common stock. The share repurchase program became effective on May 28, 2025, and will expire on December 31, 2025. Under the share repurchase program, shares of the Company’s common stock may be purchased periodically in open market transactions at
prevailing market prices, in privately negotiated transactions, or by other means in accordance with federal securities laws. Repurchased shares are held as authorized but unissued shares available for use in connection with the Company’s stock
compensation programs, other transactions, or for other corporate purposes as determined by the Company’s Board of Directors. Through September 30, 2025, the Company did not repurchase any shares under this program.
On May 1, 2025, the Company completed the merger with FCB Financial Corp., the bank holding company for FCB (collectively referred to as “First
Chatham”). Under the terms of the definitive merger agreement, the Company issued approximately 2.3 million shares of common stock plus $23.1 million in cash for all outstanding shares of First Chatham. See Note 2 to the Company’s consolidated
financial statements for additional details.
On July 1, 2025, the Company completed its acquisition of IBS, the bank holding company for Bank of Brenham, Citizens State Bank, Fayetteville
Bank, Industry State Bank, The First National Bank of Bellville and The First National Bank of Shiner (collectively, the “Industry Banks”). Under the terms of the IBS Merger Agreement, IBS and the Industry Banks were merged with and into the Company
with the Company being the surviving entity. The Company paid $20 million in cash to IBS’s shareholders. See Note 2 to the Company’s consolidated financial statements for additional details.
During the first quarter of 2025, the Company increased the common stock dividend to $0.275 per share. Additionally, during the second quarter of
2025 the Company paid a special cash dividend of $0.34375 per share of preferred stock.
Impact of Inflation
The consolidated financial statements and related consolidated financial data presented herein have been prepared in accordance with GAAP and
practices within the banking industry which require the measurement of financial position and operating results in terms of historical dollars without considering the changes in the relative purchasing power of money over time due to inflation. The
effect of inflation on a financial institution differs from the effect on other types of businesses. While a financial institution’s operating expenses are affected by general inflation, the asset and liability structure of a financial institution
consists largely of monetary items. Monetary items, such as cash, investments, loans, deposits, and borrowings, are those assets and liabilities which are or will be converted into a fixed number of dollars regardless of changes in prices. As a result,
changes in interest rates can be more impactful to a financial institution’s performance than general inflation. Inflation may also have impacts on the Company’s customers, businesses and consumers and their ability or willingness to invest, save or
spend, and perhaps on their ability to repay loans. As such, there would likely be impacts on the general appetite for banking products and the credit health to the Company’s customers. See Part 1, Item 1.A., Risk Factors, of the Company’s Annual
Report on Form 10-K for the year ended December 31, 2024, for additional information regarding the risks of inflation.
Certain Litigation and Other Contingencies
The nature of the Company’s business ordinarily results in certain types of claims, litigation, investigations, and other legal or administrative
cases and proceedings. Although the Company and its subsidiaries have policies and procedures to minimize legal noncompliance and the impact of claims and other proceedings and endeavored to procure reasonable amounts of insurance coverage, litigation
and regulatory actions present an ongoing risk.
The Company and its subsidiaries engage in lines of business that are heavily regulated and involve a large volume of actual or potential financial
transactions with customers or applicants, and the Company is a public company with a large number of shareholders. From time to time, applicants, borrowers, customers, shareholders, former employees, service providers, and other third parties have
brought actions against the Company or its subsidiaries, in cases claiming substantial damages. Financial services companies are subject to risks arising from changing regulatory frameworks or expectations, regulatory investigations, class action
litigation, and, from time to time, the Company and its subsidiaries have such actions brought against them. The Company and its subsidiaries are also subject to enforcement actions by federal or state regulators, including the Federal Reserve, the
CFPB, the DOJ, state attorneys general, and the MDBCF, which may be adversely impacted by ongoing litigation in which the Company is involved. Additionally, the Company is, and management expects it to be, engaged in a number of foreclosure proceedings
and other collection actions as part of its lending and leasing collections activities, which, from time to time, have resulted in counterclaims against the Company and its subsidiaries. Various legal proceedings have and may arise in the future out of
claims against entities to which the Company is a successor as a result of business combinations.
When and as the Company determines it has meritorious defenses to the claims asserted, it vigorously defends against such claims. The Company will
consider settlement of claims when, in management’s judgment and in consultation with counsel, it is in the best interests of the Company to do so.
The Company cannot predict with certainty the cost of defense, the cost of prosecution, or the ultimate outcome of litigation or other proceedings
filed by or against it, its subsidiaries and its directors, management or employees, including remedies or damage awards. On at least a quarterly basis, the Company assesses its liabilities and contingencies in connection with outstanding legal
proceedings as well as certain threatened claims (which are not considered incidental to the ordinary conduct of the Company’s business) utilizing the latest and most reliable information available. For matters where a loss is not probable or the
amount of the loss cannot be estimated, the Company will not accrue. For matters where it is probable the Company will incur a loss and the amount can be reasonably estimated, the Company establishes an accrual for the loss. Once established, the
accrual is adjusted periodically to reflect any relevant developments. The actual cost of any such matters, however, may turn out to be substantially higher than the amount accrued. Further, the Company’s insurance policies have deductibles and
coverage limits, and such policies are unlikely to cover all costs and expenses related to the defense or prosecution of such legal proceedings or any losses arising therefrom.
Although the final outcome of any legal proceedings is inherently uncertain, based on the information available, advice of counsel and available
insurance coverage, if applicable, management believes that the litigation-related liability of $0.3 million accrued at September 30, 2025 is adequate and that any incremental change in potential liability arising from the Company’s legal proceedings
and threatened claims, including the matters described herein and those otherwise arising in the ordinary course of business, will not have a material adverse effect on the Company’s business or consolidated results of operations or financial
condition. It is possible, however, that future developments could result in an unfavorable outcome for, or resolution of any one or more of the legal proceedings in which the Company or its subsidiaries are defendants, which may be material to the
Company’s business or consolidated results of operations or financial condition for a particular fiscal period or periods.
Recent Pronouncements
Refer to Note 1 “Summary of Significant Accounting Policies” in the consolidated financial statements for a discussion of accounting standards
currently effective for 2025 and relevant accounting standards that have been issued but are not currently effective.
CRITICAL ACCOUNTING ESTIMATES
During the three months ended September 30, 2025, there were no material changes in the Company’s critical accounting policies and no significant
changes in the application of critical accounting policies as presented in the Company’s Annual Report on Form 10-K for the year ended December 31, 2024.
The consolidated financial statements have been prepared in conformity with GAAP and practices within the banking industry which require management
to make estimates and assumptions about future events. Estimates are based on historical experience and on various other assumptions that are believed to be reasonable under the circumstances, and the resulting estimates form the basis for making
judgments about the carrying values of certain assets and liabilities not readily apparent from other sources. Actual results could differ significantly from those estimates.
ITEM 3. QUANTITATIVE AND QUALITATIVE DISCLOSURES ABOUT MARKET RISK.
Interest Rate Risk Management
Market risk reflects the risk of economic loss resulting from changes in interest rates and other relevant market prices. This risk of loss can be
reflected in either reduced potential net interest revenue in future periods or diminished market values of financial assets. The Company’s market risk arises primarily from IRR that is inherent in its lending, investment and deposit taking activities.
The main causes of IRR are the differing structural characteristics of our assets, liabilities and off-balance sheet obligations and their
cumulative net reaction to changing interest rates. These structural characteristics include timing differences in maturity or repricing and the effect of embedded options such as loan prepayments, securities prepayments and calls, interest rate caps,
floors, collars, and deposit withdrawal options. In addition to these sources of IRR, basis risk results from differences in the spreads between various market interest rates and changes in the slope of the yield curve can contribute to additional IRR.
We evaluate IRR and develop guidelines regarding balance sheet composition and re-pricing, funding sources and pricing, and off-balance sheet
commitments that aim to moderate IRR. We use financial simulation models that reflect various interest rate scenarios and the related impact on NII and EVE over specified periods of time. NII is a shorter-term indicator while EVE is a longer-term
indicator of IRR. We refer to this process as ALM.
The primary objective of ALM is to manage IRR within a desired risk tolerance for potential fluctuations in NII and EVE throughout different
interest rate cycles, which we aim to achieve through management of interest rate sensitive earning assets and liabilities. In general, we seek to maintain a desired risk tolerance with asset and liability balances within maturity and repricing
characteristics to limit our exposure to acceptable earnings volatility and changes in the value of assets and liabilities as interest rates fluctuate over time. Adjustments to maturity categories can be accomplished either by lengthening or shortening
the duration of an individual asset or liability category, or externally with interest rate derivative contracts, such as interest rate swaps, caps, collars, and floors. See “—Interest Rate Exposure” below for a more detailed discussion of our various
derivative positions.
Our ALM strategy is formulated and monitored by our ALCO in accordance with policies approved by the Board of Directors. ALCO meets regularly to
review, among other things, the sensitivity of our assets and liabilities to interest rate changes, the book and market values of assets and liabilities, unrealized gains and losses, recent purchase and sale activity, maturities of securities and
borrowings, and projected future transactions. ALCO also establishes and approves pricing and funding strategies with respect to overall asset and liability composition. ALCO reports regularly to our Risk Committee of the Board of Directors.
Financial simulation models are the primary tools we use to measure IRR exposures. These simulation models incorporate all of our earning assets
and liabilities. By examining a range of hypothetical deterministic interest rate scenarios, these models provide management with information regarding the potential impact on NII and EVE caused by changes in interest rates.
The models simulate the cash flows and accounting accruals generated by the financial instruments on our balance sheet, as well as the cash flows
generated by the new business that we anticipate over a 60-month forecast horizon. However, past the 36-month mark, the growth of the balances is static in the forecast. Numerous assumptions are made in the modeling process, including balance sheet
composition, re-pricing, a combination of market data and internal historical experiences, and maturity characteristics of existing and new business. These assumptions are reviewed regularly. Additionally, loan and investment prepayments, administered
rate account elasticity, and other option risks are considered as well as the uncertainty surrounding future customer behavior. Because our modeling is limited by the predictive power of historical data and current assumptions, and because our balance
sheet will be actively managed in the event of a change in interest rates, simulation results, including those discussed in “—Interest Rate Exposure” immediately below, are not intended as a forecast of the actual effect of a change in market interest
rates on our NII or EVE, or indicative of management’s expectations of actual results in the event of a fluctuation in market interest rates; however, these results are used to help measure the potential risks related to IRR.
Interest Rate Exposure
Based upon the current interest rate environment at September 30, 2025, our simulation model projects our sensitivity to an instantaneous increase
or decrease in interest rates over a one-year period as follows:
TABLE 33—INTEREST RATE SENSITIVITY
| |
|
Increase (Decrease) |
|
| (Dollars in millions) |
|
Net Interest Income |
|
|
Economic Value of Equity |
|
| Change (in Basis Points) in Interest Rates (12-Month Projection) |
|
Amount |
|
|
Percent |
|
|
Amount |
|
|
Percent |
|
| + 200 BP |
|
$ |
55 |
|
|
|
3.1 |
% |
|
$ |
(1,016 |
) |
|
|
(12.2 |
)% |
| + 100 BP |
|
|
30 |
|
|
|
1.7 |
|
|
|
(484 |
) |
|
|
(5.8 |
) |
| - 100 BP |
|
|
(38 |
) |
|
|
(2.2 |
) |
|
|
359 |
|
|
|
4.3 |
|
| - 200 BP |
|
|
(89 |
) |
|
|
(5.1 |
) |
|
|
522 |
|
|
|
6.2 |
|
Both the NII and EVE simulations include assumptions regarding balances, asset prepayment speeds, deposit and borrowings repricing and runoff and
interest rate relationships among balances that management believes to be reasonable for the various interest rate environments. Differences in actual occurrences from these assumptions may change our market risk exposure.
See “Table 15 – Maturity Distribution of AFS Securities” showing the maturities and weighted average yields for the carrying value of the AFS
securities as of September 30, 2025, and “Table 18 – Interest Rate Sensitivity of Loans and Leases” showing the maturity distribution based on remaining maturities of the Company’s loan and lease portfolio and the interest rate sensitivity of the
Company’s loans and leases maturing after one year at September 30, 2025.
Derivative Positions
Overview. Our Board of Directors has authorized the ALCO to utilize financial futures, forward sales, options, interest rate swaps,
caps, collars, and floors, and other instruments to the extent appropriate, in accordance with regulations and our internal policy. From time to time, we expect to use interest rate swaps, caps, collars, and floors as macro hedges against inherent rate
sensitivity in our assets and our liabilities to synthetically alter the maturities or re-pricing characteristics of assets or liabilities to reduce imbalances.
We currently engage in only the following types of hedges: (1) those which enable us to transfer the IRR exposure involved in our daily business
activities; and (2) those which serve to alter the market risk inherent in our investment portfolio, mortgage pipeline, MSR, or liabilities and thus help us to manage earnings and market value volatility within approved risk tolerances.
The following is a discussion of our current derivative positions related to IRR.
Interest Rate Lock Commitments. In the ordinary course of business, the Company enters into certain commitments with customers in connection
with residential mortgage loan applications for loans the Company intends to sell. Such commitments are considered derivatives under current accounting guidance and are required to be recorded at fair value. The change in fair value of these
instruments is reflected currently in the mortgage banking revenue of the consolidated statements of income. The fair value of these derivatives is recorded on the consolidated balance sheets in other assets and other liabilities.
Forward Sales Commitments. The Company enters into forward sales commitments of MBS with investors to mitigate the effect of the IRR
inherent in providing interest rate lock commitments to customers. During the period from commitment date to closing date, the Company is subject to the risk that market rates of interest may change. In an effort to mitigate such risk, forward delivery
sales commitments, under which the Company agrees to deliver certain MBS, are established. These commitments are non-hedging derivatives in accordance with current accounting guidance and recorded at fair value, with changes in fair value reflected
currently in the mortgage banking revenue of the consolidated statements of income. The fair value of these derivatives is recorded on the consolidated balance sheets in other assets and other liabilities.
Mortgage Servicing Right Hedges. The value of our MSR is dependent on changes in market interest rates. In order to mitigate the effects of
changes in rates on the value of our MSR, the Company has used various instruments (including but not limited to Treasury options, Treasury, SOFR and TBA futures and forwards, swap futures, etc.) as economic hedges.
Agreements Not Designated as Hedging Derivatives. The Company enters into interest rate swap, floor, cap and collar agreements on commercial
loans with customers to meet the financing needs and IRR management needs of its customers. At the same time, the Company enters into offsetting interest rate swap agreements with a financial institution in order to minimize the Company’s IRR. These
interest rate agreements are non-hedging derivatives and are recorded at fair value with changes in fair value reflected in noninterest income. The fair value of these derivatives is recorded on the consolidated balance sheets in other assets and other
liabilities.
See Note 15 to the consolidated financial statements for additional information regarding our derivative financial instruments.
ITEM 4. CONTROLS AND PROCEDURES.
CONCLUSION REGARDING THE EFFECTIVENESS OF DISCLOSURE CONTROLS AND PROCEDURES
The Company, with the participation of its management, including the Company’s CEO and CFO, carried out an evaluation of the effectiveness of the
design and operation of its disclosure controls and procedures (as defined in Rules 13a-15(e) and 15d-15(e) under the Exchange Act) as of the end of the period covered by this Report.
Based upon that evaluation, and as of the end of the period covered by this Report, the Company’s CEO and CFO concluded that the Company’s
disclosure controls and procedures were effective in ensuring that information required to be disclosed in its reports that the Company files or submits to the Federal Reserve under the Exchange Act is recorded, processed, summarized and reported on a
timely basis, and to ensure that such information is accumulated and communicated to the Company’s management, including its CEO and CFO, as appropriate, to allow timely decisions regarding required disclosures.
CHANGES IN INTERNAL CONTROL OVER FINANCIAL REPORTING
The Company is working to integrate FCB and IBS into its overall internal control over financial reporting processes. Except for changes made in
connection with this integration of FCB and IBS, there have been no changes in the Company’s internal control over financial reporting that occurred during the three months ended September 30, 2025, covered by this Report that materially affected, or
are reasonably likely to materially affect, the Company’s internal control over financial reporting.
PART II—OTHER INFORMATION
Item 1. Legal Proceedings.
The information in response to this item is incorporated herein by reference to “Note 16 - Commitments and Contingent Liabilities” in the notes to
unaudited consolidated financial statements included in Part I., Item 1. “Financial Statements” of this Report. Also, see Part I. Item II. “Financial Condition - Certain Litigation and Other Contingencies.”
Item 1A. Risk Factors.
There have been no material changes to our risk factors previously disclosed under Part I, Item 1A. of our Annual Report on Form 10-K for the year
ended December 31, 2024.
Item 2. Unregistered Sales of Equity Securities and Use of Proceeds.
During the period commencing January 1, 2025 and ending September 30, 2025, the Company issued 1,021,299 RSUs and issued 264,729 PSUs under the
2025 Long-Term Incentive Plan to eligible directors, officers, and employees of the Company for services rendered to the Company. The Company did not receive any cash consideration in connection with these grants, and these securities were exempt from
registration under the Securities Act of 1933, as amended, pursuant to Section (3)(a)(2) thereof because the sales involved securities issued by a bank.
On April 25, 2025, the Company announced a share repurchase program whereby the Company may acquire up to an aggregate of 10,000,000 shares of its
common stock. The share repurchase program became effective on May 28, 2025, and will expire on December 31, 2025. Under the share repurchase program, Cadence's shares may be purchased periodically in open market transactions at prevailing market
prices, in privately negotiated transactions, or by other means in accordance with federal securities laws. Repurchased shares are held as authorized but unissued shares available for use in connection with the Company’s stock compensation programs,
other transactions, or for other corporate purposes as determined by the Company’s Board of Directors. Through September 30, 2025, the Company did not repurchase any shares under this program. There were also no shares redeemed from employees for tax
withholding purposes for stock compensation during the period.
Item 3. Defaults Upon Senior Securities.
None.
Item 4. Mine Safety Disclosures.
None.
Item 5. Other Information.
Pursuant to Item 408(a) of Regulation S-K, none of the Company's directors or executive officers adopted, terminated or modified a Rule 10b5-1
trading arrangement or a non-Rule 10b5-1 trading arrangement during the three months ended September 30, 2025.
Item 6. Exhibits.
| (2.1) |
|
Agreement and Plan of Merger, dated as of October 26, 2025, by and among Huntington Bancshares Incorporated, The Huntington
National Bank and Cadence Bank (Filed as Exhibit 2.1 to the Company’s Current Report on Form 8-K filed with the Board of Governors of the Federal Reserve System on October 30, 2025 and incorporated herein by reference thereto). |
| |
|
|
| (3) |
|
|
| |
a) |
Second Amended and Restated Articles of Incorporation of the Company. (Filed as Exhibit 3.1 to the Company’s Current Report on Form 8-K filed
with the Board of Governors of the Federal Reserve System on January 3, 2025 and incorporated herein by reference thereto). |
| |
b) |
Second Amended and Restated Bylaws of the Company. (Filed as Exhibit 3.2 to the Company’s Current Report on Form 8-K filed with the Board of
Governors of the Federal Reserve System on January 3, 2025 and incorporated herein by reference thereto). |
| |
|
|
| (31.1) |
|
Certification of the Chief Executive Officer of Cadence Bank pursuant to Rule 13a-14 or 15d-14 of the Securities Exchange Act of 1934, as
amended, as adopted pursuant to Section 302 of the Sarbanes-Oxley Act of 2002.* |
| |
|
|
| (31.2) |
|
Certification of the Chief Financial Officer of Cadence Bank pursuant to Rule 13a-14 or 15d-14 of the Securities Exchange Act of 1934, as
amended, as adopted pursuant to Section 302 of the Sarbanes-Oxley Act of 2002.* |
| |
|
|
| (32.1) |
|
Certification of the Chief Executive Officer of Cadence Bank pursuant to 18 U.S.C. Section 1350, as adopted pursuant to Section 906 of the
Sarbanes-Oxley Act of 2002.** |
| |
|
|
| (32.2) |
|
Certification of the Chief Financial Officer of Cadence Bank pursuant to 18 U.S.C. Section 1350, as adopted pursuant to Section 906 of the
Sarbanes-Oxley Act of 2002.** |
SIGNATURES
Pursuant to the requirements of Section 13 or 15(d) of the Securities Exchange Act of 1934, the registrant has duly caused this report to be signed on its behalf by the
undersigned, thereunto duly authorized.
| |
CADENCE BANK |
| |
|
|
| DATE: November 7, 2025 |
By: |
/s/ Valerie C. Toalson |
| |
|
Valerie C. Toalson |
| |
|
Chief Financial Officer and President - Banking Services |
EXHIBIT 31.1
CADENCE BANK
CERTIFICATION PURSUANT TO RULE 13a-14 OR 15d-14 OF THE SECURITIES
EXCHANGE ACT OF 1934, AS AMENDED, AS ADOPTED PURSUANT TO
SECTION 302 OF THE SARBANES-OXLEY ACT OF 2002
I, James D. Rollins III, certify that:
|
1. |
I have reviewed this annual report on Form 10-Q (“this report”) of Cadence Bank;
|
|
2. |
Based on my knowledge, this report does not contain any untrue statement of a material fact or omit to state a material fact necessary to make the statements made, in light of the circumstances under which such statements were made, not
misleading with respect to the period covered by this report;
|
|
3. |
Based on my knowledge, the financial statements, and other financial information included in this report, fairly present in all material respects the financial condition, results of operations and cash flows of the registrant as of, and for,
the periods presented in this report;
|
|
4. |
The registrant’s other certifying officer and I are responsible for establishing and maintaining disclosure controls and procedures (as defined in Exchange Act Rules 13a-15(e) and 15d-15(e)) and internal control over financial reporting (as
defined in Exchange Act Rules 13a-15(f) and 15d-15(f)) for the registrant and have:
|
(a) Designed such disclosure controls and procedures, or caused such disclosure controls and procedures to be designed under our supervision, to ensure that material
information relating to the registrant, including its consolidated subsidiaries, is made known to us by others within those entities, particularly during the period in which this report is being prepared;
(b) Designed such internal control over financial reporting, or caused such internal control over financial reporting to be designed under our supervision, to provide
reasonable assurance regarding the reliability of financial reporting and the preparation of financial statements for external purposes in accordance with generally accepted accounting principles;
(c) Evaluated the effectiveness of the registrant’s disclosure controls and procedures and presented in this report our conclusions about the effectiveness of the
disclosure controls and procedures, as of the end of the period covered by this report based on such evaluation; and
(d) Disclosed in this report any change in the registrant’s internal control over financial reporting that occurred during the registrant's most recent fiscal quarter (the
registrant’s fourth fiscal quarter in the case of an annual report) that has materially affected, or is reasonably likely to materially affect, the registrant’s internal control over financial reporting; and
|
5. |
The registrant's other certifying officer and I have disclosed, based on our most recent evaluation of internal control over financial reporting, to the registrant's auditors and the audit committee of the registrant’s Board of Directors (or
persons performing the equivalent functions):
|
(a) All significant deficiencies and material weaknesses in the design or operation of internal control over financial reporting which are reasonably likely to adversely
affect the registrant's ability to record, process, summarize and report financial information; and
(b) Any fraud, whether or not material, that involves management or other employees who have a significant role in the registrant's internal control over financial
reporting.
Date: November 7, 2025
| |
/s/ James D. Rollins III
|
| |
James D. Rollins III
Chief Executive Officer
|
EXHIBIT 31.2
CADENCE BANK
CERTIFICATION PURSUANT TO RULE 13a-14 OR 15d-14 OF THE SECURITIES
EXCHANGE ACT OF 1934, AS AMENDED, AS ADOPTED PURSUANT TO
SECTION 302 OF THE SARBANES-OXLEY ACT OF 2002
I, Valerie C. Toalson, certify that:
|
1. |
I have reviewed this annual report on Form 10-Q (“this report”) of Cadence Bank;
|
|
2. |
Based on my knowledge, this report does not contain any untrue statement of a material fact or omit to state a material fact necessary to make the statements made, in light of the circumstances under which such statements were made, not
misleading with respect to the period covered by this report;
|
|
3. |
Based on my knowledge, the financial statements, and other financial information included in this report, fairly present in all material respects the financial condition, results of operations and cash flows of the registrant as of, and for,
the periods presented in this report;
|
|
4. |
The registrant’s other certifying officer and I are responsible for establishing and maintaining disclosure controls and procedures (as defined in Exchange Act Rules 13a-15(e) and 15d-15(e)) and internal control over financial reporting (as
defined in Exchange Act Rules 13a-15(f) and 15d-15(f)) for the registrant and have:
|
(a) Designed such disclosure controls and procedures, or caused such disclosure controls and procedures to be designed under our supervision, to ensure that material
information relating to the registrant, including its consolidated subsidiaries, is made known to us by others within those entities, particularly during the period in which this report is being prepared;
(b) Designed such internal control over financial reporting, or caused such internal control over financial reporting to be designed under our supervision, to provide
reasonable assurance regarding the reliability of financial reporting and the preparation of financial statements for external purposes in accordance with generally accepted accounting principles;
(c) Evaluated the effectiveness of the registrant’s disclosure controls and procedures and presented in this report our conclusions about the effectiveness of the
disclosure controls and procedures, as of the end of the period covered by this report based on such evaluation; and
(d) Disclosed in this report any change in the registrant’s internal control over financial reporting that occurred during the registrant's most recent fiscal quarter (the
registrant’s fourth fiscal quarter in the case of an annual report) that has materially affected, or is reasonably likely to materially affect, the registrant’s internal control over financial reporting; and
|
5. |
The registrant's other certifying officer and I have disclosed, based on our most recent evaluation of internal control over financial reporting, to the registrant's auditors and the audit committee of the registrant’s Board of Directors (or
persons performing the equivalent functions):
|
(a) All significant deficiencies and material weaknesses in the design or operation of internal control over financial reporting which are reasonably likely to adversely
affect the registrant's ability to record, process, summarize and report financial information; and
(b) Any fraud, whether or not material, that involves management or other employees who have a significant role in the registrant's internal control over financial
reporting.
Date: November 7, 2025
| |
/s/ Valerie C. Toalson
|
| |
Valerie C. Toalson
Chief Financial Officer and
President - Banking Services
(Principal Accounting Officer)
|
EXHIBIT 32.1
CADENCE BANK
CERTIFICATION PURSUANT TO
18 U.S.C. SECTION 1350,
AS ADOPTED PURSUANT TO
SECTION 906 OF THE SARBANES-OXLEY ACT OF 2002
In connection with this annual report on Form 10-Q of Cadence Bank (the “Company”), for the three-months ended
September 30, 2025, as filed with the Board of Governors of the Federal Reserve System on the date hereof (the “Report”), I, James D. Rollins III, Chief Executive Officer of the Company, certify in my capacity as an executive officer of the Company,
pursuant to 18 U.S.C. § 1350, as adopted pursuant to § 906 of the Sarbanes-Oxley Act of 2002, that to my knowledge:
(1) The Report fully complies with the requirements of Section 13(a) or 15(d) of the Securities Exchange Act of 1934, as amended; and
(2) The information contained in the Report fairly presents, in all material respects, the financial condition and results of operations of the Company.
| November 7, 2025 |
/s/ James D. Rollins III
|
| |
James D. Rollins III
|
| |
Chief Executive Officer |
A signed original of this written statement required by Section 906 has been provided to the Company and will be retained by the Company and furnished to the Board of Governors of the Federal Reserve System or its staff upon request.
EXHIBIT 32.2
CADENCE BANK
CERTIFICATION PURSUANT TO
18 U.S.C. SECTION 1350,
AS ADOPTED PURSUANT TO
SECTION 906 OF THE SARBANES-OXLEY ACT OF 2002
In connection with this annual report on Form 10-Q of Cadence Bank (the “Company”), for the three-months ended
September 30, 2025, as filed with the Board of Governors of the Federal Reserve System on the date hereof (the “Report”), I, Valerie C. Toalson, Chief Financial Officer of the Company, certify in my capacity as an executive officer of the Company,
pursuant to 18 U.S.C. § 1350, as adopted pursuant to § 906 of the Sarbanes-Oxley Act of 2002, that to my knowledge:
(1) The Report fully complies with the requirements of Section 13(a) or 15(d) of the Securities Exchange Act of 1934, as amended; and
(2) The information contained in the Report fairly presents, in all material respects, the financial condition and results of operations of the Company.
| November 7, 2025 |
/s/ Valerie C. Toalson
|
| |
Valerie C. Toalson
Chief Financial Officer and
President - Banking Services
(Principal Accounting Officer)
|
A signed original of this written statement required by Section 906 has been provided to the Company and will be retained by the Company and furnished to the Board of Governors of the Federal Reserve System or its staff upon request.
Exhibit 99.5
UNITED STATES
SECURITIES AND EXCHANGE COMMISSION
WASHINGTON, DC 20549
FORM 8-K
CURRENT REPORT PURSUANT TO
SECTION 13 OR 15(d) OF THE
SECURITIES EXCHANGE ACT OF 1934
Date of report (date of earliest event reported): December 30, 2024
CADENCE BANK
(Exact Name of Registrant as Specified in Charter)
|
Mississippi
|
|
11813
|
|
64-0117230
|
| |
|
|
|
|
|
(State or Other Jurisdiction of Incorporation)
|
|
(FDIC Certificate No.)
|
|
(IRS Employer Identification No.)
|
| |
One Mississippi Plaza
201 South Spring Street
Tupelo, Mississippi
|
|
38804 |
|
| |
|
|
|
|
| |
(Address of Principal Executive Offices)
|
|
(Zip Code)
|
|
Registrant’s telephone number, including area code (662) 680-2000
Check the appropriate box below if the Form 8-K filing is intended to simultaneously satisfy the filing obligation of the registrant under any of the following provisions (see General Instruction A.2. below):
| ☐ |
Written communications pursuant to Rule 425 under the Securities Act (17 CFR 230.425)
|
| ☐ |
Soliciting material pursuant to Rule 14a-12 under the Exchange Act (17 CFR 240.14a-12)
|
| ☐ |
Pre-commencement communications pursuant to Rule 14d-2(b) under the Exchange Act (17 CFR 240.14d-2(b))
|
| ☐ |
Pre-commencement communications pursuant to Rule 13e-4(c) under the Exchange Act (17 CFR 240.13e-4(c))
|
Securities registered pursuant to Section 12(b) of the Act:
|
Title of each class
|
|
Trading Symbol(s) |
|
Name of each exchange on which
registered
|
|
|
|
|
|
|
|
| Common Stock, $2.50 par value per share |
|
CADE |
|
New York Stock Exchange |
|
| |
|
|
|
|
|
Series A Preferred Stock, $0.01 par value per share
|
|
CADE-PrA
|
|
New York Stock Exchange |
|
Indicate by check mark whether the registrant is an emerging growth company as defined in Rule 405 of the Securities Act of 1933 (§230.405 of
this chapter) or Rule 12b-2 of the Securities Exchange Act of 1934 (§240.12b-2 of this chapter).
Emerging growth company ☐
If an emerging growth company, indicate by check mark if the registrant has elected not to use the extended transition period for complying with any new or revised
financial accounting standards provided pursuant to Section 13(a) of the Exchange Act. ☐
|
Item 5.03
|
Amendments to Articles of Incorporation or Bylaws; Change in Fiscal Year
|
On December 30, 2024, at a special meeting of shareholders (the “Special Meeting”), the Company’s shareholders approved the Company’s Second Amended and Restated Articles
of Incorporation (the “Articles”) that: (1) effect the amendments to the Company’s Amended and Restated Articles of Incorporation that were approved by the Company’s shareholders at the April 24, 2024 annual meeting of shareholders; (2)
incorporate certain other amendments to align with Title 81 of the Mississippi Code; and (3) expressly authorize the Company’s board of directors (the “Board”) to implement stock repurchases from time to time in accordance with Section
208.5(d)(2) of Regulation H. The Company caused the Articles to be filed with the Mississippi Department of Banking and Consumer Finance (“MDBCF”) on January 3, 2025; the Articles have not yet been declared effective pursuant to Mississippi
law.
The above description is qualified in its entirety by reference to the full text of the Company’s Second Amended and Restated Articles of Incorporation, filed as Exhibit
3.1 to this Current Report on Form 8-K and incorporated herein by reference.
Effective as of December 30, 2024, the Board approved an amendment to the Company’s Second Amended and Restated Bylaws to conform to the Articles, as required by the
MDBCF, to provide additional clarification as to the ability to provide indemnification to directors, officers and certain others.
The above description is qualified in its entirety by reference to the full text of the Company’s Second Amended and Restated
Bylaws, filed as Exhibit 3.2 to this Current Report on Form 8-K and incorporated herein by reference.
|
Item 5.07
|
Submission of Matters to a Vote of Security Holders.
|
At the Special Meeting, shareholders of the Company’s common stock, par value $2.50 per share (the “Common Holders”): (i) approved the Articles
with respect to certain amendments as required by the MDBCF (“Proposal 1”); (ii) approved the Articles with respect to amendments to provide authorization for the Board to implement stock repurchases from time to time in accordance with
Section 208.5(d)(2) of Regulation H, including the two-thirds approval threshold required for effectiveness under Regulation H (“Proposal 2”); and (iii) approved the Cadence Bank 2025 Long-Term Incentive Plan (“Proposal 3”).
In addition, at the Special Meeting, the Common Holders and shareholders of the Company’s Series A Preferred Stock, par value $0.01 per share (the
“Preferred Holders”) approved a proposal (“Proposal 4”) to adjourn the Special Meeting, if necessary, to solicit additional proxies in favor of Proposals 1, 2, or 3. The final voting results on the proposals presented to the Common Holders
and Preferred Holders are provided below.
The proposals presented at the Special Meeting are described in more detail in the Company’s Definitive Proxy Statement on Schedule 14A that was
filed with the Federal Deposit Insurance Corporation on November 19, 2024.
Holders of 146,425,408 shares of the Company’s common stock, or approximately 79.8% of the 183,529,583 shares of common stock that were issued and
outstanding and entitled to vote, and holders of 3,970,348 shares of the Company’s preferred stock, or approximately 57.5% of the 6,900,000 shares of preferred stock that were issued and outstanding and entitled to vote, were present
virtually or represented by proxy at the Special Meeting. Since there were insufficient votes of the Preferred Holders at the time of the Special Meeting to approve Proposal 2 solely with respect to effectiveness under Regulation H, the Board
adjourned the Special Meeting in accordance with Proposal 4 to January 27, 2025 at 3:00 p.m. Central Standard Time to allow for solicitation of additional proxies with respect to the Preferred Holders in favor of Proposal 2. The Company’s
Preferred Holders of record as of the close of business on November 8, 2024 will continue to be entitled to vote on Proposal 2 on January 27, 2025. The reconvened meeting will be held virtually via audio-only format at meetnow.global/MLVC22S.
The following are the final voting results on the proposals acted upon at the Company’s shareholders at the Special Meeting:
Proposal 1: Amendments to Articles as Required by the MDBCF
The Company’s Common Holders approved the proposal to amend the Articles as required by the MDBCF. The table below sets forth the voting results
for Proposal 1:
| For |
Against
|
Abstain
|
Broker Non-Votes |
|
146,254,811
|
64,831
|
105,764
|
—
|
Proposal 2: Amendment to Articles to Permit Stock Repurchases
The Company’s Common Holders approved the proposal to amend the Articles to permit stock repurchases in accordance with Regulation H. The table
below sets forth the voting results for Proposal 2 with respect to the Common Holders only:
For
|
Against |
Abstain |
Broker Non-Votes |
|
146,176,124
|
121,426
|
127,856
|
—
|
As discussed above, the Special Meeting was adjourned to January 27, 2025 to allow for further solicitation of proxies of Preferred Holders in
favor of Proposal 2.
Proposal 3: Cadence Bank 2025 Long-Term Incentive Plan
The Company’s Common Holders approved the Cadence Bank 2025 Long-Term Incentive Plan. The table below sets forth the voting results for Proposal 3:
For
|
Against |
Abstain
|
Broker Non-Votes |
|
141,534,051
|
4,708,219
|
183,137
|
—
|
Proposal 4: Adjournment Proposal
The Company’s Common Holders and Preferred Holders approved the proposal to adjourn the Special Meeting, if necessary, to allow time for further
solicitation of proxies. The table below sets forth the voting results for Proposal 4:
Common Holders:
| For |
Against |
Abstain |
Broker Non-Votes |
|
137,179,109
|
9,102,348
|
143,950
|
—
|
Preferred Holders:
| For |
Against |
Abstain |
Broker Non-Votes |
|
3,571,258
|
356,880
|
42,210
|
—
|
| Item 9.01. |
Financial Statements and Exhibits.
|
|
Exhibit No.
|
Description of Exhibit
|
| |
|
|
3.1
|
Second Amended and Restated Articles of Incorporation of Cadence Bank
|
| |
|
|
3.2
|
Second Amended and Restated Bylaws of Cadence Bank
|
SIGNATURES
Pursuant to the requirements of the Securities Exchange Act of 1934, the Registrant has duly caused this Report to be signed on its behalf by the
undersigned hereunto duly authorized.
|
|
CADENCE BANK
|
| |
|
|
|
By:
|
/s/ Cathy S. Freeman
|
|
|
Cathy S. Freeman
|
|
|
Senior Executive Vice President and Chief
Administrative Officer
|
|
|
|
|
Date: January 3, 2025
|
|
|
Exhibit 3.1
SECOND AMENDED AND RESTATED ARTICLES OF INCORPORATION
OF
CADENCE BANK
Pursuant to the provisions of the Mississippi Code of 1972 (the "Code"), Cadence Bank, a Mississippi banking corporation, hereby amends and restates its Articles
of Incorporation as follows:
1. Name. The name of the corporation is Cadence Bank (the “Bank”).
2. Domicile; Registered Office; Registered Agent. The domicile of the Bank is Lee
County, Tupelo, Mississippi. The street address of the registered office of the Bank is One Mississippi Plaza, 201 South Spring Street, Tupelo, Mississippi 38801. The name of the Bank’s registered agent at this address is E. Payne
Atkinson.
3. Period of Existence. The period for which the corporation is organized is ninety-nine (99) years. However, Miss. Code Ann.
Section 81-3-7(f) provides that the period of existence may be extended for additional periods of ninety-nine (99) years each as set out in Section 81-3-15. The corporation was established on March 31, 1876. Thus, the first
ninety-nine (99) year period expired on March 31, 1975. Pursuant to the aforementioned statutes, the period of existence is extended for a second ninety-nine (99) years, covering the period of March 31, 1975 to March 31, 2074.
4. Purpose. The purpose of the Bank is to engage in the business of a commercial bank, to do all acts and engage in all
activities now, or as hereafter may be, permitted to be done by such a bank (including trust powers), and to engage in any business activity or exercise any power as permitted by law.
5. Authorized Capital. The aggregate number of shares of capital stock the Bank is authorized to issue is (i) five hundred million
(500,000,000) shares of common stock, all one class having a par value of $2.50 per share (the “Common Stock”), and (ii) five hundred million (500,000,000) shares of preferred stock, having a par value of $0.01 per share (the
“Preferred Stock”).
Each share of the Common Stock shall be entitled to one vote on all matters requiring a vote of the shareholders. Subject
to any preferences and rights of any holders of any other class of stock, holders of the Common Stock shall have the right to receive such dividends as may be declared from time to time by the Bank’s Board of Directors and, upon any
liquidation or dissolution of the Bank, shall be entitled to receive the net assets of the Bank. The Board of Directors is hereby expressly vested with the authority to approve the repurchase of any shares of Common Stock, determine the
timing, manner or terms of any such repurchase or establish the methodology for determining any such timing, manner or terms, including by means of one or more share repurchase programs or plans, and determine whether any such
repurchased shares shall be held by the Bank as treasury shares or shall be retired and the consequences thereof.
Shares of the Preferred Stock may be issued from time to time in one or more classes or series by the Bank’s Board of
Directors. The Bank’s Board of Directors is hereby expressly authorized, subject to the limitations provided by law, to amend these Amended and Restated Articles of Incorporation to establish and designate classes or series of the
Preferred Stock, to fix the number of shares constituting each class or series, and to fix the designations and the voting powers, preferences and relative participating, optional or other special rights, and the qualifications,
limitations or restrictions of the shares of each class or series and the variations in the relative powers, rights, preferences and limitations as between or among classes or series, and to increase and to decrease the number of shares
constituting each class or series. The authority of the Board of Directors with respect to any class or series shall include, but shall not be limited to, the authority to fix and determine the following:
(a) The number of shares constituting that class or series and the distinctive designation of that class or series;
(b) The increase and the decrease, to a number not less than the number of the outstanding shares of such class or series, of the number of shares constituting such class
or series as theretofore fixed;
(c) The rate or rates and the time at which dividends on the shares of such class or series shall be paid, and whether or not such dividends shall be cumulative, and, if
such dividends shall be cumulative, the date or dates from and after which they shall accumulate;
(d) Whether or not the shares of such class or series shall be redeemable, and, if such shares shall be redeemable, the terms and conditions of such redemption, including,
but not limited to, the manner of selecting shares of such class or series for redemption, if less than all shares are to be redeemed, the date or dates upon or after which such shares shall be redeemable and the amount per share
which shall be payable upon such redemption, which amount may vary under different conditions and at different redemption dates;
(e) The amount payable on the shares of such class or series in the event of a voluntary or involuntary liquidation, dissolution or winding up of the Bank. A liquidation,
dissolution or winding up of the Bank, as such terms are used in this subparagraph (e), shall not be deemed to be occasioned by or to include any consolidation or merger of the Bank with or into any other entity or entities or a sale,
lease or conveyance of all or a part of the assets of the Bank;
(f) Whether or not the shares of such class or series shall have voting rights and the terms and conditions thereof;
(g) Whether or not a sinking fund or purchase fund shall be provided for the redemption or purchase of the shares of such class or series, and if such a sinking fund or
purchase fund shall be provided, the terms and conditions thereof;
(h) Whether or not the shares of such class or series shall have conversion privileges, and, if such shares shall have conversion privileges, the terms and conditions of
conversion, including but not limited to, any provision for the adjustment of the conversion rate or the conversion price; and
(i) Any other powers, preferences and relative participating, optional, or other special rights, or qualifications, limitations or restrictions thereof, as shall not be
inconsistent with the provisions of this Article 5 or the limitations provided by applicable law.
The Board of Directors is hereby expressly vested with the authority to approve the repurchase or redemptions of shares of
any class or series of Preferred Stock, and determine the timing, manner or terms of any such repurchase or redemption or establish the methodology for determining any such timing, manner or terms, including by means of one or more
share repurchase programs or plans, and determine whether any such shares shall be held by the Bank as treasury shares or shall be retired and the consequences thereof.
6. Shareholders. The names and places of residences of the stockholders and the number of shares held by each of them as required under Miss. Code
Ann. Section 81-3-7(e) is available upon request to the Bank. Such information may be obtained by submitting a request to Cadence Bank, Corporate Secretary, 201 South Spring Street, Tupelo, MS 38804;
CorporateSecretary@cadencebank.com; or 662-680-2000.
7. Board of Directors. The Board of Directors of the Bank shall consist of such number of members not less than nine (9) nor more
than twenty (20), the exact number to be fixed and determined from time to time by resolution of a majority of the entire Board of Directors. The Board of Directors shall be divided into three classes, designated Class I, Class II and
Class III, until the Bank’s annual meeting of shareholders to be held in 2027. Class I directors shall be those elected at the annual meeting of shareholders held in 2024 for a three-year term, and they and any successors shall stand
for re-election at the annual meeting of shareholders to be held in 2027; each Class II director shall serve out his or her current three-year term, and each and any successors shall stand for re-election for a one-year term beginning
at the annual meeting of shareholders in 2026; each Class III director shall be elected at the annual meeting of shareholders to be held in 2025 for a one-year term, and they and any successors shall stand for re-election at the
annual meeting of shareholders to be held in 2026. At each annual meeting of shareholders commencing with the annual meeting of shareholders to be held in 2027, each director shall be elected for a one-year term, and, from that point
forward, each director shall have a one-year term and shall hold office until his or her term expires at the next annual meeting of shareholders and until his or her successor shall have been duly elected and qualified, subject to his
or her earlier death, resignation or removal. So long as the Board of Directors is classified, if the number of directors is changed, any increase or decrease shall be apportioned among the classes in such a manner as the Board of
Directors shall determine so as to maintain the number of directors in each class as nearly equal as possible. If a vacancy occurs on the Board of Directors for any reason, including a vacancy resulting from an increase in the number
of directors, the Board of Directors may fill the vacancy, provided that the Board of Directors may elect instead to (i) not fill the vacancy or (ii) have the vacancy filled by vote of the shareholders at any regular or special
meeting of the shareholders. Shareholders shall have no right to cumulate their votes in the election of directors.
8. Removal of Directors. A director of the Bank may be removed for cause by the affirmative vote of a majority of the entire
Board of Directors of the Bank or by the affirmative vote of a majority of the shareholders. Shareholders also may remove a director of the Bank without cause by the affirmative vote of the holders of not less than sixty-seven (67%)
of the outstanding voting stock of the Bank. For the purposes of this provision, “cause” means final conviction of a felony, unsound mind, conduct prejudicial to the interests of the Bank, or suspension and/or temporary prohibition
from participating in the affairs of the Bank by a notice served under section 8(e)(3) or (g)(1) of the Federal Deposit Insurance Act (12 U.S.C. §§1818(e)(3) and (g)(1)) or other similar law or regulation.
9. Elimination of Certain Liability of Directors. A director of the Bank shall not be held personally liable to the Bank or its
successor, or the shareholders thereof, for monetary damages unless the director or officer acted in a grossly negligent manner or engaged in conduct which demonstrates a greater disregard of the duty of care than gross negligence,
such as intentional tortious conduct or intentional breach of his or her duty of loyalty or intentional commission of corporate waste. For the purposes of this provision, the term "gross negligence" means a reckless disregard of, or a
carelessness amounting to gross indifference to, the best interests of the Bank or the shareholders thereof, and involves a substantial deviation below the standard of care expected to be maintained by a reasonably careful person
under like circumstances. A director of the Bank shall, in the performance of his or her duties, be fully protected in relying in good faith on the records of the Bank and in relying in good faith upon information, opinions, reports
or statements presented to him or her, to the Bank, to the Board of Directors or to any committee thereof by any of the Bank's officers or employees or by any committee of the Board of Directors, or by any counsel, appraiser, engineer
or independent or certified public accountant selected with reasonable care by the Board of Directors or any committee thereof or by any officer having the authority to make such selection or by any other person as to matters the
director in good faith believes are within such selected person's professional or expert competence, such person having been selected in good faith by the Board of Directors or any committee thereof or any officer having the authority
to make such selection. Nothing in this section shall be deemed to eliminate any liability the elimination of which is contrary to the requirements of applicable state and federal banking laws and regulations.
If the Code is amended to authorize corporate action further eliminating or limiting the personal liability of directors,
then the liability of a director of the Bank shall be eliminated or limited to the fullest extent permitted by the Code, as so amended. Any repeal or modification of the provisions of this Article 9 by the shareholders shall not
adversely affect any right or protection of a director of the Bank existing at the time of such repeal or modification.
10. Indemnification. (a) The Bank shall indemnify, and upon request shall advance expenses prior to final disposition of a
proceeding to, any person (or the estate or personal representative of any person) who was or is a party to, or is threatened to be made a party to, any threatened, pending or completed action, suit or proceeding, whether or not by or
in the right of the Bank, and whether civil, criminal, administrative, investigative or otherwise, by reason of the fact that such person is or was a director, officer, employee or agent of the Bank, or is or was serving at the
request of the Bank as a director, officer, partner, trustee, employee or agent of another corporation, partnership, joint venture, trust, employee benefit plan or other enterprise, against any liability incurred in the action, suit
or proceeding: (a) to the full extent permitted by Section 79-4-8.51 of the Code; and (b) despite the fact that such person has not met the standard of conduct set forth in Section 79-48.51(a) of the Code or would be disqualified for
indemnification under Section 79-4-8.51(d) of the Code, if a determination is made by a person or persons enumerated in Section 79-4-8.55(b) of the Code that (i) the director, officer, employee or agent is fairly and reasonably
entitled to indemnification in view of all of the relevant circumstances, and (ii) the acts or omissions of the director, officer, employee or agent did not constitute gross negligence or willful misconduct. A request for
reimbursement or advancement of expenses prior to final disposition of the proceeding need not be accompanied by the affirmation required by Section 79-4-8.53(a)(1) of the Code, but the remaining provisions of Section 79-4-8.53 of the
Code shall be applicable to any such request. The Bank may, to the full extent permitted by law, purchase and maintain insurance on behalf of any such person against any liability which may be asserted against him or her. Nothing in
this section shall be deemed to allow for indemnification for liability resulting from a violation that is prohibited from being indemnified by any provision of Title 81, nor shall any part of this section be construed to allow for
indemnification in contravention of Section 81-5-2 of the Code or Part 359 of Title 12 of the Code of Federal Regulations (12 C.F.R. Part 359).
(b) The rights to indemnification and advancement of expenses set forth in Subsection (a) of this Article 10 are intended to be greater than those which are otherwise
provided for in the Code, are contractual between the Bank and the person being indemnified, and the heirs, executors and administrators of such person, and in this respect are mandatory, notwithstanding a person’s failure to meet the
standard of conduct required for permissive indemnification under the Code, as amended from time to time. The rights to indemnification and advancement of expenses set forth in Subsection (a) of this Article 10 shall not be deemed
exclusive of any other rights to which those seeking indemnification or advancements of expenses may be entitled or granted by law, these Articles of Incorporation, the bylaws, a resolution of the Board of Directors, a vote of the
shareholders of the Bank, or an agreement with the Bank, which means of indemnification and advancement of expenses are hereby specifically authorized. Any repeal or modification of the provisions of this Article 10 shall not affect
any obligations of the Bank or any rights regarding indemnification and advancement of expenses of a director, officer, employee or agent with respect to any threatened, pending or completed action, suit or proceeding for which
indemnification or the advancement of expenses is requested, in which the alleged cause of action accrued at any time prior to such repeal or modification. If an amendment to the Code hereafter limits or restricts in any way the
indemnification rights permitted by law as of the date hereof, such amendment shall apply only to the extent mandated by law and only to activities of persons subject to indemnification under this Article 10 which occur subsequent to
the effective date of such amendment.
(c) If this Article 10 or any portion thereof shall be invalidated on any ground by any court of competent jurisdiction, then the Bank shall nevertheless indemnify each
director, officer, employee or agent of the Bank as to any liability incurred or other amounts paid with respect to any proceeding, including, without limitation, a grand jury proceeding and any proceeding by or in the right of the
Bank, to the fullest extent permitted by any applicable portion of this Article 10 that shall not have been invalidated, by the Code, or by any other applicable law. Unless the context otherwise requires, terms used in this Article 10
shall have the meanings given in Section 79-4-8.50 of the Code.
11. Special Meetings of Shareholders. Special meetings of the shareholders, unless otherwise required by law, may be called at any
time by the Chairman, Chief Executive Officer or Secretary and shall be called by the Chairman, Chief Executive Officer or Secretary at the request in writing of a majority of the Board of Directors or of shareholders owning not less
than twenty percent (20%) of all the shares of capital stock of the Bank issued and outstanding and entitled to vote at such meeting. Such written request must state the purpose or purposes for which the meeting is called and the
person or persons calling the meeting.
12. Action Without Meeting of Shareholders. As permitted by the Code, action required or permitted to be taken at a shareholders'
meeting may be taken without a meeting if the action is evidenced by one or more written consents describing the action taken, signed by at least the same majority of shareholders as would be required to take such action at a meeting
of the shareholders where all the shareholders entitled to vote on such action were present, and delivered to the Bank for inclusion in the minutes or filing with the corporate records.
13. Venue. Unless the Bank consents in writing to the selection of an alternative venue, Lee County, Mississippi, shall be the sole
and exclusive venue for (a) any derivative action or proceeding brought on behalf of the Bank, (b) any action asserting a claim for breach of a fiduciary duty owed by any director, officer, employee or agent of the Bank to the Bank or
the Bank’s shareholders, (c) any action asserting a claim arising pursuant to any provision of Chapter 4 of Title 79 of the Code, Title 81 of the Code, these Articles of Incorporation or the Bylaws of the Bank or (d) any action
asserting a claim governed by the internal affairs doctrine, in each case subject to a court of competent jurisdiction in Lee County, Mississippi having personal jurisdiction over the indispensable parties named as defendants therein.
14. Series A Preferred Stock.
a. Designation. The designation of the series of
the Preferred Stock shall be “5.50% Series A Non-Cumulative Perpetual Preferred Stock” (the “Series A Preferred Stock”). With respect to payment of dividends and rights upon the Bank’s liquidation, dissolution or winding up, the
Series A Preferred Stock shall rank (i) senior to the Common Stock, and any other class or series of the Preferred Stock that, by its terms, ranks junior to the Series A Preferred Stock, (ii) equally with all existing and future class
or series of the Preferred Stock that does not by its terms rank junior or senior to the Series A Preferred Stock, and (iii) junior to all existing and future indebtedness and other liabilities of the Bank and any class or series of
the Preferred Stock that expressly provides in the articles of amendment creating such class or series of the Preferred Stock that it ranks senior to the Series A Preferred Stock (subject to any requisite consents prior to issuance).
b. Number of Shares. The number of authorized
shares of Series A Preferred Stock shall be 6,900,000, which number may, from time to time, be increased (but not in excess of the total number of authorized shares of the Preferred Stock) or decreased (but not below the number of
shares of Series A Preferred Stock then outstanding) by further resolution duly adopted by the Board of Directors (or a duly authorized committee thereof). The Bank may, from time to time, and without notice to, consent of or
additional action by holders of shares of the Series A Preferred Stock, issue additional shares of Series A Preferred Stock, provided that if the additional shares are not fungible for U.S. federal income tax purposes with the initial
shares of such series, the additional shares shall be issued under a separate CUSIP number. The additional shares would form a single series together with all previously issued shares of Series A Preferred Stock.
c. Definitions. As used in this Article 14 with
respect to Series A Preferred Stock:
i. “Business Day” shall mean any
weekday in New York, New York that is not a day on which banking institutions in such city are authorized or required by applicable law, regulation, or executive order to be closed.
ii. “Dividend Payment Dates”
shall have the meaning set forth in Section (d)(ii) of this Article 14.
iii. “Dividend Period” shall mean the period from, and
including, each Dividend Payment Date to, but excluding, the next succeeding Dividend Payment Date except for the initial Dividend Period which shall be the period from, and including, the original issue date to, but excluding, the
next succeeding Dividend Payment Date.
iv. “Junior Stock” shall mean the
Common Stock and any other class or series of the Bank’s capital stock over which the Series A Preferred Stock has preference or priority in the payment of dividends and rights on the liquidation, dissolution or winding up of
the Bank.
v. “Liquidation Preference” shall mean $25.00 per share
of Series A Preferred Stock.
vi. “Nonpayment” shall have the
meaning set forth in Section (g)(ii) of this Article 14.
vii. “Optional Redemption” shall have the meaning set
forth in Section (f)(i) of this Article 14.
viii. “Parity Stock” shall mean any
class or series of the Bank’s capital stock that ranks on par with the Series A Preferred Stock in the payment of dividends and rights on the liquidation, dissolution or winding up of the Bank.
ix. “Preferred Stock Directors” shall have the meaning set
forth in Section (g)(ii) of this Article 14.
x. “Redemption Price” shall have
the meaning set forth in Section(f)(iii) of this Article 14.
xi. “Regulatory Capital Treatment
Event” shall mean a good faith determination by the Board of Directors that, as a result of any (a) amendment to, clarification of, or change (including any announced prospective change) in, the laws or regulations of the
United States or any political subdivision of or in the United States that is enacted or becomes effective after the initial issuance of the Series A Preferred Stock; (b) proposed change in those laws or regulations that is announced or
becomes effective after the initial issuance of the Series A Preferred Stock; or (c) official administrative decision or judicial decision or administrative action or other official pronouncement interpreting or applying those laws or
regulations that is announced or becomes effective after the initial issuance of the Series A Preferred Stock, there is more than an insubstantial risk that the Bank shall not be entitled to treat the full liquidation value of the
Series A Preferred Stock then outstanding as “Tier 1 Capital” (or its equivalent) for purposes of the capital adequacy laws or regulations of the Federal Deposit Insurance Bank (or, as and if applicable, the capital adequacy laws or
regulations of any successor appropriate federal banking agency), as then in effect and applicable, for as long as any share of Series A Preferred Stock is outstanding.
xii. “Regulatory Event Redemption” shall have the meaning
set forth in Section (f)(ii) of this Article 14.
xiii. “Series A Preferred Stock” shall have the meaning set
forth in Section (a) of this Article 14.
xiv. “Voting Parity Stock” shall have the meaning set
forth in Section (g)(ii) of this Article 14.
d. Dividends.
i. Holders of shares of Series A
Preferred Stock shall be entitled to receive, only when, as, and if declared by the Board of Directors (or a duly authorized committee thereof), out of assets legally available under applicable law for payment, non-cumulative
cash dividends based upon the Liquidation Preference, and no more, at a rate equal to 5.50% per annum, for each quarterly Dividend Period occurring from, and including, the original issue date of the shares of Series A Preferred Stock.
ii. When, as, and if declared by
the Board of Directors (or a duly authorized committee thereof), the Bank shall pay cash dividends on the shares of Series A Preferred Stock quarterly, in arrears, on February 20, May 20, August 20 and November 20 of each year
(each such date, a “Dividend Payment Date”), beginning on February 20, 2020, and, when, as and if declared by the Board of Directors (or a duly authorized committee thereof). The Bank shall pay cash dividends to the holders of record of
shares of the Series A Preferred Stock as such holders appear on the Bank’s stock register on the applicable record date, which shall be the fifteenth (15th) calendar day before that Dividend Payment Date or such other record date fixed
by the Board of Directors (or a duly authorized committee thereof) that is not more than sixty (60) nor less than ten (10) calendar days prior to such Dividend Payment Date.
iii. If any Dividend Payment Date
is a day that is not a Business Day, then the dividend with respect to that Dividend Payment Date shall instead be paid on the immediately succeeding Business Day, without interest or other payment in respect of such delayed
payment.
iv. The Bank shall calculate dividends on the shares of
Series A Preferred Stock on the basis of a 360-day year of twelve 30-day months. Dollar amounts resulting from such calculation shall be rounded to the nearest cent, with one-half cent being rounded upward.
v. Dividends on the shares of
Series A Preferred Stock shall not be cumulative or mandatory. If the Board of Directors (or a duly authorized committee thereof) does not declare a dividend on the shares of Series A Preferred Stock or if the Board of
Directors authorizes and the Bank declares less than a full dividend in respect of any Dividend Period, the holders of the shares of Series A Preferred Stock will have no right to receive any dividend or a full dividend, as the case may
be, for the Dividend Period, and the Bank shall have no obligation to pay a dividend or to pay full dividends for that Dividend Period at any time, whether or not dividends on the shares of Series A Preferred Stock or any other series
of the Preferred Stock or Common Stock are declared for any future Dividend Period.
vi. Dividends on the shares of
Series A Preferred Stock shall accrue from the original issue date of the shares of Series A Preferred Stock at the dividend rate on the liquidation preference amount of $25.00 per share. If the Bank issues additional shares of
the Series A Preferred Stock, dividends on those additional shares shall accrue from the original issue date of those additional shares at the dividend rate.
vii. So long as any share of Series
A Preferred Stock remains outstanding:
(1) no dividend shall be declared and paid or set aside for payment and no distribution shall be declared and made or set aside for payment on any Junior
Stock (other than a dividend payable solely in shares of Junior Stock or any dividend in connection with the implementation of a shareholder rights plan or the redemption or repurchase of any rights under such a plan, including with
respect to any successor shareholder rights plan);
(2) no shares of Junior Stock shall be repurchased, redeemed, or otherwise acquired for consideration by the
Bank, directly or indirectly (other than as a result of a reclassification of Junior Stock for or into other Junior Stock, or the exchange for or conversion into Junior Stock, through the use of the proceeds of a substantially
contemporaneous sale of other shares of Junior Stock or pursuant to a contractually binding requirement to buy Junior Stock pursuant to a binding stock repurchase plan existing prior to the most recently completed Dividend Period),
nor shall any monies be paid to or made available for a sinking fund for the redemption of any such securities by the Bank; and
(3) no shares of Parity Stock shall be repurchased, redeemed or otherwise acquired for consideration by the
Bank (other than pursuant to pro rata offers to purchase all, or a pro rata portion, of the shares of Series A Preferred Stock and such Parity Stock, through the use of the proceeds of a substantially contemporaneous sale of other
shares of Parity Stock or Junior Stock, as a result of a reclassification of Parity Stock for or into other Parity Stock, or by conversion into or exchange for Junior Stock),
during a Dividend Period, unless, in each case of subsections (a), (b) and (c) immediately above, the full dividends for
the most recently completed Dividend Period on all outstanding shares of the Series A Preferred Stock have been declared and paid in full or declared and a sum sufficient for the payment of those dividends has been set aside. The
foregoing limitations in subsections (a), (b) and (c) immediately above shall not apply to purchases or acquisitions of the Bank’s Junior Stock pursuant to any employee or director incentive or benefit plan or arrangement (including any
of the Bank’s employment, severance, or consulting agreements) of the Bank or of any of the Bank’s subsidiaries heretofore or hereafter adopted.
viii. Except as provided below, for so long as any share of
Series A Preferred Stock remains outstanding, the Bank shall not declare, pay, or set aside for payment full dividends on any Parity Stock unless the Bank has paid in full, or set aside payment in full, in respect of all unpaid
dividends for all Dividend Periods for outstanding shares of Series A Preferred Stock. To the extent that the Bank declares dividends on the shares of Series A Preferred Stock and on shares of any Parity Stock but cannot make full
payment of such declared dividends, the Bank shall allocate the dividend payments on a pro rata basis among the holders of the shares of Series A Preferred Stock and the holders of any Parity Stock then outstanding. For purposes of
calculating the pro rata allocation of partial dividend payments, the Bank shall allocate dividend payments based on the ratio between the then current and the unpaid dividend payments due on the shares of Series A Preferred Stock and
(1) in the case of cumulative Parity Stock, the aggregate of the accrued and unpaid dividends due on any such Parity Stock and (2) in the case of noncumulative Parity Stock, the aggregate of the declared but unpaid dividends due on
any such Parity Stock. No interest shall be payable in respect of any dividend payment on shares of Series A Preferred Stock that may be in arrears.
ix. Subject to the foregoing conditions, and not
otherwise, dividends (payable in cash, stock, or otherwise), as may be determined by the Board of Directors (or a duly authorized committee thereof), may be declared and paid on the Common Stock and any Junior Stock from time to time
out of any funds legally available for such payment, and the holders of the shares of Series A Preferred Stock shall not be entitled to participate in such dividends.
e. Liquidation Rights.
i. In the event of any voluntary or
involuntary liquidation, dissolution or winding up of the Bank, the holders of the shares of Series A Preferred Stock then outstanding shall be entitled to be paid out of the Bank’s assets legally available for distribution to
the Bank’s shareholders, before any distribution of assets is made to holders of Common Stock or any other Junior Stock, a liquidating distribution in the amount equal to the sum of (1) the Liquidation Preference, plus (2) the sum of
any declared and unpaid dividends for prior Dividend Periods prior to the Dividend Period in which the liquidation distribution is made and any declared and unpaid dividends for the then current Dividend Period in which the liquidation
distribution is made to the date of such liquidation distribution. After payment of the full amount of the liquidating distributions to which they are entitled pursuant to the foregoing, the holders of shares of Series A Preferred Stock
shall have no right or claim to any remaining assets of the Bank.
ii. In the event that, upon any
such voluntary or involuntary liquidation, dissolution or winding up, the available assets of the Bank are insufficient to pay the amount of the liquidating distributions on all outstanding shares of Series A Preferred Stock
and the corresponding amounts payable on all shares of Parity Stock in the distribution of assets upon any liquidation, dissolution or winding up of the Bank, then the holders of the shares of Series A Preferred Stock and such Parity
Stock shall share ratably in any such distribution of assets in proportion to the full liquidating distributions to which they respectively would be entitled.
iii. For the purposes of this
Section (e), the merger or consolidation of the Bank with or into any other entity or by another entity with or into the Bank or the sale, lease, exchange or other transfer of all or substantially all of the assets of the Bank
(for cash, securities or other consideration) shall not be deemed to constitute the liquidation, dissolution or winding up of the Bank. If the Bank enters into any merger or consolidation transaction with or into any other entity and
the Bank is not the surviving entity in such transaction, shares of the Series A Preferred Stock may be converted into shares of the surviving or successor corporation or the direct or indirect parent of the surviving or successor
corporation having terms identical to the terms of the Series A Preferred Stock set forth herein.
f. Redemption Rights.
i. The Series A Preferred Stock
is not subject to any mandatory redemption, sinking fund or other similar provisions. Subject to the terms and conditions of this Section (f), the Bank may redeem shares of Series A Preferred Stock, in whole or in part, at its
option, on any Dividend Payment Date on or after November 20, 2024, with not less than thirty (30) calendar days’ and not more than sixty (60) calendar days’ notice (an “Optional Redemption”), subject to the approval of the appropriate
federal banking agency, at the Redemption Price. Dividends shall not accrue on those shares of Series A Preferred Stock so redeemed on and after the applicable redemption date.
ii. In addition, the Bank may redeem shares of Series A
Preferred Stock, in whole but not in part, at its option, for cash, at any time within ninety (90) calendar days following a Regulatory Capital Treatment Event, subject to the approval of the appropriate federal banking agency, at the
Redemption Price (a “Regulatory Event Redemption”).
iii. The redemption price for any redemption of shares of
Series A Preferred Stock, whether an Optional Redemption or Regulatory Event Redemption, shall be equal to (A) $25.00 per share of Series A Preferred Stock, plus (B) any declared and unpaid dividends (without regard to any undeclared
dividends) prior to, but excluding, the date of redemption (the “Redemption Price”).
iv. Any notice given as provided in
this Section (f) shall be conclusively presumed to have been duly given, whether or not the holder receives the notice, and any defect in the notice or in the provision of the notice, to any holder of shares of Series A
Preferred Stock designated for redemption will not affect the redemption of any other shares of Series A Preferred Stock.
Any notice provided to a holder of shares of Series A Preferred Stock shall be deemed given on the date provided, whether
or not the holder actually receives the notice. A notice of redemption shall be given not less than thirty (30) calendar days and not more than sixty (60) calendar prior to the date of redemption specified in the notice, and shall
specify (1) the redemption date, (2) the Redemption Price, (3) if fewer than all shares of Series A Preferred Stock are to be redeemed, the number of shares of Series A Preferred Stock to be redeemed and (4) the manner in which holders
of shares of Series A Preferred Stock called for redemption may obtain payment of the Redemption Price in respect of those shares. Notwithstanding anything to the contrary in this Section (f), if the Series A Preferred Stock is issued
in book-entry form through The Depository Trust Company or any other similar facility, notice of redemption may be given to the holders of shares of Series A Preferred Stock at such time and in any manner permitted by such facility.
v. If notice of redemption of any
shares of Series A Preferred Stock has been given by the Bank and if the funds necessary for such redemption have been set aside by the Bank in trust for the benefit of the holders of any shares of Series A Preferred Stock,
then from and after the redemption date such shares of Series A Preferred Stock shall no longer be outstanding for any purpose, all dividends with respect to such shares of Series A Preferred Stock shall cease to accrue from the
redemption date and all rights of the holders of such shares shall terminate, except the right to receive the Redemption Price, without interest. Shares of Series A Preferred Stock redeemed pursuant to this Section (f) or purchased or
otherwise acquired for value by the Bank shall, after such acquisition, have the status of authorized and unissued shares of the Preferred Stock and may be reissued by the Bank at any time as shares of any series of the Preferred Stock
other than as Series A Preferred Stock.
vi. In the event that fewer than all of the outstanding
shares of Series A Preferred Stock are to be redeemed, the shares of Series A Preferred Stock to be redeemed shall be selected either pro rata or by lot or in such other manner as the Board of Directors (or a duly authorized committee
thereof) determines to be fair and equitable and permitted by the rules of any stock exchange on which the Series A Preferred Stock is listed, subject to the provisions hereof. The Board of Directors (or a duly authorized committee
thereof) shall have the full power and authority to prescribe the terms and conditions upon which such shares of Series A Preferred Stock may be redeemed from time to time.
vii. No holder of shares of Series
A Preferred Stock shall have the right to require the redemption of the Series A Preferred Stock.
g. Voting Rights.
i. Holders of shares of Series A
Preferred Stock shall not have any voting rights, except as set forth below or as otherwise required by the Code.
ii. Whenever dividends payable on the shares of Series A
Preferred Stock or any other class or series of the Preferred Stock ranking equally with the Series A Preferred Stock as to payment of dividends, and upon which voting rights equivalent to those described in this paragraph have been
conferred and are exercisable, have not been declared and paid in an aggregate amount equal to, as to any class or series, the equivalent of at least six (6) or more quarterly Dividend Periods, whether or not for consecutive Dividend
Periods (a “Nonpayment”), the holders of outstanding shares of the Series A Preferred Stock voting as a class with holders of shares of any other series of the Preferred Stock ranking equally with the Series A Preferred Stock as to
payment of dividends, and upon which like voting rights have been conferred and are exercisable (“Voting Parity Stock”), shall be entitled to vote for the election of two (2) additional directors of the Board of Directors on the terms
set forth in this Section (g) (and to fill any vacancies in the terms of such directorships) (the “Preferred Stock Directors”). Holders of shares of all series of Voting Parity Stock shall vote as a single class. In the event that the
holders of the shares of the Series A Preferred Stock are entitled to vote as described in this Section (g), the number of members of the Board of Directors at that time shall be increased by two (2) directors, and the holders of the
shares of Series A Preferred Stock shall have the right, as members of that class, to elect two (2) directors at a special meeting called at the request of the holders of record of at least twenty percent (20%) of the aggregate voting
power of the Series A Preferred Stock or any other series of Voting Parity Stock (unless such request is received less than ninety (90) calendar days before the date fixed for the Bank’s next annual or special meeting of the
shareholders, in which event such election shall be held at such next annual or special meeting of the shareholders), provided that the election of any Preferred Stock Directors shall not cause the Bank to violate the corporate
governance requirements of the New York Stock Exchange (or any other exchange on which the securities of the Bank may at such time be listed) that listed companies must have a majority of independent directors, and provided further
that at no time shall the Board of Directors include more than two (2) Preferred Stock Directors.
iii. The Preferred Stock Directors
elected at any such special meeting shall hold office until the next annual meeting of the Bank’s shareholders unless they have been previously terminated or removed pursuant to Section (g)(iv). In case any vacancy in the
office of a Preferred Stock Director occurs (other than prior to the initial election of the Preferred Stock Directors), the vacancy may be filled by the written consent of the Preferred Stock Director remaining in office, or, if none
remains in office, by the vote of the holders of the shares of Series A Preferred Stock (together with holders of any shares of Voting Parity Stock) to serve until the next annual meeting of the shareholders.
iv. When the Bank has paid full dividends on the Series A
Preferred Stock for the equivalent of at least four (4) Dividend Periods, following a Nonpayment, then the right of the holders of shares of Series A Preferred Stock to elect the Preferred Stock Directors set forth in this Section (g)
shall cease (subject to the continued applicability of the provisions for the vesting of the special voting rights in the case of any future Nonpayment). Upon termination of the right of the holders of shares of the Series A Preferred
Stock and Voting Parity Stock to vote for Preferred Stock Directors as set forth in this Section (g), the term of office of all Preferred Stock Directors then in office elected by only those holders shall terminate immediately.
Whenever the term of office of the Preferred Stock Directors ends and the related voting rights have expired, the number of directors automatically will be decreased to the number of directors as otherwise would prevail. Any Preferred
Stock Director may be removed at any time without cause by the holders of record of a majority of the outstanding shares of the Series A Preferred Stock (together with holders of any shares of Voting Parity Stock) when they have the
voting rights described in Section (g)(ii).
v. So long as any shares of Series
A Preferred Stock remain outstanding, the Bank shall not, without the affirmative vote or consent of holders of at least 66 2/3% in voting power of the shares of Series A Preferred Stock and any Voting Parity Stock, voting
together as a single class, given in person or by proxy, either in writing without a meeting or at any meeting called for the purpose, authorize, create or issue any shares of capital stock ranking senior to the Series A Preferred Stock
as to dividends and rights upon liquidation, dissolution or winding up, or reclassify any authorized capital stock into any such shares of such capital stock or issue any obligation or security convertible into or evidencing the right
to purchase any such shares of capital stock. Further, so long as any shares of the Series A Preferred Stock remain outstanding, the Bank shall not, without the affirmative vote of the holders of at least 66 2/3% in voting power of the
Series A Preferred Stock, amend, alter or repeal any provision of these Articles of the Bank, including by merger, consolidation or otherwise, so as to affect the powers, preferences or special rights of the Series A Preferred Stock.
Notwithstanding the foregoing, (a) any increase in the amount of authorized shares of Common Stock or authorized shares of
the Preferred Stock, or any increase or decrease in the number of shares of any series of the Preferred Stock, or the authorization, creation and issuance of other classes or series of capital stock, in each case ranking on parity with
or junior to the shares of the Series A Preferred Stock as to dividends and distribution of assets upon liquidation, dissolution or winding up, shall not be deemed to affect such powers, preferences or special rights, (b) a merger or
consolidation of the Bank with or into another entity in which the shares of the Series A Preferred Stock (1) remain outstanding or (2) are converted into or exchanged for preference securities of the surviving entity or any entity,
directly or indirectly, controlling such surviving entity and such new preference securities have powers, preferences and special rights that are not materially less favorable than the Series A Preferred Stock shall not be deemed to
affect the powers, preferences or special rights of the Series A Preferred Stock and (c) the foregoing voting rights of the holders of Series A Preferred Stock shall not apply if, at or prior to the time when the act with respect to
which the vote would otherwise be required shall be effected, all outstanding shares of Series A Preferred Stock shall have been redeemed or called for redemption upon proper notice and sufficient funds shall have been set aside by the
Bank for the benefit of holders of shares of Series A Preferred Stock to effect the redemption.
vi. Notice for a special meeting to
elect the Preferred Stock Directors shall be given in a similar manner to that provided in the Bylaws for a special meeting of the shareholders. If the secretary of the Bank does not call a special meeting within twenty (20)
calendar days after receipt of any such request, then any holder of shares of Series A Preferred Stock may (at the Bank’s reasonable expense) call such meeting, upon notice as provided in this Section (g)(vi) and, for that purpose,
shall have access to the stock register of the Bank.
vii. Except as otherwise set forth in Section (g)(vi) hereof, the rules and
procedures for calling and conducting any meeting of the holders of shares of Series A Preferred Stock (including, without limitation, the fixing of a record date in connection therewith), the solicitation and use of proxies at such a
meeting, the obtaining of written consents and any other aspect or matter with regard to such a meeting or such consents shall be governed by any rules that the Board of Directors (or a duly authorized committee thereof), in its
discretion, may adopt from time to time, which rules and procedures shall conform to the requirements of the Articles, the Bylaws, and applicable laws and the rules of any national securities exchange or other trading facility on which
Series A Preferred Stock is listed or traded at the time.
viii. Each holder of shares of
Series A Preferred Stock will have one (1) vote per share on any matter on which holders of shares of Series A Preferred Stock are entitled to vote.
h. Conversion Rights. The holders of shares of Series A Preferred
Stock shall not have any rights to convert such shares into shares of any other class or series of stock or into any other securities of, or any interest or property in, the Bank.
i. No Sinking Fund. No sinking fund shall be established for the
retirement or redemption of shares of Series A Preferred Stock.
j. No Preemptive or Subscription Rights. No
holder of shares of Series A Preferred Stock shall, as such holder, have any preemptive right to purchase or subscribe for any additional shares of capital stock of the Bank or any other security of the Bank that it may issue or sell.
k. Information Rights.
During any period in which the Bank is not subject to Section 13 or 15(d) of the Exchange Act and any shares of Series A Preferred Stock are outstanding, the Bank will use its reasonable best efforts to (i) transmit by mail (or
other permissible means under the Exchange Act) to all holders of Series A Preferred Stock, as their names and addresses appear on the Bank’s record books and without cost to such holders, copies of the annual reports on Form 10-K and
quarterly reports on Form 10-Q that the Bank would have been required to file with the FDIC pursuant to Section 13 or 15(d) of the Exchange Act if the Bank were subject thereto (other than any exhibits that would have been required) and
(ii) promptly, after receipt of written request, supply copies of such reports to any holders or prospective holder of Series A Preferred Stock. The Bank will use its reasonable best efforts to mail (or otherwise provide) the
information to the holders of the Series A Preferred Stock within 15 days after the respective dates by which a periodic report on Form 10-K or Form 10-Q, as the case may be, in respect of such information would have been required to be
filed with the SEC, if the Bank were subject to Section 13 or 15(d) of the Exchange Act, in each case, based on the dates on which it would be required to file such periodic reports if the Bank were a “non-accelerated filer” within the
meaning of the Exchange Act.
l. Certificates. Shares of Series A Preferred
Stock shall be eligible for the Direct Registration System service offered by the Depository Trust Company and may be represented in the form of uncertificated or certificated shares. Shares of Series A Preferred Stock shall be
eligible for the Direct Registration System service offered by the Depository Trust Company and may be represented in the form of uncertificated or certificated shares; provided, however, that each holder of Series A Preferred Stock
shall be entitled, upon request, to have a certificate for shares of Series A Preferred Stock reflecting the number of shares owned by such holder in such form as is provided under the Code and the Bylaws.
m. Listing. The Bank agrees
that for the period of time during which the Series A Preferred Stock is outstanding, the Bank will use its reasonable best efforts to (i) effect within thirty (30) days of issuance and delivery of the Series A Preferred Stock the
listing of the Series A Preferred Stock on the New York Stock Exchange and (ii) maintain the listing of the Series A Preferred Stock on the New York Stock Exchange or another national securities exchange.
n. No Other Rights. The
shares of Series A Preferred Stock shall not have any designations, preferences or relative, participating, optional or other special rights except as set forth in these Articles or as otherwise required by applicable law,
including the Code.
|
Dated: December 30, 2024
|
Cadence Bank
|
| |
|
| |
By:
|
/s/ James D. Rollins III |
| |
|
| |
|
James D. Rollins III
|
| |
|
Chairman and Chief Executive
Officer
|
|
ATTEST:
|
|
| |
|
|
/s/ Cathy S. Freeman
|
|
| |
|
|
Cathy S. Freeman
|
|
|
Senior Executive Vice President and Chief
|
|
|
Administrative Officer
|
|
Exhibit 3.2
SECOND AMENDED AND RESTATED
BYLAWS
OF
CADENCE BANK
(AS AMENDED, DECEMBER 30, 2024)
Organized Under the Laws of Mississippi
ARTICLE I
OFFICES
Section 1.1 PRINCIPAL AND REGISTERED OFFICE. The principal office of Cadence Bank (the “Bank”) shall be located in the City of Tupelo, County of Lee, State of
Mississippi. Unless the Board of Directors designates otherwise, the registered office of the Bank shall be the principal office.
Section 1.2 OTHER OFFICES. The Bank may also maintain, lease, construct, or acquire offices at such other locations, either within or outside the State of
Mississippi, as the Board of Directors may, from time to time, authorize or as the business of the Bank may require.
ARTICLE II
SHAREHOLDERS
Section 2.1 GENERAL. All meetings of the shareholders of the Bank shall be held (a) at such place (either within or outside the State of Mississippi), or (b) by
such means of electronic transmission or other means of remote communication, or a combination thereof, including, but not limited to, communications through conference telephone, videoconference, the internet or such other
means by which persons not physically present in the same location may communicate with each other on a substantially concurrent basis, on such date and at such time as may be set forth in these Bylaws or as shall be
determined from time to time by the Board of Directors. All references in this Article II to “in person” representation or appearance at a meeting of the shareholders or voting at any such meeting shall be deemed to include
representation, appearance or voting by means of electronic transmission or other means of remote communication established by the Board of Directors for such purpose.
Section 2.2 ANNUAL MEETING. An annual meeting of the shareholders of the Bank shall be held during the third, fourth or fifth month following the end of the Bank’s
fiscal year on such date as may be fixed by resolution of the Board of Directors. The business to be transacted at such meeting shall be the election of directors and such other business as shall be properly brought before the
meeting. If the election of directors is not held on the date determined by the Board of Directors for an annual meeting, or at any adjournment of such meeting, the Board of Directors shall call a special meeting of the
shareholders as soon as conveniently possible thereafter. At such special meeting the election of directors shall take place and such election and any other business transacted thereat shall have the same force and effect as
if transacted at an annual meeting duly called and held.
Section 2.3 SPECIAL MEETING. Special meetings of the shareholders, unless otherwise required by law, may be called at any time by the Chairman, Chief Executive
Officer or Secretary and shall be called by the Chairman, Chief Executive Officer or Secretary at the request in writing of a majority of the Board of Directors or of shareholders owning not less than twenty percent (20%) of
all the shares of capital stock of the Bank issued and outstanding and entitled to vote at such meeting. Such written request must state the purpose or purposes for which the meeting is called and the person or persons
calling the meeting.
Section 2.4 NOTICE OF MEETING
(a) Written notice stating the (i) place or providing instructions on how to access the meeting by electronic transmission or other means of
remote communication, (ii) date, and (iii) time of the annual meeting of shareholders of the Bank and, in the case of a special meeting, the purpose or purposes for which the meeting is called, shall, unless otherwise
prescribed by statute, be delivered not less than ten (10) nor more than sixty (60) days before the date of the meeting, by or at the direction of the Board of Directors, the Chairman, Chief Executive Officer or the
Secretary, to each shareholder of record entitled to vote at such meeting. If mailed, such notice shall be deemed to be delivered when deposited in the United States mail addressed to the shareholder at the shareholder’s
address as it appears on the stock transfer books of the Bank with postage paid thereon.
(b) Without limiting the manner by which notice otherwise may be given effectively to shareholders, any notice to shareholders given by the
Bank under any provision of Chapter 5 of Title 81 of the Mississippi Code (the “Banking Act”), the Mississippi Business Corporation Act (the “Act”), the Bank’s Articles of Incorporation (the “Articles”) or these Bylaws,
shall be effective if given by a form of electronic transmission consented to by the shareholder to whom the notice is given. Any such consent shall be revocable by the shareholder by written notice to the Bank. Any such
consent shall be deemed revoked if (i) the Bank is unable to deliver by electronic transmission two consecutive notices given by the Bank in accordance with such consent, and (ii) such inability becomes known to the
Secretary of the Bank or to the transfer agent or other person responsible for the giving of notice; provided, however, the inadvertent failure to treat such inability as a revocation shall not invalidate any meeting or
other action. Notice given pursuant to this Section 2.4(b) shall be deemed delivered: (1) if by facsimile telecommunication, when directed to a number at which the shareholder has consented to receive notice; (2) if by
electronic mail, when directed to an electronic mail address at which the shareholder has consented to receive notice; (3) if by a posting on an electronic network together with separate notice to the shareholder of such
specific posting when such notice is directed to the record address of the shareholder or to such other address at which the shareholder has consented to receive notice, upon the later of such posting or the giving of such
separate notice; and (4) if by any other form of electronic transmission, when consented to by the shareholder. In addition, notice can be given in any manner authorized by the Act.
Section 2.5 VOTING LIST. The officer or agent having charge of the stock transfer books for shares of the Bank shall make a complete list of the shareholders
entitled to notice of a meeting of shareholders or any adjournment thereof, arranged by voting group (and within each voting group by class or series of shares), and in alphabetical order, with the address of and the number of
shares held by each shareholder. The list shall be available for inspection beginning two (2) business days after notice of the meeting is given for which the list was prepared and continuing through the meeting, at the
principal office of the Bank, and shall be subject to inspection on written demand by any shareholder or the shareholder’s agent at any time during regular business hours. Such list shall also be available at the time and
place of the meeting and shall be subject to the inspection of any shareholder or the shareholder’s agent during the meeting or any adjournment. The original stock transfer books shall be prima facie evidence as to
shareholders entitled to examine such list or transfer book or to vote at any meeting of shareholders.
Section 2.6 QUORUM. A majority of the shares entitled to vote, represented in person or by proxy, shall constitute a quorum at the annual meeting of shareholders. A
majority of the shares entitled to vote, represented in person or by proxy, shall constitute a quorum at a special meeting of shareholders. If a quorum is present at any meeting of shareholders, action on a matter (other than
the election of directors) is approved if the votes cast favoring the action exceed the votes cast opposing the action, unless the vote of a greater number is required by the Articles, the Banking Act or the Act for any
specific purpose. If a quorum is not established because a sufficient number of shares entitled to vote are not represented at the meeting in person or by proxy, the meeting may be adjourned by the presiding officer of the
meeting without further notice. At such adjourned meeting at which a quorum shall be present or represented, any business may be transacted which might have been transacted at the meeting as originally noticed. The
shareholders present at a duly called meeting may continue to transact business for that meeting and for any adjournment thereof, unless a new record date must be set for that adjourned meeting, notwithstanding the withdrawal
of enough shareholders to leave less than a quorum.
Section 2.7 PROXIES. At all meetings of shareholders, a shareholder may vote his or her shares either in person or by proxy. A shareholder or the shareholder’s agent
may appoint a proxy to vote or otherwise act for the shareholder by signing an appointment form, by electronic transmission or by any other method or means permitted under the laws of the State of Mississippi. An electronic
transmission must contain or be accompanied by information from which the Bank can determine that the shareholder or the shareholder’s agent authorized the electronic transmission. No proxy shall be valid after eleven (11)
months from the date of execution, unless otherwise expressly provided in the appointment form, electronic transmission or other applicable method or means of appointment.
Section 2.8 VOTING OF SHARES. Each outstanding share of the Bank’s common stock entitled to vote shall be entitled to one (1) vote upon each matter submitted to a
vote at a meeting of the shareholders. No shareholder will be allowed to vote at any meeting, either in person or by proxy, unless he or she is a shareholder of record.
Section 2.9 VOTING OF SHARES BY CERTAIN HOLDERS. Shares standing in the name of another corporation may be voted by such officer, agent or proxy as the bylaws of
such corporation may prescribe, or in the absence of such provision, as the board of directors of such corporation may determine.
Shares held by an administrator, executor, guardian, or conservator may be voted by such person, either in person or by proxy, without a transfer of such shares into his or
her name if the authority to do so is contained in an appropriate order of the court by which such administrator, executor, guardian, or conservator was appointed.
Shares standing in the name of a receiver may be voted by such receiver and shares held by or under the control of a receiver may be voted by such receiver without the transfer thereof into
his or her name if the authority to do so is contained in an appropriate order of the court by which such receiver was appointed.
A shareholder whose shares are pledged shall be entitled to vote such shares until the shares have been transferred into the name of the pledgee, and thereafter the pledgee
shall be entitled to vote the shares so transferred.
Shares of its own stock owned by the Bank or by any other corporation, the majority of whose voting shares are owned, directly or indirectly, by the Bank, shall not be voted
at any meeting, and shall not be counted in determining the total number of outstanding shares at any given time, except for any shares of the Bank which are held in a fiduciary capacity.
Section 2.10 BUSINESS TO BE TRANSACTED AT MEETINGS OF SHAREHOLDERS
(a) Director Nominations and Shareholder Business at Annual Meetings of Shareholders.
No nominations of any person for election to the Board of Directors shall be made, and no business to be considered or acted upon by the shareholders of the Bank shall be
proposed, at any annual meeting of shareholders, except as shall be (i) specified in the Bank’s notice of meeting (including shareholder proposals included in the Bank’s proxy materials under Rule 14a-8 of Regulation 14A under
the Securities Exchange Act of 1934, as amended (the “Exchange Act”)), (ii) otherwise brought before the meeting by or at the direction of the Board of Directors, or (iii) a proper subject for the meeting and which is timely
submitted by a shareholder of the Bank who was a shareholder of record at the time the notice provided for in this Section 2.10(a) was given or delivered to the Bank, who is entitled to vote at such meeting and who complies
fully with the notice procedures and other information requirements set forth in this subsection (a) in addition to any other applicable law, rule or regulation applicable to such meeting.
For nominations of persons for election to the Board of Directors or other business to be properly submitted by a shareholder before any annual meeting under subsection
(a)(iii) above, a shareholder must give timely notice in writing of such business to the Secretary of the Bank and any such proposed business (other than the nomination of persons for election to the Board of Directors) must
constitute a proper matter for shareholder action. To be considered timely, a shareholder’s notice must be received by the Secretary at the principal office of the Bank not earlier than the date which is one hundred twenty
(120) calendar days nor later than the date which is ninety (90) calendar days before the first anniversary of the date on which the Bank first mailed its proxy statement to shareholders in connection with the prior year’s
annual meeting of shareholders. However, if the Bank did not hold an annual meeting during the previous year, or if the date of the applicable year’s annual meeting has been changed by more than thirty (30) calendar days
before or more than seventy (70) days after the first anniversary of the date of the previous year’s annual meeting, then a shareholder’s notice must be received by the Secretary not earlier than the date which is one hundred
twenty (120) calendar days before the date on which the Bank first mailed its proxy statement to shareholders in connection with the applicable year’s annual meeting and not later than the date of the later to occur of (i)
ninety (90) calendar days before the date on which the Bank first mailed its proxy statement to shareholders in connection with the applicable year’s annual meeting of shareholders or (ii) ten (10) calendar days after the
Bank’s first public announcement of the date of the applicable year’s annual meeting of shareholders. In no event shall the public announcement of an adjournment or postponement of an annual meeting commence a new time period
(or extend any time period) for the giving of a shareholder’s notice as described above. The number of nominees a shareholder may nominate for election at an annual meeting (or in the case of a shareholder giving notice on
behalf of a beneficial owner, the number of nominees a shareholder may nominate for election at the meeting on behalf of such beneficial owner) shall not exceed the number of directors to be elected at such annual meeting.
A shareholder’s notice to the Secretary to submit a nomination or other business to an annual meeting of shareholders shall set forth: (i) the name and address of the
shareholder, as they appear on the books and records of the Bank, and of the beneficial owner, if any, on whose behalf the nomination or proposal is made; (ii) the class and number of shares of stock of the Bank held of record
and beneficially owned by such shareholder and such beneficial owner; (iii) the name(s), including any beneficial owners, and address(es) of such shareholder(s) in which all such shares of stock are registered on the stock
transfer books of the Bank; (iv) a representation that the shareholder is a holder of record of stock of the Bank entitled to vote at such meeting and/or by proxy at the meeting to propose such business or nomination; (iv) a
representation that the shareholder intends to appear at the meeting in person or by proxy to submit the business specified in such notice; (v) a brief description of the business desired to be submitted to the annual meeting
of shareholders, the complete text of any resolutions intended to be presented at the annual meeting (and in the event that such business includes a proposal to amend the Bylaws of the Bank, the language of the proposed
amendment) and the reasons for conducting such business at the annual meeting of shareholders; (vi) any personal or other material interest in the business to be submitted of such shareholder and the beneficial owner, if any,
on whose behalf the proposal is made; (vii) as to each person whom the shareholder proposes to nominate for election or reelection as a director, all information relating to such person that is required to be disclosed in
solicitations of proxies for election of directors, or is otherwise required, in each case pursuant to Regulation 14A under the Exchange Act (including such person’s written consent to being named in the proxy statement as a
nominee and to serving as a director if elected); (viii) (A) a description of any agreement, arrangement or understanding (whether or not in writing) with respect to the nomination or any other business between or among such
shareholder or beneficial owner and any other person, including without limitation any agreements that would be required to be disclosed pursuant to Item 5 or Item 6 of Schedule 13D under the Exchange Act (regardless of
whether a Schedule 13D is required) and a representation that the shareholder will notify the Secretary of the Bank in writing within five business days after the record date for the meeting of any such agreement, arrangement
or understanding in effect as of such record date, (B) a description of any agreement, arrangement or understanding (whether or not in writing) (including without limitation any derivative or short positions, profit interests,
options, hedging transactions and borrowed or loaned shares) that has been entered into as of the date of such shareholder’s notice by, or on behalf of, such shareholder or beneficial owner, the effect or intent of which is to
mitigate loss to, or manage risk or benefit from changes in the share price of any class or series of the Bank’s capital stock, or maintain, increase or decrease the voting power of the shareholder or beneficial owner with
respect to shares of the Bank’s capital stock, and the shareholder’s agreement to notify the Bank in writing within five business days after the record date for the meeting of any such agreement, arrangement or understanding
in effect as of such record date and (C) a description of any agreement, arrangement or understanding (whether or not in writing) between or among such shareholder or beneficial owner and any other person relating to
acquiring, holding, voting or disposing of any shares of capital stock of the Bank, including the number of shares that are subject to such agreement, arrangement or understanding, and a representation that the shareholder
will notify the Secretary of the Bank in writing within five business days after the record date for the meeting of any such agreement, arrangement or understanding in effect as of such record date, (ix) completed and signed
questionnaires required of the Bank’s directors from each person whom the shareholder proposes to nominate for election as a director (which questionnaires shall be provided to the person the shareholder proposes to nominate
within five business days of receipt of a request); (x) (A) in the case of a nomination of one or more persons for election to the Board of Directors, a representation that the shareholder or the beneficial owner, if any, will
or is part of a group that will (1) solicit proxies from holders of the Bank’s outstanding capital stock representing at least 67% of the voting power of shares of capital stock entitled to vote on the election of directors,
(2) include a statement to that effect in its proxy statement and/or its form of proxy, (3) otherwise comply with Rule 14a-19 under the Exchange Act and (4) provide the Secretary of the Bank not less than five business days
prior to the meeting or any adjournment or postponement thereof, with reasonable documentary evidence (as determined by the Secretary in good faith) that such shareholder and/or beneficial owner, if any, complied with such
representations and (B) in the case of a proposal not involving the nomination of directors, a representation whether the shareholder or the beneficial owner, if any, intends or is part of a group which intends (1) to deliver
a proxy statement and/or form of proxy to holders of at least the percentage of the Bank’s outstanding capital stock required to approve or adopt the proposal and/or (2) otherwise to solicit proxies or votes from shareholders
in support of such proposal; and (xi) all other information relating to the nomination or proposed business which may be required to be disclosed under applicable law. The Bank also may require any shareholder giving a notice
of nomination or bringing any item of business before an annual meeting, any beneficial owner on whose behalf a nomination is made or any item of business is brought before an annual meeting and any proposed nominee to furnish
such other information as the Bank may reasonably require with respect to any nomination or other item of business brought before an annual meeting or to determine the eligibility, suitability or qualifications of such
proposed nominee to serve as a director of the Bank, including such additional information as necessary to permit the Board of Directors to determine if such proposed nominee is independent, including for purposes of serving
on any committee of the Board of Directors, under the listing standards of each U.S. exchange upon which the capital stock of the Bank is listed, any applicable rules of the FDIC or SEC and any publicly disclosed standards
used by the Board of Directors in determining and disclosing the independence of the Bank’s directors and to determine whether the nominee otherwise meets all other publicly disclosed standards applicable to directors. In
addition, a shareholder seeking to submit such nominations or business at the meeting shall promptly provide any other information reasonably requested by the Bank. Any additional information shall be delivered to the
Secretary of the Bank within five business days after the request by the Bank for such information has been delivered to such person.
(b) Director Nominations and Shareholder Business at Special Meetings of Shareholders.
No nominations of any person for election to the Board of Directors shall be made, and no business to be considered or acted upon by the shareholders of the Bank shall be
proposed, at any special meeting of shareholders, except as shall be: (i) specified in the notice of meeting or (ii) otherwise brought before the meeting by or at the direction of the Board of Directors. When the notice of
meeting provides that directors will be elected at a special meeting of shareholders, nominations of persons for election to the Board of Directors may be made only (i) by or at the direction of the Board of Directors or the
Nominating Committee or (ii) by any shareholder of the Bank who is a shareholder of record at the time of giving of notice provided for in this subsection (b), who is entitled to vote at the meeting and who complies with the
notice procedures and other information requirements set forth in this subsection (b) in addition to any other applicable law, rule or regulation, applicable to such meeting.
Nominations by shareholders of persons for election to the Board of Directors may be made at a special meeting of shareholders only if the Board of Directors has determined
that directors will be elected at such special meeting and the shareholder’s notice required by this section (containing all of the information and representations provided in Section 2.10(a) above) is delivered to the
Secretary at the principal office of the Bank not earlier than the date which is one hundred twenty (120) calendar days before the date of such special meeting and not later than the date of the later to occur of (i) ninety
(90) calendar days before the date of such special meeting of shareholders or (ii) ten (10) calendar days after the Bank’s first public announcement of the date of the special meeting of shareholders. In no event shall the
public announcement of an adjournment or postponement of a special meeting commence a new time period (or extend any time period) for the giving of a shareholder’s notice as described above. In addition, a shareholder seeking
to submit such nominations or business at the meeting shall promptly provide any other information reasonably requested by the Bank (including any additional information provided in Section 2.10(a) above), which information
shall be delivered to the Secretary of the Bank within five business days after the request by the Bank for such information has been delivered to such person.
Only those persons who are nominated in accordance with the procedures set forth in this Section 2.10 shall be considered by the Board of Directors or the Nominating
Committee as to whether such persons should be recommended as director nominees for election as directors at any meeting of shareholders. Only business brought before the meeting in accordance with the procedures set forth in
this Section 2.10 shall be conducted at a meeting of shareholders. The officer presiding over the meeting (or, in advance of any meeting of shareholders, the Board of Directors or an authorized committee thereof) shall have
the power and duty to determine whether a nomination or any business proposed to be brought before the meeting was made in accordance with the procedures set forth in this Section 2.10 (including whether the shareholder or
beneficial owner, if any, on whose behalf the nomination or proposal is made solicited (or is part of a group which solicited) or did not so solicit, as the case may be, proxies in support of such shareholder’s nominee or
proposal in compliance with such shareholder’s representation as required by clause (a)(x) of this Section 2.10) and, if any proposed nomination or business is not in compliance with this Section 2.10, to declare that such
nomination shall be disregarded or that such proposed business shall not be transacted and no vote shall be taken with respect to such nomination or proposed business, in each case notwithstanding that proxies with respect to
such nomination or proposed business may have been received by the Bank.
For purposes of this Section 2.10, “public announcement” shall mean disclosure in a press release reported by the Dow Jones News Service, Associated Press, PR Newswire,
Business Wire or comparable news service or in a document filed or furnished by the Bank pursuant to the Exchange Act.
In addition to the foregoing provisions of this Section 2.10, a shareholder shall also comply with all applicable requirements of the Act, the Exchange Act and the rules and
regulations thereunder with respect to the matters set forth in this Section 2.10.
In addition to the foregoing provisions of this Section 2.10, a shareholder who seeks to have any proposal included in the Bank’s proxy materials shall comply with the
requirements of Rule 14a-8 under the Exchange Act.
Subject to the provisions of this Section 2.10, a resolution or motion shall be considered for vote only if proposed by a shareholder or a duly authorized proxy and seconded
by a shareholder or duly authorized proxy other than the individual who proposed the resolution or motion.
Section 2.11 PRESIDING OFFICER. Meetings of the shareholders shall be presided over by the Chief Executive Officer of the Bank, or if he is not present, by an officer
ranking at least as high as Vice President, or if neither the Chief Executive Officer nor such an officer is present, by a chairman to be chosen by a majority of the shareholders entitled to vote at such meeting. The Secretary
of the Bank or, in the Secretary’s absence, an Assistant Secretary, shall act as secretary of every meeting, but if neither the Secretary nor an Assistant Secretary is present, the chairman of such meeting shall choose any
person present to act as secretary of the meeting.
Section 2.12 CONDUCT OF MEETINGS. Meetings of shareholders generally shall be conducted in accordance with the following:
(a) The chairman of the meeting shall have absolute authority over matters of procedure, and there shall be no appeal from the ruling of the chairman. The chairman
may, but is under no obligation to, follow rules of parliamentary procedure to conduct any meeting.
(b) If disorder should arise which prevents the continuation of the legitimate business of the meeting, the chairman may announce the adjournment of the meeting;
and upon his so doing, the meeting is immediately adjourned.
(c) The chairman may ask or require that anyone who is not a bona fide shareholder or proxy leave the meeting.
Section 2.13 ACTION BY WRITTEN CONSENT. Action required or permitted by Section 79-4-1.01 et seq. of the Act to be taken at a shareholders' meeting may be taken
without a meeting if the action is evidenced by one or more written consents describing the action taken, signed by at least the same majority of shareholders as would be required to take such action at a meeting of the
shareholders where all the shareholders entitled to vote on such action were present, and delivered to the Bank for inclusion in the minutes or filing with the corporate records.
ARTICLE III
RECORD DATE
For the purpose of determining shareholders entitled to notice of or to vote at any meeting of shareholders, or any adjournment thereof, or shareholders entitled to receive
payment of any dividend, or in order to make a determination of shareholders for any other purpose, the Board of Directors of the Bank may fix in advance a date as the record date for any such determination of shareholders,
such date in any case to be not more than seventy (70) days and, in case of a meeting of shareholders, not less than ten (10) days prior to the date on which the particular action requiring such determination of shareholders
is to be taken. If no record date is fixed for the determination of shareholders entitled to notice of or to vote at a meeting of shareholders or to receive payment of a dividend, the date on which notice of the meeting is
mailed or the date on which the resolution of the Board of Directors declaring such dividend is adopted, as the case may be, shall be the record date for such determination of shareholders. When determination of shareholders
entitled to vote at any meeting of shareholders has been made as provided in this Article III, such determination shall apply to any adjournment thereof unless the meeting is adjourned to a date more than one hundred twenty
(120) days after the date fixed for the original meeting, in which event the Board of Directors shall fix a new record date.
ARTICLE IV
DIRECTORS
Section 4.1 NUMBER AND TERM; STOCK OWNERSHIP. The management of all affairs, property and business of the Bank shall be vested in the Board of Directors, which shall
consist of not less than nine (9) nor more than twenty (20) Directors. The exact number within such range shall be established by resolution of the Board of Directors. Each director shall hold office for the term provided in
the Articles, and until his or her successor has been duly elected and qualified. Each director must be the owner, in his or her own right, of unencumbered stock of the Bank in the amount of at least two hundred dollars
($200.00) par value.
Section 4.2 ELECTION. Directors shall, except as otherwise required by the Act or the Articles, be elected by a plurality of the votes cast by the shares entitled
to vote in the election at a meeting at which a quorum is present. In an uncontested election, any nominee for director who receives a greater number of votes “withheld” from his or her election than votes “for” such election
(a “Majority Withheld Vote”) shall promptly tender his or her resignation (unless previously tendered), following certification of the shareholder vote.
The independent directors who serve on the Nominating Committee shall consider the resignation offer and recommend to the Board of Directors whether to accept it. The Board
of Directors shall act on the Nominating Committee’s recommendation within ninety (90) days following certification of the shareholder vote. Thereafter, the Board shall promptly disclose its decision whether to accept the
director’s resignation offer (and the reasons for rejecting the resignation offer, if applicable) in a press release to be disseminated in the manner that press releases are typically distributed by the Bank.
Any director who tenders his or her resignation pursuant to this provision shall not participate in the Nominating Committee recommendation or Board action regarding whether
to accept the resignation offer.
If each member of the Nominating Committee received a Majority Withheld Vote at the same election, then the independent directors who did not receive a Majority Withheld
Vote shall appoint a committee amongst themselves to consider the resignation offers and recommend to the Board whether to accept them. However, if the only directors who did not receive a Majority Withheld Vote in the same
election constitute three or fewer directors, all directors may participate in the action regarding whether to accept the resignation offers.
Section 4.3 REMOVAL. Shareholders may remove one or more directors with or without cause (as defined in the Articles). A director may be removed by the shareholders
only at a meeting called for the purpose of removing him or her and the meeting notice must state that the purpose, or one of the purposes, of the meeting is removal of the director. Such removal shall be in accordance with
the Articles and the Act. A director may also be removed for cause by the affirmative vote of the Bank’s Board of Directors.
Section 4.4 RESIGNATION. A director may resign at any time by delivering written notice to the Bank, the Board of Directors or its Chairman. A resignation is
effective when the notice is delivered, unless the notice specifies a later effective date.
Section 4.5 VACANCIES. If a vacancy occurs on the Board of Directors for any reason, including a vacancy resulting from an increase in the number of directors, the
Board of Directors may fill the vacancy, provided that the Board of Directors may elect instead to (i) not fill the vacancy or (ii) to have the vacancy filled by vote of the shareholders at any regular or special meeting of
the shareholders. A vacancy that will occur at a later date, by reason of resignation or otherwise, may be filled before the vacancy occurs, but the new Director may not take office until the vacancy occurs.
Section 4.6 COMPENSATION. No stated salary shall be paid to Directors for their services, except as prescribed by the Act or the Banking Act, but each Director shall
receive compensation, as may be determined from time to time by the Board of Directors, for attendance at regular, special and committee meetings of the Board. Each director may be paid his or her expenses for meeting
attendance, if any, as determined from time to time by the Board of Directors. No member of the Board of Directors who is also an officer of the Bank shall be compensated for service on the Board of Directors.
Section 4.7 MEETINGS. Following (but not necessarily on the same date as) the annual meeting of the shareholders, the Board of Directors shall convene, for the
purpose of an annual meeting, taking their oaths, organizing the new Board and electing the Board officers, electing the officers of the Bank, and transacting such other business as may properly come before the annual meeting.
All meetings of the Board of Directors shall be held at such place, date and time, within or outside of the State of Mississippi, as may be set forth in these Bylaws or as
shall be determined, from time to time, by the Board of Directors. The Board of Directors shall meet at least quarterly, including an annual meeting to follow the annual meeting of the shareholders. The place, date and time of
each meeting shall be stated in the notice and call of the meeting.
Special meetings of the Board of Directors shall be held at any time upon call of the Chairman of the Board, the Chief Executive Officer or on the written request of at
least three (3) directors describing the purpose or purposes for which it is to be held.
Section 4.8 NOTICE OF MEETINGS. Regular meetings of the Board of Directors may be held without notice at such places and times as shall be determined from time to
time by resolution of the directors.
Notice of special meetings of the Board of Directors shall be given orally (in which case a written confirmation notice is not necessary) or in writing by the Secretary
delivered by overnight delivery, U.S. mail, facsimile, electronic transmission or personal delivery to the director not less than two (2) days prior to the date of the meeting; the place, date and time of the meeting shall be
stated in the notice.
Attendance of a director at a meeting shall constitute a waiver of notice of such meeting, except where a director at the beginning of the meeting objects to holding the
meeting or to the transaction of any business at the meeting and thereafter does not vote for or assent to action taken at the meeting.
The foregoing paragraphs of this Section 4.8 shall also apply to meetings of committees of the Board of Directors and their members, provided that notice of special meetings
may also be given by or upon the authority of the chairman of such committee.
Section 4.9 QUORUM. The presence of not less than a majority of the whole Board of Directors, excluding any vacancies which may exist, shall be required at all
regular and special meetings to constitute a quorum. In the event that a quorum of the Bank’s directors cannot be readily assembled because of some catastrophic event, the Emergency Bylaw contained in Article XII of these
Bylaws shall be in effect for the duration of the Emergency (as defined in Article XII).
Section 4.10 VOTING. Each Director shall have the right of one (1) vote and shall be entitled to vote only if in attendance at the meeting. Voting at all meetings of the Board of
Directors shall be by voice vote. If a quorum is present, the act of a majority of directors present at the meeting shall be the act of the Board of Directors.
Section 4.11 ACTION BY SIMULTANEOUS COMMUNICATION. Unless otherwise provided in the Articles, the Board of Directors may permit any or all directors to participate in
a regular or special meeting by, or conduct the meeting through the use of, any means of communication by which all directors participating may simultaneously hear each other during the meeting. A director participating in a
meeting by this means is deemed to be present in person at the meeting.
Section 4.12 PRESUMPTION OF ASSENT. A director of the Bank who is present at a meeting of the Board of Directors at which action on any corporate matter is taken shall
be presumed to have assented to the action unless (a) he or she objects at the beginning of the meeting to holding it or to the transaction of business at the meeting, (b) his or her dissent shall be entered in the minutes of
the meeting, or (c) he or she delivers his written dissent to such action to the presiding officer of the meeting before the adjournment thereof or shall forward such dissent by registered mail to the Secretary of the Bank
immediately after the adjournment of the meeting. Such right to dissent shall not apply to a director who voted in favor of such action.
Section 4.13 ACTION BY WRITTEN CONSENT. Any action required or permitted to be taken at a meeting of the Board of Directors may be taken without a meeting, if all
Directors consent to the taking of such action without a meeting by signing one or more written consents describing the action taken. The written consent or consents shall be included in the minutes or filed with the corporate
records reflecting the action taken. Action taken by written consent is effective when the last director signs the consent, unless the consent specifies a different effective date.
Section 4.14 APPOINTMENT OF COMMITTEES. In accordance with Article VI of these Bylaws, the Board of Directors, by resolution adopted by a majority of the full Board of
Directors, may designate from among its members committees, each of which, to the extent provided in such resolution or in the Articles or these Bylaws, shall have and may exercise all the authority of the Board of Directors,
subject to such limitations as shall be contained in such committee’s charter or as prescribed by law. Each committee of the Board shall keep minutes of meetings and shall report any actions taken at such meetings to the Board
of Directors.
Section 4.15 OATH. Each person elected Director of the Bank shall take an annual oath in the form prescribed by applicable law and any regulatory authorities. Such
oath shall be immediately transmitted to the Department of Banking and Consumer Finance of the State of Mississippi and filed in its office. Additionally, the Board of Directors shall complete any forms prescribed and
furnished by the Department of Banking and Consumer Finance and any other regulatory authority and shall file the same in its office when required by the Commissioner of Banking and Consumer Finance or such other regulatory
authority.
ARTICLE V
OFFICERS
Section 5.1 NUMBER. The officers of the Bank shall be a Chief Executive Officer, a President, a Secretary and a Treasurer, each of whom shall be elected by the Board
of Directors. Such other officers and assistant officers (including without limitation Chairman of the Board, Chief Operating Officer, Chief Financial Officer and one or more Vice Presidents) as may be deemed necessary may be
elected from time to time by the Board of Directors. Any two (2) or more offices may be held by the same person, but no officer may act in more than one capacity where action of two or more officers is required.
Section 5.2 ELECTION AND TERM OF OFFICE. The officers of the Bank to be elected by the Board of Directors shall be elected annually by the Board of Directors at the
first meeting of the Board of Directors held after each annual meeting of the shareholders. If the election of officers shall not be held at such meeting, such election shall be held as soon thereafter as conveniently may be
done. Each officer shall hold office until his or her successor shall have been duly elected and shall have qualified or until his or her death or until he or she shall resign or be removed in the manner hereinafter provided.
If authorized by the Board of Directors, an officer may appoint one or more officers or assistant officers.
Section 5.3 REMOVAL. Any officer or agent may be removed by the Board of Directors, whenever in its judgment the best interest of the Bank will be served thereby,
but such removal shall be without prejudice to the contract rights, if any, of the person so removed. Election or appointment of an officer or agent shall not of itself create contract rights.
Section 5.4 VACANCIES. A vacancy in any office because of death, resignation, removal, disqualification, or otherwise, may be filled by the Board of Directors for
the unexpired portion of the term or, for vacancies in any office at or below the level of Vice President, by the Chief Executive Officer between meetings of the Board of Directors pursuant to Section 5.6 below.
Section 5.5 CHAIRMAN OF THE BOARD. The Chairman of the Board of Directors shall preside at all meetings of the Board of Directors. The Chairman may direct the
President or a senior officer to preside at any meeting of the Board.
Section 5.6 CHIEF EXECUTIVE OFFICER. The Chief Executive Officer (who shall be the Chairman of the Board if so designated by the Board of Directors) shall have
general supervision of the policies and operations of the Bank subject to the direction and control of the Board of Directors. The Chief Executive Officer shall direct the management of the Bank and shall perform such other
duties as may be assigned to him or her, from time to time, by the Board of Directors. He or she shall prescribe the duties of the other officers and employees and see to the proper performance thereof. He or she shall cause
to be kept accurate books of account of the business of the Bank which shall at all times be open to inspection of the directors. He or she shall render, or cause to be rendered, to the shareholders annual reports in writing
of the business and condition of the Bank, and similar reports at regular meetings of the Board of Directors. The Chief Executive Officer shall have full power to sign, execute and deliver on behalf of the Bank all papers
necessary to be signed, executed and delivered in carrying on the business of the Bank and such other papers as he or she may be directed to sign by the Board of Directors.
Section 5.7 PRESIDENT. The President shall participate in the general supervision of the policies and operations of the Bank subject to the direction and control of
the Chief Executive Officer. The President shall have full power to sign, execute, and deliver on behalf of the Bank all papers necessary to be signed, executed and delivered in carrying on the business of the Bank and such
other papers as he may be directed to sign by the Board of Directors. The President shall be a member of those committees of the Board of which he is appointed by the Board of Directors.
Section 5.8 VICE PRESIDENTS. Vice Presidents may be further designated as Senior Executive Vice Presidents, Executive Vice Presidents, Senior Vice Presidents,
First Vice Presidents or Assistant Vice Presidents. In the absence of the Chief Executive Officer, the President shall perform the duties of the Chief Executive Officer; in the absence of the President or in the event of his
death, inability or refusal to act, unless the Board of Directors has designated by resolution another officer (by title or by name), a Vice President designated by the Board of Directors shall perform the duties of the
President, and when so acting, shall have all the powers of and be subject to all the restrictions upon the President. Each category of Vice President shall perform such other duties and have such responsibilities as from time
to time may be assigned to them by the Chief Executive Officer or by the Board of Directors.
Section 5.9 SECRETARY. The Secretary shall: (a) keep the minutes of the proceedings of the shareholders and of the Board of Directors in one or more books provided
for that purpose; (b) see that all notices are duly given in accordance with the provisions of these Bylaws or as required by law; (c) be custodian of the corporate records and of the seal of the Bank and see that the seal of
the Bank is affixed to all documents the execution of which on behalf of the Bank under its seal is duly authorized and required by law; (d) keep or cause to be kept a register of the postal address of each shareholder which
shall be furnished to the Secretary by such shareholder; (e) sign with the Chief Executive Officer and/or the President, certificates for shares of the Bank, the issuance of which shall have been authorized by resolution of
the Board of Directors; (f) have general charge of the stock transfer books of the Bank; and (g) in general perform all duties incident to the office of Secretary and such other duties as from time to time may be assigned to
the Secretary by the Chief Executive Officer or by the Board of Directors.
Section 5.10 TREASURER. The Treasurer shall: (a) serve as the Chief Financial Officer of the Bank; (b) have charge and custody of and be responsible for all funds and
securities of the Bank; (c) receive and give receipts for moneys due and payable to the Bank from any source whatsoever, and deposit all such moneys in the name of the Bank in such banks, trust companies or other depositaries
as shall be selected in accordance with the provisions of Article X of these Bylaws, and (d) in general perform all of the duties incident to the office of Treasurer and Chief Financial Officer and such other duties as from
time to time may be assigned to him by the Chief Executive Officer or by the Board of Directors.
Section 5.11 COMPENSATION. The Board of Directors or a committee thereof shall have the authority to determine the compensation of the Chief Executive Officer and
each other officer of the Bank, whether by employment contract or otherwise.
Section 5.12 OATH. Every executive officer as defined in Regulation O promulgated by the Board of Governors of the Federal Reserve System shall take and subscribe to
an annual oath in the form prescribed by applicable law and any regulatory authorities. Such oath shall be immediately transmitted to the Department of Banking and Consumer Finance of the State of Mississippi and filed in its
office.
Section 5.13 SURETY BONDS. Each officer and employee of the Bank shall give bond of suitable amount with security to be approved by the Board of Directors, conditioned
for the honest and faithful discharge of his or her duties as such officer or employee. At the discretion of the Board, such bonds may be schedule or blanket form and the premiums shall be paid by the Bank. The amount of such
bonds, the form of coverage and the name of the company providing the surety therefor shall be reviewed by the Board of Directors annually, and action shall be taken by the Board at that time approving the amount of the bond
to be provided.
Section 5.14 FINANCIAL STATEMENTS OF OFFICERS AND EMPLOYEES. The Board of Directors, in its discretion, may require each officer and employee to provide a personal financial statement to
the Bank, in such form and at such times as it may from time to time determine.
ARTICLE VI
COMMITTEES
Section 6.1 APPOINTMENT AND TERM. The membership of all committees of the Board of Directors shall be recommended by the Chairman of the Board and approved by a
majority vote of the Board of Directors. Committee members shall serve for the current year for which the Board of Directors by which they were appointed was elected, or until such time as they shall resign, be disqualified or
be removed from office. The chairman of each committee shall be appointed by the Chairman of the Board, which appointment shall be approved by a majority vote of the Board of Directors.
Section 6.2 QUORUM. A majority of the entire membership of the committee shall constitute a quorum.
Section 6.3 VOTING. In voting on all matters at committee meetings, a majority vote of the members present shall be necessary.
Section 6.4 SPECIAL MEETINGS. Upon call by the Committee Chairman, Chairman of the Board, President or the Board of Directors, special committee meetings may be held
at such place, date and time as may be determined from time to time.
Section 6.5 NOTICE OF MEETINGS. Written notices of regular and special committee meetings shall not be required.
Section 6.6 AUDIT COMMITTEE. The Audit Committee shall have such duties and authority as prescribed by statute and as the Board of Directors shall determine for the
review and verification of the affairs, operations, and accounts of the Bank and shall have such other duties as the Board of Directors may, from time to time, determine. The membership of the Audit Committee, shall be
appointed from the membership of the Board of Directors at its annual meeting.
The Audit Committee shall complete any forms prescribed and furnished by the Department of Banking and Consumer Finance and any other regulatory authority and shall file the
same in its office when required by the Commissioner of Banking and Consumer Finance or such other regulatory authority.
Section 6.7 LOAN COMMITTEE(S). The Loan Committee(s) shall have the responsibility for reviewing loans in accordance with the statutory requirements and credit
policy adopted by the Board of Directors each year, and such other duties as the Board of Directors may, from time to time, determine. The membership of the Loan Committees shall be appointed from the membership of the Board
of Directors at its annual meeting.
The Loan Committee(s) shall hold regular meetings as required at such place, date and time as may be determined from time to time by the Chairman of the Committee or the
Board of Directors.
Section 6.8 TRUST COMMITTEE. The Trust Committee shall have such duties and responsibilities as the Board of Directors may determine for the review and approval of
all trust affairs and activities and such other duties as the Board of Directors may, from time to time, determine. The membership of the Trust Committee shall be appointed from the membership of the Board of Directors at its
annual meeting.
The Trust Committee shall hold regular meetings, at such place, date and time as may be determined from time to time, by the Board of Directors or the Chairman of the
Committee or as required by applicable law and regulatory authority.
Section 6.9 OTHER COMMITTEES. The Chairman of the Board may appoint and the Board of Directors may approve, from time to time, from the members of the Board of
Directors, officers and employees of the Bank, or members of the Board of Directors, officers and employees of a bank holding company owning 100% of the voting capital stock of the Bank, or of another wholly-owned banking
subsidiary of such holding company, other committees of one or more persons for such purposes and with such powers as the Board of Directors may determine.
ARTICLE VII
INDEMNIFICATION
Section 7.1 INDEMNIFICATION. The Bank shall indemnify, and upon request shall advance expenses prior to final disposition of a proceeding to, any person (or the
estate or personal representative of any person) who was or is a party to, or is threatened to be made a party to, any threatened, pending or completed action, suit or proceeding, whether or not by or in the right of the Bank,
and whether civil, criminal, administrative, investigative or otherwise, by reason of the fact that such person is or was a director, officer, partner, trustee, employee or agent of the Bank, or is or was serving at the
request of the Bank as a director, officer, partner, trustee, employee or agent of another corporation, partnership, joint venture, trust employee benefit plan or other enterprise, against any liability incurred in the action,
suit or proceeding: (a) to the full extent permitted by Section 79-4-8.51 of the Act, and (b) despite the fact that such person has not met the standard of conduct set forth in Section 79-4-8.51(a) of the Act or would be
disqualified for indemnification under Section 79-4-8.51(d) of the Act, if a determination is made by a person or persons enumerated in Section 79-4-8.55(b) of the Act that (i) the director, officer, employee or agent is
fairly and reasonably entitled to indemnification in view of all of the relevant circumstances, and (ii) the acts or omissions of the officer, employee or agent did not constitute gross negligence or willful misconduct. A
request for reimbursement or advancement of expenses prior to final disposition of the proceeding need not be accompanied by the affirmation required by Section 79-4-8.53(a)(1) of the Act, but the remaining provisions of
Section 79-4-8.53 of the Act shall be applicable to any such request. Nothing in this section shall be deemed to allow for indemnification for liability resulting from a violation that is prohibited from being indemnified by
any provision of Title 81, nor shall any part of this section be construed to allow for indemnification in contravention of Section 81-5-2 of the Code or Part 359 of Title 12 of the Code of Federal Regulations (12 C.F.R. Part
359).
Section 7.2 EXPENSES. The rights to indemnification and advancement of expenses set forth in Section 7.1 of this Article VII are intended to be greater than those
which are otherwise provided for in the Act, are contractual between the Bank and the person being indemnified, and the heirs, executors and administrators of such person, and in this respect are mandatory, notwithstanding a
person’s failure to meet the standard of conduct required for permissive indemnification under the Act, as amended from time to time. The rights to indemnification and advancement of expenses provided herein shall not be
deemed exclusive of any other rights to which those seeking indemnification or advancement of expenses may be entitled or granted by law, the Articles, these Bylaws, a resolution of the Board of Directors, vote of the
shareholders of the Bank, or an agreement with the Bank, which means of indemnification and advancement of expenses are hereby specifically authorized. Any repeal or modification of the provisions of this Article VII shall not
affect any obligations of the Bank or any rights regarding indemnification and advancement of expenses of a director, officer, employee or agent with respect to any threatened, pending or completed action, suit or proceeding
for which indemnification or the advancement of expenses is requested, in which the alleged cause of action accrued at any time prior to such repeal or modification. If an amendment to the Act hereafter limits or restricts in
any way the indemnification rights permitted by law as of the date hereof, such amendment shall apply only to the extent mandated by law and only to activities of persons subject to indemnification under this Article VII which
occur subsequent to the effective date of such amendment.
Section 7.3 SEVERABILITY. If this Article VII or any portion thereof shall be invalidated on any ground by any court of competent jurisdiction, then the Bank shall
nevertheless indemnify each director, officer, employee or agent of the Bank as to any liability incurred or other amounts paid in with respect to any proceeding, including, without limitation, a grand jury proceeding and any
proceeding by or in the right of the Bank, to the fullest extent permitted by any applicable portion of this Article VII that shall not have been invalidated, by the Act, or by any other applicable law. Unless the context
otherwise requires, terms used in this Article VII shall have the meanings given in Section 79-4-8.50 of the Act.
Section 7.4 INSURANCE. The Bank may purchase and maintain insurance on behalf of any person who is or was a director, officer, employee or agent of the Bank, or is
or was serving at the request of the Bank as a director, officer, partner, trustee, employee or agent of another corporation, partnership, joint venture, trust, employee benefit plan or other enterprise, against any liability
asserted against him and incurred by him in any such capacity, or arising out of his status as such, whether or not the Bank would have the power to indemnify him against such liability under the provisions hereof.
Section 7.5 MERGERS. For the purposes of Sections 7.1 through 7.4, references to the “Bank” include all constituent corporations absorbed in a consolidation or
merger, as well as the resulting or surviving corporation, so that any person who is or was a director, officer, employee, or agent of such constituent corporation, or is or was serving at the request of such constituent
corporation as a director, officer, partner, trustee, employee or agent of another corporation, partnership, joint venture, trust, employee benefit plan or other enterprise, shall stand in the same position under the
provisions hereof with respect to the resulting or surviving corporation in the same capacity.
ARTICLE VIII
CAPITAL STOCK
Section 8.1 GENERAL AUTHORITY. The Board of Directors shall have the power and authority to make such rules and regulations, consistent with the Articles of
Incorporation, applicable statutes and regulations and these Bylaws, as it may deem expedient concerning the form, issue, registration, transfer and replacement of certificates of shares of the capital stock of the Bank.
Section 8.2 CERTIFICATED AND UNCERTIFICATED SHARES. The shares of the capital stock of the Bank may be either certificated shares or uncertificated shares. As used
herein, the term “certificated shares” means shares represented by instruments in bearer or registered form, and the term “uncertificated shares” means shares not represented by instruments and the transfer of which are
registered upon books maintained for that purpose by or on behalf of the Bank.
Section 8.3 CERTIFICATES FOR CERTIFICATED SHARES. Certificates representing shares of the Bank shall be in such form as shall be determined by the Board of
Directors. Such certificates shall be signed by the Chief Executive Officer and/or President and by the Secretary or by such other officers authorized by law or by the Board of Directors to do so, and sealed with the corporate
seal, provided that signatures and the corporate seal may be facsimiles if the certificate is countersigned by the Bank’s transfer agent or registrar. All certificates for shares shall be consecutively numbered or otherwise
identified. The name and address of the person to whom the shares represented thereby are issued, with the number of shares and date of issue, shall be entered on the stock transfer books of the Bank. All certificates
surrendered to the Bank for transfer shall be cancelled and no new certificate shall be issued until the former certificate for a like number of shares shall have been surrendered and cancelled, except that in case of a lost,
destroyed or mutilated certificate a new one may be issued therefor upon such terms and indemnity to the Bank as the proper officers designated by the Board of Directors may prescribe.
Section 8.4 TRANSFER OF SHARES. Transfer of shares of the Bank shall be made only on the stock transfer books of the Bank by the holder of record thereof or by his or
her duly authorized agent, who shall furnish proper evidence of authority to transfer, and on surrender for cancellation of the certificate of such shares. The person in whose name shares stand on the books of the Bank shall
be deemed by the Bank to be the owner thereof for all purposes.
Section 8.5 REPLACEMENTS. In case of loss or destruction of any certificate of stock, another may be issued in its place upon satisfactory proof of such loss or
destruction, and, if required by the Bank, the giving of sufficient indemnity to the Bank of such stock.
ARTICLE IX
DIVIDENDS
Section 9.1 DECLARATION. From time to time as it may determine, the Board of Directors may, in its discretion, when surplus profits justify, declare cash and/or
stock dividends to the shareholders of the Bank, subject to the conditions and limitations prescribed by applicable statutes and regulations, including that no dividend shall be paid to holders of common stock unless the Bank
has received written approval by the Commissioner of Banking and Consumer Finance.
Section 9.2 PAYMENT DATE. The date for payment of all authorized dividends shall be determined, from time to time, by the Board of Directors.
ARTICLE X
CONTRACTS, LOANS, CHECKS AND DEPOSITS
Section 10.1 CONTRACTS. Any officer as designated by the Chief Executive Officer or in resolutions adopted by the Board of Directors may enter into any contract or
execute and deliver any instrument in the name of and on behalf of the Bank, and such authority may be general or confined to specific instances.
Section 10.2 LOANS. No loans shall be contracted on behalf of the Bank and no evidence of indebtedness shall be issued in its name unless authorized by a resolution
of the Board of Directors. Such authority may be general or confined to specific instances.
Section 10.3 CHECKS, DRAFTS, ETC. All checks, drafts, or other orders for the payment of money, notes or other evidence of indebtedness issued in the name of the Bank
shall be signed by the Chief Executive Officer, President, Chief Financial Officer or Treasurer of the Bank, or any other officer designated by the Board of Directors or Chief Executive Officer, and in such manner as shall
from time to time be determined by resolution of the Board of Directors.
Section 10.4 DEPOSITS. All funds of the Bank not otherwise employed shall be deposited from time to time to the credit of the Bank in such banks, trust companies or
other depositaries as the Board of Directors may select.
ARTICLE XI
SEAL
Section 11.1 FORM. The Board of Directors shall provide a corporate seal which shall be circular in form and shall have inscribed thereon the name the Bank and the
State of incorporation and the words, “Corporate Seal.”
Section 11.2 AUTHORITY TO USE SEAL. The Chairman of the Board, the President or any other officer of the Bank shall have authority to affix the Corporate Seal of the
Bank and to attest the same.
Section 11.3 CUSTODY OF SEAL. The custodian of the seal shall be the Secretary or the Acting Secretary of the Board of Directors.
ARTICLE XII
MISCELLANEOUS
Section 12.1 BOOKS, ACCOUNTS AND RECORDS. Except as may be otherwise required by applicable statutes and regulations, the Articles of Incorporation and these Bylaws,
the books, accounts and records of the Bank shall be kept at such place or places as the Board of Directors may from time to time designate, and the Board of Directors shall determine whether and to what extent the accounts,
books and records of the Bank, or any of them, other than the shareholder records, shall be open to inspection of the shareholders.
Section 12.2 MINUTE BOOK RECORDS. The organization papers of the Bank, Articles of Incorporation, Bylaws and amendments thereto, and the minutes and reports of all
regular and special meetings of the Board of Directors, shareholders and committees shall be recorded in the minute books and kept in the principal office of the Bank.
Section 12.3 REAL ESTATE. All transfers and conveyances of real estate, title to which is vested in the Bank, shall be made by written instrument pursuant to the
order of the Board of Directors, signed and attested by an officer with the rank of Vice President or higher.
Section 12.4 FISCAL YEAR. The fiscal year of the Bank shall begin on the first (1st) day of January and end on the thirty-first (31st) day of December in each year.
Section 12.5 WAIVER OF NOTICE. Unless otherwise provided by law, whenever any notice is required to be given to any shareholder or director of the Bank under the
provisions of these Bylaws, the Articles or the Act, a waiver thereof in writing, signed by the person or persons entitled to such notice, whether before or after the time stated therein, shall be deemed equivalent to the
giving of such notice.
ARTICLE XIII
AMENDMENT OF BYLAWS
Section 13.1 AMENDMENT BY INTENT. The Board of Directors may amend or repeal these Bylaws, unless (i) the Articles of Incorporation or the applicable law reserves
this power exclusively to shareholders in whole or in part, or (ii) the shareholders, in amending or repealing a particular bylaw, provide expressly that the Board of Directors may not amend or repeal that bylaw. Shareholders
may amend or repeal any bylaw, even though the bylaws may also be amended or repealed by the Board of Directors.
Section 13.2 AMENDMENT BY LAW. These Bylaws shall be amended ipso facto at any time one or more of the provisions herein shall be inconsistent with the Articles of Incorporation of the
Bank and/or applicable statutes and regulations, and such amendments shall be duly recorded and approved, as a matter of course, by the Board of Directors.
Section 13.3 REQUIRED FILING. A certified copy of all amendments to these Bylaws shall be filed when required with the Department of Banking and Consumer Finance of
the State of Mississippi immediately after adoption, and as may be required by any other such regulatory authority.
ARTICLE XIV
EMERGENCY BYLAW
In the event that a quorum of directors cannot be readily assembled because of a catastrophic event (an “Emergency”), the Board of Directors may take
action by the affirmative vote of a majority of those directors present at a meeting and may exercise any emergency power granted to a board of directors under the Act not inconsistent with this bylaw. If less than three
regularly elected directors are present, the director present having the greatest seniority as a director may appoint one or more persons (not to exceed the number most recently fixed by the Board pursuant to Section 4.1) from
among the officers or other executive employees of the Bank to serve as substitute directors. If no regularly elected director is present, the officer present having the greatest seniority as an officer shall serve as a
substitute director, shall appoint up to four additional persons from among the officers or other executive employees of the Bank to serve as substitute directors. Special meetings of the Board of Directors may be called in an
Emergency by any one director or, if no director is present at the Bank’s principal offices, by the officer present having the greatest seniority as an officer.
All provisions of these Bylaws not contained in this Article XIV which are consistent with this Article XIV shall remain effective during the Emergency.
Any Emergency causing this Article XIV to become operative shall be deemed to be terminated whenever either of the following conditions is met: (i) the directors and any substitute directors determine by a majority vote at a
meeting that the Emergency is over or (ii) a majority of the directors elected pursuant to the provisions of these Bylaws other than this Article XIV hold a meeting and determine that the Emergency is over.
ARTICLE XV
CERTAIN GOVERNANCE MATTERS
Section 15.1 INTERPRETATION; DEFINITIONS.
(a) The following definitions shall apply to this Article XV and otherwise as applicable in these Bylaws:
(i)
“Designated Exchange” shall mean the primary stock exchange on which the Bank’s common stock is listed.
(ii) “Effective Time” shall have the meaning set forth in the Agreement and Plan of Merger, dated as of April 12, 2021, by and between BancorpSouth Bank and Cadence Bancorporation, as it may
have been amended, restated, supplemented or otherwise modified from time to time (the “Merger Agreement”).
(iii)
“Entire Board of Directors” shall mean the total number of directors on the Board without giving effect to vacancies.
(iv)
“First Annual Meeting” shall mean the first annual meeting of shareholders of the Bank following the Effective Time.
(v)
“Legacy Cadence” shall mean Cadence Bancorporation, a Delaware corporation, which has merged with and into the Bank effective as of the Effective Time.
(vi) “Legacy Cadence Directors” shall mean the directors as of the Effective Time who were directors of Legacy Cadence as of immediately prior to the Effective Time.
(vii) “Legacy BancorpSouth” shall mean BancorpSouth Bank, a Mississippi state-charted nonmember bank, as in existence immediately prior to the Effective Time.
(viii) “Legacy BancorpSouth Directors” shall mean the directors as of the Effective Time who were directors of Legacy BancorpSouth as of immediately prior to the Effective Time.
(ix) “Specified Period” shall mean the period beginning at the Effective Time and ending on the thirty-six (36) month anniversary of the Effective Time.
Section 15.2 CHAIRMAN; EXECUTIVE VICE CHAIRMAN; CHIEF EXECUTIVE OFFICER; INDEPENDENT LEAD DIRECTOR.
(a) Effective as of the Effective Time, (i) James D. Rollins III shall serve as the
Chairman of the Board of Directors and Chief Executive Officer of the Bank, (ii) Paul B. Murphy, Jr. shall serve as Executive Vice Chairman of the Bank and as a Director and (iii) Larry G. Kirk shall serve as Independent
Lead Director of the Board of Directors.
(b) During the Specified Period, (i) any removal of any of the
individuals serving in the capacities set forth in subsection (a) above from, or failure to appoint, re- elect or re-nominate any of them to, any such positions, (ii) any amendment or modification to any employment or
similar agreement with any of them to the extent such amendment or modification would materially and adversely affect such individual, or (iii) any termination of their employment by the Bank or any subsidiary of the Bank,
shall, in each case, require the affirmative vote of at least two-thirds (66.7%) of the Entire Board of Directors.
Section 15.3 COMPOSITION OF THE BOARD OF DIRECTORS. Notwithstanding Section 4.1 of these Bylaws:
(a) During the period between the Effective Time and the First Annual Meeting, the Board of Directors shall
be comprised of nineteen (19) Directors, of which eleven (11) shall be the Legacy BancorpSouth Directors (one of whom, as of the Effective Time, shall be the Chief Executive Officer of Legacy BancorpSouth as of immediately
prior to the Effective Time) and eight (8) shall be the Legacy Cadence Directors (one of whom, as of the Effective Time, shall be the Chief Executive Officer of Legacy Cadence as of immediately prior to the Effective Time);
(b) as of the First Annual Meeting, the Board of Directors shall
be reduced to eighteen (18) Directors;
(c) in connection with the First Annual Meeting, the Board of
Directors shall nominate a slate of Directors that is comprised of:
(i) all the Legacy Cadence Directors who are eligible to serve under the provisions of these Bylaws and, in accordance with the Bank’s
Corporate Governance Principles, who are under the age of seventy-five (75) as of the date of the First Annual Meeting; and
(ii) each Legacy BancorpSouth Director whose class term has expired as of the First Annual Meeting; and
(d) each Legacy Cadence Director nominated pursuant to Section
15.3(b)(i) shall be nominated to join that certain class of directors as set forth in Exhibit C of the Merger Agreement.
Section 15.4 COMMITTEES.
(a) During the Specified Period, the Board of Directors shall have
and maintain as standing committees an Audit Committee, a Risk Management Committee, an Executive Compensation and Stock Incentive Committee, a Nominating & Corporate Governance Committee, a Credit Risk Committee
and a Trust and Financial Services Committee.
(b) During the Specified Period, the Board of Directors may by resolution (which, during
the Specified Period, shall require the affirmative vote of at least two- thirds (66.7%) of the Entire Board of Directors) establish any committees not expressly contemplated by these Bylaws composed of directors as they may
determine to be necessary or appropriate for the conduct of business of the Bank and may prescribe the composition, duties and procedures thereof.
(c) At any time during the Specified Period in which an Executive
Committee is in existence, the chairman of the Executive Committee shall be James D. Rollins III and each of Paul B. Murphy, Jr. and Larry G. Kirk shall serve as a member of the Executive Committee.
(d) Notwithstanding anything to the contrary in these Bylaws, during the Specified Period,
no committee (including, for the avoidance of doubt, any Executive Committee, to the extent such a committee is in existence) shall be permitted to take any action, and the Board shall not delegate to any committee the power
to take any action, that, if taken by the Board of Directors, would require the affirmative vote of at least two- thirds (66.7%) of the Board of Directors pursuant to this Article XV.
Section 15.5 CORPORATE NAME; HEADQUARTERS. During the Specified Period, (a) the name of the Bank shall be “Cadence Bank”, (b) the shares of common stock of the Bank
shall be traded on the Designated Exchange under the ticker symbol “CADE”, and (c) the main office (as defined for purposes of the Mississippi Banking Law) and bank headquarters of the Bank shall be located in Tupelo,
Mississippi and the corporate headquarters shall be located in Houston, Texas.
Section 15.6 AMENDMENTS. During the Specified Period, the provisions of (a) this Article XV, and (b) any other provision of these Bylaws that sets forth the authority
and responsibility of the Chairman, Executive Vice Chairman or the Chief Executive Officer, may be modified, amended or repealed, and any Bylaw provision or other resolution inconsistent with this Article XV may be adopted, by
the Board of Directors only by (and any such modification, amendment, repeal or inconsistent Bylaw provisions and other resolutions may be proposed or recommended by the Board of Directors for adoption by the shareholders of
the Bank only by) an affirmative vote of at least two-thirds (66.7%) of the Entire Board of Directors.
|
Adopted by the Board of Directors
|
| on October 29, 2024, effective December 30, 2024. |
|
|
/s/ Cathy S. Freeman
|
|
| |
|
Cathy S. Freeman
|
|
Senior Executive Vice President and
|
|
Chief Administrative Officer
|
23
Exhibit 99.5(a)
BOARD OF GOVERNORS OF THE
FEDERAL RESERVE SYSTEM
FORM 8-K/A
(Amendment No. 1)
CURRENT REPORT PURSUANT TO
SECTION 13 OR 15(d) OF THE
SECURITIES EXCHANGE ACT OF 1934
Date of report (date of earliest event reported): December 30, 2024
CADENCE BANK
(Exact Name of Registrant as Specified in Charter)
|
Mississippi
|
|
11813
|
|
64-0117230
|
|
|
|
|
|
|
(State or Other Jurisdiction of Incorporation)
|
|
(FDIC Certificate No.)
|
|
(IRS Employer Identification No.)
|
| |
One Mississippi Plaza
201 South Spring Street
Tupelo, Mississippi
|
|
38804
|
|
|
|
|
|
|
| |
(Address of Principal Executive Offices)
|
|
(Zip Code)
|
|
Registrant’s telephone number, including area code (662) 680-2000
Check the appropriate box below if the Form 8-K filing is intended to simultaneously satisfy the filing obligation of the registrant under any of the following provisions (see
General Instruction A.2. below):
| ☐ |
Written communications pursuant to Rule 425 under the Securities Act (17 CFR 230.425)
|
| ☐ |
Soliciting material pursuant to Rule 14a-12 under the Exchange Act (17 CFR 240.14a-12)
|
| ☐ |
Pre-commencement communications pursuant to Rule 14d-2(b) under the Exchange Act (17 CFR 240.14d-2(b))
|
| ☐ |
Pre-commencement communications pursuant to Rule 13e-4(c) under the Exchange Act (17 CFR 240.13e-4(c))
|
Securities registered pursuant to Section 12(b) of the Act:
|
Title of each class
|
|
Trading Symbol(s)
|
|
Name of each exchange on which
registered
|
|
|
|
|
|
|
Common Stock, $2.50 par value per share
|
|
CADE
|
|
New York Stock Exchange
|
| |
|
|
|
|
|
Series A Preferred Stock, $0.01 par value per share
|
|
CADE-PrA
|
|
New York Stock Exchange
|
Indicate by check mark whether the registrant is an emerging growth company as defined in Rule 405 of the Securities Act of 1933 (§230.405 of this chapter) or Rule 12b-2 of the Securities Exchange Act of 1934 (§240.12b-2
of this chapter).
Emerging growth company ☐
If an emerging growth company, indicate by check mark if the registrant has elected not to use the extended transition period for complying with any new or revised financial accounting standards provided pursuant to
Section 13(a) of the Exchange Act. ☐
Explanatory Note
This Current Report on Form 8-K/A (Amendment No. 1) (this “Amendment”) is being filed by Cadence Bank (the “Company”) to amend the Current Report on Form 8-K
filed by the Company on January 3, 2025 (the “Original Form 8-K”). The sole purpose of this Amendment is to disclose under Item 5.03 the effective date of the Second Amended and Restated Articles of Incorporation of the Company (the “Articles”).
This Amendment does not amend, modify, or supplement the Original Form 8-K in any other respect.
|
Item 5.03
|
Amendments to Articles of Incorporation or Bylaws; Change in Fiscal Year
|
The Articles were declared effective on and as of January 31, 2025, in the form approved by the Company’s shareholders on December 30, 2024. A copy of the
Articles was included as Exhibit 3.1 to the Original Form 8-K.
SIGNATURES
Pursuant to the requirements of the Securities Exchange Act of 1934, the Registrant has duly caused this Report to be signed on its behalf by the undersigned
hereunto duly authorized.
| |
|
CADENCE BANK
|
| |
|
|
| |
By:
|
/s/ Cathy S. Freeman
|
| |
|
Cathy S. Freeman
|
| |
|
Senior Executive Vice President and
Chief Administrative Officer
|
| |
|
|
|
Date: February 5, 2025
|
|
|
Exhibit 99.5(b)
BOARD OF GOVERNORS OF THE
FEDERAL RESERVE SYSTEM
WASHINGTON, DC 20551
FORM 8-K/A
(Amendment No. 2)
CURRENT REPORT PURSUANT TO
SECTION 13 OR 15(d) OF THE
SECURITIES EXCHANGE ACT OF 1934
Date of report (date of earliest event reported): December 30, 2024
CADENCE BANK
(Exact Name of Registrant as Specified in Charter)
| Mississippi |
|
11813 |
|
64-0117230 |
| (State or Other Jurisdiction of |
|
(FDIC Certificate No.) |
|
(IRS Employer Identification |
| Incorporation) |
|
|
|
No.) |
| One Mississippi Plaza |
|
|
| 201 South Spring Street |
|
|
| Tupelo, Mississippi |
|
38804 |
| (Address of Principal Executive |
|
(Zip Code) |
| Offices) |
|
|
Registrant’s telephone number, including area code (662) 680-2000
Check the appropriate box below if the Form 8-K filing is intended to simultaneously satisfy the filing obligation of the registrant under any of the following provisions:
|
¨ |
Written communications pursuant to Rule 425 under the Securities Act (17 CFR 230.425) |
|
¨ |
Soliciting material pursuant to Rule 14a-12 under the Exchange Act (17 CFR 240.14a-12) |
|
¨ |
Pre-commencement communications pursuant to Rule 14d-2(b) under the Exchange Act (17 CFR 240.14d-2(b)) |
|
¨ |
Pre-commencement communications pursuant to Rule 13e-4(c) under the Exchange Act (17 CFR 240.13e-4(c)) |
Securities registered pursuant to Section 12(b) of the Act:
| |
|
|
|
Name of each exchange on which |
| Title of each class |
|
Trading Symbol(s) |
|
registered |
| Common Stock, $2.50 par value per share |
|
CADE |
|
New York Stock Exchange |
| |
|
|
|
|
| Series A Preferred Stock, $0.01 par value per share |
|
CADE-PrA |
|
New York Stock Exchange |
Indicate by check mark whether the registrant is an emerging growth company as defined in Rule 405 of the Securities Act of 1933 (§230.405 of this chapter) or Rule 12b-2 of the Securities
Exchange Act of 1934 (§240.12b-2 of this chapter).
Emerging growth company ¨
If an emerging growth company, indicate by check mark if the registrant has elected not to use the extended
transition period for complying with any new or revised financial accounting standards provided pursuant to Section 13(a) of the Exchange Act. ¨
Explanatory Note
This Current Report on Form 8-K/A (this “Amendment No. 2”) is being filed as the second amendment to the Current Report on Form 8-K filed by
Cadence Bank (the “Company”) on January 3, 2025 (the “Original Form 8-K”), as amended by Amendment No. 1 thereto filed on February 5, 2025. The sole purpose of this Amendment No. 2 is to report the voting results for Proposal 2 only with respect to the
holders of the Company’s Series A Preferred Stock, par value $0.01 per share (the “Preferred Stock”) at the Company’s special meeting of shareholders (the “Special Meeting”). As disclosed in the Original Form 8-K, the Special Meeting was adjourned to
provide additional time for holders of Preferred Stock (the “Preferred Holders”) to consider and vote on Proposal 2 and for the Company to solicit additional proxies in favor of the proposal. The vote on all proposals other than Proposal 2 with respect
to the Preferred Holders were reported in the Original Form 8-K, each of which is described more in detail in the Original Form 8-K and the Company’s Definitive Proxy Statement on Schedule 14A that was filed with the Federal Deposit Insurance
Corporation on November 19, 2024 (the “Proxy Statement”). This Amendment No. 2 does not amend, modify, or supplement the Original Form 8-K in any other respect.
|
Item 5.07 |
Submission of Matters to a Vote of Security Holders. |
On April 25, 2025, the Company reconvened the Special Meeting, which was originally held on December 30, 2024 and was subsequently adjourned and
reconvened on January 27, 2025 and March 26, 2025. The Special Meeting was adjourned each time solely for the purpose of soliciting additional proxies from Preferred Holders in favor of a proposal to authorize the Company’s board of directors to
implement repurchases of stock in accordance with Regulation H, or Proposal 2.
At the Special Meeting on April 25, 2025, Proposal 2 was submitted to the Preferred Holders for approval as set forth in the Proxy Statement. The
Preferred Stock constitutes all of the preferred stock of the Company entitled to vote at the Special Meeting. Present at the reconvened Special Meeting on April 25, 2025 in person or by proxy were Preferred Holders of 5,174,597 shares of Preferred
Stock, representing approximately 74.99% of the outstanding shares of Preferred Stock as of November 8, 2024.
Approval of Proposal 2 by the Preferred Holders requires that two-thirds of the outstanding shares of Preferred Stock as of the record date for the
Special Meeting vote “FOR” the proposal. The following is the final voting result on Proposal 2 acted upon by the Preferred Holders at the Special Meeting:
Proposal 2: Amendment to Articles to Permit Stock Repurchases
The Company’s Preferred Holders approved the proposal to amend the Articles to permit stock repurchases in accordance with Regulation H. The table below sets forth the voting
results for Proposal 2 with respect to the Preferred Holders only:
| For |
|
Against |
|
Abstain |
|
Broker Non-Votes |
| 4,686,980 |
|
431,228 |
|
56,389 |
|
0 |
As previously disclosed, the board of the directors of the Company declared a special cash dividend of $0.34375 per share of Preferred Stock if
Proposal 2 is approved by the Preferred Holders. Therefore, the special dividend is now payable on May 7, 2025, to Preferred Holders of record as of April 30, 2025.
SIGNATURES
Pursuant to the requirements of the Securities Exchange Act of 1934, the Registrant has duly caused this Report to be signed on its behalf by the undersigned hereunto
duly authorized.
| |
|
CADENCE BANK |
| |
By: |
/s/ Cathy S. Freeman |
| |
| |
|
Cathy S. Freeman |
| |
|
Senior Executive Vice President and Chief Administrative Officer
|
| |
|
|
| Date: April 25, 2025 |
|
|
Exhibit 99.6
UNITED STATES
SECURITIES AND EXCHANGE COMMISSION
WASHINGTON, DC 20549
FORM 8-K
CURRENT REPORT PURSUANT TO
SECTION 13 OR 15(d) OF THE
SECURITIES EXCHANGE ACT OF 1934
Date of report (date of earliest event reported): January 17, 2025
CADENCE BANK
(Exact Name of Registrant as Specified in Charter)
|
Mississippi
|
|
11813
|
|
64-0117230
|
| |
|
|
|
|
| (State or Other Jurisdiction of Incorporation) |
|
(FDIC Certificate No.)
|
|
(IRS Employer Identification No.)
|
|
|
One Mississippi Plaza
201 South Spring Street
Tupelo, Mississippi
|
|
38804 |
|
|
|
|
|
|
|
| |
(Address of Principal Executive Offices) |
|
(Zip Code) |
|
Registrant’s telephone number, including area code (662) 680-2000
Check the appropriate box below if the Form 8-K filing is intended to simultaneously satisfy the filing obligation of the registrant under any of the following provisions (see
General Instruction A.2. below):
|
☐
|
Written communications pursuant to Rule 425 under the Securities Act (17 CFR 230.425)
|
|
☐
|
Soliciting material pursuant to Rule 14a-12 under the Exchange Act (17 CFR 240.14a-12)
|
|
☐
|
Pre-commencement communications pursuant to Rule 14d-2(b) under the Exchange Act (17 CFR 240.14d-2(b))
|
|
☐
|
Pre-commencement communications pursuant to Rule 13e-4(c) under the Exchange Act (17 CFR 240.13e-4(c))
|
Securities registered pursuant to Section 12(b) of the Act:
|
Title of each class
|
|
Trading Symbol(s)
|
|
Name of each exchange on which
registered
|
|
|
|
|
|
|
|
Common Stock, $2.50 par value per share
|
|
CADE
|
|
New York Stock Exchange
|
| |
|
|
|
|
Series A Preferred Stock, $0.01 par value per share
|
|
CADE-PrA
|
|
New York Stock Exchange
|
Indicate by check mark whether the registrant is an emerging growth company as defined in Rule 405 of the Securities Act of 1933 (§230.405 of this chapter) or Rule 12b-2 of the Securities Exchange Act of 1934
(§240.12b-2 of this chapter).
Emerging growth company ☐
If an emerging growth company, indicate by check mark if the registrant has elected not to use the extended transition period for complying with any new or revised financial accounting standards provided pursuant to
Section 13(a) of the Exchange Act. ☐
|
Item 5.02
|
Departure of Directors or Certain Officers; Election of Directors; Appointment of Certain Officers; Compensatory Arrangements of Certain Officers.
|
Effective January 17, 2025, the Board of Directors (the “Board”) of Cadence Bank (the “Company”), upon recommendation of the Company’s Nominating and Corporate Governance Committee, appointed
Fernando Araujo and Alice Rodriguez to the Board. As appointed directors, Mr. Araujo and Ms. Rodriguez will be slated to stand for election at the Company’s 2025 Annual Meeting of Shareholders. As of the date of this filing, Mr. Araujo is expected
to serve on the Company’s Credit Risk Committee and Risk Management Committee and Ms. Rodriguez is expected to serve on the Company’s Credit Risk Committee and Nominating and Corporate Governance Committee. Each of Mr. Araujo and Ms. Rodriguez will
receive fees consistent with those fees received by the existing non-employee directors for service as a director of the Company.
|
Item 9.01.
|
Financial Statements and Exhibits.
|
|
Exhibit No.
|
Description of Exhibit
|
| |
|
|
99.1
|
Press Release issued by Cadence Bank dated January 21, 2025
|
SIGNATURES
Pursuant to the requirements of the Securities Exchange Act of 1934, the Registrant has duly caused this Report to be signed on its behalf by the undersigned hereunto duly
authorized.
| |
|
CADENCE BANK |
| |
|
|
| |
By:
|
/s/ Cathy S. Freeman
|
| |
|
Cathy S. Freeman
|
| |
|
Senior Executive Vice President and
Chief Administrative Officer
|
| |
|
|
| Date: January 21, 2025 |
|
|
Exhibit 99.1

| News Release |
For Immediate Release
|
Media Contacts:
Danielle Kernell
713-392-7709 direct
danielle.kernell@cadencebank.com
Natalie Barron
713-552-2053 direct
natalie.barron@cadencebank.com
Fernando Araujo and Alice Rodriguez Join Cadence Bank’s Board of Directors
HOUSTON and TUPELO Miss. (Jan. 21, 2025) – Cadence Bank (NYSE: CADE) today announced the appointment of Fernando Araujo and Alice Rodriguez to its board of directors, effective
Jan. 17, 2025. Araujo and Rodriguez join the board as independent directors.
Araujo is an accomplished executive with more than 30 years of experience in all aspects of oil and gas upstream operations. He has served as the chief executive officer of Berry Corporation (NASDAQ: BRY), a company
engaged in the safe and responsible development and production of conventional oil reserves in the Western United States, since January 2024, and as a director since March 2024. He joined the company in 2020 as executive vice president and chief
operating officer. Prior to his time at Berry, Araujo worked for some of the most accomplished brands in the industry, including Schlumberger, Apache Corporation, Repsol S.A. and Shell Oil.
Rodriguez spent over 35 years at JPMorgan Chase & Co. (NYSE: JPM) (and its predecessors) in various executive leadership roles, most recently as head of its community impact organization. Since her retirement from
JPMorgan, she has taken on a more active role as co-owner of Kendall Milagro, Inc., a boutique home builder in Dallas. She and her husband co-founded the company more than 20 years ago. Supporting her commitment to minority-driven causes, Rodriguez
served as chair of the U.S. Hispanic Chamber of Commerce from 2020-2022 and is currently a board member of Oncor Electric Delivery Company LLC, a privately held regulated electricity transmission and distribution company.
“We are honored to welcome Fernando and Alice to our board of directors,” said Dan Rollins, chairman and chief executive officer of Cadence Bank. “Fernando’s insights and experience in leading diverse teams as well as
in asset development and acquisitions within a highly regulated environment will be instrumental in driving our vision to help people, companies and communities prosper. Likewise, Alice’s extensive leadership across all sectors of the banking
industry – consumer, business, wealth management, operations and community impact and development, coupled with her experience as a small business operator, will be invaluable to our growth trajectory.”
“I am excited to join the Cadence Bank board of directors,” said Araujo. “Cadence is well-positioned in the industry and shares a similar operational focus on seeking positive outcomes for all stakeholders and
leveraging technology to improve efficiencies. I look forward to collaborating with this talented team to drive growth and deliver impactful results while harnessing an entrepreneurial spirit.”
Rodriguez added: “I look forward to using my strategic, operational and execution expertise to positively impact Cadence’s growth journey. Throughout my career, I have always put people and purpose first, and I
appreciate the company’s shared commitment to supporting people, companies and communities.”
To learn more, visit CadenceBank.com.
###
About Cadence Bank
Cadence Bank (NYSE: CADE) is a leading regional banking franchise with approximately $50 billion in assets and over 350 branch locations across the South and Texas. Cadence provides consumers, businesses and
corporations with a full range of innovative banking and financial solutions. Services and products include consumer banking, consumer loans, mortgages, home equity lines and loans, credit cards, commercial and business banking, treasury
management, specialized lending, asset-based lending, commercial real estate, equipment financing, correspondent banking, SBA lending, foreign exchange, wealth management, investment and trust services, financial planning and retirement plan
management. Additional information about Cadence Bank and its products and services can be found at www.cadencebank.com. Cadence Bank, Member FDIC. Equal Housing Lender.
Forward-Looking Statements
This release may contain certain “forward-looking statements” including statements concerning plans, objectives, future events or performance and assumptions and other statements, which are statements other than
statements of historical fact. The Company cautions readers that certain factors may have affected and could in the future affect actual results and could cause actual results for subsequent periods to differ materially from those expressed in any
forward-looking statement made by or on behalf of the Company herein. For a list of factors which could affect the Company’s results, see the Company’s filings with the FDIC and Federal Reserve, including “Item 1A. Risk Factors,” set forth in the
Company’s Annual Report on Form 10-K for the fiscal year ended December 31, 2023. You should not place undue reliance on any forward-looking statements. These statements speak only as of the date of this release, even if subsequently made available
by the Company on its website or otherwise. The Company undertakes no obligation to update or revise these statements to reflect events or circumstances occurring after the date of this release.
Exhibit 99.7
BOARD OF GOVERNORS OF THE
FEDERAL RESERVE SYSTEM
WASHINGTON, DC 20551
FORM 8-K
CURRENT REPORT PURSUANT TO
SECTION 13 OR 15(d) OF THE
SECURITIES EXCHANGE ACT OF 1934
Date of report (date of earliest event reported): January 27, 2025
CADENCE BANK
(Exact Name of Registrant as Specified in Charter)
|
Mississippi
|
|
11813
|
|
64-0117230
|
|
|
|
|
|
|
(State or Other Jurisdiction of Incorporation)
|
|
(FDIC Certificate No.)
|
|
(IRS Employer Identification No.)
|
|
One Mississippi Plaza
|
|
|
|
|
201 South Spring Street
|
|
|
|
|
Tupelo, Mississippi
|
|
38804
|
|
|
|
|
|
|
|
(Address of Principal Executive Offices)
|
|
(Zip Code)
|
|
Registrant’s telephone number, including area code (662) 680-2000
Check the appropriate box below if the Form 8-K filing is intended to simultaneously satisfy the filing obligation of the registrant under any of the following provisions (see
General Instruction A.2. below):
| ☐ |
Written communications pursuant to Rule 425 under the Securities Act (17 CFR 230.425)
|
| ☒ |
Soliciting material pursuant to Rule 14a-12 under the Exchange Act (17 CFR 240.14a-12)
|
| ☐ |
Pre-commencement communications pursuant to Rule 14d-2(b) under the Exchange Act (17 CFR 240.14d-2(b))
|
| ☐ |
Pre-commencement communications pursuant to Rule 13e-4(c) under the Exchange Act (17 CFR 240.13e-4(c))
|
Securities registered pursuant to Section 12(b) of the Act:
|
Title of each class
|
|
Trading Symbol(s)
|
|
Name of each exchange on which
registered
|
|
|
|
|
|
|
Common Stock, $2.50 par value per share
|
|
CADE
|
|
New York Stock Exchange
|
|
|
|
|
|
|
Series A Preferred Stock, $0.01 par value per share
|
|
CADE-PrA
|
|
New York Stock Exchange
|
Indicate by check mark whether the registrant is an emerging growth company as defined in Rule 405 of the Securities Act of 1933 (§230.405 of this chapter) or Rule 12b-2 of the Securities Exchange Act of 1934 (§240.12b-2 of this chapter).
Emerging growth company ☐
If an emerging growth company, indicate by check mark if the registrant has elected not to use the extended transition period for complying with any new or revised financial
accounting standards provided pursuant to Section 13(a) of the Exchange Act. ☐
On November 19, 2024, Cadence Bank (the “Company”) filed a definitive proxy statement with the Federal Deposit Insurance Corporation (“FDIC”) and made
available to its shareholders of record a definitive proxy statement (the “Proxy Statement”) for the Company’s 2024 Special Meeting of Shareholders (the “Special Meeting”), originally scheduled to be held on December 30, 2024 and adjourned to
January 27, 2025.
On January 27, 2025, the Company issued a press release announcing that the Special Meeting is to be further adjourned, without conducting any other
business, to March 26, 2025 at 8:45 a.m., central time. A copy of the press release is attached as Exhibit 99.1 and is incorporated herein by reference.
The reconvened Special Meeting will be held virtually via audio-only format at meetnow.global/MLVC22S. The record date for preferred shareholders entitled
to vote at the Special Meeting will remain November 8, 2024.
During the period of the adjournment, the Company will continue to solicit proxies from its preferred shareholders with respect to Proposal 2 set forth in
the Proxy Statement, as it may be supplemented. Proxies previously submitted by preferred shareholders in respect of the Special Meeting will be voted at the reconvened Special Meeting unless properly revoked.
Additional Information
This communication may be deemed to be additional solicitation material with respect to the Special Meeting. On November 19, 2024, Cadence Bank filed a definitive proxy
statement with the Federal Deposit Insurance Corporation (“FDIC”) in connection with the Special Meeting. SHAREHOLDERS ARE URGED TO READ CAREFULLY AND IN THEIR ENTIRETY THE PROXY STATEMENT AND ANY OTHER SOLICITING MATERIALS THAT ARE FILED WITH
THE FDIC OR FEDERAL RESERVE WHEN THEY BECOME AVAILABLE BECAUSE THESE DOCUMENTS CONTAIN IMPORTANT INFORMATION ABOUT THE COMPANY AND THE PROPOSAL TO BE VOTED UPON. The Company’s proxy statement and any other
solicitation materials filed by the Company with the FDIC and Federal Reserve can be obtained free of charge at the Investor Relations section of our website at ir.cadencebank.com. Shareholders may also request a copy of these materials
at no cost by contacting the Company at 201 South Spring Street, Tupelo, Mississippi 38804, or 1-800-368-5948. The Company has engaged Okapi Partners LLC to aid in the solicitation of proxies. Detailed information regarding the identity of
participants, and their respective interests in the Company by security holdings or otherwise, are set forth in the definitive proxy statement for the Special Meeting.
Forward-Looking Statements
This filing may contain certain “forward-looking statements” including statements concerning plans, objectives, future events or performance and assumptions
and other statements, which are statements other than statements of historical fact. The Company cautions readers that certain factors may have affected and could in the future affect actual results and could cause actual results for subsequent
periods to differ materially from those expressed in any forward-looking statement made by or on behalf of the Company herein. For a list of factors which could affect the Company’s results, see the Company’s filings with the FDIC and Federal
Reserve, including “Item 1A. Risk Factors,” set forth in the Company’s Annual Report on Form 10-K for the fiscal year ended December 31, 2023. You should not place undue reliance on any forward-looking statements. These statements speak only as
of the date of this filing, even if subsequently made available by the Company on its website or otherwise. The Company undertakes no obligation to update or revise these statements to reflect events or circumstances occurring after the date of
this filing.
|
Item 9.01.
|
Financial Statements and Exhibits.
|
|
Exhibit No.
|
Description of Exhibit
|
|
|
|
99.1
|
Press Release
|
SIGNATURES
Pursuant to the requirements of the Securities Exchange Act of 1934, the Registrant has duly caused this Report to be signed on its behalf by the
undersigned hereunto duly authorized.
|
|
CADENCE BANK
|
|
|
|
|
By:
|
/s/ Cathy S. Freeman
|
|
|
Cathy S. Freeman
|
|
|
Senior Executive Vice President and Chief
|
|
|
|
|
Date: January 27, 2025
|
|
|
Exhibit 99.1
| News Release |
For Immediate Release |
Media Contacts:
Danielle Kernell
713-392-7709 direct
danielle.kernell@cadencebank.com
Natalie Barron
713-552-2053 direct
natalie.barron@cadencebank.com
Cadence Bank Announces Adjournment of its Special Meeting
HOUSTON and TUPELO, Miss. – Jan. 27, 2025 – Cadence Bank (NYSE: CADE) (the Company) today announced that it has adjourned its special meeting of shareholders originally convened on Dec. 30, 2024 (the Special
Meeting), that reconvened this afternoon, until Wednesday, March 26, 2025, at 8:45 a.m. Central Time. The Special Meeting was adjourned to allow the Company additional time to solicit proxies from preferred shareholders in favor of a
proposal (Proposal 2) to authorize the Company’s Board of Directors to implement repurchases of stock in accordance with Regulation H.
The proposal is described in more detail in the Company’s proxy statement dated Nov. 19, 2024, furnished to the Company’s shareholders in connection with the solicitation of proxies by the Company’s Board of
Directors for use at the Special Meeting. The Company’s common shareholders approved Proposals 1, 2, 3 and 4 at the Special Meeting on Dec. 30, 2024, prior to adjournment, which was all of the business to be voted upon by common
shareholders at the Special Meeting. The Company’s preferred shareholders approved Proposal 4 prior to adjournment.
The record date for determining shareholders eligible to vote at the Special Meeting will remain the close of business on Nov. 8, 2024. Valid proxies submitted by Company preferred shareholders prior to the
adjourned Dec. 30, 2024 Special Meeting will continue to be valid for purposes of the reconvened Special Meeting scheduled for Wednesday, March 26, 2025.
Company preferred shareholders as of the close of business on Nov. 8, 2024, who have not voted on Proposal 2 but wish to do so should contact Okapi Partners,
the Company’s proxy solicitor, at info@okapipartners.com or (855) 208-8902 (Toll-Free).
Attending the Virtual Special Meeting
The reconvened Special Meeting of the Company’s preferred shareholders to vote on Proposal 2 will be held virtually on Wednesday, March 26, 2025, at 8:45 a.m. Central Time.
Preferred shareholders may attend and participate in the reconvened Special Meeting virtually by visiting the following web address, meetnow.global/MLVC22S, and entering the 15-digit control number found on
the Notice of Internet Availability of Proxy Materials (Notice) received. Preferred shareholders who hold shares through an intermediary, such as a bank or broker, must register in advance using the instructions in the Notice materials.
About Cadence Bank
Cadence Bank (NYSE: CADE) is a leading regional banking franchise with approximately $50 billion in assets and over 350 branch locations across the South and
Texas. Cadence Bank provides consumers, businesses and corporations with a full range of innovative banking and financial solutions. Services and products include consumer banking, consumer loans, mortgages, home equity lines and loans,
credit cards, commercial and business banking, treasury management, specialized lending, asset-based lending, commercial real estate, equipment financing, correspondent banking, SBA lending, foreign exchange, wealth management, investment
and trust services, financial planning and retirement plan management. Additional information about Cadence Bank and its products and services can be found at www.cadencebank.com. Cadence Bank, Member FDIC. Equal Housing Lender.
Additional Information
This communication may be deemed to be additional solicitation material with respect to the special meeting. On November 19, 2024, the Company filed a definitive proxy statement with the Federal Deposit
Insurance Corporation (“FDIC”) in connection with the Special Meeting. SHAREHOLDERS ARE URGED TO READ CAREFULLY AND IN THEIR ENTIRETY THE PROXY STATEMENT AND ANY OTHER SOLICITING MATERIALS THAT ARE FILED WITH THE FDIC OR FEDERAL RESERVE
WHEN THEY BECOME AVAILABLE BECAUSE THESE DOCUMENTS CONTAIN IMPORTANT INFORMATION ABOUT THE COMPANY AND THE PROPOSAL TO BE VOTED UPON. The Company’s proxy statement and any other solicitation materials filed by the Company with the FDIC and
Federal Reserve can be obtained free of charge on the Investor Relations section of our website at ir.cadencebank.com. Shareholders may also request a copy of these materials at no cost by contacting the Company at 201 South Spring Street,
Tupelo, Mississippi 38804, or 1-800-368-5948. The Company has engaged Okapi Partners LLC to aid in the solicitation of proxies. Detailed information regarding the identity of participants, and their respective interests in the Company by
security holdings or otherwise, are set forth in the definitive proxy statement for the Special Meeting.
Forward-Looking Statements
This press release may contain certain “forward-looking statements” including statements concerning plans, objectives, future events or performance and assumptions and other statements, which are statements
other than statements of historical fact. The Company cautions readers that certain factors may have affected and could in the future affect actual results and could cause actual results for subsequent periods to differ materially from
those expressed in any forward-looking statement made by or on behalf of the Company herein. For a list of factors which could affect the Company’s results, see the Company’s filings with the FDIC and Federal Reserve, including “Item 1A.
Risk Factors,” set forth in the Company’s Annual Report on Form 10-K for the fiscal year ended December 31, 2023. You should not place undue reliance on any forward-looking statements. These statements speak only as of the date of this
filing, even if subsequently made available by the Company on its website or otherwise. The Company undertakes no obligation to update or revise these statements to reflect events or circumstances occurring after the date of this press
release.
Exhibit 99.8
BOARD OF GOVERNERS OF THE
FEDERAL RESERVE SYSTEM
WASHINGTON, DC 20551
FORM 8-K
CURRENT REPORT PURSUANT TO
SECTION 13 OR 15(d) OF THE
SECURITIES EXCHANGE ACT OF 1934
Date of report (date of earliest event reported): April 23, 2025
CADENCE BANK
(Exact Name of Registrant as Specified in Charter)
|
Mississippi
|
|
11813
|
|
64-0117230
|
|
|
|
|
|
(State or Other Jurisdiction of Incorporation)
|
|
(FDIC Certificate No.)
|
|
(IRS Employer Identification No.)
|
|
One Mississippi Plaza
|
|
|
|
|
201 South Spring Street
|
|
|
|
|
Tupelo, Mississippi
|
|
38804
|
|
|
|
|
|
|
|
(Address of Principal Executive Offices)
|
|
(Zip Code)
|
|
Registrant’s telephone number, including area code (662) 680-2000
Check the appropriate box below if the Form 8-K filing is intended to simultaneously satisfy the filing obligation of the registrant under any of the following provisions (see General Instruction A.2. below):
| ☐ |
Written communications pursuant to Rule 425 under the Securities Act (17 CFR 230.425)
|
| ☐ |
Soliciting material pursuant to Rule 14a-12 under the Exchange Act (17 CFR 240.14a-12)
|
| ☐ |
Pre-commencement communications pursuant to Rule 14d-2(b) under the Exchange Act (17 CFR 240.14d-2(b))
|
| ☐ |
Pre-commencement communications pursuant to Rule 13e-4(c) under the Exchange Act (17 CFR 240.13e-4(c))
|
Securities registered pursuant to Section 12(b) of the Act:
|
Title of each class
|
|
Trading Symbol(s)
|
|
Name of each exchange on which
registered
|
|
|
|
|
|
|
Common Stock, $2.50 par value per share
|
|
CADE
|
|
New York Stock Exchange
|
| |
|
|
|
|
|
Series A Preferred Stock, $0.01 par value per share
|
|
CADE-PrA
|
|
New York Stock Exchange
|
Indicate by check mark whether the registrant is an emerging growth company as defined in Rule 405 of the Securities Act of 1933 (§230.405 of this chapter) or Rule 12b-2 of the Securities
Exchange Act of 1934 (§240.12b-2 of this chapter).
Emerging growth company ☐
If an emerging growth company, indicate by check mark if the registrant has elected not to use the extended transition period for complying with any new or revised financial accounting standards
provided pursuant to Section 13(a) of the Exchange Act. ☐
|
Item 5.07
|
Submission of Matters to a Vote of Security Holders.
|
On April 23, 2025, at the annual meeting of shareholders (the “Annual Meeting”), the Company’s shareholders: (i) elected five (5) directors; (ii) approved on a
non-binding, advisory basis the compensation paid to the Company’s named executive officers; and (iii) ratified the appointment of Forvis Mazars, LLP as the Company’s independent registered public accounting firm for the year ending December 31,
2025.
The proposals presented at the Annual Meeting are described in more detail in the Company’s Definitive Proxy Statement on Schedule 14A that was filed with the
Board of Governors of the Federal Reserve System on March 14, 2025. Holders of 166,571,607 shares of the Company’s common stock, or approximately 90.84% of the 183,370,998 shares of common stock that were issued and outstanding and entitled to
vote, were present virtually or represented by proxy at the Annual Meeting.
The following are the final voting results on the proposals presented to the Company’s shareholders at the Annual Meeting:
Proposal 1: Election of Directors
The Company’s shareholders elected the director nominees nominated by the Board to serve as directors, until the annual meeting of shareholders in 2026,
or until his or her earlier retirement by the following vote:
| Director |
For
|
Withhold |
Broker Non-Votes |
|
Fernando G. Araujo
|
152,307,519
|
1,237,004
|
13,027,084
|
|
Shannon A. Brown
|
151,658,745
|
1,885,777
|
13,027,084
|
|
William G. Holliman
|
152,686,629
|
857,894
|
13,027,084
|
|
Alice L. Rodriguez
|
153,065,367
|
479,156
|
13,027,084
|
|
James D. Rollins III
|
149,622,764
|
3,921,759
|
13,027,084
|
Proposal 2: Non-Binding, Advisory Vote Regarding the Compensation of the Company’s Named Executive Officers
The Company’s shareholders approved the resolution to approve on a non-binding, advisory basis the compensation of the Company’s named executive officers. The table below sets
forth the voting results for Proposal 2:
| For |
Against |
Abstain |
Broker Non-Votes |
|
150,110,635
|
2,916,250
|
517,637
|
13,027,084
|
Proposal 3: Ratification of Forvis Mazars, LLP as the Company’s Independent Registered Public Accounting Firm
The Company’s shareholders ratified the Audit Committee’s appointment of Forvis Mazars, LLP as the Company’s independent registered public accounting firm for the fiscal year ending December 31,
2025. The table below sets forth the voting results for Proposal 3:
|
For
|
Against
|
Abstain
|
Broker Non-Votes
|
|
165,886,732
|
346,654
|
338,220
|
0
|
SIGNATURES
Pursuant to the requirements of the Securities Exchange Act of 1934, the Registrant has duly caused this Report to be signed on its behalf by the undersigned hereunto duly
authorized.
|
|
CADENCE BANK
|
|
|
|
|
By:
|
/s/ Cathy S. Freeman
|
|
|
Cathy S. Freeman
|
|
|
Senior Executive Vice President and
Chief Administrative Officer
|
|
|
|
|
Date: April 25, 2025
|
|
|
Exhibit 99.9
BOARD OF GOVERNORS OF THE
FEDERAL RESERVE SYSTEM
WASHINGTON, DC 20551
FORM 8-K
CURRENT REPORT PURSUANT TO
SECTION 13 OR 15(d) OF THE
SECURITIES EXCHANGE ACT OF 1934
Date of report (date of earliest event reported): April 25, 2025
CADENCE BANK
(Exact Name of Registrant as Specified in Charter)
| Mississippi |
|
11813 |
|
64-0117230 |
| (State or Other Jurisdiction of |
|
(FDIC Certificate No.) |
|
(IRS Employer Identification |
| Incorporation) |
|
|
|
No.) |
| One Mississippi Plaza |
|
|
| 201 South Spring Street |
|
|
| Tupelo, Mississippi |
|
38804 |
(Address of Principal Executive
Offices) |
|
(Zip Code) |
Registrant’s telephone number, including area code (662) 680-2000
Check the appropriate box below if the Form 8-K filing is intended to simultaneously satisfy the filing obligation of the registrant under any of the following provisions
(see General Instruction A.2. below):
|
¨ |
Written communications pursuant to Rule 425 under the Securities Act (17 CFR 230.425) |
|
¨ |
Soliciting material pursuant to Rule 14a-12 under the Exchange Act (17 CFR 240.14a-12) |
|
¨ |
Pre-commencement communications pursuant to Rule 14d-2(b) under the Exchange Act (17 CFR 240.14d-2(b)) |
|
¨ |
Pre-commencement communications pursuant to Rule 13e-4(c) under the Exchange Act (17 CFR 240.13e-4(c)) |
Securities registered pursuant to Section 12(b) of the Act:
| |
|
|
|
Name of each exchange on which |
| Title of each class |
|
Trading Symbol(s) |
|
registered |
| Common Stock, $2.50 par value per share |
|
CADE |
|
New York Stock Exchange |
| |
|
|
|
|
| Series A Preferred Stock, $0.01 par value per share |
|
CADE-PrA |
|
New York Stock Exchange |
Indicate by check mark whether the registrant is an emerging growth company as defined in Rule 405 of the Securities Act of 1933 (§230.405 of this chapter) or Rule 12b-2
of the Securities Exchange Act of 1934 (§240.12b-2 of this chapter).
Emerging growth company ¨
If an emerging growth company, indicate by check mark if the registrant has elected not to use the extended
transition period for complying with any new or revised financial accounting standards provided pursuant to Section 13(a) of the Exchange Act. ¨
On April 25, 2025, the Board of Directors of Cadence Bank (“Cadence”) authorized a new share repurchase program (the “Repurchase Program”), pursuant
to which Cadence may repurchase up to an aggregate of 10,000,000 shares of Cadence common stock, par value $2.50 per share. The Repurchase Program is subject to and will be effective upon approval from the Federal Reserve, and will expire on December
31, 2025. The Repurchase Program will be conducted pursuant to a written plan and is intended to comply with federal securities laws.
A copy of the press release announcing the new Repurchase Program is filed as Exhibit 99.1 to this Current Report on Form 8-K.
|
Item 9.01. |
Financial Statements and Exhibits. |
SIGNATURES
Pursuant to the requirements of the Securities Exchange Act of 1934, the Registrant has duly caused this Report to be signed on its behalf by the
undersigned hereunto duly authorized.
| |
|
CADENCE BANK |
| |
|
|
| |
By: |
/s/ Cathy S. Freeman |
| |
|
Cathy S. Freeman |
| |
|
Senior Executive Vice President and Chief Administrative Officer
|
| |
|
|
| Date: April 25, 2025 |
|
|
Exhibit 99.1

| News Release |
For Immediate Release |
| |
|
| |
Media Contact: |
| |
Danielle Kernell |
| |
(713) 871-4051 direct |
| |
danielle.kernell@cadencebank.com |
| |
|
| |
Investor Relations: |
| |
Will Fisackerly |
| |
Director of Corporate Finance |
| |
(662) 680-2475 |
| |
IR@cadencebank.com |
Cadence Bank Announces 2025 Share Repurchase Program
HOUSTON and TUPELO, Miss. – April 25, 2025 – Cadence Bank’s (NYSE: CADE) (Cadence) Board of Directors authorized a new share repurchase program (the “Repurchase Program”)
allowing the company to purchase up to an aggregate of 10 million shares of Cadence’s common stock. The Repurchase Program is subject to and will be effective upon approval from the Federal Reserve and will expire on December 31, 2025.
Under the Repurchase Program, Cadence’s shares may be purchased periodically in open market transactions at prevailing market prices, in privately negotiated transactions,
or by other means in accordance with federal securities laws. The Repurchase Program may be extended, modified, amended, suspended or discontinued at any time at the discretion of Cadence’s Board of Directors and does not commit Cadence to repurchase
shares of its common stock. With respect to repurchases made pursuant to the Repurchase Program, the actual means of purchase, the timing of purchases, the target number of shares per purchase and the maximum price or range of prices per purchase will
be determined by management in its discretion, and will depend upon a number of factors, including Cadence’s capital position, liquidity, financial performance and alternate uses of capital, the market price of Cadence’s common stock, general market
and economic conditions, and applicable legal and regulatory requirements.
To learn more, visit CadenceBank.com.
###
About Cadence Bank
Cadence Bank (NYSE: CADE) is a $50 billion regional financial services company committed to helping people, companies and communities prosper. With more than 350 locations
spanning the South and Texas, Cadence offers comprehensive banking, investment, trust and mortgage products and services to meet the needs of individuals, businesses and corporations. Accolades include being recognized as one of the nation’s best
employers by Forbes and U.S. News & World Report and a as 2025 America’s Best Banks by Forbes. Cadence maintains corporate offices in Houston, Texas and Tupelo, Mississippi, and has dutifully served customers for nearly 150 years. Learn more at www.cadencebank.com.
Cadence Bank, Member FDIC. Equal Housing Lender.
Forward-Looking Statements
Certain statements made in this news release are not statements of historical fact and constitute "forward-looking statements" within the meaning of Section 21E of the
Securities Exchange Act of 1934, as amended, and are subject to the safe harbor created thereby under the Private Securities Litigation Reform Act of 1995 and the “bespeaks caution” doctrine. These statements are often, but not always, made through the
use of words or phrases such as “anticipate,” “assume,” “believe,” “budget,” “contemplate,” “continue,” “could,” “expect,” “foresee,” “goal,” “indicate,” “may,” “might,” “outlook,” “plan,” “project,” “prospect,” “potential,” “roadmap,” “should,”
“target,” “will,” “would,” or the negative version of those words, or other comparable words of a future or forward-looking nature. These forward-looking statements include, without limitation, statements related to the terms, timing, logistics and
conditions of Cadence’s share repurchase programs, Cadence’s utilization of the share repurchase programs, and Cadence’s compliance with applicable law including, but not limited to, federal securities laws, in connection with the administration of the
share repurchase programs.
These forward-looking statements are not historical facts, and are based upon current expectations, estimates, and projections about Cadence's industry, management's
beliefs, and certain assumptions made by management, many of which, by their nature, are inherently uncertain, involve risk, and are beyond Cadence's control. The inclusion of these forward-looking statements should not be regarded as a representation
by Cadence or any other person that such expectations, estimates, or projections will be achieved. Accordingly, Cadence cautions that any such forward-looking statements are not guarantees of future performance and are subject to risks, assumptions,
and uncertainties that are difficult to predict and that are beyond Cadence's control. Although Cadence believes these forward-looking statements are reasonable as of the date of this news release, actual results may prove to be materially different
from the results expressed or implied by the forward-looking statements. Undue reliance should not be placed on any such forward-looking statements.
Any forward-looking statement speaks only as of the date of this news release, and Cadence does not undertake any obligation to publicly update or review any
forward-looking statement, whether as a result of new information, future developments or otherwise, except as required by applicable law. New risks and uncertainties may emerge from time to time, and it is not possible for Cadence to predict their
occurrence or how they will affect Cadence. The foregoing should be read in conjunction with those risk factors that are set forth from time to time in Cadence’s periodic and current reports filed with its primary federal regulator, including those
factors included in Cadence’s Annual Report on Form 10-K for the year ended December 31, 2024 under the heading “Item 1A. Risk Factors,” in Cadence’s Quarterly Reports on Form 10-Q under the heading “Part II-Item 1A. Risk Factors,” in Cadence’s Current
Reports on Form 8-K.
Exhibit 99.10
BOARD OF GOVERNORS OF THE
FEDERAL RESERVE SYSTEM
WASHINGTON, DC 20551
FORM 8-K
CURRENT REPORT PURSUANT TO
SECTION 13 OR 15(d) OF THE
SECURITIES EXCHANGE ACT OF 1934
Date of report (date of earliest event reported): October 27, 2025
CADENCE BANK
(Exact Name of Registrant as Specified in Charter)
| Mississippi |
|
11813 |
|
64-0117230 |
| (State or Other Jurisdiction of |
|
(FDIC Certificate No.) |
|
(IRS Employer Identification No.) |
| Incorporation) |
|
|
|
|
| One Mississippi Plaza |
|
|
| 201 South Spring Street |
|
|
| Tupelo, Mississippi |
|
38804 |
| (Address of Principal Executive |
|
(Zip Code) |
| Offices) |
|
|
Registrant’s telephone number, including area code (662) 680-2000
Check the appropriate box below if the Form 8-K filing is intended to simultaneously satisfy the filing obligation of the registrant under any of the following provisions
(see General Instruction A.2. below):
|
x |
Written communications pursuant to Rule 425 under the Securities Act (17 CFR 230.425) |
|
¨ |
Soliciting material pursuant to Rule 14a-12 under the Exchange Act (17 CFR 240.14a-12) |
|
¨ |
Pre-commencement communications pursuant to Rule 14d-2(b) under the Exchange Act (17 CFR 240.14d-2(b)) |
|
¨ |
Pre-commencement communications pursuant to Rule 13e-4(c) under the Exchange Act (17 CFR 240.13e-4(c)) |
Securities registered pursuant to Section 12(b) of the Act:
| Title of each class |
|
Trading Symbol(s) |
|
Name of each exchange on which registered |
| Common Stock, $2.50 par value per share |
|
CADE |
|
New York Stock Exchange |
| |
|
|
|
|
| Series A Preferred Stock, $0.01 par value per share |
|
CADE-PrA |
|
New York Stock Exchange |
Indicate by check mark whether the registrant is an emerging growth company as defined in Rule 405 of the Securities Act of 1933 (§230.405 of this chapter) or Rule 12b-2
of the Securities Exchange Act of 1934 (§240.12b-2 of this chapter).
Emerging growth company ¨
If an emerging growth company, indicate by check mark if the registrant has elected not to use the extended
transition period for complying with any new or revised financial accounting standards provided pursuant to Section 13(a) of the Exchange Act. ¨
On October 27, 2025, in connection with the proposed merger of Cadence Bank and The Huntington National Bank, Cadence Bank posted a video
communication presented by the Chief Executive Officer of Huntington Bancshares Incorporated. A script of the video communication is attached as Exhibit 99.1 to this Current Report on Form 8-K and incorporated by reference herein.
|
Item 9.01 |
Financial Statements and Exhibits. |
EXHIBIT INDEX
CAUTION REGARDING FORWARD-LOOKING STATEMENTS
The information contained or incorporated by reference into this presentation may contain certain forward-looking statements, including, but not limited to, certain
plans, expectations, goals, projections, and statements about the benefits of the proposed transaction, the plans, objectives, expectations and intentions of Huntington Bancshares Incorporated (“Huntington”) and Cadence Bank (“Cadence”),
the expected timing of completion of the transaction, and other statements that are not historical facts. Such statements are subject to numerous assumptions, risks, estimates, uncertainties and other important factors that change over time and could
cause actual results to differ materially from any results, performance, or events expressed or implied by such forward-looking statements, including as a result of the factors referenced below. Statements that do not describe historical or current
facts, including statements about beliefs and expectations, are forward-looking statements. Forward-looking statements may be identified by words such as expect, anticipate, continue, believe, intend, estimate, plan, trend, objective, target, goal, or
similar expressions, or future or conditional verbs such as will, may, might, should, would, could, or similar variations. The forward-looking statements are intended to be subject to the safe harbor provided by Section 27A of the Securities Act of
1933, Section 21E of the Securities Exchange Act of 1934, and the Private Securities Litigation Reform Act of 1995.
Huntington and Cadence caution that the forward-looking statements in this communication are not guarantees of future performance and involve a number of known and
unknown risks, uncertainties and assumptions that are difficult to assess and are subject to change based on factors which are, in many instances, beyond Huntington’s and Cadence’s control. While there is no assurance that any list of risks and
uncertainties or risk factors is complete, below are certain factors which could cause actual results to differ materially from those contained or implied in the forward-looking statements or historical performance: changes in general economic,
political, or industry conditions; deterioration in business and economic conditions, including persistent inflation, supply chain issues or labor shortages, instability in global economic conditions and geopolitical matters, as well as volatility in
financial markets; changes in U.S. trade policies, including the imposition of tariffs and retaliatory tariffs; the impact of pandemics and other catastrophic events or disasters on the global economy and financial market conditions and our business,
results of operations, and financial condition; the impacts related to or resulting from bank failures and other volatility, including potential increased regulatory requirements and costs, such as Federal Deposit Insurance Corporation (the “FDIC”)
special assessments, long-term debt requirements and heightened capital requirements, and potential impacts to macroeconomic conditions, which could affect the ability of depository institutions, including us, to attract and retain depositors and to
borrow or raise capital; unexpected outflows of uninsured deposits which may require us to sell investment securities at a loss; changing interest rates which could negatively impact the value of our portfolio of investment securities; the loss of
value of our investment portfolio which could negatively impact market perceptions of us and could lead to deposit withdrawals; the effects of social media on market perceptions of us and banks generally; cybersecurity risks; uncertainty in U.S. fiscal
and monetary policy, including the interest rate policies of the Board of Governors of the Federal Reserve System (the “Federal Reserve”); volatility and disruptions in global capital, foreign exchange and credit markets; movements in interest
rates; competitive pressures on product pricing and services; success, impact, and timing of our business strategies, including market acceptance of any new products or services including those implementing our “Fair Play” banking philosophy; changes
in policies and standards for regulatory review of bank mergers; the nature, extent, timing, and results of governmental actions, examinations, reviews, reforms, regulations, and interpretations, including those related to the Dodd-Frank Wall Street
Reform and Consumer Protection Act and the Basel III regulatory capital reforms, as well as those involving the Securities and Exchange Commission (the “SEC”), the Office of the Comptroller of the Currency, Federal Reserve, FDIC, the Consumer
Financial Protection Bureau and state-level regulators; the occurrence of any event, change or other circumstances that could give rise to the right of one or both of the parties to terminate the merger agreement between Huntington and Cadence; the
outcome of any legal proceedings that may be instituted against Huntington or Cadence; delays in completing the proposed transaction involving Huntington and Cadence; the failure to obtain necessary regulatory approvals (and the risk that such
approvals may result in the imposition of conditions that could adversely affect the combined company or the expected benefits of the transaction); the failure to obtain Huntington shareholder approval or Cadence shareholder approval or to satisfy any
of the other conditions to the transaction on a timely basis or at all; the possibility that the anticipated benefits of the transaction are not realized when expected or at all, including as a result of the impact of, or problems arising from, the
integration of the two companies or as a result of the strength of the economy and competitive factors in the areas where Huntington and Cadence do business; the possibility that the transaction may be more expensive to complete than anticipated,
including as a result of unexpected factors or events; the ability of Huntington and Cadence to meet expectations regarding the timing, completion and accounting and tax treatment of the transaction; diversion of management’s attention from ongoing
business operations and opportunities; potential adverse reactions or changes to business, customer or employee relationships, including those resulting from the announcement or completion of the transaction; the ability to complete the transaction and
integration of Huntington and Cadence successfully; the dilution caused by Huntington’s issuance of additional shares of its capital stock in connection with the transaction; and other factors that may affect the future results of Huntington and
Cadence. Additional factors that could cause results to differ materially from those described above can be found in Huntington’s Annual Report on Form 10-K for the year ended December 31, 2024 and in its subsequent Quarterly Reports on Form 10-Q,
including for the quarter ended June 30, 2025, each of which is on file with the SEC and available on the “Investor Relations” section of Huntington’s website, http://www.huntington.com, under the heading “Investor Relations” and in other documents
Huntington files with the SEC, and in Cadence’s Annual Report on Form 10-K for the year ended December 31, 2024 and in its subsequent Quarterly Reports on Form 10-Q, including for the quarter ended June 30, 2025, each of which is on file with the
Federal Reserve and available on Cadence’s investor relations website, ir.cadencebank.com, under the heading “Public Filings” and in other documents Cadence files with the Federal Reserve.
All forward-looking statements are expressly qualified in their entirety by the cautionary statements set forth above. Forward-looking statements speak only as of the
date they are made and are based on information available at that time. Neither Huntington nor Cadence assume any obligation to update forward-looking statements to reflect actual results, new information or future events, changes in assumptions or
changes in circumstances or other factors affecting forward-looking statements that occur after the date the forward-looking statements were made or to reflect the occurrence of unanticipated events except as required by federal securities laws. If
Huntington or Cadence updates one or more forward-looking statements, no inference should be drawn that Huntington or Cadence will make additional updates with respect to those or other forward-looking statements. As forward-looking statements involve
significant risks and uncertainties, caution should be exercised against placing undue reliance on such statements.
IMPORTANT ADDITIONAL INFORMATION
In connection with the proposed transaction, Huntington will file with the SEC a Registration Statement on Form S-4 that will include a Joint Proxy Statement of
Huntington and Cadence and a Prospectus of Huntington, as well as other relevant documents concerning the proposed transaction. The proposed transaction involving Huntington and Cadence will be submitted to Huntington’s shareholders and Cadence’s
shareholders for their consideration. This communication does not constitute an offer to sell or the solicitation of an offer to buy any securities or a solicitation of any vote or approval, nor shall there be any sale of securities in any jurisdiction
in which such offer, solicitation or sale would be unlawful prior to registration or qualification under the securities laws of any such jurisdiction. INVESTORS, SHAREHOLDERS OF HUNTINGTON AND SHAREHOLDERS OF CADENCE ARE URGED TO READ THE REGISTRATION
STATEMENT AND THE JOINT PROXY STATEMENT/PROSPECTUS REGARDING THE TRANSACTION WHEN IT BECOMES AVAILABLE AND ANY OTHER RELEVANT DOCUMENTS FILED WITH THE SEC AND THE FEDERAL RESERVE, AS WELL AS ANY AMENDMENTS OR SUPPLEMENTS TO THOSE DOCUMENTS, BECAUSE
THEY WILL CONTAIN IMPORTANT INFORMATION. Shareholders will be able to obtain a free copy of the definitive joint proxy statement/prospectus, as well as other filings containing information about Huntington and Cadence, without charge, at the SEC’s
website (http://www.sec.gov) and Cadence’s website (https://ir.cadencebank.com/fdic-federal-reserve-filings), respectively. Copies of the joint proxy statement/prospectus, when available, and the filings with the SEC and the Federal Reserve that will
be incorporated by reference in the joint proxy statement/prospectus can also be obtained, without charge, by directing a request to Huntington Investor Relations, Huntington Bancshares Incorporated, Huntington Center, 41 South High Street, Columbus,
Ohio 43287, (800) 576-5007. Copies of the joint proxy statement/prospectus, when available, and filings containing information about Cadence may be obtained after their filing with the Federal Reserve at
(https://ir.cadencebank.com/fdic-federal-reserve-filings), by directing a request to Will Fisackerly, Cadence Investor Relations, Cadence Bank, (800) 698-7878, IR@cadencebank.com. References to Cadence’s website does not constitute incorporation by
reference of the information contained on the website and is not, and should not be, deemed part of this filing.
PARTICIPANTS IN THE SOLICITATION
Huntington, Cadence, and certain of their respective directors and executive officers may be deemed to be participants in the solicitation of proxies from the
shareholders of Huntington and shareholders of Cadence in connection with the proposed transaction. Information regarding the interests of the directors and executive officers of Huntington and Cadence and other persons who may be deemed to be
participants in the solicitation of shareholders of Huntington and Cadence in connection with the transaction and a description of their direct and indirect interests, by security holdings or otherwise, will be included in the definitive joint proxy
statement/prospectus related to the transaction, which will be filed by Huntington with the SEC. Information regarding Huntington’s directors and executive officers is available in its definitive joint proxy statement relating to its 2025 Annual
Meeting of Shareholders, which was filed with the SEC on March 6, 2025, and other documents filed by Huntington with the SEC. Information regarding Cadence’s directors and executive officers is available in its definitive proxy statement relating to
its 2025 Annual Meeting of Shareholders, which was filed with the Federal Reserve on March 14, 2025, and other documents filed by Cadence with the Federal Reserve. Other information regarding the participants in the proxy solicitation and a description
of their direct and indirect interests, by security holdings or otherwise, will be contained in the joint proxy statement/prospectus and other relevant materials filed with the SEC and the Federal Reserve by Huntington and Cadence, respectively. Free
copies of these documents may be obtained as described above under “Important Additional Information.”
SIGNATURES
Pursuant to the requirements of the Securities Exchange Act of 1934, the Registrant has duly caused this Report to be signed on its behalf by the
undersigned hereunto duly authorized.
| |
CADENCE BANK |
| |
|
|
| |
By |
/s/ Cathy S. Freeman |
| |
|
Cathy S. Freeman |
| |
|
Senior Executive Vice President and Chief Administrative
Officer |
| |
|
|
| Date: October 27, 2025 |
|
|
Exhibit 99.1
Video Transcript for Video to Cadence Bank Teammates from Steve Steinour
Hi everyone. Let me begin by extending a warm welcome.
My name is Steve Steinour and I've had the privilege to serve as the CEO at Huntington since 2009.
And on behalf of all of us at Huntington, I want you to know how excited we are to partner with you.
Cadence’s legacy is built on deep local knowledge and enduring relationships—often spanning generations. That relationship-first, the community-based approach, is at the
heart of Huntington’s model also. As we come together, we have a clear goal: to bring the full power of our combined capabilities to your customers and communities.
Now many of us have been on both sides of combinations like this—I know I have at various points in my career—and I understand the mix of emotions and the questions, the
great questions, that come with it. So let me address the most immediate questions up front.
First and foremost, what does this mean for you?
We are not here to close branches or pull back. In fact, we're not planning to close any of the branches during this combination. We’re here to invest: In you, in people,
and in certain markets and businesses. We’re here to grow.
In almost all of the markets in which you operate, we don't have teams. We don’t have colleagues. So we’re asking you and we’re counting on you to become our team. We
hope you’ll join us as we, together, continue to build a purpose-led bank. And we expect to retain the majority of the customer-facing colleagues. These positions are really important to us as we move forward.
And you and your teams are crucial to customer retention and the future growth of our combined organization. And together, we can provide more tools, products and
services to help you serve your customers more efficiently and effectively.
And where there are potential overlaps and job impacts, we’re going to do the best we can to find other opportunities for this impacted from all across our organization.
There’s still a lot to work through as we begin the integration process. But we’re committed to being open and transparent at every step of this process. We won’t always
have immediate answers, but we will provide information as soon as we have it.
And you’ll soon begin to receive regular updates, including access to an integration website and frequently asked questions with our answers.
Second: What does this mean for your customers?
The partnership will help us do even more to serve both new and existing customers.
It means access to a broader portfolio of products and services, new digital tools, award-winning capabilities - including those digital tools - and other capabilities
that will enhance yours and their experiences.
And, as a combined team we’ll continue to support and manage our customer relationships locally. We are a big believer and are strategically committed to local delivery.
That's core to our business and consistent with the relationship-first approach that Cadence is so well known for.
Third: What does this mean for your communities?
Since 1876, Cadence has played a special role in your communities.
And we recognize and deeply respect that legacy.
We want to honor it. We actually want to build on it.
And like you, Huntington is deeply engaged in the places we work and live: from small towns to big cities and everything in between.
We’re going to maintain community partnerships and philanthropic commitments that are established. And we’ll continue to invest in your communities—places like Tupelo,
Houston, Birmingham, Atlanta, and many more—for the long term.
Now, looking ahead.
This week, Huntington’s senior leaders will be in Mississippi, Texas and a number of cities to meet with you, to listen to you, and to learn from you. We’re looking
forward to sharing more about who Huntington is and what we stand for. And over the coming weeks and months, we'll visit even more locations to learn more about all of you, the teams we have and the communities you serve.
Once again, I’m thrilled and honored to welcome you to Huntington.
We’re proud to be your partner, and I look forward to a brighter future together.
Thank you very, very much.
Exhibit 99.11
BOARD OF GOVERNORS OF THE
FEDERAL RESERVE SYSTEM
WASHINGTON, DC 20551
FORM 8-K
CURRENT REPORT PURSUANT TO
SECTION 13 OR 15(d) OF THE
SECURITIES EXCHANGE ACT OF 1934
Date of report (date of earliest event reported): October 27, 2025
CADENCE BANK
(Exact Name of Registrant as Specified in Charter)
| Mississippi |
|
11813 |
|
64-0117230 |
|
(State or Other Jurisdiction of
Incorporation)
|
|
(FDIC Certificate No.) |
|
(IRS Employer Identification No.) |
| One Mississippi Plaza |
|
|
| 201 South Spring Street |
|
|
| Tupelo, Mississippi |
|
38804 |
| (Address of Principal Executive |
|
(Zip Code) |
| Offices) |
|
|
Registrant’s telephone number, including area code (662) 680-2000
Check the appropriate box below if the Form 8-K filing is intended to simultaneously satisfy the filing obligation of the registrant under any of the following
provisions (see General Instruction A.2. below):
|
x |
Written communications pursuant to Rule 425 under the Securities Act (17 CFR 230.425) |
|
¨ |
Soliciting material pursuant to Rule 14a-12 under the Exchange Act (17 CFR 240.14a-12) |
|
¨ |
Pre-commencement communications pursuant to Rule 14d-2(b) under the Exchange Act (17 CFR 240.14d-2(b)) |
|
¨ |
Pre-commencement communications pursuant to Rule 13e-4(c) under the Exchange Act (17 CFR 240.13e-4(c)) |
Securities registered pursuant to Section 12(b) of the Act:
| Title of each class |
|
Trading Symbol(s) |
|
Name of each exchange on which registered |
| Common Stock, $2.50 par value per share |
|
CADE |
|
New York Stock Exchange |
| |
|
|
|
|
| Series A Preferred Stock, $0.01 par value per share |
|
CADE-PrA |
|
New York Stock Exchange |
Indicate by check mark whether the registrant is an emerging growth company as defined in Rule 405 of the Securities Act of 1933 (§230.405 of this chapter) or Rule
12b-2 of the Securities Exchange Act of 1934 (§240.12b-2 of this chapter).
Emerging growth company ¨
If an emerging growth company, indicate by check mark if the registrant has elected not to use the extended
transition period for complying with any new or revised financial accounting standards provided pursuant to Section 13(a) of the Exchange Act. ¨
On October 27, 2025, in connection with the proposed merger of Cadence Bank and The Huntington National Bank, the Chief Executive Officer of
Cadence Bank sent an email to employees of Cadence Bank. A copy of the email is attached as Exhibit 99.1 to this Current Report on Form 8-K and incorporated by reference herein.
| Item 9.01 |
Financial Statements and Exhibits. |
EXHIBIT INDEX
CAUTION REGARDING FORWARD-LOOKING STATEMENTS
The information contained or incorporated by reference into this presentation may contain certain forward-looking statements, including, but not limited to, certain
plans, expectations, goals, projections, and statements about the benefits of the proposed transaction, the plans, objectives, expectations and intentions of Huntington Bancshares Incorporated (“Huntington”) and Cadence Bank (“Cadence”),
the expected timing of completion of the transaction, and other statements that are not historical facts. Such statements are subject to numerous assumptions, risks, estimates, uncertainties and other important factors that change over time and could
cause actual results to differ materially from any results, performance, or events expressed or implied by such forward-looking statements, including as a result of the factors referenced below. Statements that do not describe historical or current
facts, including statements about beliefs and expectations, are forward-looking statements. Forward-looking statements may be identified by words such as expect, anticipate, continue, believe, intend, estimate, plan, trend, objective, target, goal, or
similar expressions, or future or conditional verbs such as will, may, might, should, would, could, or similar variations. The forward-looking statements are intended to be subject to the safe harbor provided by Section 27A of the Securities Act of
1933, Section 21E of the Securities Exchange Act of 1934, and the Private Securities Litigation Reform Act of 1995.
Huntington and Cadence caution that the forward-looking statements in this communication are not guarantees of future performance and involve a number of known and
unknown risks, uncertainties and assumptions that are difficult to assess and are subject to change based on factors which are, in many instances, beyond Huntington’s and Cadence’s control. While there is no assurance that any list of risks and
uncertainties or risk factors is complete, below are certain factors which could cause actual results to differ materially from those contained or implied in the forward-looking statements or historical performance: changes in general economic,
political, or industry conditions; deterioration in business and economic conditions, including persistent inflation, supply chain issues or labor shortages, instability in global economic conditions and geopolitical matters, as well as volatility in
financial markets; changes in U.S. trade policies, including the imposition of tariffs and retaliatory tariffs; the impact of pandemics and other catastrophic events or disasters on the global economy and financial market conditions and our business,
results of operations, and financial condition; the impacts related to or resulting from bank failures and other volatility, including potential increased regulatory requirements and costs, such as Federal Deposit Insurance Corporation (the “FDIC”)
special assessments, long-term debt requirements and heightened capital requirements, and potential impacts to macroeconomic conditions, which could affect the ability of depository institutions, including us, to attract and retain depositors and to
borrow or raise capital; unexpected outflows of uninsured deposits which may require us to sell investment securities at a loss; changing interest rates which could negatively impact the value of our portfolio of investment securities; the loss of
value of our investment portfolio which could negatively impact market perceptions of us and could lead to deposit withdrawals; the effects of social media on market perceptions of us and banks generally; cybersecurity risks; uncertainty in U.S. fiscal
and monetary policy, including the interest rate policies of the Board of Governors of the Federal Reserve System (the “Federal Reserve”); volatility and disruptions in global capital, foreign exchange and credit markets; movements in interest
rates; competitive pressures on product pricing and services; success, impact, and timing of our business strategies, including market acceptance of any new products or services including those implementing our “Fair Play” banking philosophy; changes
in policies and standards for regulatory review of bank mergers; the nature, extent, timing, and results of governmental actions, examinations, reviews, reforms, regulations, and interpretations, including those related to the Dodd-Frank Wall Street
Reform and Consumer Protection Act and the Basel III regulatory capital reforms, as well as those involving the Securities and Exchange Commission (the “SEC”), the Office of the Comptroller of the Currency, Federal Reserve, FDIC, the Consumer
Financial Protection Bureau and state-level regulators; the occurrence of any event, change or other circumstances that could give rise to the right of one or both of the parties to terminate the merger agreement between Huntington and Cadence; the
outcome of any legal proceedings that may be instituted against Huntington or Cadence; delays in completing the proposed transaction involving Huntington and Cadence; the failure to obtain necessary regulatory approvals (and the risk that such
approvals may result in the imposition of conditions that could adversely affect the combined company or the expected benefits of the transaction); the failure to obtain Huntington shareholder approval or Cadence shareholder approval or to satisfy any
of the other conditions to the transaction on a timely basis or at all; the possibility that the anticipated benefits of the transaction are not realized when expected or at all, including as a result of the impact of, or problems arising from, the
integration of the two companies or as a result of the strength of the economy and competitive factors in the areas where Huntington and Cadence do business; the possibility that the transaction may be more expensive to complete than anticipated,
including as a result of unexpected factors or events; the ability of Huntington and Cadence to meet expectations regarding the timing, completion and accounting and tax treatment of the transaction; diversion of management’s attention from ongoing
business operations and opportunities; potential adverse reactions or changes to business, customer or employee relationships, including those resulting from the announcement or completion of the transaction; the ability to complete the transaction and
integration of Huntington and Cadence successfully; the dilution caused by Huntington’s issuance of additional shares of its capital stock in connection with the transaction; and other factors that may affect the future results of Huntington and
Cadence. Additional factors that could cause results to differ materially from those described above can be found in Huntington’s Annual Report on Form 10-K for the year ended December 31, 2024 and in its subsequent Quarterly Reports on Form 10-Q,
including for the quarter ended June 30, 2025, each of which is on file with the SEC and available on the “Investor Relations” section of Huntington’s website, http://www.huntington.com, under the heading “Investor Relations” and in other documents
Huntington files with the SEC, and in Cadence’s Annual Report on Form 10-K for the year ended December 31, 2024 and in its subsequent Quarterly Reports on Form 10-Q, including for the quarter ended June 30, 2025, each of which is on file with the
Federal Reserve and available on Cadence’s investor relations website, ir.cadencebank.com, under the heading “Public Filings” and in other documents Cadence files with the Federal Reserve.
All forward-looking statements are expressly qualified in their entirety by the cautionary statements set forth above. Forward-looking statements speak only as of the
date they are made and are based on information available at that time. Neither Huntington nor Cadence assume any obligation to update forward-looking statements to reflect actual results, new information or future events, changes in assumptions or
changes in circumstances or other factors affecting forward-looking statements that occur after the date the forward-looking statements were made or to reflect the occurrence of unanticipated events except as required by federal securities laws. If
Huntington or Cadence updates one or more forward-looking statements, no inference should be drawn that Huntington or Cadence will make additional updates with respect to those or other forward-looking statements. As forward-looking statements involve
significant risks and uncertainties, caution should be exercised against placing undue reliance on such statements.
IMPORTANT ADDITIONAL INFORMATION
In connection with the proposed transaction, Huntington will file with the SEC a Registration Statement on Form S-4 that will include a Joint Proxy Statement of
Huntington and Cadence and a Prospectus of Huntington, as well as other relevant documents concerning the proposed transaction. The proposed transaction involving Huntington and Cadence will be submitted to Huntington’s shareholders and Cadence’s
shareholders for their consideration. This communication does not constitute an offer to sell or the solicitation of an offer to buy any securities or a solicitation of any vote or approval, nor shall there be any sale of securities in any jurisdiction
in which such offer, solicitation or sale would be unlawful prior to registration or qualification under the securities laws of any such jurisdiction. INVESTORS, SHAREHOLDERS OF HUNTINGTON AND SHAREHOLDERS OF CADENCE ARE URGED TO READ THE REGISTRATION
STATEMENT AND THE JOINT PROXY STATEMENT/PROSPECTUS REGARDING THE TRANSACTION WHEN IT BECOMES AVAILABLE AND ANY OTHER RELEVANT DOCUMENTS FILED WITH THE SEC AND THE FEDERAL RESERVE, AS WELL AS ANY AMENDMENTS OR SUPPLEMENTS TO THOSE DOCUMENTS, BECAUSE
THEY WILL CONTAIN IMPORTANT INFORMATION. Shareholders will be able to obtain a free copy of the definitive joint proxy statement/prospectus, as well as other filings containing information about Huntington and Cadence, without charge, at the SEC’s
website (http://www.sec.gov) and Cadence’s website (https://ir.cadencebank.com/fdic-federal-reserve-filings), respectively. Copies of the joint proxy statement/prospectus, when available, and the filings with the SEC and the Federal Reserve that will
be incorporated by reference in the joint proxy statement/prospectus can also be obtained, without charge, by directing a request to Huntington Investor Relations, Huntington Bancshares Incorporated, Huntington Center, 41 South High Street, Columbus,
Ohio 43287, (800) 576-5007. Copies of the joint proxy statement/prospectus, when available, and filings containing information about Cadence may be obtained after their filing with the Federal Reserve at
(https://ir.cadencebank.com/fdic-federal-reserve-filings), by directing a request to Will Fisackerly, Cadence Investor Relations, Cadence Bank, (800) 698-7878, IR@cadencebank.com. References to Cadence’s website does not constitute incorporation by
reference of the information contained on the website and is not, and should not be, deemed part of this filing.
PARTICIPANTS IN THE SOLICITATION
Huntington, Cadence, and certain of their respective directors and executive officers may be deemed to be participants in the solicitation of proxies from the
shareholders of Huntington and shareholders of Cadence in connection with the proposed transaction. Information regarding the interests of the directors and executive officers of Huntington and Cadence and other persons who may be deemed to be
participants in the solicitation of shareholders of Huntington and Cadence in connection with the transaction and a description of their direct and indirect interests, by security holdings or otherwise, will be included in the definitive joint proxy
statement/prospectus related to the transaction, which will be filed by Huntington with the SEC. Information regarding Huntington’s directors and executive officers is available in its definitive joint proxy statement relating to its 2025 Annual
Meeting of Shareholders, which was filed with the SEC on March 6, 2025, and other documents filed by Huntington with the SEC. Information regarding Cadence’s directors and executive officers is available in its definitive proxy statement relating to
its 2025 Annual Meeting of Shareholders, which was filed with the Federal Reserve on March 14, 2025, and other documents filed by Cadence with the Federal Reserve. Other information regarding the participants in the proxy solicitation and a description
of their direct and indirect interests, by security holdings or otherwise, will be contained in the joint proxy statement/prospectus and other relevant materials filed with the SEC and the Federal Reserve by Huntington and Cadence, respectively. Free
copies of these documents may be obtained as described above under “Important Additional Information.”
SIGNATURES
Pursuant to the requirements of the Securities Exchange Act of 1934, the Registrant has duly caused this Report to be signed on its behalf by the
undersigned hereunto duly authorized.
| |
CADENCE BANK |
| |
|
|
| |
By |
/s/ Cathy S. Freeman |
| |
|
Cathy S. Freeman |
| |
|
Senior Executive Vice President and Chief Administrative Officer |
| |
|
|
| Date: October 27, 2025 |
|
|
Exhibit 99.1
Announcement Email to Cadence Bank Teammates
| Audience: |
All Teammates |
| Delivery: |
Dan’s Outlook Account |
| Sent by: |
Dan Rollins |
| Date: |
Monday, Oct. 27 |
| Time: |
7 a.m. CT |
| Subject: |
New Partnership with Huntington Bank |
Teammates,
We are excited to announce our decision to partner with Huntington Bank, so we can do more to help people, companies and communities prosper.
Founded in 1866 and headquartered in Columbus, Ohio, Huntington shares the same relationship-first, community-based approach that our legacy is built on and will bring expanded
capabilities and award-winning digital tools to our customers across the South and Texas.
In making this decision, it was incredibly important to us that we engage with a partner that leads with a people-first focus, and that’s what you will find in Huntington. I have seen
this firsthand, as Senior Management and I have been working together with the Huntington team throughout the planning process to position our combined organization for long-term success.
I want to share a few more reasons why we are so excited about this partnership.
|
· |
Our complementary footprints mean there is virtually no overlap in markets or branches, and Huntington is intent on maintaining and growing our branch network,
especially in the fast-growing markets we operate in. |
|
· |
Huntington is looking forward to welcoming our team and the deep knowledge and relationships that we bring. Our branches and teams will be crucial to customer
retention and the future growth of our combined organization. In most of the places we operate, they don’t, and they are counting on us to become one team and continue growing the business across our footprint. |
|
· |
Huntington’s broad portfolio of products and services and advanced digital capabilities will help us serve customers—and grow business—more efficiently and
effectively than ever before. |
|
· |
Huntington’s model of delivering locally, driven by local bankers, local decision making, local relationships and local community engagement, aligns with ours. |
|
· |
Our histories are also well aligned. We were established in 1876, just 10 years after Huntington. Like us, they were founded on modest roots and grew
organically and through strategic combinations. |
|
· |
They are deeply engaged in the communities where they live and work—from small towns to big cities and everything in between. |
I expect you have many questions. Please join our All Teammate Webinar at 8 a.m. CT today to learn more about what this partnership means for you, our
customers and our communities.
Due to the large number of teammates expected on this morning’s call, we will not be conducting Q&A, but I will do my best to answer your most pressing questions.
Both companies are committed to being open and transparent throughout this process. While we may not always have immediate answers to your questions, we will provide information as soon as it is available.
I will be joining Huntington’s executive and senior leaders in visiting with you across our footprint in the coming days and weeks. They are looking forward to
telling you more about who Huntington is and what they stand for, and to meeting you, listening and learning. I am also excited to talk to you about the significant role I will be playing in the combined company.
This is a defining moment for our company—one made possible because of the outstanding work you do to support our customers and communities and grow our business.
***
CAUTION REGARDING FORWARD-LOOKING STATEMENTS
This communication may contain certain forward-looking statements, including, but not limited to, certain plans, expectations, goals, projections, and statements
about the benefits of the proposed transaction, the plans, objectives, expectations and intentions of Huntington Bancshares Incorporated (“Huntington”) and Cadence Bank (“Cadence”), the expected timing of completion of the transaction,
and other statements that are not historical facts. Such statements are subject to numerous assumptions, risks, estimates, uncertainties and other important factors that change over time and could cause actual results to differ materially from any
results, performance, or events expressed or implied by such forward-looking statements, including as a result of the factors referenced below. Statements that do not describe historical or current facts, including statements about beliefs and
expectations, are forward-looking statements. Forward-looking statements may be identified by words such as expect, anticipate, continue, believe, intend, estimate, plan, trend, objective, target, goal, or similar expressions, or future or conditional
verbs such as will, may, might, should, would, could, or similar variations. The forward-looking statements are intended to be subject to the safe harbor provided by Section 27A of the Securities Act of 1933, Section 21E of the Securities Exchange Act
of 1934, and the Private Securities Litigation Reform Act of 1995.
Huntington and Cadence caution that the forward-looking statements in this communication are not guarantees of future performance and involve a number of known and
unknown risks, uncertainties and assumptions that are difficult to assess and are subject to change based on factors which are, in many instances, beyond Huntington’s and Cadence’s control. While there is no assurance that any list of risks and
uncertainties or risk factors is complete, below are certain factors which could cause actual results to differ materially from those contained or implied in the forward-looking statements or historical performance: changes in general economic,
political, or industry conditions; deterioration in business and economic conditions, including persistent inflation, supply chain issues or labor shortages, instability in global economic conditions and geopolitical matters, as well as volatility in
financial markets; changes in U.S. trade policies, including the imposition of tariffs and retaliatory tariffs; the impact of pandemics and other catastrophic events or disasters on the global economy and financial market conditions and our business,
results of operations, and financial condition; the impacts related to or resulting from bank failures and other volatility, including potential increased regulatory requirements and costs, such as Federal Deposit Insurance Corporation (the “FDIC”)
special assessments, long-term debt requirements and heightened capital requirements, and potential impacts to macroeconomic conditions, which could affect the ability of depository institutions, including us, to attract and retain depositors and to
borrow or raise capital; unexpected outflows of uninsured deposits which may require us to sell investment securities at a loss; changing interest rates which could negatively impact the value of our portfolio of investment securities; the loss of
value of our investment portfolio which could negatively impact market perceptions of us and could lead to deposit withdrawals; the effects of social media on market perceptions of us and banks generally; cybersecurity risks; uncertainty in U.S. fiscal
and monetary policy, including the interest rate policies of the Board of Governors of the Federal Reserve System (the “Federal Reserve”); volatility and disruptions in global capital, foreign exchange and credit markets; movements in interest
rates; competitive pressures on product pricing and services; success, impact, and timing of our business strategies, including market acceptance of any new products or services including those implementing our “Fair Play” banking philosophy; changes
in policies and standards for regulatory review of bank mergers; the nature, extent, timing, and results of governmental actions, examinations, reviews, reforms, regulations, and interpretations, including those related to the Dodd-Frank Wall Street
Reform and Consumer Protection Act and the Basel III regulatory capital reforms, as well as those involving the Securities and Exchange Commission (the “SEC”), the Office of the Comptroller of the Currency, Federal Reserve, FDIC, the Consumer
Financial Protection Bureau and state-level regulators; the occurrence of any event, change or other circumstances that could give rise to the right of one or both of the parties to terminate the merger agreement between Huntington and Cadence; the
outcome of any legal proceedings that may be instituted against Huntington or Cadence; delays in completing the proposed transaction involving Huntington and Cadence; the failure to obtain necessary regulatory approvals (and the risk that such
approvals may result in the imposition of conditions that could adversely affect the combined company or the expected benefits of the transaction); the failure to obtain Huntington shareholder approval or Cadence shareholder approval or to satisfy any
of the other conditions to the transaction on a timely basis or at all; the possibility that the anticipated benefits of the transaction are not realized when expected or at all, including as a result of the impact of, or problems arising from, the
integration of the two companies or as a result of the strength of the economy and competitive factors in the areas where Huntington and Cadence do business; the possibility that the transaction may be more expensive to complete than anticipated,
including as a result of unexpected factors or events; the ability of Huntington and Cadence to meet expectations regarding the timing, completion and accounting and tax treatment of the transaction; diversion of management’s attention from ongoing
business operations and opportunities; potential adverse reactions or changes to business, customer or employee relationships, including those resulting from the announcement or completion of the transaction; the ability to complete the transaction and
integration of Huntington and Cadence successfully; the dilution caused by Huntington’s issuance of additional shares of its capital stock in connection with the transaction; and other factors that may affect the future results of Huntington and
Cadence. Additional factors that could cause results to differ materially from those described above can be found in Huntington’s Annual Report on Form 10-K for the year ended December 31, 2024 and in its subsequent Quarterly Reports on Form 10-Q,
including for the quarter ended June 30, 2025, each of which is on file with the SEC and available on the “Investor Relations” section of Huntington’s website, http://www.huntington.com, under the heading “Investor Relations” and in other
documents Huntington files with the SEC, and in Cadence’s Annual Report on Form 10-K for the year ended December 31, 2024 and in its subsequent Quarterly Reports on Form 10-Q, including for the quarter ended June 30, 2025, each of which is on file with
the Federal Reserve and available on Cadence’s investor relations website, ir.cadencebank.com, under the heading “Public Filings” and in other documents Cadence files with the Federal Reserve.
All forward-looking statements are expressly qualified in their entirety by the cautionary statements set forth above. Forward-looking statements speak only as of the
date they are made and are based on information available at that time. Neither Huntington nor Cadence assume any obligation to update forward-looking statements to reflect actual results, new information or future events, changes in assumptions or
changes in circumstances or other factors affecting forward-looking statements that occur after the date the forward-looking statements were made or to reflect the occurrence of unanticipated events except as required by federal securities laws. If
Huntington or Cadence updates one or more forward-looking statements, no inference should be drawn that Huntington or Cadence will make additional updates with respect to those or other forward-looking statements. As forward-looking statements involve
significant risks and uncertainties, caution should be exercised against placing undue reliance on such statements.
IMPORTANT ADDITIONAL INFORMATION
In connection with the proposed transaction, Huntington will file with the SEC a Registration Statement on Form S-4 that will include a Joint Proxy Statement of
Huntington and Cadence and a Prospectus of Huntington, as well as other relevant documents concerning the proposed transaction. The proposed transaction involving Huntington and Cadence will be submitted to Huntington’s shareholders and Cadence’s
shareholders for their consideration. This communication does not constitute an offer to sell or the solicitation of an offer to buy any securities or a solicitation of any vote or approval, nor shall there be any sale of securities in any jurisdiction
in which such offer, solicitation or sale would be unlawful prior to registration or qualification under the securities laws of any such jurisdiction. INVESTORS, SHAREHOLDERS OF HUNTINGTON AND SHAREHOLDERS OF CADENCE ARE URGED TO READ THE REGISTRATION
STATEMENT AND THE JOINT PROXY STATEMENT/PROSPECTUS REGARDING THE TRANSACTION WHEN IT BECOMES AVAILABLE AND ANY OTHER RELEVANT DOCUMENTS FILED WITH THE SEC AND THE FEDERAL RESERVE, AS WELL AS ANY AMENDMENTS OR SUPPLEMENTS TO THOSE DOCUMENTS, BECAUSE
THEY WILL CONTAIN IMPORTANT INFORMATION. Shareholders will be able to obtain a free copy of the definitive joint proxy statement/prospectus, as well as other filings containing information about Huntington and Cadence, without charge, at the SEC’s
website (http://www.sec.gov) and Cadence’s website (https://ir.cadencebank.com/fdic-federal-reserve-filings), respectively. Copies of the joint proxy statement/prospectus, when available, and the filings with the SEC and the Federal
Reserve that will be incorporated by reference in the joint proxy statement/prospectus can also be obtained, without charge, by directing a request to Huntington Investor Relations, Huntington Bancshares Incorporated, Huntington Center, 41 South High
Street, Columbus, Ohio 43287, (800) 576-5007. Copies of the joint proxy statement/prospectus, when available, and filings containing information about Cadence may be obtained after their filing with the Federal Reserve at (https://ir.cadencebank.com/fdic-federal-reserve-filings),
by directing a request to Will Fisackerly, Cadence Investor Relations, Cadence Bank, (800) 698-7878, IR@cadencebank.com. References to Cadence’s website does not constitute incorporation by reference of the information contained on the website
and is not, and should not be, deemed part of this filing.
PARTICIPANTS IN THE SOLICITATION
Huntington, Cadence, and certain of their respective directors and executive officers may be deemed to be participants in the solicitation of proxies from the
shareholders of Huntington and shareholders of Cadence in connection with the proposed transaction. Information regarding the interests of the directors and executive officers of Huntington and Cadence and other persons who may be deemed to be
participants in the solicitation of shareholders of Huntington and Cadence in connection with the transaction and a description of their direct and indirect interests, by security holdings or otherwise, will be included in the definitive joint proxy
statement/prospectus related to the transaction, which will be filed by Huntington with the SEC. Information regarding Huntington’s directors and executive officers is available in its definitive joint proxy statement relating to its 2025 Annual
Meeting of Shareholders, which was filed with the SEC on March 6, 2025, and other documents filed by Huntington with the SEC. Information regarding Cadence’s directors and executive officers is available in its definitive proxy statement relating to
its 2025 Annual Meeting of Shareholders, which was filed with the Federal Reserve on March 14, 2025, and other documents filed by Cadence with the Federal Reserve. Other information regarding the participants in the proxy solicitation and a description
of their direct and indirect interests, by security holdings or otherwise, will be contained in the joint proxy statement/prospectus and other relevant materials filed with the SEC and the Federal Reserve by Huntington and Cadence, respectively. Free
copies of these documents may be obtained as described above under “Important Additional Information.”
Exhibit 99.12
BOARD OF GOVERNORS OF THE
FEDERAL RESERVE SYSTEM
WASHINGTON, DC 20551
FORM 8-K
CURRENT REPORT PURSUANT TO
SECTION 13 OR 15(d) OF THE
SECURITIES EXCHANGE ACT OF 1934
Date of report (date of earliest event reported): October 27, 2025
CADENCE BANK
(Exact Name of Registrant as Specified in Charter)
| Mississippi |
|
11813 |
|
64-0117230 |
|
(State or Other Jurisdiction of
Incorporation)
|
|
(FDIC Certificate No.) |
|
(IRS Employer Identification No.) |
| One Mississippi Plaza |
|
|
| 201 South Spring Street |
|
|
| Tupelo, Mississippi |
|
38804 |
| (Address of Principal Executive |
|
(Zip Code) |
| Offices) |
|
|
Registrant’s telephone number, including area code (662) 680-2000
Check the appropriate box below if the Form 8-K filing is intended to simultaneously satisfy the filing obligation of the registrant under any of the following
provisions (see General Instruction A.2. below):
|
x |
Written communications pursuant to Rule 425 under the Securities Act (17 CFR 230.425) |
|
¨ |
Soliciting material pursuant to Rule 14a-12 under the Exchange Act (17 CFR 240.14a-12) |
|
¨ |
Pre-commencement communications pursuant to Rule 14d-2(b) under the Exchange Act (17 CFR 240.14d-2(b)) |
|
¨ |
Pre-commencement communications pursuant to Rule 13e-4(c) under the Exchange Act (17 CFR 240.13e-4(c)) |
Securities registered pursuant to Section 12(b) of the Act:
| Title of each class |
|
Trading Symbol(s) |
|
Name of each exchange on which registered |
| Common Stock, $2.50 par value per share |
|
CADE |
|
New York Stock Exchange |
| |
|
|
|
|
| Series A Preferred Stock, $0.01 par value per share |
|
CADE-PrA |
|
New York Stock Exchange |
Indicate by check mark whether the registrant is an emerging growth company as defined in Rule 405 of the Securities Act of 1933 (§230.405 of this chapter) or Rule
12b-2 of the Securities Exchange Act of 1934 (§240.12b-2 of this chapter).
Emerging growth company ¨
If an emerging growth company, indicate by check mark if the registrant has elected not to use the extended transition period for complying with any new or revised
financial accounting standards provided pursuant to Section 13(a) of the Exchange Act. ¨
On October 27, 2025, in connection with the proposed merger of Cadence Bank and The Huntington National Bank, Cadence Bank delivered a message on
behalf of the Chief Executive Officer of Huntington Bancshares Incorporated. A copy of the email is attached as Exhibit 99.1 to this Current Report on Form 8-K and incorporated by reference herein.
|
Item 9.01 |
Financial Statements and Exhibits. |
EXHIBIT INDEX
CAUTION REGARDING FORWARD-LOOKING STATEMENTS
The information contained or incorporated by reference into this presentation may contain certain forward-looking statements, including, but not limited to, certain
plans, expectations, goals, projections, and statements about the benefits of the proposed transaction, the plans, objectives, expectations and intentions of Huntington Bancshares Incorporated (“Huntington”) and Cadence Bank (“Cadence”),
the expected timing of completion of the transaction, and other statements that are not historical facts. Such statements are subject to numerous assumptions, risks, estimates, uncertainties and other important factors that change over time and could
cause actual results to differ materially from any results, performance, or events expressed or implied by such forward-looking statements, including as a result of the factors referenced below. Statements that do not describe historical or current
facts, including statements about beliefs and expectations, are forward-looking statements. Forward-looking statements may be identified by words such as expect, anticipate, continue, believe, intend, estimate, plan, trend, objective, target, goal, or
similar expressions, or future or conditional verbs such as will, may, might, should, would, could, or similar variations. The forward-looking statements are intended to be subject to the safe harbor provided by Section 27A of the Securities Act of
1933, Section 21E of the Securities Exchange Act of 1934, and the Private Securities Litigation Reform Act of 1995.
Huntington and Cadence caution that the forward-looking statements in this communication are not guarantees of future performance and involve a number of known and
unknown risks, uncertainties and assumptions that are difficult to assess and are subject to change based on factors which are, in many instances, beyond Huntington’s and Cadence’s control. While there is no assurance that any list of risks and
uncertainties or risk factors is complete, below are certain factors which could cause actual results to differ materially from those contained or implied in the forward-looking statements or historical performance: changes in general economic,
political, or industry conditions; deterioration in business and economic conditions, including persistent inflation, supply chain issues or labor shortages, instability in global economic conditions and geopolitical matters, as well as volatility in
financial markets; changes in U.S. trade policies, including the imposition of tariffs and retaliatory tariffs; the impact of pandemics and other catastrophic events or disasters on the global economy and financial market conditions and our business,
results of operations, and financial condition; the impacts related to or resulting from bank failures and other volatility, including potential increased regulatory requirements and costs, such as Federal Deposit Insurance Corporation (the “FDIC”)
special assessments, long-term debt requirements and heightened capital requirements, and potential impacts to macroeconomic conditions, which could affect the ability of depository institutions, including us, to attract and retain depositors and to
borrow or raise capital; unexpected outflows of uninsured deposits which may require us to sell investment securities at a loss; changing interest rates which could negatively impact the value of our portfolio of investment securities; the loss of
value of our investment portfolio which could negatively impact market perceptions of us and could lead to deposit withdrawals; the effects of social media on market perceptions of us and banks generally; cybersecurity risks; uncertainty in U.S. fiscal
and monetary policy, including the interest rate policies of the Board of Governors of the Federal Reserve System (the “Federal Reserve”); volatility and disruptions in global capital, foreign exchange and credit markets; movements in interest
rates; competitive pressures on product pricing and services; success, impact, and timing of our business strategies, including market acceptance of any new products or services including those implementing our “Fair Play” banking philosophy; changes
in policies and standards for regulatory review of bank mergers; the nature, extent, timing, and results of governmental actions, examinations, reviews, reforms, regulations, and interpretations, including those related to the Dodd-Frank Wall Street
Reform and Consumer Protection Act and the Basel III regulatory capital reforms, as well as those involving the Securities and Exchange Commission (the “SEC”), the Office of the Comptroller of the Currency, Federal Reserve, FDIC, the Consumer
Financial Protection Bureau and state-level regulators; the occurrence of any event, change or other circumstances that could give rise to the right of one or both of the parties to terminate the merger agreement between Huntington and Cadence; the
outcome of any legal proceedings that may be instituted against Huntington or Cadence; delays in completing the proposed transaction involving Huntington and Cadence; the failure to obtain necessary regulatory approvals (and the risk that such
approvals may result in the imposition of conditions that could adversely affect the combined company or the expected benefits of the transaction); the failure to obtain Huntington shareholder approval or Cadence shareholder approval or to satisfy any
of the other conditions to the transaction on a timely basis or at all; the possibility that the anticipated benefits of the transaction are not realized when expected or at all, including as a result of the impact of, or problems arising from, the
integration of the two companies or as a result of the strength of the economy and competitive factors in the areas where Huntington and Cadence do business; the possibility that the transaction may be more expensive to complete than anticipated,
including as a result of unexpected factors or events; the ability of Huntington and Cadence to meet expectations regarding the timing, completion and accounting and tax treatment of the transaction; diversion of management’s attention from ongoing
business operations and opportunities; potential adverse reactions or changes to business, customer or employee relationships, including those resulting from the announcement or completion of the transaction; the ability to complete the transaction and
integration of Huntington and Cadence successfully; the dilution caused by Huntington’s issuance of additional shares of its capital stock in connection with the transaction; and other factors that may affect the future results of Huntington and
Cadence. Additional factors that could cause results to differ materially from those described above can be found in Huntington’s Annual Report on Form 10-K for the year ended December 31, 2024 and in its subsequent Quarterly Reports on Form 10-Q,
including for the quarter ended June 30, 2025, each of which is on file with the SEC and available on the “Investor Relations” section of Huntington’s website, http://www.huntington.com, under the heading “Investor Relations” and in other documents
Huntington files with the SEC, and in Cadence’s Annual Report on Form 10-K for the year ended December 31, 2024 and in its subsequent Quarterly Reports on Form 10-Q, including for the quarter ended June 30, 2025, each of which is on file with the
Federal Reserve and available on Cadence’s investor relations website, ir.cadencebank.com, under the heading “Public Filings” and in other documents Cadence files with the Federal Reserve.
|
1 |
References to Cadence Bank's or Huntington Bancshares Incorporated's websites, respectively, do not constitute incorporation by reference of the information contained on the website and are not, and should not be,
deemed part of this filing. |
All forward-looking statements are expressly qualified in their entirety by the cautionary statements set forth above. Forward-looking statements speak only as of the
date they are made and are based on information available at that time. Neither Huntington nor Cadence assume any obligation to update forward-looking statements to reflect actual results, new information or future events, changes in assumptions or
changes in circumstances or other factors affecting forward-looking statements that occur after the date the forward-looking statements were made or to reflect the occurrence of unanticipated events except as required by federal securities laws. If
Huntington or Cadence updates one or more forward-looking statements, no inference should be drawn that Huntington or Cadence will make additional updates with respect to those or other forward-looking statements. As forward-looking statements involve
significant risks and uncertainties, caution should be exercised against placing undue reliance on such statements.
IMPORTANT ADDITIONAL INFORMATION
In connection with the proposed transaction, Huntington will file with the SEC a Registration Statement on Form S-4 that will include a Joint Proxy Statement of
Huntington and Cadence and a Prospectus of Huntington, as well as other relevant documents concerning the proposed transaction. The proposed transaction involving Huntington and Cadence will be submitted to Huntington’s shareholders and Cadence’s
shareholders for their consideration. This communication does not constitute an offer to sell or the solicitation of an offer to buy any securities or a solicitation of any vote or approval, nor shall there be any sale of securities in any jurisdiction
in which such offer, solicitation or sale would be unlawful prior to registration or qualification under the securities laws of any such jurisdiction. INVESTORS, SHAREHOLDERS OF HUNTINGTON AND SHAREHOLDERS OF CADENCE ARE URGED TO READ THE REGISTRATION
STATEMENT AND THE JOINT PROXY STATEMENT/PROSPECTUS REGARDING THE TRANSACTION WHEN IT BECOMES AVAILABLE AND ANY OTHER RELEVANT DOCUMENTS FILED WITH THE SEC AND THE FEDERAL RESERVE, AS WELL AS ANY AMENDMENTS OR SUPPLEMENTS TO THOSE DOCUMENTS, BECAUSE
THEY WILL CONTAIN IMPORTANT INFORMATION. Shareholders will be able to obtain a free copy of the definitive joint proxy statement/prospectus, as well as other filings containing information about Huntington and Cadence, without charge, at the SEC’s
website (http://www.sec.gov) and Cadence’s website (https://ir.cadencebank.com/fdic-federal-reserve-filings), respectively. Copies of the joint proxy statement/prospectus, when available, and the filings with the SEC and the Federal Reserve that will
be incorporated by reference in the joint proxy statement/prospectus can also be obtained, without charge, by directing a request to Huntington Investor Relations, Huntington Bancshares Incorporated, Huntington Center, 41 South High Street, Columbus,
Ohio 43287, (800) 576-5007. Copies of the joint proxy statement/prospectus, when available, and filings containing information about Cadence may be obtained after their filing with the Federal Reserve at
(https://ir.cadencebank.com/fdic-federal-reserve-filings), by directing a request to Will Fisackerly, Cadence Investor Relations, Cadence Bank, (800) 698-7878, IR@cadencebank.com. References to Cadence’s website does not constitute incorporation by
reference of the information contained on the website and is not, and should not be, deemed part of this filing.
PARTICIPANTS IN THE SOLICITATION
Huntington, Cadence, and certain of their respective directors and executive officers may be deemed to be participants in the solicitation of proxies from the
shareholders of Huntington and shareholders of Cadence in connection with the proposed transaction. Information regarding the interests of the directors and executive officers of Huntington and Cadence and other persons who may be deemed to be
participants in the solicitation of shareholders of Huntington and Cadence in connection with the transaction and a description of their direct and indirect interests, by security holdings or otherwise, will be included in the definitive joint proxy
statement/prospectus related to the transaction, which will be filed by Huntington with the SEC. Information regarding Huntington’s directors and executive officers is available in its definitive joint proxy statement relating to its 2025 Annual
Meeting of Shareholders, which was filed with the SEC on March 6, 2025, and other documents filed by Huntington with the SEC. Information regarding Cadence’s directors and executive officers is available in its definitive proxy statement relating to
its 2025 Annual Meeting of Shareholders, which was filed with the Federal Reserve on March 14, 2025, and other documents filed by Cadence with the Federal Reserve. Other information regarding the participants in the proxy solicitation and a description
of their direct and indirect interests, by security holdings or otherwise, will be contained in the joint proxy statement/prospectus and other relevant materials filed with the SEC and the Federal Reserve by Huntington and Cadence, respectively. Free
copies of these documents may be obtained as described above under “Important Additional Information.”
SIGNATURES
Pursuant to the requirements of the Securities Exchange Act of 1934, the Registrant has duly caused this Report to be signed on its behalf by the
undersigned hereunto duly authorized.
| |
CADENCE BANK |
| |
|
|
| |
By |
/s/ Cathy S. Freeman |
| |
|
Cathy S. Freeman |
| |
|
Senior Executive Vice President and Chief Administrative Officer |
| |
|
|
| Date: October 27, 2025 |
|
|
Exhibit 99.1
Email to Cadence Teammates from Steve Steinour
From: Steve Steinour
To: All Cadence teammates
Subject: Welcome to Huntington Bank: A Message from Steve Steinour
Body:
Cadence Bank team,
I’m Steve Steinour, CEO of Huntington Bank. As Dan shared earlier today, our companies have decided to partner so that we can do even more to support our customers,
deliver for our communities, and grow our businesses.
We are very excited to welcome you to Huntington. I know you have questions about what this all means—and I invite you to watch this video to hear my thoughts
on the opportunities ahead.
You will likely have many more questions in the days and weeks ahead. We may not always have an immediate answer to provide, but we promise to be open and transparent
with you as we move through this process, and to update you on a regular basis.
Finally, I would like to thank Dan and the Cadence Senior Management team. They have been—and will continue to be—outstanding partners throughout this entire planning
process, helping position our combined organization for long-term success. We are grateful for the partnership and delighted that Dan will join as non-executive Vice Chair of Huntington Bancshares Incorporated as well as a director of Huntington
Bancshares Incorporated and the Huntington National Bank.
On behalf of my colleagues, I am thrilled and honored to welcome you to Huntington. And I look forward to meeting you soon.
Steve Steinour
Chairman, President, and CEO
***
Resources:
|
· |
Huntington.com/CadenceBank: Stay up to date with what this means for customers |
|
· |
Integration Center: See integration FAQs and resources for teammates |
***
IMPORTANT ADDITIONAL INFORMATION
In connection with the proposed transaction, Huntington will file with the SEC a Registration Statement on Form S-4 that will include a Joint Proxy Statement of
Huntington and Cadence and a Prospectus of Huntington, as well as other relevant documents concerning the proposed transaction. The proposed transaction involving Huntington and Cadence will be submitted to Huntington’s shareholders and Cadence’s
shareholders for their consideration. This communication does not constitute an offer to sell or the solicitation of an offer to buy any securities or a solicitation of any vote or approval, nor shall there be any sale of securities in any jurisdiction
in which such offer, solicitation or sale would be unlawful prior to registration or qualification under the securities laws of any such jurisdiction. INVESTORS, SHAREHOLDERS OF HUNTINGTON AND SHAREHOLDERS OF CADENCE ARE URGED TO READ THE REGISTRATION
STATEMENT AND THE JOINT PROXY STATEMENT/PROSPECTUS REGARDING THE TRANSACTION WHEN IT BECOMES AVAILABLE AND ANY OTHER RELEVANT DOCUMENTS FILED WITH THE SEC AND THE FEDERAL RESERVE, AS WELL AS ANY AMENDMENTS OR SUPPLEMENTS TO THOSE DOCUMENTS, BECAUSE
THEY WILL CONTAIN IMPORTANT INFORMATION. Shareholders will be able to obtain a free copy of the definitive joint proxy statement/prospectus, as well as other filings containing information about Huntington and Cadence, without charge, at the SEC’s
website (http://www.sec.gov) and Cadence’s website (https://ir.cadencebank.com/fdic-federal-reserve-filings), respectively. Copies of the joint proxy statement/prospectus, when available, and the filings with the SEC and the Federal
Reserve that will be incorporated by reference in the joint proxy statement/prospectus can also be obtained, without charge, by directing a request to Huntington Investor Relations, Huntington Bancshares Incorporated, Huntington Center, 41 South High
Street, Columbus, Ohio 43287, (800) 576-5007. Copies of the joint proxy statement/prospectus, when available, and filings containing information about Cadence may be obtained after their filing with the Federal Reserve at (https://ir.cadencebank.com/fdic-federal-reserve-filings),
by directing a request to Will Fisackerly, Cadence Investor Relations, Cadence Bank, (800) 698-7878, IR@cadencebank.com. References to Cadence’s website does not constitute incorporation by reference of the information contained on the website
and is not, and should not be, deemed part of this filing.
PARTICIPANTS IN THE SOLICITATION
Huntington, Cadence, and certain of their respective directors and executive officers may be deemed to be participants in the solicitation of proxies from the
shareholders of Huntington and shareholders of Cadence in connection with the proposed transaction. Information regarding the interests of the directors and executive officers of Huntington and Cadence and other persons who may be deemed to be
participants in the solicitation of shareholders of Huntington and Cadence in connection with the transaction and a description of their direct and indirect interests, by security holdings or otherwise, will be included in the definitive joint proxy
statement/prospectus related to the transaction, which will be filed by Huntington with the SEC. Information regarding Huntington’s directors and executive officers is available in its definitive joint proxy statement relating to its 2025 Annual
Meeting of Shareholders, which was filed with the SEC on March 6, 2025, and other documents filed by Huntington with the SEC. Information regarding Cadence’s directors and executive officers is available in its definitive proxy statement relating to
its 2025 Annual Meeting of Shareholders, which was filed with the Federal Reserve on March 14, 2025, and other documents filed by Cadence with the Federal Reserve. Other information regarding the participants in the proxy solicitation and a description
of their direct and indirect interests, by security holdings or otherwise, will be contained in the joint proxy statement/prospectus and other relevant materials filed with the SEC and the Federal Reserve by Huntington and Cadence, respectively. Free
copies of these documents may be obtained as described above under “Important Additional Information.”
Exhibit 99.13
BOARD OF GOVERNORS OF THE
FEDERAL RESERVE SYSTEM
WASHINGTON, DC 20551
FORM 8-K
CURRENT REPORT PURSUANT TO
SECTION 13 OR 15(d) OF THE
SECURITIES EXCHANGE ACT OF 1934
Date of report (date of earliest event reported): October 27, 2025
CADENCE BANK
(Exact Name of Registrant as Specified in Charter)
|
Mississippi
|
|
11813
|
|
64-0117230
|
| |
|
|
|
|
|
(State or Other Jurisdiction of Incorporation)
|
|
(FDIC Certificate No.)
|
|
(IRS Employer Identification No.)
|
|
One Mississippi Plaza
201 South Spring Street
Tupelo, Mississippi
|
38804
|
| |
|
|
(Address of Principal Executive Offices)
|
(Zip Code)
|
Registrant’s telephone number, including area code (662) 680-2000
Check the appropriate box below if the Form 8-K filing is intended to simultaneously satisfy the filing obligation of the registrant under any of the following provisions (see General Instruction A.2.
below):
| ☒ |
Written communications pursuant to Rule 425 under the Securities Act (17 CFR 230.425)
|
| ☐ |
Soliciting material pursuant to Rule 14a-12 under the Exchange Act (17 CFR 240.14a-12)
|
| ☐ |
Pre-commencement communications pursuant to Rule 14d-2(b) under the Exchange Act (17 CFR 240.14d-2(b))
|
|
☐
|
Pre-commencement communications pursuant to Rule 13e-4(c) under the Exchange Act (17 CFR 240.13e-4(c))
|
Securities registered pursuant to Section 12(b) of the Act:
|
Title of each class
|
|
Trading Symbol(s)
|
|
Name of each exchange on which registered
|
| |
|
|
|
|
|
Common Stock, $2.50 par value per share
|
|
CADE
|
|
New York Stock Exchange
|
| |
|
|
|
|
|
Series A Preferred Stock, $0.01 par value per share
|
|
CADE-PrA
|
|
New York Stock Exchange
|
Indicate by check mark whether the registrant is an emerging growth company as defined in Rule 405 of the Securities Act of 1933 (§230.405 of this chapter) or Rule 12b-2 of the Securities Exchange Act of 1934 (§240.12b-2 of this chapter).
Emerging growth company ☐
If an emerging growth company, indicate by check mark if the registrant has elected not to use the extended transition period for complying with any new or revised financial accounting standards provided pursuant to Section 13(a) of the Exchange
Act. ☐
On October 27, 2025, in connection with the proposed merger of Cadence Bank and The Huntington National Bank, Cadence Bank posted a “Huntington Integration Center” webpage to its internal employee
website. A copy of the internal webpage is attached as Exhibit 99.1 to this Current Report on Form 8-K and incorporated by reference herein.
|
Item 9.01
|
Financial Statements and Exhibits.
|
EXHIBIT INDEX
|
Exhibit No.
|
Description of Exhibit
|
| |
|
|
99.1
|
Huntington Integration Center Internal Webpage, dated October 27, 2025
|
CAUTION REGARDING FORWARD-LOOKING STATEMENTS
The information contained or incorporated by reference into this presentation may contain certain forward-looking statements, including, but not limited to, certain plans, expectations, goals, projections, and
statements about the benefits of the proposed transaction, the plans, objectives, expectations and intentions of Huntington Bancshares Incorporated (“Huntington”) and Cadence Bank (“Cadence”), the expected timing of completion of the
transaction, and other statements that are not historical facts. Such statements are subject to numerous assumptions, risks, estimates, uncertainties and other important factors that change over time and could cause actual results to differ
materially from any results, performance, or events expressed or implied by such forward-looking statements, including as a result of the factors referenced below. Statements that do not describe historical or current facts, including statements
about beliefs and expectations, are forward-looking statements. Forward-looking statements may be identified by words such as expect, anticipate, continue, believe, intend, estimate, plan, trend, objective, target, goal, or similar expressions, or
future or conditional verbs such as will, may, might, should, would, could, or similar variations. The forward-looking statements are intended to be subject to the safe harbor provided by Section 27A of the Securities Act of 1933, Section 21E of the
Securities Exchange Act of 1934, and the Private Securities Litigation Reform Act of 1995.
Huntington and Cadence caution that the forward-looking statements in this communication are not guarantees of future performance and involve a number of known and unknown risks, uncertainties and assumptions that are
difficult to assess and are subject to change based on factors which are, in many instances, beyond Huntington’s and Cadence’s control. While there is no assurance that any list of risks and uncertainties or risk factors is complete, below are
certain factors which could cause actual results to differ materially from those contained or implied in the forward-looking statements or historical performance: changes in general economic, political, or industry conditions; deterioration in
business and economic conditions, including persistent inflation, supply chain issues or labor shortages, instability in global economic conditions and geopolitical matters, as well as volatility in financial markets; changes in U.S. trade policies,
including the imposition of tariffs and retaliatory tariffs; the impact of pandemics and other catastrophic events or disasters on the global economy and financial market conditions and our business, results of operations, and financial condition;
the impacts related to or resulting from bank failures and other volatility, including potential increased regulatory requirements and costs, such as Federal Deposit Insurance Corporation (the “FDIC”) special assessments, long-term debt
requirements and heightened capital requirements, and potential impacts to macroeconomic conditions, which could affect the ability of depository institutions, including us, to attract and retain depositors and to borrow or raise capital; unexpected
outflows of uninsured deposits which may require us to sell investment securities at a loss; changing interest rates which could negatively impact the value of our portfolio of investment securities; the loss of value of our investment portfolio
which could negatively impact market perceptions of us and could lead to deposit withdrawals; the effects of social media on market perceptions of us and banks generally; cybersecurity risks; uncertainty in U.S. fiscal and monetary policy, including
the interest rate policies of the Board of Governors of the Federal Reserve System (the “Federal Reserve”); volatility and disruptions in global capital, foreign exchange and credit markets; movements in interest rates; competitive
pressures on product pricing and services; success, impact, and timing of our business strategies, including market acceptance of any new products or services including those implementing our “Fair Play” banking philosophy; changes in policies and
standards for regulatory review of bank mergers; the nature, extent, timing, and results of governmental actions, examinations, reviews, reforms, regulations, and interpretations, including those related to the Dodd-Frank Wall Street Reform and
Consumer Protection Act and the Basel III regulatory capital reforms, as well as those involving the Securities and Exchange Commission (the “SEC”), the Office of the Comptroller of the Currency, Federal Reserve, FDIC, the Consumer Financial
Protection Bureau and state-level regulators; the occurrence of any event, change or other circumstances that could give rise to the right of one or both of the parties to terminate the merger agreement between Huntington and Cadence; the outcome of
any legal proceedings that may be instituted against Huntington or Cadence; delays in completing the proposed transaction involving Huntington and Cadence; the failure to obtain necessary regulatory approvals (and the risk that such approvals may
result in the imposition of conditions that could adversely affect the combined company or the expected benefits of the transaction); the failure to obtain Huntington shareholder approval or Cadence shareholder approval or to satisfy any of the other
conditions to the transaction on a timely basis or at all; the possibility that the anticipated benefits of the transaction are not realized when expected or at all, including as a result of the impact of, or problems arising from, the integration of
the two companies or as a result of the strength of the economy and competitive factors in the areas where Huntington and Cadence do business; the possibility that the transaction may be more expensive to complete than anticipated, including as a
result of unexpected factors or events; the ability of Huntington and Cadence to meet expectations regarding the timing, completion and accounting and tax treatment of the transaction; diversion of management’s attention from ongoing business
operations and opportunities; potential adverse reactions or changes to business, customer or employee relationships, including those resulting from the announcement or completion of the transaction; the ability to complete the transaction and
integration of Huntington and Cadence successfully; the dilution caused by Huntington’s issuance of additional shares of its capital stock in connection with the transaction; and other factors that may affect the future results of Huntington and
Cadence. Additional factors that could cause results to differ materially from those described above can be found in Huntington’s Annual Report on Form 10-K for the year ended December 31, 2024 and in its subsequent Quarterly Reports on Form 10-Q,
including for the quarter ended June 30, 2025, each of which is on file with the SEC and available on the “Investor Relations” section of Huntington’s website, http://www.huntington.com, under the heading “Investor Relations” and in other documents
Huntington files with the SEC, and in Cadence’s Annual Report on Form 10-K for the year ended December 31, 2024 and in its subsequent Quarterly Reports on Form 10-Q, including for the quarter ended June 30, 2025, each of which is on file with the
Federal Reserve and available on Cadence’s investor relations website, ir.cadencebank.com, under the heading “Public Filings” and in other documents Cadence files with the Federal Reserve.
All forward-looking statements are expressly qualified in their entirety by the cautionary statements set forth above. Forward-looking statements speak only as of the date they are made and are based on information
available at that time. Neither Huntington nor Cadence assume any obligation to update forward-looking statements to reflect actual results, new information or future events, changes in assumptions or changes in circumstances or other factors
affecting forward-looking statements that occur after the date the forward-looking statements were made or to reflect the occurrence of unanticipated events except as required by federal securities laws. If Huntington or Cadence updates one or more
forward-looking statements, no inference should be drawn that Huntington or Cadence will make additional updates with respect to those or other forward-looking statements. As forward-looking statements involve significant risks and uncertainties,
caution should be exercised against placing undue reliance on such statements.
IMPORTANT ADDITIONAL INFORMATION
In connection with the proposed transaction, Huntington will file with the SEC a Registration Statement on Form S-4 that will include a Joint Proxy Statement of Huntington and Cadence and a Prospectus of Huntington, as well as other relevant
documents concerning the proposed transaction. The proposed transaction involving Huntington and Cadence will be submitted to Huntington’s shareholders and Cadence’s shareholders for their consideration. This communication does not constitute an
offer to sell or the solicitation of an offer to buy any securities or a solicitation of any vote or approval, nor shall there be any sale of securities in any jurisdiction in which such offer, solicitation or sale would be unlawful prior to
registration or qualification under the securities laws of any such jurisdiction. INVESTORS, SHAREHOLDERS OF HUNTINGTON AND SHAREHOLDERS OF CADENCE ARE URGED TO READ THE REGISTRATION STATEMENT AND THE JOINT PROXY STATEMENT/PROSPECTUS REGARDING THE
TRANSACTION WHEN IT BECOMES AVAILABLE AND ANY OTHER RELEVANT DOCUMENTS FILED WITH THE SEC AND THE FEDERAL RESERVE, AS WELL AS ANY AMENDMENTS OR SUPPLEMENTS TO THOSE DOCUMENTS, BECAUSE THEY WILL CONTAIN IMPORTANT INFORMATION. Shareholders will be able
to obtain a free copy of the definitive joint proxy statement/prospectus, as well as other filings containing information about Huntington and Cadence, without charge, at the SEC’s website (http://www.sec.gov) and Cadence’s website
(https://ir.cadencebank.com/fdic-federal-reserve-filings), respectively. Copies of the joint proxy statement/prospectus, when available, and the filings with the SEC and the Federal Reserve that will be incorporated by reference in the joint proxy
statement/prospectus can also be obtained, without charge, by directing a request to Huntington Investor Relations, Huntington Bancshares Incorporated, Huntington Center, 41 South High Street, Columbus, Ohio 43287, (800) 576-5007. Copies of the
joint proxy statement/prospectus, when available, and filings containing information about Cadence may be obtained after their filing with the Federal Reserve at (https://ir.cadencebank.com/fdic-federal-reserve-filings), by directing a request to
Will Fisackerly, Cadence Investor Relations, Cadence Bank, (800) 698-7878, IR@cadencebank.com. References to Cadence’s website does not constitute incorporation by reference of the information contained on the website and is not, and should not be,
deemed part of this filing.
PARTICIPANTS IN THE SOLICITATION
Huntington, Cadence, and certain of their respective directors and executive officers may be deemed to be participants in the solicitation of proxies from the shareholders of Huntington and shareholders of Cadence in connection with the proposed
transaction. Information regarding the interests of the directors and executive officers of Huntington and Cadence and other persons who may be deemed to be participants in the solicitation of shareholders of Huntington and Cadence in connection
with the transaction and a description of their direct and indirect interests, by security holdings or otherwise, will be included in the definitive joint proxy statement/prospectus related to the transaction, which will be filed by Huntington with
the SEC. Information regarding Huntington’s directors and executive officers is available in its definitive joint proxy statement relating to its 2025 Annual Meeting of Shareholders, which was filed with the SEC on March 6, 2025, and other documents
filed by Huntington with the SEC. Information regarding Cadence’s directors and executive officers is available in its definitive proxy statement relating to its 2025 Annual Meeting of Shareholders, which was filed with the Federal Reserve on March
14, 2025, and other documents filed by Cadence with the Federal Reserve. Other information regarding the participants in the proxy solicitation and a description of their direct and indirect interests, by security holdings or otherwise, will be
contained in the joint proxy statement/prospectus and other relevant materials filed with the SEC and the Federal Reserve by Huntington and Cadence, respectively. Free copies of these documents may be obtained as described above under “Important
Additional Information.”
SIGNATURES
Pursuant to the requirements of the Securities Exchange Act of 1934, the Registrant has duly caused this Report to be signed on its behalf by the undersigned hereunto duly authorized.
| |
CADENCE BANK
|
| |
|
| |
By
|
/s/ Cathy S. Freeman
|
|
| |
|
Cathy S. Freeman
|
| |
|
Senior Executive Vice President and Chief
Administrative Officer
|
| |
|
|
|
Date: October 27, 2025
|
|
|
Exhibit 99.1
Site Image Tile
Logo Lockup
CLICK HERE
Integration Center - Huntington Bank
Find the latest news and resources on our partnership and integration with Huntington Bank.
Huntington Integration Center
We are excited to partner with Huntington Bank, so we can do more to help people, companies and communities prosper. Through this partnership, Huntington is excited to bring expanded capabilities and award-winning digital tools to our
customers across the South and Texas—with the same relationship-first, community-based approach that both our legacies are built on.
The combination is expected to close in the first quarter of 2026, with conversion in the second quarter. Upon conversion, Cadence Bank branches and teams will operate under the Huntington Bank name and brand.
Find the latest news and resources below.
Welcome to Huntington Bank
|
• |
Embedded “welcome” video from Steve Steinour
|
|
• |
Announcement communication from Steve Steinour
|
FAQs
If you have additional questions not answered here, email AskHuntington@huntington.com.
General
| 1. |
Why are Cadence Bank and Huntington Bank partnering?
|
The partnership of the Cadence and Huntington teams will create a bigger, purpose-led bank. Cadence’s relationship-first, community-based approach aligns closely with Huntington’s model, which emphasizes local
bankers, local decision-making, and strong local relationships. This partnership will expand the range of capabilities and industry expertise available to Cadence’s customers, allowing us to serve more individuals, families, and businesses.
| 2. |
What is Legal Day 1 (LD1)?
|
Legal Day 1 (LD1) is the date when the two companies become one legal entity under The Huntington National Bank. This is expected to be in the first quarter of 2026, subject to regulatory approvals and customary
closing conditions.
On LD1, Cadence will become part of The Huntington National Bank but will continue to operate on its systems. Upon Conversion Day 1 (CD1), which is expected in the second quarter of 2026, Cadence teams and branches
will operate under the Huntington Bank name and brand.
Employment
| 3. |
Will I still have a job?
|
Cadence's teams have built strong relationships with their customers over generations, and we plan to retain most of Cadence's customer-facing colleagues as we remain focused on delivering locally. Additionally,
Huntington plans to maintain Cadence’s broad branch network, with no branch closures, and invest to grow over time.
As in any combination like this, we know there will be some job impacts. We are committed to being open and transparent at every step of this process. We may not always have immediate answers, but we will provide
information as soon as we are able.
| 4. |
When will I know if my job is impacted?
|
Right now, Huntington and Cadence teams are learning about one another’s team structures and roles and assessing organizational needs. We are committed to communicating decisions as soon as possible once they are
made.
| 5. |
If my job is impacted, are there options to stay with Huntington?
|
Absolutely. We know there is deep talent and expertise on the Cadence team, and we will work to place as many impacted colleagues as possible.
Huntington has many open roles across our organization, and we will encourage any impacted colleagues to apply for other jobs at Huntington. In the coming weeks, we will create and share a Job Bank of roles which can
be located in certain Cadence’s current markets.
Benefits
| 6. |
What happens to my medical benefits during the transition?
|
The medical, dental and vision benefits you have with Cadence in 2026 will continue through December 31, 2026. We will share more information about the transition once available.
| 7. |
What benefits does Huntington offer (401(k), vacation, dental, vision, health care)?
|
Huntington offers comprehensive benefits, including medical/prescription drug, dental, vision, life insurance and disability coverage; a 401(k) plan with employer match, paid time off, an Employee Assistance Plan,
and more. Other voluntary benefit offerings include Critical Illness and Hospital Indemnity insurance, subsidized childcare services, tuition reimbursement, identity theft protection and a legal plan.
You will receive a Benefits Overview in the coming weeks.
| 8. |
What will happen to my Cadence 401(k)? What are Huntington’s 401(k) plan details?
|
You will continue to participate in the Cadence 401(k) until LD1. We will share more information on the transition once available.
As of January 1, 2026, Huntington’s 401(k) Plan, administered by Fidelity, offers a 5% company match with limits when you contribute at least 4% of your eligible pay, with options for pre-tax and Roth contributions.
Compensation
| 9. |
Are there any changes to my pay schedule? What is Huntington’s payroll schedule?
|
Cadence employees will continue on their current payroll schedule until further notice. We will share more information on the transition once available.
Huntington’s payroll schedule includes:
|
• |
Non-exempt (non-salaried) colleagues are paid bi-weekly, meaning every two weeks.
|
|
• |
Exempt (salaried) colleagues are paid semi-monthly, typically on the 15th and the last day of the month.
|
All payroll is processed in arrears, which means colleagues are paid for work completed during the previous pay period. During the transition Huntington will enact a process to ensure colleagues will not have a gap
in pay.
Paid Time Off (PTO)
| 10. |
What is Huntington’s PTO accrual structure?
|
PTO hours are allotted based on salary grade, years of service and colleagues’ full-time or part-time status.
| 11. |
What will happen to my accrued PTO and/or sick time with the transition?
|
We will share more information once available.
Policies & Procedures
| 12. |
What is Huntington’s dress code?
|
Huntington follows a “Dress for Your Day” approach. Colleagues are trusted to choose attire that fits their schedule, environment and role while positively representing the Huntington brand.
| 13. |
What do retail branch colleagues wear?
|
Huntington’s retail branch colleagues have a Career Apparel Program which provides apparel guidelines. We will share more information on the program soon.
<Huntington to deliver these on a rolling basis to paste in as plain text>
Customer Resources and Communications
Customer FAQs are available at Huntington.com/cadencebank.
Teammate Communications
Coming soon!
***
CAUTION REGARDING FORWARD-LOOKING STATEMENTS
This communication may contain certain forward-looking statements, including, but not limited to, certain plans, expectations, goals, projections, and statements about the benefits of the proposed transaction, the plans, objectives,
expectations and intentions of Huntington Bancshares Incorporated (“Huntington”) and Cadence Bank (“Cadence”), the expected timing of completion of the transaction, and other statements that are not historical facts. Such
statements are subject to numerous assumptions, risks, estimates, uncertainties and other important factors that change over time and could cause actual results to differ materially from any results, performance, or events expressed or implied by
such forward-looking statements, including as a result of the factors referenced below. Statements that do not describe historical or current facts, including statements about beliefs and expectations, are forward-looking statements.
Forward-looking statements may be identified by words such as expect, anticipate, continue, believe, intend, estimate, plan, trend, objective, target, goal, or similar expressions, or future or conditional verbs such as will, may, might, should,
would, could, or similar variations. The forward-looking statements are intended to be subject to the safe harbor provided by Section 27A of the Securities Act of 1933, Section 21E of the Securities Exchange Act of 1934, and the Private
Securities Litigation Reform Act of 1995.
Huntington and Cadence caution that the forward-looking statements in this communication are not guarantees of future performance and involve a number of known and unknown risks, uncertainties and assumptions that are difficult to assess and
are subject to change based on factors which are, in many instances, beyond Huntington’s and Cadence’s control. While there is no assurance that any list of risks and uncertainties or risk factors is complete, below are certain factors which
could cause actual results to differ materially from those contained or implied in the forward-looking statements or historical performance: changes in general economic, political, or industry conditions; deterioration in business and economic
conditions, including persistent inflation, supply chain issues or labor shortages, instability in global economic conditions and geopolitical matters, as well as volatility in financial markets; changes in U.S. trade policies, including the
imposition of tariffs and retaliatory tariffs; the impact of pandemics and other catastrophic events or disasters on the global economy and financial market conditions and our business, results of operations, and financial condition; the impacts
related to or resulting from bank failures and other volatility, including potential increased regulatory requirements and costs, such as Federal Deposit Insurance Corporation (the “FDIC”) special assessments, long-term debt requirements
and heightened capital requirements, and potential impacts to macroeconomic conditions, which could affect the ability of depository institutions, including us, to attract and retain depositors and to borrow or raise capital; unexpected outflows
of uninsured deposits which may require us to sell investment securities at a loss; changing interest rates which could negatively impact the value of our portfolio of investment securities; the loss of value of our investment portfolio which
could negatively impact market perceptions of us and could lead to deposit withdrawals; the effects of social media on market perceptions of us and banks generally; cybersecurity risks; uncertainty in U.S. fiscal and monetary policy, including
the interest rate policies of the Board of Governors of the Federal Reserve System (the “Federal Reserve”); volatility and disruptions in global capital, foreign exchange and credit markets; movements in interest rates; competitive
pressures on product pricing and services; success, impact, and timing of our business strategies, including market acceptance of any new products or services including those implementing our “Fair Play” banking philosophy; changes in policies
and standards for regulatory review of bank mergers; the nature, extent, timing, and results of governmental actions, examinations, reviews, reforms, regulations, and interpretations, including those related to the Dodd-Frank Wall Street Reform
and Consumer Protection Act and the Basel III regulatory capital reforms, as well as those involving the Securities and Exchange Commission (the “SEC”), the Office of the Comptroller of the Currency, Federal Reserve, FDIC, the Consumer
Financial Protection Bureau and state-level regulators; the occurrence of any event, change or other circumstances that could give rise to the right of one or both of the parties to terminate the merger agreement between Huntington and Cadence;
the outcome of any legal proceedings that may be instituted against Huntington or Cadence; delays in completing the proposed transaction involving Huntington and Cadence; the failure to obtain necessary regulatory approvals (and the risk that
such approvals may result in the imposition of conditions that could adversely affect the combined company or the expected benefits of the transaction); the failure to obtain Huntington shareholder approval or Cadence shareholder approval or to
satisfy any of the other conditions to the transaction on a timely basis or at all; the possibility that the anticipated benefits of the transaction are not realized when expected or at all, including as a result of the impact of, or problems
arising from, the integration of the two companies or as a result of the strength of the economy and competitive factors in the areas where Huntington and Cadence do business; the possibility that the transaction may be more expensive to complete
than anticipated, including as a result of unexpected factors or events; the ability of Huntington and Cadence to meet expectations regarding the timing, completion and accounting and tax treatment of the transaction; diversion of management’s
attention from ongoing business operations and opportunities; potential adverse reactions or changes to business, customer or employee relationships, including those resulting from the announcement or completion of the transaction; the ability to
complete the transaction and integration of Huntington and Cadence successfully; the dilution caused by Huntington’s issuance of additional shares of its capital stock in connection with the transaction; and other factors that may affect the
future results of Huntington and Cadence. Additional factors that could cause results to differ materially from those described above can be found in Huntington’s Annual Report on Form 10-K for the year ended December 31, 2024 and in its
subsequent Quarterly Reports on Form 10-Q, including for the quarter ended June 30, 2025, each of which is on file with the SEC and available on the “Investor Relations” section of Huntington’s website, http://www.huntington.com, under
the heading “Investor Relations” and in other documents Huntington files with the SEC, and in Cadence’s Annual Report on Form 10-K for the year ended December 31, 2024 and in its subsequent Quarterly Reports on Form 10-Q, including for the
quarter ended June 30, 2025, each of which is on file with the Federal Reserve and available on Cadence’s investor relations website, ir.cadencebank.com, under the heading “Public Filings” and in other documents Cadence files with the Federal
Reserve.
All forward-looking statements are expressly qualified in their entirety by the cautionary statements set forth above. Forward-looking statements speak only as of the date they are made and are based on information available at that time.
Neither Huntington nor Cadence assume any obligation to update forward-looking statements to reflect actual results, new information or future events, changes in assumptions or changes in circumstances or other factors affecting forward-looking
statements that occur after the date the forward-looking statements were made or to reflect the occurrence of unanticipated events except as required by federal securities laws. If Huntington or Cadence updates one or more forward-looking
statements, no inference should be drawn that Huntington or Cadence will make additional updates with respect to those or other forward-looking statements. As forward-looking statements involve significant risks and uncertainties, caution should
be exercised against placing undue reliance on such statements.
IMPORTANT ADDITIONAL INFORMATION
In connection with the proposed transaction, Huntington will file with the SEC a Registration Statement on Form S-4 that will include a Joint Proxy Statement of Huntington and Cadence and a Prospectus of Huntington, as well as other relevant
documents concerning the proposed transaction. The proposed transaction involving Huntington and Cadence will be submitted to Huntington’s shareholders and Cadence’s shareholders for their consideration. This communication does not constitute
an offer to sell or the solicitation of an offer to buy any securities or a solicitation of any vote or approval, nor shall there be any sale of securities in any jurisdiction in which such offer, solicitation or sale would be unlawful prior to
registration or qualification under the securities laws of any such jurisdiction. INVESTORS, SHAREHOLDERS OF HUNTINGTON AND SHAREHOLDERS OF CADENCE ARE URGED TO READ THE REGISTRATION STATEMENT AND THE JOINT PROXY STATEMENT/PROSPECTUS REGARDING
THE TRANSACTION WHEN IT BECOMES AVAILABLE AND ANY OTHER RELEVANT DOCUMENTS FILED WITH THE SEC AND THE FEDERAL RESERVE, AS WELL AS ANY AMENDMENTS OR SUPPLEMENTS TO THOSE DOCUMENTS, BECAUSE THEY WILL CONTAIN IMPORTANT INFORMATION. Shareholders
will be able to obtain a free copy of the definitive joint proxy statement/prospectus, as well as other filings containing information about Huntington and Cadence, without charge, at the SEC’s website (http://www.sec.gov) and Cadence’s
website (https://ir.cadencebank.com/fdic-federal-reserve-filings), respectively. Copies of the joint proxy statement/prospectus, when available, and the filings with the SEC and the Federal Reserve that will be incorporated by reference
in the joint proxy statement/prospectus can also be obtained, without charge, by directing a request to Huntington Investor Relations, Huntington Bancshares Incorporated, Huntington Center, 41 South High Street, Columbus, Ohio 43287, (800)
576-5007. Copies of the joint proxy statement/prospectus, when available, and filings containing information about Cadence may be obtained after their filing with the Federal Reserve at (https://ir.cadencebank.com/fdic-federal-reserve-filings),
by directing a request to Will Fisackerly, Cadence Investor Relations, Cadence Bank, (800) 698-7878, IR@cadencebank.com. References to Cadence’s website does not constitute incorporation by reference of the information contained on the
website and is not, and should not be, deemed part of this filing.
PARTICIPANTS IN THE SOLICITATION
Huntington, Cadence, and certain of their respective directors and executive officers may be deemed to be participants in the solicitation of proxies from the shareholders of Huntington and shareholders of Cadence in connection with the
proposed transaction. Information regarding the interests of the directors and executive officers of Huntington and Cadence and other persons who may be deemed to be participants in the solicitation of shareholders of Huntington and Cadence in
connection with the transaction and a description of their direct and indirect interests, by security holdings or otherwise, will be included in the definitive joint proxy statement/prospectus related to the transaction, which will be filed by
Huntington with the SEC. Information regarding Huntington’s directors and executive officers is available in its definitive joint proxy statement relating to its 2025 Annual Meeting of Shareholders, which was filed with the SEC on March 6, 2025,
and other documents filed by Huntington with the SEC. Information regarding Cadence’s directors and executive officers is available in its definitive proxy statement relating to its 2025 Annual Meeting of Shareholders, which was filed with the
Federal Reserve on March 14, 2025, and other documents filed by Cadence with the Federal Reserve. Other information regarding the participants in the proxy solicitation and a description of their direct and indirect interests, by security
holdings or otherwise, will be contained in the joint proxy statement/prospectus and other relevant materials filed with the SEC and the Federal Reserve by Huntington and Cadence, respectively. Free copies of these documents may be obtained as
described above under “Important Additional Information.”
Exhibit 99.14
BOARD OF GOVERNORS OF THE
FEDERAL RESERVE SYSTEM
WASHINGTON, DC 20551
FORM 8-K
CURRENT REPORT PURSUANT TO
SECTION 13 OR 15(d) OF THE
SECURITIES EXCHANGE ACT OF 1934
Date of report (date of earliest event reported): October 26, 2025
CADENCE BANK
(Exact Name of Registrant as Specified in Charter)
| Mississippi |
|
11813 |
|
64-0117230 |
| |
|
|
|
|
| (State or Other Jurisdiction of Incorporation) |
|
(FDIC Certificate No.) |
|
(IRS Employer Identification No.) |
| |
|
|
|
|
| |
|
|
|
|
| One Mississippi Plaza |
|
|
|
|
| 201 South Spring Street |
|
|
|
38804 |
| Tupelo, Mississippi |
|
|
|
|
| |
|
|
|
(Zip Code) |
| (Address of Principal Executive Offices) |
|
|
|
|
Registrant’s telephone number, including area code (662) 680-2000
Check the appropriate box below if the Form 8-K filing is intended to simultaneously satisfy the filing
obligation of the registrant under any of the following provisions (see General Instruction A.2. below):
☒ Written communications pursuant to Rule 425 under the Securities Act (17 CFR 230.425)
|
☐ |
Soliciting material pursuant to Rule 14a-12 under the Exchange Act (17 CFR 240.14a-12) |
|
☐ |
Pre-commencement communications pursuant to Rule 14d-2(b) under the Exchange Act (17 CFR 240.14d-2(b)) |
|
☐ |
Pre-commencement communications pursuant to Rule 13e-4(c) under the Exchange Act (17 CFR 240.13e-4(c)) |
Securities registered pursuant to Section 12(b) of the Act:
| Title of each class |
|
Trading Symbol(s) |
|
Name of each exchange on which registered |
| |
|
|
|
|
| Common Stock, $2.50 par value per share |
|
CADE |
|
New York Stock Exchange |
| |
|
|
|
|
| Series A Preferred Stock, $0.01 par value per share |
|
CADE-PrA |
|
New York Stock Exchange |
Indicate by check mark whether the registrant is an emerging growth company as defined in
Rule 405 of the Securities Act of 1933 (§230.405 of this chapter) or Rule 12b-2 of the Securities Exchange Act of 1934 (§240.12b-2 of this chapter).
Emerging growth company ☐
If an emerging growth company, indicate by check mark if the registrant has elected not to use the extended
transition period for complying with any new or revised financial accounting standards provided pursuant to Section 13(a) of the Exchange Act. ☐
Item 1.01. Entry into a Material Definitive Agreement.
On October 26, 2025, Cadence Bank, a Mississippi-chartered bank
(“Cadence”), entered into an Agreement and Plan of Merger (the “Merger Agreement”) with Huntington Bancshares Incorporated, a Maryland corporation (“Huntington”) and The Huntington National Bank, a national bank and a wholly owned subsidiary of
Huntington (“Huntington National Bank” and, together with Huntington, the “Huntington Parties”).
The Merger Agreement provides that, upon the terms and subject to the
conditions set forth therein, Cadence will merge with and into Huntington National Bank (the “Merger”), with Huntington National Bank continuing as the surviving bank in the Merger. The Merger Agreement was unanimously approved by the boards of
directors of each of Cadence, Huntington and Huntington National Bank.
Subject to the terms and conditions set forth in the Merger Agreement,
at the effective time of the Merger (the “Effective Time”), each share of common stock, par value $2.50 per share, of Cadence (“Cadence Common Stock”) outstanding immediately prior to the Effective Time, including any Cadence restricted stock awards
that vest solely as a result of the Merger, and other than certain shares held by Cadence or the Huntington Parties, will be converted into the right to receive 2.475 shares of common stock (the “Exchange Ratio”), par value $0.01 per share, of
Huntington (“Huntington Common Stock”). Holders of Cadence Common Stock will receive cash in lieu of fractional shares. In addition, subject to the terms and conditions set forth in the Merger Agreement, at the Effective Time, each share of 5.50%
Series A Non-Cumulative Perpetual Preferred Stock, par value $0.01 per share, of Cadence (the “Cadence Preferred Stock”) outstanding immediately prior to the Effective Time, will be automatically converted into the right to receive 1/1000 of a share
of a newly created series of preferred stock of Huntington having powers, preferences or special rights that are not materially less favorable than the terms of the Cadence Preferred Stock (all shares of such newly created series, collectively, the
“New Huntington Preferred Stock”) or depositary shares in respect thereof.
Subject to the terms and conditions of the Merger Agreement, at the
Effective Time, (i) each outstanding Cadence restricted stock unit that is not held by a non-employee director of Cadence will convert into a Huntington restricted stock unit, with the number of shares adjusted based on the Exchange Ratio, (ii) each
outstanding Cadence restricted stock unit that is held by a non-employee director of Cadence will accelerate in full and convert into a right to receive (A) Huntington Common Stock, with the numbers of shares adjusted based on the Exchange Ratio, and
(B) a cash payment equal to the accrued dividend equivalents with respect to such unit, (iii) each outstanding Cadence performance stock unit award will convert into a Huntington restricted stock unit, with the number of shares underlying such award
(x) deemed earned based on the greater of target and actual performance measured through the latest practicable date prior to the Effective Time (provided that, with respect to any Cadence performance stock unit award that is subject to a relative
total shareholder return (“rTSR”) modifier and has a performance period ending after December 31, 2025, the rTSR modifier will be determined based on performance measured as of October 21, 2025) and (y) adjusted based on the Exchange Ratio, and (iv)
each outstanding Cadence restricted stock award (other than those that vest solely as a result of the Merger) will convert into Huntington restricted stock, with the number of shares adjusted based on the Exchange Ratio. Each such converted
Huntington award will otherwise continue to be subject to the same terms and conditions as applied to the corresponding Cadence award (excluding any performance-based vesting requirements) in effect immediately prior to the Effective Time.
The Merger Agreement also provides, among other things, that Huntington
will take all appropriate action so that three (3) current directors of Cadence will be appointed to the Board of Directors of Huntington. Each of the directors so appointed will be designated by Huntington, it being agreed that one of the designated
directors will be James D. Rollins III, the Chairman and Chief Executive Officer of Cadence.
Additionally, the Merger Agreement provides that following the
consummation of the Merger, Huntington will maintain the Cadence Bank Foundation and will dedicate any funds in the Cadence Bank Foundation at the Effective Time to supporting community development and reinvestment and civic and charitable activities
within Cadence’s footprint.
The Merger Agreement contains customary representations and warranties
of Cadence and the Huntington Parties, and each of Cadence and Huntington has agreed to customary covenants, including, among others, covenants relating to (i) the conduct of its business during the interim period between the execution of the Merger
Agreement and the Effective Time, (ii) its obligation to call a meeting of its shareholders to approve the Merger and the Merger Agreement, and, subject to certain exceptions, to recommend that its shareholders approve the Merger and the Merger
Agreement and (iii) Cadence’s non-solicitation obligations relating to alternative business combination proposals. Cadence and Huntington have also agreed to use their reasonable best efforts to obtain all necessary permits, consents, approvals and
authorizations for consummation of the transactions contemplated by the Merger Agreement.
The completion of the Merger is subject to customary conditions,
including (i) approval of the issuance of Huntington Common Stock in the Merger by Huntington’s shareholders and approval of the Merger Agreement by Cadence’s shareholders, (ii) authorization for listing on the NASDAQ Stock Market of the shares of
Huntington Common Stock and New Huntington Preferred Stock (or depositary shares in respect thereof) to be issued in the Merger, in each case subject to official notice of issuance, (iii) the receipt of required regulatory approvals, including the
approval of the Office of the Comptroller of the Currency, (iv) the effectiveness of the registration statement on Form S-4 for the shares of Huntington Common Stock and the New Huntington Preferred Stock (or depositary shares in respect thereof) to
be issued in the Merger, and (v) the absence of any order, injunction, decree or other legal restraint preventing the completion of the Merger or any of the other transactions contemplated by the Merger Agreement or making the completion of the
Merger or any of the other transactions contemplated by the Merger Agreement illegal. Each party’s obligation to complete the Merger is also subject to certain additional customary conditions, including (i) subject to certain exceptions, the accuracy
of the representations and warranties of the other party, (ii) performance in all material respects by the other party of its obligations under the Merger Agreement and (iii) receipt by such party of an opinion of counsel to the effect that the
Merger will qualify as a “reorganization” within the meaning of Section 368(a) of the Internal Revenue Code of 1986, as amended.
The Merger Agreement provides certain termination rights for
Cadence and the Huntington Parties and further provides that a termination fee of $296,000,000 will be payable by either Cadence or Huntington, as applicable, in the event of a termination of the Merger Agreement under certain circumstances.
The representations, warranties and covenants of each party set
forth in the Merger Agreement have been made only for purposes of, and were and are solely for the benefit of the parties to, the Merger Agreement, may be subject to limitations agreed upon by the contracting parties, including being qualified by
confidential disclosures made for the purposes of allocating contractual risk between the parties to the Merger Agreement instead of establishing these matters as facts, and may be subject to standards of materiality applicable to the parties that
differ from those applicable to investors. Accordingly, the representations and warranties may not describe the actual state of affairs at the date they were made or at any other time, and investors should not rely on them as statements of fact. In
addition, such representations and warranties (i) will not survive consummation of the Merger and (ii) were made only as of the date of the Merger Agreement or such other date as is specified in the Merger Agreement. Moreover, information concerning
the subject matter of the representations and warranties may change after the date of the Merger Agreement, which subsequent information may or may not be fully reflected in the parties’ public disclosures. Accordingly, the Merger Agreement is
included with this filing only to provide investors with information regarding the terms of the Merger Agreement, and not to provide investors with any other factual information regarding Cadence, Huntington, their respective affiliates or their
respective businesses. The Merger Agreement should not be read alone, but should instead be read in conjunction with the other information regarding Cadence, the Huntington Parties, their respective affiliates or their respective businesses, the
Merger Agreement and the Merger, that will be contained in, or incorporated by reference into, the registration statement on Form S-4 that will include a joint proxy statement of Cadence and Huntington and also constitute a prospectus of Huntington,
as well as in the Annual Reports on Form 10-K, Quarterly Reports on Form 10-Q, Current Reports on Form 8-K and other filings that Cadence makes with the Board of Governors of the Federal Reserve System and that Huntington makes with the Securities
and Exchange Commission.
The foregoing description of the Merger Agreement does not
purport to be complete and is qualified in its entirety by reference to the full text of the Merger Agreement, which is attached hereto as Exhibit 2.1 and is incorporated herein by reference.
|
Item 9.01. |
Financial Statements and Exhibits. |
EXHIBIT INDEX
CAUTION REGARDING FORWARD-LOOKING STATEMENTS
The information contained or incorporated by reference into this presentation may
contain certain forward-looking statements, including, but not limited to, certain plans, expectations, goals, projections, and statements about the benefits of the proposed transaction, the plans, objectives, expectations and intentions of
Huntington Bancshares Incorporated (“Huntington”) and Cadence Bank (“Cadence”), the expected timing of completion of the transaction, and other statements that are not historical facts. Such statements are subject to numerous
assumptions, risks, estimates, uncertainties and other important factors that change over time and could cause actual results to differ materially from any results, performance, or events expressed or implied by such forward-looking statements,
including as a result of the factors referenced below. Statements that do not describe historical or current facts, including statements about beliefs and expectations, are forward-looking statements. Forward-looking statements may be identified by
words such as expect, anticipate, continue, believe, intend, estimate, plan, trend, objective, target, goal, or similar expressions, or future or conditional verbs such as will, may, might, should, would, could, or similar variations. The
forward-looking statements are intended to be subject to the safe harbor provided by Section 27A of the Securities Act of 1933, Section 21E of the Securities Exchange Act of 1934, and the Private Securities Litigation Reform Act of 1995.
Huntington and Cadence caution that the forward-looking statements in this communication are not guarantees of future performance and involve a number of known and
unknown risks, uncertainties and assumptions that are difficult to assess and are subject to change based on factors which are, in many instances, beyond Huntington’s and
Cadence’s control. While there is no assurance that any list of risks and uncertainties or risk factors is complete, below are certain factors which could cause actual results to differ materially from those contained or implied in the
forward-looking statements or historical performance: changes in general economic, political, or industry conditions; deterioration in business and economic conditions, including persistent inflation, supply chain issues or labor shortages,
instability in global economic conditions and geopolitical matters, as well as volatility in financial markets; changes in U.S. trade policies, including the imposition of tariffs and retaliatory tariffs; the impact of pandemics and other
catastrophic events or disasters on the global economy and financial market conditions and our business, results of operations, and financial condition; the impacts related to or resulting from bank failures and other volatility, including potential
increased regulatory requirements and costs, such as Federal Deposit Insurance Corporation (the “FDIC”) special assessments, long-term debt requirements and heightened capital requirements, and potential impacts to macroeconomic conditions,
which could affect the ability of depository institutions, including us, to attract and retain depositors and to borrow or raise capital; unexpected outflows of uninsured deposits which may require us to sell investment securities at a loss; changing
interest rates which could negatively impact the value of our portfolio of investment securities; the loss of value of our investment portfolio which could negatively impact market perceptions of us and could lead to deposit withdrawals; the effects
of social media on market perceptions of us and banks generally; cybersecurity risks; uncertainty in U.S. fiscal and monetary policy, including the interest rate policies of the Board of Governors of the Federal Reserve System (the “Federal
Reserve”); volatility and disruptions in global capital, foreign exchange and credit markets; movements in interest rates; competitive pressures on product pricing and services; success, impact, and timing of our business strategies, including
market acceptance of any new products or services including those implementing our “Fair Play” banking philosophy; changes in policies and standards for regulatory review of bank mergers; the nature, extent, timing, and results of governmental
actions, examinations, reviews, reforms, regulations, and interpretations, including those related to the Dodd-Frank Wall Street Reform and Consumer Protection Act and the Basel III regulatory capital reforms, as well as those involving the
Securities and Exchange Commission (the “SEC”), the Office of the Comptroller of the Currency, Federal Reserve, FDIC, the Consumer Financial Protection Bureau and state-level regulators; the occurrence of any event, change or other
circumstances that could give rise to the right of one or both of the parties to terminate the merger agreement between Huntington and Cadence; the outcome of any legal proceedings that may be instituted against Huntington or Cadence; delays in
completing the proposed transaction involving Huntington and Cadence; the failure to obtain necessary regulatory approvals (and the risk that such approvals may result in the imposition of conditions that could adversely affect the combined company
or the expected benefits of the transaction); the failure to obtain Huntington shareholder approval or Cadence shareholder approval or to satisfy any of the other conditions to the transaction on a timely basis or at all; the possibility that the
anticipated benefits of the transaction are not realized when expected or at all, including as a result of the impact of, or problems arising from, the integration of the two companies or as a result of the strength of the economy and competitive
factors in the areas where Huntington and Cadence do business; the possibility that the transaction may be more expensive to complete than anticipated, including as a result of unexpected factors or events; the ability of Huntington and Cadence to
meet expectations regarding the timing, completion and accounting and tax treatment of the transaction; diversion of management’s attention from ongoing business operations and opportunities; potential adverse reactions or changes to business,
customer or employee relationships, including those resulting from the announcement or completion of the transaction; the ability to complete the transaction and integration of Huntington and Cadence successfully; the dilution caused by Huntington’s
issuance of additional shares of its capital stock in connection with the transaction; and other factors that may affect the future results of Huntington and Cadence. Additional factors that could cause results to differ materially from those
described above can be found in Huntington’s Annual Report on Form 10-K for the year ended December 31, 2024 and in its subsequent Quarterly Reports on Form 10-Q, including for the quarter ended June 30, 2025, each of which is on file with the SEC
and available on the “Investor Relations” section of Huntington’s website, http://www.huntington.com, under the heading “Investor Relations” and in other documents Huntington files with the SEC, and in Cadence’s Annual Report on Form 10-K for the
year ended December 31, 2024 and in its subsequent Quarterly Reports on Form 10-Q, including for the quarter ended June 30, 2025, each of which is on file with the Federal Reserve and available on Cadence’s investor relations website,
ir.cadencebank.com, under the heading “Public Filings” and in other documents Cadence files with the Federal Reserve.
All forward-looking statements are expressly qualified in their entirety by the cautionary
statements set forth above. Forward-looking statements speak only as of the date they are made and are based on information available at that time. Neither Huntington nor Cadence assume any obligation to update forward-looking statements to reflect
actual results, new information or future events, changes in assumptions or changes in circumstances or other factors affecting forward-looking statements that occur after the date the forward-looking statements were made or to reflect the occurrence
of unanticipated events except as required by federal securities laws. If Huntington or Cadence updates one or more forward-looking statements, no inference should be drawn that Huntington or Cadence will make additional updates with respect to those
or other forward-looking statements. As forward-looking statements involve significant risks and uncertainties, caution should be exercised against placing undue reliance on such statements.
IMPORTANT ADDITIONAL INFORMATION
In connection with the proposed transaction, Huntington will file with the SEC a Registration Statement on Form S-4 that will
include a Joint Proxy Statement of Huntington and Cadence and a Prospectus of Huntington, as well as other relevant documents concerning the proposed transaction. The proposed transaction involving Huntington and Cadence will be submitted to
Huntington’s shareholders and Cadence’s shareholders for their consideration. This communication does not constitute an offer to sell or the solicitation of an offer to buy any securities or a solicitation of any vote or approval, nor shall there be
any sale of securities in any jurisdiction in which such offer, solicitation or sale would be unlawful prior to registration or qualification under the securities laws of any such jurisdiction. INVESTORS, SHAREHOLDERS OF HUNTINGTON AND SHAREHOLDERS
OF CADENCE ARE URGED TO READ THE REGISTRATION STATEMENT AND THE JOINT PROXY STATEMENT/PROSPECTUS REGARDING THE TRANSACTION WHEN IT BECOMES AVAILABLE AND ANY OTHER RELEVANT DOCUMENTS FILED WITH THE SEC AND THE FEDERAL RESERVE, AS WELL AS ANY
AMENDMENTS OR SUPPLEMENTS TO THOSE DOCUMENTS, BECAUSE THEY WILL CONTAIN IMPORTANT INFORMATION. Shareholders will be able to obtain a free copy of the definitive joint proxy statement/prospectus, as well as other filings containing information about
Huntington and Cadence, without charge, at the SEC’s website (http://www.sec.gov) and Cadence’s website (https://ir.cadencebank.com/fdic-federal-reserve-filings), respectively. Copies of the joint proxy statement/prospectus, when available, and the
filings with the SEC and the Federal Reserve that will be incorporated by reference in the joint proxy statement/prospectus can also be obtained, without charge, by directing a request to Huntington Investor Relations, Huntington Bancshares
Incorporated, Huntington Center, 41 South High Street, Columbus, Ohio 43287, (800) 576-5007. Copies of the joint proxy statement/prospectus, when available, and filings containing information about Cadence may be obtained after their filing with the
Federal Reserve at (https://ir.cadencebank.com/fdic-federal-reserve-filings), by directing a request to Will Fisackerly, Cadence Investor Relations, Cadence Bank, (800) 698-7878, IR@cadencebank.com. References to Cadence’s website does not constitute
incorporation by reference of the information contained on the website and is not, and should not be, deemed part of this filing.
PARTICIPANTS IN THE SOLICITATION
Huntington, Cadence, and certain of their respective directors and executive officers may be deemed to be
participants in the solicitation of proxies from the shareholders of Huntington and shareholders of Cadence in connection with the proposed transaction. Information regarding the interests of the directors and executive officers of Huntington and
Cadence and other persons who may be deemed to be participants in the solicitation of shareholders of Huntington and Cadence in connection with the transaction and a description of their direct and indirect interests, by security holdings or
otherwise, will be included in the definitive joint proxy statement/prospectus related to the transaction, which will be filed by Huntington with the SEC. Information regarding Huntington’s directors and executive officers is available in its
definitive joint proxy statement relating to its 2025 Annual Meeting of Shareholders, which was filed with the SEC on March 6, 2025, and other documents filed by Huntington with the SEC. Information regarding Cadence’s directors and executive
officers is available in its definitive proxy statement relating to its 2025 Annual Meeting of Shareholders, which was filed with the Federal Reserve on March 14, 2025, and other documents filed by Cadence with the Federal Reserve. Other information
regarding the participants in the proxy solicitation and a description of their direct and indirect interests, by security holdings or otherwise, will be contained in the joint proxy statement/prospectus and other relevant materials filed with the
SEC and the Federal Reserve by Huntington and Cadence, respectively. Free copies of these documents may be obtained as described above under “Important Additional Information.”
SIGNATURES
Pursuant to the requirements of the Securities Exchange Act of 1934, the Registrant has duly
caused this Report to be signed on its behalf by the undersigned hereunto duly authorized.
| |
CADENCE BANK |
|
| |
|
|
|
| |
By |
/s/ Cathy S. Freeman |
|
| |
|
Cathy S. Freeman |
|
| |
|
Senior Executive Vice President and Chief
Administrative Officer |
|
Date: October 30, 2025
Exhibit 2.1
AGREEMENT AND PLAN OF MERGER
by and among
HUNTINGTON BANCSHARES INCORPORATED,
THE HUNTINGTON NATIONAL BANK
and
CADENCE BANK
Dated as of October 26, 2025
TABLE OF CONTENTS
| EXHIBITS |
| |
| Exhibit A |
- Form of Articles Supplementary |
INDEX OF DEFINED TERMS
Page
| Adjusted Restricted Stock Unit Award |
4 |
| affiliate |
75 |
| Agreement |
1 |
| Benefit Plans |
19 |
| business day |
75 |
| Cadence |
1 |
| Cadence 401(k) Plan |
60 |
| Cadence Acquisition Proposal |
63 |
| Cadence Adverse Recommendation Change |
55 |
| Cadence Advisory Subsidiary |
31 |
| Cadence Articles |
10 |
| Cadence Benefit Plans |
19 |
| Cadence Board Recommendation |
55 |
| Cadence Bylaws |
10 |
| Cadence Common Stock |
2 |
| Cadence Contract |
25 |
| Cadence Disclosure Schedule |
9 |
| Cadence Equity Awards |
5 |
| Cadence ERISA Affiliate |
19 |
| Cadence Indemnified Parties |
61 |
| Cadence Insiders |
65 |
| Cadence Meeting |
55 |
| Cadence Owned Properties |
27 |
| Cadence Preferred Stock |
3 |
| Cadence Qualified Plans |
20 |
| Cadence Real Property |
27 |
| Cadence Regulatory Agreement |
25 |
| Cadence Reports |
14 |
| Cadence Restricted Stock Award |
3 |
| Cadence Restricted Stock Unit Award |
4 |
| Cadence Stock Plans |
5 |
| Cadence Subsidiary |
11 |
| Cadence Tax Opinion |
69 |
| Chosen Courts |
77 |
| Closing |
1 |
| Closing Date |
1 |
| Code |
1 |
| Confidentiality Agreement |
54 |
| Continuing Employees |
59 |
| Effective Time |
2 |
| Enforceability Exceptions |
12 |
| Environmental Laws |
26 |
| ERISA |
19 |
| Exception Shares |
2 |
| Exchange Act |
13 |
| Exchange Agent |
6 |
| Exchange Fund |
6 |
| Exchange Ratio |
2 |
| FDIC |
10 |
| Federal Reserve |
13 |
| GAAP |
10 |
| Governmental Entity |
13 |
| Huntington |
1 |
| Huntington 401(k) Plan |
60 |
| Huntington Acquisition Proposal |
72 |
| Huntington Adverse Recommendation Change |
57 |
| Huntington Articles |
32 |
| Huntington Benefit Plans |
44 |
| Huntington Board Recommendation |
57 |
| Huntington Bylaws |
32 |
| Huntington Common Stock |
2 |
| Huntington Contract |
41 |
| Huntington Deferred Stock Unit Awards |
33 |
| Huntington Disclosure Schedule |
32 |
| Huntington ERISA Affiliate |
44 |
| Huntington Meeting |
57 |
| Huntington Preferred Stock |
33 |
| Huntington Regulatory Agreement |
42 |
| Huntington Reports |
36 |
| Huntington Restricted Stock Unit Awards |
33 |
| Huntington Share Closing Price |
8 |
| Huntington Stock Options |
33 |
| Huntington Stock Plans |
33 |
| Huntington Subsidiary |
32 |
| Huntington Tax Opinion |
68 |
| Intellectual Property |
28 |
| Investment Advisers Act |
31 |
| IRS |
18 |
| Joint Proxy Statement |
13 |
| knowledge |
75 |
| Liens |
12 |
| Loans |
29 |
| made available |
75 |
| Material Adverse Effect |
10 |
| Materially Burdensome Regulatory Condition |
53 |
| MBCA |
1 |
| Merger |
1 |
| Merger Consideration |
2 |
| Mississippi Articles of Merger |
2 |
| Mississippi Department |
2 |
| Mississippi Secretary |
2 |
| MS Code |
1 |
| Multiemployer Plan |
20 |
| Multiple Employer Plan |
20 |
| NASDAQ |
8 |
| New Certificates |
6 |
| New Huntington Preferred Stock |
3 |
| New Plans |
59 |
| OCC |
2 |
| Old Certificate |
3 |
| Permitted Encumbrances |
27 |
| person |
75 |
| Personal Data |
22 |
| Premium Cap |
61 |
| Regulatory Agencies |
14 |
| Representatives |
63 |
| Requisite Cadence Vote |
12 |
| Requisite Huntington Vote |
34 |
| Requisite Regulatory Approvals |
67 |
| S-4 |
13 |
| Sarbanes-Oxley Act |
16 |
| SEC |
13 |
| Securities Act |
36 |
| SRO |
13 |
| Subsidiary |
10 |
| Surviving Bank |
1 |
| Takeover Restrictions |
28 |
| Tax |
19 |
| Tax Return |
19 |
| Taxes |
19 |
| Termination Date |
69 |
| Termination Fee |
71 |
| Willful Breach |
71 |
AGREEMENT AND PLAN OF MERGER
AGREEMENT AND PLAN OF MERGER, dated as of October 26, 2025 (this “Agreement”), by and
among Huntington Bancshares Incorporated, a Maryland corporation (“Huntington”), The Huntington National Bank, a national bank and a wholly owned Subsidiary of Huntington (“Huntington National Bank” and together with Huntington, the “Huntington
Parties”) and Cadence Bank, a Mississippi-chartered bank (“Cadence”).
W I T N E S S E T H:
WHEREAS, the Boards of Directors of Huntington, Huntington National Bank and Cadence have
determined that it is in the best interests of their respective companies and their shareholders to consummate the strategic business combination transaction provided for herein, pursuant to which Cadence will, subject to the terms and conditions set
forth herein, merge with and into Huntington National Bank (the “Merger”), so that Huntington National Bank is the surviving bank (hereinafter sometimes referred to in such capacity as the “Surviving Bank”);
WHEREAS, for U.S. federal income tax purposes, it is intended that the
Merger shall qualify as a “reorganization” within the meaning of Section 368(a) of the Internal Revenue Code of 1986, as amended (the “Code”) and this Agreement is intended to be and is adopted as a “plan of reorganization” for purposes of
Sections 354 and 361 of the Code; and
WHEREAS, the parties desire to make certain representations, warranties
and agreements in connection with the Merger and also to prescribe certain conditions to the Merger.
NOW, THEREFORE, in consideration of the mutual covenants, representations, warranties and
agreements contained herein, and intending to be legally bound hereby, the parties agree as follows:
ARTICLE I
THE MERGER
1.1 The Merger. Subject to the terms and conditions of this Agreement, in accordance with the provisions of, and with the effects provided in, 12 U.S.C. § 215a-1, Article 11 of the Mississippi Business Corporation Act, as
amended (the “MBCA”), and Chapter 5 of Title 81 of the Mississippi Code of 1972, as amended (the “MS Code”), at the Effective Time, Cadence shall merge with and into Huntington National Bank. Huntington National Bank shall be the
Surviving Bank in the Merger and shall continue its corporate existence under the laws of the United States. Upon consummation of the Merger, the separate corporate existence of Cadence shall terminate.
1.2 Closing. Subject to the terms and conditions of this
Agreement, the closing of the Merger (the “Closing”) will take place at 10:00 a.m., New York City time, remotely via the electronic exchange of closing deliveries, on a date which shall be no later than three (3) business days after the
satisfaction or waiver (subject to applicable law) of the latest to occur of the conditions set forth in Article VII hereof (other than those conditions that by their nature can only be satisfied at the Closing, but subject to the satisfaction or
waiver thereof), unless another date, time or place is agreed to in writing by Huntington and Cadence. The date on which the Closing occurs is referred to in this Agreement as the “Closing Date”.
1.3 Effective Time. Subject to the terms and conditions of
this Agreement, on or before the Closing Date, Huntington National Bank and Cadence will provide the requisite materials to the Office of the Comptroller of the Currency (the “OCC”) and will cause articles of merger (the “Mississippi
Articles of Merger”) to be filed as provided under the MBCA with the Mississippi Secretary of State (the “Mississippi Secretary”) in accordance with the MBCA and with the Mississippi Department of Banking and Consumer Finance (the “Mississippi
Department”) in accordance with the MS Code. The Merger shall become effective as of the date and time specified in the Articles of Merger and notice from the OCC in accordance with the relevant provisions of the MBCA, the MS Code and federal
law, or at such other date and time as shall be provided by applicable law (such date and time, the “Effective Time”).
1.4 Effects of the Merger. At and after the Effective Time,
all assets of Cadence as they exist at the Effective Time shall pass to and vest in the Surviving Bank without any conveyance or other transfer, the Surviving Bank shall be responsible for all liabilities of every kind and description of Cadence as
they exist as of the Effective Time, and the Merger shall have the effects set forth in the applicable provisions of the MBCA, the MS Code, federal law and this Agreement.
1.5 Conversion of Cadence Common Stock. At the Effective Time,
by virtue of the Merger and without any action on the part of Huntington, Huntington National Bank, Cadence, or the holder of any of the following securities:
(a) Subject to Section 2.2(e), each share of the common stock, par value $2.50 per share,
of Cadence issued and outstanding immediately prior to the Effective Time (“Cadence Common Stock”), except for shares of Cadence Common Stock owned by Cadence or the Huntington Parties (in each case other than shares of Cadence Common Stock
(i) held in any Cadence Benefit Plans or related trust accounts, managed accounts, mutual funds and the like, or otherwise held in a fiduciary or agency capacity and (ii) held, directly or indirectly, in respect of debts previously contracted
(collectively, the “Exception Shares”)) shall be converted, in accordance with the procedures set forth in this Agreement, into the right to receive, without interest, 2.475 shares (the “Exchange Ratio” and such shares, the “Merger
Consideration”) of the common stock, par value $0.01 per share, of Huntington (the “Huntington Common Stock”).
(b) All shares of Cadence Common Stock converted into the right to receive the Merger
Consideration pursuant to this Article I shall no longer be outstanding and shall automatically be cancelled and shall cease to exist as of the Effective Time, and each certificate (each, an “Old Certificate,” it being understood that
any reference herein to “Old Certificate” shall be deemed to include reference to book-entry account statements relating to the ownership of shares of Cadence Common Stock) previously representing any such shares of Cadence Common Stock shall
thereafter represent only the right to receive (i) the Merger Consideration, (ii) cash in lieu of a fractional share which the shares of Cadence Common Stock represented by such Old Certificate have been converted into the right to receive pursuant to
this Section 1.5 and Section 2.2(e), and (iii) any dividends or distributions which the holder thereof has the right to receive pursuant to Section 2.2, in each case of clauses (i), (ii) and (iii), without any interest thereon. Old Certificates
previously representing shares of Cadence Common Stock shall be exchanged for certificates or, at Huntington’s option, evidence of shares in book-entry form representing whole shares of Huntington Common Stock as set forth in Section 1.5(a) (together
with any dividends or distributions with respect thereto and cash in lieu of fractional shares issued in consideration therefor) upon the surrender of such Old Certificates in accordance with Section 2.2, without any interest thereon. If, between the
date of this Agreement and the Effective Time, the outstanding shares of Huntington Common Stock or Cadence Common Stock shall have been increased, decreased, changed into or exchanged for a different number or kind of shares or securities, in any such
case as a result of a reorganization, recapitalization, reclassification, stock dividend, stock split, reverse stock split, or other similar change in capitalization, or there shall be any extraordinary dividend or extraordinary distribution, an
appropriate and proportionate adjustment shall be made to the Exchange Ratio to give holders of Cadence Common Stock the same economic effect as contemplated by this Agreement prior to such event; provided, that nothing in this sentence shall
be construed to permit Huntington or Cadence to take any action with respect to its securities that is prohibited by the terms of this Agreement.
(c) Notwithstanding anything in this Agreement to the contrary, at the Effective Time,
all shares of Cadence Common Stock that are owned by Cadence or the Huntington Parties (in each case other than the Exception Shares) immediately prior to the Effective Time shall be cancelled and shall cease to exist, and neither the Merger
Consideration nor any other consideration shall be delivered in exchange therefor.
1.6 Cadence Preferred Stock. At the Effective Time, by virtue of the Merger and without any action on the part of Huntington, Cadence or any holder of securities thereof, each share of 5.50% Series A Non-Cumulative Perpetual
Preferred Stock, par value $0.01 per share, of Cadence (“Cadence Preferred Stock”) issued and outstanding immediately prior to the Effective Time shall automatically be converted into the right to receive 1/1000 of a share of a newly created
series of preferred stock of Huntington having such powers, preferences or special rights that are not materially less favorable to the holders thereof than the powers, preferences or special rights of the Cadence Preferred Stock and in substantially
the form set forth in Exhibit A attached hereto (all shares of such newly created series, collectively, the “New Huntington Preferred Stock”) or depositary shares in respect thereof and, upon such conversion, the Cadence Preferred
Stock shall no longer be outstanding and shall automatically be cancelled and shall cease to exist as of the Effective Time.
1.7 Huntington Common Stock. At and after the Effective Time,
each share of Huntington National Bank common stock and preferred stock issued and outstanding immediately prior to the Effective Time shall remain issued and outstanding and shall not be affected by the Merger.
1.8 Treatment of Cadence Equity Awards.
(a) At the Effective Time, the portion of each award in respect of a share of Cadence
Common Stock subject to vesting, repurchase or other lapse restriction granted under a Cadence Stock Plan that is outstanding immediately prior to the Effective Time (a “Cadence Restricted Stock Award”) that was granted in September 2020 with
a May 2027 vesting date and that pursuant to its existing terms would vest automatically at the Effective Time shall automatically and without any required action on the part of the holder thereof, accelerate to the extent contemplated by its
existing terms and convert into, and become exchanged for the Merger Consideration with respect to each share of Cadence Common Stock subject to such Cadence Restricted Stock Award immediately prior to the Effective Time (less applicable Taxes
required to be withheld with respect to such vesting), pursuant to Section 1.5(b).
(b) At the Effective Time, each Cadence Restricted Stock Award or portion thereof, other
than the portion of each Cadence Restricted Stock Award covered by Section 1.8(a), shall automatically and without any required action on the part of the holder thereof, be assumed and converted into a restricted stock award of shares of Huntington
Common Stock subject to vesting, repurchase or other lapse restriction with the same terms and conditions as were applicable under such Cadence Restricted Stock Award immediately prior to the Effective Time (including vesting terms), and relating to
the number of shares of Huntington Common Stock equal to the product of (i) the number of shares of Cadence Common Stock subject to such Cadence Restricted Stock Award (or portion thereof) immediately prior to the Effective Time, multiplied by
(ii) the Exchange Ratio, with any fractional shares rounded to the nearest whole share of Huntington Common Stock.
(c) At the Effective Time, each restricted stock unit award in respect of shares of
Cadence Common Stock granted under a Cadence Stock Plan that is outstanding immediately prior to the Effective Time (a “Cadence Restricted Stock Unit Award”) that is held by a non-employee member of the Board of Directors of Cadence shall
automatically and without any required action on the part of the holder thereof, accelerate in full and convert into the right to receive (i) a number of shares of Huntington Common Stock equal to the product of (A) the number of shares of Cadence
Common Stock subject to such Cadence Restricted Stock Unit Award immediately prior to the Effective Time, multiplied by (B) the Exchange Ratio, with any fractional shares rounded to the nearest whole share of Huntington Common Stock and (ii)
an amount in cash equal to the dividend equivalent payments with respect to such Cadence Restricted Stock Unit Award that are accrued but unpaid as of the Effective Time.
(d) At the Effective Time, each Cadence Restricted Stock Unit Award, other than Cadence
Restricted Stock Unit Awards covered by Section 1.8(b), shall be assumed and converted into a restricted stock unit award (with any performance goals applicable to a Cadence Restricted Stock Unit Award deemed satisfied at the greater of the target
level and actual level of performance through the latest practicable date prior to the Effective Time (or such other date as provided in the Cadence Disclosure Schedule), which may be the end of the most recently completed fiscal quarter prior to the
Effective Time, as reasonably determined by the Compensation Committee of the Cadence Board immediately prior the Effective Time) in respect of Huntington Common Stock (an “Adjusted Restricted Stock Unit Award”) with the same terms and
conditions as were applicable under such Cadence Restricted Stock Unit Award immediately prior to the Effective Time (including vesting terms) and relating to the number of shares of Huntington Common Stock equal to the product of (i) the number of
shares of Cadence Common Stock subject to such Cadence Restricted Stock Unit Award immediately prior to the Effective Time (based on the deemed achievement of performance as set forth above for any such awards subject to performance-based vesting), multiplied
by (ii) the Exchange Ratio, with any fractional shares rounded to the nearest whole share of Huntington Common Stock; provided that each such Adjusted Restricted Stock Unit Award shall be subject to service-based vesting only and shall
no longer be subject to any performance conditions. For the avoidance of doubt, any amounts relating to dividend equivalent payments with respect to any Cadence Restricted Stock Unit Award (based on the deemed achievement of performance as set forth
above for any such awards subject to performance-based vesting) that are accrued but unpaid as of the Effective Time will carry over and will be paid in accordance with the terms and conditions as were applicable to such Cadence Restricted Stock Unit
Award immediately prior to the Effective Time.
(e) Promptly following the Effective Time, Huntington shall file a post-effective
amendment to the S-4 or an effective registration statement on Form S-8 with respect to the Huntington Common Stock subject to the applicable adjusted Cadence Equity Awards, as required.
(f) At or prior to the Effective Time, Cadence, the Board of Directors of Cadence and its
compensation committee, as applicable, shall adopt any resolutions and take any actions that are necessary for the treatment of the Cadence Equity Awards and to effectuate the provisions of this Section 1.8.
(g) For purposes of this Agreement, the following terms shall have the following
meanings:
(i) “Cadence Equity Awards” means the Cadence Restricted Stock Awards
and Cadence Restricted Stock Unit Awards.
(ii) “Cadence Stock Plans” means the Cadence Bank 2025 Long-Term
Incentive Plan, the Cadence Bank Equity Incentive Plan, the Cadence 2021 Long-Term Equity Incentive Plan, and the Amended and Restated 2015 Omnibus Incentive Plan.
1.9 Charter of Surviving Bank. At the
Effective Time, the charter of Huntington National Bank, as in effect immediately prior to the Effective Time, shall be the charter of the Surviving Bank until thereafter amended in accordance with applicable law.
1.10 Bylaws of Surviving Bank. At the Effective Time, the
bylaws of Huntington National Bank, as in effect immediately prior to the Effective Time, shall be the bylaws of the Surviving Bank until thereafter amended in accordance with applicable law.
1.11 Tax Consequences. It is intended that the Merger shall qualify as a “reorganization” within the meaning of Section
368(a) of the Code, and that this Agreement is intended to be and is adopted as a “plan of reorganization” for purposes of Sections 354 and 361 of the Code.
ARTICLE II
EXCHANGE OF SHARES
2.1 Huntington to Make Consideration Available. At or prior to
the Effective Time, Huntington shall deposit, or shall cause to be deposited, with a bank or trust company designated by Huntington and reasonably acceptable to Cadence (the “Exchange Agent”), for the benefit of the holders of Old Certificates
(which for purposes of this Article II shall be deemed to include certificates or book-entry account statements representing shares of Cadence Preferred Stock), for exchange in accordance with this Article II, (a) certificates or, at Huntington’s
option, evidence in book-entry form, representing shares of Huntington Common Stock and New Huntington Preferred Stock (or depositary shares in respect thereof) to be issued pursuant to Section 1.5 and Section 1.6 and exchanged pursuant to Section
2.2(a) in exchange for outstanding shares of Cadence Common Stock and Cadence Preferred Stock (collectively, referred to herein as “New Certificates”), and (b) cash in an amount sufficient to pay cash in lieu of any fractional shares (such New
Certificates and cash described in the foregoing clauses (a) and (b), together with any dividends or distributions with respect thereto payable in accordance with Section 2.2(b), being hereinafter referred to as the “Exchange Fund”).
2.2 Exchange of Shares.
(a) As promptly as practicable after the Effective Time, but in no event later than ten
(10) days thereafter, Huntington shall cause the Exchange Agent to mail to each holder of record of one or more Old Certificates representing shares of Cadence Common Stock or Cadence Preferred Stock immediately prior to the Effective Time that have
been converted at the Effective Time into the right to receive the Merger Consideration or shares of New Huntington Preferred Stock (or depositary shares in respect thereof), as applicable, pursuant to Article I, a letter of transmittal (which shall
specify that delivery shall be effected, and risk of loss and title to the Old Certificates shall pass, only upon proper delivery of the Old Certificates to the Exchange Agent) and instructions for use in effecting the surrender of the Old
Certificates in exchange for certificates representing the number of whole shares of Huntington Common Stock and any cash in lieu of fractional shares or shares of New Huntington Preferred Stock (or depositary shares in respect thereof), as
applicable, which the shares of Cadence Common Stock or Cadence Preferred Stock represented by such Old Certificate or Old Certificates shall have been converted into the right to receive pursuant to this Agreement as well as any dividends or
distributions to be paid pursuant to Section 2.2(b). From and after the Effective Time, upon proper surrender of an Old Certificate or Old Certificates for exchange and cancellation to the Exchange Agent, together with such properly completed letter
of transmittal, duly executed, the holder of such Old Certificate or Old Certificates shall be entitled to receive in exchange therefor, as applicable, (i) (A) a New Certificate representing that number of whole shares of Huntington Common Stock to
which such holder of Cadence Common Stock shall have become entitled pursuant to the provisions of Article I and (B) a check representing the amount of (x) any cash in lieu of a fractional share which such holder has the right to receive in respect
of the Old Certificate or Old Certificates surrendered pursuant to the provisions of this Article II and (y) any dividends or distributions which the holder thereof has the right to receive pursuant to this Section 2.2 or (ii) (A) a New Certificate
representing the number of shares of New Huntington Preferred Stock (or depositary shares in respect thereof) to which such holder of Cadence Preferred Stock shall have become entitled pursuant to the provisions of Article I and (B) a check
representing the amount of any dividends or distributions which the holder thereof has the right to receive pursuant to this Section 2.2, as applicable, and the Old Certificate or Old Certificates so surrendered shall forthwith be cancelled. No
interest will be paid or accrued on the Huntington Common Stock, New Huntington Preferred Stock (or depositary shares in respect thereof) or any cash in lieu of fractional shares or dividends or distributions payable to holders of Old Certificates.
Until surrendered as contemplated by this Section 2.2, each Old Certificate shall be deemed at any time after the Effective Time to represent only the right to receive, upon surrender, the number of whole shares of Huntington Common Stock or shares
of New Huntington Preferred Stock (or depositary shares in respect thereof) which the shares of Cadence Common Stock or Cadence Preferred Stock, as applicable, represented by such Old Certificate have been converted into the right to receive and any
cash in lieu of fractional shares or in respect of dividends or distributions as contemplated by this Section 2.2.
(b) No dividends or other distributions declared with respect to Huntington Common Stock
or New Huntington Preferred Stock (or depositary shares in respect thereof) shall be paid to the holder of any unsurrendered Old Certificate until the holder thereof shall surrender such Old Certificate in accordance with this Article II. After the
surrender of an Old Certificate in accordance with this Article II, the record holder thereof shall be entitled to receive any such dividends or other distributions, without any interest thereon, which theretofore had become payable with respect to
the whole shares of Huntington Common Stock or shares of New Huntington Preferred Stock (or depositary shares in respect thereof) which the shares of Cadence Common Stock or Cadence Preferred Stock, as applicable, represented by such Old Certificate
have been converted into the right to receive (after giving effect to Section 6.12).
(c) If any New Certificate representing shares of Huntington Common Stock or New
Huntington Preferred Stock (or depositary shares in respect thereof) is to be issued in a name other than that in which the Old Certificate or Old Certificates surrendered in exchange therefor is or are registered, it shall be a condition of the
issuance thereof that the Old Certificate or Old Certificates so surrendered shall be properly endorsed (or accompanied by an appropriate instrument of transfer) and otherwise in proper form for transfer, and that the person requesting such exchange
shall pay to the Exchange Agent in advance any transfer or other similar Taxes required by reason of the issuance of a New Certificate representing shares of Huntington Common Stock or New Huntington Preferred Stock (or depositary shares in respect
thereof) in any name other than that of the registered holder of the Old Certificate or Old Certificates surrendered, or required for any other reason, or shall establish to the satisfaction of the Exchange Agent that such Tax has been paid or is not
payable.
(d) After the Effective Time, there shall be no transfers on the stock transfer books of
Cadence of the shares of Cadence Common Stock or Cadence Preferred Stock that were issued and outstanding immediately prior to the Effective Time. If, after the Effective Time, Old Certificates representing such shares are presented for transfer to
the Exchange Agent, they shall be cancelled and exchanged for New Certificates representing shares of Huntington Common Stock or New Huntington Preferred Stock (or depositary shares in respect thereof), as applicable, cash in lieu of fractional
shares and dividends or distributions that the holder presenting such Old Certificates is entitled to, as provided in this Article II.
(e) Notwithstanding anything to the contrary contained herein, no New Certificates or
scrip representing fractional shares of Huntington Common Stock shall be issued upon the surrender for exchange of Old Certificates or otherwise pursuant to this Agreement, no dividend or distribution with respect to Huntington Common Stock shall be
payable on or with respect to any fractional share, and such fractional share interests shall not entitle the owner thereof to vote or to any other rights of a shareholder of Huntington. In lieu of the issuance of any such fractional share,
Huntington shall pay to each former holder who otherwise would be entitled to receive such fractional share an amount in cash (rounded to the nearest cent) determined by multiplying (i) the average of the closing sale prices of Huntington Common Stock
on the NASDAQ Stock Market (the “NASDAQ”) as reported by The Wall Street Journal for the five (5) consecutive full trading days ending on the day preceding the Closing Date (the “Huntington Share Closing Price”) by (ii) the
fraction of a share (after taking into account all shares of Cadence Common Stock held by such holder immediately prior to the Effective Time and rounded to the nearest thousandth when expressed in decimal form) of Huntington Common Stock which such
holder would otherwise be entitled to receive pursuant to Article I. The parties acknowledge that payment of such cash consideration in lieu of issuing fractional shares is not separately bargained-for consideration, but merely represents a mechanical
rounding off for purposes of avoiding the expense and inconvenience that would otherwise be caused by the issuance of fractional shares.
(f) Any portion of the Exchange Fund that remains unclaimed by the holders of Cadence
Common Stock and Cadence Preferred Stock for one (1) year after the Effective Time shall be paid to Huntington. Any former holders of Cadence Common Stock and Cadence Preferred Stock who have not theretofore exchanged their Old Certificates pursuant
to this Article II shall thereafter look only to Huntington for payment of the shares of Huntington Common Stock and cash in lieu of any fractional shares or shares of New Huntington Preferred Stock (or depositary shares in respect thereof), as
applicable, and any unpaid dividends and distributions on the Huntington Common Stock or New Huntington Preferred Stock (or depositary shares in respect thereof) deliverable in respect of each former share of Cadence Common Stock or Cadence Preferred
Stock, as applicable, that such holder holds as determined pursuant to this Agreement, in each case, without any interest thereon. Notwithstanding the foregoing, none of Huntington, Cadence, the Surviving Bank, the Exchange Agent or any other person
shall be liable to any former holder of shares of Cadence Common Stock or Cadence Preferred Stock for any amount delivered in good faith to a public official pursuant to applicable abandoned property, escheat or similar laws.
(g) Huntington shall be entitled to deduct and withhold, or cause the Exchange Agent to
deduct and withhold, from any cash in lieu of fractional shares of Huntington Common Stock, cash dividends or distributions payable pursuant to this Section 2.2 or any other amounts otherwise payable pursuant to this Agreement to any holder of
Cadence Common Stock, Cadence Preferred Stock or Cadence Equity Awards such amounts as it is required to deduct and withhold with respect to the making of such payment or vesting or settlement of such Cadence Equity Awards under the Code or any
provision of state, local or foreign Tax law, which Taxes shall be satisfied by Huntington withholding the number of shares of Huntington Common Stock necessary to satisfy applicable withholding Taxes that would otherwise be issuable to the holder of
a Cadence Equity Award in respect of such Cadence Equity Award. To the extent that amounts or shares of Huntington Common Stock, as applicable, are so withheld by Huntington or the Exchange Agent, as the case may be, and the applicable Taxes are
timely paid over to the appropriate governmental authority, the withheld amounts or shares of Huntington Common Stock shall be treated for all purposes of this Agreement as having been paid or delivered to the holder of Cadence Common Stock, Cadence
Preferred Stock or Cadence Equity Awards in respect of which the deduction and withholding was made by Huntington or the Exchange Agent, as the case may be. Notwithstanding anything herein to the contrary, any amounts payable in connection with the
Closing in respect of any Cadence Equity Award pursuant to Section 1.7, with respect to employee award holders of Cadence and its Subsidiaries may be made through the payroll system of the Surviving Bank or one of its affiliates.
(h) In the event any Old Certificate shall have been lost, stolen or destroyed, upon the
making of an affidavit of that fact by the person claiming such Old Certificate to be lost, stolen or destroyed and, if required by Huntington or the Exchange Agent, the posting by such person of a bond in such amount as Huntington or the Exchange
Agent may determine is reasonably necessary as indemnity against any claim that may be made against it with respect to such Old Certificate, the Exchange Agent will issue in exchange for such lost, stolen or destroyed Old Certificate the shares of
Huntington Common Stock and any cash in lieu of fractional shares, or the shares of New Huntington Preferred Stock (or depositary shares in respect thereof), as applicable, deliverable in respect thereof pursuant to this Agreement.
ARTICLE III
REPRESENTATIONS AND WARRANTIES OF CADENCE
Except (a) as disclosed in the disclosure schedule delivered by Cadence to the Huntington
Parties concurrently herewith (the “Cadence Disclosure Schedule”); provided, that (i) no such item is required to be set forth as an exception to a representation or warranty if its absence would not result in the related
representation or warranty being deemed untrue or incorrect, (ii) the mere inclusion of an item in the Cadence Disclosure Schedule as an exception to a representation or warranty shall not be deemed an admission by Cadence that such item represents a
material exception or fact, event or circumstance or that such item is reasonably likely to result in a Material Adverse Effect and (iii) any disclosures made with respect to a section of this Article III shall be deemed to qualify (A) any other
section of this Article III specifically referenced or cross-referenced and (B) other sections of this Article III to the extent it is reasonably apparent on its face (notwithstanding the absence of a specific cross reference) from a reading of the
disclosure that such disclosure applies to such other sections or (ii) as disclosed in any Cadence Reports publicly filed prior to the date hereof (but disregarding risk factor disclosures contained under the heading “Risk Factors,” or disclosures of
risks set forth in any “forward-looking statements” disclaimer or any other statements that are similarly non-specific or cautionary, predictive or forward-looking in nature), Cadence hereby represents and warrants to the Huntington Parties as follows:
3.1 Corporate Organization.
(a) Cadence is a Mississippi-chartered bank, duly organized, validly existing and in good
standing under the laws of the State of Mississippi. Cadence has the corporate power and authority to own, lease or operate all its properties and assets and to carry on its business as it is now being conducted in all material respects. Cadence is
duly licensed or qualified to do business and in good standing in each jurisdiction in which the nature of the business conducted by it or the character or location of the properties and assets owned, leased or operated by it makes such licensing,
qualification or standing necessary, except where the failure to be so licensed or qualified or to be in good standing would not, either individually or in the aggregate, reasonably be likely to have a Material Adverse Effect on Cadence. As used in
this Agreement, the term “Material Adverse Effect” means, with respect to the Huntington Parties, Cadence or the Surviving Bank, as the case may be, any effect, change, event, circumstance, condition, occurrence or development that,
either individually or in the aggregate, has had or would reasonably be likely to have a material adverse effect on (i) the business, properties, assets, liabilities, results of operations or financial condition of such party and its Subsidiaries,
taken as a whole (provided, however, that, with respect to this clause (i), Material Adverse Effect shall not be deemed to include the impact of or effects arising from (A) changes, after the date hereof, in U.S. generally accepted
accounting principles (“GAAP”) or applicable regulatory accounting requirements or interpretations thereof, (B) changes, after the date hereof, in laws, rules or regulations of general applicability to companies in the industries in which such
party and its Subsidiaries operate, or interpretations thereof by courts or Governmental Entities, (C) changes, after the date hereof, in global, national or regional political conditions (including the outbreak, continuation or escalation of war or
acts of terrorism or cyberattacks) or in economic or market conditions (including equity, credit and debt markets, as well as changes in interest rates) affecting the financial services industry generally and not specifically relating to such party or
its Subsidiaries, (D) any international tariffs, trade policies or similar “trade” actions, (E) changes, after the date hereof, resulting from hurricanes, earthquakes, tornados, floods, wildfires or other natural or manmade disasters or from any
outbreak of any disease, epidemic, pandemic or other public health event, (F) public disclosure of the execution of this Agreement, public disclosure or consummation of the transactions contemplated hereby (including any effect on a party’s
relationships with its customers or employees) (it being understood that this clause (F) shall not apply for purposes of the representations and warranties in Sections 3.3(b), 3.4, 4.3(b) or 4.4) or actions expressly required by this Agreement or that
are taken with the prior written consent of the other party in contemplation of the transactions contemplated hereby, or (G) a decline in the trading price of a party’s common stock or the failure, in and of itself, to meet earnings projections or
internal financial forecasts, but not, in either case, including any underlying causes thereof; except, with respect to subclauses (A), (B), (C) or (D), to the extent that the effects of such change are materially disproportionately adverse to the
business, properties, assets, liabilities, results of operations or financial condition of such party and its Subsidiaries, taken as a whole, as compared to other companies in the industry in which such party and its Subsidiaries operate) or (ii) the
ability of such party to timely consummate the transactions contemplated hereby. As used in this Agreement, the term “Subsidiary,” when used with respect to any person, means any corporation, partnership, limited liability company, bank or other
organization, whether incorporated or unincorporated, which is consolidated with such person for financial reporting purposes. True and complete copies of the articles of incorporation of Cadence, as amended (the “Cadence Articles”) and the
bylaws of Cadence, as amended (the “Cadence Bylaws”), as in effect as of the date of this Agreement, have previously been made available by Cadence to the Huntington Parties. The deposit accounts of Cadence are insured by the Federal Deposit
Insurance Corporation (the “FDIC”) through the Deposit Insurance Fund (as defined in Section 3(y) of the Federal Deposit Insurance Act of 1950) to the fullest extent permitted by law, all premiums and assessments required to be paid in
connection therewith have been paid when due, and no proceedings for the termination of such insurance are pending or, to the knowledge of Cadence, threatened.
(b) Except, in the case of clauses (ii) and (iii) only, as would not reasonably be
likely to have, individually or in the aggregate, a Material Adverse Effect on Cadence, each Subsidiary of Cadence (a “Cadence Subsidiary”) (i) is duly organized and validly existing under the laws of its jurisdiction of organization, (ii) is
duly licensed or qualified to do business and, where such concept is recognized under applicable law, in good standing in all jurisdictions (whether federal, state, local or foreign) where its ownership, leasing or operation of property or the
conduct of its business requires it to be so licensed or qualified or in good standing and (iii) has all requisite corporate power and authority to own, lease or operate its properties and assets and to carry on its business as now conducted. There
are no restrictions on the ability of any Subsidiary of Cadence to pay dividends or distributions, except, in the case of a Subsidiary that is a regulated entity, for restrictions on dividends or distributions generally applicable to all such
regulated entities. Section 3.1(b) of the Cadence Disclosure Schedule sets forth a true and complete list of all Subsidiaries of Cadence as of the date hereof.
3.2 Capitalization.
(a) The authorized capital stock of Cadence consists of 500,000,000 shares of Cadence
Common Stock, par value $2.50 per share, and 500,000,000 shares of Cadence preferred stock, par value $0.01 per share. As of October 23, 2025, no shares of capital stock or other voting securities of Cadence are issued, reserved for issuance or
outstanding, other than (i) 186,307,016 shares of Cadence Common Stock issued and outstanding (inclusive of 36,500 shares of Cadence Common Stock subject to Restricted Stock Awards), (ii) 6,900,000 shares of Cadence Preferred Stock issued and
outstanding, (iii) 3,627,414 shares of Cadence Common Stock reserved for issuance upon the settlement of outstanding Cadence Restricted Stock Unit Awards solely subject to time-vesting conditions, (iv) 1,014,775 shares of Cadence Common Stock reserved
for issuance upon the settlement of outstanding Cadence Restricted Stock Unit Awards subject to performance-based vesting, assuming achievement of the applicable performance goals at the target level of performance (and 1,778,858 shares of Cadence
Common Stock assuming the achievement of the applicable performance goals at the maximum level), and (v) 2,947,054 shares of Cadence Common Stock reserved for issuance for future grants under the Cadence Stock Plans assuming that current awards are
earned at maximum. As of the date of this Agreement, except as set forth in the immediately preceding sentence and for changes since October 23, 2025 resulting from the exercise, vesting or settlement of any Cadence Equity Awards described in the
immediately preceding sentence, there are no shares of capital stock or other voting securities or equity interests of Cadence issued, reserved for issuance or outstanding. All issued and outstanding shares of Cadence Common Stock and Cadence Preferred
Stock have been duly authorized and validly issued and are fully paid, nonassessable and free of preemptive rights, with no personal liability attaching to the ownership thereof. No bonds, debentures, notes or other indebtedness that have the right to
vote on any matters on which shareholders of Cadence may vote are issued or outstanding. Except as set forth in 3.2(a) of the Cadence Disclosure Schedule, as of the date of this Agreement, no trust preferred or subordinated debt securities of Cadence
are issued or outstanding. Other than Cadence Equity Awards issued prior to the date of this Agreement as described in this Section 3.2(a), as of the date of this Agreement, there are no outstanding subscriptions, options, warrants, puts, calls,
rights, exchangeable or convertible securities or other commitments or agreements obligating Cadence to issue, transfer, sell, purchase, redeem or otherwise acquire any such securities.
(b) There are no voting trusts, shareholder agreements, proxies or other agreements in
effect pursuant to which Cadence or any of the Cadence Subsidiaries has a contractual or other obligation with respect to the voting or transfer of Cadence Common Stock or other equity interests of Cadence. Other than the Cadence Equity Awards, no
equity-based awards (including any cash awards where the amount of payment is determined in whole or in part based on the price of any capital stock of Cadence or any of its Subsidiaries) are outstanding. Cadence has paid or made due provision for
the payment of all dividends payable on the outstanding shares of Cadence Preferred Stock through the most recent scheduled dividend payment date therefor, and has complied in all material respects with terms and conditions thereof.
(c) Cadence owns, directly or indirectly, all issued and outstanding shares of capital
stock or other equity ownership interests of each of the Cadence Subsidiaries, free and clear of any liens, pledges, charges, encumbrances and security interests whatsoever (“Liens”), and all such shares or equity ownership interests are duly
authorized and validly issued and are fully paid, nonassessable and free of preemptive rights, with no personal liability attaching to the ownership thereof. No Cadence Subsidiary has or is bound by any outstanding subscriptions, options, warrants,
calls, rights, commitments or agreements of any character calling for the purchase or issuance of any shares of capital stock or any other equity security of such Subsidiary or any securities representing the right to purchase or otherwise receive
any shares of capital stock or any other equity security of such Subsidiary.
3.3 Authority; No Violation.
(a) Cadence has full corporate power and authority to execute and deliver this Agreement
and, subject to the shareholder action described below, to consummate the transactions contemplated hereby. The execution and delivery of this Agreement and the consummation of the Merger have been duly and validly approved by the Board of Directors
of Cadence. The Board of Directors of Cadence has determined that the Merger, on the terms and conditions set forth in this Agreement, is advisable and in the best interests of Cadence and has directed that this Agreement and the transactions
contemplated hereby be submitted to Cadence’s shareholders for approval at a duly held meeting of such shareholders and has adopted a resolution to the foregoing effect. Except for the approval of this Agreement by the affirmative vote of the holders
of a majority of the outstanding shares of Cadence Common Stock entitled to vote on this Agreement (the “Requisite Cadence Vote”), no other corporate proceedings on the part of Cadence are necessary to approve this Agreement or to consummate
the transactions contemplated hereby. This Agreement has been duly and validly executed and delivered by Cadence and (assuming due authorization, execution and delivery by Huntington) constitutes a valid and binding obligation of Cadence, enforceable
against Cadence in accordance with its terms (except in all cases as such enforceability may be limited by bankruptcy, insolvency, fraudulent transfer, moratorium, reorganization or similar laws of general applicability relating to or affecting
insured depository institutions or their parent companies or the rights of creditors generally and subject to general principles of equity (the “Enforceability Exceptions”)).
(b) Subject to the receipt of the Requisite Cadence Vote, neither the execution and
delivery of this Agreement by Cadence nor the consummation by Cadence of the transactions contemplated hereby, nor compliance by Cadence with any of the terms or provisions hereof, will (i) violate any provision of the Cadence Articles or the Cadence
Bylaws or comparable governing documents of any Cadence Subsidiary or (ii) assuming that the consents, approvals and filings referred to in Section 3.4 are duly obtained and/or made, (x) violate any law, statute, code, ordinance, rule, regulation,
judgment, order, writ, decree or injunction applicable to Cadence or any of its Subsidiaries or any of their respective properties or assets or (y) violate, conflict with, result in a breach of any provision of or the loss of any benefit under,
constitute a default (or an event which, with notice or lapse of time, or both, would constitute a default) under, result in the termination of or a right of termination or cancellation under, accelerate the performance required by, or result in the
creation of any Lien upon any of the respective properties or assets of Cadence or any of its Subsidiaries under, any of the terms, conditions or provisions of any note, bond, mortgage, indenture, deed of trust, license, lease, agreement or other
instrument or obligation to which Cadence or any of its Subsidiaries is a party, or by which they or any of their respective properties or assets may be bound, except (in the case of clause (ii) above) for such violations, conflicts, breaches,
defaults, terminations, cancellations, accelerations or creations which, either individually or in the aggregate, would not reasonably be likely to have a Material Adverse Effect on Cadence.
3.4 Consents and Approvals. Except for (a) the filing of any required applications, filings and notices, as applicable, with the NASDAQ, (b) the filing of any required applications, filings and notices, as applicable, with the
NYSE, (c) the filing of any required applications, filings and notices, as applicable, with the OCC in connection with the Merger, including under the Bank Merger Act, and approval of such applications, filings and notices and expiration of any
related waiting period, (d) the filing of any required applications, filings and notices, as applicable, with the Mississippi Department, (e) the filing of any required applications, filings or notices listed on Section 3.4 of the Cadence Disclosure
Schedule or Section 4.4 of the Huntington Disclosure Schedule and approval or non-objection, as applicable, of such applications, filings and notices, (f) the filing with the Board of Governors of the Federal Reserve System (the “Federal Reserve”)
of a joint proxy statement in definitive form relating to the meetings of Cadence’s and Huntington’s shareholders to be held in connection with this Agreement and the transactions contemplated hereby (including any amendments or supplements thereto,
the “Joint Proxy Statement”), and of the registration statement on Form S-4 in which the Joint Proxy Statement will be included as a prospectus, to be filed with the Securities and Exchange Commission (the “SEC”) by Huntington in
connection with the transactions contemplated by this Agreement (the “S-4”) and declaration of effectiveness of the S-4, (g) the filing of the Mississippi Articles of Merger with the Mississippi Secretary pursuant to the MBCA, (h) the filing
with, and acceptance for record by, the Maryland Department of the Articles Supplementary for the New Huntington Preferred Stock, and (i) such filings and approvals as are required to be made or obtained under the securities or “Blue Sky” laws of
various states in connection with the issuance of the shares of Huntington Common Stock and the New Huntington Preferred Stock (or depositary shares in respect thereof) pursuant to this Agreement and the approval of the listing of such Huntington
Common Stock and New Huntington Preferred Stock (or depositary shares in respect thereof) on the NASDAQ, no consents or approvals of or filings or registrations with any court or administrative agency or commission or other governmental authority or
instrumentality or SRO (each a “Governmental Entity”) are necessary in connection with (x) the execution and delivery by Cadence of this Agreement or (y) the consummation by Cadence of the Merger and the other transactions contemplated hereby.
As used in this Agreement, “SRO” means (A) any “self-regulatory organization” as defined in Section 3(a)(26) of the Securities Exchange Act of 1934, as amended (the “Exchange Act”) and (B) any other United States or foreign securities
exchange, futures exchange, commodities exchange or contract market. As of the date hereof, Cadence is not aware of any reason why the necessary regulatory approvals and consents will not be received in order to permit consummation of the Merger on a
timely basis.
3.5 Reports.
(a) Cadence and each of its Subsidiaries have timely filed (or furnished, as applicable)
all reports, registrations and statements, together with any amendments required to be made with respect thereto, that they were required to file (or furnish, as applicable) since January 1, 2023 with (i) any state regulatory authority, (ii) the SEC,
(iii) the FDIC, (iv) the Federal Reserve, (v) the Mississippi Department, (vi) any foreign regulatory authority and (vii) any SRO (clauses (i) – (vii), together with the OCC, collectively, “Regulatory Agencies”), including any report,
registration or statement required to be filed (or furnished, as applicable) pursuant to the laws, rules or regulations of the United States, any state, any foreign entity, or any Regulatory Agency, and have paid all fees and assessments due and
payable in connection therewith, except where the failure to file such report, registration or statement or to pay such fees and assessments, either individually or in the aggregate, would not reasonably be likely to have a Material Adverse Effect on
Cadence. Subject to Section 9.7 and except for normal examinations conducted by a Regulatory Agency in the ordinary course of business of Cadence and its Subsidiaries, no Regulatory Agency has initiated or has pending any proceeding or, to the
knowledge of Cadence, investigation into the business or operations of Cadence or any of its Subsidiaries since January 1, 2023, except where such proceedings or investigations would not reasonably be likely to have, either individually or in the
aggregate, a Material Adverse Effect on Cadence. Subject to Section 9.7, there (x) is no unresolved violation, criticism, or exception by any Regulatory Agency with respect to any report or statement relating to any examinations or inspections of
Cadence or any of its Subsidiaries, and (y) has been no formal or informal inquiries by, or disagreements or disputes with, any Regulatory Agency with respect to the business, operations, policies or procedures of Cadence or any of its Subsidiaries
since January 1, 2023, in each case of clauses (x) and (y), which would reasonably be likely to have, either individually or in the aggregate, a Material Adverse Effect on Cadence.
(b) An accurate and complete copy of each final registration statement, prospectus,
report, schedule and definitive proxy statement filed with or furnished to the FDIC (through November 21, 2024) and the Federal Reserve (from and after November 22, 2024), by Cadence or any of its Subsidiaries pursuant to the Exchange Act, as the
case may be, since January 1, 2023 (the “Cadence Reports”) is publicly available. No such Cadence Report, at the time filed, furnished or communicated (and, in the case of registration statements and proxy statements, on the dates of
effectiveness and the dates of the relevant meetings, respectively), contained any untrue statement of a material fact or omitted to state any material fact required to be stated therein or necessary in order to make the statements therein, in light of
the circumstances in which they were made, not misleading, except that information filed or furnished as of a later date (but before the date of this Agreement) shall be deemed to modify information as of an earlier date. As of their respective dates,
all Cadence Reports filed or furnished under the Exchange Act complied in all material respects with the published rules and regulations of the FDIC (through November 21, 2024) and the Federal Reserve (from and after November 22, 2024) with respect
thereto. As of the date of this Agreement, no executive officer of Cadence has failed in any respect to make the certifications required of him or her under Section 302 or 906 of the Sarbanes-Oxley Act. As of the date of this Agreement, there are no
outstanding comments from or material unresolved issues raised by the FDIC (through November 21, 2024) or the Federal Reserve (from and after November 22, 2024) with respect to any of the Cadence Reports.
3.6 Financial Statements.
(a) The financial statements of Cadence and its Subsidiaries included (or incorporated by
reference) in the Cadence Reports (including the related notes, where applicable) (i) have been prepared from, and are in accordance with, the books and records of Cadence and its Subsidiaries in all material respects, (ii) fairly present in all
material respects the consolidated results of operations, cash flows, changes in shareholders’ equity and consolidated financial position of Cadence and its Subsidiaries for the respective fiscal periods or as of the respective dates therein set
forth (subject in the case of unaudited statements to year-end audit adjustments normal in nature and amount), (iii) complied, as of their respective dates of filing with the FDIC (through November 21, 2024) or the Federal Reserve (from and after
November 22, 2024), in all material respects with applicable accounting requirements and with the published rules and regulations of the FDIC (through November 21, 2024) or the Federal Reserve (from and after November 22, 2024) with respect thereto,
and (iv) have been prepared in accordance with GAAP consistently applied during the periods involved, except, in each case, as indicated in such statements or in the notes thereto. The books and records of Cadence and its Subsidiaries have been,
since January 1, 2023, and are being, maintained in all material respects in accordance with GAAP and any other applicable legal and accounting requirements. Forvis Mazars, LLP has not resigned (or informed Cadence that it intends to resign) or been
dismissed as independent public accountants of Cadence as a result of or in connection with any disagreements with Cadence on a matter of accounting principles or practices, financial statement disclosure or auditing scope or procedure.
(b) Except as would not reasonably be likely to have, either individually or in the
aggregate, a Material Adverse Effect on Cadence, neither Cadence nor any of its Subsidiaries has any liability of any nature whatsoever (whether absolute, accrued, contingent or otherwise and whether due or to become due) required by GAAP to be
included on a consolidated balance sheet of Cadence, except for those liabilities that are reflected or reserved against on the consolidated balance sheet of Cadence included in its Quarterly Report on Form 10-Q for the fiscal quarter ended June 30,
2025 (including any notes thereto) and for liabilities incurred in the ordinary course of business consistent with past practice since June 30, 2025, or in connection with this Agreement and the transactions contemplated hereby.
(c) The records, systems, controls, data and information of Cadence and its Subsidiaries
are recorded, stored, maintained and operated under means (including any electronic, mechanical or photographic process, whether computerized or not) that are under the exclusive ownership and direct control of Cadence or its Subsidiaries or
accountants (including all means of access thereto and therefrom), except for any non-exclusive ownership and non-direct control that would not reasonably be likely to have, either individually or in the aggregate, a Material Adverse Effect on
Cadence. Cadence (i) has implemented and maintains disclosure controls and procedures (as defined in Rule 13a-15(e) of the Exchange Act) to ensure that material information relating to Cadence, including its Subsidiaries, is made known to the chief
executive officer and the chief financial officer of Cadence by others within those entities as appropriate to allow timely decisions regarding required disclosures and to make the certifications required by the Exchange Act and Sections 302 and 906
of the Sarbanes-Oxley Act of 2002 (the “Sarbanes-Oxley Act”), and (ii) has disclosed, based on its most recent evaluation prior to the date hereof, to Cadence’s outside auditors and the audit committee of Cadence’s Board of Directors
(x) any significant deficiencies and material weaknesses in the design or operation of internal control over financial reporting (as defined in Rule 13a-15(f) of the Exchange Act) which are reasonably likely to adversely affect Cadence’s ability to
record, process, summarize and report financial information, and (y) to the knowledge of Cadence, any fraud, whether or not material, that involves management or other employees who have a significant role in Cadence’s internal controls over financial
reporting. These disclosures were made in writing by management to Cadence’s auditors and audit committee and true, correct and complete copies of such disclosures have been made available to Huntington. To the knowledge of Cadence, there is no reason
to believe that Cadence’s outside auditors and its chief executive officer and chief financial officer will not be able to give the certifications and attestations required pursuant to the rules and regulations adopted pursuant to Section 404 of the
Sarbanes-Oxley Act, without qualification, when next due.
(d) Since January 1, 2023, (i) neither Cadence nor any of its Subsidiaries, nor, to the
knowledge of Cadence, any director, officer, auditor, accountant or representative of Cadence or any of its Subsidiaries, has received or otherwise had or obtained knowledge of any material complaint, allegation, assertion or claim, whether written
or, to the knowledge of Cadence, oral, regarding the accounting or auditing practices, procedures, methodologies or methods (including with respect to loan loss reserves, write-downs, charge-offs and accruals) of Cadence or any of its Subsidiaries or
their respective internal accounting controls, including any material complaint, allegation, assertion or written claim that Cadence or any of its Subsidiaries has engaged in questionable accounting or auditing practices, and (ii) no employee of or
attorney representing Cadence or any of its Subsidiaries, whether or not employed or retained by Cadence or any of its Subsidiaries, has reported evidence of a material violation of securities laws, breach of fiduciary duty or similar violation by
Cadence or any of its Subsidiaries or any of their respective officers, directors, employees or agents to the Board of Directors of Cadence or any committee thereof or similar governing body of any Cadence Subsidiary or any committee thereof, or, to
the knowledge of Cadence, to any director or officer of Cadence or any Cadence Subsidiary.
3.7 Broker’s Fees. Neither Cadence nor any Cadence Subsidiary
nor any of their respective officers or directors has employed any broker, finder or financial advisor or incurred any liability for any broker’s fees, commissions or finder’s fees in connection with the Merger or related transactions contemplated by
this Agreement other than Keefe, Bruyette & Woods, Inc.
3.8 Absence of Certain Changes or Events.
(a) Since December 31, 2024, there has not been any effect, change,
event, circumstance, condition, occurrence or development that has had or would reasonably be likely to have, either individually or in the aggregate, a Material Adverse Effect on Cadence.
(b) Since December 31, 2024, through the date of this Agreement, except
with respect to the transactions contemplated hereby, Cadence and its Subsidiaries have carried on their respective businesses in all material respects in the ordinary course.
3.9 Legal Proceedings.
(a) Neither Cadence nor any of its Subsidiaries is a party to any, and
there are no pending or, to the knowledge of Cadence, threatened, legal, administrative, arbitral or other proceedings, claims, actions or governmental or regulatory investigations of any nature against Cadence or any of its Subsidiaries or any of
their current or former directors or executive officers, or of a nature challenging the validity or propriety of this Agreement or the transactions contemplated hereby, in each case, that would reasonably be likely to have, either individually or in
the aggregate, a Material Adverse Effect on Cadence.
(b) There is no material injunction, order, judgment, decree, or
regulatory restriction imposed upon Cadence, any of its Subsidiaries or the assets of Cadence or any of its Subsidiaries (or that, upon consummation of the Merger, would apply to the Surviving Bank or any of its affiliates).
3.10 Taxes and Tax Returns. In each case except
as would not reasonably be likely to have a Material Adverse Effect on Cadence:
(a) Each of Cadence and its Subsidiaries has duly and timely filed
(taking into account all applicable extensions) all Tax Returns in all jurisdictions in which Tax Returns are required to be filed by it, and all such Tax Returns are true, correct, and complete.
(b) Neither Cadence nor any of its Subsidiaries is the beneficiary of
any extension of time within which to file any Tax Return (other than extensions to file Tax Returns obtained in the ordinary course).
(c) All Taxes of Cadence and its Subsidiaries (whether or not shown on
any Tax Returns) that are due have been fully and timely paid, except for Taxes that are being contested in good faith in appropriate proceedings and for which adequate reserves have been established in accordance with GAAP.
(d) Each of Cadence and its Subsidiaries has withheld and paid all Taxes
required to have been withheld and paid in connection with amounts paid or owing to any employee, creditor, shareholder, independent contractor or other third party.
(e) Neither Cadence nor any of its Subsidiaries has granted any extension or waiver of the
limitation period applicable to any Tax that remains in effect.
(f) The federal income Tax Returns of Cadence and its Subsidiaries for all years up to and
including the tax year ended December 31, 2020 have been examined by the Internal Revenue Service (the “IRS”) or are Tax Returns with respect to which the applicable period for assessment under applicable law, after giving effect to
extensions or waivers, has expired.
(g) No deficiency with respect to Taxes has been proposed, asserted or assessed against
Cadence or any of its Subsidiaries. There are no pending or threatened (in writing) disputes, claims, audits, examinations or other proceedings regarding any Taxes of Cadence and its Subsidiaries or the assets of Cadence and its Subsidiaries.
(h) In the last six years, neither Cadence nor any of its Subsidiaries has been informed in
writing by any jurisdiction that the jurisdiction believes that Cadence or any of its Subsidiaries was required to file any Tax Return that was not filed.
(i) Cadence has made available to Huntington true, correct, and complete copies of any
private letter ruling requests, closing agreements or gain recognition agreements with respect to Taxes requested or executed in the last six years.
(j) There are no Liens for Taxes (except Taxes not yet due and payable) on any of the
assets of Cadence or any of its Subsidiaries.
(k) Neither Cadence nor any of its Subsidiaries is a party to or is bound by any Tax
sharing, allocation or indemnification agreement or arrangement (other than (i) such an agreement or arrangement exclusively between or among Cadence and its Subsidiaries or (ii) commercial agreements the principal purpose of which does not relate to
Taxes).
(l) Neither Cadence nor any of its Subsidiaries (i) has been a member of an affiliated
group filing a consolidated federal income Tax Return (other than a group the common parent of which was Cadence) or (ii) has any liability for the Taxes of any person (other than Cadence or any of its Subsidiaries) under Treasury Regulations Section
1.1502-6 (or any similar provision of state, local or foreign law), as a transferee or successor, by contract or otherwise.
(m) Neither Cadence nor any of its Subsidiaries has been, within the past two years or
otherwise as part of a “plan (or series of related transactions)” within the meaning of Section 355(e) of the Code of which the Merger is also a part, a “distributing corporation” or a “controlled corporation” (within the meaning of Section
355(a)(1)(A) of the Code) in a distribution of stock intended to qualify for tax-free treatment under Section 355 of the Code.
(n) Neither Cadence nor any of its Subsidiaries has participated in a “listed transaction”
within the meaning of Treasury Regulations Section 1.6011-4(b)(2).
(o) At no time during the past five years has Cadence been a United States real property
holding corporation within the meaning of Section 897(c)(2) of the Code.
(p) As used in this Agreement, the term “Tax” or “Taxes” means all federal,
state, local, and foreign income, excise, gross receipts, ad valorem, profits, gains, property, capital, sales, transfer, use, license, payroll, employment, social security, severance, unemployment, withholding, duties, excise, windfall profits,
intangibles, franchise, backup withholding, value added, alternative or add-on minimum, estimated and other taxes, charges, fees, levies or like assessments together with all penalties and additions to tax and interest thereon.
(q) As used in this Agreement, the term “Tax Return” means any
return, declaration, report, claim for refund, estimate, or information return or statement relating to Taxes, including any schedule or attachment thereto, and including any amendment thereof, supplied or required to be supplied to a Governmental
Entity.
3.11 Employees and Employee Benefit Plans.
(a) Section 3.11(a) of the Cadence Disclosure Schedule lists all material Cadence Benefit
Plans. For purposes of this Agreement, “Cadence Benefit Plans” means all employee benefit plans (as defined in Section 3(3) of the Employee Retirement Income Security Act of 1974, as amended (“ERISA”)), whether or not subject to
ERISA, and all bonus, stock option, stock purchase, restricted stock, incentive, deferred compensation, retiree medical or life insurance, supplemental retirement, severance or other compensation or benefit plans, programs or arrangements, and all
retention, bonus, employment, termination or severance plans, programs or arrangements or other contracts or agreements (collectively, “Benefit Plans”) to or with respect to which Cadence or any Subsidiary or any trade or business of Cadence or
any of its Subsidiaries, whether or not incorporated, all of which together with Cadence would be deemed a “single employer” within the meaning of Section 4001 of ERISA (a “Cadence ERISA Affiliate”), is a party or has any current or future
obligation or that are maintained, contributed to or sponsored by Cadence or any of its Subsidiaries or any Cadence ERISA Affiliate, or to which Cadence or any of its Subsidiaries is required or obligated to maintain, contribute to or sponsor, for the
benefit of any current or former employee, officer, director or independent contractor of Cadence or any of its Subsidiaries or any Cadence ERISA Affiliate.
(b) Cadence has heretofore made available to Huntington true and complete copies of each of
the material Cadence Benefit Plans and the following related documents, to the extent applicable: (i) all summary plan descriptions, amendments, modifications or material supplements to any Cadence Benefit Plan, (ii) the annual report (Form 5500), if
any, filed with the Internal Revenue Service (the “IRS”) for the last two plan years, (iii) the most recently received IRS determination letter, if any, relating to any such Cadence Benefit Plan, (iv) the most recently prepared actuarial
report for each such Cadence Benefit Plan (if applicable) for each of the last two years and (v) all material non-routine correspondence received from or sent to any Governmental Entity in the last two years.
(c) Each Cadence Benefit Plan has been established, operated, maintained and administered
in all respects in accordance with its terms and the requirements of all applicable laws, including ERISA and the Code, except for such noncompliance as would not result in any material liability to Cadence or its Subsidiaries.
(d) With respect to each Cadence Benefit Plan that is intended to be qualified under
Section 401(a) of the Code (the “Cadence Qualified Plans”), Cadence has received a favorable IRS determination letter (or an opinion or advisory letter upon which Cadence is entitled to rely) with respect to each Cadence Qualified Plan and the
related trust, which letter has not been revoked (nor has revocation been threatened), and, to the knowledge of Cadence, there are no existing circumstances and no events have occurred that would have a material adverse effect on the qualified status
of any Cadence Qualified Plan or the related trust or increase the costs relating thereto.
(e) Except as would not, either individually or in the aggregate, reasonably be expected
to result in a material liability to Cadence or its Subsidiaries, with respect to each Cadence Benefit Plan that is subject to Title IV or Section 302 of ERISA or Section 412, 430 or 4971 of the Code: (i) no such plan is in “at-risk” status
for purposes of Section 430 of the Code, (ii) no reportable event within the meaning of Section 4043(c) of ERISA for which the 30-day notice requirement has not been waived has occurred, (iii) all premiums to the Pension Benefit Guaranty Corporation
(the “PBGC”) have been timely paid in full, (iv) no material liability (other than for premiums to the PBGC) under Title IV of ERISA has been incurred by Cadence and its Subsidiaries or any Cadence ERISA Affiliate that has not been satisfied in
full and no such liability is reasonably expected to be incurred, (v) the PBGC has not instituted proceedings to terminate any such Cadence Benefit Plan and, to the Cadence’s Knowledge, no condition exists that presents a risk that such proceedings
will be instituted or which would constitute grounds under Section 4042 of ERISA for the termination of, or the appointment of a trustee to administer, any such Cadence Benefit Plan, and (vi) there does not exist any accumulated funding deficiency
within the meaning of Section 412 of the Code or Section 302 of ERISA, and no waiver of any minimum funding standard or extension of any amortization period has been requested or granted that has not been waived.
(f) None of Cadence and its Subsidiaries nor any Cadence ERISA Affiliate maintains,
sponsors or contributes to or has, at any time during the last six (6) years, maintained, sponsored, contributed to or been obligated to contribute to any plan that is a “multiemployer plan” within the meaning of Section 4001(a)(3) of ERISA (a “Multiemployer
Plan”) or a plan that has two or more contributing sponsors at least two of whom are not under common control, within the meaning of Section 4063 of ERISA (a “Multiple Employer Plan”).
(g) Neither Cadence nor any of its Subsidiaries sponsors, has sponsored or has any
obligation with respect to any employee benefit plan that provides for any post-employment or post-retirement health or medical or life insurance benefits for retired or former employees or beneficiaries or dependents thereof, except as required by
Section 4980B of the Code.
(h) Except as would not, either individually or in the aggregate, reasonably be expected
to result in material liability to Cadence or its Subsidiaries, all contributions required to be made to any Cadence Benefit Plan by applicable law or by any plan document or other contractual undertaking, and all premiums due or payable with respect
to insurance policies funding any Cadence Benefit Plan, since January 1, 2023, have been timely made or paid in full or, to the extent not required to be made or paid on or before the date hereof, have been fully reflected on the books and records of
Cadence. There are no pending or, to the knowledge of Cadence, threatened (in writing) claims (other than claims for benefits in the ordinary course), lawsuits or arbitrations that have been asserted or instituted, and, to the knowledge of Cadence,
no set of circumstances exists that may reasonably be likely to give rise to a material claim or lawsuit, against the Cadence Benefit Plans, any fiduciaries thereof with respect to their duties to the Cadence Benefit Plans or the assets of any of the
trusts under any of the Cadence Benefit Plans that could in any case reasonably be likely to result in any material liability of Cadence or any of its Subsidiaries to the PBGC, the IRS, the Department of Labor, any Multiemployer Plan, a Multiple
Employer Plan, any participant in a Cadence Benefit Plan, or any other party.
(i) None of Cadence or its Subsidiaries nor any Cadence ERISA Affiliate nor, to the
knowledge of Cadence, any other person, including any fiduciary, has engaged in any “prohibited transaction” (as defined in Section 4975 of the Code or Section 406 of ERISA) which could subject any of the Cadence Benefit Plans or their
related trusts, Cadence, any of its Subsidiaries, any Cadence ERISA Affiliate or any person that Cadence or any of its Subsidiaries has an obligation to indemnify to any material tax or material penalty imposed under Section 4975 of the Code or Section
502 of ERISA.
(j) Neither the execution and delivery of this Agreement nor the consummation of the
transactions contemplated hereby will (either alone or in conjunction with any other event) (i) entitle any employee, officer, director or independent contractor of Cadence or any of its Subsidiaries to any payment or benefit, including severance
pay, unemployment compensation, accrued pension benefit, or a change in control bonus or retention payment, (ii) result in, accelerate, cause the vesting, exercisability, funding, payment or delivery of, or increase the amount or value of, any
payment, right or other benefit to any employee, officer, director or independent contractor of Cadence or any of its Subsidiaries, (iii) accelerate the timing of or trigger any funding obligation under a rabbi trust or similar funding vehicle under
any Cadence Benefit Plan, or (iv) result in any limitation on the right of Cadence or any of its Subsidiaries or Cadence ERISA Affiliates to amend, merge, terminate or receive a reversion of assets from any Cadence Benefit Plan or related trust.
Without limiting the generality of the foregoing, no amount paid or payable (whether in cash, in property, or in the form of benefits) by Cadence or any of its Subsidiaries in connection with the transactions contemplated hereby (either solely as a
result thereof or as a result of such transactions in conjunction with any other event) will be an “excess parachute payment” within the meaning of Section 280G of the Code.
(k) No Cadence Benefit Plan provides for the gross-up or reimbursement of Taxes under
Section 409A or 4999 of the Code.
(l) There are no pending or, to the knowledge of Cadence, threatened (in writing) material
labor grievances or material unfair labor practice claims or charges against Cadence or any of its Subsidiaries, or any strikes or other material labor disputes against Cadence or any of its Subsidiaries. Neither Cadence nor any of its Subsidiaries
are party to or bound by any collective bargaining or similar agreement with any labor union, works council or similar labor organization, or work rules or practices agreed to with any labor organization or employee association applicable to
employees of Cadence or any of its Subsidiaries, and, to the knowledge of Cadence, there are no organizing efforts by any union or other group seeking to represent any employees of Cadence or any of its Subsidiaries.
(m) Cadence and its Subsidiaries are in compliance in all material respects with, and
since January 1, 2023 have complied in all material respects with, all laws regarding employment and employment practices, terms and conditions of employment, wages and hours, plant closing notification, classification of employees and independent
contractors, equitable pay practices, privacy right, labor disputes, employment discrimination, sexual harassment or discrimination, workers’ compensation or long-term disability policies, retaliation, immigration, family and medical leave,
occupational safety and health and other laws in respect of any reduction in force (including notice, information and consultation requirements).
(n) (i) To the knowledge of Cadence, no written allegations of sexual harassment, sexual
misconduct or discrimination have been made since January 1, 2023 against any member of the Board of Directors of Cadence or Section 16 officer, (ii) since January 1, 2023, neither Cadence nor any of its Subsidiaries has entered into any settlement
agreement related to allegations of sexual harassment, sexual misconduct or discrimination by any member of the Board of Directors of Cadence or any Section 16 officer, and (iii) there are no proceedings currently pending or, to the knowledge of
Cadence, threatened related to any allegations of sexual harassment, sexual misconduct or discrimination by any member of the Board of Directors of Cadence or any Section 16 officer.
3.12 Compliance with Applicable Law.
(a) Cadence and each of its Subsidiaries hold, and have at all times since January 1, 2023
held, all licenses, franchises, permits and authorizations necessary for the lawful conduct of their respective businesses and ownership of their respective properties, rights and assets under and pursuant to each (and have paid all fees and
assessments due and payable in connection therewith), except where neither the cost of failure to hold nor the cost of obtaining and holding such license, franchise, permit or authorization (nor the failure to pay any fees or assessments) would,
either individually or in the aggregate, reasonably be likely to have a Material Adverse Effect on Cadence, and to the knowledge of Cadence no suspension or cancellation of any such necessary license, franchise, permit or authorization is threatened.
(b) Except as would not reasonably be likely to have, either individually or in the
aggregate, a Material Adverse Effect on Cadence, Cadence and each of its Subsidiaries have complied with and are not in default or violation under any law, statute, order, rule, regulation, policy or guideline of any Governmental Entity applicable to
Cadence or any of its Subsidiaries, including (to the extent applicable to Cadence or its Subsidiaries) all laws related to data protection or privacy (including laws relating to the privacy and security of data or information that constitutes
personal data or personal information under applicable law (“Personal Data”)), the USA PATRIOT Act, the Bank Secrecy Act, the Equal Credit Opportunity Act and Regulation B, the Fair Housing Act, the Community Reinvestment Act, the Fair Credit
Reporting Act and Regulation V, the Truth in Lending Act and Regulation Z, the Home Mortgage Disclosure Act and Regulation C, the Fair Debt Collection Practices Act, the Electronic Fund Transfer Act and Regulation E, the Dodd-Frank Wall Street Reform
and Consumer Protection Act, any regulations promulgated by the Consumer Financial Protection Bureau, the Interagency Policy Statement on Retail Sales of Nondeposit Investment Products, the SAFE Mortgage Licensing Act of 2008, the Real Estate
Settlement Procedures Act and Regulation X, Title V of the Gramm-Leach-Bliley Act, any and all sanctions or regulations enforced by the Office of Foreign Assets Control of the United States Department of Treasury and any other law or regulation
relating to bank secrecy, discriminatory lending, financing or leasing practices, Executive Order 14331, money laundering prevention, Sections 23A and 23B of the Federal Reserve Act and Regulation W, the Sarbanes-Oxley Act, and all agency
requirements relating to the origination, sale and servicing of mortgage and consumer loans.
(c) Cadence has a Community Reinvestment Act rating of “outstanding” as of its most
recently completed Community Reinvestment Act examination.
(d) Cadence maintains a written information privacy and security program that maintains
reasonable measures to protect the privacy, confidentiality and security of all Personal Data against any (i) loss or misuse of Personal Data, (ii) unauthorized or unlawful operations performed upon Personal Data, or (iii) other act or omission that
compromises the security or confidentiality of Personal Data.
(e) None of Cadence or any of its Subsidiaries, or to the knowledge of Cadence, any
director, officer, employee, agent or other person acting on behalf of Cadence or any of its Subsidiaries has, directly or indirectly, (i) used any funds of Cadence or any of its Subsidiaries for unlawful contributions, unlawful gifts, unlawful
entertainment or other expenses relating to political activity, (ii) made any unlawful payment to foreign or domestic governmental officials or employees or to foreign or domestic political parties or campaigns from funds of Cadence or any of its
Subsidiaries, (iii) violated any provision that would result in the violation of the Foreign Corrupt Practices Act of 1977, as amended, or any similar law, (iv) established or maintained any unlawful fund of monies or other assets of Cadence
or any of its Subsidiaries, (v) made any fraudulent entry on the books or records of Cadence or any of its Subsidiaries, or (vi) made any unlawful bribe, unlawful rebate, unlawful payoff, unlawful influence payment, unlawful kickback or other unlawful
payment to any person, private or public, regardless of form, whether in money, property or services, to obtain favorable treatment in securing business, to obtain special concessions for Cadence or any of its Subsidiaries, to pay for favorable
treatment for business secured or to pay for special concessions already obtained for Cadence or any of its Subsidiaries, or is currently subject to any United States sanctions administered by the Office of Foreign Assets Control of the United States
Treasury Department, except in each case as would not reasonably be likely to have, either individually or in the aggregate, a Material Adverse Effect on Cadence.
(f) As of the date hereof, Cadence maintains regulatory capital ratios that exceed the
levels established for “well capitalized” institutions (under the relevant regulatory capital regulation of the institution’s primary bank regulator) and, as of the date hereof, Cadence has not received any notice from a Governmental Entity that its
status as “well-capitalized” or that Cadence’s Community Reinvestment Act rating will change within one (1) year from the date of this Agreement.
(g) Except as would not, either individually or in the aggregate, reasonably be likely to
have a Material Adverse Effect on Cadence, (i) Cadence and each of its Subsidiaries have properly administered all accounts for which it acts as a fiduciary, including accounts for which it serves as a trustee, agent, custodian, personal
representative, guardian, conservator or investment advisor, in accordance with the terms of the governing documents and applicable state, federal and foreign law; and (ii) none of Cadence, any of its Subsidiaries, or any of its or its Subsidiaries’
directors, officers or employees, has committed any breach of trust or fiduciary duty with respect to any such fiduciary account, and the accountings for each such fiduciary account are true and correct and accurately reflect the assets and results
of such fiduciary account.
3.13 Certain Contracts.
(a) Except as set forth in Section 3.13(a) of the Cadence Disclosure Schedule or as
filed with or incorporated into any Cadence Report filed prior to the date hereof, as of the date hereof, neither Cadence nor any of its Subsidiaries is a party to or bound by any contract, arrangement, commitment or understanding (whether written or
oral, but excluding any Cadence Benefit Plan):
(i) which is a “material contract” (as such term is defined in Item 601(b)(10) of Regulation S-K
of the SEC);
(ii) which contains a provision that materially restricts the conduct of any
line of business by Cadence or any of its Subsidiaries or upon consummation of the Merger will materially restrict the ability of the Surviving Bank or any of its affiliates to engage (x) in any line of business or in any geographic region or (y)
solicit any customer, client or employee of any person in any jurisdiction (other than, in the case of this clause (y), contracts with vendors or restrictions on soliciting employees arising under confidentiality or non-disclosure entered into by
Cadence or any of its Subsidiaries in the ordinary course of business);
(iii) which is a collective bargaining agreement or similar agreement with any
labor organization;
(iv) (A) that is an agreement for the incurrence of indebtedness by Cadence or
any of its Subsidiaries, including any debt for borrowed money, obligations evidenced by notes, debentures or similar instruments, sale and leaseback transactions, capitalized or finance leases and other similar financing arrangements (other than
deposit liabilities, trade payables, federal funds purchased, advances and loans from the Federal Home Loan Bank and securities sold under agreements to repurchase, in each case, incurred in the ordinary course of business consistent with past
practice) or (B) that provides for the guarantee, support, indemnification, assumption or endorsement by Cadence or any of its Subsidiaries of, or any similar commitment by Cadence or any of its Subsidiaries with respect to, the obligations,
liabilities or indebtedness of any other person, in the case of each of clauses (A) and (B), in an amount that can reasonably be expected to exceed $25,000,000);
(v) that (x) grants any right of first refusal, right of first offer or similar
right with respect to any material assets, rights or properties of Cadence or its Subsidiaries, taken as a whole or (y) requires Cadence or its Subsidiaries to sell or purchase goods or services on an exclusive basis or make referrals of business to
any person on an exclusive basis;
(vi) which creates future payment obligations in excess of $5,000,000 per annum
(other than any such contracts which are terminable by Cadence or any of its Subsidiaries on sixty (60) days or less notice without any required payment or other conditions, other than the condition of notice), other than extensions of credit, other
customary banking products offered by Cadence or its Subsidiaries, or derivatives issued or entered into in the ordinary course of business consistent with past practice;
(vii) that is a material joint venture or other material partnership agreement or
arrangement;
(viii) that is a settlement, consent or similar agreement and contains any
material continuing obligations imposed upon Cadence or any of its Subsidiaries; or
(ix) that relates to the acquisition or disposition of any
person, business or asset and under which Cadence or its Subsidiaries have or may have ongoing obligations or liabilities that are material to Cadence and its Subsidiaries, taken as a whole.
Each contract, arrangement, commitment or understanding of the type described in this Section 3.13(a), whether or
not set forth in the Cadence Disclosure Schedule, is referred to herein as a “Cadence Contract,” and neither Cadence nor any of its Subsidiaries knows of, or has received written, or to the knowledge of Cadence, oral notice of, any violation
of any Cadence Contract by any of the other parties thereto which would reasonably be likely to be, either individually or in the aggregate, material to Cadence and its Subsidiaries, taken as a whole. Cadence has made available to Huntington true,
correct and complete copies of each Cadence Contract in effect as of the date hereof.
(b) In each case, except as would not reasonably be likely to have, either individually or
in the aggregate, a Material Adverse Effect on Cadence: (i) each Cadence Contract is valid and binding on Cadence or one of its Subsidiaries, as applicable, and in full force and effect, (ii) Cadence and each of its Subsidiaries has performed all
obligations required to be performed by it prior to the date hereof under each Cadence Contract, (iii) to the knowledge of Cadence each third-party counterparty to each Cadence Contract has performed all obligations required to be performed by it to
date under such Cadence Contract, and (iv) no event or condition exists which constitutes or, after notice or lapse of time or both, will constitute, a default on the part of Cadence or any of its Subsidiaries or, to the knowledge of Cadence, any
counterparty thereto, under any such Cadence Contract.
3.14 Agreements with Regulatory Agencies. Subject to Section
9.7, neither Cadence nor any of its Subsidiaries is subject to any cease-and-desist or other order or enforcement action issued by, or is a party to any written agreement, consent agreement or memorandum of understanding with, or is a party to any
commitment letter or similar undertaking to, or is subject to any order or directive by, or has been ordered to pay any civil money penalty by, or has been since January 1, 2023, a recipient of any supervisory letter from, or since January 1, 2023,
has adopted any policies, procedures or board resolutions at the request of any Regulatory Agency or other Governmental Entity that currently restricts in any material respect or would reasonably be expected to restrict in any material respect the
conduct of its business or that in any material manner relates to its capital adequacy, its ability to pay dividends, its credit or risk management policies, its management or its business (each, whether or not set forth in the Cadence Disclosure
Schedule, a “Cadence Regulatory Agreement”), nor has Cadence or any of its Subsidiaries been advised in writing or, to the knowledge of Cadence, orally, since January 1, 2023, by any Regulatory Agency or other Governmental Entity that it is
considering issuing, initiating, ordering, or requesting any such Cadence Regulatory Agreement.
3.15 Risk Management Instruments. Except as would not
reasonably be likely to have, either individually or in the aggregate, a Material Adverse Effect on Cadence, all interest rate swaps, caps, floors, option agreements, futures and forward contracts and other similar derivative transactions and risk
management arrangements, whether entered into for the account of Cadence or any of its Subsidiaries or for the account of a customer of Cadence or one of its Subsidiaries, were entered into in the ordinary course of business and in accordance with
applicable rules, regulations and policies of any Regulatory Agency and with counterparties reasonably believed to be financially responsible at the time and are legal, valid and binding obligations of Cadence or one of its Subsidiaries enforceable
in accordance with their terms (except as may be limited by the Enforceability Exceptions). Cadence and each of its Subsidiaries has duly performed in all material respects all its material obligations thereunder to the extent that such obligations
to perform have accrued, and, to the knowledge of Cadence, there are no material breaches, violations or defaults or bona fide allegations or assertions of such by any party thereunder.
3.16 Environmental Matters. Except as would not reasonably be
likely to have, either individually or in the aggregate, a Material Adverse Effect on Cadence, Cadence and its Subsidiaries are in compliance, and, since January 1, 2023 have complied, with all federal, state and local laws, regulation, orders,
decrees, permits, authorizations, common laws and other legal requirements relating to: (a) the protection or restoration of the environment, health and safety as it relates to hazardous substance exposure or natural resource damages, (b) the
handling, use, presence, disposal, release or threatened release of, or exposure to, any hazardous substance, or (c) noise, odor, wetlands, indoor air, pollution, environmental contamination or any injury to persons or property from exposure
to any hazardous substance (collectively, “Environmental Laws”). There are no legal, administrative, arbitral or other proceedings, claims or actions, or, to the knowledge of Cadence, any private environmental investigations or remediation
activities or governmental investigations of any nature seeking to impose, or that could reasonably be likely to result in the imposition, on Cadence or any of its Subsidiaries of any liability or obligation arising under any Environmental Law, pending
or threatened against Cadence, which liability or obligation would reasonably be likely to have, either individually or in the aggregate, a Material Adverse Effect on Cadence. To the knowledge of Cadence, there is no reasonable basis for any such
proceeding, claim, action or governmental investigation that would impose any liability or obligation that would reasonably be likely to have, either individually or in the aggregate, a Material Adverse Effect on Cadence. Cadence is not subject to any
agreement, order, judgment, decree, letter agreement or memorandum of agreement by or with any court, Governmental Entity, regulatory agency or third party imposing any liability or obligation with respect to any Environmental Law that would reasonably
be likely to have, either individually or in the aggregate, a Material Adverse Effect on Cadence.
3.17 Investment Securities.
(a) Except as would not reasonably be likely to have,
individually or in the aggregate, a Material Adverse Effect on Cadence, each of Cadence and its Subsidiaries has good title to all securities and commodities owned by it (except those sold under repurchase agreements or held in any fiduciary or
agency capacity), free and clear of any Lien, except (i) as set forth in the financial statements included in the Cadence Reports and (ii) to the extent such securities or commodities are pledged in the ordinary course of business to secure
obligations of Cadence or its Subsidiaries. Such securities and commodities are valued on the books of Cadence in accordance with GAAP in all material respects.
(b) Cadence and its Subsidiaries employ, to the extent
applicable, investment, securities, risk management and other policies, practices and procedures that Cadence believes are prudent and reasonable in the context of their respective businesses, and Cadence and its Subsidiaries have, since January 1,
2023, been in compliance with such policies, practices and procedures in all material respects.
3.18
Real Property. Except as would not reasonably be likely, either individually or in the aggregate, to have a Material Adverse Effect on Cadence or a Cadence Subsidiary (a) has good and marketable
title to all real property reflected in the latest audited balance sheet included in the Cadence Reports as being owned by Cadence or a Cadence Subsidiary or acquired after the date thereof (except properties sold or otherwise disposed of since the
date thereof in the ordinary course of business) (the “Cadence Owned Properties”), free and clear of all material Liens, except (i) statutory Liens securing payments not yet due, (ii) Liens for real property Taxes not yet due and payable,
(iii) easements, rights of way, and other similar encumbrances that do not materially affect the value or use of the properties or assets subject thereto or affected thereby or otherwise materially impair business operations at such properties and
(iv) such imperfections or irregularities of title or Liens as do not materially affect the value or use of the properties or assets subject thereto or affected thereby or otherwise materially impair business operations at such properties
(collectively, “Permitted Encumbrances”), and (b) is the lessee of all leasehold estates reflected in the latest audited financial statements included in such Cadence Reports or acquired after the date thereof (except for leases that have
expired by their terms since the date thereof) (collectively with the Cadence Owned Properties, the “Cadence Real Property”), free and clear of all material Liens of any nature whatsoever, except for Permitted Encumbrances, and is in
possession of the properties purported to be leased thereunder, and each such lease is valid without material default thereunder by the lessee or, to the knowledge of Cadence, the lessor. There are no material pending or, to the knowledge of
Cadence, threatened condemnation proceedings against any Cadence Real Property.
3.19 Intellectual Property; Information Technology. Cadence and each of its Subsidiaries owns, or has a valid right to use and practice, in the manner used and practiced by Cadence and its
applicable Subsidiaries, all Intellectual Property necessary for the conduct of its business as currently conducted. All of such owned Intellectual Property is owned by Cadence and each of its Subsidiaries free and clear of any material Liens other
than any Permitted Encumbrances (it being understood that licenses, covenants not to sue and similar rights or immunities granted with respect to Intellectual Property are not “Liens” for the purposes of the foregoing). Except as would not
reasonably be likely, either individually or in the aggregate, to have a Material Adverse Effect on Cadence: (a) the conduct of the businesses of Cadence and its Subsidiaries does not infringe, misappropriate or otherwise violate the rights of any
person, and since January 1, 2023 has not infringed, misappropriated or otherwise violated the rights of any person, and is and has been (since January 1, 2023) in accordance with any applicable agreement pursuant to which Cadence or any Cadence
Subsidiary acquired the right to use any applicable Intellectual Property; (b) no person has, since January 1, 2023, asserted to Cadence in writing that Cadence or any of its Subsidiaries has infringed, misappropriated or otherwise violated the
Intellectual Property rights of such person; (c) to the knowledge of Cadence, no person is challenging, infringing on or otherwise violating any right of Cadence or any of its Subsidiaries with respect to any Intellectual Property owned by Cadence
or its Subsidiaries; (d) neither Cadence nor any Cadence Subsidiary has, since January 1, 2023, received any written notice of any pending claim with respect to any Intellectual Property owned by Cadence or any Cadence Subsidiary; and (e) since
January 1, 2023, to the knowledge of Cadence, no third party has gained unauthorized access to any information technology assets controlled by Cadence or its Subsidiaries. Except as would not reasonably be likely, either individually or in the
aggregate, to have a Material Adverse Effect on Cadence, Cadence and its Subsidiaries have taken commercially reasonable actions to avoid the abandonment, cancellation or unenforceability of all Intellectual Property owned by Cadence and its
Subsidiaries. For purposes of this Agreement, “Intellectual Property” means trademarks, service marks, brand names, Internet domain names, logos, symbols, certification marks, trade dress and other indications of origin, the goodwill
associated with the foregoing and registrations in any jurisdiction of, and applications in any jurisdiction to register, the foregoing, including any extension, modification or renewal of any such registration or application; inventions,
discoveries and ideas, whether patentable or not, in any jurisdiction; patents, applications for patents (including divisions, continuations, continuations in part and renewal applications), all improvements thereto and any re-examinations,
renewals, extensions or reissues thereof, in any jurisdiction; trade secrets and know-how (including processes, technologies, protocols, formulae, prototypes and confidential information and rights in any jurisdiction to limit the use or disclosure
thereof by any person); writings and other works, whether copyrightable or not and whether in published or unpublished works, in any jurisdiction; and registrations or applications for registration of copyrights in any jurisdiction, and any
renewals or extensions thereof; and any similar intellectual property or proprietary rights.
3.20 Related Party Transactions. There are no transactions or series of related transactions, agreements, arrangements or understandings, nor are there any currently proposed transactions or
series of related transactions, between Cadence or any of its Subsidiaries, on the one hand, and any current or former director or “executive officer” (as defined in Rule 3b-7 under the Exchange Act) of Cadence or any of its Subsidiaries or any
person who beneficially owns (as defined in Rules 13d-3 and 13d-5 of the Exchange Act) five percent (5%) or more of the outstanding Cadence Common Stock (or any of such person’s immediate family members or affiliates) (other than Subsidiaries of
Cadence), on the other hand, of the type required to be reported in any Cadence Report pursuant to Item 404 of Regulation S-K promulgated under the Exchange Act that have not been so reported on a timely basis.
3.21 Takeover Restrictions. The Board of Directors of Cadence has approved this Agreement and the transactions contemplated hereby as required to render inapplicable to this Agreement and the
transactions contemplated hereby any applicable provisions of the takeover laws of any state, including any “moratorium,” “control share,” “fair price,” “takeover” or “interested shareholder” law or any similar provisions of the Cadence Articles or
Cadence Bylaws (any such laws, collectively with any similar provisions of the Cadence Articles or Cadence Bylaws or the Huntington Articles or Huntington Bylaws, as applicable, “Takeover Restrictions”). In accordance with Section
79-4-13.02(b)(2)(i) of the MBCA, no appraisal or dissenters’ rights will be available to holders of Cadence Common Stock or Cadence Preferred Stock connection with the Merger.
3.22 Reorganization. Cadence has not taken any action and is not aware of any fact or circumstance that could reasonably be expected to prevent the Merger from qualifying as a “reorganization”
within the meaning of Section 368(a) of the Code.
3.23 Opinion. Prior to the execution of this Agreement, the Board of Directors of Cadence has received an opinion (which, if initially rendered orally, has been or will be confirmed by a
written opinion, dated the same date) from Keefe, Bruyette & Woods, to the effect that, as of the date thereof, and based upon and subject to the factors, assumptions and limitations set forth therein, the Exchange Ratio pursuant to this
Agreement is fair, from a financial point of view, to the holders of Cadence Common Stock. Such opinion has not been amended or rescinded as of the date of this Agreement.
3.24 Cadence Information. The information relating to Cadence and its Subsidiaries that is provided by Cadence or its representatives specifically for inclusion in (a) the Joint Proxy
Statement, (b) the S-4, (c) the documents and financial statements of Cadence incorporated by reference in the Joint Proxy Statement, the S-4 or any amendment or supplement thereto or (d) any other document filed with any other Regulatory Agency or
Governmental Entity in connection herewith will not contain any untrue statement of a material fact or omit to state a material fact necessary to make the statements therein, in light of the circumstances in which they are made, not misleading. The
portions of the Joint Proxy Statement relating to Cadence and its Subsidiaries and other portions within the reasonable control of Cadence and its Subsidiaries will comply in all material respects with the provisions of the Exchange Act and the
rules and regulations thereunder. Notwithstanding the foregoing, no representation or warranty is made by Cadence with respect to statements made or incorporated by reference therein based on information provided or supplied by or on behalf of
Huntington or its Subsidiaries for inclusion in the Joint Proxy Statement or the S-4.
(a) As of the date hereof, except as set forth in Section
3.25(a) of the Cadence Disclosure Schedule, neither Cadence nor any of its Subsidiaries is a party to any written or oral (i) loan, loan agreement, note or borrowing arrangement (including leases, credit enhancements, commitments, guarantees and
interest-bearing assets) (collectively, “Loans”) in which Cadence or any Subsidiary of Cadence is a creditor which as of August 31, 2025 had an outstanding balance of $5,000,000 or more and under the terms of which the obligor was, as of
August 31, 2025, over ninety (90) days or more delinquent in payment of principal or interest, or (ii) “extensions of credit” to any “executive officer” or other “insider” of Cadence or any of its Subsidiaries (as such terms are defined in 12 C.F.R.
Part 215). Each “extension of credit” to any such “executive officer” or other “insider” of Cadence or any of its Subsidiaries is subject to and was made and continues to be in compliance with 12 C.F.R. Part 215 in all material respects or is exempt
therefrom. Except as such disclosure may be limited by any applicable law, rule or regulation, Section 3.25(a) of the Cadence Disclosure Schedule sets forth a true, correct and complete list of all Loans of Cadence and its Subsidiaries that, as of
August 31, 2025, had an outstanding balance of $1,000,000 or more and were classified by Cadence as “Other Loans Specially Mentioned,” “Special Mention,” “Substandard,” “Doubtful,” “Loss,” “Classified,” “Criticized,” “Credit Risk Assets,” “Concerned
Loans,” “Watch List” or words of similar import, together with the principal amount of and accrued and unpaid interest on each such Loan, and the aggregate principal amount of and accrued and unpaid interest on such Loans as of such date.
(b) Except as would not reasonably be likely to have, either
individually or in the aggregate, a Material Adverse Effect on Cadence, each outstanding Loan of Cadence or its Subsidiaries (i) is evidenced by notes, agreements or other evidences of indebtedness that are true, genuine and what they purport to be,
(ii) to the extent carried on the books and records of Cadence and its Subsidiaries as secured Loans, has been secured by valid Liens, which have been perfected and (iii) is the legal, valid and binding obligation of the obligor named therein,
enforceable in accordance with its terms, subject to the Enforceability Exceptions.
(c) Except as would not reasonably be likely to have, either
individually or in the aggregate, a Material Adverse Effect on Cadence, each outstanding Loan of Cadence or its Subsidiaries (including Loans held for resale to investors) was solicited and originated, and is and has been administered and, where
applicable, serviced, and the relevant Loan files are being maintained, in all material respects, in accordance with the relevant notes or other credit or security documents, the applicable written underwriting standards of Cadence and its
Subsidiaries (and, in the case of Loans held for resale to investors, the applicable underwriting standards, if any, of the applicable investors) and with all applicable federal, state and local laws, regulations and rules.
(d) None of the agreements pursuant to which Cadence or any of
its Subsidiaries has sold Loans or pools of Loans or participations in Loans or pools of Loans contains any obligation to repurchase such Loans or interests therein solely on account of a payment default (other than early payment defaults) by the
obligor on any such Loan.
(e) Neither Cadence nor any of its Subsidiaries is now, nor
has it ever been since January 1, 2023, subject to any material fine, suspension, settlement or other administrative agreement or sanction by, or any reduction in any loan purchase commitment, any Governmental Entity or Regulatory Agency relating to
the origination, sale or servicing of mortgage or consumer Loans.
3.26 Insurance. Except as would not reasonably be likely, either individually or in the aggregate, to have a Material Adverse Effect on Cadence, (a) Cadence and its Subsidiaries are insured
with reputable insurers against such risks and in such amounts as the management of Cadence reasonably has determined to be prudent and consistent with industry practice, and neither Cadence nor any of its Subsidiaries has received notice to the
effect that any of them are in default under any material insurance policy, (b) each such policy is outstanding and in full force and effect and, except for policies insuring against potential liabilities of officers, directors and employees of
Cadence and its Subsidiaries, Cadence or the relevant Subsidiary thereof is the sole beneficiary of such policies, and (c) all premiums and other payments due under any such policy have been paid, and all claims thereunder have been filed in due
and timely fashion.
3.27 Investment Advisor Subsidiary. Linscomb Wealth, Inc. (“Cadence Advisory Subsidiary”) is registered as an investment adviser under the Investment Advisers Act of 1940, as amended
(the “Investment Advisers Act”), and has operated since January 1, 2023 and is currently operating in compliance with all laws applicable to it or its business and has all registrations, permits, licenses, exemptions, orders and approvals
required for the operation of its business or ownership of its properties and assets substantially as presently conducted, except, in each case, as would not reasonably be likely, either individually or in the aggregate, to have a Material Adverse
Effect on Cadence. The accounts of each advisory client of Cadence or its Subsidiaries, for purposes of the Investment Advisers Act, that are subject to ERISA have been managed by the Cadence Advisory Subsidiary in compliance with the applicable
requirements of ERISA, except as would not reasonably be likely, either individually or in the aggregate, to have a Material Adverse Effect on Cadence. Neither Cadence Advisory Subsidiary nor any person “associated” (as defined in the Investment
Advisers Act) is ineligible pursuant to Section 203 of the Investment Advisers Act to serve as an investment adviser or as a person associated with a registered investment adviser, except as would not reasonably be likely, either individually or in
the aggregate, to have a Material Adverse Effect on Cadence.
3.28 No Broker-Dealer Subsidiary. Neither Cadence nor any Cadence Subsidiary is a broker-dealer required to be registered under the Exchange Act with the SEC.
3.29 No Other Representations or Warranties.
(a) Except for the representations and warranties made by
Cadence in this Article III, neither Cadence nor any other person makes any express or implied representation or warranty with respect to Cadence, its Subsidiaries, or their respective businesses, operations, assets, liabilities, conditions
(financial or otherwise) or prospects, and Cadence hereby disclaims any such other representations or warranties. In particular, without limiting the foregoing disclaimer, neither Cadence nor any other person makes or has made any representation or
warranty to the Huntington Parties or any of its affiliates or representatives with respect to (i) any financial projection, forecast, estimate, budget or prospective information relating to Cadence, any of its Subsidiaries or their respective
businesses, or (ii) except for the representations and warranties made by Cadence in this Article III, any oral or written information presented to the Huntington Parties or any of its affiliates or representatives in the course of their due
diligence investigation of Cadence, the negotiation of this Agreement or in the course of the transactions contemplated hereby.
(b) Cadence acknowledges and agrees that neither Huntington nor
any other person has made or is making any express or implied representation or warranty other than those contained in Article IV.
ARTICLE IV
REPRESENTATIONS AND WARRANTIES OF
HUNTINGTON PARTIES
Except (i) as disclosed in the disclosure schedule delivered by the
Huntington Parties to Cadence concurrently herewith (the “Huntington Disclosure Schedule”); provided, that (a) no such item is required to be set forth as an exception to a representation or warranty if its absence would not result in
the related representation or warranty being deemed untrue or incorrect, (b) the mere inclusion of an item in the Huntington Disclosure Schedule as an exception to a representation or warranty shall not be deemed an admission by the Huntington
Parties that such item represents a material exception or fact, event or circumstance or that such item is reasonably likely to result in a Material Adverse Effect, and (c) any disclosures made with respect to a section of this Article IV shall be
deemed to qualify (1) any other section of this Article IV specifically referenced or cross-referenced and (2) other sections of this Article IV to the extent it is reasonably apparent on its face (notwithstanding the absence of a specific cross
reference) from a reading of the disclosure that such disclosure applies to such other sections or (ii) as disclosed in any Huntington Reports publicly filed prior to the date hereof (but disregarding risk factor disclosures contained under the
heading “Risk Factors,” or disclosures of risks set forth in any “forward-looking statements” disclaimer or any other statements that are similarly non-specific or cautionary, predictive or forward-looking in nature), Huntington and Huntington
National Bank hereby represent and warrant to Cadence as follows:
|
4.1 |
Corporate Organization. |
(a) Huntington is a corporation duly organized, validly
existing and in good standing under the laws of the State of Maryland and is a bank holding company duly registered under the BHC Act that has elected to be treated as a financial holding company under the BHC Act. Huntington has the corporate power
and authority to own, lease or operate all its properties and assets and to carry on its business as it is now being conducted in all material respects. Huntington is duly licensed or qualified to do business and in good standing in each jurisdiction
in which the nature of the business conducted by it or the character or location of the properties and assets owned, leased or operated by it makes such licensing, qualification or standing necessary, except where the failure to be so licensed or
qualified or to be in good standing would not, either individually or in the aggregate, reasonably be likely to have a Material Adverse Effect on the Huntington Parties. True and complete copies of the Articles of Restatement of Charter of
Huntington, as amended (“Huntington Articles”), and Amended and Restated Bylaws of Huntington (“Huntington Bylaws”), as in effect as of the date of this Agreement, have previously been made available by Huntington to Cadence.
(b) Except, in the case of clauses (ii) and (iii) only, as
would not reasonably be likely to have, individually or in the aggregate, a Material Adverse Effect on Huntington, each Subsidiary of Huntington, including Huntington National Bank (a “Huntington Subsidiary”) (i) is duly organized and validly
existing under the laws of its jurisdiction of organization, (ii) is duly licensed or qualified to do business and, where such concept is recognized under applicable law, in good standing in all jurisdictions (whether federal, state, local or
foreign) where its ownership, leasing or operation of property or the conduct of its business requires it to be so licensed or qualified or in good standing and (iii) has all requisite corporate power and authority to own, lease or operate its
properties and assets and to carry on its business as now conducted. There are no restrictions on the ability of any Subsidiary of Huntington to pay dividends or distributions, except, in the case of a Subsidiary that is a regulated entity, for
restrictions on dividends or distributions generally applicable to all such regulated entities. The deposit accounts of each Subsidiary of Huntington that is an insured depository institution are insured by the FDIC through the Deposit Insurance Fund
to the fullest extent permitted by law, all premiums and assessments required to be paid in connection therewith have been paid when due, and no proceedings for the termination of such insurance are pending or, to the knowledge of Huntington,
threatened. Section 4.1(b) of the Huntington Disclosure Schedule sets forth a true and complete list of all Subsidiaries of Huntington as of the date hereof.
(a) As of the date of this Agreement, the authorized capital
stock of Huntington consists of 2,250,000,000 shares of Huntington Common Stock and 6,617,808 shares of preferred stock, par value $0.01 per share (“Huntington Preferred Stock”). As of October 22, 2025, no shares of capital stock or other
voting securities of Huntington are issued, reserved for issuance or outstanding, other than (i) 1,572,176,401 shares of Huntington Common Stock issued and outstanding, (ii) 9,010,259 shares of Huntington Common Stock reserved for issuance upon the
exercise of outstanding stock options to purchase shares of Huntington Common Stock granted under a Huntington Stock Plan (“Huntington Stock Options”), (iii) 29,967,515 shares of Huntington Common Stock reserved for issuance upon the
settlement of outstanding restricted stock units in respect of shares of Huntington Common Stock granted under a Huntington Stock Plan (“Huntington Restricted Stock Unit Awards”) (assuming that performance with respect to performance-vesting
Huntington Restricted Stock Unit Awards is achieved at maximum performance), (iv) 1,316,223 Huntington deferred stock units in respect of 1,316,223 shares of Huntington Common Stock granted under a Huntington Stock Plan (“Huntington Deferred Stock
Unit Awards”), (v) 28,737,699 shares of Huntington Common Stock reserved for issuance pursuant to future grants under the Huntington Stock Plans, and (vi) 885,000 shares of Huntington Preferred Stock issued and outstanding. As used herein, the
“Huntington Stock Plans” shall mean all employee and director equity incentive plans of Huntington in effect as of the date of this Agreement and agreements for equity awards in respect of Huntington Common Stock granted by Huntington under
the inducement grant exception. As of the date of this Agreement, except as set forth in the immediately preceding sentence and for changes since October 22, 2025 resulting from the exercise, vesting or settlement of any Huntington equity awards
described in the immediately preceding sentence, there are no shares of capital stock or other voting securities or equity interests of Huntington issued, reserved for issuance or outstanding. All issued and outstanding shares of Huntington Common
Stock and Huntington Preferred Stock have been duly authorized and validly issued and are fully paid, nonassessable and free of preemptive rights, with no personal liability attaching to the ownership thereof. No bonds, debentures, notes or other
indebtedness that have the right to vote on any matters on which shareholders of Huntington may vote are issued or outstanding. Except as set forth in Section 4.2(a) of the Huntington Disclosure Schedule, as of the date of this Agreement, no trust
preferred or subordinated debt securities of Huntington are issued or outstanding. Other than Huntington Stock Options, Huntington Restricted Stock Unit Awards and Huntington Deferred Stock Unit Awards, in each case, issued prior to the date of this
Agreement as described in this Section 4.2(a), as of the date of this Agreement, there are no outstanding subscriptions, options, warrants, puts, calls, rights, exchangeable or convertible securities or other commitments or agreements obligating
Huntington to issue, transfer, sell, purchase, redeem or otherwise acquire any such securities.
(b) There are no voting trusts, shareholder agreements,
proxies or other agreements in effect pursuant to which Huntington or any of its Subsidiaries has a contractual or other obligation with respect to the voting or transfer of the Huntington Common Stock or other equity interests of Huntington.
Huntington has paid or made due provision for the payment of all dividends payable on the outstanding shares of Huntington Preferred Stock through the most recent scheduled dividend payment date therefor, and has complied in all material respects
with terms and conditions thereof.
(c) Huntington owns, directly or indirectly, all issued and
outstanding shares of capital stock or other equity ownership interests of each Huntington Subsidiary, free and clear of any Liens, and all such shares or equity ownership interests are duly authorized and validly issued and are fully paid,
nonassessable (except, with respect to Huntington Subsidiaries that are insured depository institutions, as provided under 12 U.S.C. § 55 or any comparable provision of applicable state law) and free of preemptive rights, with no personal liability
attaching to the ownership thereof. No Huntington Subsidiary has or is bound by any outstanding subscriptions, options, warrants, calls, rights, commitments or agreements of any character calling for the purchase or issuance of any shares of capital
stock or any other equity security of such Subsidiary or any securities representing the right to purchase or otherwise receive any shares of capital stock or any other equity security of such Subsidiary.
|
4.3 |
Authority; No Violation. |
(a) Each of Huntington and Huntington National Bank has full
corporate power and authority to execute and deliver this Agreement and, subject to the shareholder and other actions described below, to consummate the transactions contemplated hereby. The execution and delivery of this Agreement and the
consummation of the Merger have been duly and validly approved by the Board of Directors of each of Huntington and Huntington National Bank. The Board of Directors of each of Huntington and Huntington National Bank has determined that the Merger, on
the terms and conditions set forth in this Agreement, is advisable and in the best interests of Huntington, Huntington National Bank and their respective shareholders, Huntington has directed that the issuance of Huntington Common Stock in connection
with the Merger be submitted to its shareholders for approval at a duly held meeting of such shareholders and has adopted resolutions to the foregoing effect, and Huntington National Bank has directed that this Agreement and the transactions
contemplated hereby be approved by Huntington, as its sole shareholder, at a duly held meeting or by unanimous written consent. Except for (i) the approval of the issuance of Huntington Common Stock pursuant to this Agreement by a majority of the
votes cast by holders of outstanding Huntington Common Stock at the Huntington Meeting (the “Requisite Huntington Vote”) and adoption of this Agreement by Huntington as the sole shareholder of Huntington National Bank, (ii) the adoption,
approval and filing of the Articles Supplementary with respect to the New Huntington Preferred Stock with the Maryland Department, and (iii) the adoption of resolutions to give effect to the provisions of Section 6.13 in connection with the Closing,
no other corporate proceedings on the part of Huntington or Huntington National Bank are necessary to approve this Agreement or to consummate the transactions contemplated hereby. This Agreement has been duly and validly executed and delivered by
Huntington and Huntington National Bank and (assuming due authorization, execution and delivery by Cadence) constitutes a valid and binding obligation of each of Huntington and Huntington National Bank, enforceable against them in accordance with its
terms (except in all cases as such enforceability may be limited by the Enforceability Exceptions). Subject to the receipt of the Requisite Huntington Vote, the shares of Huntington Common Stock and New Huntington Preferred Stock (or depositary
shares in respect thereof) to be issued in the Merger have been validly authorized and, when issued, will be validly issued, fully paid and nonassessable, and no current or past shareholder of Huntington will have any preemptive right or similar
rights in respect thereof.
(b) Subject to the receipt of the Requisite Huntington Vote,
neither the execution and delivery of this Agreement by the Huntington Parties, nor the consummation by the Huntington Parties of the transactions contemplated hereby, nor compliance by the Huntington Parties with any of the terms or provisions
hereof, will (i) violate any provision of the Huntington Articles or the Huntington Bylaws or comparable governing documents of any Huntington Subsidiary or (ii) assuming that the consents, approvals and filings referred to in Section 4.4 are duly
obtained and/or made, (x) violate any law, statute, code, ordinance, rule, regulation, judgment, order, writ, decree or injunction applicable to Huntington, any of its Subsidiaries or any of their respective properties or assets or (y) violate,
conflict with, result in a breach of any provision of or the loss of any benefit under, constitute a default (or an event which, with notice or lapse of time, or both, would constitute a default) under, result in the termination of or a right of
termination or cancellation under, accelerate the performance required by, or result in the creation of any Lien upon any of the respective properties or assets of Huntington or any of its Subsidiaries under, any of the terms, conditions or
provisions of any note, bond, mortgage, indenture, deed of trust, license, lease, agreement or other instrument or obligation to which Huntington or any of its Subsidiaries is a party, or by which they or any of their respective properties or assets
may be bound, except (in the case of clause (ii) above) for such violations, conflicts, breaches, defaults, terminations, cancellations, accelerations or creations which, either individually or in the aggregate, would not reasonably be likely to have
a Material Adverse Effect on the Huntington Parties.
4.4 Consents and Approvals. Except for (a) the filing of any required applications, filings and notices, as applicable, with the NASDAQ, (b) the filing of any required applications, filings and
notices, as applicable, with the NYSE, (c) the filing of any required applications, filings and notices, as applicable, with the OCC in connection with the Merger, including under the Bank Merger Act, and approval of such applications, filings and
notices, (d) the filing of any required applications, filings and notices, as applicable, with the Mississippi Department, (e) the filing of any required applications, filings or notices listed on Section 3.4 of the Cadence Disclosure Schedule or
Section 4.4 of the Huntington Disclosure Schedule and approval or non-objection, as applicable, of such applications, filings and notices, (f) the filing with the SEC of the Joint Proxy Statement and the S-4 in which the Joint Proxy Statement will
be included as a prospectus, and declaration of effectiveness of the S-4, (g) the filing with, and acceptance for record by, the Maryland Department of the Articles Supplementary for the New Huntington Preferred Stock, and (h) such filings and
approvals as are required to be made or obtained under the securities or “Blue Sky” laws of various states in connection with the issuance of the shares of Huntington Common Stock and the New Huntington Preferred Stock (or depositary shares in
respect thereof) pursuant to this Agreement and the approval of the listing of such Huntington Common Stock and New Huntington Preferred Stock (or depositary shares in respect thereof) on the NASDAQ, no consents or approvals of or filings or
registrations with any Governmental Entity are necessary in connection with (x) the execution and delivery by the Huntington Parties of this Agreement or (y) the consummation by the Huntington Parties of the Merger and the other transactions
contemplated hereby. As of the date hereof, Huntington is not aware of any reason why the necessary regulatory approvals and consents will not be received in order to permit consummation of the Merger on a timely basis.
(a) Huntington and each of its Subsidiaries have timely filed
or furnished, as applicable, all reports, registrations and statements, together with any amendments required to be made with respect thereto, that they were required to file (or furnish, as applicable) since January 1, 2023 with any Regulatory
Agencies, including any report, registration or statement required to be filed (or furnished, as applicable) pursuant to the laws, rules or regulations of the United States, any state, any foreign entity, or any Regulatory Agency, and have paid all
fees and assessments due and payable in connection therewith, except where the failure to file such report, registration or statement or to pay such fees and assessments, either individually or in the aggregate, would not reasonably be likely to have
a Material Adverse Effect on the Huntington Parties. Subject to Section 9.7 and except for normal examinations conducted by a Regulatory Agency in the ordinary course of business of Huntington and its Subsidiaries, no Regulatory Agency has initiated
or has pending any proceeding or, to the knowledge of Huntington, investigation into the business or operations of Huntington or any of its Subsidiaries since January 1, 2023, except where such proceedings or investigations would not reasonably be
likely to have, either individually or in the aggregate, a Material Adverse Effect on the Huntington Parties. Subject to Section 9.7, there (i) is no unresolved violation, criticism, or exception by any Regulatory Agency with respect to any report or
statement relating to any examinations or inspections of Huntington or any of its Subsidiaries, and (ii) has been no formal or informal inquiries by, or disagreements or disputes with, any Regulatory Agency with respect to the business, operations,
policies or procedures of Huntington or any of its Subsidiaries since January 1, 2023, in each case of clauses (i) and (ii), which would reasonably be likely to have, either individually or in the aggregate, a Material Adverse Effect on the
Huntington Parties.
(b) An accurate and complete copy of each final registration
statement, prospectus, report, schedule and definitive proxy statement filed with or furnished to the SEC by Huntington or any of its Subsidiaries pursuant to the Securities Act of 1933, as amended (the “Securities Act”), or the Exchange Act,
as the case may be, since January 1, 2023 (the “Huntington Reports”) is publicly available. No such Huntington Report, at the time filed, furnished or communicated (and, in the case of registration statements and proxy statements, on the dates
of effectiveness and the dates of the relevant meetings, respectively), contained any untrue statement of a material fact or omitted to state any material fact required to be stated therein or necessary in order to make the statements therein, in
light of the circumstances in which they were made, not misleading, except that information filed or furnished as of a later date (but before the date of this Agreement) shall be deemed to modify information as of an earlier date. As of their
respective dates, all Huntington Reports filed or furnished under the Securities Act and the Exchange Act complied in all material respects with the published rules and regulations of the SEC with respect thereto. As of the date of this Agreement, no
executive officer of Huntington or Huntington National Bank has failed in any respect to make the certifications required of him or her under Section 302 or 906 of the Sarbanes-Oxley Act. As of the date of this Agreement, there are no outstanding
comments from, or material unresolved issues raised by the SEC with respect to any of the Huntington Reports.
|
4.6 |
Financial Statements. |
(a) The financial statements of Huntington and its
Subsidiaries included (or incorporated by reference) in the Huntington Reports (including the related notes, where applicable) (i) have been prepared from, and are in accordance with, the books and records of Huntington and its Subsidiaries in all
material respects, (ii) fairly present in all material respects the consolidated results of operations, cash flows, changes in shareholders’ equity and consolidated financial position of Huntington and its Subsidiaries for the respective fiscal
periods or as of the respective dates therein set forth (subject in the case of unaudited statements to year-end audit adjustments normal in nature and amount), (iii) complied, as of their respective dates of filing with the SEC, in all material
respects with applicable accounting requirements and with the published rules and regulations of the SEC with respect thereto, and (iv) have been prepared in accordance with GAAP consistently applied during the periods involved, except, in each case,
as indicated in such statements or in the notes thereto. The books and records of Huntington and its Subsidiaries have been, since January 1, 2023, and are being, maintained in all material respects in accordance with GAAP and any other applicable
legal and accounting requirements. PricewaterhouseCoopers LLP has not resigned (or informed Huntington that it intends to resign) or been dismissed as independent public accountants of Huntington as a result of or in connection with any disagreements
with Huntington on a matter of accounting principles or practices, financial statement disclosure or auditing scope or procedure.
(b) Except as would not reasonably be likely to have, either
individually or in the aggregate, a Material Adverse Effect on the Huntington Parties, neither Huntington nor any of its Subsidiaries has any liability of any nature whatsoever (whether absolute, accrued, contingent or otherwise and whether due or to
become due) required by GAAP to be included on a consolidated balance sheet of Huntington, except for those liabilities that are reflected or reserved against on the consolidated balance sheet of Huntington included in its Quarterly Report on Form
10-Q for the fiscal quarter ended June 30, 2025 (including any notes thereto) and for liabilities incurred in the ordinary course of business consistent with past practice since June 30, 2025, or in connection with this Agreement and the transactions
contemplated hereby.
(c) The records, systems, controls, data and information of
Huntington and its Subsidiaries are recorded, stored, maintained and operated under means (including any electronic, mechanical or photographic process, whether computerized or not) that are under the exclusive ownership and direct control of
Huntington or its Subsidiaries or accountants (including all means of access thereto and therefrom), except for any non-exclusive ownership and non-direct control that would not reasonably be likely to have, either individually or in the aggregate, a
Material Adverse Effect on Huntington. Huntington (i) has implemented and maintains disclosure controls and procedures (as defined in Rule 13a-15(e) of the Exchange Act) to ensure that material information relating to Huntington, including its
Subsidiaries, is made known to the chief executive officer and the chief financial officer of Huntington by others within those entities as appropriate to allow timely decisions regarding required disclosures and to make the certifications required
by the Exchange Act and Sections 302 and 906 of the Sarbanes-Oxley Act, and (ii) has disclosed, based on its most recent evaluation prior to the date hereof, to Huntington’s outside auditors and the audit committee of Huntington’s Board of Directors
(x) any significant deficiencies and material weaknesses in the design or operation of internal control over financial reporting (as defined in Rule 13a-15(f) of the Exchange Act) which are reasonably likely to adversely affect Huntington’s ability
to record, process, summarize and report financial information, and (y) to the knowledge of Huntington, any fraud, whether or not material, that involves management or other employees who have a significant role in Huntington’s internal controls over
financial reporting. These disclosures were made in writing by management to Huntington’s auditors and audit committee and true, correct and complete copies of such disclosures have been made available to Cadence. To the knowledge of Huntington,
there is no reason to believe that Huntington’s outside auditors and its chief executive officer and chief financial officer will not be able to give the certifications and attestations required pursuant to the rules and regulations adopted pursuant
to Section 404 of the Sarbanes-Oxley Act, without qualification, when next due.
(d) Since January 1, 2023, (i) neither Huntington nor any of
its Subsidiaries, nor, to the knowledge of the Huntington Parties, any director, officer, auditor, accountant or representative of Huntington or any of its Subsidiaries, has received or otherwise had or obtained knowledge of any material complaint,
allegation, assertion or claim, whether written or, to the knowledge of Huntington, oral, regarding the accounting or auditing practices, procedures, methodologies or methods (including with respect to loan loss reserves, write-downs, charge-offs and
accruals) of Huntington or any of its Subsidiaries or their respective internal accounting controls, including any material complaint, allegation, assertion or written claim that Huntington or any of its Subsidiaries has engaged in questionable
accounting or auditing practices, and (ii) no employee of or attorney representing Huntington or any of its Subsidiaries, whether or not employed by Huntington or any of its Subsidiaries, has reported evidence of a material violation of securities
laws, breach of fiduciary duty or similar violation by Huntington or any of its Subsidiaries or any of their respective officers, directors, employees or agents to the Board of Directors of Huntington or any committee thereof or similar governing
body of any Huntington Subsidiary or any committee thereof, or, to the knowledge of Huntington, to any director or officer of Huntington or any Huntington Subsidiary.
4.7 Broker’s Fees. Neither Huntington nor any Huntington Subsidiary nor any of their respective officers or directors has employed any broker, finder or financial advisor or incurred any
liability for any broker’s fees, commissions or finder’s fees in connection with the Merger or related transactions contemplated by this Agreement, other than Evercore Group L.L.C.
4.8 Absence of Certain Changes or Events.
(a) Since December 31, 2024, there has not been any effect,
change, event, circumstance, condition, occurrence or development that has had or would reasonably be likely to have, either individually or in the aggregate, a Material Adverse Effect on the Huntington Parties.
(b) Since December 31, 2024, through the date of this
Agreement, except with respect to the transactions contemplated hereby, Huntington and its Subsidiaries have carried on their respective businesses in all material respects in the ordinary course.
4.9 Legal Proceedings.
(a) Neither Huntington nor any of its Subsidiaries is a party
to any, and there are no pending or, to the knowledge of the Huntington Parties, threatened, legal, administrative, arbitral or other proceedings, claims, actions or governmental or regulatory investigations of any nature against Huntington or any of
its Subsidiaries or any of their current or former directors or executive officers, or of a nature challenging the validity or propriety of this Agreement or the transactions contemplated hereby, in each case, that would reasonably be likely to have,
either individually or in the aggregate, a Material Adverse Effect on the Huntington Parties.
(b) There is no material injunction, order, judgment, decree,
or regulatory restriction imposed upon Huntington, any of its Subsidiaries or the assets of Huntington or any of its Subsidiaries (or that, upon consummation of the Merger, would apply to the Surviving Bank or any of its affiliates).
4.10 Taxes and Tax Returns. In each case except as would not reasonably be likely to have a Material Adverse Effect on the Huntington Parties:
(a) Each of Huntington and its Subsidiaries has duly and
timely filed (taking into account all applicable extensions) all Tax Returns in all jurisdictions in which Tax Returns are required to be filed by it, and all such Tax Returns are true, correct, and complete in.
(b) All Taxes of Huntington and its Subsidiaries (whether or
not shown on any Tax Returns) that are due have been fully and timely paid, except for Taxes that are being contested in good faith in appropriate proceedings and for which adequate reserves have been established in accordance with GAAP.
(c) Each of Huntington and its Subsidiaries has withheld and
paid all Taxes required to have been withheld and paid in connection with amounts paid or owing to any employee, creditor, shareholder, independent contractor or other third party.
(d) The federal income Tax Returns of Huntington and its
Subsidiaries for all years up to and including the tax year ended December 31, 2020 have been examined by the IRS or are Tax Returns with respect to which the applicable period for assessment under applicable law, after giving effect to extensions or
waivers, has expired.
(e) No deficiency with respect to Taxes has been proposed,
asserted or assessed against Huntington or any of its Subsidiaries. There are no pending or threatened (in writing) disputes, claims, audits, examinations or other proceedings regarding any Taxes of Huntington and its Subsidiaries or the assets of
Huntington and its Subsidiaries.
|
4.11 |
Compliance with Applicable Law. |
(a) Huntington and each of its Subsidiaries hold, and have at
all times since January 1, 2023 held, all licenses, franchises, permits and authorizations necessary for the lawful conduct of their respective businesses and ownership of their respective properties, rights and assets under and pursuant to each (and
have paid all fees and assessments due and payable in connection therewith), except where neither the cost of failure to hold nor the cost of obtaining and holding such license, franchise, permit or authorization (nor the failure to pay any fees or
assessments) would, either individually or in the aggregate, reasonably be likely to have a Material Adverse Effect on the Huntington Parties, and to the knowledge of the Huntington Parties, no suspension or cancellation of any such necessary
license, franchise, permit or authorization is threatened.
(b) Except as would not reasonably be likely to have, either
individually or in the aggregate, a Material Adverse Effect on the Huntington Parties, Huntington and each of its Subsidiaries have complied with and are not in default or violation under any law, statute, order, rule, regulation, policy or guideline
of any Governmental Entity applicable to Huntington or any of its Subsidiaries, including (to the extent applicable to Huntington or its Subsidiaries) all laws related to data protection or privacy (including laws relating to the privacy and security
of Personal Data), the USA PATRIOT Act, the Bank Secrecy Act, the Equal Credit Opportunity Act and Regulation B, the Fair Housing Act, the Community Reinvestment Act, the Fair Credit Reporting Act and Regulation V, the Truth in Lending Act and
Regulation Z, the Home Mortgage Disclosure Act and Regulation C, the Fair Debt Collection Practices Act, the Electronic Fund Transfer Act and Regulation E, the Dodd-Frank Wall Street Reform and Consumer Protection Act, any regulations promulgated by
the Consumer Financial Protection Bureau, the Interagency Policy Statement on Retail Sales of Nondeposit Investment Products, the SAFE Mortgage Licensing Act of 2008, the Real Estate Settlement Procedures Act and Regulation X, Title V of the
Gramm-Leach-Bliley Act, any and all sanctions or regulations enforced by the Office of Foreign Assets Control of the United States Department of Treasury and any other law or regulation relating to bank secrecy, discriminatory lending, financing or
leasing practices, Executive Order 14331, money laundering prevention, Sections 23A and 23B of the Federal Reserve Act and Regulation W, the Sarbanes-Oxley Act, and all agency requirements relating to the origination, sale and servicing of mortgage
and consumer loans.
(c) Huntington National Bank has a Community Reinvestment Act
rating of “outstanding” as of its most recently completed Community Reinvestment Act examination.
(d) Huntington maintains a written information privacy and
security program that maintains reasonable measures to protect the privacy, confidentiality and security of all Personal Data against any (i) loss or misuse of Personal Data, (ii) unauthorized or unlawful operations performed upon Personal Data, or
(iii) other act or omission that compromises the security or confidentiality of Personal Data.
(e) None of Huntington or any of its Subsidiaries, or to the
knowledge of Huntington, any director, officer, employee, agent or other person acting on behalf of Huntington or any of its Subsidiaries has, directly or indirectly, (i) used any funds of Huntington or any of its Subsidiaries for unlawful
contributions, unlawful gifts, unlawful entertainment or other expenses relating to political activity, (ii) made any unlawful payment to foreign or domestic governmental officials or employees or to foreign or domestic political parties or campaigns
from funds of Huntington or any of its Subsidiaries, (iii) violated any provision that would result in the violation of the Foreign Corrupt Practices Act of 1977, as amended, or any similar law, (iv) established or maintained any unlawful fund of
monies or other assets of Huntington or any of its Subsidiaries, (v) made any fraudulent entry on the books or records of Huntington or any of its Subsidiaries, or (vi) made any unlawful bribe, unlawful rebate, unlawful payoff, unlawful influence
payment, unlawful kickback or other unlawful payment to any person, private or public, regardless of form, whether in money, property or services, to obtain favorable treatment in securing business, to obtain special concessions for Huntington or any
of its Subsidiaries, to pay for favorable treatment for business secured or to pay for special concessions already obtained for Huntington or any of its Subsidiaries, or is currently subject to any United States sanctions administered by the Office
of Foreign Assets Control of the United States Treasury Department, except in each case as would not reasonably be likely to have, either individually or in the aggregate, a Material Adverse Effect on the Huntington Parties.
(f) As of the date hereof, Huntington, Huntington National
Bank and each other insured depository institution Subsidiary of Huntington maintain regulatory capital ratios that exceed the levels established for “well capitalized” institutions (under the relevant regulatory capital regulation of the
institution’s primary bank regulator) and, as of the date hereof, neither Huntington nor any of its Subsidiaries has received any notice from a Governmental Entity that its status as “well-capitalized” or that Huntington National Bank’s Community
Reinvestment Act rating will change within one (1) year from the date of this Agreement.
(g) Except as would not, either individually or in the
aggregate, reasonably be likely to have a Material Adverse Effect on Huntington, (i) Huntington and each of its Subsidiaries have properly administered all accounts for which it acts as a fiduciary, including accounts for which it serves as a
trustee, agent, custodian, personal representative, guardian, conservator or investment advisor, in accordance with the terms of the governing documents and applicable state, federal and foreign law; and (ii) none of Huntington, any of its
Subsidiaries, or any of its or its Subsidiaries’ directors, officers or employees, has committed any breach of trust or fiduciary duty with respect to any such fiduciary account, and the accountings for each such fiduciary account are true and
correct and accurately reflect the assets and results of such fiduciary account.
(h) Except as would not reasonably be likely to have,
individually or in the aggregate, a Material Adverse Effect on Huntington, Huntington and its Subsidiaries are in compliance, and, since January 1, 2023, have complied, with all Environmental Laws.
4.12 Certain Contracts.
(a) Each contract, arrangement, commitment or understanding
(whether written or oral) which is a “material contract” (as such term is defined in Item 601(b)(10) of Regulation S-K of the SEC) to which Huntington or any of its Subsidiaries is a party or by which Huntington or any of its Subsidiaries is bound as
of the date hereof has been filed as an exhibit to the most recent Annual Report on Form 10-K filed by Huntington, or a Quarterly Report on Form 10-Q or Current Report on Form 8-K subsequent thereto (each, a “Huntington Contract”), and neither
Huntington nor any of its Subsidiaries knows of, or has received written, or to the knowledge of the Huntington Parties, oral notice of, any violation of any Huntington Contract by any of the other parties thereto which would reasonably be likely to
have, individually or in the aggregate, a Material Adverse Effect on Huntington.
(b) In each case, except as would not reasonably be likely to
have, either individually or in the aggregate, a Material Adverse Effect on the Huntington Parties, (i) each Huntington Contract is valid and binding on Huntington or one of its Subsidiaries, as applicable, and in full force and effect, (ii)
Huntington and each of its Subsidiaries have performed all obligations required to be performed by it prior to the date hereof under each Huntington Contract, (iii) to the knowledge of the Huntington Parties, each third-party counterparty to each
Huntington Contract has performed all obligations required to be performed by it to date under such Huntington Contract, and (iv) no event or condition exists which constitutes or, after notice or lapse of time or both, will constitute, a default on
the part of Huntington or any of its Subsidiaries or, to the knowledge of the Huntington Parties, any counterparty thereto, under any such Huntington Contract.
4.13 Agreements with Regulatory Agencies. Subject to Section 9.7, neither Huntington nor any of its Subsidiaries is subject to any cease-and-desist or other order or enforcement action issued
by, or is a party to any written agreement, consent agreement or memorandum of understanding with, or is a party to any commitment letter or similar undertaking to, or is subject to any order or directive by, or has been ordered to pay any civil
money penalty by, or has been since January 1, 2023, a recipient of any supervisory letter from, or since January 1, 2023, has adopted any policies, procedures or board resolutions at the request of any Regulatory Agency or other Governmental
Entity that currently restricts in any material respect or would reasonably be expected to restrict in any material respect the conduct of its business or that in any material manner relates to its capital adequacy, its ability to pay dividends,
its credit or risk management policies, its management or its business (each, whether or not set forth in the Huntington Disclosure Schedule, a “Huntington Regulatory Agreement”), nor has Huntington or any of its Subsidiaries been advised,
in writing or, to the knowledge of Huntington, orally, since January 1, 2023, by any Regulatory Agency or other Governmental Entity that it is considering issuing, initiating, ordering or requesting any such Huntington Regulatory Agreement.
4.14 Information Technology. Except as would not reasonably be likely, either individually or in the aggregate, to have a Material Adverse Effect on Huntington, to the knowledge of Huntington,
since January 1, 2023, no third party has gained unauthorized access to any information technology networks controlled by and material to the operation of the business of Huntington and its Subsidiaries.
4.15 Related Party Transactions. There are no transactions or series of related transactions, agreements, arrangements or understandings, nor are there any currently proposed transactions or
series of related transactions, between Huntington or any of its Subsidiaries, on the one hand, and any current or former director or “executive officer” (as defined in Rule 3b-7 under the Exchange Act) of Huntington or any of its Subsidiaries or
any person who beneficially owns (as defined in Rules 13d-3 and 13d-5 of the Exchange Act) five percent (5%) or more of the outstanding Huntington Common Stock (or any of such person’s immediate family members or affiliates) (other than
Subsidiaries of Huntington), on the other hand, of the type required to be reported in any Huntington Report pursuant to Item 404 of Regulation S-K promulgated under the Exchange Act that have not been so reported on a timely basis.
4.16 Takeover Restrictions. The Board of Directors of Huntington has approved this Agreement and the transactions contemplated hereby as required to render inapplicable to this Agreement and
the transactions contemplated hereby any applicable Takeover Restrictions. In accordance with Section 3-202 of the Maryland General Corporation Law, as amended, no appraisal or dissenters’ rights will be available to the holders of Huntington
Common Stock or Huntington Preferred Stock in connection with the Merger.
4.17 Reorganization. Huntington has not taken any action and is not aware of any fact or circumstance that could reasonably be expected to prevent the Merger from qualifying as a “reorganization” within the
meaning of Section 368(a) of the Code.
4.18 Investment Securities.
(a) Except as would not reasonably be likely to have,
individually or in the aggregate, a Material Adverse Effect on Huntington, each of Huntington and its Subsidiaries has good title to all securities and commodities owned by it (except those sold under repurchase agreements or held in any fiduciary or
agency capacity), free and clear of any Lien, except (i) as set forth in the financial statements included in the Huntington Reports and (ii) to the extent such securities or commodities are pledged in the ordinary course of business to secure
obligations of Huntington or its Subsidiaries. Such securities and commodities are valued on the books of Huntington in accordance with GAAP in all material respects.
(b) Huntington and its Subsidiaries employ, to the extent
applicable, investment, securities, risk management and other policies, practices and procedures that Huntington believes are prudent and reasonable in the context of their respective businesses, and Huntington and its Subsidiaries have, since
January 1, 2023, been in compliance with such policies, practices and procedures in all material respects.
4.19 Opinion. Prior to the execution of this Agreement, Huntington has received an opinion (which, if initially rendered orally, has been or will be confirmed by a written opinion, dated the
same date) of Evercore Group L.L.C. to the effect that as of the date thereof and based upon and subject to the factors, assumptions, and limitations set forth therein, the Exchange Ratio pursuant to this Agreement is fair from a financial point of
view to Huntington. Such opinion has not been amended or rescinded as of the date of this Agreement.
4.20 Risk Management Instruments. Except as would not reasonably be likely to have, either individually or in the aggregate, a Material Adverse Effect on the Huntington Parties, all interest
rate swaps, caps, floors, option agreements, futures and forward contracts and other similar derivative transactions and risk management arrangements, whether entered into for the account of Huntington or any of its Subsidiaries or for the account
of a customer of Huntington or one of its Subsidiaries, were entered into in the ordinary course of business and in accordance with applicable rules, regulations and policies of any Regulatory Agency and with counterparties reasonably believed to
be financially responsible at the time and are legal, valid and binding obligations of Huntington or one of its Subsidiaries enforceable in accordance with their terms (except as may be limited by the Enforceability Exceptions). Huntington and each
of its Subsidiaries have duly performed in all material respects all its material obligations thereunder to the extent that such obligations to perform have accrued, and, to the knowledge of the Huntington Parties, there are no material breaches,
violations or defaults or bona fide allegations or assertions of such by any party thereunder.
4.21 Huntington Information. The information relating to Huntington and its Subsidiaries that is provided by Huntington or its representatives specifically for inclusion in (a) the Joint Proxy
Statement, (b) the S-4, (c) the documents and financial statements of Huntington incorporated by reference in the Joint Proxy Statement, the S-4 or any amendment or supplement thereto or (d) any other document filed with any other Regulatory Agency
or Governmental Entity in connection herewith, will not contain any untrue statement of a material fact or omit to state a material fact necessary to make the statements therein, in light of the circumstances in which they are made, not misleading.
The portions of the Joint Proxy Statement relating to Huntington and its Subsidiaries and other portions within the reasonable control of Huntington and its Subsidiaries will comply in all material respects with the provisions of the Exchange Act
and the rules and regulations thereunder. Notwithstanding the foregoing, no representation or warranty is made by Huntington with respect to statements made or incorporated by reference therein based on information provided or supplied by or on
behalf of Cadence or its Subsidiaries for inclusion in the Joint Proxy Statement or the S-4.
4.22 Employee Benefit Plans.
(a) For purposes of this Agreement, “Huntington Benefit
Plans” means all Benefit Plans to or with respect to which Huntington or any Subsidiary or any trade or business of Huntington or any of its Subsidiaries, whether or not incorporated, all of which together with Huntington would be deemed a
“single employer” within the meaning of Section 4001 of ERISA (a “Huntington ERISA Affiliate”), is a party or has any current or future obligation or that are maintained, contributed to or sponsored by Huntington or any of its Subsidiaries or
any Huntington ERISA Affiliate, or to which Huntington or any of its Subsidiaries is required or obligated to maintain, contribute to or sponsor, for the benefit of any current or former employee, officer, director or independent contractor of
Huntington or any of its Subsidiaries or any Huntington ERISA Affiliate.
(b) Each Huntington Benefit Plan has been established,
operated, maintained and administered in all material respects in accordance with its terms and the requirements of all applicable laws, including ERISA and the Code, except for such noncompliance as would not result in any material liability to
Huntington or its Subsidiaries.
(c) Except as would not, either individually or in the
aggregate, reasonably be expected to result in any material liability to Huntington or its Subsidiaries, with respect to each Huntington Benefit Plan that is subject to Title IV or Section 302 of ERISA or Section 412, 430 or 4971 of the Code: (i) no
such plan is in “at-risk” status for purposes of Section 430 of the Code, (ii) no reportable event within the meaning of Section 4043(c) of ERISA for which the 30- day notice requirement has not been waived has occurred, (iii) all premiums required
to be paid to the PBGC have been timely paid in full, (iv) no material liability (other than for premiums to the PBGC) under Title IV of ERISA has been or is reasonably expected to be incurred by Huntington or any of its Subsidiaries that has not
been satisfied in full and no such liability is reasonably expected to be incurred, (v) the PBGC has not instituted proceedings to terminate any such Huntington Benefit Plan and, to the Huntington’s Knowledge, no condition exists that presents a risk
that such proceedings will be instituted or which would constitute grounds under Section 4042 of ERISA for the termination of, or the appointment of a trustee to administer, any such Huntington Benefit Plan, and (vi) there does not exist any
accumulated funding deficiency within the meaning of Section 412 of the Code or Section 302 of ERISA, and no waiver of any minimum funding standard or extension of any amortization period has been requested or granted that has not been waived.
(d) None of Huntington and its Subsidiaries nor any Huntington
ERISA Affiliate has, at any time during the last six years, contributed to or been obligated to contribute to any plan that is a Multiemployer Plan or a Multiple Employer Plan.
(a) Except as would not reasonably be likely to have, either
individually or in the aggregate, a Material Adverse Effect on Huntington, each outstanding Loan of Huntington or its Subsidiaries (i) is evidenced by notes, agreements or other evidences of indebtedness that are true, genuine and what they purport
to be, (ii) to the extent carried on the books and records of Huntington and its Subsidiaries as secured Loans, has been secured by valid Liens, which have been perfected and (iii) is the legal, valid and binding obligation of the obligor named
therein, enforceable in accordance with its terms, subject to the Enforceability Exceptions.
(b) Except as would not reasonably be likely to have, either
individually or in the aggregate, a Material Adverse Effect on Huntington, each outstanding Loan of Huntington or its Subsidiaries (including Loans held for resale to investors) was solicited and originated, and is and has been administered and,
where applicable, serviced, and the relevant Loan files are being maintained, in all material respects, in accordance with the relevant notes or other credit or security documents, the applicable written underwriting standards of Huntington and its
Subsidiaries (and, in the case of Loans held for resale to investors, the applicable underwriting standards, if any, of the applicable investors) and with all applicable federal, state and local laws, regulations and rules.
(c) None of the agreements pursuant to which Huntington or
any of its Subsidiaries has sold Loans or pools of Loans or participations in Loans or pools of Loans contains any obligation to repurchase such Loans or interests therein solely on account of a payment default (other than early payment defaults) by
the obligor on any such Loan.
(d) There are no outstanding “extensions of credit” made by
Huntington or any of its Subsidiaries to any “executive officer” or other “insider” (as each such term is defined in 12 C.F.R. Part 215) of Huntington or its Subsidiaries, other than extensions of credit that are subject to and that were made and
continue to be in compliance with 12 C.F.R. Part 215 in all material respects or that are exempt therefrom.
(e) Neither Huntington nor any of its Subsidiaries is now, nor
has it ever been since January 1, 2023, subject to any material fine, suspension, settlement or other administrative agreement or sanction by, or any reduction in any loan purchase commitment, any Governmental Entity or Regulatory Agency relating to
the origination, sale or servicing of mortgage or consumer Loans.
4.24 No Other Representations or Warranties.
(a) Except for the representations and warranties made by the
Huntington Parties in this Article IV, neither Huntington nor any other person makes any express or implied representation or warranty with respect to Huntington, its Subsidiaries, or their respective businesses, operations, assets, liabilities,
conditions (financial or otherwise) or prospects, and Huntington hereby disclaims any such other representations or warranties. In particular, without limiting the foregoing disclaimer, neither Huntington nor any other person makes or has made any
representation or warranty to Cadence or any of its affiliates or representatives with respect to (i) any financial projection, forecast, estimate, budget or prospective information relating to Huntington, any of its Subsidiaries or their respective
businesses, or (ii) except for the representations and warranties made by the Huntington Parties in this Article IV, any oral or written information presented to Cadence or any of its affiliates or representatives in the course of their due diligence
investigation of the Huntington Parties, the negotiation of this Agreement or in the course of the transactions contemplated hereby.
(b) The Huntington Parties acknowledge and agree that neither
Cadence nor any other person has made or is making any express or implied representation or warranty other than those contained in Article III.
ARTICLE V
COVENANTS RELATING TO CONDUCT OF
BUSINESS
5.1 Conduct of Business Prior to the Effective Time. During the period from the date of this Agreement to the Effective Time or earlier termination of this Agreement, except as expressly
contemplated or permitted by this Agreement (including as set forth in the Cadence Disclosure Schedule), required by law or as consented to in writing by the other party (such consent not to be unreasonably withheld, conditioned or delayed),
Cadence shall, and shall cause its Subsidiaries to, (i) conduct its business in the ordinary course in all material respects and (ii) use reasonable best efforts to maintain and preserve intact its business organization and advantageous business
relationships.
5.2 Cadence Forbearances. During the period from the date of this Agreement to the Effective Time or earlier termination of this Agreement, except as set forth in the Cadence Disclosure
Schedule, as expressly contemplated or permitted by this Agreement or as required by law, Cadence shall not, and shall not permit any of its Subsidiaries to, without the prior written consent of Huntington (such consent not to be unreasonably
withheld, conditioned or delayed):
(a) other than in the ordinary course of business consistent
with past practice, incur any indebtedness for borrowed money (other than indebtedness of Cadence or any of its wholly-owned Subsidiaries to Cadence or any of its wholly-owned Subsidiaries), or assume, guarantee, endorse or otherwise as an
accommodation become responsible for the obligations of any other person (other than any wholly owned Subsidiary of Cadence), it being understood and agreed that incurrence of indebtedness in the ordinary course of business consistent with past
practice shall include federal funds borrowings and Federal Home Loan Bank borrowings, the creation of deposit liabilities, issuances of letters of credit, purchases of federal funds, sales of certificates of deposit and entry into repurchase
agreements, in each case on terms and in amounts consistent with past practice;
|
(b) |
(i) adjust, split, combine or reclassify any capital stock; |
(ii) make, declare, pay or set a record
date for any dividend, or any other distribution on, or directly or indirectly redeem, purchase or otherwise acquire, any shares of its capital stock or other equity or voting securities or any securities or obligations convertible (whether currently
convertible or convertible only after the passage of time or the occurrence of certain events) into or exchangeable for any shares of its capital stock or other equity or voting securities (except (A) regular quarterly cash dividends by Cadence at a
rate not in excess of $0.275 per share of Cadence Common Stock, (B) dividends payable on the Cadence Preferred Stock in accordance with the terms thereof, (C) dividends paid by any of the Subsidiaries of Cadence to Cadence or any of its wholly owned
Subsidiaries, or (D) the acceptance of shares of Cadence Common Stock as payment for withholding taxes incurred in connection with the vesting or settlement of Cadence Equity Awards and dividend equivalents thereon, if any, in each case, in
accordance with past practice and the terms of the applicable award agreements);
(iii) grant any stock options, stock
appreciation rights, performance shares, restricted stock units, restricted shares or other equity-based awards or interests, including Cadence Equity Awards, or grant any individual, corporation or other entity any right to acquire any shares of its
capital stock or other equity or voting securities; or
(iv) issue, sell or otherwise permit to
become outstanding any additional shares of capital stock or other equity or voting securities or securities convertible or exchangeable into, or exercisable for or valued by reference to, any shares of its capital stock or any options, warrants, or
other rights of any kind to acquire any shares of capital stock or other equity or voting securities, except for the issuance of shares upon the vesting or settlement of Cadence Equity Awards (and dividend equivalents thereon, if any) outstanding as
of the date hereof or granted on or after the date hereof to the extent permitted under this Agreement;
(c) (i) sell, transfer, mortgage, encumber or otherwise
dispose of any of its material properties or assets to any individual, corporation or other entity other than a wholly-owned Subsidiary, (ii) abandon or allow to lapse any material properties or assets (including any issued or registered Intellectual
Property) other than lapse or expiry of Intellectual Property at the end of applicable statutory terms, or (iii) or cancel, release or assign any material indebtedness to any such person or any claims held by any person, in each case of clauses (i)
through (iii), other than in the ordinary course of business;
(d) except for transactions in the ordinary course of business
(including by way of foreclosure or acquisitions of control in a fiduciary or similar capacity or in satisfaction of debts previously contracted in good faith) or transactions that would not be material to Cadence and its Subsidiaries on a
consolidated basis, make any investment in or acquisition of, whether by purchase of stock or securities, contributions to capital, property transfers, merger or consolidation or formation of a joint venture or otherwise, any other corporation or
entity or any acquisition of property or assets of any other individual, corporation or other entity, in each case other than a wholly owned Subsidiary of Cadence;
(e) in each case except for transactions in the ordinary
course of business, (i) terminate, materially amend, or waive any material provision of, any Cadence Contract, or make any material change in any instrument or agreement governing the terms of any of its securities, other than normal renewals in the
ordinary course of business without material adverse changes to terms with respect to Cadence or its Subsidiaries or (ii) enter into any contract that would constitute a Cadence Contract if it were in effect on the date of this Agreement (it being
understood and agreed that entering into a Cadence Contract that would be such pursuant to Section 3.13(a)(ii) or (v)(y) is not ordinary course of business);
(f) except as required by the terms of any Cadence Benefit
Plan existing as of the date hereof, (i) enter into, adopt or terminate any Cadence Benefit Plan (including any plans, programs, policies, agreements or arrangements that would be considered a Cadence Benefit Plan if in effect as of the date hereof),
(ii) amend any Cadence Benefit Plan (including any plans, programs, policies, agreements or arrangements adopted or entered into that would be considered a Cadence Benefit Plan if in effect as of the date hereof), other than de minimis administrative
amendments in the ordinary course of business consistent with past practice that do not materially increase the cost or expense of maintaining, or increase the benefits payable under, such plan, program, policy or arrangements, (iii) increase the
compensation, bonus, severance, termination pay or other benefits payable to any current, prospective or former employee, officer, director, independent contractor or consultant, (iv) pay, grant or award, or commit to pay, grant or award, any bonuses
or incentive compensation, except for the payment of annual bonuses for completed periods based on actual performance in the ordinary course of business consistent with past practice (including, without limitation, as to timing), (v) accelerate the
vesting of, or otherwise deviate from the terms provided in the applicable award agreement with respect to the vesting, payment, settlement or exercisability of, any Cadence Equity Awards or other compensation, (vi) enter into any collective
bargaining agreement or similar agreement or arrangement, (vii) fund or provide any funding for any rabbi trust or similar arrangement, (viii) terminate the employment or services of any employee, independent contractor (who is a natural person) or
consultant (who is a natural person) whose annual base salary or base fee is greater than $200,000, in each case other than for cause, or (ix) hire any employee, independent contractor (who is a natural person) or consultant (who is a natural person)
whose annual base salary or base fee is greater than $200,000;
(g) except for debt workouts in the ordinary course of
business, settle any claim, suit, action or proceeding, except (i) involving solely monetary remedies in an amount and for consideration not in excess of $1,000,000 individually or $4,000,000 in the aggregate (net of any insurance proceeds or
indemnity, contribution or similar payments received by Cadence or any of its Subsidiaries in respect thereof) or (ii) that would not impose any material restriction on the business of Cadence or its Subsidiaries or the Surviving Bank or its
affiliates;
(h) take any action or knowingly fail to take any action where
such action or failure to act could reasonably be expected to prevent the Merger from qualifying as a “reorganization” within the meaning of Section 368(a) of the Code;
(i) amend the Cadence Articles, the
Cadence Bylaws, or comparable governing documents of its “Significant Subsidiaries” (as such term is defined in Rule 1-02 of Regulation S-X promulgated under the Exchange Act);
(j) merge or consolidate itself or any of its Significant
Subsidiaries with any other person, or restructure, reorganize or completely or partially liquidate or dissolve it or any of its Significant Subsidiaries;
(k) materially restructure or materially change its investment
securities or derivatives portfolio or its interest rate exposure, through purchases, sales or otherwise, or the manner in which the portfolio is classified or reported, except as may be required by GAAP or by applicable laws, regulations, guidelines
or policies imposed by any Governmental Entity or requested by a Governmental Entity;
(l) implement or adopt any change in its accounting
principles, practices or methods, other than as may be required by GAAP or by applicable laws, regulations, guidelines or policies imposed by any Governmental Entity;
(m) (i) enter into any material new line of business or change
in any material respect its lending, investment, underwriting, risk and asset liability management and other banking and operating, hedging policies, securitization and servicing policies (including any material change in the maximum ratio or similar
limits as a percentage of its capital exposure applicable with respect to its loan portfolio or any segment thereof), except as required by such policies or applicable law, regulation or policies imposed by any Governmental Entity or (ii) make any
loans or extensions of credit or renewals thereof, except in the ordinary course of business consistent with past practice and not in excess of $35,000,000 (or, in the case of any loan or extension of credit or renewal thereof that is “Adversely
Rated” (as determined in the ordinary course of business consistent with past practice under Cadence’s and its Subsidiaries’ lending policies in effect as of the date hereof), not in excess of $20,000,000); provided, that any consent from the
Huntington Parties sought pursuant to this clause (ii) shall not be unreasonably withheld; provided, further, that, if the Huntington Parties do not respond to any such request for consent within two (2) business days after the
relevant loan package is provided to the Huntington Parties, such non-response shall be deemed to constitute consent pursuant to this clause (ii);
(n) make, or commit to make, any capital expenditures that
exceed by more than five percent (5%) Cadence’s capital expenditure budget set forth in Section 5.2(n) of the Cadence Disclosure Schedule measured on a quarterly basis;
(o) change or revoke any Tax election, change an annual Tax
accounting period, adopt or change any Tax accounting method, file any amended Tax Return, enter into any closing agreement with respect to Taxes, or settle any Tax claim, audit, assessment or dispute or surrender any right to claim a refund of
Taxes, in each case, that is material to Cadence and its Subsidiaries, taken as a whole;
(p) (i) make any application for the opening or relocation of,
or open or relocate, any branch office, loan production office or other significant office or operations facility of Cadence or its Subsidiaries, (ii) other than in consultation with the Huntington Parties, make any application for the closing of or
close any branch or (iii) other than in consultation with the Huntington Parties, purchase any new real property (other than other real estate owned (OREO) properties in the ordinary course) in an amount in excess of $1,000,000 for any individual
property or enter into, amend or renew any material lease with respect to real property requiring aggregate payments under any individual lease in excess of $350,000;
(q) knowingly take any action that is intended to or would
reasonably be likely to adversely affect or materially delay the ability of Cadence or its Subsidiaries to obtain any necessary approvals of any Governmental Entity required for the transactions contemplated hereby or the Requisite Cadence Vote or to
perform its covenants and agreements under this Agreement or to consummate the transactions contemplated hereby or thereby; or
(r) agree to take, make any commitment to take, or adopt any
resolutions of its Board of Directors or similar governing body in support of, any of the actions prohibited by this Section 5.2.
5.3 Huntington Forbearances. During the period from the date of this Agreement to the Effective Time or earlier termination of this Agreement, except as set forth in the Huntington Disclosure
Schedule, as expressly contemplated or permitted by this Agreement or as required by law, Huntington shall not, and shall not permit any of its Subsidiaries to, without the prior written consent of Cadence (such consent not to be unreasonably
withheld, conditioned or delayed):
(a) amend the Huntington Articles or the
Huntington Bylaws in a manner that would materially and adversely affect the holders of Cadence Common Stock or Cadence Preferred Stock relative to other holders of Huntington Common Stock or Huntington Preferred Stock (as applicable);
(b) adjust, split, combine or reclassify any capital stock of
Huntington or make, declare or pay any extraordinary dividend on any capital stock of Huntington;
(c) incur any indebtedness for borrowed money (other than
indebtedness of Huntington or any of its wholly owned Subsidiaries to Huntington or any of its Subsidiaries) that would reasonably be expected to prevent Huntington or its Subsidiaries from assuming Cadence’s or its Subsidiaries’ outstanding
indebtedness;
(d) sell, transfer, mortgage, encumber or otherwise dispose of
any of its material properties or assets to any individual, corporation or other entity other than a wholly-owned Subsidiary, or cancel, release or assign any material indebtedness to any such person or any claims held by any person, in each case
other than in the ordinary course of business or in a transaction that, together with such other transactions, is not reasonably likely to prevent or materially delay the receipt of the Requisite Regulatory Approvals or the Closing;
(e) make any material investment in or acquisition of (whether
by purchase of stock or securities, contributions to capital, property transfers, merger or consolidation or formation of a joint venture or otherwise), any other corporation or entity or the property or assets of any other individual, corporation or
other entity, other than a wholly owned Subsidiary of Huntington, except for transactions in the ordinary course of business or in a transaction that, together with such other transactions, is not reasonably likely to prevent or materially delay the
receipt of the Requisite Regulatory Approvals or the Closing;
(f) merge or consolidate itself or Huntington National Bank
or any of their respective Significant Subsidiaries with any other person (i) where it or Huntington National Bank, is not the surviving person or (ii) if the merger or consolidation is reasonably likely to prevent, materially delay or materially
impair the receipt of the Requisite Regulatory Approvals or the Closing;
(g) take any action or knowingly fail to take any action where
such action or failure to act could reasonably be expected to prevent the Merger from qualifying as a “reorganization” within the meaning of Section 368(a) of the Code;
(h) knowingly take any action that is intended to or would
reasonably be likely to adversely affect or materially delay the ability of Huntington or its Subsidiaries to obtain any necessary approvals of any Governmental Entity required for the transactions contemplated hereby or the Requisite Huntington Vote
or to perform its covenants and agreements under this Agreement or to consummate the transactions contemplated hereby or thereby; or
(i) agree to take, make any commitment to take, or adopt any
resolutions of its Board of Directors or similar governing body in support of, any of the actions prohibited by this Section 5.3.
ARTICLE VI
ADDITIONAL AGREEMENTS
6.1 Regulatory Matters.
(a) Huntington shall promptly prepare and file with the SEC
the S-4, in which the Joint Proxy Statement will be included as a prospectus and Cadence shall promptly prepare and file with the Federal Reserve the Joint Proxy Statement. Huntington and Cadence, as applicable, shall use reasonable best efforts to
make such filings within thirty (30) days of the date of this Agreement. The S-4 shall also, to the extent required under the Securities Act and the regulations promulgated thereunder, register the shares of New Huntington Preferred Stock (or
depositary shares in respect thereof) that will be issued in the transaction. Each of Huntington and Cadence shall use their reasonable best efforts to have the S-4 declared effective under the Securities Act as promptly as practicable after such
filing and to keep the S-4 effective for so long as necessary to consummate the transactions contemplated by this Agreement, and Huntington and Cadence shall thereafter mail or deliver the Joint Proxy Statement to their respective shareholders.
Huntington shall also use its reasonable best efforts to obtain all necessary state securities law or “Blue Sky” permits and approvals required to carry out the transactions contemplated by this Agreement as promptly as practicable, and Cadence shall
furnish all information concerning Cadence and the holders of Cadence Common Stock as may be reasonably requested in connection with any such action.
(b) The parties hereto shall cooperate with each other and use
their reasonable best efforts to promptly prepare and file all necessary documentation, to effect all applications, notices, petitions and filings (and in the case of the applications, notices, petitions and filings required to obtain the Requisite
Regulatory Approvals, use their reasonable best efforts to make such filings within thirty (30) days of the date of this Agreement), to obtain as promptly as practicable all permits, consents, approvals and authorizations of all third parties and
Governmental Entities which are necessary or advisable to consummate the transactions contemplated by this Agreement (including the Merger), and to comply with the terms and conditions of all such permits, consents, approvals and authorizations of
all such third parties and Governmental Entities. Huntington and Cadence shall each use, and shall each cause their applicable Subsidiaries to use, reasonable best efforts to obtain each such Requisite Regulatory Approval and any approvals required
for the Merger as promptly as reasonably practicable. The parties shall cooperate with each other in connection therewith (including the furnishing of any information and any reasonable undertaking or commitments that may be required to obtain the
Requisite Regulatory Approvals) and shall respond as promptly as practicable to the requests of Governmental Entities for documents and information. Huntington and Cadence shall have the right to review in advance, and, to the extent practicable,
each will consult the other on, in each case subject to applicable laws relating to the exchange of information, all the information relating to Cadence or Huntington, as the case may be, and any of their respective Subsidiaries, which appears in any
filing made with, or written materials submitted to, any third party or any Governmental Entity in connection with the transactions contemplated by this Agreement. In exercising the foregoing right, each of the parties hereto shall act reasonably and
as promptly as practicable. Each party will provide the other with copies of any applications and all correspondence relating thereto prior to filing and with sufficient opportunity to comment, other than any portions of material filed in connection
therewith that contain competitively sensitive business or other proprietary information or confidential supervisory information filed under a claim of confidentiality. The parties hereto agree that they will consult with each other with respect to
the obtaining of all permits, consents, approvals and authorizations of all third parties and Governmental Entities necessary or advisable to consummate the transactions contemplated by this Agreement and each party will keep the other apprised of
the status of matters relating to completion of the transactions contemplated herein. Each party shall consult with the other in advance of any meeting or conference with any Governmental Entity in connection with the transactions contemplated by
this Agreement and, to the extent permitted by such Governmental Entity, give the other party and/or its counsel the opportunity to attend and participate in such meetings and conferences; and provided, that each party shall promptly advise the other
party with respect to substantive matters that are addressed in any meeting or conference with any Governmental Entity which the other party does not attend or participate in, to the extent permitted by such Governmental Entity and applicable law.
(c) In furtherance and not in limitation of the foregoing,
each of Huntington and Cadence shall use its reasonable best efforts to (i) avoid the entry of, or to have vacated, lifted, reversed or overturned any decree, judgment, injunction or other order, whether temporary, preliminary or permanent, that
would restrain, prevent or delay the Closing, and (ii) avoid or eliminate each and every impediment so as to enable the Closing to occur as soon as possible, including proposing, negotiating, committing to and effecting, by consent decree, hold
separate order, or otherwise, the sale, divestiture or disposition of businesses or assets of Huntington, Cadence and their respective Subsidiaries. Notwithstanding the foregoing, nothing contained herein shall be deemed to require Huntington or
Cadence or any of their respective Subsidiaries, and neither Huntington nor Cadence nor any of their respective Subsidiaries shall be permitted (without the written consent of the other party), to take any action, or commit to take any action, or
agree to any condition or restriction, in connection with the foregoing or obtaining any permits, consents, approvals and authorizations of Governmental Entities that would reasonably be likely to have a material adverse effect on Huntington, the
Surviving Bank and its Subsidiaries, taken as a whole, after giving effect to the Merger (a “Materially Burdensome Regulatory Condition”).
(d) Huntington and Cadence shall, upon request, furnish each
other with all information concerning themselves, their Subsidiaries, directors, officers and shareholders and such other matters as may be reasonably necessary or advisable in connection with the Joint Proxy Statement, the S-4 or any other
statement, filing, notice or application made by or on behalf of Huntington, Cadence or any of their respective Subsidiaries to any Governmental Entity in connection with the Merger and the other transactions contemplated by this Agreement. Each of
Huntington and Cadence agrees, as to itself and its Subsidiaries, that none of the information supplied or to be supplied by it specifically for inclusion or incorporation by reference in (i) the S-4 will, at the time the S-4 and each amendment or
supplement thereto, if any, is filed and becomes effective under the Securities Act, contain any untrue statement of a material fact or omit to state any material fact required to be stated therein or necessary to make the statements therein not
misleading, (ii) the Joint Proxy Statement and any amendment or supplement thereto will, at the time of filing and the date of mailing to the respective shareholders of Cadence or Huntington and at the time of the Huntington Meeting and the Cadence
Meeting, contain any untrue statement of a material fact or omit to state any material fact required to be stated therein or necessary to make the statements therein, in the light of the circumstances under which such statement was made, not
misleading, and (iii) any applications, notices and filings required in order to obtain the Requisite Regulatory Approvals will, at the time each is filed, contain any untrue statement of a material fact or omit to state any material fact required to
be stated therein or necessary to make the statements therein not misleading. Each of Huntington and Cadence further agrees that if it becomes aware that any information furnished by it would cause any of the statements in the S-4 or the Joint Proxy
Statement to be false or misleading with respect to any material fact, or to omit to state any material fact necessary to make the statements therein not false or misleading, to promptly inform the other party thereof and to take appropriate steps to
correct the S-4 or the Joint Proxy Statement.
(e) Huntington and Cadence shall promptly advise each other
upon receiving any communication from any Governmental Entity whose consent or approval is required for consummation of the transactions contemplated by this Agreement that causes such party to believe that there is a reasonable likelihood that any
Requisite Regulatory Approval will not be obtained or that the receipt of any such approval will be materially delayed.
(f) Without limiting the generality of this Section 6.1,
Cadence shall, and shall cause its Subsidiaries to, reasonably cooperate with Huntington and its Subsidiaries (including the furnishing of information and by making employees reasonably available) as is reasonably requested by Huntington in order to
comply with the requirements of the Comprehensive Capital Analysis and Review and Dodd-Frank Act Stress Testing programs.
6.2 Access to Information.
(a) Subject to Section 9.7, upon reasonable notice and subject
to applicable laws, each of the Huntington Parties and Cadence, for the purposes of verifying the representations and warranties of the other and preparing for the Merger and the other matters contemplated by this Agreement, shall, and shall cause
each of their respective Subsidiaries to, afford to the officers, employees, accountants, counsel, advisors and other representatives of the other party, access, during normal business hours during the period prior to the Effective Time, to all its
properties, books, contracts, personnel, information technology systems, and records, and each shall reasonably cooperate with the other party in preparing to execute after the Effective Time the conversion or consolidation of systems and business
operations generally (including by entering into customary confidentiality, non-disclosure and similar agreements with such service providers and/or the other party), and, during such period, during normal business hours and in a manner so as not to
interfere with normal business operations, each of the Huntington Parties and Cadence shall, and shall cause its respective Subsidiaries to, make available to the other party such information concerning its business, properties and personnel as such
party may reasonably request. Each party shall use commercially reasonable efforts to minimize any interference with the other party’s regular business operations during any such access. Neither the Huntington Parties nor Cadence nor any of their
respective Subsidiaries shall be required to provide access to or to disclose information where such access or disclosure would violate or prejudice the rights of the Huntington Parties’ or Cadence’s, as the case may be, customers, jeopardize the
attorney-client privilege of the institution in possession or control of such information (after giving due consideration to the existence of any common interest, joint defense or similar agreement between the parties) or contravene any law, rule,
regulation, order, judgment, decree, fiduciary duty or binding agreement entered into prior to the date of this Agreement. The parties hereto will make appropriate substitute disclosure arrangements under circumstances in which the restrictions of
the preceding sentence apply.
(b) Each of the Huntington Parties and Cadence shall hold all
information furnished by or on behalf of the other party or any of such party’s Subsidiaries or representatives pursuant to Section 6.2(a) in confidence to the extent required by, and in accordance with, the provisions of the confidentiality
agreement, dated August 12, 2025, between Huntington and Cadence (the “Confidentiality Agreement”).
(c) No investigation by either of the parties or their
respective representatives shall affect or be deemed to modify or waive the representations and warranties of the other set forth herein. Nothing contained in this Agreement shall give either party, directly or indirectly, the right to control or
direct the operations of the other party prior to the Effective Time. Prior to the Effective Time, each party shall exercise, consistent with the terms and conditions of this Agreement, complete control and supervision over its and its Subsidiaries’
respective operations.
|
6.3 |
Cadence Shareholder Approval. |
(a) Cadence shall take, in accordance with applicable law and the
Cadence Articles and Cadence Bylaws, all actions necessary to convene a meeting of its shareholders (the “Cadence Meeting”) to be held as soon as reasonably practicable after the S-4 is declared effective for the purpose of obtaining the
Requisite Cadence Vote required in connection with this Agreement and the Merger and, if so desired and mutually agreed by the parties, other matters of the type customarily brought before an annual or special meeting of shareholders to adopt a
merger agreement. The Board of Directors of Cadence shall use its reasonable best efforts to obtain from the shareholders of Cadence the Requisite Cadence Vote, including (except in the case of a Cadence Adverse Recommendation Change) by
communicating to its shareholders its recommendation (and including such recommendation in the Joint Proxy Statement) that they approve this Agreement and the transactions contemplated hereby (the “Cadence Board Recommendation”) and shall not
make a Cadence Adverse Recommendation Change except in accordance with this Section 6.3. Cadence shall engage a proxy solicitor reasonably acceptable to the Huntington Parties to assist in the solicitation of proxies from shareholders relating to the
Requisite Cadence Vote. However, subject to Section 8.1 and Section 8.2, if the Board of Directors of Cadence, after receiving the advice of its outside counsel and, with respect to financial matters, its financial advisors, determines in good faith
(x) that a Cadence Acquisition Proposal constitutes a Superior Proposal and that it would more likely than not result in a violation of its fiduciary duties under applicable law to continue to recommend this Agreement and the Merger or (y) in
response to an Intervening Event that it would more likely than not result in a violation of its fiduciary duties under applicable law to continue to recommend this Agreement and the Merger, then, prior to the receipt of the Requisite Cadence Vote,
in submitting this Agreement and the Merger to its shareholders, the Board of Directors of Cadence may withhold or withdraw or modify or qualify in a manner adverse to the Huntington Parties the Cadence Board Recommendation or may submit this
Agreement and the Merger to its shareholders without recommendation (each, a “Cadence Adverse Recommendation Change”) (although the resolutions approving this Agreement as of the date hereof may not be rescinded or amended), in which event the
Board of Directors of Cadence may communicate the basis for its Cadence Adverse Recommendation Change to its shareholders in the Joint Proxy Statement or an appropriate amendment or supplement thereto; provided, that the Board of Directors of
Cadence may not take any actions under this sentence unless (i) it gives the Huntington Parties at least three (3) business days’ prior written notice of its intention to take such action and a reasonable description of the event or circumstances
giving rise to its determination to take such action (including, in the event such action is taken by the Board of Directors of Cadence in response to a Cadence Acquisition Proposal, the latest material terms and conditions and the identity of the
third party in any such Cadence Acquisition Proposal, or any amendment or modification thereof, or describe in reasonable detail such other event or circumstances) and (ii) at the end of such notice period, the Board of Directors of Cadence takes
into account any amendment or modification to this Agreement proposed by the Huntington Parties and after receiving the advice of its outside counsel and, with respect to financial matters, its financial advisors, determines in good faith (x) that
such Cadence Acquisition Proposal nevertheless constitutes a Superior Proposal and that it would more likely than not result in a violation of its fiduciary duties under applicable law to continue to recommend this Agreement and the Merger or (y)
with respect to an Intervening Event that it would nevertheless more likely than not result in a violation of its fiduciary duties under applicable law to continue to recommend this Agreement and the Merger. Any material amendment to any Cadence
Acquisition Proposal will be deemed to be a new Cadence Acquisition Proposal for purposes of this Section 6.3 and will require a new notice period as referred to in this Section 6.3.
(b) Cadence shall adjourn or postpone the Cadence Meeting if, as of
the time for which such meeting is originally scheduled, there are insufficient shares of Cadence Common Stock represented (either in person or by proxy) to constitute a quorum necessary to conduct the business of such meeting, or if on the date of
such meeting, Cadence has not received proxies representing a sufficient number of shares necessary to obtain the Requisite Cadence Vote. Notwithstanding anything to the contrary herein, unless this Agreement has been terminated in accordance with
its terms, the Cadence Meeting shall be convened and this Agreement and the Merger shall be submitted to the shareholders of Cadence at the Cadence Meeting, for the purpose of voting on the approval of this Agreement and the Merger and the other
matters contemplated hereby, and nothing contained herein shall be deemed to relieve Cadence of such obligation. Cadence shall only be required to adjourn or postpone the Cadence Meeting two (2) times pursuant to the first sentence of this Section
6.3(b).
(c) For purposes of this Agreement, “Superior Proposal”
means (i) in the case of Cadence, any bona fide written Cadence Acquisition Proposal that the Board of Directors of Cadence has determined in good faith, after consultation with its financial advisors and outside legal counsel, and taking
into account all legal, regulatory and other aspects of the proposal and the person making the proposal, is more favorable to Cadence and its shareholders from a financial point of view than the Merger (including, as the case may be, any revisions to
the terms of this Agreement proposed by Huntington in response to such proposal or otherwise) and is reasonably likely to receive all required governmental approvals and financing on a timely basis and is otherwise reasonably capable of being
completed on the terms proposed, or (ii) in the case of Huntington, any bona fide written Huntington Acquisition Proposal that the Board of Directors of Huntington has determined in good faith, after consultation with its financial advisors
and outside legal counsel, and taking into account all legal, regulatory and other aspects of the proposal and the person making the proposal, is more favorable to Huntington and its shareholders from a financial point of view than the Merger
(including, as the case may be, any revisions to the terms of this Agreement proposed by Cadence in response to such proposal or otherwise) and is reasonably likely to receive all required governmental approvals and financing on a timely basis and is
otherwise reasonably capable of being completed on the terms proposed; provided, in each case, that for purposes of the definition of “Superior Proposal”, the references to “25%” in the definition of Cadence Acquisition Proposal or Huntington
Acquisition Proposal shall instead refer to “50%”.
(d) For purposes of this Agreement, “Intervening Event”
means any material effect, change, circumstance, event or occurrence that (i) was not known to or reasonably foreseeable by the Board of Directors of Cadence or Huntington, as the case may be, on the date hereof (or if known, the material
consequences of which were not known to or reasonably foreseeable by the Board of Directors of Cadence or Huntington, as the case may be, as of the date hereof), and (ii) that does not relate to or involve (A) any Cadence Acquisition Proposal or
Huntington Acquisition Proposal, (B) any effect, change, circumstance, event or occurrence relating to the other party or any of its Subsidiaries unless it would reasonably be likely to have, either individually or in the aggregate, a Material
Adverse Effect on such other party, or (C) the mere fact, in and of itself, of Cadence or Huntington meeting, exceeding or failing to meet earnings projections or internal financial forecasts or changes after the date hereof in the market price or
trading volume of the common stock or credit rating of Cadence or Huntington (it being understood that the underlying cause of any of the foregoing in this clause (C) may be considered and taken into account to the extent otherwise permitted by this
definition).
|
6.4 |
Huntington Shareholder Approval. |
(a) Huntington shall take, in accordance with applicable law and
the Huntington Articles and Huntington Bylaws, all actions necessary to convene a meeting of its shareholders (the “Huntington Meeting”) to be held as soon as reasonably practicable after the S- 4 is declared effective for the purpose of
obtaining the Requisite Huntington Vote required in connection with this Agreement and the Merger and, if so desired and mutually agreed by the parties, other matters of the type customarily brought before an annual or special meeting of shareholders
to adopt a merger agreement. The Board of Directors of Huntington shall use its reasonable best efforts to obtain from the shareholders of Huntington the Requisite Huntington Vote, including (except in the case of a Huntington Adverse Recommendation
Change) by communicating to its shareholders its recommendation (and including such recommendation in the Joint Proxy Statement) that they approve the issuance of Huntington Common Stock in connection with the Merger (the “Huntington Board
Recommendation”) and shall not make a Huntington Adverse Recommendation Change except in accordance with this Section 6.4. Huntington shall engage a proxy solicitor reasonably acceptable to Cadence to assist in the solicitation of proxies from
shareholders relating to the Requisite Huntington Vote. However, subject to Section 8.1 and Section 8.2, if the Board of Directors of Huntington, after receiving the advice of its outside counsel and, with respect to financial matters, its financial
advisors, determines in good faith (x) that a Huntington Acquisition Proposal constitutes a Superior Proposal and that it would more likely than not result in a violation of its fiduciary duties under applicable law to continue to recommend the
issuance of Huntington Common Stock in connection with the Merger or (y) in response to an Intervening Event that it would more likely than not result in a violation of its fiduciary duties under applicable law to continue to recommend the issuance
of Huntington Common Stock in connection with the Merger, then, prior to the receipt of the Requisite Huntington Vote, in submitting this Agreement and the Merger to its shareholders, the Board of Directors of Huntington may withhold or withdraw or
modify or qualify in a manner adverse to Cadence the Huntington Board Recommendation or may submit this Agreement and the Merger to its shareholders without recommendation (each, a “Huntington Adverse Recommendation Change”) (although the
resolutions approving this Agreement as of the date hereof may not be rescinded or amended), in which event the Board of Directors of Huntington may communicate the basis for its Huntington Adverse Recommendation Change to its shareholders in the
Joint Proxy Statement or an appropriate amendment or supplement thereto; provided, that the Board of Directors of Huntington may not take any actions under this sentence unless (i) it gives Cadence at least three (3) business days’ prior
written notice of its intention to take such action and a reasonable description of the event or circumstances giving rise to its determination to take such action and (ii) at the end of such notice period, the Board of Directors of Huntington takes
into account any amendment or modification to this Agreement proposed by Cadence and after receiving the advice of its outside counsel and, with respect to financial matters, its financial advisors, determines in good faith (x) that such Huntington
Acquisition Proposal nevertheless constitutes a Superior Proposal and that it would more likely than not result in a violation of its fiduciary duties under applicable law to continue to recommend the issuance of Huntington Common Stock in connection
with the Merger or (y) with respect to an Intervening Event that it would nevertheless more likely than not result in a violation of its fiduciary duties under applicable law to continue to recommend the issuance of Huntington Common Stock in
connection with the Merger.
(b) Huntington shall adjourn or postpone the Huntington Meeting,
if, as of the time for which such meeting is originally scheduled, there are insufficient shares of Huntington Common Stock represented (either in person or by proxy) to constitute a quorum necessary to conduct the business of such meeting, or if on
the date of such meeting, Huntington has not received proxies representing a sufficient number of shares necessary to obtain the Requisite Huntington Vote. Notwithstanding anything to the contrary herein, unless this Agreement has been terminated in
accordance with its terms, the Huntington Meeting shall be convened and this Agreement and the Merger shall be submitted to the shareholders of Huntington at the Huntington Meeting, for the purpose of voting on the approval of the Merger and the
other matters contemplated hereby, and nothing contained herein shall be deemed to relieve Huntington of such obligation. Huntington shall only be required to adjourn or postpone the Huntington Meeting two (2) times pursuant to the first sentence of
this Section 6.4(b). Each of Cadence and Huntington shall use its reasonable best efforts to cause the Cadence Meeting and the Huntington Meeting to occur as soon as reasonably practicable and on the same date.
6.5 Legal Conditions to Merger. Subject
in all respects to Section 6.1 of this Agreement, each of Huntington and Cadence shall, and shall cause its Subsidiaries to, use their reasonable best efforts, in each case as promptly as practicable, (a) to take, or cause to be taken, all actions
necessary, proper or advisable to comply promptly with all legal and regulatory requirements that may be imposed on such party or its Subsidiaries with respect to the Merger and, subject to the conditions set forth in Article VII hereof, to
consummate the transactions contemplated by this Agreement, and (b) to obtain (and to cooperate with the other party to obtain) any material consent, authorization, order or approval of, or any exemption by, any Governmental Entity and any other
third party that is required to be obtained by Cadence or Huntington or any of their respective Subsidiaries in connection with the Merger and the other transactions contemplated by this Agreement.
6.6 Stock Exchange Listing. Huntington
shall cause the shares of Huntington Common Stock and New Huntington Preferred Stock (or depositary shares in respect thereof) to be issued in the Merger to be approved for listing on the NASDAQ, subject to official notice of issuance, prior to the
Effective Time.
6.7 Tax Matters. The Huntington Parties
shall use reasonable best efforts to obtain the Huntington Tax Opinion, and Cadence shall use reasonable best efforts to obtain the Cadence Tax Opinion (and, if the SEC requires any opinion regarding the U.S. federal income tax treatment of the
Merger to be submitted in connection with the declaration of the effectiveness of the S-4, such opinions). In connection with the foregoing, each party shall deliver duly executed certificates (dated as of the necessary date and signed by an officer
of the Huntington Parties or Cadence, as applicable) containing such representations and warranties as shall be reasonably satisfactory in form and substance to Huntington’s counsel and Cadence’s counsel and reasonably necessary or appropriate to
enable such counsel to render such opinions (but only to the extent the Huntington Parties and Cadence in good faith believe they are able to make such representations and warranties truthfully).
(a) Huntington shall provide the employees of Cadence and its
Subsidiaries as of the Effective Time (the “Continuing Employees”), during the period commencing at the Effective Time and ending on December 31 of the calendar year during which the Effective Time occurs, for so long as a Continuing Employee
is employed following the Effective Time, with the following: (i) annual base salary or wages, as applicable, that are no less than the annual base salary or wages in effect for each such Continuing Employee immediately prior to the Effective Time;
(ii) target short- and long-term incentive opportunities that are no less favorable in the aggregate than those provided to each such Continuing Employee immediately prior to the Effective Time, and (iii) employee benefits (other than severance,
perquisites, defined benefit pension, deferred compensation, post-termination welfare, split dollar insurance, change in control and retention benefits) that are no less favorable in the aggregate than those provided to such Continuing Employees
immediately prior to the Effective Time (other than severance, perquisites, defined benefit pension, deferred compensation, post-termination welfare, split dollar insurance, change in control and retention benefits). For a period beginning at the
Effective Time and continuing through the first anniversary thereof, each Continuing Employee who is not party to an individual agreement providing for severance or termination benefits and is terminated under severance qualifying circumstances shall
be eligible to receive severance benefits pursuant to the Huntington Transition Pay Plan as in effect as of the date of this Agreement, subject to such Continuing Employee’s execution (and non-revocation) of a release of claims. In addition, each of
Cadence and Huntington shall take all actions necessary or appropriate to effectuate the matters set forth on Section 6.8(a) of the Cadence Disclosure Schedule.
(b) With respect to any employee benefit plans of Huntington or its
Subsidiaries in which any Continuing Employees become eligible to participate on or after the Effective Time (the “New Plans”), Huntington and its Subsidiaries shall: (i) waive all pre-existing conditions and waiting periods and use
commercially reasonable efforts to waive all exclusions with respect to participation and coverage requirements applicable to such employees and their eligible dependents under any New Plans, except to the extent such pre-existing conditions,
exclusions or waiting periods would apply under the analogous Cadence Benefit Plan, (ii) use commercially reasonable efforts to provide each such employee and their eligible dependents with credit for any co-payments or coinsurance and deductibles
paid prior to the Effective Time under a Cadence Benefit Plan that provides health care benefits (including medical, dental and vision), to the same extent that such credit was given under the analogous Cadence Benefit Plan prior to the Effective
Time, in satisfying any applicable deductible, co-payment, coinsurance or maximum out-of-pocket requirements under any New Plans, and (iii) recognize all service of such employees with Cadence and its Subsidiaries, including with their respective
predecessors, for all purposes in any New Plan to the same extent that such service was taken into account under the analogous Cadence Benefit Plan prior to the Effective Time; provided, that the foregoing service recognition shall not apply
(A) to the extent it would result in duplication of benefits for the same period of service, (B) for purposes of any defined benefit pension plan or supplemental plan, or (C) for purposes of any benefit plan that is a frozen plan or provides
grandfathered benefits.
(c) Effective as of the Effective Time, Huntington agrees to assume
and honor all Cadence Benefit Plans in accordance with their terms as of the date hereof, it being understood that this sentence shall not be construed to limit the ability of Huntington or any of its Subsidiaries or affiliates to amend or terminate
any Cadence Benefit Plan to the extent that such amendment or termination is permitted by the terms of the applicable plan.
(d) Unless otherwise requested by Huntington in writing at least
ten (10) business days prior to the Effective Time, Cadence shall cause any 401(k) plan or other defined contribution plan sponsored or maintained by Cadence (collectively, the “Cadence 401(k) Plan”) to be terminated effective as of the day
immediately prior to the Effective Time and contingent upon the occurrence of the Closing. In the event that the Cadence 401(k) Plan is terminated in accordance with the foregoing sentence, the Continuing Employees shall be eligible to participate,
effective as of the Effective Time, in a 401(k) plan sponsored or maintained by Huntington or one of its Subsidiaries (a “Huntington 401(k) Plan”). Cadence and Huntington shall take any and all actions as may be required, including amendments to the
Cadence 401(k) Plan and/or Huntington 401(k) Plan to permit the Continuing Employees who are then actively employed to make rollover contributions to the Huntington 401(k) Plan of “eligible rollover distributions” (with the meaning of Section
401(a)(31) of the Code) in the form of cash, notes (in the case of loans) or a combination thereof. Cadence shall provide Huntington with evidence that the Cadence 401(k) Plan has been terminated or amended, as applicable, in accordance with this
Section 6.7(d); provided, that prior to amending or terminating the Cadence 401(k) Plan, Cadence shall provide the form and substance of any applicable resolutions or amendments to Huntington for review and approval (which approval shall not be
unreasonably withheld, conditioned or delayed).
(e) On and after the date hereof, any broad-based employee notices
or communication materials (including any website posting) to be provided or communicated by Cadence with respect to employment, compensation or benefits matters addressed in this Agreement or related, directly or indirectly, to the transactions
contemplated by this Agreement shall be subject to the prior prompt review and comment of Huntington, and Cadence shall consider in good faith revising such notice or communication to reflect any comments or advice that Huntington timely provides.
(f) Nothing in this Agreement shall confer upon any employee,
officer, director or consultant of Cadence or any of its Subsidiaries or affiliates any right to continue in the employ or service of the Surviving Bank, Cadence, Huntington, or any Subsidiary or affiliate thereof, or shall interfere with or restrict
in any way the rights of the Surviving Bank, Cadence, Huntington or any Subsidiary or affiliate thereof to discharge or terminate the services of any employee, officer, director or consultant of Cadence or any of its Subsidiaries or affiliates at any
time for any reason whatsoever, with or without cause. Nothing in this Agreement shall be deemed to (i) establish, amend, or modify any Cadence Benefit Plan, New Plan or any other benefit or employment plan, program, agreement or arrangement, or (ii)
alter or limit the ability of the Huntington or any of its Subsidiaries or affiliates to amend, modify or terminate any particular Cadence Benefit Plan, New Plan or any other benefit or employment plan, program, agreement or arrangement after the
Effective Time. Without limiting the generality of Section 9.12, nothing in this Agreement, express or implied, is intended to or shall confer upon any person, including any current or former employee, officer, director or consultant of Cadence or
any of its Subsidiaries or affiliates, any right, benefit or remedy of any nature whatsoever under or by reason of this Agreement.
|
6.9 |
Indemnification; Directors’ and Officers’ Insurance. |
(a) From and after the Effective Time, the Surviving Bank shall
indemnify and hold harmless, to the fullest extent permitted by applicable law, each present and former director, officer or employee of Cadence and its Subsidiaries (in each case, when acting in such capacity) (collectively, the “Cadence
Indemnified Parties”) against any costs or expenses (including reasonable attorneys’ fees), judgments, fines, losses, damages or liabilities incurred in connection with any threatened or actual claim, action, suit, proceeding or investigation,
whether civil, criminal, administrative or investigative, whether arising before or after the Effective Time, arising in whole or in part out of, or pertaining to, the fact that such person is or was a director, officer or employee of Cadence or any
of its Subsidiaries or is or was serving at the request of Cadence or any of its Subsidiaries as a director or officer of another person and pertaining to matters, acts or omissions existing or occurring at or prior to the Effective Time, including
matters, acts or omissions occurring in connection with the consideration and approval of this Agreement and the transactions contemplated by this Agreement, and the Surviving Bank shall also advance expenses as incurred by the Cadence Indemnified
Party to the fullest extent permitted by applicable law; provided, that in the case of advancement of expenses the Cadence Indemnified Party to whom expenses are advanced provides an undertaking (in a reasonable and customary form) to repay
such advances if it is ultimately determined that such Cadence Indemnified Party is not entitled to indemnification.
(b) For a period of six (6) years after the Effective Time, the
Surviving Bank shall maintain in effect the current policies of directors’ and officers’ liability insurance maintained by Cadence (provided, that the Surviving Bank may substitute therefor policies with a substantially comparable insurer of
at least the same coverage and amounts containing terms and conditions which are no less advantageous to the insured) with respect to claims against the present and former officers and directors of Cadence or any of its Subsidiaries arising from
facts or events which occurred at or before the Effective Time (including the transactions contemplated by this Agreement); provided, however, that the Surviving Bank shall not be obligated to expend, on an annual basis, an amount in
excess of three hundred percent 300% of the current annual premium paid as of the date hereof by Cadence for such insurance (the “Premium Cap”), and if such premiums for such insurance would at any time exceed the Premium Cap, then the
Surviving Bank shall cause to be maintained policies of insurance that, in its good-faith determination, provide the maximum coverage available at an annual premium equal to the Premium Cap. In lieu of the foregoing, Cadence, in consultation with,
but only upon the consent of the Huntington Parties, may (and at the request of the Huntington Parties, Cadence shall use its reasonable best efforts to) obtain at or prior to the Effective Time a six-year “tail” policy under Cadence’s existing
directors’ and officers’ insurance policy providing equivalent coverage to that described in the preceding sentence if and to the extent that the same may be obtained for an amount that, in the aggregate, does not exceed the Premium Cap. If Cadence
purchases such a tail policy, the Surviving Bank shall maintain such tail policy in full force and effect and continue to honor its obligations thereunder.
(c) The provisions of this Section 6.9 shall survive the Effective
Time and are intended to be for the benefit of, and shall be enforceable by, each Cadence Indemnified Party and his or her heirs and representatives. If the Surviving Bank or any of its successors or assigns consolidates with or merges into any other
entity and is not the continuing or surviving entity of such consolidation or merger, transfers all or substantially all its assets or deposits to any other entity or engages in any similar transaction, then in each case, the Surviving Bank will
cause proper provision to be made so that the successors and assigns of the Surviving Bank will expressly assume the obligations set forth in this Section 6.9. For the avoidance of doubt, to the extent required by any agreement previously entered
into by Cadence in connection with a merger, acquisition or other business combination, the provisions of this Section 6.9 shall apply to directors, officers, employees and fiduciaries of predecessor entities previously acquired by Cadence or any of
its Subsidiaries.
(d) The obligations of the Surviving Bank, the Huntington Parties
and Cadence under this Section 6.9 shall not be terminated or modified in a manner so as to adversely affect any Cadence Indemnified Party or any other person entitled to the benefit of this Section 6.9 without the prior written consent of the
affected person.
6.10 Additional Agreements. In case at
any time after the Effective Time any further action is necessary or desirable to carry out the purposes of this Agreement or to vest the Huntington Parties or the Surviving Bank with full title to all properties, assets, rights, approvals,
immunities and franchises of any of the parties to the Merger, the then-current officers and directors of each party to this Agreement and their respective Subsidiaries shall take, or cause to be taken, all such necessary action as may be reasonably
requested by the other party, at the expense of the party who makes any such request.
6.11 Advice of Changes. The Huntington
Parties and Cadence shall each promptly advise the other party of any effect, change, event, circumstance, condition, occurrence or development known to it (i) that has had or is reasonably likely to have a Material Adverse Effect on it or (ii) which
it believes would or would be reasonably likely to cause or constitute a material breach of any of its representations, warranties or covenants contained herein or that reasonably could be expected to give rise, individually or in the aggregate, to
the failure of a condition in Article VII; provided, that any failure to give notice in accordance with the foregoing with respect to any breach shall not be deemed to constitute a violation of this Section 6.11 or the failure of any
condition set forth in Section 7.2 or 7.3 to be satisfied, or otherwise constitute a breach of this Agreement by the party failing to give such notice, in each case unless the underlying breach would independently result in a failure of the
conditions set forth in Section 7.2 or 7.3 to be satisfied; and provided, further, that the delivery of any notice pursuant to this Section 6.11 shall not cure any breach of, or noncompliance with, any other provision of this
Agreement or limit the remedies available to the party receiving such notice.
6.12 Dividends. After the date of this
Agreement, each of Huntington and Cadence shall coordinate with the other the declaration of any dividends in respect of Huntington Common Stock and Cadence Common Stock and the record dates and payment dates relating thereto, it being the intention
of the parties hereto that holders of Cadence Common Stock shall not receive two (2) dividends, or fail to receive one (1) dividend, in any quarter with respect to their shares of Cadence Common Stock and any shares of Huntington Common Stock any
such holder receives in exchange therefor in the Merger.
6.13 Corporate Governance; Foundation.
(a) Huntington shall take all appropriate action so that three (3)
current directors of Cadence shall be appointed to the Board of Directors of Huntington (the “Cadence Directors”). Each of the Cadence Directors shall be designated by Huntington, it being agreed that one of such designated Cadence Directors
shall be James D. Rollins III.
(b) Following the Closing Date, Huntington shall maintain the
Cadence Bank Foundation and shall dedicate any funds in the Cadence Bank Foundation at the Effective Time to supporting community development and reinvestment and civic and charitable activities within Cadence’s footprint as of the time immediately
prior to the Effective Time.
6.14 Acquisition
Proposals.
(a) Cadence shall not, and shall cause its Subsidiaries and shall
use its reasonable best efforts to cause its and their officers, directors, agents, advisors and representatives (collectively, “Representatives”) not to, directly or indirectly, (i) initiate, solicit, knowingly encourage or knowingly
facilitate any inquiries or proposals with respect to, (ii) engage or participate in any negotiations with any person concerning or (iii) provide any confidential or nonpublic information or data to, or have or participate in any discussions with,
any person relating to, any Cadence Acquisition Proposal, except to notify a person that has made or, to the knowledge of Cadence, is making any inquiries with respect to, or is considering making, a Cadence Acquisition Proposal of the existence of
the provisions of this Section 6.14(a); provided, that, prior to the receipt of the Requisite Cadence Vote, in the event Cadence receives an unsolicited bona fide written Cadence Acquisition Proposal, it may, and may permit its
Subsidiaries and its and its Subsidiaries’ Representatives to, furnish or cause to be furnished nonpublic information or data and participate in such negotiations or discussions to the extent that its Board of Directors concludes in good faith (after
receiving the advice of its outside counsel, and with respect to financial matters, its financial advisors) that failure to take such actions would be more likely than not to result in a violation of its fiduciary duties under applicable law; provided,
further, that, prior to or concurrently with providing any nonpublic information permitted to be provided pursuant to the foregoing proviso, Cadence shall have provided such information to Huntington, and shall have entered into a
confidentiality agreement with such third party on terms, in all material respects, no less favorable to it than the Confidentiality Agreement, which confidentiality agreement shall not provide such person with any exclusive right to negotiate with
Cadence. Cadence will, and will use its reasonable best efforts to cause its Representatives to, immediately cease and cause to be terminated any activities, discussions or negotiations conducted before the date of this Agreement with any person
other than Huntington with respect to any Cadence Acquisition Proposal. Cadence will promptly (and in any event within one (1) business day) advise Huntington following receipt of any Cadence Acquisition Proposal, and the substance thereof (including
the material terms and conditions of and the identity of the person making such inquiry or Cadence Acquisition Proposal) and will keep Huntington reasonably apprised of any related developments, discussions and negotiations on a current basis,
including any amendments to or revisions of the material terms of such inquiry or Cadence Acquisition Proposal. Cadence shall use its reasonable best efforts, subject to applicable law and the fiduciary duties of the Board of Directors of Cadence, to
enforce any existing confidentiality or standstill agreements to which it or any of its Subsidiaries is a party in accordance with the terms thereof. During the term of this Agreement, Cadence shall not, and shall cause its Subsidiaries and its and
their Representatives not to on its behalf, enter into any letter of intent, memorandum of understanding, agreement in principle, acquisition agreement, merger agreement or other similar agreement (other than a confidentiality agreement referred to
and entered into in accordance with this Section 6.14(a)) relating to any Cadence Acquisition Proposal. As used in this Agreement, “Cadence Acquisition Proposal” shall mean, other than the transactions contemplated by this Agreement, any
offer, inquiry or proposal relating to, or any third party indication of interest in, (i) any acquisition or purchase, direct or indirect, of twenty-five percent (25%) or more of the consolidated assets of Cadence and its Subsidiaries or twenty-five
percent (25%) or more of any class of equity or voting securities of Cadence or its Subsidiaries whose assets, individually or in the aggregate, constitute twenty-five percent (25%) or more of the consolidated assets of Cadence, (ii) any tender offer
or exchange offer that, if consummated, would result in such third party beneficially owning twenty-five percent (25%) or more of any class of equity or voting securities of Cadence or its Subsidiaries whose assets, individually or in the aggregate,
constitute twenty-five percent (25%) or more of the consolidated assets of Cadence, or (iii) a merger, consolidation, share exchange or other business combination, reorganization or similar transaction involving Cadence or its Subsidiaries whose
assets, individually or in the aggregate, constitute twenty-five percent (25%) or more of the consolidated assets of Cadence.
(b) Nothing contained in this Agreement shall prevent either
party or its Board of Directors from complying with Rule 14d-9 and Rule 14e-2 under the Exchange Act with respect to a Cadence Acquisition Proposal or Huntington Acquisition Proposal or from making any legally required disclosure to such party’s
shareholders; provided, that such Rules and disclosures will in no way eliminate or modify the effect that any action pursuant to such Rules or any such disclosures would otherwise have under this Agreement.
6.15 Public Announcements. Cadence and
the Huntington Parties shall each use their reasonable best efforts (a) to develop a joint communications plan, (b) to ensure that all press releases and other public statements with respect to the transactions contemplated hereby shall be consistent
with such joint communications plan, and (c) except in respect of (i) any announcement required by applicable law or regulation, or a request by a Governmental Entity, (ii) communications that are substantially similar to communications previously
approved pursuant to this Section 6.15, (iii) communications permitted by Section 6.3 or Section 6.4 or (iv) an obligation pursuant to any listing agreement with or rules of any securities exchange, Cadence and the Huntington Parties agree to consult
with each other and to obtain the advance approval of the other party (which approval shall not be unreasonably withheld, conditioned or delayed) before issuing any press release or, to the extent practical, otherwise making any public statement with
respect to this Agreement or the transactions contemplated hereby.
6.16 Change of Method. The Huntington
Parties may at any time change the method of effecting the Merger if and to the extent requested by the Huntington Parties, and Cadence agrees to enter into such amendments to this Agreement as the Huntington Parties may reasonably request in order
to give effect to such restructuring; provided, however, that no such change or amendment shall (i) alter or change the amount or kind of the Merger Consideration provided for in this Agreement, (ii) adversely affect the Tax treatment
of the Merger with respect to Cadence’s shareholders or (iii) be reasonably likely to cause the Closing to be materially delayed or the receipt of the Requisite Regulatory Approvals to be prevented or materially delayed.
6.17 Restructuring Efforts. If either
Cadence or Huntington shall have failed to obtain the Requisite Cadence Vote or the Requisite Huntington Vote at the duly convened Cadence Meeting or Huntington Meeting, as applicable, or any adjournment or postponement thereof, each of the parties
shall in good faith use its reasonable best efforts to negotiate a restructuring of the transactions contemplated by this Agreement (provided, however, that no party shall have any obligation to agree to (i) alter or change any
material term of this Agreement, including the amount or kind of the Merger Consideration, in a manner adverse to such party or its shareholders or (ii) adversely affect the Tax treatment of the Merger with respect to such party or its shareholders)
and/or resubmit this Agreement and the transactions contemplated hereby (or as restructured pursuant to this Section 6.17) to its shareholders for approval.
6.18 Takeover Restrictions. Neither
Cadence nor the Huntington Parties shall take any action that would cause any Takeover Restriction to become applicable to this Agreement, the Merger, or any of the other transactions contemplated hereby, and each of the Huntington Parties and
Cadence shall take all necessary steps to exempt (or ensure the continued exemption of) the Merger and the other transactions contemplated hereby from any applicable Takeover Restriction now or hereafter in effect. If any Takeover Restriction may
become, or may purport to be, applicable to the transactions contemplated hereby, each of the Huntington Parties and Cadence will grant such approvals and take such actions as are necessary so that the transactions contemplated by this Agreement may
be consummated as promptly as practicable on the terms contemplated hereby and otherwise act to eliminate or minimize the effects of any Takeover Restriction on any of the transactions contemplated by this Agreement, including, if necessary,
challenging the validity or applicability of any such Takeover Restriction.
6.19 Exemption from Liability Under Section
16(b). Cadence and Huntington agree that, in order to most effectively compensate and retain those officers and directors of Cadence subject to the reporting requirements of Section 16(a) of the Exchange Act (the “Cadence Insiders”),
both prior to and after the Effective Time, it is desirable that Cadence Insiders not be subject to a risk of liability under Section 16(b) of the Exchange Act to the fullest extent permitted by applicable law in connection with the conversion of
shares of Cadence Common Stock, Cadence Preferred Stock and Cadence Equity Awards in the Merger, and for that compensatory and retentive purpose agree to the provisions of this Section 6.19. The Boards of Directors of Huntington and of Cadence, or a
committee of non-employee directors thereof (as such term is defined for purposes of Rule 16b-3(d) under the Exchange Act), shall prior to the Effective Time, take all such steps as may be necessary or appropriate to cause (x) in the case of Cadence,
any dispositions of Cadence Common Stock, Cadence Preferred Stock or Cadence Equity Awards by Cadence Insiders and (y) in the case of Huntington, any acquisitions of Huntington Common Stock, New Huntington Preferred Stock (or depositary shares in
respect thereof) or equity awards of Huntington into which the Cadence Equity awards are converted by any Cadence Insiders who, immediately following the Merger, will be officers or directors of Huntington subject to the reporting requirements of
Section 16(a) of the Exchange Act, in each case pursuant to the transactions contemplated by this Agreement, to be exempt from liability pursuant to Rule 16b-3 under the Exchange Act to the fullest extent permitted by applicable law.
6.20 Litigation and Claims. Each of the
Huntington Parties and Cadence shall, to the extent permitted under applicable law and regulation, promptly notify the other party in writing of any action, arbitration, audit, hearing, investigation, litigation, suit, subpoena or summons issued,
commenced, brought, conducted or heard by or before, or otherwise involving, any Governmental Entity or arbitrator pending or, to the knowledge of the Huntington Parties or Cadence, as applicable, threatened against Huntington, Cadence or any of
their respective Subsidiaries that (a) questions or would reasonably be expected to question the validity of this Agreement or the other agreements contemplated hereby or thereby or any actions taken or to be taken by the Huntington Parties, Cadence,
or their respective Subsidiaries with respect hereto or thereto, or (b) seeks to enjoin or otherwise restrain the transactions contemplated hereby or thereby. Cadence shall give the Huntington Parties the opportunity to participate at its own expense
in the defense or settlement of any shareholder litigation against Cadence and/or its directors or affiliates relating to the transactions contemplated by this Agreement, and no such settlement shall be agreed without the Huntington Parties’s prior
written consent (such consent not to be unreasonably withheld, conditioned or delayed).
6.21 Assumption of Cadence Debt.
Effective at the Effective Time, Huntington or Huntington National Bank, as applicable, shall, to the extent permitted thereunder and required thereby, assume the due and punctual performance and observance of the covenants to be performed by Cadence
pursuant to the definitive documents governing the short-term and long-term borrowings set forth on Section 6.21 of the Cadence Disclosure Schedule, and the due and punctual payment of the principal of such borrowings (and premium, if any) and
interest thereon. In connection therewith, (i) Huntington and Cadence shall, and shall cause Huntington National Bank and Cadence respectively to, cooperate and execute and deliver any supplemental indentures, if applicable, and (ii) Cadence shall
execute and deliver any officer’s certificates or other documents, and to provide any opinions of counsel to the trustee thereof, in each case, required to make such assumption effective as of the Effective Time or the effective time of the Merger,
as applicable.
ARTICLE VII
CONDITIONS PRECEDENT
7.1 Conditions to Each
Party’s Obligation to Effect the Merger. The respective obligations of the parties to effect the Merger shall be subject to the satisfaction at or prior to the Effective Time of the following conditions:
(a) Shareholder Approval. (i) This
Agreement shall have been approved by the shareholders of Cadence by the Requisite Cadence Vote and (ii) the issuance of Huntington Common Stock in connection with the Merger shall have been approved by the shareholders of Huntington by the Requisite
Huntington Vote.
(b) Stock Exchange Listing. The shares of Huntington Common
Stock and New Huntington Preferred Stock (or depositary shares in respect thereof) that shall be issuable pursuant to this Agreement shall have been authorized for listing on the NASDAQ, in each case subject to official notice of issuance.
(c) S-4. The S-4 shall have become
effective under the Securities Act and no stop order suspending the effectiveness of the S-4 shall have been issued and no proceedings for that purpose shall have been initiated or threatened by the SEC and not withdrawn.
(d) No Injunctions or Restraints; Illegality. No order,
injunction or decree issued by any court or Governmental Entity of competent jurisdiction or other legal restraint or prohibition preventing the consummation of the Merger shall be in effect. No law, statute, rule, regulation, order, injunction or
decree shall have been enacted, entered, promulgated or enforced by any Governmental Entity which prohibits or makes illegal consummation of the Merger.
(e) Regulatory Approvals. (i) All regulatory authorizations,
consents, orders or approvals (x) from the OCC and (y) set forth in Sections 3.4 and 4.4 which are necessary to consummate the transactions contemplated by this Agreement, including the Merger or those the failure of which to be obtained would
reasonably be likely to have, individually or in the aggregate, a Material Adverse Effect on Huntington or the Surviving Bank, shall have been obtained and shall remain in full force and effect and all statutory waiting periods in respect thereof
shall have expired (such approvals and the expiration of such waiting periods being referred to herein as the “Requisite Regulatory Approvals”) and (ii) no such Requisite Regulatory Approval shall have resulted in the imposition of any
Materially Burdensome Regulatory Condition.
7.2 Conditions to Obligations of Huntington.
The obligation of Huntington and Huntington National Bank to effect the Merger is also subject to the satisfaction, or waiver by Huntington and Huntington National Bank, at or prior to the Effective Time, of the following conditions:
(a) Representations and Warranties. The representations and
warranties of Cadence set forth in (i) Sections 3.2(a) and 3.8(a) (in each case after giving effect to the lead-in to Article III) shall be true and correct (other than, in the case of Section 3.2(a), such failures to be true and correct as are de
minimis) in each case as of the date of this Agreement and as of the Closing Date as though made on and as of the Closing Date (except to the extent such representations and warranties speak as of an earlier date, in which case as of such
earlier date), and (ii) Sections 3.1(a), 3.1(b), 3.2(c) and 3.3(a) (in each case, after giving effect to the lead-in to Article III) shall be true and correct in all material respects as of the date of this Agreement and as of the Closing Date as
though made on and as of the Closing Date (except to the extent such representations and warranties speak as of an earlier date, in which case as of such earlier date). All other representations and warranties of Cadence set forth in this Agreement
(read without giving effect to any qualification as to materiality or Material Adverse Effect set forth in such representations or warranties but, in each case, after giving effect to the lead-in to Article III) shall be true and correct in all
respects as of the date of this Agreement and as of the Closing Date as though made on and as of the Closing Date (except to the extent such representations and warranties speak as of an earlier date, in which case as of such earlier date); provided,
however, that for purposes of this sentence, such representations and warranties shall be deemed to be true and correct unless the failure or failures of such representations and warranties to be so true and correct, either individually or in
the aggregate, and without giving effect to any qualification as to materiality or Material Adverse Effect set forth in such representations or warranties, has had or would reasonably be likely to have a Material Adverse Effect on Cadence or
Huntington. Huntington shall have received a certificate signed on behalf of Cadence by the Chief Executive Officer or the Chief Financial Officer of Cadence to the foregoing effect.
(b) Performance of Obligations of Cadence. Cadence shall
have performed in all material respects the obligations, covenants and agreements required to be performed by it under this Agreement at or prior to the Closing Date, and the Huntington Parties shall have received a certificate signed on behalf of
Cadence by the Chief Executive Officer or the Chief Financial Officer of Cadence to such effect.
(c) Federal Tax Opinion. The Huntington Parties shall have
received the opinion of Wachtell, Lipton, Rosen & Katz (or another nationally recognized tax counsel, including, for the avoidance of doubt, Sullivan & Cromwell LLP), in form and substance reasonably satisfactory to Huntington, dated as of
the Closing Date, to the effect that, on the basis of facts, representations and assumptions set forth or referred to in such opinion, the Merger will qualify as a “reorganization” within the meaning of Section 368(a) of the Code (the “Huntington
Tax Opinion”). In rendering such opinion, counsel may require and rely upon representations contained in certificates of officers of the Huntington Parties and Cadence reasonably satisfactory in form and substance to such counsel.
7.3 Conditions to Obligations of Cadence.
The obligation of Cadence to effect the Merger is also subject to the satisfaction or waiver by Cadence at or prior to the Effective Time of the following conditions:
(a) Representations and Warranties. The representations and
warranties of the Huntington Parties set forth in (i) Sections 4.2(a) and 4.8(a) (in each case, after giving effect to the lead-in to Article IV) shall be true and correct (other than, in the case of Section 4.2(a), such failures to be true and
correct as are de minimis) in each case as of the date of this Agreement and as of the Closing Date as though made on and as of the Closing Date (except to the extent such representations and warranties speak as of an earlier date, in which
case as of such earlier date), and (ii) Sections 4.1(a), 4.1(b) (with respect to Huntington National Bank only), 4.2(c) (with respect to Huntington National Bank only) and 4.3(a) (in each case, after giving effect to the lead-in to Article IV) shall
be true and correct in all material respects as of the date of this Agreement and as of the Closing Date as though made on and as of the Closing Date (except to the extent such representations and warranties speak as of an earlier date, in which case
as of such earlier date). All other representations and warranties of the Huntington Parties set forth in this Agreement (read without giving effect to any qualification as to materiality or Material Adverse Effect set forth in such representations
or warranties but, in each case, after giving effect to the lead-in to Article IV) shall be true and correct in all respects as of the date of this Agreement and as of the Closing Date as though made on and as of the Closing Date (except to the
extent such representations and warranties speak as of an earlier date, in which case as of such earlier date); provided, however, that for purposes of this sentence, such representations and warranties shall be deemed to be true and
correct unless the failure or failures of such representations and warranties to be so true and correct, either individually or in the aggregate, and without giving effect to any qualification as to materiality or Material Adverse Effect set forth in
such representations or warranties, has had or would reasonably be likely to have a Material Adverse Effect on the Huntington Parties. Cadence shall have received a certificate signed on behalf of Huntington by the Chief Executive Officer or the
Chief Financial Officer of Huntington to the foregoing effect.
(b) Performance of Obligations of Huntington. The Huntington
Parties shall have performed in all material respects the obligations, covenants and agreements required to be performed by it under this Agreement at or prior to the Closing Date, and Cadence shall have received a certificate signed on behalf of
Huntington by the Chief Executive Officer or the Chief Financial Officer of Huntington to such effect.
(c) Federal Tax Opinion. Cadence shall have received the
opinion of Sullivan & Cromwell LLP (or another nationally recognized tax counsel, including, for the avoidance of doubt, Wachtell, Lipton, Rosen & Katz), in form and substance reasonably satisfactory to Cadence, dated as of the Closing Date,
to the effect that, on the basis of facts, representations and assumptions set forth or referred to in such opinion, the Merger will qualify as a “reorganization” within the meaning of Section 368(a) of the Code (the “Cadence Tax Opinion”). In
rendering such opinion, counsel may require and rely upon representations contained in certificates of officers of the Huntington Parties and Cadence reasonably satisfactory in form and substance to such counsel.
ARTICLE VIII
TERMINATION AND AMENDMENT
8.1 Termination. This Agreement may be
terminated at any time prior to the Effective Time, whether before or after receipt of the Requisite Cadence Vote or the Requisite Huntington Vote:
(a) by mutual consent of the Huntington Parties and Cadence in a
written instrument;
(b) by either the Huntington Parties or Cadence if any Governmental
Entity that must grant a Requisite Regulatory Approval has denied approval of the Merger and such denial has become final and nonappealable or any Governmental Entity of competent jurisdiction shall have issued a final nonappealable order, injunction
or decree permanently enjoining or otherwise prohibiting or making illegal the consummation of the Merger, unless the failure to obtain a Requisite Regulatory Approval shall be due to the failure of the party seeking to terminate this Agreement to
perform or observe the obligations, covenants and agreements of such party set forth herein;
(c) by either the Huntington Parties or Cadence if the Merger shall
not have been consummated on or before the first anniversary of the date of this Agreement (the “Termination Date”), unless the failure of the Closing to occur by such date shall be due to the failure of the party seeking to terminate this
Agreement to perform or observe the obligations, covenants and agreements of such party set forth herein; provided, however, that if the conditions to the Closing set forth in Section 7.1(e) have not been satisfied or waived on or
prior to such date but all other conditions to the Closing set forth in Article VII have been satisfied or waived (other than those conditions that by their nature can only be satisfied at the Closing (so long as such conditions are reasonably
capable of being satisfied)), the Termination Date may be extended by either the Huntington Parties or Cadence to a date that is fifteen (15) months after the date of this Agreement, unless the failure of the Closing to occur by the Termination Date
shall be due to the failure of the party seeking to extend the Termination Date to perform or observe the obligations, covenants and agreements of such party set forth herein, and such date, as so extended, shall be the “Termination Date”;
(d) by either the Huntington Parties or Cadence (provided,
that the terminating party is not then in material breach of any representation, warranty, obligation, covenant or other agreement contained herein) if there shall have been a breach of any of the obligations, covenants or agreements or any of the
representations or warranties (or any such representation or warranty shall cease to be true) set forth in this Agreement on the part of Cadence, in the case of a termination by the Huntington Parties, or the Huntington Parties, in the case of a
termination by Cadence, which breach or failure to be true, either individually or in the aggregate with all other breaches by such party (or failures of such representations or warranties to be true), would constitute, if occurring or continuing on
the Closing Date, the failure of a condition set forth in Section 7.2, in the case of a termination by the Huntington Parties, or Section 7.3, in the case of a termination by Cadence, and which is not cured by the earlier of the Termination Date and
45 days following written notice to Cadence, in the case of a termination by the Huntington Parties, or the Huntington Parties, in the case of a termination by Cadence, or by its nature or timing cannot be cured during such period;
(e) by the Huntington Parties, prior to such time as the Requisite
Cadence Vote is obtained, if Cadence or the Board of Directors of Cadence (i) withholds, withdraws, modifies or qualifies in a manner adverse to the Huntington Parties the Cadence Board Recommendation, (ii) fails to make the Cadence Board
Recommendation in the Joint Proxy Statement, (iii) adopts, approves, recommends or endorses a Cadence Acquisition Proposal or publicly announces an intention to adopt, approve, recommend or endorse a Cadence Acquisition Proposal, (iv) fails to
publicly and without qualification (A) recommend against any Cadence Acquisition Proposal or (B) reaffirm the Cadence Board Recommendation, in each case within ten (10) business days (or such fewer number of days as remains prior to the Cadence
Meeting) after a Cadence Acquisition Proposal is made public or any request by the Huntington Parties to do so, or (v) materially breaches its obligations under Section 6.3 or Section 6.14; or
(f) by Cadence, prior to such time as the Requisite Huntington Vote
is obtained, if Huntington or the Board of Directors of Huntington (i) withholds, withdraws, modifies or qualifies in a manner adverse to Cadence the Huntington Board Recommendation, (ii) fails to make the Huntington Board Recommendation in the Joint
Proxy Statement, (iii) adopts, approves, recommends or endorses a Huntington Acquisition Proposal or publicly announces an intention to adopt, approve, recommend or endorse a Huntington Acquisition Proposal, (iv) fails to publicly and without
qualification (A) recommend against any Huntington Acquisition Proposal or (B) reaffirm the Huntington Board Recommendation, in each case within ten (10) business days (or such fewer number of days as remains prior to the Huntington Meeting) after a
Huntington Acquisition Proposal is made public or any request by Cadence to do so or (v) materially breaches its obligations under Section 6.4.
The party desiring to terminate this Agreement pursuant to clause (b),
(c), (d), (e) or (f) of this Section 8.1 shall give written notice of such termination to the other party in accordance with Section 9.5, specifying the provision or provisions hereof pursuant to which such termination is effected.
8.2 Effect of Termination.
(a) In the event of termination of this Agreement by either the
Huntington Parties or Cadence as provided in Section 8.1, this Agreement shall forthwith become void and have no effect, and none of Huntington, Cadence, any of their respective Subsidiaries or any of the officers or directors of any of them shall
have any liability of any nature whatsoever hereunder, or in connection with the transactions contemplated hereby, except that (i) Section 6.2(b) and this Section 8.2 and Article IX (other than Section 9.13) shall survive any termination of this
Agreement, and (ii) notwithstanding anything to the contrary contained in this Agreement, neither the Huntington Parties nor Cadence shall be relieved or released from any liabilities or damages arising out of its fraud or Willful Breach of any
provision of this Agreement occurring prior to termination (which, in the case of Cadence, shall include the loss to the holders of its capital stock and of Cadence Equity Awards of the economic benefits of the Merger (including the loss of premium
offered to the shareholders of Cadence), it being understood that Cadence shall be entitled to pursue damages for such losses and to enforce the right to recover such losses on behalf of its shareholders and the holders of Cadence Equity Awards in
its sole and absolute discretion, and any amounts received by Cadence in connection therewith may be retained by Cadence). “Willful Breach” shall mean a material breach of, or material failure to perform any of the covenants or other
agreements contained in this Agreement, that is a consequence of an act or failure to act by the breaching or non-performing party with actual knowledge that such party’s act or failure to act would, or would reasonably be expected to, result in or
constitute such breach of or such failure of performance under this Agreement.
(b) (i) In the event that after the date of this Agreement
and prior to the termination of this Agreement, a bona fide Cadence Acquisition Proposal shall have been communicated to or otherwise made known to the Board of Directors or senior management of Cadence or shall have been made directly to
its shareholders generally or any person shall have publicly announced (and not withdrawn at least two (2) business days prior to the Cadence Meeting) a Cadence Acquisition Proposal with respect to Cadence and (A) (x) thereafter this Agreement is
terminated by either the Huntington Parties or Cadence pursuant to Section 8.1(c) without the Requisite Cadence Vote having been obtained (and all other conditions set forth in Sections 7.1 and 7.3 had been satisfied or were capable of being
satisfied prior to such termination) or (y) thereafter this Agreement is terminated by the Huntington Parties pursuant to Section 8.1(d) as the result of a Willful Breach, and (B) prior to the date that is twelve (12) months after the date of such
termination, Cadence enters into a definitive agreement or consummates a transaction with respect to a Cadence Acquisition Proposal (whether or not the same Cadence Acquisition Proposal as that referred to above), then Cadence shall, on the earlier
of the date it enters into such definitive agreement and the date of consummation of such transaction, pay Huntington, by wire transfer of same day funds, a fee equal to $296,000,000 (the “Termination Fee”); provided, that for purposes
of this Section 8.2(b)(i), all references in the definition of Cadence Acquisition Proposal to “25%” shall instead refer to “50%”.
(ii) In the event that this Agreement is terminated by the
Huntington Parties pursuant to Section 8.1(e), then Cadence shall pay Huntington, by wire transfer of same day funds, the Termination Fee as promptly as reasonably practicable after the date of termination (and in any event, within three (3) business
days thereafter).
(c) (i) In the event that after the date of this Agreement
and prior to the termination of this Agreement, a bona fide Huntington Acquisition Proposal shall have been communicated to or otherwise made known to the Board of Directors or senior management of Huntington or shall have been made directly
to its shareholders generally or any person shall have publicly announced (and not withdrawn at least two (2) business days prior to the Huntington Meeting) a Huntington Acquisition Proposal with respect to Huntington and (A) (x) thereafter this
Agreement is terminated by either Cadence or the Huntington Parties pursuant to Section 8.1(c) without the Requisite Huntington Vote having been obtained (and all other conditions set forth in Sections 7.1 and 7.2 had been satisfied or were capable
of being satisfied prior to such termination) or (y) thereafter this Agreement is terminated by Cadence pursuant to Section 8.1(d) as a result of a Willful Breach, and (B) prior to the date that is twelve (12) months after the date of such
termination, Huntington enters into a definitive agreement or consummates a transaction with respect to a Huntington Acquisition Proposal (whether or not the same Huntington Acquisition Proposal as that referred to above), then Huntington shall, on
the earlier of the date it enters into such definitive agreement and the date of consummation of such transaction, pay Cadence, by wire transfer of same day funds, a fee equal to the Termination Fee; provided, that for purposes of this
Section 8.2(c)(i), all references in the definition of Huntington Acquisition Proposal to “25%” shall instead refer to “50%”.
(ii) In the event that this Agreement is
terminated by Cadence pursuant to Section 8.1(f), then Huntington shall pay Cadence, by wire transfer of same day funds, the Termination Fee as promptly as reasonably practicable after the date of termination (and in any event, within three (3)
business days thereafter).
(iii) As used in this Agreement, “Huntington
Acquisition Proposal” shall mean, other than the transactions contemplated by this Agreement, any offer, inquiry or proposal relating to, or any third party indication of interest in, (i) any acquisition or purchase, direct or indirect, of 25%
or more of the consolidated assets of Huntington and its Subsidiaries or 25% or more of any class of equity or voting securities of Huntington or its Subsidiaries whose assets, individually or in the aggregate, constitute 25% or more of the
consolidated assets of Huntington, (ii) any tender offer or exchange offer that, if consummated, would result in such third party beneficially owning 25% or more of any class of equity or voting securities of Huntington or its Subsidiaries whose
assets, individually or in the aggregate, constitute 25% or more of the consolidated assets of Huntington, or (iii) a merger, consolidation, share exchange or other business combination, reorganization or similar transaction involving Huntington or
its Subsidiaries whose assets, individually or in the aggregate, constitute 25% or more of the consolidated assets of Huntington.
(d) Notwithstanding anything to the contrary herein, but without
limiting Section 8.2(e) or the right of any party to recover liabilities or damages arising out of the other party’s fraud or Willful Breach of any provision of this Agreement, the maximum aggregate amount of fees, liabilities or damages payable by
Cadence or the Huntington Parties under this Section 8.2 shall be equal to the Termination Fee. In no event shall Cadence or the Huntington Parties be required to pay the Termination Fee on more than one occasion.
(e) Each of the Huntington Parties and Cadence acknowledge that the
agreements contained in this Section 8.2 are an integral part of the transactions contemplated by this Agreement, and that, without these agreements, the other party would not enter into this Agreement; accordingly, if either party fails promptly to
pay the amount due pursuant to this Section 8.2, and, in order to obtain such payment, the other party commences a suit which results in a judgment against the non-paying party for the Termination Fee or any portion thereof, such non-paying party
shall pay the costs and expenses of the other party (including reasonable attorneys’ fees and expenses) in connection with such suit. In addition, if Cadence or the Huntington Parties, as the case may be, fails to pay the amounts payable pursuant to
this Section 8.2, then such party shall pay interest on such overdue amounts (for the period commencing as of the date that such overdue amount was originally required to be paid and ending on the date that such overdue amount is actually paid in
full) at a rate per annum equal to the “prime rate” (as announced by JPMorgan Chase & Co. or any successor thereto) in effect on the date on which such payment was required to be made for the period commencing as of the date that such overdue
amount was originally required to be paid. The amounts payable by Cadence and the Huntington Parties pursuant to Section 8.2(b) and Section 8.2(c), respectively, and this Section 8.2(e), constitute liquidated damages and not a penalty, and, except in
the case of fraud or Willful Breach, shall be the sole monetary remedy of the other party in the event of a termination of this Agreement specified in such applicable section.
ARTICLE IX
GENERAL PROVISIONS
9.1 Nonsurvival of Representations,
Warranties and Agreements. None of the representations, warranties, covenants and agreements in this Agreement or in any instrument delivered pursuant to this Agreement (other than the Confidentiality Agreement, which shall survive in
accordance with its terms) shall survive the Effective Time, except for Section 6.9 and for those other covenants and agreements contained herein and therein which by their terms apply or are to be performed in whole or in part after the Effective
Time.
9.2 Amendment. Subject to compliance with
applicable law, this Agreement may be amended by the parties hereto at any time before or after the receipt of the Requisite Cadence Vote or the Requisite Huntington Vote; provided, however, that after the receipt of the Requisite
Cadence Vote or the Requisite Huntington Vote, there may not be, without further approval of such shareholders of Cadence or Huntington, as applicable, any amendment of this Agreement that requires such further approval under applicable law. This
Agreement may not be amended, modified or supplemented in any manner, whether by course of conduct or otherwise, except by an instrument in writing signed on behalf of each of the parties.
9.3 Extension; Waiver. At any time prior
to the Effective Time, the parties hereto may, to the extent legally allowed, (a) extend the time for the performance of any of the obligations or other acts of the other party hereto, (b) waive any inaccuracies in the representations and warranties
of the other party contained herein or in any document delivered by the other party pursuant hereto, and (c) waive compliance with any of the agreements or satisfaction of any conditions for its benefit contained herein; provided, however,
that after the receipt of the Requisite Cadence Vote or the Requisite Huntington Vote, there may not be, without further approval of such shareholders of Cadence or Huntington, as applicable, any extension or waiver of this Agreement or any portion
thereof that requires such further approval under applicable law. Any agreement on the part of a party hereto to any such extension or waiver shall be valid only if set forth in a written instrument signed on behalf of such party, but such extension
or waiver or failure to insist on strict compliance with an obligation, covenant, agreement or condition shall not operate as a waiver of, or estoppel with respect to, any subsequent or other failure.
9.4 Expenses. Except (a) with respect to
costs and expenses of printing and mailing the Joint Proxy Statement and all filing and other fees paid to the SEC and any other Governmental Entity in connection with the Merger and the other transactions contemplated hereby, which shall be borne
equally by the Huntington Parties and Cadence, and (b) as otherwise expressly provided in this Agreement, including in Section 8.2, all fees and expenses incurred in connection with this Agreement and the transactions contemplated hereby shall be
paid by the party incurring such fees or expenses, whether or not the Merger is consummated.
9.5 Notices. All notices, requests,
claims, demands and other communications under this Agreement shall be in writing and shall be deemed to have been given (a) when delivered by hand (with written confirmation of receipt), (b) when received by the addressee if sent by a nationally
recognized overnight courier (receipt requested), (c) on the date sent by e-mail if sent during normal business hours of the recipient, and on the next business day if sent after normal business hours of the recipient, provided that no “error”
message or other notification of non-delivery is generated, or (d) on the third day after the date mailed, by certified or registered mail, return receipt requested, postage prepaid. Such communications must be sent to the respective parties at the
following addresses (or at such other address for a party as shall be specified by like notice):
| |
if to Cadence, to: |
| |
|
| |
Cadence Bank |
| |
One Mississippi Plaza |
| |
201 South Spring Street |
| |
Tupelo, Mississippi 38804 |
| |
Attention: |
Dan Rollins |
| |
E-mail: |
[redacted] |
| |
With copies (which shall not constitute notice) to: |
| |
|
| |
Cadence Bank |
| |
1333 West Loop South, Suite 1800 |
| |
Houston, Texas 77027 |
| |
Attention: |
Shanna Kuzdzal |
| |
Email: |
[redacted] |
| |
Sullivan & Cromwell LLP |
| |
125 Broad Street |
| |
New York, NY 10004 |
| |
Attention: |
H. Rodgin Cohen and Mitchell S. Eitel |
| |
E-mail: |
[redacted] |
and
| |
if to Huntington or Huntington National Bank, to: |
| |
|
| |
Huntington Bancshares Incorporated |
| |
41 South High Street |
| |
Columbus, OH 43287 |
| |
Attention: |
Marcy C. Hingst, General Counsel |
| |
E-mail: |
[redacted] |
| |
With a copy (which shall not constitute notice) to: |
| |
|
| |
Wachtell, Lipton, Rosen & Katz |
| |
51 W. 52nd Street |
| |
New York, NY 10019 |
| |
Attention: |
Edward D. Herlihy, Nicholas G. Demmo and Brandon C. Price |
| |
E-mail: |
[redacted] |
9.6 Interpretation. The parties have
participated jointly in negotiating and drafting this Agreement. In the event that an ambiguity or a question of intent or interpretation arises, this Agreement shall be construed as if drafted jointly by the parties, and no presumption or burden of
proof shall arise favoring or disfavoring any party by virtue of the authorship of any provision of this Agreement. When a reference is made in this Agreement to Articles, Sections, Exhibits or Schedules, such reference shall be to an Article or
Section of or Exhibit or Schedule to this Agreement unless otherwise indicated. The table of contents and headings contained in this Agreement are for reference purposes only and shall not affect in any way the meaning or interpretation of this
Agreement. Whenever the words “include,” “includes” or “including” are used in this Agreement, they shall be deemed to be followed by the words “without limitation.” The word “or” shall not be exclusive. References to “the date hereof” shall mean the
date of this Agreement. As used in this Agreement, the “knowledge” of Cadence means the actual knowledge of any of the officers of Cadence listed on Section 9.6 of the Cadence Disclosure Schedule, and the “knowledge” of the Huntington
Parties means the actual knowledge of any of the officers of the Huntington Parties listed on Section 9.6 of the Huntington Disclosure Schedule. As used herein, (a) “business day” means any day other than a Saturday, a Sunday or a day on which
banks in New York, New York, Columbus, Ohio or Tupelo, Mississippi are authorized by law or executive order to be closed, (b) the term “person” means any individual, corporation (including not-for-profit), general or limited partnership,
limited liability company, joint venture, estate, trust, association, organization, Governmental Entity or other entity of any kind or nature, (c) an “affiliate” of a specified person is any person that directly or indirectly controls, is
controlled by, or is under common control with, such specified person, (d) the term “made available” means any document or other information that was (i) provided by one party or its representatives to the other party and its representatives
prior to the date hereof, (ii) included in the virtual data room of a party prior to the date hereof, (iii) filed by Huntington with the SEC and publicly available on EDGAR prior to the date hereof or (iv) filed by Cadence with the FDIC or the
Federal Reserve and publicly available prior to the date hereof and (e) references to a party’s shareholders shall mean, in the case of Huntington, its shareholders. The Cadence Disclosure Schedule and the Huntington Disclosure Schedule, as well as
all other schedules and all exhibits hereto, shall be deemed part of this Agreement and included in any reference to this Agreement. All references to “dollars” or “$” in this Agreement are to United States dollars. This Agreement shall not be
interpreted or construed to require any person to take any action, or fail to take any action, if to do so would violate any applicable law.
9.7 Confidential Supervisory Information.
No disclosure, representation or warranty shall be made (or any other action taken) pursuant to this Agreement that would involve the disclosure of confidential supervisory information (including confidential supervisory information as defined in 12
C.F.R. § 261.2(b) and as identified in 12 C.F.R. § 4.32(b)) of a Governmental Entity by any party hereto to the extent prohibited by applicable law, and, to the extent legally permissible, appropriate substitute disclosures or actions shall be made
or taken under circumstances in which the limitations of this sentence apply.
9.8 Counterparts. This Agreement may be
executed in counterparts (including by electronic means), all of which shall be considered one and the same agreement and shall become effective when counterparts have been signed by each of the parties and delivered to the other parties, it being
understood that all parties need not sign the same counterpart.
9.9 Entire Agreement. This Agreement
(including the documents and the instruments referred to herein) together with the Confidentiality Agreement constitutes the entire agreement among the parties and supersedes all prior agreements and understandings, both written and oral, among the
parties with respect to the subject matter hereof.
9.10 Governing Law; Jurisdiction.
(a) This Agreement shall be governed by and construed in accordance
with the laws of the State of Delaware, without regard to any applicable conflicts of law principles (except that matters relating to the fiduciary duties of the Board of Directors of Cadence shall be subject to the laws of the State of Mississippi
and matters relating to the fiduciary duties of the Board of Directors of Huntington shall be subject to the laws of the State of Maryland).
(b) Each party agrees that it will bring any action or proceeding
in respect of any claim arising out of or related to this Agreement or the transactions contemplated hereby exclusively in the Delaware Court of Chancery and any state appellate court therefrom within the State of Delaware or, if the Delaware Court
of Chancery declines to accept jurisdiction over a particular matter, any federal or state court of competent jurisdiction located in the State of Delaware (the “Chosen Courts”), and, solely in connection with claims arising under this
Agreement or the transactions that are the subject of this Agreement, (i) irrevocably submits to the exclusive jurisdiction of the Chosen Courts, (ii) waives any objection to laying venue in any such action or proceeding in the Chosen Courts, (iii)
waives any objection that the Chosen Courts are an inconvenient forum or do not have jurisdiction over any party and (iv) agrees that service of process upon such party in any such action or proceeding will be effective if notice is given in
accordance with Section 9.5.
9.11 Waiver of Jury Trial. EACH PARTY
ACKNOWLEDGES AND AGREES THAT ANY CONTROVERSY WHICH MAY ARISE UNDER THIS AGREEMENT IS LIKELY TO INVOLVE COMPLICATED AND DIFFICULT ISSUES, AND THEREFORE EACH SUCH PARTY HEREBY IRREVOCABLY AND UNCONDITIONALLY WAIVES, TO THE FULLEST EXTENT PERMITTED BY
APPLICABLE LAW, ANY RIGHT SUCH PARTY MAY HAVE TO A TRIAL BY JURY IN RESPECT OF ANY SUIT, ACTION OR OTHER PROCEEDING DIRECTLY OR INDIRECTLY ARISING OUT OF OR RELATING TO THIS AGREEMENT OR THE TRANSACTIONS CONTEMPLATED BY THIS AGREEMENT. EACH PARTY
CERTIFIES AND ACKNOWLEDGES THAT: (I) NO REPRESENTATIVE, AGENT OR ATTORNEY OF ANY OTHER PARTY HAS REPRESENTED, EXPRESSLY OR OTHERWISE, THAT SUCH OTHER PARTY WOULD NOT, IN THE EVENT OF ANY SUIT, ACTION OR OTHER PROCEEDING, SEEK TO ENFORCE THE FOREGOING
WAIVER, (II) EACH PARTY UNDERSTANDS AND HAS CONSIDERED THE IMPLICATIONS OF THIS WAIVER, (III) EACH PARTY MAKES THIS WAIVER VOLUNTARILY, AND (IV) EACH PARTY HAS BEEN INDUCED TO ENTER INTO THIS AGREEMENT BY, AMONG OTHER THINGS, THE MUTUAL WAIVERS AND
CERTIFICATIONS IN THIS SECTION 9.11.
9.12 Assignment; Third-Party Beneficiaries.
Neither this Agreement nor any of the rights, interests or obligations hereunder shall be assigned by any of the parties hereto (whether by operation of law or otherwise) without the prior written consent of the other party. Any purported assignment
in contravention hereof shall be null and void. Subject to the preceding sentence, this Agreement will be binding upon, inure to the benefit of and be enforceable by the parties and their respective successors and assigns. Except as otherwise
specifically provided in Section 6.9, which is intended to benefit each Cadence Indemnified Party and his or her heirs and representatives, this Agreement (including the documents and instruments referred to herein) is not intended to and does not
confer upon any person other than the parties hereto any rights or remedies hereunder, including the right to rely upon the representations and warranties set forth herein. The representations and warranties in this Agreement are the product of
negotiations among the parties hereto and are for the sole benefit of the parties. Any inaccuracies in such representations and warranties are subject to waiver by the parties hereto in accordance herewith without notice or liability to any other
person. In some instances, the representations and warranties in this Agreement may represent an allocation among the parties hereto of risks associated with particular matters regardless of the knowledge of any of the parties hereto. Consequently,
persons other than the parties may not rely upon the representations and warranties in this Agreement as characterizations of actual facts or circumstances as of the date of this Agreement or as of any other date. Except as provided in Section 6.9,
notwithstanding any other provision in this Agreement to the contrary, no consent, approval or agreement of any third-party beneficiary will be required to amend, modify or waive any provision of this Agreement.
9.13 Specific Performance. The parties
hereto agree that irreparable damage would occur if any provision of this Agreement were not performed in accordance with its specific terms or were otherwise breached. Accordingly, the parties shall be entitled to specific performance of the terms
of this Agreement, including an injunction or injunctions to prevent breaches of this Agreement or to enforce specifically the performance of the terms and provisions hereof (including the parties’ obligation to consummate the Merger), in addition to
any other remedy to which they are entitled at law or in equity. Each of the parties hereby further waives (a) any defense in any action for specific performance that a remedy at law would be adequate and (b) any requirement under any law to post
security or a bond as a prerequisite to obtaining equitable relief.
9.14 Severability. Whenever possible,
each provision or portion of any provision of this Agreement shall be interpreted in such manner as to be effective and valid under applicable law, but if any provision or portion of any provision of this Agreement is held to be invalid, illegal or
unenforceable in any respect under any applicable law or rule in any jurisdiction, such invalidity, illegality or unenforceability shall not affect any other provision or portion of any provision in such jurisdiction, and this Agreement shall be
reformed, construed and enforced in such jurisdiction such that the invalid, illegal or unenforceable provision or portion thereof shall be interpreted to be only so broad as is enforceable.
9.15 Delivery by Electronic Transmission.
This Agreement and any signed agreement or instrument entered into in connection with this Agreement, and any amendments or waivers hereto or thereto, to the extent signed and delivered by e-mail delivery of a “.pdf” format data file, shall be
treated in all manner and respects as an original agreement or instrument and shall be considered to have the same binding legal effect as if it were the original signed version thereof delivered in person. No party hereto or to any such agreement or
instrument shall raise the use of e-mail delivery of a “.pdf” format data file to deliver a signature to this Agreement or any amendment hereto or the fact that any signature or agreement or instrument was transmitted or communicated through e-mail
delivery of a “.pdf” format data file as a defense to the formation of a contract and each party hereto forever waives any such defense.
[Signature Pages Follow]
IN WITNESS WHEREOF, the parties hereto have caused this Agreement to be executed by their
respective officers thereunto duly authorized as of the date first above written.
| |
HUNTINGTON BANCSHARES INCORPORATED |
| |
|
| |
By: |
/s/Stephen D. Steinour |
| |
Name: |
Stephen D. Steinour |
| |
Title: |
Chairman, President and Chief Executive Officer |
| |
THE HUNTINGTON NATIONAL BANK |
| |
|
| |
By: |
/s/Stephen D. Steinour |
| |
Name: |
Stephen D. Steinour |
| |
Title: |
President and Chief Executive Officer |
| |
CADENCE BANK |
| |
|
|
| |
By: |
/s/James D. Rollins III |
| |
Name: |
James D. Rollins III |
| |
Title: |
Chairman & CEO |
EXHIBIT A
FORM OF ARTICLES SUPPLEMENTARY
FORM OF ARTICLES SUPPLEMENTARY
DESIGNATING THE RIGHTS AND PREFERENCES
OF
5.50% SERIES [L] NON-CUMULATIVE PERPETUAL PREFERRED STOCK,
PAR VALUE $0.01 PER SHARE
OF
HUNTINGTON BANCSHARES INCORPORATED
HUNTINGTON BANCSHARES INCORPORATED, a Maryland
corporation (hereinafter called the “Corporation”), hereby certifies to the State Department of Assessments and Taxation of Maryland that:
FIRST: Under a power contained in Article Fifth of
the charter of the Corporation (the “Charter”), the board of directors of the Corporation (the “Board of Directors”) [and a duly authorized committee thereof (the “Committee”)], by duly adopted resolutions, classified and
designated 6,900 shares of the authorized but unissued serial preferred stock of the Corporation, par value $0.01 per share (the “Preferred Stock”), as 5.50% Series [L] Non-Cumulative Perpetual Preferred Stock, par value $0.01 per share, with
the following preferences and rights, voting powers, restrictions, limitations as to dividends and other distributions, qualifications and terms and conditions of redemption, which, upon any restatement of the Charter, shall become part of Article
Fifth of the Charter, with any necessary or appropriate renumbering or relettering of the sections or subsections hereof.
(a) Designation. The designation of the
Preferred Stock shall be “5.50% Series [L] Non-Cumulative Perpetual Preferred Stock” (the “Series [L] Preferred Stock”). With respect to payment of dividends and rights upon the Corporation’s liquidation, dissolution or winding up, the Series
[L] Preferred Stock shall rank (i) senior to the Corporation’s common stock, par value $0.01 per share (the “Common Stock”), and any other class or series of the Preferred Stock that, by its terms, ranks junior to the Series [L] Preferred
Stock, (ii) equally with the Corporation’s Floating Rate Series B Non-Cumulative Perpetual Preferred Stock, par value $0.01 per share and liquidation value per share of $1,000, 5.625% Series F Non-Cumulative Perpetual Preferred Stock, par value $0.01
per share and liquidation value per share of $100,000, 4.450% Series G Non- Cumulative Perpetual Preferred Stock, par value $0.01 per share and liquidation value per share of $100,000, 4.500% Series H Non-Cumulative Perpetual Preferred Stock, par
value $0.01 per share and liquidation value per share of $1,000, 5.70% Series I Non-Cumulative Perpetual Preferred Stock, par value $0.01 per share and liquidation value per share of $25,000, 6.875% Series J Non-Cumulative Perpetual Preferred Stock,
par value $0.01 per share and liquidation value per shares of $1,000, 6.250% Series K Non-Cumulative Perpetual Preferred Stock, par value $0.01 per share and liquidation value per share of $100,000 and any future class or series of the Preferred
Stock that does not by its terms rank junior or senior to the Series [L] Preferred Stock, and (iii) junior to all existing and future indebtedness and other liabilities of the Corporation and any class or series of the Preferred Stock that expressly
provides in the articles supplementary creating such class or series of the Preferred Stock that it ranks senior to the Series [L] Preferred Stock (subject to any requisite consents prior to issuance).
(b) Number of Shares. The number of
authorized shares of Series [L] Preferred Stock shall be 6,900, which number may, from time to time, be increased (but not in excess of the total number of authorized shares of the Preferred Stock) or decreased (but not below the number of shares of
Series [L] Preferred Stock then outstanding) by further resolution duly adopted by the Board of Directors (or a duly authorized committee thereof). The Corporation may, from time to time, and without notice to, consent of or additional action by
holders of shares of the Series [L] Preferred Stock, issue additional shares of Series [L] Preferred Stock; provided that if the additional shares are not fungible for U.S. federal income tax purposes with the initial shares of such series,
the additional shares shall be issued under a separate CUSIP number. The additional shares would form a single series together with all previously issued shares of Series [L] Preferred Stock.
(c) Definitions. As used herein with
respect to Series [L] Preferred Stock:
(i) “Business Day” shall mean any
weekday in New York, New York that is not a day on which banking institutions in such city are authorized or required by applicable law, regulation, or executive order to be closed.
(ii) “Dividend Payment Dates” shall
have the meaning set forth in Section (d)(ii) hereof.
(iii) “Dividend Period” shall mean
the period from, and including, each Dividend Payment Date to, but excluding, the next succeeding Dividend Payment Date except for the initial Dividend Period which shall be the period from, and including, [●]1 to, but excluding, the next succeeding Dividend Payment Date.
(iv) “Junior Stock” shall mean the
Common Stock and any other class or series of the Corporation’s capital stock over which the Series [L] Preferred Stock has preference or priority in the payment of dividends and rights on the liquidation, dissolution or winding up of the
Corporation.
(v) “Liquidation Preference” shall
mean $25,000.00 per share of Series [L] Preferred Stock.
(vi) “Nonpayment” shall have the
meaning set forth in Section (g)(ii) hereof.
(vii) “Optional Redemption” shall
have the meaning set forth in Section (f)(i) hereof.
1 To be
the most recent Dividend Payment Date prior to closing (subject to adjustment if the closing occurs between a record date and Dividend Payment Date).
(viii) “Parity Stock” shall mean any
class or series of the Corporation’s capital stock that ranks on parity with the Series [L] Preferred Stock in the payment of dividends and rights on the liquidation, dissolution or winding up of the Corporation.
(ix) “Preferred Stock Directors”
shall have the meaning set forth in Section (g)(ii) hereof.
(x) “Redemption Price” shall have
the meaning set forth in Section (f)(iii) hereof.
(xi) “Regulatory Capital Treatment
Event” shall mean a good faith determination by the Board of Directors that, as a result of any (A) amendment to, clarification of, or change (including any announced prospective change) in, the laws or regulations of the United States or any
political subdivision of or in the United States that is enacted or becomes effective after the initial issuance of the Series [L] Preferred Stock; (B) proposed change in those laws or regulations that is announced or becomes effective after the
initial issuance of the Series [L] Preferred Stock; or (C) official administrative decision or judicial decision or administrative action or other official pronouncement interpreting or applying those laws or regulations that is announced or becomes
effective after the initial issuance of the Series [L] Preferred Stock, there is more than an insubstantial risk that the Corporation shall not be entitled to treat the full liquidation value of the Series [L] Preferred Stock then outstanding as
“Tier 1 Capital” (or its equivalent) for purposes of the capital adequacy laws or regulations of the Federal Deposit Insurance Corporation (or, as and if applicable, the capital adequacy laws or regulations of any successor appropriate federal
banking agency), as then in effect and applicable, for as long as any share of Series [L] Preferred Stock is outstanding.
(xii) “Regulatory Event Redemption”
shall have the meaning set forth in Section f(ii) hereof.
(xiii) “Series [L] Preferred Stock”
shall have the meaning set forth in Section (a) hereof.
(xiv) “Voting Parity Stock” shall
have the meaning set forth in Section (g)(ii) hereof.
(d) Dividends.
(i) Holders of shares of Series [L]
Preferred Stock shall be entitled to receive, only when, as, and if declared by the Board of Directors (or a duly authorized committee thereof), out of assets legally available under applicable law for payment, non-cumulative cash dividends based
upon the Liquidation Preference, and no more, at a rate equal to 5.50% per annum, for each quarterly Dividend Period occurring from, and including, [●]2.
2 To be
the most recent Dividend Payment Date prior to closing (subject to adjustment if the closing occurs between a record date and Dividend Payment Date).
(ii) When, as, and if declared by the
Board of Directors (or a duly authorized committee thereof), the Corporation shall pay cash dividends on the shares of Series [L] Preferred Stock quarterly, in arrears, on February 20, May 20, August 20 and November 20 of each year (each such date, a
“Dividend Payment Date”), beginning on [●]3, and, when, as and if declared by the Board of Directors (or a duly authorized committee thereof). The Corporation
shall pay cash dividends to the holders of record of shares of the Series [L] Preferred Stock as such holders appear on the Corporation’s stock register on the applicable record date, which shall be the fifteenth (15th) calendar day before
that Dividend Payment Date or such other record date fixed by the Board of Directors (or a duly authorized committee thereof) that is not more than sixty (60) nor less than ten (10) calendar days prior to such Dividend Payment Date.4
(iii) If any Dividend Payment Date is a day
that is not a Business Day, then the dividend with respect to that Dividend Payment Date shall instead be paid on the immediately succeeding Business Day, without interest or other payment in respect of such delayed payment.
(iv) The Corporation shall calculate
dividends on the shares of Series [L] Preferred Stock on the basis of a 360-day year of twelve 30-day months. Dollar amounts resulting from such calculation shall be rounded to the nearest cent, with one-half cent being rounded upward.
(v) Dividends on the shares of Series [L]
Preferred Stock shall not be cumulative or mandatory. If the Board of Directors (or a duly authorized committee thereof) does not declare a dividend on the shares of Series [L] Preferred Stock or if the Board of Directors authorizes and the
Corporation declares less than a full dividend in respect of any Dividend Period, the holders of the shares of Series [L] Preferred Stock will have no right to receive any dividend or a full dividend, as the case may be, for the Dividend Period, and
the Corporation shall have no obligation to pay a dividend or to pay full dividends for that Dividend Period at any time, whether or not dividends on the shares of Series [L] Preferred Stock or any other series of the Preferred Stock or Common Stock
are declared for any future Dividend Period.
(vi) Dividends on the shares of Series [L]
Preferred Stock shall accrue from [●]5 at the dividend rate on the liquidation preference amount of $25,000.00 per share. If the Corporation issues additional shares of
the Series [L] Preferred Stock, dividends on those additional shares shall accrue from the original issue date of those additional shares at the dividend rate.
(vii) So long as any share of Series [L] Preferred Stock remains
outstanding:
A. no dividend shall be declared and paid or set aside for payment
and no distribution shall be declared and made or set aside for payment on any Junior Stock (other than a dividend payable solely in shares of Junior Stock or any dividend in connection with the implementation of a shareholder rights plan or the
redemption or repurchase of any rights under such a plan, including with respect to any successor shareholder rights plan);
3 To be
the first Dividend Payment Date following the closing (subject to adjustment if the closing occurs between a record date and Dividend Payment Date).
4 Subject
to adjustment for first Dividend Payment Date depending on timing of closing.
5 To be
the most recent Dividend Payment Date prior to closing.
B. no shares of Junior Stock shall be
repurchased, redeemed, or otherwise acquired for consideration by the Corporation, directly or indirectly (other than as a result of a reclassification of Junior Stock for or into other Junior Stock, or the exchange for or conversion into Junior
Stock, through the use of the proceeds of a substantially contemporaneous sale of other shares of Junior Stock or pursuant to a contractually binding requirement to buy Junior Stock pursuant to a binding stock repurchase plan existing prior to the
most recently completed Dividend Period), nor shall any monies be paid to or made available for a sinking fund for the redemption of any such securities by the Corporation; and
C. no shares of Parity Stock shall be
repurchased, redeemed or otherwise acquired for consideration by the Corporation (other than pursuant to pro rata offers to purchase all, or a pro rata portion, of the shares of Series [L] Preferred Stock and such Parity Stock, through the use of the
proceeds of a substantially contemporaneous sale of other shares of Parity Stock or Junior Stock, as a result of a reclassification of Parity Stock for or into other Parity Stock, or by conversion into or exchange for Junior Stock),
during a Dividend Period, unless, in each case of
subsections (A), (B) and (C) immediately above, the full dividends for the most recently completed Dividend Period on all outstanding shares of the Series [L] Preferred Stock have been declared and paid in full or declared and a sum sufficient for
the payment of those dividends has been set aside. The foregoing limitations in subsections (A), (B) and (C) immediately above shall not apply to purchases or acquisitions of the Corporation’s Junior Stock pursuant to any employee or director
incentive or benefit plan or arrangement (including any of the Corporation’s employment, severance, or consulting agreements) of the Corporation or of any of the Corporation’s subsidiaries heretofore or hereafter adopted.
(viii) Except as provided below, for so long
as any share of Series [L] Preferred Stock remains outstanding, the Corporation shall not declare, pay, or set aside for payment full dividends on any Parity Stock unless the Corporation has paid in full, or set aside payment in full, in respect of
all unpaid dividends for all Dividend Periods for outstanding shares of Series [L] Preferred Stock. To the extent that the Corporation declares dividends on the shares of Series [L] Preferred Stock and on shares of any Parity Stock but cannot make
full payment of such declared dividends, the Corporation shall allocate the dividend payments on a pro rata basis among the holders of the shares of Series [L] Preferred Stock and the holders of any Parity Stock then outstanding. For purposes of
calculating the pro rata allocation of partial dividend payments, the Corporation shall allocate dividend payments based on the ratio between the then current and the unpaid dividend payments due on the shares of Series [L] Preferred Stock and (A) in
the case of cumulative Parity Stock, the aggregate of the accrued and unpaid dividends due on any such Parity Stock and (2) in the case of non-cumulative Parity Stock, the aggregate of the declared but unpaid dividends due on any such Parity Stock.
No interest shall be payable in respect of any dividend payment on shares of Series [L] Preferred Stock that may be in arrears.
(ix) Subject to the foregoing conditions,
and not otherwise, dividends (payable in cash, stock, or otherwise), as may be determined by the Board of Directors (or a duly authorized committee thereof), may be declared and paid on the Common Stock and any Junior Stock from time to time out of
any funds legally available for such payment, and the holders of the shares of Series [L] Preferred Stock shall not be entitled to participate in such dividends.
(e) Liquidation Rights.
(i) In the event of any voluntary or
involuntary liquidation, dissolution or winding up of the Corporation, the holders of the shares of Series [L] Preferred Stock then outstanding shall be entitled to be paid out of the Corporation’s assets legally available for distribution to the
Corporation’s shareholders, before any distribution of assets is made to holders of Common Stock or any other Junior Stock, a liquidating distribution in the amount equal to the sum of (1) the Liquidation Preference, plus (2) the sum of any declared
and unpaid dividends for prior Dividend Periods prior to the Dividend Period in which the liquidation distribution is made and any declared and unpaid dividends for the then current Dividend Period in which the liquidation distribution is made to the
date of such liquidation distribution. After payment of the full amount of the liquidating distributions to which they are entitled pursuant to the foregoing, the holders of shares of Series [L] Preferred Stock shall have no right or claim to any
remaining assets of the Corporation.
(ii) In the event that, upon any such
voluntary or involuntary liquidation, dissolution or winding up, the available assets of the Corporation are insufficient to pay the amount of the liquidating distributions on all outstanding shares of Series [L] Preferred Stock and the corresponding
amounts payable on all shares of Parity Stock in the distribution of assets upon any liquidation, dissolution or winding up of the Corporation, then the holders of the shares of Series [L] Preferred Stock and such Parity Stock shall share ratably in
any such distribution of assets in proportion to the full liquidating distributions to which they respectively would be entitled.
(iii) For the purposes of this Section (e),
the merger or consolidation of the Corporation with or into any other entity or by another entity with or into the Corporation or the sale, lease, exchange or other transfer of all or substantially all of the assets of the Corporation (for cash,
securities or other consideration) shall not be deemed to constitute the liquidation, dissolution or winding up of the Corporation. If the Corporation enters into any merger or consolidation transaction with or into any other entity and the
Corporation is not the surviving entity in such transaction, shares of the Series [L] Preferred Stock may be converted into shares of the surviving or successor corporation or the direct or indirect parent of the surviving or successor corporation
having terms identical to the terms of the Series [L] Preferred Stock set forth herein.
(f) Redemption Rights.
(i) The Series [L] Preferred Stock is not
subject to any mandatory redemption, sinking fund or other similar provisions. Subject to the terms and conditions of this Section (f), the Corporation may redeem shares of Series [L] Preferred Stock, in whole or in part, at its option, on
any Dividend Payment Date on or after November 20, 2024, with not less than thirty (30) calendar days’ and not more than sixty (60) calendar days’ notice (an “Optional Redemption”), subject to the approval of the appropriate federal banking
agency, at the Redemption Price. Dividends shall not accrue on those shares of Series [L] Preferred Stock so redeemed on and after the applicable redemption date.
(ii) In addition, the Corporation may
redeem shares of Series [L] Preferred Stock, in whole but not in part, at its option, for cash, at any time within ninety (90) calendar days following a Regulatory Capital Treatment Event, subject to the approval of the appropriate federal banking
agency, at the Redemption Price (a “Regulatory Event Redemption”).
(iii) The redemption price for any
redemption of shares of Series [L] Preferred Stock, whether an Optional Redemption or Regulatory Event Redemption, shall be equal to (A) $25,000.00 per share of Series [L] Preferred Stock, plus (B) any declared and unpaid dividends (without regard to
any undeclared dividends) prior to, but excluding, the date of redemption (the “Redemption Price”).
(iv) Any notice given as provided in this Section
(f) shall be conclusively presumed to have been duly given, whether or not the holder receives the notice, and any defect in the notice or in the provision of the notice, to any holder of shares of Series [L] Preferred Stock designated for
redemption will not affect the redemption of any other shares of Series [L] Preferred Stock.
Any notice provided to a holder of shares of
Series [L] Preferred Stock shall be deemed given on the date provided, whether or not the holder actually receives the notice. A notice of redemption shall be given not less than thirty (30) calendar days and not more than sixty (60) calendar prior
to the date of redemption specified in the notice, and shall specify (1) the redemption date, (2) the Redemption Price, (3) if fewer than all shares of Series [L] Preferred Stock are to be redeemed, the number of shares of Series [L] Preferred Stock
to be redeemed and (4) the manner in which holders of shares of Series [L] Preferred Stock called for redemption may obtain payment of the Redemption Price in respect of those shares. Notwithstanding anything to the contrary in this Section (f),
if the Series [L] Preferred Stock (or related depositary shares) is issued in book-entry form through The Depository Trust Company or any other similar facility, notice of redemption may be given to the holders of shares of Series [L] Preferred Stock
at such time and in any manner permitted by such facility.
(v) If notice of redemption of any shares of
Series [L] Preferred Stock has been given by the Corporation and if the funds necessary for such redemption have been set aside by the Corporation in trust for the benefit of the holders of any shares of Series [L] Preferred Stock, then from and
after the redemption date such shares of Series [L] Preferred Stock shall no longer be outstanding for any purpose, all dividends with respect to such shares of Series [L] Preferred Stock shall cease to accrue from the redemption date and all rights
of the holders of such shares shall terminate, except the right to receive the Redemption Price, without interest. Shares of Series [L] Preferred Stock redeemed pursuant to this Section (f) or purchased or otherwise acquired for value by the
Corporation shall, after such acquisition, have the status of authorized and unissued shares of the Preferred Stock and may be reissued by the Corporation at any time as shares of any series of the Preferred Stock other than as Series [L] Preferred
Stock.
(vi) In the event that fewer than all of the outstanding shares
of Series [L] Preferred Stock are to be redeemed, the shares of Series [L] Preferred Stock to be redeemed shall be selected either pro rata or by lot or in such other manner as the Board of Directors (or a duly authorized committee thereof)
determines to be fair and equitable and permitted by the rules of any stock exchange on which the Series [L] Preferred Stock (or related depositary shares) is listed, subject to the provisions hereof. The Board of Directors (or a duly authorized
committee thereof) shall have the full power and authority to prescribe the terms and conditions upon which such shares of Series [L] Preferred Stock may be redeemed from time to time.
(vii) No holder of shares of Series [L]
Preferred Stock shall have the right to require the redemption of the Series [L] Preferred Stock.
(g) Voting Rights.
(i) Holders of shares of Series [L]
Preferred Stock shall not have any voting rights, except as set forth below or as otherwise required by the Maryland General Corporation Law (“MGCL”).
(ii) Whenever dividends payable on the
shares of Series [L] Preferred Stock or any other class or series of the Preferred Stock ranking equally with the Series [L] Preferred Stock as to payment of dividends, and upon which voting rights equivalent to those described in this paragraph have
been conferred and are exercisable, have not been declared and paid in an aggregate amount equal to, as to any class or series, the equivalent of at least six (6) or more quarterly Dividend Periods, whether or not for consecutive Dividend Periods (a
“Nonpayment”), the holders of outstanding shares of the Series [L] Preferred Stock voting as a class with holders of shares of any other series of the Preferred Stock ranking equally with the Series [L] Preferred Stock as to payment of
dividends, and upon which like voting rights have been conferred and are exercisable (“Voting Parity Stock”), shall be entitled to vote for the election of two (2) additional directors of the Board of Directors on the terms set forth in this Section
(g) (and to fill any vacancies in the terms of such directorships) (the “Preferred Stock Directors”). Holders of shares of all series of Voting Parity Stock shall vote as a single class. In the event that the holders of the shares of the
Series [L] Preferred Stock are entitled to vote as described in this Section (g), the number of members of the Board of Directors at that time shall be increased by two (2) directors, and the holders of the shares of Series [L] Preferred
Stock shall have the right, as members of that class, to elect two (2) directors at a special meeting called at the request of the holders of record of at least twenty percent (20%) of the aggregate voting power of the Series [L] Preferred Stock or
any other series of Voting Parity Stock (unless such request is received less than ninety (90) calendar days before the date fixed for the Corporation’s next annual or special meeting of the shareholders, in which event such election shall be held at
such next annual or special meeting of the shareholders), provided that the election of any Preferred Stock Directors shall not cause the Corporation to violate the corporate governance requirements of the NASDAQ (or any other exchange on
which the securities of the Corporation may at such time be listed) that listed companies must have a majority of independent directors, and provided further that at no time shall the Board of Directors include more than two (2) Preferred
Stock Directors.
(iii) The Preferred Stock Directors elected
at any such special meeting shall hold office until the next annual meeting of the Corporation’s shareholders unless they have been previously terminated or removed pursuant to Section (g)(iv). In case any vacancy in the office of a Preferred
Stock Director occurs (other than prior to the initial election of the Preferred Stock Directors), the vacancy may be filled by the written consent of the Preferred Stock Director remaining in office, or, if none remains in office, by the vote of the
holders of the shares of Series [L] Preferred Stock (together with holders of any shares of Voting Parity Stock) to serve until the next annual meeting of the shareholders.
(iv) When the Corporation has paid full
dividends on the Series [L] Preferred Stock for the equivalent of at least four (4) Dividend Periods, following a Nonpayment, then the right of the holders of shares of Series [L] Preferred Stock to elect the Preferred Stock Directors set forth in
this Section (g) shall cease (subject to the continued applicability of the provisions for the vesting of the special voting rights in the case of any future Nonpayment). Upon termination of the right of the holders of shares of the Series
[L] Preferred Stock and Voting Parity Stock to vote for Preferred Stock Directors as set forth in this Section (g), the term of office of all Preferred Stock Directors then in office elected by only those holders shall terminate immediately.
Whenever the term of office of the Preferred Stock Directors ends and the related voting rights have expired, the number of directors automatically will be decreased to the number of directors as otherwise would prevail. Any Preferred Stock Director
may be removed at any time without cause by the holders of record of a majority of the outstanding shares of the Series [L] Preferred Stock (together with holders of any shares of Voting Parity Stock) when they have the voting rights described in Section
(g)(ii).
(v) So long as any shares of Series [L]
Preferred Stock remain outstanding, the Corporation shall not, without the affirmative vote or consent of holders of at least 66 2/3% in voting power of the shares of Series [L] Preferred Stock and any Voting Parity Stock, voting together as a single
class, given in person or by proxy, either in writing without a meeting or at any meeting called for the purpose, authorize, create or issue any shares of capital stock ranking senior to the Series [L] Preferred Stock as to dividends and rights upon
liquidation, dissolution or winding up, or reclassify any authorized capital stock into any such shares of such capital stock or issue any obligation or security convertible into or evidencing the right to purchase any such shares of capital stock.
Further, so long as any shares of the Series [L] Preferred Stock remain outstanding, the Corporation shall not, without the affirmative vote of the holders of at least 66 2/3% in voting power of the Series [L] Preferred Stock, amend, alter or repeal
any provision of the Charter, including by merger, consolidation or otherwise, so as to affect the powers, preferences or special rights of the Series [L] Preferred Stock.
Notwithstanding the foregoing, (a) any increase in the amount of
authorized shares of Common Stock or authorized shares of the Preferred Stock, or any increase or decrease in the number of shares of any series of the Preferred Stock, or the authorization, creation and issuance of other classes or series of capital
stock, in each case ranking on parity with or junior to the shares of the Series [L] Preferred Stock as to dividends and distribution of assets upon liquidation, dissolution or winding up, shall not be deemed to affect such powers, preferences or
special rights, (b) a merger or consolidation of the Corporation with or into another entity in which the shares of the Series [L] Preferred Stock (1) remain outstanding or (2) are converted into or exchanged for preference securities of the
surviving entity or any entity, directly or indirectly, controlling such surviving entity and such new preference securities have powers, preferences and special rights that are not materially less favorable than the Series [L] Preferred Stock shall
not be deemed to affect the powers, preferences or special rights of the Series [L] Preferred Stock and (c) the foregoing voting rights of the holders of Series [L] Preferred Stock shall not apply if, at or prior to the time when the act with respect
to which the vote would otherwise be required shall be effected, all outstanding shares of Series [L] Preferred Stock shall have been redeemed or called for redemption upon proper notice and sufficient funds shall have been set aside by the
Corporation for the benefit of holders of shares of Series [L] Preferred Stock to effect the redemption.
(vi) Notice for a special meeting to elect
the Preferred Stock Directors shall be given in a similar manner to that provided in the Corporation’s Bylaws for a special meeting of the shareholders. If the secretary of the Corporation does not call a special meeting within twenty (20) calendar
days after receipt of any such request, then any holder of shares of Series [L] Preferred Stock may (at the Corporation’s reasonable expense) call such meeting, upon notice as provided in this Section (g)(vi) and, for that purpose, shall have
access to the stock register of the Corporation.
(vii) Except as otherwise set forth in Section
(g)(vi) hereof, the rules and procedures for calling and conducting any meeting of the holders of shares of Series [L] Preferred Stock (including, without limitation, the fixing of a record date in connection therewith), the solicitation and
use of proxies at such a meeting, the obtaining of written consents and any other aspect or matter with regard to such a meeting or such consents shall be governed by any rules that the Board of Directors (or a duly authorized committee thereof), in
its discretion, may adopt from time to time, which rules and procedures shall conform to the requirements of the Charter, the Bylaws of the Corporation, and applicable laws and the rules of any national securities exchange or other trading facility
on which Series [L] Preferred Stock (or related depositary shares) are listed or traded at the time.
(viii) Each holder of shares of Series [L]
Preferred Stock will have one (1) vote per share on any matter on which holders of shares of Series [L] Preferred Stock are entitled to vote.
(h) Conversion Rights. The holders of
shares of Series [L] Preferred Stock shall not have any rights to convert such shares into shares of any other class or series of stock or into any other securities of, or any interest or property in, the Corporation.
(i) No Sinking Fund. No sinking fund
shall be established for the retirement or redemption of shares of Series [L] Preferred Stock.
(j) No Preemptive or Subscription Rights.
No holder of shares of Series [L] Preferred Stock shall, as such holder, have any preemptive right to purchase or subscribe for any additional shares of capital stock of the Corporation or any other security of the Corporation that it may issue or
sell.
(k) Information Rights. During any
period in which the Corporation is not subject to Section 13 or 15(d) of the Exchange Act of 1934 (the “Exchange Act”) and any shares of Series [L] Preferred Stock are outstanding, the Corporation will use its reasonable best efforts to (i)
transmit by mail (or other permissible means under the Exchange Act) to all holders of Series [L] Preferred Stock, as their names and addresses appear on the Corporation’s record books and without cost to such holders, copies of the annual reports on
Form 10-K and quarterly reports on Form 10-Q that the Corporation would have been required to file with the FDIC pursuant to Section 13 or 15(d) of the Exchange Act if the Corporation were subject thereto (other than any exhibits that would have been
required) and (ii) promptly, after receipt of written request, supply copies of such reports to any holders or prospective holder of Series [L] Preferred Stock. The Corporation will use its reasonable best efforts to mail (or otherwise provide) the
information to the holders of the Series [L] Preferred Stock within fifteen (15) days after the respective dates by which a periodic report on Form 10-K or Form 10-Q, as the case may be, in respect of such information would have been required to be
filed with the SEC, if the Corporation were subject to Section 13 or 15(d) of the Exchange Act, in each case, based on the dates on which it would be required to file such periodic reports if the Corporation were a “non-accelerated filer” within the
meaning of the Exchange Act.
(l) Certificates. Shares of Series [L]
Preferred Stock (or related depositary shares) shall be eligible for the Direct Registration System service offered by the Depository Trust Company and may be represented in the form of uncertificated or certificated shares. Shares of Series [L]
Preferred Stock shall be eligible for the Direct Registration System service offered by the Depository Trust Company and may be represented in the form of uncertificated or certificated shares, provided, however, that each holder of Series
[L] Preferred Stock (or related depositary shares) shall be entitled, upon request, to have a certificate for shares of Series [L] Preferred Stock (or related depositary shares) reflecting the number of shares owned by such holder in such form as is
provided under the MGCL and the Corporation’s Amended and Restated Bylaws.
(m) Listing. The Corporation
agrees that for the period of time during which the Series [L] Preferred Stock is outstanding, the Corporation will use its reasonable best efforts to (i) effect within thirty (30) days of issuance and delivery of the Series [L] Preferred Stock (or
related depositary shares) the listing of the Series [L] Preferred Stock (or related depositary shares) on the NASDAQ and (ii) maintain the listing of the Series [L] Preferred Stock (or related depositary shares) on the NASDAQ or another national
securities exchange.
(n) No Other Rights. The shares of
Series [L] Preferred Stock shall not have any designations, preferences or relative, participating, optional or other special rights except as set forth in the Charter or as otherwise required by applicable law, including the MGCL.
SECOND: The Series [L] Preferred Stock has been
classified and designated by the Board of Directors [and the Committee], under the authority contained in the Charter.
THIRD: These Articles Supplementary have been
approved by the Board of Directors [and the Committee] in the manner and by the vote required by law.
FOURTH: These Articles Supplementary shall become effective on [●].
FIFTH: The undersigned Chairman, President and
Chief Executive Officer of the Corporation acknowledges these Articles Supplementary to be the corporate act of the Corporation and, as to all matters or facts required to be verified under oath, the undersigned Officer acknowledges that, to the best
of his knowledge, information and belief, these matters and facts are true in all material respects and that this statement is made under the penalties of perjury.
IN WITNESS WHEREOF, the Corporation has caused these Articles
Supplementary to be signed in its name and on its behalf by its Chairman, President and Chief Executive Officer and attested to by its [●] on this [●] day of [●], [●].
| ATTEST: |
|
HUNTINGTON BANCSHARES INCORPORATED |
| |
|
|
|
|
| By: |
|
|
By: |
|
| Name: |
|
|
Name: |
Stephen D. Steinour |
| Title: |
|
|
Title: |
Chairman, President and Chief Executive Officer |
Exhibit 99.15
BOARD OF GOVENORS OF THE
FEDERAL RESERVE SYSTEM
WASHINGTON, DC 20552
SCHEDULE 14 A
PROXY STATEMENT PURSUANT TO SECTION 14(a) OF THE
SECURITIES EXCHANGE ACT OF 1934
(Amendment No. )
| Filed by the Registrant ☒ |
Filed by a party other than the Registrant ☐ |
Check the appropriate box:
|
☐ |
Preliminary Proxy Statement |
|
☐ |
Confidential, for Use of the Commission Only (as permitted by Rule 14a-6(3)(2)) |
|
☒ |
Definitive Proxy Statement |
|
☐ |
Definitive Additional Materials |
|
☐ |
Soliciting Material Pursuant to §240.14a-12 |
CADENCE BANK
(Exact Name of Registrant as Specified in Charter)
N/A
(Name of Person(s) Filing Proxy Statement, if other than Registrant)
Payment of Filing Fee (Check the Appropriate Box):
|
☐ |
Fee paid previously with preliminary materials |
|
☐ |
Fee computed on table in exhibit required by Item 25(b) per Exchange Act Rules 14a-6(i)(1) and 0-11. |

2025 Notice of
Annual Meeting
and Proxy Statement

March 14, 2025
Dear Fellow Shareholders:
In 2024, our team achieved impressive results,
driven by our vision to help people, companies and communities prosper. Our proven approach led to growth in core customer deposits of $2.2 billion, or 6.9%, for the year, and net organic loan growth of $1.2 billion, or 3.8%. Our disciplined approach
to balance sheet management and operational efficiency drove a 20.7% increase in adjusted pre-tax pre-provision net revenue to $739.0 million, compared to 2023. Additionally, we expanded our net interest margin by 22 basis points to 3.30% and
improved our adjusted efficiency ratio to 58.4%, reflecting meaningfully enhanced operating leverage.
Credit quality remained strong in 2024, with stable
net charge-offs at 0.24% and a 5.9% reduction in criticized loans. We further added to shareholder returns through the repurchase of 1.2 million shares and an 11.5% increase in tangible book value per share, alongside a strengthened capital position.
As we look ahead, we remain focused on sustaining our momentum, supporting our customers and driving long-term growth.
With increased merger and acquisition activity
across the banking industry, we remain well positioned to participate opportunistically in support of our strategies. Backed by a robust organic growth engine, the strength of our geographic footprint and the diversity of our offerings, we are
confident in our ability to drive long -term value for all our stakeholders while remaining disciplined and strategic in our approach. We kicked off 2025 with the signing of a definitive merger agreement with FCB Financial Corp., the bank holding
company for First Chatham Bank, a Savannah, Georgia-based community bank. The merger will expand Cadence’s presence in the rapidly growing Savannah market and coastal Georgia communities.
Investing in our teammates continues to remain a top
priority. We enhanced employee benefits by introducing a student debt retirement plan feature in our 401(k) plan, expanded our wellness initiatives and provided valuable retirement planning resources. We also continue to gather feedback from our
teammates to drive meaningful organizational improvements. As a result of our continued commitment to fostering a workplace culture where our teammates can thrive, we were recognized as one of U.S. News & World Report’s Best Companies to Work For
in 2024-2025. This recognition helps us attract top talent who share our focus on furthering a relationship-focused culture.
This year two directors, Alan W. Perry and Marc J.
Shapiro, will retire from our Board of Directors effective April 23, 2025. Perry, a more than 30-year veteran, has served on the Board since 1991 and chaired the Risk Management Committee from 2016-2023. Shapiro, a founding member of the legacy
Cadence Bancorporation Board, has served on the Board since 2021 and chaired the Executive Compensation and Stock Incentive Committee from 2021-2023. Over the years, each has generously dedicated their time and expertise to our Company, and we
express our sincere gratitude for their invaluable service and contributions.
Earlier this year, we welcomed two new members,
Fernando Araujo and Alice Rodriguez, to our Board of Directors. Araujo, chief executive officer of a publicly traded energy company, is an accomplished executive with more than 30 years of experience in all aspects of oil and gas upstream operations.
Rodriguez spent over 35 years in the commercial banking industry at a large nationwide bank in various executive leadership roles before transitioning to take a more active role in a boutique home builder company she and her husband co-founded.
Following the retirements of Perry and Shapiro, our Board will continue to be composed of 13 directors.
Notably, the Board of Directors amended the
Company’s Articles of Incorporation and its Bylaws to begin declassification of the Board. As a result of this amendment, the Board will be declassified over the course of the annual meeting elections in 2025 and 2026, and beginning in 2027, all
members of the Board will stand for election annually.
On behalf of the Board, we are pleased to invite you
to the 2025 annual meeting of shareholders to be held on April 23, 2025, at 9 a.m. (Central Time). Our meeting will be held virtually via an audio-only format at https://meetnow.global/MNCNDYS to provide our shareholders with an easily
accessible opportunity to attend, limiting the environmental impact of an in-person meeting.
All shareholders of record and beneficial owners as
of February 28, 2025, can access our proxy materials free of charge at the website address outlined in the Notice of Internet Availability of Proxy Materials, mailed on or about March 14, 2025, and in the accompanying Proxy Statement. The decision to
provide our proxy materials online reflects our continued commitment to improving shareholder access to information about Cadence Bank.
Your vote is important to us. Even if you
plan to attend the virtual annual meeting, we encourage you to vote your shares as soon as possible by following the voting instructions provided in the proxy materials. Voting early helps us secure a quorum on the matters submitted for a shareholder
vote and does not preclude you from voting at the meeting.
We remain committed to building long-term value in
the Company, and we appreciate your continued support of Cadence Bank.
| |
Sincerely, |
| |
|
| |
 |
| |
|
| |
James D. “Dan” Rollins III |
| |
Chairman of the Board and |
| |
Chief Executive Officer |
201 South Spring Street
Tupelo, Mississippi 38804
Notice of Annual Meeting of Shareholders
To Be Held April 23, 2025
To the Shareholders of Cadence Bank:
The annual meeting of shareholders of Cadence Bank will be conducted
virtually over the internet using an audio-only format on Wednesday, April 23, 2025 at 9:00 a.m. (Central Time) (the “Annual Meeting”) for the following purposes:
|
(1) |
To elect five directors; |
|
(2) |
To conduct a non-binding, advisory vote on the compensation of our Named Executive Officers; |
|
(3) |
To ratify the appointment of Forvis Mazars, LLP as our independent registered public accounting firm for the year ending December 31, 2024; and |
|
(4) |
To transact such other business as may properly come before the Annual Meeting or any adjournments or postponements thereof. |
The Board of Directors of Cadence Bank has fixed the close of business
on February 28, 2025 as the record date for determining shareholders entitled to notice of and to vote at the Annual Meeting.
Cadence Bank, on behalf of its Board of Directors, is soliciting your
proxy to ensure a quorum is present and your shares are represented and voted at the Annual Meeting. Please see the Notice of Internet Availability of Proxy Materials for information about: (i) electronically accessing our proxy materials, including
the accompanying Proxy Statement, a proxy card and our Annual Report to Shareholders for the year ended December 31, 2024, (ii) giving your proxy authorization via the internet or by telephone and (iii) requesting a paper copy of our proxy materials.
If you subsequently decide to vote at the Annual Meeting, we also provide information about revoking your previously submitted proxy.
Please promptly give your proxy authorization by internet, QR code scan,
telephone or if you request printed proxy materials, complete, sign and return a proxy card to ensure each of your shares are represented and voted.
| March 14, 2025 |
By order of the Board of Directors, |
| |
|
| |
|
| |
|
| |
James D. “Dan” Rollins III |
| |
Chairman of the Board and |
| |
Chief Executive Officer |
The accompanying Proxy Statement, a proxy card and Annual Report to
Shareholders for the year ended December 31, 2024 are available by internet at www.envisionreports.com/CADE.
General
This summary highlights information contained
elsewhere in this Proxy Statement. Please read the entire Proxy Statement carefully before voting as this is only a summary.
Unless the context otherwise requires, references
in this Proxy Statement to “Cadence Bank,” “Cadence,” “the Company,” “we,” “us” and “our” refer to Cadence Bank and its subsidiaries.
Annual Meeting
On Wednesday, April 23, 2025 at 9:00
a.m. (Central Time), the Annual Meeting of Cadence Bank will be conducted virtually over the internet using an audio-only format. After successfully holding our annual meetings virtually the last few years, we will continue to hold our annual
meeting virtually, allowing more access for shareholders and reducing costs and environmental impact.
You may attend and participate in the Annual
Meeting virtually by visiting or clicking the following web address, https://meetnow.global/MNCNDYS, and entering the 15-digit control number found on the Notice of Internet Availability of Proxy Materials (“Notice of Internet Availability”
or “Notice”) you received. Please review the information provided in the Notice, on your proxy card, and in the accompanying instructions. If you hold your shares through an intermediary, such as a bank or broker, you must register in advance
using the instructions in the Notice materials.
You are encouraged to log in to the Annual Meeting
website 15 minutes before the start of the Annual Meeting. The virtual Annual Meeting has been designed to provide you the same information you would otherwise have access to at an in-person meeting. Accordingly, you will be able to vote online until
the polls have closed at the Annual Meeting and will be able to submit questions in writing before or during the Annual Meeting by following the directions posted on the Annual Meeting website at https://meetnow.global/MNCNDYS.
Proxy Statement Summary
| Agenda
and Voting Recommendations |
| Proposal |
Description |
Votes Required |
Board Recommendation |
Page |
| 1 |
Election of five (5) director nominees
to serve on the Board of Directors |
Plurality of votes cast |
FOR each director
nominee |
18 |
| 2 |
Advisory approval of the
compensation of our NEOs |
Plurality of votes cast |
FOR |
86 |
| 3 |
Ratification of appointment of our
Independent(1) Registered Public
Accounting Firm |
Plurality of votes cast |
FOR |
88 |
|
(1) |
See Proposal 3: Ratification of Appointment of Independent Registered Public Accounting Firm Section describing the evaluation of independence. |
| Name |
Age(1) |
Director
Since |
Term
Expires |
Principal
Occupation |
| Fernando
G. Araujo |
57 |
2025 |
2026 |
CEO and director of Berry Corporation; former
COO of Berry Corporation |
| Shannon A. Brown |
68 |
2016 |
2026 |
Former SVP of U.S. Operations Eastern Division, Chief Human Resources and
Diversity Officer for FedEx Express |
| William
G. Holliman |
60 |
2020 |
2026 |
President and co-founder of HomeStretch
Furniture |
| Alice L. Rodriguez |
60 |
2025 |
2026 |
Retired senior executive from JP Morgan Chase & Co. |
| James
D. Rollins III |
66 |
2012 |
2026 |
Chief Executive Officer of Cadence Bank |
|
(1) |
Ages of all directors and executives and officers listed herein are as of the date of the annual meeting, April 23, 2025. |
You may cast your vote in any of the following ways:
 |
|
 |
|
 |
|
 |
| |
|
|
|
|
|
|
| Internet |
|
QR Code |
|
Phone |
|
Mail |
| |
|
|
|
|
|
|
| Visit www.envisionreports.com/CADE and follow the steps outlined on the secure website. |
|
You can scan your individualized QR code to vote with your mobile phone. |
|
Call 1-800-652-VOTE (8683) and follow the instructions provided by the recorded message. |
|
Send your completed and signed proxy card or voter instruction form to the address listed thereon. |
Proxy Statement Summary
2024 Shareholder Engagement
We value the views of our investors and welcome
feedback from them. Our standard shareholder engagement practice is to initiate conversations with our investors throughout the year. These engagement efforts supplement the many calls, conferences, and other shareholder outreach performed by the
Company’s investor relations team throughout the year. In 2024, we again reached out to and met with shareholders in a variety of formats, who were invited to talk to us about corporate strategy, risk management, corporate governance, including
environmental, social and governance issues, and executive compensation, in addition to other topics they wanted to discuss. We discuss our shareholder outreach during this last year in further detail on p. 46 in the section entitled “Shareholder
Outreach and Say-on-Pay Results.” Our frequent engagement with our shareholders provides opportunities to exchange perspectives and information with our shareholders on our policies and practices (consistent with the disclosures made available in our
public filings with the federal banking regulators) and provides us additional opportunities by which to seek input from shareholders to ensure we are addressing their questions and concerns.
The goals of our shareholder engagement include, but
are not limited to: (i) obtaining shareholder insight into our corporate governance, executive compensation, risk management, and other policies and practices, including shareholder priorities and perspectives; (ii) communicating actions undertaken
by the Board of Directors of the Company (the “Board of Directors” or the “Board”) and management in response to shareholder feedback; (iii) discussing current trends in corporate governance, executive compensation matters, risk management, and other
pertinent matters; (iv) providing insight into our current business and operational practices and procedures; and (v) enhancing communication with our shareholders. It is our belief that our shareholder engagement allows key members of management and
the Board of Directors to gather information about investor views and priorities for the Company and to make educated and deliberate decisions which are both balanced and appropriate for our diverse shareholder base and in the best interests of
Cadence Bank.
2024 Highlights
| Performance and
Corporate Governance Highlights |
|
✔ |
Total assets were $47.0 billion at December 31, 2024, ranking the Company the 8th
largest bank headquartered in its nine-state footprint, with total loans and leases of $33.7 billion, total deposits of $40.5 billion, and total shareholders’ equity of $5.6 billion as of December 31, 2024. |
|
✔ |
Maintained a well-qualified Board of Directors with diverse experiences and backgrounds. |
|
✔ |
Proposed declassifying the Board of Directors, which shareholders approved at the 2024 annual meeting. |
|
✔ |
Repurchased 1,237,021 shares of Company common stock at a weighted average price of $26.74 during 2024. |
|
✔ |
Approved an increase in the quarterly common stock dividend from $0.235 to $0.25 per share of common stock for the 2024 calendar year. The total cash dividend for 2024
was $1.00 per common share, or 36.1% of earnings. |
|
✔ |
Maintained strong regulatory capital—Common Equity Tier 1 capital of 12.4% and Total Risk Based capital of 14.0% at December 31, 2024. |
|
✔ |
Generated net organic loan growth of $1.2 billion, or 3.8%, while core customer deposits, which excluded brokered deposits and public funds, increased $2.2 billion, or
6.9%. |
|
✔ |
Net interest margin for 2024 improved to 3.30% from 3.08% in 2023, as a result of balance sheet growth, improved earning asset mix, and continued upward repricing of
earning asset yields. |
|
✔ |
Total revenue of $1.8 billion for the year ended 2024, of which 19.9% of the total revenue was non-interest revenue. |
|
✔ |
Continued progress toward improved operating efficiency reflected in approximately 500 basis points of improvement in the adjusted efficiency ratio from 63.3% in 2023 to
58.4% in 2024. |
|
✔ |
Maintained stable credit quality reflected by relatively flat non-performing asset totals combined with improved criticized and classified totals compared to 2023. Net
charge-offs totaled 0.24% of average loans and leases and the allowance for credit losses remained strong at 1.37% of net loans and leases at December 31, 2024. |
Proxy Statement Summary
GAAP Earnings Per Diluted Common Share
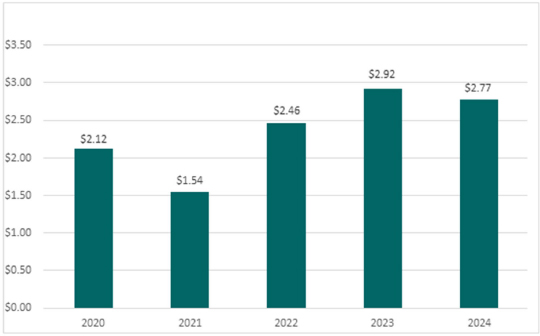
The Company reported earnings per diluted common
share of $2.77 for 2024 compared with $2.92 for 2023. The results for 2023 included an after-tax gain of approximately $520 million related to the sale of the insurance business, which was partially offset by after- tax securities portfolio
restructuring losses totaling approximately $334 million. Aside from the impact of these items, the Company experienced improvement in several aspects of core operating performance. The Company reported meaningful improvement in both net interest
margin and net interest income, stable credit quality, growth in noninterest revenue, and improved operating efficiency.
Return on Average Assets
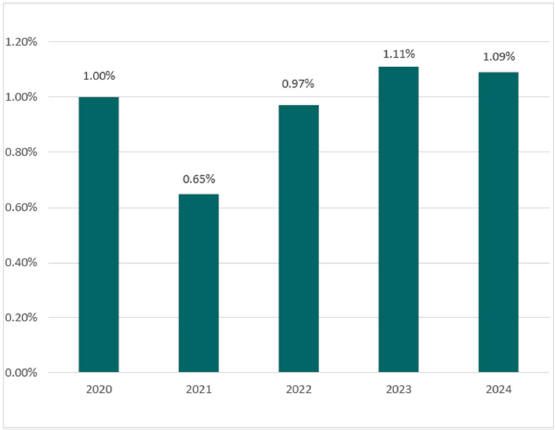
The return on average assets (“ROAA”) was
relatively flat at 1.09% for 2024 compared to 1.11% for 2023. The Company’s core operating performance was impacted by improvement in the items noted related to earnings per share.
Proxy Statement Summary
Adjusted Efficiency Ratio
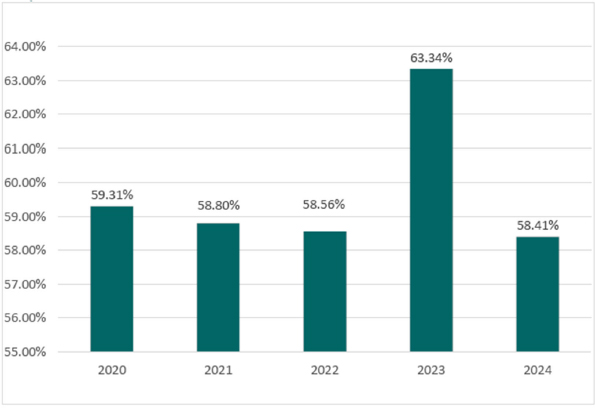
The adjusted efficiency ratio again improved to
58.4% after the increase in 2023. This improvement was driven by a decline in total noninterest expense combined with growth in both net interest revenue and noninterest revenue. The Company implemented several strategic initiatives in 2023 that
continued to yield benefits throughout 2024 including branch consolidation and headcount initiatives.
The efficiency ratio (tax equivalent) and the
adjusted efficiency ratio (tax equivalent) are supplemental financial measures utilized in management’s internal evaluation of the Company’s use of resources and are not defined under GAAP. The efficiency ratio (tax equivalent) is calculated by
dividing total noninterest expense by total revenue, which includes net interest income plus noninterest income plus the tax equivalent adjustment. The adjusted efficiency ratio (tax equivalent) excludes expense items otherwise disclosed as
non-routine from total noninterest expense.1
1 Considered a non-GAAP financial measure. Information on reconciliation of non-GAAP measures to financial measures determined in accordance with GAAP may be found in Appendix A.
Proxy Statement Summary
Net Interest Margin – Fully
Taxable Equivalent
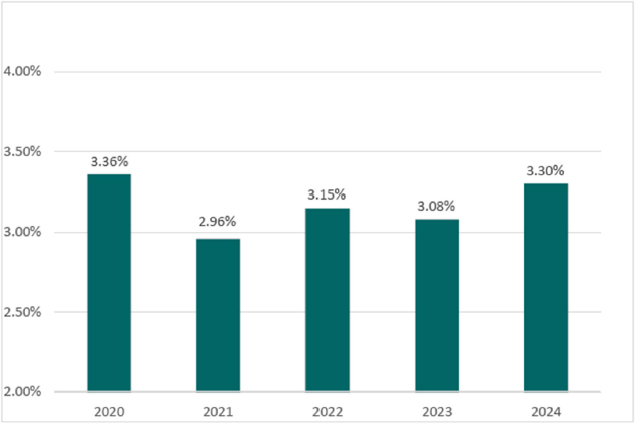
Our net interest margin improved to 3.30% in 2024
as a result of balance sheet growth, improved earning asset mix, and continued upward repricing of earning asset yields.
At December 31, 2024, the loan to deposit ratio was
83.3% and securities were 15.5% of total assets. The Company’s net interest revenue was $1.44 billion for 2024, an increase from $1.35 billion for 2023. Average interest-earning assets were $43.6 billion in 2024 compared to $44.0 billion in 2023.
Credit Metrics – Net
(Recoveries) Charge-offs to Average Loans and Leases
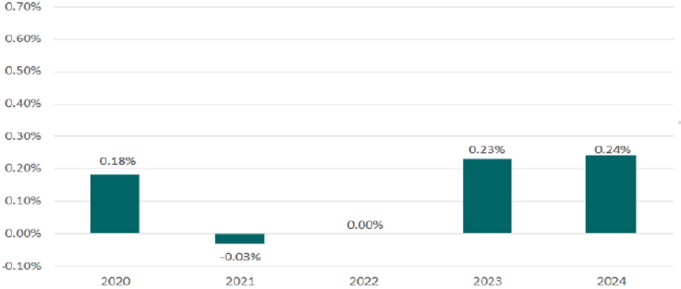
The Company reported net charge-offs of 0.24% of
average loans and leases for 2024, which is relatively flat compared to 0.23% for 2023. Credit quality metrics were stable overall year over year including criticized and classified as well as non-performing asset levels. Importantly, the allowance
for credit losses remained strong at 1.37% of net loans and leases at December 31, 2024.
Proxy Statement Summary
Cadence’s
Corporate Engagement and
Governance Framework |
Cadence built its integrated Corporate Engagement
and Governance Framework around our mission statement to meet customers where they are in their financial journey, and provide expert advice and a broad array of products and services to help them reach their goals. While delivering value to our
shareholders, we foster a workplace where teammates thrive and communities prosper.
In addition to the 2024
highlights below, our more detailed 2024 Corporate Engagement and Governance Report is available on the Investor Relations section of the Cadence Bank website at ir.cadencebank.com.

Recent Accolades
|
 |
Recognitions by Forbes 2024 - Best-In-State Employers for Mississippi. |
|
|
Linscomb Wealth, a Cadence Bank subsidiary, recognized among Barron’s Top 100 RIA Firms for the third year in a row. |
|
|
U.S. News & World Report 2024-2025 - Best Companies to Work For - Banking and Best Companies to Work For - In the South. |
|
|
Recently named a Forbes 2025 America’s Best Large Employers |
|
|
2024 America Saves Designation of Saving Excellence for promoting savings for the tenth consecutive year. |
|
|
Voted #1 Regional Bank, #1 Business That Gives Back, #1 Company to Work For, and #1 Regional Investment Firm by Northeast Mississippi Daily Journal Readers 2024. |
|
|
Recognized by Brands Reimagined - 2024 REBRAND 100® Global Award Winner Silver Award of
Distinction. |

Corporate Governance – Board Oversight and Leadership
|
|
Strong Independent Lead Director with clearly delineated duties. |
|
|
Director Independence Standards follow the Federal Reserve, U.S. Securities and Exchange Commission (“SEC”), and the New York Stock Exchange (“NYSE”) definition. |
|
|
All directors serving during 2024 attended more than 88% of the aggregate of all board meetings and 100% of all committee meetings. |
|
|
12 of 13 of our continuing directors are considered independent under the NYSE standards; the Chairman & CEO is the only non-independent director. |
|
|
Committed to regular board refreshment through our retirement policy. 54% of our continuing directors have served on the board six years or less. |
|
|
No director serves on an excess number of outside public boards. |
|
|
Annual peer-to-peer assessment of the board, its committees, and the Independent Lead Director. The Board conducts an annual evaluation of the CEO’s performance. |
|
|
Majority voting with director resignation policy. |
|
|
Significant stock ownership guidelines for our directors and executive officers, with a 12-month
holding period post-vesting of equity shares. |
|
|
Prohibited transactions in our common stock include margin accounts, short selling, trading
derivative securities, pledging, and hedging. |
|
|
No material related-party transactions involving our directors. |
|
|
Clawback policy for executive compensation for both short and long-term incentives. |
Proxy Statement Summary
Shareholder Rights
|
|
There are no classes of common stock with unequal voting rights or unequal ability to elect
directors. |
|
|
Shareholders are allowed to call special meetings and may take action by written consent pursuant to
the Mississippi Business Corporation Act. |
|
|
Shareholders may propose bylaw amendments pursuant to the Mississippi Business Corporation Act. |
|
|
No shareholder rights plan (poison pill). |
Corporate Governance – Operations and Risk Management
|
|
Risk management policies and procedures provide guidance for the appropriate risk management of
technology resources, cybersecurity, legal and regulatory risk, and other such risks as may from time to time be material to our company. |
|
|
Business Continuity Program manages the threats and impacts associated with a disruption to key
resources including people, equipment, facilities, technology and suppliers. |
|
|
Crisis Management Plan provides the management structure, key responsibilities, emergency
assignments and general procedures to follow during and immediately after an emergency. |
Corporate Governance – Information Security Risk
|
|
We continuously evaluate additional technology measures to defend against potential attacks. |
|
|
We include Information Security in internal and third-party audits and assessments. |
|
|
We conduct compliance and training programs, including those for information security awareness. |
|
|
We collaborate with other financial institutions, regulators, law enforcement officials, other
government agencies, internet service providers and internet security experts to analyze and deflect malicious online activity and deliver safe and consistent online services. |
Corporate Governance – Code of Business Conduct and
Ethics
|
|
Equal Opportunity Employer. We strive to eliminate all forms of discrimination. Our policies
prohibit all illegal harassment, retaliation and intimidation. |
|
|
Executive and board oversight of our anti-bribery and anti-corruption program. |
|
|
Maintain a strong anti-money laundering program to identify and report suspicious activity to the
appropriate regulatory agencies. |
|
|
An independent third party administers our Sarbanes-Oxley Integrity Line, with all complaints
reviewed by the Audit Committee of the board of directors. |
|
|
We regularly evaluate the effectiveness of our sales and incentive programs and the risk profile. We
also evaluate new products and services under our risk governance framework with senior leadership oversight. |
Corporate Governance – Vendor Relationships
|
|
Ongoing monitoring of third-party relationships to verify vendors are performing consistently with
the terms of the contracts. |
|
|
Management assesses, measures, and monitors the risks of each vendor. |
Proxy Statement Summary

Human Capital – Retention
|
|
Tracked teammate retention relative to industry experience; our turnover rate was in line with
industry experience. |
|
|
Utilized multiple recruitment strategies across the United States to find talented, motivated, and
qualified employees. |
|
|
We used an external compensation benchmarking service to determine market-level compensation for our
job roles at similar-sized institutions; assess any necessary modifications to job grades annually. |
|
|
Maintained established workplace safety procedures and protocols, and provided annual security
training to all teammates. |
Human Capital – Professional Development Programs
& Training
|
|
Teammates logged over 140,500 hours of training and professional development; each teammate logged
an average of 20 hours of training through the company’s internal learning management system. |
|
|
Conducted Teammate Engagement Survey, achieving an outstanding 84% participation rate. Results
revealed a strong trust and connection between teammates and their managers, as well as a high expectation of staff retention. |
|
|
Continued the Cadence Bank Management University to help supervisors and managers build important
skills, including communication, problem-solving, teammate engagement, leadership development, soft skills and more. |
|
|
Continued cohort of our Emerging Leaders Mentorship Program in 2024, which focuses on coaching and
developing teammates who have significant potential to broaden their role and responsibilities within the company. |
|
|
Identified potential successors for roles in the bank through multiple levels. |
|
|
Conducted virtual All Teammate Webinars, providing forums for our executives to connect with
teammates across our footprint. |
|
|
Offered college reimbursement to teammates to help with furthering their education in
banking-related areas. |
Human Capital – Employee Benefits & Support
|
|
Offered competitive compensation and benefits to attract and retain the best people, including paid
parental leave to assist and support new parents with balancing work and family matters. |
|
|
Introduced a 401(k) student debt retirement savings feature in the 401(k) plan for teammates. |
|
|
Offered wellness initiative called It Pays to Know Your Numbers, encouraging teammates enrolled in
the company’s health plan to complete a wellness check, including blood work and other preventive screenings. |
|
|
Maintained a dedicated healthcare clinic in Tupelo, Mississippi for our teammates and their
families, where services are free of charge to employees enrolled in our health benefits programs. |
|
|
Offered a comprehensive diabetes program, accessible 24/7, 365 days a year for teammates living with
Type 2 diabetes as part of our medical benefits plan. |
|
|
Offered free virtual visits to participants enrolled in select health plans. |
|
|
Offered a digital physical therapy benefit to teammates participating in our health plans. |
|
|
Offered free flu shot clinics in strategic office locations to support teammates’ health and
welfare. |
|
|
Helped teammates dealing with issues negatively impacting their lives and the lives of their
families through our Employee Assistance Program. |
|
|
Provided each teammate with one day’s (8 hours) pay to participate in a nonprofit organization or
community event to encourage community involvement. |
|
|
Provided wellness rooms in select locations to support teammate health, with the goal to expand this
feature as new locations are built. |
|
|
Offered Teammate Banking, a first-class, centralized unit of dedicated bankers who exclusively serve
the banking and financial needs of new and existing teammates. |
|
|
Offered flexible work schedules and work-from-home accommodation where possible. |
Proxy Statement Summary
Human Capital – Values and Engagement
|
|
Encouraged all teammates to create a collaborative environment, which supports teammate engagement
and establishes us as productive members of the communities we serve. |
|
|
Actively recruited prospective teammates from a wide range of institutions of learning, including
public and private institutions throughout our footprint. |
|
|
Continued to support employee-led groups to provide relevant events, resources, networking,
professional development, mentoring and leadership opportunities across the organization. |

Community Engagement and Investment
|
|
Partnered with the Federal Home Loan Bank to award over $3.6 million in grants under the Home Equity
Leverage Partnership, Special Needs Assistance Program, Affordable Housing Grant, and Partnership Grant Program to support community-based organizations serving underserved communities in our footprint. |
|
|
Continued our partnership with Operation HOPE for financial literacy programs, which provide our
customers with credit counseling, money management education, homeownership counseling and small business coaching. |
|
|
Managed approximately $1.2 billion in CRA-qualified investments, including current CRA exam period
investments and prior exam period investments still on the books. |
|
|
Secured funding of approximately $5.1 million in eligible grants and contributions under the
Community Reinvestment Act. |
|
|
Continued our commitment of $1.5 million to Atlanta, Georgia-based Westside Future Fund’s affordable
housing initiative. |
|
|
Cadence Bank and Cadence Bank Foundation collectively contributed approximately $5.4 million to
charitable organizations across our footprint. |
|
|
Donated more than $680,000 through the Cadence Bank Foundation and Cadence Bank in support of
affordable housing across the footprint. |
|
|
Donated more than $70,000 to support numerous Habitat for Humanity chapters throughout the company’s
footprint. |
|
|
Continued our partnership with organizations committed to supporting historically underrepresented
communities. |
|
|
Contributed financial support in the amount of $347,000 for Innovation Depot, Inc., whose mission is
to foster a thriving tech ecosystem. |
|
|
Cadence Cares Holiday Giving Program awarded $150,000 to nine select nonprofit organizations in the
communities we serve. The organizations were selected with input from Cadence Bank’s teammates, customers and local communities. |
|
|
Contributed $100,000 to help expand the Houston, Texas-based Fifth Ward Community Redevelopment
Corporation’s certified HUD counseling team. |
|
|
Contributed $100,000 to Avenue CDC in Houston, Texas to further our company’s commitment to support
affordable housing. This partnership will allow for pre-purchase counseling, first-time homebuyer education and foreclosure prevention. |
|
|
Continued to support historically underserved and underrepresented communities through our Emerging
Markets & Outreach program and other community development initiatives. |
Community Engagement and Investment – Lending
|
|
Originated loans for small businesses of $262 million through Small Business Administration (SBA)
7(a) loans; Cadence Bank ranked as the 17th highest producer of SBA 7(a) loans in the country. |
|
|
Provided a $1 million equity equivalent investment (EQ2) through 2025 to LiftFund. |
|
|
Closed nearly 2,000 mortgage loans totaling $524 million in majority-minority census tracts across
our footprint. |
|
Provided $1.3 million in assistance to reduce customers’ up-front mortgage loan costs through the |
| |
Company’s mortgage fee reductions for low - to moderate-income borrowers and borrowers via our
Community Heroes program, supporting borrowers employed in teaching, law enforcement, military, first responders and nursing. |
|
|
Invested over $400,000 to lower the up-front costs of obtaining a mortgage loan in the form of down
payment and closing cost assistance for over 140 homeowners under the Bank’s MaxAccess program in majority Black, majority Hispanic, and majority Black and Hispanic census tracts in the Houston, Texas MSA. |
Proxy Statement Summary
|
|
Closed nearly 2,100 loans totaling $401 million in mortgages made to low- to moderate-income
borrowers and in low- to moderate income neighborhoods across all mortgage loan products the bank offers through our Right@Home mortgage program. |
|
|
Maintained access to over 180 third-party programs offered by state housing authorities, local
government agencies and non-profit organizations that provide down payment, closing cost and mortgage credit certificate assistance supporting affordable home mortgages and homeownership. Originated over 330 loans in excess of $62 million in
home mortgages using many of these programs. |
|
|
Continued our relationship with Liberty Bank and Trust, a minority-owned depository institution and
Community Development Financial Institution. |
|
|
Continued our support and partnership with the National Association of Hispanic Real Estate
Professionals and the National Association of Real Estate Brokers to positively impact the housing needs of underserved communities and the development of a more diverse mortgage workforce. |
|
|
Continued our partnership with Community Land Trusts in Houston and Atlanta and with Habitat for
Humanity to help stimulate the supply of affordable housing by facilitating mortgage lending for subsidized housing through these programs. |
|
|
Continued offering the Emerging Communities Credit Builder product, a loan secured by a certificate
of deposit to help customers with blemished credit or limited credit history build or rebuild credit, improve credit habits, and save money. |
Customer-Focused Community Engagement and Investment
|
|
Continued investment in our online and mobile banking platforms for both business and consumer
applications. |
|
|
At year-end 2024, we had over 300 Cadence LIVE Teller-enabled ATMs, which combine innovative
technology with the service and expertise of an in-person bank visit, connecting customers with a live teller for personalized support and more flexible/extended hours. |
|
|
Our Voice of the Customer program includes ongoing measurement of customer satisfaction via
proactive and easily accessible surveys. |
|
|
Continued to expand the role of remote bankers to support customer engagement with new products. |
|
|
Further developed our universal branches, composed of universal bankers, personal bankers and
Cadence LIVE Tellers working in concert with one another. Instead of housing a vault or teller lines, this smaller footprint allows customers to easily conduct business with personal bankers and Cadence LIVE Teller specialists via LIVE
Teller-enabled ATM assistance. |
|
|
Continued to support our customers with resources designed to help address the language needs and
preferences of our customers through our Limited English Proficiency initiatives. |
Community Impact
|
|
Teammates volunteered over 4,000 hours conducting approximately 2,100 financial education programs
that reached more than 46,000 adults and youth through financial literacy programs. |
|
|
Teammates participated in the United Way Employee Campaign, contributing more than $459,000 to
support non-profit organizations that foster academic success, family stability, and health and wellness. |
|
|
Teammates volunteered over 11,500 service hours supporting more than 1,200 organizations in
communities across our footprint. |
|
|
Through the IRS’ VITA program, teammates assisted in the preparation of 732 federal income tax
returns and 399 state income tax returns, at no cost, for families and individuals in our communities. |
|
|
During Hurricanes Beryl, Milton, and Helene, which hit Houston, Georgia, and Florida in July,
August, and September of 2024, respectively, we deployed generators and emergency supplies, including food, water and refrigerators to branches and individually impacted teammates. |
Community Engagement – Financial Wellness
|
|
Offered Budget Smart®
Checking, an overdraft avoidance product, to provide our customers with safe, trusted and affordable banking. |
|
|
Provided spending tools through Online Banking to assist our customers with creating and managing a
budget. |
Proxy Statement Summary
|
|
Educated teammates and customers about cybersecurity threats and fraud prevention and protection
measures through a comprehensive fraud communications strategy. |
|
|
Delivered financial education, insights and resources through the Company’s website and an
electronic newsletter published monthly for customers. |

Environment – Offices and Branches
|
|
Renovated our downtown Birmingham corporate office, reducing our footprint by over 18,000 square
feet while modernizing the space for efficiency. We also relocated our Birmingham operations center to a new facility that reduced our square footage by almost 17,000 square feet. |
|
|
Continued focus on operational efficiency and the reduction of our physical impact with additional
office downsizing. |
|
|
Reduced lighting, energy and water consumption by utilizing occupancy sensors and lighting timers,
reduced-flow plumbing fixtures, and low-e glass where practical. We also attempted to minimize demands for landscape irrigation in new landscape design where possible. |
|
|
Strived for ways to lessen the impact on the environment by choosing “green” materials and building
methods, where feasible, for new construction and renovations. |
Environment – Energy Upgrades of Facilities
|
|
Facilities equipped with interior or exterior LED lighting saved nearly 60 million kilowatt hours of
energy and approximately $6 million in energy cost, as well as carbon emissions reduction of approximately 25,869 metric tons of CO2. |
|
|
Energy efficient mechanical systems with programmable controls provided additional savings on energy
cost. |
Environment – Digital Banking
|
|
Continued to deliver digital banking (online and mobile app) solutions to meet customers’
preferences for self-service transactions utilizing online, mobile and ATM/Cadence LIVE Teller-enabled ATM channels. |
|
|
Offered a full slate of digital banking solutions, including online banking and mobile apps which
help to reduce paper usage. |
Renewable Energy Lending
|
|
The number of borrower relationships continued to grow, and total funded loans increased to $468.9
million as of December 31, 2024. Additionally, 2024 was Cadence Bank’s inaugural year using our balance sheet and tax capacity to participate in the renewable energy tax credit transfer market. |
|
|
Our Renewable Energy Group has an extensive background in supporting energy transition by financing
solar, wind, battery storage and biogas projects in a responsible, thoughtful manner. The portfolio growth is well-balanced and maintains strong credit quality underwriting. |
Managing Exposure to Investments Subject to
Environmental Risk
|
|
Environmentally conscious in lending arrangements; we consider loans involving property where
environmental hazards or contamination exist undesirable except where parties can undertake proper assessments and monitoring. |
|
|
For credit extended to develop land in a floodplain, or where there are other indications there may
be wetlands present, we may require a letter or report from the United States Army Corps of Engineers. |
Proxy Statement Summary
Paper Consumption and Recycling
|
|
Over 80% of mortgage loan applications were initiated and processed through online and digital
processes. |
|
|
The Mortgage Loan department’s hybrid eClosing solution enhances a customer’s closing experience and
reduces the number of paper documents in a closing package. In 2024, 5,560 closings utilized this method, and on average, eClosing reduces paper documents per closing by an average of 63 pages, eliminating more than 350,280 pages in 2024. |
|
|
Recycling efforts resulted in nearly two million pounds, or 917 tons, of paper being shredded,
saving an estimated 15,675 trees, four million kilowatts of energy, 6.4 million gallons of water, 348,520 gallons of oil and 2,751 cubic yards of saved landfill space. |
|
|
Focused on significantly reducing our consumption of bottled water through a program called “Skip
the Bottles, Save the Earth. |
Corporate Governance, Compensation and Board Matters
The Nominating and Corporate Governance Committee, the Executive
Compensation and Stock Incentive Committee, and the Board carefully considered our corporate governance and compensation practices in 2024:
Corporate Governance Highlights
| ✔ |
Shareholder Engagement. Annual shareholder engagement program. |
| ✔ |
Board recommended governance proposals. The Board recommended
three governance proposals, which were approved by shareholders at the 2024 annual meeting. |
|
 |
To declassify the Board by 2027. |
|
|
To reduce the threshold for shareholder actions by written consent. |
|
|
To eliminate the supermajority threshold for shareholder approval of a merger or takeover where the Board does not recommend approval of the proposed transaction. |
| ✔ |
Independent Directors. Our Board is composed of 13 continuing
directors who are independent under the NYSE standards for independence as well as our Director Independence Standards. The only non-independent director is our CEO. |
| ✔ |
Independent Committees. Our Audit, Executive Compensation and
Stock Incentive, Nominating and Corporate Governance, and Risk Management Committees are composed entirely of independent directors. |
| ✔ |
Independent Lead Director. Strong Independent Lead Director with
clearly delineated duties. The Board conducts an annual assessment of the Independent Lead Director. |
| ✔ |
Executive Sessions. Independent directors meet in executive
sessions at least semi- annually, and met eight times in 2024. |
| ✔ |
Outside Advisors. Board and Committees may retain outside
advisors independently of management. |
| ✔ |
Board Diversity. Diverse Board in terms of qualifications,
specific skills, and experiences, as well as gender and ethnicity, with 69% of our continuing directors from under-represented groups (women and minorities). |
| ✔ |
Directors Public Company Service. None of the Company’s directors
serve on an excess number of public boards. |
| ✔ |
Board Involvement and Attendance. All directors serving during
2024 attended approximately 88% of all Board and 100% of all committee meetings in 2024. |
| ✔ |
Board and Committee Peer-to-Peer Assessments. Conduct Board and
Committee peer-to-peer assessments annually. |
| ✔ |
Board Refreshment. Demonstrated commitment to regular board
refreshment through retirement policy, with 54% of continuing directors having served 6 years or less. |
| ✔ |
Director Resignation Policy. Majority voting with director
resignation policy. |
| ✔ |
Related-Party Transactions. No material related-party
transactions involving our directors. |
| ✔ |
Orientation Program. Orientation program for new directors and
continuing education for all directors. |
| ✔ |
CEO Performance. The Board conducts an annual evaluation of the
CEO’s performance. |
Proxy Statement Summary
|
✔ |
CEO Public Company Service. CEO does not serve on any outside
public company boards. |
|
✔ |
Succession Planning. Maintain a formal management succession plan
that includes an annual review of management succession planning and requires executives and other managers to regularly identify potential leaders for succession planning. |
|
✔ |
Clawback Policy. Maintain a clawback policy which applies to both
short-term and long-term incentive plans, and which complies with NYSE rules. |
|
✔ |
Stock Ownership Guidelines. Directors and executive officers are
subject to significant common stock ownership guidelines, with a 12-month holding period after the vesting of equity awards. |
|
✔ |
Special Meetings. Shareholders have the right to call special
meetings. |
|
✔ |
Shareholder Action by Written Consent. The Company allows
shareholders the ability to take action by written consent. |
|
X |
Special Meeting Rights. There are no material restrictions on shareholders’ rights to call special meetings. |
|
X |
Supermajority Vote. We do not require a supermajority vote to approve amendments to our Articles of Incorporation or Bylaws. Shareholders may amend the Bylaws at any regular or special meeting where a quorum is present. |
|
X |
No Poison Pill. We do not have a shareholder rights plan. |
|
X |
No Share Recycling. Shares withheld from awards for taxes or other purposes are not available for re-issuance under our long-term equity incentive plans. |
|
X |
Short Selling or Use of Derivatives. In addition to the types of short selling prohibited by the Securities Exchange Act of 1934, as amended (the “Exchange Act”), our insider trading policy prohibits our directors and executive officers
from any short selling, hedging, or from trading derivative instruments related to our securities. |
|
X |
Margin Accounts Holding and Pledging of Our Common Stock. Our directors and executive officers are prohibited from holding shares in margin accounts and are not permitted to pledge shares of our common stock as collateral. |
Proxy Statement Summary
Executive Compensation Highlights
|
✔ |
Executive Compensation Policy. We maintain an Executive Compensation Policy, which outlines the principal criteria used to measure the success of our executive officers in achieving our business objectives. |
|
✔ |
Review Compensation Program. We review our compensation program against market practices to confirm it is competitive and does not encourage excessive risk-taking. |
|
✔ |
Pay for Performance. We provide short-term and long-term incentive awards based on performance targets aligned with identified business performance metrics. |
|
✔ |
Balance of Performance Metrics. We use multiple performance metrics and multi-year vesting timeframes to prevent over-emphasis on any single metric and minimize short-term risk-taking. |
|
✔ |
Long Vesting Periods. Awards of our restricted stock units prior to 2023 vested on a cliff basis of four years. Beginning in 2023, restricted stock units vest ratably over years 2, 3, and 4. Performance awards have cliff vesting
following a three-year performance period. |
|
✔ |
Stock Ownership Guidelines. We maintain rigorous stock ownership guidelines for our directors and executive officers, in order to more closely align the financial interests of the directors and executive officers with those of our
shareholders. |
|
✔ |
“Clawback Policy.” We maintain a clawback policy which sets forth the conditions under which we may recover excess incentive-based compensation (as defined in our policy) paid or awarded to or received by any of our current or
former executive officers. |
|
✔ |
“Double Triggers.” Our change in control agreements include a “double trigger” requiring both a change in control, and termination of the executive’s employment without cause, or by the executive for good reason, within a set period
of time for the executive to receive payment. |
|
✔ |
Shareholder Engagement. In late 2024 and January 2025, we conducted a shareholder engagement program, during which we reached out to holders representing 67.53% of our outstanding shares, and holders of 13.65% of our shares met with us.
Additionally, we are available year-round for shareholder questions and comments both in person and virtually, and we have ongoing shareholder interactions through direct contact, as well as meetings with advisors, shareholders, and other
stakeholders. |
|
✔ |
Annual Say-on-Pay Vote. We conduct an annual say-on-pay vote for shareholders to approve executive compensation of our NEOs. |
|
X |
Dividends on Unearned Performance-Based and Restricted Stock Unit Equity Awards.
Performance-based equity awards and restricted stock units accrue dividend equivalents during the respective performance and retention period, which are not
paid to the executive until vesting. |
|
X |
Short Selling or Use of Derivatives. Our insider trading policy prohibits our directors and executive officers from any short selling or hedging activities, and from trading derivative instruments related to our securities. |
|
X |
“Gross Ups.” We
do not provide tax “gross up” payments. |
|
X |
Option Repricing. Our long-term equity incentive plans prohibit option repricing without the approval of our shareholders. |
|
X |
Option Backdating or “Spring-Loading.” We do not backdate options or grant options retroactively. |
|
X |
Multi-year Guaranteed Bonuses. We do not award multi-year guaranteed bonuses. |
Voting Process
Voting Process
In an effort to lower the cost of the Annual
Meeting and conserve natural resources, we are furnishing our proxy materials to our shareholders via the internet in accordance with the “notice and access” e-proxy rules rather than mailing printed copies of those materials to each shareholder. If
you received a Notice of Internet Availability by mail, you will not receive a printed copy of our proxy materials. If, however, you would like to receive a paper copy of our proxy materials, you should follow the instructions for requesting these
materials included in the Notice of Internet Availability. If you chose to receive a printed copy of our proxy materials, you will continue to receive these materials by mail unless you affirmatively change to electronic delivery.
The Notice of Internet Availability contains
instructions regarding how to access the proxy materials, how to give your proxy authorization to vote your shares by internet, QR code scan, or telephone. This process is designed to expedite shareholders’ receipt of our proxy materials.
| February 28, 2025 |
The Record Date. Shareholders on this Date are entitled to notice of, and to vote at, the Annual Meeting. |
| March 14, 2025 |
Mailing
date of the Notice of Internet Availability of Proxy Materials, including this Proxy Statement, a proxy card, and our Annual Report for the year ending December 31, 2024 to shareholders. |
Record Date, Shares Outstanding, Votes Per Share and
Quorum
The close of business on February 28, 2025 has been
fixed as the record date for the determination of shareholders entitled to notice of and to vote at the Annual Meeting. As of such date, we had 500,000,000 authorized shares of common stock, $2.50 par value per share, of which 183,525,441 shares were
outstanding, and 6,900,000 authorized shares of 5.5% Series A Non- Cumulative Perpetual Preferred Stock, $0.01 par value per share, of which 6,900,000 shares were outstanding. Only holders of shares of our common stock are entitled to vote at the
Annual Meeting, and each share of our common stock is entitled to one vote. Holders of a majority of the outstanding shares of our common stock must be present, virtually or by proxy, to constitute a quorum for the transaction of business at the
Annual Meeting.
Information Regarding Voting
If a proxy is properly given by a shareholder of
record and not revoked, it will be voted in accordance with the instructions provided, if any, and if no instructions are provided, it will be voted as shown below.
| Proposal 1 |
“FOR” the election of each of the five director nominees to serve on the Board of Directors. |
| Proposal 2 |
“FOR”
the advisory approval of the compensation of our Named Executive Officers. |
| Proposal 3 |
“FOR”
the ratification of appointment of Forvis Mazars LLP as our independent registered public accounting firm for the year ending December 31, 2025. |
Any other proposal
properly before the
annual meeting |
As
recommended by our Board of Directors. |
We encourage shareholders to vote their proxies by internet, QR code
scan, or telephone, or, if you request a paper copy of the proxy materials, by mailing a proxy card enclosed with those materials.
| Voting Methods – Each should take only a few
minutes to complete |
| Internet |
Follow
the instructions in the Notice of Internet Availability. |
| QR code scan |
Follow the
instructions in the Notice of Internet Availability. |
| Telephone |
Follow the
instructions in the Notice of Internet Availability. |
| Mailing your
proxy card |
Follow the
instructions in the Notice of Internet Availability to request a paper copy of our proxy materials. Once received, complete, sign, date and return the proxy card by mail using the postage prepaid return envelope included with the paper copy of
your proxy materials. |
Voting Process
Frequently Asked Questions:
|
Q: Is a vote submitted via the internet, using a QR code scan, or by telephone as
valid as one submitted by mail?
|
A: Yes. All methods of voting have equal weight. |
| Q: When is the last day and time I can vote? |
A: If you are voting via the internet, using a QR code scan, or by telephone, you
may vote at any time until the voting closes during the Annual Meeting on April 23, 2025.
If you are voting by mail, we must receive your ballot before the voting closes at
the Annual Meeting on April 23, 2025.
|
| Q: What if I vote by one method, and then I vote using another method? |
A: Only the last vote
submitted by a shareholder is counted, and we will disregard previous vote(s) if we receive a subsequently voted proxy for your shares. |
| Q: Do I have to vote to attend the Annual Meeting? |
A: No. Shareholders
are not required to vote in order to attend the annual meeting. |
| Q: If I vote via proxy, can I still attend the Annual Meeting and vote there? |
A: Yes, you can still
attend the Annual Meeting, no matter if or when you vote your proxy. And if you have previously voted, you may revoke your proxy and vote at the Annual Meeting. We will only count the last vote. |
For a general description of how votes will be counted, please refer
to the section below entitled “GENERAL INFORMATION - Counting of Votes.”
If shares entitled to vote are held in “street
name” through a broker, bank or other holder of record, the beneficial holder will receive instructions from the registered holder that must be followed in order for the shares to be voted on behalf of the beneficial holder. Please vote as instructed
by your broker, bank or other holder of record. If a beneficial holder provides specific voting instructions, the shares will be voted as instructed and as the proxy holders may determine how to vote within their discretion with respect to any other
matters that may properly come before the Annual Meeting.
Voting Results
The final voting results of the Annual Meeting will
be announced no later than four business days after the Annual Meeting on a Form 8-K which will be filed with the federal banking authorities and which will be available on the Investor Relations section of our website at ir.cadencebank.com.
Proxy Solicitation
Our proxy materials have been made available to you
by internet access in connection with the solicitation of proxies by our Board of Directors for the purposes set forth in this Proxy Statement and in the accompanying Notice of Annual Meeting of Shareholders. Proxies will be voted at the Annual
Meeting and at any adjournments or postponements thereof. We pay the entire cost of soliciting your proxy, including the cost of preparing, assembling, printing, mailing, and otherwise distributing the Notice of Internet Availability of Proxy
Materials and these proxy materials, as well as soliciting your vote. If shareholders request paper copies of our proxy materials, we will bear the cost of printing, mailing and other expenses in connection with this solicitation of proxies and will
also reimburse brokers and other persons holding shares of common stock in their names or in the names of nominees for their expenses in forwarding paper copies of our proxy materials to the beneficial owners of such shares. Certain of our directors,
officers and employees may, without any additional compensation, solicit proxies in person or by telephone.
| Proposal 1: Election of Directors |
Size, Tenure, and Demographics of Board of Directors
Our Second Amended and Restated Articles of
Incorporation (the “Articles”) provide that the Board of Directors shall consist of at least nine (9) and no more than twenty (20) members, with the exact number to be determined from time to time by the entire Board of Directors. Currently, the
Board of Directors has 15 members. Current directors Alan Perry and Marc Shapiro are not standing for re-election; both reached retirement age per our retirement policy. The Board of Directors has taken action to decrease the size of the Board,
effective as of the Annual Meeting, to 13 members.
The Articles provide that the Board of Directors
shall be declassified over the course of the annual meeting elections in 2025, 2026, and beginning in 2027, all members of the Board shall stand for election annually. Over 54% of the continuing directors on our Board of Directors have a tenure of
six years or less. Additionally, 69% of our continuing directors are from historically under-represented groups, including women and minorities.
Board Skills and Qualifications
All of our directors bring a wealth of executive
leadership experience to our Board, particularly at public companies and in roles in the banking and financial services industry. The Board determined that the below skills, presented alphabetically, are linked to prudent Board oversight of the
Company as described below:
| Experience
and Attributes |
Short Description |
| Accounting/Audit Committee of a Public Company/Finance |
A director who understands general accounting principles and is
able to analyze financial data. |
| Audit Committee Financial Expert |
A director who has all of the following attributes: (i) an
understanding of generally accepted accounting principles and financial statements; (ii) the ability to apply such principles with the accounting of estimates, accruals and reserves; (iii) experience in preparing, auditing, analyzing or
evaluating financial statements as presented in the Company’s financial reporting, or experience in actively supervising one or more persons engaged in such activities; (iv) an understanding of internal controls and procedures for financial
reporting; and (v) an understanding of audit committee functions. |
| Audit Committee of a Public Company |
A director with experience serving on an Audit Committee of a
publicly-traded company. |
| Financial Services Industry |
A director who understands the types of financial products and
services offered, as well as those the Company chooses not to offer, are critical to the success of the Company. |
| Public Company CEO |
A director with experience as a current or former chief
executive officer of a publicly-traded company. |
| Corporate Governance |
A director who understands the constantly changing corporate
governance trends and practices that affect the fundamental operation of a company and how it can have a significant impact on corporate operations and shareholder value. |
| Cybersecurity Technology |
A director who has experience in the practice of securing
networks, resources, and systems from digital/cyberattacks and taking measures to protect a system or network from cyberattacks. |
Proposal 1: Election of Directors
| Experience
and Attributes |
Short
Description |
| Executive Leadership |
A director who has experience leading an organization by providing practical
insights on governance, accountability and integrity. |
| Human Resources (compensation, management succession, ethics,
diversity) |
A director who understands and has experience in various types of executive
compensation, benefit options, talent recruitment and retention, succession planning, corporate culture, code of conduct and ethics, and diversity in the workforce. |
| Information Security & Technology |
A director who has experience in implementing, establishing, or overseeing
technology to include information security systems and protocols. |
| Investment Banking and Trust Services |
A director who is knowledgeable in the benefits and risks associated with serving as
a fiduciary. |
| Operations Management Technology |
A director who possesses the knowledge and experience in providing the best customer
experience in business operations and technology by improving processes, services, and products, as well as reducing operational risks. |
| Public Company Board Service |
A director with publicly-traded company board service who understands the board’s
function, reporting requirements, strategic planning, prudent governance practices and problem-solving. |
| Real Estate Uses and Transactions |
A director who has experience in real estate appraisals, values, and transactions
over complex real estate matters. |
| Regulatory or Compliance |
A director who has experience in understanding the federal and state regulations
that impact the Company’s products and services. |
| Risk Management |
A director who is familiar with risk management by identifying risks and
establishing a risk appetite framework and controls. |
| Strategic Planning – M&A Strategy and Development |
A director who understands how to strategically plan for the future of the Company,
both in the short-and long-term, and is able to oversee and advise management with respect to the formulation and execution of the Company’s strategic planning, which includes not only organic growth, but growth through mergers and
acquisitions. |
| Sustainability Practices |
A director who has experience in recognizing risks and opportunities associated with
the environmental related issues resulting from the operations of a company; the creation and development of a diverse workforce reflective of the communities served; and transparent governance practices which make the Company’s current
operations more resilient and sustainable. |
Proposal 1: Election of Directors
The following chart summarizes each continuing
director’s key experience, qualifications and attributes.
| Experience
and Attributes |
Rol l ins |
Araujo |
Brown |
Cannon |
Corley |
Evans |
Hepner |
Holliman |
Hood |
Jackson |
Owodunni |
Rodriguez |
Stanton |
| Accounting/Audit Committee of a Public Company/Finance |
✓ |
✓ |
✓ |
✓ |
✓ |
✓ |
✓ |
✓ |
✓ |
✓ |
✓ |
✓ |
✓ |
| Audit Committee Financial Expert |
- |
- |
- |
✓ |
✓ |
✓ |
✓ |
- |
✓ |
✓ |
✓ |
- |
✓ |
| Audit Committee of a Public Company |
- |
- |
- |
✓ |
✓ |
- |
✓ |
- |
✓ |
✓ |
✓ |
- |
- |
| Corporate Governance |
✓ |
✓ |
✓ |
✓ |
✓ |
✓ |
✓ |
✓ |
✓ |
✓ |
✓ |
✓ |
✓ |
| Cybersecurity Technology |
✓ |
- |
- |
- |
- |
- |
- |
✓ |
✓ |
- |
- |
- |
✓ |
| Executive Leadership |
✓ |
✓ |
✓ |
✓ |
✓ |
✓ |
✓ |
✓ |
✓ |
✓ |
✓ |
✓ |
✓ |
| Financial Services Industry |
✓ |
- |
✓ |
✓ |
✓ |
✓ |
✓ |
✓ |
✓ |
✓ |
✓ |
✓ |
✓ |
| Human Resources (compensation, management succession, ethics, diversity) |
✓ |
✓ |
✓ |
✓ |
✓ |
✓ |
✓ |
✓ |
✓ |
✓ |
✓ |
✓ |
✓ |
| Information Security & Technology |
✓ |
✓ |
- |
- |
✓ |
✓ |
- |
✓ |
✓ |
- |
- |
- |
✓ |
| Investment Banking and Trust Services |
✓ |
- |
✓ |
✓ |
✓ |
✓ |
✓ |
✓ |
✓ |
✓ |
✓ |
- |
- |
| Operations Management and Technology |
✓ |
✓ |
✓ |
✓ |
✓ |
✓ |
- |
✓ |
✓ |
- |
✓ |
✓ |
✓ |
| Public Company Board Service |
✓ |
✓ |
✓ |
✓ |
✓ |
✓ |
✓ |
✓ |
✓ |
✓ |
✓ |
- |
✓ |
| Public Company CEO |
✓ |
✓ |
- |
- |
- |
✓ |
- |
- |
- |
- |
- |
- |
✓ |
| Real Estate Uses and Transactions |
✓ |
✓ |
✓ |
- |
- |
✓ |
✓ |
✓ |
- |
✓ |
- |
- |
- |
| Regulatory or Compliance |
✓ |
✓ |
✓ |
✓ |
✓ |
✓ |
✓ |
✓ |
✓ |
✓ |
✓ |
✓ |
✓ |
| Risk Management |
✓ |
✓ |
✓ |
✓ |
✓ |
✓ |
✓ |
✓ |
✓ |
✓ |
✓ |
✓ |
✓ |
| Strategic Planning – M&A Strategy and Development |
✓ |
✓ |
✓ |
✓ |
✓ |
✓ |
✓ |
✓ |
✓ |
✓ |
✓ |
✓ |
✓ |
Proposal 1: Election of Directors
Retirement Policy
Our retirement policy serves as a mechanism to
encourage director refreshment on our Board by providing that directors retire at age 75. Any director who reaches the age of 75 during his or her term of office may continue to serve until the expiration of the then-current term.
Required Vote and Voting Process
Directors are elected by a plurality of the votes
cast by the holders of shares of our common stock represented at a meeting at which a quorum is present. The holders of our common stock do not have cumulative voting rights with respect to the election of directors. Consequently, each shareholder
may cast only one vote per share for each nominee. Unless a proxy specifies otherwise, the persons named in the proxy card shall vote the shares covered by the proxy for the nominees listed below. Should any nominee become unavailable for election,
shares covered by a proxy will be voted for a substitute nominee selected by the current Board of Directors.
Majority Vote Policy
Our Second Amended and Restated Bylaws, as amended
(“Bylaws”), provide that, in an uncontested election, any nominee for director who receives a greater number of votes “withheld” from than votes “for” his or her election must promptly tender his or her resignation following certification of the
shareholder vote. The Nominating and Corporate Governance Committee will consider any such resignation offer and recommend to the Board of Directors whether to accept it. The Board of Directors will act on any such recommendation of the Nominating
and Corporate Governance Committee within 90 days following certification of the shareholder vote.
Nominees for Election
Last year our shareholders approved an amendment to
our Articles to declassify our Board. This year is the first year in which shareholders will vote for directors for a one-year term. The directors up for election this year include the two directors appointed to the Board in January of 2025, Fernando
G. Araujo and Alice L. Rodriguez, and are joined by three continuing Board members, Shannon A. Brown, William G. Holliman and the CEO and Chairman of the Board, James D. Rollins III. These five (5) individuals, if elected, will serve until the annual
meeting of shareholders in 2026, or until their earlier removal, resignation or retirement.
Each nominee has consented to be a candidate and to
serve as a director if elected. The Board has no reason to believe any nominee will be unavailable to serve as a director. Assuming the election of the five (5) director nominees at the Annual Meeting, the Board of Directors will consist of 13
members.
The biographies in the table below show the name,
age, principal occupation, and directorships with other public, private, and non-profit companies, and if applicable, information regarding involvement in certain legal or administrative proceedings held by each of the nominees designated by the
Board of Directors for election as a director. In addition, each of the nominees has held their principal occupation for more than five (5) years unless otherwise indicated below. We have also provided a brief discussion of the specific experience,
qualifications, attributes, or skills that led to the Nominating and Corporate Governance Committee’s conclusion that each nominee should serve as one of our directors.
Proposal 1: Election of Directors
Director Nominees’ Background and Qualifications
| Directors Standing for Election – 1-year Term |
|

Fernando G. Araujo, 57
|
Background and Qualifications: Mr. Araujo, the CEO of Berry Corporation, brings more than 30 years experience in the oil & gas industry to the Board. His extensive career has included domestic, international, and cross-border
assignments, among them, several where he oversaw operations in various countries. In addition to Mr. Araujo’s extensive executive experience, he has decades of experience operating a business in a highly-regulated environment with
significant compliance obligations. Mr. Araujo’s background also includes a great deal of strategic planning, experience with mergers and acquisitions, sustainability practices, and both operational and risk management skills. He is
well-versed in the establishment and maintenance of information security protocols. The experience Mr. Araujo brings to the Board deepens that of the collective group in a number of areas, while expanding it beyond the financial services
sector.
Directorships, public:
● Cadence Bank (NYSE: CADE) (Since 2025)
● Berry Corporation (NASDAQ: BRY) (non-independent director)
Directorships, Non-profit:
● Western States Petroleum Association
|
Proposal 1: Election of Directors
|

Shannon A. Brown, 68
|
Background and Qualifications: Mr. Brown is deeply familiar with issues related to the financial services industry and the customers and employees it serves. Mr. Brown previously held a number of senior
executive level positions at FedEx Express prior to his retirement in November 2022. At the time of his retirement, Mr. Brown was the Senior Vice President of U.S. Operations, Eastern Division and the Chief Diversity Officer. During his more
than three-decade career at FedEx Express, Mr. Brown also served as Senior Vice President, Human Resources and Senior Vice President of Air, Ground, and Freight Services. Through this professional background Mr. Brown possesses expertise in
matters relating to recruitment, development, and retention of a diverse workforce, as well as employee benefits and compensation. Mr. Brown also has extensive non-profit experience, through which he has additional expertise related to
serving constituencies with a variety of economic, racial, and geographic backgrounds and needs.
Directorships, public:
● Cadence Bank (NYSE: CADE) (Since 2016)
● Universal Insurance Holdings, Inc. (NYSE: UVE)
Directorships, non-profit:
● United Way of the Mid-South
● Central Board of the Boys & Girls Club of Greater Memphis
● Western Governors University Advisory Board
● University of Denver School of Transportation & Supply Chain
● Orpheum Theatre Group
● Atlanta Business League
● Atlanta Convention and Visitors Bureau
● Metal Museum
Former Directorships:
● Buckeye Technologies, Inc.
● Memphis Area Chamber of Commerce
● Teach for America – Memphis
● Memphis International Festival
|
Proposal 1: Election of Directors
|

William G. Holliman, 60
|
Background and Qualifications: Mr. Holliman is an experienced executive and entrepreneur whose hands-on business and management experience contributes to the diversity of types of management experience on
the Board. He currently serves as President of HomeStretch Furniture, a private company he co-founded, which specializes in furniture manufacturing. Mr. Holliman is a lifelong native Mississippian, whose ties and understanding of one of the
primary markets in which the Company has operations, augments the Board’s understanding of the kinds of compensation, diversity, sustainability, strategic planning, and risk management matters the Board oversees.
Directorships, public:
● Cadence Bank (NYSE: CADE) (Since 2020)
Directorships, non-profit:
● North Mississippi Medical Center
● North Mississippi Health Services, Inc.
● Faith Family Ministries
|
Proposal 1: Election of Directors
|

Alice L. Rodriguez, 60
|
Background and Qualifications: Ms. Rodriguez brings her experience of over 35 years working for JP Morgan Chase & Co. (and its predecessors). Over the decades, Ms. Rodriguez served the company in a
variety of roles, including as the head of the community impact organization and Managing Director, and before that as Managing Director and head of the community and business development organization. Earlier in her career, Ms. Rodriguez
served as a wealth management executive in the Texas markets, and as a business banking executive for the California region. She has extensive experience managing large teams of people, and with the related human resources matters, in
addition to managing risks more broadly. Ms. Rodriguez also has deep experience with corporate governance, strategic planning, operations management, and regulatory compliance.
Directorships, public:
● Cadence Bank (NYSE: CADE) (Since 2025)
Directorships, private:
● Oncor Holdings
Directorships, non-profit:
● DreamSpring (Chair)
● Latino Business Action Network
● United States Hispanic Chamber of Commerce Education Fund
● Avance Inc
● Perot Museum of Natural Science
● Dallas Arboretum
Former Directorships:
● United States Hispanic Chamber of Commerce (Chair)
● DreamSpring (Chair)
|
Proposal 1: Election of Directors
|

James D. Rollins III, 66
|
Background and Qualifications: Mr. Rollins has served as Chairman of the Board of Cadence Bank since April 2014 and CEO since November 2012. Prior to that, he served as President and Chief Operating Officer
of Prosperity Bancshares, Inc., from 2006 to 2012. From 1994-2006, Mr. Rollins held other senior executive positions at Prosperity Bancshares and Prosperity Bank. Before joining Prosperity Bank, Mr. Rollins worked for First State Bank and
Trust Company. Mr. Rollins brings his decades of executive, operational, and leadership experience to his role as Chairman of the Board. Reflective of his broad experience in the banking industry, Mr. Rollins is an audit committee financial
expert who also has expertise with strategic and risk management, operations management, information and technology security, as well as human resources issues, including compensation, diversity, ethics, and sustainability matters.
Directorships, public:
● Cadence Bank (NYSE: CADE) (Since 2012 and Chair since 2014)
Directorships, non-profit:
● North Mississippi Health Services, Inc. (Past Chair)
● Mississippi Economic Council (Past Chair)
Former Directorships:
● Prosperity Bancshares, Inc. (NYSE: PB)
● Healthcare Foundation of North Mississippi
|
Voting Recommendation
The Board of Directors Recommends Shareholders
vote “FOR” each of the five Nominees for Director
named above.
Proposal 1: Election of Directors
Continuing Directors’ Background and Qualifications
The biographies in the table below show the name,
age, principal occupation and directorships with other public, private, and non-profit companies, held by each of the continuing directors. In addition, each of the continuing directors has held their principal occupation for more than five years
unless otherwise indicated. We have also provided a brief discussion of the specific experience, qualifications, attributes or skills that led to the Nominating and Corporate Governance Committee’s conclusion that each continuing director should
serve as one of our directors.
| Continuing Directors – Class II – Term Expires 2026 |
|

Deborah M. Cannon, 73
|
Background and Qualifications: Ms. Cannon has extensive experience in the financial services industry, having served in a number of roles at Bank of America over thirty years. At the time of her retirement
from Bank of America, Ms. Cannon was an Executive Vice President and President of the Houston region. During the course of her career at Bank of America, Ms. Cannon was a lender in and managed groups of other bankers in local, regional,
national, and international regions. Subsequently, Ms. Cannon served as CEO of the Houston Zoo, Inc. for over ten years. Ms. Cannon not only has deep financial experience, she is also an audit committee financial expert. Ms. Cannon
additionally has experience relevant to some of the significant regions in which Cadence operates, as well as the employees and customers served in Houston. Ms. Cannon’s experience in talent retention, recruitment, and corporate culture are
valuable contributions to the Cadence Board.
Directorships, public:
● Cadence Bank (NYSE: CADE) (Since 2015)
Directorships, non-profit:
● Houston Parks Board
● Teach for America
● Memorial Hermann Accountable Care Organization
Former Directorships:
● Memorial Hermann Health Systems (Chair)
● Deltic Timber Corporation (Audit Committee Member)
● United Way of the Texas Gulf Coast
● Greater Houston Partnership (Chair)
|
Proposal 1: Election of Directors
|

Warren A. Hood, Jr., 73
|
Background and Qualifications: Mr. Hood brings the expertise from his long business career running a multi-national company to his Board service. He is currently the Chairman and CEO of Hood Companies,
Inc., a corporation with manufacturing and distribution sites throughout the United States, Canada, and Mexico. He is well-versed in a wide variety of relevant matters ranging from human resources, to financial, to strategic planning and risk
management, to issues surrounding establishment, maintenance, and protection of technology resources. Mr. Hood has a wealth of prior board service, in financial services companies as well as community and philanthropic boards. Mr. Hood brings
skills navigating financial statements and financial disclosure issues, gained through his prior service on the board and the audit committee of another NYSE listed company. Mr. Hood is an audit committee financial expert.
Directorships, public:
● Cadence Bank (NYSE: CADE) (Since 2007)
Directorships, private:
● Hood Companies, Inc. (Chair)
Former Directorships:
● First American Corporation
● First American National Bank
● Mississippi Power Company
● Deposit Guaranty Corporation
● Southern Company (NYSE: SO) (Audit Committee Member)
|
| |
|
|

Precious W. Owodunni, 50
|
Background and Qualifications: Ms. Owodunni was formerly an investment banker and Vice President at Goldman Sachs who is now the CEO of Mountaintop Consulting LLC, a business strategy and branding company
that serves leading corporations and financial services, law and private equity firms. She is experienced in business strategy and branding, as well as strategic business combinations and matters of corporate finance. In addition to her
financial expertise, Ms. Owodunni is an audit committee financial expert, and she has a deep well of experience related to human resources matters, such as executive leadership and succession planning, as well as experience with governance,
regulatory and compliance matters, and risk management.
Directorships, public:
● Cadence Bank (NYSE: CADE) (Since 2021)
Directorships, non-profit:
● Baylor College of Medicine (Trustee)
Former Directorships:
● Cadence Bancorporation and Cadence Bank, N.A. (2019-2021)
● Episcopal Health Foundation
● Houston Parks Board
● Switchback II Corporation, n/k/a Bird Global, Inc.
|
Proposal 1: Election of Directors
|

Thomas R. Stanton, 60
|
Background and Qualifications: Mr. Stanton is a seasoned CEO and Chairman of ADTRAN, Inc., a public computer networking and communications company. He brings invaluable technological expertise to his Board
service at Cadence Bank. Mr. Stanton is also a former Director and Chairman of both the Federal Reserve Bank of Atlanta’s Birmingham Branch and the Telecommunications Industry Association. Mr. Stanton has decades of experience with computer
networking and technology issues in addition to his expertise with economic development. Moreover, Mr. Stanton brings experience in risk management, strategic planning, and human resources, in addition to his information security,
cybersecurity, technology, leadership, corporate governance, and management experience. Mr. Stanton also qualifies as an audit committee financial expert.
Directorships, public:
● Cadence Bank (NYSE: CADE) (Since 2015)
● ADTRAN, Inc. (NASDAQ: ADTN) (Chair)
Directorships, non-profit:
● Economic Development Partnership of Alabama
● Chamber of Commerce of Huntsville/Madison County
Former Directorships:
● Federal Reserve Bank of Atlanta’s Birmingham Branch (Chair)
● Telecommunications Industry Association (Chair)
|
| |
|
| Continuing Directors – Term Expires 2027 |
| |
|
|

Charlotte N. Corley, 61
|
Background and Qualifications: Ms. Corley is the former Commissioner of the Mississippi Department of Banking and Consumer Finance (“MDBCF”), who retired from this regulatory body after a 34-year career,
which she began as a bank examiner. During Ms. Corley’s career at the MDBCF, she also served as Banking Division Director and later as Deputy Commissioner. Ms. Corley’s prior professional experience leading teams, and then an entire agency,
further contribute to her knowledge and understanding of human resources issues, including succession planning, diversity, compensation, and ethics, as well as sustainability practices. Ms. Corley’s varied experiences within the financial
services industry provide an additional perspective regarding regulatory and compliance issues.
Directorships, public:
● Cadence Bank (NYSE: CADE) (Since 2020)
Directorships, private:
● Deel, Inc. Advisory Director
Former Directorships:
● Conference of State Bank Supervisors (“CSBS”) (Chair)
● CSBS State Supervisory Processes and Technology Committees
● CSBS Education Foundation (Chair)
● Federal Financial Institutions Examination Council’s Task Force on Examiner Education
● Interagency Supervisory Processes Committee
|
Proposal 1: Election of Directors
|

Joseph W. Evans, 75
|
Background and Qualifications: Mr. Evans is a former bank and financial holding company CEO who brings decades of such experience to his role as a director. Mr. Evans was CEO of State Bank and Trust Company
and later Chairman and CEO of State Bank Financial Corporation and State Bank. Prior to that, Mr. Evans was the Chairman and CEO of Flag Financial Corporation, until it was acquired by RBC Centura Bank. Prior to that, Mr. Evans was President
and CEO of both Bank Corporation of Georgia and Century South Banks, Inc. In addition to his executive and regulatory experience, Mr. Evans has substantial experience with issues relating to strategic planning, risk management, diversity,
real estate, fiduciary based financial services, sustainability practices, and he qualifies as an audit committee financial expert.
Directorships, public:
● Cadence Bank (NYSE: CADE) (Since 2021)
Directorships, private:
● Carter Center Board of Councilors
● The Foundation of the Methodist Home
● Scheller College of Business at Georgia Tech Advisory Board
● Monroe County Sports Hall of Fame
Former Directorships:
● Cadence Bancorporation and Cadence Bank, N.A. (2019-2021)
● State Bank Financial Corporation (Chair)
● State Bank and Trust Company (Chair)
● Flag Financial Corporation (Chair)
● Buckhead Coalition (Chair)
● Georgia Tech Foundation Board of Trustees (Chair)
● Southern Trust Insurance Company
|
Proposal 1: Election of Directors
|

Virginia A. Hepner, 67
|
Background and Qualifications: Ms. Hepner is a veteran banking executive and real estate investor, who also previously worked as a consultant to a global technology solutions company. Ms. Hepner worked for
25 years at Wachovia Bank, in various leadership roles, including as a Managing Director of U.S. Corporate Finance, the head of Foreign Exchange and Derivatives Trading, and the Commercial Banking Director in Atlanta. In addition to her
executive leadership, banking, and real estate experience, Ms. Hepner is an audit committee financial expert who also has significant knowledge regarding human resources matters, including compensation, ethics, diversity, and sustainability
practices. Ms. Hepner additionally brings experience with regulatory and compliance issues related to the financial services industry, risk management, strategic planning, management, and governance to her Board service.
Directorships, public:
● Cadence Bank (NYSE: CADE) (Since 2021) (Chair of the Audit Committee)
● Oxford Industries, Inc. (NYSE: OXM)
● National Vision Holdings, Inc. (NASDAQ: EYE) (Audit Committee)
Directorships, non-profit:
● Westside Future Fund
● Community Foundation for Greater Atlanta Housing and GoAtl Committees
● Penn Institute for Urban Research
● Georgia Chapter of International Women’s Forum
● Russell Innovation Center Finance Committee
Former Directorships:
● Cadence Bancorporation and Cadence Bank, N.A. (2019-2021)
● State Bank Financial Corporation
● State Bank and Trust Company
● Woodruff Arts Center, Life Trustee (former President and CEO)
|
| |
|
|

Keith J. Jackson, 60
|
Background and Qualifications: Mr. Jackson is the President and founder of Positive Atmosphere Reaches Kids, a non-profit organization, which works with at-risk youth to provide positive reinforcement for
their success. Mr. Jackson is also a prolific public speaker, where he often focuses on investing in and developing people, as well as leadership. Mr. Jackson has significant business experience in real estate and qualifies as an audit
committee financial expert, in addition to his experience with strategic planning, risk management, human resources, executive leadership, corporate governance and fiduciary services.
Directorships, public:
● Cadence Bank (NYSE: CADE) (Since 2007)
● Dun & Bradstreet Holdings, Inc. (NYSE: DNB)
Directorships, non-profit:
● Positive Atmosphere Reaches Kids
● University of Oklahoma Foundation (Trustee)
● The Baptist Health Foundation Board
● Donaghey Foundation (Trustee)
|
Proposal 1: Election of Directors
Executive Officers’ Background and Qualifications
The Board of Directors appointed an Executive Management
Committee with policy-making authority. The Executive Management Committee consists of 11 executive officers including Mr. Rollins whose biography is included above. Other members of the Executive Management Committee are set forth below:
| Executive Officer |
|
Age |
|
Position |
|
Position in Past 5 Years with Company
(unless otherwise noted) |
| Chris A. Bagley |
|
64 |
|
President and Chief Credit Officer |
|
President from 2021-2024; President and Chief Operating Officer from 2014-2021 |
| Edward H. Braddock |
|
54 |
|
Senior Executive Vice President, Chief Banking Officer |
|
Senior Executive Vice President, Chief Credit Officer from 2021-2024; Executive Vice President and Chief Lending Officer - Cadence Bancorporation
and Cadence Bank, N.A. from 2020-2021; Executive Deposit Strategy Officer from 2019-2020; and Chief Credit Officer from 2021-2024 |
| Cathy S. Freeman |
|
59 |
|
Senior Executive Vice President, Chief Administrative Officer and Corporate Secretary |
|
Senior Executive Vice President, Chief Administrative Officer and Corporate Secretary from 2013 -present |
| Jeffrey W. Jaggers |
|
62 |
|
Senior Executive Vice President, Chief Operating Officer |
|
Senior Executive Vice President, Chief Information Officer from 2017-2021 |
| Shanna R. Kuzdzal |
|
46 |
|
Senior Executive Vice President, Chief Legal Officer |
|
Senior Executive Vice President, Chief Legal Officer from 2023-present; Senior Executive Vice President, General Counsel of Stellar Bancorp, Inc.
(2022-2023); Executive Vice President, General Counsel & Corporate Secretary of Allegiance Bancshares, Inc. (2017-2022) |
| Tyler L. Lambert |
|
43 |
|
Senior Executive Vice President, Chief Risk Officer |
|
Executive Vice President and Chief Data Analytics Officer from 2018-2020 |
| Kevin H. McMahon |
|
56 |
|
Senior Executive Vice President, Chief Information Officer |
|
Deputy Chief Operating Officer from 2022-2024; Senior Executive Vice President & U.S. Head of Engineering at BBVA USA (2000-2022) |
| Jerrell M. Moore |
|
48 |
|
Senior Executive Vice President, Chief Human Resources Officer |
|
Executive Vice President and Chief Diversity Officer from 2023-2024; Head of Global Inclusion Programs at Google (2021-2023); Vice President and
Chief Diversity Officer at Assurant (2020- 2021) |
| Valerie C. Toalson |
|
59 |
|
Senior Executive Vice President, Chief Financial Officer and President – Banking Services |
|
Chief Financial Officer from 2021-2024; Executive Vice President, Chief Financial Officer of Cadence Bancorporation and Cadence Bank, N.A. from
2013-2021 |
| Brian D. Walhood |
|
58 |
|
Senior Executive Vice President, President Community Bank |
|
Executive Vice President, President Community Bank |
Role of the Board of Directors
The role of the Board of Directors is to facilitate the Company’s long-term success consistent
with its fiduciary responsibilities to its shareholders. In this role, our Board of Directors is responsible for, among other things:
|
● |
reviewing, monitoring and changing, when necessary, fundamental operating, financial and other
corporate plans, policies, strategies and objectives with the advice and assistance of management; |
|
● |
overseeing the management of the Company’s activities, including management’s risk culture and risk
appetite; |
|
● |
selecting, monitoring, evaluating and, if necessary, replacing the Company’s Chief Executive Officer
and senior management; |
|
● |
addressing management succession issues in a timely manner; |
|
● |
monitoring the Company’s performance against strategic and business plans; |
|
● |
overseeing and monitoring compliance with laws, regulations, auditing and accounting principles; |
|
● |
exercising oversight for the development and performance of internal controls and the ability of
employees and other stakeholders to report unethical or improper conduct; |
|
● |
considering and, when advisable or required, approving mergers, acquisitions, and other similar
transactions for the Company and its subsidiaries; and |
|
● |
overseeing Management’s activities with respect to belonging and inclusion initiatives. |
To ensure it is effective in fulfilling its duties, the Board of
Directors conducts an annual peer-to-peer assessment of the Board of Directors as well as assessments of the members of each of its six standing committees, the Independent Lead Director, and CEO performance.
Director Attendance at Board, Committee and Annual Meetings
During 2024, our Board of Directors held eight meetings. Each director
attended 100% of the committee meetings and at least 88% of the total number of all meetings of the Board of Directors. We encourage our Board members to attend annual meetings of shareholders. In 2024, all of our directors attended the annual
meeting of shareholders.
Corporate Governance
Committees of the Board of Directors
The Board of Directors has six standing committees - the Audit Committee,
the Risk Management Committee, the Executive Compensation and Stock Incentive Committee, the Nominating and Corporate Governance Committee, the Credit Risk Committee, and the Trust and Financial Services Committee. A copy of the charter for each of
these committees is available on the Investor Relations page of our website at ir.cadencebank.com under the caption “Corporate Governance – Governance Documents.”
The following table, and committee information which follows, shows the
committee membership of each committee of the Board of Directors following the annual meeting:
| Director |
Audit
Committee |
Risk Management
Committee |
Executive
Compensation and
Stock Incentive
Committee |
Nominating and
Corporate
Governance
Committee |
Credit Risk
Committee |
Trust and
Financial
Services
Committee |
| James D. Rollins III |
|
|
|
|
|
|
| Fernando G. Araujo* |
|
X |
|
|
X |
|
| Shannon A. Brown* |
|
X |
Chair |
|
|
|
| Deborah M. Cannon* |
X |
|
|
|
Chair |
|
| Charlotte N. Corley* |
X |
|
|
|
|
Chair |
| Joseph W. Evans*+ |
|
|
|
Chair |
X |
|
| Virginia A. Hepner* |
Chair |
|
X |
|
|
|
| William G. Holliman* |
|
|
X |
X |
|
|
| Warren A. Hood, Jr.* |
X |
X |
|
|
|
|
| Keith J. Jackson* |
|
|
|
X |
|
X |
| Precious W. Owodunni* |
|
|
|
X |
|
X |
| Alice L. Rodriguez* |
|
|
|
X |
X |
|
| Thomas R. Stanton* |
|
Chair |
X |
|
|
|
|
* |
Reflects an independent director. For more information, see the section below entitled “Director Independence.” |
|
+ |
Reflects the Independent Lead Director effective as of the date of the annual meeting, April 23, 2025. |
Corporate Governance
|
Audit Committee
Virginia A. Hepner (Chair)*
Deborah M. Cannon*
Charlotte N. Corley*
Warren A. Hood, Jr.*
*Independent Directors
|
|
Pursuant to its charter, the Audit Committee is responsible for, among other things, monitoring the integrity
of our financial statements, our compliance with legal and regulatory requirements and our financial reporting process and systems of internal controls; evaluating the independence and qualifications of our independent registered public
accounting firm; evaluating the performance of our independent registered public accounting firm and our internal auditing department; providing an avenue of communication among our independent registered public accounting firm, management,
our internal audit department, our subsidiaries, and our Board of Directors; and selecting, engaging, overseeing, evaluating and determining the compensation of our independent registered public accounting firm.
This committee has the authority, in its sole
discretion, to select, retain and obtain the advice and services of one or more independent legal counsel, accountants or other advisors as it determines necessary to fulfill or assist with the execution of its duties and responsibilities.
|
| |
|
|
| |
|
A peer-to-peer assessment as well as an assessment of the committee’s overall
performance is conducted annually. The Board of Directors has determined each member of the Audit Committee is independent under the listing standards of the NYSE. Our Board of Directors has also determined each of Mr. Hood and Mses. Cannon,
Corley, and Hepner is an “audit committee financial expert” as defined in rules adopted by the Exchange Act. |
| |
|
|
| |
|
The committee held eight meetings during 2024. |
| |
|
|
|
Risk Management
Committee
Thomas R. Stanton (Chair)*
Fernando G. Araujo*
Shannon A. Brown*
Warren A. Hood, Jr.*
*Independent Directors
|
|
The Risk Management Committee is responsible for the oversight of our
enterprise-wide risk management practices and ascertains whether management has adequately considered all material risks we face, and determines whether procedures have been effectively implemented to sufficiently mitigate the risks
identified. This includes oversight of the Company’s Information Security program. In addition, the Committee provides oversight and guidance concerning the Company’s sustainability initiatives. These initiatives are designed to promote the
Company’s investments in social capital, human capital, corporate governance, and the environment, and to limit or mitigate attendant risks.
This committee has the
authority, in its sole discretion, to select, retain and obtain the advice and services of one or more independent legal counsel, accountants or other advisors as it determines necessary to fulfill or assist with the execution of its duties
and responsibilities.
|
| |
|
|
| |
|
A peer-to-peer assessment as well as an assessment of the committee’s overall
performance is conducted annually. In addition, the Board of Directors has determined each member of the Risk Management Committee is independent under the listing standards of the NYSE. |
| |
|
|
| |
|
The committee held five meetings during 2024. |
Corporate Governance
|
Executive Compensation
and Stock Incentive
Committee
Shannon A. Brown (Chair)*
Virginia A. Hepner*
William G. Holliman*
Thomas R. Stanton*
*Independent Directors
|
|
Pursuant to its charter, the Executive Compensation and Stock
Incentive Committee reviews corporate goals and objectives pertaining to the compensation of our executive officers, evaluates the performance of our executive officers and determines the salary, benefits and other compensation of our executive
officers. This committee also administers our incentive compensation plans, equity-based plans and other compensation plans, policies and programs, including the Executive Compensation Policy. See “COMPENSATION DISCUSSION AND ANALYSIS.”
Pursuant to its charter, the committee evaluates and recommends to the Board the form and amount of non-management director compensation and, at least every two years, reviews non-management director compensation. It also oversees the
succession planning process for senior management other than the CEO. |
| |
|
This committee has the authority, in its sole discretion, to select, retain and
obtain the advice and services of one or more compensation consultants, independent legal counsel, accountants or other advisors as it determines necessary to fulfill or assist with the execution of its duties and responsibilities. |
| |
|
|
| |
|
A peer-to-peer assessment as well as an assessment of the
committee’s overall performance is conducted annually. The Board of Directors has determined each member of the Executive Compensation and Stock Incentive Committee is independent under the listing standards of the NYSE and the Exchange Act
regulations. |
| |
|
|
| |
|
The committee held six meetings during 2024. |
| |
|
|
|
Credit Risk Committee
Deborah M. Cannon (Chair)*
Fernando G. Araujo*
Joseph W. Evans*
Alice L. Rodriguez*
*Independent Directors
|
|
The Credit Risk Committee is responsible for advising and informing the Board and management as it
relates to: (i) optimization of the risk/return profile of the Company’s consolidated loan portfolio and other real estate owned portfolio; (ii) compliance with the General Loan Policy; and (iii) appropriate classification of loans. To meet its
responsibilities, the committee is further responsible for, among other things, assessing the overall quality of the loan portfolio, including the level and direction of risk, monitoring the development of risk mitigation tools, monitoring
policies and plans for dealing with other real estate owned, reviewing the Asset Quality Trend Report and making recommendations to management, monitoring the activities of internal loan review, reviewing and commenting on the discussion of
allowance for loan and lease loss on a quarterly basis, monitoring the work of the Credit Committee, reviewing the appraisal procedures, reviewing portfolio concentration analyses, reviewing Regulation O and Regulation H reports, and assessing
the overall adequacy of the commercial lending staff. |
| |
|
|
| |
|
A peer-to-peer assessment as well as an assessment of the committee’s overall
performance is conducted annually. The committee’s charter is also evaluated annually. |
| |
|
|
| |
|
The committee held four meetings in 2024. |
Corporate Governance
|
Nominating and
Corporate Governance
Committee
Joseph W. Evans (Chair)*
William G. Holliman*
Keith J. Jackson*
Precious W. Owodunni*
Alice L. Rodriguez*
*Independent Directors
|
|
The Nominating and Corporate Governance Committee identifies and
recommends to the Board nominees for election to the Board and candidates for appointment to Board committees consistent with criteria approved by the Board. In considering all director nominees, including those nominated by shareholders, this
committee expects all nominees to possess the characteristics of integrity, high personal and professional ethics, sound business judgment and the ability and willingness to commit sufficient time to the Board of Directors. In evaluating the
suitability of individual directors, this committee will take into account many factors, including a general understanding of marketing, finance and other disciplines relevant to the success of the Company in the prevailing business
environment; an understanding of financial service industry issues and the business of the Company; a good educational and professional background; personal accomplishment; and should represent a range of geographic, gender, age, racial and
ethnic backgrounds. This committee will also evaluate each incumbent director to determine whether he or she should be nominated to stand for reelection, based on the types of criteria outlined above as well as the director’s contributions to
the Board of Directors during the relevant term. |
| |
|
|
| |
|
This committee reviews and re-assesses our Corporate Governance Principles,
Related Person Transactions Policies and Procedures, and Stock Ownership Guidelines at least annually. It also oversees the annual peer-to-peer assessment of the Board, recommends to the Board of Directors an Independent Lead Director (as
identified in “Board Leadership Structure” below) and reviews, approves, and, where appropriate, recommends to the Board for approval all “related person” transactions. |
| |
|
|
| |
|
This committee has the authority, in its sole discretion, to select, retain and
obtain the advice and services of one or more consultants, independent legal counsel, accountants or other advisors as it determines necessary to fulfill or assist with the execution of its duties and responsibilities. |
| |
|
|
| |
|
A peer-to-peer assessment as well as an assessment of the
committee’s overall performance is conducted annually. The Board of Directors has determined each member of the Nominating and Corporate Governance Committee is independent under the listing standards of the NYSE. |
| |
|
|
| |
|
The committee held four meetings during 2024. |
| |
|
|
|
Trust and Financial
Services Committee
Charlotte N. Corley (Chair)*
Keith J. Jackson*
Precious W. Owodunni*
*Independent Directors
|
|
The Trust and Financial Services Committee is responsible for supervising, reviewing
and approving the organization of our Trust and Wealth Management department, Mortgage Lending department and the Company’s subsidiary, Linscomb Wealth, Inc. The committee seeks to ensure the proper exercise of the Company’s fiduciary powers,
and the departments and subsidiaries the committee supervises utilize sound risk management practices to minimize risk of loss.
A peer-to-peer assessment of this committee is conducted annually as well as the
committee’s overall performance. The committee’s charter is also evaluated annually.
The committee
held four meetings in 2024.
|
| |
|
|
Corporate Governance
Communications with the Board of Directors
Interested parties and shareholders may send communications to the Board
of Directors, the Independent Lead Director, the non-management directors as a group, or any individual director by writing to the intended recipient(s) in care of the Corporate Secretary at 201 South Spring Street, Tupelo, Mississippi 38804. The
Corporate Secretary will directly forward the received written communications to the recipient(s) indicated on the communication.
Governance Information
In addition to the committee charters described above, our Stock
Ownership Guidelines, Code of Business Conduct and Ethics Policy, Whistleblower and Unethical Conduct Reporting Policy, Corporate Governance Principles and Director Independence Standards are available on the Investor Relations page of our website at
ir.cadencebank.com under the caption “Corporate Governance - Governance Documents.” These materials as well as the committee charters described above are also available in print to any shareholder upon request. Such requests should be
sent to the following address:
Cadence Bank
201 South Spring Street
Tupelo, Mississippi 38804
Attention: Corporate Secretary
Director Independence
The Board of Directors reviews the independence of all directors and
affirmatively makes a determination as to the independence of each director on an annual basis. No director will qualify as independent unless the Board of Directors affirmatively determines the director has no material relationship with the Company
(either directly or indirectly, including, without limitation, as a partner, shareholder or officer of an organization which has a material relationship with the Company). In each case, the Board of Directors broadly considers all relevant facts and
circumstances when making independence determinations. To assist the Board of Directors in determining whether a director is independent, the Board of Directors has adopted Director Independence Standards, which are available on the Investor
Relations page of our website at ir.cadencebank.com under the caption “Corporate Governance - Governance Documents.”
In determining the independence of each director, the Board considered
and deemed immaterial to certain directors’ independence certain transactions involving companies or organizations at which some of our directors were officers or employees during fiscal year 2024, and a lease arrangement with a prior board member,
who is a family member of a current board member. In each case, the amount we paid to these companies or organizations in each of the last three fiscal years was below the 2% of total revenue threshold included in our Director Independence Standards.
Accordingly, the Board of Directors has determined each of directors Araujo, Brown, Cannon, Corley, Evans, Hepner, Holliman, Hood, Jackson, Owodunni, Perry, Rodriguez, Shapiro, and Stanton, constituting a majority of our Board members both before and
following the Annual Meeting, meets our standards as well as the current listing standards of the NYSE for independence, and none of the relationships it considered impaired the independence of our directors.
Director Qualification Standards
The Nominating and Corporate Governance Committee and our Chief Executive
Officer actively seek individuals qualified to become members of our Board of Directors for recommendation to our Board of Directors and shareholders. The Nominating and Corporate Governance Committee considers nominees proposed by our shareholders
to serve on our Board of Directors who are properly submitted in accordance with our Bylaws as discussed in the section below entitled “GENERAL INFORMATION - Shareholder Nominations and Proposals.” The Nominating and Corporate Governance Committee
believes the members who comprise our Board of Directors should represent an array of backgrounds and experiences, and should be capable of articulating a variety of viewpoints. In recommending candidates and evaluating shareholder nominees for our
Board of Directors, the Nominating and Corporate Governance Committee considers each candidate’s qualifications in the context of an assessment of the perceived needs of the Company at that point in time. The Nominating and Corporate Governance
Committee considers a variety of characteristics, including, but not limited to: independence, background, age, gender, stock ownership, influence, and skills, such as an understanding of financial services industry issues. Our director
qualifications are set forth in our Corporate Governance Principles, which are available on the Investor Relations page of our website at ir.cadencebank.com under the caption “Corporate Governance -
Governance Documents.” The Nominating and Corporate Governance Committee meets at least annually with our Chief Executive Officer to discuss the qualifications of potential new members of our Board of Directors. After consulting with our Chief
Executive Officer, the Nominating and Corporate Governance Committee recommends the director nominees to the Board of Directors for their approval. In 2024, the Company utilized the services and paid a fee to Spencer Stuart to assist the Nominating
and Corporate Governance Committee in the director nomination process.
Corporate Governance
The Nominating and Corporate Governance Committee determines the
appropriate characteristics, skills and experiences for the Board of Directors as a whole, as well as for individual directors and nominees, with the objective of having a Board with a variety of backgrounds and experiences. In considering the
structure of the Board, the Nominating and Corporate Governance Committee evaluates each nominee, with the objective of recommending a group of nominees which can best perpetuate the success of Cadence and represent shareholder interests through the
exercise of sound judgment using the Board’s experience.
Board Leadership Structure
As specified in our Corporate Governance Principles, the Board of
Directors does not have a policy with respect to the separation of the offices of Chairman of the Board and the Chief Executive Officer. The Board believes this structure is part of the succession planning process and it is in the best interests of
the Company and our shareholders to retain the flexibility to combine or separate these functions.
Mr. Rollins, our Chief Executive Officer, has served as Chairman of the
Board since April 2014. At that time, the Board determined combining the roles of Chairman of the Board and Chief Executive Officer would add a substantial strategic perspective to the chair position, while providing important continuity to Board
leadership. Each year, the Board evaluates Mr. Rollins’ dual position as Chief Executive Officer and Chairman of the Board and the strategic vision and perspective he brings to the position of Chairman. The Board is unanimously of the view that Mr.
Rollins continues to provide excellent leadership of the Board and his continuing as Chairman serves the best interests of shareholders and the Company.
For 2025, the Nominating and Corporate Governance Committee appointed
Joeseph W. Evans to serve as the Independent Lead Director. Joseph W. Evans will continue as Independent Lead Director after the annual meeting. In this role he:
|
● |
Presides at all meetings of the Board at which the Chairman of the Board or the Chief Executive
Officer is not present, including executive sessions of the independent directors; |
|
● |
Serves as liaison between the Chairman of the Board and the independent directors and between senior
management and the independent directors; |
|
● |
Advises and consults with the Chairman of the Board and the Chief Executive Officer in matters related
to corporate governance and performance of the Board; |
|
● |
Is available for consultation and direct communication with shareholders of the Company; and |
|
● |
Performs such other duties as the Board may from time-to-time delegate. |
Management Succession Planning
Management succession planning is a priority of the Company, which allows
the Company to plan for continuity in its leadership. The Company designed its succession plan to identify and prepare a diversified group of candidates for high-level management positions which become vacant as a result of retirement, resignation,
death, disability, or the pursuit of new business opportunities. On at least an annual basis, the Executive Management Committee assesses the leadership needs of the Company to ensure the selection of qualified leaders who reflect the Company, the
markets it serves, and the communities in which it operates, who possess a range of backgrounds and who possess the necessary skills to serve as a member of the Company’s senior management.
In 2024, the Company expanded its succession analysis, conducting an
expanded review covering three-tiers below the Executive Management Committee as well as significant regulatory roles, which resulted in a review of over 300 roles. The Company continued its engagement of professional coaches to prepare certain of
these individuals for additional career progression through additional development and personal growth opportunities.
The Executive Management Committee, in conjunction with the Chief Human
Resources Officer, is responsible for the Company’s succession planning for each member of senior management, regulatory required positions, and other critical roles, identifying potential candidates to fill future vacancies in those positions. When
making succession plans, and in order to create a broad pool of applicants, the Company strives to promote a diverse pool of candidates for employment, including women, minorities, and/or other historically under-represented groups.
Corporate Governance
The Board of Directors has taken an active role in succession planning
for members of the Executive Management team and has engaged a third-party consulting firm to provide appropriate development support for successor candidates to expand capability in their current roles and to improve readiness for CEO succession and
to other executive roles.
Executive Sessions
Our independent directors have the opportunity to meet in executive
sessions without management and after each board meeting, and do so no less than semi-annually. During 2024, our independent directors met in executive session eight times without management, and the Independent Lead Director presided at those
meetings.
Stock Ownership Guidelines
We have significant Stock Ownership Guidelines which apply to each
director, the Chief Executive Officer, and each other individual identified as an executive officer of the Company (each, a “Covered Participant”). The Stock Ownership Guidelines are available on the Investor Relations page of our website at ir.cadencebank.com under the caption “Corporate Governance - Governance Documents.”
The Stock Ownership Guidelines apply to a Covered Participant only until
the effective date of his or her retirement or resignation from the Company. Each Covered Participant must beneficially own shares of our common stock at a minimum ownership level for as long as he or she is a Covered Participant, as follows:
| Position |
Minimum Ownership Level |
| Chief Executive Officer |
6x base salary |
| All other Executive Officers |
3x base salary |
| Non-Employee Directors |
3x annual retainer |
Holding Periods for Equity Awards
| Minimum Period |
|
On-going ownership requirements |
|
Exception(s)(2) |
| 100% of shares(1) for 1 year |
|
Retention of 75%+ of shares until attain minimum ownership level. |
|
1. For stock options only, to pay the exercise price and tax liability.
2. To pay tax liability on vesting or other equity incentive awards.
|
| |
|
|
|
|
(1) Shares include shares of restricted stock and restricted stock units upon grant
date and shares issued upon the vesting date of performance units or upon the exercise of stock options.
(2) The Nominating and Corporate Governance Committee administers the Stock
Ownership Guidelines and may, in its discretion, consider exceptions if the guidelines place a severe financial hardship on a Covered Participant, or for charitable gifts, estate planning transactions and certain other limited circumstances.
Risk Oversight
Our Board of Directors oversees a Company-wide approach to risk
management, designed to support the achievement of strategic objectives to improve long-term organizational performance and enhance shareholder value. Effective risk oversight is an important priority of the Board. The Board has implemented a risk
governance framework to:
|
● |
Understand critical risks in our business and strategy; |
Corporate Governance
|
● |
Allocate responsibilities for risk oversight among the full Board, its committees and management; |
|
● |
Evaluate our risk management processes and ensure they are functioning adequately; |
|
● |
Facilitate open communication between management and the Board; |
|
● |
Foster an appropriate culture of integrity and risk awareness; and |
|
● |
Monitor and address our risk exposure to cyber-attacks and other security breaches which pose a threat
to our operations. |
The Board implements its risk oversight function both as a whole and
through its committees. All committees of the Board play a significant role in carrying out the risk oversight function. In particular:
|
● |
The Audit Committee oversees risks related to our financial statements, our compliance with legal and regulatory requirements, our financial reporting process and system
of internal controls. The Audit Committee evaluates the performance of our independent auditors and our internal auditing department. The Audit Committee periodically meets privately in separate executive sessions with management, our internal
audit department, and our independent external auditors. |
|
● |
The Risk Management Committee oversees enterprise-wide risk management practices. The committee’s
focus includes the identification, monitoring, management and planning for the Company’s exposure to applicable risks, including, without limitation, market risk, interest rate risk, credit risk, liquidity risk, operational risk, capital risk,
technology risk (including cybersecurity), legal, compliance, and regulatory risk, human resource risk, reputation risk and acquisition and strategic risk, and other such risks as may from time to time be material to us. The committee seeks to
determine whether management has adequately considered all material risks facing us and whether procedures have been effectively implemented in order to sufficiently mitigate the risks identified. The committee provides advice to the Board of
Directors and its other committees as to appropriate risk mitigation procedures and structures, which helps the Board fulfill its responsibilities to effectively monitor and review actions of management. The Risk Management Committee uses
information from management’s Enterprise Risk Oversight Committee, the Enterprise Risk Management department, and other risk managers in fulfilling the Risk Management Committee’s role relative to risk assessment, monitoring and reporting. In
addition, the committee provides oversight and guidance concerning the Company’s responsibility and sustainability initiatives. These initiatives seek to promote the Company’s investments in social capital, human capital, sustainability,
corporate governance, the environment, and to limit or mitigate attendant risks. |
|
● |
The Executive Compensation and Stock Incentive Committee oversees the risks and rewards associated
with our compensation philosophy and programs. As discussed in more detail below in the section entitled “COMPENSATION DISCUSSION AND ANALYSIS,” this committee determines and approves the compensation for our NEOs and the compensation for our
other executive officers, approves, administers and evaluates our incentive compensation plans, equity-based plans and other compensation plans, policies and programs and administers the Executive Compensation Policy. For example, the Executive
Compensation and Stock Incentive Committee will engage a third party, from time to time, to perform an Incentive Compensation Plan Risk Assessment to assist in assessing risk within the Company’s incentive compensation plans and programs,
described below in the “COMPENSATION DISCUSSION AND ANALYSIS - Compensation Program: Process’’ section. |
|
● |
The Nominating and Corporate Governance Committee oversees risks related to our Corporate Governance
Principles and risks arising from related person transactions. |
|
● |
The Credit Risk Committee oversees the overall risks associated with our credit, lending practices,
and the overall adequacy of the commercial lending staff. |
|
● |
The Trust and Financial Services Committee oversees risks related to our fiduciary powers of trust and
wealth management and ensures sound risk management practices are in place to minimize risk of loss. |
Corporate Governance
Although the Board has the ultimate oversight responsibility for the risk
management process, management is charged with actively managing risk. Management has internal processes and policies to identify and manage risks and to communicate with the Board. These include the Enterprise Risk Oversight Committee, the
Enterprise Risk Management department, a real estate risk management group, regular internal meetings of the executive officers, ongoing long-term strategic planning, regular reviews of regulatory and compliance guidance, as well as litigation and
government enforcement actions, a Code of Business Conduct and Ethics Policy, a whistleblower policy, and a comprehensive internal and external audit process. The Board and the Audit Committee monitor and evaluate the effectiveness of the internal
controls at least annually. Management communicates routinely with the Board and its committees, and the Risk Management Committee communicates routinely with the Board regarding significant risks and how the Company is managing them.
The Company conducts internal and third-party audits and assessments
related to information security in accordance with regulatory guidance and industry standards. It also conducts compliance and training programs, which include information security awareness.
| Security Ownership of Certain Beneficial Owners and Management |
Stock Ownership Matters
Beneficial Ownership
The table below sets forth certain information, as
of January 31, 2025 (except as otherwise specified), with respect to the beneficial ownership of our common stock by: (1) each person known by us to be the beneficial owner of more than 5% of the outstanding shares of our common stock, based on a
review of submissions made to the FDIC and the SEC; (2) each director and nominee for director as of the date of this Proxy Statement; (3) each of our NEOs; and (4) all of our directors and executive officers as a group. As of January 31, 2025, a
total of 183,526,121 shares of our common stock were outstanding. Our Stock Ownership Guidelines generally require our directors and NEOs to beneficially own a minimum number of shares of our common stock as described in the section above entitled
“CORPORATE GOVERNANCE - Stock Ownership Guidelines.” The number of shares of common stock owned by each officer and director reflected in the table below includes such shares.
For purposes of this table, we relied on
information supplied by our directors, nominees for director and executive officers as well as submissions made by beneficial owners on Schedule 13G and Schedule 13D.
| Name and Address of Beneficial Owner (1) |
Amount and Nature of
Beneficial Ownership (2) |
Percent of Class |
| The Vanguard Group,
Inc. (3) |
19,330,338 |
10.59% |
| BlackRock, Inc.(4) |
17,647,446 |
9.70% |
| FMR, LLC(5) |
16,375,275 |
8.97% |
| Wellington
Management Group LLP(6) |
12,642,169 |
6.92% |
| State Street
Corporation(7) |
9,712,739 |
5.30% |
| Dimensional Fund
Advisors LP(8) |
9,240,516 |
5.10% |
| Fernando G. Araujo |
-- |
* |
| Chris A. Bagley(9) |
172,355 |
* |
| Edward H. Braddock(10) |
42,075 |
* |
| Shannon A. Brown |
19,166 |
* |
| Deborah M. Cannon |
28,318 |
* |
| Charlotte N. Corley(11) |
11,627 |
* |
| Joseph W. Evans |
165,870 |
* |
| Virginia A. Hepner |
22,491 |
* |
| William G. Holliman
(12) |
36,122 |
* |
| Warren A. Hood, Jr. |
39,538 |
* |
| Keith J. Jackson |
38,172 |
* |
| Tyler L. Lambert(13) |
42,993 |
* |
| Precious W. Owodunni |
16,079 |
* |
| Alan W. Perry |
74,551 |
* |
| Alice L. Rodriguez |
-- |
* |
| James D. Rollins III(14) |
400,097 |
* |
| Marc J. Shapiro |
186,100 |
* |
| Thomas R. Stanton |
21,037 |
* |
| Valerie C. Toalson (15) |
112,271 |
* |
| All current
directors and executive officers as a group (25 persons) |
1,687,889 |
0.92% |
Beneficial Ownership
|
(1) |
The address of each person or entity listed, other than The Vanguard Group, Inc., BlackRock, Inc., FMR,
LLC, State Street Corporation, and Dimensional Fund Advisors LP, is c/o Cadence Bank, 201 South Spring Street, Tupelo, Mississippi 38804. The address of Vanguard Group, Inc. is 100 Vanguard Blvd. Malvern, PA 19355. The address of Blackrock,
Inc. is 50 Hudson Yards, New York, NY 10001. The address for Wellington Group LLP is 280 Congress Street, Boston, MA 02210. The address for State Street Corporation is 1 Congress Street, Suite 1, Boston, MA, 02114. The address for FMR, LLC 245
Summer Street, Boston, MA 02210. The address for Dimensional Fund Advisors LP is 6300 Bee Cave Road, Building One, Austin, TX, 78746. |
|
(2) |
Beneficial ownership is deemed to include shares of common stock an individual has a right to acquire
within 60 days after January 31, 2025. These shares are deemed to be outstanding for the purposes of computing the “percent of class” for that individual, but are not deemed outstanding for the purposes of computing the percentage of any other
person. Information in the table for individuals also includes shares held for their benefit in our 401(k) Profit-Sharing Plan, and in individual retirement accounts for which the shareholder can direct the vote. Except as indicated in the
footnotes to this table, each person listed has sole voting and investment power with respect to all shares of common stock shown as beneficially owned by him or her pursuant to applicable law. The amount of shares reflected as beneficially
owned by some of the executive officers includes unvested restricted stock with regard to which these individuals hold only voting power and not investment power. No shares beneficially owned by executive officers are held in margin accounts,
are pledged, or are otherwise available to a lender as security. |
|
(3) |
Based on shares beneficially owned by The Vanguard Group, Inc. as set forth in a Schedule 13G/A dated
February 13, 2024, and filed with the SEC on February 13, 2024. The Vanguard Group, Inc. reported it possesses sole voting power with respect to 0 of such shares, shared voting power with respect to 156,376 of such shares, sole dispositive
power with respect to 18,981,875 of such shares, and shared dispositive power to 348,513 of such shares. |
|
(4) |
Based on shares beneficially owned by BlackRock, Inc. as set forth in a Schedule 13G dated January 24,
2024 and filed with the SEC on January 24, 2024. BlackRock, Inc. reported it possesses sole voting power with respect to 17,341,045 of such shares, shared voting power with respect to 0 of such shares, sole dispositive power with respect to
17,347,446 of such shares, and shared dispositive power to 0 of such shares. |
|
(5) |
Based on the number of shares beneficially owned by FMR LLC, and Abigail P. Johnson (Ms. Johnson) on
behalf of the members of the Johnson family, who form a controlling group with respect to FMR LLC, as set forth in a Schedule 13G dated February 8, 2024, and filed with the SEC on February 9, 2024. FMR LLC reported it possesses sole voting
power with respect to 16,359,925 shares, shared voting power with respect to 0 shares, sole dispositive power with respect to 16,375,275 of such shares, and shared dispositive power to 0 of such shares. Ms. Johnson reported the Johnson family
possesses sole voting power with respect to 0 shares, shared voting power with respect to 0 shares, sole dispositive power with respect to 16,375,275 of such shares, and shared dispositive power to 0 of such shares. |
|
(6) |
Based on shares beneficially owned by Wellington Group Holdings LLP, as set forth in a Schedule 13G
filed with the SEC on November 8, 2024. Wellington Group Holdings LLP reported it possesses sole voting power with respect to 0 such shares, shared voting power with respect to 10,737,876 shares, sole dispositive power with respect to 0 shares,
and shared dispositive power with respect to 12,642,169 of such shares. |
|
(7) |
Based on shares beneficially owned by State Street Corporation, as set forth in a Schedule 13G filed
with the SEC on February 6, 2025. State Street Corporation reported it possesses sole voting power with respect to 0 of such shares, shared voting power with respect to 1,274,452 shares, sole dispositive power with respect to 0 shares, and
shared dispositive power to 9,712,739 of such shares. |
|
(8) |
Based on the number of shares beneficially owned by Dimensional Fund Advisors LP, as set forth in
Schedule 13G dated February 14, 2024 and filed with the SEC on February 9, 2024. Dimensional Fund Advisors LP reported it possesses sole voting power with respect to 9,032,970 of such shares, shared voting power with respect to 0 of such
shares, sole dispositive power with respect to 9,240,516 shares, and shared dispositive power with respect to 0 shares. |
|
(9) |
Includes 5,972 restricted stock units and 16,109 performance stock units which vest within 60 days of January 31, 2025. |
|
(10) |
Includes 1,700 restricted stock units and 4,534 performance stock units which vest within 60 days of January 31, 2025. |
|
(11) |
Includes 10,286 shares of which Ms. Corley shares voting and investment power with her spouse. |
|
(12) |
Includes 36,122 shares of which Mr. Holliman shares voting and investment power with his spouse. |
|
(13) |
Includes 2,359 restricted stock units and 5,568 performance stock units which vest within 60 days of January 31, 2025. |
|
(14) |
Includes 16,220 restricted stock units and 43,753 performance stock units which vest within 60 days of January 31, 2025. |
|
(15) |
Includes 3,244 restricted stock units and 8,750 performance stock units which vest within 60 days of January 31, 2025. |
| Compensation Discussion and Analysis |
The purpose of this Compensation Discussion and
Analysis is to provide shareholders with insight into the views of the Executive Compensation and Stock Incentive Committee (the “Compensation Committee” or the “Committee”), the Committee’s objectives in selecting and setting the performance metrics
and elements of the compensation paid or awarded to our Named Executive Officers (“NEOs”), and to discuss our philosophy, practices and procedures with respect to our executive compensation program.
Our discussion will focus on our NEOs, who are as follows:
| Name |
Title |
| James D. Rollins III |
Chief Executive Officer |
| Valerie C. Toalson |
Chief Financial Officer and President - Banking Services |
| Christopher A. Bagley |
President and Chief Credit Officer |
| Edward H. Braddock |
Chief Banking Officer |
| Tyler L. Lambert |
Chief Risk Officer |
Executive Summary
2024 Business Highlights
In 2024, the Company improved operating performance
through steady balance sheet growth, reduction of debt, stable credit quality, and improved net interest margin and operating efficiency. The accomplishments of management for the year-ended December 31, 2024, are outlined below:
|
- |
Generated net organic loan growth of $1.2 billion, or 3.8% for the year while core customer deposits,
which exclude brokered deposits and public funds, increased $2.2 billion, or 6.9%. |
|
- |
Reported annual adjusted pre-tax pre-provision net revenue (PPNR)2 from continuing operations of $739.0 million, or 1.54% of average assets, an increase of $126.7 million, or 20.7%, compared to 2023. |
|
- |
Increased net interest margin for the year by 22 basis points to 3.30%. |
|
- |
Achieved continued improvement in operating leverage reflected in a decline in the adjusted efficiency
ratio2 from 63.3% in 2023 to 58.4% in 2024. |
|
- |
Recorded stable net charge-offs as a percent of average loans in 2024 of 0.24%, and criticized loans
improved 5.9% to $794.5 million at December 31, 2024. |
|
- |
Repurchased 1,237,021 shares of Company common stock at a weighted average price of $26.74; tangible
book value per common share increased to $21.54 per share at December 31, 2024, up $2.22 per share, or 11.5%, compared to December 31, 2023 while tangible common shareholders’ equity to tangible assets increased from 7.44% to 8.67% over the
same time period. |
|
- |
Increased quarterly Common Stock dividend to $0.275 per share in the first quarter of 2025. |
2024 Compensation Highlights and Program Advances
In late 2023 and early 2024, the Compensation
Committee met to consider the Company’s 2024 executive compensation program guided by the compensation principles described in the section entitled “Compensation Program: Principles, Philosophy, and Objectives” below. In recent years, the Committee
has reconfigured its program, identifying and concentrating on a narrower range of metrics intended to focus attention on short and long-term goals, and making annual increases in the proportion of performance stock units (“PSUs”) to restricted stock
units (“RSUs”) until it reached a ratio of 65% PSUs and 35% RSUs in 2024. While the Committee has received favorable feedback from shareholders on these adjustments, in its review of the executive compensation program, the Committee further
considered unexpected market conditions in 2023 and the crisis that led to failures of other financial institutions. The Committee recognized the benefit of structurally addressing risk factors that could result from unexpected market conditions. In
response to these considerations, the Committee adopted “risk triggers,” which either automatically eliminate or give the Committee discretion to reduce or eliminate annual incentive compensation in response to certain events that could create
concerns for the safety and soundness of the Company. Those events include loss of well-capitalized status, which automatically eliminates annual incentives, and serious liquidity and credit downturns as well as other factors, which give the
Committee discretion to eliminate all or a part of an annual incentive.
|
2 |
Please see Appendix A for additional information and a reconciliation of these measures to financial measures derived in
accordance with U.S. GAAP. |
Compensation Discussion and Analysis
The Committee also considered the potential of
volatility in the business environment and regulatory actions that make it more challenging to set absolute performance goals. In response to this concern, the Committee adopted a “market condition modifier.” In the 2024 annual incentive grants, the
Committee provided a relative measure as an alternate metric in the event the actual operating revenue metric of the annual incentive plan did not meet threshold. The relative measure of PPNR as a percentage of assets may be reviewed by the Committee
as compared to peers in the KRX so that the Committee may provide a reduced award based on superior relative performance during unexpected market events.
The Committee believes these two mechanisms work
together to provide appropriate incentives and safeguards and the compensation structure as a whole aligns with shareholders’ interests, provides the Company with the ability to retain key talent, and encourages management to take appropriate but not
unnecessary risks.
Also, in 2024, the Company reached the third
anniversary of the merger of Cadence Bancorporation, N.A. and BancorpSouth Bank as well as the vesting of the merger integration grants (the “Integration Grants”). As described in more detail in the section entitled “Conclusion of the Integration
Grants,” the Committee reviewed the progress of the goals and metrics in the Integration Grants and calculated the shares to be awarded. Following completion of the performance period on September 30, 2024, the trailing efficiency ratio for the
period ending December 31, 2024, improved. The Committee believes this continued enhancement in the efficiency ratio and focus on expense control was supported by the Integration Grants and has benefitted the Company and shareholders.
Shareholder Outreach and Say-on-Pay Results
When setting compensation policy, the Committee
solicits and values the viewpoints of shareholders and other stakeholders. In 2024, our Say-on-Pay vote received support from 98.21% of our shareholders. The Committee routinely seeks to improve our compensation program and has adopted a formal
shareholder engagement process. Our formal engagement efforts supplement the many calls, conferences, and other shareholder outreach performed by the Company’s executive management and investor relations team throughout the year.
During late 2024 and early 2025, members of our
Board, executive management and investor relations team met with a number of our top institutional shareholders to solicit their views on our compensation program, among other practices. During this engagement process, we contacted our top 25 holders
representing 67.53% of our outstanding shares. Five of our shareholders, representing 13.65% of our outstanding shares, met with us. The meetings were led by Joseph Evans, the Company’s Independent Lead Director, who invited discussion on executive
compensation, governance, compliance, and any other issues raised by shareholders. Upon completion of the meetings, the Committee reviewed a summary of the shareholder insights, which was provided to the full Board of Directors.
In our meetings, we received positive feedback on
the changes we’ve made to our program and disclosures. Below is a summary of the feedback we received from shareholders related to compensation, and how we responded to this feedback.
| What we heard |
Action taken |
| Well-designed
program |
The form of our program
is substantially the same, including an emphasis on performance units and eliminating duplication of metrics. In 2024, we added risk triggers to address payments in case of unexpected negative events and market condition modifiers as described
above. |
| Supportive of
inclusion of Total Shareholder Return (“TSR”) as part of compensation program |
In 2024, we changed the
role of TSR from a stand alone metric to a modifier that affected all component metrics. |
| Supportive of the
use of relative metrics |
We continue to adopt
relative measures to compare our performance to peers. In 2024, all metrics for long term incentive awards were based on relative performance. |
Compensation Discussion and Analysis
Executive Compensation Governance
The Compensation Committee relies on strong
governance practices and compensation metrics which address risk management and are intended to align with the interests of our shareholders. The list below outlines many of our compensation practices.
|
✔ |
Executive Compensation Policy. We maintain an Executive Compensation Policy, which outlines the principal criteria used to measure the success of our executive officers in achieving our business objectives. |
|
✔ |
Review Compensation Program. We review our compensation program against market practices to confirm it is competitive and review them to ensure they do not encourage excessive risk-taking. |
|
✔ |
Pay for Performance. We provide short-term and long-term incentive awards based on performance targets aligned with identified business performance metrics. |
|
✔ |
Balance of Performance Metrics. We use multiple performance metrics and multi-year vesting timeframes to prevent over-emphasis on any single metric and minimize short-term risk-taking. |
|
✔ |
Long Vesting Periods. Awards of our restricted stock units prior to 2023 vested on a cliff basis of four years. Beginning in 2023, restricted stock units vest ratably over years 2, 3, and 4. Performance awards have
cliff vesting following a three-year performance period. |
|
✔ |
Stock Ownership Guidelines. We maintain rigorous stock ownership guidelines for our directors and executive officers, in |
|
|
order to more closely align the financial interests of the directors and executive officers with those of our shareholders. |
|
✔ |
“Clawback Policy.” We maintain a clawback policy which sets forth the conditions under which we may recover excess incentive-based compensation (as defined in our policy) paid or awarded to or received by any of our current or
former executive officers. |
|
✔ |
“Double Triggers.” Our change in control agreements include a “double trigger” requiring both a change in control and termination of the executive’s employment without cause or by the executive for good reason, within a set period
of time for the executive to receive payment. |
|
✔ |
Shareholder Engagement. In late 2024 and early 2025, we conducted a shareholder engagement program, during which we communicated with holders of over 13% of our shares. Additionally, we are available year-round for shareholder questions
and comments both in person and virtually, and we have ongoing shareholder interactions through direct contact, as well as meetings with advisors, shareholders, and other stakeholders. |
|
✔ |
Annual Say-on-Pay Vote. We conduct an annual say-on-pay vote for shareholders to approve executive compensation of our NEOs. |
|
X |
Dividends on Unearned PSUs and RSUs. PSUs and RSUs accrue dividend equivalents during the performance period, which are not paid to the executive until vesting. |
|
X |
Short Selling, Use of Derivatives or Pledging. Our insider trading policy prohibits our directors and executive officers from any short selling or hedging activities, from trading derivative instruments related to our
securities, and from pledging our securities. |
|
X |
“Gross Ups.” We do not provide tax “gross up” payments. |
|
X |
Option Repricing. Our long-term equity incentive plans prohibit option repricing without the approval of our shareholders. |
|
X |
Option Backdating or “Spring-Loading.” We do not backdate options or grant options retroactively. |
|
X |
Multi-year Guaranteed Bonuses. We do not award multi-year guaranteed bonuses. |
Compensation Discussion and Analysis
Compensation Program: Principles, Philosophy and
Objectives
Our executive compensation program is designed to
provide compensatory incentives to an experienced and engaged management team while the team implements the Company’s short- and long-term strategic goals. The program balances the emphasis placed on growth and earnings with well-considered
governance and risk management.
| Compensation Principles |
How
Our Program Aligns with
Our Principles |
| Developing a
market-competitive plan designed to attract quality executive talent |
 Base salary, annual cash incentives, and long-term equity incentives are evaluated against the median of our peers Base salary, annual cash incentives, and long-term equity incentives are evaluated against the median of our peers |
| Emphasizing
performance-based compensation |
Pay is weighted toward at-risk, performance cash and equity compensation
Payouts under the annual cash and long-term equity incentive plans are variable, based on the results of
the underlying metrics
Providing a limited payout when management performs better than peers in the event of a downturn
affecting absolute metrics
|
| Setting clear and specific
annual and long-term goals supporting the Company’s strategic business goals |
Metrics selected by the Committee align with current Company strategic goals for annual and long-term
incentives
Long-term goals set a pathway for improvement year over year
|
| Alignment with the long-term
interests of shareholders |
Equity awards vest over a three- or four-year period
Stock Ownership Guidelines require the CEO to maintain six times his base salary in equity and for other
executive officers to maintain at least three times their base salaries in equity
|
| Taking into account the
opinions and expectations of shareholders and the advice of professionals |
Conducting a concerted seasonal shareholder engagement effort and meeting with shareholders throughout
the year
Engaging a compensation consultant to provide expert advice on our program and a comparison to the market
|
| Encourage consistency with
safe and sound practices and discourage excessive risk-taking |
Outside review of compensation practices to ensure
compensation arrangements are designed to support intended results without excessive risk
Eliminating or reducing bonuses as a result of the occurrence of
certain risk triggers
|
Compensation Discussion and Analysis
Compensation Program: Process
The Compensation Committee is composed entirely of
directors who are independent under the listing standards of the NYSE, our Director Independence Standards, and Exchange Act Rule 16b-3. The Director Independence Standards and the charter of the Executive Compensation and Stock Incentive Committee
are each available on our website at ir.cadencebank.com on our Investor Relations web page under the caption “Corporate Governance - Governance Documents.” The charter is reviewed annually by the Compensation Committee and was most
recently revised in 2024.
In 2024, Aon plc (“Aon”) acted as the Committee’s
compensation consultant. The Committee reviewed a letter from Aon dated April 12, 2024, attesting to its independence at its May meeting. The Committee considered independence factors prescribed by applicable regulations and concluded none of the
work provided by Aon raised any conflicts of interest and determined Aon met the independence criteria. Aon reported to and was directed by the Committee. Aon provides only compensation consulting services, which includes benchmarking executive
compensation against peer institutions, advice to the Committee on non-executive compensation structure, and a risk review of all incentive plans, for the Company. When setting criteria and evaluating performance in 2024, the Committee relied upon
the expertise and advice of Aon.
The Compensation Committee engaged Aon beginning in
2023 to conduct a risk assessment of all the Company’s compensation programs, including executive and broad-based employee compensation programs and policies to identify any aspect which could encourage inappropriate risk taking. In 2024, Aon
concluded each of our incentive compensation programs and policies are well-designed and do not encourage behaviors which would create material risk to the Company. The incentive compensation programs contain drivers which align with corporate
objectives and have plan design features that minimize organizational risk. After reviewing the findings of the risk assessment, the Committee believes there is an appropriate balance in the structure of our incentive compensation programs, and our
incentive compensation plans and policies include terms designed to mitigate any potential material risks created by the performance-based metrics used in the incentive compensation plans.
The Committee has adopted a process intended to
provide appropriate oversight and to make compensation decisions designed to encourage executives to accomplish the Company’s goals and strategic plans. The Committee held six meetings in 2024, which include its four regular quarterly meetings. Prior
to each regular meeting, the materials are provided to each Committee member, including minutes of the previous meeting, an agenda, recommendations for the upcoming meeting and other materials relevant to the agenda items. Historically, the Chief
Executive Officer has attended Committee meetings to provide information to the Committee concerning the performance of executive officers, discuss performance measures relating to executive officer compensation and to make recommendations to the
Committee concerning the compensation of executive officers. The Committee holds executive sessions consisting only of Committee members and the Independent Lead Director and periodically meets in executive session with the independent compensation
consultant retained by the Committee for advice on executive compensation. The Chief Executive Officer does not engage in discussions with the Committee regarding his own compensation, except to respond to questions posed by Committee members outside
of executive session deliberations.
In setting the compensation of our NEOs, the
Committee reviewed all components of their respective compensation, including base salary, annual non-equity incentive compensation and long-term equity incentive compensation. In addition, the Committee reviewed their compensation history and
comparative performance information. The Committee reviewed and discussed the pay, equity incentives, perquisites, and retirement benefits of similarly- situated NEOs from our peer group. The Committee further reviewed and discussed the composition
and weighting of the types of equity incentives as well as the typical performance metrics associated with cash and equity incentives. Lastly, the Committee reviewed and discussed Company performance in comparison with peer banks.
The Compensation Committee believes the overall
compensation for our NEOs is competitive with our peer group and is commensurate with the goals we have set for them as well as the responsibilities assigned to their respective positions. The differences in the compensation paid to each of our NEOs
in relation to one another is a reflection of differences in the level and scope of responsibility of their respective positions, their experience level in their current position, and the market’s pattern of providing progressive award opportunities
at higher levels.
Compensation Discussion and Analysis
Compensation Components
Our executive compensation program consists of the
following primary elements, which are used in conjunction with one another in varying proportions to provide competitive total compensation:
|
● |
Base salary is intended to provide a foundation element of compensation that is
relatively secure and reflects the skills and experience an executive brings to us; we seek to pay base salaries which are competitive with those paid to executive officers in comparable positions at comparable financial institutions; |
|
● |
Annual cash incentive compensation is a variable, cash award based on the achievement of
defined goals for a given fiscal year; |
|
● |
Long-term equity incentive compensation is a variable, equity element which provides an
emphasis on long-term performance goals and stock price performance; |
|
● |
Employee benefits are intended to provide reasonable levels of security with respect to
retirement, medical, death and disability protection and paid time off; and |
|
● |
Certain perquisites are used to supplement the other elements of compensation,
facilitating the attraction and retention of executive officers of the caliber we believe necessary to remain competitive. |
Review of Peer Group Data
The Compensation Committee reviews the compensation
of the Chief Executive Officer and our other NEOs relative to the compensation paid to similarly-situated executives at financial institutions we determine to be peer companies. While it does not impose rigid benchmarking as part of the process, the
Committee does compare the compensation of the individual NEOs to similarly- situated executives as a point of reference for measurement for the Committee’s review and analysis. Because this peer group analysis is just one of the analytical tools
used in setting the compensation of our NEOs, the Committee has discretion in determining the nature and extent of its use.
In May 2024, Aon assisted the Committee in
reviewing the peer group using publicly-available information from potential peer companies. The selection criteria included regional banks based on their asset size as set forth below along with the inclusion of a historical competitor, Texas
Capital Bancshares, due to geography. The Company’s asset size closely aligns with the median of the group. After conducting this analysis, the Committee reaffirmed the full 2023 peer group for 2024 as follows:
| Associated Banc-Corp |
First Horizon Corp. |
Texas Capital Bancshares, Inc. |
| |
|
|
| BankUnited, Inc. |
Hancock Whitney Corp. |
UMB Financial Corp. |
| |
|
|
| BOK Financial Corp. |
Old National Bancorp |
Valley National Bancorp. |
| |
|
|
| Comerica, Inc. |
Pinnacle Financial Partners |
Webster Financial Corp. |
| |
|
|
| Cullen/Frost Bankers, Inc. |
Prosperity Bancshares, Inc. |
Wintrust Financial Corp. |
| |
|
|
| East West Bancorp, Inc. |
SouthState Corp. |
Western Alliance Bancorp |
| |
|
|
| F.N.B. Corp. |
Synovus Financial Corp. |
Zions Bancorp. NA |
Compensation Discussion and Analysis
Target Compensation Mix
The following charts present the mix of
compensation elements which make up the total target compensation for 2024 for our Chief Executive Officer and an average of the compensation targets of the remaining NEOs. For purposes of this chart, total target compensation is composed of (i) base
salary; (ii) the value of time-vested equity, (iii) the value of performance-based equity, and (iv) the target annual incentive compensation.
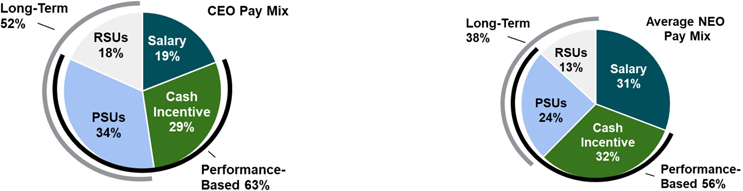
|
** |
Values for restricted stock units and regular performance stock units are determined as of the date of the grant. |
2024 Compensation—Executive Opportunities and Committee
Decisions
The Compensation Committee focuses both on the mix
of individual components that make up each executive’s total compensation as well as the amount of total compensation itself to determine the total compensation package for each NEO. Each of the components of compensation is discussed in more detail
below. The charts below set forth the base salaries, the target for the annual cash incentive, and the total equity award targets, divided between PSUs and RSUs, for 2024.
Base Salary
Base salary is intended to provide a foundation
element of compensation that is relatively secure and reflects the skills and experience an executive brings to us; we seek to pay base salaries which are competitive with those paid to executive officers in comparable positions at comparable
financial institutions.
Following 2023, in which no adjustments were given
to Mr. Rollins, Ms. Toalson, or Mr. Bagley, the Compensation Committee increased base salary in 2024 as set forth below after reviewing the market data for the Company’s peers. Mr. Braddock was promoted to Chief Banking Officer and received an
increase commensurate with his new position and duties. Mr. Lambert also received a base salary increase as noted below in accordance with the market.
| Name |
Base Salary as of Year-End |
Absolute Change |
Change as a
Percentage |
| James D. Rollins III |
$1,040,000 |
$40,000 |
4.0% |
| Valerie C. Toalson |
$600,000 |
$50,000 |
8.3% |
| Christopher A. Bagley |
$700,000 |
$25,000 |
3.8% |
| Edward H. Braddock |
$515,000 |
$90,000 |
17.5% |
| Tyler L. Lambert |
$440,000 |
$40,000 |
9.1% |
Compensation Discussion and Analysis
Annual Incentive Compensation
Annual cash incentive compensation is a variable, cash award based on
the achievement of defined goals for a given fiscal year. Each NEO has an opportunity to receive annual incentive compensation as a percentage of base salary. The table below provides the opportunities for each NEO.
| Name |
Cash Incentive Opportunity(1) |
2024 Target |
| James D Rollins III |
150% of base salary |
$1,560,000 |
| Valerie C. Toalson |
100% of base salary |
$600,000 |
| Christopher A. Bagley |
125% of base salary |
$875,000 |
| Edward H. Braddock |
100% of base salary |
$515,000 |
| Tyler L. Lambert |
100% of base salary |
$440,000 |
|
(1) |
The incentive opportunity is shown at target. If all metrics were achieved at maximum or higher, the award would be limited to 200% of target. |
The Committee developed metrics and goals for the 2024 annual
performance cycle to support the creation of shareholder value. Below we explain how our goals align with our long-term strategy.
| What
Are Our Goals |
How We Calculate Achievement |
Why Our Goals Matter |
| Adjusted Total Operating Revenue(1) |
Target attainment is determined by the budget approved by the Board.
The calculation of adjusted total operating revenue will generally exclude nonroutine revenue.
|
Along
with adjusted non-interest expense, provides an appropriate measure of core profitability. |
| Adjusted Non-interest Expense(1) |
Target attainment is determined by the budget approved by the Board.
The calculation of adjusted non-interest expense generally excludes nonroutine expenses.
|
Along
with adjusted total operating revenue, provides an appropriate measure of core profitability. |
| Relative Net Charge-Offs/Average Loans(2) |
Dividing
total charge-offs less recoveries by average loans during the fiscal year as compared to the KRX Index. |
Targeting
credit metrics helps to establish the risk profile of the Company, which the Board monitors closely. The Company’s risk profile assumes the attainment of financial goals without increasing credit risk beyond normal peer levels. |
(1) May be adjusted if performance of non-executive officers in revenue-generating
compensation programs exceeds budgets to ensure incentives remain aligned.
(2) Measured by relative performance of net charge-off to average loans as compared to the
institutions included in KBW Regional Banking Index (KRX Index). The KRX Index is composed of approximately 50 publicly traded companies that do business as regional banks or thrifts listed on U.S. stock markets.
Compensation Discussion and Analysis
The Committee retained the authority to adjust the final calculation of
incentive payout utilizing any of three defined modifiers. Although none of these modifiers were utilized in 2024, the Committee believes the modifiers provide a methodology to calculate appropriate payouts in the event of unforeseen circumstances so
that payouts are balanced and fair for the Company, executives and shareholders. The three defined modifiers are as follows: (a) a discretionary adjustment, either individually or as a group, by +/- 20%, (b) a market condition modifier to reward
superior performance when unexpected market conditions occur that impact the industry’s ability to achieve absolute revenue targets (described above in footnote 1), and (c) risk triggers that automatically eliminate or provide the Committee with the
discretion to eliminate the award in whole or in part. The triggers are described in the charts below.
| Market Condition
Modifier |
| Metric Adjustment |
Payout/Rationale |
Threshold |
Target |
Maximum |
| Adjusted Operating Total Revenue metric changed to Relative Operating PPNR/Assets if threshold for Adjusted Operating Total Revenue is not met |
Discretionary based on relative ranking; weighted payout lowered so that full payout is not
achievable
Rewards superior performance in unexpected market conditions
|
25th percentile up to 50th percentile |
50th percentile up to 75th percentile |
75th percentile and above |
|
Weighted payout not to exceed 20%
|
Weighted payout not to
exceed 36% |
Weighted payout not to exceed 60% |
In addition to the formal metrics, the 2024 plan also contained risk triggers that either
automatically eliminate or give the Committee discretion to eliminate annual incentive compensation as set forth in the table below.
| Risk Triggers |
| Measure |
Trigger |
Result |
| Well-capitalized status |
Falling below well-capitalized status |
No annual incentive |
| Liquidity status |
Total wholesale funding to total deposits and borrowing >20% |
Discretion up to elimination of entire award |
| Credit quality |
Material, unanticipated increase in non-performing assets or criticized loans |
Discretion up to elimination of entire award |
| Other factors |
Including CAMELS rating, MRBAs or non-financial considerations |
Discretion up to elimination of entire award |
2024 Annual Incentive Results
The metrics and weightings of each goal and the Company’s performance are set forth in the chart below.
| Performance Goal |
Factor
Weighting |
Threshold |
Target |
Maximum |
Actual
Performance |
Weighted
Payout |
Adjusted
Operating Total Revenue
(Dollars in Thousands) |
40% |
$1,605.94 |
$1,784.38 |
$2,052.04 |
$1,780.70 |
39.37% |
Adjusted
Non-interest Expense
(Dollars in Thousands) |
40% |
$1,115.71 |
$1,062.58 |
$1,009.45 |
$1,041.70 |
55.72% |
Relative Net
Charge Offs/Average
Loans |
20% |
35th
percentile |
55th percentile |
75th
percentile |
33rd
percentile |
0.00% |
| Total |
95.09% |
The table below shows the payout by NEO:
| NEO |
Actual Performance
(% of Target) |
Amount of Payment |
| James D Rollins
III |
95.09% |
$1,483,404 |
| Valerie C.
Toalson |
95.09% |
570,540 |
| Christopher A.
Bagley |
95.09% |
832,038 |
| Edward H.
Braddock |
95.09% |
489,714 |
| Tyler L. Lambert |
95.09% |
418,396 |
Compensation Discussion and Analysis
Long-Term Equity Incentive Compensation
Long-term incentive compensation is an important part of our executive
compensation program. In 2024, the Company’s long- term equity incentive compensation was granted in the form of PSUs and RSUs. Following the results of the shareholder engagement process, a review of the practices of our peers, and consideration of
the effect on performance, the Committee reconfigured the ratio of PSUs and RSUs and, in 2024, awarded 65% of each NEO’s equity grant in PSUs and 35% in RSUs. The exception to this split occurred with respect to Mr. Lambert who received a special
award of 6,321 RSUs later in the year for retention purposes in connection with the Committee’s review of succession planning.
In determining the total number of equity-based awards to be granted to
recipients in the 2024 annual grants, the Compensation Committee determined the number of units by dividing the established dollar value of the award by the volume-weighted average price during March 2024. Mr. Lambert’s October award was determined
using the volume-weighted average price during September 2024. In determining the dollar value of each award, the Committee considered factors such as:
|
● |
Market competitive data; |
|
● |
Scope of responsibility of each officer; |
|
● |
Degree to which the business unit(s) influenced by each officer contributed to our profits; |
|
● |
Degree to which asset quality and other risk decisions were influenced by each officer’s direction; and |
|
● |
Long-term management potential of each officer. |
| Name |
Equity Incentive Opportunity |
Performance Units at Target |
Restricted Stock Units |
| James D. Rollins III |
275% of base salary |
66,991 units |
36,072 units |
| Valerie C. Toalson |
125% of base salary |
17,568 units |
9,459 units |
| Christopher A. Bagley |
150% of base salary |
24,595 units |
13,243 units |
| Edward H. Braddock |
100% of base salary |
11,360 units |
6,117 units |
| Tyler L. Lambert |
100% of base salary |
10,306 units |
11,871 units |
Restricted Stock Units
Restricted stock units are the time-based method of equity grant
currently utilized by the Committee. The Committee determined awards granted in 2024 should be subject to graded vesting with one-third vested on each of the second, third, and fourth anniversaries of grant. The holder is not entitled to exercise
voting rights on the shares until the award is vested and does not receive dividends. However, dividend equivalent payments are accrued on the award and paid when the award becomes vested. Because the value of each RSU varies based upon the price of
the Company’s common stock, the Committee views RSUs as an effective performance-related component of equity compensation that aligns the interest of the executive with our shareholders.
Performance Stock Units
Equity-based performance awards also align the interests of our
executives with those of our shareholders and encourage attainment of strategically important financial objectives. Performance stock units are subject to a three-year performance period for the attainment of goals. The Company believes a three-year
performance period reflects a realistic time period for establishing credible performance goals and also meets the Company’s goals of encouraging retention and focusing on long -term growth. The holder accrues dividend equivalents during the
performance period which are only paid when all award vesting conditions have been satisfied. The award cycle for long-term incentive compensation is structured so that a new three-year performance period will begin every year.
Compensation Discussion and Analysis
Performance Stock Units–2024 Awards
The Committee developed metrics and goals for the 2024-26 performance
period to support the creation of shareholder value. Below we explain how our goals align with our long-term strategy.
| What
Are Our Goals |
How We Calculate Achievement |
Why Our Goals Matter |
| Relative Core PPNR/Avg. Assets |
Core
PPNR relative performance will be measured for the three-year performance period, and compared to the KRX Index. Performance will be determined by measuring performance for each year of the three-year period and compared to the KRX Index for
that year. |
Provides an appropriate measure of core profitability due to its insulation from the volatility in
loan loss provision expense in various economic cycles. The use of core PPNR provides a clear assessment of the operating performance of the Company.
The components of PPNR in the annual incentive plan measure the Company’s attainment of annual
financial goals. This relative measure determines the Company’s comparative performance in relation to its peers each year over a three-year period.
|
| Relative Growth in core EPS |
Measures
the growth of core earnings per share over the full performance period. EPS reported by the Company and by the banks represented in the KRX Index will be calculated annually and the Company’s percentile rank determined. The growth rate for the
full performance period will be an average of the Company’s ranking over the three-year period. If core EPS for the three-year period is negative, the maximum payout is 100% for this metric. |
This
measure addresses core net income after tax per share which is a meaningful measure for forward trading multiples and further aligns the interest of the executive with the shareholders over the performance period. Sustained growth in earnings
per share at a rate above its peers should generate opportunity for value creation given the increased support for higher stock price, organic capital generation to support growth and support for increasing dividends. |
| Modifier |
|
|
| Relative Total Shareholder Return |
TSR
is the overall appreciation in the Company’s stock price plus any dividends paid by the Company during the measurement period relative to the performance of the banks represented in the KRX Index. If TSR is negative, the modifier will not
exceed 100% of target. |
This
measure aligns the interest of the executive with the results provided to shareholders over the period. Above median shareholder return over a sustained period of time, which includes the Company’s ability to provide a strong dividend, directly
reflects the Company’s ability to generate attractive returns for its shareholders. |
Compensation Discussion and Analysis
In 2024, the Compensation Committee evaluated a series of metrics and
relative goals, including current and historical goals to determine the desired balance of metrics. The Committee decided to focus on two metrics—earnings per share (“EPS”) and relative core PPNR/average assets. The Committee adopted a more rigorous
threshold, target, and maximum for EPS in 2024 than adopted in 2023. For the relative core PPNR over average assets, the Committee adopted a stepped approach within the performance period, which is designed to encourage improved core PPNR/average
assets in manageable increments as set forth below. The Committee feels that the stepped approach to relative improvement provides a roadmap of their expectations and the target for each year reflects a significant improvement in the Company’s
performance as compared to the prior year’s relative ranking, resulting in an above-median target for the final and most heavily-weighted year of the performance period.
| Performance Goal (1) |
Threshold Amount (2) |
Target Amount (2) |
Maximum Amount (2) |
Factor Weighting |
| Relative Growth in EPS(3) |
30th percentile |
55th percentile |
80th percentile |
50% |
| Relative Core PPNR/Average Assets |
| Year 1 |
20th percentile |
30th percentile |
45th percentile |
15% |
| Year 2 |
30th percentile |
40th percentile |
55th percentile |
15% |
| Year 3 |
45th percentile |
55th percentile |
70th percentile |
20% |
| Application Modifier |
| TSR(4) |
25th percentile/75% |
50th percentile/100% |
75th percentile/125% |
N/A |
|
(1) |
Performance below the threshold in all measures results in no shares being earned, and performance at target in all measures results in 100%
payout. Performance at threshold results in a 25% payout. Performance equal to or above the maximum results in a 200% payout. Straight-line interpolation is applied between points. |
|
(2) |
Subject to the required service during the performance period, PSUs are earned if at least the threshold performance goal is achieved with
respect to one of the performance measures. The number of performance shares actually earned is then determined based on the actual performance achieved with respect to each measure, provided each measure is considered separately and is subject
to its own maximum. |
|
(3) |
If the Company’s EPS declines over the three-year period, the maximum payout under this metric may not exceed target, regardless of relative
performance. |
|
(4) |
If the Company’s TSR during the performance period is negative, the modifier may not exceed 100%, regardless of relative performance. The TSR
modifier may reduce the total earned award by up to 25% or increase the total earned award by up to 25%. The maximum payout for the full grant, after applying the modifier is 200% of target. |
Conclusion of the 2022-24 Performance Period
For equity awards granted in 2022, the Company completed the three-year
performance period on December 31, 2024, and the Committee evaluated attainment of the goals set forth below. As a result of the calculations set forth in the table below, the Committee determined that the PSUs granted in 2022 covering the
performance years 2022-2024, will be paid out at 95.43% of target. Those shares will vest March 31, 2025, and will be released shortly after.
| Performance Goal |
Factor
Weighing |
Threshold |
Target |
Maximum |
Actual
Performance |
Weighted
Payout (%
of Target) |
| Relative
Total Shareholders Return |
33.3% |
30th percentile |
55th percentile |
75th
percentile |
83.6th
percentile |
50.00% |
| Relative Core
PPNR/Average Assets |
33.3% |
30th percentile |
55th percentile |
75th
percentile |
34.1st
percentile |
12.47% |
| Relative
NCO/Average Loans |
16.7% |
25th percentile |
50th percentile |
70th
percentile |
51.1st
percentile |
17.11% |
Relative
Nonaccrual loan + OREO/Total
Assets |
16.7% |
25th percentile |
50th percentile |
70th
percentile |
48.4th
percentile |
15.85% |
| |
|
|
|
|
Total |
95.43 |
Performance below the threshold in all measures results in no shares
being earned, and performance at target in all measures results in 100% payout. Performance at threshold results in a 25% payout. Performance equal to or above the maximum results in a 200% payout. If the Company’s TSR during the performance period
is negative, the maximum payout for this component is target, even if actual relative performance is above target. Straight-line interpolation is applied between points. Relative calculations were made according to S&P Capital IQ (“Cap IQ”) to
ensure consistency.
Compensation Discussion and Analysis
| NEO |
Actual Performance
(% of Target) |
Shares Awarded |
| James D.
Rollins III |
95.43% |
43,753 |
| Valerie C.
Toalson |
95.43% |
8,750 |
| Christopher
A. Bagley |
95.43% |
16,109 |
| Edward H.
Braddock |
95.43% |
4,534 |
| Tyler L.
Lambert |
95.43% |
5,568 |
Conclusion of the Integration Grants
On September 30, 2024, the performance period for the grants issued in
connection with the merger of Cadence Bancorporation N.A. into BancorpSouth Bank concluded, and the awards vested on October 29, 2024. The Committee determined the performance of each metric. Each metric is based on the Company’s core or normalized
performance which would typically include adjustments for a variety of non-recurring or unusual items. Adjustments in the calculation of performance for the integration grants included (i) exclusion of the gain recognized on the sale Cadence
Insurance, Inc. in the fourth quarter of 2023, (ii) exclusion of the pension settlement expense, which resulted from a reduction in force in 2023 achieved primarily through an early retirement program, (iii) exclusion of net service charge rebates,
and (iv) deduction of the gain related to the early extinguishment of debt in the fourth quarter of 2023. The Committee considered the purpose of each metric and determined that each of the above items is properly excluded as a non-recurring item
from the core ROAA and normalized operating efficiency calculations. Further, the Committee authorized the exclusion of one member of the proxy group due to inconsistencies identified by the Cap IQ model, which excludes that proxy peer from its ROAA
calculation. The Committee utilized Cap IQ calculations of ROAA to create a consistent methodology in regard to its peers.
| Performance Goal (1) |
Factor
Weighing |
Threshold |
Target |
Maximum |
Actual
Performance |
Weighted
Payout (% of
Target) |
| Relative Core ROAA(2) |
40% |
30% |
55% |
75% |
45.55% |
28.66% |
| Normalized Operating Efficiency Ratio(3) |
40% |
60% |
56% |
54% |
59.47% |
14.00% |
| Strategic Goals(4) |
| Customer Satisfaction |
6.7% |
16% |
12% |
8% |
12.01% |
6.65% |
| Talent Retention |
6.7% |
16 |
12 |
8 |
8 |
10% |
| Systems Integration |
6.7% |
4Q23 |
2Q23 |
4Q22 |
4Q22 |
10% |
| Total |
69.3% |
|
(1) |
Performance below the threshold in all measures results in no shares being earned, and performance at target in all measures results in 100%
payout. Performance at threshold results in 25% payout. Performance equal to or above the maximum results in a 200% payout. Straight-line interpolation is applied between points. |
|
(2) |
Relative Core ROAA was calculated using the Cap IQ calculations for the proxy peers as they existed in 2021 at the time of the grant. This
metric measures core net income divided by total average assets and was calculated for trailing 36, 24, and 12 month period prior to the vesting date, utilizing the best percentage. The Committee calculated the most recent 12-month period. Core
net income is defined as net income after taxes and before extraordinary items, for example, net income attributable to a non-controlling interest, gain on the sale of held to maturity and available for sale securities, the items described
above, amortization of intangibles and goodwill and nonrecurring items, such as merger expenses. |
|
(3) |
Normalized Operating Efficiency Ratio is the GAAP Efficiency Ratio adjusted for non-routine items, including merger expense, pension expense,
gain on sales of securities, and Mortgage Servicing Rights Market Value Adjustment. The Committee then sought a “normalized” operating efficiency ratio to reflect the achievement of ongoing expense efficiencies. Under this rubric, the following
adjustments were made: net service charge regulatory rebate expense, severance, intangible asset amortization, purchase accounting accretion, amortization of unfunded unused fair value mark, alternative investments income, and SBA servicing
rights market value adjustment. |
|
(4) |
The three components of Strategic goals were calculated as follows: (a) customer satisfaction was determined by the annualized loss rate of
legacy Cadence Bancorporation non-interest bearing customer accounts, (b) talent retention was determined by calculating the number of employees from a pre-identified list who left employment voluntarily and not through an expected retirement,
and (c) systems integration was determined by the date on which the core system conversion was completed. |
Compensation Discussion and Analysis
The table below shows the actual performance and the shares awarded under the integration grant for
each NEO:
| NEO |
Actual Performance
(% of Target) |
Shares Awarded |
| James D.
Rollins III |
69.3% |
114,887 |
| Valerie C.
Toalson |
69.3% |
25,275 |
| Christopher
A. Bagley |
69.3% |
38,775 |
| Edward H.
Braddock |
69.3% |
8,616 |
| Tyler L.
Lambert |
69.3% |
16,085 |
OTHER ELEMENTS OF COMPENSATION
Executive Benefits
We provide our executive officers with benefits in amounts we believe
are reasonable, competitive and consistent with our executive compensation program. We believe such benefits help us to attract, motivate and retain executive officers of the caliber we believe necessary to remain competitive. We offer group life,
disability, medical, dental and vision insurance to all of our employees, including our NEOs. We also maintain retirement benefit programs which are discussed in detail below in the section entitled “Retirement Benefits.” In addition, we maintain
bank-owned life insurance that can be used for funding supplemental benefits to certain executive officers.
Perquisites
We provide our executive officers with perquisites in amounts we believe
help us attract and retain highly-qualified leaders. For certain executives, including the NEOs, we provide a Company automobile or an automobile allowance and a cell phone allowance. In addition, we own and operate corporate aircraft to facilitate
the business travel of our executive officers (including the NEOs) and the attendance of Board members at Board meetings. Executives other than Messrs. Rollins and Bagley are generally not entitled to use our aircraft for personal travel except for
limited circumstances as described in the Company’s Corporate Aircraft Policy. The Company has dual headquarters located in Tupelo, Mississippi, and Houston, Texas, and our executives frequently travel between the headquarters and within the
footprint. While there are plentiful air travel options from Houston, there are limited service options through the Tupelo airport and fewer within the Company’s footprint. Company air travel for executives provides a meaningful benefit to the
Company.
Letter, Change in Control and Consulting Agreements
Letter Agreements
In connection with the 2021 merger of Cadence Bancorporation, N.A. into
the Company, each of Mr. Rollins, Ms. Toalson, and Mr. Bagley executed a letter agreement with a three-year service term with up to two one-year renewals. As of December 31, 2024, the three-year service period ended, and the first one-year renewal
began. Details of the various post-severance payments available under the agreements and restrictive covenants are described below in the section entitled “Potential Payments Upon Termination or Change in Control” set forth below. As discussed above,
base salary and target annual cash and long-term equity incentives are specified by the letter agreements and are reflected in the salaries and award levels set by the Committee. In 2024, the agreements of Mr. Bagley and Ms. Toalson were amended to
limit payment events upon a “good reason” separation from service.
Change in Control Agreements
We previously entered into Change in Control Agreements with certain of
our executives that provide certain benefits in the event we experience a change in control and the executive’s employment is terminated within 12 months without cause or for good reason. For more information about the eligibility conditions and
amounts payable to the NEOs under the Change in Control Agreements, see the section below entitled “Potential Payments Upon Termination or Change in Control.”
Compensation Discussion and Analysis
Retirement Benefits
We maintain additional compensatory arrangements as part of our
executive compensation program intended to provide payments to certain of our employees, including the NEOs, upon their resignation or retirement. These include our 401(k) Plan, a defined benefit plan referred to as our Retirement Plan, supplemental
defined benefit plan referred to as our Restoration Plan, our Supplemental Executive Retirement Plan, which is frozen to new entrants, and a frozen contributory deferred compensation arrangement referred to as our Deferred Compensation Plan. The
purpose of these plans is to provide competitive retirement benefits that enable us to attract and retain talented leaders who will exert considerable influence on our direction and success.
We make a matching contribution of up to 5% of eligible compensation for
participants in the 401(k) Plan, and participants accrue a cash balance benefit in the Retirement Plan of 2.5% of eligible compensation plus an interest calculation.
Our nonqualified retirement-style plans include the Restoration Plan,
the Supplemental Executive Retirement Plan, and a frozen Deferred Compensation Plan. The Restoration Plan provides a benefit similar to the Retirement Plan for participants who earn in excess of the compensation the Internal Revenue Service allows a
plan to consider. The Supplemental Executive Retirement Plan provides a ten-year benefit based upon 15% of final average compensation as defined in the Retirement Plan. The Deferred Compensation Plan is frozen, and none of the NEOs participate in
this plan. Our nonqualified plans are limited to a select group of management employees.
All of our NEOs are eligible to participate in the Retirement Plan and
the Restoration Plan. Each NEO is currently an active participant and accrued benefits in 2024 based on a cash balance formula. All NEOs have a vested benefit in the 401(k) Plan. Each NEO has vested benefits in the Retirement and Restoration Plans.
Because the Retirement Plan is cash balance with no subsidies, each NEO will be entitled to receive his or her vested benefit upon termination of service. There is no need to satisfy a “retirement” definition to be eligible for benefits. All NEOs
except Mr. Braddock are eligible for benefits under the Supplemental Executive Retirement Plan after separation from employment. The amounts each NEO would have received under these plans if they had left service on December 31, 2024, are provided
below in the section entitled “Potential Payments Upon Termination or Change in Control.”
Life Insurance Plans
Cadence Bank maintains a Split Dollar Life Insurance Plan providing
death benefits to all NEOs except Mr. Braddock. The death benefit equals an amount up to 250% of the participant’s total compensation, subject to certain limitations and a maximum death benefit of $2.5 million. Cadence Bank is the sole owner of the
corresponding life insurance policies and pays the premiums due on the policies. The Split Dollar Life Insurance Plan provides that a participant’s beneficiary will be entitled to certain death benefits if the participant’s death occurs:
|
● |
Before separation from service; |
|
● |
Within 24 months following a change in control (as defined in the Split Dollar Life Insurance Plan); |
|
● |
After attainment of age 55 and completion of five years of participation; or |
|
● |
Following separation from service due to disability or resignation for good reason (as defined in the Split Dollar Life Insurance Plan). |
All proceeds in excess of the death benefits received by the
participant’s beneficiary are retained by Cadence Bank to offset the cost of providing the benefit.
Compensation Discussion and Analysis
Risk Management Considerations
The Compensation Committee reviews the risks and rewards associated with
our compensation program. The Committee designs our compensation program with features that mitigate risk without diminishing the incentive nature of the compensation. The Committee believes our compensation program encourages and rewards prudent
business judgment and appropriate risk-taking over the long term. As discussed above in the section entitled “Executive Summary,” we believe our incentive compensation plans and policies include terms designed to mitigate any potential material risks
created by the performance-based metrics used in the incentive compensation plans. In 2024, the Committee added risk triggers that will reduce or eliminate eligibility for an annual incentive in the case of certain unexpected events. In the event the
bank is not well-capitalized, annual executive bonuses are automatically eliminated. In the case of other events, such as an adverse liquidity status or materially negative credit quality, the Committee has the discretion to lower or fully eliminate
the annual incentive. The Committee reserved the right to make reductions on a discretionary basis for other unanticipated factors.
Together, the features of our executive compensation program are intended to:
|
● |
Ensure our compensation opportunities do not encourage excessive risk taking; and |
|
● |
Focus our executive officers on managing Cadence towards creating long-term, sustainable value for our shareholders. |
Executive Compensation Clawback Policy
The Company’s Executive Compensation Policy, the Clawback Policy, and
the underlying Variable Compensation Policy set forth the conditions under which we may recover excess incentive-based compensation paid or awarded to or received by any of our NEOs and any other executive officers identified by our Compensation
Committee. In the event we are required to prepare an accounting restatement of our financial statements as a result of material noncompliance with any financial reporting requirement under applicable federal securities laws that is a result of
misconduct, we will recover from each former or current executive officer who is subject to the policy any excess incentive-based compensation paid or awarded to or received during the three-year period preceding the date of filing of the latest
document containing materially non-compliant financial statements which are subject to the restatement. The Company is entitled to recover amounts paid in error or due to the use of materially inaccurate financial information or performance metrics
used to determine the amount of the compensation, regardless of fault. Finally, the Company may recover any amount paid due to an executive’s fraudulent, dishonest, or bad faith conduct. We require each covered executive to acknowledge the policy
prior to the making of an award.
Stock Ownership Guidelines
We have rigorous Stock Ownership Guidelines which generally require our
directors, the Chief Executive Officer, and any executive officer to beneficially own a minimum number of shares of our common stock - six times base salary, in the case of the Chief Executive Officer, and three times their base salaries, in the case
of such other executive officer. Each of these officers is also required to hold stock awards until the minimum ownership is reached and, in all cases, for 12 months after they become vested. Mr. Rollins, Ms. Toalson, and Mr. Bagley, as
longer-serving executives, have met this standard. The remaining NEOs have made significant progress.
Insider Trading Policy
Our Insider Trading Policy prohibits directors, officers and other
employees from engaging in short sales, from hedging the economic risk of ownership of any shares of our securities they own, and from pledging Company securities.
Equity Grant Policy
The Compensation Committee approves and grants annual equity awards at
approximately the same time every year. Outside of the annual grant cycle, we may make equity awards in connection with a new hire package or retention grant. Annual grants are made on or about April 1. Off-cycle retention and new-hire grants are
made July 1 or October 1. Equity awards are not granted in anticipation of the release of material non-public information, and the release of material non-public information is not timed on the basis of equity grant dates.
Compensation Discussion and Analysis
| Compensation Committee
Interlocks and Insider Participation |
The Executive Compensation and Stock Incentive Committee is currently
composed of Messrs. Brown (Chair), Holliman, Shapiro, and Stanton, and Ms. Hepner.
None of the members of the Committee has at any time been one of our
officers or employees. Members of the Committee may, from time to time, have banking relationships in the ordinary course of business with Cadence, as described below in the section entitled “CERTAIN RELATIONSHIPS AND RELATED TRANSACTIONS.” Except as
described in that section and in the section above entitled “Director Independence,” none of the members had any other relationship during 2024 requiring disclosure by us.
During 2024, none of our executive officers served as a member of
another entity’s compensation committee if such entity employed an executive officer who served on our Compensation Committee or on our Board of Directors. Further, none of our executive officers served as a director of another entity if that entity
employed an executive officer who served on our Compensation Committee.
| Executive Compensation
and Stock Incentive Committee Report |
The Executive Compensation and Stock Incentive Committee has reviewed
and discussed the Compensation Discussion and Analysis with management. Based on such review and discussions, the Committee recommended to the Board of Directors the Compensation Discussion and Analysis be included in this Proxy Statement and
incorporated by reference in Cadence’s Annual Report on Form 10-K for the year ended December 31, 2024.
The members of the Committee are set forth below.
Executive Compensation and Stock Incentive
Committee:
Shannon A. Brown (Chair)
Virginia A. Hepner
William G. “Skipper” Holliman
Marc J. Shapiro
Thomas R. Stanton
Summary Compensation Table
The following table sets forth certain information
concerning compensation paid or accrued by us for the last three years with respect to each of our NEOs – the Chief Executive Officer, the Chief Financial Officer, and our three other most highly compensated executive officers who were serving as
executive officers at December 31, 2024:
Name and Principal
Position |
Year |
Salary |
Non-Equity Incentive
Plan Compensation |
Stock Awards (1) |
Change in Pension Value
and Nonqualified
Deferred Compensation
Earnings (2) |
All Other
Compensation (3) |
Total |
James
D. Rollins III
Chairman and Chief Executive Officer |
2024 |
$1,040,000 |
$1,483,404 |
$3,089,262 |
$56,032 |
$80,080 |
$5,748,777 |
| 2023 |
1,000,000 |
996,460 |
2,485,465 |
380,056 |
245,963 |
5,107,944 |
| 2022 |
1,000,000 |
1,946,571 |
2,600,527 |
150,125 |
185,262 |
5,882,486 |
Valerie
C. Toalson
Chief Financial Officer and President - Banking Services |
2024 |
$600,000 |
$570,540 |
$810,122 |
$85,337 |
$47,879 |
$2,113,878 |
| 2023 |
550,000 |
365,369 |
497,093 |
76,603 |
117,043 |
1,606,109 |
| 2022 |
550,000 |
713,743 |
520,094 |
399,560 |
137,849 |
2,321,246 |
Christopher
A. Bagley
President and Chief Credit Officer |
2024 |
$700,000 |
$832,038 |
$1,134,176 |
$84,399 |
$146,205 |
$2,896,818 |
| 2023 |
675,000 |
560,509 |
915,103 |
307,585 |
115,331 |
2,573,528 |
| 2022 |
675,000 |
1,094,946 |
957,462 |
142,885 |
119,717 |
2,990,010 |
Edward
H. Braddock
Chief Banking Officer |
2024 |
$515,000 |
$489,714 |
$523,864 |
$16,759 |
$60,741 |
$1,606,078 |
| 2023 |
403,077 |
211,748 |
549,338 |
24,439 |
55,902 |
1,224,505 |
Tyler L.
Lambert
Chief Risk Officer |
2024 |
$440,00 |
$418,396 |
$668,318 |
$74,762 |
$37,914 |
$1,639,390 |
|
(1) |
The amount shown in the Stock Awards column represents the grant date fair value of
stock awards granted to our NEOs in the fiscal year shown, which was calculated as follows: (i) for restricted stock units and shares of restricted stock, calculated by multiplying the number of shares subject to the award by the closing sale
price of our common stock on the grant date; (ii) for the 2022 PSUs, calculated using the lattice valuation model with the following assumptions: risk free interest rate, 4.51%; expected volatility rate, 45.7%; expected term, 2.75; and dividend
yield, 2.71%; (iii) for the 2023 PSUs, calculated using a lattice valuation model with the following assumptions: continuous rate, 4.19%; discrete risk free rate, 4.23%; expected term, 2; and dividend yield, 3.18%. and (iv) for the 2024 PSUs,
calculated using the lattice valuation model with the following assumptions: risk free interest rate, 2.55%; expected volatility rate, 36.0%; expected term, 2.75; and dividend yield, 3.27%. Refer to Note 14, “Share-Based Compensation,” to the
consolidated audited financial statements in our Annual Report on Form 10-K for the fiscal year ended December 31, 2024 for additional discussion. Assuming the maximum performance level is achieved, the values of the PSUs as of the grant date
for fiscal years 2024, 2023, and 2022, for each NEO are as follows: |
| Name and Principal Position |
Year |
PSUs Determined at
Maximum |
James D. Rollins
Chairman and Chief Executive
Officer |
2024 |
$4,497,765 |
| 2023 |
4,236,566 |
| 2022 |
3,013,618 |
Valerie C. Toalson
Chief Financial Officer and
President - Banking Services |
2024 |
$1,179,489 |
| 2023 |
847,323 |
| 2022 |
602,719 |
Christopher A. Bagley
President and Chief Credit Officer |
2024 |
$1,651,303 |
| 2023 |
1,559,831 |
| 2022 |
1,109,551 |
Edward H. Braddock
Chief Banking Officer |
2024 |
$762,708 |
| 2023 |
444,819 |
Tyler L. Lambert
Chief Risk Officer |
2024 |
$885,002 |
Executive Compensation
For more information about the restricted stock units and performance stock units, see the
sections above entitled “COMPENSATION DISCUSSION AND ANALYSIS - Components of Compensation - Long -Term Equity Incentive Compensation - Restricted Stock Units” and “COMPENSATION DISCUSSION AND ANALYSIS - Components of Compensation - Long-Term Equity
Incentive Compensation - Performance Stock Units,” respectively, and refer to Note 14, “Share Based Compensation” to the consolidated audited financial statements in our Annual Report on Form 10-K for the fiscal year ended December 31, 2024 and the
table setting forth “Dividends on Unvested Restricted Stock.”
|
(2) |
The key assumptions used to determine the pension values are described below in the section entitled
“Pension Benefits – Assumptions Used to Calculate Pension Values.” |
|
(3) |
Details of the amounts reported as All Other Compensation for 2024 are as follows: |
| Name |
401(k)
Contribution |
Country Club
Dues |
Company
Automobile |
Cell Phone
Allowance |
Imputed
Income for
Life Insurance
Benefit |
Personal Use
of Corporate
Aircraft |
Dividends on
Unvested
Restricted Stock |
Total |
| James D.
Rollins III |
$17,250 |
$0 |
$18,656 |
$1,560 |
$5,800 |
$36,814 |
$0 |
$80,080 |
| Valerie
C. Toalson |
$17,250 |
$8,574 |
$17,458 |
$1,560 |
$3,038 |
$0 |
$0 |
$47,879 |
| Christopher
A. Bagley |
$17,250 |
$0 |
$20,901 |
$1,560 |
$4,625 |
$101,869 |
$0 |
$146,205 |
| Edward H.
Braddock |
$17,250 |
$13,711 |
$26,410 |
$1,300 |
$2,070 |
$0 |
$0 |
$60,741 |
| Tyler L.
Lambert |
$17,250 |
$0 |
$18,291 |
$1,560 |
$813 |
$0 |
$0 |
$37,914 |
|
* |
Reflects the amount of imputed income with respect to participation in Cadence’s life insurance plans.
For more information about these plans, see the section above entitled “COMPENSATION DISCUSSION AND ANALYSIS-Life Insurance Plan.” |
|
** |
We report the use of corporate aircraft by the NEOs as a perquisite or other personal benefit only if
it is not “integrally and directly related” to the performance of the executive’s duties. While we maintain aircraft, only Messrs. Rollins and Bagley are generally entitled to use our aircraft for personal travel, while Ms. Toalson, Mr.
Braddock and Mr. Lambert may use our aircraft for personal travel only in limited circumstances described in the Company’s Corporate Aircraft Policy. We report such use as compensation in an amount equal to our aggregate incremental cost. We
estimate our aggregate incremental cost to be equal to the average operating cost per hour for the year (which includes items such as fuel, maintenance, landing fees, additional crew expenses and other expenses incurred based on the number of
hours flown per year) multiplied by the number of hours for each flight. The amount reported for Messrs. Rollins and Bagley represents the total flight hours attributable to their personal use of our corporate aircraft multiplied by our
incremental cost rate for 2024 of $5,043 per hour. |
Change in Pension Value and
Nonqualified Deferred Compensation Earnings
The change in each executive’s
pension value reported in the Summary Compensation Table is the change in our obligation to provide pension benefits (at a future retirement date) from the beginning of the fiscal year to the end of the fiscal year. The obligation is the value of a
benefit, as of December 31 of each respective year, which will be paid at the executive’s normal retirement date (age 65) based on the benefit formula and the executive’s current pay and service.
Change in pension values may be a result of various sources such as:
Service
accruals. As the executive earns an additional year of service, the present value of the liability increases because the executive has earned one year more service
than he had at the prior measurement date.
Compensation
increases/decreases. Changes in compensation do not result in a change in pension values. Since 2017, the accrual rate has been based on a “cash balance” formula
where changes in compensation do not affect previously accrued benefits. Average compensation under the final average pay formula was frozen in 2016, and none of the NEOs were eligible to participate in that portion of the Retirement Plan.
Aging. The change in pension values shown in the Summary Compensation Table are present values of retirement benefits to be paid in the future. Generally, as the executive approaches
retirement age, the present value of the liability increases because the executive is one year closer to retirement.
Changes in
assumptions. The change in pension values shown in the Summary Compensation Table is the present value of the increase in pension benefits during the applicable
year. A discount rate and mortality table are used to calculate these values. The discount rates under the Retirement Plan, the Restoration Plan and the Supplemental Executive Retirement Plan increased slightly since the prior year.
Executive Compensation
Vesting Event.
The merger with Legacy Cadence resulted in a vesting event for then-current participants in the Supplemental Executive Retirement Plan, which required the full vesting of the
unreduced benefits of Mr. Rollins, Mr. Bagley, and Mr. Lambert as of the merger date. For purposes of the Pension Benefits Table and Summary Compensation Table calculations, the fully vested unreduced benefit which would have otherwise been payable
at age 65 is now available for payment upon retirement at the executive’s current age.
The pension benefits and
assumptions used to calculate these values are described in more detail in the section below entitled “Pension Benefits.”
Grants of Plan-Based Awards During
Fiscal Year 2024
The following table sets forth certain information regarding plan-based
awards granted to the NEOs during 2024:
| |
|
Estimated Possible Payouts Under Non-Equity Incentive
Plan Awards (1)
($) |
Estimated Future Payouts Under
Equity Incentive Plan Awards (#) |
|
|
| Name |
Date |
Threshold (5) |
Target |
Maximum |
Threshold (5) |
Target |
Maximum |
All
Other
Stock
Awards:
Number
of
Shares
of Stock
or Units |
Grant
Date Fair
Value of
Awards (6) |
| James D. Rollins III |
|
$48,750 |
$1,560,000 |
$3,120,000 |
|
|
|
|
|
| 4/1/2024 (2) |
|
|
|
8,374 |
66,991 |
100,487 |
|
$2,053,274 |
| 4/1/2024 (3) |
|
|
|
|
|
|
36,072 |
$1,035,988 |
| Valerie C. Toalson |
|
$18,750 |
$600,000 |
$1,200,000 |
|
|
|
|
|
| 4/1/2024 (2) |
|
|
|
2,196 |
17,568 |
26,352 |
|
$538,459 |
| 4/1/2024 (3) |
|
|
|
|
|
|
9,459 |
271,662 |
| Christopher A. Bagley |
|
$27,344 |
$875,00 |
$1,750,000 |
|
|
|
|
|
| 4/1/2024 (2) |
|
|
|
3,074 |
24,595 |
36,893 |
|
$753,837 |
| 4/1/2024 (3) |
|
|
|
|
|
|
13,243 |
380,339 |
| Edward H. Braddock |
|
$16,094 |
$515,000 |
$1,030,000 |
|
|
|
|
|
| 4/1/2024 (2) |
|
|
|
1,420 |
11,360 |
17,040 |
|
$348,184 |
| 4/1/2024 (3) |
|
|
|
|
|
|
6,117 |
175,680 |
| Tyler L. Lambert |
|
$13,750 |
$440,00 |
$880,000 |
|
|
|
|
|
| 4/1/2024 (2) |
|
|
|
1,288 |
10,306 |
15,459 |
|
$315,879 |
| 4/1/2024 (3) |
|
|
|
|
|
|
5,550 |
159,396 |
| 10/1/2024(4) |
|
|
|
|
|
|
6,321 |
193,043 |
|
(1) |
Reflects non-equity incentive plan awards granted under the Executive Performance Incentive Plan, where
receipt is contingent upon the achievement of certain performance goals. For more information about the awards and goals, see the section above entitled “COMPENSATION DISCUSSION AND ANALYSIS - Annual Incentive Compensation.” |
|
(2) |
Reflects PSUs granted under the LTEIP on April 1, 2024, which require certain performance conditions be
met based on the performance criteria as set forth above during the performance period. PSUs vest March 31, 2027. For additional information about the award and goals, see the section above entitled “COMPENSATION DISCUSSION AND ANALYSIS -
Long-Term Equity Incentive Compensation - Performance Stock Units.” |
|
(3) |
Reflects shares of restricted stock units granted under the LTEIP at the annual April grant, which vest
ratably at the second, third, and fourth anniversary dates of the grant. |
|
(4) |
Reflects shares of restricted stock units granted under the LTEIP in a special October grant, which
vest ratably based at years two and one-half, three and one-half, and four and one-half. |
|
(5) |
Reflects the minimum award available as the result of attainment of the lowest weighted metric at
threshold. |
|
(6) |
Reflects the aggregate grant date fair value of stock awards granted in 2024. Refer to Note 14, “Share
Based Compensation” to the consolidated audited financial statements in our Annual Report on Form 10-K for the fiscal year ended December 31, 2024, and footnote 1 under the Summary Compensation table for a discussion of the relevant assumptions
used to determine the grant date fair value of these awards. Performance award values are based on earning the target number of units. |
Executive Compensation
Outstanding Equity Awards at 2024
Fiscal Year-End
The following table provides certain information with
respect to the NEOs regarding outstanding option awards and stock awards as of December 31, 2024:
| |
|
STOCK AWARDS |
|
|
| Name |
Grant Date |
Number of Shares of
Units of Stock That
Have Not Vested
# |
Market Value of
Shares of Units that
Have not Vested (12)
$ |
Equity Incentive Plan
Awards: Number of
Unearned Shares,
Units of Other Rights
That Have Not Vested
# |
Equity Incentive Plan
Awards Market or
Payout Value of
Unearned Shares,
Units or Other Rights
That Have Not Vested (11)
$ |
| James D. Rollins III |
1/22/20 |
30,661 (1) |
1,056,271 |
|
|
| |
1/26/21 |
26,562 (2) |
915,061 |
|
|
| |
4/1/22 |
89,602 (3) |
3,086,789 |
|
|
| |
4/1/23 |
48,664 (4) |
1,676,475 |
72,996 (13) |
2,514,712 |
| |
4/1/24 |
36,072 (5) |
1,242,680 |
100,487 (14) |
3,461,777 |
| Valerie C. Toalson |
4/1/22 |
17,920 (6) |
617,344 |
|
|
| |
4/1/23 |
9,733 (4) |
335,302 |
14,599 (13) |
502,936 |
| |
4/1/24 |
9,459 (5) |
325,863 |
26,352 (14) |
907,826 |
| Christopher A. Bagley |
1/22/20 |
15,398 (1) |
530,461 |
|
|
| |
1/26/21 |
17,787 (2) |
612,762 |
|
|
| |
4/1/22 |
32,990 (7) |
1,136,506 |
|
|
| |
4/1/23 |
17,917 (4) |
617,241 |
26,876 (13) |
925,878 |
| |
4/1/24 |
13,243 (5) |
456,221 |
36,893 (14) |
1,270,964 |
| Edward H. Braddock |
4/1/22 |
9,286 (8) |
319,903 |
|
|
| |
4/1/23 |
5,110 (4) |
176,040 |
7,664 (13) |
264,025 |
| |
10/1/23 |
13,884 (9) |
478,304 |
|
|
| |
4/1/24 |
6,117 (5) |
210,731 |
17,040 (14) |
587,028 |
| Tyler L. Lambert |
1/22/20 |
1,078 (1) |
37,137 |
|
|
| |
1/26/21 |
4,995 (2) |
172,078 |
|
|
| |
4/1/22 |
11,404 (10) |
392,868 |
|
|
| |
4/1/23 |
7,078 (4) |
243,837 |
10,618 (13) |
365,790 |
| |
4/1/24 |
5,550 (5) |
191,198 |
15,459 (14) |
532,563 |
| |
10/1/24 |
6,321 (11) |
217,758 |
|
|
|
(1) |
Reflects shares of restricted stock granted under the LTEIP which vest on May 15, 2025. |
|
(2) |
Reflects restricted stock units granted under the LTEIP which vest on May 15, 2026. |
|
(3) |
Reflects 45,849 restricted stock units granted under the LTEIP which vest on March 31, 2026, and 43,753
PSUs which converted to time vesting on December 31, 2024, and vest on March 31, 2025. |
|
(4) |
Reflects restricted stock units granted under the LTEIP which vest on ratably over a three year period
beginning March 31, 2025, and ending March 31, 2027. |
|
(5) |
Reflects restricted stock units granted under the LTEIP which vest on ratably over a three year period
beginning March 31, 2026, and endin6g March 31, 2028. |
|
(6) |
Reflects 9,170 restricted stock units granted under the LTEIP which vest on March 31, 2026, and 8,750
PSUs which converted to time vesting on December 31, 2024, and vest on March 31, 2025. |
|
(7) |
Reflects 16,881 restricted stock units granted under the LTEIP which vest on March 31, 2026, and 16,109
PSUs which converted to time vesting on December 31, 2024, and vest on March 31, 2025. |
|
(8) |
Reflects 4,752 restricted stock units granted under the LTEIP
which vest on March 31, 2026, and 4,534 PSUs which converted to time vesting on December 31, 2024, and vest on March 31, 2025. |
Executive Compensation
|
(9) |
Reflects restricted stock units granted under the LTEIP, which vest ratably over a three-year period
beginning March 31, 2026, and ending March 31, 2028. |
|
(10) |
Reflects 5,836 restricted stock units granted under the LTEIP
which vest on March 31, 2026, and 5,568 PSUs which converted to time vesting on December 31, 2024, and vest on March 31, 2025. |
|
(11) |
Reflects restricted stock units granted under the LTEIP which vest on ratably over a three year period
beginning March 31, 2027, and ending March 31, 2029. |
|
(12) |
Based upon the closing sale price of our common stock of $34.45 per share, as reported on the NYSE on
December 31, 2024. |
|
(13) |
Reflects the number of performance units at target available to be earned by the NEO pursuant to
performance unit awards granted to the NEO in April 2023 under the LTEIP (the “2023 Performance Units”). The 2023 Performance Units have a performance period ending on December 31, 2025. After completion of the second fiscal year, performance
has exceeded the threshold in a sufficient number of determinable metrics, thus we report the award at the target level. |
|
(14) |
Reflects the number of performance units at target available to be earned by the NEO pursuant to
performance unit awards granted to the NEO in April 2024 under the LTEIP (the “2024 Performance Units”). The 2024 Performance Units have a performance period ending on December 31, 2026. After completion of the first fiscal year, performance
has exceeded the target in a sufficient number of determinable metrics, thus we report the award at the maximum level. |
Stock Vested
The following table shows the
amounts received by the NEOs upon option exercise or vesting of restricted stock or performance stock units during 2024:
| |
Option Awards |
Stock Awards |
| Name |
Number of
Shares
Acquired on
Exercise |
Value Realized on
Exercise |
Number of Shares
Acquired on
Vesting |
Value Realized
on Vesting |
| James D.
Rollins III(1) |
N/A |
N/A |
220,326 |
$7,014,729 |
| Valerie C.
Toalson(2) |
181,662 |
$1,145,383 |
49,899 |
$1,569,655 |
| Christopher
A. Bagley(3) |
N/A |
N/A |
81,326 |
$2,574,040 |
| Edward H.
Braddock(4) |
N/A |
N/A |
17,921 |
$561,497 |
| Tyler L.
Lambert(5) |
N/A |
N/A |
21,295 |
$698,807 |
|
(1) |
Reflects 39,095 shares of restricted stock that vested on May 15, 2024, and 66,344
performance stock units that vested on January 1, 2024, and 114,887 performance stock units that vested on October 29, 2024. With respect to the vested restricted stock, this column is based upon the closing sale price of our common stock of
$29.74 per share, as reported on the NYSE on May 15, 2024. With respect to the vested performance stock units that vested on January 1, this column is based upon the closing sale price of our common stock of $29.59 per share, as reported on the
NYSE on December 31, 2023. With respect to the performance stock units that vested on October 29, this column is based upon the closing sale price of our common stock of $33.85 per share, as reported on the NYSE on October 29, 2024. |
|
(2) |
Reflects 24,624 shares of restricted stock that vested on March 31, 2024, and 25,275
performance stock units that vested on October 29, 2024. With respect to the vested restricted shares, this column is based upon the closing sale price of our common stock of $29.00 share, as reported on the NYSE on March 31, 2024. With respect
to the performance stock units that vested on October 29, this column is based upon the closing sale price of our common stock of $33.85 per share, as reported on the NYSE on October 29, 2024. In addition, reflects 181,662 options exercised
July 26, 2024, with a sale price of $33.70. |
|
(3) |
Reflects 16,147 shares of restricted stock that vested on May 15, 2024, and 26,404
performance stock units that vested on March 1, 2024, and 38,775 performance stock units that vested on October 29, 2024. With respect to the vested restricted stock, this column is based upon the closing sale price of our common stock of
$29.74 per share, as reported on the NYSE on May 15, 2024. With respect to the performance stock units that vested on January 1, this column is based upon the closing sale price of our common stock of $29.59 per share, as reported on the NYSE
on December 31, 2023. With respect to the performance stock units that vested on October 29, this column is based upon the closing sale price of our common stock of $33.85 per share, as reported on the NYSE on October 29, 2024. |
|
(4) |
Reflects 9,305 shares of restricted stock that vested on March 31, 2024, and 8,616
performance stock units that vested on October 29, 2024. With respect to the vested restricted stock, this column is based upon the closing sale price of our common stock of $29.00 share, as reported on the NYSE on March 31, 2024. With respect
to the performance stock units that vested on October 29, this column is based upon the closing sale price of our common stock of $33.85 per share, as reported on the NYSE on October 29, 2024. |
|
(5) |
Reflects 1,108 shares of restricted stock that vested on May 15, 2024, and 4,102
performance stock units that vested on March 1, 2024, and 16,085 performance stock units that vested on October 29, 2024. With respect to the vested restricted stock, this column is based upon the closing sale price of our common stock of
$29.74 per share, as reported on the NYSE on May 15, 2024. With respect to the performance stock units that vested on January 1, this column is based upon the closing sale price of our common stock of $29.59 per share, as reported on the NYSE
on December 31, 2023. With respect to the performance stock units that vested on October 29, this column is based upon the closing sale price of our common stock of $33.85 per share, as reported on the NYSE on October 29, 2024. |
Executive Compensation
Pension Benefits
The following table provides
information regarding the present value of the accumulated benefit to each of the NEOs as of December 31, 2024:
| Name |
Plan Name |
Years of Credited
Service (through
December 31, 2016) |
Present Value
of Accumulated
Benefit |
Payments
During Last
Fiscal Year |
| James
D. Rollins III |
Retirement Plan |
N/A |
$103,172 |
$0 |
| |
Restoration Plan |
N/A |
582,392 |
0 |
| |
Supplemental Executive Retirement Plan |
N/A |
3,149,004 |
0 |
| Valerie C. Toalson |
Retirement Plan |
N/A |
$24,042 |
$0 |
| |
Restoration Plan |
N/A |
62,441 |
0 |
| |
Supplemental Executive Retirement Plan |
N/A |
1,020,855 |
0 |
| Christopher
A. Bagley |
Retirement Plan |
N/A |
$84,550 |
$0 |
| |
Restoration Plan |
N/A |
239,908 |
0 |
| |
Supplemental Executive Retirement Plan |
N/A |
1,824,302 |
0 |
| Edward H. Braddock |
Retirement Plan |
N/A |
$22,093 |
$0 |
| |
Restoration Plan |
N/A |
19,105 |
0 |
| |
Supplemental Executive Retirement Plan |
N/A |
0 |
0 |
| Tyler
L. Lambert |
Retirement Plan |
N/A |
$63,639 |
$0 |
| |
Restoration Plan |
N/A |
20,034 |
0 |
| |
Supplemental Executive Retirement Plan |
N/A |
402,995 |
0 |
Retirement Plan
We maintain a tax- qualified,
non-contributory, defined benefit retirement plan for our employees who have reached the age of 18 and have completed one year of service. Eligible employees accrue benefits in the Retirement Plan through a cash balance formula. Through December 31,
2016, the Retirement Plan also included a final average pay formula for employees who were hired prior to January 1, 2006. No NEO participated in the final average pay formula. Beginning January 1, 2017, all benefits are accrued under the cash
balance formula for all eligible employees.
The key provisions of the Retirement Plan applicable to our NEOs are as
follows:
Cash balance formula. The cash balance formula is based on the following:
|
● |
Retirement benefit will be based on the value of a hypothetical account balance which is credited with
2.5% of pay (at the IRS maximum, which is $345,000 in 2024) for each year the participant works at least 1,000 hours; and |
|
● |
Interest credits will be added to the hypothetical account each year based on the yield of the
six-month Treasury Bill as of the prior September, plus 1.5%. |
|
● |
Vesting. Participants become vested after reaching three years of service. |
|
● |
Early retirement benefits. Participants who are at least age 55 and have at least ten years of vesting service may elect to retire prior to their normal retirement date. The normal form of monthly benefit is a single life annuity
which is actuarially equivalent to the cash balance account value payable as of the early retirement date. There is no reduction for early retirement under the cash balance formula. |
|
● |
Death benefits. The participant’s beneficiary will receive the value of the accrued benefit under the cash balance formula upon the death of the participant. |
|
● |
Disability benefits. Disabled participants will receive their accrued benefit determined as of the date of disability. |
|
● |
Lump sum payments. Participants may elect to waive the annuity form of payment and receive a lump sum payment of the entire benefit accrued under the plan. |
Executive Compensation
Restoration Plan
This plan provides a supplement to
our Retirement Plan for amounts that exceed the statutory limits on qualified plans under the Code. As a result, the executives, officers and management employees designated to participate in this plan will have a similar total retirement income as a
percentage of total compensation as our other employees. This plan applies to compensation earned in excess of the limitation of Section 401(a)(17) of the Code (i.e., $345,000 in 2024). Benefits are calculated by applying the same benefit
formula applied under the Retirement Plan to the compensation earned by the participant in excess of the compensation limit and in amounts exceeding the limit on annual annuity payments. For this purpose, compensation is the same as defined in the
Retirement Plan but excludes commissions and includes compensation deferred under the Deferred Compensation Plan. Benefits are forfeited if the participant terminates employment prior to earning three years of vesting service, if terminated for cause
at any time, or the participant violates certain non-competition or confidentiality covenants. Benefits are paid out of our general assets and are not dependent on investment returns or interest earned. Benefits under the cash balance formula are
paid as a lump sum within 90 days after separation from service.
Supplemental Executive Retirement
Plan
We sponsor a non-qualified,
non-contributory, unfunded defined benefit pension arrangement for a select group of key management employees; however, participation in this plan is extremely limited. The plan is closed to new entrants. Benefits are paid out of our general assets
and are not impacted by investment returns or interest earned. The key provisions of the Supplemental Executive Retirement Plan are as follows:
|
● |
Monthly benefit. Eligible participants will receive 15% of average compensation, payable on the date of the participant’s normal retirement date (age 65) or earlier if vested. The Committee has the authority to provide additional
benefits in an amount up to $1,000 per month for the maximum payment period. |
|
● |
Average compensation. Average compensation is calculated by dividing eligible pay earned over a 36-month period by 36. The period is determined by selecting the highest 36 consecutive months of eligible pay. |
|
● |
Eligibility. The
plan is frozen to new participants. |
|
● |
Early retirement benefits. Participants may elect to retire and commence payments as early as age 55. The monthly benefit is calculated in the same manner as the normal retirement benefit, but is reduced 5% for each year the
participant elects to retire prior to age 65 except for Messrs. Rollins, Bagley, and Lambert who vested in their benefits following the merger of Cadence Bancorporation N.A. into the Company, as set forth below. |
|
● |
Death, disability and change in control benefits. If a participant dies or becomes totally and permanently disabled prior to retirement, the participant’s designated beneficiary will receive the early retirement benefit
described above, but such an amount will not be less than one-half of the normal retirement benefit (i.e., 7.5% of average monthly compensation). Upon termination of employment following a change in control, the participant will receive the
full retirement benefit with no reduction for termination prior to age 65. The merger with Cadence Bancorporation, N.A. entitled Mr. Rollins, Mr. Bagley, Mr. Lambert and other participants prior to the merger to an early, unreduced benefit. |
|
● |
Form of benefit payment. All benefits will be paid in equal consecutive monthly installments over a period of ten years. |
|
● |
Forfeiture of benefits. Except in the event of death, disability or a change in control, benefits under the plan are forfeited by participants who terminate employment prior to age 55. Benefits are also forfeited if a
participant violates non-competition or confidentiality covenants. |
Executive Compensation
Compounding Effect of Compensation Increases
The Compensation Committee is aware that compensation increases for
executive officers can have the effect of enhancing benefits under certain types of pension plans. Through December 31, 2016, the Retirement Plan and the Restoration Plan provided benefits based on a final average pay formula and benefits were
affected by changes in compensation. However, effective January 1, 2017, benefits for the Retirement Plan and the Restoration Plan are calculated under a cash balance formula so compensation increases do not tend to have a compounding effect on
benefits. Fidelity Workplace Consulting, in its capacity as benefits consultant and pension actuary, provides us with relevant information so the Committee is able to consider the compounding effect of compensation adjustments under these programs.
Assumptions Used to Calculate Pension Values
| Assumption |
Basis for Assumption |
December 31, 2024 |
December 31, 2023 |
| Discount rate |
Under SEC rules,
discount rate used to measure pension liabilities under FASB ASC Topic 715. |
5.60% for the Retirement Plan; 5.50%
for the Restoration Plan; 5.31% for the Supplemental Executive Retirement Plan |
5.29% for the Retirement Plan; 5.22%
for the Restoration Plan; 5.05% for the Supplemental Executive Retirement Plan |
| Rate of future salary
Increases |
Under SEC rules, no salary projection. |
0% |
0% |
| Cash Balance Interest Crediting
Rate |
|
| Retirement Plan |
|
4.08% |
3.79% |
| Restoration Plan |
|
4.08% |
3.79% |
| Normal Form of
payment |
Retirement Plan(1) |
Life annuity |
Life annuity |
| Restoration Plan(2) |
Life annuity |
Life annuity |
| Supplemental Executive Retirement Plan |
Ten-year certain annuity |
Ten-year certain annuity |
| Date of
retirement |
For Summary Compensation Table and Pension Benefits Table, use normal retirement
age pursuant to SEC rules. |
Later of current age or age 65 for Retirement Plan and
Restoration Plan; earlier of age 65 and fully-vested age for Supplemental Executive Retirement Plan |
Later of current age or age 65 for Retirement Plan and
Restoration Plan; earlier of age 65 and fully-vested age for Supplemental Executive Retirement Plan |
| For Potential Payments Upon
Termination or Change-in Control Tables, use the determination date. |
Immediate(3) |
Immediate(3) |
| Lump
sum interest rate |
For Summary Compensation Table and
Pension Benefits Table, use same assumption to measure pension liabilities under FASB ASC Topic 715. For Potential Payments Upon Termination or Change- in-Control Tables, use interest rate defined by the plan for the upcoming plan year pursuant
to §417(e) of the Code. |
Assumed equal to the discount rate
used for the Retirement Plan. Rates as specified at the time of payment by the Treasury under §417(e) of the Code. |
Assumed equal to the discount rate
used for the Retirement Plan. Rates as specified at the time of payment by the Treasury under §417(e) of the Code. |
| Assumption |
Basis for Assumption |
December 31, 2024 |
December 31, 2023 |
| Post-retirement mortality |
For Summary Compensation Table and
Pension Benefits Table, use same assumption to measure pension liabilities under FASB ASC Topic 715. For Potential Payments Upon Termination or Change- in-Control Tables, use Mortality Table pursuant to §417(e) of the Code. |
Pri-2012 Healthy Annuitants
mortality tables for males and females projected generationally using Scale MP-2021 (Restoration Plan adds white collar adjustments) |
Pri-2012 Healthy Annuitants mortality
tables for males and females projected generationally using Scale MP-2021 (Restoration Plan adds white collar adjustments) |
Because the pension amounts shown in the Summary Compensation Table and
the Pension Benefits Table are projections of future retirement benefits, numerous assumptions have been applied. In general, the assumptions should be the same as those used to calculate the pension liabilities in accordance with Financial
Accounting Standards Board Accounting Standards Codification Topic 715, “Compensation - Retirement Benefits,” or FASB ASC Topic 715, on the measurement date, although SEC rules specify certain exceptions (as noted in the table).
Executive Compensation
The changes in pension values shown in the Summary Compensation Table is the present value
of the increase in pension benefits during the fiscal year and the impact of changing discount rates and mortality tables used to calculate these values. The accumulated pension values shown in the Pension Benefits Table are based on the assumptions
applied as of December 31, 2024.
The following key assumptions are used to determine the pension values:
|
(1) |
For the Retirement Plan, information in the Summary Compensation Table and the Pension Benefits Table assumes each participant elects a lump sum. Results in the Potential
Payments Upon Termination or Change-in-Control Tables show the lump sum value of the participant’s accrued benefit as of December 31, 2024. |
|
(2) |
For the Restoration Plan, it is assumed participants elect a lump sum payment for the cash balance benefit. Results in the Potential Payments Upon Termination or
Change-in-Control Tables show the appropriate value of the participant’s accrued benefit as of December 31, 2024. |
|
(3) |
For the Retirement Plan and the Restoration Plan, cash balance formula benefits are payable as a lump sum at any time after termination, with the option to elect an
actuarially equivalent annuity. For the Supplemental Executive Retirement Plan, participants may retire immediately under the early retirement provisions of the plan if they have reached age 55. Participants who terminate employment prior to
retirement eligibility will not be eligible for a benefit under the Supplemental Executive Retirement Plan. Mr. Rollins, Mr. Bagley, and Mr. Lambert are entitled to an unreduced benefit under the Supplemental Retirement Plan as of the merger
date as a result of vesting due to the merger with Legacy Cadence. |
Nonqualified Deferred Compensation
We have maintained the Deferred Compensation Plan as a nonqualified
contribution benefit arrangement for our executive officers. None of the NEOs participate in this plan, and the plan is frozen.
Potential Payments Upon Termination or Change in Control
The following tables show the amounts each NEO would have received
assuming the NEO resigned or retired, his or her employment was terminated without cause, he or she terminated employment for good reason, a change in control occurred with a resulting termination of employment, or he or she died or became disabled,
in each case effective December 31, 2024. Additional information regarding the payments described below is summarized above under “COMPENSATION DISCUSSION AND ANALYSIS - Letter Agreements and Change in Control Agreements” and under “Pension
Benefits.”
Letter Agreements
The Company executed individual letter agreements with Ms. Toalson and
Messrs. Rollins and Bagley. Neither Mr. Braddock nor Mr. Lambert has entered into a letter agreement. The discussion below applies only to Ms. Toalson and Messrs. Rollins and Bagley unless specifically noted.
Base Payments. In any termination, the executive is entitled to accrued, but unpaid compensation, such as salary, vacation, and incentive pay as well as any employee benefits which are due pursuant to the relevant plan. Other
compensation may be payable upon a good reason termination by the executive, a not-for-cause termination by the Company, death, or disability as described below or in the accompanying table. Except for accrued, but unpaid compensation, each payment
or benefit due under any of the letter agreements requires timely execution and non-revocation of a release.
Good Reason or Without Cause. With respect to a good reason termination by the executive or a not-for-cause termination by the Company, Mr. Rollins, Ms. Toalson, and Mr. Bagley, each receive (a) a pro-rated portion of any partial year
target incentive payment for the year of termination, (b) the employer cost of continuation coverage under the Company’s group health plans for a 24-month period, excluding any employee contribution and (c) severance equal to a multiple of annual
salary plus the target incentive. With respect to Mr. Rollins, the multiple is three, and with respect to Ms. Toalson and Mr. Bagley, two.
In addition to the payments and benefits above resulting from termination
without cause or a good reason termination by the executive, Mr. Rollins is entitled to enhancements of their long-term equity benefits. Mr. Rollins is entitled to accelerated vesting and lapse of any restrictions on all outstanding long-term
incentive awards with performance to be determined in the same manner as other senior executives.
Executive Compensation
A good reason termination may occur if the executive experiences any of the following: (a) a
diminution in annual base pay, excluding a temporary reduction which applies to similarly-situated executives, or a diminution in the target incentive payment, (b) a material diminution in position, title, authority, duties, or responsibilities, (c)
a change in the party to whom executive reports, (d) a required change in the location where services are performed, (e) a material breach of the letter agreement, or (f) a failure by the Company to require a successor to assume the letter agreement.
For Ms. Toalson and Mr. Bagley, a material diminution under subsection (b) must also result in the loss of a position on the Executive Management Committee.
A termination without cause excludes a termination as a result of death
or disability as well as a for-cause termination. With respect to the NEOs with a letter agreement, such executive’s employment may be terminated for cause if the executive (a) engages in an act of misconduct or dishonesty that is injurious to the
Company, (b) engages in an act of fraud, embezzlement, theft, or any other crime of moral turpitude, without the necessity of formal charges, (c) willfully violated a material, written policy or procedure, (d) is suspended or temporarily prohibited
from participating in the affairs of the Company by the FDIC, or (e) breaches the restrictive covenants contained in the letter agreement. Any other terminations by the Company, excluding death and disability, are deemed to be without cause for
purposes of the letter agreement.
Disability or Death. In the event of the executive’s disability or death, the executive or the estate is entitled to receive (a) a pro-rated portion of any partial year target incentive payment for the
year of termination, (b) the cost of continuation coverage under the Company’s group health plans (i) for the period of disability up to a maximum of 29 months for Mr. Rollins and (ii) for 12 months for Ms. Toalson and Mr. Bagley, and (c), for Mr.
Rollins, accelerated vesting and lapse of any restrictions on outstanding long-term incentive awards and of any service requirements related to performance-vesting with achievement determined on the basis of other similarly-situated executives for
Mr. Rollins. With respect to any long-term incentive awards applicable upon retirement or stock options or stock appreciation rights, those remain outstanding and exercisable for the full term.
Section 280G. If any payment under the letter agreement or any other similar agreement would trigger an excise tax to the executive as a result of Sections 280G and 4999 of the Internal Revenue Code, a determination
is made by an independent accounting firm whether to reduce the amount of the payments under the letter agreement so the aggregate after-tax payments to the executive after the reduction exceeds the amount that would have been paid absent the
reduction.
Restrictive Covenants. The letter agreements also contain restrictive covenants. Each agreement requires perpetual mutual non-disparagement and confidentiality as well as non-solicitation and
non-competition provisions with differing lengths. Messrs. Rollins and Bagley’s and Ms. Toalson’s non-solicitation and non-competition restrictions end 12 months following termination of employment.
Change in Control Agreements
Amount of Change in Control Benefit. Each on-going NEO is entitled to a payment of a multiple of base salary plus target bonus upon a termination of employment without cause or for good reason within 12 months after a
change in control, as well as vesting of outstanding equity. The multiples are as follows: Mr. Rollins, three; Ms. Toalson and Mr. Bagley, two and one-half; Mr. Braddock and Mr. Lambert, two. The change in control agreements provide for additional
multiples of perquisites and insurance benefits, ranging from two to three, depending upon the multiple in the individual’s agreement.
Good Reason or Without Cause. The change in control benefit is limited to an involuntary termination by the surviving entity without “cause” or termination by the executive for “good reason” within 12 months of
the change in control. The definitions of cause and good reason are materially the same as the definitions under the letter agreements, provided that a reduction in pay applicable to similarly-situated executives may trigger a good reason termination
under the relevant Change in Control Agreement.
Double Trigger. Each agreement includes a “double trigger” (i.e., requiring both a change in control and termination of the executive’s employment) so the executive will only receive additional benefits if a change in
control also has an adverse impact on the executive. With respect to stock incentive awards granted prior to 2021, only 50% of the award becomes vested on a change in control while the other 50% is subject to the “double trigger” described above.
Section 280G. As described above with respect to the letter agreements, covered executives are not entitled to a tax gross up due to excise taxes under Section 280G of the Code. Compensatory payments and benefits to
be received on a change in control may be reduced in the event the aggregate change in control payments triggers an excise tax under Section 280G with respect to the benefit of any of the NEOs as set forth above with respect to letter agreements.
Executive Compensation
Restrictive Covenants. The terms of the Change in Control Agreements contain restrictive covenants. Under these covenants, Mr. Rollins and Mr. Bagley may not at any time divulge confidential information
about the Company or its affiliates and, for during the term of employment and a period of two years following termination of employment (except in the case of a resignation for good reason), operate, own, be employed by or consult with any competing
business, or directly or indirectly solicit customers or employees of Cadence or any of its affiliates. The agreements of Ms. Toalson, Mr. Braddock, and Mr. Lambert contain similar restrictions on disclosure of confidential information and are
restricted from directly or indirectly soliciting customers or employees of Cadence and affiliates for one year.
Mr. Rollins
| Executive Benefits and Payments upon Termination |
|
Retirement |
|
Involuntary
Termination without
Cause/Good
Reason |
|
Involuntary or Good
Reason
Termination
Related to Change
in Control (1) |
|
Death or Disability |
| Base Salary(2) |
|
$0 |
|
|
$3,120,000 |
|
|
$3,120,000 |
|
|
$0 |
|
| Non-Equity Incentive Plan Compensation(3) |
|
0 |
|
|
4,680,000 |
|
|
4,680,000 |
|
|
0 |
|
| Restricted Stock (unvested)(4) |
|
0 |
|
|
1,056,271 |
(5) |
|
1,056,271 |
(5) |
|
1,056,271 |
(5) |
| Restricted Stock Units (unvested)(4) |
|
6,862,922 |
(6) |
|
6,921,005 |
(7) |
|
6,921,005 |
(7) |
|
6,921,005 |
(7) |
| Performance Units (unvested)(4)(8) |
|
4,822,522 |
|
|
4,822,522 |
|
|
4,822,522 |
|
|
4,822,522 |
|
| Health and Fringe Benefits |
|
0 |
|
|
20,953 |
(9) |
|
57,118 |
(10) |
|
20,953 |
(9) |
| Split Dollar Life Plan |
|
5,800 |
(11) |
|
5,800 |
(11) |
|
5,800 |
(11) |
|
2,500,000 |
(12) |
| Restoration Plan(13) |
|
582,392 |
|
|
582,392 |
|
|
582,392 |
|
|
582.392 |
|
|
Supplemental Executive Retirement Plan(14)
|
|
404,226 |
|
|
404,226 |
|
|
404,226 |
|
|
404,226 |
|
| Accrued Vacation |
|
120,000 |
|
|
120,000 |
|
|
120,000 |
|
|
120,000 |
|
| Perquisites |
|
0 |
|
|
0 |
|
|
60,649 |
(15) |
|
0 |
|
|
(1) |
Amounts shown as a result of a termination after a change in control may be reduced according to the terms of the applicable agreement, which require reductions after
application of the excise tax imposed under Code Section 4999 if the aggregate after-tax payments to the executive after the reduction exceeds the amount that would have been paid absent the reduction, as set forth above. |
|
(2) |
The amounts shown reflect the product of three multiplied by Mr. Rollins’ base salary pursuant to the terms of Mr. Rollins’ letter agreement and his change in control
agreement, respectively. No amount of base salary is payable upon retirement, death or disability under the letter agreement. |
|
(3) |
The amounts shown reflect the product of three multiplied by Mr. Rollins’ target annual cash incentive pursuant to the terms of his letter agreement and his change in
control agreement as modified by the letter agreement, respectively. No amount of annual cash incentive is payable upon retirement, death or disability. |
|
(4) |
All calculations of restricted stock awards, restricted stock units, and performance stock units are based on the closing sale price of our common stock of $34.45 per
share, as reported on the NYSE on December 31, 2024. See Outstanding Equity Awards at 2024 Fiscal Year-End for more information. |
|
(5) |
The amounts shown reflect the market value of 30,661 shares of restricted stock from the 2020 award. All outstanding restricted stock awards vest upon termination, except
for retirement, pursuant to Mr. Rollins’ letter agreement. |
|
(6) |
Vesting as a result of retirement under the restricted stock unit awards is available to all employees who retire in good standing with notice on or after age 60 with at
least five years of service and the execution of an agreement containing a two-year non-competition, non-solicitation and other restrictive covenants. The amount shown reflects the market value of 155,461 restricted stock units, composed of a
pro-rated amount of 24,876 restricted stock units from the April 2021 award; the full 45,849 from the April 2022 award; the full 48,664 from the April 2023 award, and the full 36,072 from the April 2024 award. In addition, the amount shown
reflects the market value of 43,753 performance stock units that converted to time-based vesting on December 31, 2024, after completion of the performance period. Those units will vest March 31, 2025. |
|
(7) |
The amount shown reflects the market value of 157,147 restricted stock units, composed of 26,562 restricted stock units from the April 2021 award; the full 45,849 from the
April 2022 award; the full 48,664 from the April 2023 award, and the full 36,072 from the April 2024 award. In addition, the amount shown reflects the market value of 43,753 performance stock units that converted to time-based vesting on
December 31, 2024, after completion of the performance period. All outstanding restricted stock units vest upon an involuntary or good reason termination pursuant to Mr. Rollins’ letter agreement or change in control agreement, as applicable. |
Executive Compensation
|
(8) |
The amounts shown reflect the market value of 139,987 performance stock units, composed of 72,996 performance units granted in April 2023 and 66,991 performance units
granted in April 2024, each determined at the target performance level. Both performance unit agreements provide for full vesting upon retirement in good standing on or after age 60 with at least five years of service and execution of an
agreement containing a two-year non-competition, non-solicitation, and other restrictive covenants. All outstanding performance units continue to vest pursuant to Mr. Rollins’ letter agreement as a result of death, disability, or an involuntary
or good reason termination. Additionally, his change in control agreement vests such awards as a result of an involuntary or good reason termination in connection with a change in control. Upon completion of the performance period, the payout
percentage will be calculated according to the percentage paid for similarly-situated executives. |
|
(9) |
The amount shown reflects the employer-cost of participation in our health and welfare plans for a period of 24 months as required by Mr. Rollins’ letter agreement as a
result of involuntary termination, good reason termination, or disability. No amount is payable upon death. |
|
(10) |
The amount shown reflects the value for participation in our health and welfare benefit plans and fringe benefits for a 36-month period following a change in control in
accordance with the terms of Mr. Rollins’ change in control agreement. |
|
(11) |
The amounts reflect the value of one year of the split dollar benefit, which vests upon completion of five years of service after age 55, under the terms of the Split
Dollar Plan. |
|
(12) |
The amount shown reflects the proceeds due under our split dollar life insurance program in the event of death on or before December 31, 2024. There is no disability
benefit under this program; however, because the benefit is vested, Mr. Rollins would also have imputed income in the event of disability, in the same amount as any non-death termination of employment. |
|
(13) |
The amount shown reflects the lump sum present value of benefits accrued that would be payable under the Restoration Plan. |
|
(14) |
The amounts shown reflect the annual benefit payable upon retirement at age 66 years and one month. |
|
(15) |
The amount shown is equal to 300% of the value of perquisites provided to Mr. Rollins under his change in control agreement. |
Ms. Toalson
Executive Benefits and Payments upon
Termination |
|
Retirement |
|
Involuntary
Termination
without
Cause/
Good
Reason |
|
Involuntary or
Good Reason
Termination
Related to
Change in
Control (1) |
|
Death or
Disability |
| Base Salary (2) |
|
$0 |
|
|
$1,200,000 |
|
|
$1,500,000 |
|
|
$0 |
|
| Non-Equity Incentive Plan Compensation(3) |
|
0 |
|
|
1,200,000 |
|
|
1,500,000 |
|
|
0 |
|
| Restricted Stock Units (unvested)(4) |
|
0 |
|
|
0 |
|
|
1,278,508 |
(5) |
|
517,332 |
(6) |
| Performance Units (unvested)(4) |
|
0 |
|
|
0 |
|
|
1,108,153 |
(7) |
|
537,030 |
(8) |
| Health and Fringe Benefits |
|
0 |
|
|
34,475 |
(9) |
|
78,250 |
(10) |
|
17,237 |
(9) |
| Split Dollar Life Plan(11) |
|
0 |
|
|
3,038 |
|
|
3,038 |
|
|
2,500,000 |
|
| Restoration Plan(12) |
|
67,272 |
|
|
67,272 |
|
|
67,272 |
|
|
67,272 |
|
| Supplemental Executive Retirement Plan(13) |
|
121,926 |
|
|
121,926 |
|
|
174,180 |
|
|
121,926 |
|
| Accrued Vacation |
|
86,011 |
|
|
86,011 |
|
|
86,011 |
|
|
86,011 |
|
| Perquisites |
|
0 |
|
|
0 |
|
|
68,979 |
(14) |
|
0 |
|
|
(1) |
Amounts shown as a result of a termination after a change in control may be reduced according to the terms of the applicable agreement, which require reductions after
application of the excise tax imposed under Code Section 4999 if the aggregate after-tax payments to the executive after the reduction exceeds the amount that would have been paid absent the reduction, as set forth above. |
|
(2) |
The amounts shown reflect the product of two multiplied by Ms. Toalson’s base salary with respect to an involuntary termination without cause/good-reason and the product of
base salary multiplied by two and one-half with respect to a termination related to change in control, pursuant to her letter agreement and change in control agreement, respectively. No amount is payable upon retirement, death or disability
under the letter agreement or the change in control agreement. |
Executive Compensation
|
(3) |
The amounts shown reflect the product of Ms. Toalson’s target incentive multiplied by two with respect to an involuntary termination without cause/good-reason and the
product of the target incentive multiplied by two and one-half with respect to a termination related to change in control, pursuant to her letter agreement and change in control agreement, respectively. |
|
(4) |
All calculations of restricted stock awards, restricted stock units, and performance stock units are based on the closing sale price of our common stock of $34.45 per
share, as reported on the NYSE on December 31, 2024. See Outstanding Equity Awards at 2024 Fiscal Year-End for more information. |
|
(5) |
The amount shown reflects the market value of 28,362 outstanding restricted stock units, composed of 9,170 restricted stock units from the April 2022 award; 9,733 from the
April 2023 award; and 9,459 from the April 2024 award. In addition, the amount shown reflects the market value of 8,750 performance stock units that converted to time-based vesting on December 31, 2024, after completion of the performance
period. All outstanding restricted stock units vest upon an involuntary or good reason termination following a change in control according to Ms. Toalson’s change in control agreement and are paid at the same rate as other similarly-situated
executives. |
|
(6) |
A pro rata portion of the restricted stock units vest on death or disability according to the terms of the awards. The pro rata portion is determined by dividing the months
since grant by the number of months from the date of grant to vesting for each award (or each tranche of an award) and applying that percentage to the award. The amounts shown reflect the market value of 15,017 outstanding restricted stock
units. In addition, the amount shown reflects the market value of 8,750 performance stock units that converted to time-based vesting on December 31, 2024, after completion of the performance period. |
|
(7) |
The amount shown reflects the value of 32,167 performance units composed of 14,599 performance units granted in April 2023 and 17,568 performance units granted in April
2024, each determined at the target performance level. All outstanding performance units continue to vest pursuant to her change in control agreement as a result of an involuntary or good reason termination in connection with a change in
control. Upon completion of the performance period, the payout percentage will be calculated according to the percentage paid for similarly-situated executives. |
|
(8) |
The amount shown reflects the value of 15,589 performance units composed of 9,733 performance units granted in April 2023 and 5,856 performance units granted in April 2024,
each determined at the target performance level. The awards are pro-rated to reflect the remainder of the performance period as of December 31, 2024. Upon completion of the performance period, the payout percentage will be calculated according
to the percentage paid for similarly-situated executives. |
|
(9) |
The amounts shown reflect the employer portion of the premiums paid for any health, dental or vision that Ms. Toalson has elected. With respect to an involuntary or
good-reason termination, the period is 24 months and with respect to a disability termination, the period is 12 months. No health, dental or vision premium is paid as a result of death; however, Ms. Toalson is entitled to the value of other
executive benefits in the event of her death under the split dollar plan, which is described below. |
|
(10) |
The amount shown reflects the value of Ms. Toalson’s participation in our health and welfare benefit plans and fringe benefits for a 36-month period following a change in
control in accordance with the terms of the Company’s change in control agreement. |
|
(11) |
The amounts reflect the value of one year of the split dollar benefit, which vests upon completion of five years of service after age 55, under the terms of the Split
Dollar Plan. Ms. Toalson is entitled to a split dollar benefit upon her death, but she was not yet vested in the benefit if she left service on December 31, 2024. |
|
(12) |
The amount shown reflects the lump sum present value of benefits accrued that would be payable under the Restoration Plan. |
|
(13) |
The amount shown is the annual benefit at age 59 years, six months. |
|
(14) |
The amount shown is equal to 250% of the value of perquisites according to the change in control multiplier in Ms. Toalson’s letter agreement. |
Executive Compensation
Mr. Bagley
| Executive Benefits and Payments upon Termination |
|
Retirement |
|
Involuntary Termination without Cause/Good
Reason |
|
Involuntary or Good
Reason Termination
Related to Change in
Control (1)
|
|
Death or Disability |
| Base Salary (2) |
|
$0 |
|
|
$1,400,000 |
|
|
$1,750,000 |
|
|
$0 |
|
| Non-Equity Incentive Plan Compensation (3) |
|
0 |
|
|
1,750,000 |
|
|
2,187,500 |
|
|
0 |
|
| Restricted Stock (unvested) (4) |
|
0 |
|
|
0 |
|
|
530,461 |
(5) |
|
496,781 |
(6) |
| Restricted Stock Units (unvested) (4) |
|
2,783,824 |
(7) |
|
0 |
|
|
2,822,730 |
(8) |
|
1,925,545 |
(9) |
| Performance Units (unvested) (4) |
|
1,773,776 |
(10) |
|
0 |
|
|
1,773,776 |
(10) |
|
899,685 |
(11) |
| Health and Fringe Benefits |
|
0 |
|
|
24,954 |
(12) |
|
55,478 |
(13) |
|
12,477 |
(14) |
| Split Dollar Life Plan |
|
4,625 |
(15) |
|
4,625 |
(15) |
|
4,625 |
(15) |
|
2,500,000 |
(16) |
| Restoration Plan (17) |
|
242,906 |
|
|
242,906 |
|
|
242,906 |
|
|
242,906 |
|
|
Supplemental Executive Retirement Plan (18)
|
|
234,179 |
|
|
234,179 |
|
|
234,179 |
|
|
234,179 |
|
| Accrued Vacation |
|
94,230 |
|
|
94,230 |
|
|
94,230 |
|
|
94,230 |
|
| Perquisites |
|
0 |
|
|
0 |
|
|
56,153 |
(19) |
|
0 |
|
|
(1) |
Amounts shown as a result of a termination after a change in control may be reduced according to the terms of the applicable agreement, which require reductions after
application of the excise tax imposed under Code Section 4999 if the aggregate after-tax payments to the executive after the reduction exceeds the amount that would have been paid absent the reduction, as set forth above. |
|
(2) |
The amounts shown reflect the product of Mr. Bagley’s base salary multiplied by two with respect to an involuntary termination without cause/good reason pursuant to his
letter agreement and the product of his base salary multiplied by two and one-half with respect to a termination related to a change in control pursuant to his change in control agreement. No amount is payable on retirement, death or
disability. |
|
(3) |
The amounts shown reflect the product of Mr. Bagley’s target incentive multiplied by two with respect to an involuntary termination without cause/good reason pursuant to
his letter agreement and the product of the target incentive multiplied by two and one-half with respect to a termination related to a change in control pursuant to his change in control agreement as modified by his letter agreement. No amount
is payable on retirement, death or disability. |
|
(4) |
All calculations of restricted stock awards, restricted stock units, and performance stock units are based on the closing sale price of our common stock of $34.45 per
share, as reported on the NYSE on December 31, 2024. See Outstanding Equity Awards at 2024 Fiscal Year-End for more information. |
|
(5) |
The amount shown reflects the market value of 15,398 shares of restricted stock. All outstanding restricted stock vests upon termination without cause or for good-reason in
connection with a change in control pursuant to Mr. Bagley’s change in control agreement. |
|
(6) |
The amount shown reflects the market value of 14,420 shares of restricted stock, composed of pro-rated portions of awards vesting in May 2025. In the case of death or
disability, a pro rata number of restricted stock awards vest pursuant to the relevant restricted stock agreements. The prorated number is determined for each award by multiplying the award by a fraction, the numerator of which is the number of
whole months between award date and the date of death or disability and the denominator of which is the number of whole months in the vesting period. |
|
(7) |
The amount shown reflects the market value of 64,699, composed of 16,658 restricted stock units from the April 2021 award, 16,881 restricted stock units from the April 2022
award; 17,917 from the April 2023 award; and 13,243 from the April 2024 award. In addition, the amount shown reflects the market value of 16,109 performance stock units that converted to time-based vesting on December 31, 2024, after completion
of the performance period. Upon retirement in good standing on or after age 60 with at least five years of service and execution of an agreement containing two-year non-competition, non-solicitation and other restrictive covenants, Mr. Bagley
is eligible to vest in these units. |
|
(8) |
The amount shown reflects the market value of 65,828 outstanding restricted stock units, composed of 17,787 restricted stock units from the April 2021 award; 16,881
restricted stock units from the April 2022 award; 17,917 from the April 2023 award; and 13,243 from the April 2024 award. In addition, the amount shown reflects the market value of 16,109 performance stock units that converted to time-based
vesting on December 31, 2024, after completion of the performance period. All outstanding restricted stock units vest upon an involuntary or good reason termination following a change in control according to Mr. Bagley’s change in control
agreement. |
Executive Compensation
|
(9) |
A pro rata portion of the restricted stock units vest on death or disability according to the terms of the awards. The pro rata portion is determined by dividing the months
since grant by the number of months from the date of grant to vesting for each award (or each tranche of an award) and applying that percentage to the award. The amounts shown reflect the market value of 39,785 outstanding restricted stock
units. In addition, the amount shown reflects the market value of 16,109 performance stock units that converted to time-based vesting on December 31, 2024, after completion of the performance period. |
|
(10) |
The amounts shown reflect the market value of 51,471 performance stock units, composed of 26,876 performance stock units granted in April 2023 and 24,595 performance stock
units granted in April 2024, each determined at the target performance level. Both performance unit agreements provide for continued vesting upon retirement in good standing on or after age 60 with at least five years of service and execution
of an agreement containing a two-year non-competition, non-solicitation, and other restrictive covenants. Additionally, Mr. Bagley’s change in control agreement vests such awards as a result of an involuntary or good reason termination in
connection with a change in control. |
|
(11) |
The amount shown reflects the value of 26,116 performance units composed of 17,917 performance units granted in April 2023 and 8,198 performance units granted in April
2024, each determined at the target performance level. The awards are pro-rated to reflect the remainder of the performance period as of December 31, 2024. Upon vesting, the percentage will be calculated according to the percentage paid for
similarly-situated executives. |
|
(12) |
The amount shown reflects the employer-cost of participation in our health and welfare plans for a period of 24 months in accordance with the terms of the letter agreement
with Mr. Bagley. |
|
(13) |
The amount shown reflects the value for participation in our health and welfare benefit plans for a 36-month period in accordance with the terms of Mr. Bagley’s change in
control agreement. |
|
(14) |
The amount shown reflects the employer-cost of participation in our health and welfare plans for a period of 12 months in the event of his disability in accordance with the
terms of the letter agreement with Mr. Bagley. |
|
(15) |
The amount reflects the value of one year of the split dollar benefit, which vests upon completion of five years of service after age 55, under the terms of the Split
Dollar Plan. |
|
(16) |
The amount shown reflects the proceeds due under our split dollar life insurance program in the event of death on or before December 31, 2024. There is no disability
benefit under this program; however, because the benefit is vested, Mr. Bagley would also have imputed income in the event of disability, in the same amount as any non-death termination of employment. |
|
(17) |
The amount shown reflects the lump sum present value of benefits accrued that would be payable under the Restoration Plan. |
|
(18) |
The amount shown reflects the annual benefit payable upon retirement at 64 years and 1 month. |
|
(19) |
The amount shown is equal to 300% of the value of perquisites provided to Mr. Bagley under his change in control agreement. |
Mr. Braddock
| Executive Benefits and Payments upon Termination |
|
Retirement |
|
Involuntary Termination
without Cause/Good
Reason |
|
Involuntary or Good
Reason
Termination
Related to Change
in Control (1) |
|
Death or Disability |
| Base Salary (2) |
|
$0 |
|
|
$0 |
|
|
$1,030,000 |
|
|
$0 |
|
| Non-Equity Incentive Plan Compensation (3) |
|
0 |
|
|
0 |
|
|
1,030,000 |
|
|
0 |
|
| Restricted Stock Units (unvested) (4) |
|
0 |
|
|
0 |
|
|
1,184,977 |
(5) |
|
739,334 |
(6) |
| Performance Units (unvested) (4) |
|
0 |
|
|
0 |
|
|
655,377 |
(7) |
|
306,467 |
(8) |
| Health and Fringe Benefits |
|
0 |
|
|
0 |
|
|
54,057 |
(9) |
|
0 |
|
| Split Dollar Life Plan |
|
0 |
|
|
0 |
|
|
0 |
|
|
0 |
|
| Restoration Plan (10) |
|
22,276 |
|
|
22,276 |
|
|
22,276 |
|
|
22,276 |
|
| Supplemental Executive Retirement Plan |
|
0 |
|
|
0 |
|
|
0 |
|
|
0 |
|
| Accrued Vacation |
|
53,688 |
|
|
53,688 |
|
|
53,688 |
|
|
53,688 |
|
| Perquisites |
|
0 |
|
|
0 |
|
|
82,842 |
(11) |
|
0 |
|
|
(1) |
Amounts shown as a result of a termination after a change in control may be reduced according to the terms of the applicable agreement, which require reductions after
application of the excise tax imposed under Code Section 4999 if the aggregate after-tax payments to the executive after the reduction exceeds the amount that would have been paid absent the reduction, as set forth above. |
Executive Compensation
|
(2) |
The amounts shown reflect the product of Mr. Braddock’s base salary multiplied by two with respect to a good reason or involuntary termination in connection with a change
in control pursuant to his change in control agreement. No amount is payable due to an involuntary or good reason termination outside the change of control context, or on retirement, death or disability. |
|
(3) |
The amounts shown reflect the product of Mr. Braddock’s annual target cash incentive multiplied by two with respect to a good reason or involuntary termination in
connection with a change in control pursuant to his change in control agreement. No amount is payable due to an involuntary or good reason termination outside the change of control context, or on retirement, death or disability. |
|
(4) |
All calculations of restricted stock awards, restricted stock units, and performance stock units are based on the closing sale price of our common stock of $34.45 per
share, as reported on the NYSE on December 31, 2024. See Outstanding Equity Awards at 2024 Fiscal Year-End for more information. |
|
(5) |
The amount shown reflects the market value of 29,863 outstanding restricted stock units, composed of 4,752 restricted stock units from the April 2022 award; 18,994 from the
April 2023 and October 2023 awards; and 6,117 from the April 2024 award. In addition, the amount shown reflects the market value of 4,534 performance stock units that converted to time-based vesting on December 31, 2024, after completion of the
performance period. All outstanding restricted stock units vest upon an involuntary or good reason termination following a change in control according to Mr. Braddock’s change in control agreement and are paid at the same rate as other
similarly-situated executives. |
|
(6) |
A pro rata portion of the restricted stock units vest on death or disability according to the terms of the awards. The pro rata portion is determined by dividing the months
since grant by the number of months from the date of grant to vesting for each award (or each tranche of an award) and applying that percentage to the award. The amounts shown reflect the market value of 16,927 outstanding restricted stock
units. In addition, the amount shown reflects the market value of 4,534 performance stock units that converted to time-based vesting on December 31, 2024, after completion of the performance period. |
|
(7) |
The amount shown reflects the value of 19,024 performance units composed of 7,664 performance units granted in April 2023 and 11,360 performance units granted in April
2024, each determined at the target performance level. All outstanding performance units continue to vest pursuant to his change in control agreement as a result of an involuntary or good reason termination in connection with a change in
control. Upon vesting, the percentage will be calculated according to the percentage paid for similarly-situated executives. |
|
(8) |
The amount shown reflects the value of 15,589 performance units composed of 9,733 performance units granted in April 2023 and 5,856 performance units granted in April 2024,
each determined at the target performance level. The awards are pro-rated to reflect the remainder of the performance period as of December 31, 2024. Upon vesting, the percentage will be calculated according to the percentage paid for
similarly-situated executives. |
|
(9) |
The amount shown reflects the value for participation in our health and welfare benefit plans for a 24-month period in accordance with the terms of Mr. Braddock’s change in
control agreement. |
|
(10) |
The amount shown reflects the lump sum present value of benefits accrued that would be payable under the Restoration Plan. |
|
(11) |
The amount shown is equal to 200% of the value of perquisites provided to Mr. Braddock under his change in control agreement. |
Executive Compensation
Mr. Lambert
| Executive Benefits and Payments upon Termination |
|
Retirement |
|
Involuntary Termination
without Cause/Good
Reason |
|
Involuntary of Good
Reason Termination
Related to Change in
Control (1) |
|
Death or Disability |
| Base Salary (2) |
|
$0 |
|
|
$0 |
|
|
$880,000 |
|
|
$0 |
|
| Non-Equity Incentive Plan Compensation (3) |
|
0 |
|
|
0 |
|
|
880,000 |
|
|
0 |
|
| Restricted Stock (unvested) (4) |
|
0 |
|
|
0 |
|
|
37,137 |
(5) |
|
34,779 |
(6) |
| Restricted Stock Units (unvested) (4) |
|
0 |
|
|
0 |
|
|
1,254,875 |
(7) |
|
682,216 |
(8) |
| Performance Units (unvested) (4) |
|
0 |
|
|
0 |
|
|
720,832 |
(9) |
|
362,207 |
(10) |
| Health and Fringe Benefits |
|
0 |
|
|
0 |
|
|
36,647 |
(11) |
|
0 |
|
| Split Dollar Life Plan |
|
0 |
|
|
813 |
(12) |
|
813 |
(12) |
|
2,500,000 |
(13) |
| Restoration Plan (14) |
|
26,932 |
|
|
26,932 |
|
|
26,932 |
|
|
26,932 |
|
| Supplemental Executive Retirement Plan (15) |
|
95,420 |
|
|
95,420 |
|
|
95,420 |
|
|
95,420 |
|
| Accrued Vacation |
|
33,845 |
|
|
33,845 |
|
|
33,845 |
|
|
33,845 |
|
| Perquisites |
|
0 |
|
|
0 |
|
|
39,702 |
(16) |
|
0 |
|
|
(1) |
All calculations of restricted stock awards, restricted stock units, and performance stock units are based on the closing sale price of our common stock of $34.45 per
share, as reported on the NYSE on December 31, 2024. See Outstanding Equity Awards at 2024 Fiscal Year-End for more information. |
|
(2) |
Amounts shown as a result of a termination after a change in control may be reduced according to the terms of the applicable agreement, which require reductions after
application of the excise tax imposed under Code Section 4999 if the aggregate after-tax payments to the executive after the reduction exceeds the amount that would have been paid absent the reduction, as set forth above. |
|
(3) |
The amounts shown reflect the product of Mr. Lambert’s base salary multiplied by two with respect to a good reason or involuntary termination in connection with a change in
control pursuant to his change in control agreement. No amount is payable due to an involuntary or good reason termination outside the change of control context, or on retirement, death or disability. |
|
(4) |
The amounts shown reflect the product of Mr. Lambert’s annual target cash incentive multiplied by two with respect to a good reason or involuntary termination in connection
with a change in control pursuant to his change in control agreement. No amount is payable due to an involuntary or good reason termination outside the change of control context, or on retirement, death or disability. |
|
(5) |
The amount shown reflects the market value of 1,078 shares of restricted stock. All outstanding restricted stock vests upon termination without cause or for good-reason in
connection with a change in control pursuant to Mr. Lambert’s change in control agreement. |
|
(6) |
The amount shown reflects the market value of 1,010 shares of restricted stock, composed of pro-rated portions of awards vesting in May 2025. In the case of death or
disability, a pro rata number of restricted stock awards vest pursuant to the relevant restricted stock agreements. The prorated number is determined for each award by multiplying the award by a fraction, the numerator of which is the number of
whole months between award date and the date of death or disability and the denominator of which is the number of whole months in the vesting period. |
|
(7) |
The amount shown reflects the market value of 30,858 outstanding restricted stock units, composed of 4,995 restricted stock units from the January 2021 award; 5,836
restricted stock units from the April 2022 award; 7,078 from the April 2023 award; and 11,871 from the April 2024 and October 2024 awards. In addition, the amount shown reflects the market value of 5,568 performance stock units that converted
to time-based vesting on December 31, 2024, after completion of the performance period. All outstanding restricted stock units vest upon an involuntary or good reason termination following a change in control according to Mr. Lambert’s change
in control agreement and are paid at the same rate as other similarly-situated executives. |
|
(8) |
A pro rata portion of the restricted stock units vest on death or disability according to the terms of the awards. The pro rata portion is determined by dividing the months
since grant by the number of months from the date of grant to vesting for each award (or each tranche of an award) and applying that percentage to the award. The amounts shown reflect the market value of 14,235 outstanding restricted stock
units. In addition, the amount shown reflects the market value of 5,568 performance stock units that converted to time-based vesting on December 31, 2024, after completion of the performance period. |
Executive Compensation
|
(9) |
The amount shown reflects the value of 20,924 performance units composed of 10,618 performance units granted in April 2023 and 10,306 performance units granted in April
2024, each determined at the target performance level. All outstanding performance units continue to vest pursuant to his change in control agreement as a result of an involuntary or good reason termination in connection with a change in
control. Upon vesting, the percentage will be calculated according to the percentage paid for similarly-situated executives. |
|
(10) |
The amount shown reflects the value of 10,514 performance units composed of 7,079 performance units granted in April 2023 and 3,345 performance units granted in April 2024,
each determined at the target performance level. The awards are pro-rated to reflect the remainder of the performance period as of December 31, 2024. Upon vesting, the percentage will be calculated according to the percentage paid for
similarly-situated executives. |
|
(11) |
The amount shown reflects the value for participation in our health and welfare benefit plans for a 24-month period in accordance with the terms of Mr. Lambert’s change in
control agreement. |
|
(12) |
The amount reflects the value of one year of the split dollar benefit, which vests upon completion of five years of service after age 55, under the terms of the Split
Dollar Plan. |
|
(13) |
Mr. Lambert’s heirs would be entitled to a split dollar benefit upon his death in service, but he is not yet vested if he leaves service. |
|
(14) |
The amount shown reflects the lump sum present value of benefits accrued that would be payable under the Restoration Plan. |
|
(15) |
The amount shown reflects the annual benefit payable upon retirement at 43 years and 2 months. Mr. Lambert’s benefit as of October 21, 2021, is vested. |
|
(16) |
The amount shown is equal to 200% of the value of perquisites provided to Mr. Lambert under his change in control agreement. |
Executive Compensation
Pay Versus Performance
As required by Section 953(a) of the Dodd-Frank Wall Street Reform and
Consumer Protection Act, and Item 402(v) of Regulation S-K, the chart below reflects the “compensation actually paid” to Mr. Rollins, our PEO, and an average of the “compensation actually paid” to our remaining NEOs, in each case as calculated in
accordance with Item 402(v) of Regulation S-K, as compared to our total shareholder return, the total shareholder return of the KBW Regional Bank index peer group, our net income, and the measure the Company has identified as the most important
element of its executive compensation program, adjusted PPNR.
| Year |
Summary
Compensation
Total for
PEO(1)
|
Compensation
Actually Paid
to PEO
|
Average
Summary
Compensation
Table Total for
Non-PEO
NEOs(2)
|
Average
Compensation
Actually Paid
to non-PEO
NEOs
|
Value of Fixed Initial $100 Investment |
Net Income
(Thousands)(5) |
Adjusted
PPNR (6) |
|
Total
Shareholder
Return(3)
|
Peer Group
Total
Shareholder
Return(4)
|
| 2024 |
$5,748,777 |
$7,701,534 |
$1,157,752 |
$1,388,809 |
129.66 |
132.63 |
$523,604 |
$739,005 |
| 2023 |
5,011,483 |
8,325,510 |
2,819,001 |
3,557,028 |
107.73 |
96.66 |
542,304 |
612,300 |
| 2022 |
5,882,485 |
4,162,954 |
3,421,152 |
3,107,650 |
86.21 |
97.53 |
463,237 |
722,337 |
| 2021 |
10,577,641 |
10,924,106 |
4,461,822 |
5,176,367 |
100.65 |
124.08 |
195,162 |
452,965 |
| 2020 |
4,395,720 |
2,336,256 |
1,473,908 |
1,029,038 |
90.37 |
89.69 |
228,051 |
400,536 |
|
(1) |
The Principal Executive Officer, or PEO, for each year is Mr. Rollins. |
|
(2) |
The non-PEO NEOs for 2024 are Ms. Toalson, Mr. Bagley, Mr. Braddock, and Mr. Lambert; for 2023, they are Ms. Toalson, Mr. Bagley, Mr. Braddock, the former Chief Banking
Officer Mr. Holmes, the former Executive Vice Chairman Mr. Murphy, and the former President - Banking Services Michael Meyer; for 2022 they are Ms. Toalson, Mr. Murphy, Mr. Bagley, and Mr. Holmes; for 2021, they are Ms. Toalson, the former
Chief Financial Officer Mr. Copeland, Mr. Murphy, Mr. Bagley, and Mr. Holmes; and for 2020, they are Mr. Copeland, Mr. Bagley, Mr. Meyer, and the former Chief Legal Officer Charles Pignuolo. |
|
(3) |
Reflects the Company’s cumulative shareholder return for the years ended December 31, 2024, 2023, 2022, 2021, and 2020, assuming the investment of $100 in our common stock
and reinvestment of all dividends. |
|
(4) |
Reflects the peer group’s cumulative shareholder returns for the years ended December 31, 2024, 2023, 2022, 2021, and 2020, assuming the investment of $100 in the peer
group and the reinvestment of all dividends and weighted according to the respective companies’ stock market capitalization at the beginning of each period for which a return is indicated. The Company selected the KBW Regional Bank Index as its
peer group as set forth in the Company’s Annual Report filed on the Form 10-K, for the fiscal year ended December 31, 2024. |
|
(5) |
Net income is calculated in accordance with U.S. GAAP and is reflected in the Company’s Annual Reports filed on Form 10-K, for each of the years ended December 31, 2024,
2023, 2022, 2021, and 2020. |
|
(6) |
Adjusted PPNR is the Company-selected measure. Please see Appendix A for additional information and a reconciliation of these measures to financial measures derived in
accordance with U.S. GAAP. |
Executive Compensation
The chart below shows the amounts deducted from and added to Summary Compensation Table
total compensation to calculate “compensation actually paid,” or CAP, as required by the SEC’s rules. The dollar amounts reported as CAP do not reflect the actual amount of compensation earned by or paid to the PEO or the Non-PEO NEOs, respectively,
during the applicable year.
| |
PEO |
Non-PEO NEO |
|
Adjustments to Summary Compensation Table Compensation
|
2024 |
2023 |
2022 |
2021 |
2020 |
2024 |
2023 |
2022 |
2021 |
2020 |
| Less Change in
Pension Value from Compensation Table |
$56,032 |
$388,056 |
$150,125 |
$322,091 |
$654,781 |
$37,322 |
$137,782 |
$533,844 |
$373,602 |
$174,766 |
| Plus by Pension
Service Cost (1) |
50,628 |
299,066 |
557,599 |
277,780 |
371,483 |
31,863 |
157,002 |
775,645 |
383,373 |
95,645 |
| Less Stock Awards
Value in Summary Compensation Table |
3,089,262 |
2,485,465 |
2,600,527 |
7,154,737 |
1,391,228 |
448,069 |
737,003 |
901,317 |
661,063 |
390,187 |
|
Plus Fair Value of RSAs and RSUs
granted in the applicable year (2)
|
1,242,680 |
1,439,968 |
1,130,636 |
791,282 |
841,338 |
200,253 |
467,625 |
391,872 |
109,704 |
235,957 |
| Plus Fair Value of
PSUs granted in the applicable year (2) |
2,467,948 |
2,286,379 |
997,194 |
6,455,883 |
420,655 |
335,923 |
633,774 |
345,613 |
1,155,444 |
117,985 |
|
Adjusted by Change in Year-end Fair Value of unvested RSUs, RSA, or PSUs granted in a prior year
(2) (3)
|
2,248,108 |
2,603,348 |
(1,743,083) |
355,052 |
(734,561) |
266,236 |
544,566 |
(542,560) |
100,727 |
(167,747) |
|
Adjusted by Change in Year-end Fair Value of RSUs, RSA, or PSUs that vested in the
applicable year (2)
|
811,481 |
(405,112) |
(189,987) |
157,293 |
(427,337) (3) |
72,294 |
(226,994) |
57,496 |
24,453 |
(47,518) |
| Adjustment to value for
performance in relation to target |
(1,722,796) |
316,209 |
0 |
(311,285) |
(485,033) |
(190,121) |
87,994 |
0 |
(45,314) |
$114,238) |
| Plus Dividends paid by
the Company and accrued |
0 |
371,402 |
278,762 |
97,288 |
0 |
0 |
90,678 |
93,593 |
22,823 |
0 |
|
(1) |
Reflects the “service cost,” calculated as the actuarial present value of the PEO’s or Non-PEO NEO’s, as applicable, benefit under the Retirement Plan and the Restoration
Plan for all NEOs and the Supplemental Executive Retirement Plan for all NEOs except Mr. Copeland, Mr. Braddock, and Mr. Holmes, attributable to services rendered during the covered year. |
|
(2) |
The fair values of the RSAs, RSUs, and 2021 PSUs were determined based on the stock price on the applicable valuation dates. The fair value of the PSUs granted in 2022,
2023, and 2024 with a market condition was determined based on the probable outcome of the performance condition and the stock price on the applicable valuation dates, using a lattice model as described in the Summary Compensation Table. Except
as described in footnote 3, the assumptions used in calculating the fair value of the RSAs, RSUs and PSUs did not differ in any material respect from the assumptions used to calculate the grant date fair value of the awards as reported in the
Summary Compensation Table for the applicable year. The fair value calculation used herein is consistent with the fair value methodology used to account for share-based payments in the Company’s financial statements. |
|
(3) |
PSUs vesting in 2020 and 2021 were awarded at maximum. PSUs vesting in 2022, 2023, vested at 21%, 26%, and 119.4% of target, respectively. Shares to be awarded under all
other PSUs are determined at target. PSUs and RSUs provide for vesting on retirement; however, there are substantial conditions required for vesting including a significant notice period and restrictive covenants, and, accordingly, the CEO or a
Non-PEO’s retirement eligibility, as applicable, is not considered satisfaction of a vesting condition for purposes of this table. |
Executive Compensation
Required Tabular Disclosure of Most Important Measures to Determine FY2024 CAP
| |
Most Important Metrics |
|
| Adjusted PPNR |
Relative Net Charge Offs |
Relative Non Accruing Loans |
Company Total Shareholder Return v. KBW Regional Bank Index Total Shareholder Return
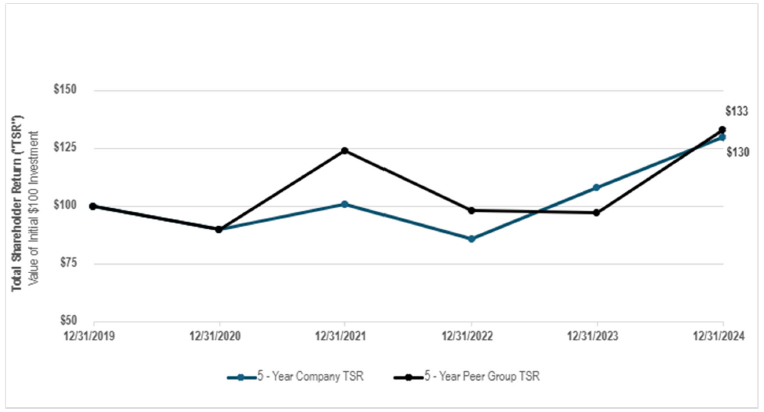
Relationship between CAP paid to PEO and non-PEO NEOs and Cumulative TSR
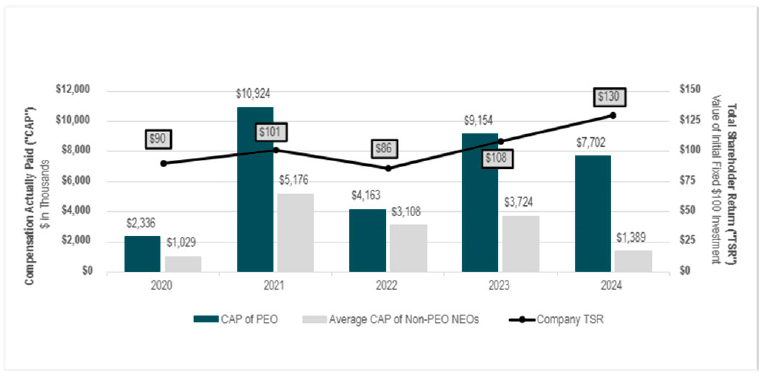
Executive Compensation
Relationship between CAP paid to PEO and non-PEO NEOs and Net Income
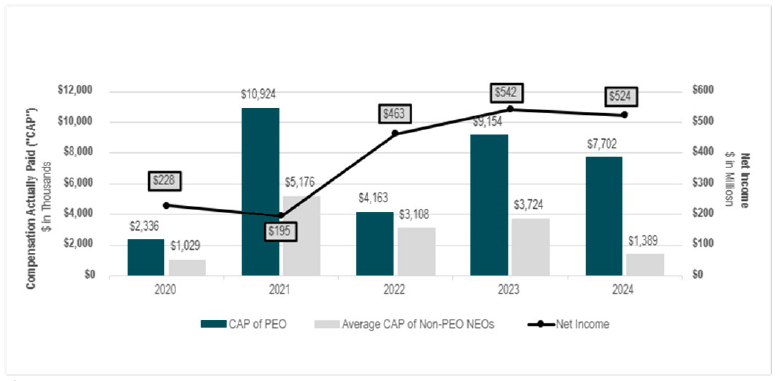
Relationship between CAP paid to PEO and non-PEO NEOs and Adjusted PPNR
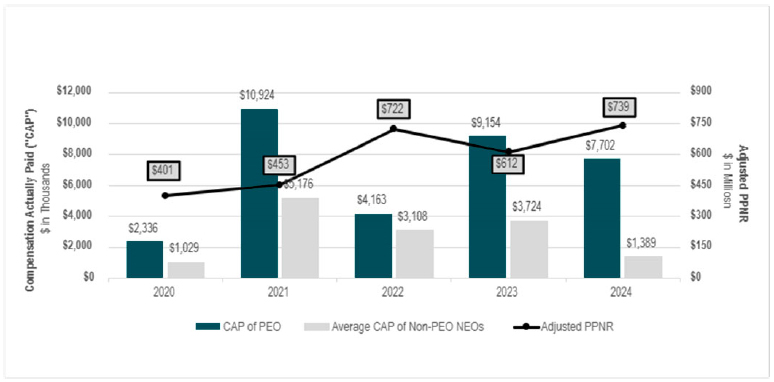
Executive Compensation
CEO Pay Ratio
For 2024, the ratio of the annual total compensation of our CEO to the median of the annual total
compensation of all employees is estimated to be 88.10 to 1.
To identify the “median employee,” we analyzed multiple pay elements from our payroll records as of December
21, 2024 (the last day of our payroll year) for all employees, excluding our CEO, who were employed by the Company on that date and consistently applied the same measure of pay elements for all individuals, excluding our CEO, who were employed by the
Company on that date. Our employee population, as defined above, consisted of approximately 5,276 individuals during 2024. All of our employees are located in the United States.
We analyzed multiple pay elements within our payroll records to determine annual total compensation of all
employees, including, without limitation, 2024 salary received, overtime pay received, annual incentive payments received, bonuses received, vacation pay, sick pay, commissions, restricted stock dividends, and vested fair value of any equity-based
awards received in 2024, as of the determination date. Once we determined the median of the annual total compensation of all employees of the Company (other than our CEO), we were then able to determine the “median employee” for purposes of evaluating
the CEO pay ratio.
After identifying the “median employee” in the manner described above, we calculated this employee’s
compensation for 2024 in accordance with the requirements of applicable Exchange Act rules and arrived at an estimated annual total compensation of our median employee of $57,850. This amount is different (greater) than the amount reported to our
median employee in Box 1 of Form W-2 because it includes some non-taxable items, such as the value of our contributions to the 401(k) plan, premiums we pay for life insurance, as well as premiums we pay for medical insurance. We calculated the annual
total compensation of our median employee on this basis because it permits us to more accurately compare the total compensation received by this employee to the total compensation of our CEO.
The CEO pay ratio compares the annual total compensation of our CEO to the annual total compensation of our
median employee. For this comparison, we are required to calculate our CEO’s “annual total compensation” as the amount we reported in the “Total” column of the 2024 Summary Compensation Table above.
The following table provides information with respect to non-employee director compensation for the fiscal year ended December 31, 2024 and excludes
Mr. Araujo and Ms. Rodriguez who were appointed in 2025:
| |
Fees Earned |
|
|
| |
or Paid in |
Restricted Stock |
|
| Name |
Cash |
Unit Awards (1) |
Total |
| Shannon A. Brown** |
$99,167 |
$81,218 |
$180,385 |
| Deborah M. Cannon** |
$99,167 |
$81,218 |
$180,385 |
| Charlotte N. Corley** |
$107,500 |
$81,218 |
$188,718 |
| Joseph W. Evans**+ |
$130,833 |
$81,218 |
$212,051 |
| Virginia A. Hepner** |
$112,500 |
$81,218 |
$193,718 |
| William G. Holliman |
$82,500 |
$81,218 |
$163,718 |
| Warren A. Hood, Jr. |
$82,500 |
$81,218 |
$163,718 |
| Keith J. Jackson |
$82,500 |
$81,218 |
$163,718 |
| Larry G. Kirk* |
$46,669 |
— |
$46,669 |
| Precious W. Owodunni |
$82,500 |
$81,218 |
$163,718 |
| Alan W. Perry |
$90,833 |
$81,218 |
$172,051 |
| James D. Rollins III(2) |
— |
— |
— |
| Marc J. Shapiro |
$90,833 |
$81,218 |
$172,051 |
| Thomas R. Stanton** |
$99,167 |
$81,218 |
$180,385 |
| Kathy N. Waller* |
$26,667 |
— |
$26,667 |
|
* |
Served as a Director until the 2024 Annual Meeting. |
|
** |
Served as Chair of a committee of the Board of Directors of Cadence in 2024. |
|
+ |
Serves as Independent Lead Director. |
|
(1) |
Reflects the aggregate grant date fair value of restricted stock units awarded on May 1, 2024 to non-employee directors of Cadence pursuant to the terms of our 2021 LTEIP, each according
to its appropriate valuation date. The shares of our common stock underlying these awards will vest on the date of the Annual Meeting. |
|
(2) |
Mr. Rollins was employed by us in 2024, and did not receive compensation for serving as a member of the Board of Directors. |
Our non- employee directors received the following compensation for their service in 2024:
| Annual Board Retainer - Cash |
|
$90,000 |
(1) |
| Annual Board Retainer - Equity |
|
$90,000 |
(1) |
| Annual Audit Committee Chair Cash Retainer |
|
$30,000 |
|
| Annual Cash Retainer for all Other Committee Chairs |
|
$25,000 |
|
| Annual Cash Retainer for Independent Lead Director |
|
$35,000 |
|
|
(1) |
Annual retainer was increased from $80,000 to $90,000 effective October 1, 2024. |
Directors are also reimbursed for necessary travel expenses. On May 1, 2024, each of our non- employee
directors was awarded 2,877 restricted stock units pursuant to our Long Term Incentive Plan. All of the shares of our common stock underlying these awards will vest on the date of the Annual Meeting.
|
Proposal 2: Non-Binding, Advisory Vote Regarding the Compensation of the Named Executive Officers
|
“Proposal 2: Say On Pay”
In accordance with the Dodd-Frank Wall Street Reform and Consumer Protection Act of 2010, as amended, the
Exchange Act and the SEC’s rules promulgated thereunder, we are asking our shareholders to vote to approve, on a non-binding, advisory basis, the compensation of our Named Executive Officers as disclosed in this Proxy Statement. This Proposal 2,
commonly known as a “Say-On-Pay” proposal, gives our shareholders the opportunity to express their views on the compensation of our Named Executive Officers. This vote is not intended to address any specific item of compensation, but rather the overall
compensation of our Named Executive Officers and the philosophy, policies and practices described in this Proxy Statement. We conduct our Say-On-Pay votes annually, consistent with the recommendation of our Board of Directors and the advisory vote of
our shareholders at our 2023 annual meeting. A new advisory vote on the frequency of shareholder votes on executive compensation, which will occur no later than the Company’s annual meeting of stockholders in 2029.
A significant component of our executive compensation program is performance-based, and it is designed to
attract, motivate and retain our executive officers, who are critical to our success. Under this program, our Named Executive Officers are rewarded for the achievement of specific annual, long-term or strategic goals, corporate goals, and the overall
realization of increased shareholder value. Our Executive Compensation and Stock Incentive Committee regularly reviews our executive compensation program to ensure it achieves the desired goals of aligning our executive compensation structure with our
shareholders’ interests and current market practices. Our Board of Directors requires certification of achievement of performance goals under the Amended and Restated Executive Performance Incentive Plan, and payment of the corresponding cash bonus
payments following the filing of our Annual Report on Form 10-K, rather than upon the announcement of preliminary unaudited financial results. In addition, our Board of Directors adopted the Executive Compensation Policy, which sets forth the
conditions under which we may recover any excess incentive-based compensation paid or awarded to our executive officers. A more detailed discussion regarding the compensation of our Named Executive Officers is provided under the captions “COMPENSATION
DISCUSSION AND ANALYSIS” and “EXECUTIVE COMPENSATION,” and we encourage you to read those sections in full.
The Board of Directors and the Executive Compensation and Stock Incentive Committee believe our executive
compensation program is meeting its objectives. Accordingly, we ask our shareholders to vote “FOR” the following resolution at the annual meeting:
RESOLVED, that the shareholders of Cadence Bank approve, on a non-binding, advisory basis, the compensation
of Cadence Bank’s named executive officers, which is disclosed pursuant to Item 402 of Regulation S-K in the Compensation Discussion and Analysis, executive compensation tables, and narrative discussions appearing in Cadence Bank’s Proxy Statement for
the 2025 annual meeting of shareholders.”
Summary Compensation Decisions for 2024
After assessing the Company’s financial and strategic performance for 2024, and after further evaluating the
individual performance of our current NEOs, the Executive Compensation and Stock Incentive Committee exercises its discretion to award total annual direct compensation for 2024 to our NEOs as set forth in the Summary Compensation Table contained in the
“COMPENSATION DISCUSSION AND ANALYSIS.”
Vote is Non-Binding and Advisory
Because your vote is advisory, it will not be binding upon the Board of Directors or the Executive
Compensation and Stock Incentive Committee, will not override any decision made by the Board of Directors or the Executive Compensation and Stock Incentive Committee or create or imply any additional fiduciary duty of the Board of Directors or the
Executive Compensation and Stock Incentive Committee. However, the Board of Directors and the Executive Compensation and Stock Incentive Committee value the opinions of our shareholders. Accordingly, to the extent there is any significant vote against
the compensation of our NEOs as disclosed in this Proxy Statement, we will carefully consider our shareholders’ concerns, and the Board of Directors and the Executive Compensation and Stock Incentive Committee will evaluate whether any actions are
necessary to address such concerns.
Proposal 2: Non-Binding, Advisory Vote Regarding the
Compensation of the Named Executive Officers
Required Vote
If there is a quorum, the resolution to approve, on a non-binding, advisory basis, the compensation of our
NEOs will be approved if the votes cast “for” Proposal 2 outnumber the votes cast “against” Proposal 2.
Voting Recommendation
The Board of Directors recommends Shareholders vote “FOR” the
resolution to approve, on a non-binding, advisory basis, the
compensation of our NEOs.
|
Proposal 3: Ratification of Appointment of Independent
Registered Public Accounting Firm
|
“Proposal 3: Ratification of Appointment of Independent Registered Public
Accounting Firm.”
The Audit Committee of the Board of Directors appointed Forvis Mazars, LLP (“Forvis”) (f/k/a FORVIS, LLP) as
our independent registered public accounting firm for the year ending December 31, 2025 and seeks ratification of the appointment by our shareholders.
Services and Fees of Independent Registered Public Accounting Firm
In addition to rendering audit services for the year ended December 31, 2024, Forvis performed various other
services for us and our subsidiaries. The following table presents the aggregate fees billed for the services rendered to us by Forvis for the year ended December 31, 2023 and December 31, 2024:
| Fee Type |
2024 |
2023 |
| Audit Fees(1) |
$1,986,000 |
$1,816,000 |
| Audit-Related |
$43,300 |
$41,000 |
| Fees(2) |
|
|
| Tax Fees |
- |
- |
| All Other Fees(3) |
- |
$7,000 |
| Total |
$2,029,300 |
$1,864,000 |
(1) Audit Fees for the year ended December 31, 2024 and 2023 represent the aggregate fees billed to us by our independent registered public accounting firm for
professional services rendered for the audit of our financial statements, including the audit of internal control over financial reporting, and for services normally provided by our independent registered public accounting firm in connection with
regulatory filings or engagements.
(2) Audit-Related Fees for the years ended December 31, 2024 and 2023 consisted principally of fees for audits of financial statements of certain employee
benefit plans.
(3) All Other Fees for the year ended December 31, 2023 represent the aggregate fees billed to us by our independent registered public accounting firm for
certain one-time professional services related to the sale of Cadence Insurance, Inc.
Pre-Approval of Audit and Non-Audit Services
The Audit Committee specifically reviews and pre-approves all audit and non-audit services provided by Forvis
prior to its engagement to perform such services. The Audit Committee has not adopted any other pre- approval policies or procedures.
Presence of Representatives of Independent Registered Public Accounting Firm
Representatives of Forvis will attend the Annual Meeting virtually, will have an opportunity to make a
statement if they desire, and will be available to respond to appropriate questions.
Required Vote
Shareholder ratification of the Audit Committee’s appointment of Forvis as our independent registered public
accounting firm for the year ending December 31, 2025 is not required by our Amended and Restated Bylaws or otherwise. Nonetheless, the Board of Directors elected to submit the appointment of Forvis to our shareholders for ratification.
If a quorum is present, this Proposal 3 will be approved if the votes cast for ratification exceed the votes
cast against ratification. If this Proposal 3 is not approved, the matter will be referred to the Audit Committee for further review.
Proposal 3: Ratification of Appointment of Independent
Registered Public Accounting Firm
Voting Recommendation
The Board of Directors Recommends Shareholders Vote “FOR” Ratification of the Appointment of
Forvis Mazars, LLP as Our Independent Registered Public Accounting Firm for the Year Ending December 31, 2025.
The Audit Committee of the Board of Directors consisted of five directors until the 2024 Annual Meeting, and
four directors for the remainder of 2024, each of whom is “independent” as defined by the listing standards of the NYSE. The Audit Committee held eight meetings in 2024. These meetings facilitated communication with executive officers, the internal
auditors and Cadence’s independent registered public accounting firm. During 2024, the Audit Committee held discussions with the internal auditors and Cadence’s independent registered public accounting firm, both with and without management present, on
the results of their examinations and the overall quality of Cadence’s financial reporting and internal controls.
The role and responsibilities of the Audit Committee are set forth in the charter adopted by the Board of
Directors, a copy of which is available on the Investor Relations page of Cadence’s website at ir.cadencebank.com under the caption “Corporate Governance – Governance Documents.” In fulfilling its
responsibilities, the Audit Committee:
● Reviewed and discussed with management Cadence’s audited
consolidated financial statements for the year ended December 31, 2024 and Cadence’s unaudited quarterly consolidated financial statements during 2024 (including the disclosures contained in Cadence’s Annual Report on Form 10-K and its Quarterly
Reports on Form 10-Q in the sections entitled “Management’s Discussion and Analysis of Financial Condition and Results of Operations”);
● Discussed with Forvis Mazars, LLP (f/k/a FORVIS, LLP) (“Forvis”),
Cadence’s independent registered public accounting firm, the matters required to be discussed under Auditing Standard No. 1301, both with and without management present; and
● Received the written disclosures and the letter from Forvis
required by the applicable requirements of the Public Company Accounting Oversight Board regarding the independent accountants’ communications with the Audit Committee concerning independence, as fully described above, and discussed with Forvis their
independence, and determined Forvis’s independence with respect to Forvis’s audit of Cadence’s 2024 financial statements.
Based on the Audit Committee’s review and discussions as described above, and in reliance thereon, the Audit
Committee recommended to Cadence’s Board of Directors that Cadence’s audited consolidated financial statements for the year ended December 31, 2024 be included in Cadence’s Annual Report on Form 10-K for the year ended December 31, 2024 for filing with
the federal banking regulators.
Audit Committee:
Virginia A. Hepner (Chair)
Deborah M. Cannon
Charlotte N. Corley
Warren A. Hood, Jr.
| Certain Relationships and Related
Transactions |
Cadence conducts banking transactions in the ordinary course of business with our officers and directors and
their associates, affiliates, and family members. While certain provisions of the Sarbanes-Oxley Act of 2002 generally prohibit us from making personal loans to our executive officers and directors, it permits Cadence to make loans to our executive
officers and directors so long as such loans are subject to the insider lending restrictions of Section 22(h) of the Federal Reserve Act and Regulation O promulgated thereunder. During the year ended December 31, 2024, Cadence made loans to our
executive officers, directors and their family members which were made in the ordinary course of business, were made on substantially the same terms, including interest rates and collateral, as those prevailing at the time for comparable loans with
persons not related to Cadence, and did not involve more than the normal risk of collectability or present other unfavorable features. Further, our written Related Person Transaction Policies and Procedures, approved by our Board of Directors, permits
extensions of credit by Cadence or its subsidiaries to a related person, so long as such extensions of credit are made in compliance with applicable law, including Regulation O, Sections 23A and 23B of the Federal Reserve Act and Section 13(k) of the
Exchange Act.
Pursuant to its written charter and the Related Person Transaction Policies and Procedures, the Nominating
and Corporate Governance Committee reviews and approves all “related person” transactions between Cadence and any of their “related persons” or affiliates, or transactions in which any of such persons directly or indirectly is interested or benefitted.
If advance approval of a related person transaction by the Nominating and Corporate Governance Committee is not practicable, then the related person transaction shall be considered and, if the committee determines it to be appropriate, ratified at the
committee’s next regularly scheduled meeting. In determining whether to approve or ratify a related person transaction, the Nominating and Corporate Governance Committee takes into account, among other factors it deems appropriate, whether the related
person transaction is on terms no less favorable than terms generally available to an unaffiliated third-party under the same or similar circumstances and the extent of the related person’s interest in the transaction. In accordance with the Related
Person Transaction Policies and Procedures, no director is permitted to participate in any discussion or approval of a related person transaction for which he or she is a related person, except the director shall provide all material information
concerning the related person transaction to the Nominating and Corporate Governance Committee. In addition, the policy enumerates certain related person transactions which are deemed to be pre-approved or ratified, as applicable, by the committee.
Counting of Votes
All matters specified in this Proxy Statement to be voted on at the Annual Meeting will be voted on by
ballot. Inspectors of election will be appointed to, among other things:
|
● |
Determine the number of shares of our common stock outstanding, the shares of common stock represented at the Annual Meeting, the existence of a quorum and the authenticity, validity and
effect of proxies; |
|
● |
Receive votes on ballots; |
|
● |
Hear and determine all challenges and questions in any way arising in connection with the right to count and tabulate all votes; and |
|
● |
Determine the voting results. |
Each proposal presented herein to be voted on at the Annual Meeting must be approved
by the vote described under such proposal.
These instructions incorporate the instructions required by the Universal Proxy Rule.
| Proposal |
Voting Options |
Routine? |
| |
|
|
| 1. |
Directors |
“For” or “Withhold” individually |
No |
| |
|
No slates of directors |
|
| 2. |
Say on Pay (non-binding) |
“For,” “Against,” or “Abstain” |
No |
| 3. |
Ratification of Appointment of Independent |
“For,” “Against,” or “Abstain” |
Yes |
| Registered Public Accounting Firm |
|
|
Inspectors of election will treat the following shares of common stock as present and entitled to vote for
purposes of determining a quorum:
|
● |
properly submitted proxies which reflect “against votes” |
|
(1) |
Broker non-votes are shares of common stock held “of record” by brokers or nominees as to which voting instructions have not been received from the beneficial owner with respect to any proposal which does not relate
to a “routine” matter. |
Non-routine matters. If the shares entitled to vote are held in “street name” through a broker or
other holder of record and the beneficial holder does not indicate how to vote on these matters, the record holder will not vote the beneficial holder’s shares on those matters.
Abstentions and broker non-votes are counted as shares presented at the Annual Meeting
and entitled to vote for purposes of determining the presence of a quorum, but will not be counted as votes cast and will not have any effect on voting for any of the proposals presented in this Proxy Statement.
Undervoting. If a shareholder under-votes their proxy, the vote “for” or “withheld” for each
nominee shall be counted as cast.
Overvoting. If a shareholder over-votes their proxy card, the card shall be counted to establish
a quorum, and votes for shareholder nominees shall be counted in the order in which they appear on the card, but no vote for a nominee beyond the number allowed shall have any effect on the vote totals.
General Information
Signed, unvoted proxy cards. If a shareholder signs and sends in their proxy card, but votes for no
nominees and no proposals, such proxy cards shall be deemed to grant authority for each proposal or nominee as recommended by management and the proxies.
“Withhold” votes for purposes of the election of directors will not have any effect on the vote
for election of directors; however, our Bylaws provide that, in an uncontested election, any nominee for director who receives a greater number of votes “withheld” than votes “for” his or her election must promptly tender his or her resignation
following certification of the shareholder vote. For more information, see “Proposal 1: Election of Directors - Majority Vote Policy.”
Shareholder Nominations and Proposals
Shareholders who would like to recommend director nominees or make a proposal for consideration at the 2026
annual meeting of shareholders should submit the nomination or proposal, along with proof of ownership of our common stock in accordance with Rule 14a-8(b)(2) promulgated under the Exchange Act in writing and mailed to the Corporate Secretary at the
address listed below. If a shareholder nominates an individual to stand for election as a director, but the shareholder then fails to comply with Rule 14a regulations governing those nominations, any proxy authority granted for such shareholder
nominees shall not be counted, and that proxy card shall be counted for the purposes of establishing a quorum only. We must receive all such nominations and proposals not before November 14, 2025 and not later than December 15, 2025 in order for the
nomination or proposal to be included in our proxy statement. Shareholder nominations and proposals received after December 15, 2025, shall be considered untimely and will not be included in our proxy statement, but may be included in the agenda for
our 2026 annual meeting if submitted to our Corporate Secretary at the address listed below and if such nomination or proposal includes:
|
● |
The name and address of the shareholder; |
|
● |
The class and number of shares of common stock held of record and beneficially owned by such shareholder; |
|
● |
The name(s), including any beneficial owners, and address(es) of such shareholder(s) in which all such shares of common stock are registered on our stock
transfer books; |
|
● |
A representation that the shareholder intends to appear at the meeting virtually or by proxy to submit the business specified in such notice; |
|
● |
A brief description of the business desired to be submitted to the annual meeting of shareholders, the complete text of any resolutions intended to be presented
at the annual meeting and the reasons for conducting such business at the annual meeting of shareholders; |
|
● |
Any personal or other material interest of the shareholder in the business to be submitted; |
|
● |
As to each person whom the shareholder proposes to nominate for election or reelection as a director, all information relating to such person required to be
disclosed in solicitations of proxies for election of directors, or is otherwise required, in each case pursuant to Regulation 14A under the Exchange Act (including such person’s written consent to being named in the proxy statement as a
nominee and to serving as a director if elected); and |
|
● |
All other information relating to the nomination or proposed business which may be required to be disclosed under applicable law. |
In addition, a shareholder seeking to submit such nominations or business at the meeting shall promptly
provide any other information we reasonably request. Such notice shall be sent to the following address:
Cadence Bank
201 South Spring Street
Tupelo, Mississippi 38804
Attention: Corporate Secretary
In addition to the requirements to comply with the Rule 14a regulations for a shareholder nominee listed
above, if a nomination for director or other proposal by a shareholder is not timely submitted and does not comply with any of these notice requirements, such proposal or nomination will be disregarded and, upon the instructions of the presiding
officer of the annual meeting, all votes cast for each such nominee and any such proposal will be disregarded.
General Information
The individuals named as proxies on the proxy card for our 2026 annual meeting of shareholders will be
entitled to exercise their discretionary authority in voting proxies on any shareholder proposal which is not included in our proxy statement for the 2026 annual meeting, unless we receive notice of the matter to be proposed not earlier than November
14, 2025 nor later than December 16, 2025, and in accordance with the requirements listed above and the Company’s advance notice provisions of the by-laws. These dates are based on a distribution date of our proxy materials of March 14, 2025 and the
advance notice provisions of the Company’s by-laws. Even if proper notice is received within such time period, the individuals named as proxies on the proxy card for that meeting may nevertheless exercise their discretionary authority with respect to
such matter by advising shareholders of the proposal and how the proxies intend to exercise their discretion to vote on these matters, unless the shareholder making the proposal solicits proxies with respect to the proposal to the extent required by
Rule 14a-4(c)(2), 14a-8, and 14a-19(a)(3) under the Exchange Act.
Householding of Proxy Materials
The applicable regulatory rules regarding delivery of proxy statements and annual reports may be satisfied
by delivering a single Notice of Internet Availability and, if requested, a single set of our proxy materials to an address shared by two or more of our shareholders. This method of delivery is referred to as “householding” and can result in meaningful
cost savings for us. In order to take advantage of this opportunity, we may deliver only one Notice of Internet Availability and, if requested, a single set of our proxy materials to multiple shareholders who share an address, unless we have received
contrary instructions from one or more of the shareholders. We undertake to deliver promptly upon request paper copies of our proxy materials, as requested, to shareholders at a shared address. If you hold our common stock as a registered shareholder
and prefer to receive a paper copy of our proxy materials either now or in the future, please call 1-800-368-5948 or send a written request to:
Cadence Bank
201 South Spring Street
Tupelo, Mississippi 38804
Attention: Corporate Secretary
If your shares of common stock are held through a broker or bank and you prefer to receive a paper copy of
our proxy materials either now or in the future, please contact such broker or bank. Shareholders who share an address and elect to receive printed copies of our proxy materials may request to receive a single copy of such materials, either now or in
the future, by calling 1-800-368-5948 or sending a written request to the address above.
Special Meetings of Shareholders
As it relates to the ability of our shareholders to convene a special meeting, the Articles provide that
shareholders owning 20% or more of our shares of common stock can call a special meeting. A majority of the shares entitled to vote will constitute a quorum for the transaction of any business at a special shareholders’ meeting.
2024 Annual Report
A copy of our Annual Report on Form 10-K for the year ended December 31, 2024 can be accessed by
following the instructions contained on the Notice of Internet Availability mailed to shareholders of record as of the record date on or about March 14, 2025. A copy of our 2024 Annual Report may also be obtained without charge on the Investor
Relations section of our website at ir.cadencebank.com under the caption “Public Filings.”
In addition, a copy of our 2024 Annual Report will be furnished without charge to any shareholder who requests such report by
sending a written request to:
Cadence Bank
201 South Spring Street
Tupelo, Mississippi 38804
Attention: Corporate Secretary
General Information
Miscellaneous
Our management is not aware of any matters other than those described above which may be presented for
action at the Annual Meeting. If any other matters properly come before the Annual Meeting, the proxies will be voted with respect to such matters in accordance with the judgment of the person or persons voting such proxies, subject to the direction of
our Board of Directors.
| |
Cadence Bank |
| |
|
| |
 |
| |
|
| |
James D. “Dan” Rollins III |
| |
Chairman of the Board and |
| March 14, 2025 |
Chief Executive Officer |
APPENDIX A
Appendix A contains reconciliations for the following: (1) total
noninterest expense to adjusted total noninterest expense and total noninterest revenue to adjusted total noninterest revenue for purposes of the Compensation Committee's determination of performance under the Executive Performance Incentive Plan;
(2) adjusted PPNR for purpose of the pay versus performance table; (3) normalized operating efficiency ratio and adjusted ROAA for purposes of calculating the Integration grants; and (4) the adjusted effieciency ratio as set forth in the proxy. The
Company supplements the financial reporting it does according to Generally Accepted Accounting Principles (GAAP), by utilizing certain financial measures not calculated in accordance with GAAP. The Company included a limited number of these non-GAAP
financial measures in this proxy statement for the applicable periods presented. Management believes that the presentation of these non-GAAP financial measures: (i) provides important supplemental information that contributes to a proper
understanding of the Company’s capital position and adjusted performance; (ii) enables a more complete understanding of factors and trends affecting the Company’s business; and (iii) allows investors to evaluate the Company’s performance in a manner
similar to management, the financial services industry, bank stock analysts and bank regulators. Reconciliations of these non-GAAP financial measures to the most directly comparable GAAP financial measures are presented in the tables below. These
non-GAAP financial measures should not be considered substitutes for GAAP financial measures, and the Company strongly encourages investors to review the GAAP financial measures included in this proxy statement and not to place undue reliance upon
any single financial measure. In addition, because non-GAAP financial measures are not standardized, it may not be possible to compare the non-GAAP financial measures presented in this proxy statement with other companies’ non-GAAP financial measures
having the same or similar names.
| |
|
|
2024 |
|
| Reconciliation of Total Noninterest Expense to Adjusted Total Noninterest Expense |
|
|
|
|
| |
Total noninterest expense |
|
$ |
1,045,528 |
|
| Less: |
Gain on extinguishment of debt |
|
|
(1,674 |
) |
| |
Restructuring and other nonroutine expenses |
|
|
5,501 |
|
| |
Adjusted Total Noninterest Expense |
|
$ |
1,041,701 |
|
| |
|
|
2024 |
|
| Reconciliation of Total Noninterest Revenue to Adjusted Total Noninterest Revenue |
|
|
|
|
Total noninterest revenue |
|
$ |
356,510 |
|
| Less: |
Security losses, net |
|
|
(2,962 |
) |
| |
Gain on sale of business |
|
|
14,980 |
|
| |
Adjusted Total Noninterest Revenue |
|
$ |
344,492 |
|
| |
|
Year-to-date |
|
| |
|
Dec 2024 |
|
|
Dec 2023 |
|
|
Dec 2022 |
|
|
Dec 2021 |
|
|
Dec 2020 |
|
| Reconciliation of Net Income to Adjusted Pre-Tax Pre-Provision Net Revenue |
|
|
|
|
|
|
|
|
|
|
|
|
|
|
|
|
|
|
|
|
| |
Net Income |
|
$ |
523,604 |
|
|
$ |
542,304 |
|
|
$ |
463,237 |
|
|
$ |
195,162 |
|
|
$ |
228,051 |
|
| Plus: |
Provision for credit losses |
|
|
71,000 |
|
|
|
80,000 |
|
|
|
7,000 |
|
|
|
138,062 |
|
|
|
89,044 |
|
| |
Merger expense |
|
|
- |
|
|
|
5,192 |
|
|
|
51,214 |
|
|
|
59,896 |
|
|
|
5,345 |
|
| |
Incremental merger related expense |
|
|
- |
|
|
|
18,131 |
|
|
|
52,247 |
|
|
|
4,633 |
|
|
|
- |
|
| |
Gain on extinguishment of debt |
|
|
(1,674 |
) |
|
|
(1,792 |
) |
|
|
- |
|
|
|
- |
|
|
|
- |
|
| |
Restructuring and other nonroutine expenses/branch closing expense |
|
|
5,501 |
|
|
|
57,548 |
|
|
|
3,094 |
|
|
|
- |
|
|
|
- |
|
| |
Pension settlement expense |
|
|
- |
|
|
|
11,826 |
|
|
|
9,023 |
|
|
|
3,051 |
|
|
|
5,846 |
|
| |
Income tax expense (benefit) |
|
|
152,593 |
|
|
|
(4,594 |
) |
|
|
136,138 |
|
|
|
51,766 |
|
|
|
59,494 |
|
| Less: |
Security (losses) gains, net |
|
|
(2,962 |
) |
|
|
(435,652 |
) |
|
|
(384 |
) |
|
|
(395 |
) |
|
|
58 |
|
| |
Gain on sale of business |
|
|
14,980 |
|
|
|
- |
|
|
|
- |
|
|
|
- |
|
|
|
- |
|
| |
Nonroutine (losses) gains |
|
|
- |
|
|
|
(6,653 |
) |
|
|
- |
|
|
|
- |
|
|
|
- |
|
| |
Income from discontinued operations, net of income taxes (1) |
|
|
- |
|
|
|
538,620 |
|
|
|
- |
|
|
|
- |
|
|
|
- |
|
| Adjusted pre-tax pre-provision net revenue from continuing operations (1) |
|
$ |
739,006 |
|
|
$ |
612,300 |
|
|
$ |
722,337 |
|
|
$ |
452,965 |
|
|
$ |
387,722 |
|
(1) Fiscal
years 2023 and 2024 reflects income from continuing operations only. Fiscal years 2020, 2021, and 2022 include both continuing and discontinued operations.
| |
|
|
|
|
|
|
|
|
|
|
|
|
|
|
|
|
| |
|
|
Dec 2024 |
|
|
Dec 2023 |
|
|
Dec 2022 |
|
|
Dec 2021 |
|
|
Dec 2020 |
|
| Adjusted Efficiency Ratio |
|
|
|
|
|
|
|
|
|
|
|
|
|
|
|
|
|
|
|
|
| |
Adjusted non-interest expense |
|
$ |
1,041,701 |
|
|
$ |
1,065,018 |
|
|
$ |
994,545 |
|
|
$ |
618,241 |
|
|
$ |
533,449 |
|
| |
Net interest income FTE |
|
|
1,438,838 |
|
|
|
1,355,540 |
|
|
|
1,355,503 |
|
|
|
808,099 |
|
|
|
693,733 |
|
| |
Non-interest income |
|
|
356,510 |
|
|
|
(116,343 |
) |
|
|
342,485 |
|
|
|
242,905 |
|
|
|
205,726 |
|
| Less: |
Security (losses) gains, net |
|
|
(2,962 |
) |
|
|
(435,652 |
) |
|
|
(384 |
) |
|
|
(395 |
) |
|
|
58 |
|
| |
Gain on sale of businesses |
|
|
14,980 |
|
|
|
- |
|
|
|
- |
|
|
|
- |
|
|
|
- |
|
| |
Nonroutine (losses) gains |
|
|
- |
|
|
|
(6,653 |
) |
|
|
- |
|
|
|
- |
|
|
|
- |
|
| |
Total adjusted revenue |
|
$ |
1,783,330 |
|
|
$ |
1,681,502 |
|
|
$ |
1,698,372 |
|
|
$ |
1,051,399 |
|
|
$ |
899,401 |
|
| |
Adjusted efficiency ratio |
|
|
58.4 |
% |
|
|
63.3 |
% |
|
|
58.6 |
% |
|
|
58.8 |
% |
|
|
59.3 |
% |
| |
|
10/1/2023- |
|
| (Dollars in Thousands) |
|
9/30/2024 Total |
|
| Normalized Operating Efficiency Ratio |
|
|
|
|
| |
Non-Interest Expense |
|
$ |
1,108,709 |
|
| Less: |
Incremental Merger Related Expenses |
|
|
7,500 |
|
| |
Restructuring and other Nonroutine Expenses |
|
|
47,528 |
|
| |
Pension Settlement Expense |
|
|
11,226 |
|
| |
Gain on Extinguishment of Debt |
|
|
(2,326 |
) |
| |
Adjusted Non-Interest Expense |
|
|
1,044,782 |
|
| Less: |
Amortization of Intangibles |
|
|
16,403 |
|
| |
Adjustment to Service Charge Refund Expense |
|
|
(2,750 |
) |
| |
Total Normalized Adjusted Expenses |
|
$ |
1,031,129 |
|
| |
|
|
|
|
| |
Interest Revenue (1) |
|
$ |
2,545,185 |
|
| |
Interest Expense |
|
|
1,135,935 |
|
| |
Net Interest Revenue |
|
|
1,409,250 |
|
| |
Non-Interest Revenue |
|
|
(41,115 |
) |
| Less: |
Gain on Sale of Businesses |
|
|
14,980 |
|
| |
Securities Losses, net |
|
|
(387,484 |
) |
| |
Adjusted Non-Interest Revenue |
|
|
331,389 |
|
| |
Total Adjusted Revenue |
|
|
1,740,639 |
|
| Less: |
Accretion Income on Acquired Loans |
|
|
13,616 |
|
| |
Amortization of Loan Unfunded Commitment Fair Value Marks |
|
|
704 |
|
| |
Earnings from Limited Partnerships |
|
|
10,568 |
|
| |
Change in fair value of SBA servicing rights |
|
|
(1,364 |
) |
| |
Market Value Adjustment on MSR Hedge |
|
|
(9,288 |
) |
| |
Service Charges Refund Expense |
|
|
(8,000 |
) |
| Plus: |
Amortization of Fixed Maturity Deposit Fair Value Marks |
|
|
(427 |
) |
| |
Total Normalized Adjusted Revenues |
|
$ |
1,733,976 |
|
| |
|
|
|
|
| |
Normalized Operating Efficiency Ratio |
|
|
59.47 |
% |
(1) Includes taxable equivalent adjustment to
interest of $1.9 million, using an effective tax rate of 21%.
| |
|
|
|
3Q24 |
|
|
|
2Q24 |
|
|
|
1Q24 |
|
|
|
4Q23 |
|
| Adjusted Return on Average Assets |
|
|
|
|
|
|
|
|
|
|
|
|
|
|
|
|
| |
Income (Loss) from Continuing Operations |
|
$ |
136,439 |
|
|
$ |
137,472 |
|
|
$ |
116,978 |
|
|
$ |
(263,737 |
) |
| |
|
|
|
|
|
|
|
|
|
|
|
|
|
|
|
|
|
| Plus: |
Incremental Merger Related Expense |
|
|
- |
|
|
|
- |
|
|
|
- |
|
|
|
7,500 |
|
| |
Restructuring and Other Nonroutine Expenses |
|
|
(920 |
) |
|
|
6,675 |
|
|
|
251 |
|
|
|
41,522 |
|
| |
Gain on Extinguishment of Debt |
|
|
- |
|
|
|
(1,098 |
) |
|
|
(576 |
) |
|
|
(652 |
) |
| |
Pension Settlement Expense |
|
|
- |
|
|
|
- |
|
|
|
- |
|
|
|
11,226 |
|
| |
Service Charges Refund Expense |
|
|
- |
|
|
|
- |
|
|
|
- |
|
|
|
8,000 |
|
| |
Adjustment to Service Charge Refund Expense |
|
|
- |
|
|
|
(2,750 |
) |
|
|
- |
|
|
|
- |
|
| |
Amortization of Intangibles |
|
|
3,933 |
|
|
|
3,999 |
|
|
|
4,066 |
|
|
|
4,405 |
|
| Less: |
Securities Losses, net |
|
|
(2,947 |
) |
|
|
(4 |
) |
|
|
(9 |
) |
|
|
(384,524 |
) |
| |
Gain on Sale of Businesses |
|
|
- |
|
|
|
14,980 |
|
|
|
- |
|
|
|
- |
|
| |
Tax Adjustment |
|
|
1,252 |
|
|
|
(1,712 |
) |
|
|
788 |
|
|
|
95,870 |
|
| |
Adjusted Income from Continuing Operations |
|
$ |
141,147 |
|
|
$ |
131,034 |
|
|
$ |
119,941 |
|
|
$ |
96,918 |
|
| |
|
|
|
|
|
|
|
|
|
|
|
|
|
|
|
|
|
| |
Average Assets |
|
$ |
47,803,977 |
|
|
$ |
48,192,719 |
|
|
$ |
48,642,540 |
|
|
$ |
48,444,176 |
|
| |
|
|
|
|
|
|
|
|
|
|
|
|
|
|
|
|
|
| |
Adjusted Return on Average Assets* |
|
|
1.18 |
% |
|
|
1.09 |
% |
|
|
0.99 |
% |
|
|
0.80 |
% |
* Annualized