hele-20220427
0000916789FALSE00009167892022-04-272022-04-270000916789dei:OtherAddressMember2022-04-272022-04-27

UNITED STATES
SECURITIES AND EXCHANGE COMMISSION
Washington, D.C. 20549
 
FORM 8-K
 
CURRENT REPORT
PURSUANT TO SECTION 13 OR 15(d) of THE SECURITIES EXCHANGE ACT OF 1934
 
Date of report (Date of earliest event reported)  April 27, 2022
hele-20220427_g1.jpg
 
HELEN OF TROY LIMITED
(Exact name of registrant as specified in its charter)

Commission File Number:  001-14669
Bermuda 74-2692550
(State or other jurisdiction (IRS Employer
of incorporation) Identification No.)

Clarendon House
2 Church Street
Hamilton, Bermuda
(Address of principal executive offices)
 
One Helen Of Troy Plaza
El Paso, Texas 79912
(Registrant's United States mailing address)

915-225-8000
(Registrant’s telephone number, including area code)


Check the appropriate box below if the Form 8-K filing is intended to simultaneously satisfy the filing obligation of the registrant under any of the following provisions:
Written communications pursuant to Rule 425 under the Securities Act (17 CFR 230.425)

Soliciting material pursuant to Rule 14a-12 under the Exchange Act (17 CFR 240.14a-12)
Pre-commencement communications pursuant to Rule 14d-2(b) under the Exchange Act (17 CFR 240.14d-2(b))
Pre-commencement communications pursuant to Rule 13e-4(c) under the Exchange Act (17 CFR 240.13e-4(c))

Securities registered pursuant to Section 12(b) of the Act: 
Title of each class Trading Symbol(s) Name of each exchange on which registered
Common Shares, $0.10 par value per share HELE The NASDAQ Stock Market LLC

Indicate by check mark whether the registrant is an emerging growth company as defined in Rule 405 of the Securities Act of 1933 (§230.405 of this chapter) or Rule 12b-2 of the Securities Exchange Act of 1934 (§240.12b-2 of this chapter).

Emerging growth company

If an emerging growth company, indicate by check mark if the registrant has elected not to use the extended transition period for complying with any new or revised financial accounting standards provided pursuant to Section 13(a) of the Exchange Act.    


Item 7.01    Regulation FD Disclosure.

On April 27, 2022, Helen of Troy Limited (the “Company”, “our”, “we” or “us”) hosted a conference call to discuss the results for its fiscal quarter and year ended February 28, 2022.  With this Form 8-K, we are furnishing a copy of the text of the conference call (attached hereto as Exhibit 99.1). We also issued a press release on April 27, 2022, announcing our results for the fiscal quarter and year ended February 28, 2022. We previously filed a Form 8-K on April 27, 2022, to furnish a copy of the press release which was attached thereto as Exhibit 99.1 (the “April 2022 8-K”).

On April 29, 2022, we posted an investor presentation to our website at http://investor.hotus.com/events-andpresentations/presentations/default.aspx. Page 16 of the presentation contains additional information related to our outlook for the first quarter of fiscal 2023, which is included in the full fiscal year 2023 outlook discussed in our April 27, 2022 conference call. A copy of this investor presentation is attached as Exhibit 99.2 to this Current Report on Form 8-K.

Certain written and oral statements made by the Company and subsidiaries of the Company may constitute “forward-looking statements” as defined under the Private Securities Litigation Reform Act of 1995. This includes statements made in this Form 8-K and the exhibit attached hereto, in other filings with the SEC, and in certain other oral and written presentations. Generally, the words “anticipates”, “believes”, “expects”, “plans”, “may”, “will”, “would”, “should”, “seeks”, “estimates”, “project”, “predict”, “potential”, “currently”, “continue”, “intends”, “outlook”, “forecasts”, “could”, and other similar words identify forward-looking statements. All statements that address operating results, events or developments that the Company expects or anticipates may occur in the future, including statements related to sales, earnings per share results, and statements expressing general expectations about future operating results, are forward-looking statements and are based upon its current expectations and various assumptions. The Company believes there is a reasonable basis for these expectations and assumptions, but there can be no assurance that the Company will realize these expectations or that these assumptions will prove correct. Forward-looking statements are subject to risks that could cause them to differ materially from actual results. Accordingly, the Company cautions readers not to place undue reliance on forward-looking statements. The forward-looking statements contained in this Form 8-K and the exhibit attached hereto should be read in conjunction with, and are subject to and qualified by, the risks described in the Company’s Form 10-K for the year ended February 28, 2022, and in the Company’s other filings with the SEC. Investors are urged to refer to the risk factors referred to above for a description of these risks. Such risks include, among others, the occurrence of cyber incidents or failure by the Company or its third-party service providers to maintain cybersecurity and the integrity of confidential internal or customer data, a cybersecurity breach, obsolescence or interruptions in the operation of the Company’s central global Enterprise Resource Planning systems and other peripheral information systems, the geographic concentration and peak season capacity of certain U.S. distribution facilities which increase its risk to disruptions that could affect the Company’s ability to deliver products in a timely manner, the Company's ability to successfully manage the demand, supply, and operational challenges associated with the actual or perceived effects of COVID-19 and any similar future public health crisis, pandemic or epidemic, the Company’s ability to develop and introduce a continuing stream of innovative new products to meet changing consumer preferences, actions taken by large customers that may adversely affect the Company’s gross profit and operating results, the Company’s dependence on sales to several large customers and the risks associated with any loss of, or substantial decline in, sales to top customers, the Company’s dependence on third-party manufacturers, most of which are located in Asia, and any inability to obtain products from such manufacturers, the Company’s ability to deliver products to its customers in a timely manner and according to their fulfillment standards, the risks associated with trade barriers, exchange controls, expropriations, and other risks associated with domestic and foreign operations including uncertainty and business interruptions resulting from political changes and actions in the U.S. and abroad, such as the current conflict between Russia and Ukraine, and volatility in the global credit and financial markets and economy, the Company’s dependence on the strength of retail economies and vulnerabilities to any prolonged economic downturn, including a future
2


downturn from the effects of COVID-19, risks associated with the use of licensed trademarks from or to third parties, risks associated with weather conditions, the duration and severity of the cold and flu season and other related factors, the Company’s reliance on its Chief Executive Officer and a limited number of other key senior officers to operate its business, expectations regarding recent acquisitions (including Curlsmith and Osprey) and any future acquisitions or divestitures, including the Company’s ability to realize related synergies along with its ability to effectively integrate acquired businesses or disaggregate divested businesses, the risks of potential changes in laws and regulations, including environmental, employment and health and safety and tax laws, and the costs and complexities of compliance with such laws, the risks associated with increased focus and expectations on climate change and other environmental, social and governance matters, the risks associated with significant changes in or the Company’s compliance with regulations, interpretations or product certification requirements, the risks associated with global legal developments regarding privacy and data security that could result in changes to its business practices, penalties, increased cost of operations, or otherwise harm the business, the Company’s ability to continue to avoid classification as a Controlled Foreign Corporation, the risks associated with legislation enacted in Bermuda and Barbados in response to the European Union’s review of harmful tax competition, the risks associated with accounting for tax positions and the resolution of tax disputes, the risks of significant tariffs or other restrictions being placed on imports from China, Mexico or Vietnam or any retaliatory trade measures taken by China, Mexico or Vietnam, the risks associated with product recalls, product liability and other claims against the Company, and associated financial risks including but not limited to, significant impairment of the Company’s goodwill, indefinite-lived and definite-lived intangible assets or other long-lived assets, increased costs of raw materials, energy and transportation, the risks to the Company’s liquidity or cost of capital which may be materially adversely affected by constraints or changes in the capital and credit markets and limitations under its financing arrangements, risks associated with foreign currency exchange rate fluctuations, and projections of product demand, sales and net income, which are highly subjective in nature, and from which future sales and net income could vary in a material amount. The Company undertakes no obligation to publicly update or revise any forward-looking statements as a result of new information, future events or otherwise.

Exhibit 99.1 and Exhibit 99.2 include or refer to certain information that the Company believes is non-GAAP Financial Information as contemplated by SEC Regulation G, Rule 100. The press release furnished in the April 2022 8-K, which is hereby incorporated by reference, and Exhibit 99.2 attached here-in contain tables that reconcile these measures to their corresponding GAAP based measures presented in the Company’s Consolidated Statements of Income and Cash Flows. The material limitation associated with the use of the non-GAAP financial measures is that the non-GAAP measures do not reflect the full economic impact of the Company’s activities. These non-GAAP measures are not prepared in accordance with GAAP, are not an alternative to GAAP financial information, and may be calculated differently than non-GAAP financial information disclosed by other companies. Accordingly, undue reliance should not be placed on non-GAAP information.

The information in this Item 7.01 of this Form 8-K and Exhibit 99.1 attached hereto shall not be deemed “filed” for purposes of Section 18 of the Securities Exchange Act of 1934, nor shall it be deemed incorporated by reference in any filing under the Securities Act of 1933 or any proxy statement or report or other document we may file with the SEC, regardless of any general incorporation language in any such filing, except as shall be expressly set forth by specific reference in such filing.

Item 9.01    Financial Statements and Exhibits.

(d)        Exhibits

3


Exhibit Number    Description
104Cover Page Interactive Data File (embedded within the Inline XBRL document)

Signatures

Pursuant to the requirements of the Securities Exchange Act of 1934, the registrant has duly caused this report to be signed on its behalf by the undersigned hereunto duly authorized.

 HELEN OF TROY LIMITED
  
Date: April 29, 2022/s/ Matthew J. Osberg
 Matthew J. Osberg
 Chief Financial Officer, Principal Financial Officer and Principal Accounting Officer
4
Exhibit 99.1 PARTICIPANTS Corporate Participants Jack Jancin – Senior Vice President-Corporate Business Development, Helen of Troy Ltd. Julien R. Mininberg – Chief Executive Officer & Director, Helen of Troy Ltd. Matt Osberg – Chief Financial Officer, Helen of Troy Ltd. Other Participants Bob J. Labick – Analyst, CJS Securities, Inc. Rupesh Parikh – Analyst, Oppenheimer & Co., Inc. Anthony C. Lebiedzinski – Analyst, Sidoti & Co. LLC Linda Bolton Weiser – Analyst, D.A. Davidson & Co. Steven L. Marotta – Analyst, C.L. King & Associates, Inc. MANAGEMENT DISCUSSION SECTION Operator: Greetings and welcome to the Helen of Troy Ltd. Fourth Quarter 2022 Earnings Call. At this time, all participants are in a listen-only mode. A question-and-answer session will follow the formal presentation. [Operator Instructions] As a reminder, this conference is being recorded. I would now like to turn the conference over to your host, Jack Jancin, Senior Vice President of Corporate Business Development. Please go ahead, sir. Jack Jancin, Senior Vice President-Corporate Business Development, Helen of Troy Ltd. Thank you, operator. Good morning, everyone, and welcome to Helen of Troy’s fourth quarter fiscal 2022 earnings conference call. The agenda for the call this morning is as follows, I will begin with a brief discussion of forward-looking statements. Mr. Julien Mininberg, the company’s CEO, will comment on the business performance and key accomplishments, and then provide some perspective as we begin the new fiscal year. Then Mr. Matt Osberg, the company’s CFO, will review the financials in more detail and comment about current trends and expectations for the upcoming fiscal year. Following this, we will take questions you have for us today. This conference call may contain certain forward-looking statements that are based on management’s current expectation with respect to future events or financial performance. Generally, the words anticipates, believes, expects, and other words similar, are words identifying forward-looking statements. Forward-looking statements are subject to a number of risks and uncertainties that could cause anticipated results to differ materially from the actual results. This conference call may also include information that may be considered non-GAAP financial information. These non-GAAP measures are not an alternative to GAAP financial information and may be calculated differently than the non-GAAP financial information disclosed by other parties. The company cautions listeners not to place undue reliance on forward-looking statements or non-GAAP information. Before I turn the call over to Mr. Mininberg, I would like to inform all interested parties that a copy of today’s earnings release has been posted to the Investor Relations section of the company’s website at www.helenoftroy.com. The earnings release contains tables that reconcile non-GAAP financial measures


to their corresponding GAAP-based measures. The release can be obtained by selecting the Investor Relations tab on the company’s homepage and then the Press Releases tab. I will now turn the conference call over to Mr. Mininberg. Julien R. Mininberg, Chief Executive Officer & Director, Helen of Troy Ltd. Thank you, Jack. Good morning, everyone, and thank you for joining us today. We’re excited to discuss our recent acquisition of Curlsmith and our fourth quarter and full-year fiscal 2022 results. On today’s call, we will also introduce our outlook for fiscal 2023, and provide an overview of the investments we’re making to continue to drive our transformation in the back half of Phase II and beyond. As we have now completed our third year of Phase II, we will also update you on the outstanding progress we have made on the goals we laid out during our May 2019 Investor Day. Spoiler alert, we are ahead nearly across the board. Let me start by providing a bit more color on the Curlsmith acquisition. We see it as an exciting and excellent strategic fit for our prestige beauty portfolio that also delivers immediate value creation and strong growth potential. Our M&A strategy calls for adding Leadership Brands and up and comers where we can add value and leverage our scalable operating platform. In this case, we are adding a fast- growing, innovative up and comer that complements our portfolio of Leadership Brands. With approximately 60% of US consumers having hair with varying degrees of waves and curls, prestige textured hair products are growing 10 times faster than products for non-textured hair, and twice as fast as mass-market textured hair products. Curlsmith business more than doubled in size over the last two years, and we expect it to continue growing at a double digit rate. Curlsmith products are designed to make caring for textured hair easier for consumers, earning it leading Net Promoter Scores, impressive repeat purchase loyalty and strong reviews. Curlsmith further builds our presence in prestige with a brand that complements our successful Drybar acquisition. We expect it to immediately become our most profitable brand and further sweeten our mix in Beauty. Consistent with our better together thinking on acquisitions, we expect to add significant further value to Curlsmith by capitalizing on our much larger beauty salesforce in brick and mortar and online, additional DTC capability, marketing, appliance know-how, our international go-to-market footprint and our robust shared services platform that includes global sourcing, distribution, IT and back office capability well beyond what Curlsmith has today. Our acquisition and divestiture activity so far in Phase II has significantly improved our beauty portfolio. With the acquisition of Curlsmith and Drybar, Revlon license buyout and divestiture of our mass-market personal care liquids, four of our last five major deals have been in Beauty. These were strategic moves, which when combined with Beauty’s organic growth and efficiency projects, have made it our highest margin segment. The portfolio now includes a good, better, best set of winning appliance brands under Revlon, Bed Head, Hot Tools and Drybar and a growing consumables presence in prestige liquids with Drybar and Curlsmith. Turning to the fourth quarter, today we are pleased to report outstanding results, including double-digit growth in consolidated revenue and EPS. All three business segments performed well ahead of our expectations on both the top and bottom line. Since COVID has had such a big impact on the comparisons over the past two years, we think it is also helpful to look at the two year stacked comparisons, which are included in today’s press release. On that basis, for the quarter we grew core net sales by 37% and core adjusted diluted EPS by 45%.


As you have likely noticed in today’s earnings release, we’ve renamed two of our business segments to reflect the substantial changes to our portfolio in recent years. With OXO now joined by two iconic brands in the outdoor industry, Hydro Flask and Osprey, we are renaming our Housewares segment to Home & Outdoor. We are also renaming our Health & Home segment to Health & Wellness. The Health side of the new name reflects the functional benefits of helping consumers monitor their physical condition and provide relief when family members may be sick. The Wellness side allows us to put even more focus on the emotional benefits of providing peace of mind and well-being. Looking specifically at segment performance, Home & Outdoor sales grew significantly in the fourth quarter, aided by the contribution of Osprey. This comes on top of double-digit growth in the comparison period. The growth this quarter was led by Hydro Flask, which continued to grow market share. Turning to Beauty, demand was especially strong in volumizers and wavers. We continued to grow share in this segment as well. Beauty also continued to perform internationally, posting double-digit growth with particular strength in EMEA and Latin America. This reinforces our strategic focus on appliances and premium beauty products in Latin America. Fiscal 2022 marks two years of Drybar under our ownership, delivering performance ahead of our acquisition economics despite the challenges of the pandemic. Turning to Health & Wellness, the segment significantly exceeded our expectations. Key drivers in the fourth quarter included higher than expected sales of thermometers and humidifiers related to a late- season Omicron surge that tended to produce cough and flu-like symptoms. With the cold and flu season, [ph] it fell (00:08:25) indeed below historical averages as we forecasted on our third quarter call in January, it turned out that Omicron stimulated demand for health-related products. The quarter also benefited from higher sales of seasonal products such as fans. Turning now to the full fiscal year result, we are proud to continue delivering growth over the elevated base laid down last year and despite the many challenges from supply chain disruption, inflation, and the EPA matter. Fiscal 2022 marks another record year for revenues and adjusted earnings per share and delivered further adjusted operating margin expansion. Growth rates, on top of the elevated base, were ahead of our Phase II targets. Our business model is working, reflecting the power of our diversified portfolio of nine leadership brands, investment in our value-creation flywheel, and excellence in execution of our transformation strategy by a high-performance organization who operates under a winning culture. Fiscal 2022 also demonstrated that the playbook we executed was effective in helping mitigate supply chain disruption and inflation. Stepping back now to look at our progress so far in Phase II, we are proud that our results have contributed to total shareholder returns well ahead of our proxy peer group since the start of Phase II and all through Phase I. Even though we are just three years into Phase II, we have grown significantly, with core net sales growth of 50% and core adjusted diluted EPS growth of 68%. Both represent an acceleration of compound annual growth rates versus Phase I. Looking at other Phase II targets, we are also ahead of plan. Core adjusted operating margins so far in Phase II has expanded well beyond our target. This was achieved primarily through flywheel investments, cost reduction projects and new products that have sweetened our mix. When we started Phase II, we set a goal of feeding our Leadership Brands with an average annual increase of at least 10% in growth investments such as consumer-centric product innovation and marketing support. The ROI from these investments has helped expand our margins, as have the benefits of our flywheel investments made in international and in shared services. Doubling down on international is another Phase II strategic choice that has paid off with results ahead of plan. During our 2019 Investor Day, we set a goal of adding over $100 million of organic revenue growth


outside of the United States by the end of fiscal 2024. I am pleased to report that we have achieved this goal two years ahead of schedule. That provides us an opportunity to raise the bar. Today, we are announcing that we are targeting an additional $130 million of growth outside the United States over the two remaining years of Phase II. This includes further organic growth in the two geographic regions we originally chose, EMEA and Asia Pacific, while now also adding two new important international growth drivers, both of which are expected to grow double digits in the back half of Phase II. The first of those is Latin America, which has been growing rapidly over Phase II on a core basis and second is Osprey, which is 50% international. Another impressive outcome from the choice to double down on international is the margin improvements during Phase II. International margins have increased significantly over the past three years with EMEA and Latin America joining Asia Pacific as investment grade, making them a further focus for the back half of Phase II. ROIC is another key metric of our Phase II plan. Careful stewardship and allocation of capital has been a hallmark of our transformation from the beginning. In priority order, our stated capital allocation strategy has been to invest in our business, make strategic and accretive acquisitions and buyback shares. We have committed approximately $1.3 billion of capital in the first three years of Phase II, which includes investments to date in the new distribution center, the Drybar, Osprey and Curlsmith acquisitions, the Revlon 100-year license buyout and share repurchases. This is approximately the same amount that we committed over the five years of Phase I. Like all capital allocations that have multiyear payouts, these latest investments require time to deliver their return, not just in ROIC, but also in the form of an even more robust enterprise that we expect will serve as the foundation for further growth well beyond Phase II. Now looking ahead to fiscal 2023, the outlook we are introducing today projects another year of solid growth in revenue and profitability. Our two new acquisitions, Osprey and Curlsmith, are expected to drive revenue and margin growth. We expect their incremental revenues to add operating leverage and make further use of our shared services, which in turn provides further lift from adding critical mass to the flywheel not only in fiscal 2023, but also in future years, very similar to what we did with Hydro Flask and Drybar in the past and continue to do today. We recognize the broad-based concerns about continued supply chain interruption, rising interest rates and rising inflation that puts pressure on input costs and also on consumer buying power. And in fact, we are seeing weakness in consumption in some categories in March and April. It is important to note our outlook includes our current assessment of the impact of each of these headwinds. To address them we are reapplying our proven playbook, which we expect to mitigate more than $3 a share of inflation and supply chain interruption. We have now contracted all of our expected shipping needs for the year, which locks in sea freight for the full fiscal year at significant discounts to current spot market rates and provides considerable visibility on these costs. We have also now introduced many of our price increases. To help offset margin compression from higher costs, we also expect growth from Drybar and Hydro Flask to sweeten our organic mix. With regard to the EPA matter, the recent EPA concerns are related to the packaging and labels of certain additional humidifiers and air products that have been in the market for years. We continue to engage in dialogue with the EPA to resolve the matter as quickly as possible. The current estimate of the impact of this matter is included in our outlook. On the spending side for fiscal 2023, we continue to believe strongly that executing our transformation strategy is the best way to continue delivering long-term value for shareholders. Our fiscal 2023 outlook, therefore, includes carefully considered investments in the most important opportunities for our brands


and the key shared service initiatives intended to open new efficiency, capability and scalability for the back half of fiscal 2023 and beyond. We also continue to invest in consumer-centric innovation, which has been the lifeblood of our Leadership Brands throughout the transformation. We are investing in the most attractive brand marketing opportunities, customization, personalization and international. I mentioned earlier we see further upside in EMEA and Asia-Pacific and are increasing our focus on Latin America, especially in beauty appliances. In shared services, the major fiscal 2023 investments are primarily related to improvements in operations, IT and in executing the $10 million-plus multiyear cost of goods savings programs underway in each business unit. In operations, we are further diversifying the geographic footprint of our global sourcing across China, Southeast Asia and Mexico and creating more dual sourcing to improve cost and certainty of supply. This in turn, opens the door to creating new efficiencies and lower risks, such as shortening lead times, decreasing inventory, lowering freight and reducing exposure to global geopolitical friction and to tariffs. On the distribution side of operations, the new Tennessee distribution center will significantly increase our capacity and allow us to more efficiently handle the growth of our business over the past five years and the new growth we are planning. Construction is proceeding on time and on budget and we expect to open by the end of fiscal 2023. On the IT side, our outlook includes choiceful investments in system upgrades, such as best-of-breed applications for demand planning and warehouse management, and new direct-to-consumer capability and capacity to adapt even further to the growing demand for online purchases and increasing service expectations. We believe we are making the right spending decisions and have been careful, especially in this cost environment, to focus on the ones we expect will matter most. We have a track record of delivering on the annual guidance we provide. This has been the case throughout the transformation and was proven again today in our fiscal 2022 results. This track record is driven by our relentless focus on execution of our strategic plan, our agility in the face of adversity and our culture that brings out the very best in our outstanding people. As we look further out, we reiterate our commitment to our long-term average annual top and bottom line growth targets for fiscal 2024. Overall, we expect Phase II will deliver a five-year run of top and bottom line organic growth well ahead of the average annual targets we set. Even though we have two years left in Phase II and are focused on executing with excellence in all of the areas just mentioned, we are now beginning to work on Phase III. Over the balance of this fiscal year, I will be working with our global leadership team and our board on the strategic planning for Phase III. As you can see from the previously discussed investments we are making now in infrastructure, we are looking to further build out our platform so we can scale it in the next generation of profitable organic and inorganic growth. We look forward to sharing our Phase III strategic choices and plans with you in fiscal 2024. Moving now to an update on executive leadership, I am pleased to report that we have completed our previously announced search for a Chief Operating Officer. Adding this role will help us focus on continuing our growth and executing the major strategic initiatives for the back half of Phase II and beyond with excellence. Noel Geoffroy will join Helen of Troy as the Chief Operating Officer on May 9 of 2022 and will oversee the day-to-day business, the execution of major projects and help plan for Phase III. Noel Geoffroy brings over 25 years of experience as a proven leader in president and general manager roles at world-class companies, including Sanofi in consumer health care, Kellogg’s, H.J. Heinz and Procter & Gamble. She is a consumer-centric leader, a passionate brand builder, a product innovator and has a strong reputation as an inspirational organizational and cultural leader. She will report directly to me and will sit on our global leadership team.


Additionally, I am very pleased to announce that we have new leadership in Health & Wellness. Christophe Coudray, President of our Health & Wellness business segment, retired from Helen of Troy at the end of February. It is an honor to see long service leaders like Christophe finish a distinguished career of over 35 years in the consumer products industry. Mauricio Troncoso has joined Helen of Troy as our new President of Health & Wellness. He brings 30 years of domestic and international experience. His career spans progressive roles at Kimberly-Clark, Ontex, Mead Johnson Nutrition and Procter & Gamble. He has led a wide range of consumer goods businesses, reorganizations, transformation programs, and operational efficiency initiatives, as well as acquisition integrations. Before concluding my remarks, I would like to briefly touch on further progress we have made on ESG and diversity, equity, inclusion and belonging. Starting with ESG, at the corporate level, we recently increased our efforts to minimize our impact on the environment by confirming our plastic packaging targets as part of our participation in the new plastics economy. Through the global commitment, business and governments commit to change on how we produce, use, and reuse plastic to work towards a circular economy for plastics. We look forward to providing more details on our corporate and brand-specific ESG initiatives in our second annual ESG report, which we expect to issue in June. Turning to diversity, equity, inclusion and belonging. Throughout the transformation, our focus has been to attract, retain, unify, include and train the very best talent. Like ESG, diversity, equity, inclusion and belonging is a priority for Helen of Troy, and we continue to make significant progress. This includes adding more diversity of thought, experience, gender and ethnic background. With Noel joining next month, half of our named executive officers will be women and half of our global leadership team will be women or ethnically diverse. Beyond senior management, diversity in hiring across levels also continues to increase with more and more diverse candidates in our hiring pools. Our plans for the back half of Phase II include further focus on DEI&B initiatives. And with that, I’d like to hand the call over to our CFO, Matt Osberg. Matt Osberg, Chief Financial Officer, Helen of Troy Ltd. Thank you, Julien. Good morning, everyone. Our fourth quarter results represent a very strong finish to the year and deliver full fiscal year core business net sales and adjusted diluted EPS growth ahead of our long-term Phase II targets. I am very proud of how our entire organization again delivered strong results in what proved to be a very challenging year as we navigated the unpredictable path of COVID-19, inflationary cost headwinds, continued supply chain disruption and the EPA matter. A couple of points before I move on to my discussion of our fourth quarter and full year results, first, I’ll be speaking primarily to consolidated results, as well as core business results. Core business results exclude the entire Personal Care business in all periods and provide the best comparability between historical and future periods. Second, our results include $24.4 million in sales and $0.06 in adjusted diluted EPS from Osprey, which we acquired in December of 2021. Now moving on to results for the fourth quarter. Core business net sales increased 17.2%, reflecting growth in brick and mortar and online channels in our Home & Outdoor and Beauty segments. We benefited from strong consumer demand, higher sales in the club and closeout channels, the impact of customer price increases and growth in international sales.


Results also reflect approximately $20 million in sales that were pulled forward into the fourth quarter from the first quarter of fiscal 2023 as retailers accelerated orders to improve their inventory levels and in anticipation of price increases. We also had a comparative benefit due to last year’s winter storm Uri, which delayed approximately $15 million in orders that were not able to be shipped in the fourth quarter of fiscal 2021. GAAP consolidated operating income was $50.4 million or 8.7% of net sales. On an adjusted basis, operating margin increased 4.1 percentage points to 12.5%, primarily due to a decrease in marketing expense. Net income was $39.8 million or $1.64 per diluted share. Non-GAAP core adjusted diluted EPS increased 76.8% to $2.51, primarily due to higher adjusted operating income in the Home & Outdoor and Health & Wellness segments and lower weighted average diluted shares outstanding. Net cash provided by operating activities for the fourth quarter of fiscal 2022 was $145.9 million, reflecting higher EBITDA, strong collection of accounts receivable and a sequential reduction in inventory levels from the third quarter despite the incremental inventory added as part of the Osprey acquisition. Looking at our results on a full year basis, we were able to grow our core business at rates in excess of our long-term Phase II targets over the high base of fiscal 2021. In fiscal 2022, core net sales grew 8.4%, including the unfavorable impact of approximately $60 million related to the EPA matter. This growth is on top of 25.1% growth in fiscal 2021. We also grew core adjusted diluted EPS by 10.4% on top of the 26.5% growth in fiscal 2021. EPS growth in fiscal 2022 includes the unfavorable impact of approximately $0.30 per share due to lost sales volume related to the EPA matter, as well as approximately $2.25 per share of incremental inflationary costs. We also expanded our core adjusted operating margin by approximately 30 basis points, despite the EPA matter and inflationary cost headwinds. Finally, we deployed over $630 million in capital towards the Osprey acquisition, share repurchases and investments in our new distribution center. Our fiscal 2022 results illustrate the power of our value creation flywheel and our ability to continue executing our strategy, even in the face of significant headwinds. Although we deployed significant amounts of capital in fiscal 2022, our net leverage ratio as defined in our debt agreements was 2.0 times at the end of the fourth quarter. Now turning to our full year outlook for fiscal 2023. Since we have now completed the sale of all our mass market personal care business, we are not expecting any material activity related to non-core business in fiscal 2023. Therefore, the fiscal 2023 amounts we are providing in our outlook are on a consolidated basis, which includes Osprey and Curlsmith. However, due to the fact that the fiscal 2022 results include material activity related to noncore business, the year-over-year growth rates on a consolidated and core business basis will be different. The tables provided in today’s release compare our outlook to the prior year on both a consolidated and core basis. We believe that core business growth is the most relevant basis as it provides the best comparability between historical and future periods. For fiscal 2023, we expect consolidated net sales revenue in the range of $2.38 billion to $2.42 billion, which implies consolidated growth of 6.8% to 8.8% and core growth of 8.5% to 10.5%. Our net sales outlook reflects the following expectations by segment. Home & Outdoor net sales growth of 19% to 21%, including net sales from Osprey of $180 million to $185 million, Health & Wellness net sales decline of 1% to growth of 1% and Beauty core business net sales growth of 4.5% to 7.5%, including net sales from Curlsmith of $30 million to $35 million for the pro-rata period of fiscal 2023. We expect consolidated GAAP diluted EPS of $9.92 to $10.38, and consolidated non-GAAP adjusted diluted EPS in the range of $12.73 to $13.03 which implies consolidated growth of 3% to 5.4% and core growth of 4.5% to 7%. This includes an adjusted diluted EPS contribution from Osprey of approximately $0.50 to $0.55 and a pro-rata fiscal 2023 contribution from Curlsmith of approximately $0.20 to $0.25.


The EPS contribution from both acquisitions includes the impact of interest expense that reflects our current expectation of 225 basis points of interest rate increases in calendar year 2022. Our fiscal 2023 outlook includes the unfavorable category and consumption trends we are seeing in March and April, some caution relating to medium term uncertainty of consumer behavior in an inflationary environment, our best estimate of incremental inflationary input cost and the impact of forecasted higher interest rates. While sales and operating results were unfavorably impacted in fiscal 2022 by the EPA matter, we expect a favorable effect from the recovery of a portion of that impact in fiscal 2023. Additionally, as a result of continuing dialogue with the EPA, we are executing further repackaging and relabeling plans on certain additional humidifier and air filtration products. We currently expect this to limit our ability to ship to demand for the newly effective products and result in an unfavorable impact to net sales and EPS in fiscal 2023. We estimate that the net result of the EPA matter on fiscal 2023 will be a favorable impact to net sales of approximately $10 million and adjusted diluted EPS of approximately $0.10, which is included in our outlook. On March 30, 2022, a third-party facility that we utilize for inventory storage incurred severe damage from a weather-related incident. The inventory stored at this facility primarily relates to our Health & Wellness and Beauty segments, while the inventory is insured, some seasonal inventory and inventory designated for specific customer promotions is currently not accessible. As a result, we expect not to be able to ship certain products on a timely basis and have included an unfavorable impact on net sales of approximately $10 million and adjusted diluted EPS of approximately $0.10. We are working with local officials and our insurance provider to understand the extent of the damage, however, the building must be assessed and made to be structurally sound before we will have access to the inventory and be able to fully assess damages and the related financial impact. In fiscal 2023, we believe we can expand gross profit margin as well as grow our adjusted operating margin by 10 to 20 basis points despite the headwind of approximately 100 basis points from the net dilutive effect of price increases to offset the majority of the dollar gross profit impact of higher product and freight costs. Our outlook includes an estimated after-tax impact of incremental inflationary costs of approximately $75 million to $80 million, or approximately $3.10 to $3.30 of adjusted diluted EPS. Using our proven playbook, we believe we can mitigate the majority of these costs through a combination of improved mix, price increases, locking in shipping contracts at rates below current market prices and continuing to implement other cost reduction initiatives across our supplier base. We are also pleased to be able to expand operating margin as we continue to make further growth investments to transform our business and support the rapid growth we have experienced since we began Phase II. Due to expected higher levels of average debt from the Osprey and Curlsmith acquisitions and capital investments in our new distribution center, as well as higher expected interest rates in fiscal 2023, we expect interest expense in the range of $35 million to $36 million. We expect a fiscal 2023 GAAP effective tax rate of 13% to 14% and an adjusted effective tax rate of 11.7% to 12.7%. We do not expect a meaningful impact in fiscal 2023 from currently proposed tax legislation changes. At this stage, it is still unclear what domestic and global tax laws will be passed, in what form and on what timing. We will continue to assess the impacts as proposed legislation is considered and keep you updated. Capital asset expenditures are expected to be in the range of $180 million to $205 million for fiscal 2023 which includes expected expenditures related to our new distribution facility in the range of $145 million to $170 million, as well as further investment in IT systems for other key Phase II projects. We continue to expect the total cost of the new distribution center and equipment to be in the range of $200 million to $225 million spread over fiscal years 2022 and 2023.


With respect to cash flow and liquidity, typically, the majority of our operating cash flow is generated in the second half of our fiscal year. This, coupled with a higher concentration of capital expenditures expected in the first half of our fiscal year, is expected to lead to higher average debt balances and increasing net leverage ratios during the first half of our fiscal year. We expect debt levels and net leverage ratios to improve sequentially in the second half of our fiscal year to levels in line with where we finished fiscal 2022. We expect to end fiscal 2023 with inventory levels approximately flat to fiscal 2022 as increases in inventory for Osprey and Curlsmith, as well as higher product and freight costs, are planned to be offset by inventory efficiency. In terms of the quarterly cadence of sales and EPS, we expect the majority of our net sales and adjusted diluted EPS growth to be concentrated in the second and third quarters of fiscal 2023. This is primarily due to the strong net sales and adjusted diluted EPS growth comparisons in the first and fourth quarters of fiscal 2022, the adverse net sales and earnings impact of the EPA matter in the second and third quarters of fiscal 2022 and the impact of approximately $20 million from retailers accelerating orders in the fourth quarter of fiscal 2022. As I conclude my comments, I am very proud of the fact that despite significant headwinds and challenges during the first three years of Phase II, we have delivered core net sales growth of 50%, core adjusted diluted EPS growth of 68% and core adjusted operating margin expansion of 130 basis points. Our fiscal 2023 outlook, plans for continued core business, net sales and adjusted EPS growth, as well as adjusted operating margin expansion even as we plan to make further growth investments and overcome higher inflationary costs, continued supply chain disruption and higher interest expense. We are also looking forward to leveraging the opportunities in our existing brands, as well as the new ones created through the acquisitions of Osprey and Curlsmith. We expect these growth investments to set us up for success for the remainder of Phase II and beyond. We have dedicated and talented people, a track record of overcoming challenges and proven strategies to further leverage our value creation flywheel to continue to drive growth and incremental shareholder value over the long term. And with that, I’d like to turn it back to the operator for questions.


QUESTION AND ANSWER SECTION Operator: At this time we will be conducting a question-and-answer session. [Operator Instructions] Our first question is from Bob Labick with CJS Securities. Please proceed with your question. <Q – Bob Labick – CJS Securities, Inc.>: Thank you. Good morning. Congratulations on a great quarter and year and on the Curlsmith acquisition. <A – Julien Mininberg – Helen of Troy Ltd.>: Bob, great to hear from you and thanks for the comment. <Q – Bob Labick – CJS Securities, Inc.>: Thanks. Yes. So just wanted to start, you touched on or you alluded to the impact of inflation on demand, talked about that a little bit. Maybe taking a step back, could you give us a sense – a broader sense of the consumer now? Where are the areas of weakness as it relates to inflation or what are you seeing and what were you kind of hinting at? And you mentioned some softness in, I think, March and April. And then so, what are you seeing, what’s the consumer, and then what is your response to that and how do you kind of play through that? <A – Julien Mininberg – Helen of Troy Ltd.>: Yeah, a great question. I think a lot of folks on the call are trying to read the tea leaves on where consumers are as the various factors that dominate the headlines every day play through the news. Our take is that the consumer is generally quite healthy and will continue to stay so. And that said, there is pressure on the consumer. So what we see is not just more employment but, importantly, more labor participation. So that rate, we watch very closely because it’s one thing to have a job, it’s another thing for more people to be in the workplace altogether and then see the unemployment rate go down means there’s just a lot more jobs. Wages are climbing. And unfortunately, that climb is largely eaten away by inflation and so it impacts buying power and ultimately consumer bullishness, animal spirits, all of that. In the case of consumers, they’re very wise and careful with their money. So I think what we’re seeing is people just making choices about where to spend in the face of things like higher gas prices and other stuff that grabs headlines. Supermarket itself, it’s just more expensive. Go to the checkout and ask yourself, how does that feel? It feels more expensive. So we have a good, better, best portfolio. We’ve been very careful to build one. So think of not just OXO at the high end, but also Softworks at the middle level of the market. Revlon, good; Hot Tools, better; Drybar, best, and on it goes through our portfolio and so we appeal to all the different price points. And then from the consumer itself, things like the Michigan Consumer Confidence Indicator speak and their number is above 100 and it stays there, so that says to us that it backs these up. The only other thing that’s on my mind is this very famous thing that you hear all the time, which is, hey, the stimulus money is not in the annual compare now and consumers want experiences. It doesn’t mean they don’t want goods, it just means they want experiences. So as people make choices, things rebalance. All of that added to a little pressure in March and April, we said so, and you’re right to pick it up. But our outlook importantly includes every single one of the things I mentioned, plus the ones that were not mentioned, supply chain costs, the $3 a share of inflation, input cost headwinds, et cetera. So that’s how we see it, Bob. <Q – Bob Labick – CJS Securities, Inc.>: Okay. Great. Thanks. And then just kind of sticking along that line, how has kind of the inflation and supply constraints impacted your marketing, your ability to drive sales, your desire to get more people into your products because the supply [ph] train (00:41:14) has been difficult for quite some time? So where do you stand in terms of that marketing and where’s the balance of demand and your ability to supply? <A – Julien Mininberg – Helen of Troy Ltd.>: I think we’re in much better shape than most on this front. Excuse me, hang on one sec. Sorry, I think we’re in much better shape than most on this front. And the reason is because we got ahead of the supply chain disruption with a strategic inventory build more than


a year ago. Remember, we were coming off of the COVID craziness of especially health-related products and the scarcity of supply. So we built back more quickly and we went with the tough move of depleting our cash flow in order to have more inventory and meet demand. The demand then surged. And so our situation on out-of-stocks and the ability to market to that demand surge was extremely good. And you saw that all through last year. So we just reported a big number in Q4, and you’ve seen us do it in earlier quarters when others were just suffering from more of the supply chain disruption. We’re not bulletproof and we do have some places where there are shortages, but we’ve been very careful. You also heard in our statements that we’re continuing to carry a bit of elevated inventory, but less than before. You see in our balance sheet that our inventory number is down even though we just put another seven or eight points of growth on the top line. And we are just projecting in Matt’s comments to end the year with inventory roughly flat. But remember we also have the Curlsmith and the Osprey coming in as additional inventory year-over-year so all of that is netted into the number. But the bottom line of it all is we’re in pretty good shape, but not perfect. And on the contracting and the sea freight and the rest of it, we’ve been super careful with our suppliers to keep it that way. And there are bumps in the road, whether it’s the backups of ships in the Long Beach kind of thing that you see all over the place or the COVID scares that sweep still through China even to this day. So we’re not immune, but we’re in better shape than most. And on the marketing side, we spend to opportunity, as mentioned in my comments. We support the demand and then we support our retail customers. So we’re in pretty good shape. And on the long term, you heard some pretty substantial comments, I hope, in my prepared remarks about the work to diversify our supplier base. So this was mentioned specifically in Southeast Asia, Mexico, and even within China with dual sourcing in multiple places in order to be able to better meet this, which also has the benefits of shorter lead times, less inventory, less sea freight and the other efficiencies I mentioned. So the net of it all is better shape than most, and we’ll spend to the demand, and we’ll try to stimulate the demand with that marketing money. <Q – Bob Labick – CJS Securities, Inc.>: Okay. Great. And last one for me, I’ll jump back in queue. But maybe on Curlsmith, obviously, it’s a really attractive asset for you. What attracted you to it? What’s unique about Curlsmith? You touched on better together, but what are the primary attributes that make you believe it is poised for significant growth going forward? What differentiates it and how can it continue to grow or how can it grow double digits going forward? <A – Julien Mininberg – Helen of Troy Ltd.>: Yeah, great. It’s a terrific brand. Curlsmith is quite new. So you remember probably from our Investor Day back in 2019, we said that we’re focusing on adding Leadership Brands and also some up and comers that can serve as earlier-stage tuck-ins, especially when they’re disruptive. This one is disruptive in a segment of the prestige haircare category that really catches our attention, not just because it’s in prestige rather than mass where you’ve seen us actually exit rather than lean in with the personal care sales. But this part of prestige, I’m talking about curly hair, is something like 60% of consumers – in fact, just a little bit more, have type 2A or higher hair and that those types – by the way, you can see it on our website, there’s a chart in the Curlsmith deck that shows each of the hair types and the type it goes – that goes with it in terms of curliness or texturedness. Curlsmith has a unique approach. It’s consumer-centric which is chapter and verse for us, DNA. It has the natural type of ingredients. And on product development, it focuses on consumer-centric changes to get regimens that really work for a group of consumers who are incredibly loyal to their products. And the reason they’re loyal is not unique to Curlsmith, it’s unique to their hair type, which is when they find something that works, they really stick with it. The further thing we liked about it is the speed of growth in the textured hair segment is higher than that of non-textured hair by double and within prestige actually by 10x.


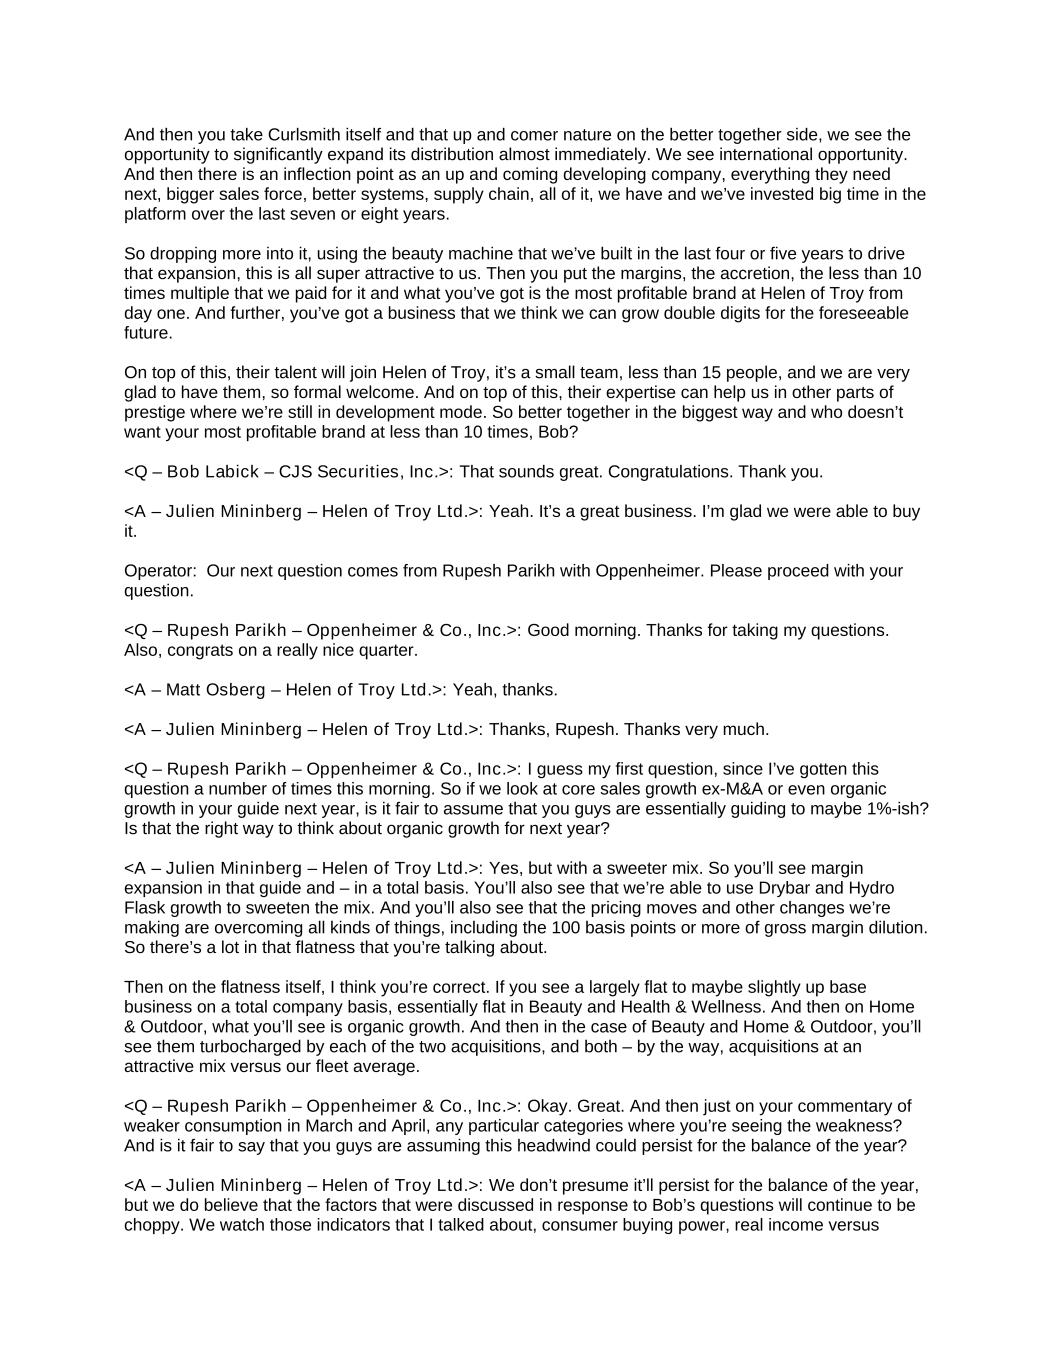
And then you take Curlsmith itself and that up and comer nature on the better together side, we see the opportunity to significantly expand its distribution almost immediately. We see international opportunity. And then there is an inflection point as an up and coming developing company, everything they need next, bigger sales force, better systems, supply chain, all of it, we have and we’ve invested big time in the platform over the last seven or eight years. So dropping more into it, using the beauty machine that we’ve built in the last four or five years to drive that expansion, this is all super attractive to us. Then you put the margins, the accretion, the less than 10 times multiple that we paid for it and what you’ve got is the most profitable brand at Helen of Troy from day one. And further, you’ve got a business that we think we can grow double digits for the foreseeable future. On top of this, their talent will join Helen of Troy, it’s a small team, less than 15 people, and we are very glad to have them, so formal welcome. And on top of this, their expertise can help us in other parts of prestige where we’re still in development mode. So better together in the biggest way and who doesn’t want your most profitable brand at less than 10 times, Bob? <Q – Bob Labick – CJS Securities, Inc.>: That sounds great. Congratulations. Thank you. <A – Julien Mininberg – Helen of Troy Ltd.>: Yeah. It’s a great business. I’m glad we were able to buy it. Operator: Our next question comes from Rupesh Parikh with Oppenheimer. Please proceed with your question. <Q – Rupesh Parikh – Oppenheimer & Co., Inc.>: Good morning. Thanks for taking my questions. Also, congrats on a really nice quarter. <A – Matt Osberg – Helen of Troy Ltd.>: Yeah, thanks. <A – Julien Mininberg – Helen of Troy Ltd.>: Thanks, Rupesh. Thanks very much. <Q – Rupesh Parikh – Oppenheimer & Co., Inc.>: I guess my first question, since I’ve gotten this question a number of times this morning. So if we look at core sales growth ex-M&A or even organic growth in your guide next year, is it fair to assume that you guys are essentially guiding to maybe 1%-ish? Is that the right way to think about organic growth for next year? <A – Julien Mininberg – Helen of Troy Ltd.>: Yes, but with a sweeter mix. So you’ll see margin expansion in that guide and – in a total basis. You’ll also see that we’re able to use Drybar and Hydro Flask growth to sweeten the mix. And you’ll also see that the pricing moves and other changes we’re making are overcoming all kinds of things, including the 100 basis points or more of gross margin dilution. So there’s a lot in that flatness that you’re talking about. Then on the flatness itself, I think you’re correct. If you see a largely flat to maybe slightly up base business on a total company basis, essentially flat in Beauty and Health & Wellness. And then on Home & Outdoor, what you’ll see is organic growth. And then in the case of Beauty and Home & Outdoor, you’ll see them turbocharged by each of the two acquisitions, and both – by the way, acquisitions at an attractive mix versus our fleet average. <Q – Rupesh Parikh – Oppenheimer & Co., Inc.>: Okay. Great. And then just on your commentary of weaker consumption in March and April, any particular categories where you’re seeing the weakness? And is it fair to say that you guys are assuming this headwind could persist for the balance of the year? <A – Julien Mininberg – Helen of Troy Ltd.>: We don’t presume it’ll persist for the balance of the year, but we do believe that the factors that were discussed in response to Bob’s questions will continue to be choppy. We watch those indicators that I talked about, consumer buying power, real income versus


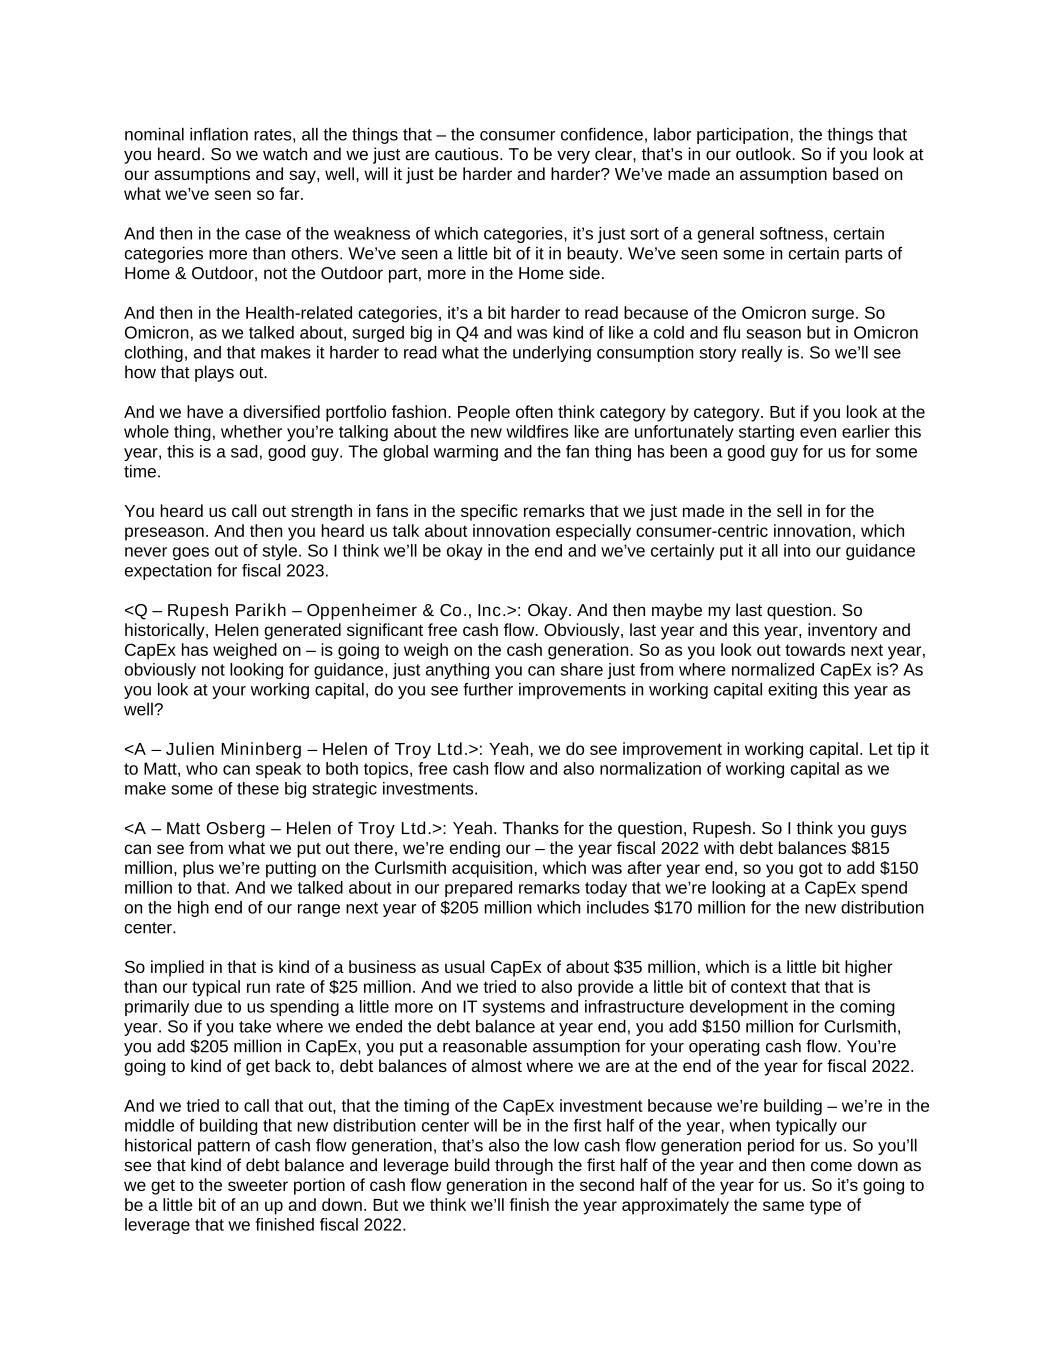
nominal inflation rates, all the things that – the consumer confidence, labor participation, the things that you heard. So we watch and we just are cautious. To be very clear, that’s in our outlook. So if you look at our assumptions and say, well, will it just be harder and harder? We’ve made an assumption based on what we’ve seen so far. And then in the case of the weakness of which categories, it’s just sort of a general softness, certain categories more than others. We’ve seen a little bit of it in beauty. We’ve seen some in certain parts of Home & Outdoor, not the Outdoor part, more in the Home side. And then in the Health-related categories, it’s a bit harder to read because of the Omicron surge. So Omicron, as we talked about, surged big in Q4 and was kind of like a cold and flu season but in Omicron clothing, and that makes it harder to read what the underlying consumption story really is. So we’ll see how that plays out. And we have a diversified portfolio fashion. People often think category by category. But if you look at the whole thing, whether you’re talking about the new wildfires like are unfortunately starting even earlier this year, this is a sad, good guy. The global warming and the fan thing has been a good guy for us for some time. You heard us call out strength in fans in the specific remarks that we just made in the sell in for the preseason. And then you heard us talk about innovation especially consumer-centric innovation, which never goes out of style. So I think we’ll be okay in the end and we’ve certainly put it all into our guidance expectation for fiscal 2023. <Q – Rupesh Parikh – Oppenheimer & Co., Inc.>: Okay. And then maybe my last question. So historically, Helen generated significant free cash flow. Obviously, last year and this year, inventory and CapEx has weighed on – is going to weigh on the cash generation. So as you look out towards next year, obviously not looking for guidance, just anything you can share just from where normalized CapEx is? As you look at your working capital, do you see further improvements in working capital exiting this year as well? <A – Julien Mininberg – Helen of Troy Ltd.>: Yeah, we do see improvement in working capital. Let tip it to Matt, who can speak to both topics, free cash flow and also normalization of working capital as we make some of these big strategic investments. <A – Matt Osberg – Helen of Troy Ltd.>: Yeah. Thanks for the question, Rupesh. So I think you guys can see from what we put out there, we’re ending our – the year fiscal 2022 with debt balances $815 million, plus we’re putting on the Curlsmith acquisition, which was after year end, so you got to add $150 million to that. And we talked about in our prepared remarks today that we’re looking at a CapEx spend on the high end of our range next year of $205 million which includes $170 million for the new distribution center. So implied in that is kind of a business as usual CapEx of about $35 million, which is a little bit higher than our typical run rate of $25 million. And we tried to also provide a little bit of context that that is primarily due to us spending a little more on IT systems and infrastructure development in the coming year. So if you take where we ended the debt balance at year end, you add $150 million for Curlsmith, you add $205 million in CapEx, you put a reasonable assumption for your operating cash flow. You’re going to kind of get back to, debt balances of almost where we are at the end of the year for fiscal 2022. And we tried to call that out, that the timing of the CapEx investment because we’re building – we’re in the middle of building that new distribution center will be in the first half of the year, when typically our historical pattern of cash flow generation, that’s also the low cash flow generation period for us. So you’ll see that kind of debt balance and leverage build through the first half of the year and then come down as we get to the sweeter portion of cash flow generation in the second half of the year for us. So it’s going to be a little bit of an up and down. But we think we’ll finish the year approximately the same type of leverage that we finished fiscal 2022.


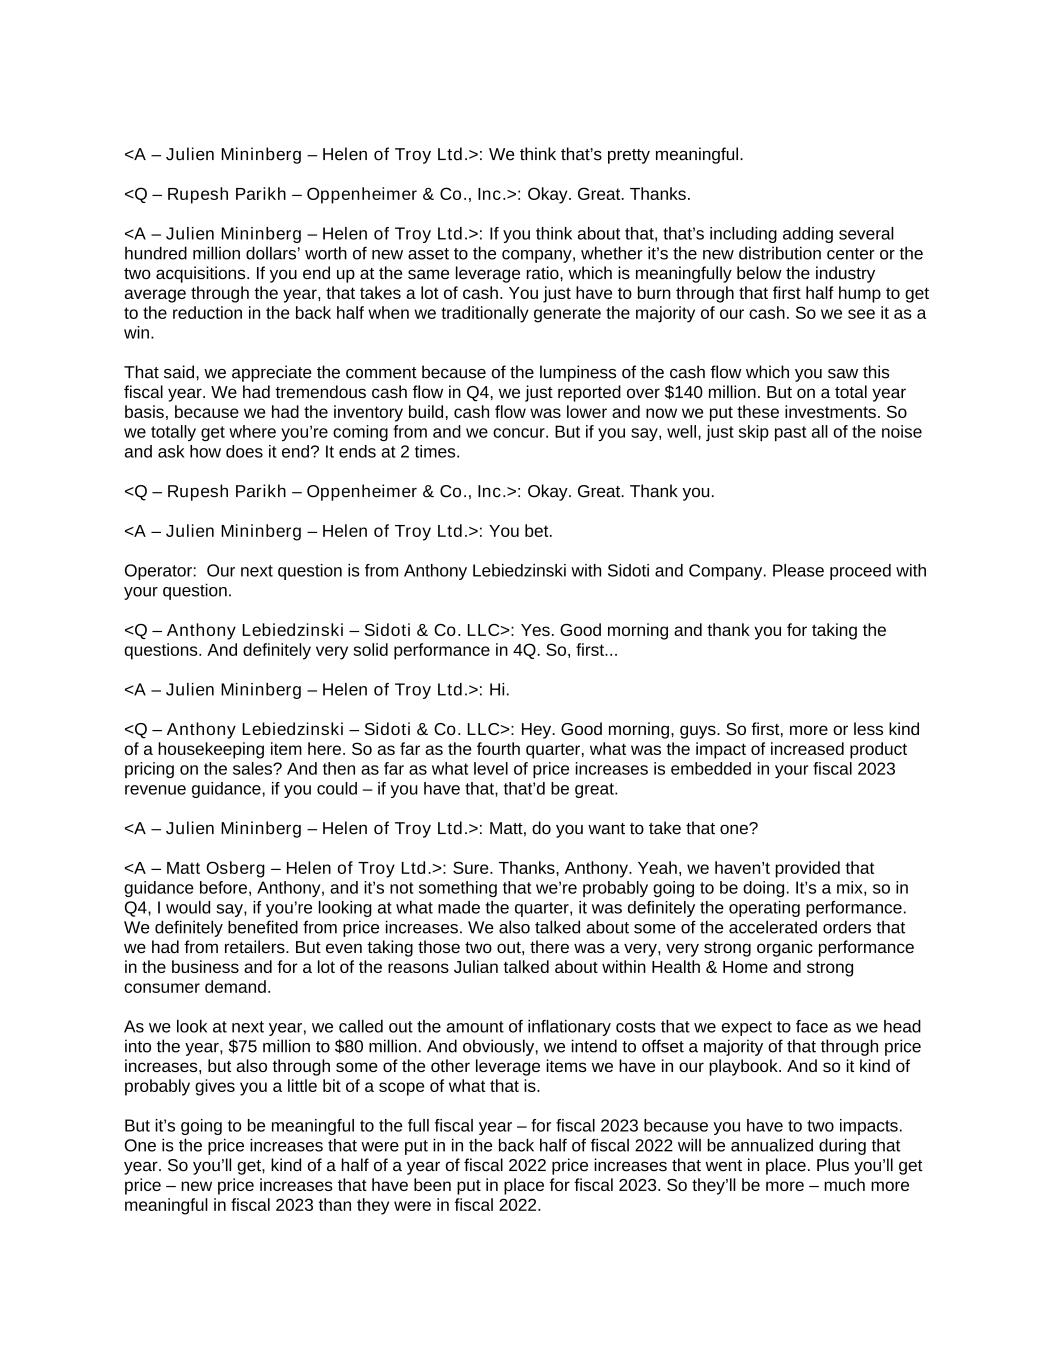
<A – Julien Mininberg – Helen of Troy Ltd.>: We think that’s pretty meaningful. <Q – Rupesh Parikh – Oppenheimer & Co., Inc.>: Okay. Great. Thanks. <A – Julien Mininberg – Helen of Troy Ltd.>: If you think about that, that’s including adding several hundred million dollars’ worth of new asset to the company, whether it’s the new distribution center or the two acquisitions. If you end up at the same leverage ratio, which is meaningfully below the industry average through the year, that takes a lot of cash. You just have to burn through that first half hump to get to the reduction in the back half when we traditionally generate the majority of our cash. So we see it as a win. That said, we appreciate the comment because of the lumpiness of the cash flow which you saw this fiscal year. We had tremendous cash flow in Q4, we just reported over $140 million. But on a total year basis, because we had the inventory build, cash flow was lower and now we put these investments. So we totally get where you’re coming from and we concur. But if you say, well, just skip past all of the noise and ask how does it end? It ends at 2 times. <Q – Rupesh Parikh – Oppenheimer & Co., Inc.>: Okay. Great. Thank you. <A – Julien Mininberg – Helen of Troy Ltd.>: You bet. Operator: Our next question is from Anthony Lebiedzinski with Sidoti and Company. Please proceed with your question. <Q – Anthony Lebiedzinski – Sidoti & Co. LLC>: Yes. Good morning and thank you for taking the questions. And definitely very solid performance in 4Q. So, first... <A – Julien Mininberg – Helen of Troy Ltd.>: Hi. <Q – Anthony Lebiedzinski – Sidoti & Co. LLC>: Hey. Good morning, guys. So first, more or less kind of a housekeeping item here. So as far as the fourth quarter, what was the impact of increased product pricing on the sales? And then as far as what level of price increases is embedded in your fiscal 2023 revenue guidance, if you could – if you have that, that’d be great. <A – Julien Mininberg – Helen of Troy Ltd.>: Matt, do you want to take that one? <A – Matt Osberg – Helen of Troy Ltd.>: Sure. Thanks, Anthony. Yeah, we haven’t provided that guidance before, Anthony, and it’s not something that we’re probably going to be doing. It’s a mix, so in Q4, I would say, if you’re looking at what made the quarter, it was definitely the operating performance. We definitely benefited from price increases. We also talked about some of the accelerated orders that we had from retailers. But even taking those two out, there was a very, very strong organic performance in the business and for a lot of the reasons Julian talked about within Health & Home and strong consumer demand. As we look at next year, we called out the amount of inflationary costs that we expect to face as we head into the year, $75 million to $80 million. And obviously, we intend to offset a majority of that through price increases, but also through some of the other leverage items we have in our playbook. And so it kind of probably gives you a little bit of a scope of what that is. But it’s going to be meaningful to the full fiscal year – for fiscal 2023 because you have to two impacts. One is the price increases that were put in in the back half of fiscal 2022 will be annualized during that year. So you’ll get, kind of a half of a year of fiscal 2022 price increases that went in place. Plus you’ll get price – new price increases that have been put in place for fiscal 2023. So they’ll be more – much more meaningful in fiscal 2023 than they were in fiscal 2022.


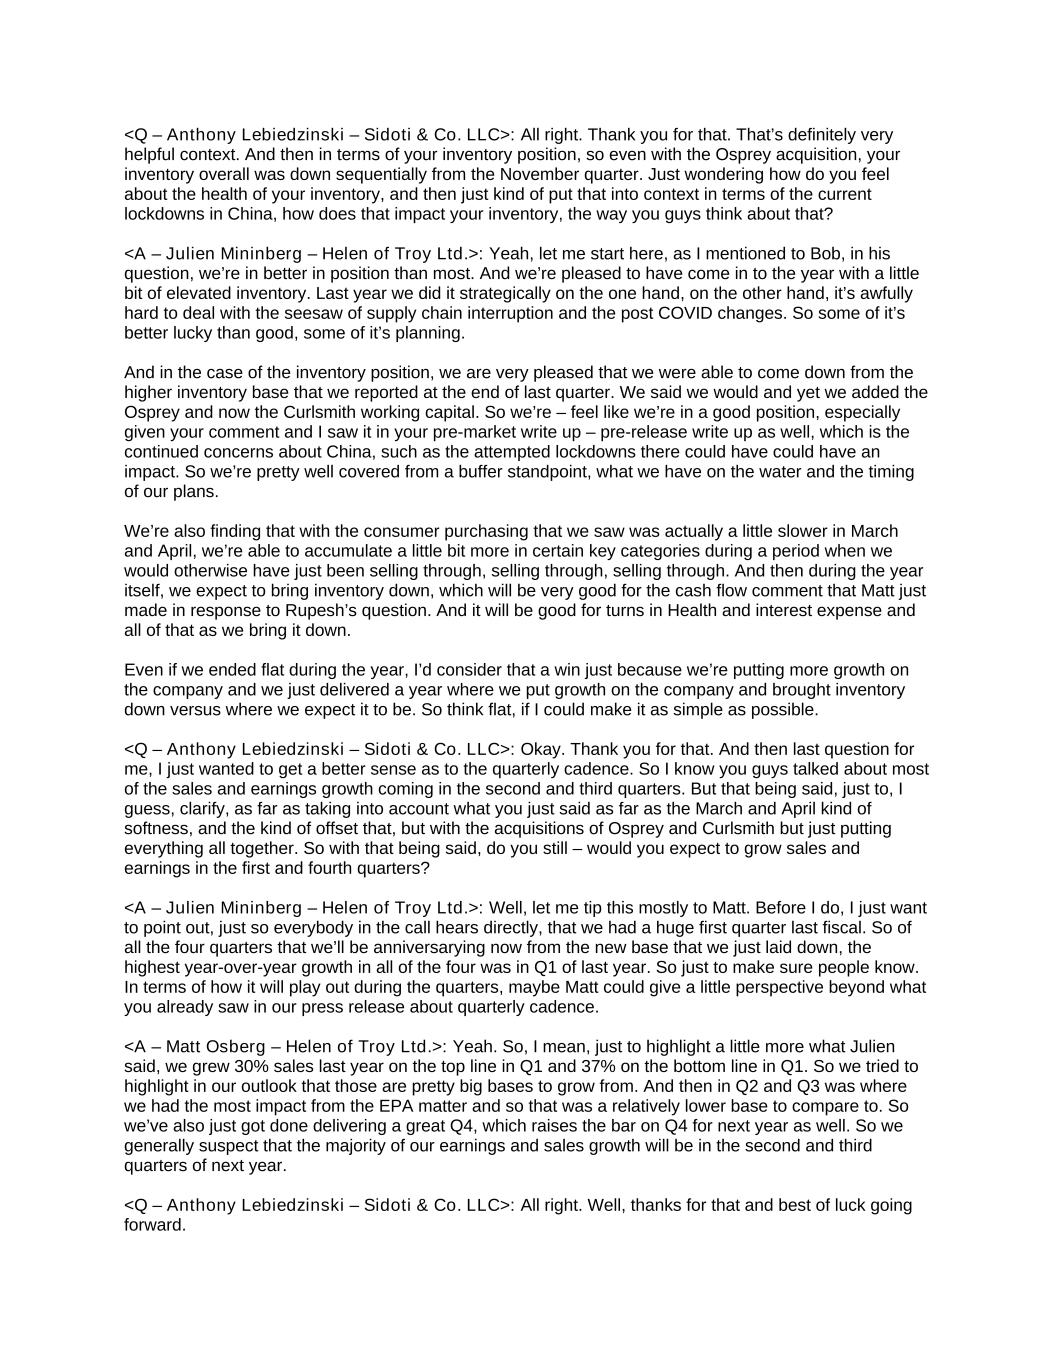
<Q – Anthony Lebiedzinski – Sidoti & Co. LLC>: All right. Thank you for that. That’s definitely very helpful context. And then in terms of your inventory position, so even with the Osprey acquisition, your inventory overall was down sequentially from the November quarter. Just wondering how do you feel about the health of your inventory, and then just kind of put that into context in terms of the current lockdowns in China, how does that impact your inventory, the way you guys think about that? <A – Julien Mininberg – Helen of Troy Ltd.>: Yeah, let me start here, as I mentioned to Bob, in his question, we’re in better in position than most. And we’re pleased to have come in to the year with a little bit of elevated inventory. Last year we did it strategically on the one hand, on the other hand, it’s awfully hard to deal with the seesaw of supply chain interruption and the post COVID changes. So some of it’s better lucky than good, some of it’s planning. And in the case of the inventory position, we are very pleased that we were able to come down from the higher inventory base that we reported at the end of last quarter. We said we would and yet we added the Osprey and now the Curlsmith working capital. So we’re – feel like we’re in a good position, especially given your comment and I saw it in your pre-market write up – pre-release write up as well, which is the continued concerns about China, such as the attempted lockdowns there could have could have an impact. So we’re pretty well covered from a buffer standpoint, what we have on the water and the timing of our plans. We’re also finding that with the consumer purchasing that we saw was actually a little slower in March and April, we’re able to accumulate a little bit more in certain key categories during a period when we would otherwise have just been selling through, selling through, selling through. And then during the year itself, we expect to bring inventory down, which will be very good for the cash flow comment that Matt just made in response to Rupesh’s question. And it will be good for turns in Health and interest expense and all of that as we bring it down. Even if we ended flat during the year, I’d consider that a win just because we’re putting more growth on the company and we just delivered a year where we put growth on the company and brought inventory down versus where we expect it to be. So think flat, if I could make it as simple as possible. <Q – Anthony Lebiedzinski – Sidoti & Co. LLC>: Okay. Thank you for that. And then last question for me, I just wanted to get a better sense as to the quarterly cadence. So I know you guys talked about most of the sales and earnings growth coming in the second and third quarters. But that being said, just to, I guess, clarify, as far as taking into account what you just said as far as the March and April kind of softness, and the kind of offset that, but with the acquisitions of Osprey and Curlsmith but just putting everything all together. So with that being said, do you still – would you expect to grow sales and earnings in the first and fourth quarters? <A – Julien Mininberg – Helen of Troy Ltd.>: Well, let me tip this mostly to Matt. Before I do, I just want to point out, just so everybody in the call hears directly, that we had a huge first quarter last fiscal. So of all the four quarters that we’ll be anniversarying now from the new base that we just laid down, the highest year-over-year growth in all of the four was in Q1 of last year. So just to make sure people know. In terms of how it will play out during the quarters, maybe Matt could give a little perspective beyond what you already saw in our press release about quarterly cadence. <A – Matt Osberg – Helen of Troy Ltd.>: Yeah. So, I mean, just to highlight a little more what Julien said, we grew 30% sales last year on the top line in Q1 and 37% on the bottom line in Q1. So we tried to highlight in our outlook that those are pretty big bases to grow from. And then in Q2 and Q3 was where we had the most impact from the EPA matter and so that was a relatively lower base to compare to. So we’ve also just got done delivering a great Q4, which raises the bar on Q4 for next year as well. So we generally suspect that the majority of our earnings and sales growth will be in the second and third quarters of next year. <Q – Anthony Lebiedzinski – Sidoti & Co. LLC>: All right. Well, thanks for that and best of luck going forward.


<A – Matt Osberg – Helen of Troy Ltd.>: Thanks. Operator: Our next question comes from Linda Bolton Weiser with D.A. Davidson. Please proceed with your question. <Q – Linda Weiser – D.A. Davidson & Co.>: Hi, how are you? <A – Julien Mininberg – Helen of Troy Ltd.>: Hey, Linda. Good. Nice to talk to you. <Q – Linda Weiser – D.A. Davidson & Co.>: Yes, great. Same here. So can I just ask you to – just to make sure I understand the projection for FY 2023 for Health & Wellness segment because we had originally expected you to gain back some of the lost sales that you lost from the labeling issue but then there’s incremental labeling changes. So is the idea that they kind of offset each other, and that’s why we’re not expecting really any growth or am I understanding that correctly? Can you give a little bit more explanation? <A – Julien Mininberg – Helen of Troy Ltd.>: Sure. Net tend to the good is the answer. Meaning $10 million upside net of the two, meaning the good guy and the bad guy that you’re referring to, the old recovery and the new labeling matters that we’re now working through. And so the result is $10 million to the good and then $0.10 to the good on the bottom line. So 10 to the good, $10 million on the top, $0.10 on the bottom. And to say, well, is that less than we expected? The answer is yes. What we had originally projected that roughly half of the recovery would occur in fiscal 2023. We’re sticking by that actually in our outlook. We may be able to do a bit better. We’re certainly trying. And on the new stuff, it’s being worked through as we speak. But when we net it all together, we thought rather than go through all the drama, we’ll just make a projection and just put the number out there so that people don’t have to sweat this. <Q – Linda Weiser – D.A. Davidson & Co.>: Okay. And then with regard to this issue with your third- party facility that may impact sales a little bit. I’m just wondering the EPA labeling issue and your inability to ship did affect market shares in certain areas. So I’m wondering if this issue with the other facility could also open up an opportunity for competitors to take advantage of the situation. So can you be a little more specific, like what product lines, like is it particular beauty products or like what’s being affected by the inability to ship? <A – Julien Mininberg – Helen of Troy Ltd.>: Sure. So importantly, it was largely a storage facility, as Matt mentioned, and this was a tornado-like event. So I think the weather service classifies tornadoes a very specific way, they have to touch down for a certain amount of time and all that, so we didn’t get into deciding exactly what kind of storm it was. We just called it a big weather thing. If you saw the place, you’d see, looks like a tornado hit. And in terms of getting in there to assess all the detail, this will be done as Matt mentioned in his remarks as soon as it’s safe to go back in the building. That work is being done right now and we already have a kind of preliminary estimate, which we’ve included in our outlook based on what we know so far. It’s a storage facility, so very little shipping happens out of there. Beauty got hurt by a couple of million dollars’ worth of an item that we couldn’t ship. And therefore, it’s cooked into our outlook. It’s also in those Q1 comments that we made. And in the case of the Health & Wellness, it’s not so much the EPA-related, so think of some fans and some other products that are a little further out in our shipping cycle for our upcoming seasonal businesses. So of course, we’re working with our suppliers to replace what we think is affected. And as soon as we get in there, we’ll find out how much of the product is still good and sellable and can be moved to shipping facilities, versus how much has to get put into the insurance cycle. And then because we’re insured, we’ll have our recovery that way. So that’s how we approach it right now. I wish I could put numbers on it all


and tell you exactly which SKUs. We believe we know and that said, once we get eyes and can do the count, and do the damage check, then we’ll be able to get very specific. <A – Matt Osberg – Helen of Troy Ltd.>: And hey, Linda. This is Matt. I might be able to add just a little bit to that, just on kind of the concerns over market share loss. As Julien pointed out, we had some of that loss was a very specific promotion that we were running for Beauty. So that was timely, we had to get inventory into it for that one specific promotion and we missed the window on it. So that’s – I wouldn’t look at as something that’s really a long-term product placement on the shelves of some very specific. And as Julien said, the other part of it was a lot of seasonal inventory for Health & Wellness. And that seasonal inventory, a lot of it is originally filled by retailers through DI shipments. And then a lot of what we have is replacement and replenishment as they sell through that during the year. So I think it’s more temporary than permanent, but we’ll have to kind of go through the cycle here and see how it plays out and see how fast we can get back into restoring that inventory. <Q – Linda Weiser – D.A. Davidson & Co.>: Okay. Thank you. And then let me just ask about the Curlsmith acquisition. The valuation looks like it was a little bit lower that you paid versus the Drybar acquisition, which is interesting to me because Drybar was actually partly appliances and not all consumables and this is all consumables. So it seems like it should be a higher valuation perhaps. So are you finding the deal valuations are coming down a bit here or kind of what – can you just kind of help us understand maybe the valuations between the two deals? <A – Julien Mininberg – Helen of Troy Ltd.>: Sure. Yeah. First of all, we concur, the valuation is compelling and it’s great to see a high-quality, fast-growing, high margin prestige product with meaningful differentiation, like was talked in response to Bob’s question, be able to trade for this multiple into a strategic portfolio that can add value to it. So, we strongly concur on the attractiveness of the price. In terms of the valuations in general, I think it’s too broad to say that we’re generally seeing prices come down. What we are seeing is interest rates going up. And when interest rates go up, it gives buyers the need to be careful about the impact of interest expense at the higher rates in the valuations that they can bid. We did that, and this valuation does reflect some discussion between the buyer and the seller on the impact of higher interest rates. And then in terms of relative to Drybar, it’s true that we bought it at a roughly three turns lower but Drybar had some unique features. Drybar has the moat around it of the salons. It has the license back to the salons, which puts the name out every day. There’s literally thousands of consumers every single day who are receiving professional treatments at Drybar salons with our products exclusively that are not only used but also recommended, also for sale in those stores. So there’s a lot of uniqueness to the Drybar arrangement that made it trade at a higher multiple. Interest rates were lower at that time. And then in terms of Curlsmith, as I said before from an infrastructure standpoint, there’s just less of it. So we’ll be putting that infrastructure but at a higher level of efficiency, which is attractive to us. So that’s how it came to be. And Jack, I don’t know if you have any comment on multiples in general, but it’s not my view that this is an indication of the old 12 is the new 10, something like that. I don’t see it that way. <A – Matt Osberg – Helen of Troy Ltd.>: No, I wouldn’t use this one data point as a trend for what’s happening in the marketplace right now. We pay for the business what was worked with all the modeling that we did. So we really like the deal and we think we can do a really good job with this business both short term and long term. <Q – Linda Weiser – D.A. Davidson & Co.>: Okay. Well, thank you very much. I appreciate it. <A – Matt Osberg – Helen of Troy Ltd.>: Sure. <A – Julien Mininberg – Helen of Troy Ltd.>: Yeah. No problem. Linda, I saw you had some other questions in the report that you put out on Curlsmith. And I know that a lot of those answers are in the


PowerPoint that we have posted on our website. So you’ve probably had a chance to look. And then one in particular, I wanted to make sure got addressed here, which is this is not about hair style Curlsmith as much as it is about hair type. So there’s just a lot of people – not just women, by the way, but also men that have textured hair. And regardless of whether it’s an ethnic person of color or it’s just someone with wavy or curly hair or textured hair all together, there’s plenty of people of all types. This type of hair is difficult to care for. So when you meet people with that type of hair and ask them, how do you care for your hair? They’ll be quite involved in its care because it’s challenging. And when they find products that stick with it, they’re tremendously loyal to them. Curlsmith has the highest Net Promoter Score we’ve seen so far in that category. It has the loyalty rates and the reviews that speak to this further, and because it’s a repurchasable or consumable product, that’s extremely attractive to us. And it’s one of the things that made us go for it as opposed to something that might not be as sticky. So that’s the – and I don’t mean the product, I mean the habit is sticky. So that’s attractive to us, but it’s not about, hey, curls might come back, it’s more about if you have that type of hair, this is just important in your everyday regimen, regardless of your fashion <Q – Linda Weiser – D.A. Davidson & Co.>: Okay. Thanks for that. <A – Matt Osberg – Helen of Troy Ltd.>: Sure. Operator: Our next question comes from Steve Marotta with C.L. King. Please proceed with your question. <Q – Steve Marotta – C.L. King & Associates, Inc.>: Good morning, Julien, Matt and Jack. <A – Julien Mininberg – Helen of Troy Ltd.>: Yeah. <Q – Steve Marotta – C.L. King & Associates, Inc.>: Julien, has the Ukraine conflict negatively impacted the European consumer? Is that discernible at this moment or still just not impacted? <A – Julien Mininberg – Helen of Troy Ltd.>: Not directly that we know of. And that said, we’re keenly aware in general that there’s a lot of pressures in the world, whether it’s the stuff that was mentioned earlier about just general pressure on the consumers’ confidence and buying power and all that. But on the specific topic of has the Ukraine suppressed European demand, we haven’t seen clear evidence of that. What we have seen is the interest rates – sorry, not the interest rates, the exchange rates move a bit. I’m sure you’ve all seen the pound and the euro have moved. We have some hedges in place. And that said, there have been significant movements in those currencies. We don’t have a lot of exposure directly in Russia, in fact, almost none. And in Ukraine in particular, I believe the number is less than $1 million. It’s actually a prepaid customer, so the money’s already been collected. And then from a sell-through standpoint, they’ll do the best they can. But it’s de minimis, I think is the word I would use. And on the sort of broader dark cloud over Europe. War sucks, so I can’t speak anything positive about how it’s helpful. What I can say is we’re not seeing a direct input at this time. <Q – Steve Marotta – C.L. King & Associates, Inc.>: Thank you. And I know that... <A – Julien Mininberg – Helen of Troy Ltd.>: Yeah. Oh, I’m sorry, Steve. I wanted to mention that the vast majority of our European sales are in Western Europe. Some of them are in the Middle Eastern countries, but there’s a surprisingly small amount in the Eastern European countries, especially in the south Eastern European countries, so think of Moldova, Belarus, Ukraine, these types of countries. It’s just not a big part of our portfolio.


<Q – Steve Marotta – C.L. King & Associates, Inc.>: Sure. I understand. I know that all the supply chain constraints that are known at this moment are incorporated within the guidance. But can you talk a little bit about direct exposure to Shanghai? Is that a new thorn in the side or is your exposure there relatively not material? <A – Julien Mininberg – Helen of Troy Ltd.>: Doesn’t help but relatively lean. The vast majority of our operational footprint in China is in other parts of China, especially Shenzhen, Macau, Hong Kong from both a supply chain and a go-to-market standpoint in the region. That said, we do have some people on the ground in Shanghai, so it doesn’t help. And then in the northern parts of China, think Ningbo and other parts, we do have people on the ground and capability and infrastructure. So it doesn’t affect but Shanghai in particular is just not a center of gravity for us at this time. So I suppose that’s good news. And that said, the concept of enforcing the lockdowns broadly, whether it’s Shanghai or in other cities, it does have an impact. We see that in port shutdowns and other things. And as strong as our inventory buffers are and as good as our supply chain playbook is, if the stuff doesn’t get made, it certainly doesn’t ship. And if it doesn’t ship, then it can’t get here or to Europe. And so it does affect us. But we have enough buffer to get through the, call it, bumps in the road, but not through earthquake. <Q – Steve Marotta – C.L. King & Associates, Inc.>: I understand. Thank you. I have a few more I’ll take off line. Thank you again. <A – Julien Mininberg – Helen of Troy Ltd.>: Yeah, pleasure. Thanks. Nice to hear from everybody. Operator, are there more questions at this time? Operator: It appears that we don’t have any questions at this time. And I would like to turn it back over to Mr. Minigan – Mininberg for closing remarks. Julien R. Mininberg, Chief Executive Officer & Director, Helen of Troy Ltd. Yeah. That’s me. Well, thanks. Thanks, everyone. Thanks for joining today and for your continued interest in Helen of Troy. We’re super excited about the results we just posted. You heard us speak clearly about what’s happened over the last three years as Phase II has had its first half. And you’ve heard us speak as specifically as we know how on what’s our expectation for Phase II’s back half, and in particular the guidance that we just provided for fiscal 2023. You also, I hope, heard us reiterate our commitment to the long-term Phase II average annual targets for fiscal 2024. So you know where we stand. And so we’re excited about the future. We’re excited to speak to many of you in the coming weeks. And with that, I’ll say thank you very much and have a great day. Operator: This concludes today’s conference. You may disconnect your lines at this time. Thank you for your participation.


Invest in Leadership Brands Double Down on International Selective & Strategic M&A Consumer Centric Unify, Include & Elevate the Best People Accelerate Shared Service Excellence Maximize Operating Efficiency Optimize Capital Deployment Investor Presentation April 2022

 
costs and complexities of compliance with such laws, the risks associated with increased focus and expectations on climate change and other environmental, social and governance matters, the risks associated with significant changes in or the Company’s compliance with regulations, interpretations or product certification requirements, the risks associated with global legal developments regarding privacy and data security that could result in changes to its business practices, penalties, increased cost of operations, or otherwise harm the business, the Company’s ability to continue to avoid classification as a Controlled Foreign Corporation, the risks associated with legislation enacted in Bermuda and Barbados in response to the European Union’s review of harmful tax competition, the risks associated with accounting for tax positions and the resolution of tax disputes, the risks of significant tariffs or other restrictions being placed on imports from China, Mexico or Vietnam or any retaliatory trade measures taken by China, Mexico or Vietnam, the risks associated with product recalls, product liability and other claims against the Company, and associated financial risks including but not limited to, significant impairment of the Company’s goodwill, indefinite-lived and definite-lived intangible assets or other long-lived assets, increased costs of raw materials, energy and transportation, the risks to the Company’s liquidity or cost of capital which may be materially adversely affected by constraints or changes in the capital and credit markets and limitations under its financing arrangements, risks associated with foreign currency exchange rate fluctuations, and projections of product demand, sales and net income, which are highly subjective in nature, and from which future sales and net income could vary in a material amount. The Company undertakes no obligation to publicly update or revise any forward-looking statements as a result of new information, future events or otherwise. Reconciliation of Non-GAAP Financial Measures: This presentation includes non-GAAP financial measures. Adjusted Operating Income, Adjusted Operating Margin, Adjusted Income, Adjusted Diluted Earnings per Share (“EPS”), Core and Non-Core Adjusted Diluted EPS, and Free Cash Flow (“Non-GAAP Financial Measures”) that are discussed in this presentation or in the accompanying tables may be considered non-GAAP financial information as contemplated by SEC Regulation G, Rule 100. Accordingly, the Company is providing the tables within this presentation which reconcile these measures to their corresponding GAAP- based measures. The Company believes that these non-GAAP measures provide useful information to management and investors regarding financial and business trends relating to its financial condition and results of operations. The Company believes that these non-GAAP financial measures, in combination with the Company’s financial results calculated in accordance with GAAP, provide investors with additional perspective regarding the impact of certain charges and benefits on applicable income, margin and earnings per share measures. The Company also believes that these non-GAAP measures facilitate a more direct comparison of the Company’s performance with its competitors. The Company further believes that including the excluded charges and benefits would not accurately reflect the underlying performance of the Company’s operations for the period in which the charges and benefits are incurred, even though such charges and benefits may be incurred and reflected in the Company’s GAAP financial results in the near future. The material limitation associated with the use of the non-GAAP financial measures is that the non-GAAP measures do not reflect the full economic impact of the Company’s activities. These non-GAAP measures are not prepared in accordance with GAAP, are not an alternative to GAAP financial information and may be calculated differently than non- GAAP financial information disclosed by other companies. Accordingly, undue reliance should not be placed on non- GAAP information. Forward Looking Statements and Reconciliation of Non-GAAP Financial Measures Forward Looking Statements: Certain written and oral statements made by the Company and subsidiaries of the Company may constitute “forward-looking statements” as defined under the Private Securities Litigation Reform Act of 1995. This includes statements made in this presentation, in other filings with the SEC, and in certain other oral and written presentations. Generally, the words “anticipates”, “believes”, “expects”, “plans”, “may”, “will”, “would”, “should”, “seeks”, “estimates”, “project”, “predict”, “potential”, “currently”, “continue”, “intends”, “outlook”, “forecasts”, “could”, and other similar words identify forward-looking statements. All statements that address operating results, events or developments that the Company expects or anticipates may occur in the future, including statements related to sales, earnings per share results, and statements expressing general expectations about future operating results, are forward-looking statements and are based upon its current expectations and various assumptions. The Company believes there is a reasonable basis for these expectations and assumptions, but there can be no assurance that the Company will realize these expectations or that these assumptions will prove correct. Forward-looking statements are subject to risks that could cause them to differ materially from actual results. Accordingly, the Company cautions readers not to place undue reliance on forward-looking statements. The forward-looking statements contained in this press release should be read in conjunction with, and are subject to and qualified by, the risks described in the Company’s Form 10-K for the year ended February 28, 2022, and in the Company's other filings with the SEC. Investors are urged to refer to the risk factors referred to above for a description of these risks. Such risks include, among others, the occurrence of cyber incidents or failure by the Company or its third-party service providers to maintain cybersecurity and the integrity of confidential internal or customer data, a cybersecurity breach, obsolescence or interruptions in the operation of the Company’s central global Enterprise Resource Planning systems and other peripheral information systems, the geographic concentration and peak season capacity of certain U.S. distribution facilities which increase its risk to disruptions that could affect the Company’s ability to deliver products in a timely manner, the Company's ability to successfully manage the demand, supply, and operational challenges associated with the actual or perceived effects of COVID-19 and any similar future public health crisis, pandemic or epidemic, the Company’s ability to develop and introduce a continuing stream of innovative new products to meet changing consumer preferences, actions taken by large customers that may adversely affect the Company’s gross profit and operating results, the Company’s dependence on sales to several large customers and the risks associated with any loss of, or substantial decline in, sales to top customers, the Company’s dependence on third-party manufacturers, most of which are located in Asia, and any inability to obtain products from such manufacturers, the Company’s ability to deliver products to its customers in a timely manner and according to their fulfillment standards, the risks associated with trade barriers, exchange controls, expropriations, and other risks associated with domestic and foreign operations including uncertainty and business interruptions resulting from political changes and actions in the U.S. and abroad, such as the current conflict between Russia and Ukraine, and volatility in the global credit and financial markets and economy, the Company’s dependence on the strength of retail economies and vulnerabilities to any prolonged economic downturn, including a future downturn from the effects of COVID-19, risks associated with the use of licensed trademarks from or to third parties, risks associated with weather conditions, the duration and severity of the cold and flu season and other related factors, the Company’s reliance on its Chief Executive Officer and a limited number of other key senior officers to operate its business, expectations regarding recent acquisitions (including Curlsmith and Osprey) and any future acquisitions or divestitures, including the Company’s ability to realize related synergies along with its ability to effectively integrate acquired businesses or disaggregate divested businesses, the risks of potential changes in laws and regulations, including environmental, employment and health and safety and tax laws, and the
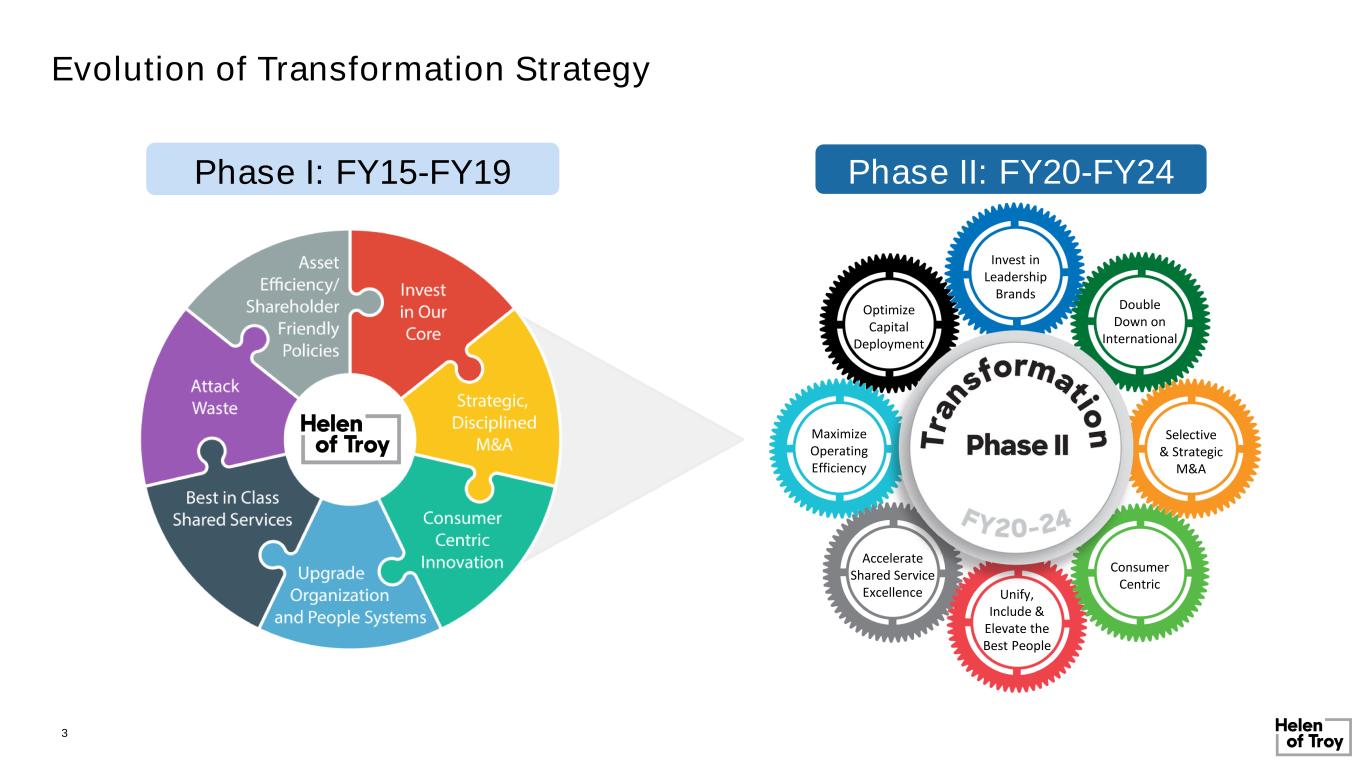

 
Phase II: FY20-FY24Phase I: FY15-FY19 3 Evolution of Transformation Strategy Invest in Leadership Brands Double Down on International Selective & Strategic M&A Consumer Centric Unify, Include & Elevate the Best People Accelerate Shared Service Excellence Maximize Operating Efficiency Optimize Capital Deployment
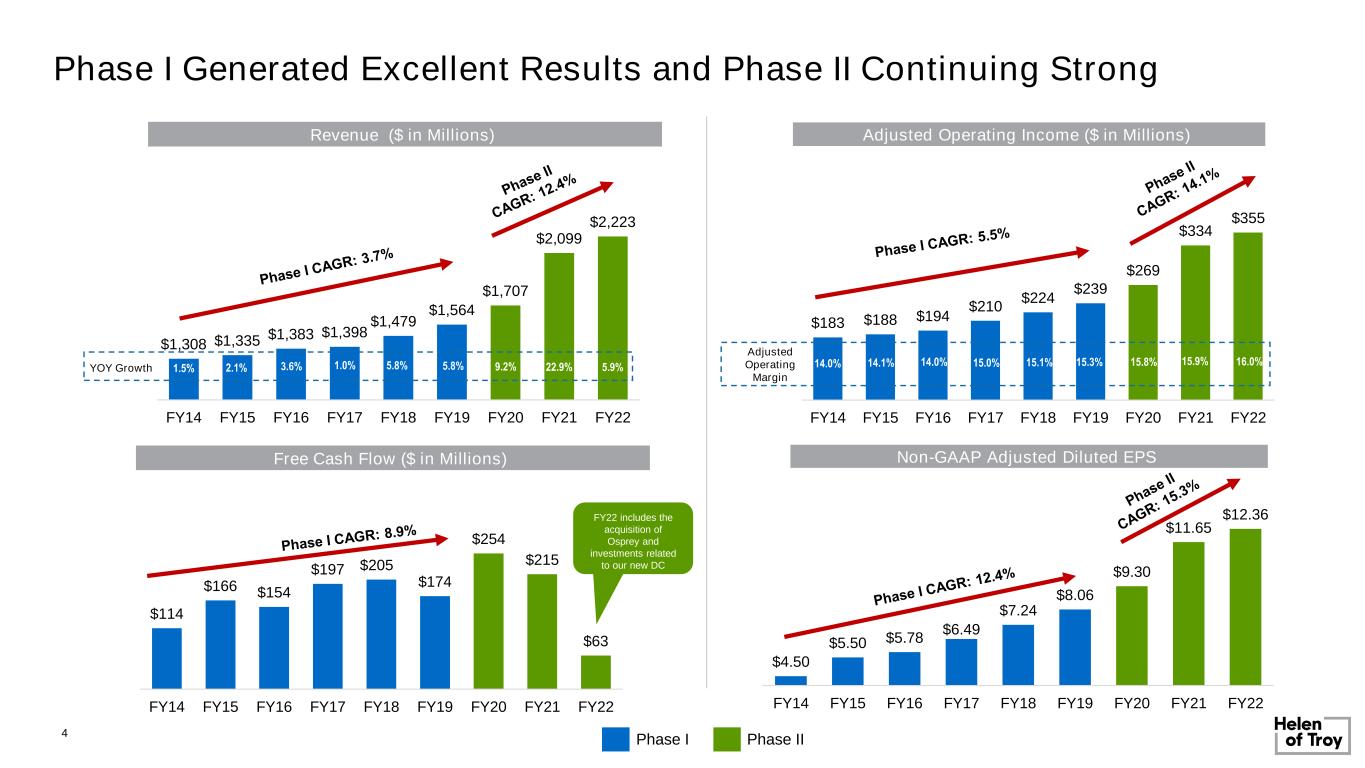

 
$114 $166 $154 $197 $205 $174 $254 $215 $63 FY14 FY15 FY16 FY17 FY18 FY19 FY20 FY21 FY22 4 $1,308 $1,335 $1,383 $1,398 $1,479 $1,564 $1,707 $2,099 $2,223 FY14 FY15 FY16 FY17 FY18 FY19 FY20 FY21 FY22 Revenue ($ in Millions) $4.50 $5.50 $5.78 $6.49 $7.24 $8.06 $9.30 $11.65 $12.36 FY14 FY15 FY16 FY17 FY18 FY19 FY20 FY21 FY22 Free Cash Flow ($ in Millions) 1.5% 2.1% 3.6% 1.0% 5.8%YOY Growth Adjusted Operating Income ($ in Millions) $183 $188 $194 $210 $224 $239 $269 $334 $355 FY14 FY15 FY16 FY17 FY18 FY19 FY20 FY21 FY22 14.0% 14.1% 14.0% 15.0% 15.1% Adjusted Operating Margin 5.8% 15.3% Non-GAAP Adjusted Diluted EPS Phase I Generated Excellent Results and Phase II Continuing Strong 9.2% 15.8% Phase I Phase II 22.9% 15.9% 5.9% 16.0% FY22 includes the acquisition of Osprey and investments related to our new DC
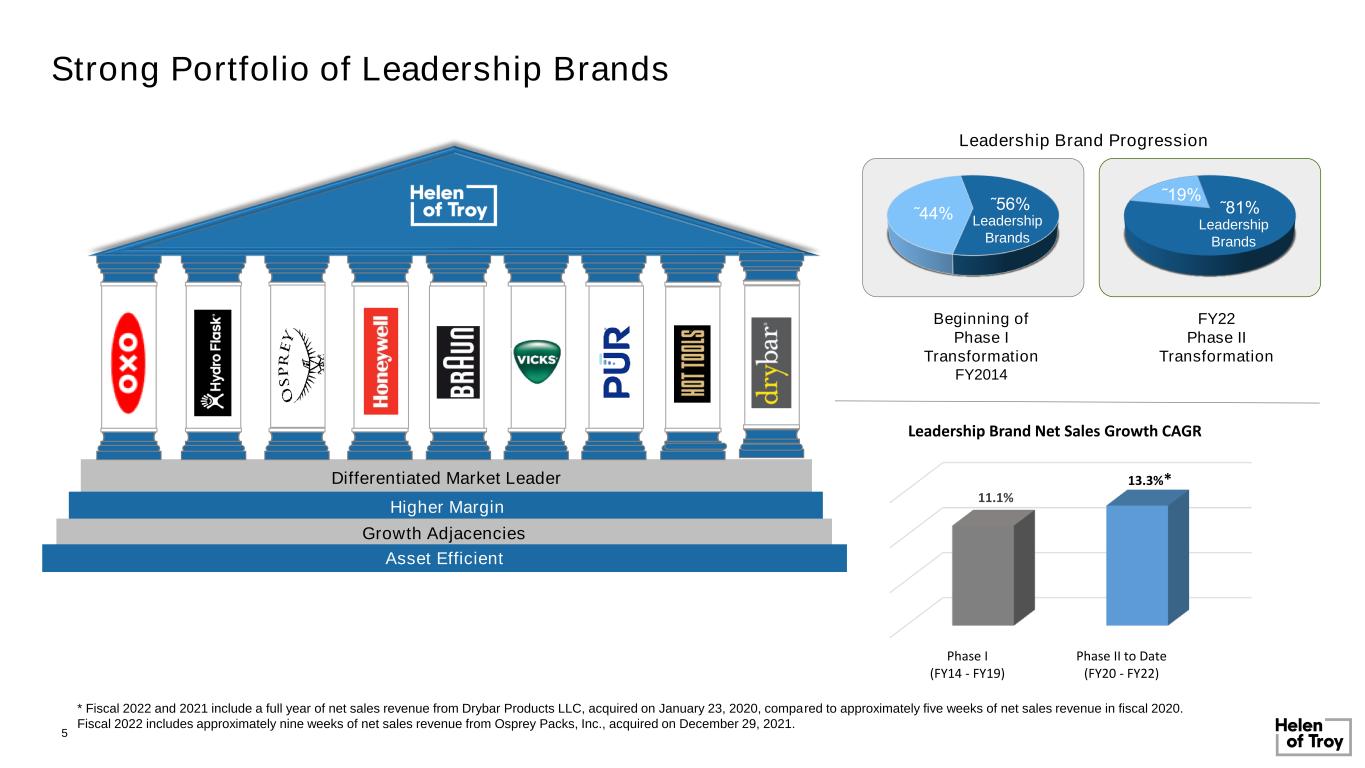

 
5 Higher Margin Asset Efficient Differentiated Market Leader Growth Adjacencies FY22 Phase II Transformation Beginning of Phase I Transformation FY2014 Leadership Brand Progression ˜44% ˜56% ˜19% ˜81% Leadership Brands Leadership Brands Phase I (FY14 - FY19) Phase II to Date (FY20 - FY22) 11.1% 13.3%* Leadership Brand Net Sales Growth CAGR * Fiscal 2022 and 2021 include a full year of net sales revenue from Drybar Products LLC, acquired on January 23, 2020, compared to approximately five weeks of net sales revenue in fiscal 2020. Fiscal 2022 includes approximately nine weeks of net sales revenue from Osprey Packs, Inc., acquired on December 29, 2021. Strong Portfolio of Leadership Brands
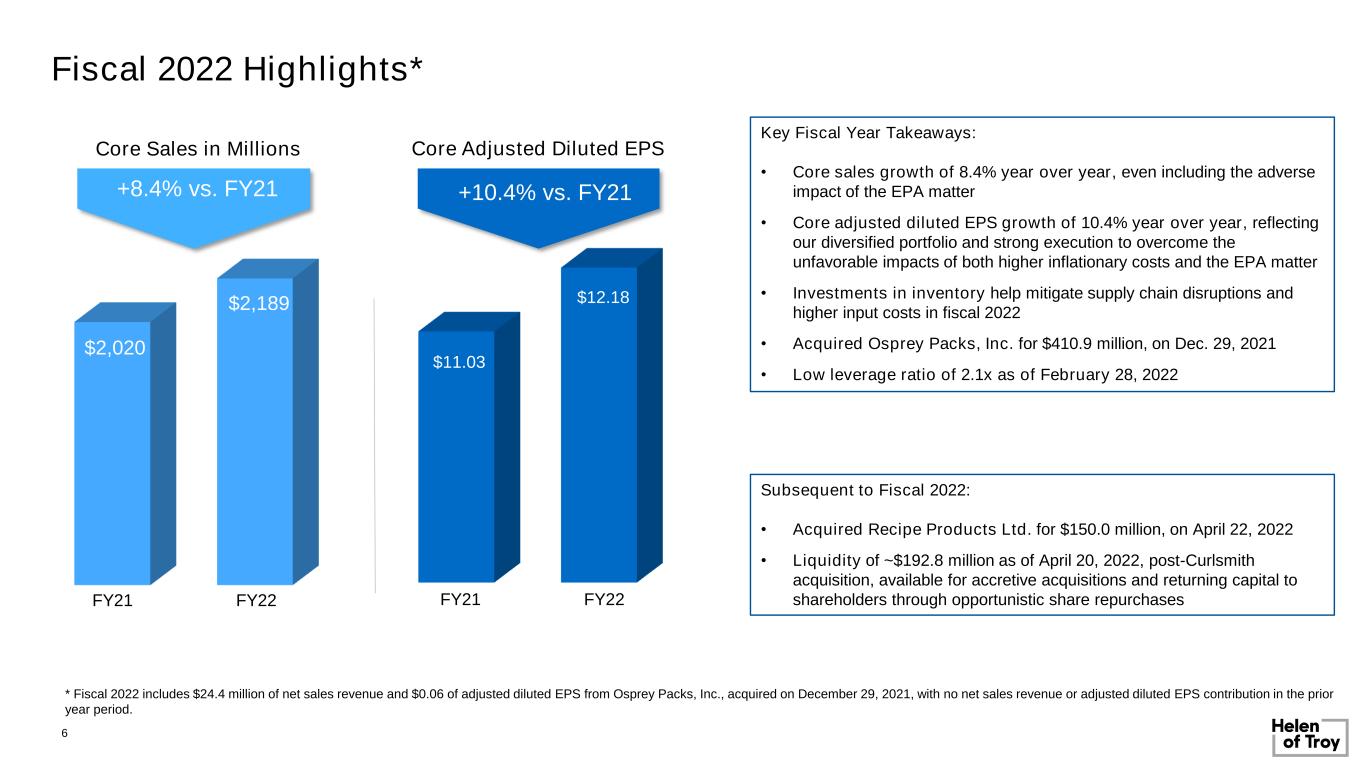

 
Fiscal 2022 Highlights* Core Sales in Millions $2,020 $2,189 +8.4% vs. FY21 Key Fiscal Year Takeaways: • Core sales growth of 8.4% year over year, even including the adverse impact of the EPA matter • Core adjusted diluted EPS growth of 10.4% year over year, reflecting our diversified portfolio and strong execution to overcome the unfavorable impacts of both higher inflationary costs and the EPA matter • Investments in inventory help mitigate supply chain disruptions and higher input costs in fiscal 2022 • Acquired Osprey Packs, Inc. for $410.9 million, on Dec. 29, 2021 • Low leverage ratio of 2.1x as of February 28, 2022 6 FY21 FY22 * Fiscal 2022 includes $24.4 million of net sales revenue and $0.06 of adjusted diluted EPS from Osprey Packs, Inc., acquired on December 29, 2021, with no net sales revenue or adjusted diluted EPS contribution in the prior year period. Subsequent to Fiscal 2022: • Acquired Recipe Products Ltd. for $150.0 million, on April 22, 2022 • Liquidity of ~$192.8 million as of April 20, 2022, post-Curlsmith acquisition, available for accretive acquisitions and returning capital to shareholders through opportunistic share repurchases Core Adjusted Diluted EPS +10.4% vs. FY21 FY21 FY22 $11.03 $12.18
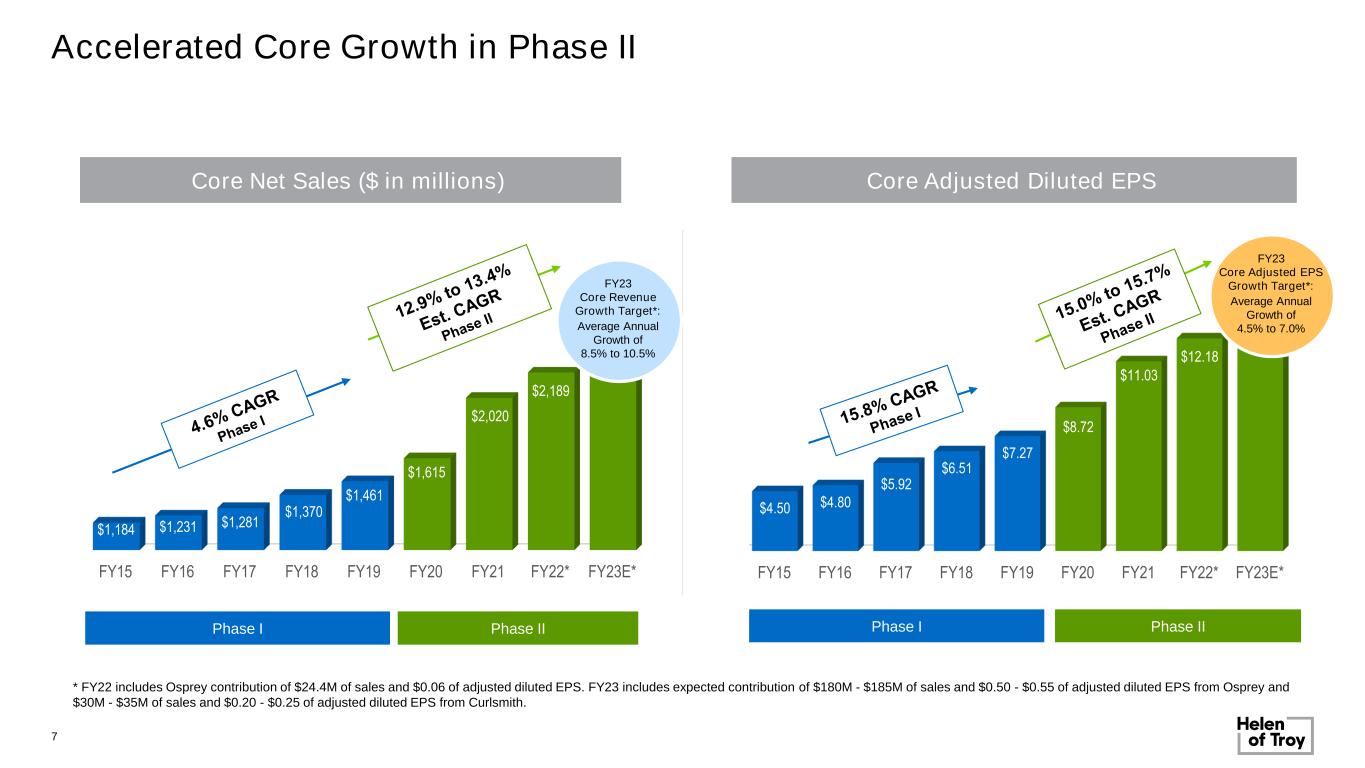

 
FY15 FY16 FY17 FY18 FY19 FY20 FY21 FY22* FY23E* $4.50 $4.80 $5.92 $6.51 $7.27 $8.72 $11.03 $12.18 $13.38 FY15 FY16 FY17 FY18 FY19 FY20 FY21 FY22* FY23E* $1,184 $1,231 $1,281 $1,370 $1,461 $1,615 $2,020 $2,189 $2,450 7 Accelerated Core Growth in Phase II Core Net Sales ($ in millions) Phase I Phase II Core Adjusted Diluted EPS Phase I Phase II * FY22 includes Osprey contribution of $24.4M of sales and $0.06 of adjusted diluted EPS. FY23 includes expected contribution of $180M - $185M of sales and $0.50 - $0.55 of adjusted diluted EPS from Osprey and $30M - $35M of sales and $0.20 - $0.25 of adjusted diluted EPS from Curlsmith. FY23 Core Adjusted EPS Growth Target*: Average Annual Growth of 4.5% to 7.0% FY23 Core Revenue Growth Target*: Average Annual Growth of 8.5% to 10.5%
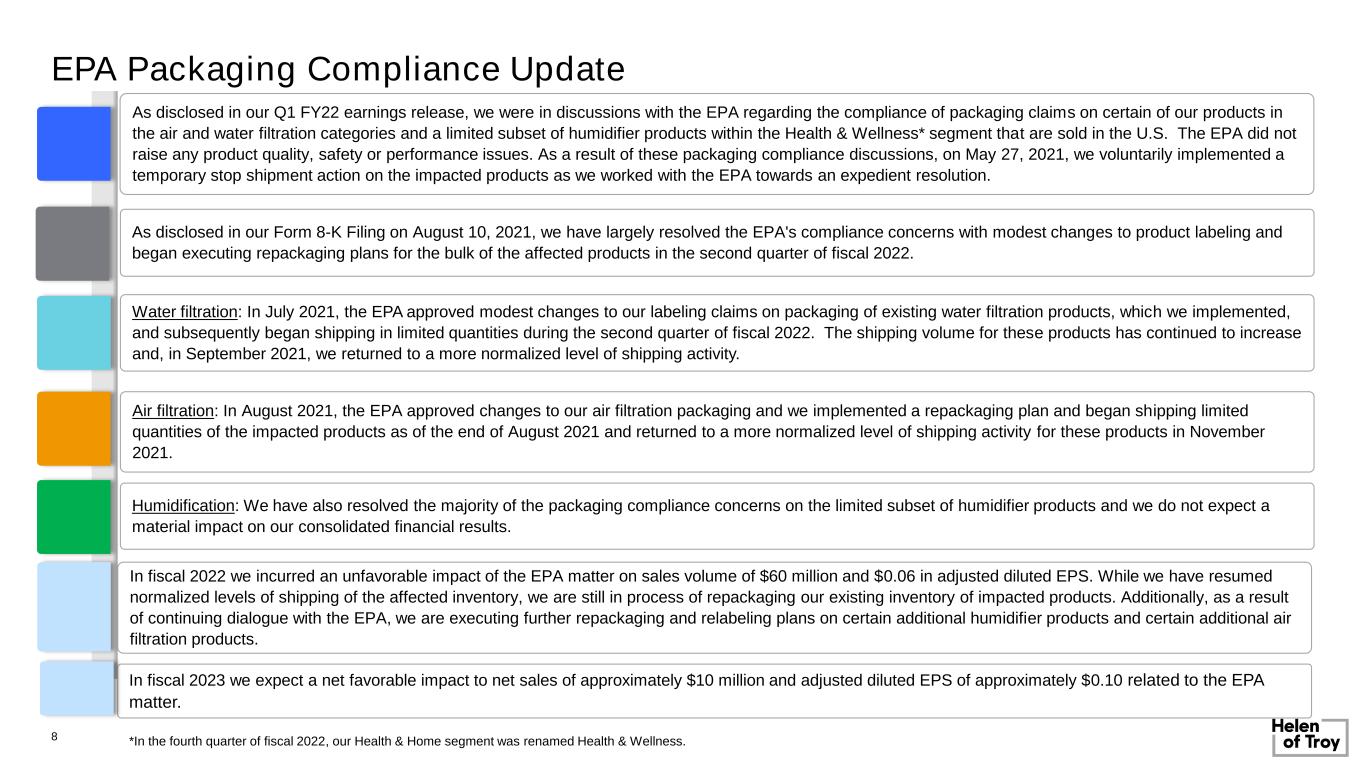

 
In fiscal 2023 we expect a net favorable impact to net sales of approximately $10 million and adjusted diluted EPS of approximately $0.10 related to the EPA matter. In fiscal 2022 we incurred an unfavorable impact of the EPA matter on sales volume of $60 million and $0.06 in adjusted diluted EPS. While we have resumed normalized levels of shipping of the affected inventory, we are still in process of repackaging our existing inventory of impacted products. Additionally, as a result of continuing dialogue with the EPA, we are executing further repackaging and relabeling plans on certain additional humidifier products and certain additional air filtration products. EPA Packaging Compliance Update As disclosed in our Form 8-K Filing on August 10, 2021, we have largely resolved the EPA's compliance concerns with modest changes to product labeling and began executing repackaging plans for the bulk of the affected products in the second quarter of fiscal 2022. Water filtration: In July 2021, the EPA approved modest changes to our labeling claims on packaging of existing water filtration products, which we implemented, and subsequently began shipping in limited quantities during the second quarter of fiscal 2022. The shipping volume for these products has continued to increase and, in September 2021, we returned to a more normalized level of shipping activity. Air filtration: In August 2021, the EPA approved changes to our air filtration packaging and we implemented a repackaging plan and began shipping limited quantities of the impacted products as of the end of August 2021 and returned to a more normalized level of shipping activity for these products in November 2021. Humidification: We have also resolved the majority of the packaging compliance concerns on the limited subset of humidifier products and we do not expect a material impact on our consolidated financial results. As disclosed in our Q1 FY22 earnings release, we were in discussions with the EPA regarding the compliance of packaging claims on certain of our products in the air and water filtration categories and a limited subset of humidifier products within the Health & Wellness* segment that are sold in the U.S. The EPA did not raise any product quality, safety or performance issues. As a result of these packaging compliance discussions, on May 27, 2021, we voluntarily implemented a temporary stop shipment action on the impacted products as we worked with the EPA towards an expedient resolution. 8 *In the fourth quarter of fiscal 2022, our Health & Home segment was renamed Health & Wellness.
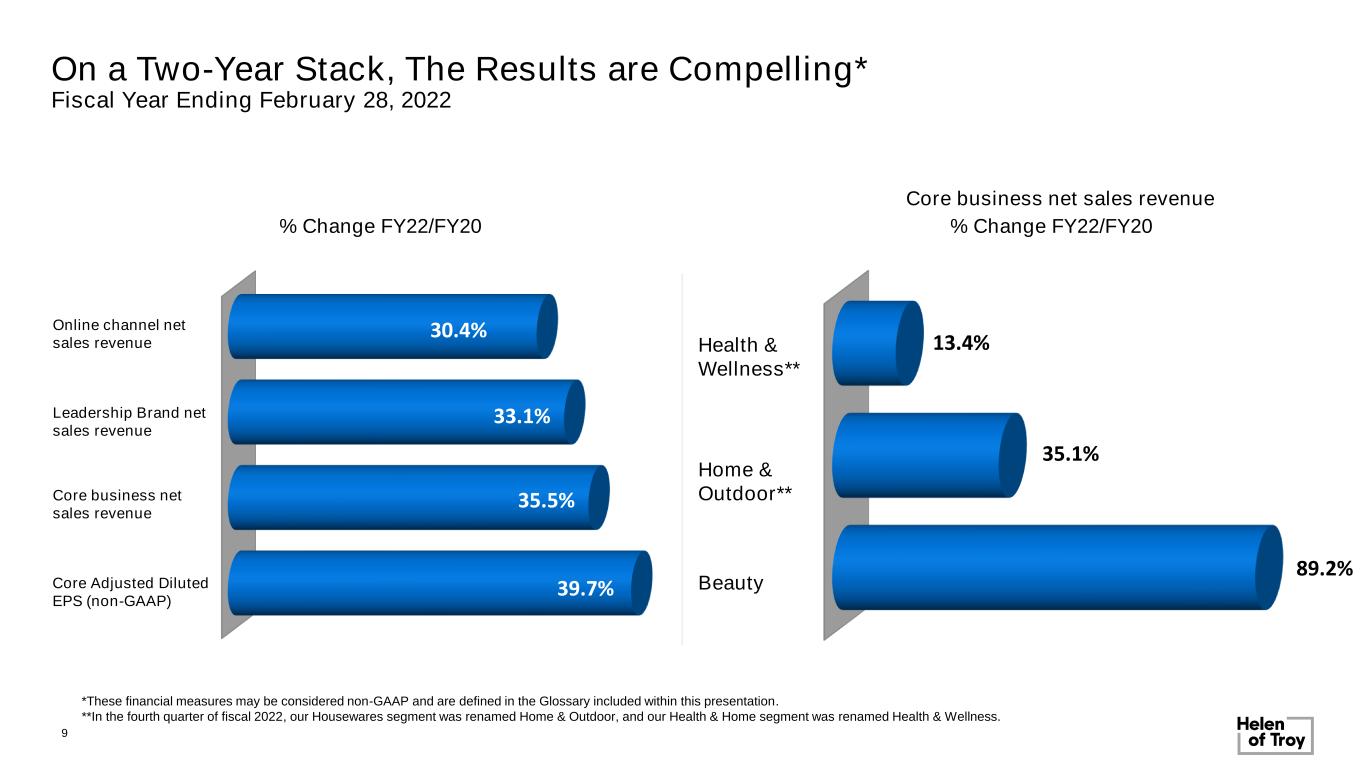

 
On a Two-Year Stack, The Results are Compelling* Fiscal Year Ending February 28, 2022 % Change FY22/FY20 39.7% 35.5% 33.1% 30.4% Core Adjusted Diluted EPS (non-GAAP) Online channel net sales revenue Leadership Brand net sales revenue Core business net sales revenue 9 Health & Wellness** Home & Outdoor** Beauty 89.2% 35.1% 13.4% Core business net sales revenue % Change FY22/FY20 *These financial measures may be considered non-GAAP and are defined in the Glossary included within this presentation. **In the fourth quarter of fiscal 2022, our Housewares segment was renamed Home & Outdoor, and our Health & Home segment was renamed Health & Wellness.
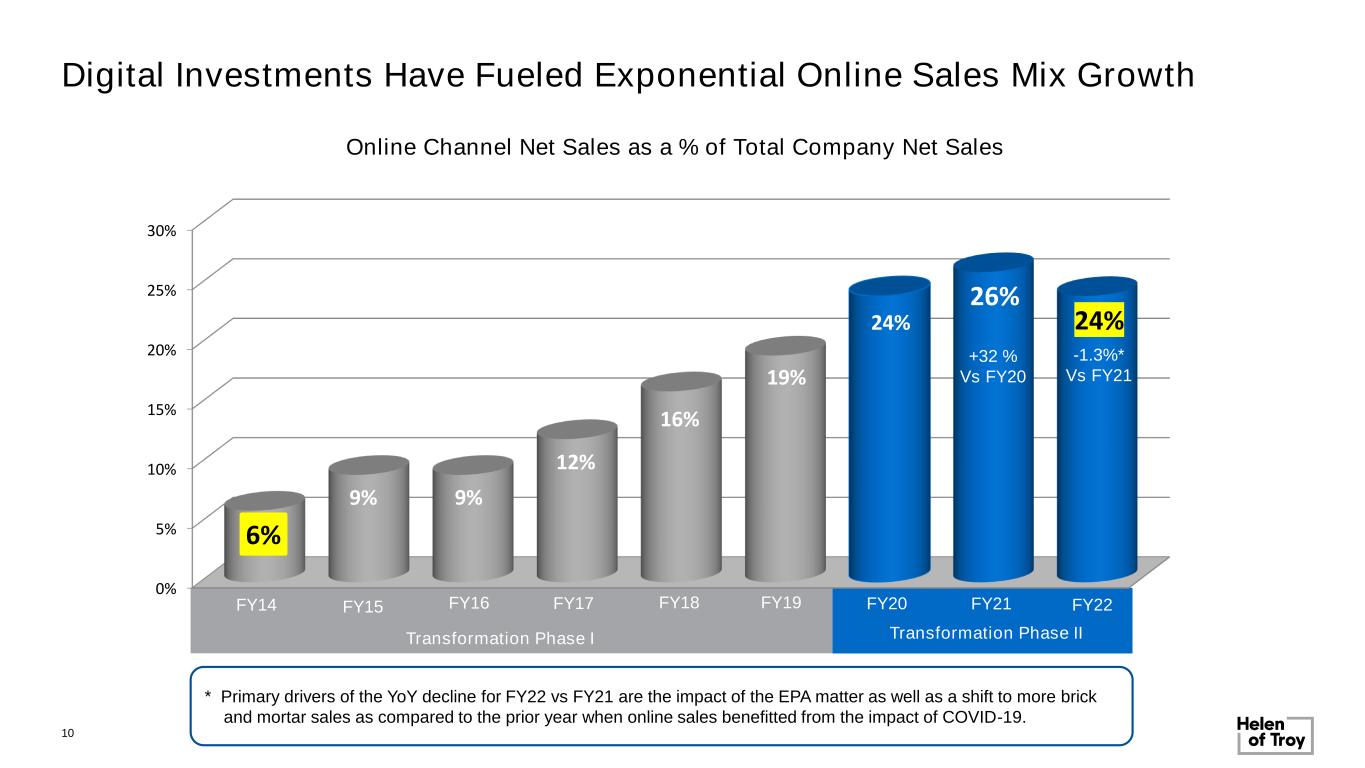

 
Digital Investments Have Fueled Exponential Online Sales Mix Growth 0% 5% 10% 15% 20% 25% 30% 6% 9% 9% 12% 16% 19% 24% 26% 24% FY14 FY20 FY21 Online Channel Net Sales as a % of Total Company Net Sales Transformation Phase I Transformation Phase II +32 % Vs FY20 10 FY22 -1.3%* Vs FY21 FY19FY15 FY16 FY18FY17 * Primary drivers of the YoY decline for FY22 vs FY21 are the impact of the EPA matter as well as a shift to more brick and mortar sales as compared to the prior year when online sales benefitted from the impact of COVID-19.
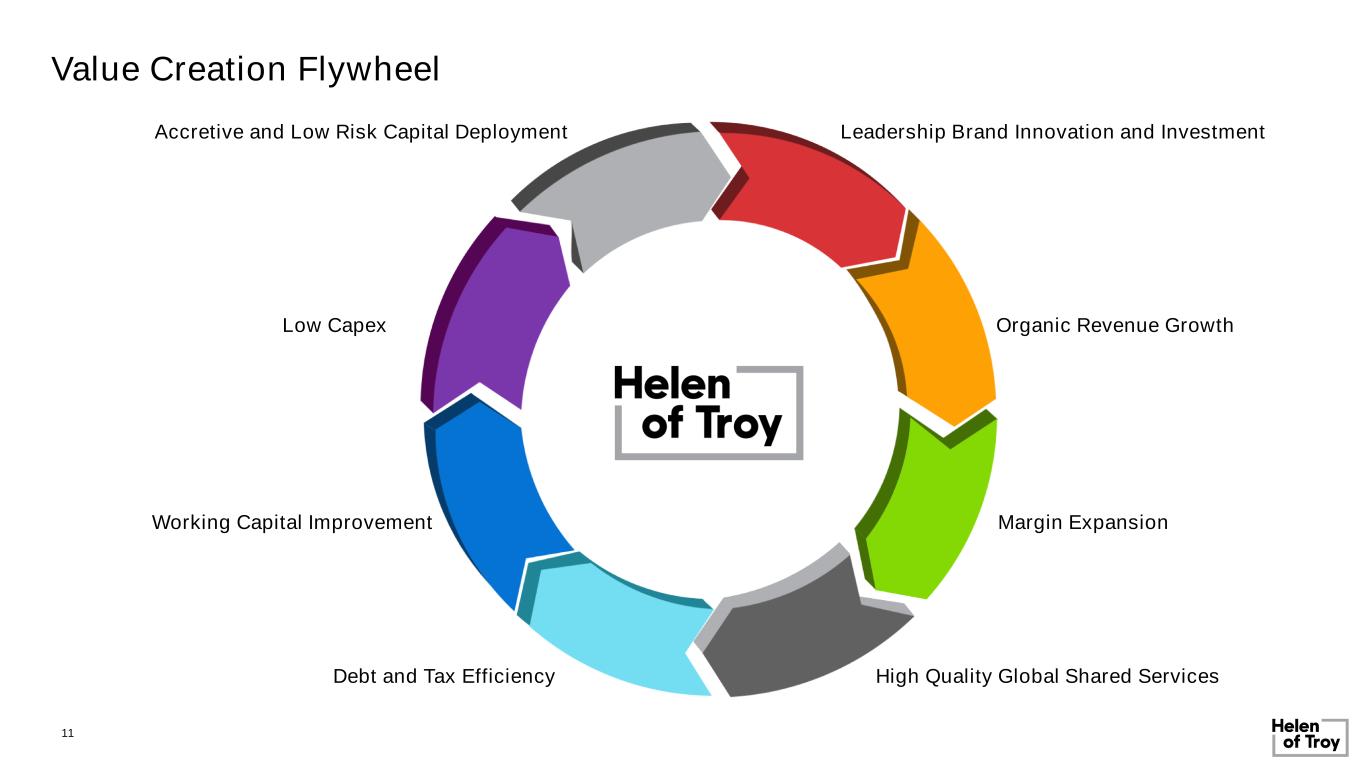

 
Value Creation Flywheel 11 Working Capital Improvement Margin Expansion Organic Revenue GrowthLow Capex Accretive and Low Risk Capital Deployment Leadership Brand Innovation and Investment High Quality Global Shared ServicesDebt and Tax Efficiency
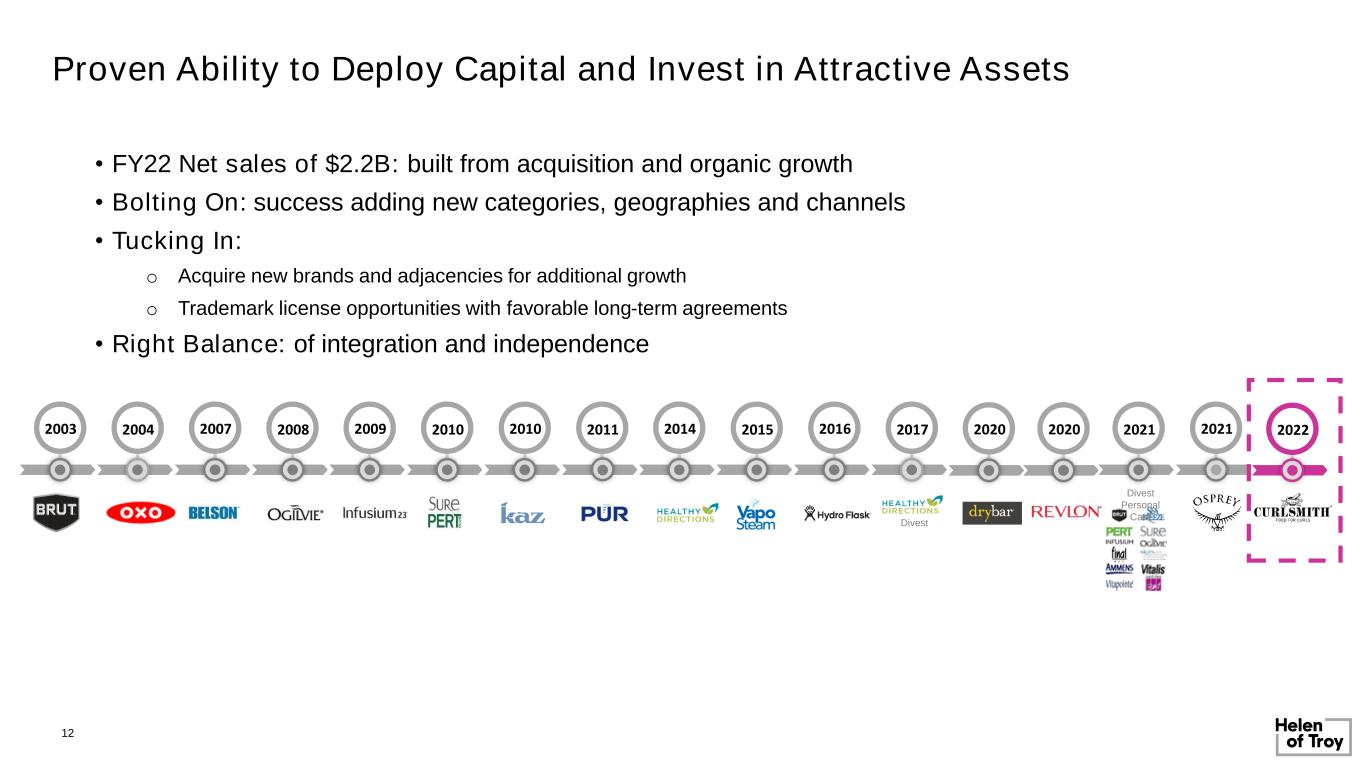

 
Proven Ability to Deploy Capital and Invest in Attractive Assets • FY22 Net sales of $2.2B: built from acquisition and organic growth • Bolting On: success adding new categories, geographies and channels • Tucking In: o Acquire new brands and adjacencies for additional growth o Trademark license opportunities with favorable long-term agreements • Right Balance: of integration and independence Divest 2009 2010 2016 202020142011 20152010200720042003 2008 2017 Divest Personal Care 2021 2021 20222020 12
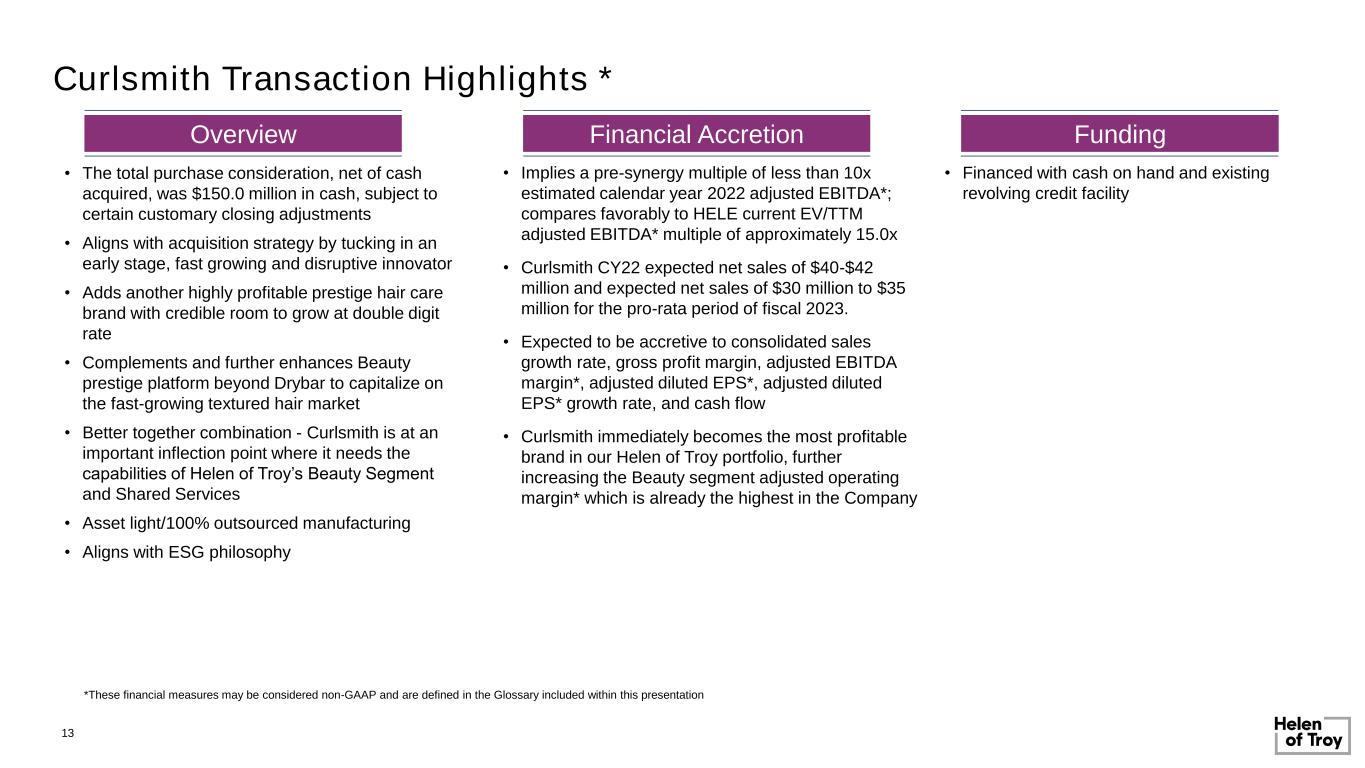

 
Curlsmith Transaction Highlights * • The total purchase consideration, net of cash acquired, was $150.0 million in cash, subject to certain customary closing adjustments • Aligns with acquisition strategy by tucking in an early stage, fast growing and disruptive innovator • Adds another highly profitable prestige hair care brand with credible room to grow at double digit rate • Complements and further enhances Beauty prestige platform beyond Drybar to capitalize on the fast-growing textured hair market • Better together combination - Curlsmith is at an important inflection point where it needs the capabilities of Helen of Troy’s Beauty Segment and Shared Services • Asset light/100% outsourced manufacturing • Aligns with ESG philosophy • Implies a pre-synergy multiple of less than 10x estimated calendar year 2022 adjusted EBITDA*; compares favorably to HELE current EV/TTM adjusted EBITDA* multiple of approximately 15.0x • Curlsmith CY22 expected net sales of $40-$42 million and expected net sales of $30 million to $35 million for the pro-rata period of fiscal 2023. • Expected to be accretive to consolidated sales growth rate, gross profit margin, adjusted EBITDA margin*, adjusted diluted EPS*, adjusted diluted EPS* growth rate, and cash flow • Curlsmith immediately becomes the most profitable brand in our Helen of Troy portfolio, further increasing the Beauty segment adjusted operating margin* which is already the highest in the Company • Financed with cash on hand and existing revolving credit facility Overview Financial Accretion Funding *These financial measures may be considered non-GAAP and are defined in the Glossary included within this presentation 13
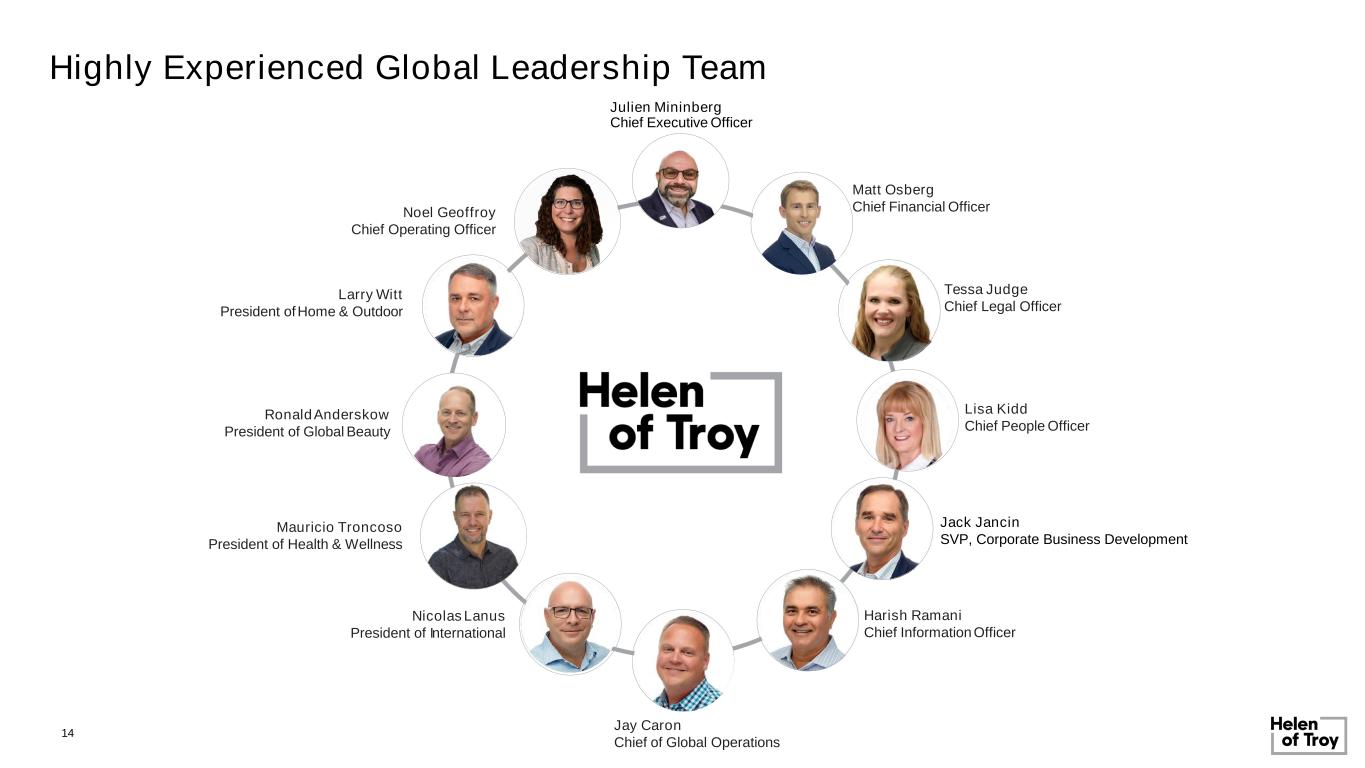

 
Highly Experienced Global Leadership Team 2. Conservative Approach to Debt Julien Mininberg Chief Executive Officer Jay Caron Chief of Global Operations Harish Ramani Chief Information Officer Lisa Kidd Chief People Officer Tessa Judge Chief Legal Officer Larry Witt President ofHome & Outdoor NicolasLanus President of International Matt Osberg Chief Financial OfficerNoel Geoffroy Chief Operating Officer RonaldAnderskow President of Global Beauty Mauricio Troncoso President of Health & Wellness Jack Jancin SVP, Corporate Business Development 14
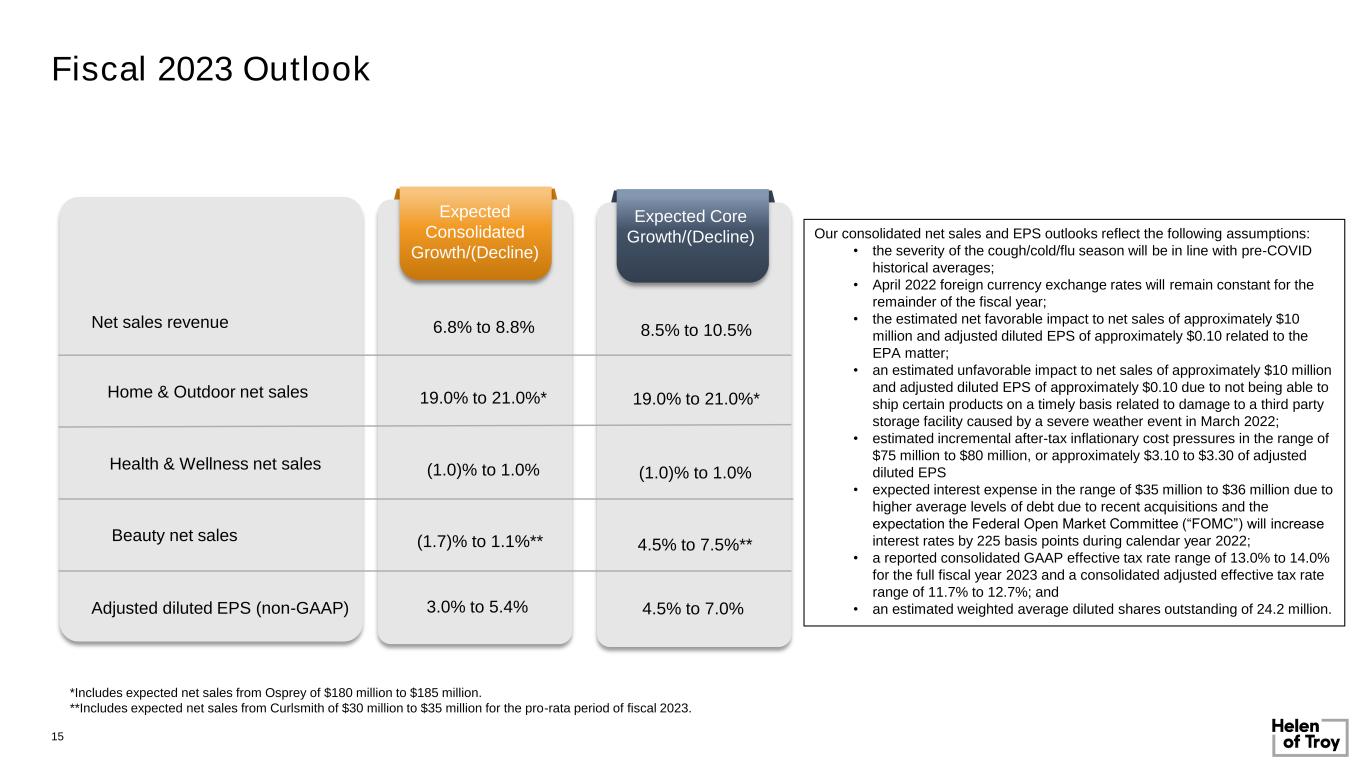

 
Fiscal 2023 Outlook 15 Consolidated Expected Consolidated Growth/(Decline) Expected Core Growth/(Decline) Health & Wellness net sales Adjusted diluted EPS (non-GAAP) Beauty net sales Home & Outdoor net sales 3.0% to 5.4% 4.5% to 7.0% Net sales revenue 6.8% to 8.8% 19.0% to 21.0%* (1.0)% to 1.0% (1.7)% to 1.1%** 8.5% to 10.5% 19.0% to 21.0%* (1.0)% to 1.0% 4.5% to 7.5%** Our consolidated net sales and EPS outlooks reflect the following assumptions: • the severity of the cough/cold/flu season will be in line with pre-COVID historical averages; • April 2022 foreign currency exchange rates will remain constant for the remainder of the fiscal year; • the estimated net favorable impact to net sales of approximately $10 million and adjusted diluted EPS of approximately $0.10 related to the EPA matter; • an estimated unfavorable impact to net sales of approximately $10 million and adjusted diluted EPS of approximately $0.10 due to not being able to ship certain products on a timely basis related to damage to a third party storage facility caused by a severe weather event in March 2022; • estimated incremental after-tax inflationary cost pressures in the range of $75 million to $80 million, or approximately $3.10 to $3.30 of adjusted diluted EPS • expected interest expense in the range of $35 million to $36 million due to higher average levels of debt due to recent acquisitions and the expectation the Federal Open Market Committee (“FOMC”) will increase interest rates by 225 basis points during calendar year 2022; • a reported consolidated GAAP effective tax rate range of 13.0% to 14.0% for the full fiscal year 2023 and a consolidated adjusted effective tax rate range of 11.7% to 12.7%; and • an estimated weighted average diluted shares outstanding of 24.2 million. *Includes expected net sales from Osprey of $180 million to $185 million. **Includes expected net sales from Curlsmith of $30 million to $35 million for the pro-rata period of fiscal 2023.
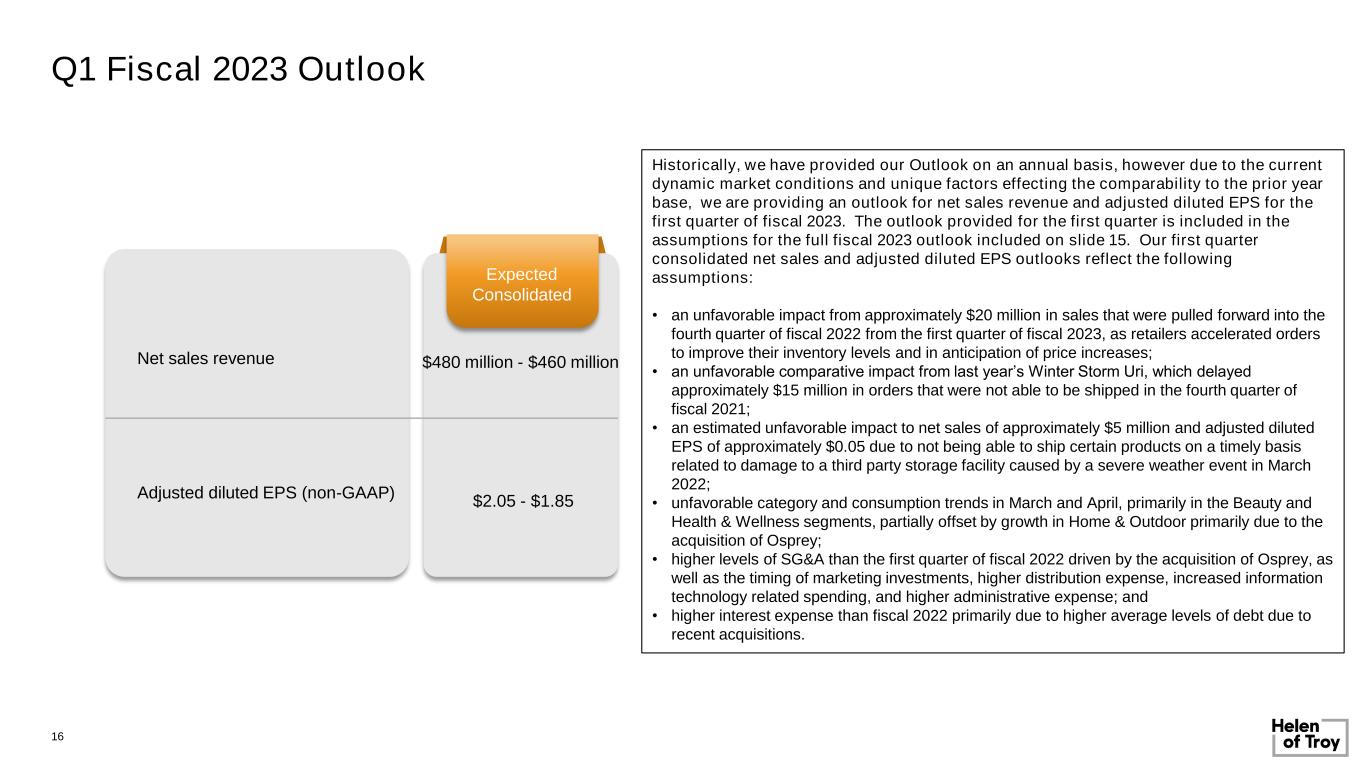

 
Q1 Fiscal 2023 Outlook 16 Consolidated Expected Consolidated Adjusted diluted EPS (non-GAAP) $2.05 - $1.85 Net sales revenue $480 million - $460 million Historically, we have provided our Outlook on an annual basis, however due to the current dynamic market conditions and unique factors effecting the comparability to the prior year base, we are providing an outlook for net sales revenue and adjusted diluted EPS for the first quarter of fiscal 2023. The outlook provided for the first quarter is included in the assumptions for the full fiscal 2023 outlook included on slide 15. Our first quarter consolidated net sales and adjusted diluted EPS outlooks reflect the following assumptions: • an unfavorable impact from approximately $20 million in sales that were pulled forward into the fourth quarter of fiscal 2022 from the first quarter of fiscal 2023, as retailers accelerated orders to improve their inventory levels and in anticipation of price increases; • an unfavorable comparative impact from last year’s Winter Storm Uri, which delayed approximately $15 million in orders that were not able to be shipped in the fourth quarter of fiscal 2021; • an estimated unfavorable impact to net sales of approximately $5 million and adjusted diluted EPS of approximately $0.05 due to not being able to ship certain products on a timely basis related to damage to a third party storage facility caused by a severe weather event in March 2022; • unfavorable category and consumption trends in March and April, primarily in the Beauty and Health & Wellness segments, partially offset by growth in Home & Outdoor primarily due to the acquisition of Osprey; • higher levels of SG&A than the first quarter of fiscal 2022 driven by the acquisition of Osprey, as well as the timing of marketing investments, higher distribution expense, increased information technology related spending, and higher administrative expense; and • higher interest expense than fiscal 2022 primarily due to higher average levels of debt due to recent acquisitions.
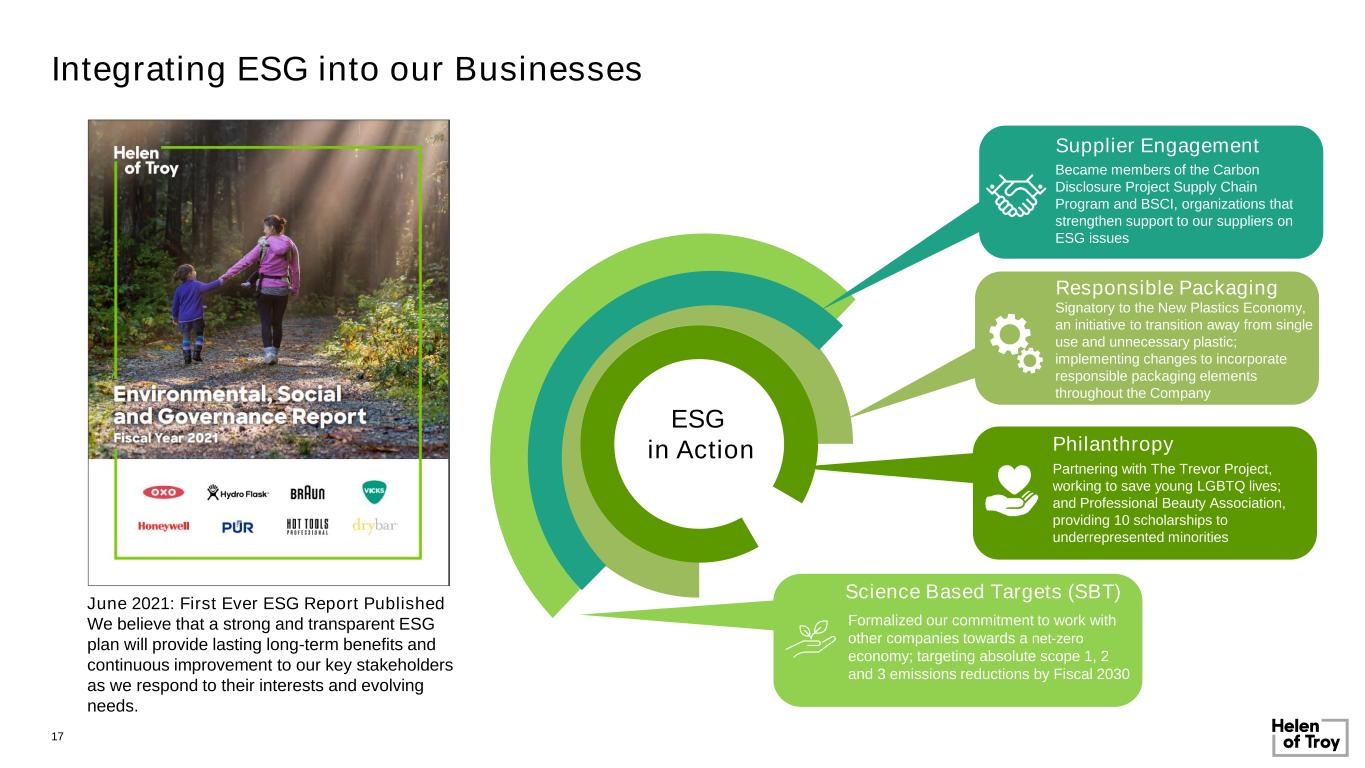

 
Signatory to the New Plastics Economy, an initiative to transition away from single use and unnecessary plastic; implementing changes to incorporate responsible packaging elements throughout the Company Integrating ESG into our Businesses June 2021: First Ever ESG Report Published We believe that a strong and transparent ESG plan will provide lasting long-term benefits and continuous improvement to our key stakeholders as we respond to their interests and evolving needs. Became members of the Carbon Disclosure Project Supply Chain Program and BSCI, organizations that strengthen support to our suppliers on ESG issues Partnering with The Trevor Project, working to save young LGBTQ lives; and Professional Beauty Association, providing 10 scholarships to underrepresented minorities Supplier Engagement Responsible Packaging Philanthropy ESG in Action 17 Science Based Targets (SBT) Formalized our commitment to work with other companies towards a net-zero economy; targeting absolute scope 1, 2 and 3 emissions reductions by Fiscal 2030


 
Appendix
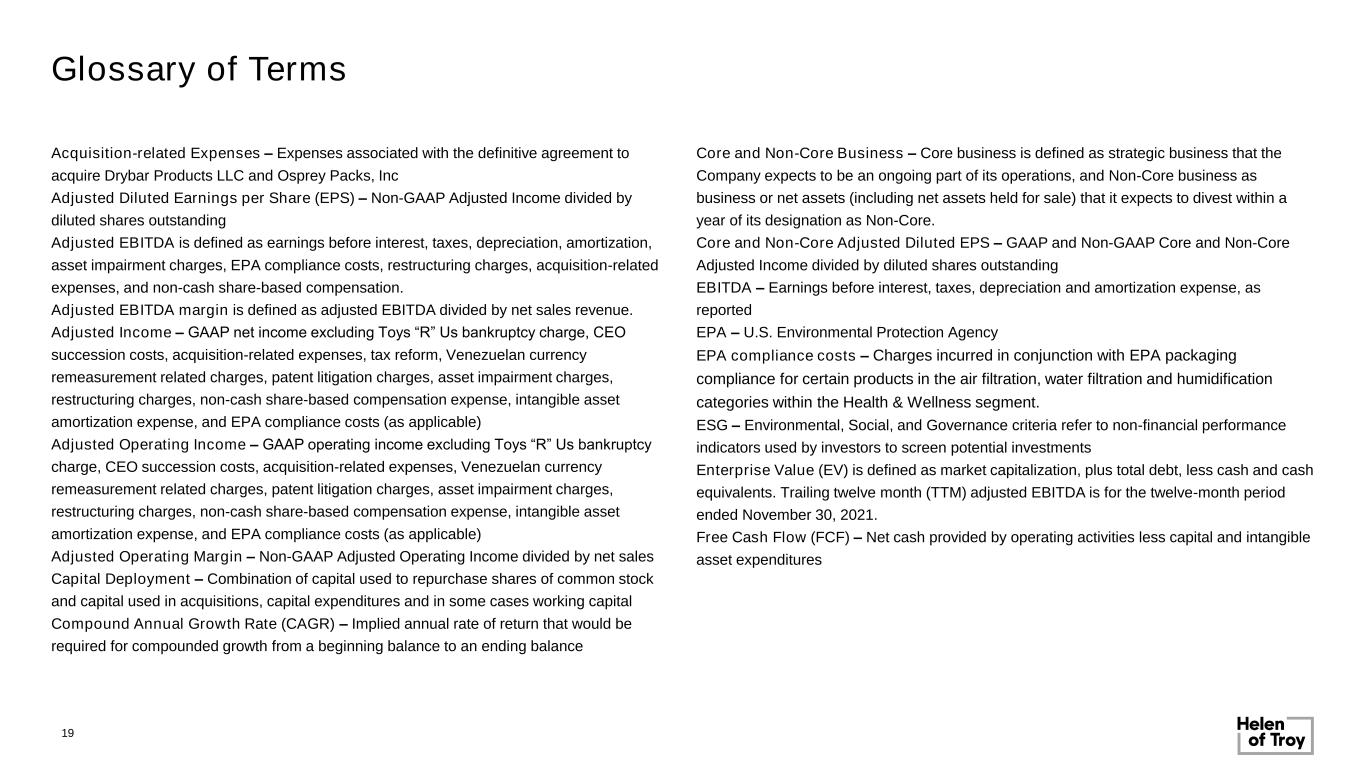

 
Glossary of Terms 19 Acquisition-related Expenses – Expenses associated with the definitive agreement to acquire Drybar Products LLC and Osprey Packs, Inc Adjusted Diluted Earnings per Share (EPS) – Non-GAAP Adjusted Income divided by diluted shares outstanding Adjusted EBITDA is defined as earnings before interest, taxes, depreciation, amortization, asset impairment charges, EPA compliance costs, restructuring charges, acquisition-related expenses, and non-cash share-based compensation. Adjusted EBITDA margin is defined as adjusted EBITDA divided by net sales revenue. Adjusted Income – GAAP net income excluding Toys “R” Us bankruptcy charge, CEO succession costs, acquisition-related expenses, tax reform, Venezuelan currency remeasurement related charges, patent litigation charges, asset impairment charges, restructuring charges, non-cash share-based compensation expense, intangible asset amortization expense, and EPA compliance costs (as applicable) Adjusted Operating Income – GAAP operating income excluding Toys “R” Us bankruptcy charge, CEO succession costs, acquisition-related expenses, Venezuelan currency remeasurement related charges, patent litigation charges, asset impairment charges, restructuring charges, non-cash share-based compensation expense, intangible asset amortization expense, and EPA compliance costs (as applicable) Adjusted Operating Margin – Non-GAAP Adjusted Operating Income divided by net sales Capital Deployment – Combination of capital used to repurchase shares of common stock and capital used in acquisitions, capital expenditures and in some cases working capital Compound Annual Growth Rate (CAGR) – Implied annual rate of return that would be required for compounded growth from a beginning balance to an ending balance Core and Non-Core Business – Core business is defined as strategic business that the Company expects to be an ongoing part of its operations, and Non-Core business as business or net assets (including net assets held for sale) that it expects to divest within a year of its designation as Non-Core. Core and Non-Core Adjusted Diluted EPS – GAAP and Non-GAAP Core and Non-Core Adjusted Income divided by diluted shares outstanding EBITDA – Earnings before interest, taxes, depreciation and amortization expense, as reported EPA – U.S. Environmental Protection Agency EPA compliance costs – Charges incurred in conjunction with EPA packaging compliance for certain products in the air filtration, water filtration and humidification categories within the Health & Wellness segment. ESG – Environmental, Social, and Governance criteria refer to non-financial performance indicators used by investors to screen potential investments Enterprise Value (EV) is defined as market capitalization, plus total debt, less cash and cash equivalents. Trailing twelve month (TTM) adjusted EBITDA is for the twelve-month period ended November 30, 2021. Free Cash Flow (FCF) – Net cash provided by operating activities less capital and intangible asset expenditures
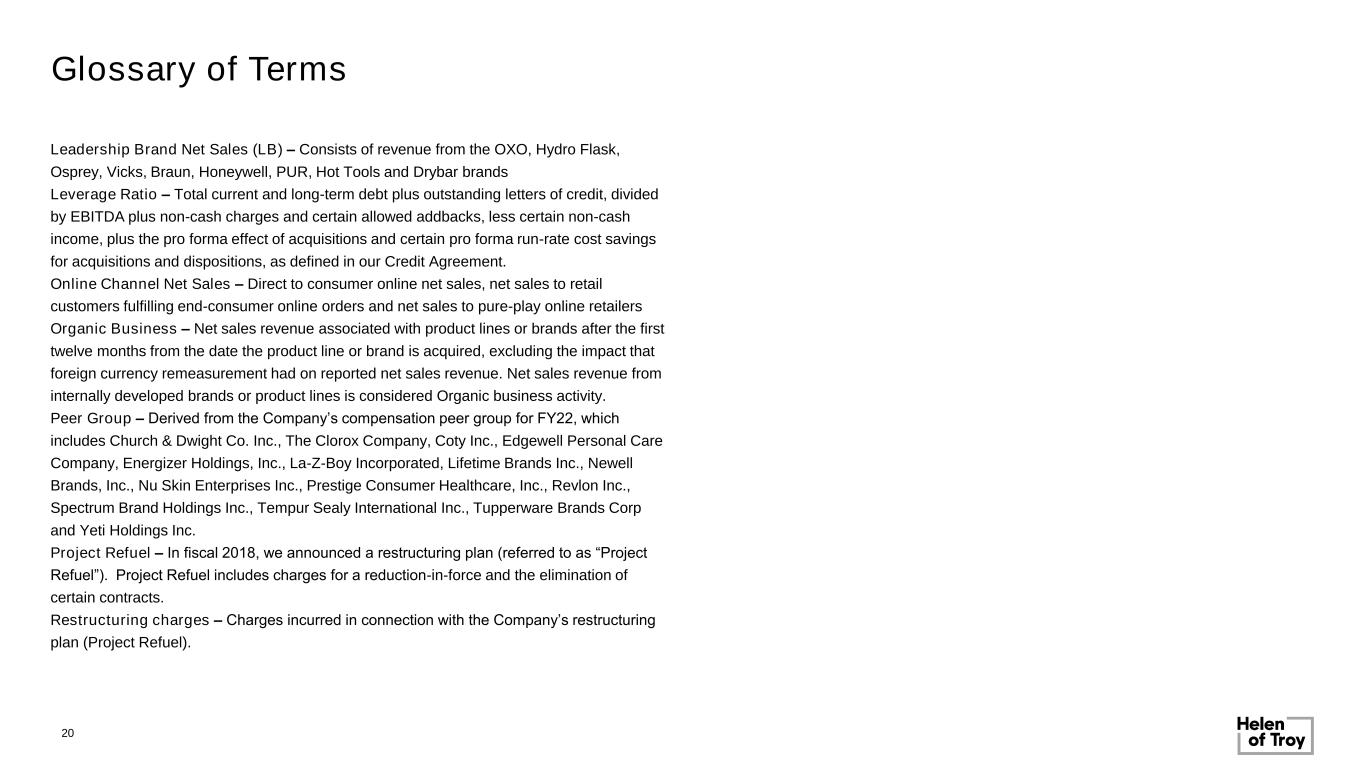

 
Glossary of Terms Leadership Brand Net Sales (LB) – Consists of revenue from the OXO, Hydro Flask, Osprey, Vicks, Braun, Honeywell, PUR, Hot Tools and Drybar brands Leverage Ratio – Total current and long-term debt plus outstanding letters of credit, divided by EBITDA plus non-cash charges and certain allowed addbacks, less certain non-cash income, plus the pro forma effect of acquisitions and certain pro forma run-rate cost savings for acquisitions and dispositions, as defined in our Credit Agreement. Online Channel Net Sales – Direct to consumer online net sales, net sales to retail customers fulfilling end-consumer online orders and net sales to pure-play online retailers Organic Business – Net sales revenue associated with product lines or brands after the first twelve months from the date the product line or brand is acquired, excluding the impact that foreign currency remeasurement had on reported net sales revenue. Net sales revenue from internally developed brands or product lines is considered Organic business activity. Peer Group – Derived from the Company’s compensation peer group for FY22, which includes Church & Dwight Co. Inc., The Clorox Company, Coty Inc., Edgewell Personal Care Company, Energizer Holdings, Inc., La-Z-Boy Incorporated, Lifetime Brands Inc., Newell Brands, Inc., Nu Skin Enterprises Inc., Prestige Consumer Healthcare, Inc., Revlon Inc., Spectrum Brand Holdings Inc., Tempur Sealy International Inc., Tupperware Brands Corp and Yeti Holdings Inc. Project Refuel – In fiscal 2018, we announced a restructuring plan (referred to as “Project Refuel”). Project Refuel includes charges for a reduction-in-force and the elimination of certain contracts. Restructuring charges – Charges incurred in connection with the Company’s restructuring plan (Project Refuel). 20
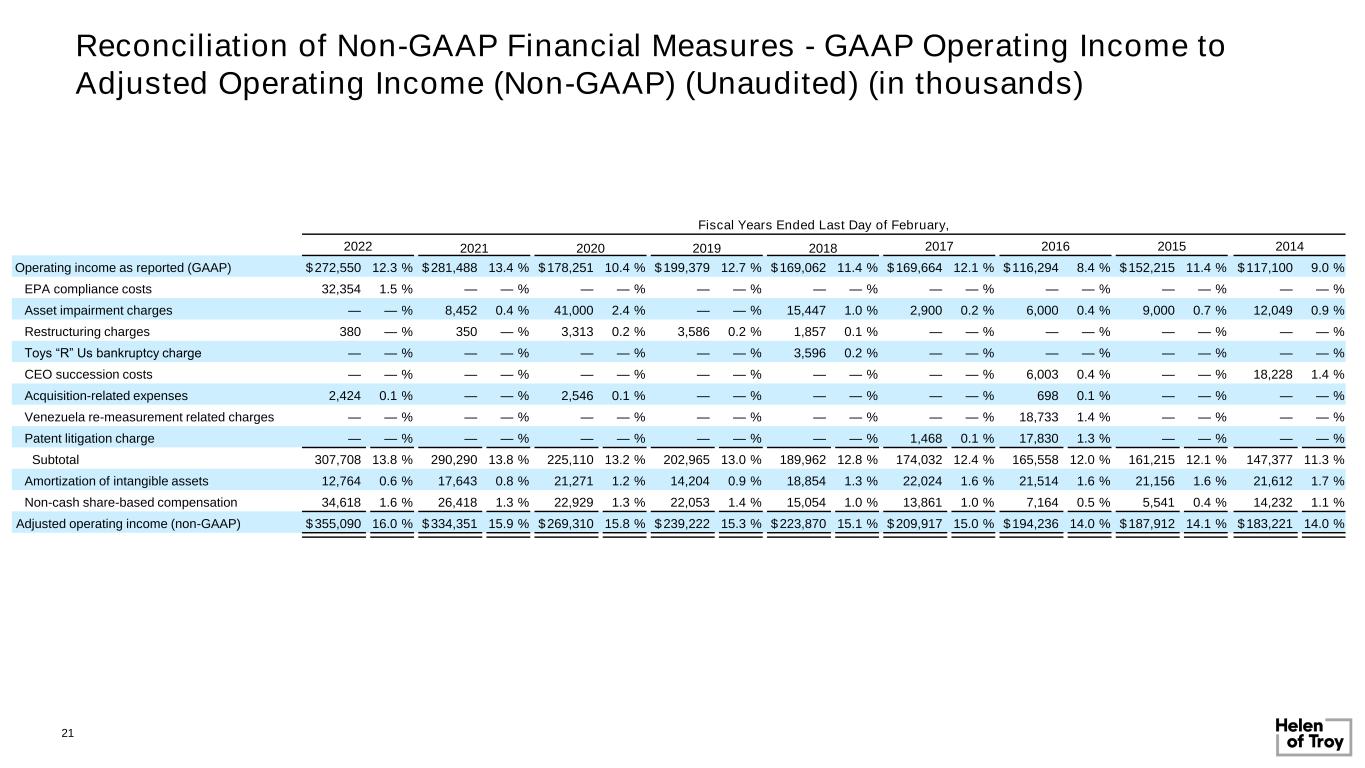

 
Reconciliation of Non-GAAP Financial Measures - GAAP Operating Income to Adjusted Operating Income (Non-GAAP) (Unaudited) (in thousands) Fiscal Years Ended Last Day of February, 2022 2021 2020 2019 2018 2017 2016 2015 2014 Operating income as reported (GAAP) $272,550 12.3 % $281,488 13.4 % $178,251 10.4 % $199,379 12.7 % $169,062 11.4 % $169,664 12.1 % $116,294 8.4 % $152,215 11.4 % $117,100 9.0 % EPA compliance costs 32,354 1.5 % — — % — — % — — % — — % — — % — — % — — % — — % Asset impairment charges — — % 8,452 0.4 % 41,000 2.4 % — — % 15,447 1.0 % 2,900 0.2 % 6,000 0.4 % 9,000 0.7 % 12,049 0.9 % Restructuring charges 380 — % 350 — % 3,313 0.2 % 3,586 0.2 % 1,857 0.1 % — — % — — % — — % — — % Toys “R” Us bankruptcy charge — — % — — % — — % — — % 3,596 0.2 % — — % — — % — — % — — % CEO succession costs — — % — — % — — % — — % — — % — — % 6,003 0.4 % — — % 18,228 1.4 % Acquisition-related expenses 2,424 0.1 % — — % 2,546 0.1 % — — % — — % — — % 698 0.1 % — — % — — % Venezuela re-measurement related charges — — % — — % — — % — — % — — % — — % 18,733 1.4 % — — % — — % Patent litigation charge — — % — — % — — % — — % — — % 1,468 0.1 % 17,830 1.3 % — — % — — % Subtotal 307,708 13.8 % 290,290 13.8 % 225,110 13.2 % 202,965 13.0 % 189,962 12.8 % 174,032 12.4 % 165,558 12.0 % 161,215 12.1 % 147,377 11.3 % Amortization of intangible assets 12,764 0.6 % 17,643 0.8 % 21,271 1.2 % 14,204 0.9 % 18,854 1.3 % 22,024 1.6 % 21,514 1.6 % 21,156 1.6 % 21,612 1.7 % Non-cash share-based compensation 34,618 1.6 % 26,418 1.3 % 22,929 1.3 % 22,053 1.4 % 15,054 1.0 % 13,861 1.0 % 7,164 0.5 % 5,541 0.4 % 14,232 1.1 % Adjusted operating income (non-GAAP) $355,090 16.0 % $334,351 15.9 % $269,310 15.8 % $239,222 15.3 % $223,870 15.1 % $209,917 15.0 % $194,236 14.0 % $187,912 14.1 % $183,221 14.0 % 21
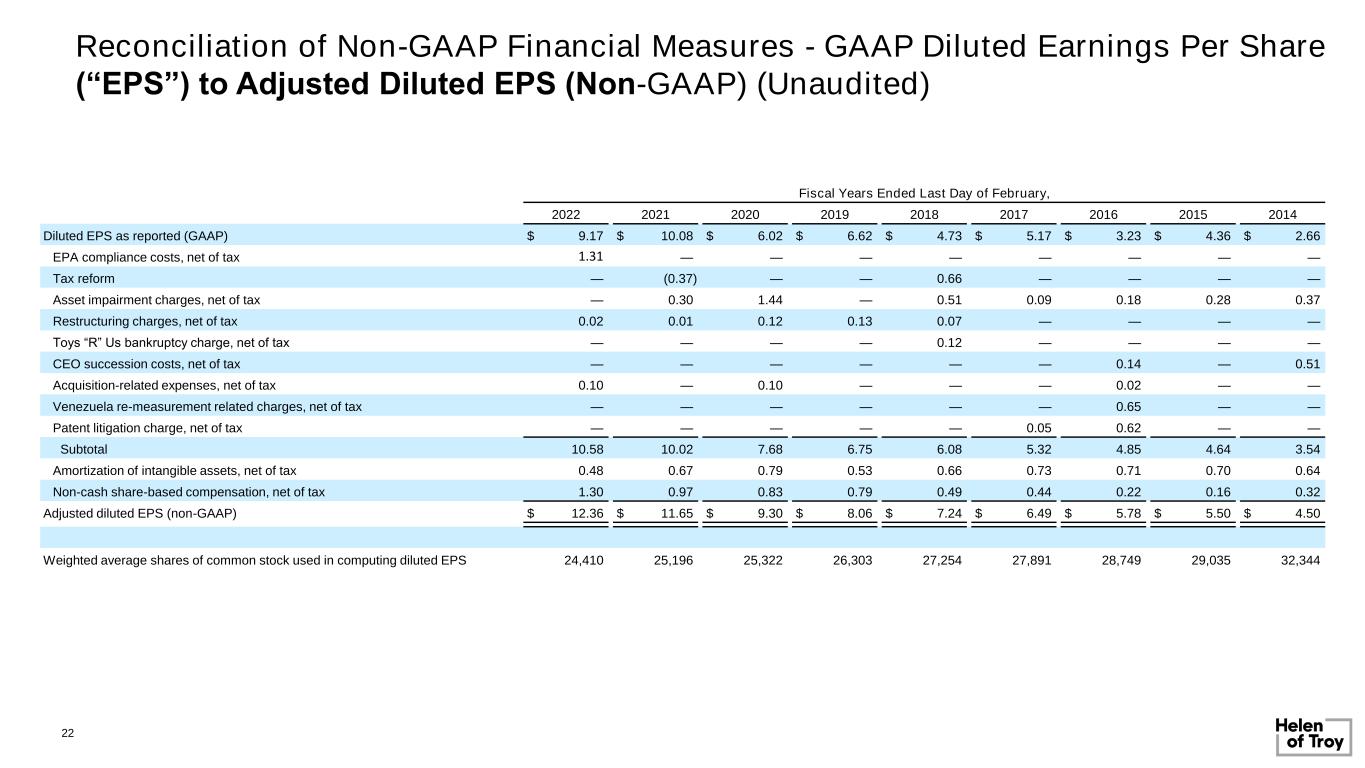

 
Reconciliation of Non-GAAP Financial Measures - GAAP Diluted Earnings Per Share (“EPS”) to Adjusted Diluted EPS (Non-GAAP) (Unaudited) Fiscal Years Ended Last Day of February, 2022 2021 2020 2019 2018 2017 2016 2015 2014 Diluted EPS as reported (GAAP) $ 9.17 $ 10.08 $ 6.02 $ 6.62 $ 4.73 $ 5.17 $ 3.23 $ 4.36 $ 2.66 EPA compliance costs, net of tax 1.31 — — — — — — — — Tax reform — (0.37) — — 0.66 — — — — Asset impairment charges, net of tax — 0.30 1.44 — 0.51 0.09 0.18 0.28 0.37 Restructuring charges, net of tax 0.02 0.01 0.12 0.13 0.07 — — — — Toys “R” Us bankruptcy charge, net of tax — — — — 0.12 — — — — CEO succession costs, net of tax — — — — — — 0.14 — 0.51 Acquisition-related expenses, net of tax 0.10 — 0.10 — — — 0.02 — — Venezuela re-measurement related charges, net of tax — — — — — — 0.65 — — Patent litigation charge, net of tax — — — — — 0.05 0.62 — — Subtotal 10.58 10.02 7.68 6.75 6.08 5.32 4.85 4.64 3.54 Amortization of intangible assets, net of tax 0.48 0.67 0.79 0.53 0.66 0.73 0.71 0.70 0.64 Non-cash share-based compensation, net of tax 1.30 0.97 0.83 0.79 0.49 0.44 0.22 0.16 0.32 Adjusted diluted EPS (non-GAAP) $ 12.36 $ 11.65 $ 9.30 $ 8.06 $ 7.24 $ 6.49 $ 5.78 $ 5.50 $ 4.50 Weighted average shares of common stock used in computing diluted EPS 24,410 25,196 25,322 26,303 27,254 27,891 28,749 29,035 32,344 22
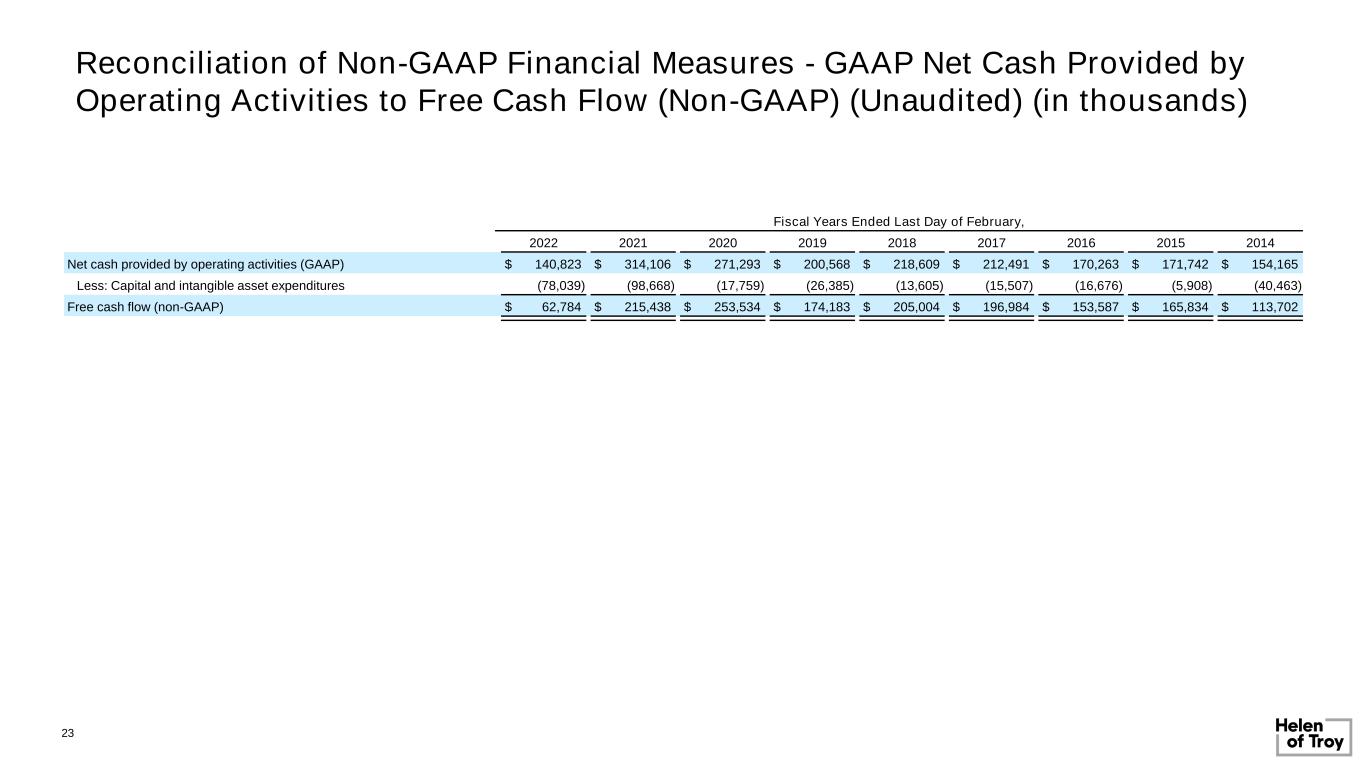

 
Reconciliation of Non-GAAP Financial Measures - GAAP Net Cash Provided by Operating Activities to Free Cash Flow (Non-GAAP) (Unaudited) (in thousands) Fiscal Years Ended Last Day of February, 2022 2021 2020 2019 2018 2017 2016 2015 2014 Net cash provided by operating activities (GAAP) $ 140,823 $ 314,106 $ 271,293 $ 200,568 $ 218,609 $ 212,491 $ 170,263 $ 171,742 $ 154,165 Less: Capital and intangible asset expenditures (78,039) (98,668) (17,759) (26,385) (13,605) (15,507) (16,676) (5,908) (40,463) Free cash flow (non-GAAP) $ 62,784 $ 215,438 $ 253,534 $ 174,183 $ 205,004 $ 196,984 $ 153,587 $ 165,834 $ 113,702 23
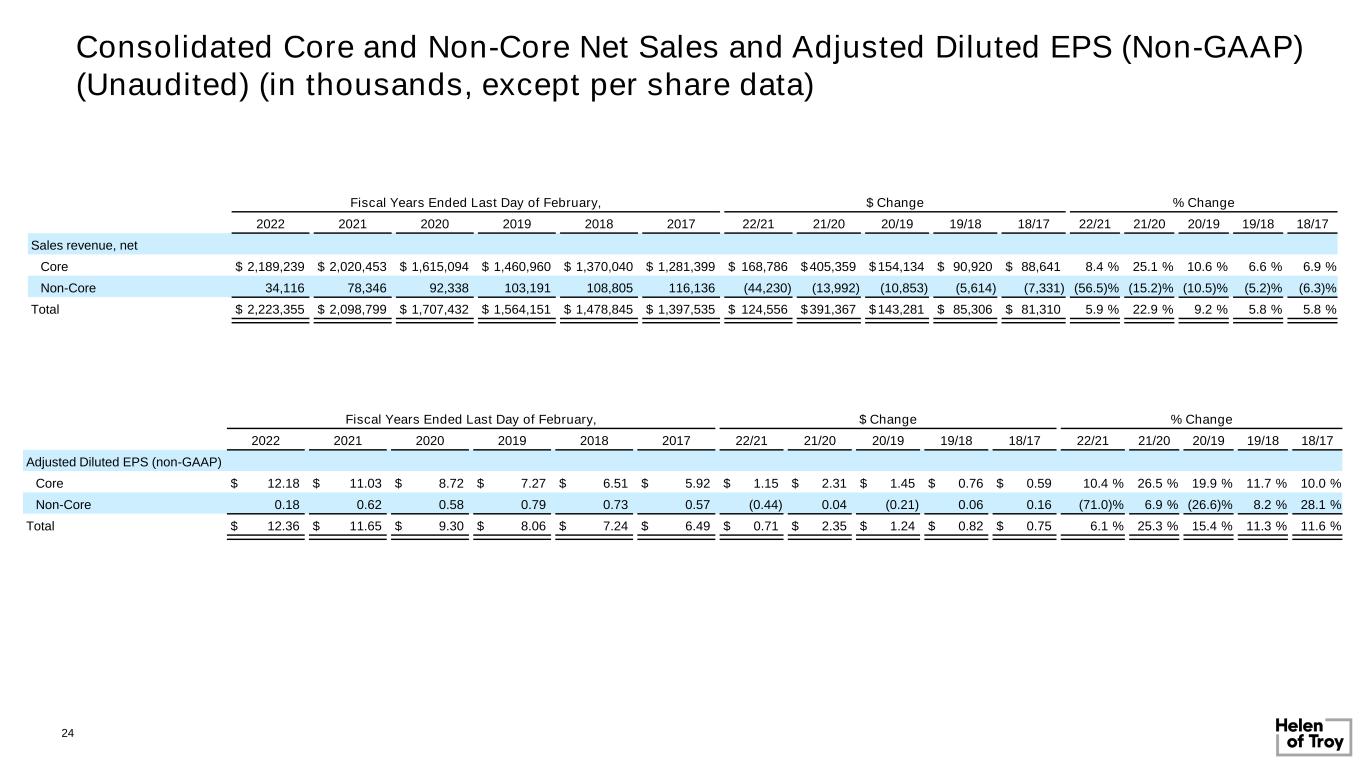

 
Consolidated Core and Non-Core Net Sales and Adjusted Diluted EPS (Non-GAAP) (Unaudited) (in thousands, except per share data) Fiscal Years Ended Last Day of February, $ Change % Change 2022 2021 2020 2019 2018 2017 22/21 21/20 20/19 19/18 18/17 22/21 21/20 20/19 19/18 18/17 Sales revenue, net Core $ 2,189,239 $ 2,020,453 $ 1,615,094 $ 1,460,960 $ 1,370,040 $ 1,281,399 $ 168,786 $405,359 $154,134 $ 90,920 $ 88,641 8.4 % 25.1 % 10.6 % 6.6 % 6.9 % Non-Core 34,116 78,346 92,338 103,191 108,805 116,136 (44,230) (13,992) (10,853) (5,614) (7,331) (56.5)% (15.2)% (10.5)% (5.2)% (6.3)% Total $ 2,223,355 $ 2,098,799 $ 1,707,432 $ 1,564,151 $ 1,478,845 $ 1,397,535 $ 124,556 $391,367 $143,281 $ 85,306 $ 81,310 5.9 % 22.9 % 9.2 % 5.8 % 5.8 % Fiscal Years Ended Last Day of February, $ Change % Change 2022 2021 2020 2019 2018 2017 22/21 21/20 20/19 19/18 18/17 22/21 21/20 20/19 19/18 18/17 Adjusted Diluted EPS (non-GAAP) Core $ 12.18 $ 11.03 $ 8.72 $ 7.27 $ 6.51 $ 5.92 $ 1.15 $ 2.31 $ 1.45 $ 0.76 $ 0.59 10.4 % 26.5 % 19.9 % 11.7 % 10.0 % Non-Core 0.18 0.62 0.58 0.79 0.73 0.57 (0.44) 0.04 (0.21) 0.06 0.16 (71.0)% 6.9 % (26.6)% 8.2 % 28.1 % Total $ 12.36 $ 11.65 $ 9.30 $ 8.06 $ 7.24 $ 6.49 $ 0.71 $ 2.35 $ 1.24 $ 0.82 $ 0.75 6.1 % 25.3 % 15.4 % 11.3 % 11.6 % 24
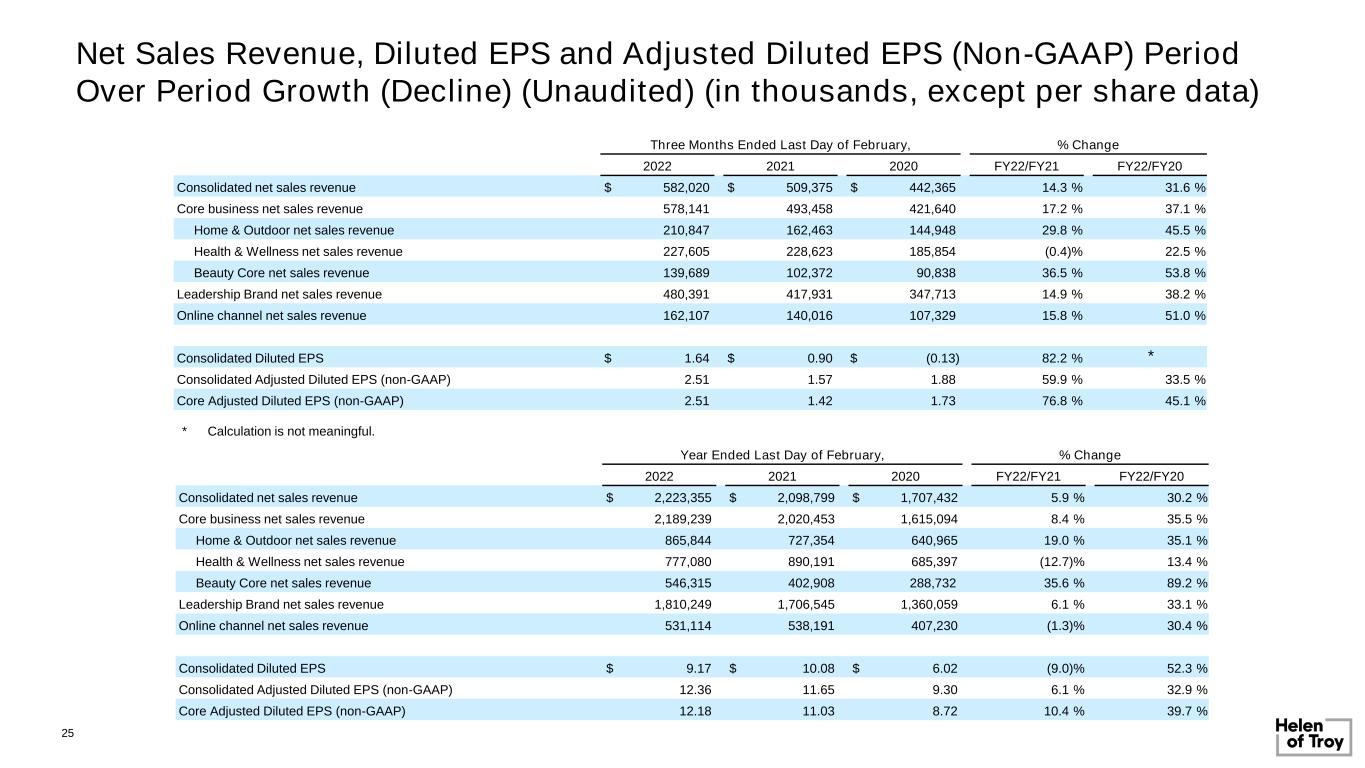

 
Net Sales Revenue, Diluted EPS and Adjusted Diluted EPS (Non-GAAP) Period Over Period Growth (Decline) (Unaudited) (in thousands, except per share data) Three Months Ended Last Day of February, % Change 2022 2021 2020 FY22/FY21 FY22/FY20 Consolidated net sales revenue $ 582,020 $ 509,375 $ 442,365 14.3 % 31.6 % Core business net sales revenue 578,141 493,458 421,640 17.2 % 37.1 % Home & Outdoor net sales revenue 210,847 162,463 144,948 29.8 % 45.5 % Health & Wellness net sales revenue 227,605 228,623 185,854 (0.4)% 22.5 % Beauty Core net sales revenue 139,689 102,372 90,838 36.5 % 53.8 % Leadership Brand net sales revenue 480,391 417,931 347,713 14.9 % 38.2 % Online channel net sales revenue 162,107 140,016 107,329 15.8 % 51.0 % Consolidated Diluted EPS $ 1.64 $ 0.90 $ (0.13) 82.2 % * Consolidated Adjusted Diluted EPS (non-GAAP) 2.51 1.57 1.88 59.9 % 33.5 % Core Adjusted Diluted EPS (non-GAAP) 2.51 1.42 1.73 76.8 % 45.1 % Year Ended Last Day of February, % Change 2022 2021 2020 FY22/FY21 FY22/FY20 Consolidated net sales revenue $ 2,223,355 $ 2,098,799 $ 1,707,432 5.9 % 30.2 % Core business net sales revenue 2,189,239 2,020,453 1,615,094 8.4 % 35.5 % Home & Outdoor net sales revenue 865,844 727,354 640,965 19.0 % 35.1 % Health & Wellness net sales revenue 777,080 890,191 685,397 (12.7)% 13.4 % Beauty Core net sales revenue 546,315 402,908 288,732 35.6 % 89.2 % Leadership Brand net sales revenue 1,810,249 1,706,545 1,360,059 6.1 % 33.1 % Online channel net sales revenue 531,114 538,191 407,230 (1.3)% 30.4 % Consolidated Diluted EPS $ 9.17 $ 10.08 $ 6.02 (9.0)% 52.3 % Consolidated Adjusted Diluted EPS (non-GAAP) 12.36 11.65 9.30 6.1 % 32.9 % Core Adjusted Diluted EPS (non-GAAP) 12.18 11.03 8.72 10.4 % 39.7 % 25 * Calculation is not meaningful.
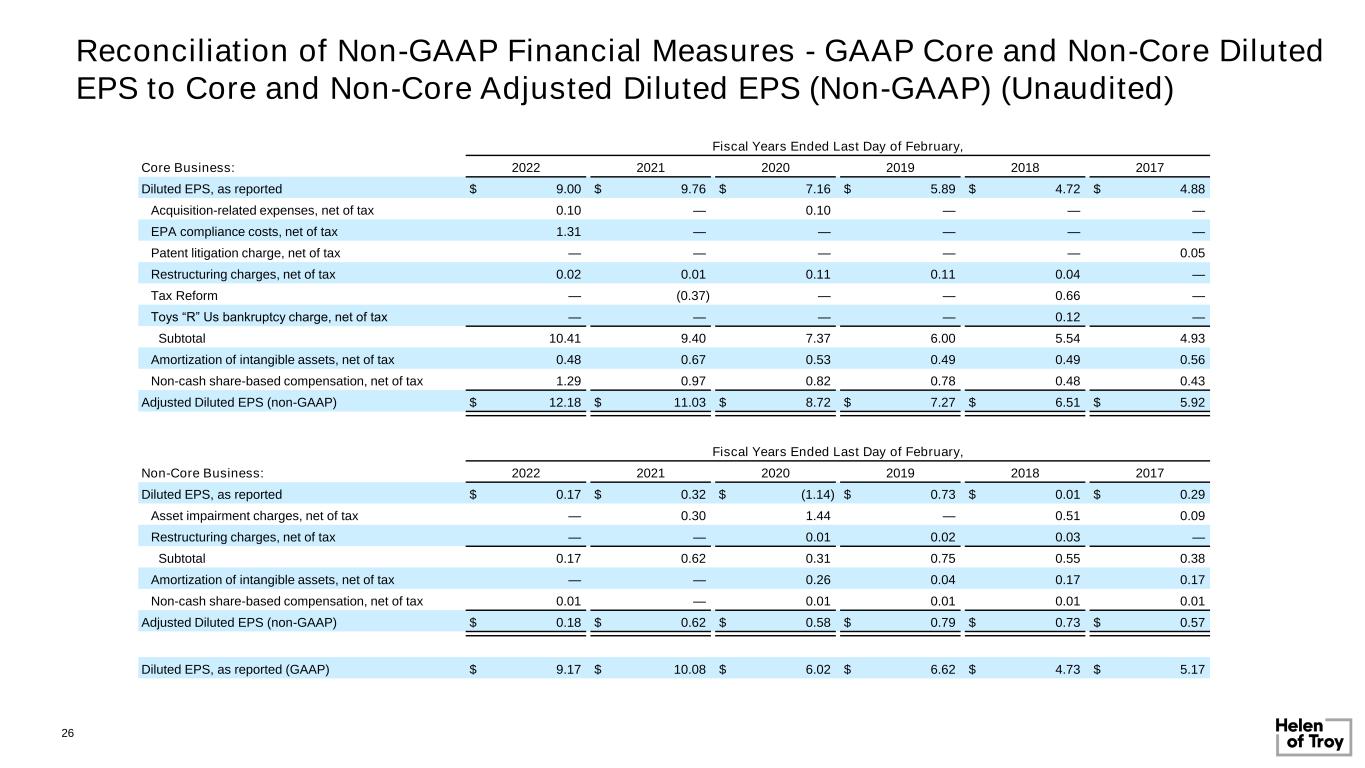

 
Reconciliation of Non-GAAP Financial Measures - GAAP Core and Non-Core Diluted EPS to Core and Non-Core Adjusted Diluted EPS (Non-GAAP) (Unaudited) Fiscal Years Ended Last Day of February, Core Business: 2022 2021 2020 2019 2018 2017 Diluted EPS, as reported $ 9.00 $ 9.76 $ 7.16 $ 5.89 $ 4.72 $ 4.88 Acquisition-related expenses, net of tax 0.10 — 0.10 — — — EPA compliance costs, net of tax 1.31 — — — — — Patent litigation charge, net of tax — — — — — 0.05 Restructuring charges, net of tax 0.02 0.01 0.11 0.11 0.04 — Tax Reform — (0.37) — — 0.66 — Toys “R” Us bankruptcy charge, net of tax — — — — 0.12 — Subtotal 10.41 9.40 7.37 6.00 5.54 4.93 Amortization of intangible assets, net of tax 0.48 0.67 0.53 0.49 0.49 0.56 Non-cash share-based compensation, net of tax 1.29 0.97 0.82 0.78 0.48 0.43 Adjusted Diluted EPS (non-GAAP) $ 12.18 $ 11.03 $ 8.72 $ 7.27 $ 6.51 $ 5.92 Fiscal Years Ended Last Day of February, Non-Core Business: 2022 2021 2020 2019 2018 2017 Diluted EPS, as reported $ 0.17 $ 0.32 $ (1.14) $ 0.73 $ 0.01 $ 0.29 Asset impairment charges, net of tax — 0.30 1.44 — 0.51 0.09 Restructuring charges, net of tax — — 0.01 0.02 0.03 — Subtotal 0.17 0.62 0.31 0.75 0.55 0.38 Amortization of intangible assets, net of tax — — 0.26 0.04 0.17 0.17 Non-cash share-based compensation, net of tax 0.01 — 0.01 0.01 0.01 0.01 Adjusted Diluted EPS (non-GAAP) $ 0.18 $ 0.62 $ 0.58 $ 0.79 $ 0.73 $ 0.57 Diluted EPS, as reported (GAAP) $ 9.17 $ 10.08 $ 6.02 $ 6.62 $ 4.73 $ 5.17 26
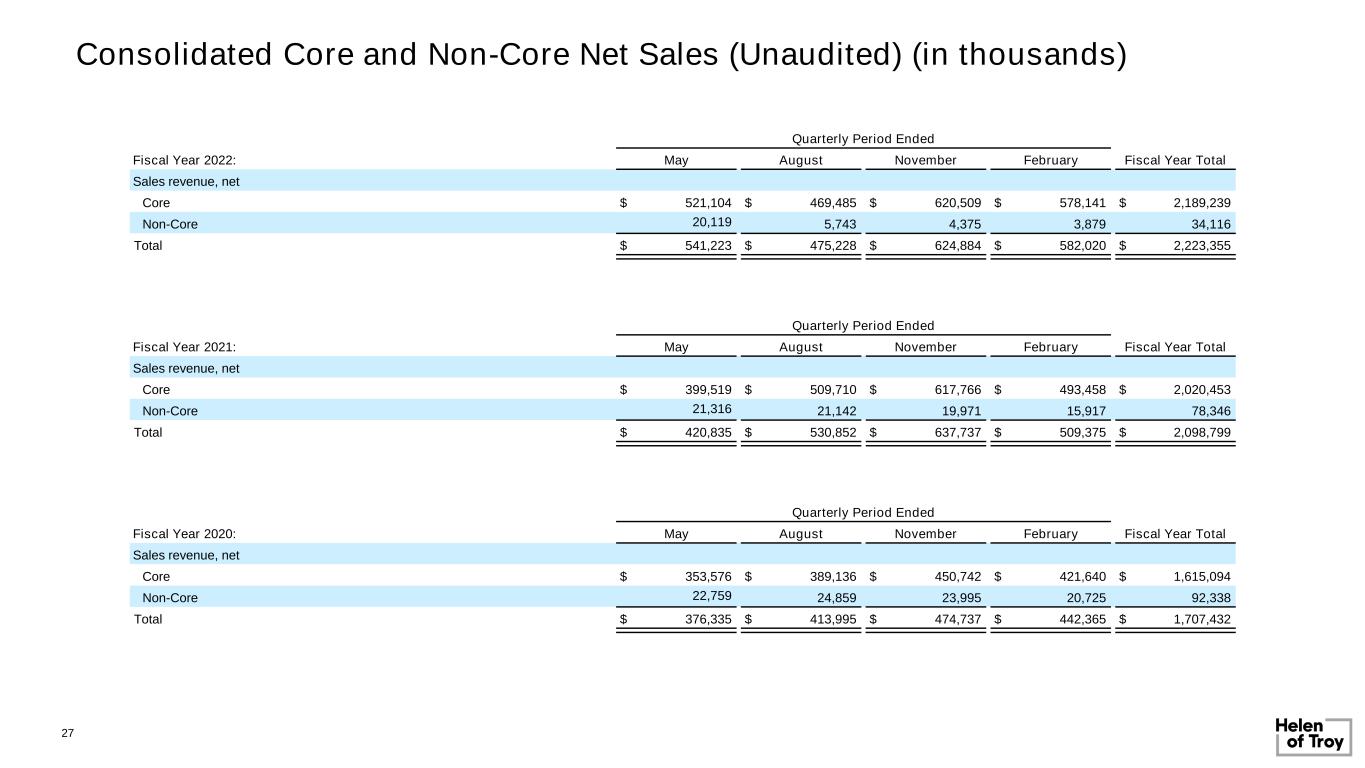

 
Consolidated Core and Non-Core Net Sales (Unaudited) (in thousands) Quarterly Period Ended Fiscal Year 2021: May August November February Fiscal Year Total Sales revenue, net Core $ 399,519 $ 509,710 $ 617,766 $ 493,458 $ 2,020,453 Non-Core 21,316 21,142 19,971 15,917 78,346 Total $ 420,835 $ 530,852 $ 637,737 $ 509,375 $ 2,098,799 Quarterly Period Ended Fiscal Year 2020: May August November February Fiscal Year Total Sales revenue, net Core $ 353,576 $ 389,136 $ 450,742 $ 421,640 $ 1,615,094 Non-Core 22,759 24,859 23,995 20,725 92,338 Total $ 376,335 $ 413,995 $ 474,737 $ 442,365 $ 1,707,432 Quarterly Period Ended Fiscal Year 2022: May August November February Fiscal Year Total Sales revenue, net Core $ 521,104 $ 469,485 $ 620,509 $ 578,141 $ 2,189,239 Non-Core 20,119 5,743 4,375 3,879 34,116 Total $ 541,223 $ 475,228 $ 624,884 $ 582,020 $ 2,223,355 27
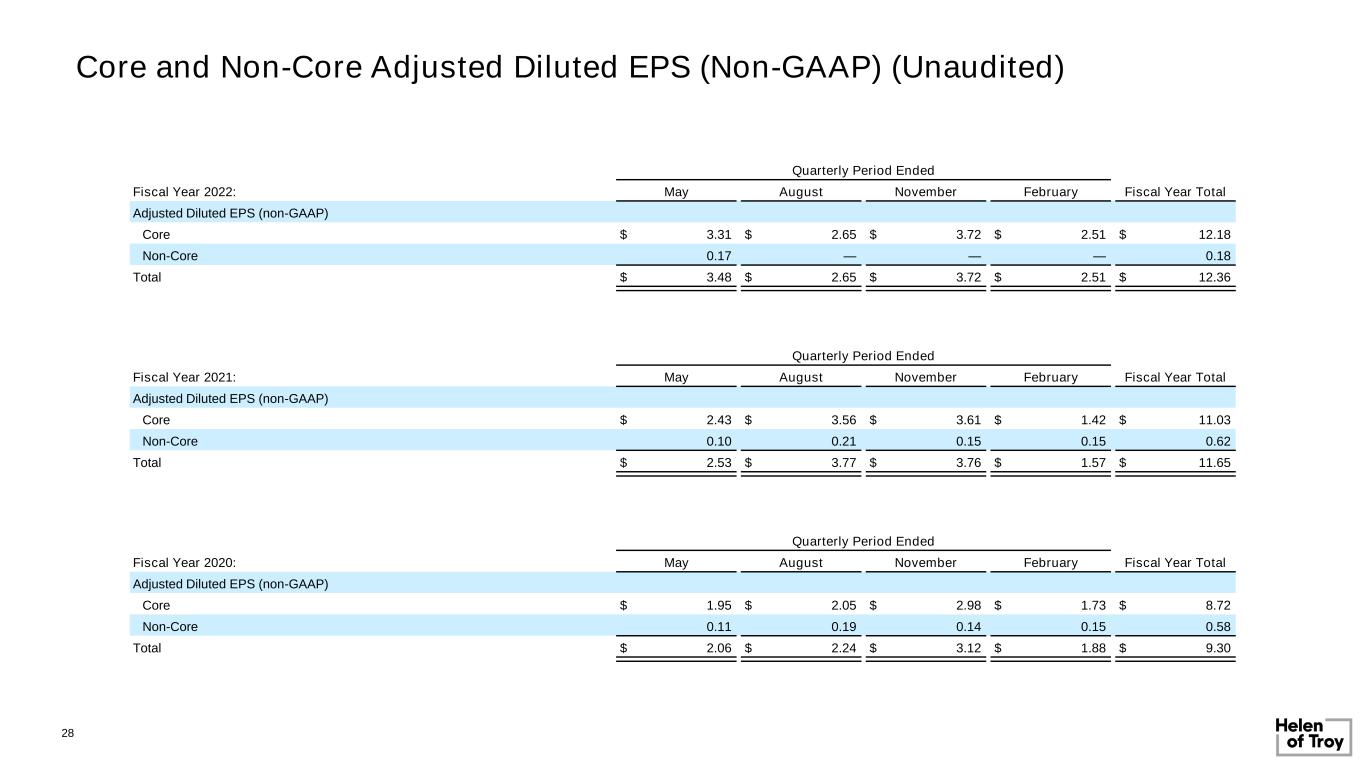

 
Quarterly Period Ended Fiscal Year 2021: May August November February Fiscal Year Total Adjusted Diluted EPS (non-GAAP) Core $ 2.43 $ 3.56 $ 3.61 $ 1.42 $ 11.03 Non-Core 0.10 0.21 0.15 0.15 0.62 Total $ 2.53 $ 3.77 $ 3.76 $ 1.57 $ 11.65 Quarterly Period Ended Fiscal Year 2020: May August November February Fiscal Year Total Adjusted Diluted EPS (non-GAAP) Core $ 1.95 $ 2.05 $ 2.98 $ 1.73 $ 8.72 Non-Core 0.11 0.19 0.14 0.15 0.58 Total $ 2.06 $ 2.24 $ 3.12 $ 1.88 $ 9.30 Core and Non-Core Adjusted Diluted EPS (Non-GAAP) (Unaudited) Quarterly Period Ended Fiscal Year 2022: May August November February Fiscal Year Total Adjusted Diluted EPS (non-GAAP) Core $ 3.31 $ 2.65 $ 3.72 $ 2.51 $ 12.18 Non-Core 0.17 — — — 0.18 Total $ 3.48 $ 2.65 $ 3.72 $ 2.51 $ 12.36 28
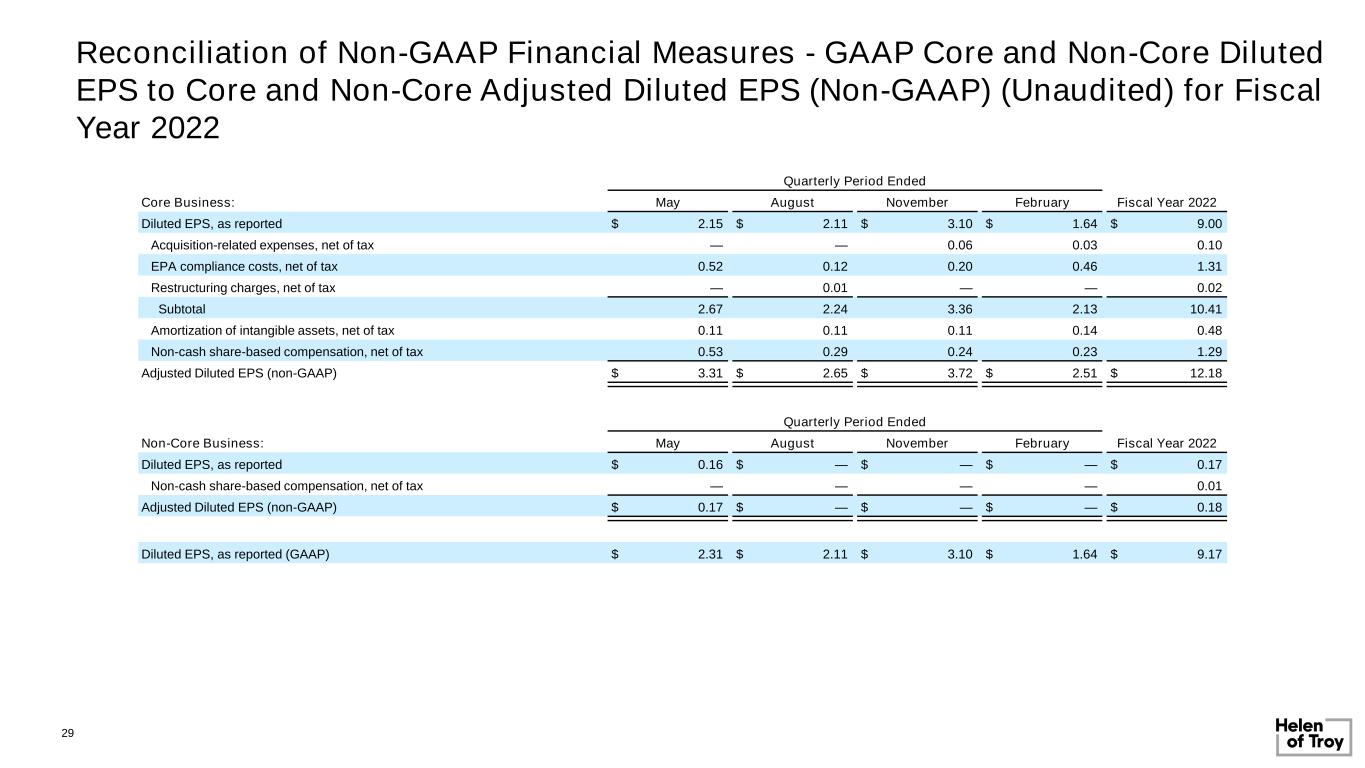

 
Reconciliation of Non-GAAP Financial Measures - GAAP Core and Non-Core Diluted EPS to Core and Non-Core Adjusted Diluted EPS (Non-GAAP) (Unaudited) for Fiscal Year 2022 Quarterly Period Ended Core Business: May August November February Fiscal Year 2022 Diluted EPS, as reported $ 2.15 $ 2.11 $ 3.10 $ 1.64 $ 9.00 Acquisition-related expenses, net of tax — — 0.06 0.03 0.10 EPA compliance costs, net of tax 0.52 0.12 0.20 0.46 1.31 Restructuring charges, net of tax — 0.01 — — 0.02 Subtotal 2.67 2.24 3.36 2.13 10.41 Amortization of intangible assets, net of tax 0.11 0.11 0.11 0.14 0.48 Non-cash share-based compensation, net of tax 0.53 0.29 0.24 0.23 1.29 Adjusted Diluted EPS (non-GAAP) $ 3.31 $ 2.65 $ 3.72 $ 2.51 $ 12.18 Quarterly Period Ended Non-Core Business: May August November February Fiscal Year 2022 Diluted EPS, as reported $ 0.16 $ — $ — $ — $ 0.17 Non-cash share-based compensation, net of tax — — — — 0.01 Adjusted Diluted EPS (non-GAAP) $ 0.17 $ — $ — $ — $ 0.18 Diluted EPS, as reported (GAAP) $ 2.31 $ 2.11 $ 3.10 $ 1.64 $ 9.17 29
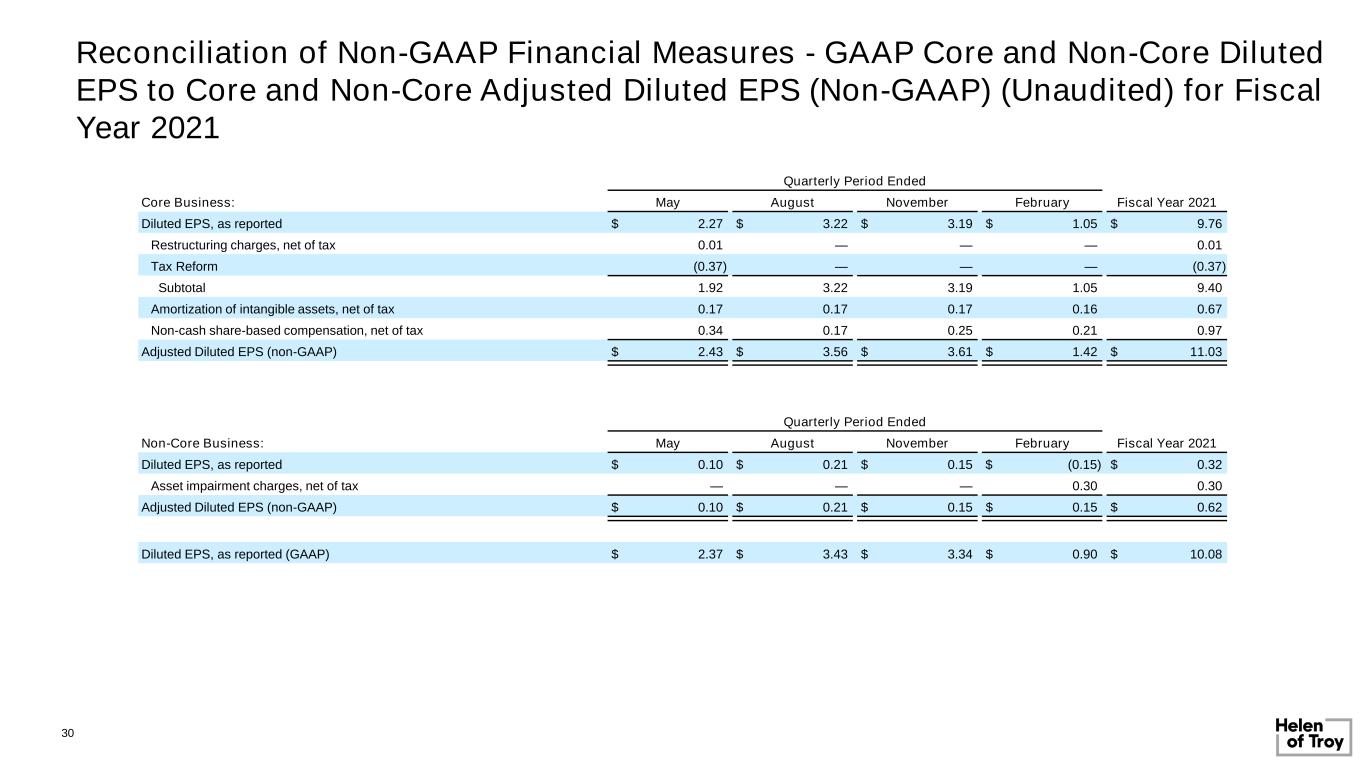

 
Reconciliation of Non-GAAP Financial Measures - GAAP Core and Non-Core Diluted EPS to Core and Non-Core Adjusted Diluted EPS (Non-GAAP) (Unaudited) for Fiscal Year 2021 Quarterly Period Ended Core Business: May August November February Fiscal Year 2021 Diluted EPS, as reported $ 2.27 $ 3.22 $ 3.19 $ 1.05 $ 9.76 Restructuring charges, net of tax 0.01 — — — 0.01 Tax Reform (0.37) — — — (0.37) Subtotal 1.92 3.22 3.19 1.05 9.40 Amortization of intangible assets, net of tax 0.17 0.17 0.17 0.16 0.67 Non-cash share-based compensation, net of tax 0.34 0.17 0.25 0.21 0.97 Adjusted Diluted EPS (non-GAAP) $ 2.43 $ 3.56 $ 3.61 $ 1.42 $ 11.03 Quarterly Period Ended Non-Core Business: May August November February Fiscal Year 2021 Diluted EPS, as reported $ 0.10 $ 0.21 $ 0.15 $ (0.15) $ 0.32 Asset impairment charges, net of tax — — — 0.30 0.30 Adjusted Diluted EPS (non-GAAP) $ 0.10 $ 0.21 $ 0.15 $ 0.15 $ 0.62 Diluted EPS, as reported (GAAP) $ 2.37 $ 3.43 $ 3.34 $ 0.90 $ 10.08 30
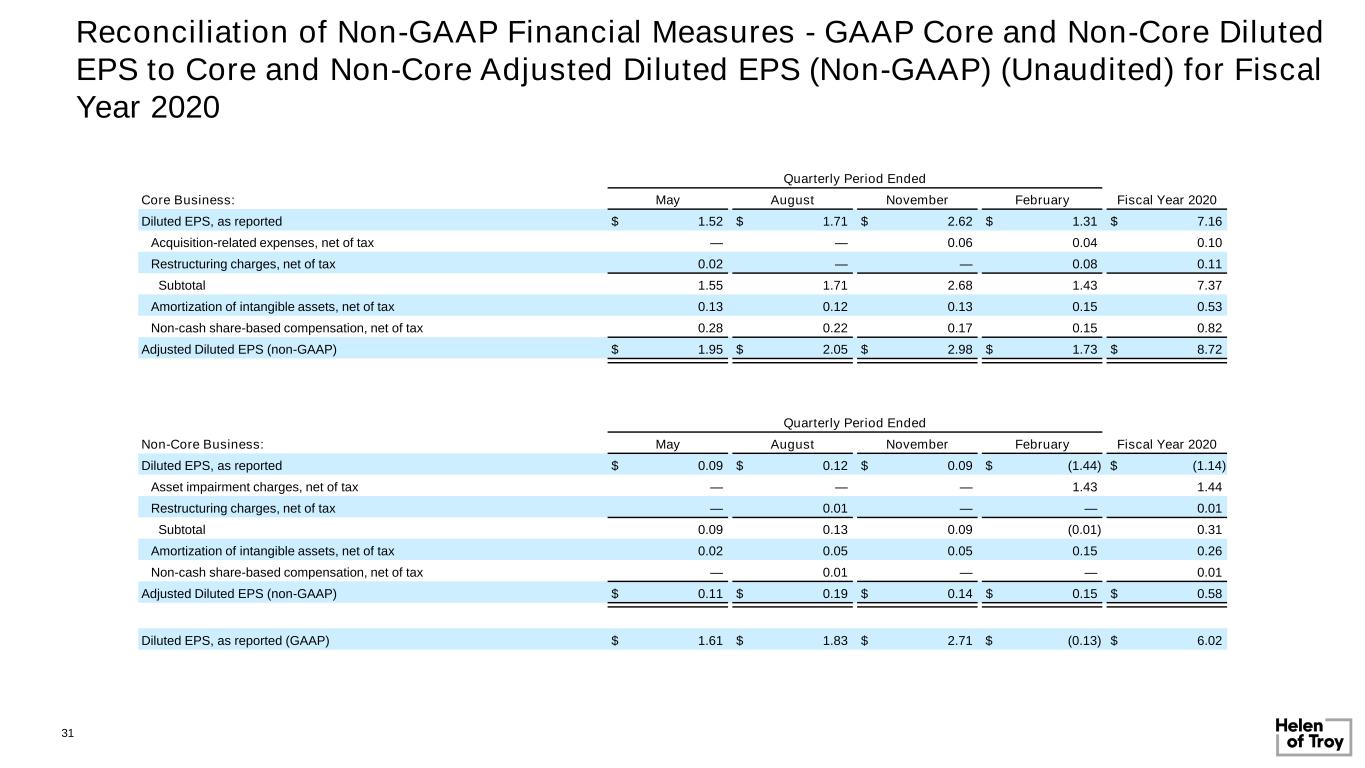

 
Reconciliation of Non-GAAP Financial Measures - GAAP Core and Non-Core Diluted EPS to Core and Non-Core Adjusted Diluted EPS (Non-GAAP) (Unaudited) for Fiscal Year 2020 Quarterly Period Ended Core Business: May August November February Fiscal Year 2020 Diluted EPS, as reported $ 1.52 $ 1.71 $ 2.62 $ 1.31 $ 7.16 Acquisition-related expenses, net of tax — — 0.06 0.04 0.10 Restructuring charges, net of tax 0.02 — — 0.08 0.11 Subtotal 1.55 1.71 2.68 1.43 7.37 Amortization of intangible assets, net of tax 0.13 0.12 0.13 0.15 0.53 Non-cash share-based compensation, net of tax 0.28 0.22 0.17 0.15 0.82 Adjusted Diluted EPS (non-GAAP) $ 1.95 $ 2.05 $ 2.98 $ 1.73 $ 8.72 Quarterly Period Ended Non-Core Business: May August November February Fiscal Year 2020 Diluted EPS, as reported $ 0.09 $ 0.12 $ 0.09 $ (1.44) $ (1.14) Asset impairment charges, net of tax — — — 1.43 1.44 Restructuring charges, net of tax — 0.01 — — 0.01 Subtotal 0.09 0.13 0.09 (0.01) 0.31 Amortization of intangible assets, net of tax 0.02 0.05 0.05 0.15 0.26 Non-cash share-based compensation, net of tax — 0.01 — — 0.01 Adjusted Diluted EPS (non-GAAP) $ 0.11 $ 0.19 $ 0.14 $ 0.15 $ 0.58 Diluted EPS, as reported (GAAP) $ 1.61 $ 1.83 $ 2.71 $ (0.13) $ 6.02 31
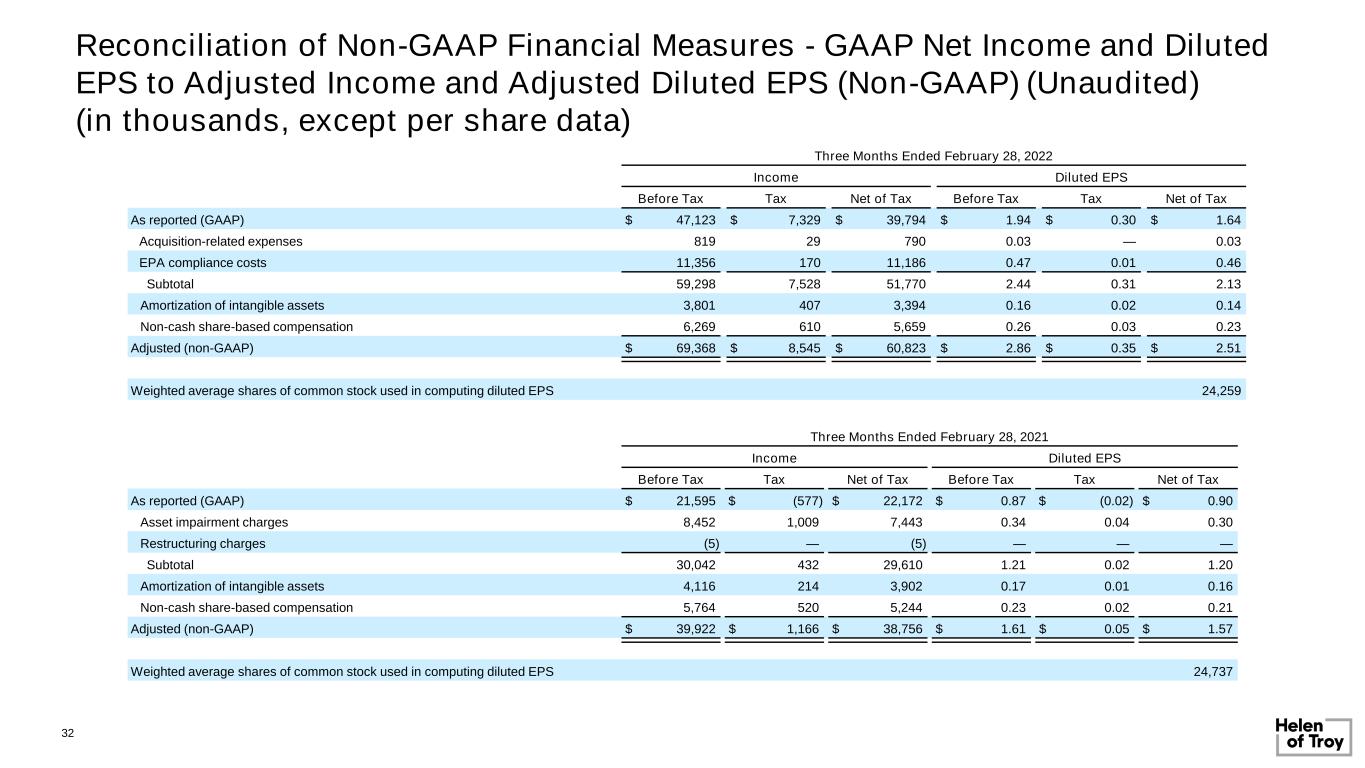

 
Reconciliation of Non-GAAP Financial Measures - GAAP Net Income and Diluted EPS to Adjusted Income and Adjusted Diluted EPS (Non-GAAP) (Unaudited) (in thousands, except per share data) Three Months Ended February 28, 2022 Income Diluted EPS Before Tax Tax Net of Tax Before Tax Tax Net of Tax As reported (GAAP) $ 47,123 $ 7,329 $ 39,794 $ 1.94 $ 0.30 $ 1.64 Acquisition-related expenses 819 29 790 0.03 — 0.03 EPA compliance costs 11,356 170 11,186 0.47 0.01 0.46 Subtotal 59,298 7,528 51,770 2.44 0.31 2.13 Amortization of intangible assets 3,801 407 3,394 0.16 0.02 0.14 Non-cash share-based compensation 6,269 610 5,659 0.26 0.03 0.23 Adjusted (non-GAAP) $ 69,368 $ 8,545 $ 60,823 $ 2.86 $ 0.35 $ 2.51 Weighted average shares of common stock used in computing diluted EPS 24,259 Three Months Ended February 28, 2021 Income Diluted EPS Before Tax Tax Net of Tax Before Tax Tax Net of Tax As reported (GAAP) $ 21,595 $ (577) $ 22,172 $ 0.87 $ (0.02) $ 0.90 Asset impairment charges 8,452 1,009 7,443 0.34 0.04 0.30 Restructuring charges (5) — (5) — — — Subtotal 30,042 432 29,610 1.21 0.02 1.20 Amortization of intangible assets 4,116 214 3,902 0.17 0.01 0.16 Non-cash share-based compensation 5,764 520 5,244 0.23 0.02 0.21 Adjusted (non-GAAP) $ 39,922 $ 1,166 $ 38,756 $ 1.61 $ 0.05 $ 1.57 Weighted average shares of common stock used in computing diluted EPS 24,737 32
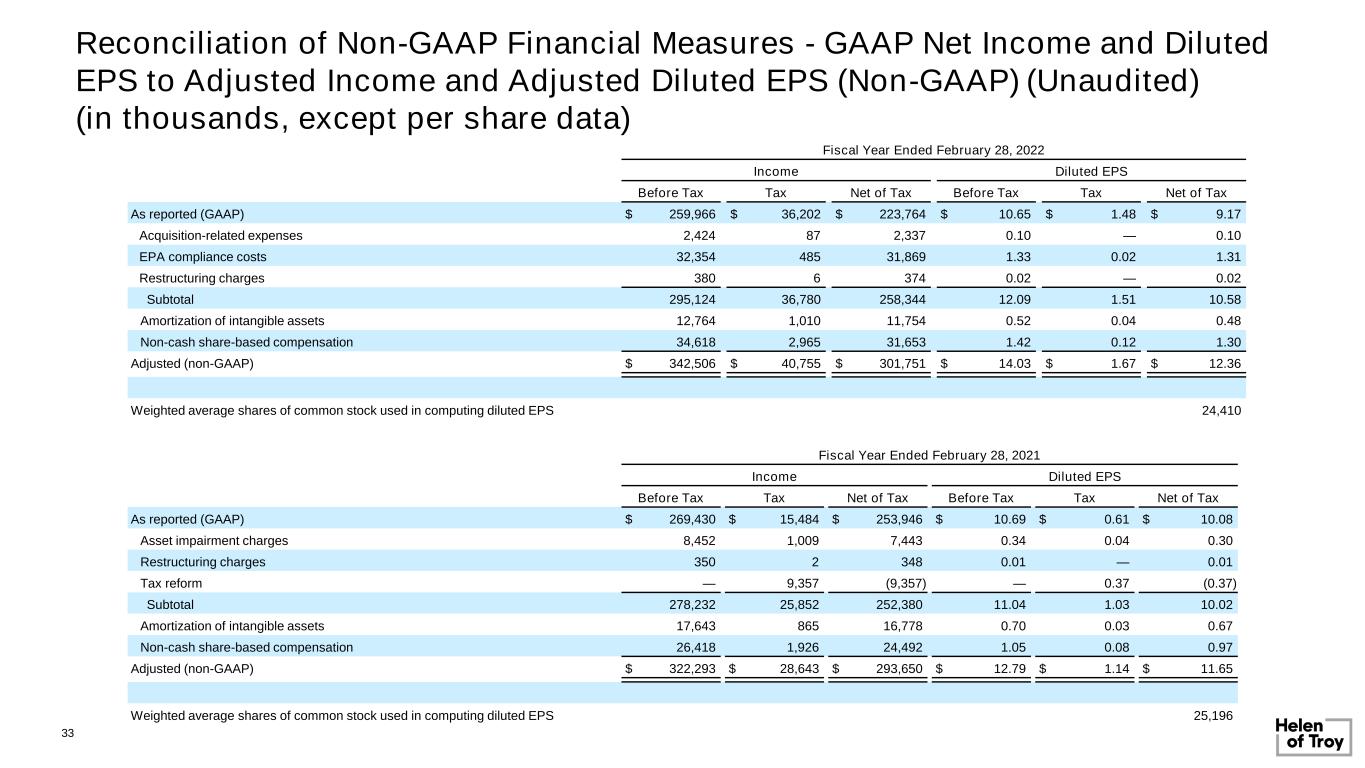

 
Reconciliation of Non-GAAP Financial Measures - GAAP Net Income and Diluted EPS to Adjusted Income and Adjusted Diluted EPS (Non-GAAP) (Unaudited) (in thousands, except per share data) Fiscal Year Ended February 28, 2022 Income Diluted EPS Before Tax Tax Net of Tax Before Tax Tax Net of Tax As reported (GAAP) $ 259,966 $ 36,202 $ 223,764 $ 10.65 $ 1.48 $ 9.17 Acquisition-related expenses 2,424 87 2,337 0.10 — 0.10 EPA compliance costs 32,354 485 31,869 1.33 0.02 1.31 Restructuring charges 380 6 374 0.02 — 0.02 Subtotal 295,124 36,780 258,344 12.09 1.51 10.58 Amortization of intangible assets 12,764 1,010 11,754 0.52 0.04 0.48 Non-cash share-based compensation 34,618 2,965 31,653 1.42 0.12 1.30 Adjusted (non-GAAP) $ 342,506 $ 40,755 $ 301,751 $ 14.03 $ 1.67 $ 12.36 Weighted average shares of common stock used in computing diluted EPS 24,410 Fiscal Year Ended February 28, 2021 Income Diluted EPS Before Tax Tax Net of Tax Before Tax Tax Net of Tax As reported (GAAP) $ 269,430 $ 15,484 $ 253,946 $ 10.69 $ 0.61 $ 10.08 Asset impairment charges 8,452 1,009 7,443 0.34 0.04 0.30 Restructuring charges 350 2 348 0.01 — 0.01 Tax reform — 9,357 (9,357) — 0.37 (0.37) Subtotal 278,232 25,852 252,380 11.04 1.03 10.02 Amortization of intangible assets 17,643 865 16,778 0.70 0.03 0.67 Non-cash share-based compensation 26,418 1,926 24,492 1.05 0.08 0.97 Adjusted (non-GAAP) $ 322,293 $ 28,643 $ 293,650 $ 12.79 $ 1.14 $ 11.65 Weighted average shares of common stock used in computing diluted EPS 25,196 33
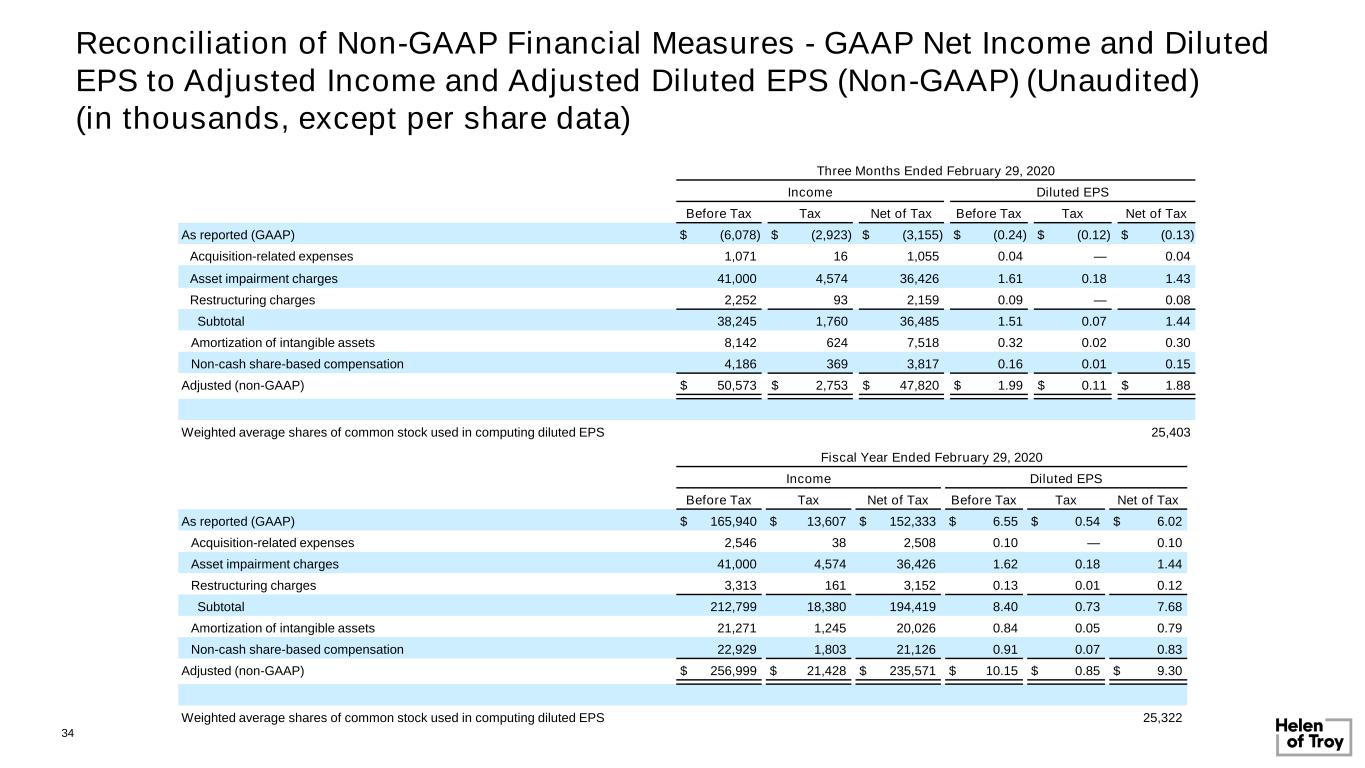

 
Reconciliation of Non-GAAP Financial Measures - GAAP Net Income and Diluted EPS to Adjusted Income and Adjusted Diluted EPS (Non-GAAP) (Unaudited) (in thousands, except per share data) Three Months Ended February 29, 2020 Income Diluted EPS Before Tax Tax Net of Tax Before Tax Tax Net of Tax As reported (GAAP) $ (6,078) $ (2,923) $ (3,155) $ (0.24) $ (0.12) $ (0.13) Acquisition-related expenses 1,071 16 1,055 0.04 — 0.04 Asset impairment charges 41,000 4,574 36,426 1.61 0.18 1.43 Restructuring charges 2,252 93 2,159 0.09 — 0.08 Subtotal 38,245 1,760 36,485 1.51 0.07 1.44 Amortization of intangible assets 8,142 624 7,518 0.32 0.02 0.30 Non-cash share-based compensation 4,186 369 3,817 0.16 0.01 0.15 Adjusted (non-GAAP) $ 50,573 $ 2,753 $ 47,820 $ 1.99 $ 0.11 $ 1.88 Weighted average shares of common stock used in computing diluted EPS 25,403 Fiscal Year Ended February 29, 2020 Income Diluted EPS Before Tax Tax Net of Tax Before Tax Tax Net of Tax As reported (GAAP) $ 165,940 $ 13,607 $ 152,333 $ 6.55 $ 0.54 $ 6.02 Acquisition-related expenses 2,546 38 2,508 0.10 — 0.10 Asset impairment charges 41,000 4,574 36,426 1.62 0.18 1.44 Restructuring charges 3,313 161 3,152 0.13 0.01 0.12 Subtotal 212,799 18,380 194,419 8.40 0.73 7.68 Amortization of intangible assets 21,271 1,245 20,026 0.84 0.05 0.79 Non-cash share-based compensation 22,929 1,803 21,126 0.91 0.07 0.83 Adjusted (non-GAAP) $ 256,999 $ 21,428 $ 235,571 $ 10.15 $ 0.85 $ 9.30 Weighted average shares of common stock used in computing diluted EPS 25,322 34
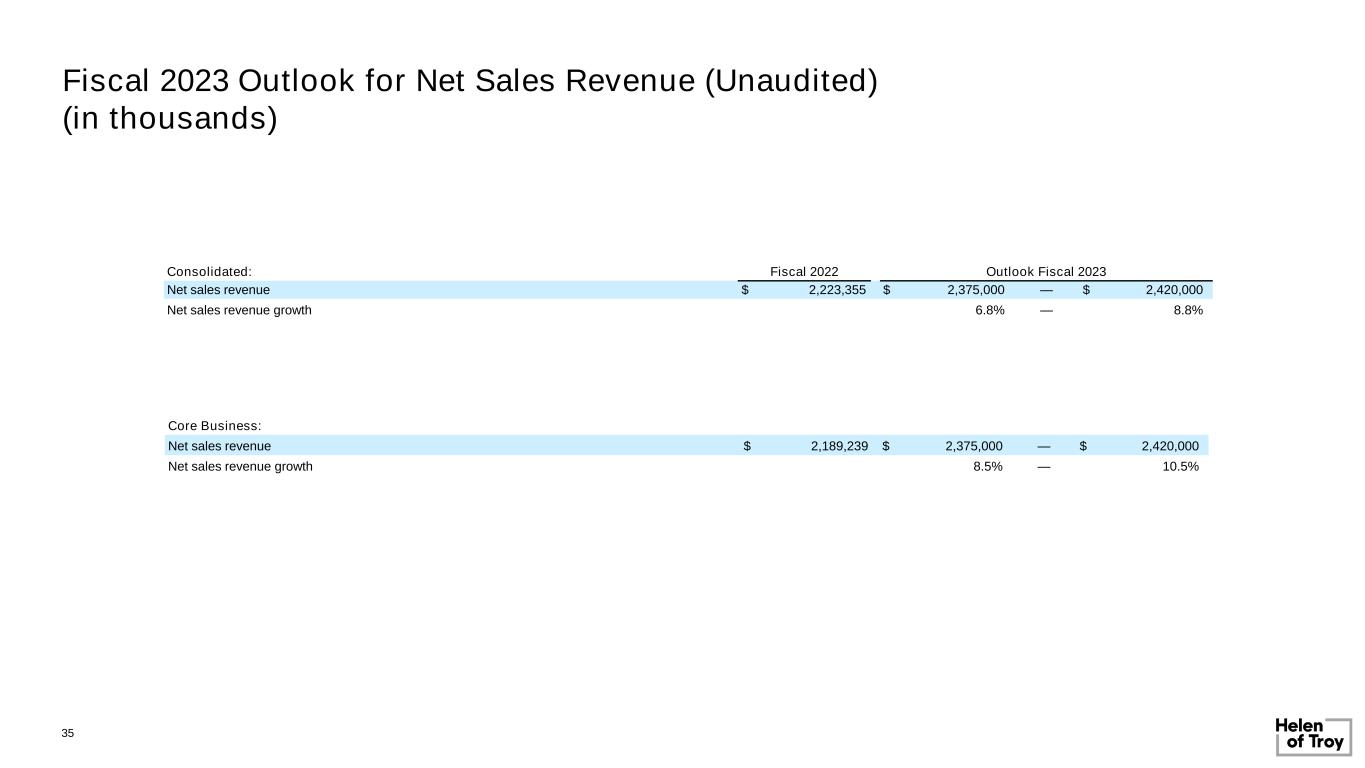

 
Fiscal 2023 Outlook for Net Sales Revenue (Unaudited) (in thousands) Core Business: Net sales revenue $ 2,189,239 $ 2,375,000 — $ 2,420,000 Net sales revenue growth 8.5% — 10.5% Consolidated: Fiscal 2022 Outlook Fiscal 2023 Net sales revenue $ 2,223,355 $ 2,375,000 — $ 2,420,000 Net sales revenue growth 6.8% — 8.8% 35
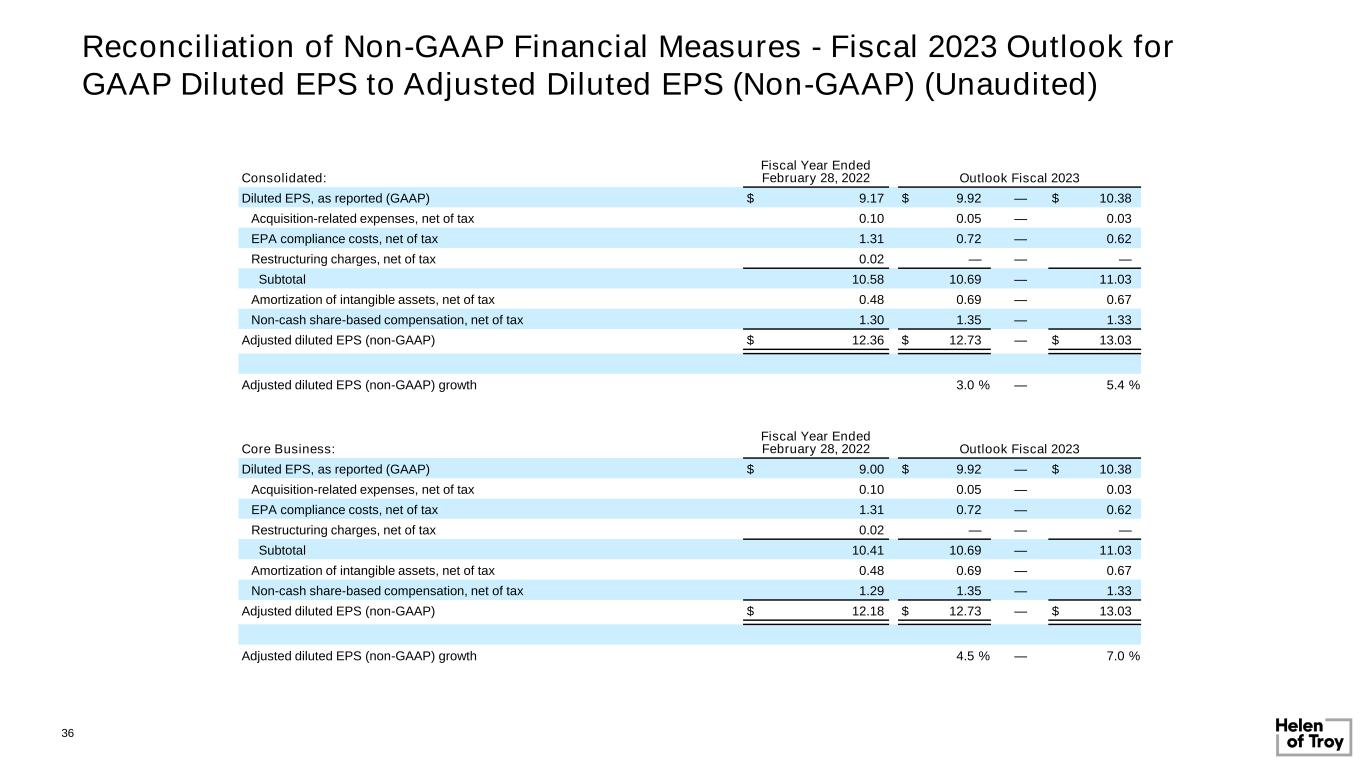

 
Reconciliation of Non-GAAP Financial Measures - Fiscal 2023 Outlook for GAAP Diluted EPS to Adjusted Diluted EPS (Non-GAAP) (Unaudited) Core Business: Fiscal Year Ended February 28, 2022 Outlook Fiscal 2023 Diluted EPS, as reported (GAAP) $ 9.00 $ 9.92 — $ 10.38 Acquisition-related expenses, net of tax 0.10 0.05 — 0.03 EPA compliance costs, net of tax 1.31 0.72 — 0.62 Restructuring charges, net of tax 0.02 — — — Subtotal 10.41 10.69 — 11.03 Amortization of intangible assets, net of tax 0.48 0.69 — 0.67 Non-cash share-based compensation, net of tax 1.29 1.35 — 1.33 Adjusted diluted EPS (non-GAAP) $ 12.18 $ 12.73 — $ 13.03 Adjusted diluted EPS (non-GAAP) growth 4.5 % — 7.0 % Consolidated: Fiscal Year Ended February 28, 2022 Outlook Fiscal 2023 Diluted EPS, as reported (GAAP) $ 9.17 $ 9.92 — $ 10.38 Acquisition-related expenses, net of tax 0.10 0.05 — 0.03 EPA compliance costs, net of tax 1.31 0.72 — 0.62 Restructuring charges, net of tax 0.02 — — — Subtotal 10.58 10.69 — 11.03 Amortization of intangible assets, net of tax 0.48 0.69 — 0.67 Non-cash share-based compensation, net of tax 1.30 1.35 — 1.33 Adjusted diluted EPS (non-GAAP) $ 12.36 $ 12.73 — $ 13.03 Adjusted diluted EPS (non-GAAP) growth 3.0 % — 5.4 % 36
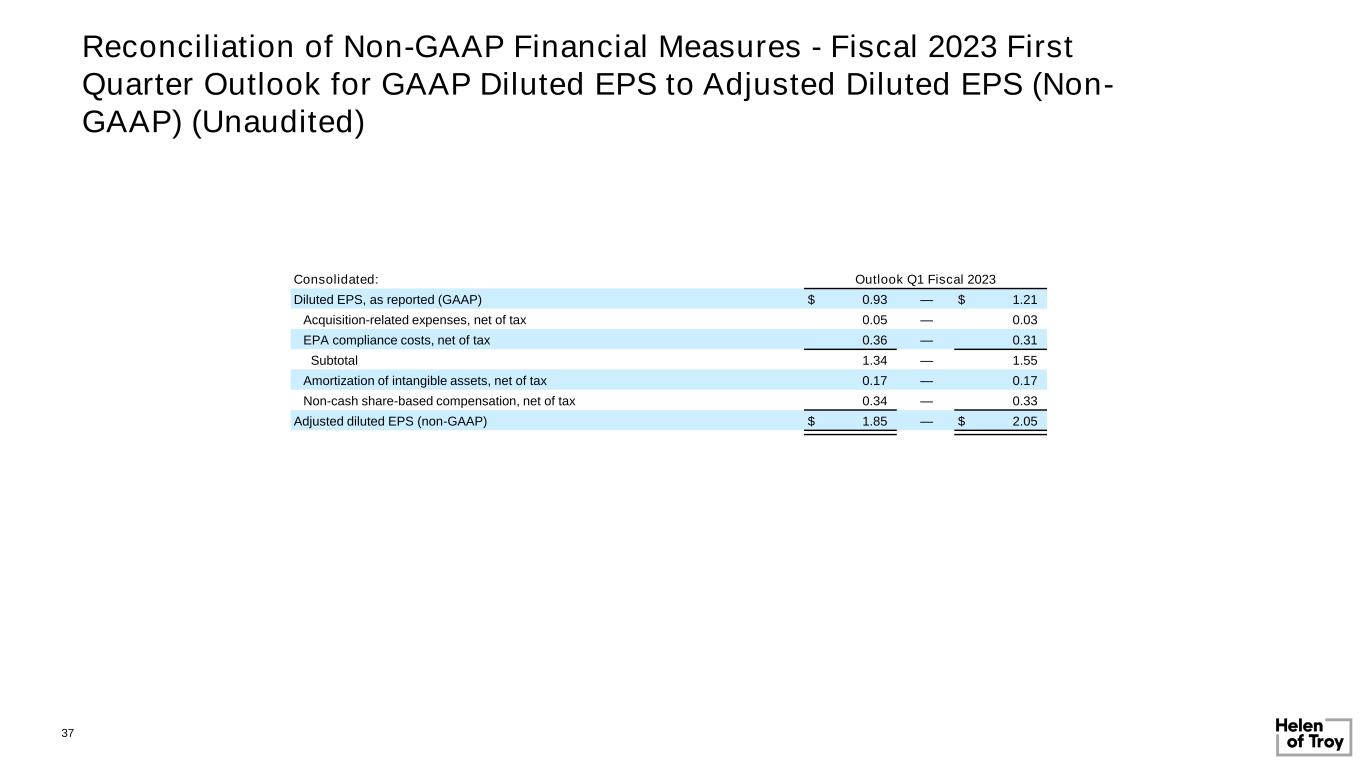

 
Reconciliation of Non-GAAP Financial Measures - Fiscal 2023 First Quarter Outlook for GAAP Diluted EPS to Adjusted Diluted EPS (Non- GAAP) (Unaudited) 37 Consolidated: Outlook Q1 Fiscal 2023 Diluted EPS, as reported (GAAP) $ 0.93 — $ 1.21 Acquisition-related expenses, net of tax 0.05 — 0.03 EPA compliance costs, net of tax 0.36 — 0.31 Subtotal 1.34 — 1.55 Amortization of intangible assets, net of tax 0.17 — 0.17 Non-cash share-based compensation, net of tax 0.34 — 0.33 Adjusted diluted EPS (non-GAAP) $ 1.85 — $ 2.05