hg-20240306
false000159327500015932752024-03-062024-03-06

UNITED STATES
SECURITIES AND EXCHANGE COMMISSION
Washington, D.C. 20549
___________________________________
FORM 8-K
___________________________________
CURRENT REPORT
Pursuant to Section 13 or 15(d)
of the Securities Exchange Act of 1934
March 6, 2024
Date of Report (date of earliest event reported)
___________________________________
Hamilton Insurance Group, Ltd.
(Exact name of registrant as specified in its charter)
___________________________________
Bermuda
(State or other jurisdiction of
incorporation or organization)
001-41862
(Commission File Number)
98-1153847
(I.R.S. Employer Identification
Number)
Wellesley House North, 1st Floor
90 Pitts Bay Road
Pembroke, Bermuda HM 08
(Address of principal executive offices and zip code)
(441) 405-5200
(Registrant's telephone number, including area code)
___________________________________
Check the appropriate box below if the Form 8-K filing is intended to simultaneously satisfy the filing obligation of the registrant under any of the following provisions:
o
Written communications pursuant to Rule 425 under the Securities Act (17 CFR 230.425)
o
Soliciting material pursuant to Rule 14a-12 under the Exchange Act (17 CFR 240.14a-12)
o
Pre-commencement communications pursuant to Rule 14d-2(b) under the Exchange Act (17 CFR 240.14d-2(b))
o
Pre-commencement communications pursuant to Rule 13e-4(c) under the Exchange Act (17 CFR 240.13e-4(c))
Securities registered pursuant to Section 12(b) of the Act:
Title of each class
Trading Symbol
Name of each exchange on which
registered
Class B common shares, par value $0.01 per shareHGNew York Stock Exchange
Indicate by check mark whether the registrant is an emerging growth company as defined in Rule 12b-2 of the Exchange Act.                                Emerging growth company    o
If an emerging growth company, indicate by check mark if the registrant has elected not to use the extended transition period for complying with any new or revised financial accounting standards provided pursuant to Section 13(a) of the Exchange Act. o


Item 2.02 – Results of Operations and Financial Condition

On March 6, 2024, Hamilton Insurance Group, Ltd. (the “Company”) issued a press release announcing its financial results for the quarter ended December 31, 2023 and the availability of its corresponding supplementary financial information. Copies of this press release and the supplementary financial information are furnished as Exhibits 99.1 and 99.2, respectively, to this report. In addition, a copy of our investor presentation which may be referred to during our earnings call is furnished as Exhibit 99.3.

As provided in General Instruction B.2 of Form 8-K, the information and exhibits in this report are being “furnished” and shall not be deemed “filed” for purposes of Section 18 of the Securities Exchange Act of 1934, as amended (the “Exchange Act”), or otherwise subject to liability under that section, nor shall they be deemed to be incorporated by reference into any filing or other document under the Securities Act of 1933, as amended, or the Exchange Act, except as shall be expressly set forth by specific reference in such filing or document.

Item 9.01 - Financial Statements and Exhibits
(d):The following exhibits are being filed herewith:
Exhibit No.Description
99.1
99.2
99.3
104
Cover Page Interactive Data File (embedded within the Inline XBRL document)


SIGNATURE
Pursuant to the requirements of the Securities Exchange Act of 1934, as amended, the Registrant has duly caused this report to be signed on its behalf by the undersigned hereunto duly authorized.

Date: March 6, 2024.
HAMILTON INSURANCE GROUP, LTD.
By:
/s/ Brian Deegan
Name:
Brian Deegan
Title:
Group Chief Accounting Officer


Hamilton Reports 2023 Fourth Quarter Results

PEMBROKE, Bermuda, March 6, 2024 – Hamilton Insurance Group, Ltd. (NYSE: HG; “Hamilton” or “The Company”) today announced financial results for the fourth quarter ended December 31, 2023.

Consolidated Highlights – Fourth Quarter
Net income of $126.9 million;
Annualized return on average equity of 26.4%;
Income tax benefit of $35.1 million, or 7.1% annualized return on average equity, reflecting the enactment of the Bermuda Corporate Income Tax Act of 2023;
Gross premiums written of $433.8 million and net premiums earned of $366.1 million;
Combined ratio of 90.2%, including 1.8 points of catastrophe losses;
Underwriting income of $36.0 million;
Net investment income of $113.8 million comprised of fixed income, short term and cash and cash equivalents return of $77.1 million and Two Sigma Hamilton Fund return of $36.7 million; and
Corporate expenses of $44.9 million, which includes $18.9 million of compensation costs related to the Value Appreciation Pool, and $12.9 million of other compensation costs.


Consolidated Highlights – Full Year
Net income of $258.7 million;
Return on average equity of 13.9%;
Income tax benefit of $35.1 million, or 1.8% return on average equity, reflecting the enactment of the Bermuda Corporate Income Tax Act of 2023;
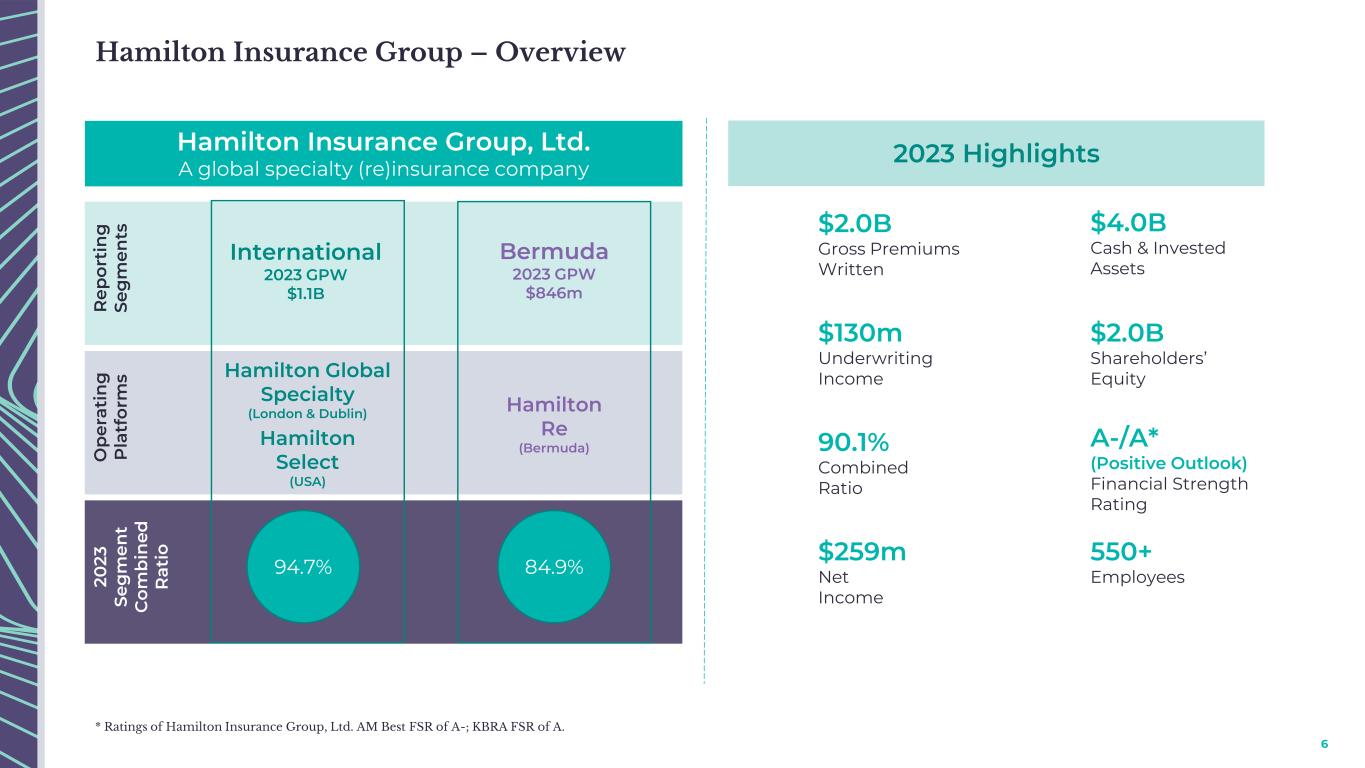
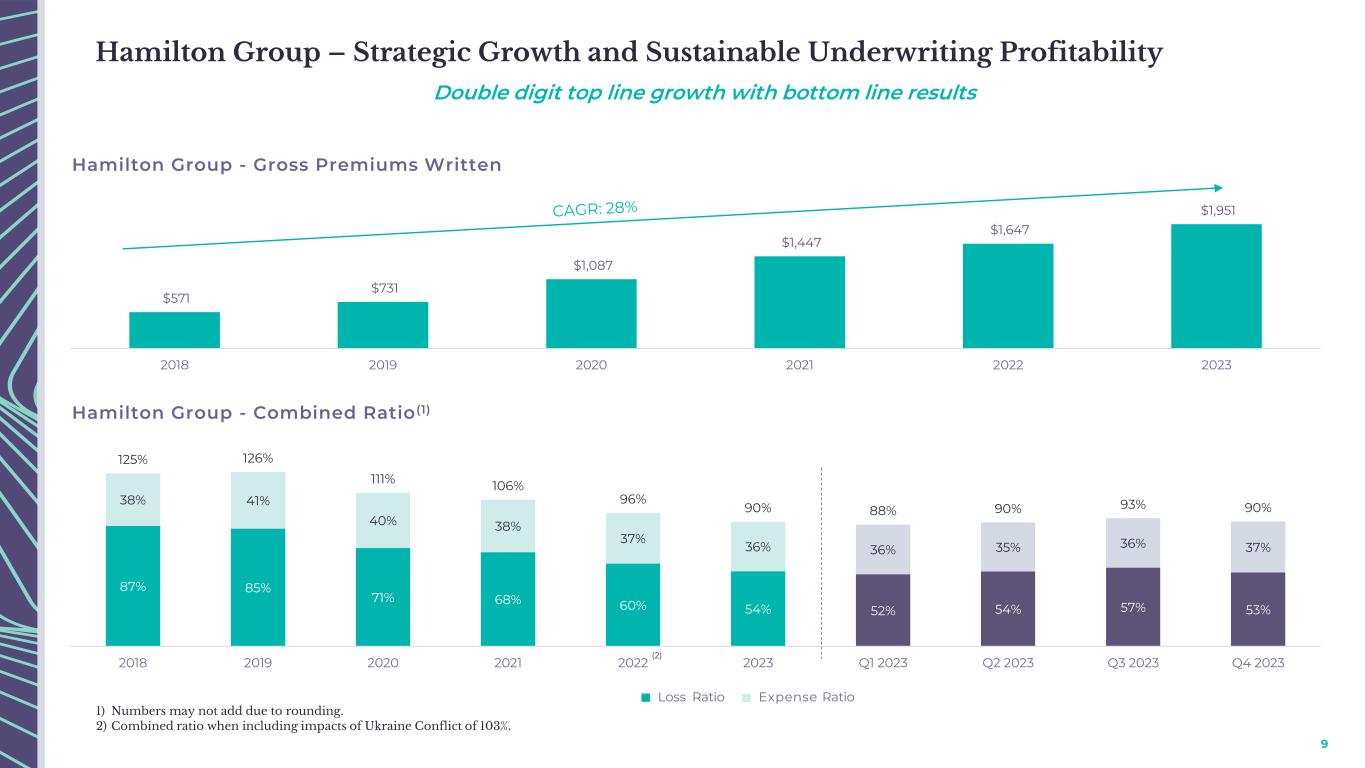
Gross premiums written of $1,951.0 million and net premiums earned of $1,318.5 million;
Combined ratio of 90.1%, including 2.8 points of catastrophe losses;
Underwriting income of $129.9 million;
Net investment income of $218.3 million comprised of Two Sigma Hamilton Fund return of $122.1 million, and fixed income, short term and cash and cash equivalents return of $96.2 million; and
Corporate expenses of $76.7 million, which includes $30.3 million of compensation costs related to the Value Appreciation Pool.


Commenting on the financial results, Pina Albo, CEO of Hamilton, said:

“2023 was a year that truly exemplified the transformation of Hamilton’s business. Our talented team demonstrated our ability to deliver strong results and grow at the right time and in the right lines, all while strengthening our relationships with brokers and clients.”


For the Three Months Ended
($ in thousands, except for per share amounts and percentages)December 31, 2023December 31, 2022Change
Gross premiums written$433,791$341,252$92,539
Net premiums written363,666283,37680,290
Net premiums earned366,135312,24753,888
Underwriting income (loss)$36,028$38,605$(2,577)
Combined ratio90.2%87.6%2.6%
Net income (loss) attributable to common shareholders$126,865$(59,017)$185,882
Income (loss) per share attributable to common shareholders - diluted$1.15$(0.57)
Book value per common share$18.58$16.14
Change in book value per share7.1%(3.4%)
Return on average common equity - annualized26.4%(13.9%)

For the Three Months Ended
Key RatiosDecember 31, 2023December 31, 2022Change
Attritional loss ratio - current year53.2 %57.8 %(4.6 %)
Attritional loss ratio - prior year(1.7 %)(4.7 %)3.0 %
Catastrophe loss ratio - current year1.9 %(0.7 %)2.6 %
Catastrophe loss ratio - prior year(0.1 %)(0.8 %)0.7 %
Loss and loss adjustment expense ratio53.3 %51.6 %1.7 %
Acquisition cost ratio24.2 %24.5 %(0.3 %)
Other underwriting expense ratio12.7 %11.5 %1.2 %
Combined ratio90.2 %87.6 %2.6 %

Gross premiums written increased by $92.5 million, or 27.1%, to $433.8 million with an increase of $39.2 million, or 16.7% in the International Segment, and $53.3 million, or 49.9% in the Bermuda Segment.
Net premiums written increased by $80.3 million, or 28.3%, to $363.7 million with an increase of $27.5 million, or 14.5% in the International Segment, and $52.8 million, or 56.0% in the Bermuda Segment.
Net premiums earned increased by $53.9 million, or 17.3%, to $366.1 million with an increase of $25.9 million, or 15.0% in the International Segment, and $28.0 million, or 20.1% in the Bermuda Segment.
Catastrophe losses (current and prior year), net of reinsurance, were $6.5 million, or 1.8 points, driven by the Hawaii wildfires and the March Storms, partially offset by favorable prior year development.
Net favorable attritional prior year reserve development was $6.4 million.

2


For the Years Ended
($ in thousands, except for per share amounts and percentages)December 31, 2023December 31, 2022Change
Gross premiums written$1,951,038$1,646,673$304,365
Net premiums written1,480,4381,221,864258,574
Net premiums earned1,318,5331,143,714174,819
Underwriting income (loss)$129,851$(31,717)$161,568
Combined ratio90.1%102.8%(12.7%)
Net income (loss) attributable to common shareholders$258,727$(97,999)$356,726
Income (loss) per share attributable to common shareholders - diluted$2.44$(0.95)
Book value per common share$18.58$16.14
Change in book value per share15.1%(5.6%)
Return on average common equity
13.9%(5.7%)
For the Years Ended
Key RatiosDecember 31, 2023December 31, 2022Change
Attritional loss ratio - current year52.2 %51.8 %0.4 %
Attritional loss ratio - prior year(0.8 %)(0.3 %)(0.5 %)
Catastrophe loss ratio - current year3.2 %16.3 %(13.1 %)
Catastrophe loss ratio - prior year(0.4 %)(1.5 %)1.1 %
Loss and loss adjustment expense ratio54.2 %66.3 %(12.1 %)
Acquisition cost ratio23.4 %23.7 %(0.3 %)
Other underwriting expense ratio12.5 %12.8 %(0.3 %)
Combined ratio90.1 %102.8 %(12.7 %)

Gross premiums written increased by $304.4 million, or 18.5%, to $2.0 billion with an increase of $172.3 million, or 18.5% in the International Segment, and $132.1 million, or 18.5% in the Bermuda Segment.
Net premiums written increased by $258.6 million, or 21.2%, to $1.5 billion with an increase of $134.6 million, or 21.2% in the International Segment, and $123.9 million, or 21.1% in the Bermuda Segment.
Net premiums earned increased by $174.8 million, or 15.3%, to $1.3 billion with an increase of $80.5 million, or 12.9% in the International Segment, and $94.4 million, or 18.1% in the Bermuda Segment.
Catastrophe losses (current and prior year), net of reinsurance, were $36.9 million, or 2.8 points, driven by the Hawaii wildfires, the March Storms, the severe convective storms in June 2023, Hurricane Idalia and the Vermont Floods, partially offset by favorable prior year development.
Net favorable attritional prior year reserve development was $10.4 million.
3


Segment Underwriting Results – Fourth Quarter
International SegmentFor the Three Months Ended
($ in thousands, except for percentages)December 31, 2023December 31, 2022Change
Gross premiums written$273,472$234,273$39,199
Net premiums written216,712189,19527,517
Net premiums earned198,725172,84625,879
Underwriting income (loss)$1,867$15,650$(13,783)
Key ratios
Attritional loss ratio - current year54.5 %60.0 %(5.5 %)
Attritional loss ratio - prior year(1.4 %)(8.1 %)6.7 %
Catastrophe loss ratio - current year0.0 %(1.2 %)1.2 %
Catastrophe loss ratio - prior year0.4 %(1.2 %)1.6 %
Loss and loss adjustment expense ratio53.5 %49.5 %4.0 %
Acquisition cost ratio27.7 %27.8 %(0.1 %)
Other underwriting expense ratio17.9 %13.6 %4.3 %
Combined ratio99.1 %90.9 %8.2 %

Gross premiums written increased by $39.2 million, or 16.7%, to $273.5 million, primarily driven by growth in specialty insurance and reinsurance classes and casualty insurance classes.
Catastrophe losses (current and prior year), net of reinsurance, were $0.8 million, driven by prior year catastrophe losses.
Net favorable attritional prior year reserve development was $2.7 million or 1.4 points driven by reserve releases on our property and casualty classes of business.
The acquisition cost ratio decreased by 0.1 points in the fourth quarter, compared to the same period in 2022.
The other underwriting expense ratio increased by 4.3 points in the fourth quarter, compared to the same period in 2022, resulting from higher incentive compensation costs.


4


Bermuda SegmentFor the Three Months Ended
($ in thousands, except for percentages)December 31, 2023December 31, 2022Change
Gross premiums written$160,319$106,979$53,340
Net premiums written146,95494,18152,773
Net premiums earned167,410139,40128,009
Underwriting income (loss)$34,161$22,955$11,206
Key ratios
Attritional loss ratio - current year51.8 %55.1 %(3.3 %)
Attritional loss ratio - prior year(2.2 %)(0.5 %)(1.7 %)
Catastrophe loss ratio - current year4.1 %0.0 %4.1 %
Catastrophe loss ratio - prior year(0.7 %)(0.3 %)(0.4 %)
Loss and loss adjustment expense ratio53.0 %54.3 %(1.3 %)
Acquisition cost ratio20.1 %20.4 %(0.3 %)
Other underwriting expense ratio6.5 %8.9 %(2.4 %)
Combined ratio79.6 %83.6 %(4.0 %)
Gross premiums written increased by $53.3 million, or 49.9%, to $160.3 million, primarily attributable to increases related to expanded participation and improved pricing on the renewed casualty reinsurance classes and new business.
Catastrophe losses (current and prior year), net of reinsurance, were $5.7 million, driven by the Hawaii wildfires and the March storms, partially offset by favorable prior year development.
Net favorable attritional prior year reserve development was $3.7 million or 2.2 points driven by specialty classes of business.
The acquisition cost ratio decreased by 0.3 points in the fourth quarter, compared to the same period in 2022.
The other underwriting expense ratio decreased by 2.4 points in the fourth quarter compared to the same period in 2022. The decrease was primarily driven by performance based management fees generated by our third party capital manager, Ada Capital Management Limited, partially offset by higher incentive compensation costs.

5


Segment Underwriting Results – Full Year
International SegmentFor the Years Ended
($ in thousands, except for percentages)December 31, 2023December 31, 2022Change
Gross premiums written$1,105,522$933,241$172,281
Net premiums written770,399635,773134,626
Net premiums earned703,508623,04780,461
Underwriting income (loss)$36,956$20,183$16,773
Key ratios
Attritional loss ratio - current year53.2 %50.9 %2.3 %
Attritional loss ratio - prior year(3.5 %)(4.8 %)1.3 %
Catastrophe loss ratio - current year1.5 %7.2 %(5.7 %)
Catastrophe loss ratio - prior year0.3 %0.5 %(0.2 %)
Loss and loss adjustment expense ratio51.5 %53.8 %(2.3 %)
Acquisition cost ratio26.5 %27.4 %(0.9 %)
Other underwriting expense ratio16.7 %15.5 %1.2 %
Combined ratio94.7 %96.7 %(2.0 %)

Gross premiums written increased by $172.3 million, or 18.5%, to $1.1 billion, primarily driven by growth in specialty insurance and reinsurance classes and casualty insurance classes.
Catastrophe losses (current and prior year), net of reinsurance, were $12.6 million, driven by the Vermont Floods, Hurricane Idalia, the Hawaii wildfires, the severe convective storms in June 2023 and prior year catastrophe losses.
Net favorable attritional prior year reserve development was $24.4 million or 3.5 points driven by reserve releases on our property and specialty classes of business.
The acquisition cost ratio decreased by 0.9 points compared to the same period in 2022 primarily driven by a change in business mix.
The other underwriting expense ratio increased by 1.2 points compared to the same period in 2022, resulting from higher incentive compensation costs.


6


Bermuda SegmentFor the Years Ended
($ in thousands, except for percentages)December 31, 2023December 31, 2022Change
Gross premiums written$845,516$713,432$132,084
Net premiums written710,039586,091123,948
Net premiums earned615,025520,66794,358
Underwriting income (loss)$92,895$(51,900)$144,795
Key ratios
Attritional loss ratio - current year51.1 %52.9 %(1.8 %)
Attritional loss ratio - prior year2.3 %5.1 %(2.8 %)
Catastrophe loss ratio - current year5.1 %27.1 %(22.0 %)
Catastrophe loss ratio - prior year(1.2 %)(3.9 %)2.7 %
Loss and loss adjustment expense ratio57.3 %81.2 %(23.9 %)
Acquisition cost ratio19.9 %19.3 %0.6 %
Other underwriting expense ratio7.7 %9.4 %(1.7 %)
Combined ratio84.9 %109.9 %(25.0 %)
Gross premiums written increased by $132.1 million, or 18.5%, to $845.5 million, primarily attributable to new business opportunities and rate increases in casualty reinsurance classes and property insurance classes.
Catastrophe losses (current and prior year), net of reinsurance, were $24.3 million, driven by the March Storms, the Hawaii wildfires, the severe convective storms in June 2023, Hurricane Idalia and the Vermont Floods, offset by favorable prior year catastrophe losses.
Net unfavorable attritional prior year reserve development was $14.0 million or 2.3 points driven by property and casualty classes of business, partially offset by favorable development in specialty classes.
The acquisition cost ratio increased by 0.6 points compared to the same period in 2022.

The other underwriting expense ratio decreased by 1.7 points compared to the same period in 2022. The decrease was primarily driven by performance based management fees generated by our third party capital manager, Ada Capital Management Limited, partially offset by higher incentive compensation costs.
Investments and Shareholders’ Equity as of December 31, 2023
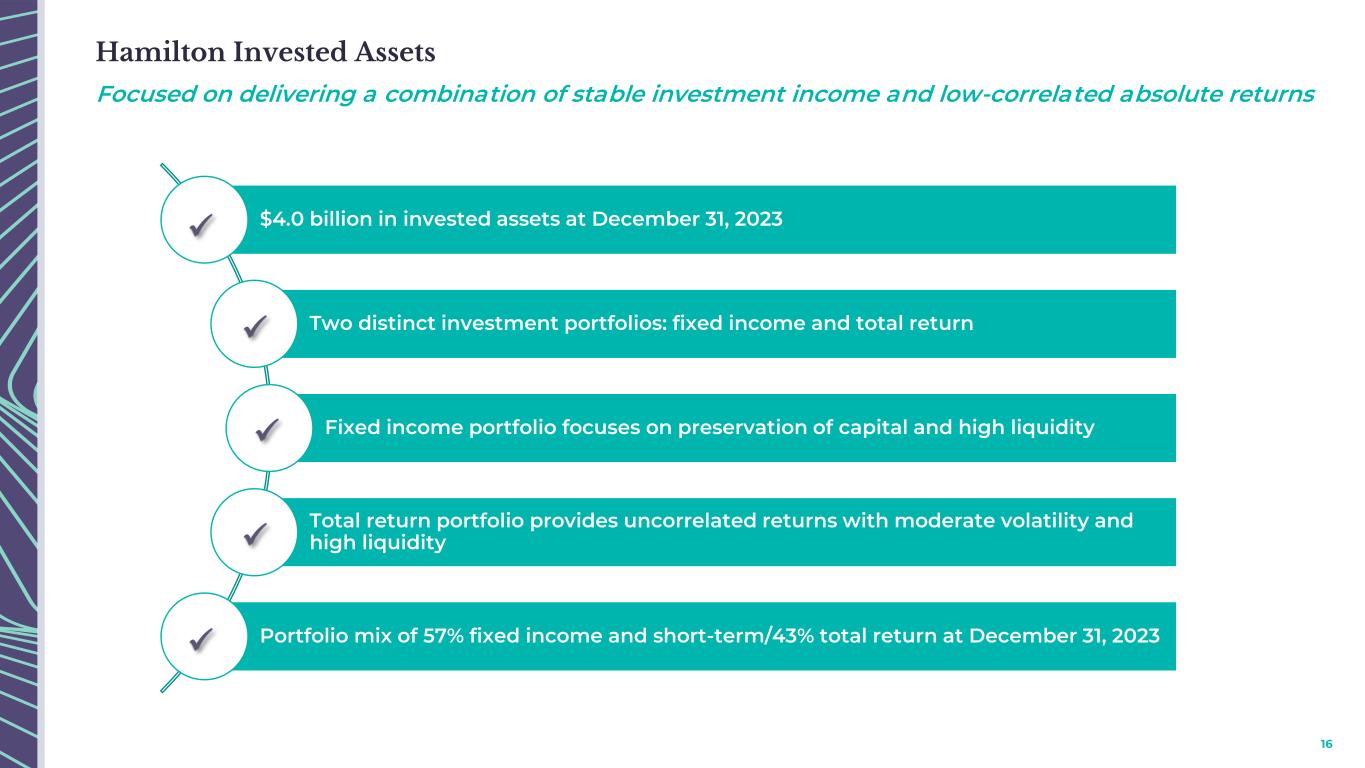
Total invested assets and cash of $4.0 billion compared to $3.4 billion at December 31, 2022.
Total shareholders’ equity of $2.0 billion compared to $1.7 billion at December 31, 2022.
Book value per share of $18.58 compared to $16.14 at December 31, 2022, an increase of 15.1%.
7


Conference Call Details and Additional Information
Conference Call Information
Hamilton will host a conference call to discuss its financial results on Thursday, March 7, 2024, at 10:00 a.m. ET. The conference call can be accessed by dialing 1-855-761-5600 (US toll free), or 1-646-307-1097, and entering the conference ID 6439207.

A live, audio webcast of the conference call will also be available through the Investors portal of the Company’s website at investors.hamiltongroup.com.

A replay of the audio conference call will be available at investors.hamiltongroup.com or by dialing 1-800-770-2030 (U.S. toll free) and entering the conference ID 6439207.

Additional Information

In addition to the information provided in the Company's earnings release, we have also made available supplementary financial information and an investor presentation which may be referred to during the conference call and will be available on the Company’s website at investors.hamiltongroup.com.
About Hamilton Insurance Group, Ltd.

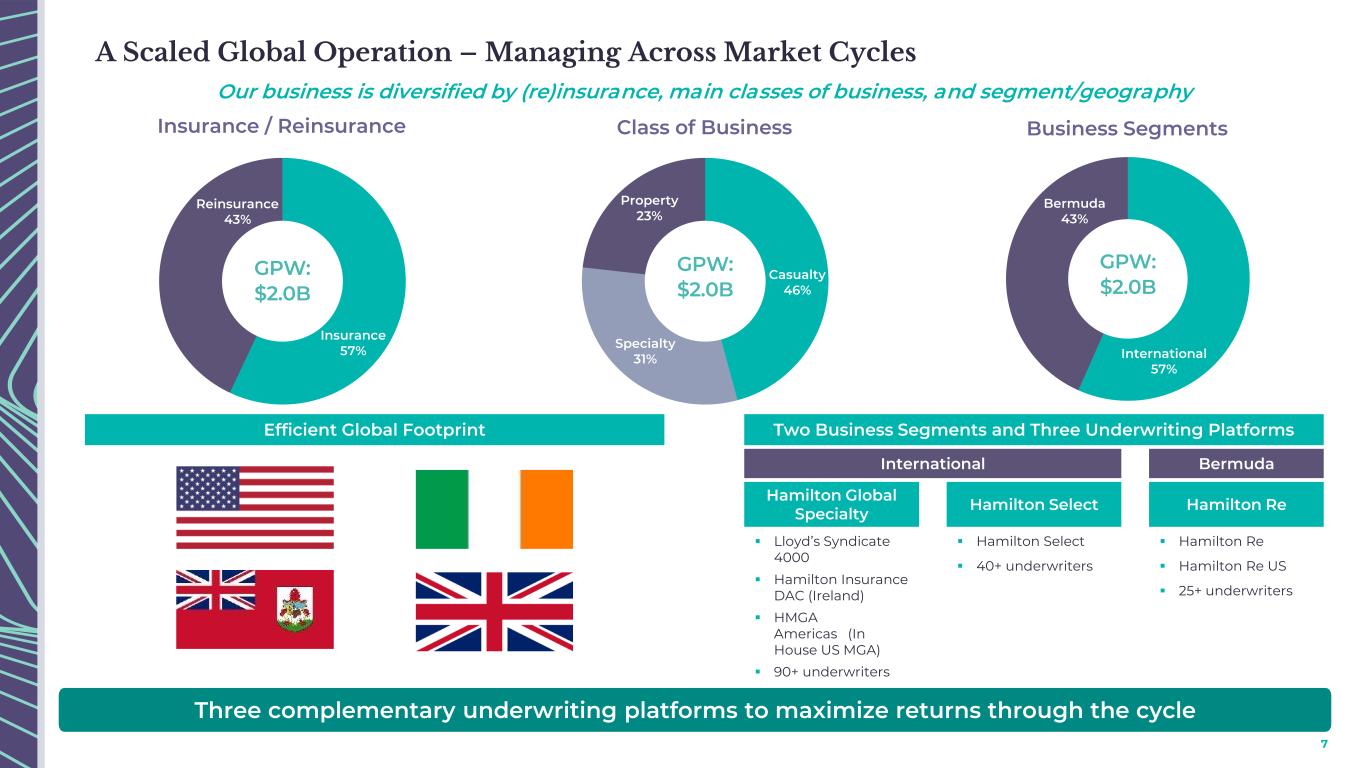
Hamilton is a Bermuda-headquartered company that underwrites specialty insurance and reinsurance risks on a global basis through its wholly owned subsidiaries. Its three underwriting platforms: Hamilton Global Specialty, Hamilton Re and Hamilton Select, each with dedicated and experienced leadership, provide us with access to diversified and profitable markets around the world.

For more information about Hamilton Insurance Group, visit our website at www.hamiltongroup.com or on LinkedIn at Hamilton.
8


Consolidated Balance Sheet
($ in thousands)
December 31,
2023
December 31,
2022
Assets
Fixed maturity investments, at fair value
   (amortized cost 2023: $1,867,499; 2022: $1,348,684)
$1,831,268 $1,259,476 
Short-term investments, at fair value (amortized cost 2023: $427,437; 2022: $285,130)428,878286,111
Investments in Two Sigma Funds, at fair value (cost 2023: $770,191; 2022: $731,100)851,470740,736
Total investments3,111,616 2,286,323 
Cash and cash equivalents
794,509 1,076,420 
Restricted cash and cash equivalents106,351 130,783 
Premiums receivable
658,363 522,670 
Paid losses recoverable145,202 90,655 
Deferred acquisition costs
156,895 115,147 
Unpaid losses and loss adjustment expenses recoverable
1,161,077 1,177,863 
Receivables for investments sold
42,419 371 
Prepaid reinsurance
194,306 164,313 
Intangible assets
90,996 86,958 
Other assets
209,621 167,462 
Total assets$6,671,355 $5,818,965 
Liabilities, non-controlling interest, and shareholders' equity
Liabilities
Reserve for losses and loss adjustment expenses
$3,030,037 $2,856,275 
Unearned premiums
911,222 718,188 
Reinsurance balances payable
272,310 244,320 
Payables for investments purchased
66,606 48,095 
Term loan, net of issuance costs149,830 149,715 
Accounts payable and accrued expenses
186,887 138,050 
Payables to related parties
6,480 20 
Total liabilities4,623,372 4,154,663 
Non-controlling interest – TS Hamilton Fund
133 119 
Shareholders’ equity
Common shares:
Class A, authorized (2023: 28,644,807 and 2022: 53,993,690), par value $0.01;
   issued and outstanding (2023: 28,644,807 and 2022: 30,520,078)
286 305 
Class B, authorized (2023: 72,337,352 and 2022: 50,480,684), par value $0.01;
   issued and outstanding (2023: 56,036,067 and 2022: 42,042,155)
560 420 
Class C, authorized (2023: 25,544,229 and 2022: 30,525,626), par value $0.01;
   issued and outstanding (2023: 25,544,229 and 2022: 30,525,626)
255 305 
Additional paid-in capital
1,249,817 1,120,242 
Accumulated other comprehensive loss
(4,441)(4,441)
Retained earnings
801,373 547,352 
Total shareholders' equity2,047,850 1,664,183 
Total liabilities, non-controlling interest, and shareholders' equity$6,671,355 $5,818,965 
9


Consolidated Statement of Operations
Three Months Ended December 31,
Years Ended
December 31,
($ in thousands, except per share information)
2023202220232022
Revenues
Gross premiums written$433,791 $341,252 $1,951,038 $1,646,673 
Reinsurance premiums ceded(70,125)(57,876)(470,600)(424,809)
Net premiums written363,666 283,376 1,480,438 1,221,864 
Net change in unearned premiums2,469 28,871 (161,905)(78,150)
Net premiums earned366,135 312,247 1,318,533 1,143,714 
Net realized and unrealized gains (losses) on investments107,517 (60,280)209,399 86,357 
Net investment income (loss)12,737 695 30,456 (21,487)
Total net realized and unrealized gains (losses) on investments and net investment income (loss)
120,254 (59,585)239,855 64,870 
Net gain on sale of equity method investment211 6,991 211 6,991 
Other income (loss)10,792 2,199 18,631 11,316 
Net foreign exchange gains (losses)(2,230)(9,245)(6,185)6,137 
Total revenues495,162 252,607 1,571,045 1,233,028 
Expenses
Losses and loss adjustment expenses195,049 161,318 714,603 758,333 
Acquisition costs88,615 76,394 309,148 271,189 
General and administrative expenses101,781 42,392 259,856 177,682 
Impairment of goodwill— 24,082 — 24,082 
Amortization of intangible assets2,914 2,957 10,783 12,832 
Interest expense5,428 4,485 21,434 15,741 
Total expenses393,787 311,628 1,315,824 1,259,859 
Income (loss) before income tax101,375 (59,021)255,221 (26,831)
Income tax expense (benefit)
(31,974)(25,066)3,104 
Net income (loss)133,349 (59,022)280,287 (29,935)
Net income (loss) attributable to non-controlling interest6,484 (5)21,560 68,064 
Net income (loss) and other comprehensive income (loss) attributable to common shareholders$126,865 $(59,017)$258,727 $(97,999)
Per share data
Basic income (loss) per share attributable to common shareholders$1.18 $(0.57)$2.47 $(0.95)
Diluted income (loss) per share attributable to common shareholders$1.15 $(0.57)$2.44 $(0.95)

10


Non-GAAP Financial Measures Reconciliation
We present our results of operations in a way that we believe will be the most meaningful and useful to investors, analysts, rating agencies and others who use our financial information to evaluate our performance. Some of the measurements are considered non-GAAP financial measures under SEC rules and regulations. In this press release, we present underwriting income (loss), a non-GAAP financial measure as defined in Item 10(e) of SEC Regulation S-K. We believe that non-GAAP financial measures, which may be defined and calculated differently by other companies, help explain and enhance the understanding of our results of operations. However, these measures should not be viewed as a substitute for those determined in accordance with U.S. GAAP. Where appropriate, reconciliations of our non-GAAP measures to the most comparable GAAP figures are included below.

Underwriting Income (Loss)

We calculate underwriting income (loss) on a pre-tax basis as net premiums earned less losses and loss adjustment expenses, acquisition costs and other underwriting expenses (net of third party fee income). We believe that this measure of our performance focuses on the core fundamental performance of the Company’s reportable segments in any given period and is not distorted by investment market conditions, corporate expense allocations or income tax effects.

The following table reconciles underwriting income (loss) to net income (loss), the most comparable GAAP financial measure:
For the Three Months Ended
For the Years Ended
($ in thousands)December 31, 2023December 31, 2022December 31, 2023December 31, 2022
Underwriting income (loss)$36,028 $38,605 $129,851 $(31,717)
Total net realized and unrealized gains (losses) on investments and net investment income (loss)
120,254 (59,585)239,855 64,870 
Net gain on sale of equity method investment211 6,991 211 6,991 
Other income (loss), excluding third party fee income312 (55)397 (315)
Net foreign exchange gains (losses)(2,230)(9,245)(6,185)6,137 
Corporate expenses(44,858)(4,208)(76,691)(20,142)
Impairment of goodwill— (24,082)— (24,082)
Amortization of intangible assets(2,914)(2,957)(10,783)(12,832)
Interest expense(5,428)(4,485)(21,434)(15,741)
Income tax (expense) benefit31,974 (1)25,066 (3,104)
Net income (loss), prior to non-controlling interest$133,349 $(59,022)$280,287 $(29,935)


11


Third Party Fee Income

Third party fee income includes income that is incremental and/or directly attributable to our underwriting operations. It is primarily comprised of fees earned by the International Segment for management services provided to third party syndicates and consortia and by the Bermuda Segment for performance based management fees generated by our third party capital manager, Ada Capital Management Limited. We believe that this measure is a relevant component of our underwriting income (loss).

The following table reconciles third party fee income to other income, the most comparable GAAP financial measure:
For the Three Months EndedFor the Years Ended
($ in thousands)December 31, 2023December 31, 2022December 31, 2023December 31, 2022
Third party fee income$10,480 $2,254 $18,234 $11,631 
Other income (loss), excluding third party fee income312 (55)397 (315)
Other income (loss)$10,792 $2,199 $18,631 $11,316 
Other Underwriting Expenses

Other underwriting expenses include those general and administrative expenses that are incremental and/or directly attributable to our underwriting operations. While this measure is presented in Note 10, Segment Reporting in the consolidated financial statements, it is considered a non-GAAP financial measure when presented elsewhere.

Corporate expenses include holding company costs necessary to support our reportable segments. As these costs are not incremental and/or directly attributable to our underwriting operations, these costs are excluded from other underwriting expenses, and therefore, underwriting income (loss). General and administrative expenses, the most comparable GAAP financial measure to other underwriting expenses, also includes corporate expenses.

The following table reconciles other underwriting expenses to general and administrative expenses, the most comparable GAAP financial measure:
For the Three Months EndedFor the Years Ended
($ in thousands)December 31, 2023December 31, 2022December 31, 2023December 31, 2022
Other underwriting expenses$56,923 $38,184 $183,165 $157,540 
Corporate expenses44,858 4,208 76,691 20,142 
General and administrative expenses$101,781 $42,392 $259,856 $177,682 

12


Special Note Regarding Forward-Looking Statements
This information may contain forward-looking statements which reflect the Company's current views with respect to future events and financial performance and are made pursuant to the safe harbor provisions of the Private Securities Litigation Reform Act of 1995. Forward-looking statements are made based on management's current expectations and beliefs concerning future developments and their potential effects upon Hamilton. There can be no assurance that future developments affecting Hamilton will be those anticipated by management. Forward-looking statements include, without limitation, all matters that are not historical facts. These forward-looking statements are not a guarantee of future performance and involve risk and uncertainties, and there are certain important factors that could cause actual results to differ, possibly materially, from expectations or estimates reflected in such forward-looking statements, including the following:

our results of operations and financial condition could be adversely affected by unpredictable catastrophic events, global climate change or emerging claim and coverage issues;
our business could be materially adversely affected if we do not accurately assess our underwriting risk, our reserves are inadequate to cover our actual losses, our models or assessments and pricing of risks are incorrect or we lose important broker relationships;
the insurance and reinsurance business is historically cyclical and the pricing and terms for our products may decline, which would affect our profitability and ability to maintain or grow premiums;
we have significant foreign operations that expose us to certain additional risks, including foreign currency risks and political risk;
we do not control the allocations to and/or the performance of the Two Sigma Hamilton Fund, LLC ("TS Hamilton Fund")’s investment portfolio, and its performance depends on the ability of its investment manager, Two Sigma, to select and manage appropriate investments and we have a limited ability to withdraw our capital accounts;
Two Sigma Principals, LLC, Two Sigma and their respective affiliates have potential conflicts of interest that could adversely affect us;
the historical performance of Two Sigma Investments, LP ("Two Sigma") is not necessarily indicative of the future results of the TS Hamilton Fund’s investment portfolio or of our future results;
our ability to manage risks associated with macroeconomic conditions resulting from geopolitical and global economic events, including public health crises, current or anticipated military conflicts, terrorism, sanctions, rising energy prices, inflation and interest rates and other global events;

our ability to compete successfully with more established competitors and risks relating to consolidation in the reinsurance and insurance industries;
downgrades, potential downgrades or other negative actions by rating agencies;
our dependence on key executives, including the potential loss of Bermudian personnel as a result of Bermuda employment restrictions, and the inability to attract qualified personnel, particularly in very competitive hiring conditions;
our dependence on letter of credit facilities that may not be available on commercially acceptable terms;
our potential need for additional capital in the future and the potential unavailability of such capital to us on favorable terms or at all;
the suspension or revocation of our subsidiaries’ insurance licenses;
risks associated with our investment strategy, including such risks being greater than those faced by competitors;
changes in the regulatory environment and the potential for greater regulatory scrutiny of the Company going forward;
a cyclical downturn of the reinsurance industry;
13


operational failures, failure of information systems or failure to protect the confidentiality of customer information, including by service providers, or losses due to defaults, errors or omissions by third parties or our affiliates;
we are a holding company with no direct operations, and our insurance and reinsurance subsidiaries’ ability to pay dividends and other distributions to us is restricted by law;
risks relating to our ability to identify and execute opportunities for growth or our ability to complete transactions as planned or realize the anticipated benefits of our acquisitions or other investments;
our potentially becoming subject to U.S. federal income taxation, Bermuda taxation or other taxes as a result of a change of tax laws or otherwise;
the potential characterization of us and/or any of our subsidiaries as a passive foreign investment company, or PFIC;
our potentially becoming subject to U.S. withholding and information reporting requirements under the U.S. Foreign Account Tax Compliance Act, or FATCA, provisions;
our costs will increase as a result of operating as a public company, and our management will be required to devote substantial time to complying with public company regulations;
if we were to identify a material weakness and were unable to remediate such material weakness, or fail to achieve and maintain effective internal controls, our operating results and financial condition could be impacted and the market price of our Class B common shares may be negatively affected;
the lack of a prior public market for our Class B common shares means our share price may be volatile and anti-takeover provisions contained in our organizational documents could delay management changes;
the potential that the market price of our Class B common shares could decline due to future sales of shares by our existing shareholders;
applicable insurance laws, which could make it difficult to effect a change of control of our company;
investors may have difficulties in serving process or enforcing judgments against us in the United States; and
other factors affecting future results disclosed in the Company’s filing with the SEC, including the Form 10-K.


Jon Levenson & Darian Niforatos
[email protected]

Media contact:
Kelly Corday Ferris
[email protected]
14
Hamilton Insurance Group, Ltd. Supplementary Financial Information December 31, 2023 Investor Contact [email protected]

 
Hamilton Insurance Group, Ltd. Table of Contents Page I. Basis of Presentation 1 II. Financial Highlights Financial Highlights 3 Key Operating and Financial Metrics 4 III. Summary Consolidated Results Statements of Operations 5 Consolidated Balance Sheets 6 Reconciliation of Consolidated GAAP Balance Sheet to Unconsolidated Balance Sheet 7 Net Investment Return 8 Fixed Maturity and Short-Term Investments 9 IV. Segment Results Consolidated Underwriting Results 10 - 11 5Q Consolidated Underwriting Results 12 5Q Underwriting Results - International 13 5Q Underwriting Results - Bermuda 14 V. Other Information Modeled Exposure to Catastrophe Losses (PML) 15 Non-GAAP Measures 16 - 17

 
Basis of Presentation Cautionary Note Regarding Forward-Looking Statements • our results of operations and financial condition could be adversely affected by unpredictable catastrophic events, global climate change or emerging claim and coverage issues; • our business could be materially adversely affected if we do not accurately assess our underwriting risk, our reserves are inadequate to cover our actual losses, our models or assessments and pricing of risks are incorrect or we lose important broker relationships; • the insurance and reinsurance business is historically cyclical and the pricing and terms for our products may decline, which would affect our profitability and ability to maintain or grow premiums; • we have significant foreign operations that expose us to certain additional risks, including foreign currency risks and political risk; • we do not control the allocations to and/or the performance of the Two Sigma Hamilton Fund, LLC ("TS Hamilton Fund")’s investment portfolio, and its performance depends on the ability of its investment manager, Two Sigma, to select and manage appropriate investments and we have a limited ability to withdraw our capital accounts; • Two Sigma Principals, LLC, Two Sigma and their respective affiliates have potential conflicts of interest that could adversely affect us; • the historical performance of Two Sigma Investments, LP ("Two Sigma") is not necessarily indicative of the future results of the TS Hamilton Fund’s investment portfolio or of our future results; • our ability to manage risks associated with macroeconomic conditions resulting from geopolitical and global economic events, including public health crises, current or anticipated military conflicts, terrorism, sanctions, rising energy prices, inflation and interest rates and other global events; • our ability to compete successfully with more established competitors and risks relating to consolidation in the reinsurance and insurance industries; • downgrades, potential downgrades or other negative actions by rating agencies; All financial information contained herein is unaudited, however, certain information relating to the consolidated balance sheet at the most recent year end is derived from or agrees to audited financial information. Unless otherwise noted, all data is in thousands, except for share and per share amounts and ratio information. This information is being provided for informational purposes only. It should be read in conjunction with the documents filed by Hamilton Insurance Group, Inc. ("Hamilton") with the U.S Securities and Exchange Commission, including its Form 10-K. This information may contain forward-looking statements which reflect the Company's current views with respect to future events and financial performance and are made pursuant to the safe harbor provisions of the Private Securities Litigation Reform Act of 1995. Forward-looking statements are made based on management's current expectations and beliefs concerning future developments and their potential effects upon Hamilton. There can be no assurance that future developments affecting Hamilton will be those anticipated by management. Forward-looking statements include, without limitation, all matters that are not historical facts. These forward-looking statements are not a guarantee of future performance and involve risk and uncertainties, and there are certain important factors that could cause actual results to differ, possibly materially, from expectations or estimates reflected in such forward-looking statements, including the following: 1

 
Cautionary Note Regarding Forward-Looking Statements (continued) • our dependence on key executives, including the potential loss of Bermudian personnel as a result of Bermuda employment restrictions, and the inability to attract qualified personnel, particularly in very competitive hiring conditions; • our dependence on letter of credit facilities that may not be available on commercially acceptable terms; • our potential need for additional capital in the future and the potential unavailability of such capital to us on favorable terms or at all; • the suspension or revocation of our subsidiaries’ insurance licenses; • risks associated with our investment strategy, including such risks being greater than those faced by competitors; • changes in the regulatory environment and the potential for greater regulatory scrutiny of the Company going forward; • a cyclical downturn of the reinsurance industry; • operational failures, failure of information systems or failure to protect the confidentiality of customer information, including by service providers, or losses due to defaults, errors or omissions by third parties or our affiliates; • we are a holding company with no direct operations, and our insurance and reinsurance subsidiaries’ ability to pay dividends and other distributions to us is restricted by law; • risks relating to our ability to identify and execute opportunities for growth or our ability to complete transactions as planned or realize the anticipated benefits of our acquisitions or other investments; • our potentially becoming subject to U.S. federal income taxation, Bermuda taxation or other taxes as a result of a change of tax laws or otherwise; • the potential characterization of us and/or any of our subsidiaries as a passive foreign investment company, or PFIC; • our potentially becoming subject to U.S. withholding and information reporting requirements under the U.S. Foreign Account Tax Compliance Act, or FATCA, provisions; • our costs will increase as a result of operating as a public company, and our management will be required to devote substantial time to complying with public company regulations; • if we were to identify a material weakness and were unable to remediate such material weakness, or fail to achieve and maintain effective internal controls, our operating results and financial condition could be impacted and the market price of our Class B common shares may be negatively affected; • the lack of a prior public market for our Class B common shares means our share price may be volatile and anti-takeover provisions contained in our organizational documents could delay management changes; • the potential that the market price of our Class B common shares could decline due to future sales of shares by our existing shareholders; • applicable insurance laws, which could make it difficult to effect a change of control of our company; • investors may have difficulties in serving process or enforcing judgments against us in the United States; and • other factors affecting future results disclosed in the Company’s filing with the SEC, including Form 10-K. 2
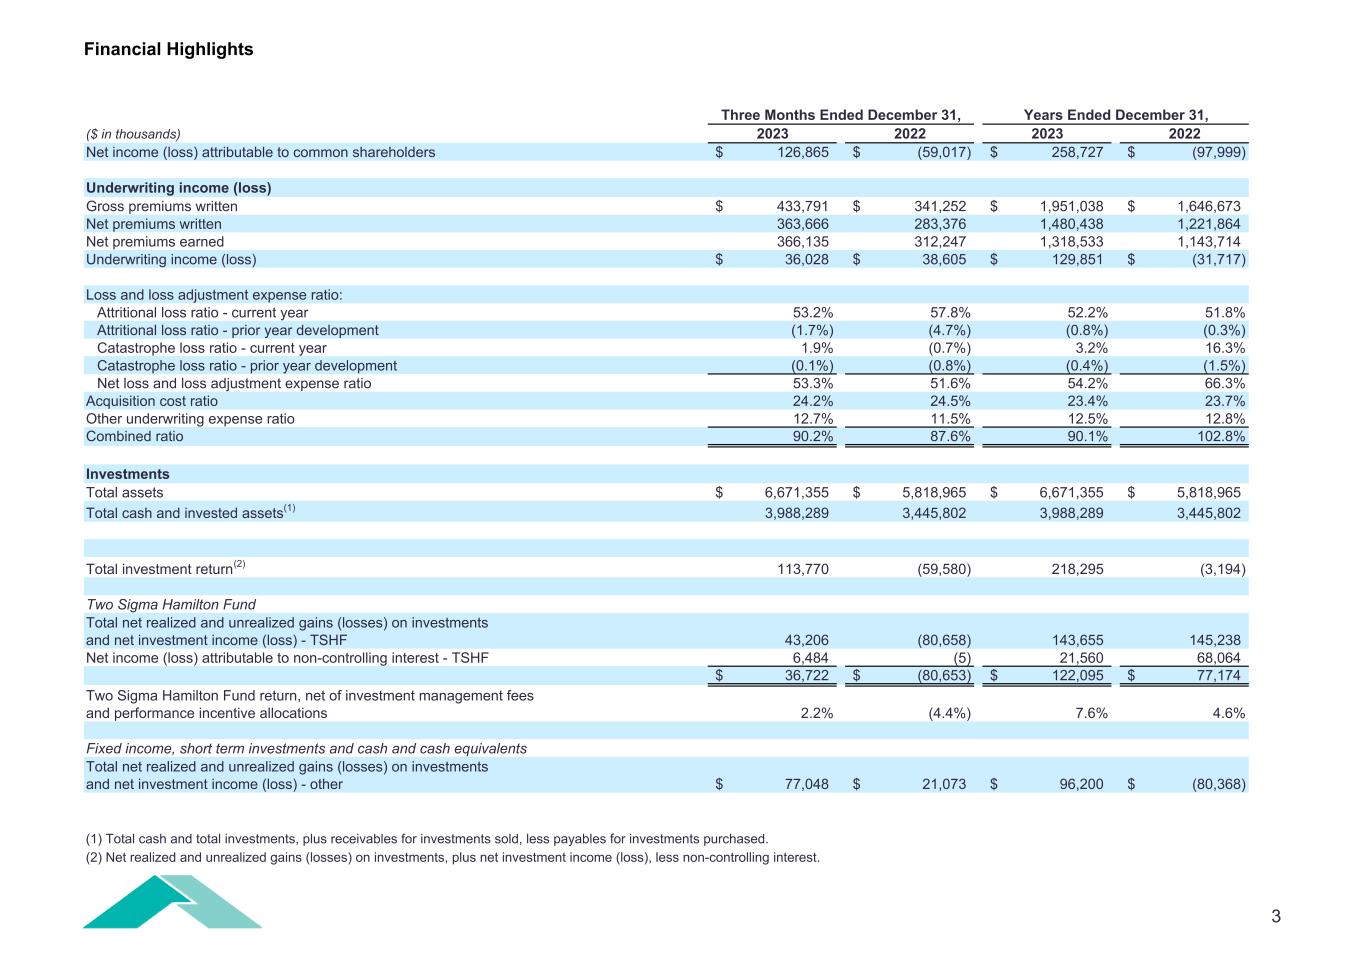

 
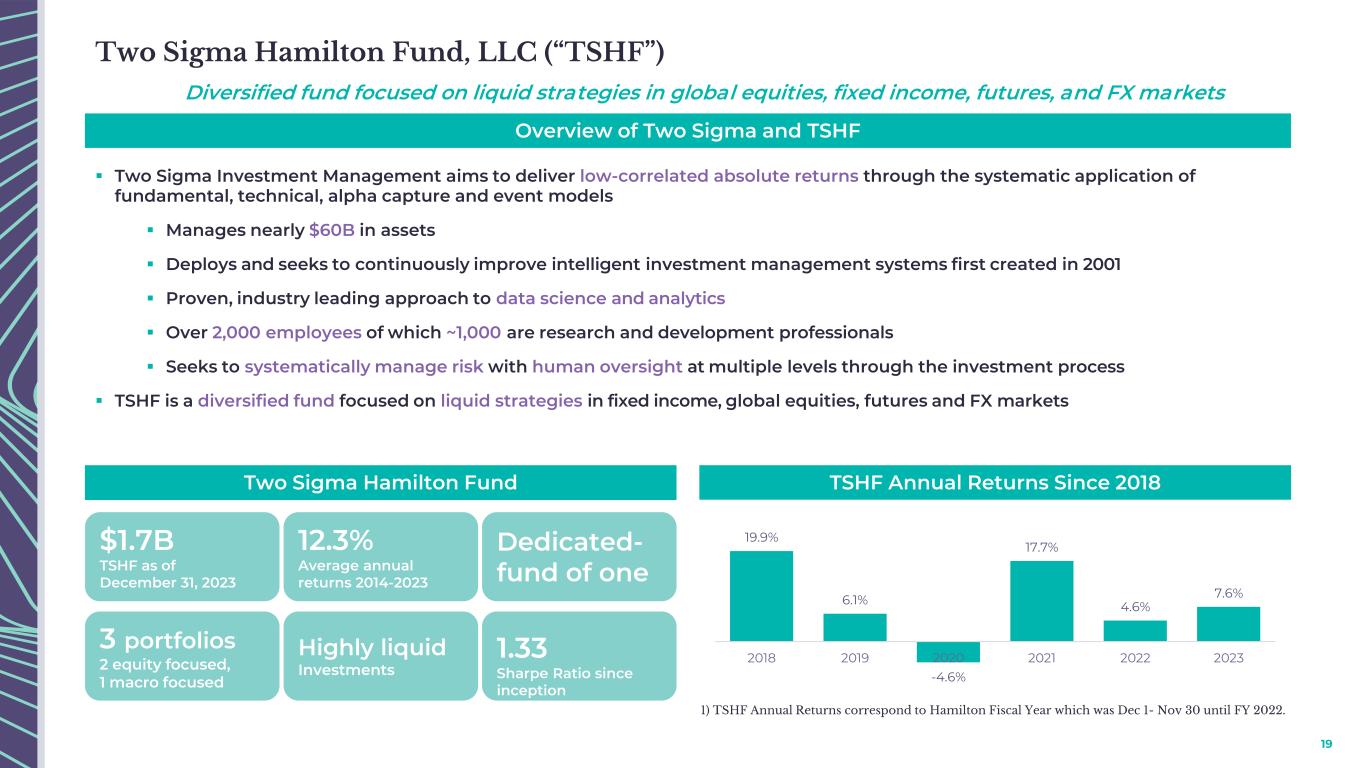
Financial Highlights Three Months Ended December 31, ($ in thousands) 2023 2022 2023 2022 Net income (loss) attributable to common shareholders 126,865$ (59,017)$ 258,727$ (97,999)$ Underwriting income (loss) Gross premiums written 433,791$ 341,252$ 1,951,038$ 1,646,673$ Net premiums written 363,666 283,376 1,480,438 1,221,864 Net premiums earned 366,135 312,247 1,318,533 1,143,714 Underwriting income (loss) 36,028$ 38,605$ 129,851$ (31,717)$ Loss and loss adjustment expense ratio: Attritional loss ratio - current year 53.2% 57.8% 52.2% 51.8% Attritional loss ratio - prior year development (1.7%) (4.7%) (0.8%) (0.3%) Catastrophe loss ratio - current year 1.9% (0.7%) 3.2% 16.3% Catastrophe loss ratio - prior year development (0.1%) (0.8%) (0.4%) (1.5%) Net loss and loss adjustment expense ratio 53.3% 51.6% 54.2% 66.3% Acquisition cost ratio 24.2% 24.5% 23.4% 23.7% Other underwriting expense ratio 12.7% 11.5% 12.5% 12.8% Combined ratio 90.2% 87.6% 90.1% 102.8% Investments Total assets 6,671,355$ 5,818,965$ 6,671,355$ 5,818,965$ Total cash and invested assets(1) 3,988,289 3,445,802 3,988,289 3,445,802 Total investment return(2) 113,770 (59,580) 218,295 (3,194) Two Sigma Hamilton Fund Total net realized and unrealized gains (losses) on investments and net investment income (loss) - TSHF 43,206 (80,658) 143,655 145,238 Net income (loss) attributable to non-controlling interest - TSHF 6,484 (5) 21,560 68,064 36,722$ (80,653)$ 122,095$ 77,174$ Two Sigma Hamilton Fund return, net of investment management fees and performance incentive allocations 2.2% (4.4%) 7.6% 4.6% Fixed income, short term investments and cash and cash equivalents Total net realized and unrealized gains (losses) on investments and net investment income (loss) - other 77,048$ 21,073$ 96,200$ (80,368)$ (1) Total cash and total investments, plus receivables for investments sold, less payables for investments purchased. (2) Net realized and unrealized gains (losses) on investments, plus net investment income (loss), less non-controlling interest. Years Ended December 31, 3
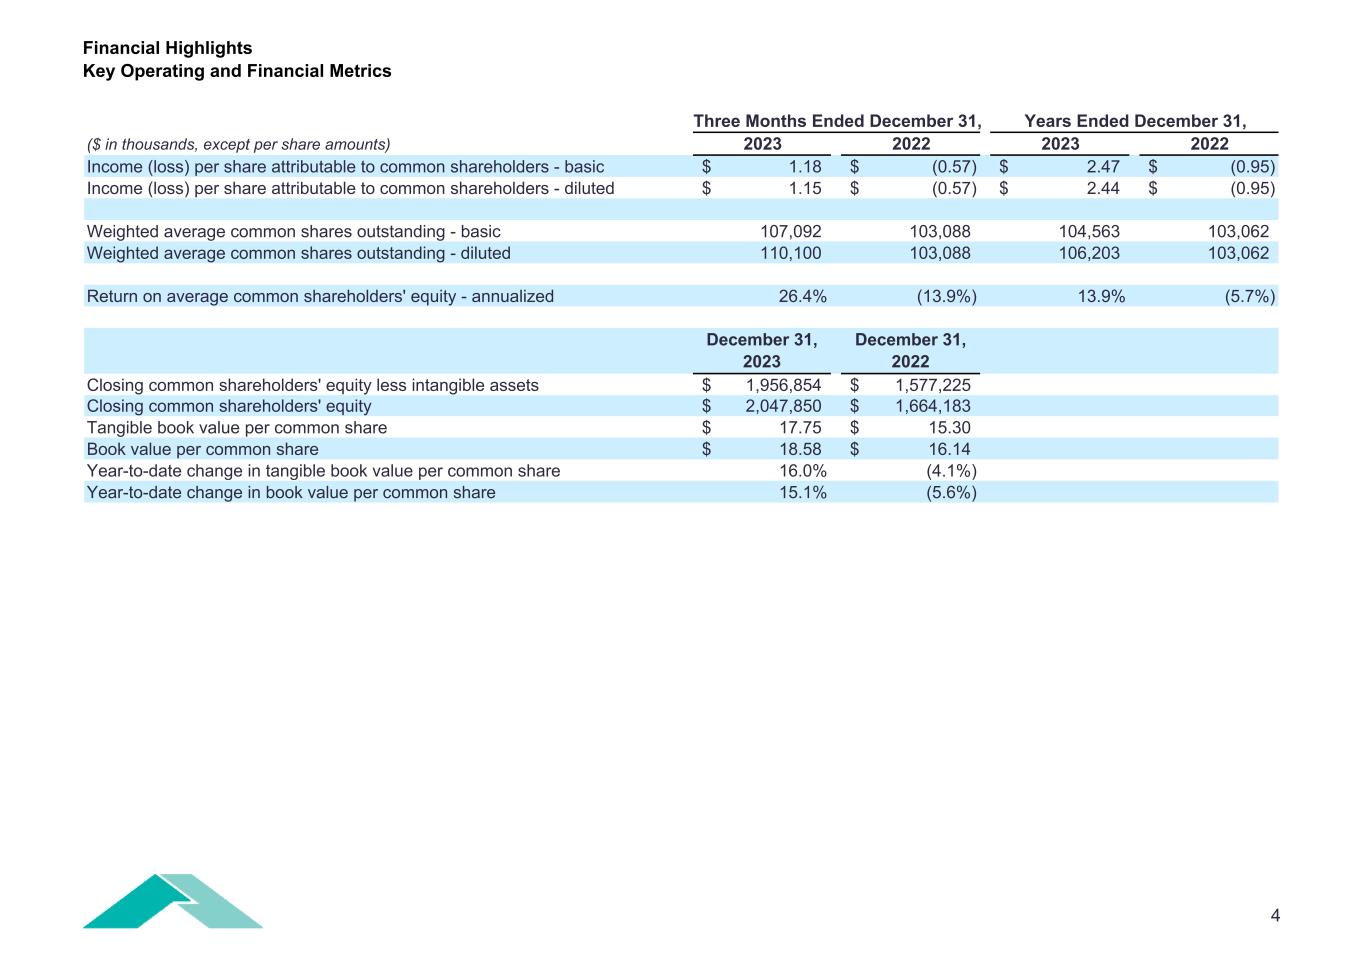

 
Financial Highlights Key Operating and Financial Metrics Three Months Ended December 31, Years Ended December 31, ($ in thousands, except per share amounts) 2023 2022 2023 2022 Income (loss) per share attributable to common shareholders - basic 1.18$ (0.57)$ 2.47$ (0.95)$ Income (loss) per share attributable to common shareholders - diluted 1.15$ (0.57)$ 2.44$ (0.95)$ Weighted average common shares outstanding - basic 107,092 103,088 104,563 103,062 Weighted average common shares outstanding - diluted 110,100 103,088 106,203 103,062 Return on average common shareholders' equity - annualized 26.4% (13.9%) 13.9% (5.7%) December 31, 2023 December 31, 2022 Closing common shareholders' equity less intangible assets 1,956,854$ 1,577,225$ Closing common shareholders' equity 2,047,850$ 1,664,183$ Tangible book value per common share 17.75$ 15.30$ Book value per common share 18.58$ 16.14$ Year-to-date change in tangible book value per common share 16.0% (4.1%) Year-to-date change in book value per common share 15.1% (5.6%) 4
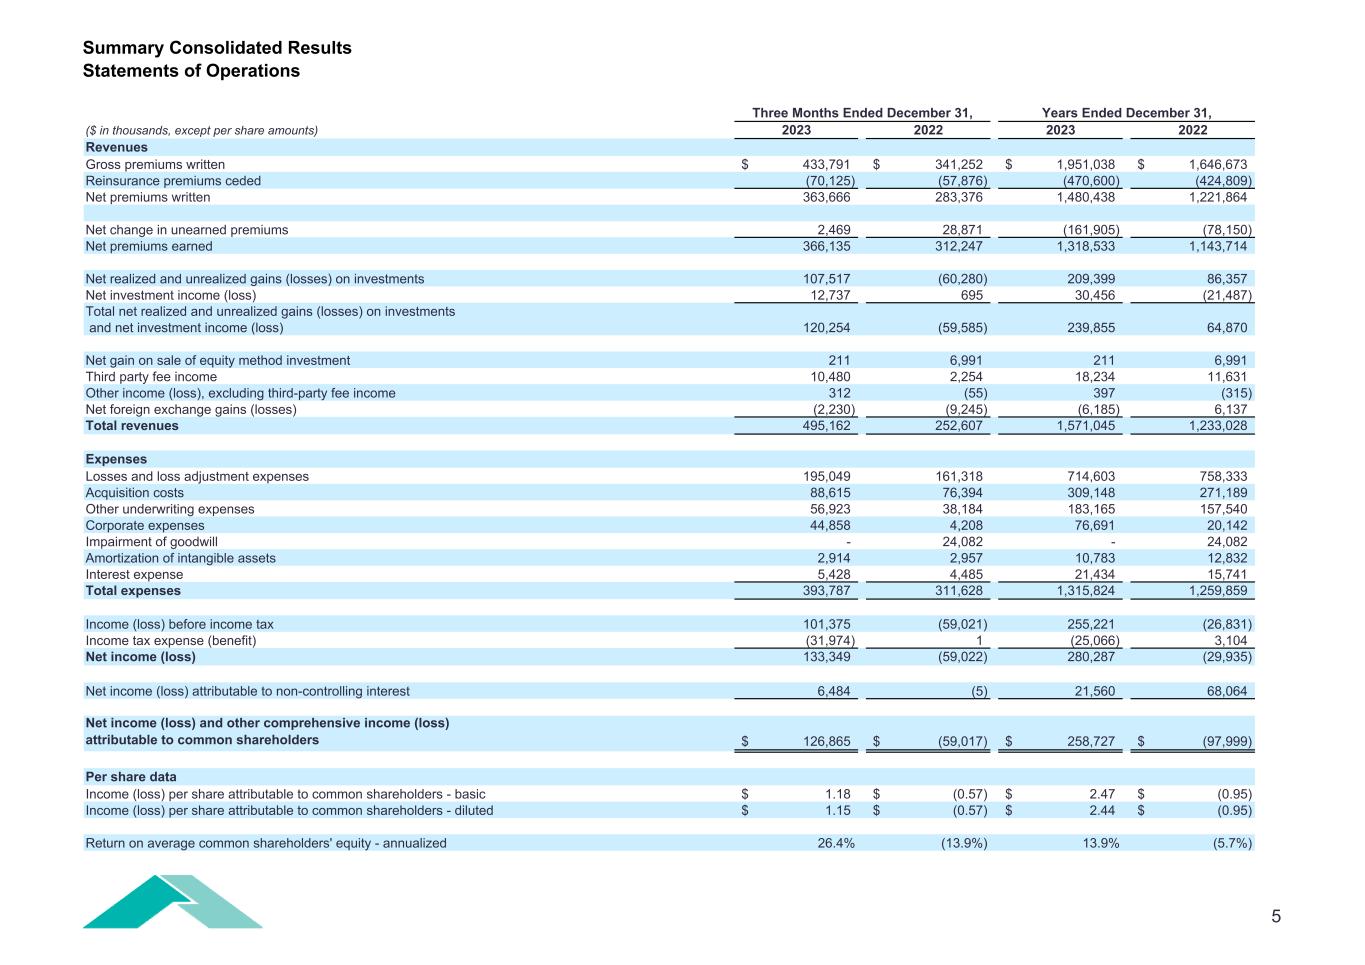

 
Summary Consolidated Results Statements of Operations ($ in thousands, except per share amounts) 2023 2022 2023 2022 Revenues Gross premiums written 433,791$ 341,252$ 1,951,038$ 1,646,673$ Reinsurance premiums ceded (70,125) (57,876) (470,600) (424,809) Net premiums written 363,666 283,376 1,480,438 1,221,864 Net change in unearned premiums 2,469 28,871 (161,905) (78,150) Net premiums earned 366,135 312,247 1,318,533 1,143,714 Net realized and unrealized gains (losses) on investments 107,517 (60,280) 209,399 86,357 Net investment income (loss) 12,737 695 30,456 (21,487) Total net realized and unrealized gains (losses) on investments and net investment income (loss) 120,254 (59,585) 239,855 64,870 Net gain on sale of equity method investment 211 6,991 211 6,991 Third party fee income 10,480 2,254 18,234 11,631 Other income (loss), excluding third-party fee income 312 (55) 397 (315) Net foreign exchange gains (losses) (2,230) (9,245) (6,185) 6,137 Total revenues 495,162 252,607 1,571,045 1,233,028 Expenses Losses and loss adjustment expenses 195,049 161,318 714,603 758,333 Acquisition costs 88,615 76,394 309,148 271,189 Other underwriting expenses 56,923 38,184 183,165 157,540 Corporate expenses 44,858 4,208 76,691 20,142 Impairment of goodwill - 24,082 - 24,082 Amortization of intangible assets 2,914 2,957 10,783 12,832 Interest expense 5,428 4,485 21,434 15,741 Total expenses 393,787 311,628 1,315,824 1,259,859 Income (loss) before income tax 101,375 (59,021) 255,221 (26,831) Income tax expense (benefit) (31,974) 1 (25,066) 3,104 Net income (loss) 133,349 (59,022) 280,287 (29,935) Net income (loss) attributable to non-controlling interest 6,484 (5) 21,560 68,064 Net income (loss) and other comprehensive income (loss) attributable to common shareholders 126,865$ (59,017)$ 258,727$ (97,999)$ Per share data Income (loss) per share attributable to common shareholders - basic 1.18$ (0.57)$ 2.47$ (0.95)$ Income (loss) per share attributable to common shareholders - diluted 1.15$ (0.57)$ 2.44$ (0.95)$ Return on average common shareholders' equity - annualized 26.4% (13.9%) 13.9% (5.7%) Years Ended December 31,Three Months Ended December 31, 5
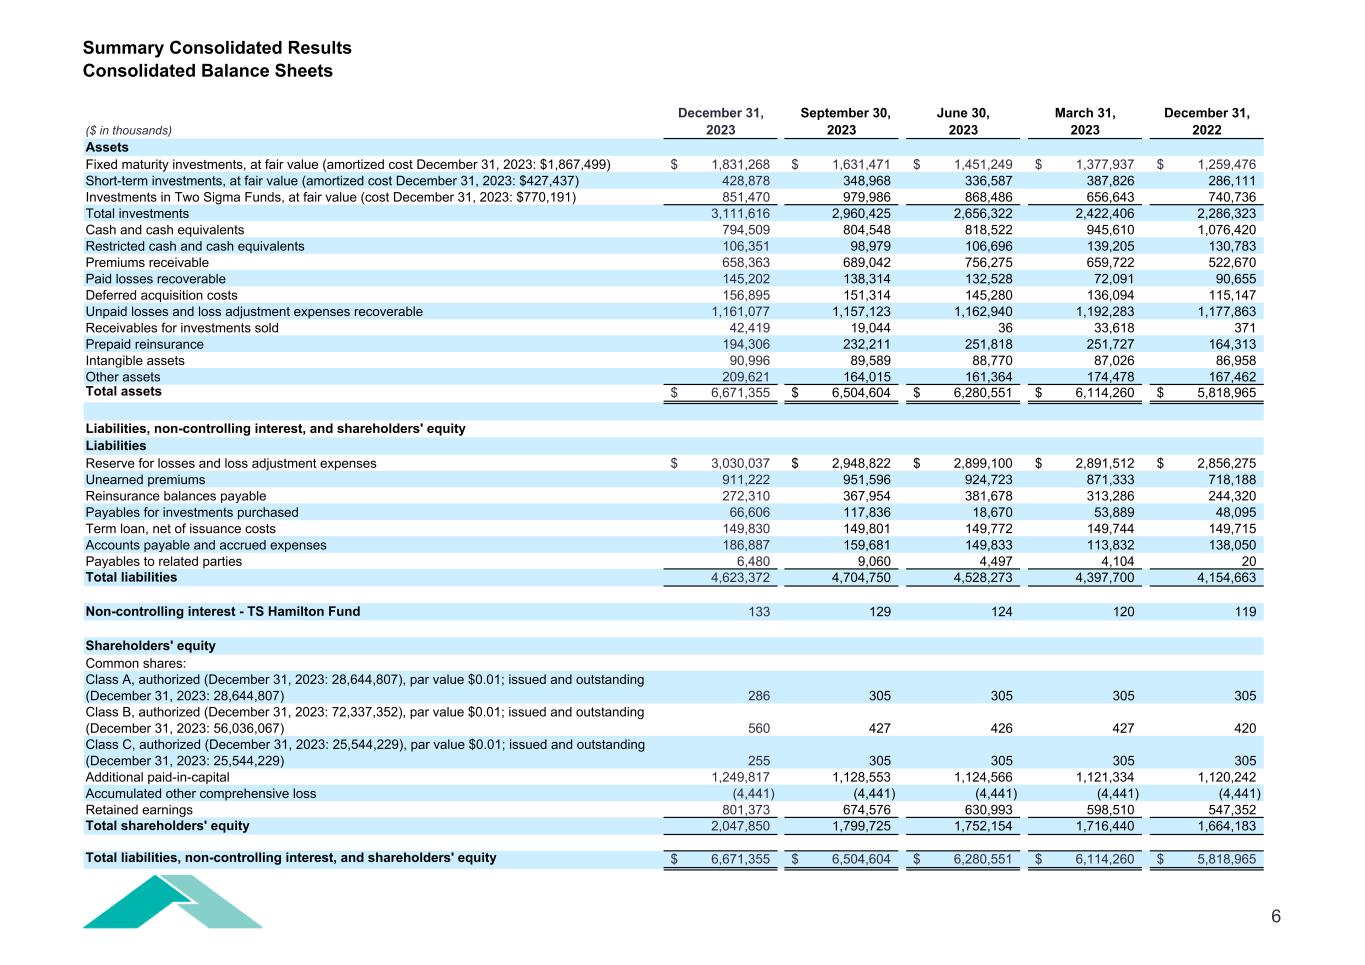

 
Summary Consolidated Results Consolidated Balance Sheets December 31, September 30, June 30, March 31, December 31, ($ in thousands) 2023 2023 2023 2023 2022 Assets Fixed maturity investments, at fair value (amortized cost December 31, 2023: $1,867,499) 1,831,268$ 1,631,471$ 1,451,249$ 1,377,937$ 1,259,476$ Short-term investments, at fair value (amortized cost December 31, 2023: $427,437) 428,878 348,968 336,587 387,826 286,111 Investments in Two Sigma Funds, at fair value (cost December 31, 2023: $770,191) 851,470 979,986 868,486 656,643 740,736 Total investments 3,111,616 2,960,425 2,656,322 2,422,406 2,286,323 Cash and cash equivalents 794,509 804,548 818,522 945,610 1,076,420 Restricted cash and cash equivalents 106,351 98,979 106,696 139,205 130,783 Premiums receivable 658,363 689,042 756,275 659,722 522,670 Paid losses recoverable 145,202 138,314 132,528 72,091 90,655 Deferred acquisition costs 156,895 151,314 145,280 136,094 115,147 Unpaid losses and loss adjustment expenses recoverable 1,161,077 1,157,123 1,162,940 1,192,283 1,177,863 Receivables for investments sold 42,419 19,044 36 33,618 371 Prepaid reinsurance 194,306 232,211 251,818 251,727 164,313 Intangible assets 90,996 89,589 88,770 87,026 86,958 Other assets 209,621 164,015 161,364 174,478 167,462 Total assets 6,671,355$ 6,504,604$ 6,280,551$ 6,114,260$ 5,818,965$ Liabilities, non-controlling interest, and shareholders' equity Liabilities Reserve for losses and loss adjustment expenses 3,030,037$ 2,948,822$ 2,899,100$ 2,891,512$ 2,856,275$ Unearned premiums 911,222 951,596 924,723 871,333 718,188 Reinsurance balances payable 272,310 367,954 381,678 313,286 244,320 Payables for investments purchased 66,606 117,836 18,670 53,889 48,095 Term loan, net of issuance costs 149,830 149,801 149,772 149,744 149,715 Accounts payable and accrued expenses 186,887 159,681 149,833 113,832 138,050 Payables to related parties 6,480 9,060 4,497 4,104 20 Total liabilities 4,623,372 4,704,750 4,528,273 4,397,700 4,154,663 Non-controlling interest - TS Hamilton Fund 133 129 124 120 119 Shareholders' equity Common shares: Class A, authorized (December 31, 2023: 28,644,807), par value $0.01; issued and outstanding (December 31, 2023: 28,644,807) 286 305 305 305 305 Class B, authorized (December 31, 2023: 72,337,352), par value $0.01; issued and outstanding (December 31, 2023: 56,036,067) 560 427 426 427 420 Class C, authorized (December 31, 2023: 25,544,229), par value $0.01; issued and outstanding (December 31, 2023: 25,544,229) 255 305 305 305 305 Additional paid-in-capital 1,249,817 1,128,553 1,124,566 1,121,334 1,120,242 Accumulated other comprehensive loss (4,441) (4,441) (4,441) (4,441) (4,441) Retained earnings 801,373 674,576 630,993 598,510 547,352 Total shareholders' equity 2,047,850 1,799,725 1,752,154 1,716,440 1,664,183 Total liabilities, non-controlling interest, and shareholders' equity 6,671,355$ 6,504,604$ 6,280,551$ 6,114,260$ 5,818,965$ 6
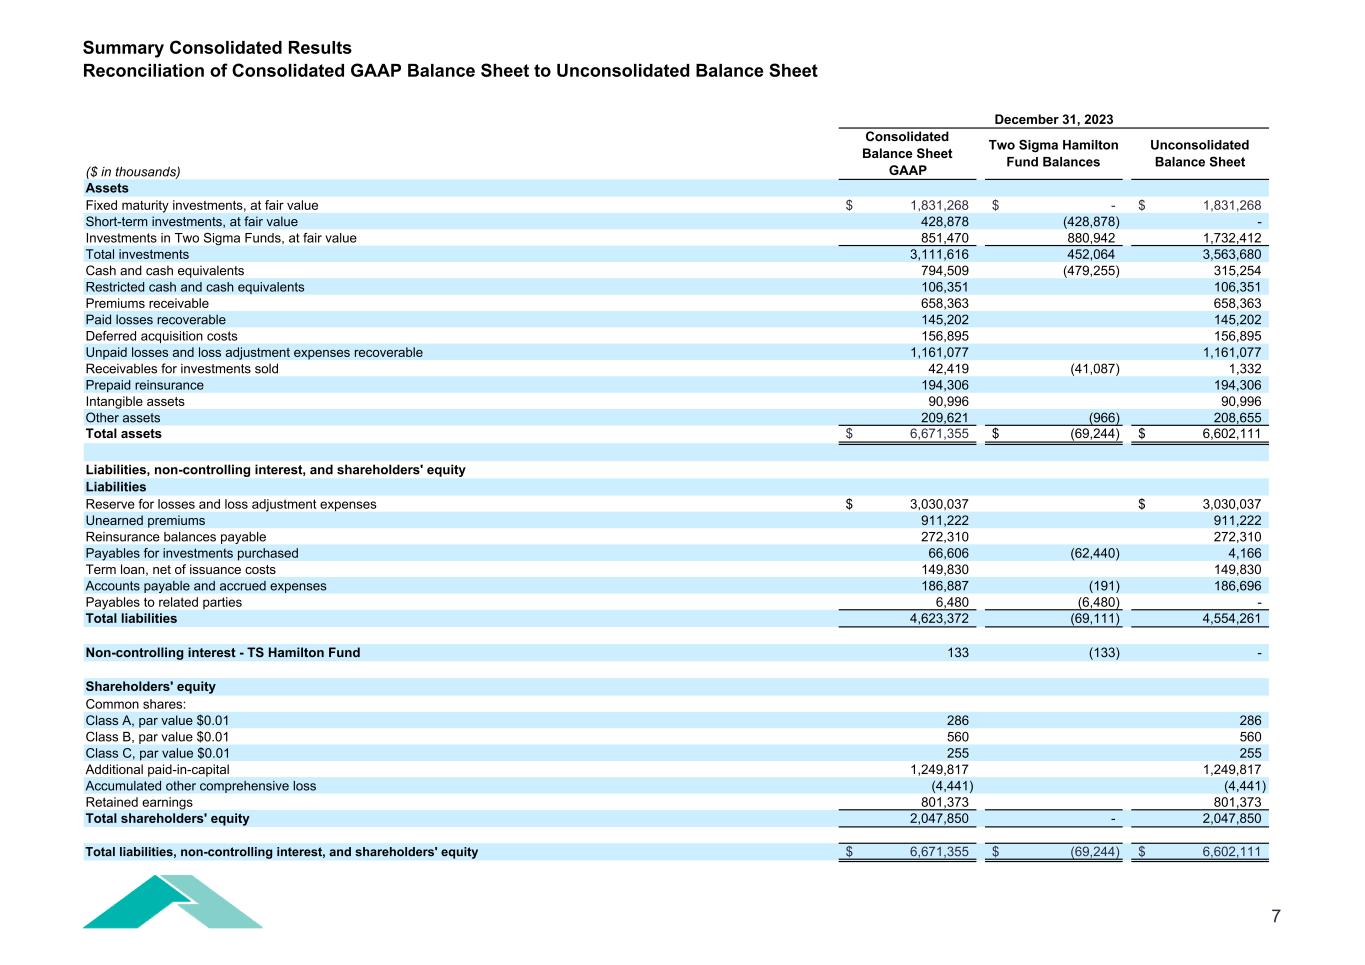

 
Summary Consolidated Results Reconciliation of Consolidated GAAP Balance Sheet to Unconsolidated Balance Sheet December 31, 2023 ($ in thousands) Assets Fixed maturity investments, at fair value 1,831,268$ -$ 1,831,268$ Short-term investments, at fair value 428,878 (428,878) - Investments in Two Sigma Funds, at fair value 851,470 880,942 1,732,412 Total investments 3,111,616 452,064 3,563,680 Cash and cash equivalents 794,509 (479,255) 315,254 Restricted cash and cash equivalents 106,351 106,351 Premiums receivable 658,363 658,363 Paid losses recoverable 145,202 145,202 Deferred acquisition costs 156,895 156,895 Unpaid losses and loss adjustment expenses recoverable 1,161,077 1,161,077 Receivables for investments sold 42,419 (41,087) 1,332 Prepaid reinsurance 194,306 194,306 Intangible assets 90,996 90,996 Other assets 209,621 (966) 208,655 Total assets 6,671,355$ (69,244)$ 6,602,111$ Liabilities, non-controlling interest, and shareholders' equity Liabilities Reserve for losses and loss adjustment expenses 3,030,037$ 3,030,037$ Unearned premiums 911,222 911,222 Reinsurance balances payable 272,310 272,310 Payables for investments purchased 66,606 (62,440) 4,166 Term loan, net of issuance costs 149,830 149,830 Accounts payable and accrued expenses 186,887 (191) 186,696 Payables to related parties 6,480 (6,480) - Total liabilities 4,623,372 (69,111) 4,554,261 Non-controlling interest - TS Hamilton Fund 133 (133) - Shareholders' equity Common shares: Class A, par value $0.01 286 286 Class B, par value $0.01 560 560 Class C, par value $0.01 255 255 Additional paid-in-capital 1,249,817 1,249,817 Accumulated other comprehensive loss (4,441) (4,441) Retained earnings 801,373 801,373 Total shareholders' equity 2,047,850 - 2,047,850 Total liabilities, non-controlling interest, and shareholders' equity 6,671,355$ (69,244)$ 6,602,111$ Consolidated Balance Sheet GAAP Unconsolidated Balance Sheet Two Sigma Hamilton Fund Balances 7
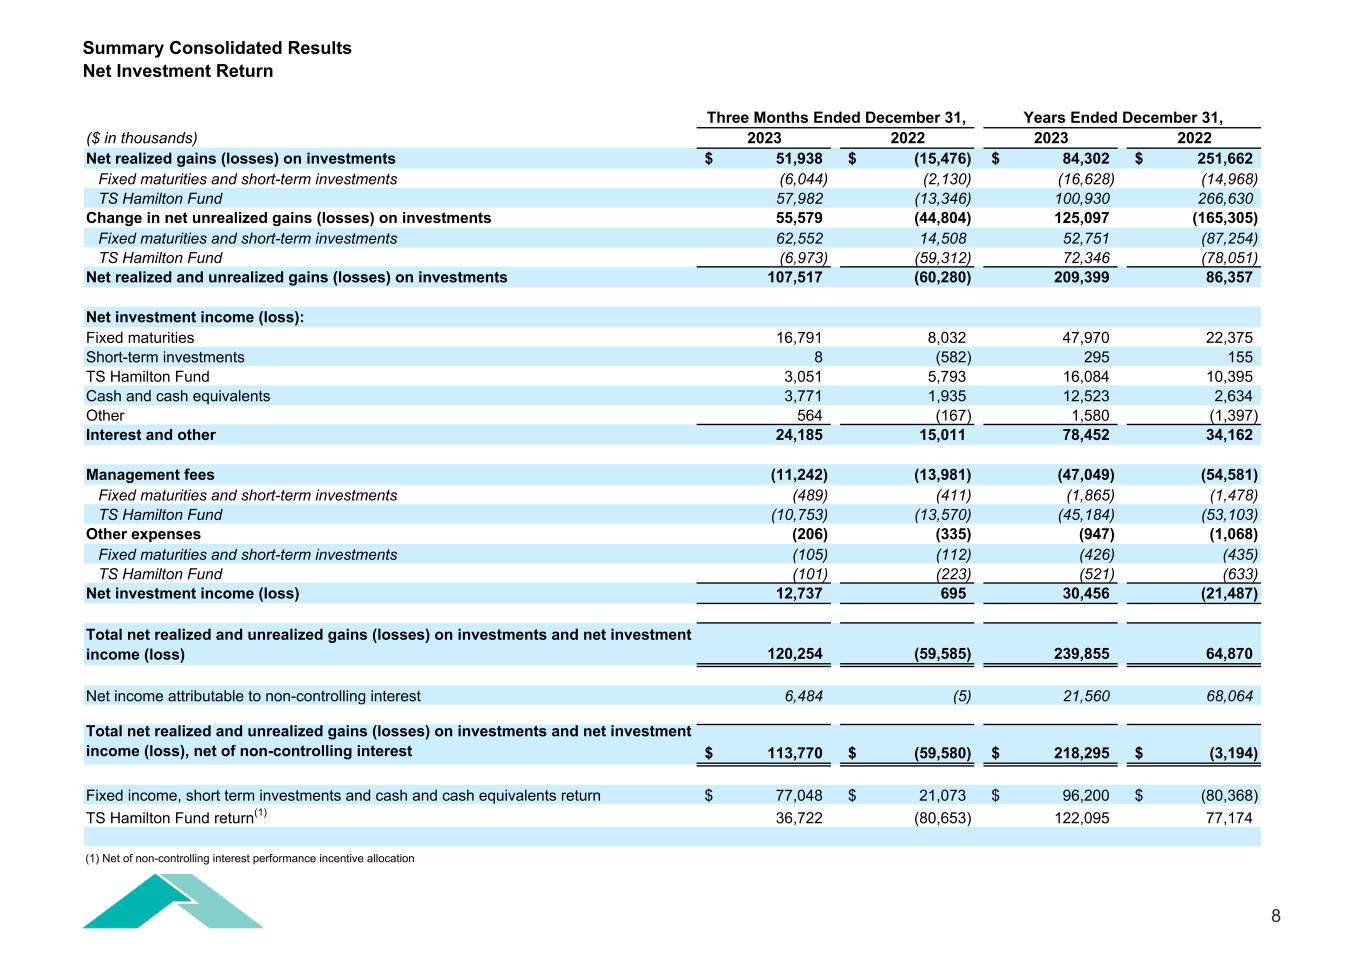

 
Summary Consolidated Results Net Investment Return Three Months Ended December 31, ($ in thousands) 2023 2022 2023 2022 Net realized gains (losses) on investments 51,938$ (15,476)$ 84,302$ 251,662$ Fixed maturities and short-term investments (6,044) (2,130) (16,628) (14,968) TS Hamilton Fund 57,982 (13,346) 100,930 266,630 Change in net unrealized gains (losses) on investments 55,579 (44,804) 125,097 (165,305) Fixed maturities and short-term investments 62,552 14,508 52,751 (87,254) TS Hamilton Fund (6,973) (59,312) 72,346 (78,051) Net realized and unrealized gains (losses) on investments 107,517 (60,280) 209,399 86,357 Net investment income (loss): Fixed maturities 16,791 8,032 47,970 22,375 Short-term investments 8 (582) 295 155 TS Hamilton Fund 3,051 5,793 16,084 10,395 Cash and cash equivalents 3,771 1,935 12,523 2,634 Other 564 (167) 1,580 (1,397) Interest and other 24,185 15,011 78,452 34,162 Management fees (11,242) (13,981) (47,049) (54,581) Fixed maturities and short-term investments (489) (411) (1,865) (1,478) TS Hamilton Fund (10,753) (13,570) (45,184) (53,103) Other expenses (206) (335) (947) (1,068) Fixed maturities and short-term investments (105) (112) (426) (435) TS Hamilton Fund (101) (223) (521) (633) Net investment income (loss) 12,737 695 30,456 (21,487) Total net realized and unrealized gains (losses) on investments and net investment income (loss) 120,254 (59,585) 239,855 64,870 Net income attributable to non-controlling interest 6,484 (5) 21,560 68,064 Total net realized and unrealized gains (losses) on investments and net investment income (loss), net of non-controlling interest 113,770$ (59,580)$ 218,295$ (3,194)$ Fixed income, short term investments and cash and cash equivalents return 77,048$ 21,073$ 96,200$ (80,368)$ TS Hamilton Fund return(1) 36,722 (80,653) 122,095 77,174 (1) Net of non-controlling interest performance incentive allocation Years Ended December 31, 8
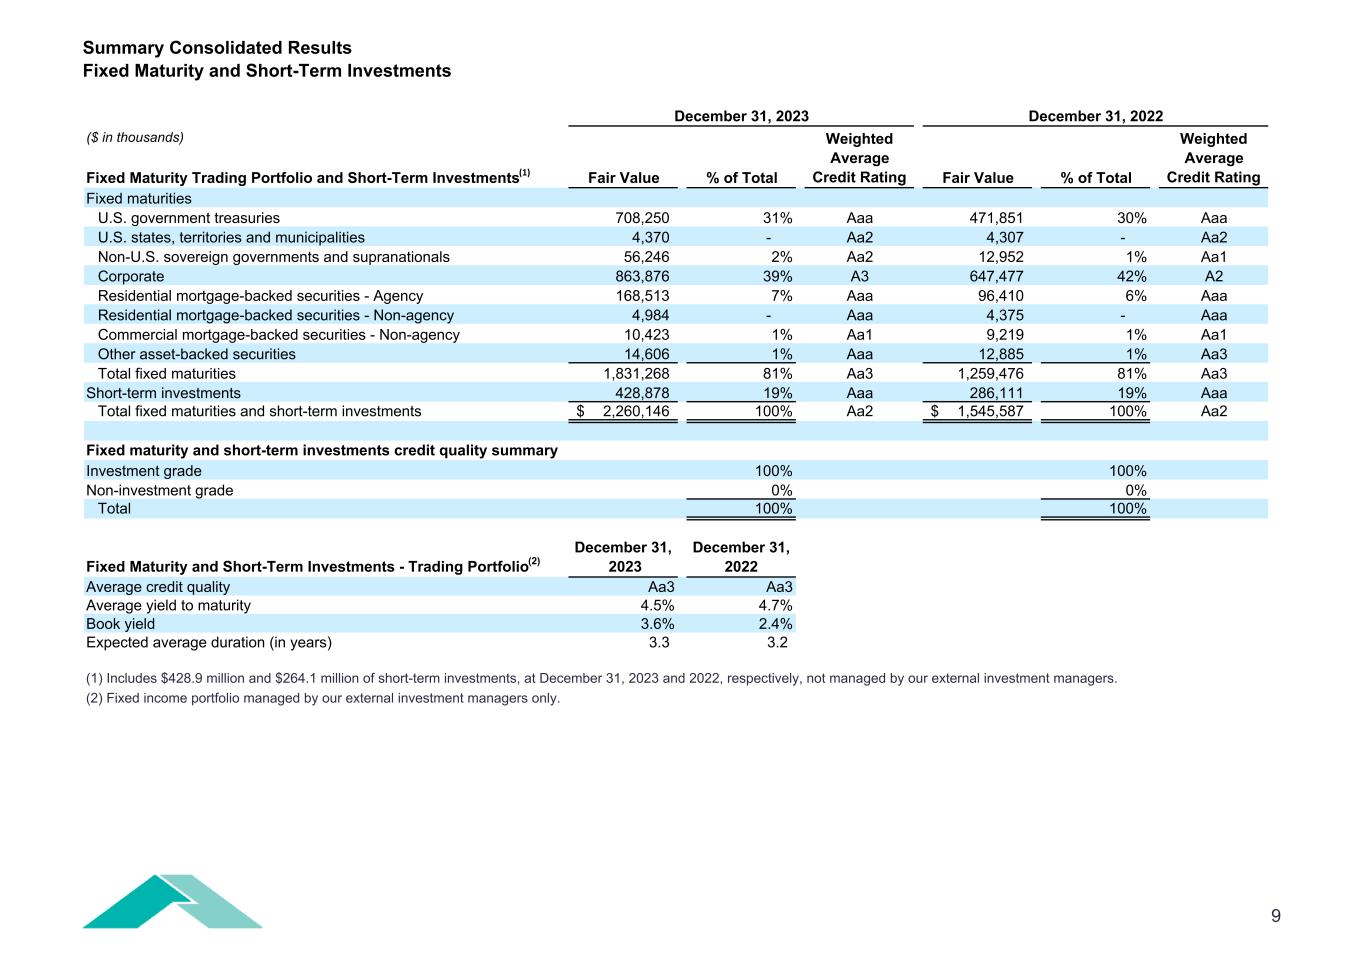

 
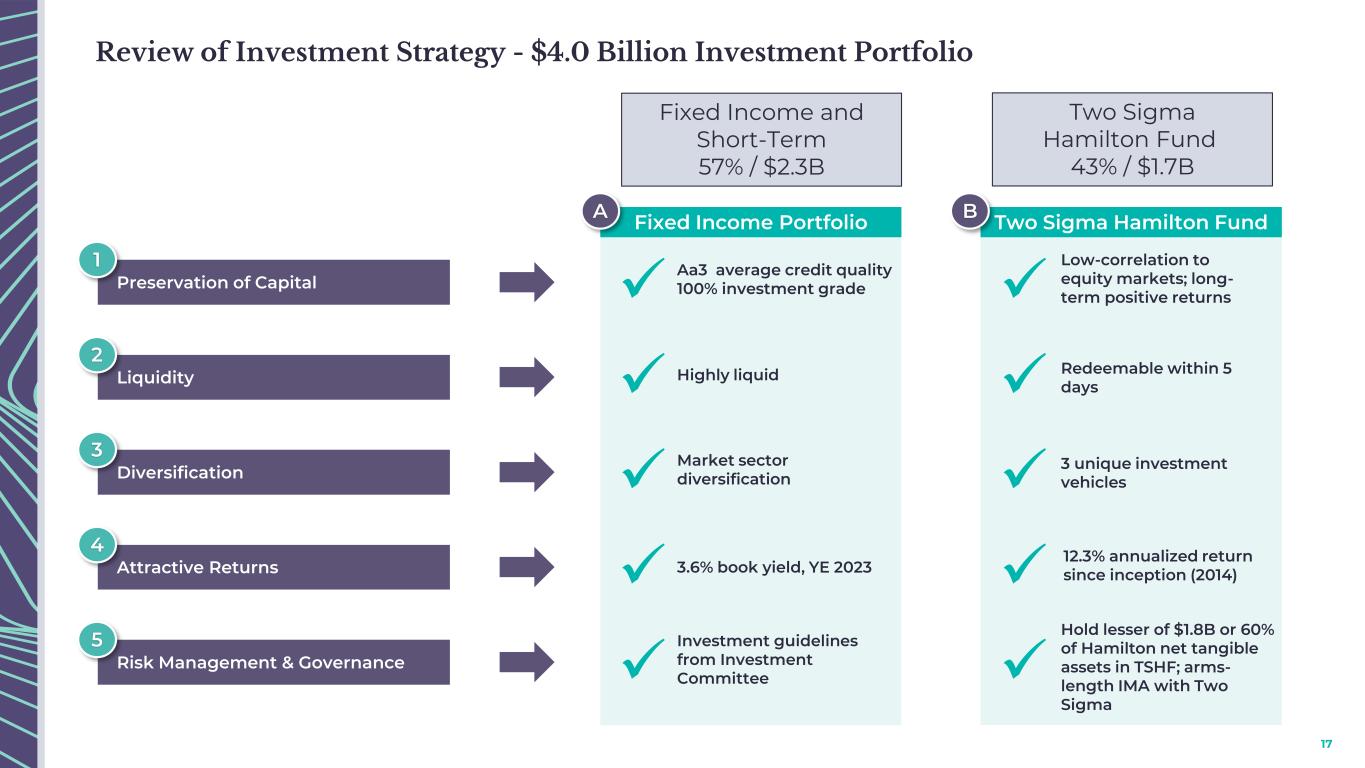
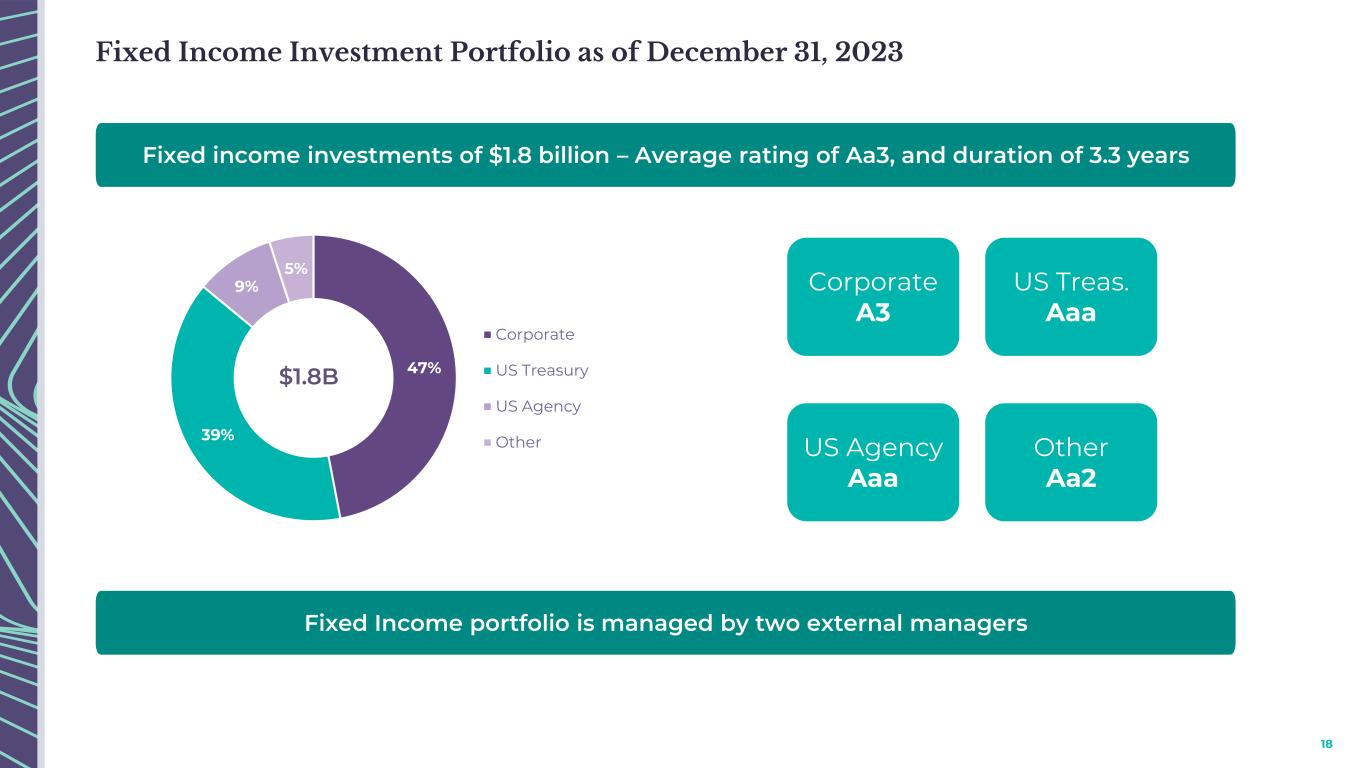
Summary Consolidated Results Fixed Maturity and Short-Term Investments December 31, 2023 December 31, 2022 ($ in thousands) Fixed Maturity Trading Portfolio and Short-Term Investments(1) Fair Value % of Total Weighted Average Credit Rating Fair Value % of Total Weighted Average Credit Rating Fixed maturities U.S. government treasuries 708,250 31% Aaa 471,851 30% Aaa U.S. states, territories and municipalities 4,370 - Aa2 4,307 - Aa2 Non-U.S. sovereign governments and supranationals 56,246 2% Aa2 12,952 1% Aa1 Corporate 863,876 39% A3 647,477 42% A2 Residential mortgage-backed securities - Agency 168,513 7% Aaa 96,410 6% Aaa Residential mortgage-backed securities - Non-agency 4,984 - Aaa 4,375 - Aaa Commercial mortgage-backed securities - Non-agency 10,423 1% Aa1 9,219 1% Aa1 Other asset-backed securities 14,606 1% Aaa 12,885 1% Aa3 Total fixed maturities 1,831,268 81% Aa3 1,259,476 81% Aa3 Short-term investments 428,878 19% Aaa 286,111 19% Aaa Total fixed maturities and short-term investments 2,260,146$ 100% Aa2 1,545,587$ 100% Aa2 Fixed maturity and short-term investments credit quality summary Investment grade 100% 100% Non-investment grade 0% 0% Total 100% 100% Fixed Maturity and Short-Term Investments - Trading Portfolio(2) December 31, 2023 December 31, 2022 Average credit quality Aa3 Aa3 Average yield to maturity 4.5% 4.7% Book yield 3.6% 2.4% Expected average duration (in years) 3.3 3.2 (1) Includes $428.9 million and $264.1 million of short-term investments, at December 31, 2023 and 2022, respectively, not managed by our external investment managers. (2) Fixed income portfolio managed by our external investment managers only. 9
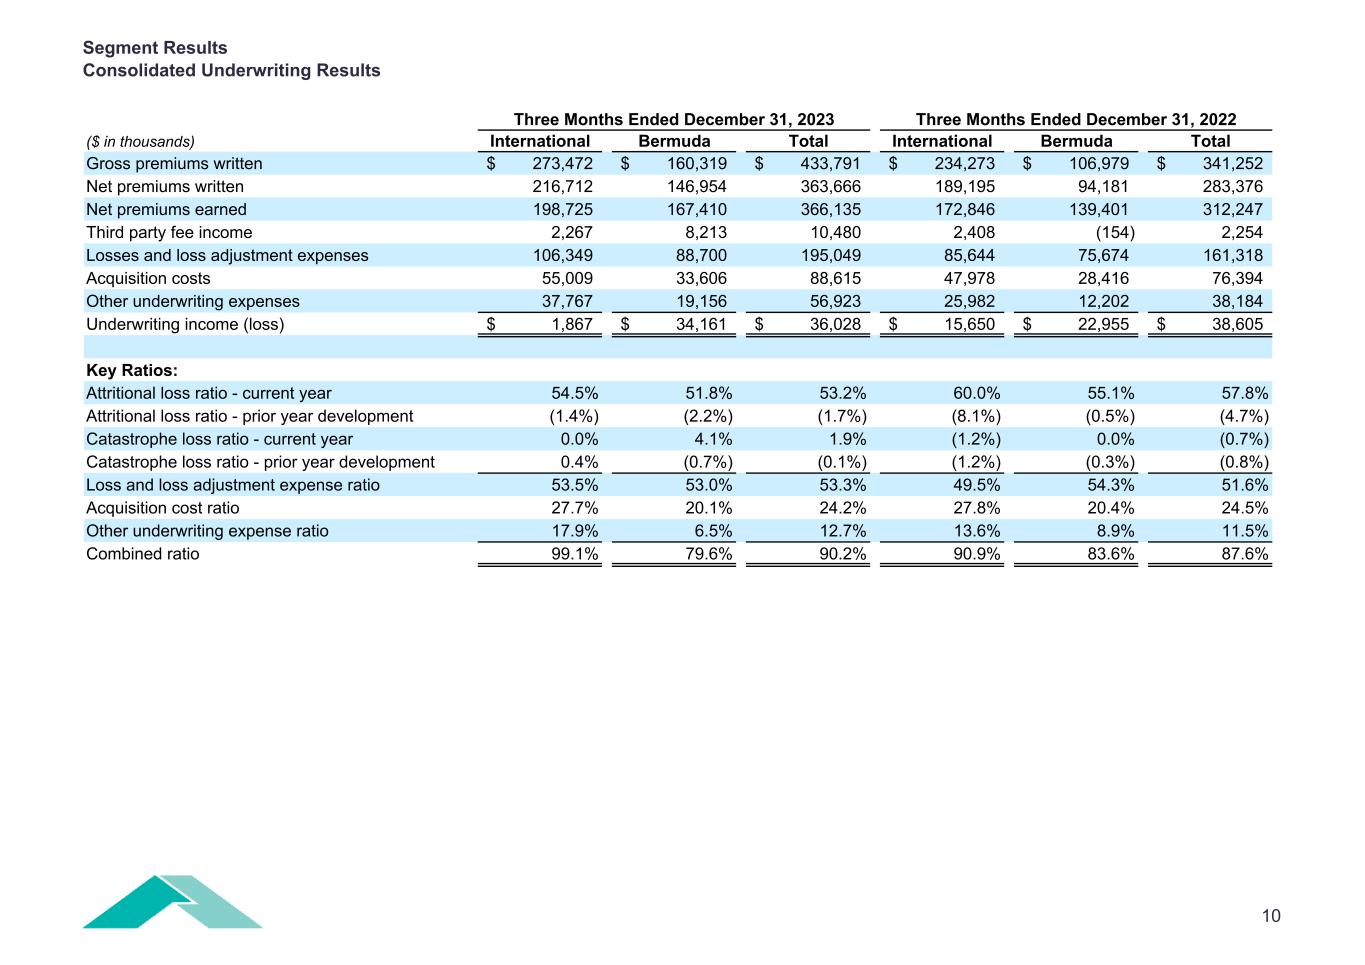

 
Segment Results Consolidated Underwriting Results Three Months Ended December 31, 2023 Three Months Ended December 31, 2022 ($ in thousands) International Bermuda Total International Bermuda Total Gross premiums written 273,472$ 160,319$ 433,791$ 234,273$ 106,979$ 341,252$ Net premiums written 216,712 146,954 363,666 189,195 94,181 283,376 Net premiums earned 198,725 167,410 366,135 172,846 139,401 312,247 Third party fee income 2,267 8,213 10,480 2,408 (154) 2,254 Losses and loss adjustment expenses 106,349 88,700 195,049 85,644 75,674 161,318 Acquisition costs 55,009 33,606 88,615 47,978 28,416 76,394 Other underwriting expenses 37,767 19,156 56,923 25,982 12,202 38,184 Underwriting income (loss) 1,867$ 34,161$ 36,028$ 15,650$ 22,955$ 38,605$ Key Ratios: Attritional loss ratio - current year 54.5% 51.8% 53.2% 60.0% 55.1% 57.8% Attritional loss ratio - prior year development (1.4%) (2.2%) (1.7%) (8.1%) (0.5%) (4.7%) Catastrophe loss ratio - current year 0.0% 4.1% 1.9% (1.2%) 0.0% (0.7%) Catastrophe loss ratio - prior year development 0.4% (0.7%) (0.1%) (1.2%) (0.3%) (0.8%) Loss and loss adjustment expense ratio 53.5% 53.0% 53.3% 49.5% 54.3% 51.6% Acquisition cost ratio 27.7% 20.1% 24.2% 27.8% 20.4% 24.5% Other underwriting expense ratio 17.9% 6.5% 12.7% 13.6% 8.9% 11.5% Combined ratio 99.1% 79.6% 90.2% 90.9% 83.6% 87.6% 10
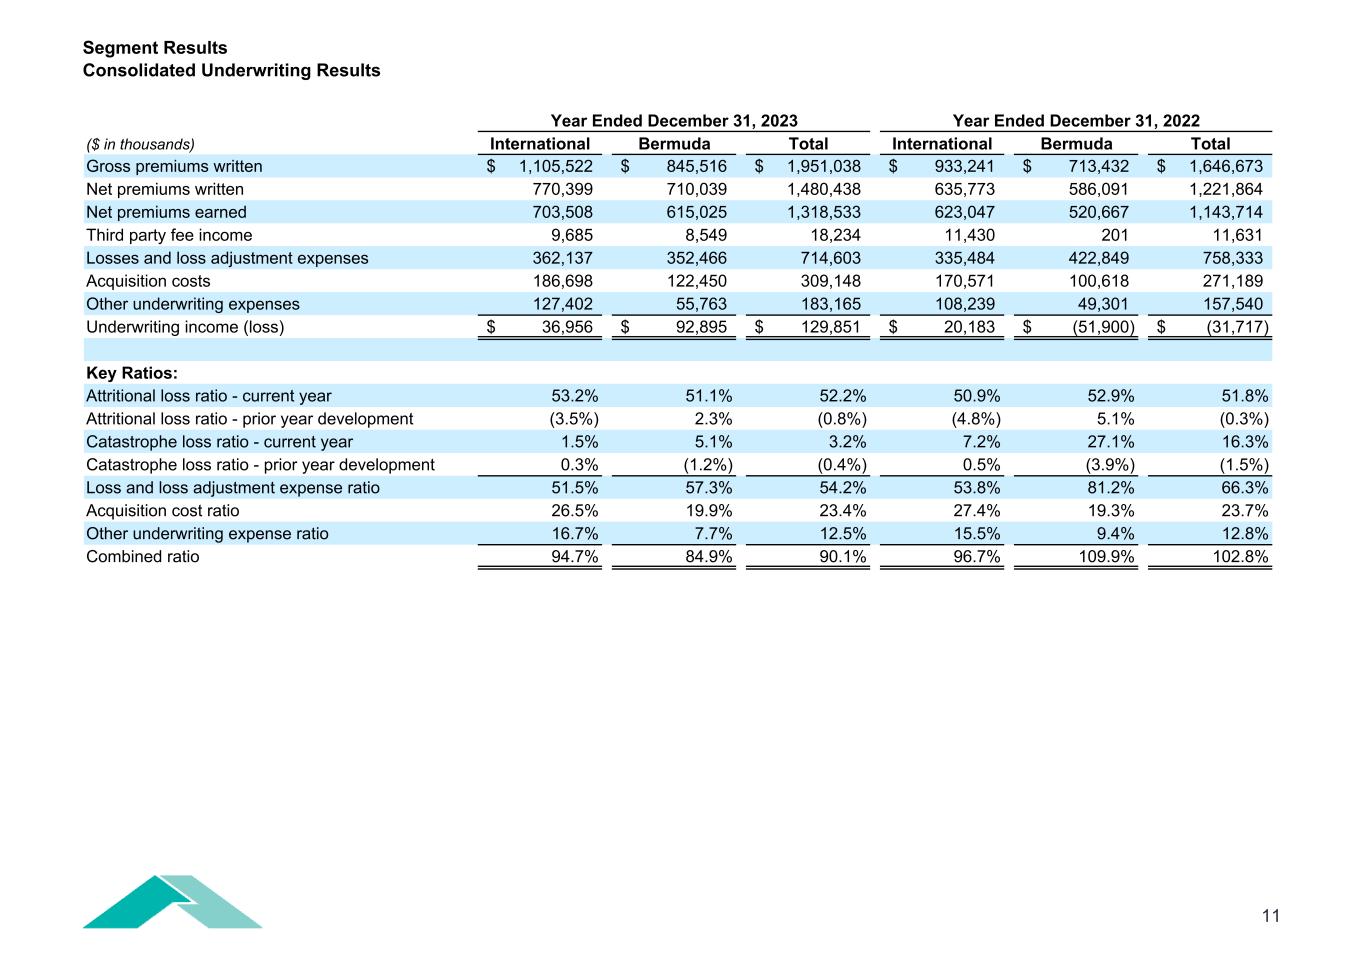

 
Segment Results Consolidated Underwriting Results Year Ended December 31, 2023 Year Ended December 31, 2022 ($ in thousands) International Bermuda Total International Bermuda Total Gross premiums written 1,105,522$ 845,516$ 1,951,038$ 933,241$ 713,432$ 1,646,673$ Net premiums written 770,399 710,039 1,480,438 635,773 586,091 1,221,864 Net premiums earned 703,508 615,025 1,318,533 623,047 520,667 1,143,714 Third party fee income 9,685 8,549 18,234 11,430 201 11,631 Losses and loss adjustment expenses 362,137 352,466 714,603 335,484 422,849 758,333 Acquisition costs 186,698 122,450 309,148 170,571 100,618 271,189 Other underwriting expenses 127,402 55,763 183,165 108,239 49,301 157,540 Underwriting income (loss) 36,956$ 92,895$ 129,851$ 20,183$ (51,900)$ (31,717)$ Key Ratios: Attritional loss ratio - current year 53.2% 51.1% 52.2% 50.9% 52.9% 51.8% Attritional loss ratio - prior year development (3.5%) 2.3% (0.8%) (4.8%) 5.1% (0.3%) Catastrophe loss ratio - current year 1.5% 5.1% 3.2% 7.2% 27.1% 16.3% Catastrophe loss ratio - prior year development 0.3% (1.2%) (0.4%) 0.5% (3.9%) (1.5%) Loss and loss adjustment expense ratio 51.5% 57.3% 54.2% 53.8% 81.2% 66.3% Acquisition cost ratio 26.5% 19.9% 23.4% 27.4% 19.3% 23.7% Other underwriting expense ratio 16.7% 7.7% 12.5% 15.5% 9.4% 12.8% Combined ratio 94.7% 84.9% 90.1% 96.7% 109.9% 102.8% 11
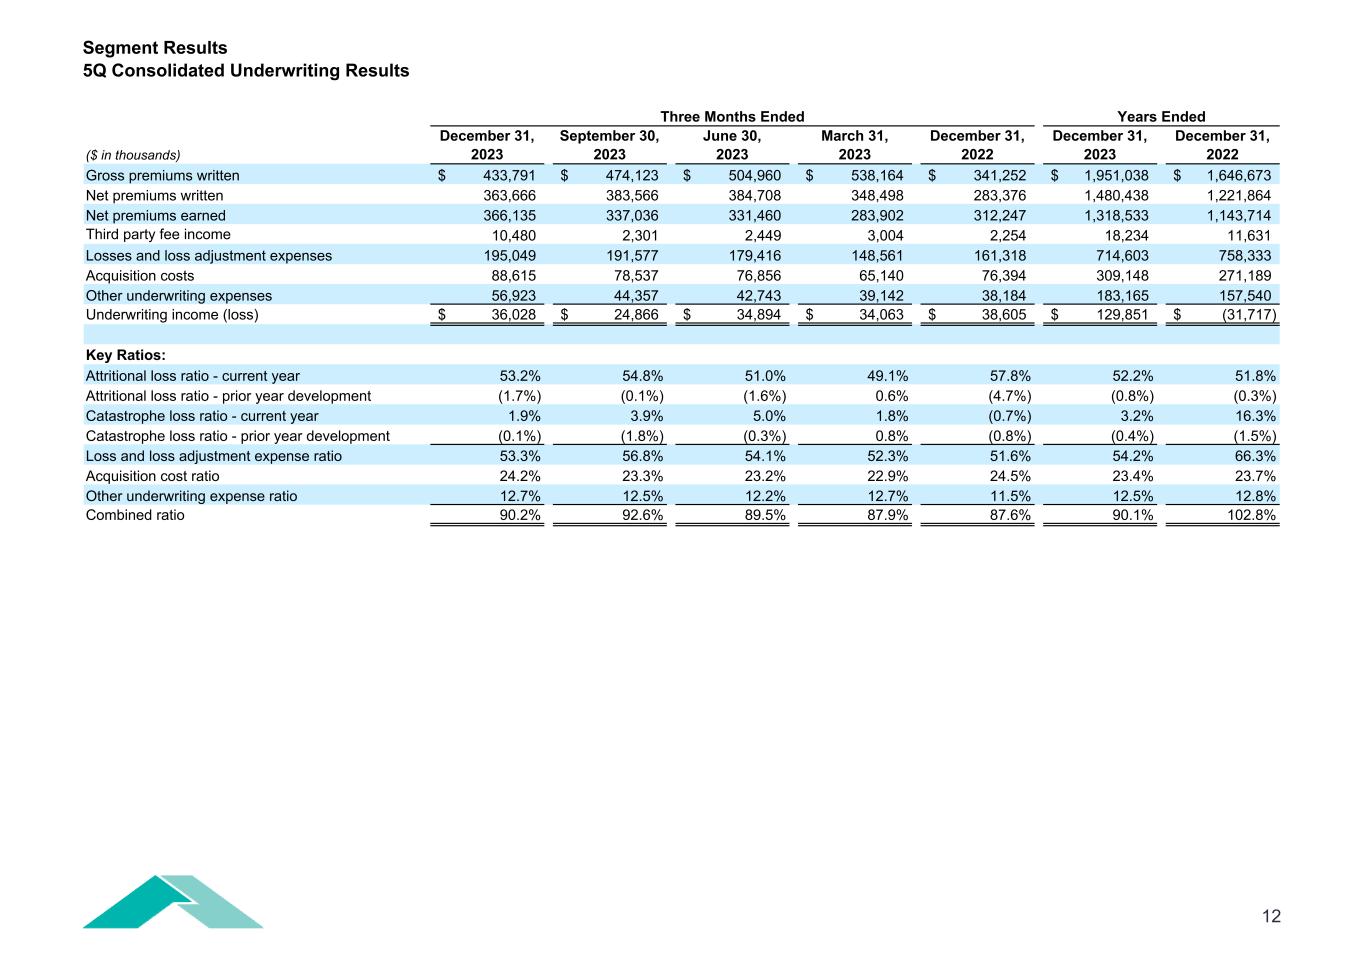

 
Segment Results 5Q Consolidated Underwriting Results Years Ended ($ in thousands) December 31, 2023 September 30, 2023 June 30, 2023 March 31, 2023 December 31, 2022 December 31, 2023 December 31, 2022 Gross premiums written 433,791$ 474,123$ 504,960$ 538,164$ 341,252$ 1,951,038$ 1,646,673$ Net premiums written 363,666 383,566 384,708 348,498 283,376 1,480,438 1,221,864 Net premiums earned 366,135 337,036 331,460 283,902 312,247 1,318,533 1,143,714 Third party fee income 10,480 2,301 2,449 3,004 2,254 18,234 11,631 Losses and loss adjustment expenses 195,049 191,577 179,416 148,561 161,318 714,603 758,333 Acquisition costs 88,615 78,537 76,856 65,140 76,394 309,148 271,189 Other underwriting expenses 56,923 44,357 42,743 39,142 38,184 183,165 157,540 Underwriting income (loss) 36,028$ 24,866$ 34,894$ 34,063$ 38,605$ 129,851$ (31,717)$ Key Ratios: Attritional loss ratio - current year 53.2% 54.8% 51.0% 49.1% 57.8% 52.2% 51.8% Attritional loss ratio - prior year development (1.7%) (0.1%) (1.6%) 0.6% (4.7%) (0.8%) (0.3%) Catastrophe loss ratio - current year 1.9% 3.9% 5.0% 1.8% (0.7%) 3.2% 16.3% Catastrophe loss ratio - prior year development (0.1%) (1.8%) (0.3%) 0.8% (0.8%) (0.4%) (1.5%) Loss and loss adjustment expense ratio 53.3% 56.8% 54.1% 52.3% 51.6% 54.2% 66.3% Acquisition cost ratio 24.2% 23.3% 23.2% 22.9% 24.5% 23.4% 23.7% Other underwriting expense ratio 12.7% 12.5% 12.2% 12.7% 11.5% 12.5% 12.8% Combined ratio 90.2% 92.6% 89.5% 87.9% 87.6% 90.1% 102.8% Three Months Ended 12
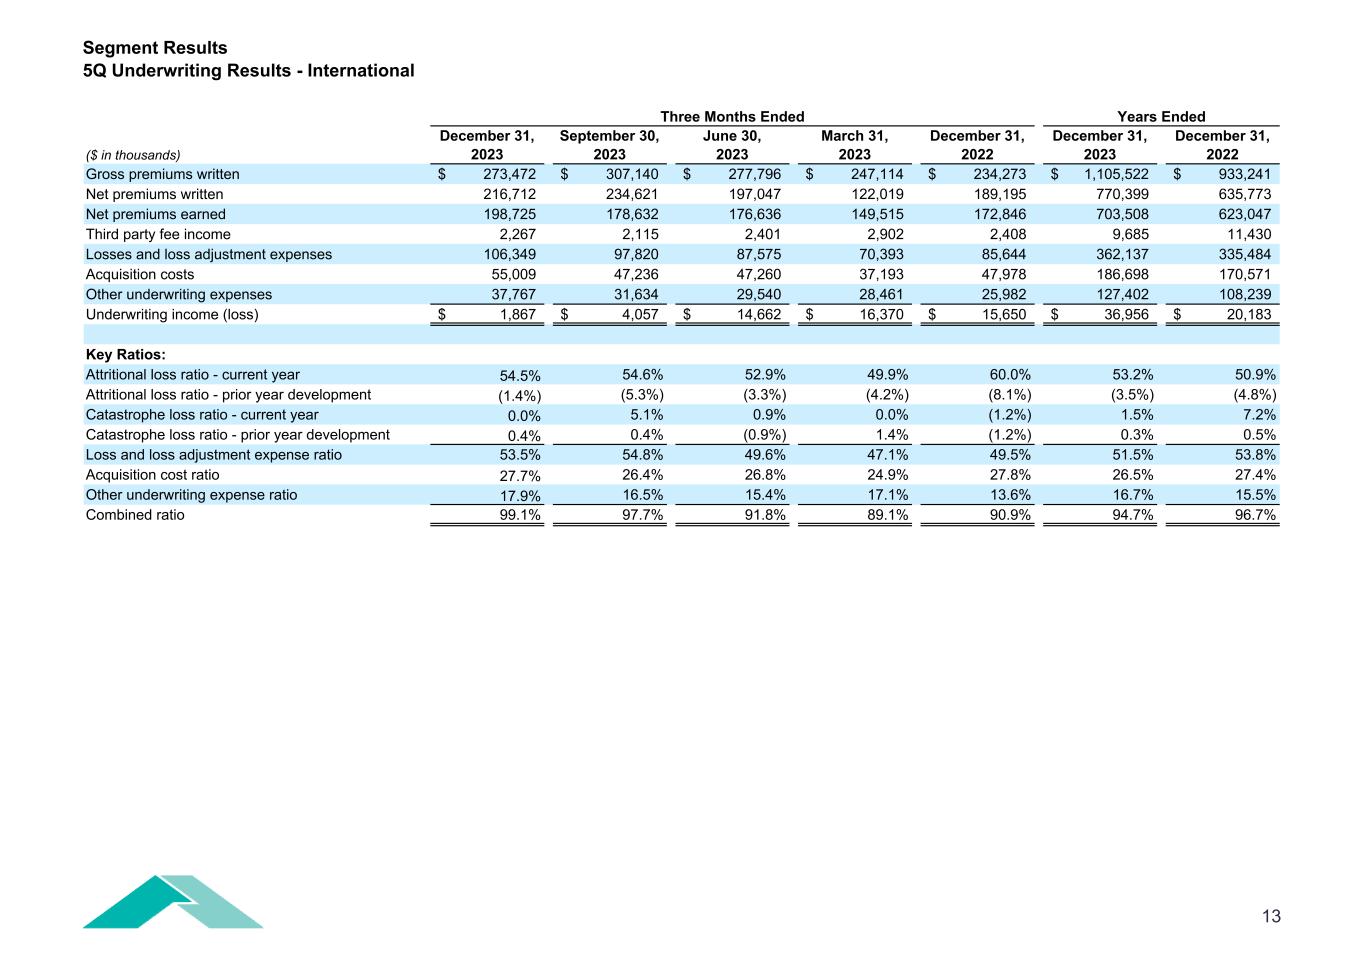

 
Segment Results 5Q Underwriting Results - International Years Ended ($ in thousands) December 31, 2023 September 30, 2023 June 30, 2023 March 31, 2023 December 31, 2022 December 31, 2023 December 31, 2022 Gross premiums written 273,472$ 307,140$ 277,796$ 247,114$ 234,273$ 1,105,522$ 933,241$ Net premiums written 216,712 234,621 197,047 122,019 189,195 770,399 635,773 Net premiums earned 198,725 178,632 176,636 149,515 172,846 703,508 623,047 Third party fee income 2,267 2,115 2,401 2,902 2,408 9,685 11,430 Losses and loss adjustment expenses 106,349 97,820 87,575 70,393 85,644 362,137 335,484 Acquisition costs 55,009 47,236 47,260 37,193 47,978 186,698 170,571 Other underwriting expenses 37,767 31,634 29,540 28,461 25,982 127,402 108,239 Underwriting income (loss) 1,867$ 4,057$ 14,662$ 16,370$ 15,650$ 36,956$ 20,183$ Key Ratios: Attritional loss ratio - current year 54.5% 54.6% 52.9% 49.9% 60.0% 53.2% 50.9% Attritional loss ratio - prior year development (1.4%) (5.3%) (3.3%) (4.2%) (8.1%) (3.5%) (4.8%) Catastrophe loss ratio - current year 0.0% 5.1% 0.9% 0.0% (1.2%) 1.5% 7.2% Catastrophe loss ratio - prior year development 0.4% 0.4% (0.9%) 1.4% (1.2%) 0.3% 0.5% Loss and loss adjustment expense ratio 53.5% 54.8% 49.6% 47.1% 49.5% 51.5% 53.8% Acquisition cost ratio 27.7% 26.4% 26.8% 24.9% 27.8% 26.5% 27.4% Other underwriting expense ratio 17.9% 16.5% 15.4% 17.1% 13.6% 16.7% 15.5% Combined ratio 99.1% 97.7% 91.8% 89.1% 90.9% 94.7% 96.7% Three Months Ended 13
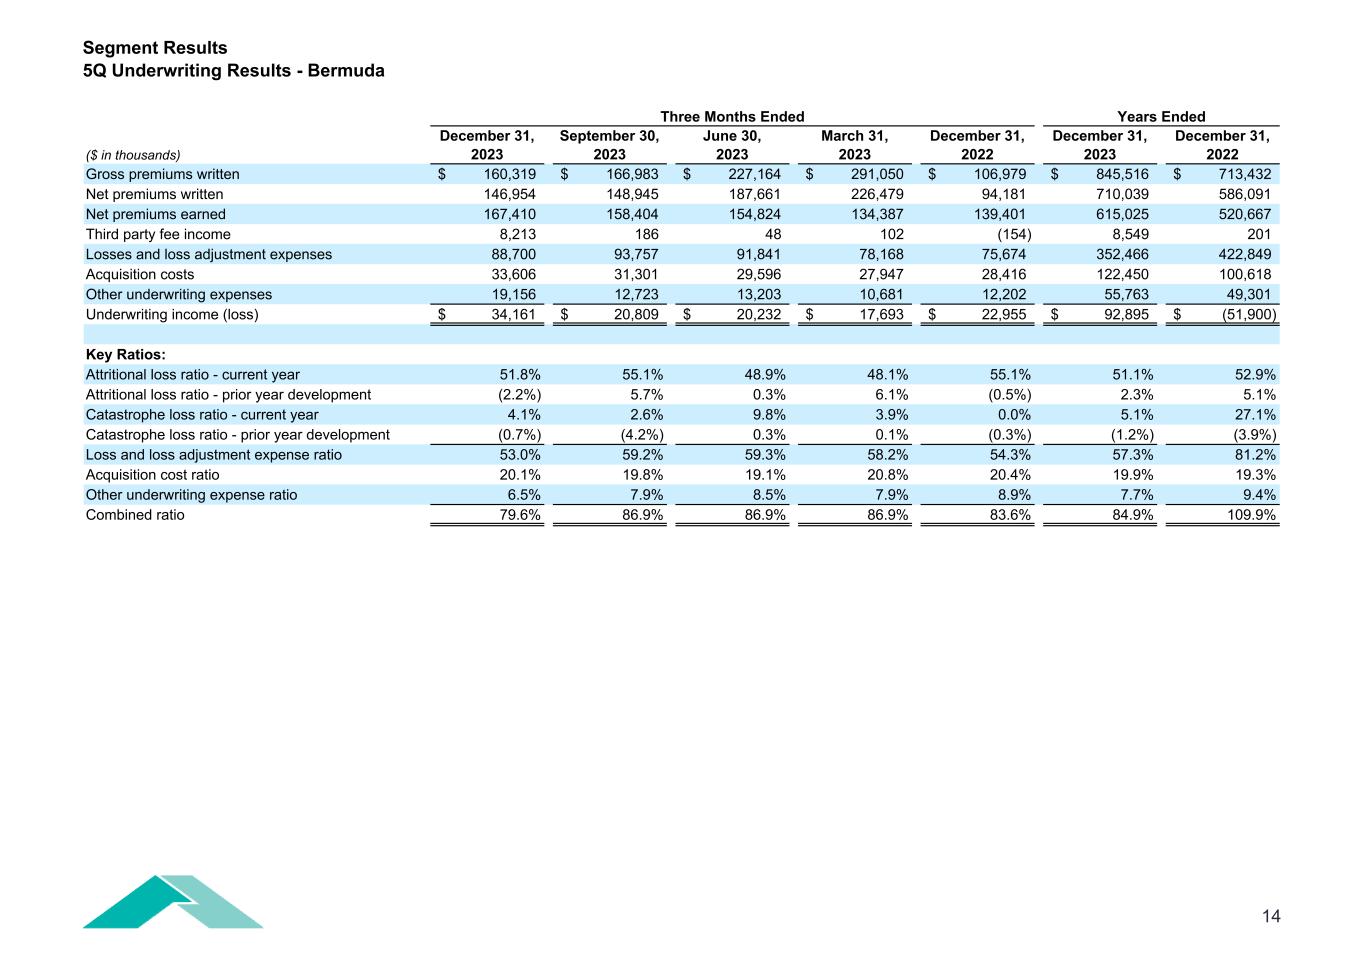

 
Segment Results 5Q Underwriting Results - Bermuda Years Ended ($ in thousands) December 31, 2023 September 30, 2023 June 30, 2023 March 31, 2023 December 31, 2022 December 31, 2023 December 31, 2022 Gross premiums written 160,319$ 166,983$ 227,164$ 291,050$ 106,979$ 845,516$ 713,432$ Net premiums written 146,954 148,945 187,661 226,479 94,181 710,039 586,091 Net premiums earned 167,410 158,404 154,824 134,387 139,401 615,025 520,667 Third party fee income 8,213 186 48 102 (154) 8,549 201 Losses and loss adjustment expenses 88,700 93,757 91,841 78,168 75,674 352,466 422,849 Acquisition costs 33,606 31,301 29,596 27,947 28,416 122,450 100,618 Other underwriting expenses 19,156 12,723 13,203 10,681 12,202 55,763 49,301 Underwriting income (loss) 34,161$ 20,809$ 20,232$ 17,693$ 22,955$ 92,895$ (51,900)$ Key Ratios: Attritional loss ratio - current year 51.8% 55.1% 48.9% 48.1% 55.1% 51.1% 52.9% Attritional loss ratio - prior year development (2.2%) 5.7% 0.3% 6.1% (0.5%) 2.3% 5.1% Catastrophe loss ratio - current year 4.1% 2.6% 9.8% 3.9% 0.0% 5.1% 27.1% Catastrophe loss ratio - prior year development (0.7%) (4.2%) 0.3% 0.1% (0.3%) (1.2%) (3.9%) Loss and loss adjustment expense ratio 53.0% 59.2% 59.3% 58.2% 54.3% 57.3% 81.2% Acquisition cost ratio 20.1% 19.8% 19.1% 20.8% 20.4% 19.9% 19.3% Other underwriting expense ratio 6.5% 7.9% 8.5% 7.9% 8.9% 7.7% 9.4% Combined ratio 79.6% 86.9% 86.9% 86.9% 83.6% 84.9% 109.9% Three Months Ended 14
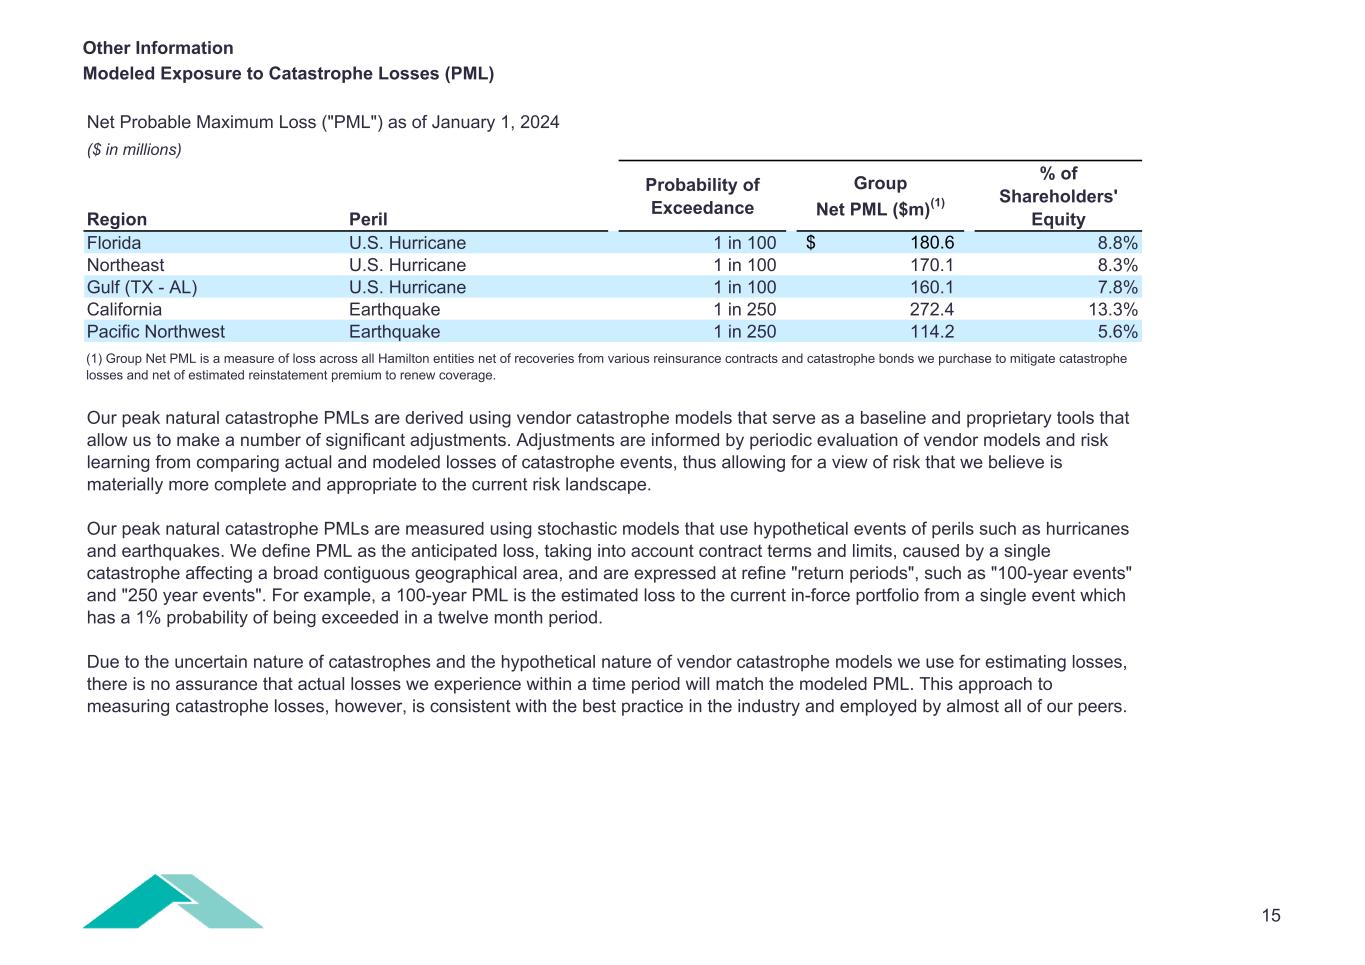

 
Other Information Modeled Exposure to Catastrophe Losses (PML) Net Probable Maximum Loss ("PML") as of January 1, 2024 ($ in millions) Region Peril Probability of Exceedance Group Net PML ($m)(1) % of Shareholders' Equity Florida U.S. Hurricane 1 in 100 180.6$ 8.8% Northeast U.S. Hurricane 1 in 100 170.1 8.3% Gulf (TX - AL) U.S. Hurricane 1 in 100 160.1 7.8% California Earthquake 1 in 250 272.4 13.3% Pacific Northwest Earthquake 1 in 250 114.2 5.6% (1) Group Net PML is a measure of loss across all Hamilton entities net of recoveries from various reinsurance contracts and catastrophe bonds we purchase to mitigate catastrophe losses and net of estimated reinstatement premium to renew coverage. Our peak natural catastrophe PMLs are derived using vendor catastrophe models that serve as a baseline and proprietary tools that allow us to make a number of significant adjustments. Adjustments are informed by periodic evaluation of vendor models and risk learning from comparing actual and modeled losses of catastrophe events, thus allowing for a view of risk that we believe is materially more complete and appropriate to the current risk landscape. Our peak natural catastrophe PMLs are measured using stochastic models that use hypothetical events of perils such as hurricanes and earthquakes. We define PML as the anticipated loss, taking into account contract terms and limits, caused by a single catastrophe affecting a broad contiguous geographical area, and are expressed at refine "return periods", such as "100-year events" and "250 year events". For example, a 100-year PML is the estimated loss to the current in-force portfolio from a single event which has a 1% probability of being exceeded in a twelve month period. Due to the uncertain nature of catastrophes and the hypothetical nature of vendor catastrophe models we use for estimating losses, there is no assurance that actual losses we experience within a time period will match the modeled PML. This approach to measuring catastrophe losses, however, is consistent with the best practice in the industry and employed by almost all of our peers. 15
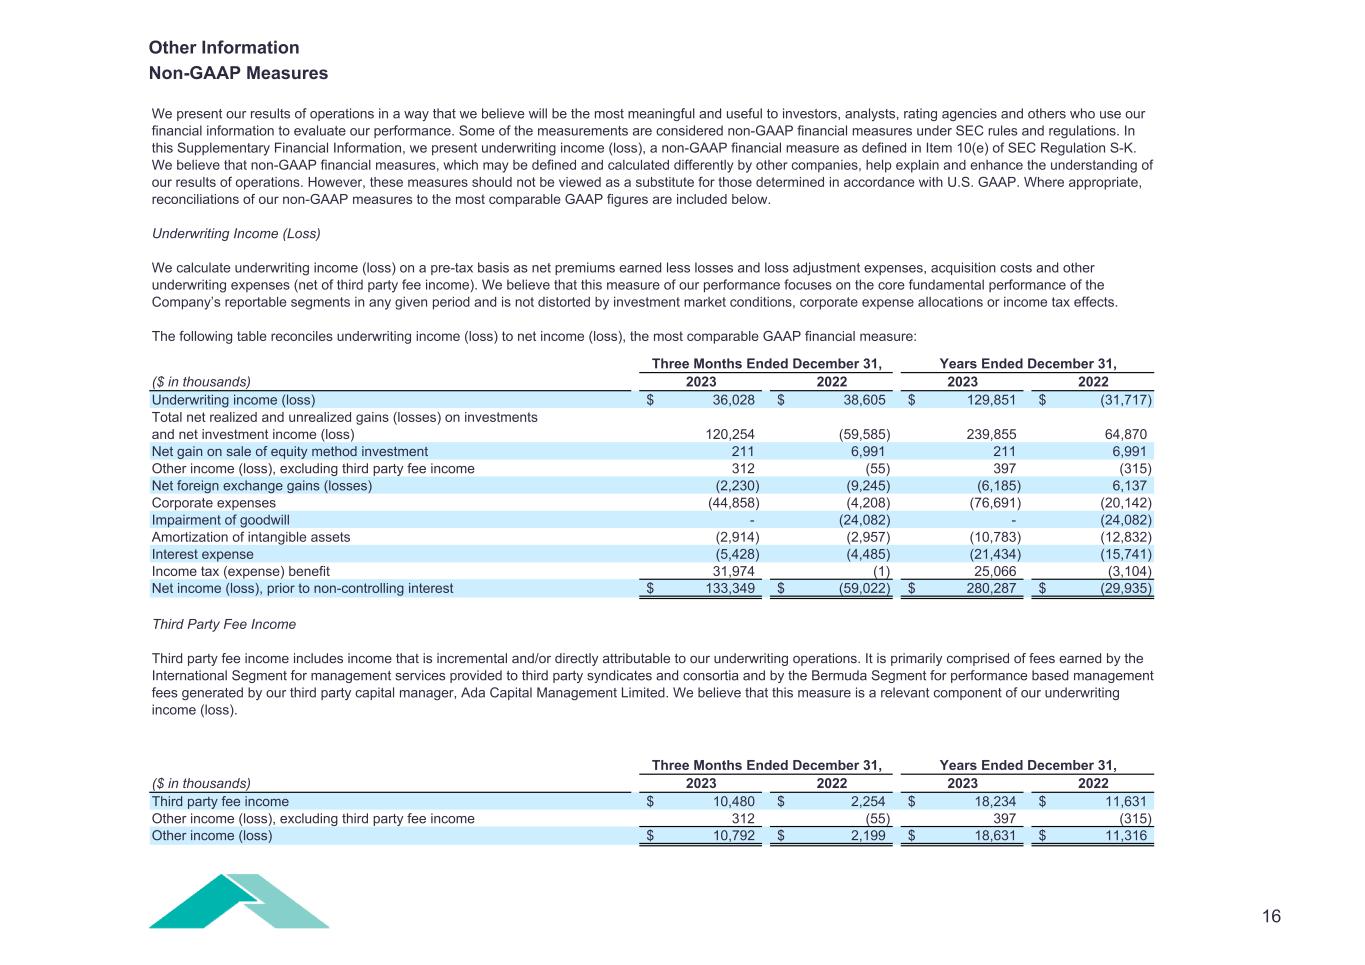

 
Other Information Non-GAAP Measures Three Months Ended December 31, ($ in thousands) 2023 2022 2023 2022 Underwriting income (loss) 36,028$ 38,605$ 129,851$ (31,717)$ Total net realized and unrealized gains (losses) on investments and net investment income (loss) 120,254 (59,585) 239,855 64,870 Net gain on sale of equity method investment 211 6,991 211 6,991 Other income (loss), excluding third party fee income 312 (55) 397 (315) Net foreign exchange gains (losses) (2,230) (9,245) (6,185) 6,137 Corporate expenses (44,858) (4,208) (76,691) (20,142) Impairment of goodwill - (24,082) - (24,082) Amortization of intangible assets (2,914) (2,957) (10,783) (12,832) Interest expense (5,428) (4,485) (21,434) (15,741) Income tax (expense) benefit 31,974 (1) 25,066 (3,104) Net income (loss), prior to non-controlling interest 133,349$ (59,022)$ 280,287$ (29,935)$ Three Months Ended December 31, ($ in thousands) 2023 2022 2023 2022 Third party fee income 10,480$ 2,254$ 18,234$ 11,631$ Other income (loss), excluding third party fee income 312 (55) 397 (315) Other income (loss) 10,792$ 2,199$ 18,631$ 11,316$ Third Party Fee Income Third party fee income includes income that is incremental and/or directly attributable to our underwriting operations. It is primarily comprised of fees earned by the International Segment for management services provided to third party syndicates and consortia and by the Bermuda Segment for performance based management fees generated by our third party capital manager, Ada Capital Management Limited. We believe that this measure is a relevant component of our underwriting income (loss). We present our results of operations in a way that we believe will be the most meaningful and useful to investors, analysts, rating agencies and others who use our financial information to evaluate our performance. Some of the measurements are considered non-GAAP financial measures under SEC rules and regulations. In this Supplementary Financial Information, we present underwriting income (loss), a non-GAAP financial measure as defined in Item 10(e) of SEC Regulation S-K. We believe that non-GAAP financial measures, which may be defined and calculated differently by other companies, help explain and enhance the understanding of our results of operations. However, these measures should not be viewed as a substitute for those determined in accordance with U.S. GAAP. Where appropriate, reconciliations of our non-GAAP measures to the most comparable GAAP figures are included below. Underwriting Income (Loss) We calculate underwriting income (loss) on a pre-tax basis as net premiums earned less losses and loss adjustment expenses, acquisition costs and other underwriting expenses (net of third party fee income). We believe that this measure of our performance focuses on the core fundamental performance of the Company’s reportable segments in any given period and is not distorted by investment market conditions, corporate expense allocations or income tax effects. The following table reconciles underwriting income (loss) to net income (loss), the most comparable GAAP financial measure: Years Ended December 31, Years Ended December 31, 16
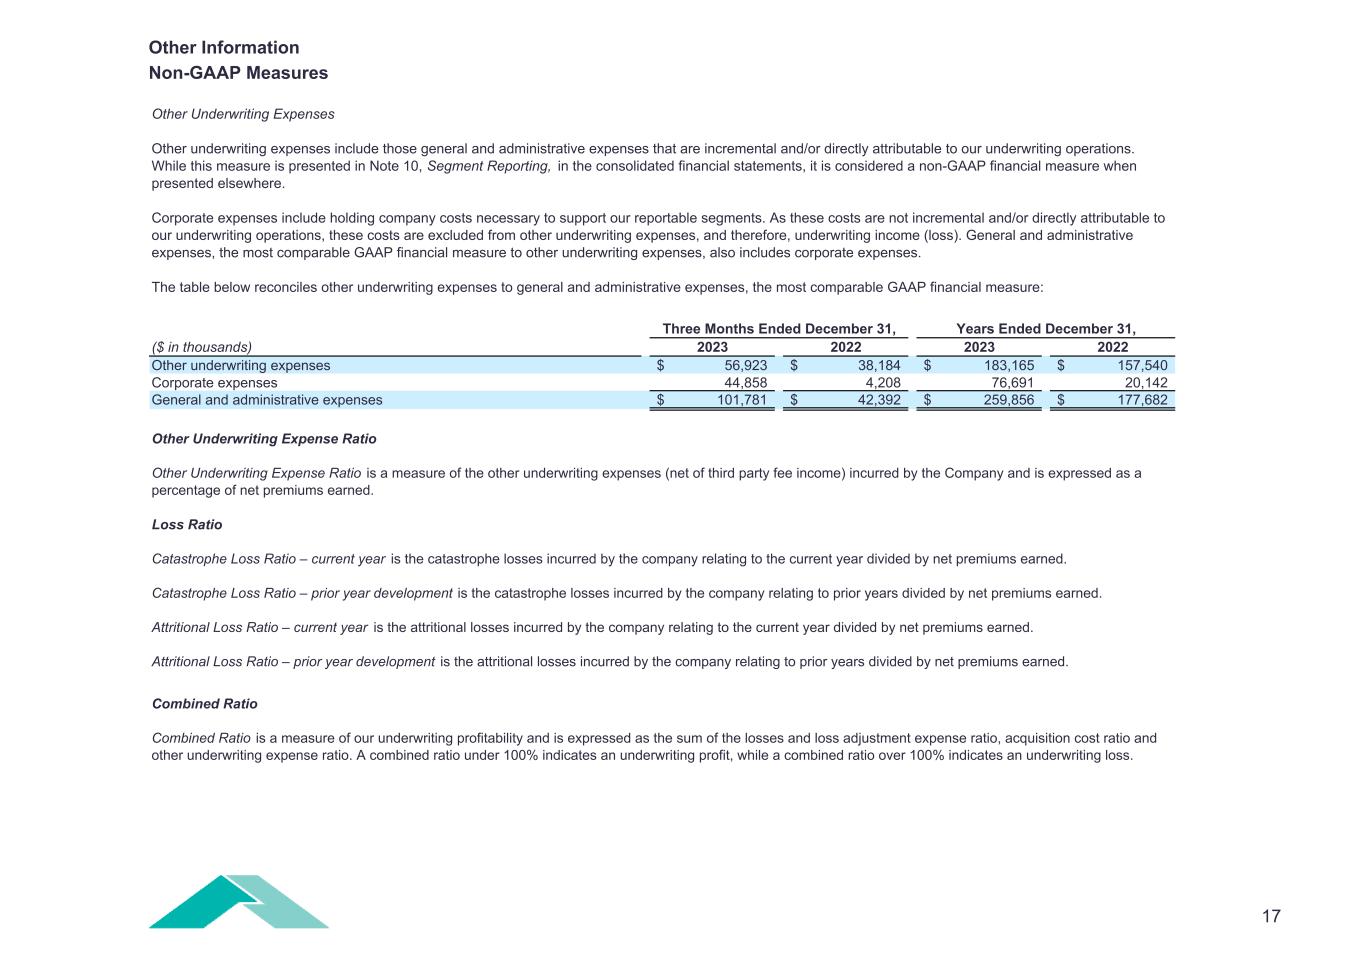

 
Other Information Non-GAAP Measures Three Months Ended December 31, ($ in thousands) 2023 2022 2023 2022 Other underwriting expenses 56,923$ 38,184$ 183,165$ 157,540$ Corporate expenses 44,858 4,208 76,691 20,142 General and administrative expenses 101,781$ 42,392$ 259,856$ 177,682$ Other Underwriting Expense Ratio Other Underwriting Expense Ratio is a measure of the other underwriting expenses (net of third party fee income) incurred by the Company and is expressed as a percentage of net premiums earned. Loss Ratio Catastrophe Loss Ratio – current year is the catastrophe losses incurred by the company relating to the current year divided by net premiums earned. Catastrophe Loss Ratio – prior year development is the catastrophe losses incurred by the company relating to prior years divided by net premiums earned. Attritional Loss Ratio – current year is the attritional losses incurred by the company relating to the current year divided by net premiums earned. Attritional Loss Ratio – prior year development is the attritional losses incurred by the company relating to prior years divided by net premiums earned. Other Underwriting Expenses Other underwriting expenses include those general and administrative expenses that are incremental and/or directly attributable to our underwriting operations. While this measure is presented in Note 10, Segment Reporting, in the consolidated financial statements, it is considered a non-GAAP financial measure when presented elsewhere. Corporate expenses include holding company costs necessary to support our reportable segments. As these costs are not incremental and/or directly attributable to our underwriting operations, these costs are excluded from other underwriting expenses, and therefore, underwriting income (loss). General and administrative expenses, the most comparable GAAP financial measure to other underwriting expenses, also includes corporate expenses. The table below reconciles other underwriting expenses to general and administrative expenses, the most comparable GAAP financial measure: Years Ended December 31, Combined Ratio Combined Ratio is a measure of our underwriting profitability and is expressed as the sum of the losses and loss adjustment expense ratio, acquisition cost ratio and other underwriting expense ratio. A combined ratio under 100% indicates an underwriting profit, while a combined ratio over 100% indicates an underwriting loss. 17

 
Investor Presentation Hamilton Insurance Group, Ltd. December 31, 2023


2 Special Note Regarding Forward-Looking Statements This information may contain forward-looking statements which reflect the Company's current views with respect to future events and financial performance and are made pursuant to the safe harbor provisions of the Private Securities Litigation Reform Act of 1995. Forward- looking statements are made based on management's current expectations and beliefs concerning future developments and their potential effects upon Hamilton. There can be no assurance that future developments affecting Hamilton will be those anticipated by management. Forward-looking statements include, without limitation, all matters that are not historical facts. These forward-looking statements are not a guarantee of future performance and involve risk and uncertainties, and there are certain important factors that could cause actual results to differ, possibly materially, from expectations or estimates reflected in such forward-looking statements, including the following: • our results of operations and financial condition could be adversely affected by unpredictable catastrophic events, global climate change or emerging claim and coverage issues; • our business could be materially adversely affected if we do not accurately assess our underwriting risk, our reserves are inadequate to cover our actual losses, our models or assessments and pricing of risks are incorrect or we lose important broker relationships; • the insurance and reinsurance business is historically cyclical and the pricing and terms for our products may decline, which would affect our profitability and ability to maintain or grow premiums; • we have significant foreign operations that expose us to certain additional risks, including foreign currency risks and political risk; • we do not control the allocations to and/or the performance of the Two Sigma Hamilton Fund, LLC ("TS Hamilton Fund")’s investment portfolio, and its performance depends on the ability of its investment manager, Two Sigma, to select and manage appropriate investments and we have a limited ability to withdraw our capital accounts; • Two Sigma Principals, LLC, Two Sigma and their respective affiliates have potential conflicts of interest that could adversely affect us; • the historical performance of Two Sigma Investments, LP ("Two Sigma") is not necessarily indicative of the future results of the TS Hamilton Fund’s investment portfolio or of our future results; • our ability to manage risks associated with macroeconomic conditions resulting from geopolitical and global economic events, including public health crises, current or anticipated military conflicts, terrorism, sanctions, rising energy prices, inflation and interest rates and other global events; • our ability to compete successfully with more established competitors and risks relating to consolidation in the reinsurance and insurance industries; • downgrades, potential downgrades or other negative actions by rating agencies;


3 • our dependence on key executives, including the potential loss of Bermudian personnel as a result of Bermuda employment restrictions, and the inability to attract qualified personnel, particularly in very competitive hiring conditions; • our dependence on letter of credit facilities that may not be available on commercially acceptable terms; • our potential need for additional capital in the future and the potential unavailability of such capital to us on favorable terms or at all; • the suspension or revocation of our subsidiaries’ insurance licenses; • risks associated with our investment strategy, including such risks being greater than those faced by competitors; • changes in the regulatory environment and the potential for greater regulatory scrutiny of the Company going forward; • a cyclical downturn of the reinsurance industry; • operational failures, failure of information systems or failure to protect the confidentiality of customer information, including by service providers, or losses due to defaults, errors or omissions by third parties or our affiliates; • we are a holding company with no direct operations, and our insurance and reinsurance subsidiaries’ ability to pay dividends and other distributions to us is restricted by law; • risks relating to our ability to identify and execute opportunities for growth or our ability to complete transactions as planned or realize the anticipated benefits of our acquisitions or other investments; • our potentially becoming subject to U.S. federal income taxation, Bermuda taxation or other taxes as a result of a change of tax laws or otherwise; • the potential characterization of us and/or any of our subsidiaries as a passive foreign investment company, or PFIC; • our potentially becoming subject to U.S. withholding and information reporting requirements under the U.S. Foreign Account Tax Compliance Act, or FATCA, provisions; • our costs will increase as a result of operating as a public company, and our management will be required to devote substantial time to complying with public company regulations; • if we were to identify a material weakness and were unable to remediate such material weakness, or fail to achieve and maintain effective internal controls, our operating results and financial condition could be impacted and the market price of our Class B common shares may be negatively affected; • the lack of a prior public market for our Class B common shares means our share price may be volatile and anti-takeover provisions contained in our organizational documents could delay management changes; • the potential that the market price of our Class B common shares could decline due to future sales of shares by our existing shareholders; • applicable insurance laws, which could make it difficult to effect a change of control of our company; • investors may have difficulties in serving process or enforcing judgments against us in the United States; and • other factors affecting future results disclosed in the Company’s filing with the SEC, including the Form 10-K. Special Note Regarding Forward-Looking Statements, continued


Introduction to Hamilton


5 Highly Entrepreneurial & Experienced Leadership Team Fostering an Attractive Culture Gemma Carreiro 20+ Years General Counsel Former: PartnerRe Pina Albo 30+ Years Group CEO Former: Munich Re Megan Thomas 20+ Years CEO, Hamilton Re Former: AIG Venkat Krishnamoorthy 30+ Years (IT Industry) Group CTO Former: Coleman Research Group Craig Howie 35+ Years Group CFO Former: Everest Anita Kuchma 35+ Years CEO, Hamilton Select Former: Munich Re Alex Baker 20+ Years Group Chief Risk Officer Former: Chubb Insurance Adrian Daws 20+ Years CEO, Hamilton Global Specialty Former: CNA Hardy Daniel Fisher 20+ Years Group Head of HR, Communications & Culture Former: Munich Re Executive Leadership In Good Company Management team with 230+ years of collective (re)insurance experience Highly Collaborative Service Oriented Open, Diverse and Inclusive Expertise Experienced Board of Directors


6 Hamilton Insurance Group – Overview Hamilton Insurance Group, Ltd. A global specialty (re)insurance company R e p o rt in g S e g m e n ts International 2023 GPW $1.1B Bermuda 2023 GPW $846m Hamilton Global Specialty (London & Dublin) Hamilton Select (USA) Hamilton Re (Bermuda)O p e ra ti n g P la tf o rm s 20 23 S e g m e n t C o m b in e d R at io 94.7% 84.9% 2023 Highlights $2.0B Gross Premiums Written $130m Underwriting Income 90.1% Combined Ratio $259m Net Income $4.0B Cash & Invested Assets $2.0B Shareholders’ Equity 550+ Employees A-/A* (Positive Outlook) Financial Strength Rating * Ratings of Hamilton Insurance Group, Ltd. AM Best FSR of A-; KBRA FSR of A.


7 ▪ Lloyd’s Syndicate 4000 ▪ Hamilton Insurance DAC (Ireland) ▪ HMGA Americas (In House US MGA) ▪ 90+ underwriters Insurance 57% Reinsurance 43% Insurance / Reinsurance GPW: $2.0B Casualty 46% Specialty 31% Property 23% Class of Business GPW: $2.0B International 57% Bermuda 43% Business Segments GPW: $2.0B Efficient Global Footprint A Scaled Global Operation – Managing Across Market Cycles Our business is diversified by (re)insurance, main classes of business, and segment/geography Two Business Segments and Three Underwriting Platforms Hamilton Global Specialty Hamilton Select Hamilton Re ▪ Hamilton Select ▪ 40+ underwriters ▪ Hamilton Re ▪ Hamilton Re US ▪ 25+ underwriters International Bermuda Three complementary underwriting platforms to maximize returns through the cycle


8 Hamilton is Guided by Four Business Imperatives • Data driven, disciplined underwriting & risk-management culture • Significant reduction of volatility from natural catastrophe events Sustainable Underwriting Profitability • 3 complementary underwriting platforms with expertise in cycle management • Double digit growth every year since 2018 reflecting cycle dynamicsStrategic Growth • Combination of proprietary and partner technology solutions • Enable data informed decisions, operational efficiency and digital automationTechnology Enablement • Attracting and retaining top talent in a highly competitive marketplace • Collaborative culture with high accountability and ownership mentalityMagnet for Talent You’re “In good company” with Hamilton 1 2 3 4


9 87% 85% 71% 68% 60% 54% 52% 54% 57% 53% 38% 41% 40% 38% 37% 36% 36% 35% 36% 37% 125% 126% 111% 106% 96% 90% 88% 90% 93% 90% 2018 2019 2020 2021 2022 2023 Q1 2023 Q2 2023 Q3 2023 Q4 2023 $571 $731 $1,087 $1,447 $1,647 $1,951 2018 2019 2020 2021 2022 2023 Hamilton Group – Strategic Growth and Sustainable Underwriting Profitability Hamilton Group - Gross Premiums Written Hamilton Group - Combined Ratio (1) Loss Ratio Expense Ratio (2) 1) Numbers may not add due to rounding. 2) Combined ratio when including impacts of Ukraine Conflict of 103%. Double digit top line growth with bottom line results


Segment Results


11 Hamilton International: Market Leading Writer of Specialty (Re)Insurance Business Specialty insurance products written in Lloyd’s, HIDAC, Hamilton Americas and Hamilton Select 12% 45% 43% Property Casualty Specialty 2023 GPW Business Mix 90% 10% Insurance Reinsurance $1.1B Leading specialty insurance business with a track record of profitability and low volatility Specialized underwriters leading consortia on behalf of other brand name peers Ability to offer both Lloyd’s and company paper across multiple platforms Longstanding client & broker relationships fuel growth in core E&S markets Limited legacy exposures Hamilton Select: New US domiciled carrier writing SME hard-to-place E&S business Hamilton Select $78m / 7%


12 84% 103% 65% 63% 50% 52% 47% 50% 55% 54% 52% 50% 46% 44% 43% 43% 42% 42% 43% 46% 136% 153% 111% 108% 93% 95% 89% 92% 98% 99% 2018 2019 2020 2021 2022 2023 Q1 2023 Q2 2023 Q3 2023 Q4 2023 (2) Hamilton made transformative acquisition of Pembroke Managing Agency in 2019 International Segment: Measured Growth Following Significant Acquisition in 2019 $176 $277 $662 $892 $933 $1,106 2018 2019 2020 2021 2022 2023 International Segment - Gross Premiums Written International Segment - Combined Ratio Loss Ratio Expense Ratio 1) Numbers may not add due to rounding. 2) Combined ratio when including impacts of Ukraine Conflict of 97%.


13 Established, scaled and scalable platform with broad, diversified client base Underwriting profitability through portfolio optimization and cycle management Accelerate targeted growth in current favorable reinsurance market, complementing cat offerings with other lines of business Ability to write reinsurance business through both Bermuda and US underwriting teams Clear, consistent appetite and responsive service rewarded by clients and brokers Data-driven, digital approach supports underwriting and operational efficiencies Hamilton Bermuda: Well Diversified Writer of Property, Casualty and Specialty Classes Underwriting-focused operation with strong foundation to capture growth opportunities 38% 47% 15% Property Casualty Specialty 14% 86% Insurance Reinsurance 2023 GPW Business Mix $846m


14 Current portfolio mix is well balanced by class of business and with reduced nat cat volatility Bermuda Segment: Strategic Growth Following Portfolio Optimization 88% 74% 81% 75% 72% 57% 58% 59% 59% 53% 34% 36% 31% 29% 29% 28% 29% 28% 28% 27% 122% 110% 111% 104% 101% 85% 87% 87% 87% 80% 2018 2019 2020 2021 2022 2023 Q1 2023 Q2 2023 Q3 2023 Q4 2023 $396 $454 $425 $554 $713 $846 2018 2019 2020 2021 2022 2023 Bermuda Segment - Gross Premiums Written Bermuda Segment - Combined Ratio Loss Ratio Expense Ratio 1) Numbers may not add due to rounding. 2) Combined ratio when including impacts of Ukraine Conflict of 110%. (2)


Invested Assets


16 Focused on delivering a combination of stable investment income and low-correlated absolute returns Hamilton Invested Assets $4.0 billion in invested assets at December 31, 2023 Two distinct investment portfolios: fixed income and total return Fixed income portfolio focuses on preservation of capital and high liquidity Total return portfolio provides uncorrelated returns with moderate volatility and high liquidity Portfolio mix of 57% fixed income and short-term/43% total return at December 31, 2023


17 Two Sigma Hamilton FundFixed Income PortfolioA B Preservation of Capital 1 Liquidity 2 Diversification 3 Attractive Returns 4 Risk Management & Governance 5 ✓ Aa3 average credit quality 100% investment grade ✓ Highly liquid ✓ Market sector diversification ✓ 3.6% book yield, YE 2023 ✓ Investment guidelines from Investment Committee ✓ Low-correlation to equity markets; long- term positive returns ✓ Redeemable within 5 days ✓ 3 unique investment vehicles ✓ 12.3% annualized return since inception (2014) ✓ Hold lesser of $1.8B or 60% of Hamilton net tangible assets in TSHF; arms- length IMA with Two Sigma Review of Investment Strategy - $4.0 Billion Investment Portfolio Fixed Income and Short-Term 57% / $2.3B Two Sigma Hamilton Fund 43% / $1.7B


18 Fixed Income Investment Portfolio as of December 31, 2023 47% 39% 9% 5% Corporate US Treasury US Agency Other $1.8B Corporate A3 US Treas. Aaa US Agency Aaa Other Aa2 Fixed Income portfolio is managed by two external managers Fixed income investments of $1.8 billion – Average rating of Aa3, and duration of 3.3 years


19 Overview of Two Sigma and TSHF Diversified fund focused on liquid strategies in global equities, fixed income, futures, and FX markets ▪ Two Sigma Investment Management aims to deliver low-correlated absolute returns through the systematic application of fundamental, technical, alpha capture and event models ▪ Manages nearly $60B in assets ▪ Deploys and seeks to continuously improve intelligent investment management systems first created in 2001 ▪ Proven, industry leading approach to data science and analytics ▪ Over 2,000 employees of which ~1,000 are research and development professionals ▪ Seeks to systematically manage risk with human oversight at multiple levels through the investment process ▪ TSHF is a diversified fund focused on liquid strategies in fixed income, global equities, futures and FX markets Two Sigma Hamilton Fund $1.7B TSHF as of December 31, 2023 12.3% Average annual returns 2014-2023 Dedicated- fund of one 3 portfolios 2 equity focused, 1 macro focused Highly liquid Investments TSHF Annual Returns Since 2018 Two Sigma Hamilton Fund, LLC (“TSHF”) 1.33 Sharpe Ratio since inception 19.9% 6.1% -4.6% 17.7% 4.6% 7.6% 2018 2019 2020 2021 2022 2023 1) TSHF Annual Returns correspond to Hamilton Fiscal Year which was Dec 1- Nov 30 until FY 2022.


Investing in Hamilton


21 5 A scaled, diversified, global specialty insurance and reinsurance operation Highly entrepreneurial & experienced leadership team fostering a distinctive and attractive culture Disciplined and data-driven underwriting approach to drive sustainable profitability Strong balance sheet with significant financial flexibility Proprietary technology infrastructure to support underwriting and operational efficiencies Differentiated asset management capabilities with Two Sigma to enhance investment returns Ability to grow profitably, navigating across all market cycles Poised to Deliver Significant Shareholder Value Hamilton Insurance Group - Who We Are Today


Hamilton Insurance Group, Ltd. Wellesley House North, 1st Floor 90 Pitts Bay Road, Pembroke HM08, Bermuda +1 (441) 405 5200 hamiltongroup.com Contact us at: [email protected]