Exhibit 99.1
 |
 |
HECLA ANNOUNCES FULL YEAR PRODUCTION AND
2026 GUIDANCE
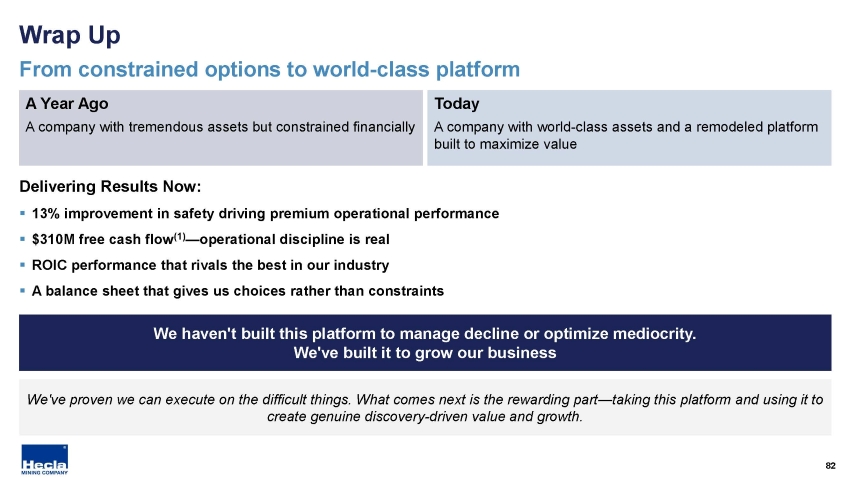
Silver and gold production achieve top end of production guidance,
Lucky Friday achieves record production
COEUR D'ALENE, IDAHO -- January 26, 2026 - Hecla Mining Company (NYSE:HL) ("Hecla" or the "Company") today announced its preliminary metals production for the fourth quarter and full year of 2025 and provided 2026 Guidance.
HIGHLIGHTS
|
● |
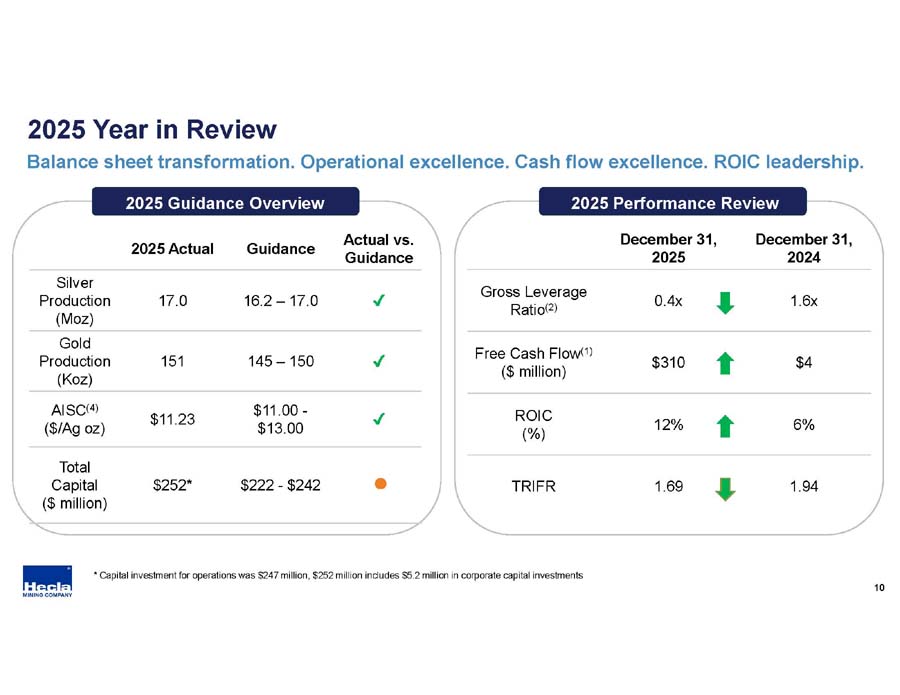
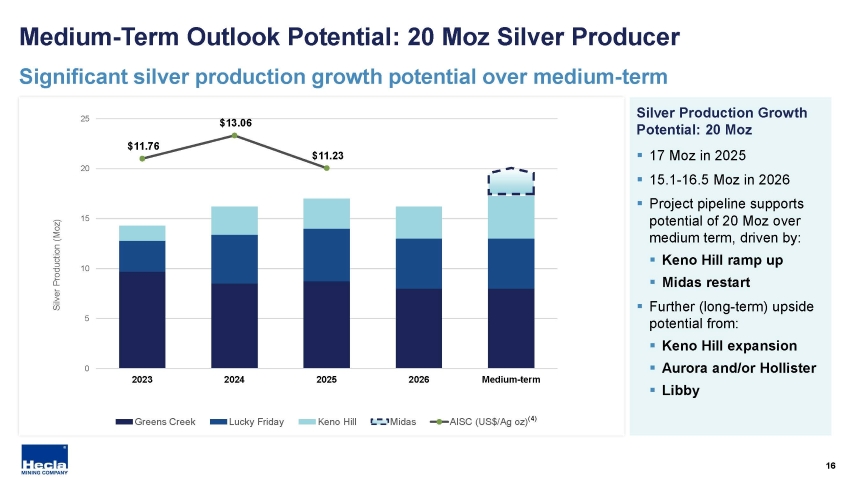
Silver production of 17.0 million ounces exceeded 2024 production by over 5% and came in at the top end of consolidated silver production guidance. |
|
● |
All silver operations met production guidance, with Lucky Friday producing 5.3 million ounces and exceeding the top end of its guidance range. |
|
● |
Consolidated gold production of 150,509 ounces exceeded top end of gold guidance of 150,000 gold ounces. |
2026 GUIDANCE
|
● |
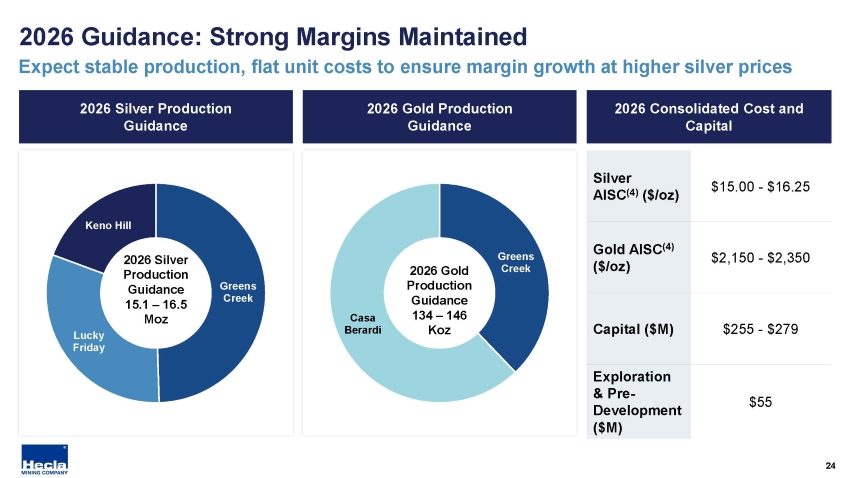
Consolidated silver production guidance of 15.1-16.5 million ounces, consolidated gold production guidance of 134-146 thousand ounces. |
|
● |
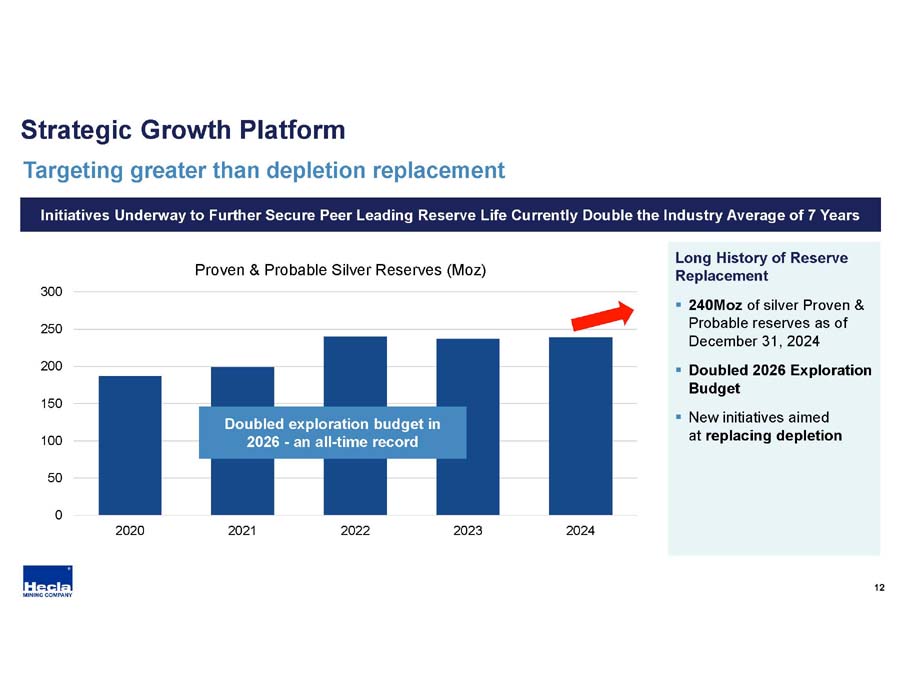
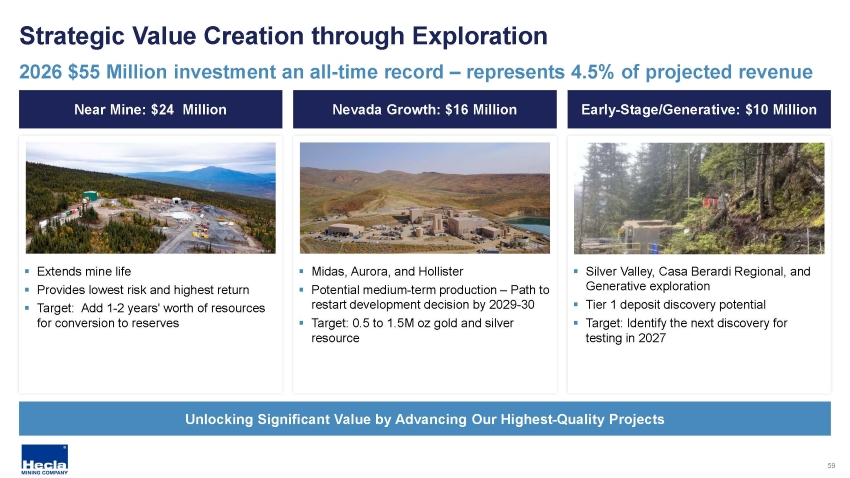
Investment in exploration and pre-development of $55 million in 2026, a record high for the Company, nearly double the investment during 2025. |
|
● |
Expected to maintain strong silver margins with guidance for consolidated silver total cost of sales of $471 million, with silver cash costs of ($1.50)-($1.25) per ounce and AISC of $15.00-$16.25 per ounce (both after by-product credits). With robust metal prices to start the year, potential exists to beat this cost guidance if current prices persist as guidance is based off by-product price assumptions below current spot prices.1,2 |
|
● |
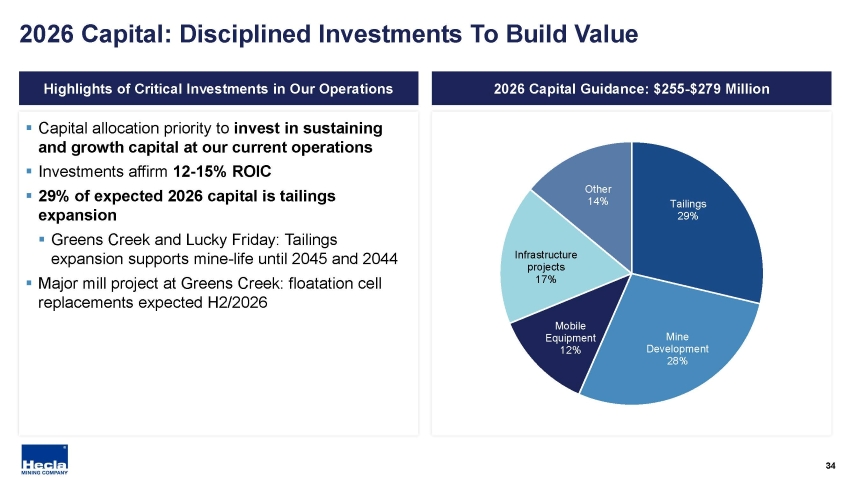
Total capital investment (sustaining and growth) guided to $255-$279 million in 2026, expected to be up modestly from prior year. |
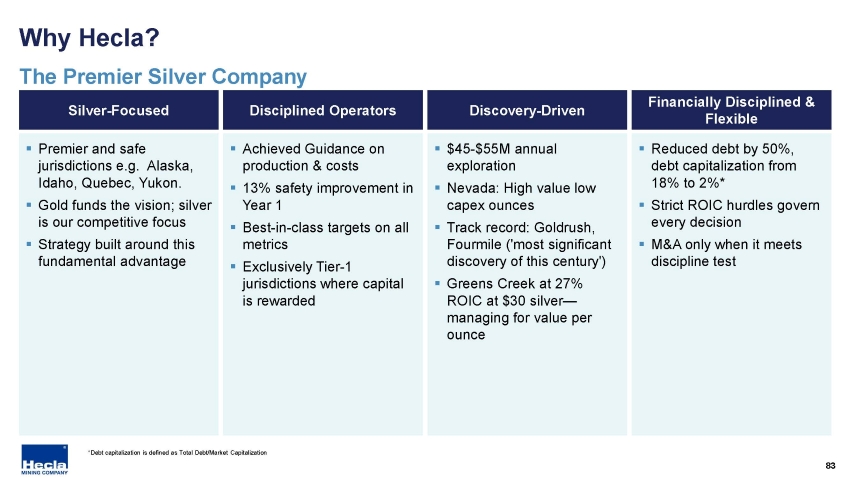
“Our 2025 results demonstrate operational excellence, with 17.0 million ounces of silver production and every primary silver operation meeting or exceeding guidance. We're now accelerating investments in our future—nearly doubling our investment in exploration and pre-development to a record $55 million—while maintaining the financial discipline that positions us to generate substantial free cash flow. This is how North America's premier silver producer creates long-term shareholder value,” said Rob Krcmarov, President and CEO.
OPERATIONS
Greens Creek
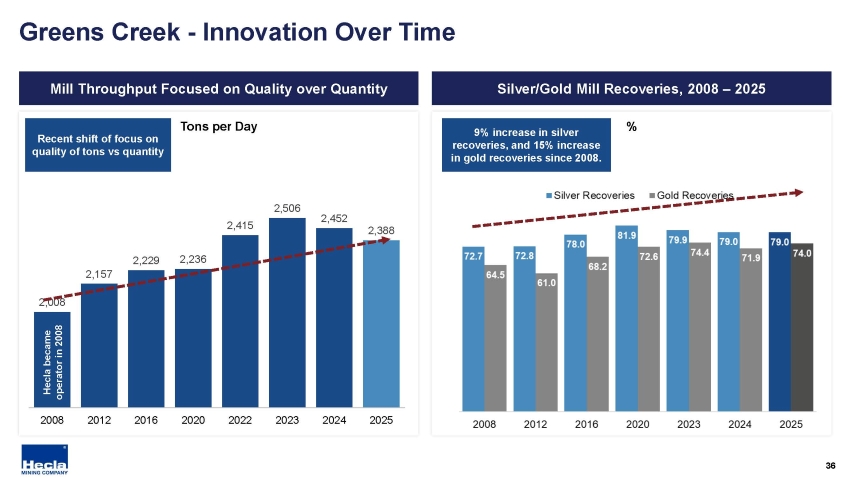
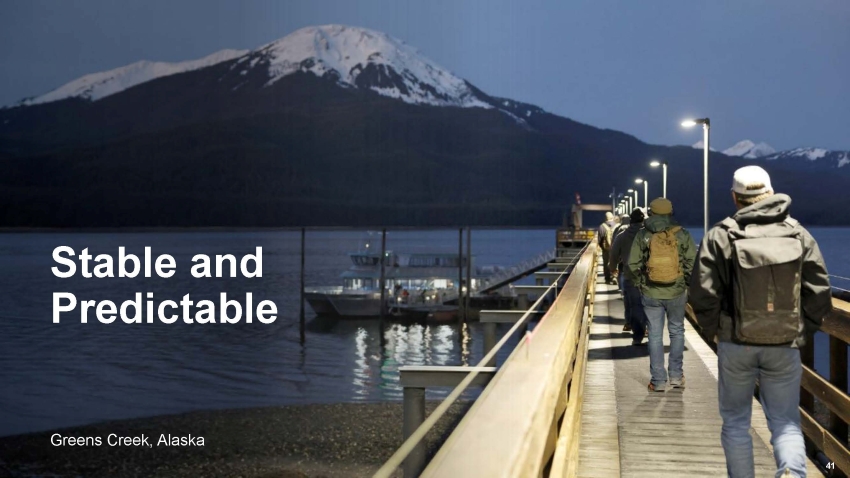
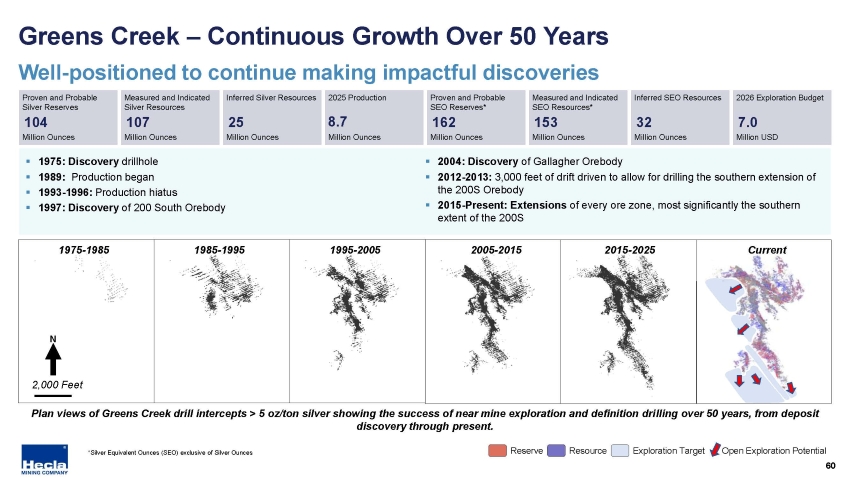
Greens Creek produced 8.7 million ounces of silver and 59,349 ounces of gold in 2025, an increase of 3% and 7% respectively compared to 2024, while processing 2,388 tpd. The increase in silver production was primarily driven by a 5% improvement in grade, partly offset by slightly lower throughput. Gold production in 2025 benefited from 7% higher average milled grades compared to the prior year, largely tied to positive grade reconciliation.
Lucky Friday
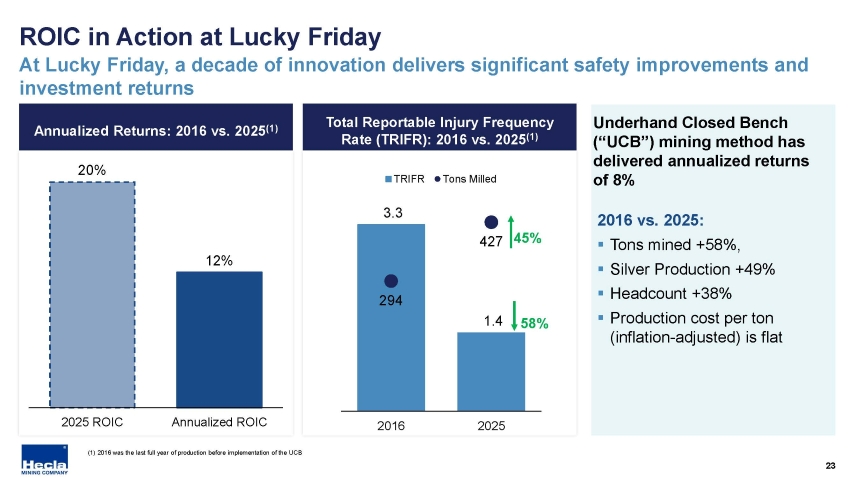
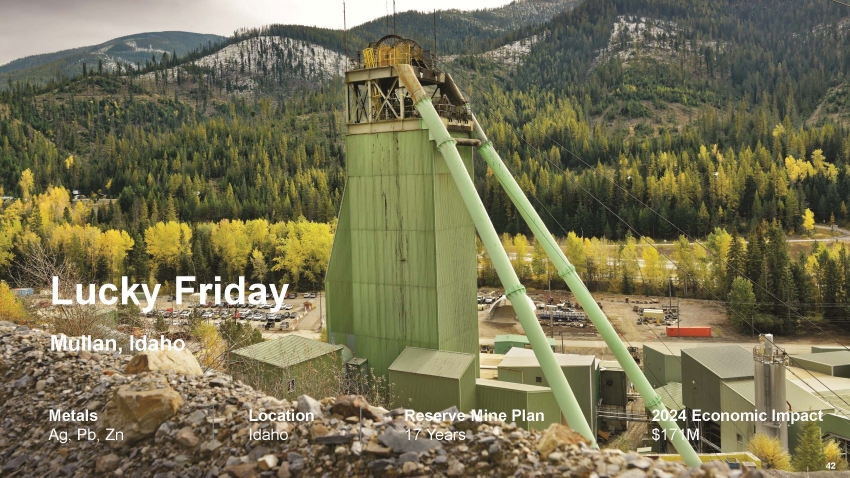
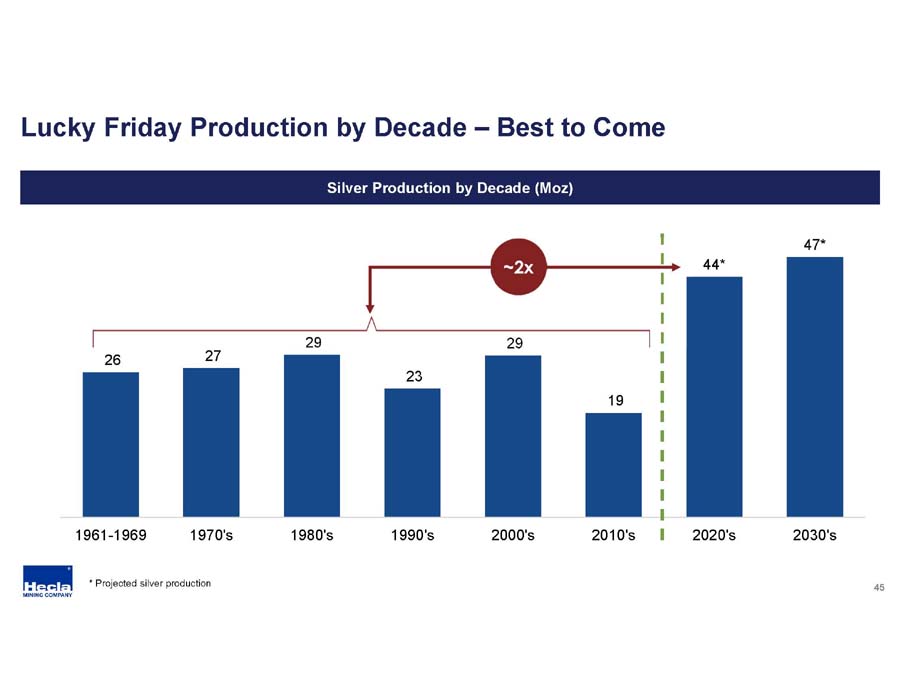
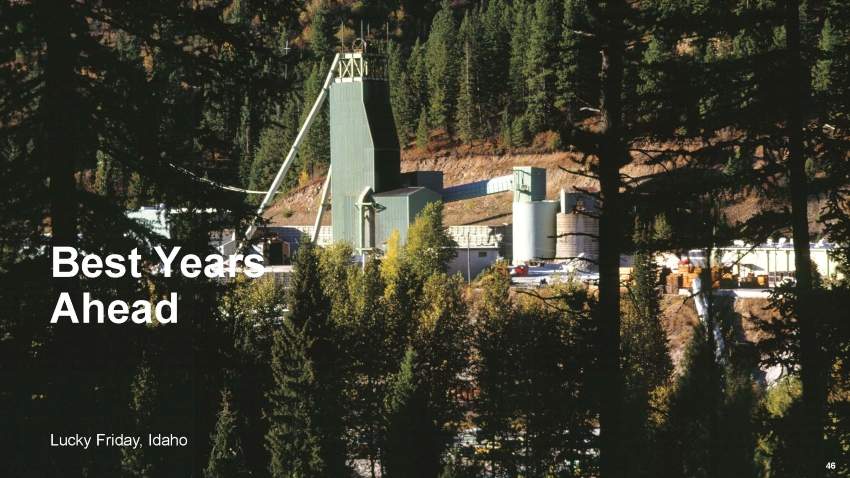
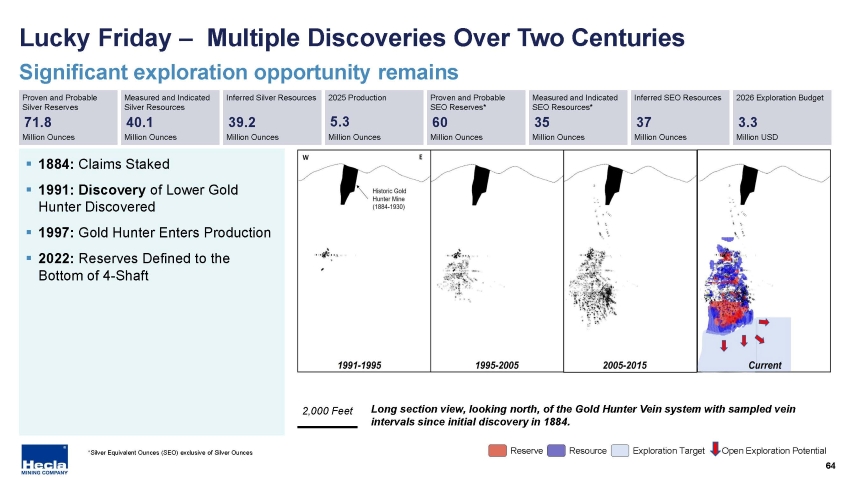
Lucky Friday produced 5.3 million ounces of silver in 2025, an increase of 8% over 2024, establishing annual records for both silver production and mill throughput. The increase was primarily driven by 5% higher throughput and 2% higher milled grade. Mill throughput was 1,170 tpd during the year.
Keno Hill
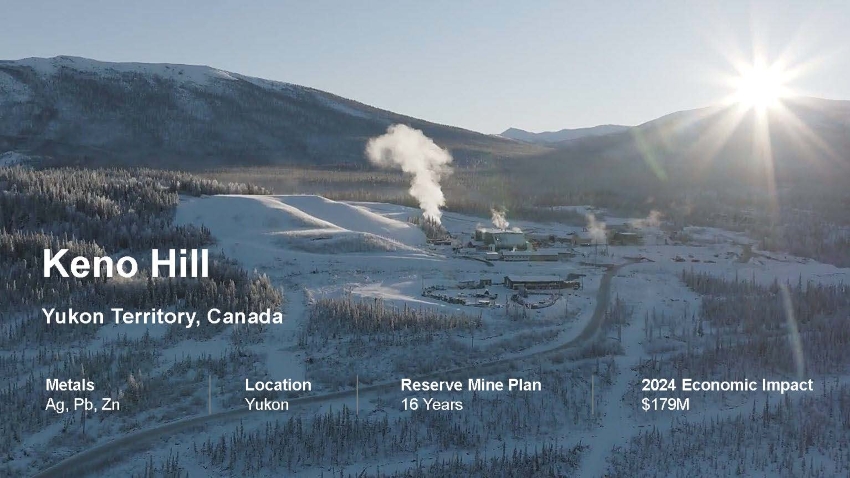
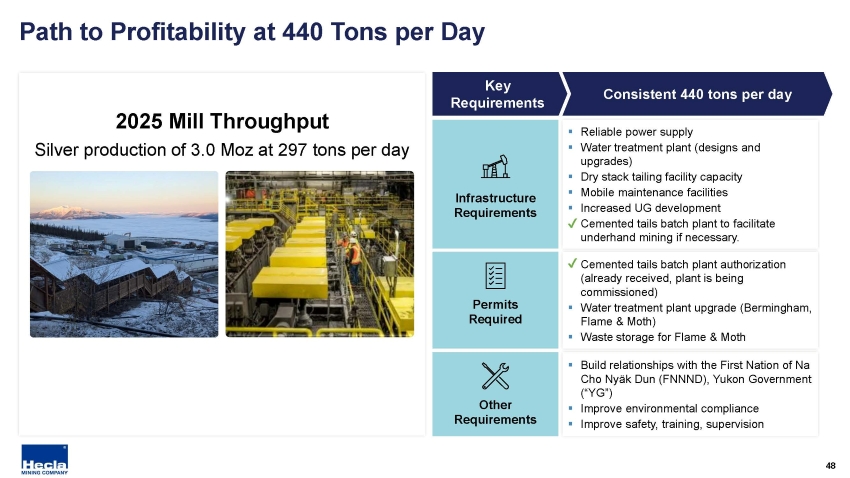
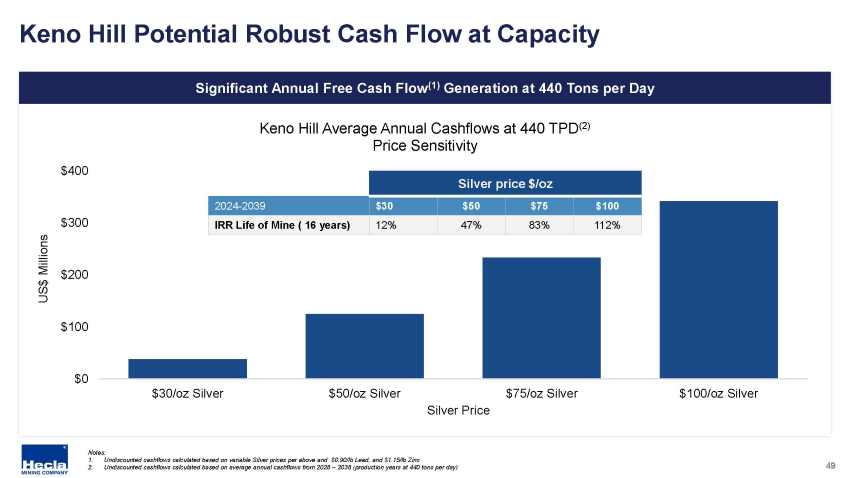
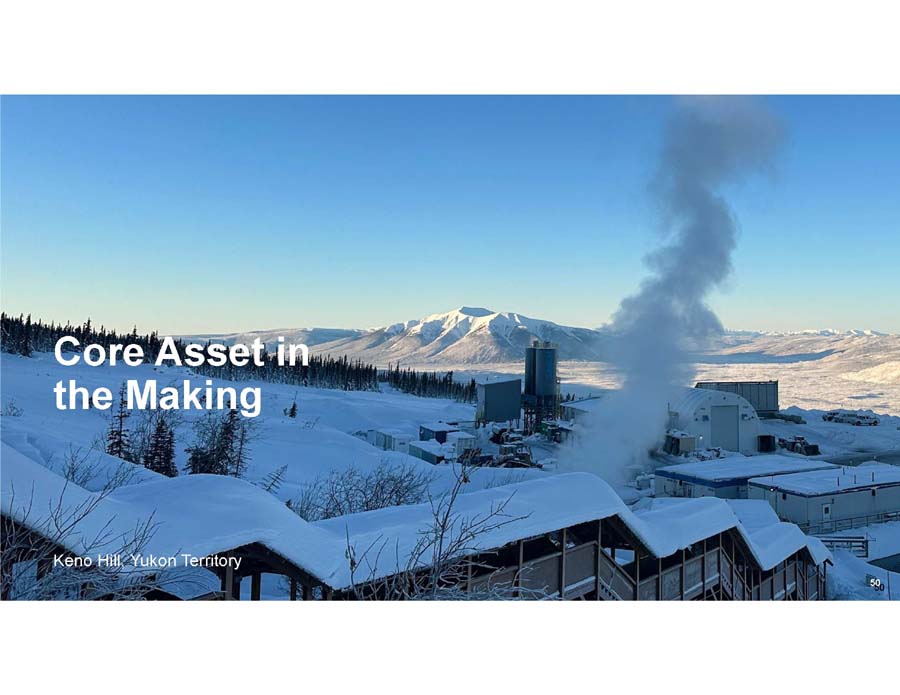
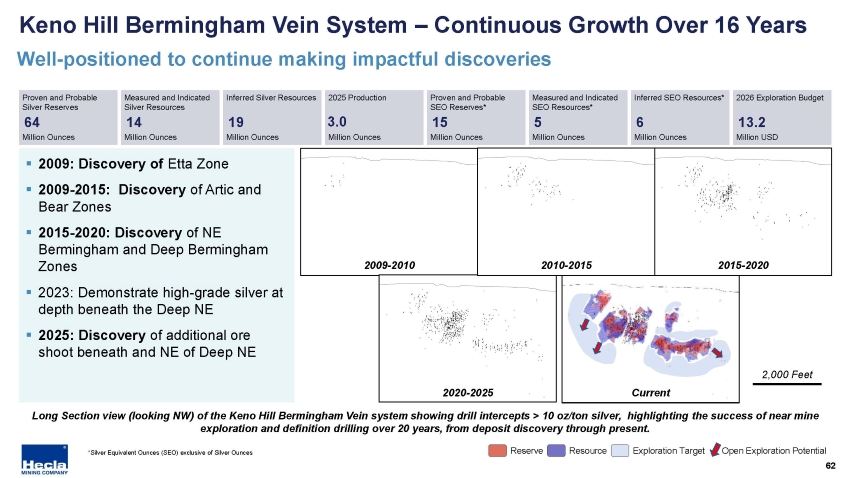
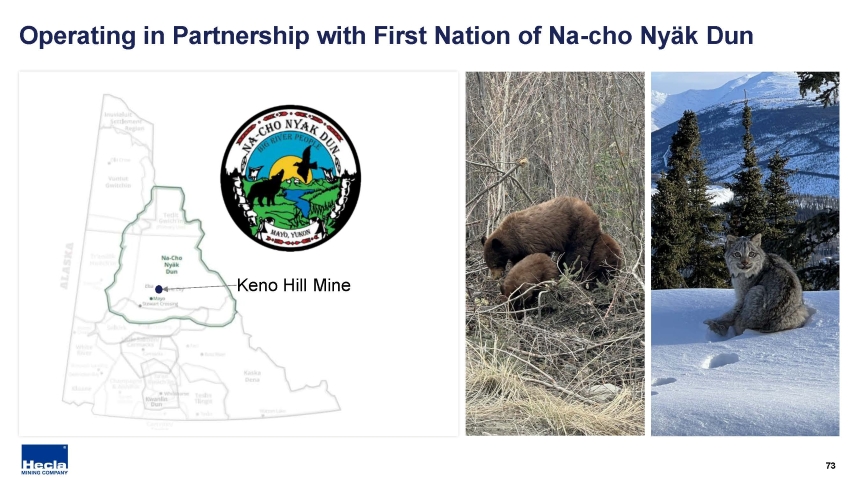
Keno Hill produced 3.02 million ounces of silver, an increase of 9% compared to 2024. The increased production was driven by higher grades that averaged 29.0 ounces per ton.
Casa Berardi
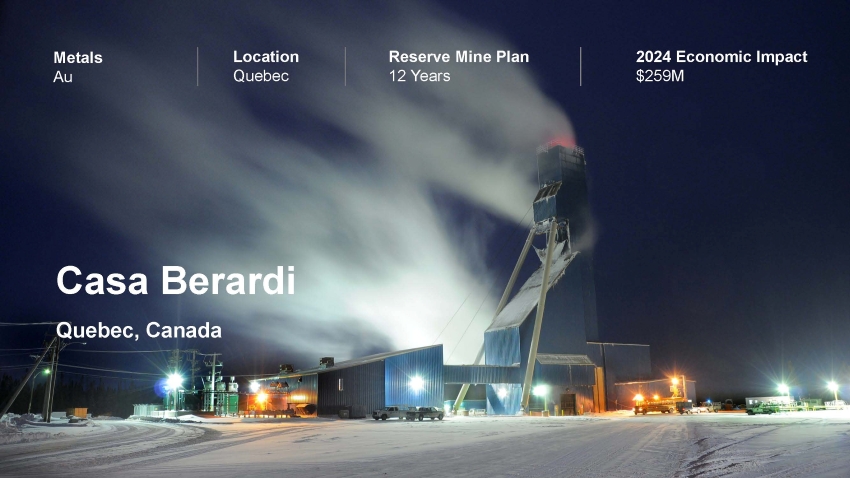
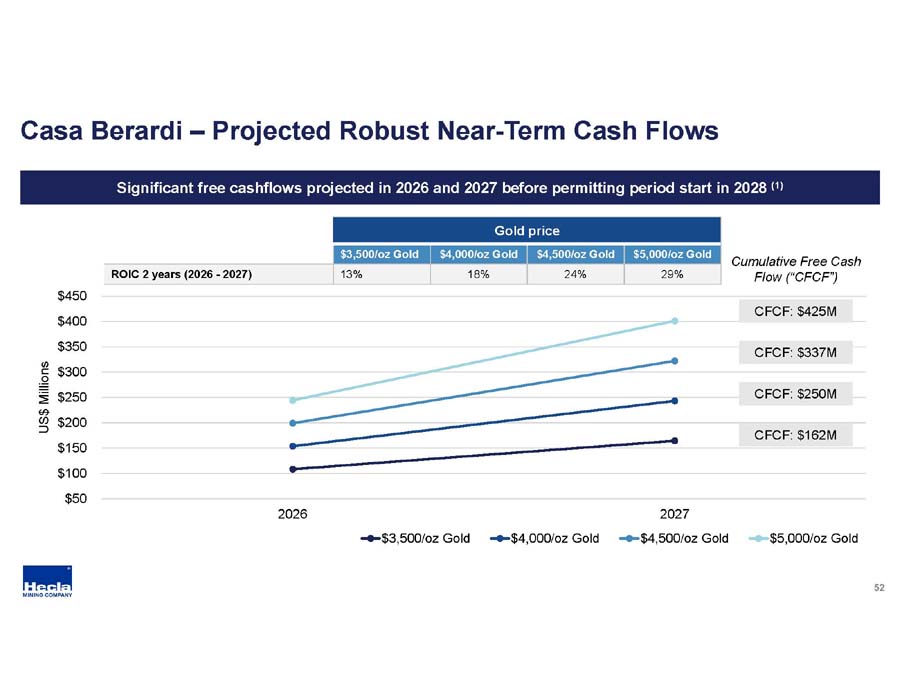
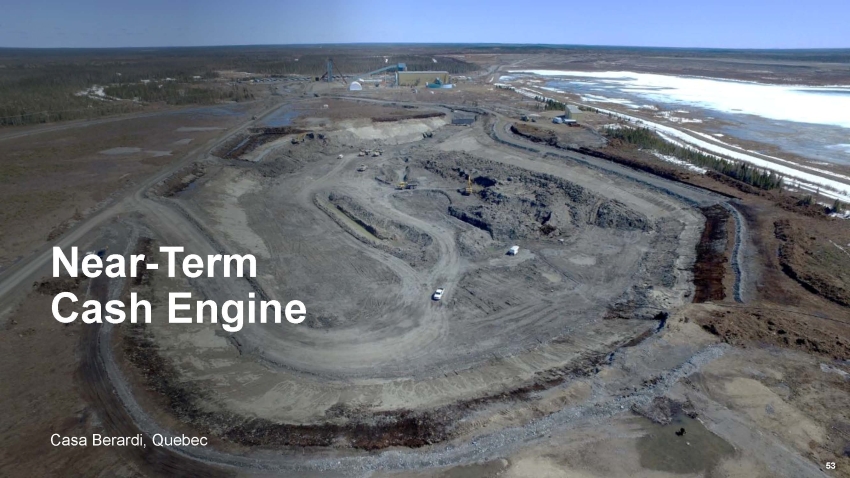
Casa Berardi produced 91,160 ounces of gold in 2025, an increase of 5% compared to 2024 attributable to higher recoveries. Throughput and ore grade milled were largely unchanged compared to the prior year. The mill operated at an average of 4,202 tpd during the year.
PRODUCTION SUMMARY
|
Fiscal Year |
||||||||
|
December 31 |
December 31 |
|||||||
|
2025 |
2024 |
|||||||
|
Production |
||||||||
|
Silver (oz) |
17,026,785 | 16,169,930 | ||||||
|
Gold (oz) |
150,509 | 141,923 | ||||||
|
Lead (tons) |
56,130 | 52,515 | ||||||
|
Zinc (tons) |
68,558 | 66,308 | ||||||
|
Greens Creek - Silver (oz) |
8,724,996 | 8,480,877 | ||||||
|
Greens Creek - Gold (oz) |
59,349 | 55,275 | ||||||
|
Lucky Friday - Silver (oz) |
5,260,686 | 4,890,949 | ||||||
|
Keno Hill - Silver (oz) |
3,018,490 | 2,773,873 | ||||||
|
Casa Berardi - Gold (oz) |
91,160 | 86,648 | ||||||
2026 GUIDANCE
In the tables below the Company provides production, cost, and capital guidance on a consolidated basis and by mine, as well as projected consolidated exploration and pre-development expenditures.
Consolidated silver production is expected to be 15.1-16.5 million ounces, down modestly to the prior year on expected lower milled grades at Greens Creek.
Consolidated gold production is expected to decrease to 134.0-146.0 koz on lower expected milled grades at Casa Berardi.
|
Silver Production (Moz) |
Gold Production (Koz) |
|||||||
|
Greens Creek |
4.5 | - | 8.1 | 51.0 | - | 55.0 | ||
|
Lucky Friday |
4.7 | - | 5.2 | N/A | ||||
|
Casa Berardi |
N/A | 83.0 | - | 91.0 | ||||
|
Keno Hill |
2.9 | - | 3.2 | N/A | ||||
|
2026 Total |
15.1 | - | 16.5 | 134.0 | - | 146.0 | ||
2026 Cost Guidance
Consolidated silver total cost of sales of $471 million with cash cost and AISC guidance per silver ounce (after by-product credits) expected to increase modestly from the prior year at ($1.50)-($1.25)/oz and $15.00-$16.25/oz respectively.1,2 This guidance only incorporates Greens Creek and Lucky Friday, as Keno Hill does not meet our definition of commercial production.
|
● |
At Greens Creek, guidance for total cost of sales (includes depreciation) is $287 million, nearly unchanged compared to the prior year. Cash cost per silver ounce (after by-product credits) and AISC per silver ounce (after by-product credits) guidance is ($9.00)-($8.25) and $0.00-$0.50 respectively, both benefiting from assumed higher by-product credits, especially from gold.1,2 |
|
● |
At Lucky Friday, guidance for total cost of sales (includes depreciation) is $184 million, an increase over the prior year largely reflecting the expected impact of higher profit-sharing payments driven by the elevated silver price. Cash cost guidance is $10.25-$11.00 (after by-product credits), per silver ounce, and AISC at $23.50-$26.00 (after by-product credits), per silver ounce.1,2 |
Casa Berardi guidance for total cost of sales (includes depreciation) is $192 million, expected to be down from the prior year. Cash cost (after by-product credits) per gold ounce is expected to be up modestly to the prior year due to the expected lower volume of sales at $1,700-$1,850 and AISC (after by-product credits) is expected to be higher to the prior year on lower sales volumes and expected higher sustaining capital investment at $2,150-$2,350.1,2
Metal Prices and FX rate assumptions. Expectations for 2026 include gold $4,000/oz, silver $50.00/oz, zinc $1.30/lb, and lead 0.90$/lb, for by-product credit calculations. Numbers are rounded. Assumed exchange rate for Canadian dollar is 1.35 CAD/USD, unchanged from the prior year.
|
Total Cost of Sales (million) |
Cash cost, after by- product credits, per silver/gold ounce1 |
AISC, after by-product credits, per produced silver/gold ounce2 |
|||
|
Greens Creek |
287.0 |
($9.00) - ($8.25) |
$0.00 - $0.50 |
||
|
Lucky Friday |
184.0 |
$10.25 - $11.00 |
$23.50 - $26.00 |
||
|
Total Silver |
471.0 |
($1.50) - ($1.25) |
$15.00 - $16.25 |
||
|
Casa Berardi |
192.0 |
$1,700 - $1,850 |
$2,150 - $2,350 |
||
|
Total Gold |
192.0 |
$1,700 - $1,850 |
$2,150 - $2,350 |
2026 Capital and Exploration Guidance
Consolidated capital (growth and sustaining) investment is expected to increase modestly compared to the prior year at $255-$279 million driven by anticipated higher investment at Greens Creek and Keno Hill, partly offset by expected lower investment at Casa Berardi and Lucky Friday. This new guidance range for 2026 capital investment includes $9-$13 million for corporate projects which was not included as a line item in the 2025 guidance range of $222-$242 million reiterated in November 2025.
|
● |
Greens Creek's capital investment is primarily attributable to mine development and engineering and construction related to the expansion of its tailings facility, which is expected to increase tailings capacity to 2045. |
|
● |
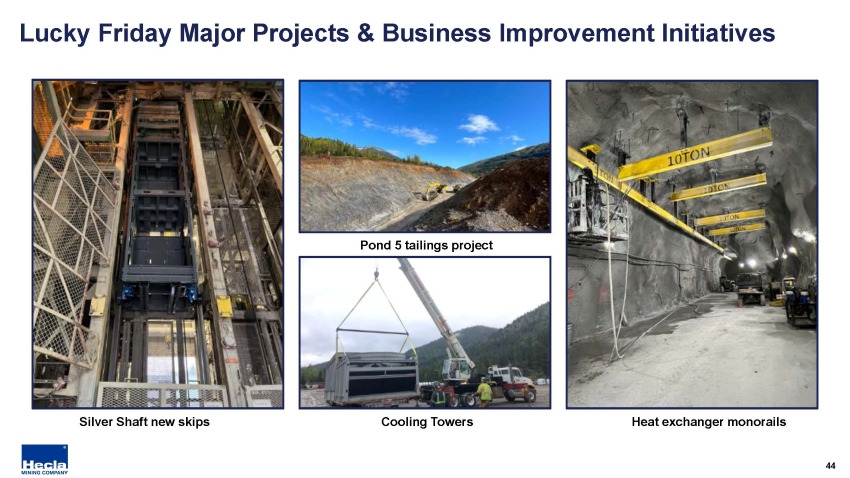
Lucky Friday's capital investment is heavily tied to underground development, a new tailings facility and a surface cooling project, which is expected to be completed by mid-2026, and is critical to increase the designed cooling capacity at the mine over its reserve mine-life of seventeen years. |
|
● |
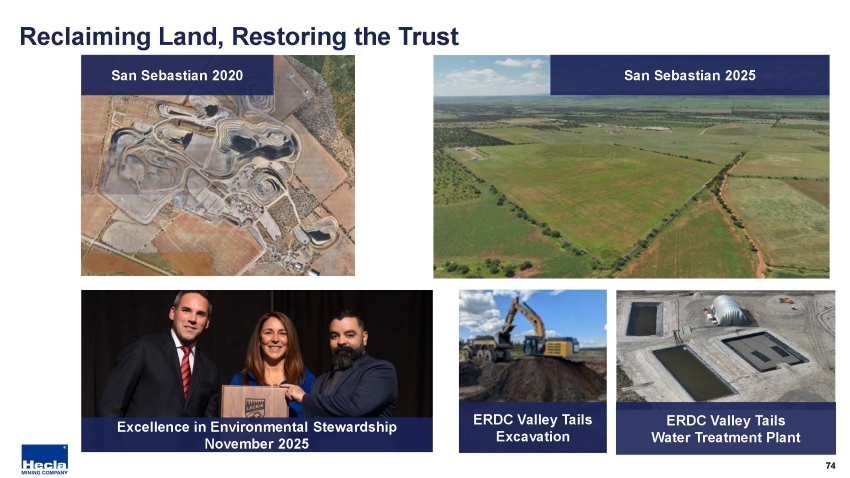
Expected capital spend at Keno Hill comprises mine development and mine infrastructure projects, including, a waste storage facility and water treatment plant. |
|
● |
Casa Berardi's expected growth capital spend includes tailings construction costs. |
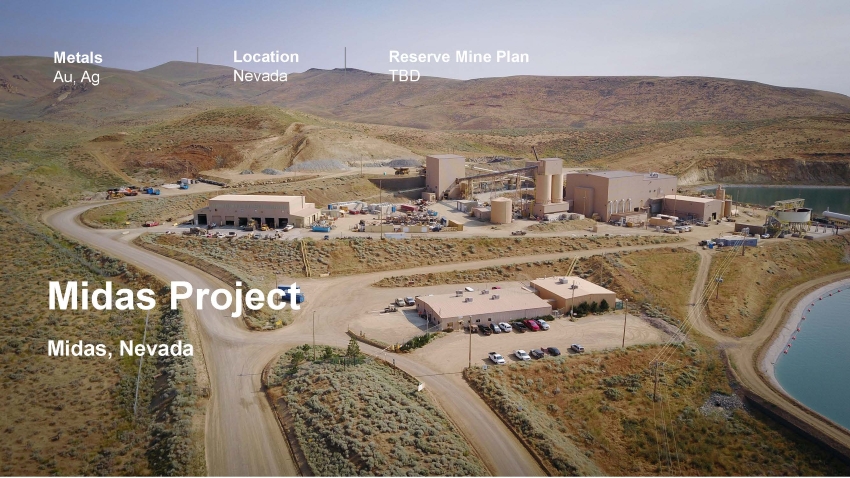
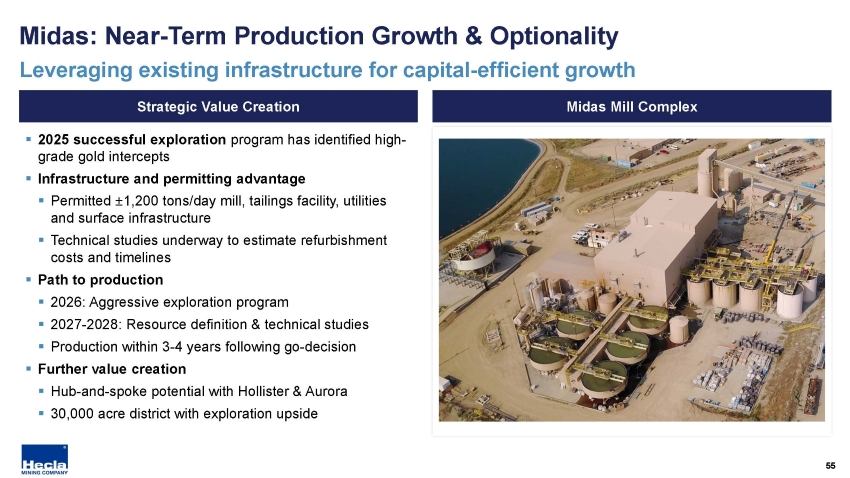
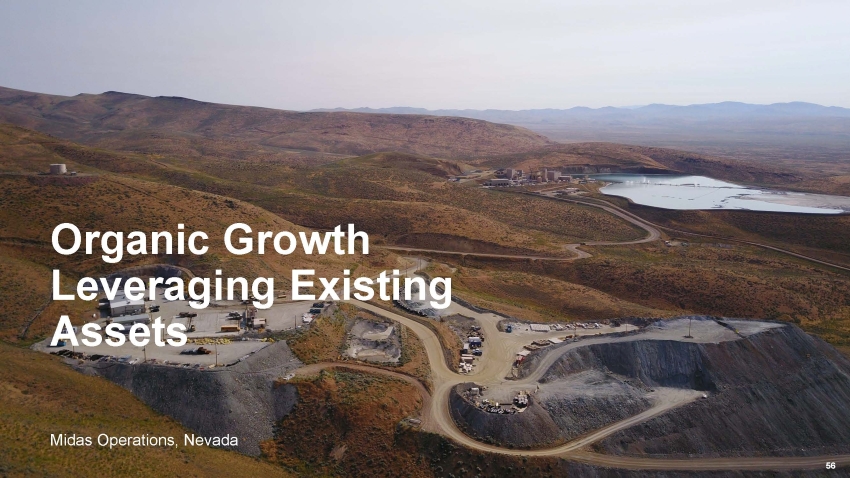
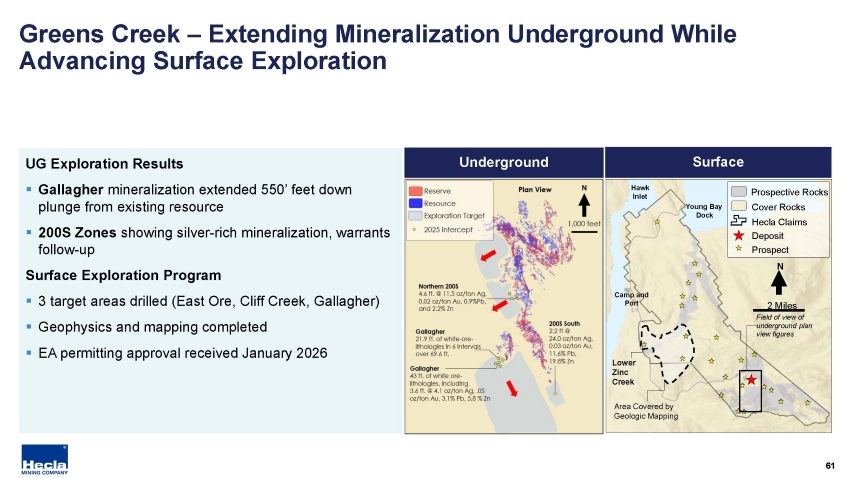
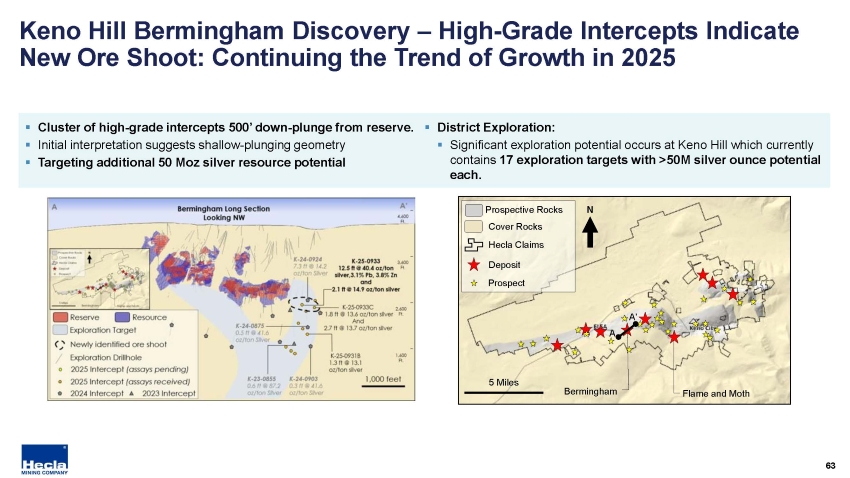
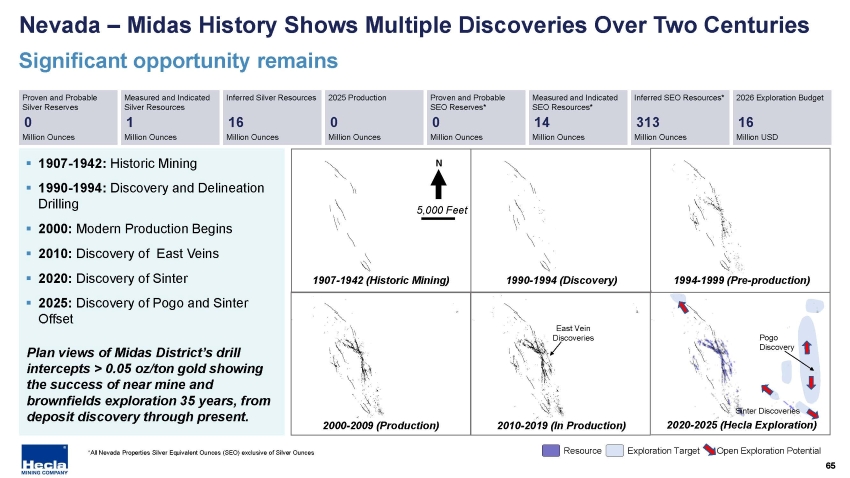
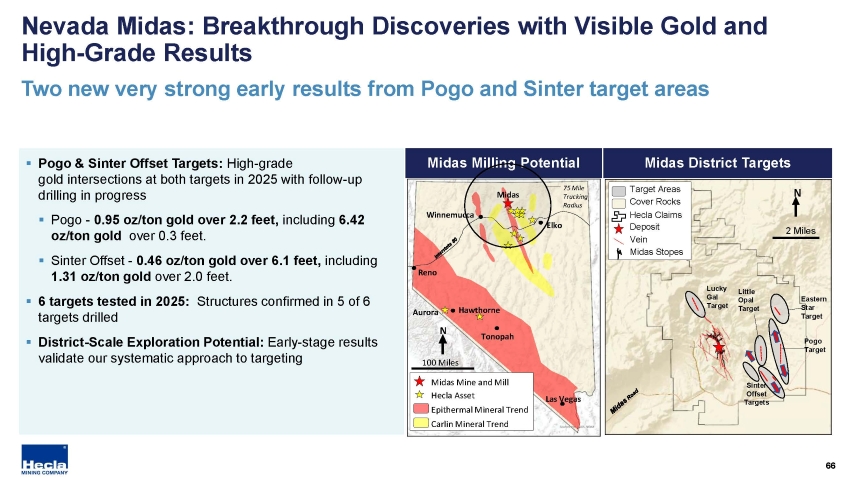
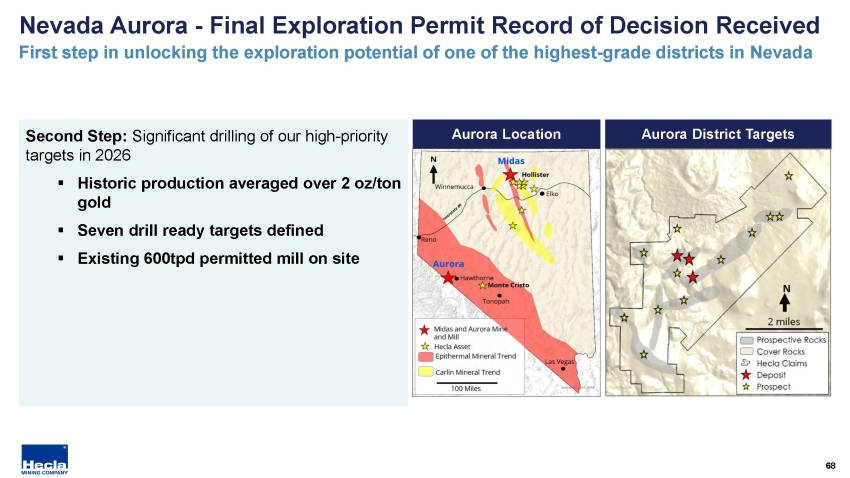
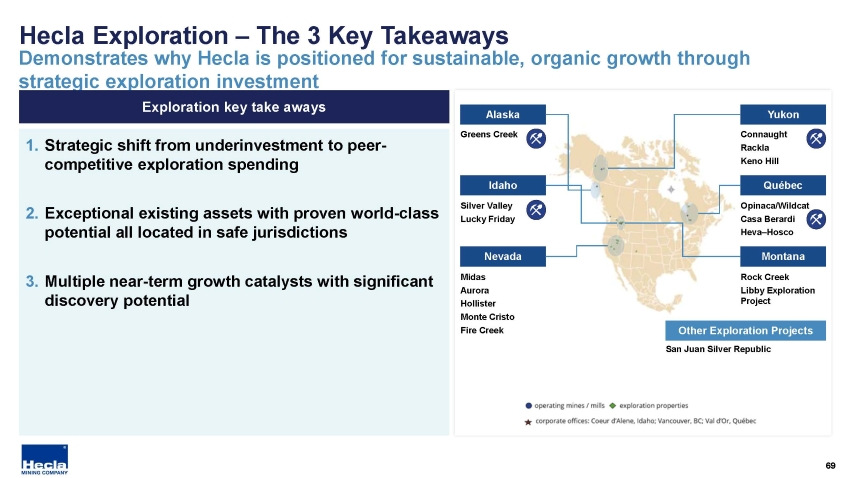
Exploration and pre-development investments are expected to nearly double from the prior year to $55 million, with the focus at Nevada (Midas, Hollister and Aurora), Greens Creek, Keno Hill and Lucky Friday. The expectations for Nevada has nearly tripled from that of 2025.
|
(millions) |
Total |
Sustaining |
Growth |
||||||
|
2026 Total Capital Investment |
$255 - $279 |
$182 - $199 |
$73 - $80 |
||||||
|
Greens Creek |
$66 - $71 |
$66 - $71 |
— | ||||||
|
Lucky Friday |
$68 - $73 |
$68 - $73 |
— | ||||||
|
Casa Berardi |
$51 - $56 |
$39 - $42 |
$12 - $14 |
||||||
|
Keno Hill |
$61 - $66 |
— |
$61 - $66 |
||||||
|
Corporate |
$9 - $13 |
$9 - $13 |
— | ||||||
|
2026 Exploration & Pre-Development |
$55 |
ABOUT HECLA
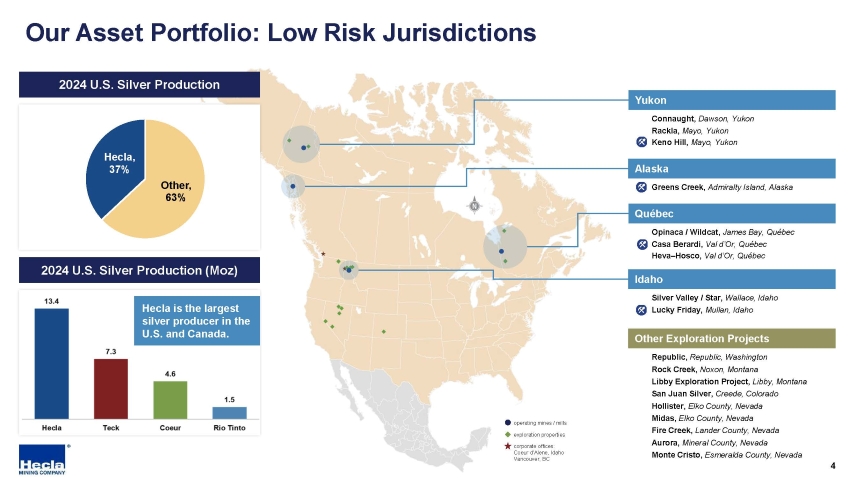
Founded in 1891, Hecla Mining Company (NYSE: HL) is the largest silver producer in the United States and Canada. In addition to operating mines in Alaska, Idaho, and Quebec, Canada, the Company is developing a mine in the Yukon, Canada, and owns a number of exploration and pre-development projects in world-class silver and gold mining districts throughout North America.
NOTES
Non-GAAP Financial Measures
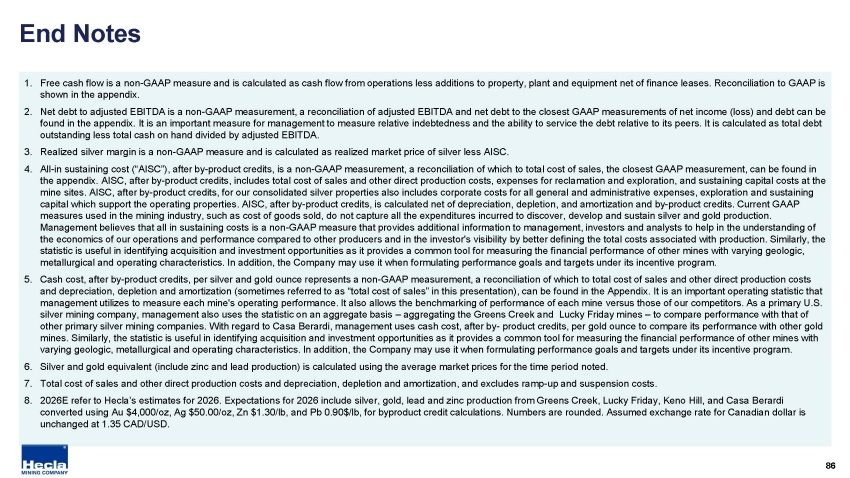
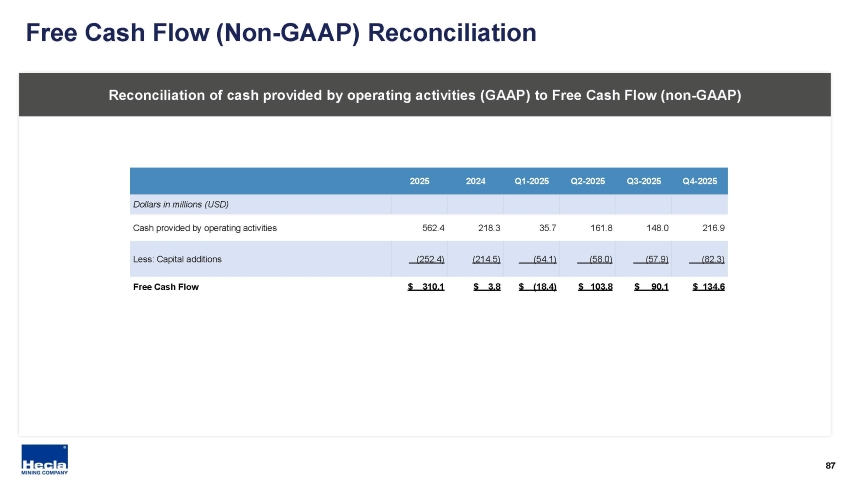
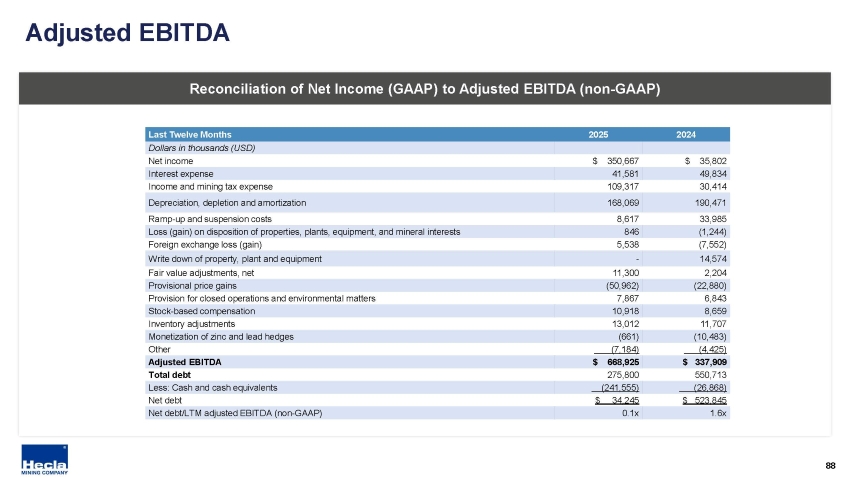
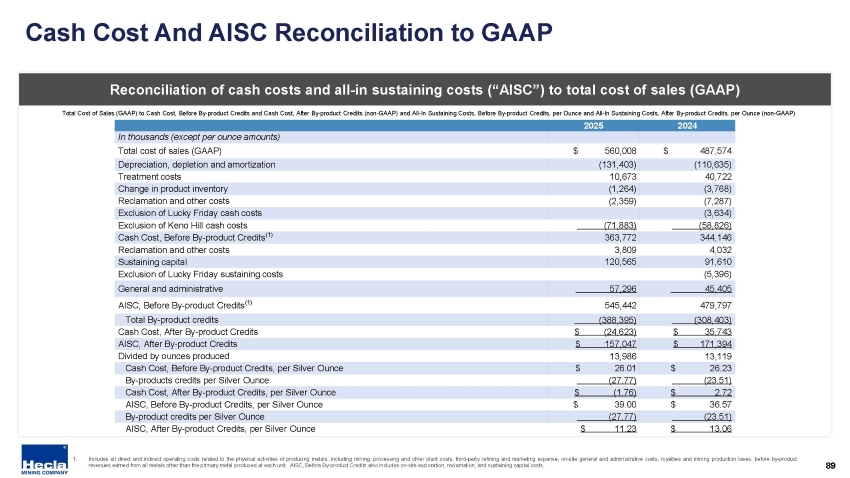
Non-GAAP financial measures are intended to provide additional information only and do not have any standard meaning prescribed by United States generally accepted accounting principles ("GAAP"). These measures should not be considered in isolation or as a substitute for measures of performance prepared in accordance with GAAP. The non-GAAP financial measures cited in this release and listed below are reconciled to their most comparable GAAP measure at the end of this release.
(1) Cash cost, after by-product credits, per silver and gold ounce is a non-GAAP measurement, a reconciliation of total cost of sales, can be found at the end of the release. It is an important operating statistic that management utilizes to measure each mine's operating performance. It also allows the benchmarking of performance of each mine versus those of our competitors. As a primary silver mining company, management also uses the statistic on an aggregate basis - aggregating the Greens Creek and Lucky Friday mines to compare performance with that of other silver mining companies. Similarly, the statistic is useful in identifying acquisition and investment opportunities as it provides a common tool for measuring the financial performance of other mines with varying geologic, metallurgical and operating characteristics. In addition, the Company may use it when formulating performance goals and targets under its incentive program.
(2) All-in sustaining cost (AISC), after by-product credits, is a non-GAAP measurement, a reconciliation of which to total cost of sales, the closest GAAP measurement, can be found in the end of the release. AISC, after by-product credits, includes total cost of sales and other direct production costs, expenses for reclamation at the mine sites and all site sustaining capital costs. AISC, after by-product credits, is calculated net of depreciation, depletion, and amortization and by-product credits. Prior year presentation has been adjusted to conform with current year presentation.
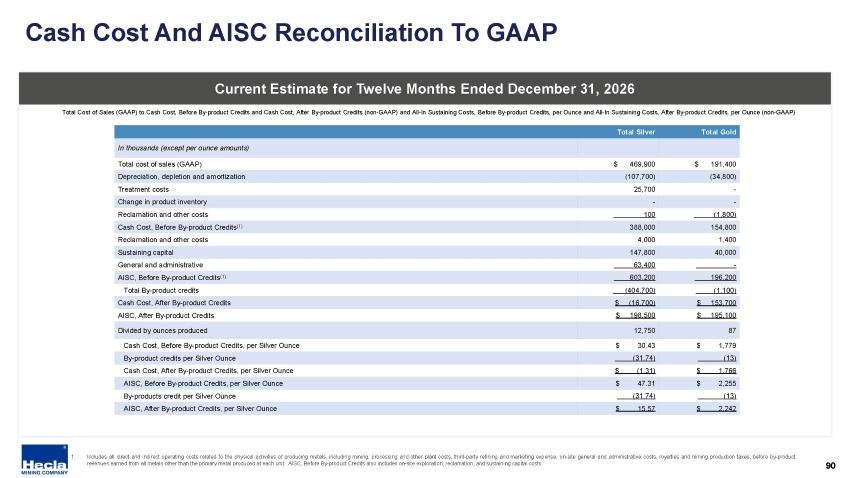
2026 Guidance: Reconciliation of Cost of Sales to Non-GAAP Measures
|
In thousands (except per ounce amounts) |
Current Estimate for Twelve Months Ended December 31, 2026 |
|||||||||||||||||||||||
|
Greens Creek |
Lucky Friday |
Corporate |
Total Silver |
Casa Berardi |
Total Gold |
|||||||||||||||||||
|
Total cost of sales |
$ | 286,300 | $ | 183,600 | $ | — | $ | 469,900 | $ | 191,400 | $ | 191,400 | ||||||||||||
|
Depreciation, depletion and amortization |
(56,100 | ) | (51,600 | ) | — | (107,700 | ) | (34,800 | ) | (34,800 | ) | |||||||||||||
|
Treatment costs |
17,800 | 7,900 | — | 25,700 | — | — | ||||||||||||||||||
|
Change in product inventory |
— | — | — | — | — | — | ||||||||||||||||||
|
Reclamation and other costs |
(1,500 | ) | 1,600 | — | 100 | (1,800 | ) | (1,800 | ) | |||||||||||||||
|
Cash Cost, Before By-product Credits (1) |
246,500 | 141,500 | — | 388,000 | 154,800 | 154,800 | ||||||||||||||||||
|
Reclamation and other costs |
3,000 | 1,000 | — | 4,000 | 1,400 | 1,400 | ||||||||||||||||||
|
Sustaining capital |
67,400 | 69,400 | 11,000 | 147,800 | 40,000 | 40,000 | ||||||||||||||||||
|
General and administrative |
— | — | 63,400 | 63,400 | — | — | ||||||||||||||||||
|
AISC, Before By-product Credits (2) |
316,900 | 211,900 | 74,400 | 603,200 | 196,200 | 196,200 | ||||||||||||||||||
|
By-product credits: |
||||||||||||||||||||||||
|
Zinc |
(95,800 | ) | (30,500 | ) | — | (126,300 | ) | — | — | |||||||||||||||
|
Gold |
(192,200 | ) | — | — | (192,200 | ) | — | — | ||||||||||||||||
|
Lead |
(24,700 | ) | (59,200 | ) | — | (83,900 | ) | — | — | |||||||||||||||
|
Copper |
(2,300 | ) | — | — | (2,300 | ) | ||||||||||||||||||
|
Silver |
— | — | — | — | (1,100 | ) | (1,100 | ) | ||||||||||||||||
|
Total By-product credits |
(315,000 | ) | (89,700 | ) | — | (404,700 | ) | (1,100 | ) | (1,100 | ) | |||||||||||||
|
Cash Cost, After By-product Credits |
$ | (68,500 | ) | $ | 51,800 | $ | — | $ | (16,700 | ) | $ | 153,700 | $ | 153,700 | ||||||||||
|
AISC, After By-product Credits |
$ | 1,900 | $ | 122,200 | $ | 74,400 | $ | 198,500 | $ | 195,100 | $ | 195,100 | ||||||||||||
|
Divided by silver ounces produced |
7,800 | 4,950 | 12,750 | 87 | 87 | |||||||||||||||||||
|
Cash Cost, Before By-product Credits, per Silver Ounce |
$ | 31.60 | $ | 28.59 | $ | 30.43 | $ | 1,779 | $ | 1,779 | ||||||||||||||
|
By-product credits per silver ounce |
(40.38 | ) | (18.12 | ) | (31.74 | ) | (13 | ) | (13 | ) | ||||||||||||||
|
Cash Cost, After By-product Credits, per Silver Ounce |
$ | (8.78 | ) | $ | 10.47 | $ | (1.31 | ) | $ | 1,766 | $ | 1,766 | ||||||||||||
|
AISC, Before By-product Credits, per Silver Ounce |
$ | 40.63 | $ | 42.81 | $ | 47.31 | $ | 2,255 | $ | 2,255 | ||||||||||||||
|
By-product credits per silver ounce |
(40.38 | ) | (18.12 | ) | (31.74 | ) | (13 | ) | (13 | ) | ||||||||||||||
|
AISC, After By-product Credits, per Silver Ounce |
$ | 0.25 | $ | 24.69 | $ | 15.57 | $ | 2,242 | $ | 2,242 | ||||||||||||||
Cautionary Statements Regarding Estimates and Forward-Looking Statements
All measures of the Company's full year 2025 operating results contained in this release are preliminary and reflect the Company’s expected results as of the date of this release. Actual reported full year 2025 results are subject to management's final review as well as review by the Company's independent registered accounting firm and may vary significantly from current expectations because of a number of factors, including, without limitation, additional or revised information and changes in accounting standards or policies or in how those standards are applied.
This news release contains "forward-looking statements" within the meaning of Section 27A of the Securities Act of 1933, as amended, and Section 21E of the Securities Exchange Act of 1934, as amended, which are intended to be covered by the safe harbor created by such sections and other applicable laws, including Canadian securities laws. Words such as "may", "will", "should", "expects", "intends", "projects", "believes", "estimates", "targets", "anticipates" and similar expressions are used to identify these forward-looking statements.
Such forward-looking statements may include, without limitation: (i) the Company is positioned to generate substantial free cash flow; (ii) Company-wide and mine-specific estimated spending on capital, exploration and predevelopment for 2026; (iii) Company-wide and mine-specific estimated silver and gold production for 2026; (iv) metals prices and foreign exchange rate assumptions; (v) the tailings construction project at Greens Creek is expected to increase tailings capacity to 2045; (vi) the Company could beat its cost guidance if current prices persist; and (vi) Lucky Friday’s cooling project is expected to be completed by mid-2026.
The material factors or assumptions used to develop such forward-looking statements or forward-looking information include that the Company’s plans for development and production will proceed as expected and will not require revision as a result of risks or uncertainties, whether known, unknown or unanticipated, to which the Company’s operations are subject. Estimates or expectations of future events or results are based upon certain assumptions, which may prove to be incorrect, which could cause actual results to differ from forward-looking statements. Such assumptions, include, but are not limited to: (i) there being no significant change to current geotechnical, metallurgical, hydrological and other physical conditions; (ii) permitting, development, operations and expansion of the Company’s projects being consistent with current expectations and mine plans; (iii) political/regulatory developments in any jurisdiction in which the Company operates being consistent with its current expectations, including with respect to permitting matters; (iv) the exchange rate for the USD/CAD being approximately consistent with current levels; (v) certain price assumptions for gold, silver, lead and zinc; (vi) prices for key supplies being approximately consistent with current levels; (vii) the accuracy of our current mineral reserve and mineral resource estimates; (viii) there being no significant changes to the availability of employees, vendors and equipment; (ix) the Company’s plans for development and production will proceed as expected and will not require revision as a result of risks or uncertainties, whether known, unknown or unanticipated; (x) counterparties performing their obligations under hedging instruments and put option contracts; (xi) sufficient workforce is available and trained to perform assigned tasks; (xii) weather patterns and rain/snowfall within normal seasonal ranges so as not to impact operations; (xiii) relations with interested parties, including First Nations and Native Americans, remain productive; (xiv) maintaining availability of water rights; (xv) factors do not arise that reduce available cash balances; and (xvi) there being no material increases in our current requirements to post or maintain reclamation and performance bonds or collateral related thereto. In addition, material risks that could cause actual results to differ from forward-looking statements include but are not limited to: (i) gold, silver and other metals price volatility; (ii) operating risks; (iii) currency fluctuations; (iv) increased production costs and variances in ore grade or recovery rates from those assumed in mining plans; (v) community relations; and (vi) litigation, political, regulatory, labor and environmental risks. For a more detailed discussion of such risks and other factors, see the Company's 2024 Form 10-K filed on February 13, 2025, Form 10-Q filed on May 1, 2025, Form 10-Q filed on August 6, 2025 and Form 10-Q filed on November 5, 2025, for a more detailed discussion of factors that may impact expected future results. The Company undertakes no obligation and has no intention of updating forward-looking statements other than as may be required by law.
For further information, please contact:
Mike Parkin
Vice President – Strategy and Investor Relations
Cheryl Turner
Investor Relations Coordinator
Investor Relations
Email: [email protected]
Website: http://www.hecla.com