hlmn-202408010001822492false00018224922024-08-012024-08-01
UNITED STATES
SECURITIES AND EXCHANGE COMMISSION
WASHINGTON, D.C. 20549
__________________________
FORM 8-K
CURRENT REPORT
Pursuant to Section 13 or 15(d) of the Securities Exchange Act of 1934
Date of Report (Date of earliest event reported): August 1, 2024
Hillman Solutions Corp.
(Exact name of registrant as specified in its charter)
| | | | | | | | | | | | | | |
| Delaware | | 001-39609 | | 85-2096734 |
| (State or other jurisdiction | | (Commission File No.) | | (I.R.S. Employer |
| of incorporation) | | | | Identification No.) |
1280 Kemper Meadows Drive
Cincinnati, Ohio 45240
(Address of principal executive offices)
Registrant’s telephone number, including area code: (513) 851-4900
Not Applicable
(Former name or former address, if changed since last report.)
Check the appropriate box below if the Form 8-K filing is intended to simultaneously satisfy the filing obligation of the registrant under any of the following provisions (see General Instruction A.2. below):
☐ Written communications pursuant to Rule 425 under the Securities Act (17 CFR 230.425)
☐ Soliciting material pursuant to Rule 14a-12 under the Exchange Act (17 CFR 240.14a-12)
☐ Pre-commencement communications pursuant to Rule 14d-2(b) under the Exchange Act (17 CFR 240.14d-2(b))
☐ Pre-commencement communications pursuant to Rule 13e-4(c) under the Exchange Act (17 CFR 240.13e-4(c))
Securities registered pursuant to Section 12(b) of the Act:
| | | | | | | | |
| Title of each class | Trading Symbols | Name of each exchange on which registered |
| Common Stock, par value $0.0001 per share | HLMN | The Nasdaq Stock Market LLC |
Indicate by check mark whether the registrant is an emerging growth company as defined in Rule 405 of the Securities Act of 1933 (§230.405 of this chapter) or Rule 12b-2 of the Securities Exchange Act of 1934 (§240.12b-2 of this chapter).
Emerging growth company ☐
If an emerging growth company, indicate by check mark if the registrant has elected not to use the extended transition period for complying with any new or revised financial accounting standards provided pursuant to Section 13(a) of the Exchange Act. ☐
Item 2.02 Results of Operations and Financial Condition.
On August 6, 2024, Hillman Solutions Corp. (the “Company”) issued a press release, furnished as Exhibit 99.1 and incorporated herein by reference, announcing the Company's selected summary financial results for its thirteen and twenty-six weeks ended June 29, 2024.
The information provided pursuant to Item 2.02, including the exhibit attached hereto, is being furnished and shall not be deemed to be “filed” for purposes of Section 18 of the Securities Exchange Act of 1934, as amended (the “Exchange Act”), or otherwise subject to the liabilities of that section, nor shall it be deemed to be incorporated by reference in any filing under the Securities Act of 1933, as amended, or the Exchange Act, except as shall be expressly set forth by specific reference in any such filing.
Item 5.02. Departure of Directors or Certain Officers; Election of Directors; Appointment of Certain Officers; Compensatory Arrangements of Certain Officers.
On August 1, 2024, the Board of Directors of Hillman Solutions Corp. (the “Company’) appointed Jon Michael Adinolfi to the position of Chief Executive Officer (“CEO”) and President of the Company, effective January 1, 2025. As CEO and President, Mr. Adinolfi will serve as the principal executive officer of the Company and will report to the Board of Directors.
Current Chairman, CEO, and President Douglas J. Cahill, age 64, will step down from the CEO and President position, effective January 1, 2025, and remain as Chair of the Board of Directors serving under the new position of Executive Chairman.
Mr. Adinolfi, age 48, has served as the Company’s Chief Operating Officer since June 2023, overseeing our Hardware and Protective Solutions businesses and Canadian operations. Mr. Adinolfi previously served as the Company’s Divisional President, Hillman US, since July 2019. Prior to joining Hillman, Mr. Adinolfi served as President of US Retail for Stanley Black & Decker from November 2016 to July 2019. Prior to that, he served as President of Hand Tools for Stanley Black & Decker from October 2013 to December 2016. From June 2011 to September 2013, he served as the CFO — North America, CDIY for Stanley Black & Decker.
The independent members of the Board of Directors, upon the recommendation of the Compensation Committee of the Board of Directors, approved the compensation for Mr. Adinolfi and Mr. Cahill in their new roles, all to take effect as of January 1, 2025.
Mr. Adinolfi’s new annual base salary will be $700,000, and his new target bonus opportunity will be 100% of base salary. Mr. Adinolfi’s new annual target equity award grant will be $2,000,000.
Mr. Cahill’s new annual base salary will be $800,000 and his new target bonus opportunity will be 100% of base salary. Mr. Cahill’s new annual target equity award grant will be $1,400,000. As Executive Chairman, Mr. Cahill will serve as the Chair of the Board of Directors will report to the independent members of the Board of Directors.
The independent members of the Board of Directors, upon the recommendation of the Compensation Committee of the Board of Directors, also approved increases to the participation levels of Mr. Adinolfi and decreases to the participation level of Mr. Cahill under the Company’s Executive Severance Plan, dated November 2, 2023 (the "Severance Plan"). Mr. Adinolfi and Mr. Cahill are each currently participants in the Severance Plan, and their new participation levels are described below (each a participating “Executive” under the Severance Plan).
Under the Severance Plan, in the event of a termination by the Company without Cause or by the Executive for Good Reason prior to a Change in Control or more than 24 months following a Change in Control, the updated severance benefits for Mr. Adinolfi and Mr. Cahill shall generally consist of the following:
•Lump sum payment of the Executive's earned but unpaid bonus for a performance period ending prior to the Executive's termination (if any);
•Continuation of the Executive's base salary for a period specified in the applicable Executive's participation notice, which is (i) eighteen months in the case of Mr. Adinolfi; and (ii) twelve months in the case of Mr. Cahill.
•In the case of Mr. Adinolfi only, and not in the case of Mr. Cahill, an amount equal to 150% of his performance based bonus at target achievement level, payable over eighteen months in equal installments on the Company's regular payroll dates.
•Payment by the Company of COBRA medical, dental and/or vision insurance premiums, based on the Executive’s benefits plan elections in effect at the time of termination for a period specified in the applicable Executive's participation notice, which is (i) eighteen months in the case of Mr. Adinolfi; and (ii) twelve months in the case Mr. Cahill.
•Payment of the Executive's performance based bonus for the year in which the termination occurred, pro-rated for the Executive's service up to and including the date of termination and based on actual performance for the year, payable concurrently with bonus payments to other employees under the bonus plan.
Under the Severance Plan, in the event of a termination by the Company without Cause or by the Executive for Good Reason within the 24 months following a Change in Control, the severance benefits for the Executive shall generally consist of the following:
•Lump sum payment of the Executive's earned but unpaid bonus for a performance period ending prior to the Executive's termination (if any);
•Continuation of the Executive's base salary for a period specified in the applicable Executive's participation notice, which is (i) twenty-four months in the case of Mr. Adinolfi; and (ii) twelve months in the case of Mr. Cahill.
•In the case of Mr. Adinolfi only, and not Mr. Cahill, an amount equal to 200% of his performance based bonus at target achievement level, payable over twenty-four months in equal installments on the Company's regular payroll dates.
•In the case of Mr. Cahill, an amount equal to 100% of the Executive's performance based bonus at target achievement level, payable over twelve months in equal installments on the Company's regular payroll dates.
•Payment by the Company of COBRA medical, dental and/or vision insurance premiums, based on the Executive’s benefits plan elections in effect at the time of termination for a period specified in the applicable Executive's participation notice, which is (i) twenty-four months in the case of Mr. Adinolfi; and (ii) twelve months in the case of Mr. Cahill.
•Payment of the Executive's performance based bonus for the year in which the termination occurred, pro-rated for the Executive's service up to and including the date of termination and based on actual performance for the year, payable concurrently with bonus payments to other employees under the bonus plan.
The foregoing summary is qualified in its entirety by reference to the Severance Plan filed as Exhibit 10.1 to our Quarterly Report on Form 10-Q filed with the SEC on November 8, 2023 and incorporated herein by reference. A copy of the press release announcing these leadership changes is attached hereto as Exhibit 99.3.
Item 9.01 Financial Statements and Exhibits.
(d) Exhibits.
SIGNATURES
Pursuant to the requirements of the Securities Exchange Act of 1934, the registrant has duly caused this report to be signed on its behalf by the undersigned hereunto duly authorized.
| | | | | | | | | | | |
Date: August 6, 2024 | Hillman Solutions Corp. | |
|
|
|
| By: | /s/ Robert O. Kraft |
| Name: | Robert O. Kraft |
| Title: | Chief Financial Officer |
Hillman Reports Second Quarter 2024 Results
CINCINNATI, August 6, 2024 -- Hillman Solutions Corp. (Nasdaq: HLMN) (the “Company” or “Hillman”), a leading provider of hardware products and merchandising solutions, reported financial results for the thirteen and twenty-six weeks ended June 29, 2024.
Second Quarter 2024 Highlights (Thirteen weeks ended June 29, 2024)
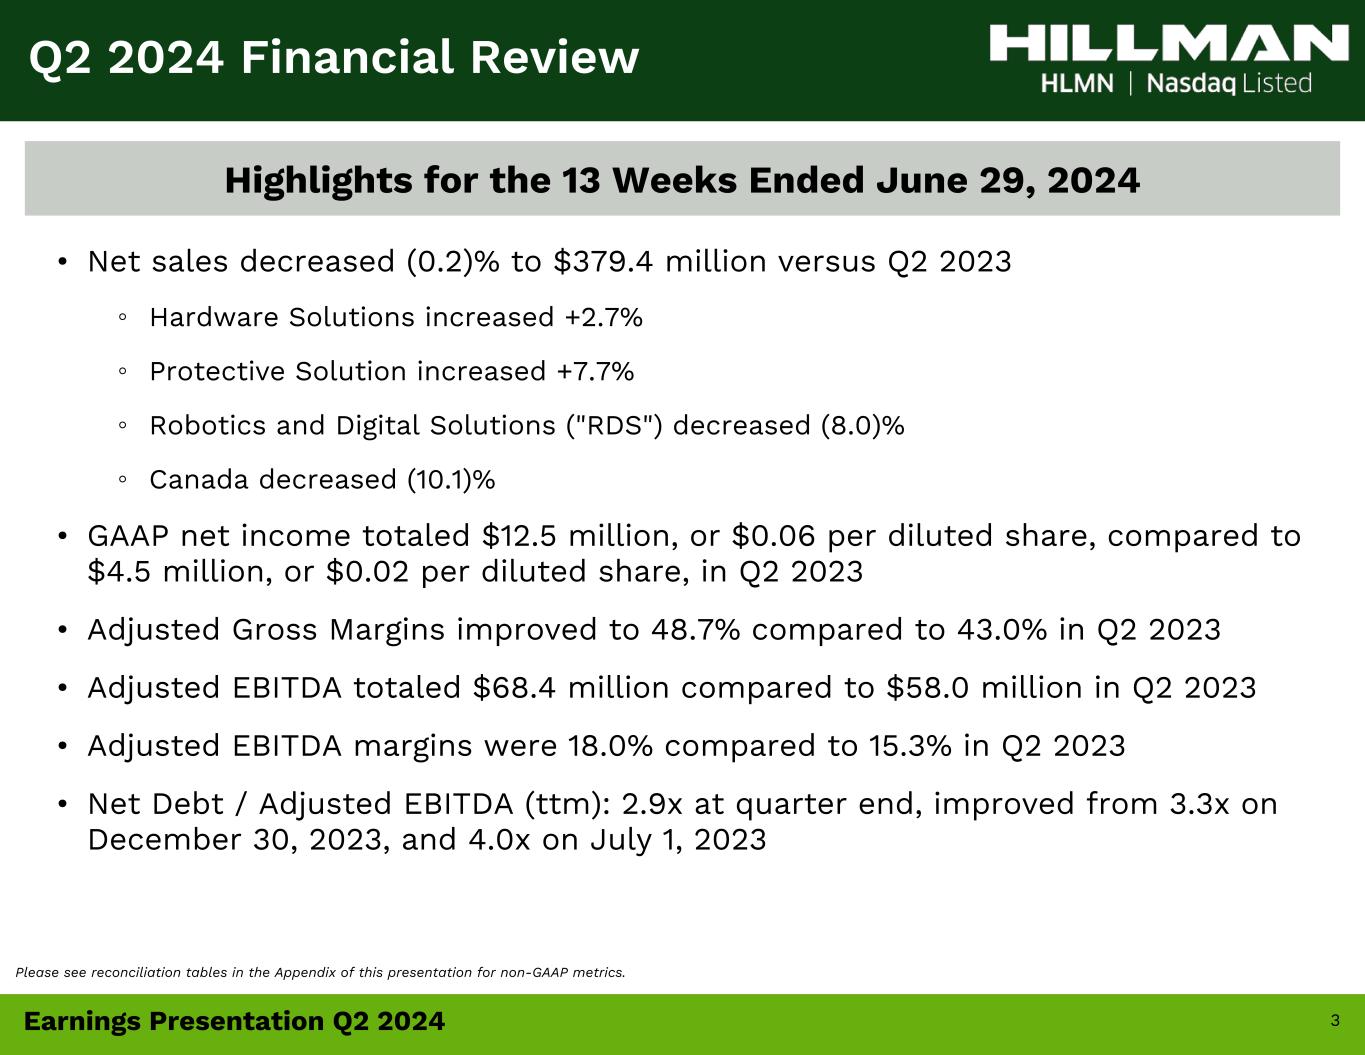
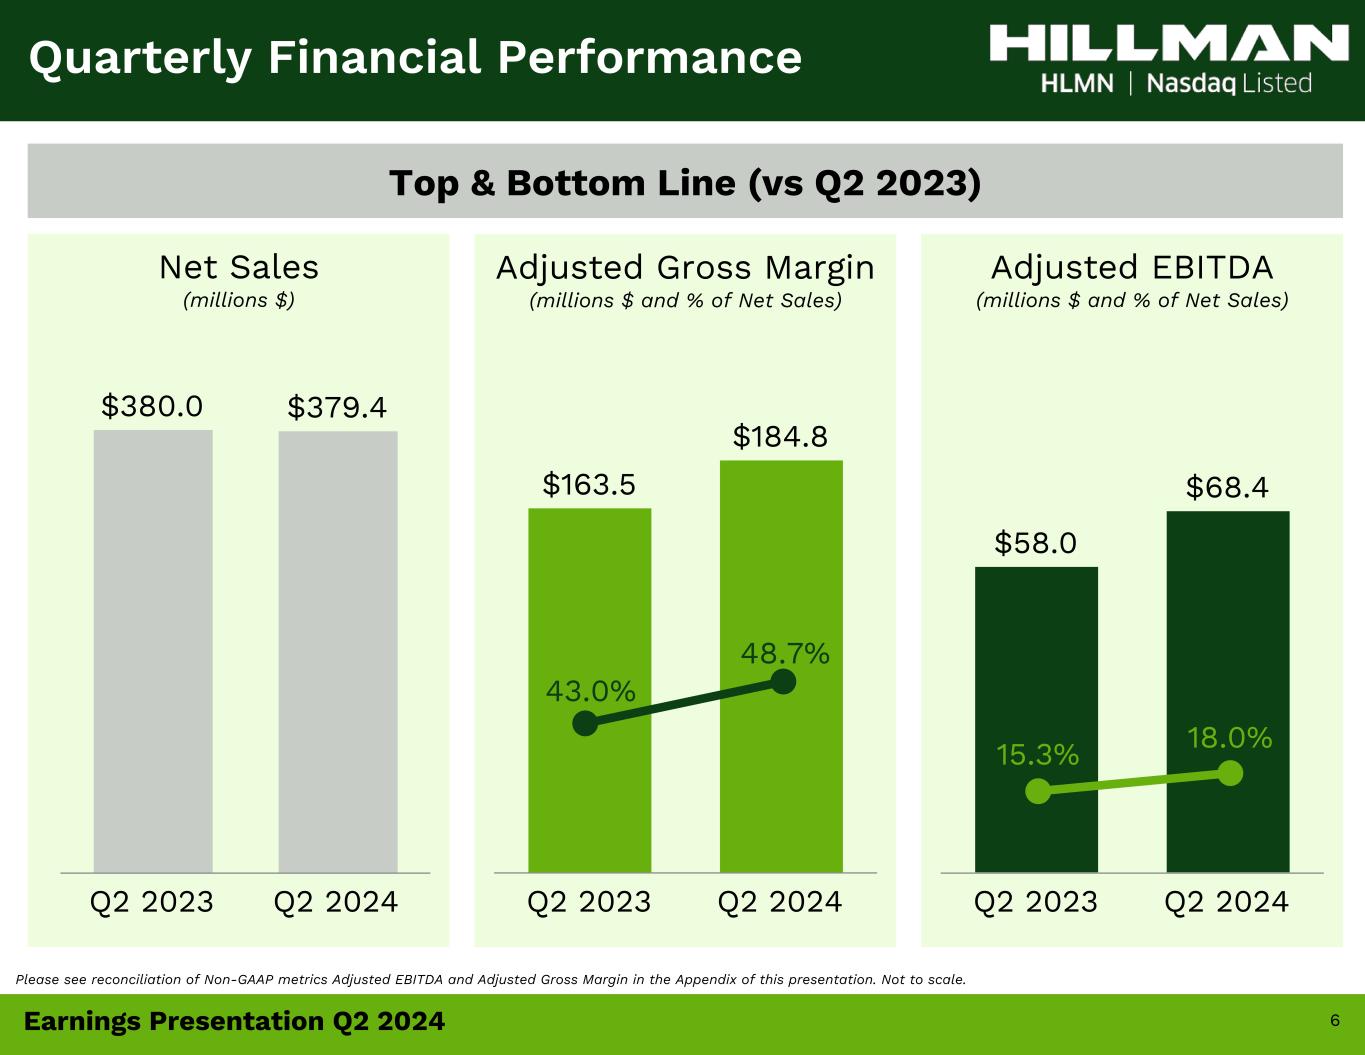
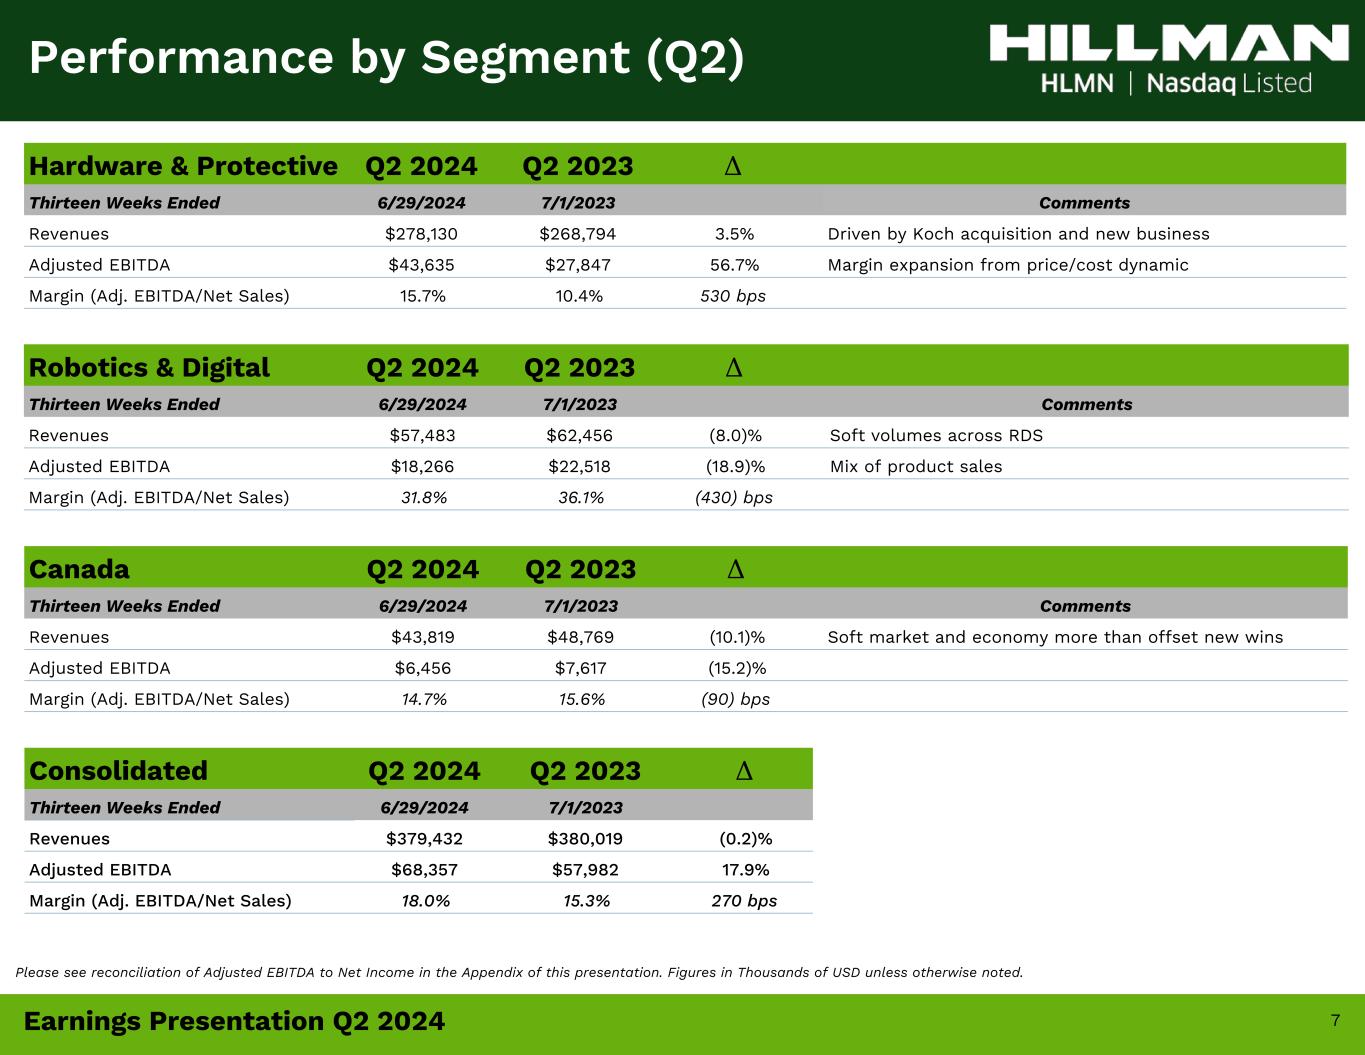
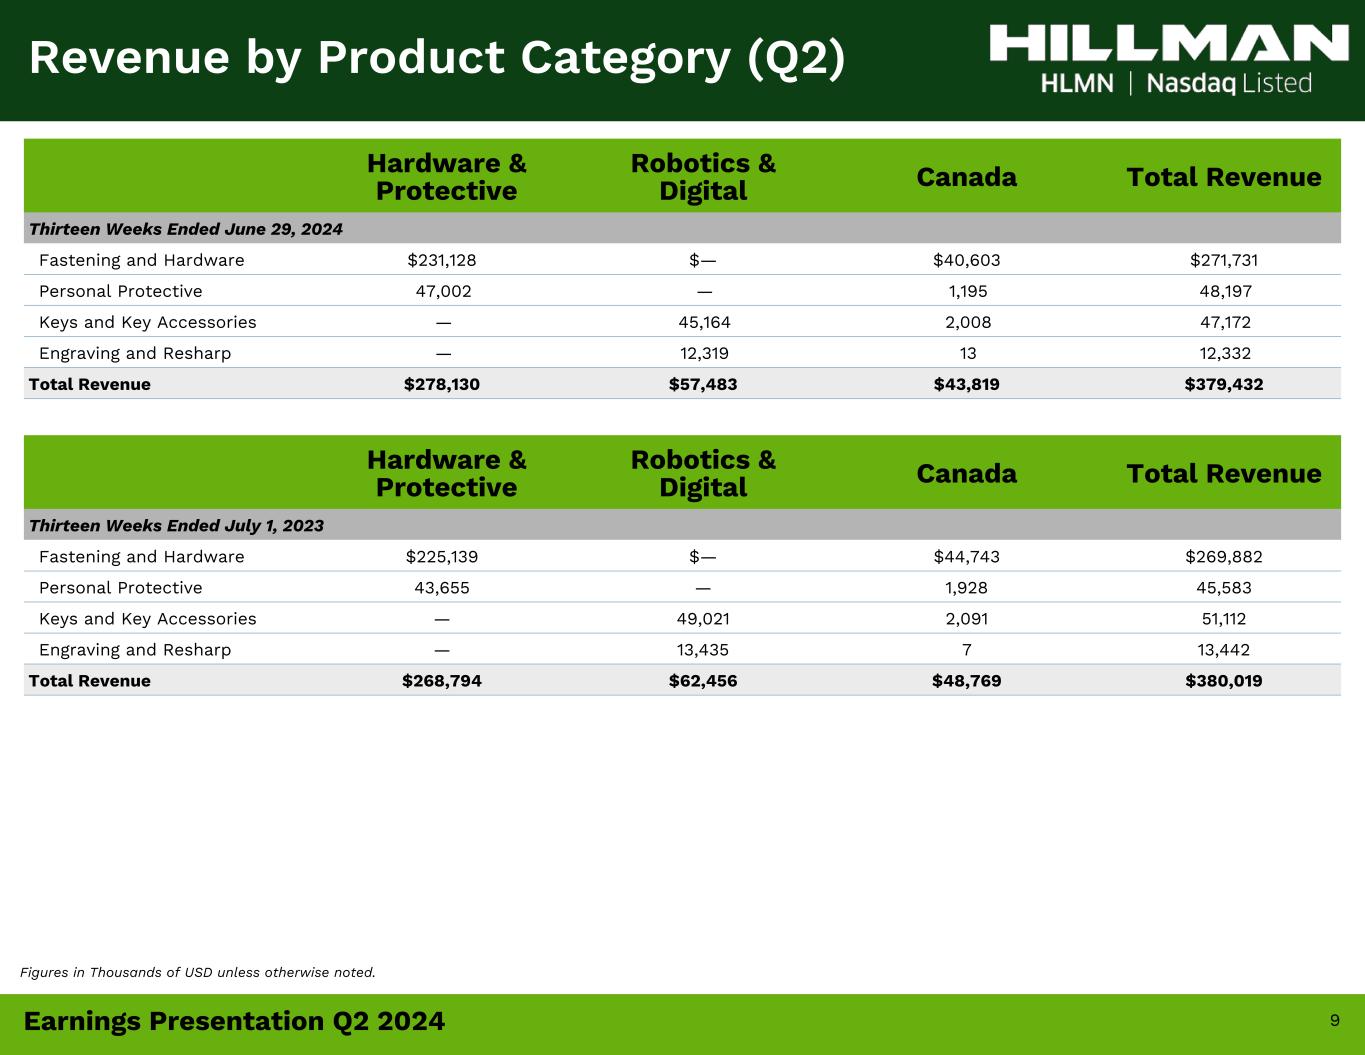
•Net sales decreased (0.2)% to $379.4 million compared to $380.0 million in the prior year quarter
•Net income totaled $12.5 million, or $0.06 per diluted share, compared to $4.5 million, or $0.02 per diluted share, in the prior year quarter
•Adjusted diluted EPS1 was $0.16 per diluted share compared to $0.13 per diluted share in the prior year quarter
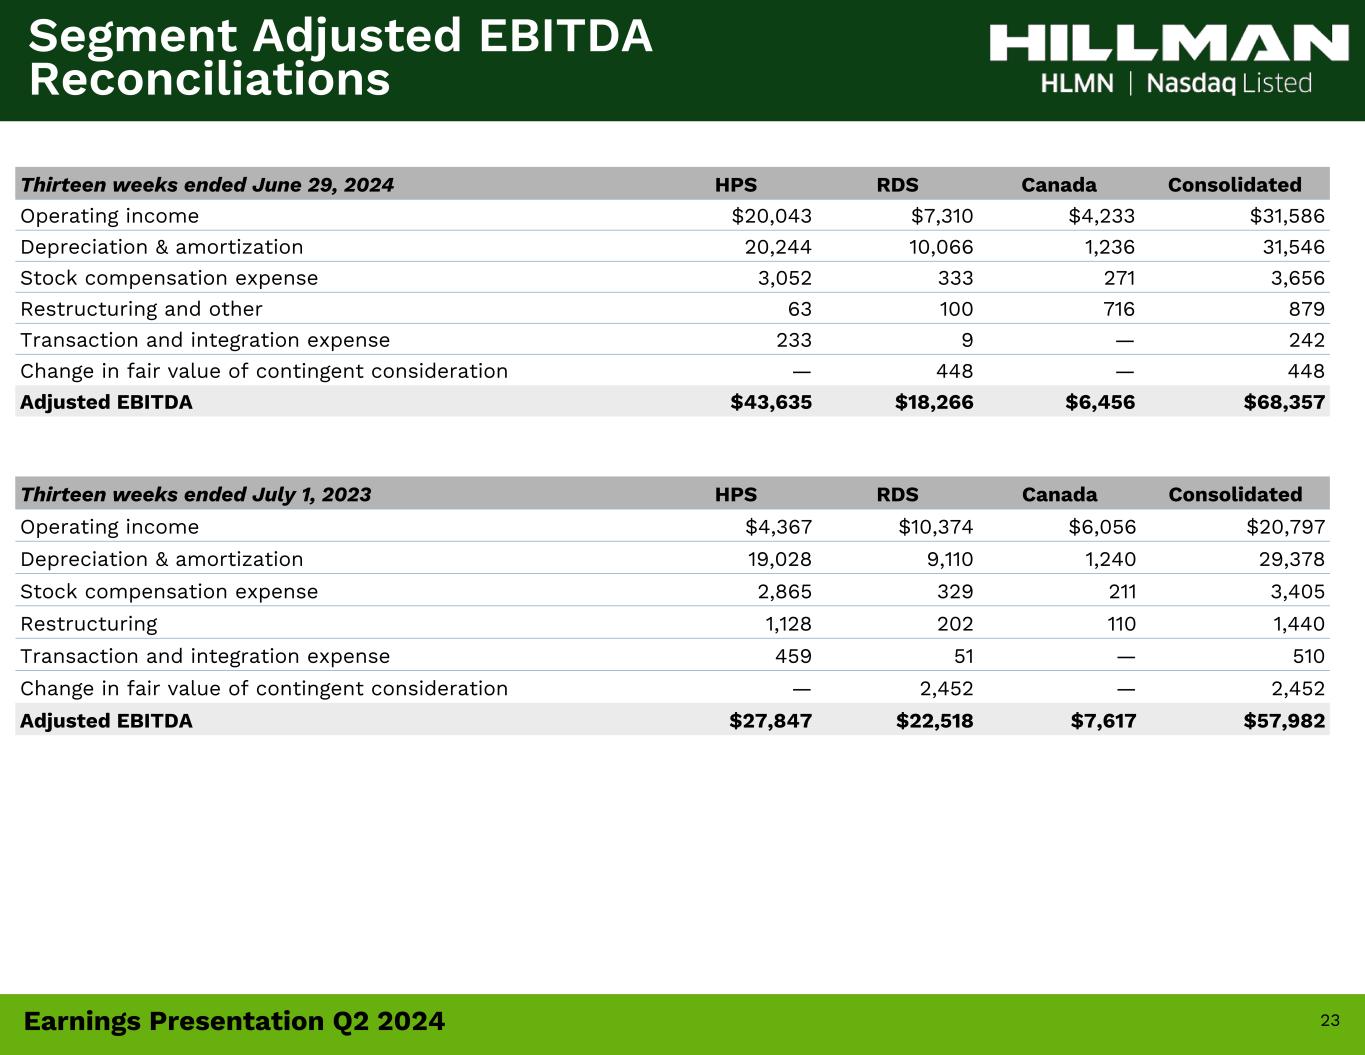
•Adjusted EBITDA1 totaled $68.4 million compared to $58.0 million in the prior year quarter
Second Quarter YTD 2024 Highlights (Twenty-six weeks ended June 29, 2024)
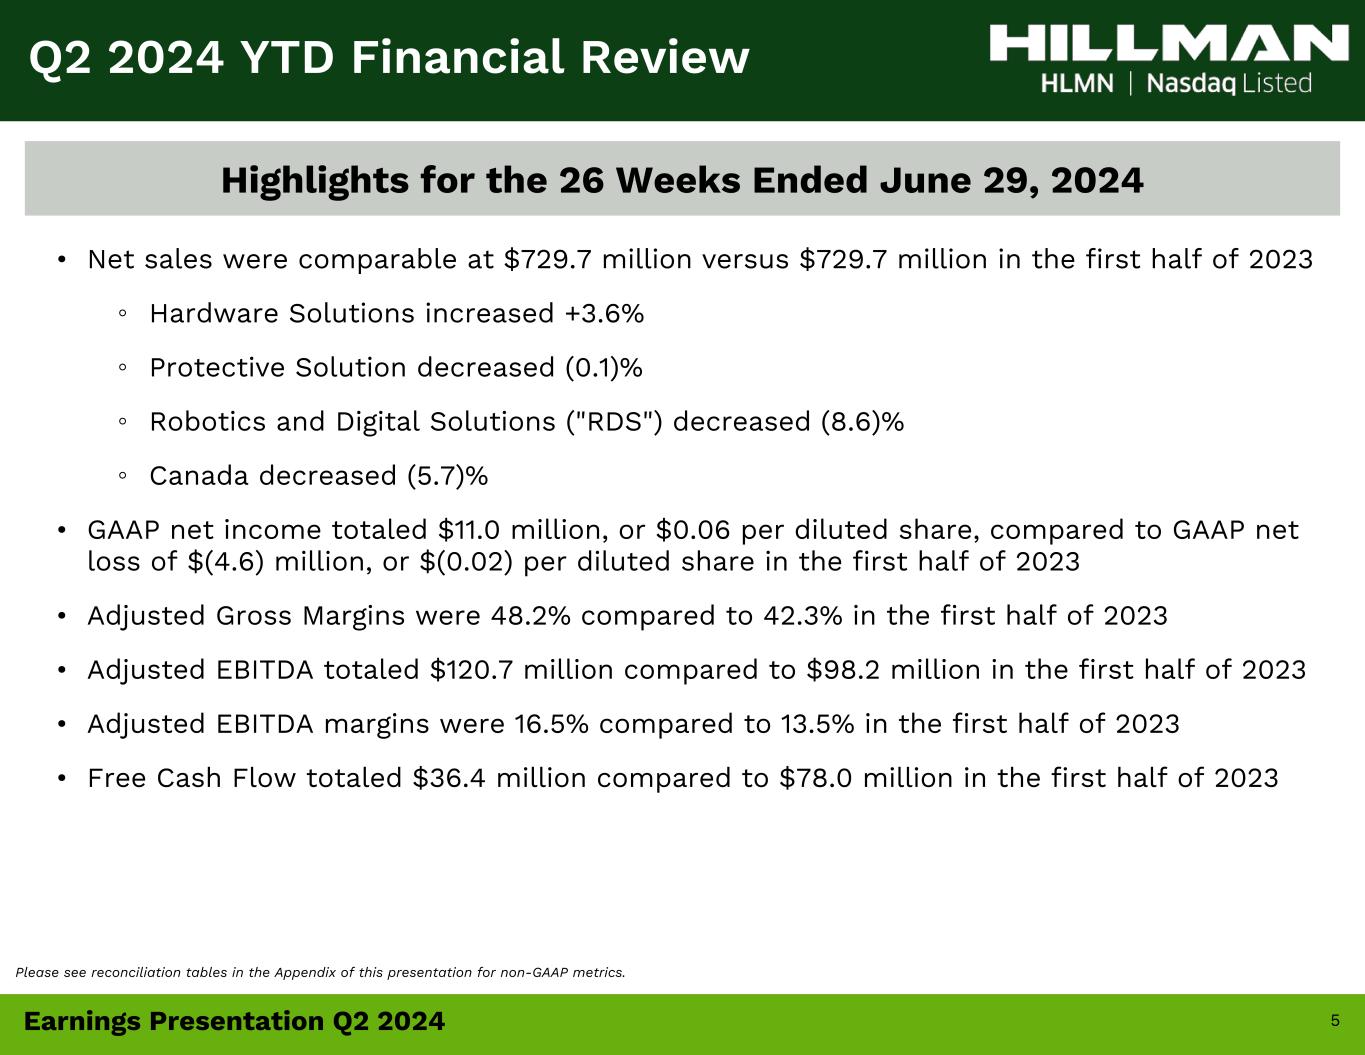
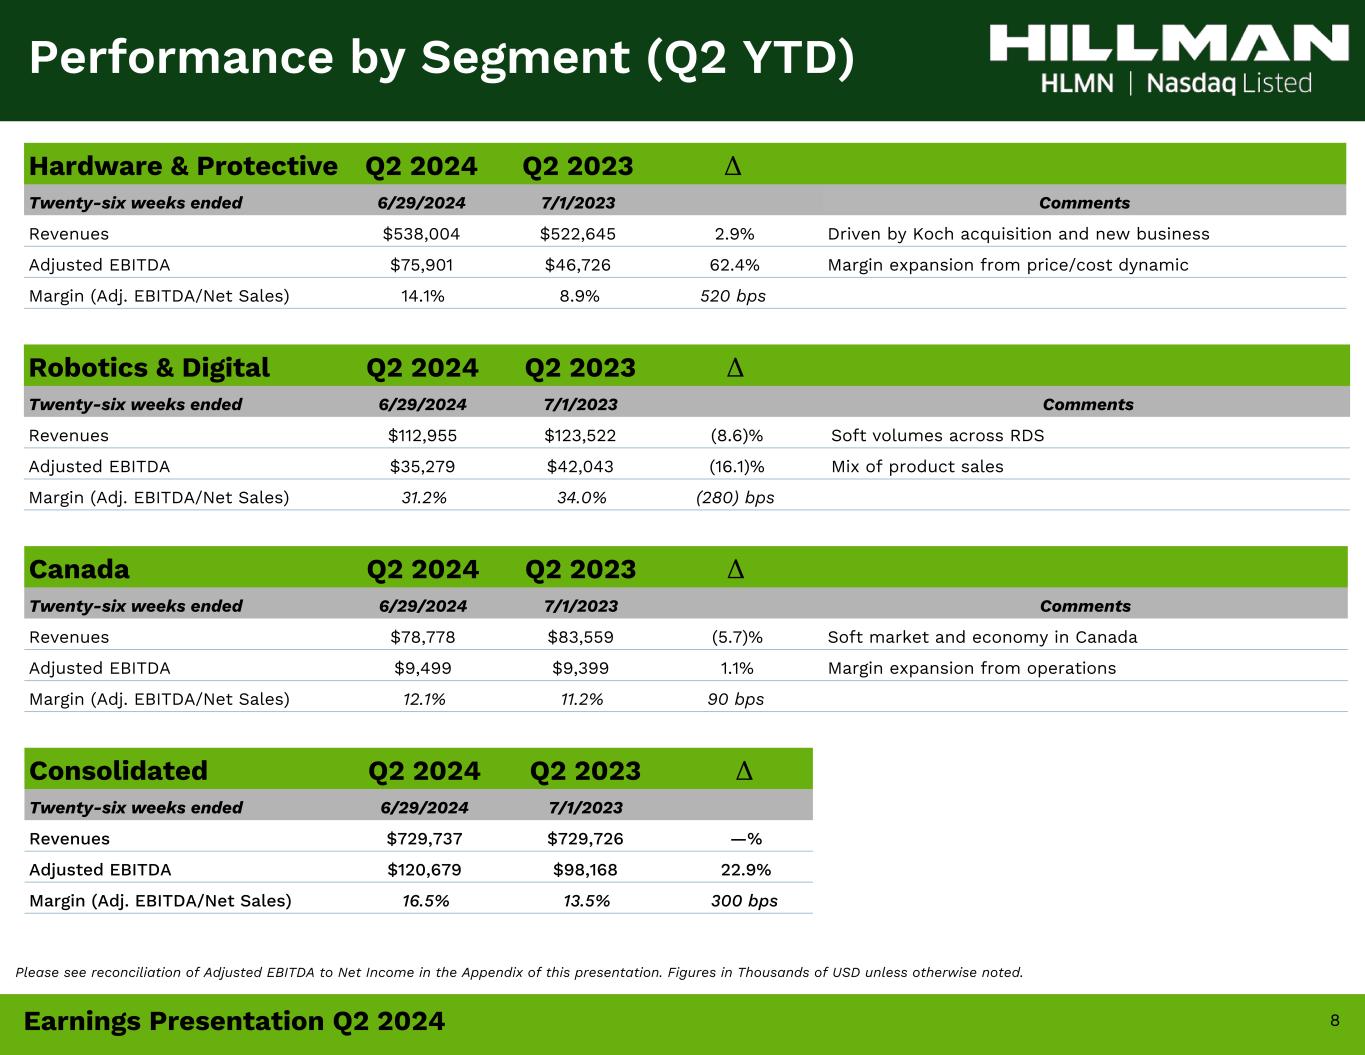
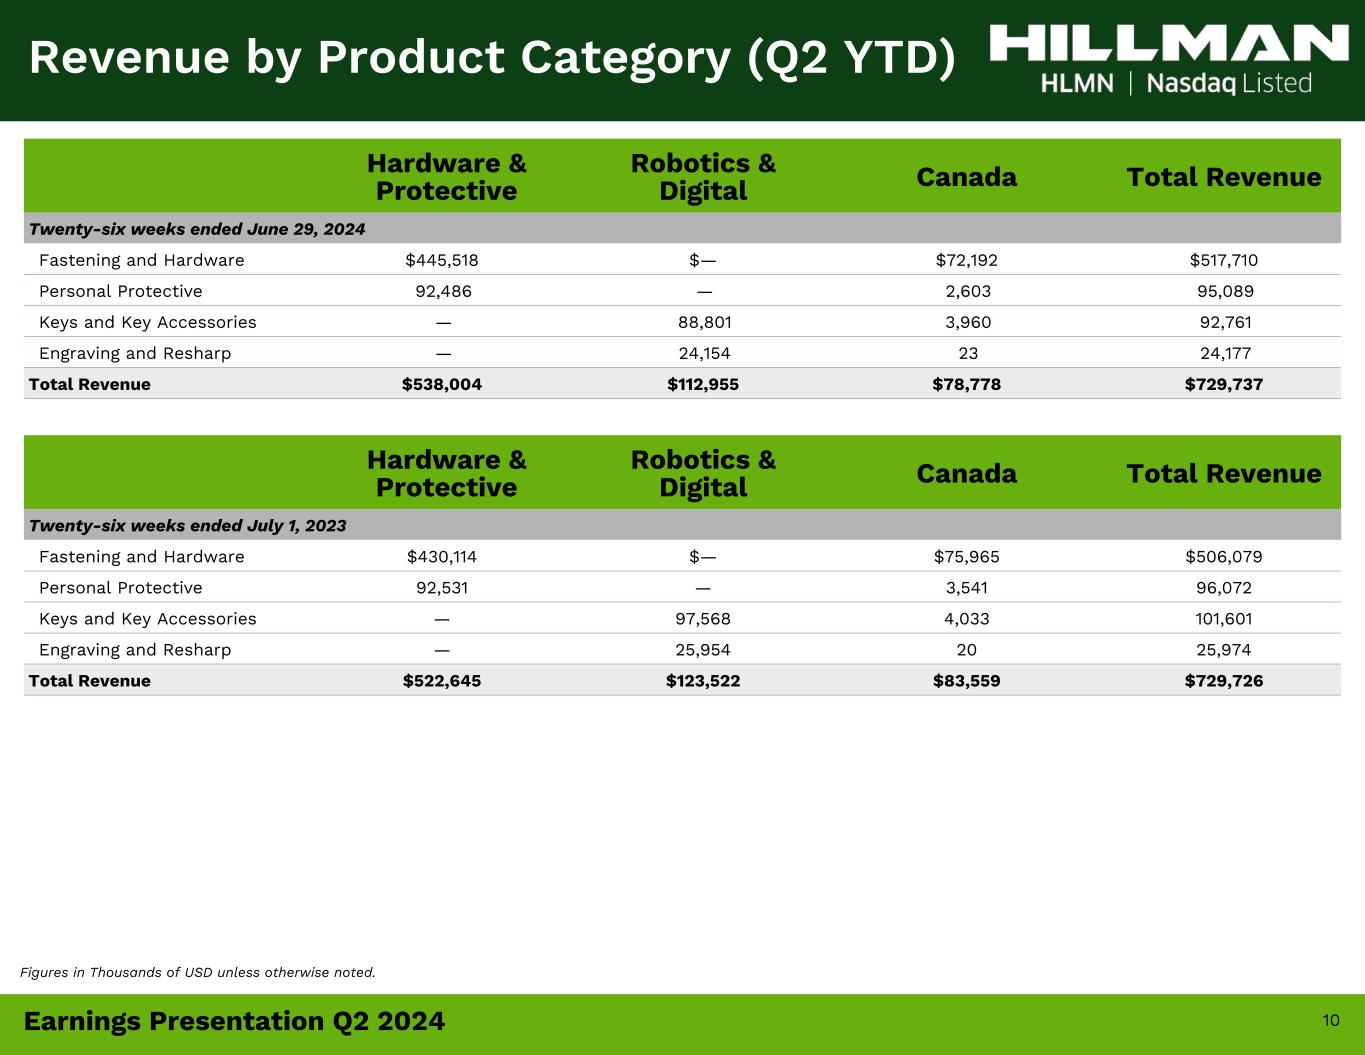
•Net sales were $729.7 million, unchanged versus the prior year period
•Net income totaled $11.0 million, or $0.06 per diluted share, compared to net loss of $(4.6) million, or $(0.02) per diluted share, in the prior year period
•Adjusted diluted EPS1 was $0.25 per diluted share compared to $0.19 per diluted share in the prior year period
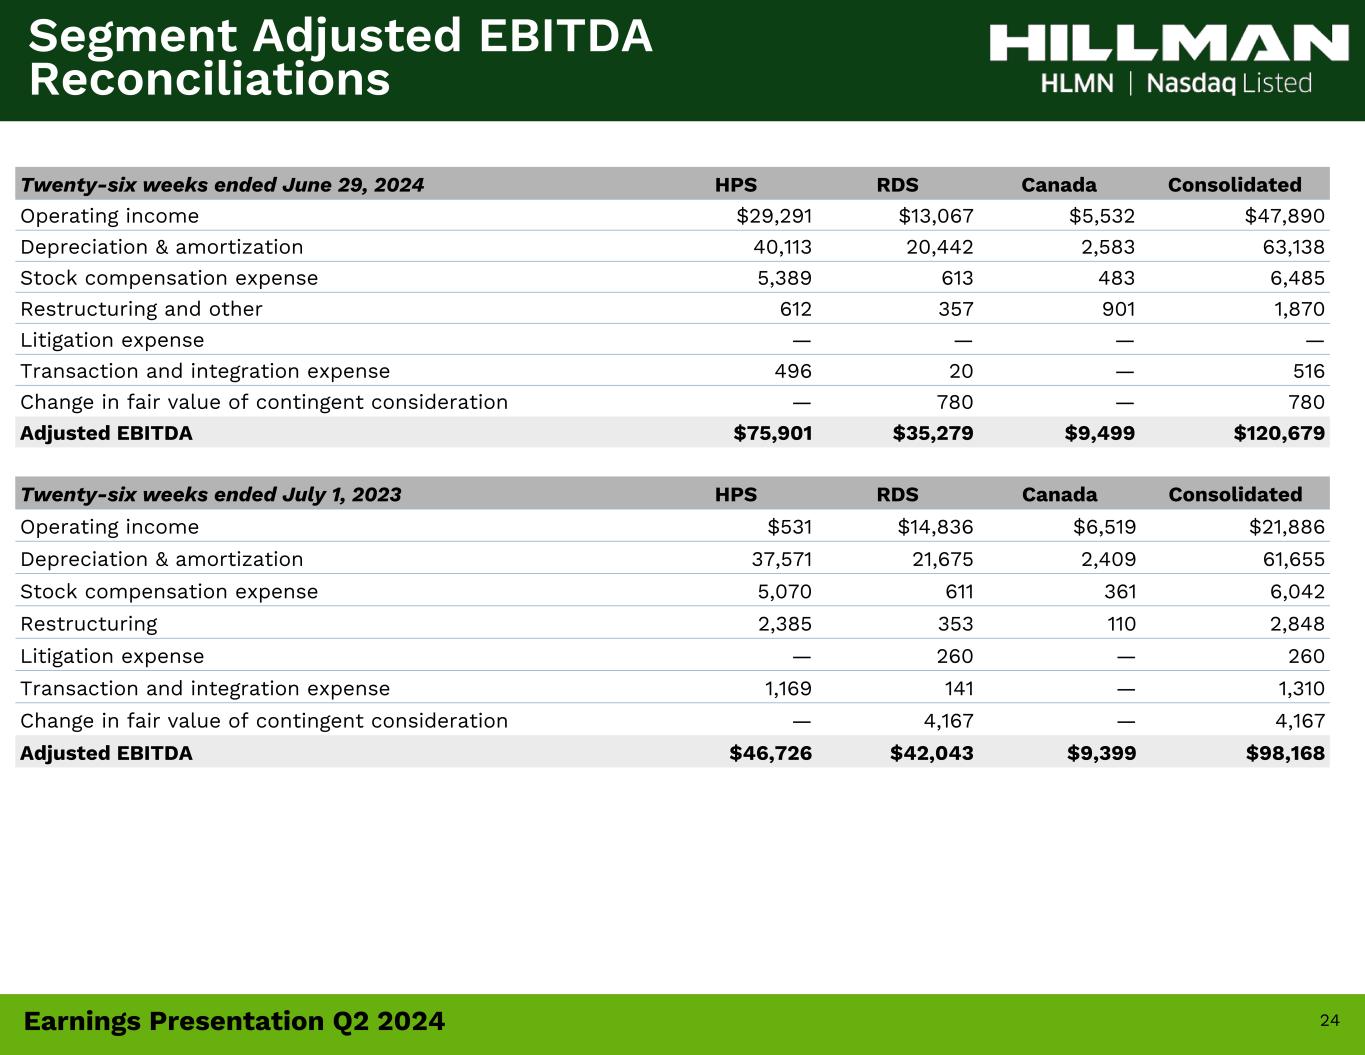
•Adjusted EBITDA1 totaled $120.7 million compared to $98.2 million in the prior year period
•Net cash provided by operating activities was $76.5 million compared to $115.0 million in the prior year period
•Free Cash Flow1 totaled $36.4 million compared to $78.0 million in the prior year period
1) Denotes Non-GAAP metric. For additional information, including our definitions, use of, and reconciliations of these metrics to the most directly comparable financial measures under GAAP, please see the reconciliations toward the end of the press release.
1
Balance Sheet and Liquidity at June 29, 2024
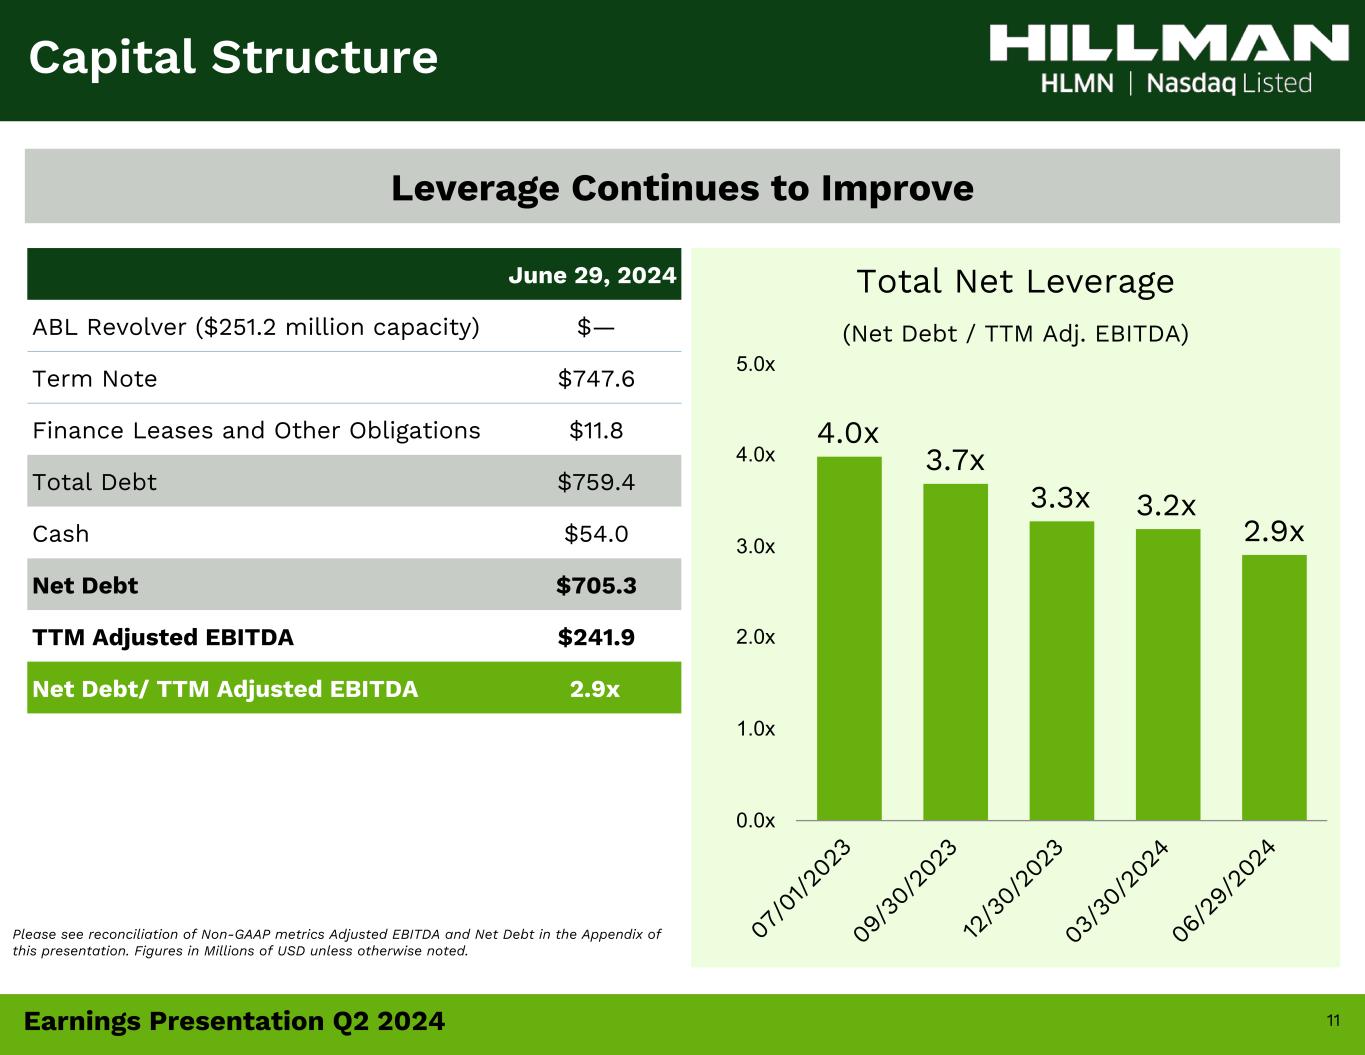
•Gross debt was $759.4 million, compared to $760.9 million on December 30, 2023, and $851.5 million on July 1, 2023
•Net debt1 outstanding decreased to $705.3 million, compared to $722.4 million on December 30, 2023, and $813.8 million on July 1, 2023
•Liquidity available totaled approximately $305.3 million, consisting of $251.2 million of available borrowing under the revolving credit facility and $54.0 million of cash and equivalents
•Net debt1 to trailing twelve month Adjusted EBITDA improved to 2.9x from 3.3x on December 30, 2023, and 4.0x on July 1, 2023
Management Commentary
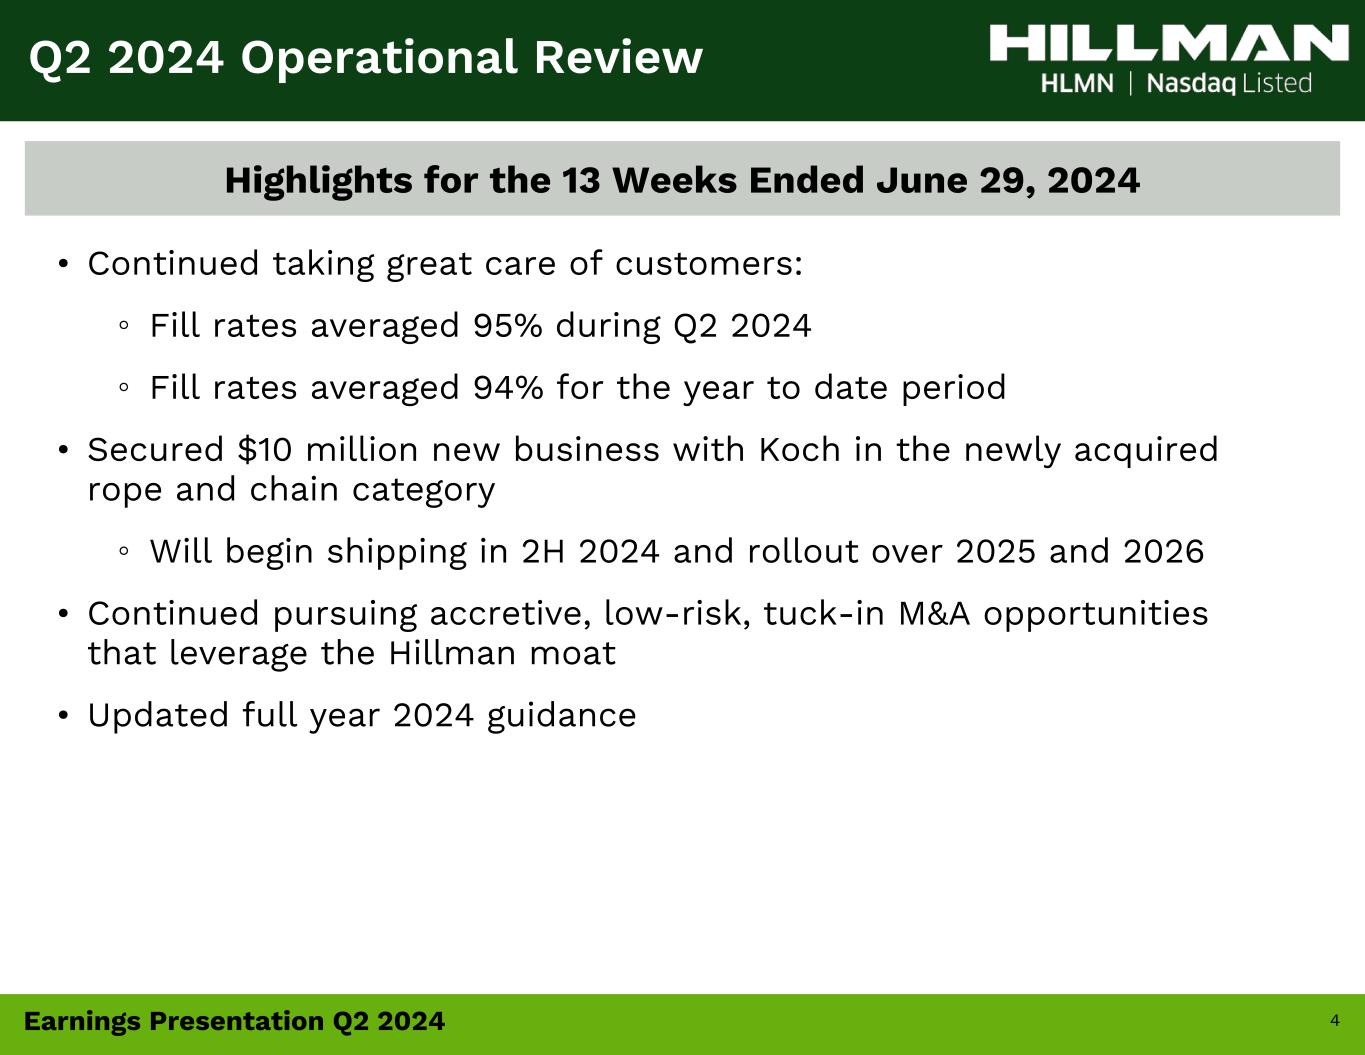
"During the second quarter we delivered outstanding bottom-line performance resulting from improved efficiencies and strong margins," commented Doug Cahill, Chairman, President, and Chief Executive Officer of Hillman. "We took great care of our customers during the quarter with exceptional fill rates of 95%, which ensures that our products are in stock and on the shelves of our retail partners. Although sales were impacted by prevailing market conditions, we continued to roll out new business wins and improve our financial position by strengthening our balance sheet."
"As we navigate the market, we remain steadfast in our commitment to adding value to our customers, associates and stakeholders. Our strategic focus remains 'controlling the controllables' and positioning Hillman for future growth. We look forward to building the foundation for continued success in the years to come."
Full Year 2024 Guidance - Updated
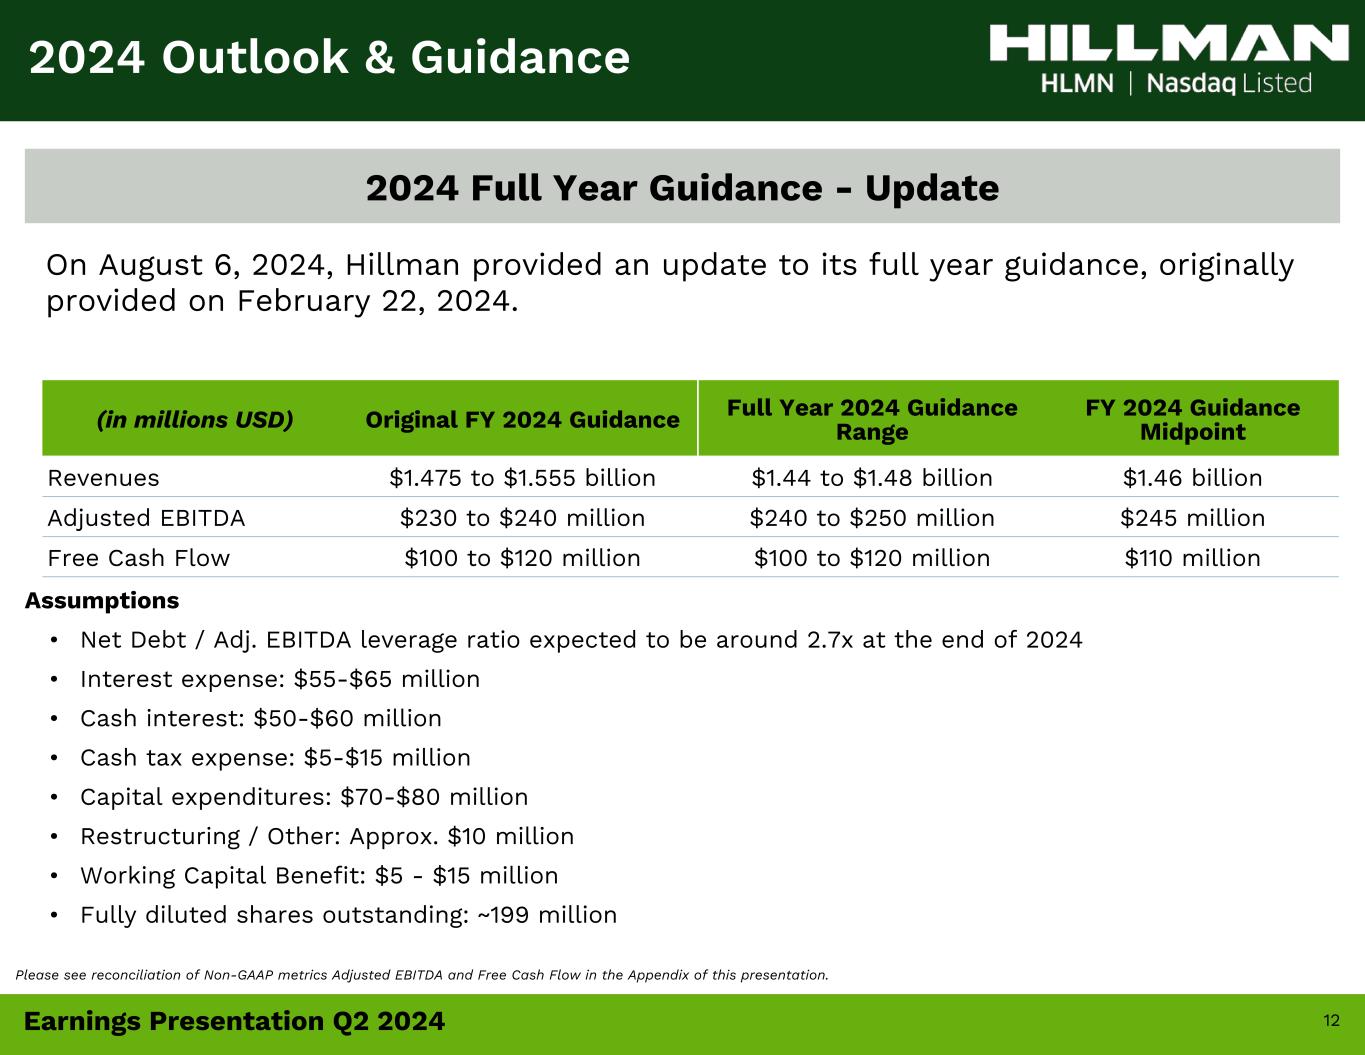
Based on year-to-date performance and improved visibility on the remainder of the year, management is updating its full year 2024 guidance originally provided on February 22, 2024 with Hillman's fourth quarter 2023 results.
| | | | | | | | |
| Original 2024 Guidance | Full year 2024 Guidance |
| Net Sales | $1.475 to $1.555 billion | $1.44 to $1.48 billion |
Adjusted EBITDA1 | $230 to $240 million | $240 to $250 million |
Free Cash Flow1 | $100 to $120 million | $100 to $120 million |
Rocky Kraft, Hillman's chief financial officer commented: "We are adjusting our guidance to better align with the current market landscape. Specifically, we are lowering our top-line revenue expectations while simultaneously increasing our bottom-line guidance, underscoring our confidence in our ability to drive profitability through operations and margin management. Our cash flow guidance remains unchanged, reflecting the net impact of our top and bottom line expectations."
1) Denotes Non-GAAP metric. For additional information, including our definitions, use of, and reconciliations of these metrics to the most directly comparable financial measures under GAAP, please see the reconciliations toward the end of the press release.
2
Leadership Succession
In a separate press release issued this morning, Hillman announced the following planned transition effective January 1, 2025:
•Jon Michael Adinolfi will transition to the role of President and Chief Executive Officer
•Doug Cahill will transition to the role of Executive Chairman
This leadership succession ensures the continuity of Hillman’s current leadership and strategy.
Second Quarter 2024 Results Presentation
Hillman plans to host a conference call and webcast presentation today, August 6, 2024, at 8:30 a.m. Eastern Time to discuss its results. Chairman, President, and Chief Executive Officer Doug Cahill; Chief Operating Officer Jon Michael Adinolfi, and Chief Financial Officer Rocky Kraft will host the results presentation.
Date: Tuesday, August 6, 2024
Time: 8:30 a.m. Eastern Time
Listen-Only Webcast: https://edge.media-server.com/mmc/p/rc53kxup
A webcast replay will be available approximately one hour after the conclusion of the call using the link above.
Hillman’s quarterly presentation and Form 10-Q are expected to be filed with the SEC and posted to its Investor Relations website, https://ir.hillmangroup.com, prior to the webcast presentation.
About Hillman Solutions Corp.
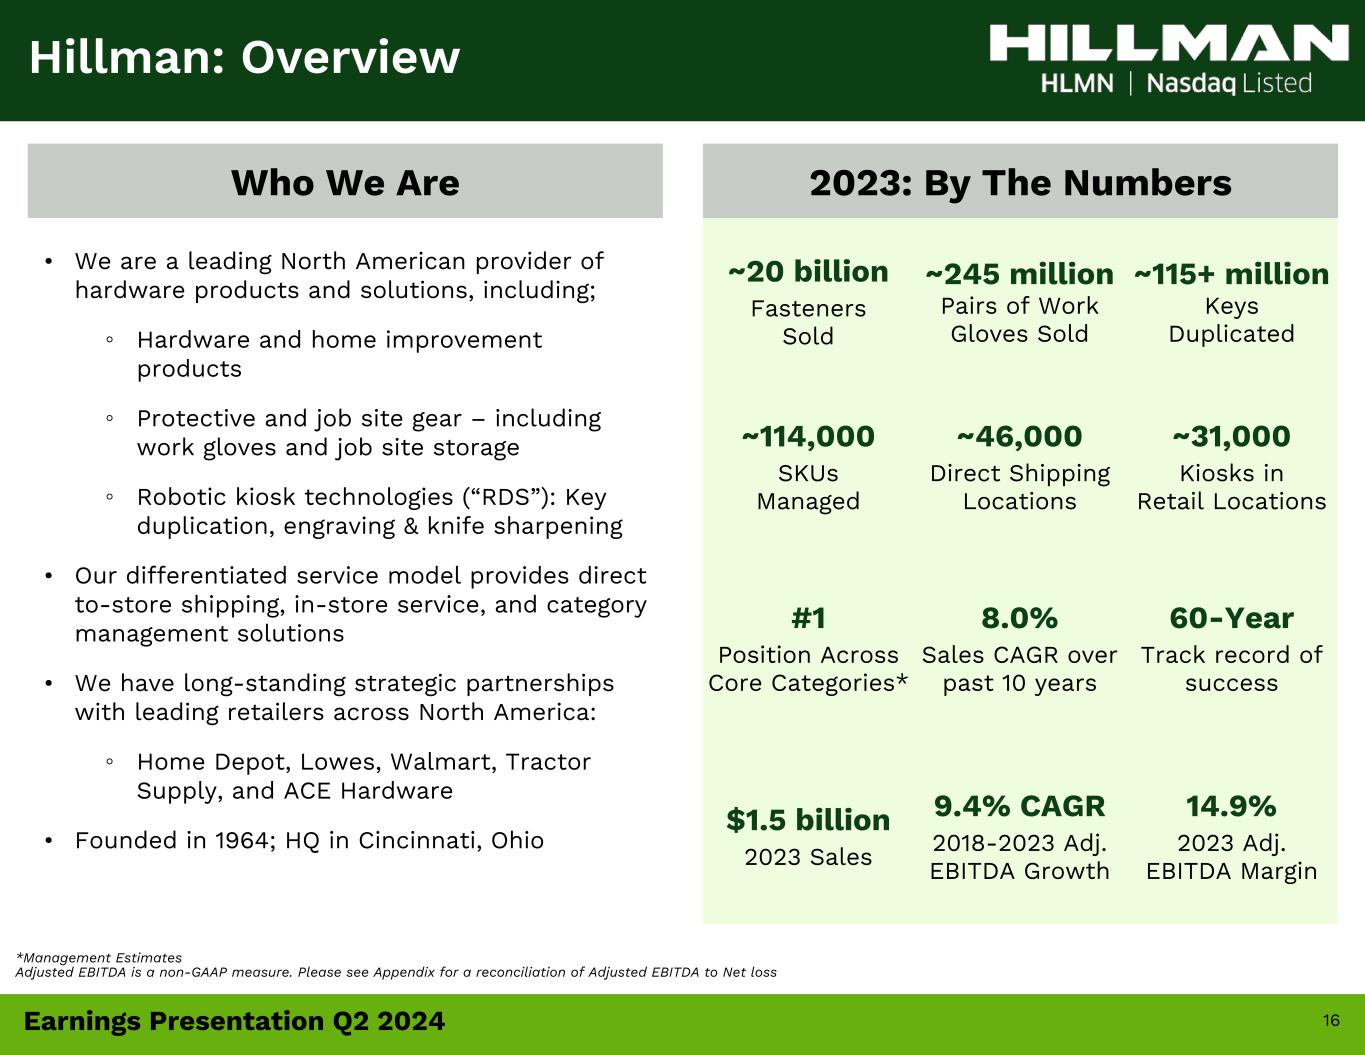
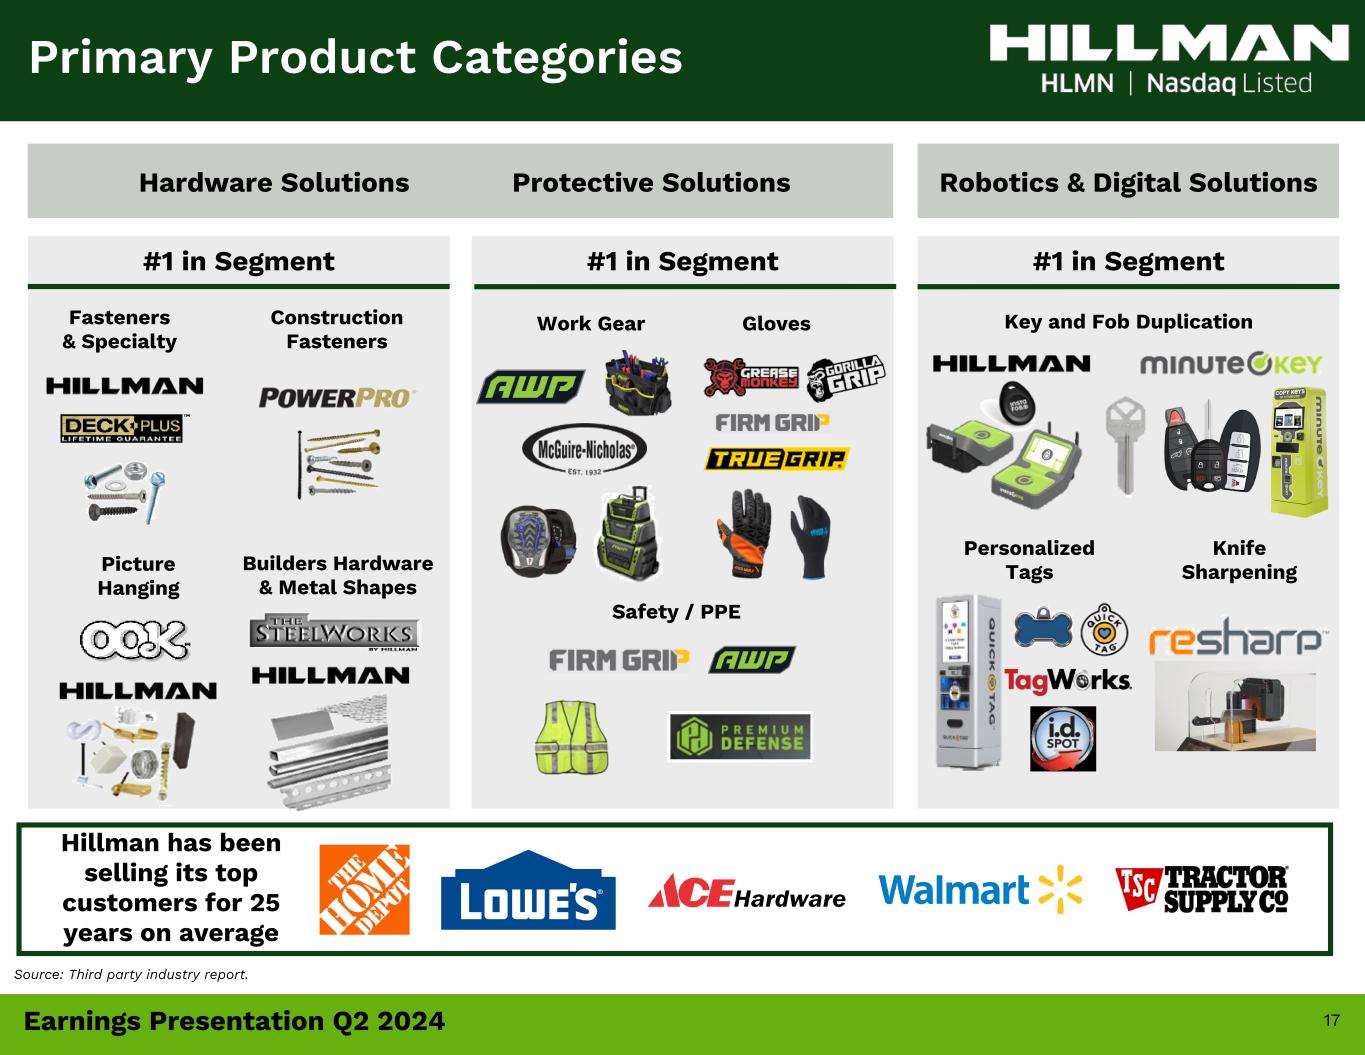
Founded in 1964 and headquartered in Cincinnati, Ohio, Hillman Solutions Corp. (“Hillman”) and its subsidiaries are leading North American providers of complete hardware solutions, delivered with outstanding customer service to over 46,000 locations. Hillman is celebrating 60 years of service this year, a significant milestone achieved by maintaining strong company values, an innovative culture, and delivering a “small business” experience with “big business” efficiency. Hillman designs innovative product and merchandising solutions for complex categories that deliver an outstanding customer experience to home improvement centers, mass merchants, national and regional hardware stores, pet supply stores, and OEM & industrial customers. For more information on Hillman, visit www.hillman.com.
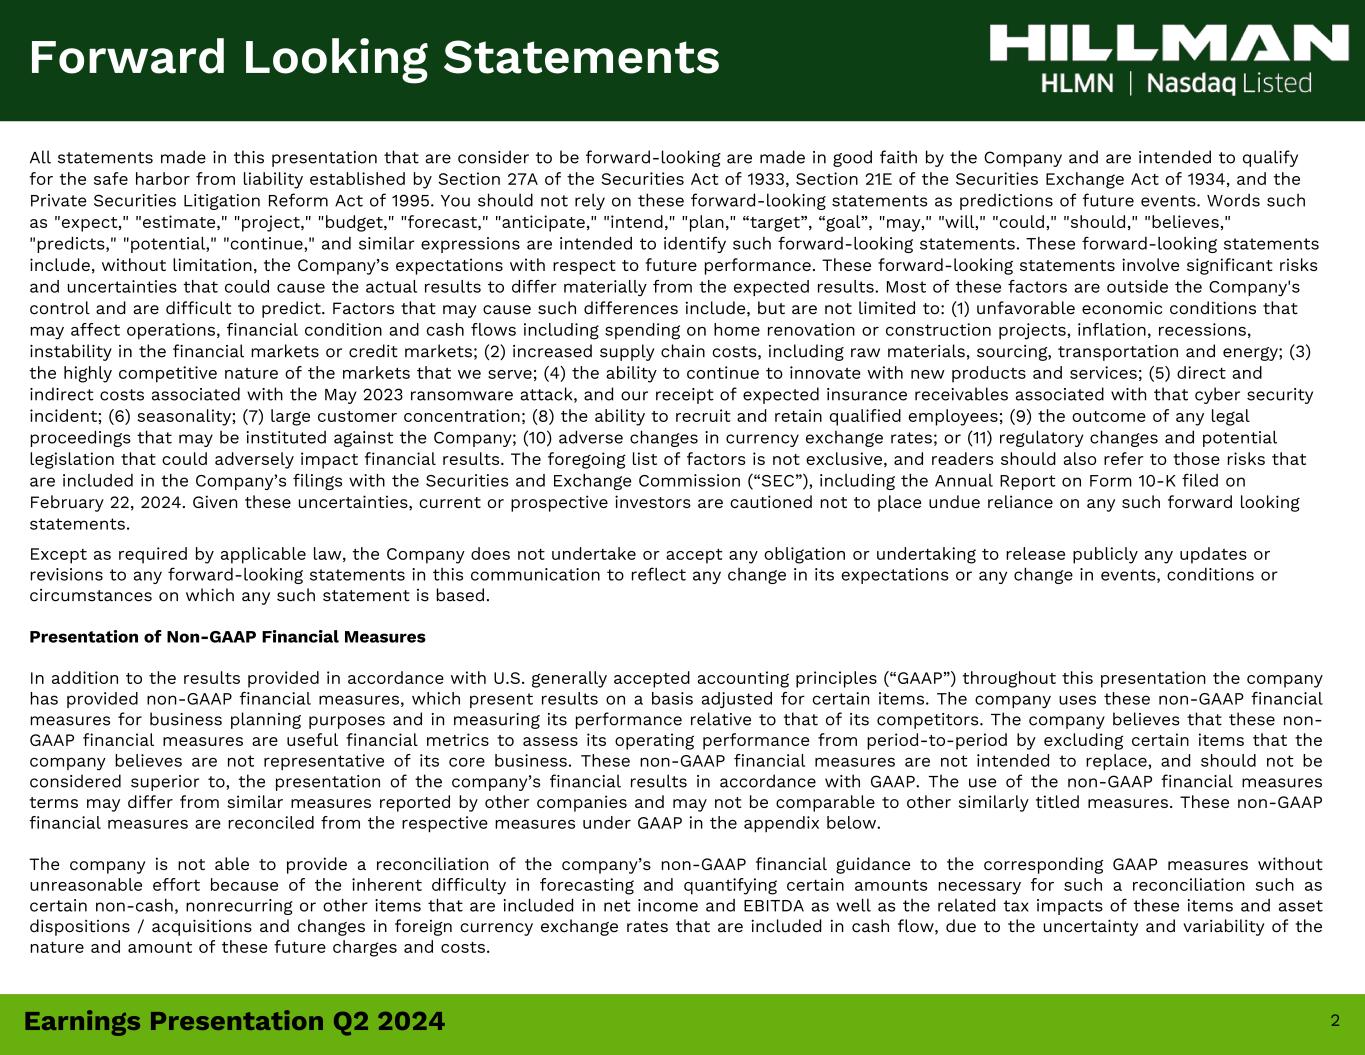
Forward Looking Statements
All statements made in this press release that are consider to be forward-looking are made in good faith by the Company and are intended to qualify for the safe harbor from liability established by Section 27A of the Securities Act of 1933, Section 21E of the Securities Exchange Act of 1934, and the Private Securities Litigation Reform Act of 1995. You should not rely on these forward-looking statements as predictions of future events. Words such as "expect," "estimate," "project," "budget," "forecast," "anticipate," "intend," "plan," “target”,
1) Denotes Non-GAAP metric. For additional information, including our definitions, use of, and reconciliations of these metrics to the most directly comparable financial measures under GAAP, please see the reconciliations toward the end of the press release.
3
“goal”, "may," "will," "could," "should," "believes," "predicts," "potential," "continue," and similar expressions are intended to identify such forward-looking statements. These forward-looking statements include, without limitation, the Company’s expectations with respect to future performance. These forward-looking statements involve significant risks and uncertainties that could cause the actual results to differ materially from the expected results. Most of these factors are outside the Company's control and are difficult to predict. Factors that may cause such differences include, but are not limited to: (1) unfavorable economic conditions that may affect operations, financial condition and cash flows including spending on home renovation or construction projects, inflation, recessions, instability in the financial markets or credit markets; (2) increased supply chain costs, including raw materials, sourcing, transportation and energy; (3) the highly competitive nature of the markets that we serve; (4) the ability to continue to innovate with new products and services; (5) direct and indirect costs associated with the May 2023 ransomware attack, and our receipt of expected insurance receivables associated with that cyber security incident; (6) seasonality; (7) large customer concentration; (8) the ability to recruit and retain qualified employees; (9) the outcome of any legal proceedings that may be instituted against the Company; (10) adverse changes in currency exchange rates; or (11) regulatory changes and potential legislation that could adversely impact financial results. The foregoing list of factors is not exclusive, and readers should also refer to those risks that are included in the Company’s filings with the Securities and Exchange Commission (“SEC”), including the Annual Report on Form 10-K filed on February 22, 2024. Given these uncertainties, current or prospective investors are cautioned not to place undue reliance on any such forward looking statements.
Except as required by applicable law, the Company does not undertake or accept any obligation or undertaking to release publicly any updates or revisions to any forward-looking statements in this communication to reflect any change in its expectations or any change in events, conditions or circumstances on which any such statement is based.
Contact:
Michael Koehler
Vice President of Investor Relations & Treasury
513-826-5495
1) Denotes Non-GAAP metric. For additional information, including our definitions, use of, and reconciliations of these metrics to the most directly comparable financial measures under GAAP, please see the reconciliations toward the end of the press release.
4
HILLMAN SOLUTIONS CORP.
Condensed Consolidated Statement of Net Income (Loss), GAAP Basis
(dollars in thousands) Unaudited
| | | | | | | | | | | | | | | | | | | | | | | |
| Thirteen Weeks Ended
June 29, 2024 | | Thirteen Weeks Ended
July 1, 2023 | | Twenty-six Weeks Ended
June 29, 2024 | | Twenty-six Weeks Ended
July 1, 2023 |
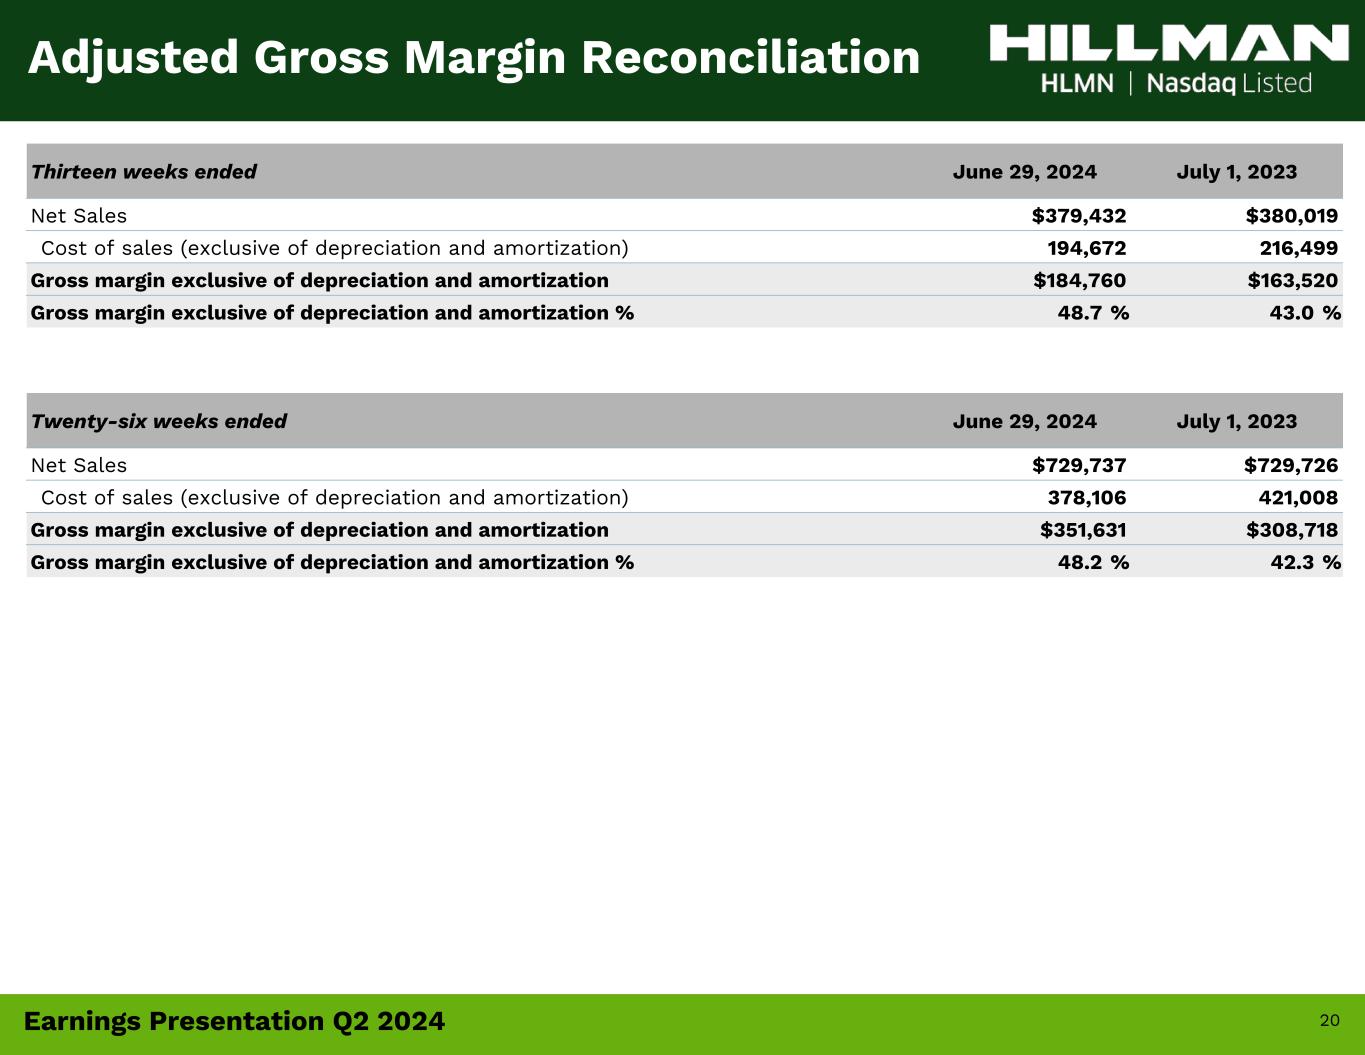
| Net sales | $ | 379,432 | | | $ | 380,019 | | | $ | 729,737 | | | $ | 729,726 | |
| Cost of sales (exclusive of depreciation and amortization shown separately below) | 194,672 | | | 216,499 | | | 378,106 | | | 421,008 | |
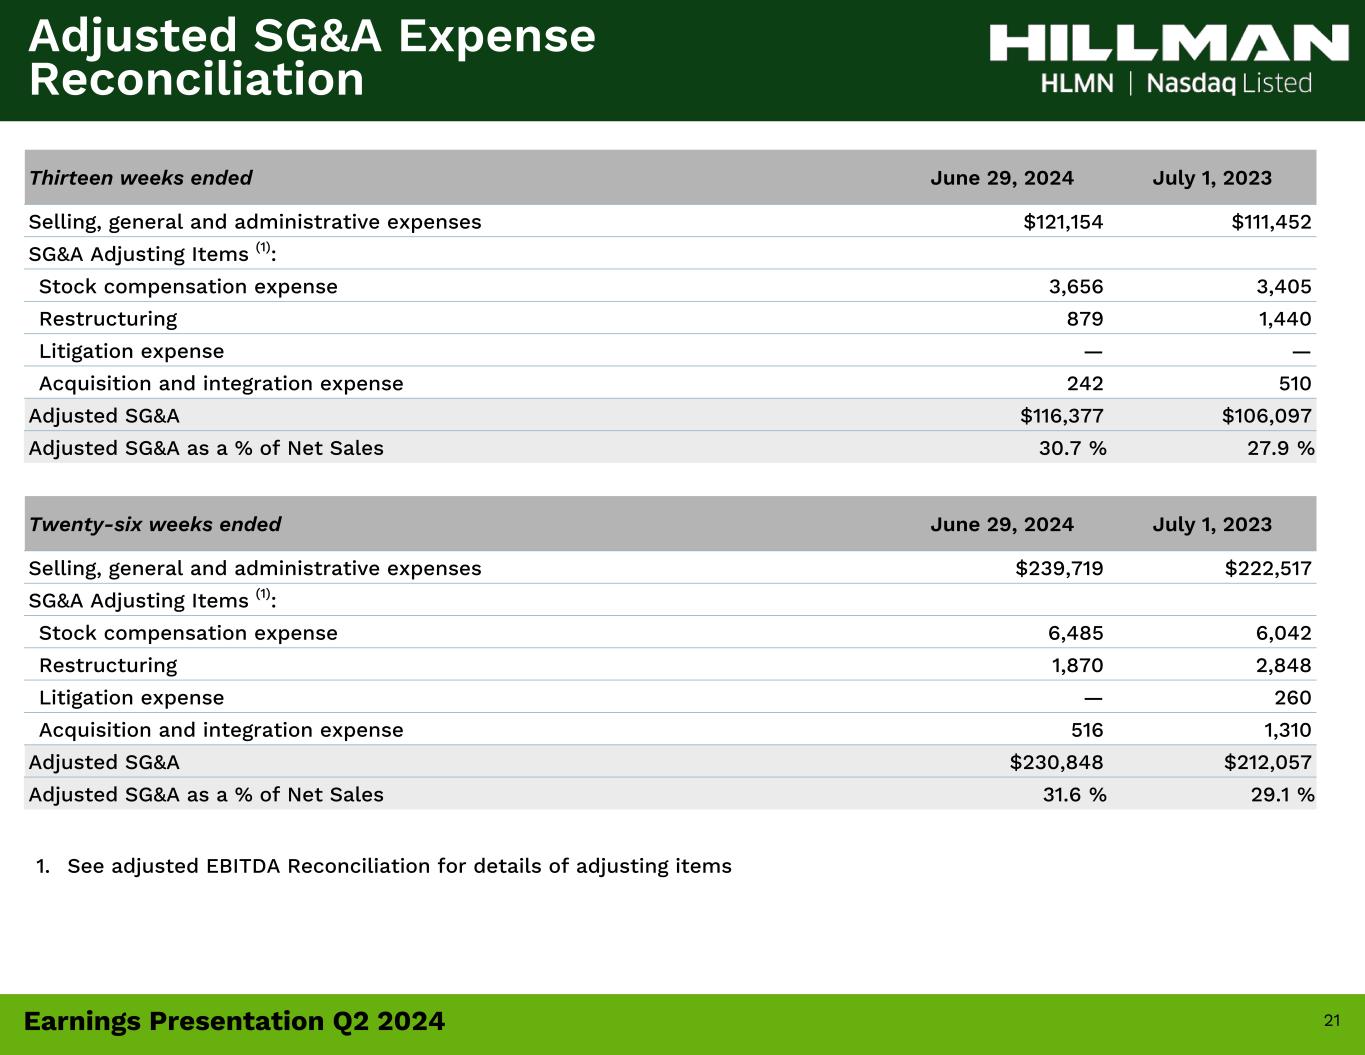
| Selling, warehouse, general and administrative expenses | 121,154 | | | 111,452 | | | 239,719 | | | 222,517 | |
| Depreciation | 16,297 | | | 13,800 | | | 32,635 | | | 30,505 | |
| Amortization | 15,249 | | | 15,578 | | | 30,503 | | | 31,150 | |
| Other expense | 474 | | | 1,893 | | | 884 | | | 2,660 | |
| Income from operations | 31,586 | | | 20,797 | | | 47,890 | | | 21,886 | |
| Interest expense, net | 13,937 | | | 18,075 | | | 29,208 | | | 36,152 | |
| Refinancing costs | — | | | — | | | 3,008 | | | — | |
| Income (loss) before income taxes | 17,649 | | | 2,722 | | | 15,674 | | | (14,266) | |
| Income tax expense (benefit) | 5,114 | | | (1,823) | | | 4,631 | | | (9,679) | |
| Net income (loss) | $ | 12,535 | | | $ | 4,545 | | | $ | 11,043 | | | $ | (4,587) | |
| | | | | | | |
| Basic income (loss) per share | $ | 0.06 | | | $ | 0.02 | | | $0.06 | | $ | (0.02) | |
| Weighted average basic shares outstanding | 196,075 | | | 194,644 | | | 195,721 | | | 194,596 | |
| | | | | | | |
| Diluted income (loss) per share | $ | 0.06 | | | $ | 0.02 | | | $0.06 | | $ | (0.02) | |
| Weighted average diluted shares outstanding | 198,420 | | | 195,528 | | | 198,037 | | | 194,596 | |
HILLMAN SOLUTIONS CORP.
Condensed Consolidated Balance Sheets
(dollars in thousands)
Unaudited
| | | | | | | | | | | |
| | June 29, 2024 | | December 30, 2023 |
| ASSETS | | | |
| Current assets: | | | |
| Cash and cash equivalents | $ | 54,016 | | | $ | 38,553 | |
Accounts receivable, net of allowances of 2,477 (2,770 - 2023) | 130,505 | | | 103,482 | |
| Inventories, net | 411,928 | | | 382,710 | |
| Other current assets | 21,324 | | | 23,235 | |
| Total current assets | 617,773 | | | 547,980 | |
Property and equipment, net of accumulated depreciation of 358,874 (333,875 - 2023) | 212,428 | | | 200,553 | |
| Goodwill | 827,400 | | | 825,042 | |
Other intangibles, net of accumulated amortization of 500,617 (470,791 - 2023) | 627,671 | | | 655,293 | |
| Operating lease right of use assets | 83,539 | | | 87,479 | |
| Other assets | 16,305 | | | 14,754 | |
| | | |
| Total assets | $ | 2,385,116 | | | $ | 2,331,101 | |
| LIABILITIES AND STOCKHOLDERS’ EQUITY | | | |
| Current liabilities: | | | |
| Accounts payable | $ | 170,548 | | | $ | 140,290 | |
| Current portion of debt and financing lease liabilities | 11,416 | | | 9,952 | |
| Current portion of operating lease liabilities | 15,459 | | | 14,407 | |
| Accrued expenses: | | | |
| Salaries and wages | 28,324 | | | 22,548 | |
| Pricing allowances | 6,287 | | | 8,145 | |
| Income and other taxes | 10,021 | | | 6,469 | |
| | | |
| Other accrued liabilities | 24,504 | | | 21,309 | |
| Total current liabilities | 266,559 | | | 223,120 | |
| Long-term debt | 732,097 | | | 731,708 | |
| Deferred tax liabilities | 129,748 | | | 131,552 | |
| Operating lease liabilities | 74,794 | | | 79,994 | |
| Other non-current liabilities | 7,476 | | | 10,198 | |
| Total liabilities | $ | 1,210,674 | | | $ | 1,176,572 | |
| Commitments and contingencies (Note 6) | | | |
| Stockholders' equity: | | | |
Common stock, 0.0001 par, 500,000,000 shares authorized, 196,156,159 issued and outstanding at June 29, 2024 and 194,913,124 issued and outstanding at December 30, 2023 | 20 | | | 20 | |
| Additional paid-in capital | 1,431,862 | | | 1,418,535 | |
| Accumulated deficit | (225,163) | | | (236,206) | |
| Accumulated other comprehensive loss | (32,277) | | | (27,820) | |
| Total stockholders' equity | 1,174,442 | | | 1,154,529 | |
| Total liabilities and stockholders' equity | $ | 2,385,116 | | | $ | 2,331,101 | |
HILLMAN SOLUTIONS CORP.
Condensed Consolidated Statement of Cash Flows
(dollars in thousands)
Unaudited
| | | | | | | | | | | |
| | Twenty-six Weeks Ended
June 29, 2024 | | Twenty-six Weeks Ended
July 1, 2023 |
| Cash flows from operating activities: | | | |
| Net income (loss) | $ | 11,043 | | | $ | (4,587) | |
| Adjustments to reconcile net income (loss) to net cash provided by operating activities: | | | |
| Depreciation and amortization | 63,138 | | | 61,655 | |
| Deferred income taxes | (1,706) | | | (5,232) | |
| Deferred financing and original issue discount amortization | 2,551 | | | 2,663 | |
| Stock-based compensation expense | 6,484 | | | 6,044 | |
| Loss on debt restructuring | 3,008 | | | — | |
| Cash paid to third parties in connection with debt restructuring | (1,554) | | | — | |
| | | |
| | | |
| Loss on disposal of property and equipment | 56 | | | 123 | |
| Change in fair value of contingent consideration | 780 | | | 4,167 | |
| | | |
| Changes in operating items: | | | |
| Accounts receivable, net | (28,413) | | | (43,458) | |
| Inventories, net | (10,929) | | | 62,208 | |
| Other assets | (4,409) | | | (4,514) | |
| Accounts payable | 28,683 | | | 43,845 | |
| Other accrued liabilities | 7,744 | | | (7,868) | |
| | | |
| | | |
| Net cash provided by operating activities | 76,476 | | | 115,046 | |
| Net cash from investing activities | | | |
| Acquisition of business, net of cash received | (23,783) | | | (300) | |
| Capital expenditures | (40,078) | | | (37,029) | |
| | | |
| Other investing activities | (153) | | | (225) | |
| Net cash used for investing activities | (64,014) | | | (37,554) | |
| Cash flows from financing activities: | | | |
| Repayments of senior term loans | (4,255) | | | (4,255) | |
| | | |
| | | |
| | | |
| | | |
| | | |
| Financing fees | (33) | | | — | |
| Borrowings on revolving credit loans | 65,000 | | | 58,000 | |
| Repayments of revolving credit loans | (65,000) | | | (122,000) | |
| Principal payments under finance lease obligations | (1,758) | | | (1,039) | |
| Proceeds from exercise of stock options | 6,379 | | | 611 | |
| Payments of contingent consideration | (133) | | | (1,125) | |
| Other financing activities | 570 | | | (155) | |
| | | |
| Net cash provided by (used for) financing activities | 770 | | | (69,963) | |
| Effect of exchange rate changes on cash | 2,231 | | | (954) | |
| Net increase in cash and cash equivalents | 15,463 | | | 6,575 | |
| Cash and cash equivalents at beginning of period | 38,553 | | | 31,081 | |
| Cash and cash equivalents at end of period | $ | 54,016 | | | $ | 37,656 | |
Reconciliations of Non-GAAP Financial Measures to the Most Directly Comparable GAAP Financial Measures
The Company uses non-GAAP financial measures to analyze underlying business performance and trends. The Company believes that providing these non-GAAP financial measures enhances the Company’s and investors’ ability to compare the Company’s past financial performance with its current performance. These non-GAAP financial measures are provided as supplemental information to the financial measures presented in this press release that are calculated and presented in accordance with GAAP. Non-GAAP financial measures should not be considered a substitute for, or superior to, financial measures determined or calculated in accordance with GAAP. The Company’s definitions of its non-GAAP financial measures may not be comparable to similarly titled measures reported by other companies. Because GAAP financial measures on a forward-looking basis are not accessible, and reconciling information is not available without unreasonable effort, reconciliations to GAAP financial measures are not provided for forward-looking non-GAAP measures. For the same reasons, the Company is unable to address the probable significance of the unavailable information, which could be material to future results.
Non-GAAP financial measures such as consolidated adjusted EBITDA and Adjusted Diluted Earnings per Share (EPS) exclude from the relevant GAAP metrics items that neither relate to the ordinary course of the Company’s business, nor reflect the Company’s underlying business performance.
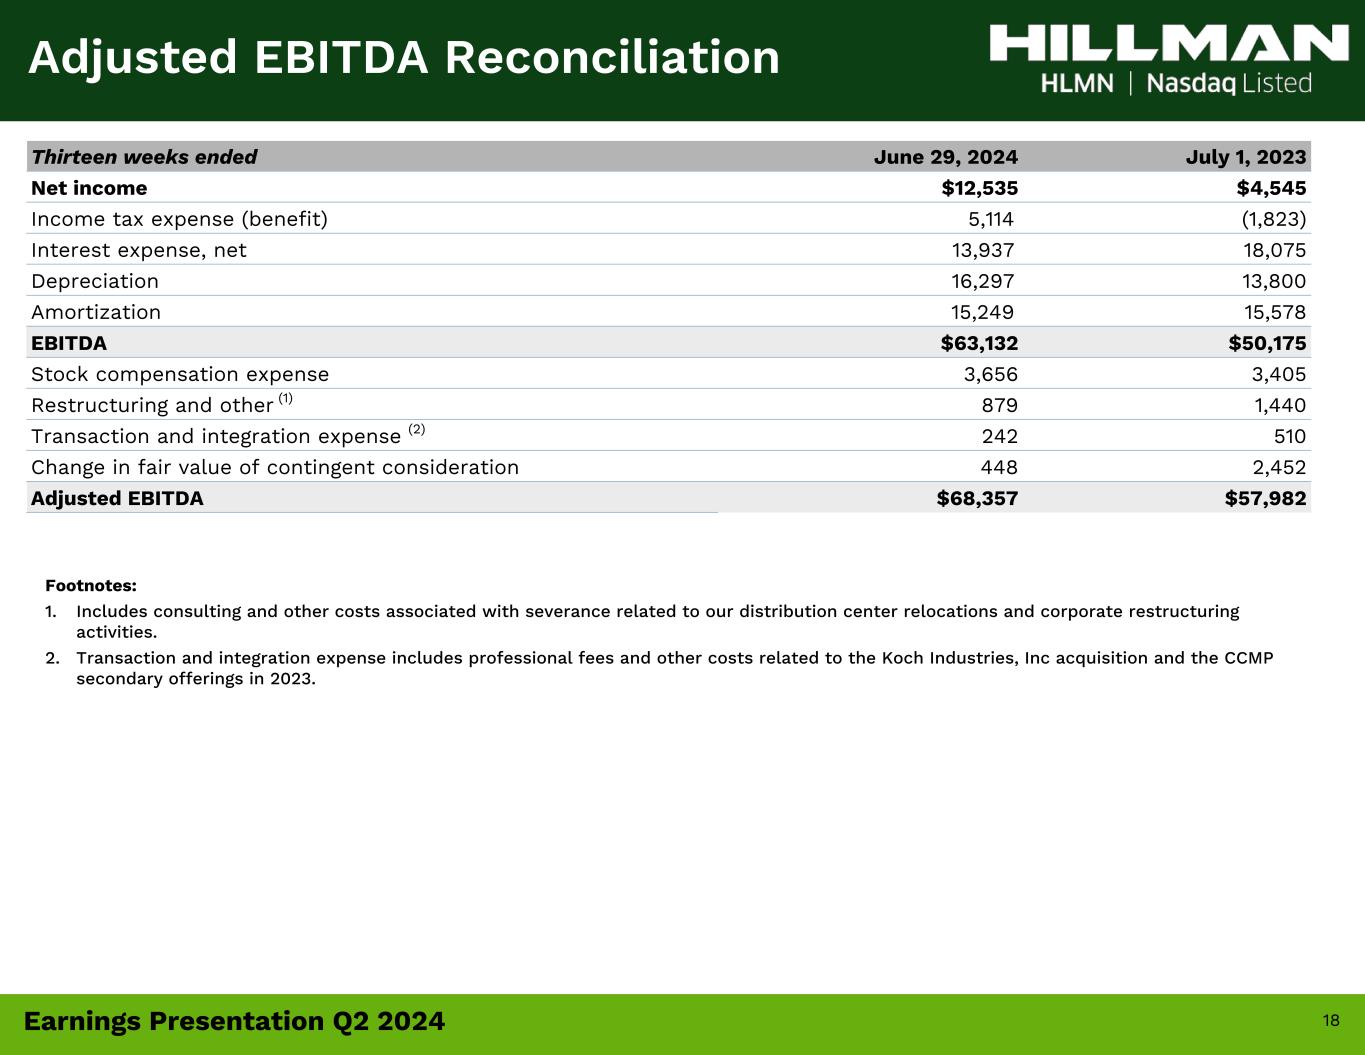
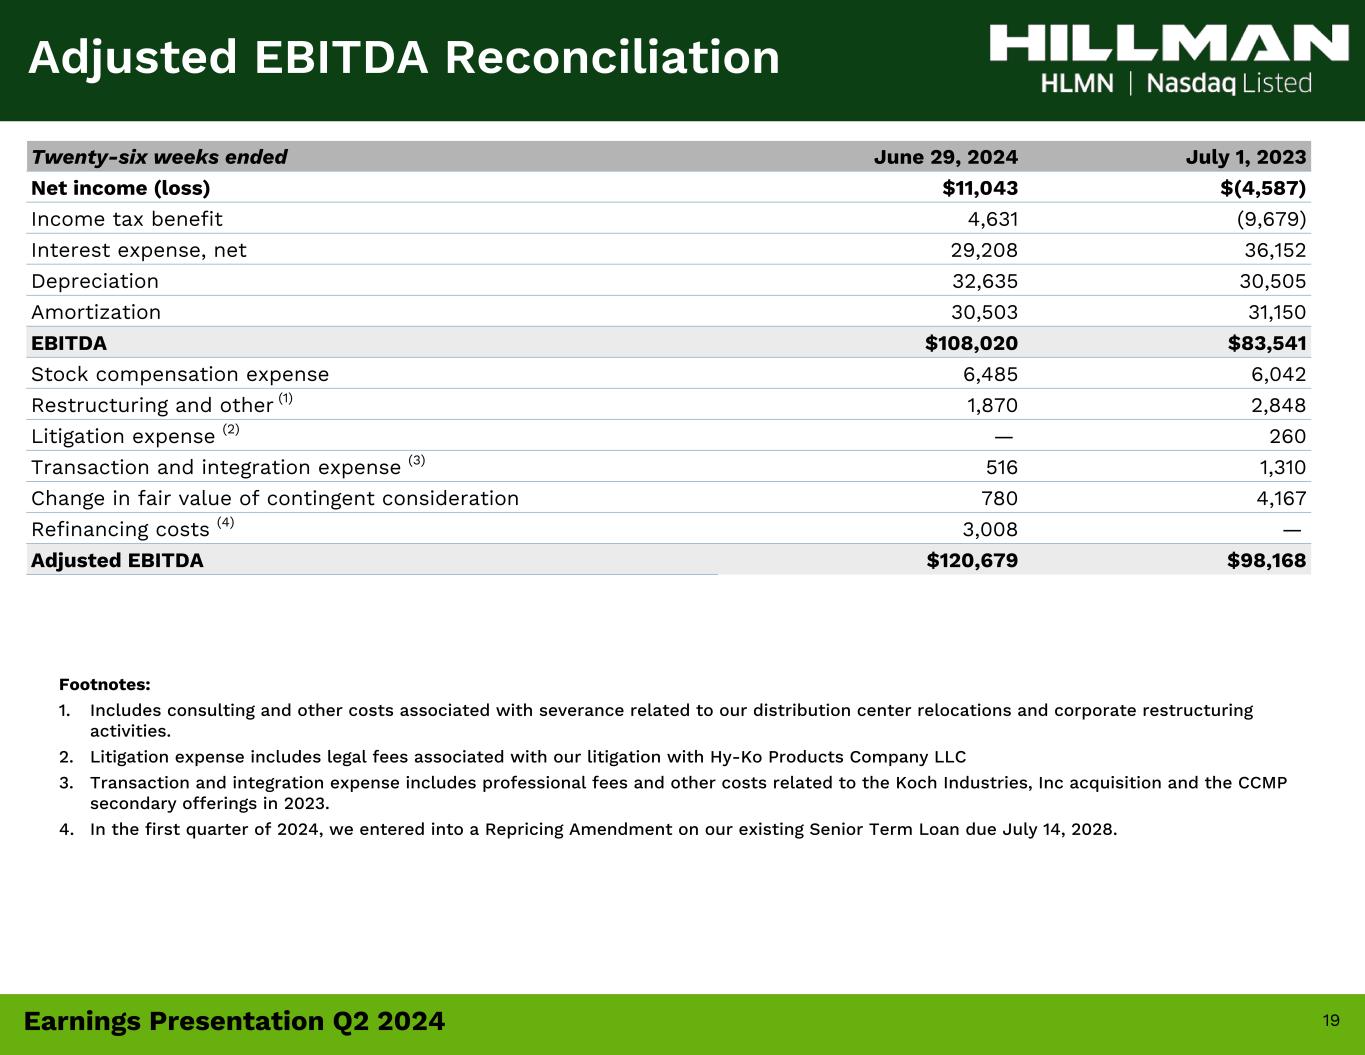
Reconciliation of Adjusted EBITDA (Unaudited)
(dollars in thousands)
Adjusted EBITDA is a non-GAAP financial measure and is the primary basis used to measure the operational strength and performance of our businesses as well as to assist in the evaluation of underlying trends in our businesses. This measure eliminates the significant level of noncash depreciation and amortization expense that results from the capital-intensive nature of our businesses and from intangible assets recognized in business combinations. It is also unaffected by our capital and tax structures, as our management excludes these results when evaluating our operating performance. Our management use this financial measure to evaluate our consolidated operating performance and the operating performance of our operating segments as well as to allocate resources and capital to our operating segments. Additionally, we believe that Adjusted EBITDA is useful to investors because it is one of the bases for comparing our operating performance with that of other companies in our industries, although our measure of Adjusted EBITDA may not be directly comparable to similar measures used by other companies.
| | | | | | | | | | | | | | | | | | | | | | | |
| Thirteen Weeks Ended
June 29, 2024 | | Thirteen Weeks Ended
July 1, 2023 | | Twenty-six Weeks Ended
June 29, 2024 | | Twenty-six Weeks Ended
July 1, 2023 |
| Net income (loss) | $ | 12,535 | | | $ | 4,545 | | | $ | 11,043 | | | $ | (4,587) | |
| Income tax expense (benefit) | 5,114 | | | (1,823) | | | 4,631 | | | (9,679) | |
| Interest expense, net | 13,937 | | | 18,075 | | | 29,208 | | | 36,152 | |
| | | | | | | |
| | | | | | | |
| Depreciation | 16,297 | | | 13,800 | | | 32,635 | | | 30,505 | |
| Amortization | 15,249 | | | 15,578 | | | 30,503 | | | 31,150 | |
| | | | | | | |
| EBITDA | $ | 63,132 | | | $ | 50,175 | | | $ | 108,020 | | | $ | 83,541 | |
| | | | | | | |
| Stock compensation expense | 3,656 | | | 3,405 | | | 6,485 | | | 6,042 | |
Restructuring and other (1) | 879 | | | 1,440 | | | 1,870 | | | 2,848 | |
Litigation expense (2) | — | | | — | | | — | | | 260 | |
Transaction and integration expense (3) | 242 | | | 510 | | | 516 | | | 1,310 | |
| Change in fair value of contingent consideration | 448 | | | 2,452 | | | 780 | | | 4,167 | |
Refinancing costs (4) | — | | | — | | | 3,008 | | | $ | — | |
| Total adjusting items | 5,225 | | | 7,807 | | | 12,659 | | | 14,627 | |
| Adjusted EBITDA | $ | 68,357 | | | $ | 57,982 | | | $ | 120,679 | | | $ | 98,168 | |
(1)Includes consulting and other costs associated with severance related to our distribution center relocations and corporate restructuring activities.
(2)Litigation expense includes legal fees associated with our litigation with Hy-Ko Products Company LLC.
(3)Transaction and integration expense includes professional fees and other costs related to the Koch Industries, Inc acquisition and the CCMP secondary offerings in 2023.
(4)In the first quarter of 2024, we entered into a Repricing Amendment (2024 Repricing Amendment) on our existing Senior Term Loan due July 14, 2028.
Reconciliation of Adjusted Diluted Earnings Per Share
(in thousands, except per share data)
Unaudited
We define Adjusted Diluted EPS as reported diluted EPS excluding the effect of one-time, non-recurring activity and volatility associated with our income tax expense. The Company believes that Adjusted Diluted EPS provides further insight and comparability in operating performance as it eliminates the effects of certain items that are not comparable from one period to the next. The following is a reconciliation of reported diluted EPS from continuing operations to Adjusted Diluted EPS from continuing operations:
| | | | | | | | | | | | | | | | | | | | | | | |
| Thirteen Weeks Ended
June 29, 2024 | | Thirteen Weeks Ended
July 1, 2023 | | Twenty-six Weeks Ended
June 29, 2024 | | Twenty-six Weeks Ended
July 1, 2023 |
| Reconciliation to Adjusted Net Income | | | | | | | |
| Net income (loss) | $ | 12,535 | | | $ | 4,545 | | | $ | 11,043 | | | $ | (4,587) | |
Remove adjusting items (1) | 5,225 | | | 7,807 | | | 12,659 | | | 14,627 | |
| Remove amortization expense | 15,249 | | | 15,578 | | | 30,503 | | | 31,150 | |
Remove tax benefit on adjusting items and amortization expense (2) | (1,544) | | | (2,190) | | | (3,780) | | | (3,851) | |
| Adjusted Net Income | $ | 31,465 | | | $ | 25,740 | | | $ | 50,425 | | | $ | 37,339 | |
| | | | | | | |
| Reconciliation to Adjusted Diluted Earnings per Share | | | | | | | |
| Diluted Earnings per Share | $ | 0.06 | | | $ | 0.02 | | | $ | 0.06 | | | $ | (0.02) | |
Remove adjusting items (1) | 0.03 | | | 0.04 | | | 0.06 | | | 0.07 | |
| Remove amortization expense | 0.08 | | | 0.08 | | | 0.15 | | | 0.16 | |
Remove tax benefit on adjusting items and amortization expense (2) | (0.01) | | | (0.01) | | | (0.02) | | | (0.02) | |
| Adjusted Diluted Earnings per Share | $ | 0.16 | | | $ | 0.13 | | | $ | 0.25 | | | $ | 0.19 | |
| | | | | | | |
| Reconciliation to Adjusted Diluted Shares Outstanding | | | | | | | |
| Diluted Shares, as reported | 198,420 | | | 195,528 | | | 198,037 | | | 194,596 | |
| Non-GAAP dilution adjustments: | | | | | | | |
| Dilutive effect of stock options and awards | — | | | — | | | — | | | 865 | |
| Adjusted Diluted Shares | 198,420 | | | 195,528 | | | 198,037 | | | 195,461 | |
Note: Adjusted EPS may not add due to rounding.
(1)Please refer to "Reconciliation of Adjusted EBITDA" table above for additional information on adjusting items. See "Per share impact of Adjusting Items" table below for the per share impact of each adjustment.
(2)We have calculated the income tax effect of the non-GAAP adjustments shown above at the applicable statutory rate of 25.1% for the U.S. and 26.2% for Canada except for the following items:
a.The tax impact of stock compensation expense was calculated using the statutory rate of 25.1%, excluding certain awards that are non-deductible.
b.The tax impact of acquisition and integration expense was calculated using the statutory rate of 25.1%, excluding certain charges that were non-deductible.
c.Amortization expense for financial accounting purposes was offset by the tax benefit of deductible amortization expense using the statutory rate of 25.1%.
(3)Diluted shares on a GAAP basis for thirteen and twenty-six weeks ended June 29, 2024 include the dilutive impact of 2,345 and 2,316 options and awards, respectfully. Diluted shares on a GAAP basis for the thirteen weeks ended July 1, 2023 include the dilutive impact of 884 options and awards.
Per Share Impact of Adjusting Items
| | | | | | | | | | | | | | | | | | | | | | | | | | |
| | Thirteen Weeks Ended
June 29, 2024 | | Thirteen Weeks Ended
July 1, 2023 | | Twenty-six Weeks Ended
June 29, 2024 | | Twenty-six Weeks Ended
July 1, 2023 |
| Stock compensation expense | | $ | 0.02 | | | $ | 0.02 | | | $ | 0.03 | | | $ | 0.03 | |
| Restructuring and other costs | | 0.00 | | 0.01 | | 0.01 | | 0.01 | |
| Litigation expense | | — | | | — | | | — | | | 0.00 |
| Transaction and integration expense | | 0.00 | | 0.00 | | 0.00 | | 0.01 | |
| Change in fair value of contingent consideration | | 0.00 | | 0.01 | | 0.00 | | 0.02 | |
| Refinancing costs | | — | | | — | | | 0.02 | | | $ | — | |
| Total adjusting items | | $ | 0.03 | | | $ | 0.04 | | | $ | 0.06 | | | $ | 0.07 | |
Note: Adjusting items may not add due to rounding.
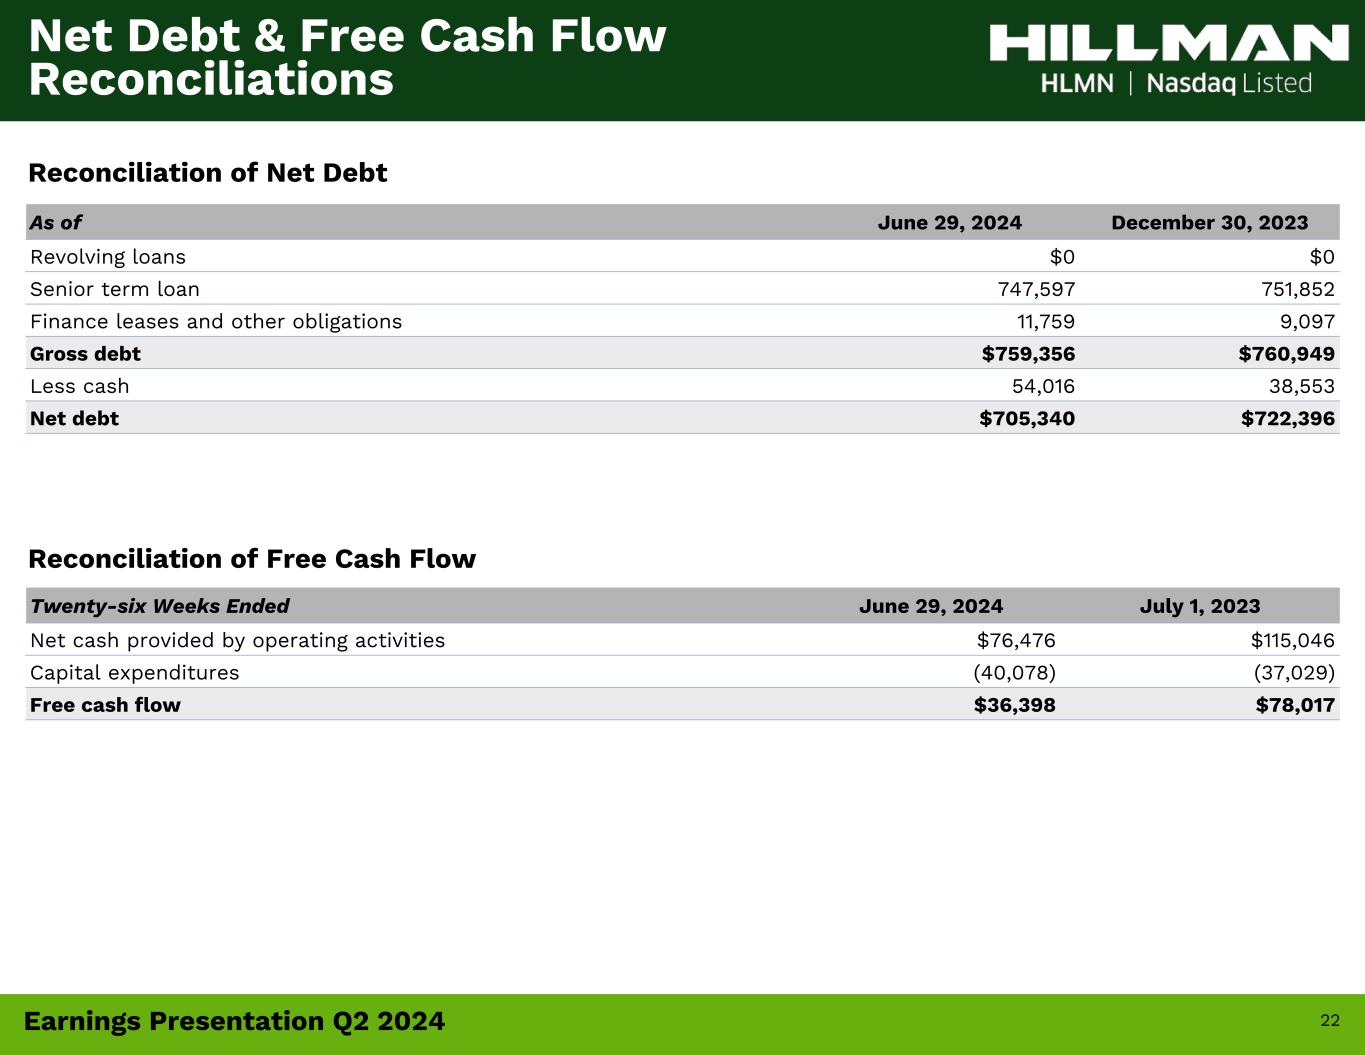
Reconciliation of Net Debt
We define Net Debt as reported gross debt less cash on hand. Net debt is not defined under U.S. GAAP and may not be computed the same as similarly titled measures used by other companies. The Company believes that Net Debt provides further insight and comparability into liquidity and capital structure. The following is the calculation of Net Debt:
| | | | | | | | | | | |
| June 29, 2024 | | December 30, 2023 |
| Revolving loans | $ | — | | | $ | — | |
| Senior term loan, due 2028 | 747,597 | | | 751,852 | |
| Finance leases and other obligations | 11,759 | | | 9,097 | |
| Gross debt | $ | 759,356 | | | $ | 760,949 | |
| Less cash | 54,016 | | | 38,553 | |
| Net debt | $ | 705,340 | | | $ | 722,396 | |
Reconciliation of Free Cash Flow
We calculate free cash flow as cash flows from operating activities less capital expenditures. Free cash flow is not defined under U.S. GAAP and may not be computed the same as similarly titled measures used by other companies. We believe free cash flow is an important indicator of how much cash is generated by our business operations and is a measure of incremental cash available to invest in our business and meet our debt obligations.
| | | | | | | | | | | |
| Twenty-six Weeks Ended
June 29, 2024 | | Twenty-six Weeks Ended
July 1, 2023 |
| Net cash provided by operating activities | $ | 76,476 | | | $ | 115,046 | |
| Capital expenditures | (40,078) | | | (37,029) | |
| Free cash flow | $ | 36,398 | | | $ | 78,017 | |
Source: Hillman Solutions Corp.
###
Hillman Announces Leadership Succession Plans: COO Jon Michael Adinolfi to be Appointed as Next CEO; CEO Doug Cahill to Become Executive Chairman
CINCINNATI, August 6, 2024 -- Hillman Solutions Corp. (Nasdaq: HLMN) (the “Company” or “Hillman”), a leading provider of hardware products and merchandising solutions, announced that Jon Michael Adinolfi (“JMA”), Hillman’s current Chief Operating Officer, will transition to the role of President and Chief Executive Officer; and Doug Cahill, Hillman’s current Chairman, President, and Chief Executive Officer, will transition to the Role of Executive Chairman effective January 1, 2025. This planned leadership succession ensures the continuity of Hillman’s current leadership and strategy.
“Over the past 60 years, Hillman has provided its customers with unparalleled service, brought innovative products and creative solutions to market, and has grown to be a trusted partner for hardware stores and home improvement centers across North America,” stated Jon Michael Adinolfi. “We love our customers and as the next CEO, I look forward to continuing to build on Hillman’s legacy of service and growth as we seek to find new ways to serve and deepen our partnerships with them.”
“I am grateful for Doug’s mentorship and guidance having worked side-by-side with him since joining Hillman five years ago. Together, we helped the team successfully navigate COVID, supply chain volatility, and inflation while regularly winning new business, expanding our range of products, and improving our competitive moat. As I look to Hillman’s next chapter, we have our sights set on the goal of achieving $2 billion in net sales through organic growth and M&A. I am confident that we have the right team in place to achieve our goals while continuing to take great care of our customers.”
Mr. Adinolfi has a track record of success in the hardware and home improvement industry and has proven to be an effective, strategic and forward-thinking leader. Prior to JMA’s role as COO, he served as Divisional President, Hillman U.S. since joining the Company in 2019. Prior to that, he held leadership roles with ever-increasing responsibility at Stanley Black & Decker starting in 2011, culminating with his role of President of U.S. Retail. Prior to that, JMA served as President of Crown Bolt, when Crown Bolt was the fastener supplier for Home Depot.
Doug Cahill, Hillman’s chairman, president, and chief executive officer added: “Leading Hillman for the past ten years as Chairman and the past five as CEO, has been a remarkable highlight of my career. From expanding our product offerings to include power screws and builder’s hardware, to becoming public in 2021 and paying down over $900 million of debt – it has been a great experience working with the warriors at Hillman. Throughout my tenure, we have upheld our commitment to the Hillman family legacy – putting our customers first. As JMA takes the reins, I have the utmost confidence that he will further strengthen Hillman’s relationship with our customers and investors while driving Hillman forward with profitable growth.”
Cahill continued: “JMA is a great leader and has excellent rapport with the Hillman team and our customers. We hired JMA five years ago and felt strongly that he would be a perfect fit as
Hillman’s next leader, now becoming just the sixth CEO in Hillman’s 60-year history. I love this company and am very proud of this leadership handoff. Hillman is in excellent hands under his leadership, and I look forward to continuing to support JMA and the Hillman team as I step into the executive chairman role.”
Hillman’s Second Quarter 2024 Financial Results
Later today, Tuesday, August 6, 2024, at 8:30 am ET, Hillman’s management team will discuss its results for the thirteen and twenty-six weeks ended June 29, 2024, as well as its leadership succession plans.
About Hillman Solutions Corp.
Founded in 1964 and headquartered in Cincinnati, Ohio, Hillman Solutions Corp. (“Hillman”) and its subsidiaries are leading North American providers of complete hardware solutions, delivered with outstanding customer service to over 46,000 locations. Hillman is celebrating 60 years of service this year, a significant milestone achieved by maintaining strong company values, an innovative culture, and delivering a “small business” experience with “big business” efficiency. Hillman designs innovative product and merchandising solutions for complex categories that deliver an outstanding customer experience to home improvement centers, mass merchants, national and regional hardware stores, pet supply stores, and OEM & industrial customers. For more information on Hillman, visit www.hillman.com.
Forward Looking Statements
All statements made in this press release that are consider to be forward-looking are made in good faith by the Company and are intended to qualify for the safe harbor from liability established by Section 27A of the Securities Act of 1933, Section 21E of the Securities Exchange Act of 1934, and the Private Securities Litigation Reform Act of 1995. You should not rely on these forward-looking statements as predictions of future events. Words such as "expect," "estimate," "project," "budget," "forecast," "anticipate," "intend," "plan," “target”, “goal”, "may," "will," "could," "should," "believes," "predicts," "potential," "continue," and similar expressions are intended to identify such forward-looking statements. These forward-looking statements include, without limitation, the Company’s expectations with respect to future performance. These forward-looking statements involve significant risks and uncertainties that could cause the actual results to differ materially from the expected results. Most of these factors are outside the Company's control and are difficult to predict. Factors that may cause such differences include, but are not limited to: (1) unfavorable economic conditions that may affect operations, financial condition and cash flows including spending on home renovation or construction projects, inflation, recessions, instability in the financial markets or credit markets; (2) increased supply chain costs, including raw materials, sourcing, transportation and energy; (3) the highly competitive nature of the markets that we serve; (4) the ability to continue to innovate with new products and services; (5) direct and indirect costs associated with the May 2023 ransomware attack, and our receipt of expected insurance receivables associated with that cyber security incident; (6) seasonality; (7) large customer concentration; (8) the ability to recruit and retain qualified employees; (9) the outcome of any legal proceedings that may be instituted against the Company; (10) adverse changes in currency exchange rates; or (11) regulatory changes and potential legislation that could adversely impact financial results. The foregoing list of factors is not exclusive, and
readers should also refer to those risks that are included in the Company’s filings with the Securities and Exchange Commission (“SEC”), including the Annual Report on Form 10-K filed on February 22, 2024. Given these uncertainties, current or prospective investors are cautioned not to place undue reliance on any such forward looking statements.
Except as required by applicable law, the Company does not undertake or accept any obligation or undertaking to release publicly any updates or revisions to any forward-looking statements in this communication to reflect any change in its expectations or any change in events, conditions or circumstances on which any such statement is based.
Contact:
Michael Koehler
Vice President of Investor Relations & Treasury
513-826-5495
Source: Hillman Solutions Corp.
###