Ron Hubbard
Vice President, Investor Relations
P: 615.269.8290
News Release
HEALTHCARE REALTY TRUST REPORTS RESULTS FOR THE FOURTH QUARTER AND ANNOUNCES QUARTERLY DIVIDEND
NASHVILLE, Tennessee, February 19, 2025 - Healthcare Realty Trust Incorporated (NYSE:HR) today announced results for the fourth quarter ended December 31, 2024. Net (loss) income attributable to common stockholders for the three months ended December 31, 2024 was $(106.8) million, or $(0.31) per diluted common share. Additionally, the Company announced its quarterly dividend of $0.31 per share and operating partnership unit.
| | | | | | | | | | | | | | |
| KEY FOURTH QUARTER AND ANNUAL HIGHLIGHTS |
•Normalized FFO per share totaled $0.40 for the quarter, at the high end of the previously provided guidance range and up 2.5% over the prior year period. Normalized FFO per share was $1.56 for the year ended December 31, 2024.
•Cash NOI growth in the fourth quarter and year was as shown below (for more detail on the impact of Steward Health and Prospect Medical please see the related section herein):
| | | | | | | | |
| ACTUAL |
| 4Q 2024 | 2024 |
| Same store | 3.1 | % | 2.9 | % |
| Same store excluding Steward Health and Prospect Medical | 3.6 | % | 3.1 | % |
•140,000 square feet, or 44 basis points, of multi-tenant absorption for the quarter and 479,000 square feet, or 149 basis points, for the year
•686,000 square feet of signed new leases in the quarter, the sixth consecutive quarter above 400,000 and a new single-quarter high
•The Company closed joint venture and asset sale transactions totaling $522 million in the fourth quarter, and generated approximately $1.3 billion of proceeds for the year, which includes the following:
◦$770 million from joint venture transactions
◦$491 million from asset sales
•For the year, the Company repurchased approximately 31 million shares totaling $510 million at an average price of $16.56 per share.
•The Company repaid its $350 million term loan maturing in 2025 and ended the year with leverage at 6.4 times net debt to adjusted EBITDA.
| | | | | | | | | | | | | | |
| MULTI-TENANT GROWTH AND ABSORPTION |
•Compared to prior year periods, multi-tenant cash NOI growth in the fourth quarter and year was:
| | | | | | | | | | | |
| | | | |
| | | ACTUAL | |
| | | 4Q 2024 | 2024 | |
| Multi-tenant | | | 3.4 | % | 3.0 | % | |
| Multi-tenant excluding Steward Health & Prospect Medical | | | 3.9 | % | 3.2 | % | |
| | | | | |
| HEALTHCAREREALTY.COM | PAGE 1 OF 8 |
•Multi-tenant occupancy gains at the high end of full year 2024 guidance were:
| | | | | | | | | | | | | | | | |
| | | ACTUAL | 2024 GUIDANCE |
| | | 4Q 2024 | 2024 | LOW | HIGH |
| | | | | | |
| | | | | | |
| | | | | | |
| | | | | | |
| | | | | | |
| Absorption (SF) | | | 140,182 | 479,439 | 370,000 | 490,000 |
| | | | | | |
| | | | | | |
| Change in occupancy (bps) | | | + 44 | + 149 | + 100 | + 150 |
| | | | | | |
•At the end of the year, the multi-tenant portfolio occupancy rate was 86.3% and the leased percentage was 88.3%.
•Portfolio leasing activity that commenced in the fourth quarter totaled 1,534,000 square feet related to 349 leases:
◦954,000 square feet of renewals
◦580,000 square feet of new and expansion lease commencements
•In the fourth quarter, the Company signed new leases totaling 686,000 square feet, a new, single-quarter high for the Company.
•Cash NOI for the fourth quarter increased 3.1% over the same quarter in the prior year, and 2.9% for the year ended December 31, 2024. Adjusted for the impact of Steward Health and Prospect Medical, cash NOI growth would have been 3.6% for the fourth quarter and 3.1% for the year.
•Tenant retention for the fourth quarter was 81.6% and 83.4% for the year.
•Operating expenses for the fourth quarter increased 2.7% over the same quarter in the prior year, and 0.2% for the year ended December 31, 2024.
•MOB cash leasing spreads were 2.7% for the quarter and 3.4% for the year.
•At year end, net debt to adjusted EBITDA was 6.4 times, down from 6.7 times at the end of the third quarter.
•The Company fully repaid its $350 million Unsecured Term Loan maturing in 2025.
•At year end, the Company had no balance on its revolving credit facility, resulting in $1.5 billion of availability.
•In January 2025, the Company repaid $35 million of its term loans maturing in 2026.
•Connie Moore appointed Interim President & Chief Executive Officer
•Austen Helfrich promoted to Chief Financial Officer
•Significant board refreshment in 2024, with four new directors joining, each with deep REIT industry and leadership experience
•Tom Bohjalian appointed Independent Chair of the Board
•Search committee of the board, chaired by Glenn Rufrano, conducting a search for a permanent President & Chief Executive Officer
| | | | | |
| |
| HEALTHCARE REALTY TRUST INCORPORATED | HEALTHCAREREALTY.COM | PAGE 2 OF 8 |
•A common stock cash dividend in the amount of $0.31 per share will be paid on March 19, 2025 to Class A common stockholders of record on March 3, 2025. Additionally, the eligible holders of operating partnership units will receive a distribution of $0.31 per unit, equivalent to the Company's Class A common stock dividend.
| | | | | | | | | | | | | | |
| STEWARD HEALTH AND PROSPECT MEDICAL UPDATE |
•During the fourth quarter, the Company made significant progress re-leasing space previously occupied by Steward Health, with leases in-place for over 80% of the previously occupied 593,000 square feet. Based on these actions, the Company entered 2025 having replaced approximately $19 million of the $27 million of pre-bankruptcy total exposure to Steward. Longer term, the Company continues to expect to recover over 80% of the pre-bankruptcy Steward Health revenue.
•On January 11, 2025, Prospect Medical filed for Chapter 11 bankruptcy protection. Prospect Medical leases approximately 81,000 square feet of space from the Company accounting for approximately $2.9 million of annual revenue. 2025 guidance provided herein assumes no revenue collected from the Prospect leases.
•The Company's 2025 per share estimated guidance ranges are as follows:
| | | | | | | | | | | | | | | | |
| | |
| ACTUAL | | 2025 GUIDANCE | | |
| 2024 | | LOW | HIGH | | |
| Earnings per share | $(1.81) | | $(0.28) | $(0.20) | | |
| NAREIT FFO per share | $0.52 | | $1.44 | $1.48 | | |
| Normalized FFO per share | $1.56 | | $1.56 | $1.60 | | |
| | | | | | |
| | | | | | |
| | | | | | |
| | | | | | |
| | | | | | |
| | | | | | |
| | | | | | |
| | | | | | |
| | | | | | |
| | | | | | |
•The Company's 2025 same store cash NOI growth estimated guidance range is 3.00% to 3.75%, which excludes the impact of Prospect Medical and Steward Health.
•The Company's 2025 guidance range includes activities outlined on page 29 of the Supplemental Information.
The 2025 annual guidance range reflects the Company's view of current and future market conditions, including assumptions with respect to rental rates, occupancy levels, interest rates, and operating and general and administrative expenses. The Company's guidance does not contemplate impacts from gains or losses from
dispositions, potential impairments, or debt extinguishment costs, if any. There can be no assurance that the Company's actual results will not be materially higher or lower than these expectations. If actual results vary from these assumptions, the Company's expectations may change.
•On Wednesday, February 19, 2025, at 11:00 a.m. Eastern Time, Healthcare Realty Trust has scheduled a conference call to discuss earnings results, quarterly activities, general operations of the Company and industry trends.
•Simultaneously, a webcast of the conference call will be available to interested parties at https://investors.healthcarerealty.com/corporate-profile/webcasts under the Investor Relations section. A webcast replay will be available following the call at the same address.
•Live Conference Call Access Details:
◦Domestic Dial-In Number: +1 646-968-2525 access code 4950066;
◦All Other Locations: +1 888-596-4144 access code 4950066.
•Replay Information:
◦Domestic Dial-In Number: +1 609-800-9909 access code 4950066;
| | | | | |
| |
| HEALTHCARE REALTY TRUST INCORPORATED | HEALTHCAREREALTY.COM | PAGE 3 OF 8 |
◦All Other Locations: +1 800-770-2030 access code 4950066.
Healthcare Realty (NYSE: HR) is a real estate investment trust (REIT) that owns and operates medical outpatient buildings primarily located around market-leading hospital campuses. The Company selectively grows its portfolio through property acquisition and development. As the first and largest REIT to specialize in medical outpatient buildings, Healthcare Realty's portfolio includes over 650 properties totaling more than 38 million square feet concentrated in 15 growth markets.
Additional information regarding the Company, including this quarter's operations, can be found at www.healthcarerealty.com. In addition to the historical information contained within, this press release contains certain forward-looking statements with respect to the Company. Forward-looking statements are statements that are not descriptions of historical facts and include statements regarding management’s intentions, beliefs, expectations, plans or predictions of the future, within the meaning of Section 27A of the Securities Act of 1933, as amended, and Section 21E of the Securities Exchange Act of 1934, as amended. Because such statements include risks, uncertainties and contingencies, actual results may differ materially and in adverse ways from those expressed or implied by such forward-looking statements. These risks, uncertainties and contingencies include, without limitation, the following: the Company's expected results may not be achieved; failure to realize the expected benefits of the Merger; significant transaction costs and/or unknown or inestimable liabilities; risks related to future opportunities and plans for the Company, including the uncertainty of expected future financial performance and results of the Company; the possibility that, if the Company does not achieve the perceived benefits of the Merger as rapidly or to the extent anticipated by financial analysts or investors, the market price of the Company’s common stock could decline; general adverse economic and local real estate conditions; changes in economic conditions generally and the real estate market specifically; legislative and regulatory changes, including changes to laws governing the taxation of REITs and changes to laws governing the healthcare industry; the availability of capital; changes in interest rates; competition in the real estate industry; the supply and demand for operating properties in the Company’s proposed market areas; changes in accounting principles generally accepted in the US; policies and guidelines applicable to REITs; the availability of properties to acquire; the availability of financing; pandemics and other health concerns, and the measures intended to prevent their spread and the potential material adverse effect these matters may have on the Company’s business, results of operations, cash flows and financial condition. Additional information concerning the Company and its business, including additional factors that could materially and adversely affect the Company’s financial results, include, without limitation, the risks described under Part I, Item 1A - Risk Factors, in the Company’s 2024 Annual Report on Form 10-K and in its other filings with the SEC.
| | | | | |
| |
| HEALTHCARE REALTY TRUST INCORPORATED | HEALTHCAREREALTY.COM | PAGE 4 OF 8 |
| | |
| Consolidated Balance Sheets |
| DOLLARS IN THOUSANDS, EXCEPT PER SHARE DATA |
| | | | | | | | | | | | | | | | | | | | | | |
| ASSETS | | | | | | | | | | |
| 4Q 2024 | 3Q 2024 | 2Q 2024 | 1Q 2024 | 4Q 2023 | | | | | |
| Real estate properties | | | | | | | | | | |
| Land | $1,143,468 | | $1,195,116 | | $1,287,532 | | $1,342,895 | | $1,343,265 | | | | | | |
| Buildings and improvements | 9,707,066 | | 10,074,504 | | 10,436,218 | | 10,902,835 | | 10,881,373 | | | | | | |
| Lease intangibles | 664,867 | | 718,343 | | 764,730 | | 816,303 | | 836,302 | | | | | | |
| Personal property | 9,909 | | 9,246 | | 12,501 | | 12,720 | | 12,718 | | | | | | |
| Investment in financing receivables, net | 123,671 | | 123,045 | | 122,413 | | 122,001 | | 122,602 | | | | | | |
| Financing lease right-of-use assets | 77,343 | | 77,728 | | 81,401 | | 81,805 | | 82,209 | | | | | | |
| Construction in progress | 31,978 | | 125,944 | | 97,732 | | 70,651 | | 60,727 | | | | | | |
| Land held for development | 52,408 | | 52,408 | | 59,871 | | 59,871 | | 59,871 | | | | | | |
| Total real estate investments | 11,810,710 | | 12,376,334 | | 12,862,398 | | 13,409,081 | | 13,399,067 | | | | | | |
| Less accumulated depreciation and amortization | (2,483,656) | | (2,478,544) | | (2,427,709) | | (2,374,047) | | (2,226,853) | | | | | | |
| Total real estate investments, net | 9,327,054 | | 9,897,790 | | 10,434,689 | | 11,035,034 | | 11,172,214 | | | | | | |
Cash and cash equivalents 1 | 68,916 | | 22,801 | | 137,773 | | 26,172 | | 25,699 | | | | | | |
| | | | | | | | | | |
| Assets held for sale, net | 12,897 | | 156,218 | | 34,530 | | 30,968 | | 8,834 | | | | | | |
| Operating lease right-of-use assets | 261,438 | | 259,013 | | 261,976 | | 273,949 | | 275,975 | | | | | | |
| Investments in unconsolidated joint ventures | 473,122 | | 417,084 | | 374,841 | | 309,754 | | 311,511 | | | | | | |
| Other assets, net and goodwill | 507,496 | | 491,679 | | 559,818 | | 605,047 | | 842,898 | | | | | | |
| Total assets | $10,650,923 | | $11,244,585 | | $11,803,627 | | $12,280,924 | | $12,637,131 | | | | | | |
| | | | | | | | | | |
| LIABILITIES AND STOCKHOLDERS' EQUITY | | | | | | | | | | |
| 4Q 2024 | 3Q 2024 | 2Q 2024 | 1Q 2024 | 4Q 2023 | | | | | |
| Liabilities | | | | | | | | | | |
| Notes and bonds payable | $4,662,771 | | $4,957,796 | | $5,148,153 | | $5,108,279 | | $4,994,859 | | | | | | |
| Accounts payable and accrued liabilities | 222,510 | | 197,428 | | 195,884 | | 163,172 | | 211,994 | | | | | | |
| Liabilities of properties held for sale | 1,283 | | 7,919 | | 1,805 | | 700 | | 295 | | | | | | |
| Operating lease liabilities | 224,499 | | 229,925 | | 230,601 | | 229,223 | | 229,714 | | | | | | |
| Financing lease liabilities | 72,346 | | 71,887 | | 75,199 | | 74,769 | | 74,503 | | | | | | |
| Other liabilities | 161,640 | | 180,283 | | 177,293 | | 197,763 | | 202,984 | | | | | | |
| Total liabilities | 5,345,049 | | 5,645,238 | | 5,828,935 | | 5,773,906 | | 5,714,349 | | | | | | |
| | | | | | | | | | |
| | | | | | | | | | |
| Redeemable non-controlling interests | 4,778 | | 3,875 | | 3,875 | | 3,880 | | 3,868 | | | | | | |
| | | | | | | | | | |
| Stockholders' equity | | | | | | | | | | |
| Preferred stock, $0.01 par value; 200,000 shares authorized | — | | — | | — | | — | | — | | | | | | |
| Common stock, $0.01 par value; 1,000,000 shares authorized | 3,505 | | 3,558 | | 3,643 | | 3,815 | | 3,810 | | | | | | |
| Additional paid-in capital | 9,118,229 | | 9,198,004 | | 9,340,028 | | 9,609,530 | | 9,602,592 | | | | | | |
| Accumulated other comprehensive (loss) income | (1,168) | | (16,963) | | 6,986 | | 4,791 | | (10,741) | | | | | | |
| Cumulative net income attributable to common stockholders | 374,309 | | 481,155 | | 574,178 | | 717,958 | | 1,028,794 | | | | | | |
| Cumulative dividends | (4,260,014) | | (4,150,328) | | (4,037,693) | | (3,920,199) | | (3,801,793) | | | | | | |
| Total stockholders' equity | 5,234,861 | | 5,515,426 | | 5,887,142 | | 6,415,895 | | 6,822,662 | | | | | | |
| Non-controlling interest | 66,235 | | 80,046 | | 83,675 | | 87,243 | | 96,252 | | | | | | |
| Total Equity | 5,301,096 | | 5,595,472 | | 5,970,817 | | 6,503,138 | | 6,918,914 | | | | | | |
| Total liabilities and stockholders' equity | $10,650,923 | | $11,244,585 | | $11,803,627 | | $12,280,924 | | $12,637,131 | | | | | | |
12Q 2024 cash and cash equivalents includes $96.0 million of proceeds held in a cash escrow account from a portfolio disposition that closed on June 28, 2024 and was received by the Company on July 1, 2024.
| | | | | |
| |
| HEALTHCARE REALTY TRUST INCORPORATED | HEALTHCAREREALTY.COM | PAGE 5 OF 8 |
| | |
| Consolidated Statements of Income |
| DOLLARS IN THOUSANDS, EXCEPT PER SHARE DATA |
| | | | | | | | | | | | | | | | | |
| | | | | | | |
| THREE MONTHS ENDED DECEMBER 31, | TWELVE MONTHS ENDED DECEMBER 31, | | | |
| 2024 | 2023 | 2024 | 2023 | | | |
| Revenues | | | | | | | |
Rental income 1 | $300,065 | $322,076 | $1,232,776 | $1,309,184 | | | |
| Interest income | 4,076 | 4,422 | 16,383 | 17,134 | | | |
| Other operating | 5,625 | 3,943 | 19,157 | 17,451 | | | |
| 309,766 | 330,441 | 1,268,316 | 1,343,769 | | | |
| Expenses | | | | | | | |
| Property operating | 114,415 | 121,362 | 473,444 | $500,437 | | | | |
| General and administrative | 34,208 | 14,609 | 83,121 | $58,405 | | | | |
Normalizing items 2 | (22,991) | (1,445) | (29,852) | (1,720) | | | |
| Normalized general and administrative | 11,217 | 13,164 | 53,269 | 56,685 | | | |
| Transaction costs | 1,577 | 301 | 3,122 | 2,026 | | | |
| Merger-related costs | — | 1,414 | — | (1,952) | | | |
| Depreciation and amortization | 160,330 | 180,049 | 675,152 | 730,709 | | | |
| 310,530 | 317,735 | 1,234,839 | 1,289,625 | | | |
| Other income (expense) | | | | | | | |
| Interest expense before merger-related fair value | (47,951) | (52,387) | (201,758) | (215,699) | | | |
| Merger-related fair value adjustment | (10,314) | (10,800) | (40,667) | (42,885) | | | |
| Interest expense | (58,265) | (63,187) | (242,425) | (258,584) | | | |
| Gain on sales of real estate properties and other assets | 32,082 | 20,573 | 109,753 | 77,546 | | | |
| (Loss) gain on extinguishment of debt | (237) | — | (237) | 62 | | | |
| Impairment of real estate assets and credit loss reserves | (81,098) | (11,403) | (313,547) | (154,912) | | | |
| Impairment of goodwill | — | — | (250,530) | — | | | |
| Equity income (loss) from unconsolidated joint ventures | 224 | (430) | (135) | (1,682) | | | |
| Interest and other (expense) income, net | (154) | 65 | (260) | 1,343 | | | |
| (107,448) | (54,382) | (697,381) | (336,227) | | | |
| Net (loss) income | $(108,212) | $(41,676) | $(663,904) | $(282,083) | | | |
| Net loss (income) attributable to non-controlling interests | 1,366 | 1,143 | 9,419 | 3,822 | | | |
| Net (loss) income attributable to common stockholders | $(106,846) | $(40,533) | $(654,485) | $(278,261) | | | |
| | | | | | | |
| | | | | | | |
| Basic earnings per common share | $(0.31) | $(0.11) | $(1.81) | $(0.74) | | | |
| Diluted earnings per common share | $(0.31) | $(0.11) | $(1.81) | $(0.74) | | | |
| | | | | | | |
| Weighted average common shares outstanding - basic | 351,560 | 379,044 | 365,553 | 378,928 | | | |
Weighted average common shares outstanding - diluted 3 | 351,560 | 379,044 | 365,553 | 378,928 | | | |
1In 4Q 2024, rental income was reduced by $0.7 million for Prospect Medical revenue reserves. In 2Q 2024, rental income was reduced by $3.0 million for Steward Health revenue reserves.
2Normalizing items primarily include restructuring, severance-related costs and non-routine advisory fees associated with shareholder engagement.
3Potential common shares are not included in the computation of diluted earnings per share when a loss exists, as the effect would be an antidilutive per share amount. As a result, the outstanding limited partnership units in the Company's operating partnership ("OP"), totaling 3,622,036 units were not included.
| | | | | |
| |
| HEALTHCARE REALTY TRUST INCORPORATED | HEALTHCAREREALTY.COM | PAGE 6 OF 8 |
| | |
Reconciliation of FFO, Normalized FFO and FAD 1,2,3 |
| DOLLARS IN THOUSANDS, EXCEPT PER SHARE DATA |
| | | | | | | | | | | | | | | | | |
| | | | | | | |
| THREE MONTHS ENDED DECEMBER 31, | TWELVE MONTHS ENDED DECEMBER 31, | | | |
| 2024 | 2023 | 2024 | 2023 | | | |
| Net loss attributable to common stockholders | $(106,846) | $(40,533) | $(654,485) | $(278,261) | | | |
Net loss attributable to common stockholders/diluted share 3 | $(0.31) | $(0.11) | $(1.81) | $(0.74) | | | |
| | | | | | | |
| Gain on sales of real estate assets | (32,082) | | (20,573) | | (104,684) | | (77,546) | | | | |
| Impairments of real estate assets | 75,423 | | 11,403 | | 249,909 | | 149,717 | | | | |
| Real estate depreciation and amortization | 164,656 | | 182,272 | | 690,988 | | 738,526 | | | | |
| Non-controlling loss from operating partnership units | (1,422) | | (491) | | (9,149) | | (3,426) | | | | |
| Unconsolidated JV depreciation and amortization | 5,913 | 4,442 | 20,678 | 18,116 | | | |
| FFO adjustments | $212,488 | $177,053 | $847,742 | $825,387 | | | |
| FFO adjustments per common share - diluted | $0.60 | $0.46 | $2.29 | $2.15 | | | |
| FFO | $105,642 | $136,520 | $193,257 | $547,126 | | | |
FFO per common share - diluted 4 | $0.30 | $0.36 | $0.52 | $1.43 | | | |
| | | | | | | |
| Transaction costs | 1,577 | 301 | 3,122 | | 2,026 | | | |
Merger-related costs | — | 1,414 | — | | (1,952) | | | |
| Lease intangible amortization | (2,348) | | 261 | (2,054) | | 860 | | | |
| Non-routine legal costs/forfeited earnest money received | 306 | | (100) | | 1,077 | | 175 | | | | |
| Debt financing costs | 237 | — | 237 | | (62) | | | |
| Restructuring and severance-related charges | 22,991 | 1,445 | 29,852 | | 1,445 | | | |
Credit losses and gains (losses) on other assets, net 5 | 4,582 | — | 59,707 | | 8,599 | | | |
| Impairment of goodwill | — | — | 250,530 | | — | | | |
| Merger-related fair value adjustment | 10,314 | 10,800 | 40,667 | | 42,885 | | | |
Unconsolidated JV normalizing items 6 | 113 | 89 | 390 | 389 | | | |
| Normalized FFO adjustments | $37,772 | $14,210 | $383,528 | $54,365 | | | |
| Normalized FFO adjustments per common share - diluted | $0.11 | $0.04 | $1.04 | $0.14 | | | |
Normalized FFO | $143,414 | $150,730 | $576,785 | $601,491 | | | |
| Normalized FFO per common share - diluted | $0.40 | $0.39 | $1.56 | $1.57 | | | |
| | | | | | | |
| Non-real estate depreciation and amortization | 404 | 685 | 1,478 | 2,566 | | | |
Non-cash interest amortization, net 7 | 1,239 | 1,265 | 5,101 | 4,968 | | | |
Rent reserves, net 8 | (369) | 1,404 | 714 | 3,163 | | | |
| Straight-line rent income, net | (7,051) | (7,872) | (27,254) | (32,592) | | | |
| Stock-based compensation | 3,028 | 3,566 | 14,036 | 13,791 | | | |
Unconsolidated JV non-cash items 9 | (277) | (206) | (923) | (1,034) | | | |
Normalized FFO adjusted for non-cash items | 140,388 | 149,572 | 569,937 | 592,353 | | | |
| 2nd generation TI | (20,003) | (18,715) | (69,445) | (66,081) | | | |
| Leasing commissions paid | (11,957) | (14,978) | (47,450) | (36,391) | | | |
| Building capital | (8,347) | (17,393) | (33,934) | (49,343) | | | |
| Total maintenance capex | (40,307) | (51,086) | (150,829) | (151,815) | | | |
| FAD | $100,081 | $98,486 | $419,108 | $440,538 | | | |
| Quarterly/dividends and OP distributions | $110,808 | $118,897 | $462,746 | 477,239 | | | |
FFO wtd avg common shares outstanding - diluted 10 | 355,874 | 383,326 | 369,767 | 383,381 | | | |
1Funds from operations (“FFO”) and FFO per share are operating performance measures adopted by NAREIT. NAREIT defines FFO as “net income (computed in accordance with GAAP) excluding depreciation and amortization related to real estate, gains and losses from the sale of certain real estate assets, gains and losses from change in control, and impairment write-downs of certain real assets and investments in entities when the impairment is directly attributable to decreases in the value of depreciable real estate held by the entity.”
2FFO, Normalized FFO and Funds Available for Distribution ("FAD") do not represent cash generated from operating activities determined in accordance with GAAP and are not necessarily indicative of cash available to fund cash needs. FFO, Normalized FFO and FAD should not be considered alternatives to net income attributable to common stockholders as indicators of the Company's operating performance or as alternatives to cash flow as measures of liquidity.
3Potential common shares are not included in the computation of diluted earnings per share when a loss exists, as the effect would be an antidilutive per share amount.
4For 1Q 2024, basic weighted average common shares outstanding was the denominator used in the per share calculation.
54Q 2024 includes $1.6 million of credit loss reserves, net of recoveries and a $4.1 million loss on other assets. These amounts were partially offset by a $1.1 million recovery of prior-period Steward Health straight-line rent for leases assumed. 3Q 2024 includes $46.8 million of credit loss reserves and $0.2 million gain on other assets. 2Q 2024 includes $11.2 million of credit loss reserves and $2.2 million write-off of prior period Steward Health straight-line rent, offset by $4.9 million gain on other assets.
6Includes the Company's proportionate share of normalizing items related to unconsolidated joint ventures such as lease intangibles and acquisition and pursuit costs.
7Includes the amortization of deferred financing costs, discounts and premiums, and non-cash financing receivable amortization.
82Q 2024 includes $0.8 million related to the Steward Health revenue reserve for March.
9Includes the Company's proportionate share of straight-line rent, net and rent reserves, net related to unconsolidated joint ventures.
10The Company utilizes the treasury stock method, which includes the dilutive effect of nonvested share-based awards outstanding of 691,557 for the three months ended December 31, 2024. Also includes the diluted impact of 3,622,036 OP units outstanding.
| | | | | |
| |
| HEALTHCARE REALTY TRUST INCORPORATED | HEALTHCAREREALTY.COM | PAGE 7 OF 8 |
| | |
| Reconciliation of Non-GAAP Measures |
| DOLLARS IN THOUSANDS, EXCEPT PER SHARE DATA - UNAUDITED |
|
Management considers funds from operations ("FFO"), FFO per share, normalized FFO, normalized FFO per share, and funds available for distribution ("FAD") to be useful non-GAAP measures of the Company's operating performance. A non-GAAP financial measure is generally defined as one that purports to measure historical financial performance, financial position or cash flows, but excludes or includes amounts that would not be so adjusted in the most comparable measure determined in accordance with GAAP. Set forth below are descriptions of the non-GAAP financial measures management considers relevant to the Company's business and useful to investors.
The non-GAAP financial measures presented herein are not necessarily identical to those presented by other real estate companies due to the fact that not all real estate companies use the same definitions. These measures should not be considered as alternatives to net income (determined in accordance with GAAP), as indicators of the Company's financial performance, or as alternatives to cash flow from operating activities (determined in accordance with GAAP) as measures of the Company's liquidity, nor are these measures necessarily indicative of sufficient cash flow to fund all of the Company's needs.
FFO and FFO per share are operating performance measures adopted by the National Association of Real Estate Investment Trusts, Inc. (“NAREIT”). NAREIT defines FFO as “net income (computed in accordance with GAAP) excluding depreciation and amortization related to real estate, gains and losses from the sale of certain real estate assets, gains and losses from change in control, and impairment write-downs of certain real assets and investments in entities when the impairment is directly attributable to decreases in the value of depreciable real estate held by the entity.” The Company defines Normalized FFO as FFO excluding acquisition-related expenses, lease intangible amortization and other normalizing items that are unusual and infrequent in nature. FAD is presented by adding to Normalized FFO non-real estate depreciation and amortization, deferred financing fees amortization, share-based compensation expense and rent reserves, net; and subtracting maintenance capital expenditures, including second generation tenant improvements and leasing commissions paid and straight-line rent income, net of expense. The Company's definition of these terms may not be comparable to that of other real estate companies as they may have different methodologies for computing these amounts. FFO, Normalized FFO and FAD do not represent cash generated from operating activities determined in accordance with GAAP and are not necessarily indicative of cash available to fund cash needs. FFO, Normalized FFO and FAD should not be considered an alternative to net income as an indicator of the Company’s operating performance or as an alternative to cash flow as a measure of liquidity. FFO, Normalized FFO and FAD should be reviewed in connection with GAAP financial measures.
Management believes FFO, FFO per share, Normalized FFO, Normalized FFO per share, and FAD provide an understanding of the operating performance of the Company’s properties without giving effect to certain significant non-cash items, including depreciation and amortization expense. Historical cost accounting for real estate assets in accordance with GAAP assumes that the value of real estate assets diminishes predictably over time. However, real estate values instead have historically risen or fallen with market conditions. The Company believes that by excluding the effect of depreciation, amortization, gains or losses from sales of real estate, and other normalizing items that are unusual and infrequent, FFO, FFO per share, Normalized FFO, Normalized FFO per share and FAD can facilitate comparisons of operating performance between periods. The Company reports these measures because they have been observed by management to be the predominant measures used by the REIT industry and by industry analysts to evaluate REITs and because these measures are consistently reported, discussed, and compared by research analysts in their notes and publications about REITs.
Cash NOI and Same Store Cash NOI are key performance indicators. Management considers these to be supplemental measures that allow investors, analysts and Company management to measure unlevered property-level operating results. The Company defines Cash NOI as rental income and less property operating expenses. Cash NOI excludes non-cash items such as above and below market lease intangibles, straight-line rent, lease inducements, lease termination fees, tenant improvement amortization and leasing commission amortization. Cash NOI is historical and not necessarily indicative of future results.
Same Store Cash NOI compares Cash NOI for stabilized properties. Stabilized properties are properties that have been included in operations for the duration of the year-over-year comparison period presented. Accordingly, stabilized properties exclude properties that were recently acquired or disposed of, properties classified as held for sale, properties undergoing redevelopment, and newly redeveloped or developed properties.
The Company utilizes the redevelopment classification for properties where management has approved a change in strategic direction for such properties through the application of additional resources including an amount of capital expenditures significantly above routine maintenance and capital improvement expenditures.
Any recently acquired property will be included in the same store pool once the Company has owned the property for eight full quarters. Newly developed or redeveloped properties will be included in the same store pool eight full quarters after substantial completion.
| | | | | |
| |
| HEALTHCARE REALTY TRUST INCORPORATED | HEALTHCAREREALTY.COM | PAGE 8 OF 8 |
| | |
4Q2024 |
| Supplemental Information |
| FURNISHED AS OF FEBRUARY 19, 2025 - UNAUDITED |
|
|
| | |
| FORWARD LOOKING STATEMENTS & RISK FACTORS |
|
This Supplemental Information report contains disclosures that are “forward-looking statements” as defined in Section 27A of the Securities Act of 1933, as amended, and Section 21E of the Securities Exchange Act of 1934, as amended. Forward-looking statements include all statements that do not relate solely to historical or current facts and can be identified by the use of words and phrases such as “can,” “may,” “payable,” “indicative,” "predictive," “annualized,” “expect,” “expected,” “range of expectations,” "would have been," "budget," "will," "run-rate," and other comparable terms in this report, and include, but are not limited to, statements related to the merger between Healthcare Realty Trust Incorporated (the “Company” or "HR") and Healthcare Trust of America, Inc. (“Legacy HTA”) that closed on July 20, 2022 (the “Merger”). These forward-looking statements are made as of the date of this report and are not necessarily indicative of future performance. These statements are based on the current plans and expectations of Company management and are subject to a number of unknown risks, uncertainties, assumptions and other factors that could cause actual results to differ materially from those described in this release or implied by such forward-looking statements. Such risks and uncertainties include, among other things, the following: the Company’s expected results may not be achieved; failure to realize the expected benefits of the Merger; risks related to future opportunities and plans for the Company, including the uncertainty of expected future financial performance and results of the Company; the possibility that, if the Company does not achieve the perceived benefits of the Merger as rapidly or to the extent anticipated by financial analysts or investors, the market price of the Company’s common stock could decline; pandemics or other health crises, such as COVID-19; increases in interest rates; the availability and cost of capital at expected rates; competition for quality assets; negative developments in the operating results or financial condition of the Company's tenants, including, but not limited to, their ability to pay rent; the Company's ability to reposition or sell facilities with profitable results; the Company's ability to release space at similar rates as vacancies occur; the Company's ability to renew expiring leases; government regulations affecting tenants' Medicare and Medicaid reimbursement rates and operational requirements; unanticipated difficulties and/or expenditures relating to future acquisitions and developments; changes in rules or practices governing the Company's financial reporting; the Company may be required under purchase options to sell properties and may not be able to reinvest the proceeds from such sales at rates of return equal to the return received on the properties sold; uninsured or underinsured losses related to casualty or liability; the incurrence of impairment charges on its real estate properties or other assets; and other legal and operational matters. Other risks, uncertainties and factors that could cause actual results to differ materially from those projected are detailed under the heading “Risk Factors,” in the Annual Report on Form 10-K filed with the Securities and Exchange Commission (“SEC”) for the year ended December 31, 2024, under the heading "Risk Factors" and other risks described from time to time thereafter in the Company's SEC filings. The Company undertakes no obligation to publicly update or revise any forward-looking statements, whether as a result of new information, future events or otherwise.
| | | | | |
| Highlights |
| Salient Facts |
| Corporate Information |
| Balance Sheet |
| Statements of Income |
| FFO, Normalized FFO, & FAD |
| Capital Funding & Commitments |
| Debt Metrics |
| Debt Covenants & Liquidity |
| JV and Disposition Activity |
| Joint Ventures |
| Re/development Activity |
| Portfolio |
| Health Systems |
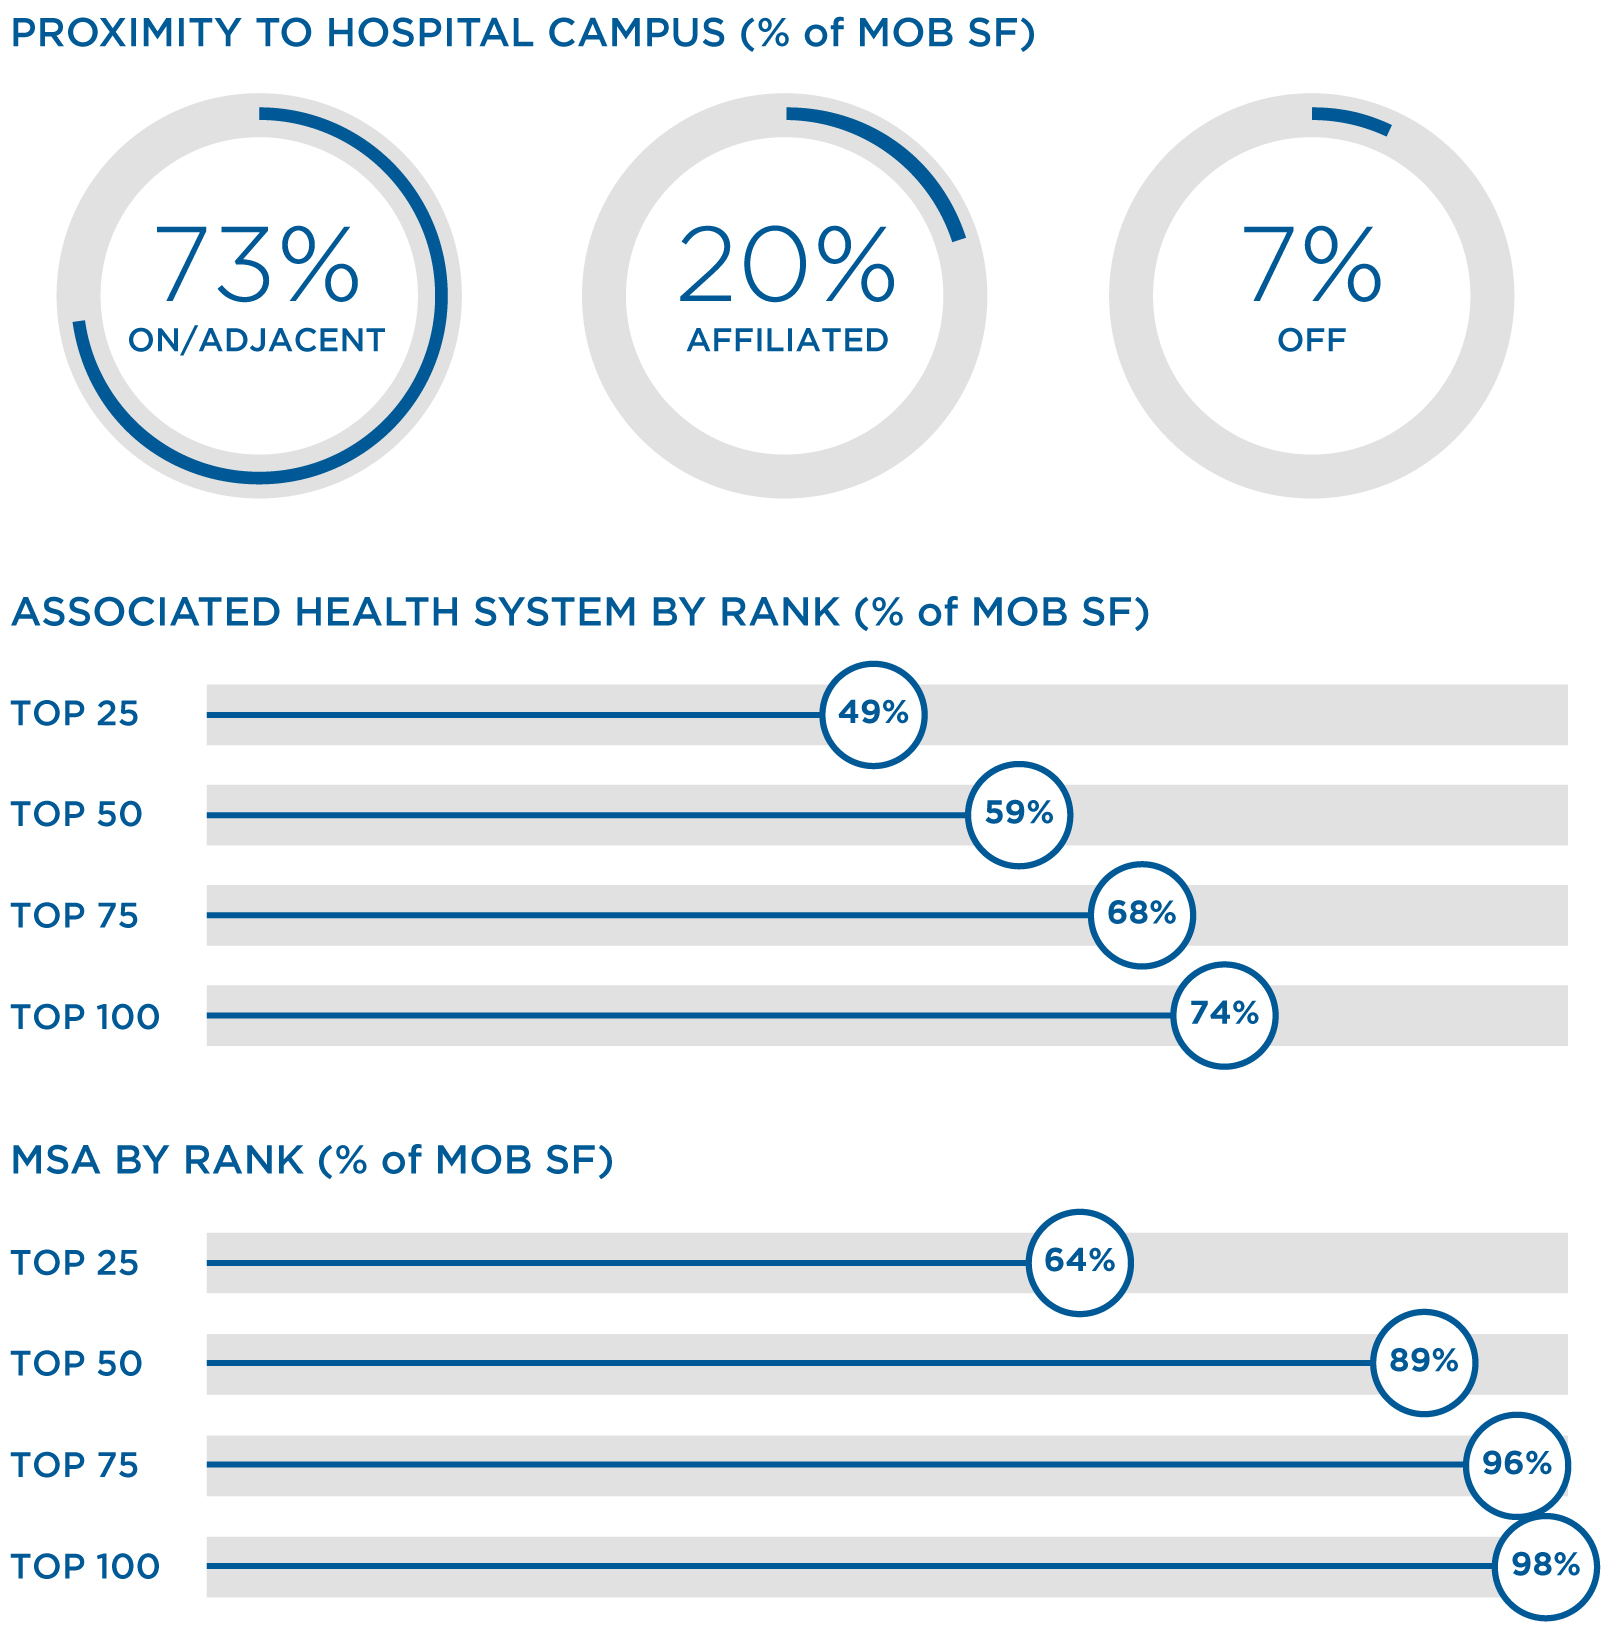
| MOB Proximity to Hospital |
| Lease Maturity & Occupancy |
| Leasing Statistics |
| Same Store |
| NOI Reconciliations |
| 27 | EBITDA Reconciliations |
| Components of Net Asset Value |
| 2025 Guidance |
| | | | | |
| |
HEALTHCARE REALTY | 4Q 2024 SUPPLEMENTAL INFORMATION 3 |
Net (loss) income attributable to common stockholders for the three months ended December 31, 2024 was $(106.8) million or $(0.31) per diluted common share. Net (loss) income attributable to common stockholders for the year ended December 31, 2024 was $(654.5) million or $(1.81) per diluted common share.
| | | | | | | | | | | | | | |
| KEY FOURTH QUARTER AND ANNUAL HIGHLIGHTS | |
•Normalized FFO per share totaled $0.40 for the quarter, at the high end of the previously provided guidance range and up 2.5% over the prior year period. Normalized FFO per share was $1.56 for the year ended December 31, 2024.
•Cash NOI growth in the fourth quarter and year was as shown below (for more detail on the impact of Steward Health and Prospect Medical please see the related section herein):
| | | | | | | | | | | |
| | | | |
| | | ACTUAL | |
| | | 4Q 2024 | 2024 | |
| Same store | | | 3.1 | % | 2.9 | % | |
| Same store excluding Steward Health & Prospect Medical | | | 3.6 | % | 3.1 | % | |
•140,000 square feet, or 44 basis points, of multi-tenant absorption for the quarter and 479,000 square feet, or 149 basis points, for the year
•686,000 square feet of signed new leases in the quarter, the sixth consecutive quarter above 400,000 and a new single-quarter high
•The Company closed joint venture and asset sale transactions totaling $522 million in the fourth quarter, and generated approximately $1.3 billion of proceeds for the year, which includes the following:
◦$770 million from joint venture transactions
◦$491 million from asset sales
•For the year, the Company repurchased approximately 31 million shares totaling $510 million at an average price of $16.56 per share.
•The Company repaid its $350 million term loan maturing in 2025 and ended the year with leverage at 6.4 times net debt to adjusted EBITDA.
| | | | | | | | | | | | | | |
| MULTI-TENANT GROWTH AND ABSORPTION | | | |
•Compared to prior year periods, multi-tenant cash NOI growth in the fourth quarter and year was:
| | | | | | | | | | | |
| | | | |
| | | ACTUAL | |
| | | 4Q 2024 | 2024 | |
| Multi-tenant | | | 3.4 | % | 3.0 | % | |
| Multi-tenant excluding Steward Health & Prospect Medical | | | 3.9 | % | 3.2 | % | |
•Multi-tenant occupancy gains at the high end of full year 2024 guidance were:
| | | | | | | | | | | | | | | | | |
| | | | | | |
| | | ACTUAL | 2024 GUIDANCE | |
| | | 4Q 2024 | 2024 | LOW | HIGH | |
| | | | | | | |
| | | | | | | |
| | | | | | | |
| | | | | | | |
| | | | | | | |
| Absorption (SF) | | | 140,182 | 479,439 | 370,000 | 490,000 | |
| | | | | | | |
| | | | | | | |
| Change in occupancy (bps) | | | + 44 | + 149 | + 100 | + 150 | |
•At the end of the year, the multi-tenant portfolio occupancy rate was 86.3% and the leased percentage was 88.3%.
| | | | | |
| |
HEALTHCARE REALTY | 4Q 2024 SUPPLEMENTAL INFORMATION 4 |
•Portfolio leasing activity that commenced in the fourth quarter totaled 1,534,000 square feet related to 349 leases:
◦954,000 square feet of renewals
◦580,000 square feet of new and expansion lease commencements
•In the fourth quarter, the Company signed new leases totaling 686,000 square feet, a new, single-quarter high for the Company.
•Cash NOI for the fourth quarter increased 3.1% over the same quarter in the prior year, and 2.9% for the year ended December 31, 2024. Adjusted for the impact of Steward Health and Prospect Medical, cash NOI growth would have been 3.6% for the fourth quarter and 3.1% for the year.
•Tenant retention for the fourth quarter was 81.6% and 83.4% for the year.
•Operating expenses for the fourth quarter increased 2.7% over the same quarter in the prior year, and 0.2% for the year ended December 31, 2024.
•MOB cash leasing spreads were 2.7% for the quarter and 3.4% for the year.
•At year end, net debt to adjusted EBITDA was 6.4 times, down from 6.7 times at the end of the third quarter.
•The Company fully repaid its $350 million Unsecured Term Loan maturing in 2025.
•At year end, the Company had no balance on its revolving credit facility, resulting in $1.5 billion of availability.
•In January 2025, the Company repaid $35 million of its term loans maturing in 2026.
•Connie Moore appointed Interim President & Chief Executive Officer
•Austen Helfrich promoted to Chief Financial Officer
•Significant board refreshment in 2024, with four new directors joining, each with deep REIT industry and leadership experience
•Tom Bohjalian appointed Independent Chair of the Board
•Search committee of the board, chaired by Glenn Rufrano, conducting a search for a permanent President & Chief Executive Officer
•A common stock cash dividend in the amount of $0.31 per share will be paid on March 19, 2025 to Class A common stockholders of record on March 3, 2025. Additionally, the eligible holders of operating partnership units will receive a distribution of $0.31 per unit, equivalent to the Company's Class A common stock dividend.
| | | | | | | | | | | | | | |
| STEWARD HEALTH AND PROSPECT MEDICAL UPDATE |
•During the fourth quarter, the Company made significant progress re-leasing space previously occupied by Steward Health, with leases in-place for over 80% of the previously occupied 593,000 square feet. Based on these actions, the Company entered 2025 having replaced approximately $19 million of the $27 million of pre-bankruptcy total exposure to Steward. Longer term, the Company continues to expect to recover over 80% of the pre-bankruptcy Steward Health revenue.
| | | | | |
| |
HEALTHCARE REALTY | 4Q 2024 SUPPLEMENTAL INFORMATION 5 |
•On January 11, 2025, Prospect Medical filed for Chapter 11 bankruptcy protection. Prospect Medical leases approximately 81,000 square feet of space from the Company accounting for approximately $2.9 million of annual revenue. 2025 guidance provided herein assumes no revenue collected from the Prospect leases.
•The Company's 2025 per share estimated guidance ranges are as follows:
| | | | | | | | | | | | | | | | | | |
| | | | |
| | ACTUAL | | 2025 GUIDANCE | | |
| | | 2024 | | LOW | HIGH | | |
| Earnings per share | | | $(1.81) | | $(0.28) | $(0.20) | | |
| NAREIT FFO per share | | | $0.52 | | $1.44 | $1.48 | | |
| Normalized FFO per share | | | $1.56 | | $1.56 | $1.60 | | |
| | | | | | | | |
| | | | | | | | |
| | | | | | | | |
| | | | | | | | |
| | | | | | | | |
| | | | | | | | |
| | | | | | | | |
| | | | | | | | |
| | | | | | | | |
| | | | | | | | |
•The Company's 2025 same store cash NOI growth estimated guidance range is 3.00% to 3.75%, which excludes the impact of Prospect Medical and Steward Health.
•The Company's 2025 guidance range includes activities outlined on page 29 of the Supplemental Information.
The 2025 annual guidance range reflects the Company's view of current and future market conditions, including assumptions with respect to rental rates, occupancy levels, interest rates, and operating and general and administrative expenses. The Company's guidance does not contemplate impacts from gains or losses from
dispositions, potential impairments, or debt extinguishment costs, if any. There can be no assurance that the Company's actual results will not be materially higher or lower than these expectations. If actual results vary from these assumptions, the Company's expectations may change.
•On Wednesday, February 19, 2025, at 11:00 a.m. Eastern Time, Healthcare Realty Trust has scheduled a conference call to discuss earnings results, quarterly activities, general operations of the Company and industry trends.
•Simultaneously, a webcast of the conference call will be available to interested parties at https://investors.healthcarerealty.com/corporate-profile/webcasts under the Investor Relations section. A webcast replay will be available following the call at the same address.
•Live Conference Call Access Details:
◦Domestic Dial-In Number: +1 646-968-2525 access code 4950066;
◦All Other Locations: +1 888-596-4144 access code 4950066.
•Replay Information:
◦Domestic Dial-In Number: +1 609-800-9909 access code 4950066;
◦All Other Locations: +1 800-770-2030 access code 4950066.
| | | | | |
| |
HEALTHCARE REALTY | 4Q 2024 SUPPLEMENTAL INFORMATION 6 |
| | | | | | | | | | | |
| Properties | | |
| | |
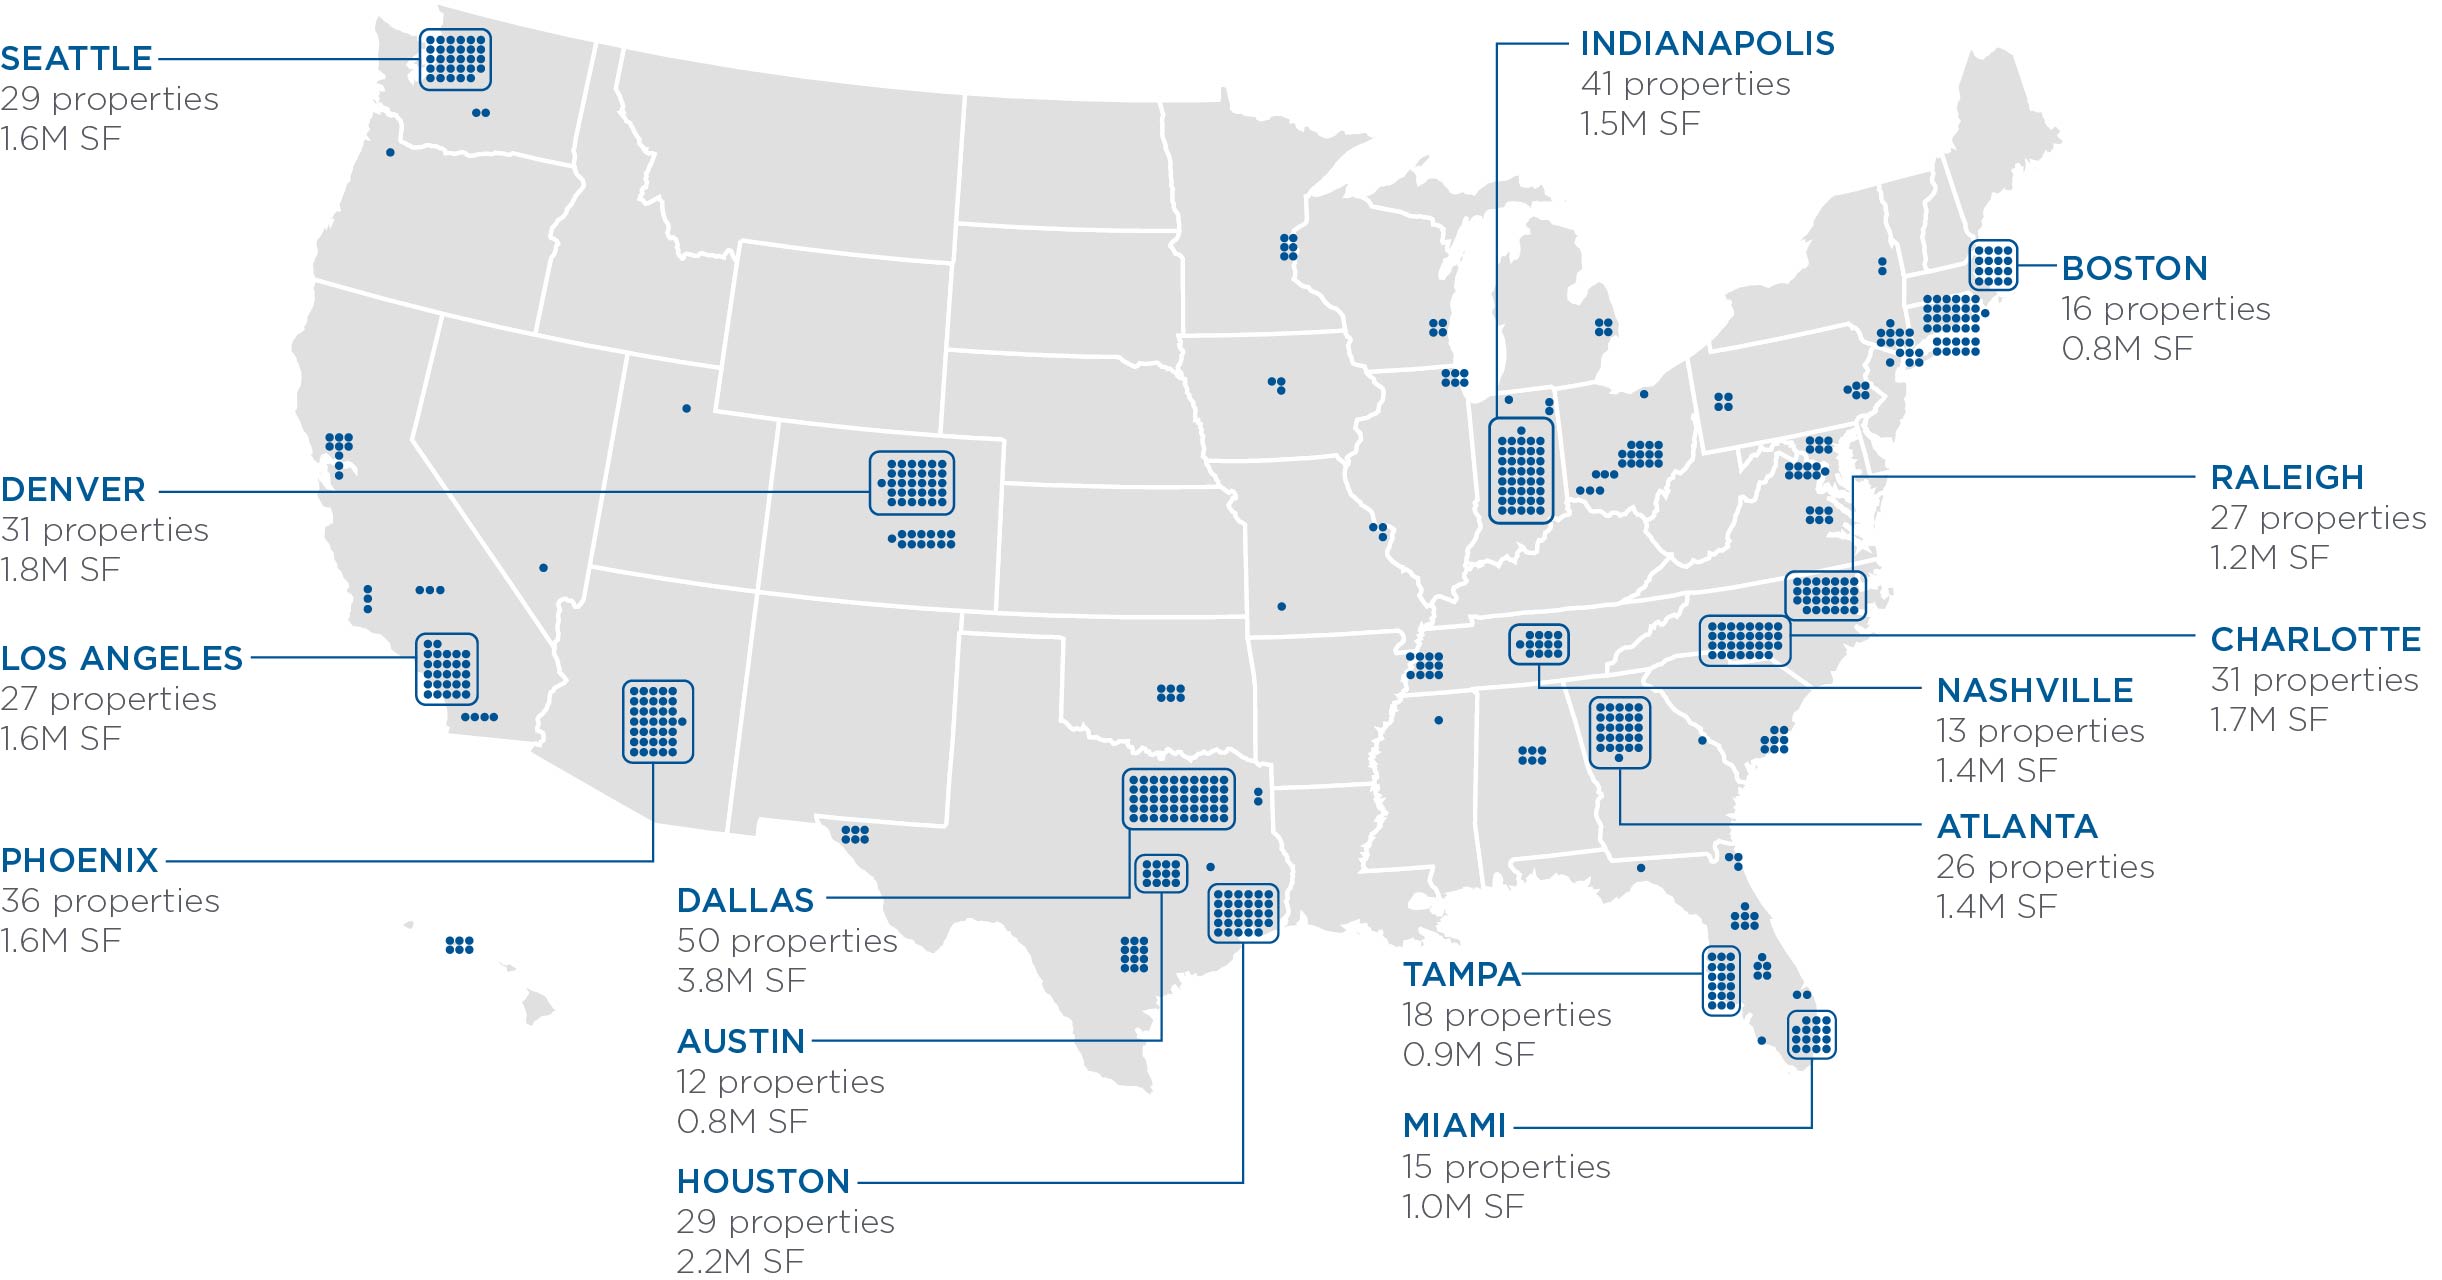
| 651 properties totaling 38.4M SF | |
| 65 markets in 34 states | |
| 92% managed by Healthcare Realty | |
| 93% outpatient medical facilities | |
| 59% of NOI in Top 15 Markets | |
| | |
| | |
| Capitalization | |
| | |
| $10.8B enterprise value as of 12/31/24 | |
| $6.0B market capitalization as of 12/31/24 | |
| 354.1M shares/units outstanding as of 12/31/24 | |
| 355.9M diluted WA shares outstanding | |
| BBB/Baa2 S&P/Moody's | |
| 44.6% net debt to enterprise value at 12/31/24 | |
| 6.4x net debt to EBITDA | |
| | |
| | |
1Includes properties held in joint ventures.
| | | | | |
| |
HEALTHCARE REALTY | 4Q 2024 SUPPLEMENTAL INFORMATION 7 |
Healthcare Realty (NYSE: HR) is a real estate investment trust (REIT) that owns and operates medical outpatient buildings primarily located around market-leading hospital campuses. The Company selectively grows its portfolio through property acquisition and development. As of December 31, 2024, the Company was invested in 651 real estate properties in 34 states totaling 38.4 million square feet and had an enterprise value of approximately $10.8 billion, defined as equity market capitalization plus the principal amount of debt less cash. The Company provided leasing and property management services to 93% of its portfolio.
| | |
| EXECUTIVE OFFICERS |
|
| Ryan E. Crowley |
| Executive Vice President and Chief Investment Officer |
|
| Austen B. Helfrich |
| Executive Vice President and Chief Financial Officer |
|
| Robert E. Hull |
| Executive Vice President and Chief Operating Officer |
|
| Andrew E. Loope |
| Executive Vice President, General Counsel and Secretary |
|
| Constance B. Moore |
| Interim President and Chief Executive Officer |
|
| Julie F. Wilson |
| Executive Vice President and Chief Administrative Officer |
|
|
|
|
|
| | | | | |
| ANALYST COVERAGE |
| |
| BMO Capital Markets |
| BTIG, LLC |
| Citi Research |
| Deutsche Bank Securities |
| Green Street Advisors, Inc. |
| J.P. Morgan Securities LLC |
| Jefferies LLC |
| KeyBanc Capital Markets Inc. |
| Raymond James & Associates |
| Scotiabank |
| Wedbush Securities |
| Wells Fargo Securities, LLC |
| |
| |
Nancy H. Agee
Retired President and Chief Executive Officer
Carilion Clinic
Thomas N. Bohjalian
Chairman, Healthcare Realty Trust Incorporated
Retired Head of U.S Real Estate, Cohen & Steers
Ajay Gupta
Chief Executive Officer
Physician Rehabilitation Network
David B. Henry
Retired Vice Chairman and Chief Executive Officer
Kimco Realty Corporation
James J. Kilroy
President and Portfolio Manager
Willis Investment Counsel
Jay P. Leupp
Managing Partner and Senior Portfolio Manager
Terra Firma Asset Management, LLC
Peter F. Lyle
Executive Vice President
Medical Management Associates, Inc.
Constance B. Moore
Interim President and Chief Executive Officer
Healthcare Realty Trust Incorporated
Glenn J. Rufrano
Executive Chairman
PREIT
Christann M. Vasquez
Retired Healthcare Executive
Donald C. Wood
Chief Executive Officer
Federal Realty Investment Trust
David R. Emery (1944-2019)
Chairman Emeritus
Healthcare Realty Trust Incorporated
| | | | | |
| |
HEALTHCARE REALTY | 4Q 2024 SUPPLEMENTAL INFORMATION 8 |
| | |
| Balance Sheet |
| AMOUNTS IN THOUSANDS, EXCEPT PER SHARE DATA |
|
| | | | | | | | | | | | | | | | | | | | | | | |
| ASSETS | | | | | | | | | | | |
| | | | | | | | | |
| 4Q 2024 | 3Q 2024 | 2Q 2024 | 1Q 2024 | 4Q 2023 | | | | | | |
| Real estate properties | | | | | | | | | | | |
| Land | $1,143,468 | | $1,195,116 | | $1,287,532 | | $1,342,895 | | $1,343,265 | | | | | | | |
| Buildings and improvements | 9,707,066 | | 10,074,504 | | 10,436,218 | | 10,902,835 | | 10,881,373 | | | | | | | |
| Lease intangibles | 664,867 | | 718,343 | | 764,730 | | 816,303 | | 836,302 | | | | | | | |
| Personal property | 9,909 | | 9,246 | | 12,501 | | 12,720 | | 12,718 | | | | | | | |
| Investment in financing receivables, net | 123,671 | | 123,045 | | 122,413 | | 122,001 | | 122,602 | | | | | | | |
| Financing lease right-of-use assets | 77,343 | | 77,728 | | 81,401 | | 81,805 | | 82,209 | | | | | | | |
| Construction in progress | 31,978 | | 125,944 | | 97,732 | | 70,651 | | 60,727 | | | | | | | |
| Land held for development | 52,408 | | 52,408 | | 59,871 | | 59,871 | | 59,871 | | | | | | | |
| Total real estate investments | 11,810,710 | | 12,376,334 | | 12,862,398 | | 13,409,081 | | 13,399,067 | | | | | | | |
| Less accumulated depreciation and amortization | (2,483,656) | | (2,478,544) | | (2,427,709) | | (2,374,047) | | (2,226,853) | | | | | | | |
| Total real estate investments, net | 9,327,054 | | 9,897,790 | | 10,434,689 | | 11,035,034 | | 11,172,214 | | | | | | | |
Cash and cash equivalents 1 | 68,916 | | 22,801 | | 137,773 | | 26,172 | | 25,699 | | | | | | | |
| | | | | | | | | | | |
| Assets held for sale, net | 12,897 | | 156,218 | | 34,530 | | 30,968 | | 8,834 | | | | | | | |
| Operating lease right-of-use assets | 261,438 | | 259,013 | | 261,976 | | 273,949 | | 275,975 | | | | | | | |
| Investments in unconsolidated joint ventures | 473,122 | | 417,084 | | 374,841 | | 309,754 | | 311,511 | | | | | | | |
| Other assets, net and goodwill | 507,496 | | 491,679 | | 559,818 | | 605,047 | | 842,898 | | | | | | | |
| Total assets | $10,650,923 | | $11,244,585 | | $11,803,627 | | $12,280,924 | | $12,637,131 | | | | | | | |
| | | | | | | | | | | |
| LIABILITIES AND STOCKHOLDERS' EQUITY | | | | | | | | | | | |
| | | | | | | | | |
| 4Q 2024 | 3Q 2024 | 2Q 2024 | 1Q 2024 | 4Q 2023 | | | | | | |
| Liabilities | | | | | | | | | | | |
| Notes and bonds payable | $4,662,771 | | $4,957,796 | | $5,148,153 | | $5,108,279 | | $4,994,859 | | | | | | | |
| Accounts payable and accrued liabilities | 222,510 | | 197,428 | | 195,884 | | 163,172 | | 211,994 | | | | | | | |
| Liabilities of properties held for sale | 1,283 | | 7,919 | | 1,805 | | 700 | | 295 | | | | | | | |
| Operating lease liabilities | 224,499 | | 229,925 | | 230,601 | | 229,223 | | 229,714 | | | | | | | |
| Financing lease liabilities | 72,346 | | 71,887 | | 75,199 | | 74,769 | | 74,503 | | | | | | | |
| Other liabilities | 161,640 | | 180,283 | | 177,293 | | 197,763 | | 202,984 | | | | | | | |
| Total liabilities | 5,345,049 | | 5,645,238 | | 5,828,935 | | 5,773,906 | | 5,714,349 | | | | | | | |
| | | | | | | | | | | |
| | | | | | | | | | | |
| Redeemable non-controlling interests | 4,778 | | 3,875 | | 3,875 | | 3,880 | | 3,868 | | | | | | | |
| | | | | | | | | | | |
| Stockholders' equity | | | | | | | | | | | |
| Preferred stock, $0.01 par value; 200,000 shares authorized | — | | — | | — | | — | | — | | | | | | | |
| Common stock, $0.01 par value; 1,000,000 shares authorized | 3,505 | | 3,558 | | 3,643 | | 3,815 | | 3,810 | | | | | | | |
| Additional paid-in capital | 9,118,229 | | 9,198,004 | | 9,340,028 | | 9,609,530 | | 9,602,592 | | | | | | | |
| Accumulated other comprehensive (loss) income | (1,168) | | (16,963) | | 6,986 | | 4,791 | | (10,741) | | | | | | | |
| Cumulative net income attributable to common stockholders | 374,309 | | 481,155 | | 574,178 | | 717,958 | | 1,028,794 | | | | | | | |
| Cumulative dividends | (4,260,014) | | (4,150,328) | | (4,037,693) | | (3,920,199) | | (3,801,793) | | | | | | | |
| Total stockholders' equity | 5,234,861 | | 5,515,426 | | 5,887,142 | | 6,415,895 | | 6,822,662 | | | | | | | |
| Non-controlling interest | 66,235 | | 80,046 | | 83,675 | | 87,243 | | 96,252 | | | | | | | |
| Total equity | 5,301,096 | | 5,595,472 | | 5,970,817 | | 6,503,138 | | 6,918,914 | | | | | | | |
| Total liabilities and stockholders' equity | $10,650,923 | | $11,244,585 | | $11,803,627 | | $12,280,924 | | $12,637,131 | | | | | | | |
12Q 2024 cash and cash equivalents includes $96.0 million of proceeds held in a cash escrow account from a portfolio disposition that closed on June 28, 2024 and was received by the Company on July 1, 2024.
| | | | | |
| |
HEALTHCARE REALTY | 4Q 2024 SUPPLEMENTAL INFORMATION 9 |
| | |
| Statements of Income |
| DOLLARS IN THOUSANDS |
|
| | | | | | | | | | | | | | | | | | | | | | | | | | | | | | | | |
| | | | | | | | | | | | | | | | | | | | |
| | | | | | | | | | | | | | | | | | | |
| 4Q 2024 | 3Q 2024 | 2Q 2024 | 1Q 2024 | 4Q 2023 | | | | | | | | | | | | | | | |
| Revenues | | | | | | | | | | | | | | | | | | | | |
Rental income 1 | $300,065 | $306,499 | $308,135 | $318,076 | $322,076 | | | | | | | | | | | | | | | |
| Interest income | 4,076 | 3,904 | 3,865 | 4,538 | 4,422 | | | | | | | | | | | | | | | |
| Other operating | 5,625 | 5,020 | 4,322 | 4,191 | 3,943 | | | | | | | | | | | | | | | |
| 309,766 | 315,423 | 316,322 | 326,805 | 330,441 | | | | | | | | | | | | | | | |
| Expenses | | | | | | | | | | | | | | | | | | | | |
| Property operating | 114,415 | 120,232 | 117,719 | 121,078 | 121,362 | | | | | | | | | | | | | | | |
| General and administrative | 34,208 | 20,124 | 14,002 | 14,787 | 14,609 | | | | | | | | | | | | | | | |
Normalizing items 2 | (22,991) | (6,861) | — | — | (1,445) | | | | | | | | | | | | | | | |
| Normalized general and administrative | 11,217 | 13,263 | 14,002 | 14,787 | 13,164 | | | | | | | | | | | | | | | |
| Transaction costs | 1,577 | 719 | 431 | 395 | 301 | | | | | | | | | | | | | | | |
| Merger-related costs | — | — | — | — | 1,414 | | | | | | | | | | | | | | | |
| Depreciation and amortization | 160,330 | 163,226 | 173,477 | 178,119 | 180,049 | | | | | | | | | | | | | | | |
| 310,530 | 304,301 | 305,629 | 314,379 | 317,735 | | | | | | | | | | | | | | | |
| Other income (expense) | | | | | | | | | | | | | | | | | | | | |
| Interest expense before merger-related fair value | (47,951) | (50,465) | (52,393) | (50,949) | (52,387) | | | | | | | | | | | | | | | |
| Merger-related fair value adjustment | (10,314) | (10,184) | (10,064) | (10,105) | (10,800) | | | | | | | | | | | | | | | |
| Interest expense | (58,265) | (60,649) | (62,457) | (61,054) | (63,187) | | | | | | | | | | | | | | | |
| Gain on sales of real estate properties and other assets | 32,082 | 39,310 | 38,338 | 22 | 20,573 | | | | | | | | | | | | | | | |
| Loss on extinguishment of debt | (237) | — | — | — | — | | | | | | | | | | | | | | | |
| Impairment of real estate assets and credit loss reserves | (81,098) | (84,394) | (132,118) | (15,937) | (11,403) | | | | | | | | | | | | | | | |
| Impairment of goodwill | — | — | — | (250,530) | — | | | | | | | | | | | | | | | |
| Equity income (loss) from unconsolidated joint ventures | 224 | 208 | (146) | (422) | (430) | | | | | | | | | | | | | | | |
| Interest and other (expense) income, net | (154) | (132) | (248) | 275 | 65 | | | | | | | | | | | | | | | |
| (107,448) | (105,657) | (156,631) | (327,646) | (54,382) | | | | | | | | | | | | | | | |
| Net (loss) income | $(108,212) | $(94,535) | $(145,938) | $(315,220) | $(41,676) | | | | | | | | | | | | | | | |
| Net loss (income) attributable to non-controlling interests | 1,366 | 1,512 | 2,158 | 4,384 | 1,143 | | | | | | | | | | | | | | | |
| Net (loss) income attributable to common stockholders | $(106,846) | $(93,023) | $(143,780) | $(310,836) | $(40,533) | | | | | | | | | | | | | | | |
| | | | | | | | | | | | | | | | | | | | |
| Basic earnings per common share | $(0.31) | $(0.26) | $(0.39) | $(0.82) | $(0.11) | | | | | | | | | | | | | | | |
| Diluted earnings per common share | $(0.31) | $(0.26) | $(0.39) | $(0.82) | $(0.11) | | | | | | | | | | | | | | | |
| | | | | | | | | | | | | | | | | | | | |
| Weighted average common shares outstanding - basic | 351,560 | 358,960 | 372,477 | 379,455 | 379,044 | | | | | | | | | | | | | | | |
Weighted average common shares outstanding - diluted 3 | 351,560 | 358,960 | 372,477 | 379,455 | 379,044 | | | | | | | | | | | | | | | |
| | | | | | | | | | | | | | | | | | | | |
| | | | | | | | | | | | | | | | | | | | |
| | | | | | | | | | | | | | | | | | | | |
| | | | | | | | | | | | | | | | | | | | |
| | | | | | | | | | | | | | | | | | | | |
| | | | | | | | | | | | | | | | | | | | |
| | | | | | | | | | | | | | | | | | | | |
| | | | | | | | | | | | | | | | | | | | |
| | | | | | | | | | | | | | | | | | | | | | | | | | | | | | | | |
| STATEMENTS OF INCOME SUPPLEMENTAL INFORMATION | | | | | | | | | | | | | | | | | | | | |
| | | | | | | | | | | | | | | | | | | |
| 4Q 2024 | 3Q 2024 | 2Q 2024 | 1Q 2024 | 4Q 2023 | | | | | | | | | | | | | | | |
| Interest income | | | | | | | | | | | | | | | | | | | | |
| Financing receivables | $2,103 | $2,117 | $2,094 | $2,117 | $2,132 | | | | | | | | | | | | | | | |
| Interest on mortgage and mezzanine loans | 1,973 | 1,787 | 1,771 | 2,421 | 2,290 | | | | | | | | | | | | | | | |
| Total | $4,076 | $3,904 | $3,865 | $4,538 | $4,422 | | | | | | | | | | | | | | | |
| | | | | | | | | | | | | | | | | | | | |
| Other operating income | | | | | | | | | | | | | | | | | | | | |
| Parking income | $1,958 | $2,363 | $2,463 | $2,545 | $2,392 | | | | | | | | | | | | | | | |
| Management fee and miscellaneous income | 3,667 | 2,657 | 1,859 | 1,646 | 1,551 | | | | | | | | | | | | | | | |
| Total | $5,625 | $5,020 | $4,322 | $4,191 | $3,943 | | | | | | | | | | | | | | | |
1In 4Q 2024, rental income was reduced by $0.7 million for Prospect Medical revenue reserves. In 2Q 2024, rental income was reduced by $3.0 million for Steward Health revenue reserves.
2Normalizing items primarily include restructuring, severance-related costs and non-routine advisory fees associated with shareholder engagement.
3Potential common shares are not included in the computation of diluted earnings per share when a loss exists, as the effect would be an antidilutive per share amount. As a result, the outstanding limited partnership units in the Company's operating partnership ("OP"), totaling 3,622,036 units were not included.
| | | | | |
| |
HEALTHCARE REALTY | 4Q 2024 SUPPLEMENTAL INFORMATION 10 |
| | |
FFO, Normalized FFO, & FAD 1,2,3 |
| DOLLARS IN THOUSANDS, EXCEPT PER SHARE DATA |
|
| | | | | | | | | | | | | | | | | | | | | | | | | | | | | | | | | | | | |
| | | | | | | | | | | | | | | | | | | | | | | | |
| | | | | | | | | | | | | | | | | | | | | | | | |
| 4Q 2024 | 3Q 2024 | 2Q 2024 | 1Q 2024 | 4Q 2023 | | | | | | | | | | | | | | | | | | | |
| Net loss attributable to common stockholders | $(106,846) | $(93,023) | $(143,780) | $(310,836) | $(40,533) | | | | | | | | | | | | | | | | | | | |
Net loss attributable to common stockholders per diluted share 3 | $(0.31) | $(0.26) | $(0.39) | $(0.82) | $(0.11) | | | | | | | | | | | | | | | | | | | |
| | | | | | | | | | | | | | | | | | | | | | | | |
| Gain on sales of real estate assets | $(32,082) | $(39,148) | $(33,431) | $(22) | $(20,573) | | | | | | | | | | | | | | | | | | | |
| Impairments of real estate assets | 75,423 | | 37,632 | | 120,917 | | 15,937 | | 11,403 | | | | | | | | | | | | | | | | | | | | |
| Real estate depreciation and amortization | 164,656 | | 167,821 | | 177,350 | | 181,161 | | 182,272 | | | | | | | | | | | | | | | | | | | | |
| Non-controlling loss from operating partnership units | (1,422) | | (1,372) | | (2,077) | | (4,278) | | (491) | | | | | | | | | | | | | | | | | | | | |
| Unconsolidated JV depreciation and amortization | 5,913 | 5,378 | 4,818 | 4,568 | 4,442 | | | | | | | | | | | | | | | | | | | |
| FFO adjustments | $212,488 | $170,311 | $267,577 | $197,366 | $177,053 | | | | | | | | | | | | | | | | | | | |
| FFO adjustments per common share - diluted | $0.60 | $0.47 | $0.71 | $0.51 | $0.46 | | | | | | | | | | | | | | | | | | | |
| FFO | $105,642 | $77,288 | $123,797 | $(113,470) | $136,520 | | | | | | | | | | | | | | | | | | | |
FFO per common share - diluted 4 | $0.30 | $0.21 | $0.33 | $(0.30) | $0.36 | | | | | | | | | | | | | | | | | | | |
| | | | | | | | | | | | | | | | | | | | | | | | |
| Transaction costs | 1,577 | 719 | 431 | 395 | 301 | | | | | | | | | | | | | | | | | | | |
Merger-related costs | — | — | — | — | 1,414 | | | | | | | | | | | | | | | | | | | |
| Lease intangible amortization | (2,348) | | (10) | | 129 | | 175 | | 261 | | | | | | | | | | | | | | | | | | | | |
| Non-routine legal costs/forfeited earnest money received | 306 | | 306 | | 465 | | — | | (100) | | | | | | | | | | | | | | | | | | | | |
| Debt financing costs | 237 | — | — | — | — | | | | | | | | | | | | | | | | | | | |
| Restructuring and severance-related charges | 22,991 | 6,861 | — | — | 1,445 | | | | | | | | | | | | | | | | | | | |
Credit losses and gains (losses) on other assets, net 5 | 4,582 | 46,600 | 8,525 | — | — | | | | | | | | | | | | | | | | | | | |
| Impairment of goodwill | — | — | — | 250,530 | — | | | | | | | | | | | | | | | | | | | |
| Merger-related fair value adjustment | 10,314 | 10,184 | 10,064 | 10,105 | 10,800 | | | | | | | | | | | | | | | | | | | |
Unconsolidated JV normalizing items 6 | 113 | 101 | 89 | 87 | 89 | | | | | | | | | | | | | | | | | | | |
| Normalized FFO adjustments | $37,772 | $64,761 | $19,703 | $261,292 | $14,210 | | | | | | | | | | | | | | | | | | | |
| Normalized FFO adjustments per common share - diluted | $0.11 | $0.18 | $0.05 | $0.68 | $0.04 | | | | | | | | | | | | | | | | | | | |
Normalized FFO | $143,414 | $142,049 | $143,500 | $147,822 | $150,730 | | | | | | | | | | | | | | | | | | | |
| Normalized FFO per common share - diluted | $0.40 | $0.39 | $0.38 | $0.39 | $0.39 | | | | | | | | | | | | | | | | | | | |
| | | | | | | | | | | | | | | | | | | | | | | | |
| Non-real estate depreciation and amortization | 404 | 276 | 313 | 485 | 685 | | | | | | | | | | | | | | | | | | | |
Non-cash interest amortization, net 7 | 1,239 | 1,319 | 1,267 | 1,277 | 1,265 | | | | | | | | | | | | | | | | | | | |
Rent reserves, net 8 | (369) | (27) | 1,261 | (151) | 1,404 | | | | | | | | | | | | | | | | | | | |
| Straight-line rent income, net | (7,051) | (5,771) | (6,799) | (7,633) | (7,872) | | | | | | | | | | | | | | | | | | | |
| Stock-based compensation | 3,028 | 4,064 | 3,383 | 3,562 | 3,566 | | | | | | | | | | | | | | | | | | | |
Unconsolidated JV non-cash items 9 | (277) | (376) | (148) | (122) | (206) | | | | | | | | | | | | | | | | | | | |
Normalized FFO adjusted for non-cash items | 140,388 | 141,534 | 142,777 | 145,240 | 149,572 | | | | | | | | | | | | | | | | | | | |
| 2nd generation TI | (20,003) | (16,951) | (12,287) | (20,204) | (18,715) | | | | | | | | | | | | | | | | | | | |
| Leasing commissions paid | (11,957) | (10,266) | (10,012) | (15,215) | (14,978) | | | | | | | | | | | | | | | | | | | |
| Building capital | (8,347) | (7,389) | (12,835) | (5,363) | (17,393) | | | | | | | | | | | | | | | | | | | |
| Total maintenance capex | (40,307) | (34,606) | (35,134) | (40,782) | (51,086) | | | | | | | | | | | | | | | | | | | |
| FAD | $100,081 | $106,928 | $107,643 | $104,458 | $98,486 | | | | | | | | | | | | | | | | | | | |
| Quarterly dividends and OP distributions | $110,808 | $113,770 | $118,627 | $119,541 | $118,897 | | | | | | | | | | | | | | | | | | | |
FFO wtd avg common shares outstanding - diluted 10 | 355,874 | 363,370 | 376,556 | 383,413 | 383,326 | | | | | | | | | | | | | | | | | | | |
1Funds from operations (“FFO”) and FFO per share are operating performance measures adopted by NAREIT. NAREIT defines FFO as “net income (computed in accordance with GAAP) excluding depreciation and amortization related to real estate, gains and losses from the sale of certain real estate assets, gains and losses from change in control, and impairment write-downs of certain real assets and investments in entities when the impairment is directly attributable to decreases in the value of depreciable real estate held by the entity.”
2FFO, Normalized FFO and Funds Available for Distribution ("FAD") do not represent cash generated from operating activities determined in accordance with GAAP and are not necessarily indicative of cash available to fund cash needs. FFO, Normalized FFO and FAD should not be considered alternatives to net income attributable to common stockholders as indicators of the Company's operating performance or as alternatives to cash flow as measures of liquidity.
3Potential common shares are not included in the computation of diluted earnings per share when a loss exists, as the effect would be an antidilutive per share amount.
4For 1Q 2024, basic weighted average common shares outstanding was the denominator used in the per share calculation.
54Q 2024 includes $1.6 million of credit loss reserves, net of recoveries and a $4.1 million loss on other assets. These amounts were partially offset by a $1.1 million recovery of prior-period Steward Health straight-line rent for leases assumed. 3Q 2024 includes $46.8 million of credit loss reserves and $0.2 million gain on other assets. 2Q 2024 includes $11.2 million of credit loss reserves and $2.2 million write-off of prior period Steward Health straight-line rent, offset by $4.9 million gain on other assets.
6Includes the Company's proportionate share of normalizing items related to unconsolidated joint ventures such as lease intangibles and acquisition and pursuit costs.
7Includes the amortization of deferred financing costs, discounts and premiums, and non-cash financing receivable amortization.
82Q 2024 includes $0.8 million related to the Steward Health revenue reserve for March.
9Includes the Company's proportionate share of straight-line rent, net and rent reserves, net related to unconsolidated joint ventures.
10The Company utilizes the treasury stock method, which includes the dilutive effect of nonvested share-based awards outstanding of 691,557 for the three months ended December 31, 2024. Also includes the diluted impact of 3,622,036 OP units outstanding.
| | | | | |
| |
HEALTHCARE REALTY | 4Q 2024 SUPPLEMENTAL INFORMATION 11 |
| | |
| Capital Funding & Commitments |
| DOLLARS IN THOUSANDS, EXCEPT PER SHARE DATA |
|
| | | | | | | | | | | | | | | | | | | | | | | | | | | | | | | | |
| ACQUISITION AND RE/DEVELOPMENT FUNDING | | | | | | | |
| 4Q 2024 | 3Q 2024 | 2Q 2024 | 1Q 2024 | 4Q 2023 | | | | | | | | | | | | | | | |
Acquisitions 1 | $— | $— | $— | $— | $— | | | | | | | | | | | | | | | |
Re/development 2 | 39,611 | 44,590 | 44,796 | 21,580 | 32,272 | | | | | | | | | | | | | | | |
1st generation TI & acquisition capex 3 | 14,794 | 15,677 | 13,010 | 12,421 | 7,632 | | | | | | | | | | | | | | | |
| | | | | | | | | | | | | | | | | | | | |
| MAINTENANCE CAPITAL EXPENDITURES FUNDING | |
| 4Q 2024 | 3Q 2024 | 2Q 2024 | 1Q 2024 | 4Q 2023 | | | | | | | | | | | | | | | |
| | | | | | | | | | | | | | | | | | | | |
| 2nd generation TI | $20,003 | $16,951 | $12,287 | $20,204 | $18,715 | | | | | | | | | | | | | | | |
| Leasing commissions paid | 11,957 | 10,266 | 10,012 | 15,215 | 14,978 | | | | | | | | | | | | | | | |
| Building capital | 8,347 | 7,389 | 12,835 | 5,363 | 17,393 | | | | | | | | | | | | | | | |
| $40,307 | $34,606 | $35,134 | $40,782 | $51,086 | | | | | | | | | | | | | | | |
| % of Cash NOI | | | | | | | |
| 2nd generation TI | 10.6 | % | 8.8 | % | 6.2 | % | 10.1 | % | 9.2 | % | | | | | | | | | | | | | | | |
| Leasing commissions paid | 6.3 | % | 5.3 | % | 5.0 | % | 7.6 | % | 7.3 | % | | | | | | | | | | | | | | | |
| Building capital | 4.4 | % | 3.8 | % | 6.5 | % | 2.7 | % | 8.5 | % | | | | | | | | | | | | | | | |
| 21.3 | % | 17.9 | % | 17.7 | % | 20.4 | % | 25.0 | % | | | | | | | | | | | | | | | |
| | | | | | | | | | | | | | | | | | | | |
LEASING COMMITMENTS 4 | |
| 4Q 2024 | 3Q 2024 | 2Q 2024 | 1Q 2024 | 4Q 2023 | | | | | | | | | | | | | | | |
| Renewals | | | | | | | | | | | | | | | | | | | | |
| Square feet | 783,975 | 909,844 | 788,862 | 1,454,998 | 582,239 | | | | | | | | | | | | | | | |
| 2nd generation TI/square foot/lease year | $2.20 | $1.91 | $1.81 | $2.39 | $1.89 | | | | | | | | | | | | | | | |
| Leasing commissions/square foot/lease year | $1.48 | $1.36 | $1.33 | $0.90 | $1.66 | | | | | | | | | | | | | | | |
| Renewal commitments as a % of annual net rent | 14.1 | % | 12.2 | % | 13.6 | % | 13.8 | % | 12.7 | % | | | | | | | | | | | | | | | |
WALT (in months) 5 | 59.7 | 50.3 | 52.3 | 60.5 | 43.1 | | | | | | | | | | | | | | | |
| | | | | | | | | | | | | | | | | | | | |
| New leases | | | | | | | | | | | | | | | | | | | | |
| Square feet | 299,950 | 462,756 | 252,795 | 337,357 | 315,243 | | | | | | | | | | | | | | | |
| 2nd generation TI/square foot/lease year | $7.30 | $7.18 | $6.90 | $7.32 | $5.98 | | | | | | | | | | | | | | | |
| Leasing commissions/square foot/lease year | $1.82 | $1.91 | $1.98 | $1.68 | $1.72 | | | | | | | | | | | | | | | |
| New lease commitments as a % of annual net rent | 40.7 | % | 39.9 | % | 43.3 | % | 42.8 | % | 33.4 | % | | | | | | | | | | | | | | | |
WALT (in months) 5 | 78.3 | 94.7 | 82.6 | 92.8 | 90.2 | | | | | | | | | | | | | | | |
| | | | | | | | | | | | | | | | | | | | |
| All | | | | | | | | | | | | | | | | | | | | |
| Square feet | 1,083,925 | 1,372,600 | 1,041,657 | 1,792,355 | 897,482 | | | | | | | | | | | | | | | |
| | | | | | | | | | | | | | | | | | | | |
| | | | | | | | | | | | | | | | | | | | |
| Leasing commitments as a % of annual net rent | 21.9 | % | 24.0 | % | 22.6 | % | 20.5 | % | 21.9 | % | | | | | | | | | | | | | | | |
WALT (in months) 5 | 64.8 | 65.3 | 59.6 | 66.6 | 59.6 | | | | | | | | | | | | | | | |
| | | | | | | | | | | | | | | | | | | | |
| | | | | | | | | | | | | | | | | | | | |
1Acquisitions include properties acquired through joint ventures at the Company's ownership percentage.
2Re/development funding includes capital spend on re/developments, development completions and unstabilized properties.
3Acquisition capex includes near-term fundings underwritten as part of recent acquisitions. 1st generation tenant improvements for re/developments are excluded.
4Reflects leases commencing in the quarter. Excludes recently acquired or disposed properties, development completions, construction in progress, land held for development, corporate property, redevelopment properties, unstabilized properties, planned dispositions and assets classified as held for sale.
5WALT = weighted average lease term.
| | | | | |
| |
HEALTHCARE REALTY | 4Q 2024 SUPPLEMENTAL INFORMATION 12 |
| | |
Debt Metrics1 |
| DOLLARS IN THOUSANDS |
|
| | | | | | | | | | | | | | | | | | | | | | | | | | | | | |
| SUMMARY OF INDEBTEDNESS AS OF DECEMBER 31, 2024 | |
| PRINCIPAL BALANCE | BALANCE 1 | MATURITY DATE 2 | MONTHS TO MATURITY 2 | 4Q 2024 INTEREST EXPENSE | CONTRACTUAL INTEREST EXPENSE | CONTRACTUAL RATE | EFFECTIVE RATE | FAIR VALUE MERGER ADJUSTED |
| SENIOR NOTES | $250,000 | $249,868 | 5/1/2025 | 4 | | $2,470 | $2,422 | 3.88 | % | 4.12 | % | |
| 600,000 | 586,824 | 8/1/2026 | 19 | | 7,238 | 5,251 | 3.50 | % | 4.94 | % | Y |
| 500,000 | 488,104 | 7/1/2027 | 30 | | 5,801 | 4,687 | 3.75 | % | 4.76 | % | Y |
| 300,000 | 298,029 | 1/15/2028 | 37 | | 2,786 | 2,719 | 3.63 | % | 3.85 | % | |
| 650,000 | 586,028 | 2/15/2030 | 62 | | 7,737 | 5,037 | 3.10 | % | 5.30 | % | Y |
| 299,500 | 297,190 | 3/15/2030 | 63 | | 1,928 | 1,797 | 2.40 | % | 2.72 | % | |
| 299,785 | 296,343 | 3/15/2031 | 75 | | 1,593 | 1,536 | 2.05 | % | 2.25 | % | |
| 800,000 | 667,233 | 3/15/2031 | 75 | | 8,513 | 4,000 | 2.00 | % | 5.13 | % | Y |
| $3,699,285 | $3,469,619 | | 47 | | $38,066 | $27,449 | 2.97 | % | 4.44 | % | |
| TERM LOANS | $200,000 | $199,896 | 5/31/2026 | 17 | | 2,929 | 2,929 | SOFR + 1.04% | 5.59 | % | |
| 150,000 | 149,790 | 6/1/2026 | 17 | | 2,197 | 2,197 | SOFR + 1.04% | 5.59 | % | |
| 300,000 | 299,981 | 10/31/2026 | 22 | | 4,394 | 4,394 | SOFR + 1.04% | 5.59 | % | |
| 200,000 | 199,641 | 7/20/2027 | 30 | | 2,929 | 2,929 | SOFR + 1.04% | 5.59 | % | |
| 300,000 | 298,708 | 1/20/2028 | 36 | | 4,394 | 4,394 | SOFR + 1.04% | 5.59 | % | |
| $1,150,000 | $1,148,016 | | 26 | | $16,843 | $16,843 | | 5.59 | % | |
| $1.5B CREDIT FACILITY | — | | — | | 10/31/2027 | 34 | | $2,904 | $2,904 | SOFR + 0.94% | 5.30 | % | |
| | | | | | | | | |
| MORTGAGES | $45,279 | $45,136 | various | 16 | | $449 | $460 | 4.04 | % | 4.17 | % | |
| $4,894,564 | $4,662,771 | | 42 | $58,262 | $47,656 | 3.59 | % | 4.72 | % | $2,550,000 |
| Less cash | (68,916) | | | | | | | | | |
| Net debt | $4,825,648 | | | | | | | | |
| Interest on term loan fully repaid in October 2024 | $391 | $391 | | | |
| Interest rate swaps | (2,135) | (2,135) | | | |
| Interest cost capitalization | (1,083) | — | | | |
| Unsecured credit facility fee & deferred financing costs | 1,918 | 767 | | | |
| | | | | |
| Financing right-of-use asset amortization | 912 | — | | | |
| | | | | $58,265 | $46,679 | | | |
| | | | | | | | | | | | | | | | | | | | | |
DEBT MATURITIES SCHEDULE AS OF DECEMBER 31, 2024 |
| | PRINCIPAL PAYMENTS | | |
| | BANK
LOANS | SENIOR NOTES | MORTGAGE NOTES | TOTAL | | WA RATE |
| 2025 | | $0 | $250,000 | $16,375 | $266,375 | | 3.90 | % |
| 2026 | | 650,000 | 600,000 | 28,904 | 1,278,904 | | 4.57 | % |
| 2027 | | 200,000 | 500,000 | — | | 700,000 | | 4.28 | % |
| 2028 | | 300,000 | 300,000 | — | | 600,000 | | 4.61 | % |
| 2029 | | — | | — | | — | | — | | — | % |
| Thereafter | | — | | 2,049,285 | — | | 2,049,285 | | 2.41 | % |
| Total | | $1,150,000 | $3,699,285 | $45,279 | $4,894,564 | | 3.59 | % |
Net debt | | | | | $4,825,648 | | |
Fixed rate debt balance | | $1,075,000 | $3,699,285 | $45,279 | $4,819,564 | | |
% fixed rate debt, net of cash | | 99.9 | % | | |
Company share of JV net debt | | $31,455 | | | |
| | | | | | | |
| | | | | | | |
| | | | | | | | |
| INTEREST RATE SWAPS |
| MATURITY | AMOUNT | FIXED SOFR RATE |
| May 2026 | $275,000 | 3.74 | % |
| June 2026 | 150,000 | | 3.83 | % |
| December 2026 | 150,000 | | 3.84 | % |
| June 2027 | 200,000 | | 4.27 | % |
| December 2027 | 300,000 | | 3.93 | % |
| As of 12/31/2024 | $1,075,000 | 3.92 | % |
| | |
| | |
| | |
| | |
| | |
1Balances are reflected net of discounts, fair value adjustments, and deferred financing costs and include premiums.
2Includes extension options.
| | | | | |
| |
HEALTHCARE REALTY | 4Q 2024 SUPPLEMENTAL INFORMATION 13 |
| | |
| Debt Covenants & Liquidity |
| DOLLARS IN THOUSANDS |
|
| | | | | | | | | | | |
SELECTED FINANCIAL DEBT COVENANTS YEAR ENDED DECEMBER 31, 2024 1 | |
| CALCULATION | REQUIREMENT | PER DEBT COVENANTS |
| Revolving credit facility and term loan | | |
| Leverage ratio | Total debt/total capital | Not greater than 60% | 38.8 | % |
| Secured leverage ratio | Total secured debt/total capital | Not greater than 30% | 0.4 | % |
| Unencumbered leverage ratio | Unsecured debt/unsecured real estate | Not greater than 60% | 42.2 | % |
| Fixed charge coverage ratio | EBITDA/fixed charges | Not less than 1.50x | 2.8x |
| Unsecured coverage ratio | Unsecured EBITDA/unsecured interest | Not less than 1.75x | 2.9x |
| Asset investments | Unimproved land, JVs & mortgages/total assets | Not greater than 35% | 10.5 | % |
| | | |
| Senior Notes | | | |
| Incurrence of total debt | Total debt/total assets | Not greater than 60% | 38.0 | % |
| Incurrence of debt secured by any lien | Secured debt/total assets | Not greater than 40% | 0.4 | % |
| Maintenance of total unsecured assets | Unencumbered assets/unsecured debt | Not less than 150% | 252.6 | % |
| Debt service coverage | EBITDA/interest expense | Not less than 1.5x | 2.9x |
| | | |
| Other | | | |
Net debt to adjusted EBITDA 2 | Net debt (debt less cash)/adjusted EBITDA | Not required | 6.4x |
Net debt to enterprise value 3 | Net debt/enterprise value | Not required | 44.6 | % |
| | | | | |
| LIQUIDITY SOURCES |
| |
| Cash | $68,916 |
| Unsecured credit facility availability | 1,500,000 |
Consolidated unencumbered assets (gross) 4 | 11,688,475 |
1Does not include all financial and non-financial covenants and restrictions that are required by the Company's various debt agreements. Financial measures include the Company's proportionate share of unconsolidated joint ventures, as applicable.
2Net debt includes the Company's share of unconsolidated JV net debt. See page 27 for a reconciliation of adjusted EBITDA.
3Based on the closing price of $16.95 on December 31, 2024 and 354,147,499 shares outstanding including outstanding OP units.
4Annualized fourth quarter 2024 unencumbered asset NOI was $720.0 million.
| | | | | |
| |
HEALTHCARE REALTY | 4Q 2024 SUPPLEMENTAL INFORMATION 14 |
| | |
| JV & Disposition Activity |
| DOLLARS IN THOUSANDS |
|
| | | | | | | | | | | | | | | | | | | | | | | | | | | |
| JV AND DISPOSITION ACTIVITY | | | |
| LOCATION | COUNT | TYPE | CLOSING | SQUARE FEET | LEASED % | SALE
PRICE | PROCEEDS | % OWNERSHIP RETAINED | |
| Joint Ventures | | | | | | | | | |
KKR JV 1 | 10 | MOB | 5/23/2024 | 556,274 | 99 | % | $284,348 | $227,478 | 20 | % | |
KKR JV 1 | 1 | MOB | 6/6/2024 | 129,879 | 100 | % | 54,858 | 43,886 | 20 | % | |
KKR JV 1 | 4 | MOB | 8/23/2024 | 266,782 | 93 | % | 118,000 | 94,400 | 20 | % | |
Nuveen JV 2 | 7 | MOB | 8/27/2024 | 473,003 | 89 | % | 177,250 | 156,180 | 20 | % | |
KKR JV 1 | 8 | MOB | 12/18/2024 | 766,622 | 92 | % | 310,250 | 248,200 | 20 | % | |
| | | | | | | | | |
| Total 2024 joint venture activity | 30 | | | 2,192,560 | 94 | % | $944,706 | $770,144 | | |
| | | | | | | | | |
| Dispositions | | | | | | | | | |
| Albany, NY | 1 | MOB | 4/1/2024 | 14,800 | — | % | $725 | $725 | — | | |
| San Angelo, TX | 1 | MOB | 4/12/2024 | 24,580 | 100 | % | 5,085 | 5,085 | — | | |
| Houston, TX | 1 | MOB | 5/20/2024 | 37,040 | 5 | % | 250 | 250 | — | | |
| Denver, CO | 1 | MOB | 5/30/2024 | 37,130 | 100 | % | 19,000 | 19,000 | — | | |
| Minneapolis, MN | 1 | MOB | 6/21/2024 | 50,291 | 23 | % | 1,082 | 1,082 | — | | |
Greensboro/Raleigh, NC 3 | 9 | MOB | 6/28/2024 | 309,424 | 97 | % | 99,518 | 99,518 | — | | |
| Albany, NY | 1 | OFFICE | 8/2/2024 | 180,000 | 100 | % | 6,300 | 6,300 | — | | |
| Charlotte, NC | 1 | MOB | 8/6/2024 | 90,633 | 100 | % | 26,670 | 26,670 | — | | |
| Charleston, SC | 1 | MOB | 8/13/2024 | 46,711 | 46 | % | 14,500 | 14,500 | — | | |
| Austin, TX | 1 | MOB | 9/13/2024 | 76,246 | 100 | % | 42,281 | 42,281 | — | | |
| Raleigh, NC | 1 | MOB | 9/26/2024 | 5,934 | 100 | % | 1,813 | 1,813 | — | | |
Houston, TX 4 | 1 | MOB | 10/3/2024 | 140,012 | 66 | % | 12,000 | 2,400 | — | | |
| Greensboro, NC | 1 | MOB | 10/9/2024 | 35,373 | 100 | % | 12,514 | 12,514 | — | | |
| Des Moines, IA | 1 | MOB | 10/15/2024 | 95,486 | 94 | % | 31,750 | 31,750 | — | | |
| Albany, NY | 1 | MOB | 10/15/2024 | 80,676 | 72 | % | 9,500 | 9,500 | — | | |
Salt Lake City, UT 5 | 1 | MOB | 10/24/2024 | 112,192 | 72 | % | 30,712 | 25,400 | — | | |
| Miami, FL | 1 | MOB | 10/25/2024 | 102,186 | 96 | % | 36,789 | 36,789 | — | | |
| Miami, FL | 2 | MOB | 10/25/2024 | 60,761 | 92 | % | 17,767 | 17,767 | — | | |
| Cleveland, OH | 1 | MOB | 12/10/2024 | 31,152 | 58 | % | 1,000 | 1,000 | — | | |
| Boise, ID | 3 | MOB | 12/12/2024 | 83,078 | 95 | % | 18,350 | 18,350 | — | | |
| Atlanta, GA | 1 | MOB | 12/20/2024 | 42,921 | 100 | % | 15,900 | 15,900 | — | | |
| Los Angeles, CA | 3 | MOB | 12/20/2024 | 162,554 | 94 | % | 64,000 | 64,000 | — | | |
| Tampa, FL | 1 | MOB | 12/27/2024 | 95,896 | 100 | % | 37,500 | 37,500 | — | | |
| Wichita Falls, TX | 1 | MOB | 12/27/2024 | 25,133 | 100 | % | 600 | 600 | — | | |
| | | | | | | | | |
| Total 2024 disposition activity | 37 | | | 1,940,209 | 86 | % | $505,606 | $490,694 | | |
| | | | | | | | | |
| Total 2024 JV and disposition activity | 67 | | | 4,132,769 | 89 | % | $1,450,312 | $1,260,838 | | |
Average cap rate 6 | | | | | 6.6 | % | | | |
| | | | | | | | | |
| Subsequent Disposition Activity | | | | | | | | | |
| Boston, MA | 1 | MOB | 2/7/2025 | 30,304 | 41 | % | 4,500 | 4,500 | — | | |
| Denver, CO | 2 | MOB | 2/14/2025 | 69,715 | 54 | % | 8,600 | 8,600 | — | | |
1The Company sold the following MOBs into a joint venture, retaining 20% ownership: one in each of Raleigh, NC, New York, NY, Philadelphia, PA, Atlanta, GA, Austin, TX, Miami, FL, Denver, CO, Memphis, TN, Indianapolis, IN, and Honolulu, HI; two MOBs in Los Angeles; three MOBs in Houston, TX and Dallas, TX; and five in Seattle, WA.
2The Company sold the following MOBs into a joint venture, retaining 20% ownership: one in each of Dallas, TX, San Antonio, TX and Atlanta, GA; and two MOBs in each of Nashville, TN and Denver, CO. The joint venture obtained secured financing equal to approximately 40% of the contribution value. The proceeds are net of the Company's share of the secured financing.
3The Company sold seven MOBs in Greensboro, NC and two non-clustered single-tenant MOBs in Raleigh, NC to a single buyer in a single transaction.
4The Company provided seller financing of approximately $9.6 million in connection with this sale.
5The Company sold an MOB that was included in a consolidated joint venture in which the Company held a 63% ownership interest. Proceeds include the Company's pro-rata share of the purchase price as well as amounts due to the Company by the joint venture.
6Cap rate represents the in-place cash NOI divided by sales price.
| | | | | |
| |
HEALTHCARE REALTY | 4Q 2024 SUPPLEMENTAL INFORMATION 15 |
| | |
Joint Ventures 1 |
| DOLLARS IN THOUSANDS |
|
| | | | | | | | | | | | | | | | | | | | | | | | |
| PORTFOLIOS | | | | |
| | WA OWNERSHIP INTEREST | | | 4Q 2024 |
| JOINT VENTURE | | # OF PROPERTIES | SQUARE FEET | OCCUPANCY | NOI | NOI AT SHARE | SAME STORE NOI AT SHARE |
| Nuveen | | 40 | % | 28 | 1,526,776 | | 86 | % | $8,163 | $3,145 | $2,520 |
| CBRE | | 20 | % | 4 | 283,880 | | 58 | % | 1,066 | 213 | 190 |
| KKR | | 20 | % | 23 | 1,719,557 | | 96 | % | 9,083 | 1,817 | — |
Other 2 | | 57 | % | 10 | 723,632 | | 82 | % | 4,321 | 2,020 | 1,710 |
| Total | | | 65 | 4,253,845 | | 87 | % | $22,633 | $7,195 | $4,420 |
| | | | | | | | |
| | | | | | | | | | | | | | | | |
| BALANCE SHEET |
| JOINT VENTURE | | | REAL ESTATE INVESTMENT 3 | DEBT 3 | DEBT AT SHARE | INTEREST RATE |
| Nuveen | | | $600,089 | $71,900 | $14,380 | 5.9 | % |
| CBRE | | | 132,850 | | — | | — | | — | |
| KKR | | | 734,378 | | — | | — | | — | |
Other 2 | | | 335,050 | | 69,100 | | 27,640 | 5.3 | % |
| Total | | | $1,802,367 | $141,000 | $42,020 | 5.6 | % |
| Net debt at JV share | | $31,455 | |
1Excludes completed dispositions, assets held for sale and construction in progress.
2Ownership percentages are weighted based on investment.
3Represents 100% of the real estate assets and debt of the joint ventures.
| | | | | |
| |
HEALTHCARE REALTY | 4Q 2024 SUPPLEMENTAL INFORMATION 16 |
| | |
| Re/development Activity |
| DOLLARS IN THOUSANDS |
|
| | | | | | | | | | | | | | | | | | | | | | |
| RE/DEVELOPMENT PROJECTS | | |
| MARKET | ASSOCIATED HEALTH SYSTEM | | SQUARE
FEET | CURRENT LEASED % | BUDGET | COST TO COMPLETE | | ESTIMATED COMPLETION/INITIAL LEASE COMMENCEMENT |
| Recently completed development | | | | | | | |
| Raleigh, NC | UNC REX Health | | 122,991 | 41 | % | $52,600 | $7,606 | | 4Q 2024 |
| Phoenix, AZ | HonorHealth | | 101,086 | 89 | % | 58,000 | 3,050 | | 4Q 2024 |
| Active development | | | | | | | |
| Fort Worth, TX | Baylor Scott & White | | 101,000 | 54 | % | 48,200 | 18,124 | | 4Q 2025 |
| Total development | | 325,077 | 60 | % | $158,800 | $28,780 | | |
| Projected stabilized yield - 7.0%-8.5% | | | |
| Estimated stabilization period post completion - 12 - 36 months | | | |
| | | | | | | | |
| Active redevelopment | | | | | | | |
| Washington, DC | Inova Health | | 259,290 | 88 | % | $17,557 | $1,704 | | 4Q 2024 |
| Charlotte, NC | Novant Health | | 169,135 | 94 | % | 18,700 | 1,291 | | 2Q 2025 |
| Washington, DC | Inova Health | | 57,323 | 87 | % | 10,078 | 1,083 | | 4Q 2025 |
| White Plains, NY | Montefiore Einstein/White Plains | | 65,851 | 89 | % | 19,400 | 14,799 | | 4Q 2025 |
| Raleigh, NC | UNC REX Health | | 40,400 | 100 | % | 10,800 | 10,032 | | 1Q 2026 |
| Houston, TX | HCA | | 314,861 | 67 | % | 30,000 | 16,439 | | 2Q 2026 |
| Total redevelopment | | 906,860 | 83 | % | $106,535 | $45,348 | | |
| Occupied % | | | | 69 | % | | | | |
| Projected stabilized yield - 9.0%-12.0% | | | |
| Estimated stabilization period post completion - 12 - 36 months | | | |
| | | | | | | | |
| Total active re/development projects | 1,231,937 | 77 | % | $265,335 | $74,128 | | |
| | | | | | | | |
| | | | | | | | |
| | | | | | | | |
| | | | | | | | |
| | | | | | | | |
| | | | | | | | |
| | | | | | | | |
| | | | | |
| |
HEALTHCARE REALTY | 4Q 2024 SUPPLEMENTAL INFORMATION 17 |
| | |
Portfolio 1,2 |
| DOLLARS IN THOUSANDS |
|
| | | | | | | | | | | | | | | | | | | | | | | | | | | | | | | | | | | | | | | | | |
| MARKETS | | | | |
| | COUNT | | SQUARE FEET | WHOLLY OWNED |
| | | | | | | | | |
| MARKET | MSA RANK | | MOB | | INPATIENT | OFFICE | | WHOLLY OWNED | JOINT VENTURES | TOTAL | % OF NOI | CUMULATIVE % OF NOI |
| Dallas, TX | 4 | 50 | | 2,875,468 | | 146,519 | 199,800 | | 3,221,787 | 581,096 | 3,802,883 | 9.0 | % | 9.0 | % |
| Seattle, WA | 15 | 29 | | 1,335,380 | | | | | 1,335,380 | 257,121 | 1,592,501 | 5.9 | % | 14.9 | % |
| Charlotte, NC | 23 | 31 | | 1,702,275 | | | | | 1,702,275 | | 1,702,275 | 4.9 | % | 19.8 | % |
| Houston, TX | 5 | 29 | | 1,924,925 | | 67,500 | | | 1,992,425 | 249,158 | 2,241,583 | 4.5 | % | 24.3 | % |
| Denver, CO | 19 | 31 | | 1,483,641 | | | | | 1,483,641 | 306,949 | 1,790,590 | 4.1 | % | 28.4 | % |
| Atlanta, GA | 8 | 26 | | 1,284,112 | | | | | 1,284,112 | 96,108 | 1,380,220 | 3.8 | % | 32.2 | % |
| Boston, MA | 11 | 16 | | 776,106 | | | | | 776,106 | | 776,106 | 3.7 | % | 35.9 | % |
| Los Angeles, CA | 2 | 27 | | 787,715 | | 63,000 | | | 850,715 | 786,520 | 1,637,235 | 3.5 | % | 39.4 | % |
| Phoenix, AZ | 10 | 36 | | 1,512,304 | | | | | 1,512,304 | 101,086 | 1,613,390 | 3.3 | % | 42.7 | % |
| Raleigh, NC | 41 | 27 | | 980,469 | | | | | 980,469 | 198,485 | 1,178,954 | 2.9 | % | 45.6 | % |
| Nashville, TN | 35 | 13 | | 1,134,891 | | | 108,691 | | 1,243,582 | 106,981 | 1,350,563 | 2.8 | % | 48.4 | % |
| Miami, FL | 9 | 15 | | 981,406 | | | | | 981,406 | 52,178 | 1,033,584 | 2.8 | % | 51.2 | % |
| Tampa, FL | 18 | 18 | | 876,079 | | | | | 876,079 | | 876,079 | 2.7 | % | 53.9 | % |
| Indianapolis, IN | 33 | 41 | | 1,078,519 | | 61,398 | | | 1,139,917 | 357,915 | 1,497,832 | 2.7 | % | 56.6 | % |
| New York, NY | 1 | 15 | | 647,004 | | | | | 647,004 | 57,411 | 704,415 | 2.1 | % | 58.7 | % |
| Austin, TX | 27 | 12 | | 657,575 | | | | | 657,575 | 129,879 | 787,454 | 2.1 | % | 60.8 | % |
| Washington, DC | 6 | 9 | | 692,107 | | | | | 692,107 | | 692,107 | 2.1 | % | 62.9 | % |
| Chicago, IL | 3 | 6 | | 607,845 | | | | | 607,845 | | 607,845 | 2.1 | % | 65.0 | % |
| San Francisco, CA | 13 | 9 | | 452,666 | | | | | 452,666 | 110,865 | 563,531 | 2.1 | % | 67.1 | % |
| Orlando, FL | 22 | 7 | | 359,477 | | 56,998 | | | 416,475 | | 416,475 | 1.9 | % | 69.0 | % |
| Other (45 Market) | 204 | | 9,750,704 | | 538,392 | 1,048,363 | | 11,337,459 | 862,093 | 12,199,552 | 31.0 | % | 100.0 | % |
| Total | | 651 | | 31,900,668 | | 933,807 | 1,356,854 | | 34,191,329 | 4,253,845 | 38,445,174 | 100.0 | % | |
| Number of properties | | | 565 | | 15 | 6 | | 586 | 65 | 651 | | |
| % of square feet | | | | 93.3 | % | | 2.7 | % | 4.0 | % | | 100.0 | % | | | | |
| % multi-tenant | | | | 86.3 | % | | — | % | 77.2 | % | | 83.6 | % | | | | |
Investment | | | | $10,675,361 | | $438,074 | $422,211 | | $11,535,646 | | | | |
Quarterly cash NOI 2 | | | $161,715 | | $8,307 | $5,524 | | $175,546 | | | | |
| % of cash NOI | | | | 92.2 | % | | 4.7 | % | 3.1 | % | | 100.0 | % | | | | |
| | | | | | | | | | | | | | | | | | |
| BY OWNERSHIP AND TENANT TYPE |
| WHOLLY OWNED | JOINT VENTURES | |
| MULTI-TENANT | SINGLE-TENANT | | MULTI-TENANT | SINGLE-TENANT | TOTAL |
| Number of properties | 476 | 110 | | 50 | 15 | 651 |
| Square feet | 28,583,286 | 5,608,043 | | 3,554,671 | 699,174 | 38,445,174 |
| % of square feet | 74.4 | % | 14.6 | % | | 9.2 | % | 1.8 | % | 100.0 | % |
Investment 2 | $9,150,489 | $2,385,157 | | $456,411 | $100,487 | $12,092,543 |
Quarterly cash NOI 2 | $137,349 | $38,197 | | $5,630 | $1,565 | $182,741 |
| % of cash NOI | 75.1 | % | 20.9 | % | | 3.1 | % | 0.9 | % | 100.0 | % |
1Gross investment and quarterly cash NOI are reflected at the Company's ownership percentage. Lease and building level related metrics such as building square feet and occupancy are reflected at 100% of the buildings.
2Excludes assets held for sale, land held for development, construction in progress and corporate property.
| | | | | |
| |
HEALTHCARE REALTY | 4Q 2024 SUPPLEMENTAL INFORMATION 18 |
| | | | | | | | | | | | | | | | | | | | | | | | | | | | | | | | |
| MOB PORTFOLIO | | |
| | | BUILDING SQUARE FEET | # OF BLDGS | | LEASED BY HEALTH SYSTEM | % OF LEASED SF | # OF LEASES |
| | | | | | |
| HEALTH SYSTEM | SYSTEM RANK 3 | CREDIT RATING | ON/ADJACENT 4 | OFF-CAMPUS AFFILIATED 5 | TOTAL | % OF NOI |
| HCA | 1 | BBB-/Baa3 | 2,136,592 | 770,430 | 2,907,022 | | 43 | 7.2 | % | 813,257 | 2.6 | % | 134 |
| CommonSpirit | 4 | A-/A3 | 1,801,813 | 564,790 | 2,366,603 | | 43 | 6.5 | % | 737,002 | 2.3 | % | 141 |
| Baylor Scott & White | 21 | AA-/Aa3 | 2,493,934 | 66,376 | 2,560,310 | | 28 | 6.5 | % | 1,201,110 | 3.8 | % | 196 |
| Ascension Health | 3 | AA/Aa2 | 2,262,563 | 97,551 | 2,360,114 | | 25 | 5.7 | % | 960,277 | 3.1 | % | 149 |
| Advocate Health | 14 | AA/Aa3 | 898,199 | 388,316 | 1,286,515 | | 20 | 4.5 | % | 1,069,872 | 3.4 | % | 99 |
| Tenet Healthcare Corporation | 6 | B+/Ba3 | 1,024,007 | 277,447 | 1,301,454 | | 22 | 2.9 | % | 330,699 | 1.1 | % | 61 |
| Wellstar Health System | 75 | A+/A2 | 919,861 | — | | 919,861 | | 18 | 2.8 | % | 602,555 | 1.9 | % | 81 |
| UW Medicine (Seattle) | 91 | AA+/Aaa | 461,363 | 169,709 | 631,072 | | 10 | 2.7 | % | 294,971 | 0.9 | % | 32 |
| Providence Health & Services | 5 | A/A2 | 614,167 | 31,601 | | 645,768 | | 12 | 2.5 | % | 238,370 | 0.8 | % | 48 |
| AdventHealth | 11 | AA/Aa2 | 662,742 | 118,585 | | 781,327 | | 12 | 2.4 | % | 288,633 | 0.9 | % | 72 |
| Community Health Systems | 8 | CCC+/Caa2 | 785,169 | — | 785,169 | | 16 | 2.1 | % | 353,264 | 1.1 | % | 44 |
| Indiana University Health | 26 | AA/Aa2 | 416,978 | 269,320 | | 686,298 | | 10 | 2.0 | % | 376,842 | 1.2 | % | 50 |
| Trinity Health | 7 | AA-/Aa3 | 804,737 | | 8,156 | | 812,893 | | 11 | 2.0 | % | 454,969 | 1.4 | % | 54 |
| Tufts Medicine | None | BBB-/Aa3 | 252,087 | — | 252,087 | | 2 | 1.8 | % | 254,680 | 0.8 | % | 3 |
| WakeMed | 185 | --/A2 | 374,207 | 101,597 | 475,804 | | 13 | 1.5 | % | 132,015 | 0.4 | % | 19 |
| Cedars-Sinai Health Systems | 51 | AA-/Aa3 | 199,701 | 90,607 | 290,308 | | 5 | 1.5 | % | 65,278 | 0.2 | % | 21 |
| Banner Health | 24 | AA-/-- | 749,075 | 31,039 | | 780,114 | | 24 | 1.5 | % | 125,664 | 0.4 | % | 33 |
| Baptist Memorial Health Care | 89 | A-2/-- | 544,122 | 150,228 | | 694,350 | | 9 | 1.4 | % | 407,894 | 1.3 | % | 50 |
| Sutter Health | 12 | A+/A1 | 175,591 | 99,947 | | 275,538 | | 4 | 1.4 | % | 105,752 | 0.3 | % | 22 |
| MemorialCare Health Systems | 133 | AA-/-- | 353,541 | 48,759 | | 402,300 | | 5 | 1.4 | % | 3,156 | — | % | 2 |
| Bon Secours Health System | 22 | A+/A2 | 405,945 | — | | 405,945 | | 6 | 1.4 | % | 242,817 | 0.8 | % | 50 |
| Other (71 Credit Rated) | | | 7,571,886 | 3,544,355 | 11,116,241 | | 208 | | 30.6 | % | 4,669,027 | 14.8 | % | |
Subtotal - credit rated 6 | | | 25,908,280 | 6,828,813 | 32,737,093 | | 546 | | 92.3 | % | 13,728,104 | 43.5 | % | |
Other non-credit rated 7 | | | 220,425 | 456,005 | 676,430 | | 15 | 1.9 | % | 249,601 | 0.8 | % | |
Off-campus non-affiliated 8 | | | — | 2,514,914 | 2,514,914 | | 62 | 5.8 | % | — | — | % | |
| Total | | | 26,128,705 | 9,799,732 | 35,928,437 | | 623 | 100.0 | % | 13,977,705 | 44.3 | % | |
| Joint ventures | | | 2,823,464 | 1,204,305 | 4,027,769 | | | | | | |
| Wholly-owned | | | 23,305,241 | 8,595,427 | 31,900,668 | | | | | | |
1Gross investment and quarterly cash NOI are reflected at the Company's ownership percentage. Lease and building level related metrics such as building square feet and occupancy are reflected at 100% of the buildings.
2Excludes construction in progress and assets classified as held for sale.
3Ranked by revenue based on Modern Healthcare's Healthcare Systems Financials Database.
4The Company defines an adjacent property as being no more than 0.25 miles from a hospital campus.
5Includes off-campus buildings where health systems lease 20% or more of the property and/or are located within 2 miles from a hospital campus.
6Based on square footage, 92% is associated and 40% is leased by an investment-grade rated healthcare provider.
7Includes 15 properties associated with hospital systems that are not credit rated. Prospect Medical leases approximately 81,000 square feet and represents 0.2% of total company rental income.
8Includes off-campus buildings that are not 20% or more leased by a health system and are more than two miles from a hospital campus.
| | | | | |
| |
HEALTHCARE REALTY | 4Q 2024 SUPPLEMENTAL INFORMATION 19 |
| | |
MOB Proximity to Hospital 1,2,3 |
|
|
| | | | | | | | | | | | | | | |
| MOB BY LOCATION | | | | | |
| | | | | |
| # OF PROPERTIES | SQUARE FEET | TOTAL | % GROUND LEASED | |
| On campus | 252 | 19,628,604 | 54.6 | % | 72.9 | % | |
Adjacent to campus 4 | 147 | 6,500,101 | 18.1 | % | 13.7 | % | |
| Total on/adjacent | 399 | 26,128,705 | 72.7 | % | 58.2 | % | |
Off campus - affiliated 5 | 162 | 7,284,818 | 20.3 | % | 16.5 | % | |
| Off campus | 62 | 2,514,914 | 7.0 | % | 10.4 | % | |
| 623 | 35,928,437 | 100.0 | % | 46.4 | % | |
| Wholly-owned | 565 | 31,900,668 | | | |
| Joint ventures | 58 | 4,027,769 | | | |
| | | | | | | | | | | | | | | | | | | | | |
MOB BY CLUSTER 6 | |
| | | | | | | |
| TOTAL | HOSPITAL CENTRIC 7 | |
| # OF PROPERTIES | SQUARE FEET | % OF SQUARE FEET | # OF PROPERTIES | SQUARE FEET | % OF SQUARE FEET | |
| Clustered | 455 | 25,561,438 | 71.1 | % | 375 | 22,391,485 | 73.1 | % | |
| Non-clustered | 168 | 10,366,999 | 28.9 | % | 115 | 8,238,103 | 26.9 | % | |
| Total | 623 | 35,928,437 | 100.0 | % | 490 | 30,629,588 | 100.0 | % | |
1Gross investment and quarterly cash NOI are reflected at the Company's ownership percentage. Lease and building level related metrics such as building square feet and occupancy are reflected at 100% of the buildings.
2Includes joint venture properties and excludes construction in progress and assets classified as held for sale.
3Proximity to hospital campus includes acute care hospitals with inpatient beds. The Company does not consider inpatient rehab hospitals (IRFs), skilled nursing facilities (SNFs) or long-term acute care hospitals (LTACHs) to be hospital campuses for distance calculations.
4The Company defines an adjacent property as being no more than 0.25 miles from a hospital campus.
5Includes off-campus buildings where health systems lease 20% or more of the property and/or are located within 2 miles from a hospital campus.
6A cluster is defined as at least two properties within a geographic radius of two miles. The Company believes clusters provide operational efficiencies and greater local leasing knowledge that accelerate NOI growth.
7Includes buildings that are located within two miles of a hospital campus.
| | | | | |
| |
HEALTHCARE REALTY | 4Q 2024 SUPPLEMENTAL INFORMATION 20 |
| | |
Lease Maturity & Occupancy 1,2 |
|
|
| | | | | | | | | | | | | | | | | | | | | | | | |
| LEASE MATURITY SCHEDULE | | | | | |
| | | SQUARE FEET | # OF WHOLLY-OWNED LEASES |
| | WHOLLY-OWNED AND JOINT VENTURE | | |
| | | MULTI-TENANT 3 | SINGLE-TENANT | TOTAL | % OF TOTAL | JOINT VENTURES | WHOLLY-OWNED |
| Month-to-month | | 270,123 | 2,946 | 273,069 | 0.9 | % | 15,115 | 257,954 | 109 |
| 1Q 2025 | | 1,176,527 | 244,660 | 1,421,187 | 4.2 | % | 67,907 | 1,353,280 | 357 |
| 2Q 2025 | | 927,189 | 445,967 | 1,373,156 | 4.0 | % | 144,514 | 1,228,642 | 295 |
| 3Q 2025 | | 1,234,979 | 157,404 | 1,392,383 | 4.1 | % | 51,788 | 1,340,595 | 358 |
| 4Q 2025 | | 1,026,267 | 155,225 | 1,181,492 | 3.5 | % | 70,547 | 1,110,945 | 303 |
| 2026 | | 3,890,407 | 300,862 | 4,191,269 | 12.4 | % | 243,790 | 3,947,479 | 1,029 |
| 2027 | | 4,022,433 | 1,023,495 | 5,045,928 | 14.9 | % | 492,331 | 4,553,597 | 1,071 |
| 2028 | | 3,034,948 | 585,199 | 3,620,147 | 10.7 | % | 219,640 | 3,400,507 | 814 |
| 2029 | | 3,224,097 | 919,192 | 4,143,289 | 12.2 | % | 595,279 | 3,548,010 | 804 |
| 2030 | | 1,899,462 | 547,479 | 2,446,941 | 7.2 | % | 233,008 | 2,213,933 | 351 |
| 2031 | | 1,475,992 | 362,674 | 1,838,666 | 5.4 | % | 231,989 | 1,606,677 | 315 |
| 2032 | | 1,872,263 | 359,827 | 2,232,090 | 6.6 | % | 340,988 | 1,891,102 | 290 |
| 2033 | | 961,990 | 0 | 961,990 | 2.8 | % | 195,993 | 765,997 | 179 |
| 2034 | | 1,242,095 | 124,204 | 1,366,299 | 4.0 | % | 256,739 | 1,109,560 | 197 |
| Thereafter | | 1,485,668 | 939,000 | 2,424,668 | 7.1 | % | 558,189 | 1,866,479 | 195 |
| Total occupied | | 27,744,440 | 6,168,134 | 33,912,574 | 88.2 | % | 3,717,817 | 30,194,757 | 6,667 |
| Total building | | 32,137,957 | 6,307,217 | 38,445,174 | | 4,253,845 | 34,191,329 | |
| Occupancy | | 86.3 | % | 97.8 | % | 88.2 | % | | 87.4 | % | 88.3 | % | |
| Leased % | | 88.3 | % | 97.8 | % | 89.8 | % | | 89.8 | % | 89.8 | % | |
WALTR (months) 4 | 49.5 | 67.2 | 52.7 | | | 49.9 | |
WALT (months) 4 | 91.5 | 138.0 | 100.0 | | | 99.3 | |
| | | | | | | | | | | | | | | | | | | | | |
QUARTERLY LEASING ACTIVITY 5 |
| | MULTI-TENANT | SINGLE-TENANT | TOTAL |
| | ABSORPTION ACTIVITY | SQUARE FEET | ABSORPTION ACTIVITY | SQUARE FEET | ABSORPTION ACTIVITY | SQUARE FEET |
| Occupied square feet, beginning of period | | | 27,881,907 | | | 6,270,282 | | | 34,152,189 | |
| Dispositions and assets held for sale | | | (277,649) | | | (121,029) | | | (398,678) | |
| Expirations and early vacates | | (1,147,362) | | | (226,896) | | | (1,374,258) | | |
| Renewals, amendments and extensions | | 834,287 | | | 119,315 | | | 953,602 | | |
| New lease commencements | | 453,257 | | | 126,462 | | | 579,719 | | |
| Absorption | | | 140,182 | | | 18,881 | | | 159,063 | |
| Occupied square feet, end of period | | | 27,744,440 | | | 6,168,134 | | | 33,912,574 | |
| | | | | | | |
1Gross investment and quarterly cash NOI are reflected at the Company's ownership percentage. Lease and building level related metrics such as building square feet and occupancy are reflected at 100% of the buildings.
2Excludes land held for development, construction in progress, corporate property and assets classified as held for sale, unless noted otherwise.
3The average lease size in the wholly-owned multi-tenant portfolio is 3,868 square feet.
4WALTR = weighted average lease term remaining; WALT = weighted average lease term.
5Excludes month-to-month activity until such time that a term renewal is signed or the tenant vacates.
| | | | | |
| |
HEALTHCARE REALTY | 4Q 2024 SUPPLEMENTAL INFORMATION 21 |
| | | | | | | | | | |
SAME STORE RENEWALS 2 |
| 4Q 2024 | 2024 | | |
| | | | |
MOB cash leasing spreads 3 | 2.7 | % | 3.4 | % | | |
| | | | |
| MOB cash leasing spreads distribution | | | |
| < 0% spread | 4.6 | % | 6.1 | % | | |
| 0-3% spread | 11.2 | % | 8.9 | % | | |
| 3-4% spread | 72.2 | % | 59.9 | % | | |
| > 4% spread | 12.0 | % | 25.1 | % | | |
| Total | 100.0 | % | 100.0 | % | | |
| | | | |
| MOB tenant retention rate | 81.6 | % | 83.4 | % | | |
| | | | |
| | | | |
| | | | | | | | | | | | | | | | | | | | | | | | | | |
AVERAGE IN-PLACE CONTRACTUAL INCREASES 4 |
| MULTI-TENANT | SINGLE-TENANT | TOTAL |
| % INCREASE | % OF
BASE RENT | | % INCREASE | % OF
BASE RENT | | % INCREASE | % OF
BASE RENT |
Same store 2 | 2.87 | % | 71.3 | % | | 2.48 | % | 17.1 | % | | 2.80 | % | 88.4 | % |
| Acquisitions | 2.86 | % | 6.0 | % | | 2.48 | % | 1.3 | % | | 2.80 | % | 7.3 | % |
Other 5 | 2.95 | % | 3.9 | % | | 2.53 | % | 0.4 | % | | 2.91 | % | 4.3 | % |
| Total | 2.87 | % | 81.2 | % | | 2.48 | % | 18.8 | % | | 2.80 | % | 100.0 | % |
| Escalator type | | | | | | | | |
| Fixed | 2.86 | % | 97.2 | % | | 2.52 | % | 89.2 | % | | 2.80 | % | 95.7 | % |
| CPI | 3.36 | % | 2.8 | % | | 2.18 | % | 10.8 | % | | 2.81 | % | 4.3 | % |
| | | | | | | | | | | | | | |
SAME STORE TYPE AND OWNERSHIP STRUCTURE 2 |
| MULTI-TENANT | SINGLE-TENANT | | TOTAL |
| Tenant type | | | | |
| Hospital | 45.7 | % | 58.2 | % | | 48.0 | % |
| Physician and other | 54.3 | % | 41.8 | % | | 52.0 | % |
| | | | |
| Lease structure | | | | |
| Gross | 9.3 | % | 1.5 | % | | 7.9 | % |
| Modified gross | 31.6 | % | 10.0 | % | | 27.7 | % |
| Net | 59.1 | % | 64.8 | % | | 60.1 | % |
Absolute net 6 | — | % | 23.7 | % | | 4.3 | % |
| | | | |
| Ownership type | | | | |
| Ground lease | 47.8 | % | 39.8 | % | | 46.5 | % |
| Fee simple | 52.2 | % | 60.2 | % | | 53.5 | % |
| | | | | | | | | | | |
# OF LEASES BY SIZE 7 | |
| LEASED SQUARE FEET | # OF LEASES | WALT | WALTR |
| 0 - 2,500 | 3,481 | | 70.4 | | 36.8 | |
| 2,501 - 5,000 | 1,668 | | 79.8 | | 41.2 | |
| 5,001 - 7,500 | 583 | | 90.8 | | 46.1 | |
| 7,501 - 10,000 | 318 | | 97.3 | | 52.7 | |
| 10,001 + | 617 | | 119.2 | | 58.1 | |
| Total Leases | 6,667 | | 99.3 | | 49.9 | |
| | | |
| | | |
| | | |
|
| | | |
| | | |
1Gross investment and quarterly cash NOI are reflected at the Company's ownership percentage. Lease and building level related metrics such as building square feet and occupancy are reflected at 100% of the buildings.
2Same store properties are properties that have been included in operations for the duration of the year-over-year comparison period presented. Accordingly, same store properties exclude properties that were recently acquired or disposed of, properties classified as held for sale or intended for sale, properties undergoing redevelopment, and newly redeveloped or developed properties.
3Excludes non-MOB renewals of 15,582 square feet and 146,082 square feet for the fourth quarter and full year 2024, respectively.
4Excludes leases with lease terms of one year or less.
5Includes redevelopment properties, development completion, and joint ventures.
6Tenant is typically responsible for operating expenses and capital obligations.
7Excludes joint ventures, land held for development, construction in progress, corporate property and assets classified as held for sale.
| | | | | |
| |
HEALTHCARE REALTY | 4Q 2024 SUPPLEMENTAL INFORMATION 22 |
| | |
Same Store 1,2 |
| DOLLARS IN THOUSANDS, EXCEPT PER SQUARE FOOT DATA |
| | | | | | | | | | | | | | | | | | | | | | | | |
| TOTAL CASH NOI |
| % of Total NOI | 4Q 2024 | | 4Q 2023 | Y-o-Y% CHANGE | 2024 | 2023 | % CHANGE |
| Multi-tenant | 70 | % | $ | 132,122 | | | $ | 128,558 | | 2.8 | % | $ | 520,725 | | $ | 507,086 | | 2.7 | % |
| Single-tenant | 20 | % | 37,924 | | | 36,509 | | 3.9 | % | 150,142 | | 145,334 | | 3.3 | % |
| Joint venture | 2 | % | 4,420 | | | 4,224 | | 4.6 | % | 17,595 | | 16,869 | | 4.3 | % |
| Same store | 92 | % | $ | 174,466 | | | $ | 169,291 | | 3.1 | % | $ | 688,462 | | $ | 669,289 | | 2.9 | % |
| Planned dispositions | — | % | 40 | | | 86 | | (53.5 | %) | 122 | | 366 | | (66.7 | %) |
| Re/development | 2 | % | 3,974 | | | 4,747 | | (16.3 | %) | 17,618 | | 18,697 | | (5.8 | %) |
| Wholly owned and joint venture acquisitions | 2 | % | 3,220 | | | 614 | | 424.4 | % | 7,829 | | 2,230 | | 251.1 | % |
| Development completions | 1 | % | 1,043 | | | 656 | | 59.0 | % | 3,236 | | 2,165 | | 49.5 | % |
| Completed dispositions & assets held for sale | 3 | % | 6,032 | | | 28,677 | | (79.0 | %) | 64,066 | | 133,259 | | (51.9 | %) |
| Total cash NOI | 100 | % | $188,775 | | | $204,071 | | (7.5 | %) | $781,333 | | $826,006 | | (5.4 | %) |
| | | | | | | | |
| Same store cash NOI w/o Steward Health & Prospect Medical | $173,988 | | | $167,987 | | 3.6 | % | $684,216 | | $663,747 | | 3.1 | % |
| | | | | | | | |
| | | | | | | | |
| | | | | | | | |
| | | | | | | | | | | | | | | | | | | | | | | | | | | |
| PORTFOLIO OCCUPANCY AND ABSORPTION | | | | | | |
| | | | OCCUPANCY % | ABSORPTION
(square feet in thousands) | | | |
| COUNT | SQUARE FEET | | 4Q 2024 | 3Q 2024 | 4Q 2023 | SEQUENTIAL | Y-O-Y | | | |
| Multi-tenant | 452 | 26,591,560 | | 88.0 | % | 87.9 | % | 87.1 | % | 21 | 240 | | | |
| Single-tenant | 104 | 5,258,047 | | 99.3 | % | 99.4 | % | 99.5 | % | (9) | (15) | | | |
| Joint venture | 29 | 1,636,232 | | 89.2 | % | 89.8 | % | 89.7 | % | (9) | (9) | | | |
| Same store | 585 | 33,485,839 | | 89.8 | % | 89.8 | % | 89.2 | % | 3 | 216 | | | |
| Planned dispositions | 3 | 143,935 | | 58.3 | % | 26.3 | % | 23.3 | % | 46 | 50 | | | |
| Re/development | 25 | 1,873,966 | | 63.0 | % | 62.9 | % | 62.0 | % | 2 | 17 | | | |
| Wholly owned and joint venture acquisitions | 33 | 2,387,888 | | 94.3 | % | 94.1 | % | 92.3 | % | 5 | 50 | | | |
| Development completions | 5 | 553,546 | | 57.7 | % | 65.6 | % | 59.0 | % | 103 | 125 | | | |
| Total portfolio | 651 | 38,445,174 | | 88.2 | % | 88.3 | % | 87.5 | % | 159 | 459 | | | |
| Joint ventures | 65 | 4,253,845 | | 87.4 | % | 89.8 | % | 89.7 | % | 100 | 103 | | | |
| Total wholly-owned | 586 | 34,191,329 | | 88.3 | % | 88.1 | % | 87.3 | % | 59 | 356 | | | |
| | | | | | | | | | | |
| Multi-tenant | 526 | 32,137,957 | | 86.3 | % | 86.5 | % | 85.4 | % | 140 | 479 | | | |
1Gross investment and quarterly cash NOI are reflected at the Company's ownership percentage. Lease and building level related metrics such as building square feet and occupancy are reflected at 100% of the buildings.
2Same store properties are properties that have been included in operations for the duration of the year-over-year comparison period presented. Accordingly, same store properties exclude properties that were recently acquired or disposed of, properties classified as held for sale or intended for sale, properties undergoing redevelopment, and newly redeveloped or developed properties.
| | | | | |
| |
HEALTHCARE REALTY | 4Q 2024 SUPPLEMENTAL INFORMATION 23 |
| | |
Same Store 1,2,3 |
| DOLLARS IN THOUSANDS, EXCEPT PER SQUARE FOOT DATA |
|
| | | | | | | | | | | | | | | | | | | | | | | |
| SAME STORE CASH NOI |
| TOTAL |
| 4Q 2024 | 3Q 2024 | 2Q 2024 | 1Q 2024 | 4Q 2023 | 2024 | 2023 |
| Base revenue | $209,310 | $208,131 | $206,019 | $206,094 | $204,944 | $829,554 | $812,114 |
| Op. exp. recoveries | 63,840 | 64,122 | 60,006 | 61,990 | 60,466 | 249,958 | 247,425 |
| Revenues | $273,150 | $272,253 | $266,025 | $268,084 | $265,410 | $1,079,512 | $1,059,539 |
| Expenses | 98,684 | 100,540 | 94,967 | 96,859 | 96,119 | 391,050 | 390,250 |
| Cash NOI | $174,466 | $171,713 | $171,058 | $171,225 | $169,291 | $688,462 | $669,289 |
Revenue per occ SF 4 | $36.33 | $36.29 | $35.57 | $35.90 | $35.58 | $36.02 | $35.51 |
| Margin | 63.9 | % | 63.1 | % | 64.3 | % | 63.9 | % | 63.8 | % | 63.8 | % | 63.2 | % |
| Average occupancy | 89.8 | % | 89.6 | % | 89.3 | % | 89.2 | % | 89.1 | % | 89.5 | % | 89.1 | % |
| Period end occupancy | 89.8 | % | 89.8 | % | 89.4 | % | 89.2 | % | 89.2 | % | 89.8 | % | 89.2 | % |
| Number of properties | 585 | 585 | 585 | 585 | 585 | 585 | 585 |
| | | | | | | |
| Year-Over-Year Change | | | | | | | |
Revenue per occ SF 4 | 2.1 | % | | | | | 1.4 | % | |
| Avg occupancy (bps) | +70 | | | | | +40 | |
| Revenues | 2.9 | % | | | | | 1.9 | % | |
| Base revenue | 2.1 | % | | | | | 2.1 | % | |
| Exp recoveries | 5.6 | % | | | | | 1.0 | % | |
| Expenses | 2.7 | % | | | | | 0.2 | % | |
| Cash NOI | 3.1 | % | | | | | 2.9 | % | |
| | | | | | | |
| Cash NOI w/o Steward Health & Prospect Medical | 3.6 | % | | | | | 3.1 | % | |
1Gross investment and quarterly cash NOI are reflected at the Company's ownership percentage. Lease and building level related metrics such as building square feet and occupancy are reflected at 100% of the buildings.
2Same store properties are properties that have been included in operations for the duration of the year-over-year comparison period presented. Accordingly, same store properties exclude properties that were recently acquired or disposed of, properties classified as held for sale or intended for sale, properties undergoing redevelopment, and newly redeveloped or developed properties.
3Excludes recently acquired or disposed properties, development completions, construction in progress, land held for development, corporate property, redevelopment properties, planned dispositions and assets classified as held for sale.
4Revenue per occ SF is calculated by dividing revenue by the average of the occupied SF for the period provided. Quarterly revenue per occ SF is annualized.
| | | | | |
| |
HEALTHCARE REALTY | 4Q 2024 SUPPLEMENTAL INFORMATION 24 |
| | |
NOI Reconciliations 1 |
| DOLLARS IN THOUSANDS |
|
| | | | | | | | | | | | | | | | | | | | | | | | | | | | | | | | | | | | | |
| BOTTOM UP RECONCILIATION | | | | | | | | | | | | | | | | | | | |
| 4Q 2024 | 3Q 2024 | 2Q 2024 | 1Q 2024 | 4Q 2023 | 3Q 2023 | 2Q 2023 | 1Q 2023 | | | | | | | | | | | |
| Net loss | ($108,212) | | ($94,535) | | ($145,938) | | ($315,220) | | ($41,676) | | ($68,604) | | ($83,726) | | ($88,078) | | | | | | | | | | | | |
| Other income (expense) | 107,448 | | 105,657 | | 156,631 | | 327,646 | | 54,382 | | 74,621 | | 112,818 | | 94,407 | | | | | | | | | | | | |
| General and administrative expense | 34,208 | | 20,124 | | 14,002 | | 14,787 | | 14,609 | | 13,396 | | 15,464 | | 14,935 | | | | | | | | | | | | |
| Depreciation and amortization expense | 160,330 | | 163,226 | | 173,477 | | 178,119 | | 180,049 | | 182,989 | | 183,193 | | 184,479 | | | | | | | | | | | | |
Other expenses 2 | 7,059 | | 6,434 | | 5,226 | | 4,727 | | 4,899 | | 12,543 | | (11,969) | | 7,940 | | | | | | | | | | | | |
| Straight-line rent expense | 917 | | 965 | | 1,063 | | 935 | | 1,484 | | 1,538 | | 1,525 | | 1,537 | | | | | | | | | | | | |
| Straight-line rent revenue | (9,061) | | (6,736) | | (5,630) | | (8,568) | | (9,356) | | (10,008) | | (9,530) | | (9,782) | | | | | | | | | | | | |
Other revenue 3 | (11,194) | | (8,334) | | (5,433) | | (7,006) | | (5,078) | | (6,446) | | (4,992) | | (733) | | | | | | | | | | | | |
| Joint venture property cash NOI | 7,280 | | 6,477 | | 5,504 | | 4,958 | | 4,758 | | 4,692 | | 4,957 | | 4,769 | | | | | | | | | | | | |
| Cash NOI | $188,775 | | $193,278 | | $198,902 | | $200,378 | | $204,071 | | $204,721 | | $207,740 | | $209,474 | | | | | | | | | | | | |
| Planned dispositions | (40) | | 14 | | (57) | | (39) | | (86) | | 100 | | 151 | | (531) | | | | | | | | | | | | |
| Redevelopment | (3,974) | | (4,795) | | (4,276) | | (4,573) | | (4,747) | | (4,260) | | (4,649) | | (5,041) | | | | | | | | | | | | |
| Wholly owned and joint venture acquisitions | (3,220) | | (2,406) | | (1,368) | | (835) | | (614) | | (817) | | (651) | | (148) | | | | | | | | | | | | |
| Development completions | (1,043) | | (756) | | (738) | | (699) | | (656) | | (622) | | (435) | | (452) | | | | | | | | | | | | |
| Completed dispositions & assets held for sale | (6,032) | | (13,622) | | (21,405) | | (23,007) | | (28,677) | | (32,650) | | (35,027) | | (36,905) | | | | | | | | | | | | |
| Same store cash NOI | $174,466 | | $171,713 | | $171,058 | | $171,225 | | $169,291 | | $166,472 | | $167,129 | | $166,397 | | | | | | | | | | | | |
| Same store joint venture properties | (4,420) | | (4,387) | | (4,395) | | (4,393) | | (4,224) | | (4,178) | | (4,318) | | (4,149) | | | | | | | | | | | | |
| Same store excluding JVs | $170,046 | | $167,326 | | $166,663 | | $166,832 | | $165,067 | | $162,294 | | $162,811 | | $162,248 | | | | | | | | | | | | |
| | | | | | | | | | | | | | | | | | | |
| TOP DOWN RECONCILIATION | | | | | | | | | | | | | | | | | | | |
| 4Q 2024 | 3Q 2024 | 2Q 2024 | 1Q 2024 | 4Q 2023 | 3Q 2023 | 2Q 2023 | 1Q 2023 | | | | | | | | | | | |
| Rental income before rent concessions | $305,229 | | $310,080 | | $311,592 | | $321,833 | | $325,772 | | $336,503 | | $332,992 | | $328,115 | | | | | | | | | | | | |
| Rent concessions | (5,164) | | (3,581) | | (3,457) | | (3,757) | | (3,696) | | (3,168) | | (3,312) | | (4,022) | | | | | | | | | | | | |
| Rental income | $300,065 | | $306,499 | | $308,135 | | $318,076 | | $322,076 | | $333,335 | | $329,680 | | $324,093 | | | | | | | | | | | | |
| Parking income | 1,958 | | 2,363 | | 2,463 | | 2,545 | | 2,392 | | 2,751 | | 2,370 | | 2,391 | | | | | | | | | | | | |
| Interest from financing receivable, net | 2,103 | | 2,117 | | 2,094 | | 2,117 | | 2,132 | | 2,002 | | 2,180 | | 2,227 | | | | | | | | | | | | |
| Exclude straight-line rent revenue | (9,061) | | (6,736) | | (5,630) | | (8,568) | | (9,356) | | (10,008) | | (9,530) | | (9,782) | | | | | | | | | | | | |
Exclude other non-cash revenue 4 | (5,697) | | (4,149) | | (2,018) | | (3,163) | | (1,513) | | (1,410) | | (1,018) | | 3,594 | | | | | | | | | | | | |
| Cash revenue | $289,368 | | $300,094 | | $305,044 | | $311,007 | | $315,731 | | $326,670 | | $323,682 | | $322,523 | | | | | | | | | | | | |
| Property operating expense | (114,415) | | (120,232) | | (117,719) | | (121,078) | | (121,362) | | (131,639) | | (125,395) | | (122,040) | | | | | | | | | | | | |
Exclude non-cash expenses 5 | 6,542 | | 6,939 | | 6,073 | | 5,491 | | 4,944 | | 4,998 | | 4,496 | | 4,222 | | | | | | | | | | | | |
| Joint venture property cash NOI | 7,280 | | 6,477 | | 5,504 | | 4,958 | | 4,758 | | 4,692 | | 4,957 | | 4,769 | | | | | | | | | | | | |
| Cash NOI | $188,775 | | $193,278 | | $198,902 | | $200,378 | | $204,071 | | $204,721 | | $207,740 | | $209,474 | | | | | | | | | | | | |
| Planned dispositions | (40) | | 14 | | (57) | | (39) | | (86) | | 100 | | 151 | | (531) | | | | | | | | | | | | |
| Redevelopment | (3,974) | | (4,795) | | (4,276) | | (4,573) | | (4,747) | | (4,260) | | (4,649) | | (5,041) | | | | | | | | | | | | |
| Wholly owned and joint venture acquisitions | (3,220) | | (2,406) | | (1,368) | | (835) | | (614) | | (817) | | (651) | | (148) | | | | | | | | | | | | |
| Development completions | (1,043) | | (756) | | (738) | | (699) | | (656) | | (622) | | (435) | | (452) | | | | | | | | | | | | |
| Completed dispositions & assets held for sale | (6,032) | | (13,622) | | (21,405) | | (23,007) | | (28,677) | | (32,650) | | (35,027) | | (36,905) | | | | | | | | | | | | |
| Same store cash NOI | $174,466 | | $171,713 | | $171,058 | | $171,225 | | $169,291 | | $166,472 | | $167,129 | | $166,397 | | | | | | | | | | | | |
| Same store joint venture properties | (4,420) | | (4,387) | | (4,395) | | (4,393) | | (4,224) | | (4,178) | | (4,318) | | (4,149) | | | | | | | | | | | | |
| Same store excluding JVs | $170,046 | | $167,326 | | $166,663 | | $166,832 | | $165,067 | | $162,294 | | $162,811 | | $162,248 | | | | | | | | | | | | |
1Gross investment and quarterly cash NOI are reflected at the Company's ownership percentage. Lease and building level related metrics such as building square feet and occupancy are reflected at 100% of the buildings.
2Includes transaction costs, merger-related costs, rent reserves, above and below market ground lease intangible amortization, leasing commission amortization, non-cash adjustments for financing receivables, and ground lease straight-line rent.
3Includes management fee income, interest, above and below market lease intangible amortization, lease inducement amortization, lease termination fees, deferred financing cost amortization and principal related to investment in financing receivable, and tenant improvement overage amortization.
4Includes above and below market intangibles, lease inducements, lease termination fees, deferred financing cost amortization, financing receivable, and TI amortization.
5Includes above and below market ground lease intangible amortization, leasing commission amortization, and ground lease straight-line rent.
| | | | | |
| |
HEALTHCARE REALTY | 4Q 2024 SUPPLEMENTAL INFORMATION 25 |
| | |
NOI Reconciliations 1 |
| DOLLARS IN THOUSANDS |
|
| | | | | | | | | | | | | | | | | | | | | | | | | | | |
| RECONCILIATION OF NOI TO FFO AND NORMALIZED FFO | | | | | | | |
| 4Q 2024 | 3Q 2024 | 2Q 2024 | 1Q 2024 | | | | | | | | | | | | | |
| Cash NOI | $188,775 | | $193,278 | | $198,902 | | $200,378 | | | | | | | | | | | | | | |
| General and administrative expense | (34,208) | | (20,124) | | (14,002) | | (14,787) | | | | | | | | | | | | | | |
| Straight-line rent | 9,061 | | 6,736 | | 5,630 | | 8,568 | | | | | | | | | | | | | | |
| Interest and other income (expense), net | (154) | | (132) | | (248) | | 275 | | | | | | | | | | | | | | |
| Management fees and other income | 3,667 | | 2,658 | | 1,858 | | 1,646 | | | | | | | | | | | | | | |
| Note receivable interest income | 1,973 | | 1,787 | | 1,771 | | 2,421 | | | | | | | | | | | | | | |
Other non-cash revenue 2 | 5,554 | | 3,891 | | 1,804 | | 2,939 | | | | | | | | | | | | | | |
Other non-cash expenses 3 | (6,400) | | (6,687) | | (5,858) | | (5,268) | | | | | | | | | | | | | | |
| Non-real estate impairment | (1,600) | | (46,762) | | (11,201) | | — | | | | | | | | | | | | | | |
| Restructuring and severance-related costs | 19,288 | | — | | — | | — | | | | | | | | | | | | | | |
| Income taxes | 657 | | 448 | | 454 | | 336 | | | | | | | | | | | | | | |
| Unconsolidated JV adjustments | (720) | (401) | (443) | (427) | | | | | | | | | | | | | |
| Debt Covenant EBITDA | $185,893 | | $134,692 | | $178,667 | | $196,081 | | | | | | | | | | | | | | |
| Interest expense | (58,265) | | (60,649) | | (62,457) | | (61,054) | | | | | | | | | | | | | | |
| Transaction costs | (1,577) | | (719) | | (431) | | (395) | | | | | | | | | | | | | | |
| | | | | | | | | | | | | | | | | |
Leasing commission amortization 4 | 5,744 | | 5,827 | | 5,151 | | 4,467 | | | | | | | | | | | | | | |
| Non-real estate depreciation and amortization | (1,418) | | (1,232) | | (1,278) | | (1,424) | | | | | | | | | | | | | | |
| (Loss) gain on non-real estate assets | (4,075) | 162 | 4,907 | — | | | | | | | | | | | | | |
| Non-controlling interest | (56) | 139 | 81 | 106 | | | | | | | | | | | | | |
| Goodwill impairment | — | | — | — | (250,530) | | | | | | | | | | | | | |
| Restructuring and severance-related costs | (19,288) | | — | | — | | — | | | | | | | | | | | | | | |
| Income taxes | (657) | | (448) | | (454) | | (336) | | | | | | | | | | | | | | |
| Loss on extinguishment of debt | (237) | — | — | — | | | | | | | | | | | | | |
| Unconsolidated JV adjustments | (422) | (484) | (389) | (385) | | | | | | | | | | | | | |
| FFO | $105,642 | | $77,288 | | $123,797 | | ($113,470) | | | | | | | | | | | | | | |
| Transaction costs | 1,577 | 719 | 431 | 395 | | | | | | | | | | | | | |
| | | | | | | | | | | | | | | | | |
| Lease intangible amortization | (2,348) | (10) | 129 | 175 | | | | | | | | | | | | | |
| Significant non-recurring legal fees/forfeited earnest money received | 306 | 306 | 465 | — | | | | | | | | | | | | | |
| Loss on extinguishment of debt | 237 | — | — | — | | | | | | | | | | | | | |
| Restructuring and severance-related costs | 22,991 | 6,861 | — | — | | | | | | | | | | | | | |
| Merger-related fair value adjustment | 10,314 | 10,184 | 10,064 | 10,105 | | | | | | | | | | | | | |
| | | | | | | | | | | | | | | | | |
| Credit losses and gains on other assets, net | 4,582 | 46,600 | 8,525 | — | | | | | | | | | | | | | |
| Goodwill impairment | — | — | — | 250,530 | | | | | | | | | | | | | |
| Unconsolidated JV normalizing items | 113 | 101 | 89 | 87 | | | | | | | | | | | | | |
| Normalized FFO | $143,414 | | $142,049 | | $143,500 | | $147,822 | | | | | | | | | | | | | | |
1Gross investment and quarterly cash NOI are reflected at the Company's ownership percentage. Lease and building level related metrics such as building square feet and occupancy are reflected at 100% of the buildings.
2Includes above and below market lease intangibles, interest income related to sales-type leases, lease inducements, lease termination fees, deferred financing cost amortization, and principal related to investment in financing receivable and TI amortization.
3Includes above and below market ground lease intangible amortization, leasing commission amortization, and ground lease straight-line rent.
4Leasing commission amortization is included in the real estate depreciation and amortization add-back for FFO.
| | | | | |
| |
HEALTHCARE REALTY | 4Q 2024 SUPPLEMENTAL INFORMATION 26 |
| | |
EBITDA Reconciliations 1 |
| DOLLARS IN THOUSANDS |
|
| | | | | | | | | | | | | | | | | | |
| RECONCILIATION OF EBITDA | | | | | |
| | | | | | | | |
| 4Q 2024 | 3Q 2024 | 2Q 2024 | 1Q 2024 | | | | |
| Net loss | ($108,212) | | ($94,535) | | ($145,938) | | ($315,220) | | | | | |
| Interest expense | 58,265 | 60,649 | 62,457 | 61,054 | | | | |
| Income taxes | 657 | 448 | 454 | 336 | | | | |
| Depreciation and amortization | 160,330 | 163,226 | 173,477 | 178,119 | | | | |
| Unconsolidated JV depreciation, amortization, and interest | 6,336 | 5,863 | 5,207 | 4,952 | | | | |
| EBITDA | $117,376 | $135,651 | $95,657 | $(70,759) | | | | |
| | | | | | | | |
| | | | | | | | |
| | | | | | | | |
| | | | | | | | |
| | | | | | | | |
| Transaction costs | 1,577 | 719 | 431 | 395 | | | | |
| | | | | | | | |
| Gain on sales of assets | (32,082) | | (39,310) | | (38,338) | | (22) | | | | | |
| Impairments on real estate assets | 79,497 | 37,632 | 120,917 | 15,937 | | | | |
| Restructuring and severance-related costs | 19,288 | — | — | — | | | | |
| Goodwill Impairment | — | — | — | 250,530 | | | | |
| Loss on extinguishment of debt | 237 | — | — | — | | | | |
| | | | | | | | |
| Debt Covenant EBITDA | $185,893 | $134,692 | $178,667 | $196,081 | | | | |
Leasing commission amortization 2 | 5,744 | 5,827 | 5,151 | 4,467 | | | | |
| Lease intangibles, franchise taxes and prepaid ground amortization | (3,596) | | 692 | 980 | 975 | | | | |
Timing impact 3 | (2,125) | | (1,511) | | (1,438) | | — | | | | | |
| Stock based compensation | 3,028 | 7,908 | 3,383 | 3,562 | | | | |
| Allowance for credit losses | 1,600 | 46,762 | 11,201 | — | | | | |
| Rent reserves, net | (369) | | (27) | | 1,261 | | (151) | | | | | |
| Unconsolidated JV adjustments | 113 | 101 | 89 | 87 | | | | |
| Adjusted EBITDA | $190,288 | $194,444 | $199,294 | $205,021 | | | | |
| Annualized Adjusted EBITDA | $761,152 | $777,776 | $797,176 | $820,084 | | | | |
| | | | | | | | |
| RECONCILIATION OF NET DEBT | | | | | | | | |
| Debt (principal balance) | $4,894,564 | | $5,200,907 | | $5,402,290 | | $5,372,710 | | | | | |
| Share of unconsolidated net debt | 31,455 | 30,054 | 20,299 | 23,276 | | | | |
Cash 4 | (68,916) | | (22,801) | | (137,773) | | (26,172) | | | | | |
| Net debt | $4,857,103 | $5,208,160 | $5,284,816 | $5,369,814 | | | | |
| | | | | | | | |
| Net debt to adjusted EBITDA | 6.4x | 6.7x | 6.6x | 6.5x | | | | |
| | | | | | | | |
| | | | | | | | |
| | | | | | | | |
| | | | | | | | |
1Gross investment and quarterly cash NOI are reflected at the Company's ownership percentage. Lease and building level related metrics such as building square feet and occupancy are reflected at 100% of the buildings.
2Leasing commission amortization is included in the real estate depreciation and amortization add-back for FFO.
3Timing adjustments to represent a full quarter impact of acquisitions and dispositions. Properties contributed into a joint venture are adjusted at the Company's share. Timing adjustments also include non-recurring impacts due to one-time items recognized in the quarter.
42Q 2024 cash includes $96.0 million of proceeds from a portfolio disposition held in a cash escrow account as of June 30, 2024.
| | | | | |
| |
HEALTHCARE REALTY | 4Q 2024 SUPPLEMENTAL INFORMATION 27 |
| | |
Components of Net Asset Value 1 |
| DOLLARS IN THOUSANDS, EXCEPT PER SHARE DATA |
|
| | | | | |
| CASH NOI |
| 4Q 2024 |
Same store 2 | $174,466 | |
Acquisition/Development Completions 3 | 4,263 | |
| Re/development | 3,974 | |
| Total | $182,703 | |
Timing adjustments 4 | 631 | |
| Total Cash NOI | $183,334 | |
| | | | | | | | | | | |
| DEVELOPMENT & REDEVELOPMENT PROPERTIES |
| ESTIMATED COST TO COMPLETE | ESTIMATED TOTAL COST | PROJECTED STABILIZED ANNUAL CASH NOI |
| Developments | $28,780 | | $158,800 | | $11,858 | |
Redevelopments 5 | 45,348 | | 106,535 | | 19,130 | |
| $74,128 | | $265,335 | | $30,988 | |
| | | |
| | | | | | | | |
| LAND HELD FOR DEVELOPMENT, CASH, & OTHER ASSETS | | |
| Land held for development | $52,408 | | |
Disposition pipeline 6 | 67,801 | | |
Unstabilized properties 7 | 234,842 | | |
Cash and other assets 8 | 434,145 | | |
| $789,196 | | |
| | |
| DEBT | | |
| Unsecured credit facility | $— | | |
| Unsecured term loans | 1,150,000 | | |
| Senior notes | 3,699,285 | | |
| Mortgage notes payable | 45,279 | | |
| Company share of joint venture net debt | 31,455 | | |
Other liabilities 9 | 329,779 | | |
| $5,255,798 | | |
| | |
| TOTAL SHARES OUTSTANDING | | |
As of December 31, 2024 10 | 354,147,499 | | |
| | |
1Gross investment and quarterly cash NOI are reflected at the Company's ownership percentage. Lease and building level related metrics such as building square feet and occupancy are reflected at 100% of the buildings.
2See Same Store schedule on pages 23 - 24 for details on Same Store NOI. 3Adjusted to reflect quarterly NOI from properties acquired or stabilized re/developments completed during the full five quarter period that are not included in same store NOI.
4Timing adjustments include adjustments to reflect full quarterly stabilized NOI of a recently completed development of $0.7 million, full quarter NOI for JV contributed assets of $0.9 million, and management fee income of $3.5 million, offset by $2.9 million of in-place NOI on development and redevelopment properties and $1.6 million of positive NOI for unstabilized properties, which are shown in other assets.
5Estimated total cost includes only the incremental capital to complete the redevelopment. Projected Stabilized Annual Cash NOI is the total property NOI at stabilization.
6Includes assets held for sale and planned dispositions.
7Includes 27 properties at their gross book value. These properties were comprised of 1.2 million square feet that generated positive NOI of $1.6 million.
8Includes cash of $68.9 million, notes receivable of $127.6 million, prepaid assets of $162.1 million, accounts receivable of $36.7 million, prepaid ground leases of $18.9 million, and other investments of $1.9 million. In addition, includes the Company's occupied portion of its corporate headquarters in Nashville of $18.0 million.
9Includes only liabilities that are expected to reduce future cash or NOI and that are currently producing non-cash benefits to NOI. Included are accounts payable and accrued liabilities of $223.2 million, security deposits of $30.9 million, financing right of use liabilities of $72.4 million, and deferred operating expense reimbursements of $3.3 million.
10Total shares outstanding includes OP units.
| | | | | |
| |
HEALTHCARE REALTY | 4Q 2024 SUPPLEMENTAL INFORMATION 28 |
| | |
| 2025 Guidance |
| DOLLARS IN THOUSANDS, EXCEPT PER SHARE DATA |
|
| | | | | | | | | | | | | | | | | | | | | | | |
| | | | | | | | | | | | | |
| ACTUAL | | 2025 GUIDANCE | | | | | | | |
| 2024 | | LOW | HIGH | | | | | | | | | |
| | | | | | | | | | | | | |
| | | | | | | | | | | | | |
| | | | | | | | | | | | | |
| | | | | | | | | | | | | |
| | | | | | | | | | | | | |
| | | | | | | | | | | | | |
| | | | | | | | | | | | | |
| OPERATING METRICS | | | | | | | | | | | | | |
| | | | | | | | | | | | | |
| | | | | | | | | | | | | |
| | | | | | | | | | | | | |
| Year-end same store net absorption (bps) | 73 | | 75 | 125 | | | | | | | | | |
Same store cash NOI growth 1 | 2.9 | % | | 3.00 | % | 3.75 | % | | | | | | | | | |
| | | | | | | | | | | | | |
| Same store MOB cash leasing spreads | 3.4 | % | | 2.0 | % | 3.0 | % | | | | | | | | | |
| Same store lease retention rate | 83.4 | % | | 80.0 | % | 85.0 | % | | | | | | | | | |
| | | | | | | | | | | | | |
| | | | | | | | | | | | | |
| Normalized G&A | $53,269 | | $52,000 | $56,000 | | | | | | | | | |
| | | | | | | | | | | | | |
| | | | | | | | | | | | | |
| CAPITAL FUNDING | | | | | | | | | | | | | |
| | | | | | | | | | | | | |
| Asset sales and JV contributions | $1,260,838 | | $400,000 | $500,000 | | | | | | | | | |
| Re/development | 150,577 | | 95,000 | 115,000 | | | | | | | | | |
| 1st generation TI and acq. capex | 55,902 | | 55,000 | 65,000 | | | | | | | | | |
| Maintenance capex | | | | | | | | | | | | | |
| 2nd generation TI | 69,445 | | 55,000 | 65,000 | | | | | | | | | |
| Leasing commissions paid | 47,450 | | 35,000 | 45,000 | | | | | | | | | |
| Building capital | 33,934 | | 30,000 | 40,000 | | | | | | | | | |
| Total maintenance capex | 150,829 | | 120,000 | 150,000 | | | | | | | | | |
| | | | | | | | | | | | | |
| CASH YIELD | | | | | | | | | | | | | |
| | | | | | | | | | | | | |
| Dispositions | 6.6 | % | | 6.8 | % | 7.3 | % | | | | | | | | | |
| | | | | | | | | | | | | |
| | | | | | | | | | | | | |
| | | | | | | | | | | | | |
| | | | | | | | | | | | | |
| EARNINGS AND LEVERAGE | | | | | | | | | | | | | |
| Earnings per share | $(1.81) | | $(0.28) | $(0.20) | | | | | | | | | |
Normalized FFO per share | $1.56 | | $1.56 | $1.60 | | | | | | | | | |
Net debt to adjusted EBITDA | 6.4x | | 6.00x | 6.25x | | | | | | | | | |
1Same store cash NOI growth guidance excludes the impact of Prospect Medical and Steward Health.
| | | | | |
| |
HEALTHCARE REALTY | 4Q 2024 SUPPLEMENTAL INFORMATION 29 |