SECURITIES AND EXCHANGE COMMISSION
Washington, DC 20549

FORM 8-K

CURRENT REPORT

Pursuant to Section 13 or 15(d) of the Securities Exchange Act of 1934

Date of Report: October 26, 2021

INDEPENDENT BANK CORPORATION
(Exact name of registrant as specified in its charter)

Michigan
0-7818
38-2032782
(State or other jurisdiction of incorporation)
(Commission File Number)
(IRS Employer Identification No.)

4200 East Beltline
Grand Rapids, Michigan
 
49525
(Address of principal executive office)
 
(Zip Code)

Registrant's telephone number,
including area code:
(616) 527-5820

Check the appropriate box below if the Form 8-K filing is intended to simultaneously satisfy the filing obligation of the registrant under any of the following provisions (see General Instruction A.2. below):


Written communications pursuant to Rule 425 under the Securities Act (17 CFR 230.425)


Soliciting material pursuant to Rule 14a-12 under the Exchange Act (17 CFR 240.14a-12)


Pre-commencement communications pursuant to Rule 14d-2(b) under the Exchange Act (17 CFR 240.14d-2(b))


Pre-commencement communications pursuant to Rule 13e-4(c) under the Exchange Act (17 CFR 240.13e-4(c))

Securities registered pursuant to Section 12(b) of the Act:

Title of each class
Trading symbol(s)
Name of each exchange on which registered
Common stock, no par value
IBCP
NASDAQ Global Select Market

Indicate by check mark whether the registrant is an emerging growth company as defined in Rule 405 of the Securities Act of 1933 (§230.405 of this chapter) or Rule 12b-2 of the Securities Exchange Act of 1934 (§240.12b-2 of this chapter).

Emerging growth company

If an emerging growth company, indicate by check mark if the registrant has elected not to use the extended transition period for complying with any new or revised financial accounting standards provided pursuant to Section 13(a) of the Exchange Act. ☐


Item 2.02.
Results of Operations and Financial Condition

On October 26, 2021, Independent Bank Corporation issued a press release announcing its financial results for the quarter ended September 30, 2021.  A copy of the press release is attached as Exhibit 99.1.  Attached Exhibit 99.2 contains supplemental data to that press release and attached Exhibit 99.3 contains a slide presentation for our earnings conference call.

The information in this Form 8-K and the attached Exhibits shall not be deemed filed for purposes of Section 18 of the Securities Exchange Act of 1934, as amended, nor shall they be deemed incorporated by reference in any filing under the Securities Act of 1933, as amended, except as shall be expressly set forth by specific reference in such filing.

Item 9.01.
Financial Statements and Exhibits

Exhibits.
 
Press release dated October 26, 2021.
   
Supplemental data to the Registrant's press release dated October 26, 2021.
   
Earnings conference call presentation.


SIGNATURE

Pursuant to the requirements of the Securities Exchange Act of 1934, the Registrant has duly caused this report to be signed on its behalf by the undersigned thereunto duly authorized.

     
INDEPENDENT BANK CORPORATION
     
(Registrant)
       
Date
October 26, 2021
 
By
s/Gavin A. Mohr
 
     
Gavin A. Mohr, Principal Financial Officer


3


Exhibit 99.1


News Release

Independent Bank Corporation
4200 East Beltline
Grand Rapids, MI 49525
616.527.5820

For Release:
Immediately
Contact:
William B. Kessel, President and CEO, 616.447.3933
Gavin A. Mohr, Chief Financial Officer, 616.447.3929

INDEPENDENT BANK CORPORATION REPORTS
 2021 THIRD QUARTER RESULTS

GRAND RAPIDS, Mich., October 26, 2021 - Independent Bank Corporation (NASDAQ: IBCP) reported third quarter 2021 net income of $16.0 million, or $0.73 per diluted share, versus net income of $19.6 million, or $0.89 per diluted share, in the prior- year period. For the nine months ended September 30, 2021, the Company reported net income of $50.4 million, or $2.30 per diluted share, compared to net income of $39.2 million, or $1.76 per diluted share, in the prior-year period.

Highlights for the third quarter of 2021 include:


Annualized return on average assets and on average equity of 1.40% and 15.93%, respectively;

An increase in net interest income of 5.7% over the third quarter of 2020;

Net gains on mortgage loans of $8.4 million and total mortgage loan origination volume of $453.8 million;

Net growth in portfolio loans of $69.4 million (or 9.8% annualized);

Continued strong asset quality metrics as evidenced by $1.5 million in net loan recoveries during the quarter as well as a low level of non-performing loans and non-performing assets; and

The payment of a 21 cent per share dividend on common stock on August 16, 2021.

Highlights for the first nine months of 2021 include:


Increases in net income and diluted earnings per share of 28.6% and 30.7%, respectively;

Annualized return on average assets and on average equity of 1.53% and 17.32%, respectively;

Net gains on mortgage loans of $30.3 million and total mortgage loan origination volume of $1.44 billion;

Net growth in portfolio loans of $150.3 million (or 7.4% annualized); and

Net growth in deposits of $374.7 million (or 13.8% annualized).

William B. (“Brad”) Kessel, the President and Chief Executive Officer of Independent Bank Corporation, commented: “I continue to be very pleased with the high level of performance by our team generating strong core results for yet another quarter. We continue to execute on our strategies of investing in people and technology. During the third quarter we saw good growth in net interest income, stabilization of our net interest margin and across the board loan growth, net of PPP.  Our commercial pipeline is at its highest level in many quarters.  Fueling some of this growth was the opening of two new commercial loan production offices, one in Ottawa County and the second in Macomb County.  Deposit gathering continues to be robust both via existing customers as well as through the addition of new customers. In addition, mortgage gains continue to be solid and our card strategies are generating good growth in interchange revenue.  On the asset quality front, I could not be more pleased, with net recoveries for the quarter, commercial watch credits at 2.4% of the portfolio, and a very low level of past due loans. Following our second quarter whole bank conversion, we are seeing good utilization and growth rates in our ONE Wallet and Treasury ONE platforms. While there are many uncertainties and challenges ahead, we are excited about the momentum we have in our markets and look forward to continuing these trends through the end of 2021 and into 2022.”

1

Significant items impacting comparable quarterly and year to date 2021 and 2020 results include the following:


Changes in the fair value due to price of capitalized mortgage loan servicing rights (the “MSR Changes”) of $0.6 million ($0.02 per diluted share, after taxes) and $2.8 million ($0.10 per diluted share, after taxes) for the three- and nine-months ended September 30, 2021, respectively, as compared to a negative $1.1 million ($0.04 per diluted share, after taxes) and a negative $9.9 million ($0.35 per diluted share, after taxes) for the three- and nine-months ended September 30, 2020, respectively.

Operating Results

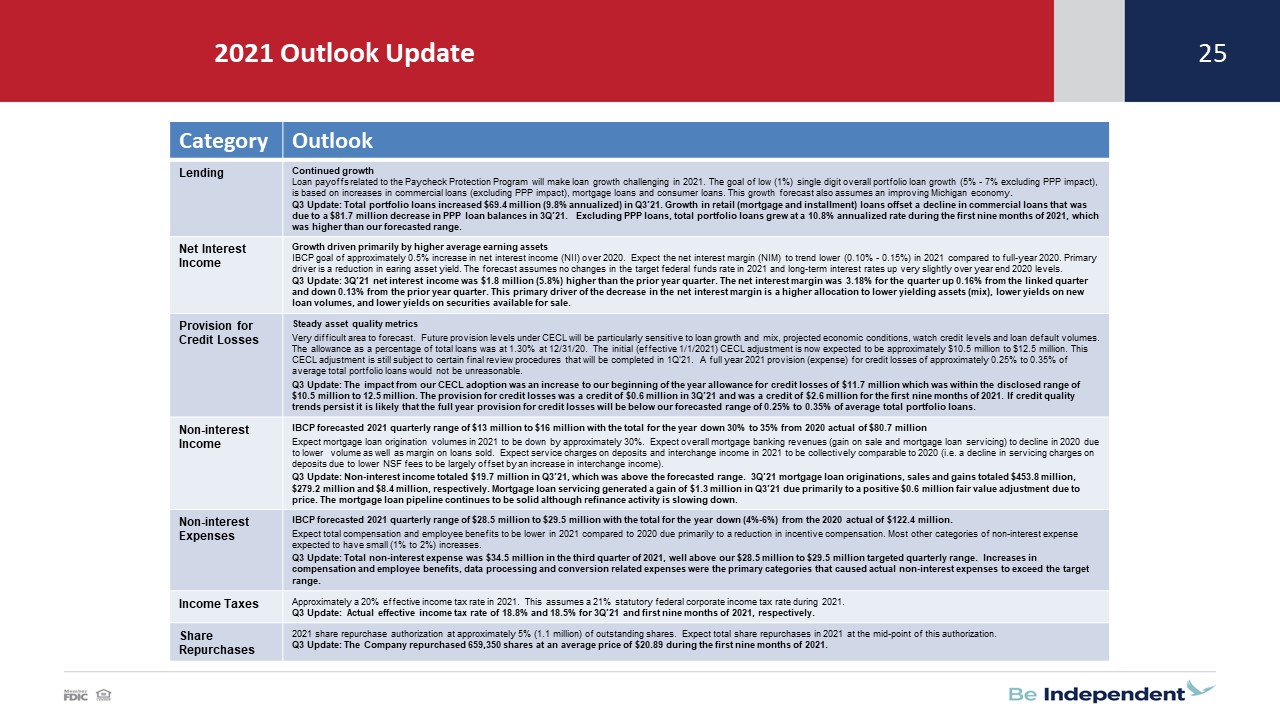
The Company’s net interest income totaled $33.8 million during the third quarter of 2021, an increase of $1.8 million, or 5.7% from the year-ago period, and up $2.4 million, or 7.7%, from the second quarter of 2021. The Company’s tax equivalent net interest income as a percent of average interest-earning assets (the “net interest margin”) was 3.18% during the third quarter of 2021, compared to 3.31% in the year-ago period, and 3.02% in the second quarter of 2021. The year-over-year quarterly increase in net interest income was due to an increase in average interest-earning assets that was partially offset by a decline in the net interest margin. Average interest-earning assets were $4.30 billion in the third quarter of 2021, compared to $3.89 billion in the year ago quarter and $4.22 billion in the second quarter of 2021.

For the first nine months of 2021, net interest income totaled $95.5 million, an increase of $2.9 million, or 3.1% from the first nine months in 2020. The Company’s net interest margin for the first nine months of 2021 was 3.09% compared to 3.42% in 2020. The increase in net interest income for the first nine months of 2021 compared to 2020 was also due to an increase in average interest- earning assets that was partially offset by a decline in the net interest margin.

Due principally to the economic impact of COVID-19, the Federal Reserve has taken a variety of actions to stimulate the economy, including significantly lowering short-term interest rates. These lower interest rates combined with a higher allocation to lower yielding securities available for sale has placed continued pressure on the Company’s net interest margin.

2

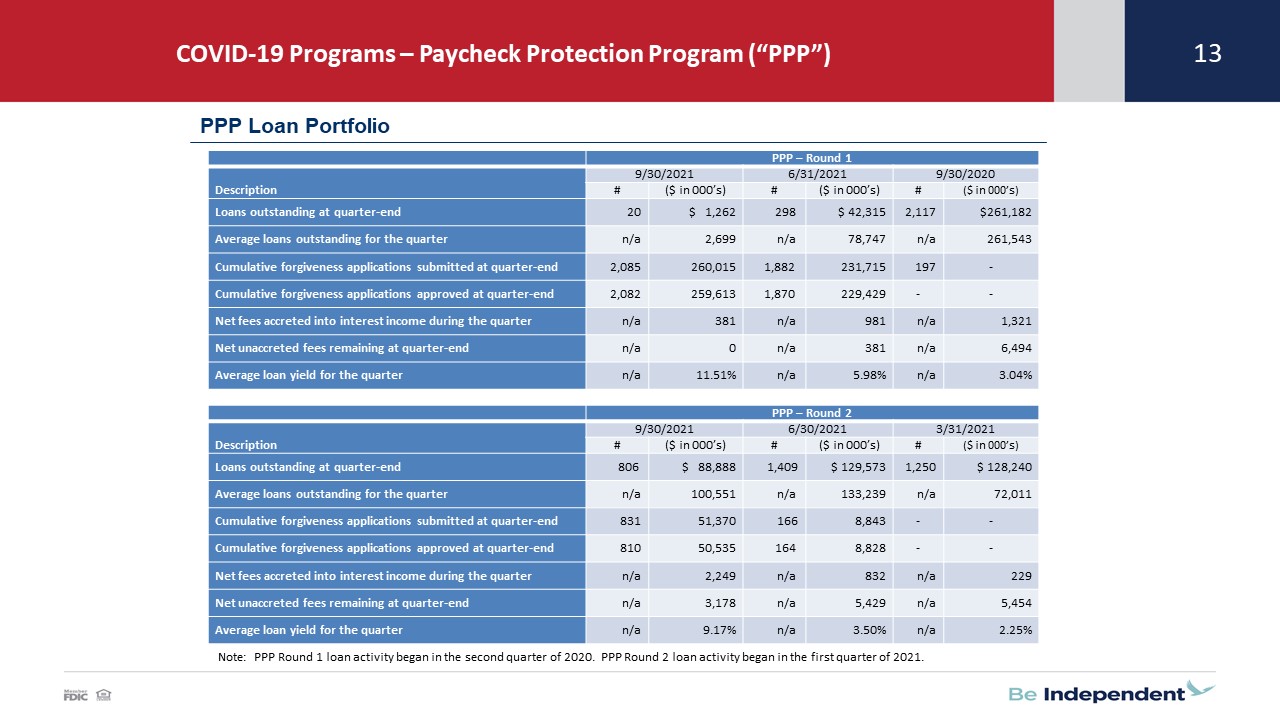
In addition, commercial loan balances, interest income and yields have been impacted by Paycheck Protection Program (“PPP”) lending activity. PPP lending activity is summarized in the following tables:

   
PPP – Round 1
 
At or for the three months ended
 
9/30/2021
   
6/30/2021
   
9/30/2020
 
     
#
     
(000’s)

   
#
     
(000’s)

   
#
     
(000’s)

Loans outstanding at period end
   
20
   
$
1,262
     
298
   
$
42,315
     
2,117
   
$
261,182
 
Average loans outstanding
   
-
     
2,699
     
-
     
78,747
     
-
     
261,543
 
Cumulative forgiveness applications submitted
   
2,085
     
260,015
     
1,882
     
231,715
     
197
     
37,223
 
Cumulative forgiveness applications approved
   
2,082
     
259,613
     
1,870
     
229,429
     
-
     
-
 
Net fees accreted into interest income
   
-
     
381
     
-
     
981
     
-
     
1,321
 
Net unaccreted fees at period end
   
-
     
-
     
-
     
381
     
-
     
6,494
 
Average loan yield
   
-
     
11.51
%
   
-
     
5.98
%
   
-
     
3.04
%

Note: PPP – Round 1 loan activity began in the second quarter of 2020.

   
PPP – Round 2
 
At or for the three months ended
 
9/30/2021
   
6/30/2021
   
3/31/2021
 
     
#
     
(000’s)

   
#
     
(000’s)

   
#
     
(000’s)

Loans outstanding at period end
   
806
   
$
88,888
     
1,409
   
$
129,573
     
1,250
   
$
128,240
 
Average loans outstanding
   
-
     
110,276
     
-
     
133,239
     
-
     
72,011
 
Cumulative forgiveness applications submitted
   
831
     
51,370
     
166
     
8,843
     
-
     
-
 
Cumulative forgiveness applications approved
   
810
     
50,535
     
164
     
8,828
     
-
     
-
 
Net fees accreted into interest income
   
-
     
2,249
     
-
     
832
     
-
     
229
 
Net unaccreted fees at period end
   
-
     
3,178
     
-
     
5,429
     
-
     
5,454
 
Average loan yield
   
-
     
9.17
%
   
-
     
3.50
%
   
-
     
2.25
%

Note: PPP – Round 2 loan activity began in the first quarter of 2021.

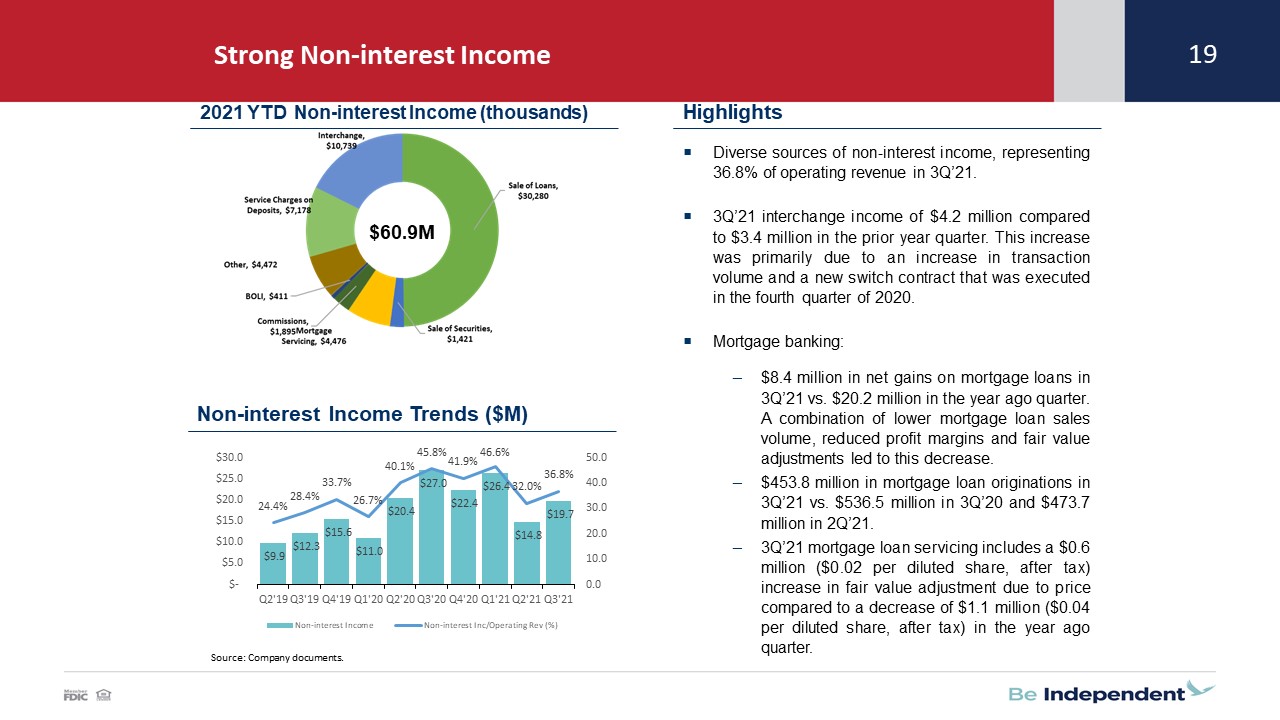
Non-interest income totaled $19.7 million and $60.9 million, respectively, for the third quarter and first nine months of 2021, compared to $27.0 million and $58.4 million in the respective comparable year ago periods. These changes were primarily due to variances in mortgage banking related revenues (net gains on mortgage loans and mortgage loan servicing, net).

Net gains on mortgage loans in the third quarters of 2021 and 2020, were approximately $8.4 million and $20.2 million, respectively. For the first nine months of 2021, net gains on mortgage loans totaled $30.3 million compared to $46.7 million in 2020. The decrease in net gains on mortgage loans was primarily due to lower profit margins on mortgage loan sales, a decrease in the volume of mortgage loans sold and fair value adjustments on the mortgage loan pipeline.

Mortgage loan servicing, net, generated a gain of $1.3 million and a loss of $0.6 million in the third quarters of 2021 and 2020, respectively. For the first nine months of 2021 and 2020, mortgage loan servicing, net, generated income of $4.5 million and a loss of $9.0 million, respectively. The significant variances in mortgage loan servicing, net are primarily due to changes in the fair value of capitalized mortgage loan servicing rights associated with changes in mortgage loan interest rates and expected future prepayment levels. Mortgage loan servicing, net activity is summarized in the following table:

   
Three Months Ended
   
Nine Months Ended
 
   
9/30/2021
   
9/30/2020
   
9/30/2021
   
9/30/2020
 
Mortgage loan servicing, net:
 
(Dollars in thousands)
 
Revenue, net
 
$
2,023
   
$
1,743
   
$
5,809
   
$
5,062
 
Fair value change due to price
   
599
     
(1,089
)
   
2,813
     
(9,941
)
Fair value change due to pay-downs
   
(1,351
)
   
(1,298
)
   
(4,146
)
   
(4,087
)
Total
 
$
1,271
   
$
(644
)
 
$
4,476
   
$
(8,966
)

3

Net gain on securities available for sale totaled $0.01 million and $1.421 million in third quarter and first nine months of 2021, respectively, compared to zero and $0.253 million in the prior year third quarter and first nine months, respectively. The increase in gain during the first nine months of 2021 was related to the divestiture of a group of mortgage backed securities in the first quarter of 2021.

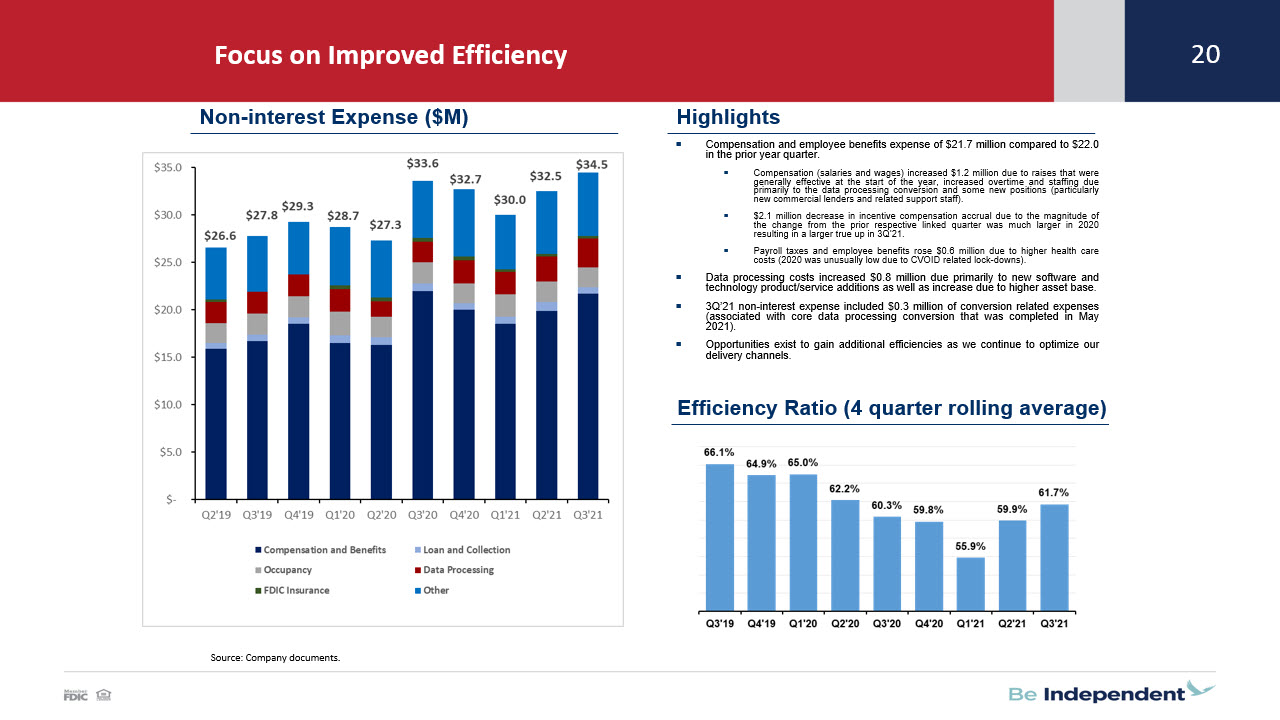
Non-interest expenses totaled $34.5 million in the third quarter of 2021, compared to $33.6 million in the year-ago period. For the first nine months of 2021, non-interest expenses totaled $97.1 million versus $89.7 million in 2020. These year-over-year increases in non-interest expense are primarily due to increases in compensation and employee benefits (for the year to date period), data processing, interchange, conversion related expenses (for the year to date period) and other expenses (for the quarter to date period). The increase in compensation and employee benefits in 2021 is due to several factors, including, wage increases that were generally effective at the start of the year, an increase in lending personnel, increased overtime primarily associated with a data processing conversion, a higher accrual for incentive compensation (due to higher base for such incentives), higher payroll taxes due to the increase in compensation and higher health care insurance costs (these costs during the first nine months of 2020 were unusually low due to the various COVID related lock-downs). In addition, the third quarter and first nine months of 2021 included $0.3 million and $1.6 million, respectively, of expenses related to the Company’s core data processing conversion (this conversion was completed in May 2021) compared to $0.6 million and $1.0 million, respectively, in the comparable periods in 2020. The first nine months of 2020 also included $0.4 million of expenses (primarily write-downs of fixed assets and leases) related to the closures of nine bank branch offices that were completed in the third quarter of 2020.

The Company recorded an income tax expense of $3.7 million and $11.5 million in the third quarter and first nine months of 2021, respectively. This compares to an income tax expense of $4.8 million and $9.2 million in the third quarter and first nine months of 2020, respectively. The changes in income tax expense principally reflect changes in pre-tax earnings in 2021 relative to 2020.

Asset Quality

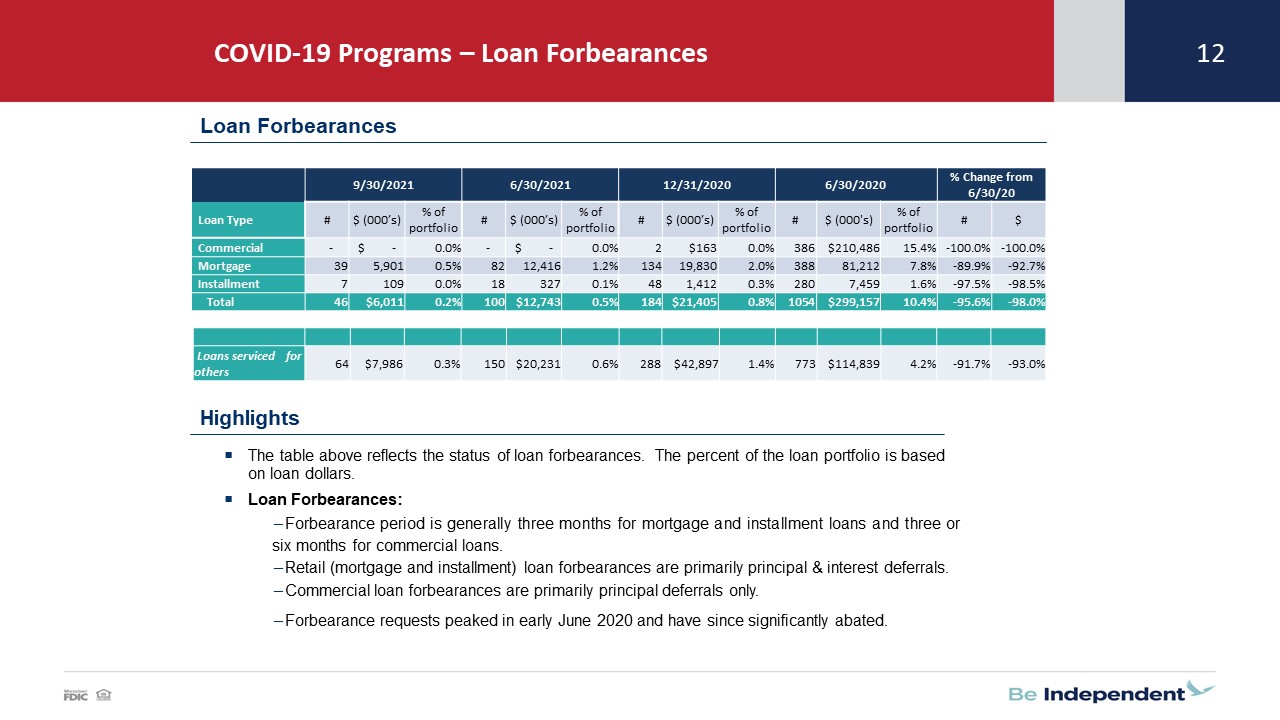
A breakdown of loan forbearance totals by loan type is as follows:

 
9/30/2021
   
6/30/2021
   
% change vs. prior quarter
 
 
Loan Type
   
#
   
$ (000’s)

 
% of
portfolio
     
#
   
$ (000's)
   
% of
portfolio
     
#
   
 $  
Commercial
   
-
   
$
-
     
0.0
%
   
-
   
$
-
     
0.0
%
 
none
   
none
 
Mortgage
   
39
     
5,901
     
0.5
%
   
82
     
12,416
     
1.2
%
   
(52.4
)%
   
(52.5
)%
Installment
   
7
     
109
     
0.0
%
   
18
     
327
     
0.1
%
   
(61.1
)%
   
(66.7
)%
Total
   
46
   
$
6,010
     
0.2
%
   
100
   
$
12,743
     
0.5
%
   
(54.0
)%
   
(52.8
)%
                                                                 
Loans serviced for others
   
64
   
$
7,986
     
0.3
%
   
150
   
$
20,231
     
0.6
%
   
(57.3
)%
   
(60.5
)%

Note: The % of portfolio is based on the dollar amount of forbearances to the total for the loan portfolio segment.

A breakdown of non-performing loans(1) by loan type is as follows:

Loan Type
 
9/30/2021
   
12/31/2020
   
9/30/2020
 
   
(Dollars in thousands)
 
Commercial
 
$
242
   
$
1,440
   
$
2,487
 
Mortgage
   
5,160
     
6,353
     
7,580
 
Installment
   
515
     
519
     
680
 
Subtotal
   
5,917
     
8,312
     
10,747
 
Less – government guaranteed loans
   
327
     
439
     
510
 
Total non-performing loans
 
$
5,590
   
$
7,873
   
$
10,237
 
Ratio of non-performing loans to total portfolio loans
   
0. 19
%
   
0.29
%
   
0.36
%
Ratio of non-performing assets to total assets
   
0.13
%
   
0.21
%
   
0.28
%
Ratio of the allowance for credit losses to non-performing loans
   
837.19
%
   
450.01
%
   
349.43
%

(1)
Excludes loans that are classified as “troubled debt restructured” that are still performing.

Non-performing loans decreased $2.3 million from December 31, 2020, as all loan categories have declined, reflecting improving economic conditions and the Company’s collection efforts.

4

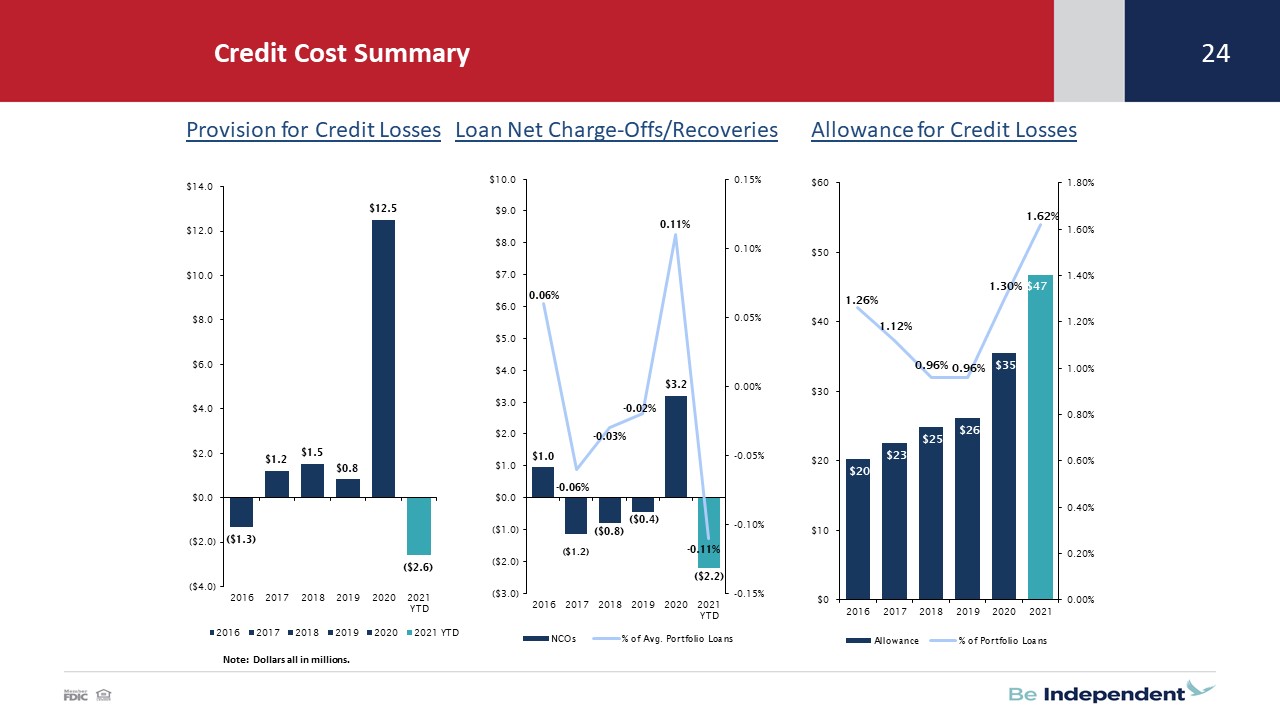
The provision for credit losses was a credit of $0.7 million and an expense of $1.0 million in the third quarters of 2021 and 2020, respectively. The provision for credit losses was a credit of $2.6 million and an expense of $12.9 million in the first nine months of 2021 and 2020, respectively. The quarterly and year-to-date decreases in the provision for credit losses in 2021 compared to 2020, were primarily the result of a decline in the adjustment to allocations based on subjective factors and an increase in recoveries of loans previously charged off. In particular, the higher year-to-date provision for credit losses in 2020 included a $10.7 million (or 122.1%) increase in the qualitative/subjective portion of the allowance for credit losses. That increase in 2020 principally reflected the unique challenges and prevailing economic uncertainty resulting from the COVID-19 pandemic and the potential impact on the loan portfolio.

The Company recorded loan net recoveries of $1.5 million and $0.3 million in the third quarters of 2021 and 2020, respectively. For the first nine months of 2021 and 2020, the Company recorded loan net recoveries of $2.2 million and loan net charge-offs of $3.3 million, respectively.

The allowance for credit losses totaled $46.8 million at September 30, 2021 compared to $35.4 million at December 31, 2020. The increase from December 31, 2020 is attributed to the adoption of Financial Accounting Standards Board Accounting Standards Update 2016-13, Financial Instruments — Credit Losses (Topic 326), Measurement of Credit Losses on Financial Instruments (“CECL”) on January 1, 2021. The impact of the adoption of CECL was an increase in the allowance for credit losses of $11.7 million. At September 30, 2021, the allowance for credit losses equaled 1.62% of total portfolio loans (1.68% when excluding PPP loans) under CECL, compared to 1.30% of total portfolio loans (1.38% when excluding PPP loans) at December 31, 2020, under the probable incurred loss methodology.

Balance Sheet, Liquidity and Capital

Total assets were $4.62 billion at September 30, 2021, an increase of $418.3 million from December 31, 2020. Loans, excluding loans held for sale, were $2.88 billion at September 30, 2021, compared to $2.73 billion at December 31, 2020.   Deposits totaled $4.01 billion at September 30, 2021, an increase of $374.7 million from December 31, 2020. This increase is primarily due to growth in non- interest bearing, savings and interest-bearing checking and reciprocal deposit account balances.

Cash and cash equivalents totaled $125.6 million at September 30, 2021, compared to $118.7 million at December 31, 2020. Securities available for sale totaled $1.35 billion at September 30, 2021, compared to $1.07 billion at December 31, 2020.   The significant increase in securities available for sale is due to the deployment of funds generated from the growth in deposits.

Total shareholders’ equity was $400.0 million at September 30, 2021, or 8.65% of total assets. Tangible common equity totaled $368.2 million at September 30, 2021, or $17.27 per share. The Company’s wholly owned subsidiary, Independent Bank, remains significantly above “well capitalized” for regulatory purposes with the following ratios:

Regulatory Capital Ratios
 
9/30/2021
 
12/31/2020
Well Capitalized
Minimum
Tier 1 capital to average total assets
8.75%
8.81%
5.00%
Tier 1 common equity to risk-weighted assets
12.14%
12.81%
6.50%
Tier 1 capital to risk-weighted assets
12.14%
12.81%
8.00%
Total capital to risk-weighted assets
13.39%
14.06%
10.00%

Share Repurchase Plan

On December 18, 2020, the Board of Directors of the Company authorized the 2021 share repurchase plan. Under the terms of the 2021 share repurchase plan, the Company is authorized to purchase up to 1,100,000 shares, or approximately 5% of its then outstanding common stock. The repurchase plan is authorized to last through December 31, 2021. For the first nine months of 2021, the Company repurchased 659,350 shares at a weighted average price of $20.89 per share.

Earnings Conference Call

Brad Kessel, President and CEO, Gavin A. Mohr, CFO and Joel Rahn, EVP – Commercial Banking will review the quarterly results in a conference call for investors and analysts beginning at 11:00 am ET on Tuesday, October 26, 2021.

5

To participate in the live conference call, please dial 1-866-200-8394. Also the conference call will be accessible through an audio webcast with user-controlled slides via the following site/URL: https://services.choruscall.com/links/ibcp211026.html.

A playback of the call can be accessed by dialing 1-877-344-7529 (Conference ID # 10160661). The replay will be available through November 2, 2021.

About Independent Bank Corporation

Independent Bank Corporation (NASDAQ: IBCP) is a Michigan-based bank holding company with total assets of approximately $4.6 billion. Founded as First National Bank of Ionia in 1864, Independent Bank Corporation operates a branch network across Michigan's Lower Peninsula through one state-chartered bank subsidiary. This subsidiary (Independent Bank) provides a full range of financial services, including commercial banking, mortgage lending, investments and insurance. Independent Bank Corporation is committed to providing exceptional personal service and value to its customers, stockholders and the communities it serves.

For more information, please visit our Web site at: IndependentBank.com.

Forward-Looking Statements

This press release contains forward-looking statements about Independent Bank Corporation. Statements that are not historical or current facts, including statements about beliefs and expectations, are forward-looking statements and are based on the information available to, and assumptions and estimates made by, management as of the date hereof. These forward-looking statements cover, among other things, anticipated future revenue and expenses and the future plans and prospects of Independent Bank Corporation. Forward-looking statements involve inherent risks and uncertainties, and important factors could cause actual results to differ materially from those anticipated. The COVID-19 pandemic is adversely affecting Independent Bank Corporation, its customers, counterparties, employees, and third-party service providers, and the ultimate extent of the impacts on its business, financial position, results of operations, liquidity, and prospects is uncertain. Continued deterioration in general business and economic conditions or turbulence in domestic or global financial markets could adversely affect Independent Bank Corporation’s revenues and the values of its assets and liabilities, reduce the availability of funding from certain financial institutions, lead to a tightening of credit, and increase stock price volatility. In addition, changes to statutes, regulations, or regulatory policies or practices could affect Independent Bank Corporation in substantial and unpredictable ways. Independent Bank Corporation’s results could also be adversely affected by changes in interest rates; further increases in unemployment rates; deterioration in the credit quality of its loan portfolios or in the value of the collateral securing those loans; deterioration in the value of its investment securities; legal and regulatory developments; litigation; increased competition from both banks and non-banks; changes in the level of tariffs and other trade policies of the United States and its global trading partners; changes in customer behavior and preferences; breaches in data security; failures to safeguard personal information; effects of mergers and acquisitions and related integration; effects of critical accounting policies and judgments; and management’s ability to effectively manage credit risk, market risk, operational risk, compliance risk, strategic risk, interest rate risk, liquidity risk and reputation risk.

Certain risks and important factors that could affect Independent Bank Corporation's future results are identified in its Annual Report on Form 10-K for the year ended December 31, 2020 and other reports filed with the SEC, including among other things under the heading “Risk Factors” in such Annual Report on Form 10-K. Any forward- looking statement speaks only as of the date on which it is made, and Independent Bank Corporation undertakes no obligation to update any forward-looking statement, whether to reflect events or circumstances, after the date on which the statement is made, to reflect new information or the occurrence of unanticipated events, or otherwise.

6

INDEPENDENT BANK CORPORATION AND SUBSIDIARIES
Consolidated Statements of Financial Condition

   
September 30,
2021
   
December 31,
2020
 
   
(unaudited)
 
   
(In thousands, except share
amounts)
 
Assets
 
Cash and due from banks
 
$
49,946
   
$
56,006
 
Interest bearing deposits
   
75,675
     
62,699
 
Cash and Cash Equivalents
   
125,621
     
118,705
 
Securities available for sale
   
1,348,378
     
1,072,159
 
Federal Home Loan Bank and Federal Reserve Bank stock, at cost
   
18,427
     
18,427
 
Loans held for sale, carried at fair value
   
78,731
     
92,434
 
Loans
               
Commercial
   
1,222,802
     
1,242,415
 
Mortgage
   
1,100,992
     
1,015,926
 
Installment
   
560,184
     
475,337
 
Total Loans
   
2,883,978
     
2,733,678
 
Allowance for credit losses (1)
   
(46,799
)
   
(35,429
)
Net Loans
   
2,837,179
     
2,698,249
 
Other real estate and repossessed assets
   
224
     
766
 
Property and equipment, net
   
36,623
     
36,127
 
Bank-owned life insurance
   
55,124
     
55,180
 
Capitalized mortgage loan servicing rights, carried at fair value
   
24,208
     
16,904
 
Other intangibles
   
3,579
     
4,306
 
Goodwill
   
28,300
     
28,300
 
Accrued income and other assets
   
65,946
     
62,456
 
Total Assets
 
$
4,622,340
   
$
4,204,013
 
                 
Liabilities and Shareholders' Equity
 
Deposits
               
Non-interest bearing
 
$
1,297,096
   
$
1,153,473
 
Savings and interest-bearing checking
   
1,803,763
     
1,526,465
 
Reciprocal
   
596,193
     
556,185
 
Time
   
312,085
     
287,402
 
Brokered time
   
2,931
     
113,830
 
Total Deposits
   
4,012,068
     
3,637,355
 
Other borrowings
   
30,007
     
30,012
 
Subordinated debt
   
39,338
     
39,281
 
Subordinated debentures
   
39,575
     
39,524
 
Accrued expenses and other liabilities
   
101,321
     
68,319
 
Total Liabilities
   
4,222,309
     
3,814,491
 
                 
Shareholders’ Equity
               
Preferred stock, no par value, 200,000 shares authorized; none issued or outstanding
   
-
     
-
 
Common stock, no par value, 500,000,000 shares authorized; issued and outstanding: 21,321,092 shares at September 30, 2021 and 21,853,800 shares at December 31, 2020
   
326,390
     
339,353
 
Retained earnings
   
66,543
     
40,145
 
Accumulated other comprehensive income
   
7,098
     
10,024
 
Total Shareholders’ Equity
   
400,031
     
389,522
 
Total Liabilities and Shareholders’ Equity
 
$
4,622,340
   
$
4,204,013
 

(1)
Beginning January 1, 2021, calculation is based on CECL methodology.  Prior to January 1, 2021, calculation was based on the probable incurred loss methodology.

7

INDEPENDENT BANK CORPORATION AND SUBSIDIARIES
Consolidated Statements of Operations

   
Three Months Ended
   
Nine Months Ended
 
   
September 30,
   
June 30,
   
September 30,
   
September 30,
 
   
2021
   
2021
   
2020
   
2021
   
2020
 
   
(unaudited)
 
Interest Income
 
(In thousands, except per share amounts)
 
Interest and fees on loans
 
$
30,132
   
$
28,091
   
$
30,393
   
$
86,328
   
$
92,020
 
Interest on securities available for sale
                                       
Taxable
   
3,922
     
3,656
     
3,450
     
10,374
     
9,356
 
Tax-exempt
   
1,597
     
1,544
     
954
     
4,525
     
2,137
 
Other investments
   
204
     
208
     
237
     
629
     
854
 
Total Interest Income
   
35,855
     
33,499
     
35,034
     
101,856
     
104,367
 
Interest Expense
                                       
Deposits
   
1,090
     
1,142
     
2,062
     
3,488
     
9,150
 
Other borrowings and subordinated debt and debentures
   
962
     
964
     
1,006
     
2,888
     
2,598
 
Total Interest Expense
   
2,052
     
2,106
     
3,068
     
6,376
     
11,748
 
Net Interest Income
   
33,803
     
31,393
     
31,966
     
95,480
     
92,619
 
Provision for credit losses (1)
   
(659
)
   
(1,425
)
   
975
     
(2,558
)
   
12,884
 
Net Interest Income After Provision for Credit Losses
   
34,462
     
32,818
     
30,991
     
98,038
     
79,735
 
Non-interest Income
                                       
Interchange income
   
4,237
     
3,453
     
3,428
     
10,739
     
8,411
 
Service charges on deposit accounts
   
2,944
     
2,318
     
2,085
     
7,178
     
6,299
 
Net gains on assets
                                       
Mortgage loans
   
8,361
     
9,091
     
20,205
     
30,280
     
46,687
 
Securities available for sale
   
5
     
-
     
-
     
1,421
     
253
 
Mortgage loan servicing, net
   
1,271
     
(1,962
)
   
(644
)
   
4,476
     
(8,966
)
Other
   
2,877
     
1,871
     
1,937
     
6,778
     
5,698
 
Total Non-interest Income
   
19,695
     
14,771
     
27,011
     
60,872
     
58,382
 
Non-interest Expense
                                       
Compensation and employee benefits
   
21,659
     
19,883
     
21,954
     
60,064
     
54,742
 
Data processing
   
3,022
     
2,576
     
2,215
     
7,972
     
6,160
 
Occupancy, net
   
2,082
     
2,153
     
2,199
     
6,578
     
6,818
 
Interchange expense
   
1,202
     
1,201
     
831
     
3,351
     
2,416
 
Furniture, fixtures and equipment
   
1,075
     
1,034
     
999
     
3,112
     
3,125
 
Loan and collection
   
735
     
859
     
768
     
2,353
     
2,329
 
Communications
   
683
     
777
     
806
     
2,341
     
2,409
 
Conversion related expenses
   
275
     
1,143
     
643
     
1,636
     
1,045
 
Legal and professional
   
513
     
522
     
566
     
1,534
     
1,427
 
Advertising
   
666
     
164
     
589
     
1,319
     
1,636
 
FDIC deposit insurance
   
346
     
307
     
411
     
983
     
1,211
 
Correspondent bank service fees
   
77
     
115
     
101
     
292
     
294
 
Branch closure costs
   
-
     
-
     
-
     
-
     
417
 
Net (gains) losses on other real estate and repossessed assets
   
(28
)
   
6
     
46
     
(202
)
   
146
 
Other
   
2,205
     
1,796
     
1,513
     
5,736
     
5,531
 
Total Non-interest Expense
   
34,512
     
32,536
     
33,641
     
97,069
     
89,706
 
Income Before Income Tax
   
19,645
     
15,053
     
24,361
     
61,841
     
48,411
 
Income tax expense
   
3,683
     
2,665
     
4,777
     
11,454
     
9,245
 
Net Income
 
$
15,962
   
$
12,388
   
$
19,584
   
$
50,387
   
$
39,166
 
Net Income Per Common Share
                                       
Basic
 
$
0.74
   
$
0.57
   
$
0.90
   
$
2.32
   
$
1.78
 
Diluted
 
$
0.73
   
$
0.56
   
$
0.89
   
$
2.30
   
$
1.76
 

(1)
Beginning January 1, 2021, calculation is based on CECL methodology.  Prior to January 1, 2021, calculation was based on the probable incurred loss methodology.

8

INDEPENDENT BANK CORPORATION AND SUBSIDIARIES
Selected Financial Data

   
September 30,
2021
   
June 30,
2021
   
March 31,
2021
   
December 31,
2020
   
September 30,
2020
 
   
(unaudited)
 
   
(Dollars in thousands except per share data)
 
Three Months Ended
                             
Net interest income
 
$
33,803
   
$
31,393
   
$
30,284
   
$
30,993
   
$
31,966
 
Provision for credit losses (1)
   
(659
)
   
(1,425
)
   
(474
)
   
(421
)
   
975
 
Non-interest income
   
19,695
     
14,771
     
26,406
     
22,363
     
27,011
 
Non-interest expense
   
34,512
     
32,536
     
30,021
     
32,707
     
33,641
 
Income before income tax
   
19,645
     
15,053
     
27,143
     
21,070
     
24,361
 
Income tax expense
   
3,683
     
2,665
     
5,106
     
4,084
     
4,777
 
Net income
 
$
15,962
   
$
12,388
   
$
22,037
   
$
16,986
   
$
19,584
 
                                         
Basic earnings per share
 
$
0.74
   
$
0.57
   
$
1.01
   
$
0.78
   
$
0.90
 
Diluted earnings per share
   
0.73
     
0.56
     
1.00
     
0.77
     
0.89
 
Cash dividend per share
   
0.21
     
0.21
     
0.21
     
0.20
     
0.20
 
                                         
Average shares outstanding
   
21,515,669
     
21,749,654
     
21,825,937
     
21,866,326
     
21,881,562
 
Average diluted shares outstanding
   
21,726,346
     
21,966,829
     
22,058,503
     
22,112,829
     
22,114,692
 
                                         
Performance Ratios
                                       
Return on average assets
   
1.40
%
   
1.12
%
   
2.10
%
   
1.61
%
   
1.90
%
Return on average equity
   
15.93
     
12.78
     
23.51
     
17.82
     
21.36
 
Efficiency ratio (2)
   
63.47
     
69.24
     
53.48
     
60.59
     
56.36
 
                                         
As a Percent of Average Interest-Earning Assets (2)
                                 
Interest income
   
3.37
%
   
3.22
%
   
3.27
%
   
3.57
%
   
3.62
%
Interest expense
   
0.19
     
0.20
     
0.22
     
0.45
     
0.31
 
Net interest income
   
3.18
     
3.02
     
3.05
     
3.12
     
3.31
 
                                         
Average Balances
                                       
Loans
 
$
2,903,700
   
$
2,859,544
   
$
2,834,012
   
$
2,876,795
   
$
2,925,872
 
Securities available for sale
   
1,317,382
     
1,274,556
     
1,093,618
     
1,009,578
     
891,975
 
Total earning assets
   
4,296,662
     
4,223,570
     
4,047,952
     
3,984,080
     
3,887,455
 
Total assets
   
4,513,774
     
4,434,760
     
4,254,294
     
4,195,546
     
4,102,318
 
Deposits
   
3,934,937
     
3,879,715
     
3,698,811
     
3,632,758
     
3,559,070
 
Interest bearing liabilities
   
2,740,444
     
2,674,425
     
2,589,102
     
2,574,306
     
2,532,481
 
Shareholders' equity
   
397,542
     
388,780
     
380,111
     
379,232
     
364,714
 
                                         
End of Period
                                       
Capital
                                       
Tangible common equity ratio
   
8.02
%
   
8.21
%
   
8.08
%
   
8.56
%
   
8.23
%
Average equity to average assets
   
8.81
     
8.77
     
8.93
     
9.04
     
8.89
 
Common shareholders' equity per share of common stock
 
$
18.76
   
$
18.30
   
$
17.79
   
$
17.82
   
$
17.05
 
Tangible common equity per share of common stock
   
17.27
     
16.82
     
16.30
     
16.33
     
15.55
 
Total shares outstanding
   
21,321,092
     
21,632,912
     
21,773,734
     
21,853,800
     
21,885,368
 
                                         
Selected Balances
                                       
Loans
 
$
2,883,978
   
$
2,814,559
   
$
2,784,224
   
$
2,733,678
   
$
2,855,479
 
Securities available for sale
   
1,348,378
     
1,330,660
     
1,247,280
     
1,072,159
     
985,050
 
Total earning assets
   
4,405,189
     
4,246,410
     
4,209,017
     
3,979,397
     
3,962,824
 
Total assets
   
4,622,340
     
4,461,272
     
4,426,440
     
4,204,013
     
4,168,944
 
Deposits
   
4,012,068
     
3,862,466
     
3,858,575
     
3,637,355
     
3,597,745
 
Interest bearing liabilities
   
2,784,554
     
2,633,747
     
2,626,280
     
2,553,418
     
2,515,185
 
Shareholders' equity
   
400,031
     
395,974
     
387,329
     
389,522
     
373,092
 

(1)
Beginning January 1, 2021, calculation is based on CECL methodology.  Prior to January 1, 2021, calculation was based on the probable incurred loss methodology.
(2)
Presented on a fully tax equivalent basis assuming a marginal tax rate of 21%.

9

Reconciliation of Non-GAAP Financial Measures
Independent Bank Corporation

Independent Bank Corporation believes non-GAAP measures are meaningful because they reflect adjustments commonly made by management, investors, regulators and analysts to evaluate the adequacy of common equity and performance trends.  Tangible common equity is used by the Company to measure the quality of capital.

Reconciliation of Non-GAAP Financial Measures

   
Three Months Ended
September 30,
   
Nine Months Ended
September 30,
 
   
2021
   
2020
   
2021
   
2020
 
   
(Dollars in thousands)
             
Net Interest Margin, Fully Taxable Equivalent ("FTE")
                       
                         
Net interest income
 
$
33,803
   
$
31,966
   
$
95,480
   
$
92,619
 
Add:  taxable equivalent adjustment
   
492
     
258
     
1,374
     
602
 
Net interest income - taxable equivalent
 
$
34,295
   
$
32,224
   
$
96,854
   
$
93,221
 
Net interest margin (GAAP) (1)
   
3.13
%
   
3.28
%
   
3.04
%
   
3.40
%
Net interest margin (FTE) (1)
   
3.18
%
   
3.31
%
   
3.09
%
   
3.42
%

(1)
Annualized.

Tangible Common Equity Ratio

   
September 30,
2021
   
June 30,
2021
   
March 31,
2021
   
December 31,
2020
   
September 30,
2020
 
   
(Dollars in thousands)
 
Common shareholders' equity
 
$
400,031
   
$
395,974
   
$
387,329
   
$
389,522
   
$
373,092
 
Less:
                                       
Goodwill
   
28,300
     
28,300
     
28,300
     
28,300
     
28,300
 
Other intangibles
   
3,579
     
3,821
     
4,063
     
4,306
     
4,561
 
Tangible common equity
 
$
368,152
   
$
363,853
   
$
354,966
   
$
356,916
   
$
340,231
 
                                         
Total assets
 
$
4,622,340
   
$
4,461,272
   
$
4,426,440
   
$
4,204,013
   
$
4,168,944
 
Less:
                                       
Goodwill
   
28,300
     
28,300
     
28,300
     
28,300
     
28,300
 
Other intangibles
   
3,579
     
3,821
     
4,063
     
4,306
     
4,561
 
Tangible assets
 
$
4,590,461
   
$
4,429,151
   
$
4,394,077
   
$
4,171,407
   
$
4,136,083
 
                                         
Common equity ratio
   
8.65
%
   
8.88
%
   
8.75
%
   
9.27
%
   
8.95
%
Tangible common equity ratio
   
8.02
%
   
8.21
%
   
8.08
%
   
8.56
%
   
8.23
%
                                         
Tangible Common Equity per Share of Common Stock:
                                 
                                         
Common shareholders' equity
 
$
400,031
   
$
395,974
   
$
387,329
   
$
389,522
   
$
373,092
 
Tangible common equity
 
$
368,152
   
$
363,853
   
$
354,966
   
$
356,916
   
$
340,231
 
Shares of common stock outstanding (in thousands)
   
21,321
     
21,633
     
21,774
     
21,854
     
21,885


Common shareholders' equity per share of common stock
 
$
18.76
   
$
18.30
   
$
17.79
   
$
17.82
   
$
17.05
 
Tangible common equity per share of common stock
 
$
17.27
   
$
16.82
   
$
16.30
   
$
16.33
   
$
15.55
 

The tangible common equity ratio removes the effect of goodwill and other intangible assets from capital and total assets.  Tangible common equity per share of common stock removes the effect of goodwill and other intangible assets from common shareholders’ equity per share of common stock.


10
Exhibit 99.2

INDEPENDENT BANK CORPORATION AND SUBSIDIARIES
Supplemental Data

Non-performing assets (1)
                             
   
September 30,
2021
   
June 30,
2021
   
March 31,
2021
   
December 31,
2020
   
September 30,
2020
 
   
(Dollars in thousands)
 
Non-accrual loans
 
$
5,917
   
$
5,531
   
$
7,548
   
$
8,312
   
$
10,481
 
Loans 90 days or more past due and still accruing interest
   
-
     
14
     
-
     
-
     
266
 
Subtotal
   
5,917
     
5,545
     
7,548
     
8,312
     
10,747
 
Less:  Government guaranteed loans
   
327
     
427
     
459
     
439
     
510
 
Total non-performing loans
   
5,590
     
5,118
     
7,089
     
7,873
     
10,237
 
Other real estate and repossessed assets
   
224
     
296
     
346
     
766
     
1,487
 
Total non-performing assets
 
$
5,814
   
$
5,414
   
$
7,435
   
$
8,639
   
$
11,724
 
                                         
As a percent of Portfolio Loans
                                       
Non-performing loans
   
0.19
%
   
0.18
%
   
0.25
%
   
0.29
%
   
0.36
%
Allowance for credit losses
   
1.62
     
1.63
     
1.68
     
1.30
     
1.25
 
Non-performing assets to total assets
   
0.13
     
0.12
     
0.17
     
0.21
     
0.28
 
Allowance for credit losses as a percent of non-performing loans
   
837.19
     
897.34
     
659.54
     
450.01
     
349.43
 

(1)
Excludes loans classified as "trouble debt restructured" that are not past due.

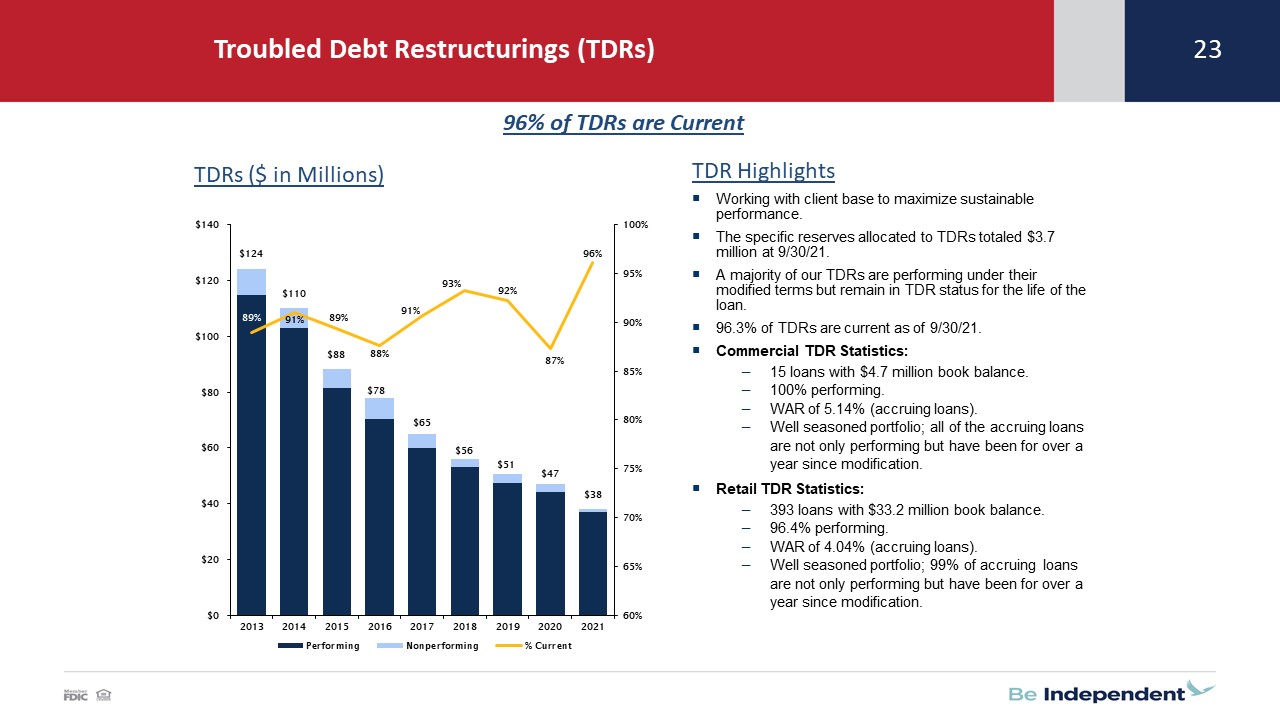
Troubled debt restructurings ("TDR")

   
September 30, 2021
 
   
Commercial
   
Retail (1)
   
Total
 
   
(In thousands)
 
Performing TDR's
 
$
4,692
   
$
32,037
   
$
36,729
 
Non-performing TDR's (2)
   
-
     
1,198
(3)

 
1,198
 
Total
 
$
4,692
   
$
33,235
   
$
37,927


December 31, 2020
 
   
Commercial
   
Retail (1)
   
Total
 
   
(In thousands)
 
Performing TDR's
 
$
7,956
   
$
36,385
   
$
44,341
 
Non-performing TDR's (2)
   
1,148
     
1,584
(3)
 
 
2,732
 
Total
 
$
9,104
   
$
37,969
   
$
47,073
 

(1)
Retail loans include mortgage and installment loan segments.
(2)
Included in non-performing assets table above.
(3)
Also includes loans on non-accrual at the time of modification until six payments are received on a timely basis.

1

Allowance for credit losses

   
Nine months ended
September 30,
 
   
2021
   
2020
 
   
Loans
   
Unfunded
Commitments
   
Loans
   
Unfunded
Commitments
 
   
(Dollars in thousands)
 
Balance at beginning of period
 
$
35,429
   
$
1,805
   
$
26,148
   
$
1,542
 
Additions (deductions)
                               
Impact of adoption of ASC 326
   
11,574
     
1,469
     
-
     
-
 
Provision for credit losses (1)
   
(2,558
)
   
-
     
12,884
     
-
 
Initial allowance on loans purchased with credit deterioration
   
134
     
-
     
-
     
-
 
Recoveries credited to allowance
   
3,918
     
-
     
2,404
     
-
 
Loans charged against the allowance
   
(1,698
)
   
-
     
(5,665
)
   
-
 
Additions included in non-interest expense
   
-
     
363
     
-
     
271
 
Balance at end of period
 
$
46,799
   
$
3,637
   
$
35,771
   
$
1,813
 
                                 
Net loans charged (recovered) against the allowance to average Portfolio Loans
   
(0.11
)%
           
0.16
%
       

(1)
Beginning January 1, 2021, calculation is based on CECL methodology.  Prior to January 1, 2021, calculation was based on the probable incurred loss methodology.

Capitalization

   
September 30,
2021
   
December 31,
2020
 
   
(In thousands)
 
Subordinated debt
 
$
39,338
   
$
39,281
 
Subordinated debentures
   
39,575
     
39,524
 
Amount not qualifying as regulatory capital
   
(562
)
   
(505
)
Amount qualifying as regulatory capital
   
78,351
     
78,300
 
Shareholders’ equity
               
Common stock
   
326,390
     
339,353
 
Retained earnings
   
66,543
     
40,145
 
Accumulated other comprehensive income
   
7,098
     
10,024
 
Total shareholders’ equity
   
400,031
     
389,522
 
Total capitalization
 
$
478,382
   
$
467,822
 

2

Non-Interest Income

   
Three months ended
   
Nine months ended
 
   
September 30,
   
June 30,
   
September 30,
   
September 30,
 
   
2021
   
2021
   
2020
   
2021
   
2020
 
   
(In thousands)
 
Interchange income
 
$
4,237
   
$
3,453
   
$
3,428
   
$
10,739
   
$
8,411
 
Service charges on deposit accounts
   
2,944
     
2,318
     
2,085
     
7,178
     
6,299
 
Net gains on assets
                                       
Mortgage loans
   
8,361
     
9,091
     
20,205
     
30,280
     
46,687
 
Securities
   
5
     
-
     
-
     
1,421
     
253
 
Mortgage loan servicing, net
   
1,271
     
(1,962
)
   
(644
)
   
4,476
     
(8,966
)
Investment and insurance commissions
   
678
     
634
     
530
     
1,895
     
1,478
 
Bank owned life insurance
   
145
     
127
     
215
     
411
     
750
 
Other
   
2,054
     
1,110
     
1,192
     
4,472
     
3,470
 
Total non-interest income
 
$
19,695
   
$
14,771
   
$
27,011
   
$
60,872
   
$
58,382
 

Capitalized Mortgage Loan Servicing Rights

   
Three months ended
September 30,
   
Nine months ended
September 30,
 
   
2021
   
2020
   
2021
   
2020
 
   
(In thousands)
 
Balance at beginning of period
 
$
22,431
   
$
13,773
   
$
16,904
   
$
19,171
 
Originated servicing rights capitalized
   
2,529
     
4,017
     
8,637
     
10,260
 
Change in fair value
   
(752
)
   
(2,387
)
   
(1,333
)
   
(14,028
)
Balance at end of period
 
$
24,208
   
$
15,403
   
$
24,208
   
$
15,403
 

3

Mortgage Loan Activity

   
Three months ended
   
Nine months ended
 
   
September 30,
   
June 30,
   
September 30,
   
September 30,
 
   
2021
   
2021
   
2020
   
2021
   
2020
 
   
(Dollars in thousands)
 
Mortgage loans originated
 
$
453,752
   
$
473,742
   
$
536,502
   
$
1,436,497
   
$
1,318,206
 
Mortgage loans sold
   
279,235
     
306,789
     
417,092
     
963,442
     
1,058,400
 
Net gains on mortgage loans
   
8,361
     
9,091
     
20,205
     
30,280
     
46,687
 
Net gains as a percent of mortgage loans sold  ("Loan Sales Margin")
   
2.99
%
   
2.96
%
   
4.84
%
   
3.14
%
   
4.41
%
Fair value adjustments included in the
                                       
Loan Sales Margin
   
0.04
     
(0.08
)
   
0.50
     
(0.40
)
   
0.81
 

Non-Interest Expense

   
Three months ended
   
Nine months ended
 
   
September 30,
   
June 30,
   
September 30,
   
September 30,
 
   
2021
   
2021
   
2020
   
2021
   
2020
 
   
(In thousands)
 
Compensation
 
$
11,507
   
$
11,136
   
$
10,294
   
$
32,764
   
$
30,665
 
Performance-based compensation
   
6,252
     
4,783
     
8,310
     
15,327
     
14,240
 
Payroll taxes and employee benefits
   
3,900
     
3,964
     
3,350
     
11,973
     
9,837
 
Compensation and employee benefits
   
21,659
     
19,883
     
21,954
     
60,064
     
54,742
 
Data processing
   
3,022
     
2,576
     
2,215
     
7,972
     
6,160
 
Occupancy, net
   
2,082
     
2,153
     
2,199
     
6,578
     
6,818
 
Interchange expense
   
1,202
     
1,201
     
831
     
3,351
     
2,416
 
Furniture, fixtures and equipment
   
1,075
     
1,034
     
999
     
3,112
     
3,125
 
Loan and collection
   
735
     
859
     
768
     
2,353
     
2,329
 
Communications
   
683
     
777
     
806
     
2,341
     
2,409
 
Conversion related expenses
   
275
     
1,143
     
643
     
1,636
     
1,045
 
Legal and professional
   
513
     
522
     
566
     
1,534
     
1,427
 
Advertising
   
666
     
164
     
589
     
1,319
     
1,636
 
FDIC deposit insurance
   
346
     
307
     
411
     
983
     
1,211
 
Amortization of intangible assets
   
242
     
243
     
255
     
727
     
765
 
Supplies
   
116
     
170
     
126
     
460
     
513
 
Costs related to unfunded lending commitments
   
369
     
26
     
41
     
363
     
271
 
Correspondent bank service fees
   
77
     
115
     
101
     
292
     
294
 
Provision for loss reimbursement on sold loans
   
36
     
25
     
46
     
95
     
160
 
Branch closure costs
   
-
     
-
     
-
     
-
     
417
 
Net (gains) losses on other real estate and repossessed assets
   
(28
)
   
6
     
46
     
(202
)
   
146
 
Other
   
1,442
     
1,332
     
1,045
     
4,091
     
3,822
 
Total non-interest expense
 
$
34,512
   
$
32,536
   
$
33,641
   
$
97,069
   
$
89,706
 

4

Average Balances and Tax Equivalent Rates

   
Three Months Ended
 
   
September 30,
 
         
2021
               
2020
       
   
Average
Balance
   
Interest
   
Rate (2)
   
Average
Balance
   
Interest
   
Rate (2)
 
   
(Dollars in thousands)
 
Assets
                                   
Taxable loans
 
$
2,896,552
   
$
30,061
     
4.13
%
 
$
2,918,946
   
$
30,323
     
4.14
%
Tax-exempt loans (1)
   
7,148
     
90
     
5.00
     
6,926
     
88
     
5.05
 
Taxable securities
   
951,445
     
3,922
     
1.65
     
733,977
     
3,450
     
1.88
 
Tax-exempt securities (1)
   
365,937
     
2,070
     
2.26
     
157,998
     
1,194
     
3.02
 
Interest bearing cash
   
57,153
     
23
     
0.16
     
51,181
     
14
     
0.11
 
Other investments
   
18,427
     
181
     
3.90
     
18,427
     
223
     
4.81
 
Interest Earning Assets
   
4,296,662
     
36,347
     
3.37
     
3,887,455
     
35,292
     
3.62
 
Cash and due from banks
   
57,151
                     
52,676
                 
Other assets, net
   
159,961
                     
162,187
                 
Total Assets
 
$
4,513,774
                   
$
4,102,318
                 
                                                 
Liabilities
                                               
Savings and interest- bearing checking
 
$
2,317,142
     
695
     
0.12
   
$
1,922,971
     
686
     
0.14
 
Time deposits
   
314,394
     
395
     
0.50
     
498,796
     
1,376
     
1.10
 
Other borrowings
   
108,908
     
962
     
3.50
     
110,714
     
1,006
     
3.61
 
Interest Bearing Liabilities
   
2,740,444
     
2,052
     
0.30
     
2,532,481
     
3,068
     
0.48
 
Non-interest bearing deposits
   
1,303,401
                     
1,137,303
                 
Other liabilities
   
72,387
                     
67,820
                 
Shareholders’ equity
   
397,542
                     
364,714


Total liabilities and shareholders’ equity
 
$
4,513,774
                   
$
4,102,318
                 
                                                 
Net Interest Income
         
$
34,295
                   
$
32,224
         
                                                 
Net Interest Income as a Percent of Average Interest Earning Assets
                   
3.18
%
                   
3.31
%


(1)
Interest on tax-exempt loans and securities is presented on a fully tax equivalent basis assuming a marginal tax rate of 21%.
(2)
Annualized

5

Average Balances and Tax Equivalent Rates

   
Nine Months Ended
 
   
September 30,
 
         
2021
               
2020
       
   
Average
Balance
   
Interest
   
Rate (2)
   
Average
Balance
   
Interest
   
Rate (2)
 
   
(Dollars in thousands)
 
Assets
                                   
Taxable loans
 
$
2,859,207
   
$
86,126
     
4.02
%
 
$
2,861,776
   
$
91,804
     
4.28
%
Tax-exempt loans (1)
   
6,801
     
256
     
5.03
     
7,266
     
273
     
5.02
 
Taxable securities
   
881,465
     
10,374
     
1.57
     
579,704
     
9,356
     
2.15
 
Tax-exempt securities (1)
   
347,873
     
5,845
     
2.24
     
114,187
     
2,682
     
3.13
 
Interest bearing cash
   
76,533
     
74
     
0.13
     
52,265
     
160
     
0.41
 
Other investments
   
18,427
     
555
     
4.03
     
18,404
     
694
     
5.04
 
Interest Earning Assets
   
4,190,306
     
103,230
     
3.29
     
3,633,602
     
104,969
     
3.85
 
Cash and due from banks
   
55,883
                     
49,345
                 
Other assets, net
   
155,701
                     
163,503
                 
Total Assets
 
$
4,401,890
                   
$
3,846,450
                 
                                                 
Liabilities
                                               
Savings and interest- bearing checking
 
$
2,239,887
     
2,059
     
0.12
   
$
1,764,933
     
3,121
     
0.24
 
Time deposits
   
319,792
     
1,429
     
0.60
     
529,248
     
6,029
     
1.52
 
Other borrowings
   
108,866
     
2,888
     
3.55
     
121,195
     
2,598
     
2.86
 
Interest Bearing Liabilities
   
2,668,545
     
6,376
     
0.32
     
2,415,376
     
11,748
     
0.65
 
Non-interest bearing deposits
   
1,279,006
                     
1,016,286
                 
Other liabilities
   
65,464
                     
62,984
                 
Shareholders’ equity
   
388,875
                     
351,804


Total liabilities and shareholders’ equity
 
$
4,401,890
                   
$
3,846,450
                 
                                                 
Net Interest Income
         
$
96,854
                   
$
93,221
         
                                                 
Net Interest Income as a Percent of Average Interest Earning Assets
                   
3.09
%
                   
3.42
%


(1)
Interest on tax-exempt loans and securities is presented on a fully tax equivalent basis assuming a marginal tax rate of 21%.
(2)
Annualized

6

Commercial Loan Portfolio Analysis as of September 30, 2021

   
Total Commercial Loans
 
         
Watch Credits
   
Percent of
Loan
 
Loan Category
 
All Loans
   
Performing
   
Non-accrual
   
Total
   
Category in
Watch Credit
 
   
(Dollars in thousands)
 
Land
 
$
14,751
   
$
73
   
$
-
   
$
73
     
0.5
%
Land Development
   
11,912
     
33
     
-
     
33
     
0.3
 
Construction
   
86,284
     
-
     
-
     
-
     
0.0
 
Income Producing
   
376,010
     
1,964
     
-
     
1,964
     
0.5
 
Owner Occupied
   
350,819
     
19,997
     
-
     
19,997
     
5.7
 
Total Commercial Real Estate Loans
 
$
839,776
   
$
22,067
     
-
   
$
22,067
     
2.6
 
                                         
Other Commercial Loans
 
$
383,026
   
$
4,488
     
189
   
$
4,677
     
1.2
 
Total non-performing commercial loans
                 
$
189
                 

Commercial Loan Portfolio Analysis as of December 31, 2020

   
Total Commercial Loans
 
         
Watch Credits
   
Percent of
Loan
 
Loan Category
 
All Loans
   
Performing
   
Non-accrual
   
Total
   
Category in
Watch Credit
 
   
(Dollars in thousands)
 
Land
 
$
14,567
   
$
116
   
$
-
   
$
116
     
0.8
%
Land Development
   
12,176
     
36
     
-
     
36
     
0.3
 
Construction
   
68,724
     
36
     
-
     
36
     
0.1
 
Income Producing
   
358,603
     
3,699
     
-
     
3,699
     
1.0
 
Owner Occupied
   
360,510
     
24,693
     
745
     
25,438
     
7.1
 
Total Commercial Real Estate Loans
 
$
814,580
   
$
28,580
     
745
   
$
29,325
     
3.6
 
                                         
Other Commercial Loans
 
$
427,835
   
$
16,059
     
695
   
$
16,754
     
3.9
 
Total non-performing commercial loans
                 
$
1,440


7

Exhibit 99.3

 Independent Bank Corporation (IBCP)  Earnings CallThird Quarter 2021October 26, 2021 
 

 Cautionary note regarding forward-looking statements  This presentation contains forward-looking statements about Independent Bank Corporation. Statements that are not historical or current facts, including statements about beliefs and expectations, are forward-looking statements and are based on the information available to, and assumptions and estimates made by, management as of the date hereof. These forward-looking statements cover, among other things, anticipated future revenue and expenses and the future plans and prospects of Independent Bank Corporation. Forward-looking statements involve inherent risks and uncertainties, and important factors could cause actual results to differ materially from those anticipated. The COVID-19 pandemic is adversely affecting Independent Bank Corporation, its customers, counterparties, employees, and third-party service providers, and the ultimate extent of the impacts on its business, financial position, results of operations, liquidity, and prospects is uncertain. Continued deterioration in general business and economic conditions or turbulence in domestic or global financial markets could adversely affect Independent Bank Corporation’s revenues and the values of its assets and liabilities, reduce the availability of funding from certain financial institutions, lead to a tightening of credit, and increase stock price volatility. In addition, changes to statutes, regulations, or regulatory policies or practices could affect Independent Bank Corporation in substantial and unpredictable ways. Independent Bank Corporation’s results could also be adversely affected by changes in interest rates; further increases in unemployment rates; deterioration in the credit quality of its loan portfolios or in the value of the collateral securing those loans; deterioration in the value of its investment securities; legal and regulatory developments; litigation; increased competition from both banks and non-banks; changes in the level of tariffs and other trade policies of the United States and its global trading partners; changes in customer behavior and preferences; breaches in data security; failures to safeguard personal information; effects of mergers and acquisitions and related integration; effects of critical accounting policies and judgments; and management’s ability to effectively manage credit risk, market risk, operational risk, compliance risk, strategic risk, interest rate risk, liquidity risk and reputation risk. Certain risks and important factors that could affect Independent Bank Corporation's future results are identified in its Annual Report on Form 10-K for the year ended December 31, 2020 and other reports filed with the SEC, including among other things under the heading “Risk Factors” in such Annual Report on Form 10-K. Any forward-looking statement speaks only as of the date on which it is made, and Independent Bank Corporation undertakes no obligation to update any forward-looking statement, whether to reflect events or circumstances after the date on which the statement is made, to reflect new information or the occurrence of unanticipated events, or otherwise.  2 
 

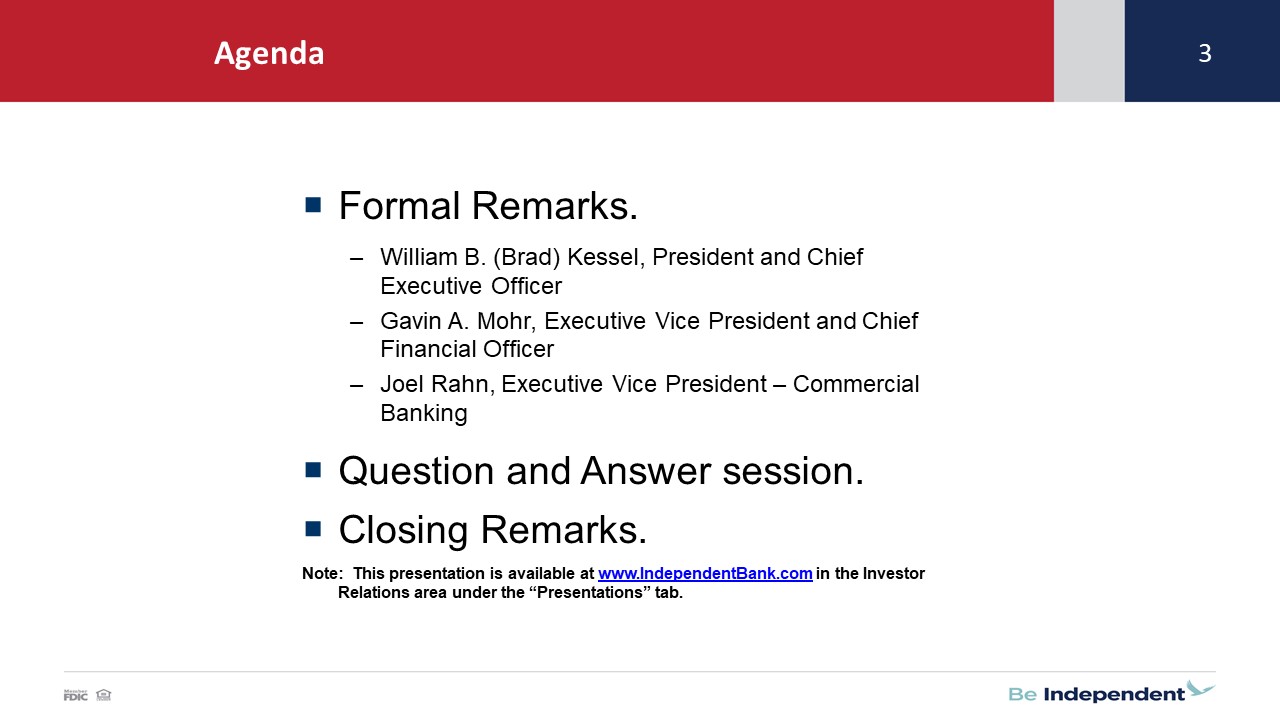
 Agenda  Formal Remarks.William B. (Brad) Kessel, President and Chief Executive OfficerGavin A. Mohr, Executive Vice President and Chief Financial OfficerJoel Rahn, Executive Vice President – Commercial Banking Question and Answer session.Closing Remarks.Note: This presentation is available at www.IndependentBank.com in the Investor Relations area under the “Presentations” tab.  3 
 

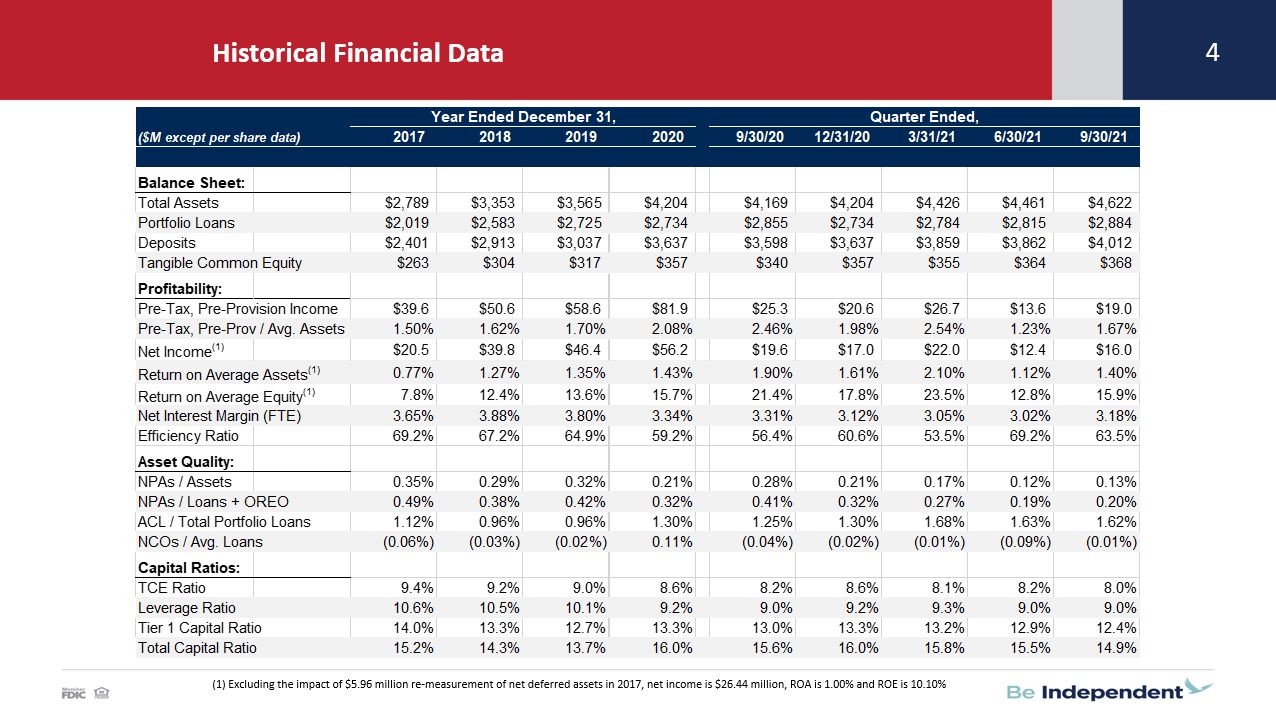
 Historical Financial Data  4  (1) Excluding the impact of $5.96 million re-measurement of net deferred assets in 2017, net income is $26.44 million, ROA is 1.00% and ROE is 10.10% 
 

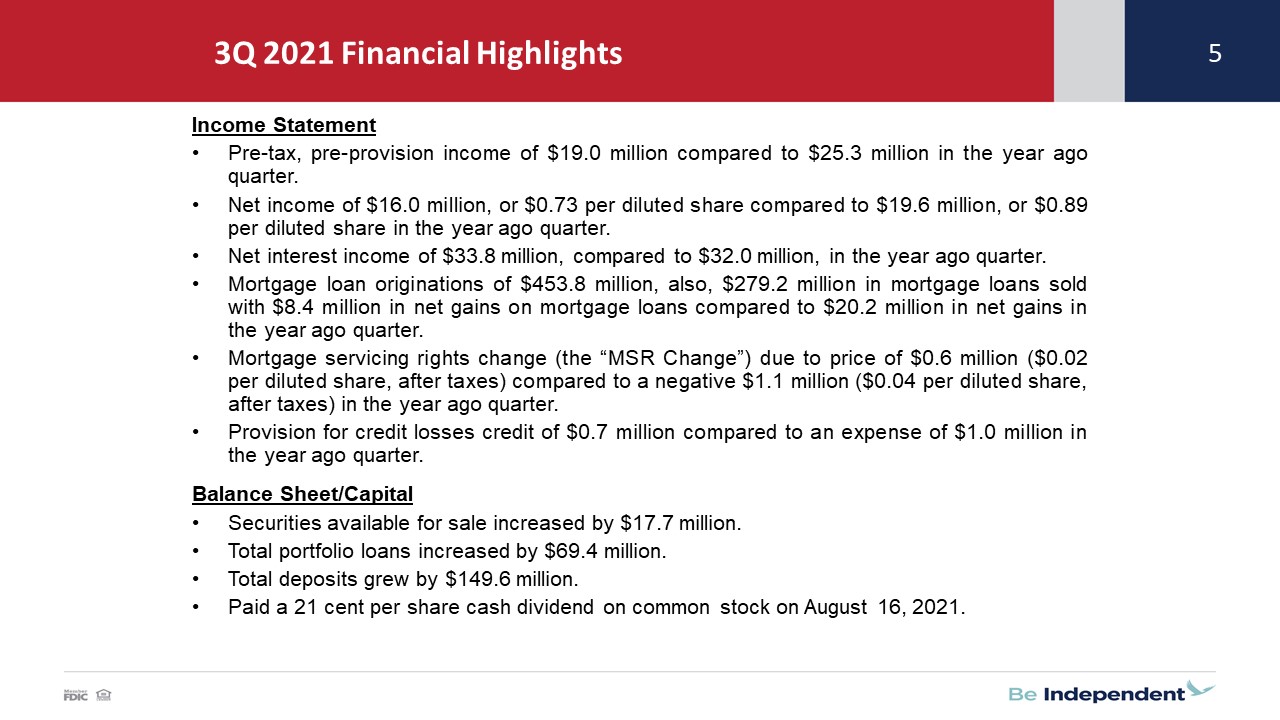
 3Q 2021 Financial Highlights  Income StatementPre-tax, pre-provision income of $19.0 million compared to $25.3 million in the year ago quarter.Net income of $16.0 million, or $0.73 per diluted share compared to $19.6 million, or $0.89 per diluted share in the year ago quarter.Net interest income of $33.8 million, compared to $32.0 million, in the year ago quarter.Mortgage loan originations of $453.8 million, also, $279.2 million in mortgage loans sold with $8.4 million in net gains on mortgage loans compared to $20.2 million in net gains in the year ago quarter. Mortgage servicing rights change (the “MSR Change”) due to price of $0.6 million ($0.02 per diluted share, after taxes) compared to a negative $1.1 million ($0.04 per diluted share, after taxes) in the year ago quarter. Provision for credit losses credit of $0.7 million compared to an expense of $1.0 million in the year ago quarter. Balance Sheet/CapitalSecurities available for sale increased by $17.7 million.Total portfolio loans increased by $69.4 million.Total deposits grew by $149.6 million.Paid a 21 cent per share cash dividend on common stock on August 16, 2021.  5 
 

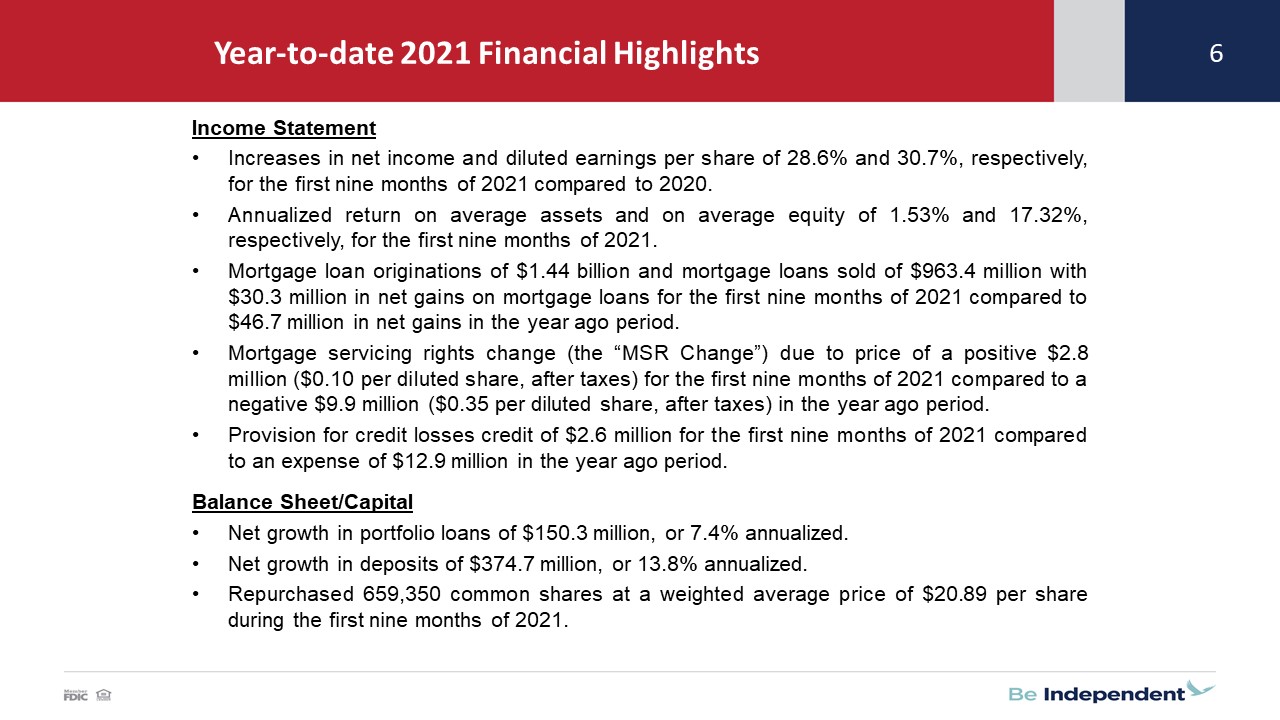
 Year-to-date 2021 Financial Highlights  Income StatementIncreases in net income and diluted earnings per share of 28.6% and 30.7%, respectively, for the first nine months of 2021 compared to 2020.Annualized return on average assets and on average equity of 1.53% and 17.32%, respectively, for the first nine months of 2021.Mortgage loan originations of $1.44 billion and mortgage loans sold of $963.4 million with $30.3 million in net gains on mortgage loans for the first nine months of 2021 compared to $46.7 million in net gains in the year ago period. Mortgage servicing rights change (the “MSR Change”) due to price of a positive $2.8 million ($0.10 per diluted share, after taxes) for the first nine months of 2021 compared to a negative $9.9 million ($0.35 per diluted share, after taxes) in the year ago period. Provision for credit losses credit of $2.6 million for the first nine months of 2021 compared to an expense of $12.9 million in the year ago period. Balance Sheet/CapitalNet growth in portfolio loans of $150.3 million, or 7.4% annualized.Net growth in deposits of $374.7 million, or 13.8% annualized.Repurchased 659,350 common shares at a weighted average price of $20.89 per share during the first nine months of 2021.  6 
 

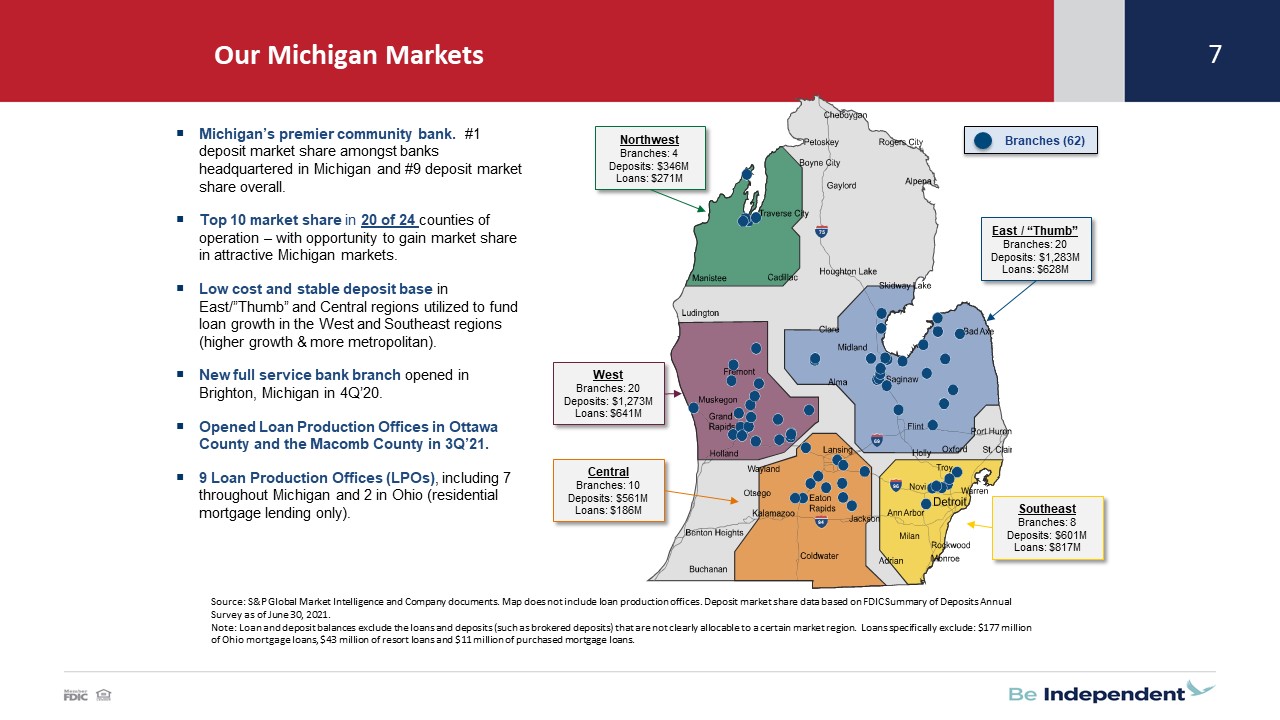
 Our Michigan Markets  7  Source: S&P Global Market Intelligence and Company documents. Map does not include loan production offices. Deposit market share data based on FDIC Summary of Deposits Annual Survey as of June 30, 2021.Note: Loan and deposit balances exclude the loans and deposits (such as brokered deposits) that are not clearly allocable to a certain market region. Loans specifically exclude: $177 million of Ohio mortgage loans, $43 million of resort loans and $11 million of purchased mortgage loans.      94          96          75          69      Michigan’s premier community bank. #1 deposit market share amongst banks headquartered in Michigan and #9 deposit market share overall. Top 10 market share in 20 of 24 counties of operation – with opportunity to gain market share in attractive Michigan markets.Low cost and stable deposit base in East/”Thumb” and Central regions utilized to fund loan growth in the West and Southeast regions (higher growth & more metropolitan).New full service bank branch opened in Brighton, Michigan in 4Q’20.Opened Loan Production Offices in Ottawa County and the Macomb County in 3Q’21. 9 Loan Production Offices (LPOs), including 7 throughout Michigan and 2 in Ohio (residential mortgage lending only).    Branches (62)    East / “Thumb”Branches: 20Deposits: $1,283MLoans: $628M  SoutheastBranches: 8Deposits: $601MLoans: $817M  CentralBranches: 10Deposits: $561MLoans: $186M  WestBranches: 20Deposits: $1,273MLoans: $641M  NorthwestBranches: 4Deposits: $346MLoans: $271M 
 

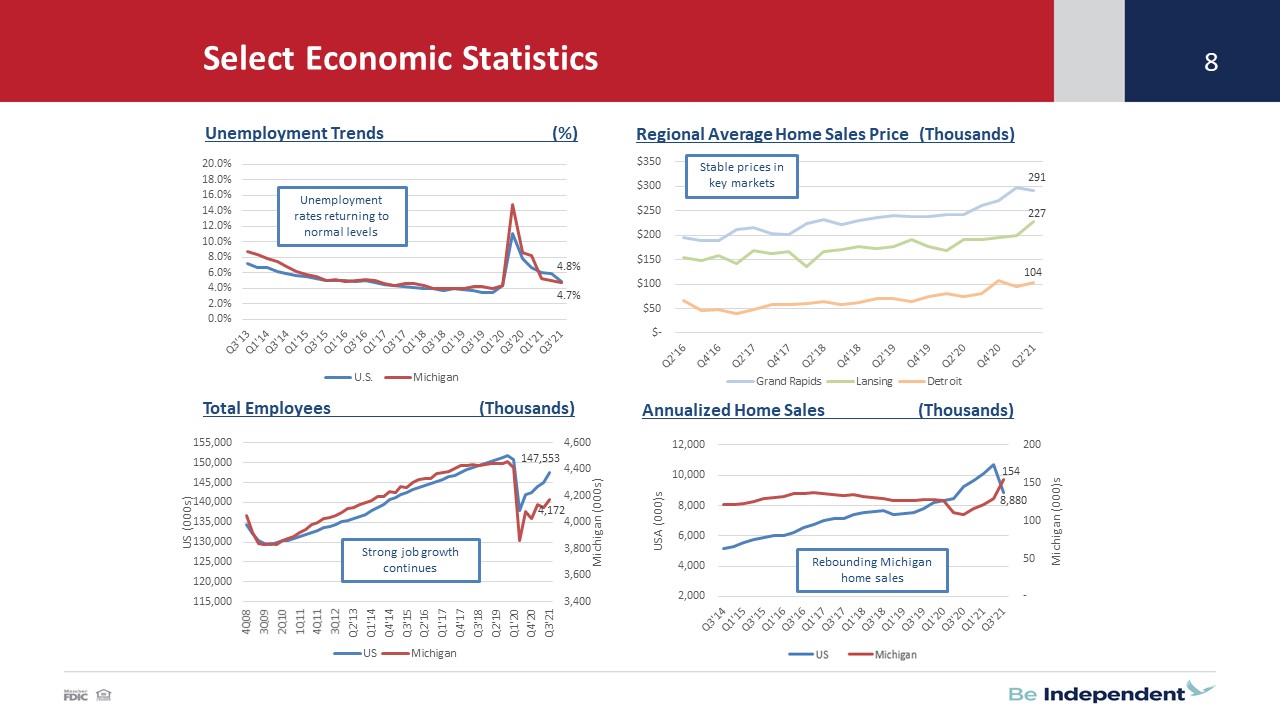
 Select Economic Statistics  8  Unemployment Trends (%)  Total Employees (Thousands)  Regional Average Home Sales Price (Thousands)  Annualized Home Sales (Thousands)  Select Economic Statistics   Unemployment rates returning to normal levels  Stable prices in key markets  Strong job growth continues  Rebounding Michigan home sales 
 

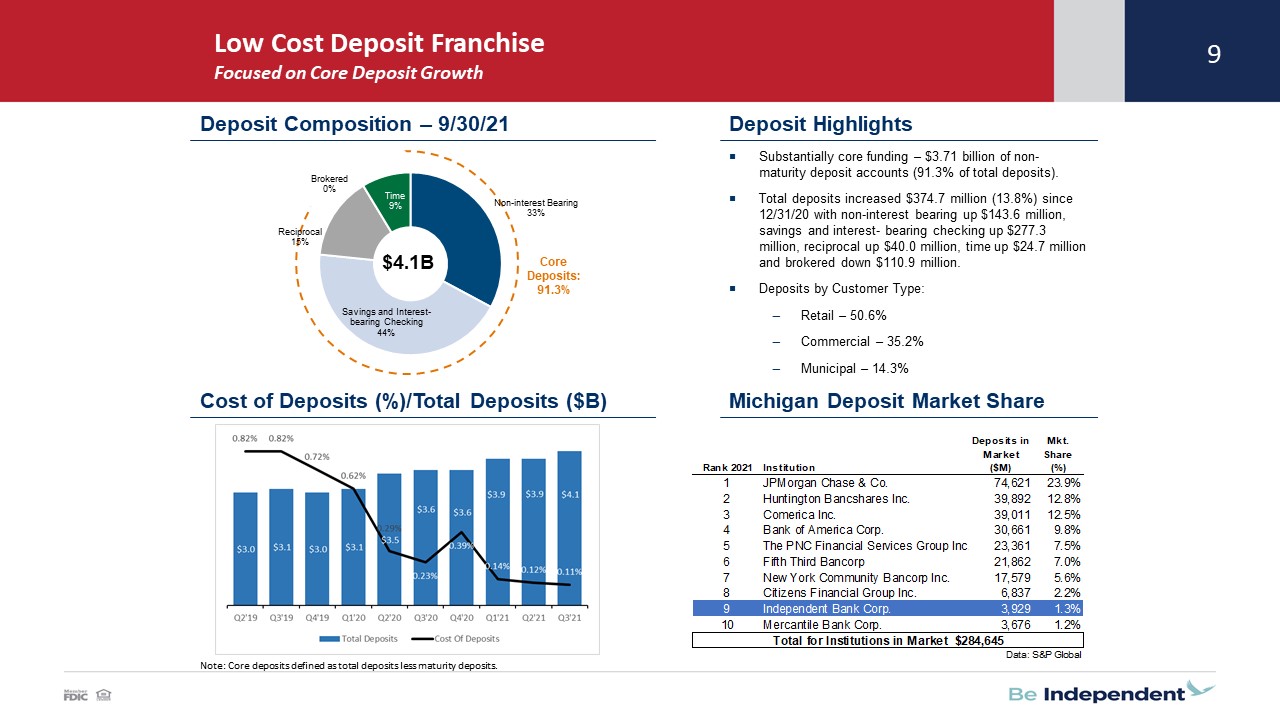
     Low Cost Deposit Franchise Focused on Core Deposit Growth  9  Substantially core funding – $3.71 billion of non-maturity deposit accounts (91.3% of total deposits).Total deposits increased $374.7 million (13.8%) since 12/31/20 with non-interest bearing up $143.6 million, savings and interest- bearing checking up $277.3 million, reciprocal up $40.0 million, time up $24.7 million and brokered down $110.9 million.Deposits by Customer Type:Retail – 50.6%Commercial – 35.2%Municipal – 14.3%  Deposit Composition – 9/30/21  Deposit Highlights  Michigan Deposit Market Share  $4.1B  Core Deposits: 91.3%  Cost of Deposits (%)/Total Deposits ($B)  Note: Core deposits defined as total deposits less maturity deposits.  
 

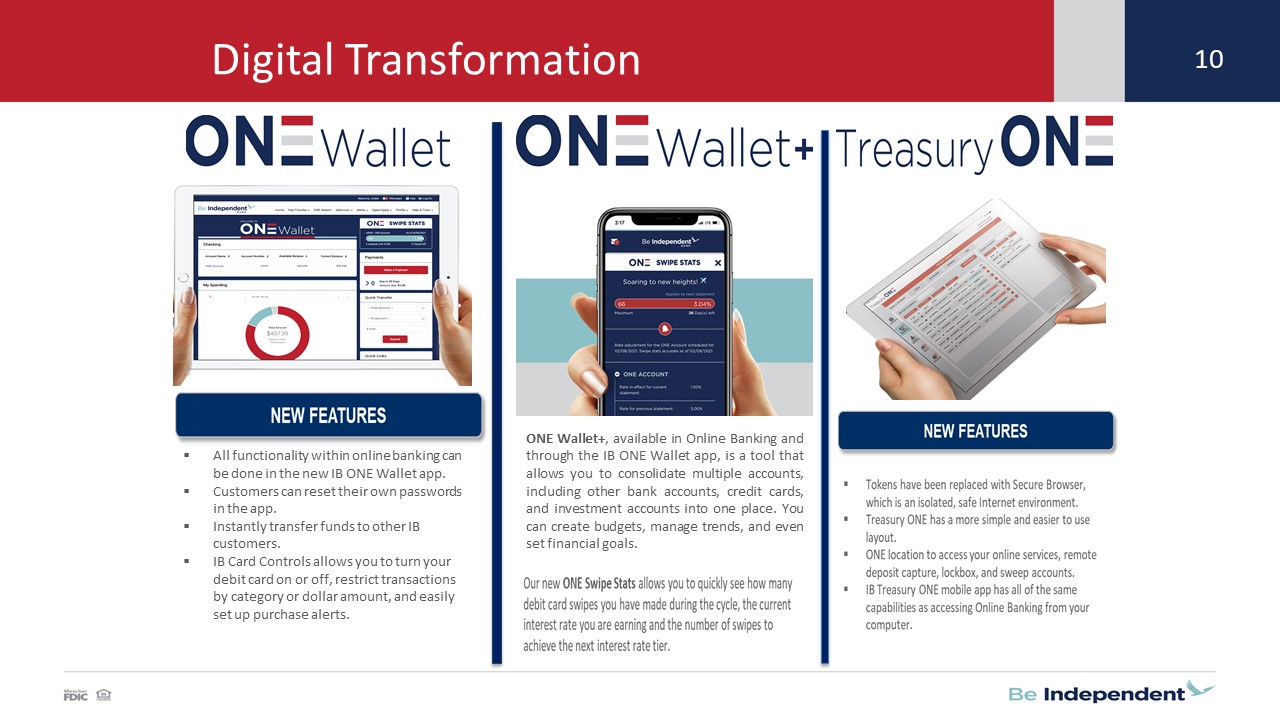
  10  10  All functionality within online banking can be done in the new IB ONE Wallet app.Customers can reset their own passwords in the app. Instantly transfer funds to other IB customers. IB Card Controls allows you to turn your debit card on or off, restrict transactions by category or dollar amount, and easily set up purchase alerts.       ONE Wallet+, available in Online Banking and through the IB ONE Wallet app, is a tool that allows you to consolidate multiple accounts, including other bank accounts, credit cards, and investment accounts into one place. You can create budgets, manage trends, and even set financial goals.  Digital Transformation 
 

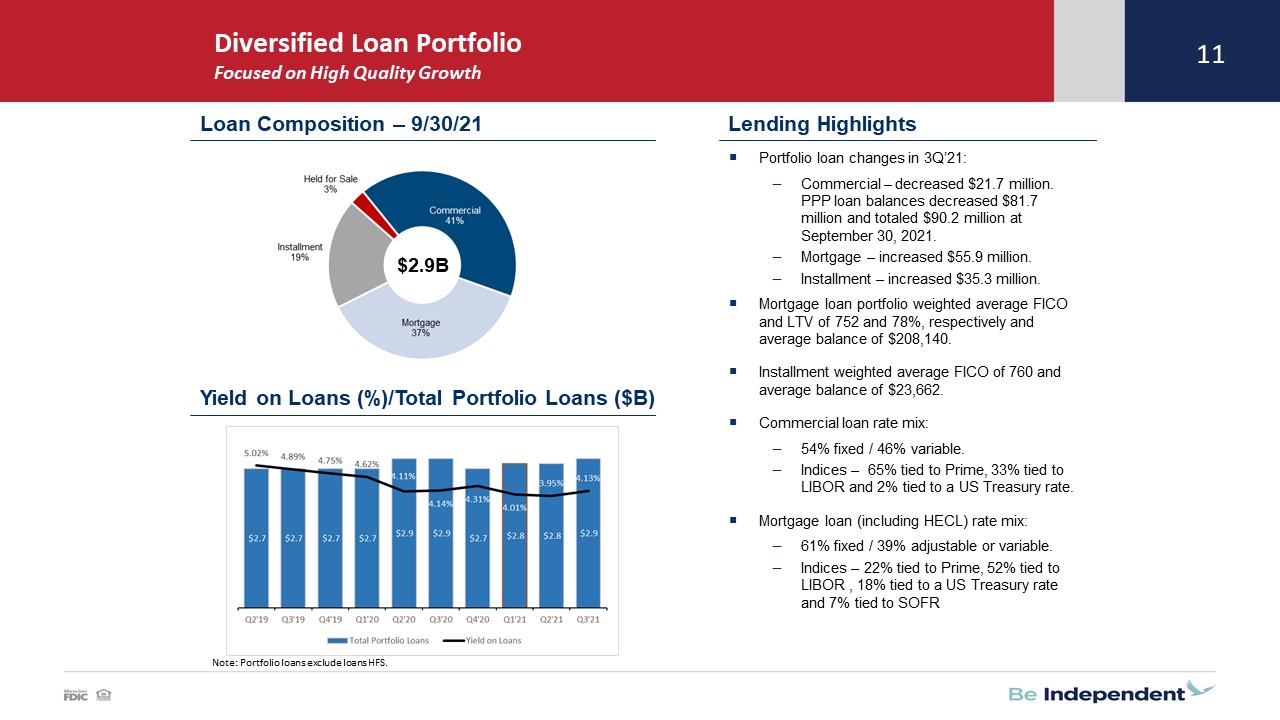
 Diversified Loan PortfolioFocused on High Quality Growth  11  Lending Highlights  Note: Portfolio loans exclude loans HFS.  Portfolio loan changes in 3Q’21:Commercial – decreased $21.7 million. PPP loan balances decreased $81.7 million and totaled $90.2 million at September 30, 2021.Mortgage – increased $55.9 million.Installment – increased $35.3 million.Mortgage loan portfolio weighted average FICO and LTV of 752 and 78%, respectively and average balance of $208,140.Installment weighted average FICO of 760 and average balance of $23,662.Commercial loan rate mix:54% fixed / 46% variable.Indices – 65% tied to Prime, 33% tied to LIBOR and 2% tied to a US Treasury rate.Mortgage loan (including HECL) rate mix: 61% fixed / 39% adjustable or variable. Indices – 22% tied to Prime, 52% tied to LIBOR , 18% tied to a US Treasury rate and 7% tied to SOFR  Loan Composition – 9/30/21  $2.9B  Yield on Loans (%)/Total Portfolio Loans ($B) 
 

 COVID-19 Programs – Loan Forbearances  12  Highlights  Loan Forbearances    The table above reflects the status of loan forbearances. The percent of the loan portfolio is based on loan dollars.Loan Forbearances:Forbearance period is generally three months for mortgage and installment loans and three or six months for commercial loans. Retail (mortgage and installment) loan forbearances are primarily principal & interest deferrals.Commercial loan forbearances are primarily principal deferrals only.Forbearance requests peaked in early June 2020 and have since significantly abated.     9/30/2021      6/30/2021      12/31/2020      6/30/2020      % Change from 6/30/20     Loan Type  #  $ (000’s)  % of portfolio  #  $ (000’s)  % of portfolio  #  $ (000’s)  % of portfolio  #  $ (000's)  % of portfolio  #  $   Commercial   -  $ -   0.0%   -  $ -   0.0%  2  $163   0.0%  386  $210,486   15.4%  -100.0%  -100.0%   Mortgage  39  5,901  0.5%  82  12,416  1.2%  134  19,830  2.0%  388  81,212  7.8%  -89.9%  -92.7%   Installment  7  109  0.0%  18  327  0.1%  48  1,412  0.3%  280  7,459  1.6%  -97.5%  -98.5%   Total   46   $6,011  0.2%   100   $12,743  0.5%   184    $21,405   0.8%   1054    $299,157   10.4%  -95.6%  -98.0%                                                Loans serviced for others  64  $7,986  0.3%  150  $20,231  0.6%  288  $42,897   1.4%  773  $114,839   4.2%  -91.7%  -93.0% 
 

 COVID-19 Programs – Paycheck Protection Program (“PPP”)  13  PPP Loan Portfolio    PPP – Round 1             Description  9/30/2021    6/31/2021    9/30/2020      #  ($ in 000’s)  #  ($ in 000’s)  #  ($ in 000’s)  Loans outstanding at quarter-end  20  $ 1,262  298   $ 42,315   2,117  $261,182  Average loans outstanding for the quarter  n/a  2,699  n/a   78,747  n/a  261,543  Cumulative forgiveness applications submitted at quarter-end  2,085  260,015  1,882   231,715  197  -  Cumulative forgiveness applications approved at quarter-end  2,082  259,613  1,870   229,429  -  -  Net fees accreted into interest income during the quarter  n/a  381  n/a   981  n/a  1,321  Net unaccreted fees remaining at quarter-end   n/a  0  n/a   381  n/a  6,494  Average loan yield for the quarter   n/a  11.51%  n/a   5.98%  n/a  3.04%  Note: PPP Round 1 loan activity began in the second quarter of 2020. PPP Round 2 loan activity began in the first quarter of 2021.    PPP – Round 2             Description  9/30/2021    6/30/2021    3/31/2021      #  ($ in 000’s)  #  ($ in 000’s)  #  ($ in 000’s)  Loans outstanding at quarter-end  806   $ 88,888  1,409  $ 129,573   1,250  $ 128,240  Average loans outstanding for the quarter  n/a  100,551  n/a   133,239  n/a  72,011  Cumulative forgiveness applications submitted at quarter-end  831  51,370  166  8,843  -  -  Cumulative forgiveness applications approved at quarter-end  810  50,535  164   8,828  -  -  Net fees accreted into interest income during the quarter  n/a  2,249  n/a   832  n/a  229  Net unaccreted fees remaining at quarter-end   n/a  3,178  n/a   5,429  n/a  5,454  Average loan yield for the quarter   n/a  9.17%  n/a   3.50%  n/a  2.25% 
 

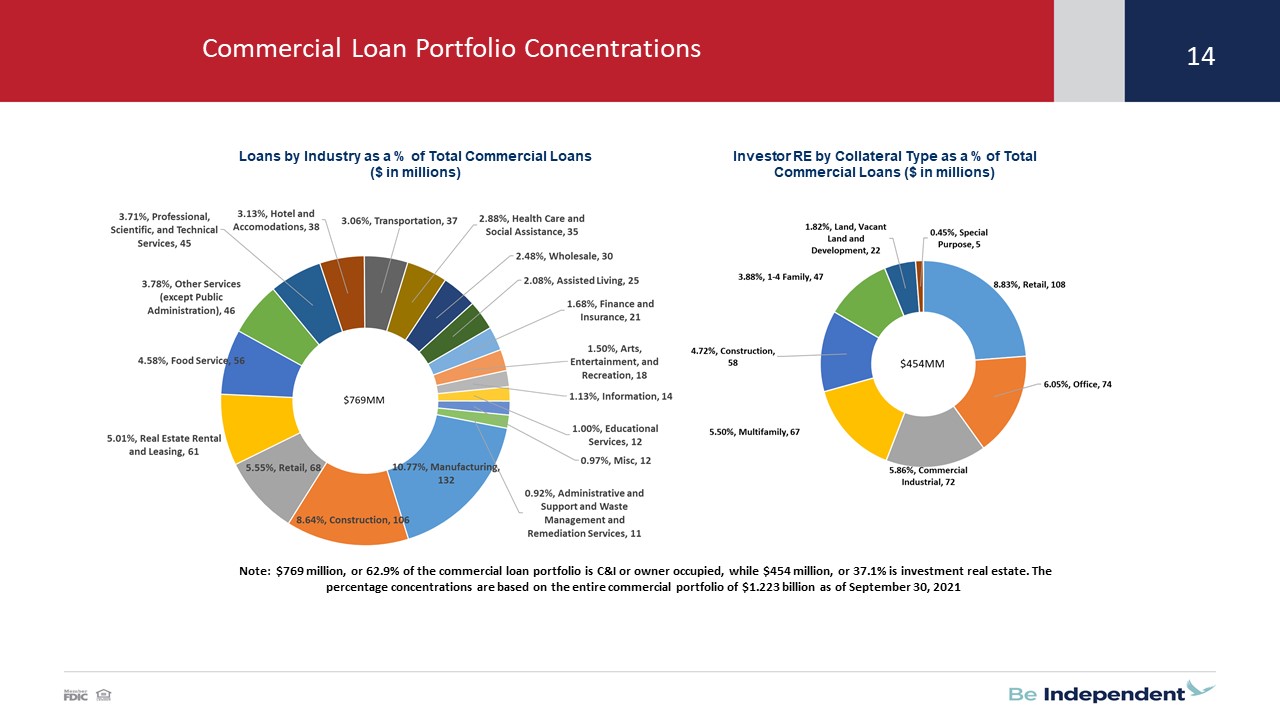
 Loans by Industry as a % of Total Commercial Loans ($ in millions)  Investor RE by Collateral Type as a % of Total Commercial Loans ($ in millions)   14  Commercial Loan Portfolio Concentrations  14   Note: $769 million, or 62.9% of the commercial loan portfolio is C&I or owner occupied, while $454 million, or 37.1% is investment real estate. The percentage concentrations are based on the entire commercial portfolio of $1.223 billion as of September 30, 2021 
 

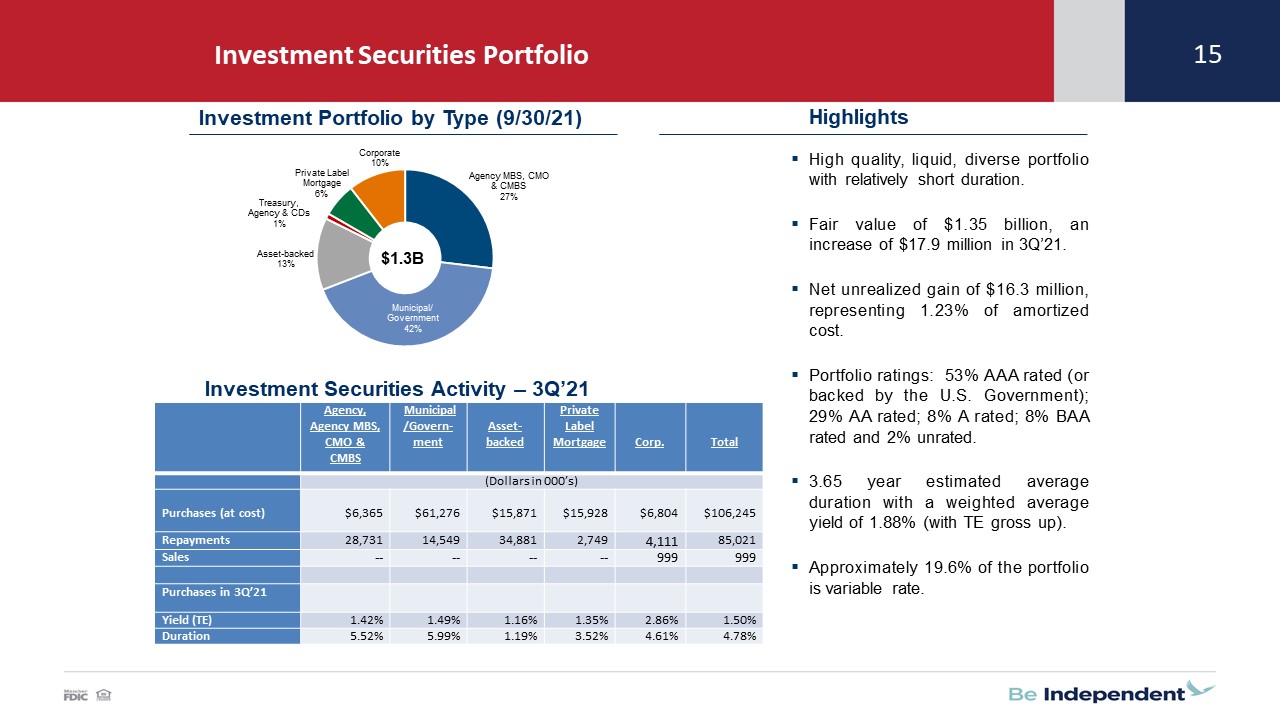
 Investment Securities Portfolio  15  Highlights  High quality, liquid, diverse portfolio with relatively short duration.Fair value of $1.35 billion, an increase of $17.9 million in 3Q’21.Net unrealized gain of $16.3 million, representing 1.23% of amortized cost.Portfolio ratings: 53% AAA rated (or backed by the U.S. Government); 29% AA rated; 8% A rated; 8% BAA rated and 2% unrated.3.65 year estimated average duration with a weighted average yield of 1.88% (with TE gross up).Approximately 19.6% of the portfolio is variable rate.    $1.3B  Investment Portfolio by Type (9/30/21)  Investment Securities Activity – 3Q’21  e.    Agency, Agency MBS, CMO & CMBS   Municipal/Govern-ment   Asset-backed  Private Label Mortgage    Corp.    Total     (Dollars in 000’s)            Purchases (at cost)  $6,365  $61,276  $15,871  $15,928  $6,804  $106,245  Repayments   28,731  14,549  34,881  2,749  4,111  85,021  Sales  --  --  --  --  999  999                Purchases in 3Q’21              Yield (TE)  1.42%  1.49%  1.16%  1.35%  2.86%  1.50%  Duration   5.52%  5.99%  1.19%  3.52%  4.61%  4.78% 
 

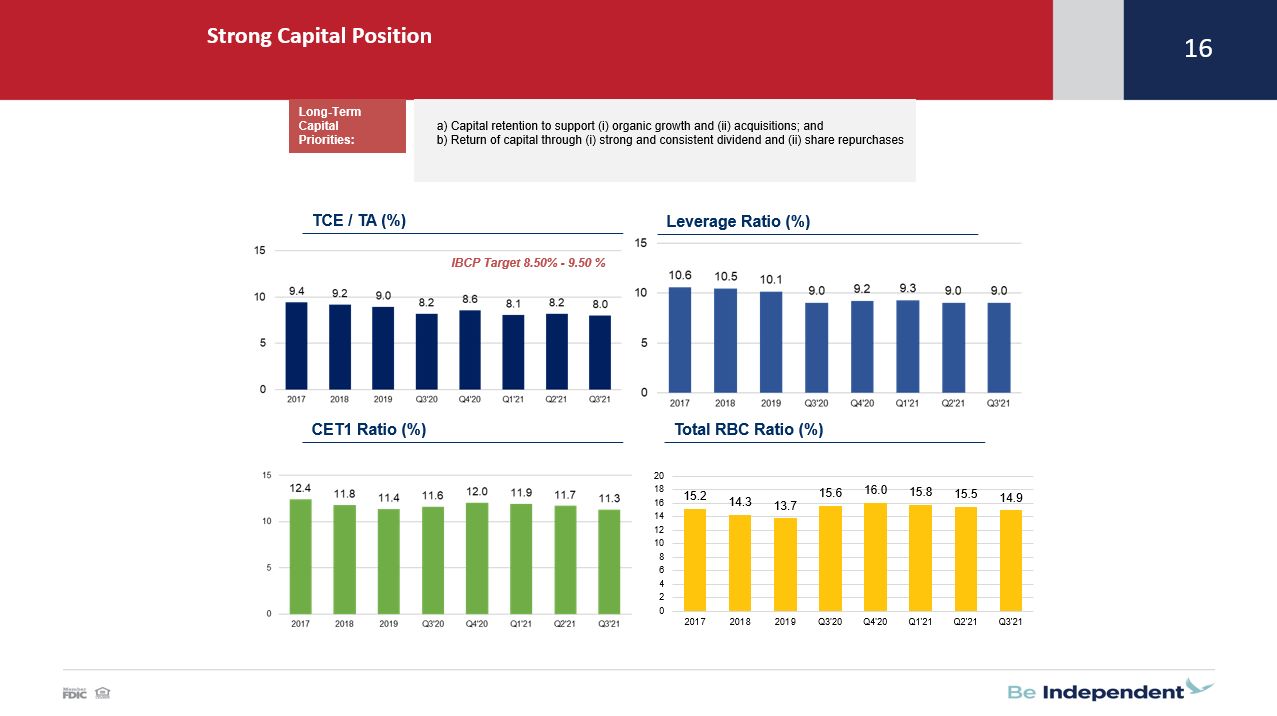
 Strong Capital Position  16   TCE / TA (%)   Leverage Ratio (%)   CET1 Ratio (%)   Total RBC Ratio (%)   IBCP Target 8.50% - 9.50 %  Capital retention to support (i) organic growth and (ii) acquisitions; and Return of capital through (i) strong and consistent dividend and (ii) share repurchases  Long-Term Capital Priorities:  Strong Capital Position 
 

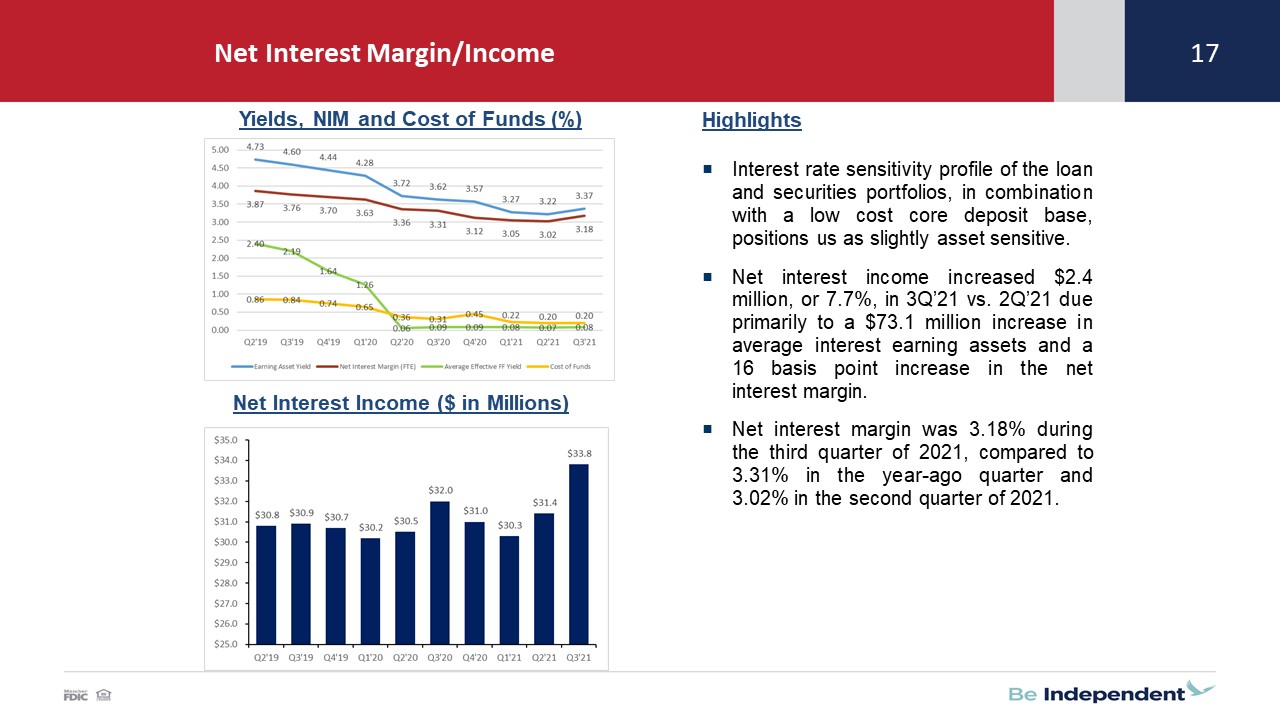
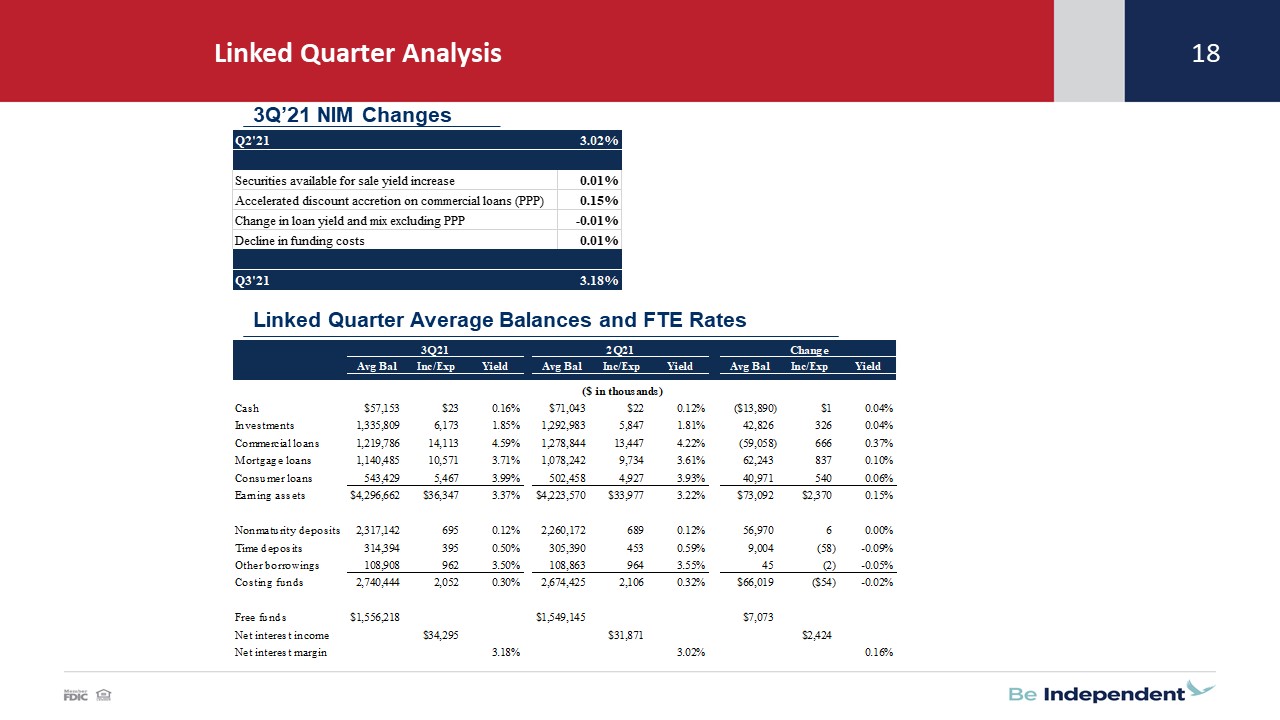
 HighlightsInterest rate sensitivity profile of the loan and securities portfolios, in combination with a low cost core deposit base, positions us as slightly asset sensitive.Net interest income increased $2.4 million, or 7.7%, in 3Q’21 vs. 2Q’21 due primarily to a $73.1 million increase in average interest earning assets and a 16 basis point increase in the net interest margin. Net interest margin was 3.18% during the third quarter of 2021, compared to 3.31% in the year-ago quarter and 3.02% in the second quarter of 2021.  Yields, NIM and Cost of Funds (%)  Net Interest Income ($ in Millions)   Net Interest Margin/Income  17 
 

 Linked Quarter Analysis  18  3Q’21 NIM Changes  Linked Quarter Average Balances and FTE Rates   
 

 Strong Non-interest Income  19  Diverse sources of non-interest income, representing 36.8% of operating revenue in 3Q’21.3Q’21 interchange income of $4.2 million compared to $3.4 million in the prior year quarter. This increase was primarily due to an increase in transaction volume and a new switch contract that was executed in the fourth quarter of 2020. Mortgage banking: $8.4 million in net gains on mortgage loans in 3Q’21 vs. $20.2 million in the year ago quarter. A combination of lower mortgage loan sales volume, reduced profit margins and fair value adjustments led to this decrease.$453.8 million in mortgage loan originations in 3Q’21 vs. $536.5 million in 3Q’20 and $473.7 million in 2Q’21.3Q’21 mortgage loan servicing includes a $0.6 million ($0.02 per diluted share, after tax) increase in fair value adjustment due to price compared to a decrease of $1.1 million ($0.04 per diluted share, after tax) in the year ago quarter.       Source: Company documents.  $60.9M  2021 YTD Non-interest Income (thousands)  Non-interest Income Trends ($M)  Highlights 
 

 Focus on Improved Efficiency   20  Source: Company documents.  Non-interest Expense ($M)  Highlights   Efficiency Ratio (4 quarter rolling average) Compensation and employee benefits expense of $21.7 million compared to $22.0 in the prior year quarter. Compensation (salaries and wages) increased $1.2 million due to raises that were generally effective at the start of the year, increased overtime and staffing due primarily to the data processing conversion and some new positions (particularly new commercial lenders and related support staff). $2.1 million decrease in incentive compensation accrual due to the magnitude of the change from the prior respective linked quarter was much larger in 2020 resulting in a larger true up in 3Q’21. Payroll taxes and employee benefits rose $0.6 million due to higher health care costs (2020 was unusually low due to CVOID related lock-downs). Data processing costs increased $0.8 million due primarily to new software and technology product/service additions as well as increase due to higher asset base.3Q’21 non-interest expense included $0.3 million of conversion related expenses (associated with core data processing conversion that was completed in May 2021).Opportunities exist to gain additional efficiencies as we continue to optimize our delivery channels.
 

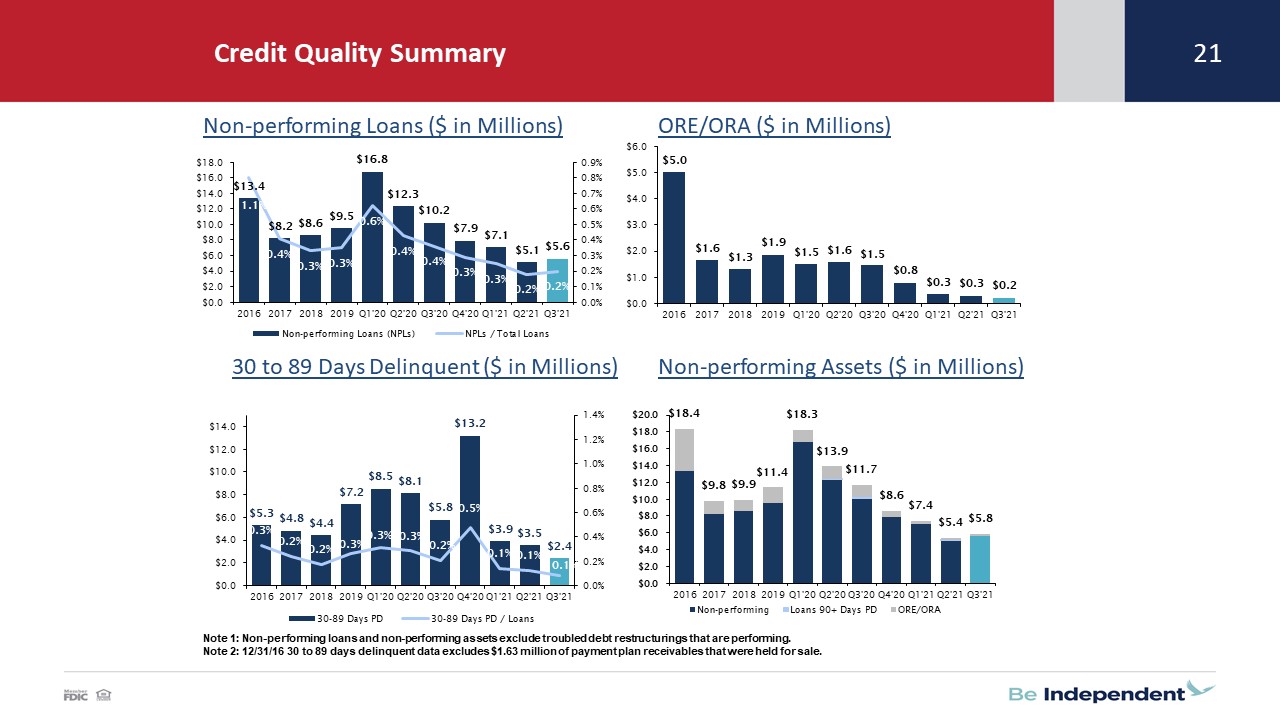
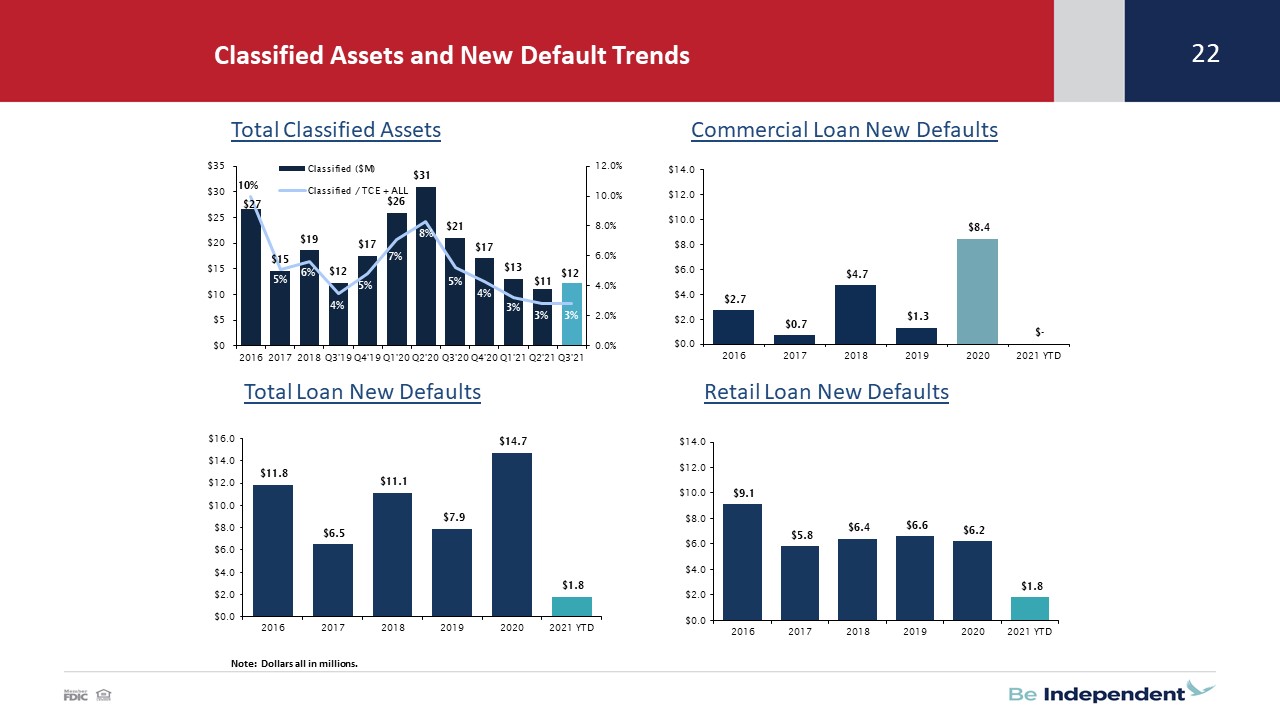
 Credit Quality Summary  Note 1: Non-performing loans and non-performing assets exclude troubled debt restructurings that are performing.Note 2: 12/31/16 30 to 89 days delinquent data excludes $1.63 million of payment plan receivables that were held for sale.  Non-performing Assets ($ in Millions)  ORE/ORA ($ in Millions)  Non-performing Loans ($ in Millions)  30 to 89 Days Delinquent ($ in Millions)  21 
 

 Classified Assets and New Default Trends  Note: Dollars all in millions.  Total Classified Assets  Commercial Loan New Defaults  Total Loan New Defaults  Retail Loan New Defaults  22 
 

 Troubled Debt Restructurings (TDRs)  TDR HighlightsWorking with client base to maximize sustainable performance.The specific reserves allocated to TDRs totaled $3.7 million at 9/30/21.A majority of our TDRs are performing under their modified terms but remain in TDR status for the life of the loan.96.3% of TDRs are current as of 9/30/21.Commercial TDR Statistics:15 loans with $4.7 million book balance.100% performing.WAR of 5.14% (accruing loans).Well seasoned portfolio; all of the accruing loans are not only performing but have been for over a year since modification.Retail TDR Statistics:393 loans with $33.2 million book balance.96.4% performing.WAR of 4.04% (accruing loans).Well seasoned portfolio; 99% of accruing loans are not only performing but have been for over a year since modification.  TDRs ($ in Millions)  96% of TDRs are Current  23 
 

 Note: Dollars all in millions.   Provision for Credit Losses   Loan Net Charge-Offs/Recoveries   Allowance for Credit Losses  Credit Cost Summary  24 
 

 2021 Outlook Update  Category  Outlook  Lending  Continued growthLoan payoffs related to the Paycheck Protection Program will make loan growth challenging in 2021. The goal of low (1%) single digit overall portfolio loan growth (5% - 7% excluding PPP impact), is based on increases in commercial loans (excluding PPP impact), mortgage loans and consumer loans. This growth forecast also assumes an improving Michigan economy.Q3 Update: Total portfolio loans increased $69.4 million (9.8% annualized) in Q3’21. Growth in retail (mortgage and installment) loans offset a decline in commercial loans that was due to a $81.7 million decrease in PPP loan balances in 3Q’21. Excluding PPP loans, total portfolio loans grew at a 10.8% annualized rate during the first nine months of 2021, which was higher than our forecasted range.  Net Interest Income  Growth driven primarily by higher average earning assetsIBCP goal of approximately 0.5% increase in net interest income (NII) over 2020. Expect the net interest margin (NIM) to trend lower (0.10% - 0.15%) in 2021 compared to full-year 2020. Primary driver is a reduction in earing asset yield. The forecast assumes no changes in the target federal funds rate in 2021 and long-term interest rates up very slightly over year end 2020 levels. Q3 Update: 3Q’21 net interest income was $1.8 million (5.8%) higher than the prior year quarter. The net interest margin was 3.18% for the quarter up 0.16% from the linked quarter and down 0.13% from the prior year quarter. This primary driver of the decrease in the net interest margin is a higher allocation to lower yielding assets (mix), lower yields on new loan volumes, and lower yields on securities available for sale.   Provision for Credit Losses  Steady asset quality metricsVery difficult area to forecast. Future provision levels under CECL will be particularly sensitive to loan growth and mix, projected economic conditions, watch credit levels and loan default volumes. The allowance as a percentage of total loans was at 1.30% at 12/31/20. The initial (effective 1/1/2021) CECL adjustment is now expected to be approximately $10.5 million to $12.5 million. This CECL adjustment is still subject to certain final review procedures that will be completed in 1Q’21. A full year 2021 provision (expense) for credit losses of approximately 0.25% to 0.35% of average total portfolio loans would not be unreasonable.Q3 Update: The impact from our CECL adoption was an increase to our beginning of the year allowance for credit losses of $11.7 million which was within the disclosed range of $10.5 million to 12.5 million. The provision for credit losses was a credit of $0.6 million in 3Q’21 and was a credit of $2.6 million for the first nine months of 2021. If credit quality trends persist it is likely that the full year provision for credit losses will be below our forecasted range of 0.25% to 0.35% of average total portfolio loans.   Non-interest Income  IBCP forecasted 2021 quarterly range of $13 million to $16 million with the total for the year down 30% to 35% from 2020 actual of $80.7 millionExpect mortgage loan origination volumes in 2021 to be down by approximately 30%. Expect overall mortgage banking revenues (gain on sale and mortgage loan servicing) to decline in 2020 due to lower volume as well as margin on loans sold. Expect service charges on deposits and interchange income in 2021 to be collectively comparable to 2020 (i.e. a decline in servicing charges on deposits due to lower NSF fees to be largely offset by an increase in interchange income). Q3 Update: Non-interest income totaled $19.7 million in Q3’21, which was above the forecasted range. 3Q’21 mortgage loan originations, sales and gains totaled $453.8 million, $279.2 million and $8.4 million, respectively. Mortgage loan servicing generated a gain of $1.3 million in Q3’21 due primarily to a positive $0.6 million fair value adjustment due to price. The mortgage loan pipeline continues to be solid although refinance activity is slowing down.   Non-interest Expenses  IBCP forecasted 2021 quarterly range of $28.5 million to $29.5 million with the total for the year down (4%-6%) from the 2020 actual of $122.4 million.Expect total compensation and employee benefits to be lower in 2021 compared to 2020 due primarily to a reduction in incentive compensation. Most other categories of non-interest expense expected to have small (1% to 2%) increases.Q3 Update: Total non-interest expense was $34.5 million in the third quarter of 2021, well above our $28.5 million to $29.5 million targeted quarterly range. Increases in compensation and employee benefits, data processing and conversion related expenses were the primary categories that caused actual non-interest expenses to exceed the target range.  Income Taxes  Approximately a 20% effective income tax rate in 2021. This assumes a 21% statutory federal corporate income tax rate during 2021. Q3 Update: Actual effective income tax rate of 18.8% and 18.5% for 3Q’21 and first nine months of 2021, respectively.  Share Repurchases  2021 share repurchase authorization at approximately 5% (1.1 million) of outstanding shares. Expect total share repurchases in 2021 at the mid-point of this authorization.Q3 Update: The Company repurchased 659,350 shares at an average price of $20.89 during the first nine months of 2021.   25 
 

  Strategic Initiatives  26    Serve consumers and businesses in our markets in an inclusive way with straight forward marketing and outreach efforts and fostering relationships and strong customer engagement.Improve net interest income via balanced loan growth, disciplined risk adjusted loan pricing and active management of deposit pricing. Add new customers and grow revenue through outbound calling.Add new customers and grow revenue through the addition of new talented sales professionals in our existing markets. Supplement our organic growth initiatives via selective and opportunistic bank acquisitions and branch acquisitions.    Growth      Enhance process improvement expertise, enabling all business lines and departments to streamline/automate operating processes and workflows.Successfully complete 2021 core conversion, capitalizing upon opportunity to streamline and improve bank processes.Leverage virtual capabilities to make more effective meetings, training and customer engagement.Optimize branch delivery channel including assessing existing locations, new locations, service hours, staffing, & workflow and leveraging our existing technology. Expand Digital Branch services.Build/enhance dashboard reporting and business intelligence.   Process Improvement & Cost Controls      Create and maintain an engaged workforce through a culture and environment that promotes diversity, equity, inclusion and professional development. Empower and support our team members to serve our customers. Demonstrate that we are committed to the well-being of our team members who ensure our success. This entails recognizing and rewarding contributions, developing new talent via internships, providing coaching and development, and planning for succession and new opportunities.    Talent Management       Produce strong and consistent earnings and capital levels. Maintain good credit quality aided by strong proactive asset quality monitoring and problem resolution.Practice sound risk management with effective reporting to include fair banking and scenario planning.Actively manage and monitor liquidity and interest rate risk.Promote strong, independent & collaborative risk management, utilizing three layers of defense (business unit, risk management and internal audit). Ensure effective operational controls with special emphasis on cyber security, fraud prevention, core system conversion and regulatory compliance.Maintain effective relationships with regulators & other outside oversight parties.   Risk Management    
 

 Q&A and Closing Remarks  Question and Answer SessionClosing RemarksThank you for attending!NASDAQ: IBCP  27