0000051143falseCapital stock, par value $.20 per shareIBMCHX0000051143exch:XNYSus-gaap:CommonStockMember2021-12-272021-12-270000051143exch:XNYSibm:Notes2.875PercentDue2025Member2021-12-272021-12-270000051143exch:XNYSibm:Notes2.625PercentDue2022Member2021-12-272021-12-270000051143exch:XNYSibm:Notes1.750PercentDue2031Member2021-12-272021-12-270000051143exch:XNYSibm:Notes1.750PercentDue2028Member2021-12-272021-12-270000051143exch:XNYSibm:Notes1.500PercentDue2029Member2021-12-272021-12-270000051143exch:XNYSibm:Notes1.25PercentDue2023Member2021-12-272021-12-270000051143exch:XNYSibm:Notes1.250PercentDue2027Member2021-12-272021-12-270000051143exch:XNYSibm:Notes1.200PercentDue2040Member2021-12-272021-12-270000051143exch:XNYSibm:Notes1.125PercentDue2024Member2021-12-272021-12-270000051143exch:XNYSibm:Notes0.950PercentDue2025Member2021-12-272021-12-270000051143exch:XNYSibm:Notes0.875PercentDue2025Member2021-12-272021-12-270000051143exch:XNYSibm:Notes0.650PercentDue2032Member2021-12-272021-12-270000051143exch:XNYSibm:Notes0.375PercentDue2023Member2021-12-272021-12-270000051143exch:XNYSibm:Notes0.300PercentDue2028Member2021-12-272021-12-270000051143exch:XNYSibm:Notes0.300PercentDue2026Member2021-12-272021-12-270000051143exch:XNYSibm:Debentures7.125PercentDue2096Member2021-12-272021-12-270000051143exch:XNYSibm:Debentures7.00PercentDue2045Member2021-12-272021-12-270000051143exch:XNYSibm:Debentures7.00PercentDue2025Member2021-12-272021-12-270000051143exch:XNYSibm:Debentures6.50PercentDue2028Member2021-12-272021-12-270000051143exch:XNYSibm:Debentures6.22PercentDue2027Member2021-12-272021-12-270000051143exch:XCHIus-gaap:CommonStockMember2021-12-272021-12-2700000511432021-12-272021-12-27

​

​

UNITED STATES

SECURITIES AND EXCHANGE COMMISSION

WASHINGTON, D.C. 20549

FORM 8-K

CURRENT REPORT PURSUANT TO SECTION 13 OR 15 (d)

OF THE SECURITIES EXCHANGE ACT OF 1934

Date of Report: December 27, 2021

(Date of earliest event reported)

INTERNATIONAL BUSINESS MACHINES CORPORATION

(Exact name of registrant as specified in its charter)

​

​

​

​

​

New York

​

1-2360

​

13-0871985

(State of Incorporation)

​

(Commission File Number)

​

(IRS employer Identification No.)

​

​

​

​

​

One New Orchard Road

Armonk, New York

​

​

10504

(Address of principal executive offices)

​

(Zip Code)

​

914-499-1900

(Registrant’s telephone number)

Check the appropriate box below if the Form 8-K filing is intended to simultaneously satisfy the filing obligation of the registrant under any of the following provisions:

​

​

☐

Written communications pursuant to Rule 425 under the Securities Act (17 CFR 230.425)

☐

Soliciting material pursuant to Rule 14a-12 under the Exchange Act (17 CFR 240.14a-12)

☐

Pre-commencement communications pursuant to Rule 14d-2(b) under the Exchange Act (17 CFR 240.14d-2(b))

☐

Pre-commencement communications pursuant to Rule 13e-4(c) under the Exchange Act (17 CFR 240.13e-4(c))

​

Securities registered pursuant to Section 12(b) of the Act:

​

​

​

​

​

Title of each class

​

Trading symbol(s)

​

Name of each exchange
on which registered

Capital stock, par value $.20 per share

​

IBM

​

New York Stock Exchange

​

​

​

​

NYSE Chicago

2.625% Notes due 2022

​

IBM 22A

​

New York Stock Exchange

1.250% Notes due 2023

​

IBM 23A

​

New York Stock Exchange

0.375% Notes due 2023

​

IBM 23B

​

New York Stock Exchange

1.125% Notes due 2024

​

IBM 24A

​

New York Stock Exchange

2.875% Notes due 2025

​

IBM 25A

​

New York Stock Exchange

0.950% Notes due 2025

​

IBM 25B

​

New York Stock Exchange

0.875% Notes due 2025

​

IBM 25C

​

New York Stock Exchange

0.300% Notes due 2026

​

IBM 26B

​

New York Stock Exchange

1.250% Notes due 2027

​

IBM 27B

​

New York Stock Exchange

0.300% Notes due 2028

​

IBM 28B

​

New York Stock Exchange

1.750% Notes due 2028

​

IBM 28A

​

New York Stock Exchange

1.500% Notes due 2029

​

IBM 29

​

New York Stock Exchange

1.750% Notes due 2031

​

IBM 31

​

New York Stock Exchange

0.650% Notes due 2032

​

IBM 32A

​

New York Stock Exchange

1.200% Notes due 2040

​

IBM 40

​

New York Stock Exchange

7.00% Debentures due 2025

​

IBM 25

​

New York Stock Exchange

6.22% Debentures due 2027

​

IBM 27

​

New York Stock Exchange

6.50% Debentures due 2028

​

IBM 28

​

New York Stock Exchange

7.00% Debentures due 2045

​

IBM 45

​

New York Stock Exchange

7.125% Debentures due 2096

​

IBM 96

​

New York Stock Exchange

​

Indicate by check mark whether the registrant is an emerging growth company as defined in Rule 405 of the Securities Act of 1933 (§230.405 of this chapter) or Rule 12b-2 of the Securities Exchange Act of 1934 (§240.12b-2 of this chapter).

Emerging growth company  ☐

If an emerging growth company, indicate by check mark if the registrant has elected not to use the extended transition period for complying with any new or revised financial accounting standards provided pursuant to Section 13(a) of the Exchange Act. ☐

​

​

​

​

​

​

Item 2.02. Results of Operations and Financial Condition.

​

On October 4, 2021, IBM announced that it is updating its reporting segments, and on November 3, 2021, IBM completed the separation of Kyndryl Holdings, Inc. Exhibit 7 of Exhibit 99.1 to this Form 8-K contains information that the Company has posted to its Investor Relations website (www.ibm.com/investor/) including recast historical financial data as adjusted for discontinued operations as well as recast segment data under the new segment structure. Reconciliations of non-GAAP financial measures included in exhibits 7c and 7d of Exhibit 99.1 to the most directly comparable financial measures calculated and presented in accordance with GAAP are included in Exhibit 99.2 to this Form 8-K.

​

The information in this Item 2.02, including exhibit 7 of Exhibit 99.1 and Exhibit 99.2, is being furnished with the Commission and shall not be deemed “filed” for purposes of Section 18 of the Securities Exchange Act of 1934.

​

Item 7.01. Regulation FD Disclosure.

Exhibit 99.1 to this Form 8-K contains information on IBM’s historical financials which reflect the separation of Kyndryl Holdings, Inc. as well as changes to IBM’s management structure and segment reporting that the company has posted on its Investor Relations website (www.ibm.com/investor/).

​

In an effort to provide investors with additional information regarding the company’s results as determined by generally accepted accounting principles (“GAAP”), the company has disclosed in the attached investor relations article certain non-GAAP information, which management believes provides useful information to investors. The rationale for management’s use of non-GAAP measures and reconciliations of these non-GAAP financial measures to the most directly comparable financial measures calculated and presented in accordance with GAAP are included in Exhibit 99.2 to this Form 8-K.

​

The information in this Item 7.01, including Exhibits 99.1 and 99.2, is being furnished with the Commission and shall not be deemed “filed” for purposes of Section 18 of the Securities Exchange Act of 1934.

​

Item 9.01. Financial Statements and Exhibits.

(d) Exhibits

The following exhibits are being furnished as part of this report:

​

​

​

Exhibit No.

​

Description of Exhibit

99.1

​

Investor Relations Article, dated December 27, 2021

99.2

​

Non-GAAP Financial Information

​

The following exhibit is being filed as part of this report:

​

​

​

Exhibit No.

​

Description of Exhibit

104

​

Cover Page Interactive Data File – the cover page interactive data file does not appear in the Interactive Data File because its XBRL tags are embedded within the Inline XBRL document

​

IBM’s web site (www.ibm.com) contains a significant amount of information about IBM, including financial and other information for investors (www.ibm.com/investor/). IBM encourages investors to visit its various web sites from time to time, as information is updated and new information is posted.

​

2

SIGNATURE

Pursuant to the requirements of the Securities Exchange Act of 1934, the registrant has duly caused this report to be signed on its behalf by the undersigned, hereunto duly authorized.

​

​

​

Date: December 27, 2021

​

​

​

​

​

​

​

By:

/s/ Robert F. Del Bene

​

​

Robert F. Del Bene

​

​

Vice President and Controller

​

​

​

​

​

​

​

​

​

3

Exhibit 99.1

New Microsoft Word Document_ibm_ex99_1_page_01.gif

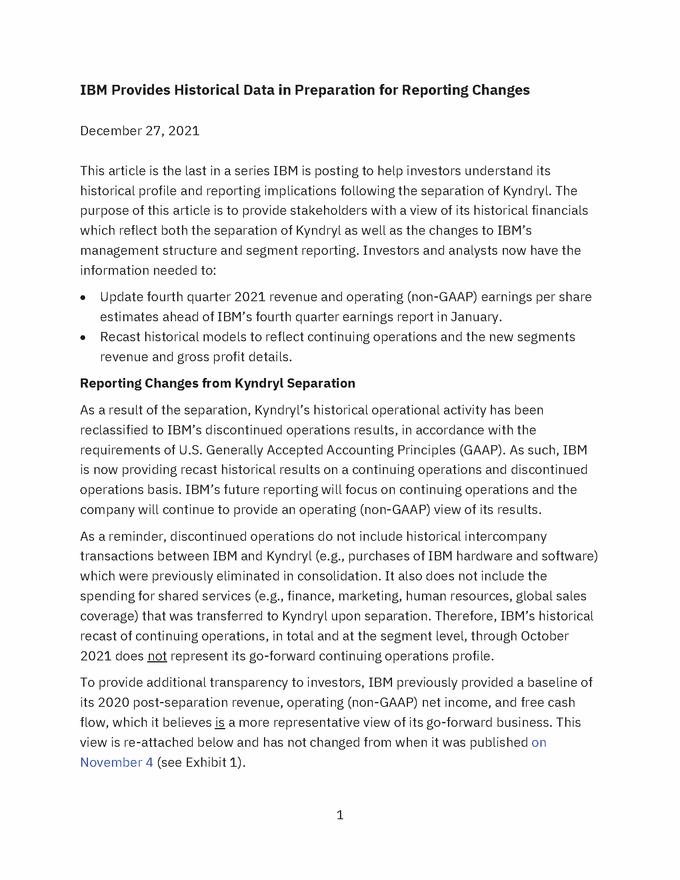
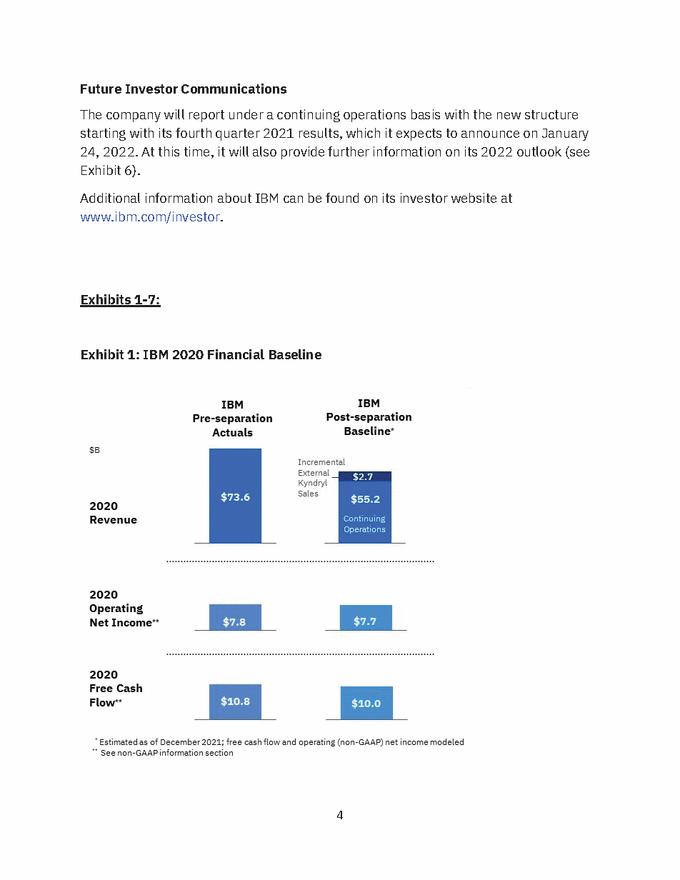
IBM Provides Historical Data in Preparation for Reporting Changes December 27, 2021 This article is the last in a series IBM is posting to help investors understand its historical profile and reporting implications following the separation of Kyndryl. The purpose of this article is to provide stakeholders with a view of its historical financials which reflect both the separation of Kyndryl as well as the changes to IBM’s management structure and segment reporting. Investors and analysts now have the information needed to: x Update fourth quarter 2021 revenue and operating (non-GAAP) earnings per share estimates ahead of IBM’s fourth quarter earnings report in January. Recast historical models to reflect continuing operations and the new segments revenue and gross profit details. x Reporting Changes from Kyndryl Separation As a result of the separation, Kyndryl’s historical operational activity has been reclassified to IBM’s discontinued operations results, in accordance with the requirements of U.S. Generally Accepted Accounting Principles (GAAP). As such, IBM is now providing recast historical results on a continuing operations and discontinued operations basis. IBM’s future reporting will focus on continuing operations and the company will continue to provide an operating (non-GAAP) view of its results. As a reminder, discontinued operations do not include historical intercompany transactions between IBM and Kyndryl (e.g., purchases of IBM hardware and software) which were previously eliminated in consolidation. It also does not include the spending for shared services (e.g., finance, marketing, human resources, global sales coverage) that was transferred to Kyndryl upon separation. Therefore, IBM’s historical recast of continuing operations, in total and at the segment level, through October 2021 does not represent its go-forward continuing operations profile. To provide additional transparency to investors, IBM previously provided a baseline of its 2020 post-separation revenue, operating (non-GAAP) net income, and free cash flow, which it believes is a more representative view of its go-forward business. This view is re-attached below and has not changed from when it was published on November 4 (see Exhibit 1). 1

​


New Microsoft Word Document_ibm_ex99_1_page_02.gif

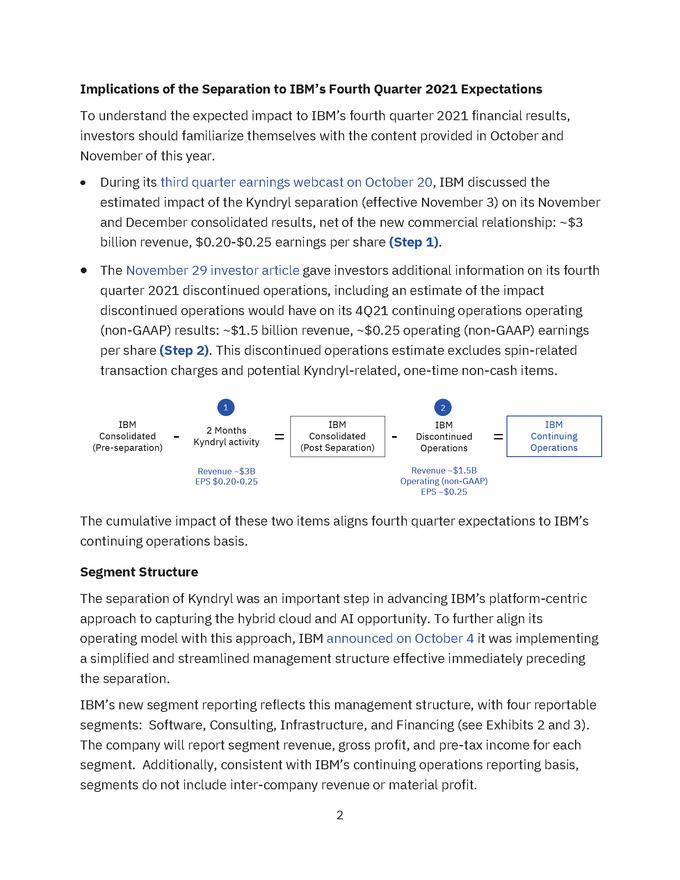
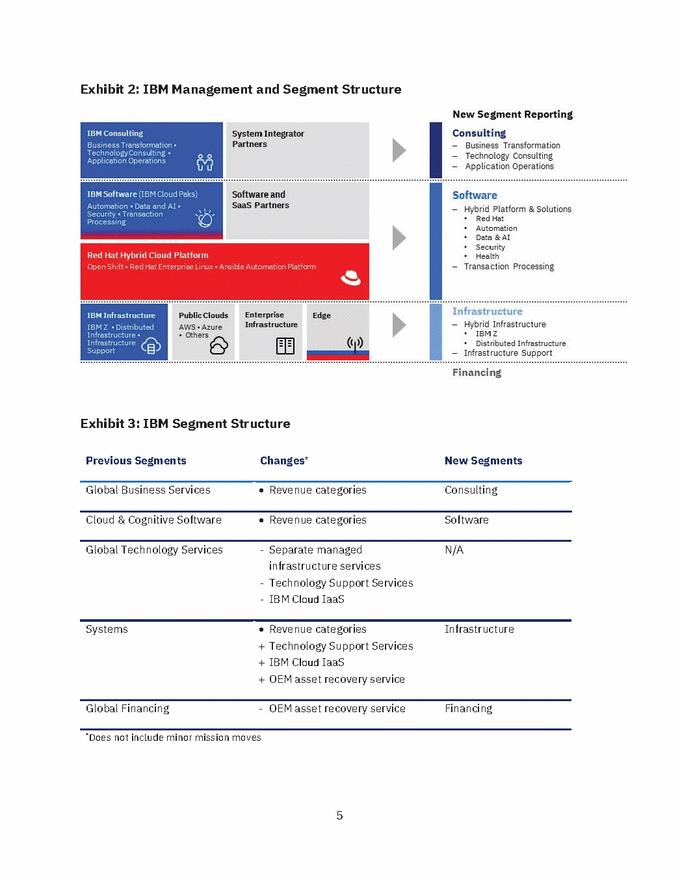
Implications of the Separation to IBM’s Fourth Quarter 2021 Expectations To understand the expected impact to IBM’s fourth quarter 2021 financial results, investors should familiarize themselves with the content provided in October and November of this year. x During its third quarter earnings webcast on October 20, IBM discussed the estimated impact of the Kyndryl separation (effective November 3) on its November and December consolidated results, net of the new commercial relationship: ~$3 billion revenue, $0.20-$0.25 earnings per share (Step 1). x The November 29 investor article gave investors additional information on its fourth quarter 2021 discontinued operations, including an estimate of the impact discontinued operations would have on its 4Q21 continuing operations operating (non-GAAP) results: ~$1.5 billion revenue, ~$0.25 operating (non-GAAP) earnings per share (Step 2). This discontinued operations estimate excludes spin-related transaction charges and potential Kyndryl-related, one-time non-cash items. The cumulative impact of these two items aligns fourth quarter expectations to IBM’s continuing operations basis. Segment Structure The separation of Kyndryl was an important step in advancing IBM’s platform-centric approach to capturing the hybrid cloud and AI opportunity. To further align its operating model with this approach, IBM announced on October 4 it was implementing a simplified and streamlined management structure effective immediately preceding the separation. IBM’s new segment reporting reflects this management structure, with four reportable segments: Software, Consulting, Infrastructure, and Financing (see Exhibits 2 and 3). The company will report segment revenue, gross profit, and pre-tax income for each segment. Additionally, consistent with IBM’s continuing operations reporting basis, segments do not include inter-company revenue or material profit. 2

​


New Microsoft Word Document_ibm_ex99_1_page_03.gif

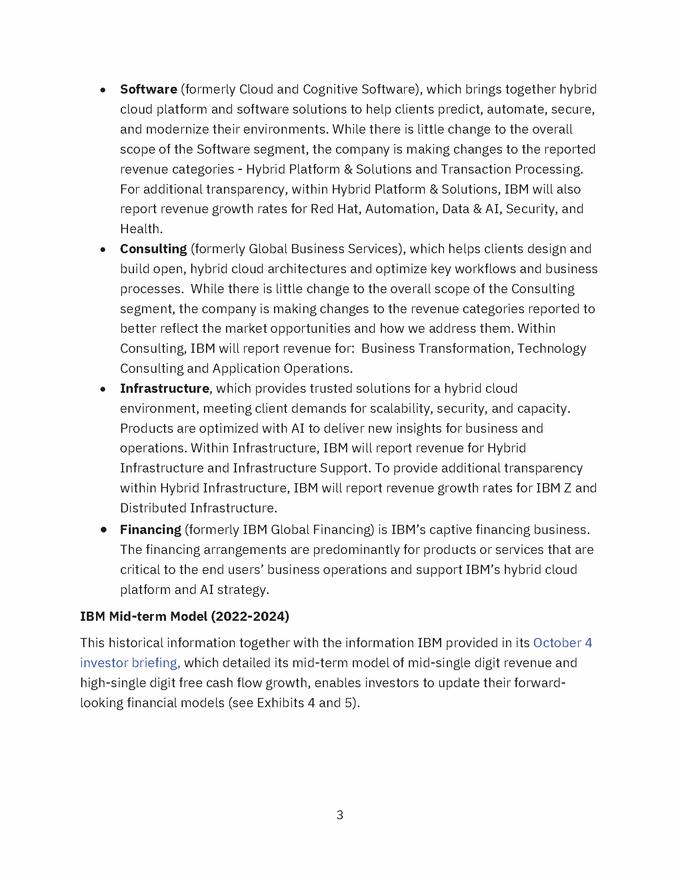
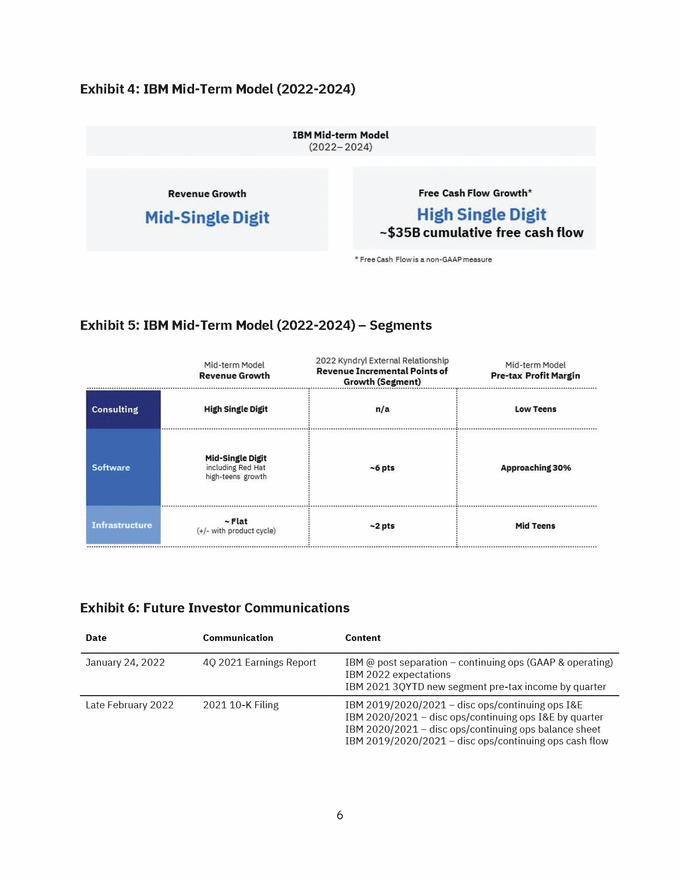
x Software (formerly Cloud and Cognitive Software), which brings together hybrid cloud platform and software solutions to help clients predict, automate, secure, and modernize their environments. While there is little change to the overall scope of the Software segment, the company is making changes to the reported revenue categories - Hybrid Platform & Solutions and Transaction Processing. For additional transparency, within Hybrid Platform & Solutions, IBM will also report revenue growth rates for Red Hat, Automation, Data & AI, Security, and Health. Consulting (formerly Global Business Services), which helps clients design and build open, hybrid cloud architectures and optimize key workflows and business processes. While there is little change to the overall scope of the Consulting segment, the company is making changes to the revenue categories reported to better reflect the market opportunities and how we address them. Within Consulting, IBM will report revenue for: Business Transformation, Technology Consulting and Application Operations. Infrastructure, which provides trusted solutions for a hybrid cloud environment, meeting client demands for scalability, security, and capacity. Products are optimized with AI to deliver new insights for business and operations. Within Infrastructure, IBM will report revenue for Hybrid Infrastructure and Infrastructure Support. To provide additional transparency within Hybrid Infrastructure, IBM will report revenue growth rates for IBM Z and Distributed Infrastructure. Financing (formerly IBM Global Financing) is IBM’s captive financing business. The financing arrangements are predominantly for products or services that are critical to the end users’ business operations and support IBM’s hybrid cloud platform and AI strategy. x x x IBM Mid-term Model (2022-2024) This historical information together with the information IBM provided in its October 4 investor briefing, which detailed its mid-term model of mid-single digit revenue and high-single digit free cash flow growth, enables investors to update their forward-looking financial models (see Exhibits 4 and 5). 3

​


New Microsoft Word Document_ibm_ex99_1_page_04.gif

Future Investor Communications The company will report under a continuing operations basis with the new structure starting with its fourth quarter 2021 results, which it expects to announce on January 24, 2022. At this time, it will also provide further information on its 2022 outlook (see Exhibit 6). Additional information about IBM can be found on its investor website at www.ibm.com/investor. Exhibits 1-7: Exhibit 1: IBM 2020 Financial Baseline 4

​


New Microsoft Word Document_ibm_ex99_1_page_05.gif

Exhibit 2: IBM Management and Segment Structure Exhibit 3: IBM Segment Structure Previous Segments Changes* New Segments Global Business Services x Revenue categories Consulting x Revenue categories Cloud & Cognitive Software Software Global Technology Services - Separate managed infrastructure services - Technology Support Services - IBM Cloud IaaS N/A x Revenue categories + Technology Support Services + IBM Cloud IaaS + OEM asset recovery service Systems Infrastructure Global Financing - OEM asset recovery service Financing *Does not include minor mission moves 5

​


New Microsoft Word Document_ibm_ex99_1_page_06.gif

Exhibit 4: IBM Mid-Term Model (2022-2024) Exhibit 5: IBM Mid-Term Model (2022-2024) – Segments Exhibit 6: Future Investor Communications 6

​


New Microsoft Word Document_ibm_ex99_1_page_07.gif

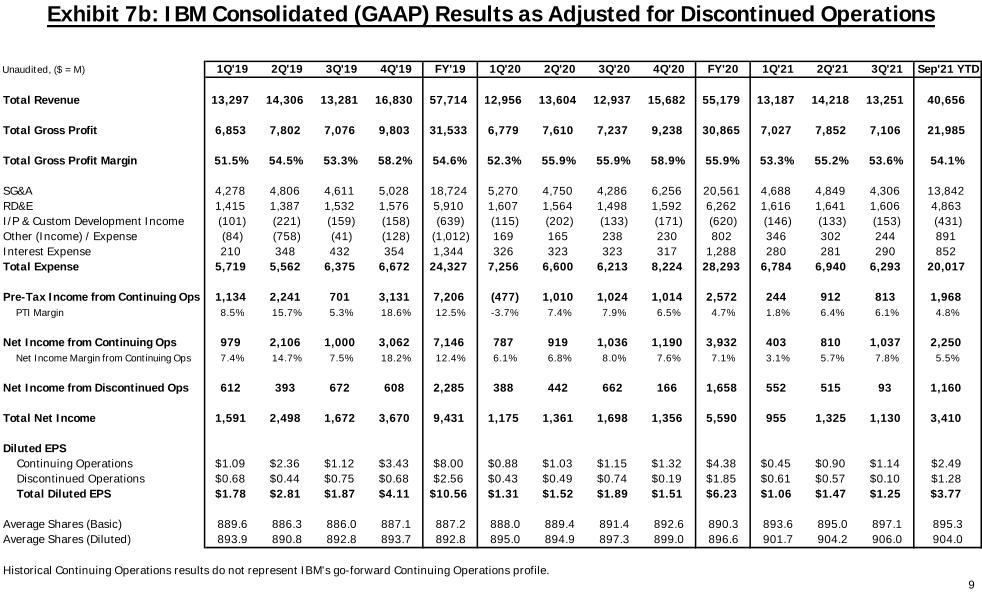
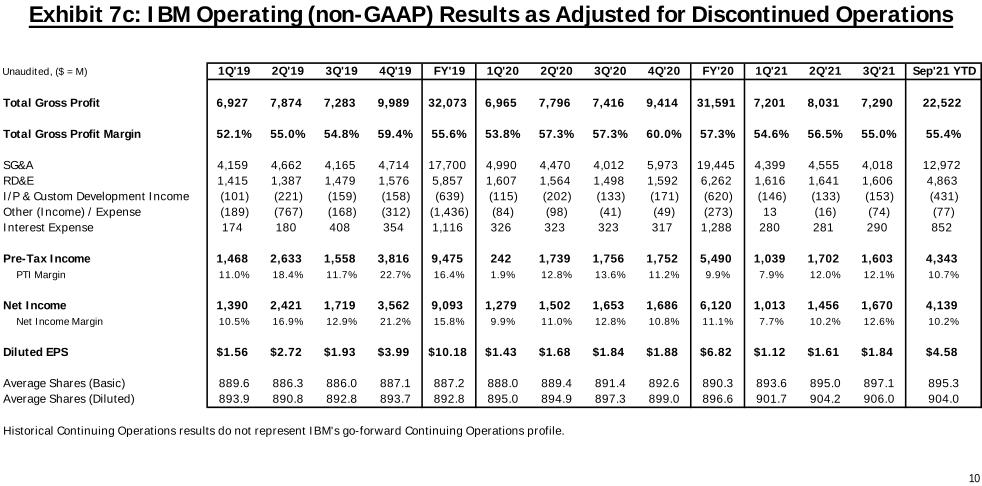
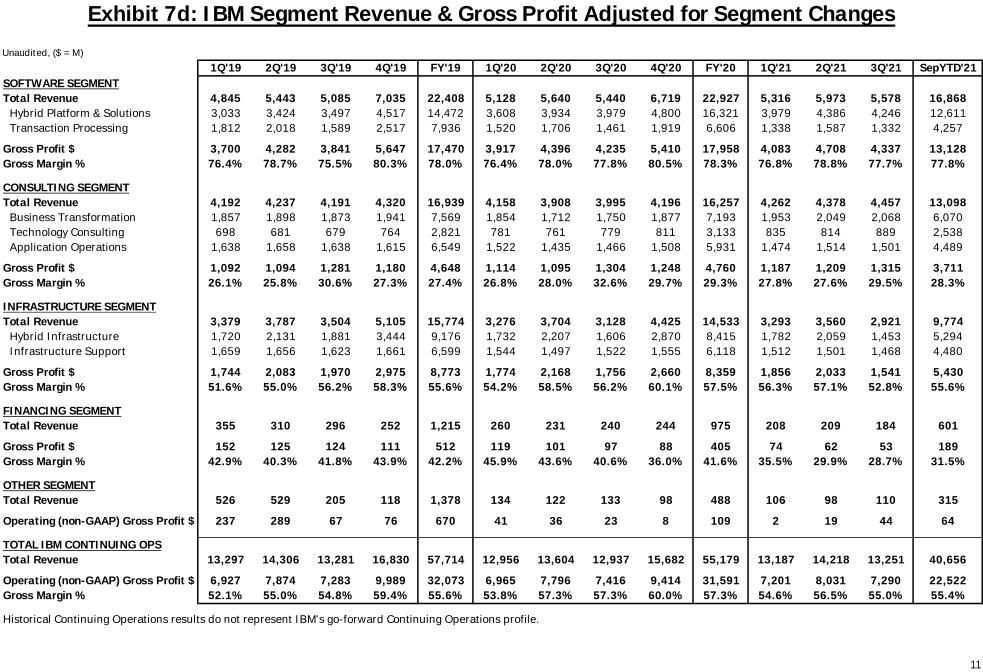
Exhibit 7: IBM Historical Recast of Financial Data Exhibit 7a: IBM Consolidated (GAAP) Results as Historically Reported Exhibit 7b: IBM Consolidated (GAAP) Results as Adjusted for Discontinued Operations Exhibit 7c: IBM Operating (non-GAAP) Results as Adjusted for Discontinued Operations Exhibit 7d: IBM Segment Revenue & Gross Profit Adjusted for Segment Changes 7

​

​


​

​

​

Graphic

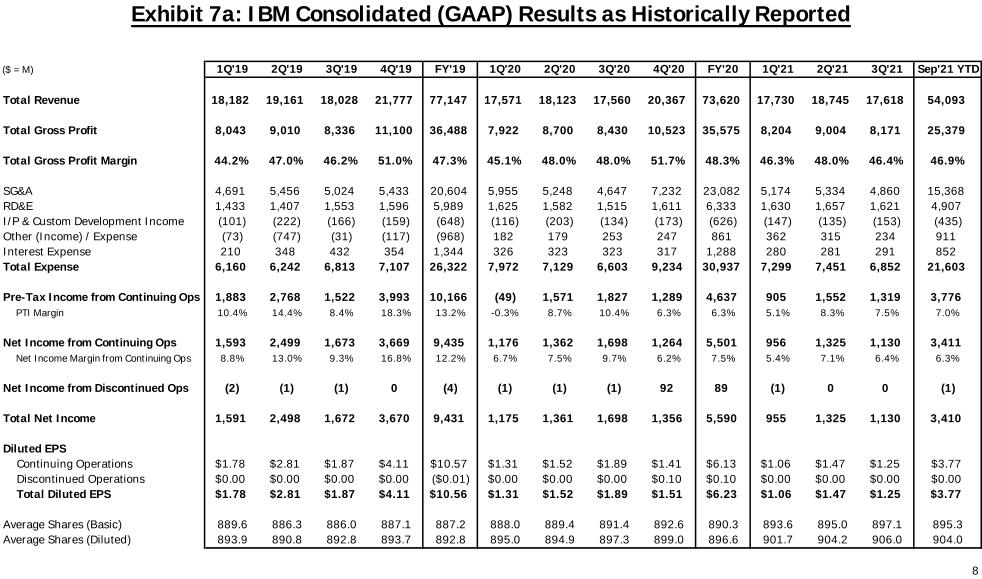
Exhibit 7a: IBM Consolidated (GAAP) Results as Historically Reported ($ = M) Total Revenue Total Gross Profit Total Gross Profit Margin SG&A RD&E I/P & Custom Development Income Other (Income) / Expense Interest Expense Total Expense Pre-Tax Income from Continuing Ops PTI Margin Net Income from Continuing Ops Net Income Margin from Continuing Ops Net Income from Discontinued Ops Total Net Income Diluted EPS Continuing Operations Discontinued Operations Total Diluted EPS Average Shares (Basic) Average Shares (Diluted) 8 1Q'19 2Q'19 3Q'19 4Q'19 FY'19 1Q'20 2Q'20 3Q'20 4Q'20 FY'20 1Q'21 2Q'21 3Q'21 Sep'21 YTD 18,182 19,161 18,028 21,777 8,043 9,010 8,336 11,100 44.2% 47.0% 46.2% 51.0% 4,691 5,456 5,024 5,433 1,433 1,407 1,553 1,596 (101) (222) (166) (159) (73) (747) (31) (117) 210 348 432 354 6,160 6,242 6,813 7,107 1,883 2,768 1,522 3,993 10.4% 14.4% 8.4% 18.3% 1,593 2,499 1,673 3,669 8.8% 13.0% 9.3% 16.8% (2) (1) (1) 0 1,591 2,498 1,672 3,670 $1.78 $2.81 $1.87 $4.11 $0.00 $0.00 $0.00 $0.00 $1.78 $2.81 $1.87 $4.11 889.6 886.3 886.0 887.1 893.9 890.8 892.8 893.7 77,147 36,488 47.3% 20,604 5,989 (648) (968) 1,344 26,322 10,166 13.2% 9,435 12.2% (4) 9,431 $10.57 ($0.01) $10.56 887.2 892.8 17,571 18,123 17,560 20,367 7,922 8,700 8,430 10,523 45.1% 48.0% 48.0% 51.7% 5,955 5,248 4,647 7,232 1,625 1,582 1,515 1,611 (116) (203) (134) (173) 182 179 253 247 326 323 323 317 7,972 7,129 6,603 9,234 (49) 1,571 1,827 1,289 -0.3% 8.7% 10.4% 6.3% 1,176 1,362 1,698 1,264 6.7% 7.5% 9.7% 6.2% (1) (1) (1) 92 1,175 1,361 1,698 1,356 $1.31 $1.52 $1.89 $1.41 $0.00 $0.00 $0.00 $0.10 $1.31 $1.52 $1.89 $1.51 888.0 889.4 891.4 892.6 895.0 894.9 897.3 899.0 73,620 35,575 48.3% 23,082 6,333 (626) 861 1,288 30,937 4,637 6.3% 5,501 7.5% 89 5,590 $6.13 $0.10 $6.23 890.3 896.6 17,730 18,745 17,618 8,204 9,004 8,171 46.3% 48.0% 46.4% 5,174 5,334 4,860 1,630 1,657 1,621 (147) (135) (153) 362 315 234 280 281 291 7,299 7,451 6,852 905 1,552 1,319 5.1% 8.3% 7.5% 956 1,325 1,130 5.4% 7.1% 6.4% (1) 0 0 955 1,325 1,130 $1.06 $1.47 $1.25 $0.00 $0.00 $0.00 $1.06 $1.47 $1.25 893.6 895.0 897.1 901.7 904.2 906.0 54,093 25,379 46.9% 15,368 4,907 (435) 911 852 21,603 3,776 7.0% 3,411 6.3% (1) 3,410 $3.77 $0.00 $3.77 895.3 904.0

​

​


​

​

Graphic

Exhibit 7b: IBM Consolidated (GAAP) Results as Adjusted for Discontinued Operations Unaudited, ($ = M) Total Revenue Total Gross Profit Total Gross Profit Margin SG&A RD&E I/P & Custom Development Income Other (Income) / Expense Interest Expense Total Expense Pre-Tax Income from Continuing Ops PTI Margin Net Income from Continuing Ops Net Income Margin from Continuing Ops Net Income from Discontinued Ops Total Net Income Diluted EPS Continuing Operations Discontinued Operations Total Diluted EPS Average Shares (Basic) Average Shares (Diluted) Historical Continuing Operations results do not represent IBM's go-forward Continuing Operations profile. 9 1Q'19 2Q'19 3Q'19 4Q'19 FY'19 1Q'20 2Q'20 3Q'20 4Q'20 FY'20 1Q'21 2Q'21 3Q'21 Sep'21 YTD 13,297 14,306 13,281 16,830 6,853 7,802 7,076 9,803 51.5% 54.5% 53.3% 58.2% 4,278 4,806 4,611 5,028 1,415 1,387 1,532 1,576 (101) (221) (159) (158) (84) (758) (41) (128) 210 348 432 354 5,719 5,562 6,375 6,672 1,134 2,241 701 3,131 8.5% 15.7% 5.3% 18.6% 979 2,106 1,000 3,062 7.4% 14.7% 7.5% 18.2% 612 393 672 608 1,591 2,498 1,672 3,670 $1.09 $2.36 $1.12 $3.43 $0.68 $0.44 $0.75 $0.68 $1.78 $2.81 $1.87 $4.11 889.6 886.3 886.0 887.1 893.9 890.8 892.8 893.7 57,714 31,533 54.6% 18,724 5,910 (639) (1,012) 1,344 24,327 7,206 12.5% 7,146 12.4% 2,285 9,431 $8.00 $2.56 $10.56 887.2 892.8 12,956 13,604 12,937 15,682 6,779 7,610 7,237 9,238 52.3% 55.9% 55.9% 58.9% 5,270 4,750 4,286 6,256 1,607 1,564 1,498 1,592 (115) (202) (133) (171) 169 165 238 230 326 323 323 317 7,256 6,600 6,213 8,224 (477) 1,010 1,024 1,014 -3.7% 7.4% 7.9% 6.5% 787 919 1,036 1,190 6.1% 6.8% 8.0% 7.6% 388 442 662 166 1,175 1,361 1,698 1,356 $0.88 $1.03 $1.15 $1.32 $0.43 $0.49 $0.74 $0.19 $1.31 $1.52 $1.89 $1.51 888.0 889.4 891.4 892.6 895.0 894.9 897.3 899.0 55,179 30,865 55.9% 20,561 6,262 (620) 802 1,288 28,293 2,572 4.7% 3,932 7.1% 1,658 5,590 $4.38 $1.85 $6.23 890.3 896.6 13,187 14,218 13,251 7,027 7,852 7,106 53.3% 55.2% 53.6% 4,688 4,849 4,306 1,616 1,641 1,606 (146) (133) (153) 346 302 244 280 281 290 6,784 6,940 6,293 244 912 813 1.8% 6.4% 6.1% 403 810 1,037 3.1% 5.7% 7.8% 552 515 93 955 1,325 1,130 $0.45 $0.90 $1.14 $0.61 $0.57 $0.10 $1.06 $1.47 $1.25 893.6 895.0 897.1 901.7 904.2 906.0 40,656 21,985 54.1% 13,842 4,863 (431) 891 852 20,017 1,968 4.8% 2,250 5.5% 1,160 3,410 $2.49 $1.28 $3.77 895.3 904.0

​

​


​

​

Graphic

Exhibit 7c: IBM Operating (non-GAAP) Results as Adjusted for Discontinued Operations Unaudited, ($ = M) Total Gross Profit Total Gross Profit Margin SG&A RD&E I/P & Custom Development Income Other (Income) / Expense Interest Expense Pre-Tax Income PTI Margin Net Income Net Income Margin Diluted EPS Average Shares (Basic) Average Shares (Diluted) Historical Continuing Operations results do not represent IBM's go-forward Continuing Operations profile. 10 1Q'19 2Q'19 3Q'19 4Q'19 FY'19 1Q'20 2Q'20 3Q'20 4Q'20 FY'20 1Q'21 2Q'21 3Q'21 Sep'21 YTD 6,927 7,874 7,283 9,989 52.1% 55.0% 54.8% 59.4% 4,159 4,662 4,165 4,714 1,415 1,387 1,479 1,576 (101) (221) (159) (158) (189) (767) (168) (312) 174 180 408 354 1,468 2,633 1,558 3,816 11.0% 18.4% 11.7% 22.7% 1,390 2,421 1,719 3,562 10.5% 16.9% 12.9% 21.2% $1.56 $2.72 $1.93 $3.99 889.6 886.3 886.0 887.1 893.9 890.8 892.8 893.7 32,073 55.6% 17,700 5,857 (639) (1,436) 1,116 9,475 16.4% 9,093 15.8% $10.18 887.2 892.8 6,965 7,796 7,416 9,414 53.8% 57.3% 57.3% 60.0% 4,990 4,470 4,012 5,973 1,607 1,564 1,498 1,592 (115) (202) (133) (171) (84) (98) (41) (49) 326 323 323 317 242 1,739 1,756 1,752 1.9% 12.8% 13.6% 11.2% 1,279 1,502 1,653 1,686 9.9% 11.0% 12.8% 10.8% $1.43 $1.68 $1.84 $1.88 888.0 889.4 891.4 892.6 895.0 894.9 897.3 899.0 31,591 57.3% 19,445 6,262 (620) (273) 1,288 5,490 9.9% 6,120 11.1% $6.82 890.3 896.6 7,201 8,031 7,290 54.6% 56.5% 55.0% 4,399 4,555 4,018 1,616 1,641 1,606 (146) (133) (153) 13 (16) (74) 280 281 290 1,039 1,702 1,603 7.9% 12.0% 12.1% 1,013 1,456 1,670 7.7% 10.2% 12.6% $1.12 $1.61 $1.84 893.6 895.0 897.1 901.7 904.2 906.0 22,522 55.4% 12,972 4,863 (431) (77) 852 4,343 10.7% 4,139 10.2% $4.58 895.3 904.0

​

​


​

​

Graphic

Exhibit 7d: IBM Segment Revenue & Gross Profit Adjusted for Segment Changes Unaudited, ($ = M) SOFTWARE SEGMENT Total Revenue Hybrid Platform & Solutions Transaction Processing Gross Profit $ Gross Margin % CONSULTING SEGMENT Total Revenue Business Transformation Technology Consulting Application Operations Gross Profit $ Gross Margin % INFRASTRUCTURE SEGMENT Total Revenue Hybrid Infrastructure Infrastructure Support Gross Profit $ Gross Margin % FINANCING SEGMENT Total Revenue Gross Profit $ Gross Margin % OTHER SEGMENT Total Revenue Operating (non-GAAP) Gross Profit $ TOTAL IBM CONTINUING OPS Total Revenue Operating (non-GAAP) Gross Profit $ Gross Margin % Historical Continuing Operations results do not represent IBM's go-forward Continuing Operations profile. 11 1Q'19 2Q'19 3Q'19 4Q'19 FY'19 1Q'20 2Q'20 3Q'20 4Q'20 FY'20 1Q'21 2Q'21 3Q'21 SepYTD'21 4,845 5,443 5,085 7,035 3,033 3,424 3,497 4,517 1,812 2,018 1,589 2,517 3,700 4,282 3,841 5,647 76.4% 78.7% 75.5% 80.3% 4,192 4,237 4,191 4,320 1,857 1,898 1,873 1,941 698 681 679 764 1,638 1,658 1,638 1,615 1,092 1,094 1,281 1,180 26.1% 25.8% 30.6% 27.3% 3,379 3,787 3,504 5,105 1,720 2,131 1,881 3,444 1,659 1,656 1,623 1,661 1,744 2,083 1,970 2,975 51.6% 55.0% 56.2% 58.3% 355 310 296 252 152 125 124 111 42.9% 40.3% 41.8% 43.9% 526 529 205 118 237 289 67 76 22,408 14,472 7,936 17,470 78.0% 16,939 7,569 2,821 6,549 4,648 27.4% 15,774 9,176 6,599 8,773 55.6% 1,215 512 42.2% 1,378 670 5,128 5,640 5,440 6,719 3,608 3,934 3,979 4,800 1,520 1,706 1,461 1,919 3,917 4,396 4,235 5,410 76.4% 78.0% 77.8% 80.5% 4,158 3,908 3,995 4,196 1,854 1,712 1,750 1,877 781 761 779 811 1,522 1,435 1,466 1,508 1,114 1,095 1,304 1,248 26.8% 28.0% 32.6% 29.7% 3,276 3,704 3,128 4,425 1,732 2,207 1,606 2,870 1,544 1,497 1,522 1,555 1,774 2,168 1,756 2,660 54.2% 58.5% 56.2% 60.1% 260 231 240 244 119 101 97 88 45.9% 43.6% 40.6% 36.0% 134 122 133 98 41 36 23 8 22,927 16,321 6,606 17,958 78.3% 16,257 7,193 3,133 5,931 4,760 29.3% 14,533 8,415 6,118 8,359 57.5% 975 405 41.6% 488 109 5,316 5,973 5,578 3,979 4,386 4,246 1,338 1,587 1,332 4,083 4,708 4,337 76.8% 78.8% 77.7% 4,262 4,378 4,457 1,953 2,049 2,068 835 814 889 1,474 1,514 1,501 1,187 1,209 1,315 27.8% 27.6% 29.5% 3,293 3,560 2,921 1,782 2,059 1,453 1,512 1,501 1,468 1,856 2,033 1,541 56.3% 57.1% 52.8% 208 209 184 74 62 53 35.5% 29.9% 28.7% 106 98 110 2 19 44 16,868 12,611 4,257 13,128 77.8% 13,098 6,070 2,538 4,489 3,711 28.3% 9,774 5,294 4,480 5,430 55.6% 601 189 31.5% 315 64 13,297 14,306 13,281 16,830 6,927 7,874 7,283 9,989 52.1% 55.0% 54.8% 59.4% 57,714 32,073 55.6% 12,956 13,604 12,937 15,682 6,965 7,796 7,416 9,414 53.8% 57.3% 57.3% 60.0% 55,179 31,591 57.3% 13,187 14,218 13,251 7,201 8,031 7,290 54.6% 56.5% 55.0% 40,656 22,522 55.4%

​

​


​

​

New Microsoft Word Document_ibm_ex99_1_page_12.gif

Forward-looking statements and non-GAAP information: Except for the historical information and discussions contained herein, certain statements made in this investor relations article may be characterized as forward looking under the Private Securities Litigation Reform Act of 1995. Forward-looking statements are based on the company’s current assumptions regarding future business and financial performance. Those statements by their nature address matters that are uncertain to different degrees and involve a number of factors that could cause actual results to differ materially. Additional information concerning these factors is contained in the company’s filings with the SEC. Copies are available from the SEC, from the IBM web site, or from IBM Investor Relations. Any forward-looking statement made speaks only as of the date on which it is made. Except as required by law, the company assumes no obligation to update or revise any forward-looking statements. This article, the below-mentioned rationale for management’s use of non-GAAP metrics and the below-mentioned reconciliations are integrally related and are intended to be presented and understood together. In an effort to provide better transparency into IBM’s operational results and forward-looking financial information on a continuing operations basis, as determined by generally accepted accounting principles (GAAP), these materials contain non-GAAP financial measures, including “operating” earnings, free cash flow, as well as a post-separation modeled free cash flow estimate and pro forma earnings. The rationale for management’s use of non-GAAP information and a reconciliation of these non-GAAP financial measures to the most directly comparable GAAP measures are included in Exhibit 99.2 to the company’s Form 8-K furnished with the SEC on December 27, 2021. >?

​


Exhibit 99.2

​

​

Graphic

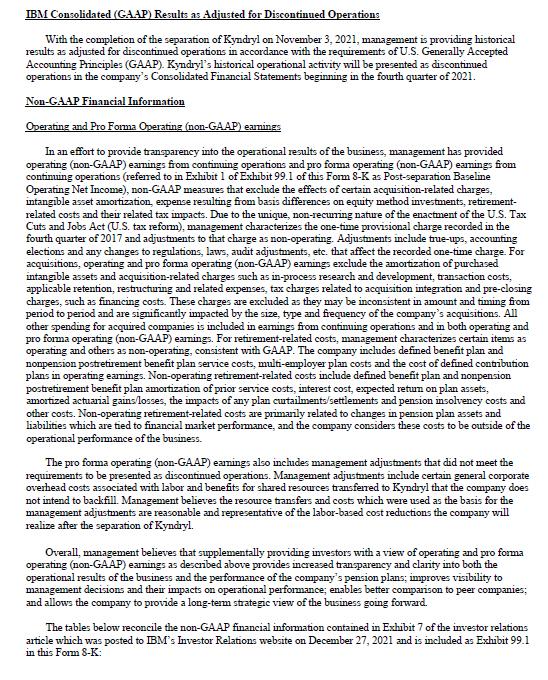
EXHIBIT 99.2 IBM Consolidated (GAAP) Results as Adjusted for Discontinued Operations With the completion of the separation of Kyndryl on November 3, 2021, management is providing historical results as adjusted for discontinued operations in accordance with the requirements of U.S. Generally Accepted Accounting Principles (GAAP). Kyndryl’s historical operational activity will be presented as discontinued operations in the company’s Consolidated Financial Statements beginning in the fourth quarter of 2021. Non-GAAP Financial Information Operating and Pro Forma Operating (non-GAAP) earnings In an effort to provide transparency into the operational results of the business, management has provided operating (non-GAAP) earnings from continuing operations and pro forma operating (non-GAAP) earnings from continuing operations (referred to in Exhibit 1 of Exhibit 99.1 of this Form 8-K as Post-separation Baseline Operating Net Income), non-GAAP measures that exclude the effects of certain acquisition-related charges, intangible asset amortization, expense resulting from basis differences on equity method investments, retirement-related costs and their related tax impacts. Due to the unique, non-recurring nature of the enactment of the U.S. Tax Cuts and Jobs Act (U.S. tax reform), management characterizes the one-time provisional charge recorded in the fourth quarter of 2017 and adjustments to that charge as non-operating. Adjustments include true-ups, accounting elections and any changes to regulations, laws, audit adjustments, etc. that affect the recorded one-time charge. For acquisitions, operating and pro forma operating (non-GAAP) earnings exclude the amortization of purchased intangible assets and acquisition-related charges such as in-process research and development, transaction costs, applicable retention, restructuring and related expenses, tax charges related to acquisition integration and pre-closing charges, such as financing costs. These charges are excluded as they may be inconsistent in amount and timing from period to period and are significantly impacted by the size, type and frequency of the company’s acquisitions. All other spending for acquired companies is included in earnings from continuing operations and in both operating and pro forma operating (non-GAAP) earnings. For retirement-related costs, management characterizes certain items as operating and others as non-operating, consistent with GAAP. The company includes defined benefit plan and nonpension postretirement benefit plan service costs, multi-employer plan costs and the cost of defined contribution plans in operating earnings. Non-operating retirement-related costs include defined benefit plan and nonpension postretirement benefit plan amortization of prior service costs, interest cost, expected return on plan assets, amortized actuarial gains/losses, the impacts of any plan curtailments/settlements and pension insolvency costs and other costs. Non-operating retirement-related costs are primarily related to changes in pension plan assets and liabilities which are tied to financial market performance, and the company considers these costs to be outside of the operational performance of the business. The pro forma operating (non-GAAP) earnings also includes management adjustments that did not meet the requirements to be presented as discontinued operations. Management adjustments include certain general corporate overhead costs associated with labor and benefits for shared resources transferred to Kyndryl that the company does not intend to backfill. Management believes the resource transfers and costs which were used as the basis for the management adjustments are reasonable and representative of the labor-based cost reductions the company will realize after the separation of Kyndryl. Overall, management believes that supplementally providing investors with a view of operating and pro forma operating (non-GAAP) earnings as described above provides increased transparency and clarity into both the operational results of the business and the performance of the company’s pension plans; improves visibility to management decisions and their impacts on operational performance; enables better comparison to peer companies; and allows the company to provide a long-term strategic view of the business going forward. The tables below reconcile the non-GAAP financial information contained in Exhibit 7 of the investor relations article which was posted to IBM’s Investor Relations website on December 27, 2021 and is included as Exhibit 99.1 in this Form 8-K:

​

​


New Microsoft Word Document_ibm_ex99_2_page_02.gif

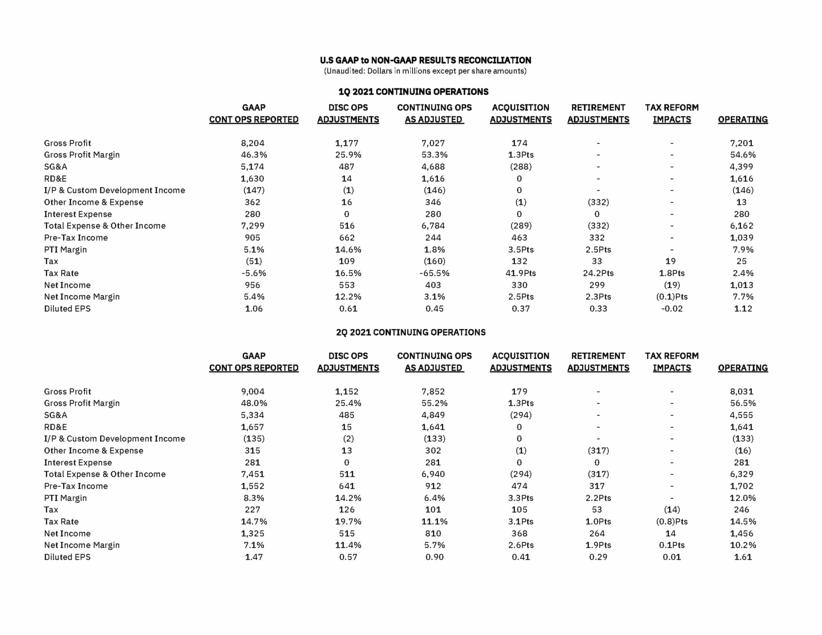
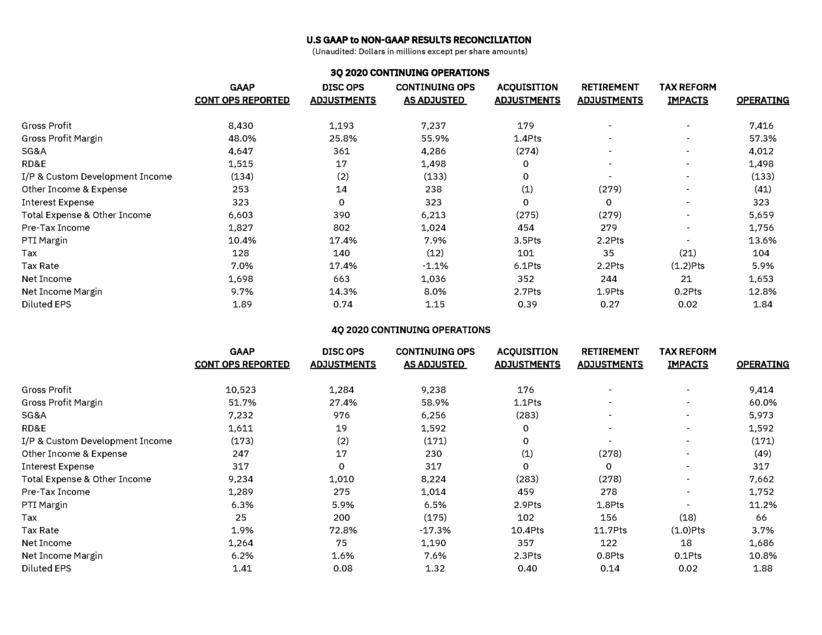
U.S GAAP to NON-GAAP RESULTS RECONCILIATION (Unaudited: Dollars in millions except per share amounts) 1Q 2021 CONTINUING OPERATIONS GAAP CONT OPS REPORTED DISC OPS ADJUSTMENTS CONTINUING OPS AS ADJUSTED ACQUISITION ADJUSTMENTS RETIREMENT ADJUSTMENTS TAX REFORM IMPACTS OPERATING Gross Profit Gross Profit Margin SG&A RD&E I/P & Custom Development Income Other Income & Expense Interest Expense Total Expense & Other Income Pre-Tax Income PTI Margin Tax Tax Rate Net Income Net Income Margin Diluted EPS 8,204 46.3% 5,174 1,630 (147) 362 280 7,299 905 5.1% (51) -5.6% 956 5.4% 1.06 1,177 25.9% 487 14 (1) 16 0 516 662 14.6% 109 16.5% 553 12.2% 0.61 7,027 53.3% 4,688 1,616 (146) 346 280 6,784 244 1.8% (160) -65.5% 403 3.1% 0.45 174 1.3Pts (288) 0 0 (1) 0 (289) 463 3.5Pts 132 41.9Pts 330 2.5Pts 0.37 - - - - - (332) 0 (332) 332 2.5Pts 33 24.2Pts 299 2.3Pts 0.33 - - - - - - - - - - 19 1.8Pts (19) (0.1)Pts -0.02 7,201 54.6% 4,399 1,616 (146) 13 280 6,162 1,039 7.9% 25 2.4% 1,013 7.7% 1.12 2Q 2021 CONTINUING OPERATIONS GAAP CONT OPS REPORTED DISC OPS ADJUSTMENTS CONTINUING OPS AS ADJUSTED ACQUISITION ADJUSTMENTS RETIREMENT ADJUSTMENTS TAX REFORM IMPACTS OPERATING Gross Profit Gross Profit Margin SG&A RD&E I/P & Custom Development Income Other Income & Expense Interest Expense Total Expense & Other Income Pre-Tax Income PTI Margin Tax Tax Rate Net Income Net Income Margin Diluted EPS 9,004 48.0% 5,334 1,657 (135) 315 281 7,451 1,552 8.3% 227 14.7% 1,325 7.1% 1.47 1,152 25.4% 485 15 (2) 13 0 511 641 14.2% 126 19.7% 515 11.4% 0.57 7,852 55.2% 4,849 1,641 (133) 302 281 6,940 912 6.4% 101 11.1% 810 5.7% 0.90 179 1.3Pts (294) 0 0 (1) 0 (294) 474 3.3Pts 105 3.1Pts 368 2.6Pts 0.41 - - - - - (317) 0 (317) 317 2.2Pts 53 1.0Pts 264 1.9Pts 0.29 - - - - - - - - - - (14) (0.8)Pts 14 0.1Pts 0.01 8,031 56.5% 4,555 1,641 (133) (16) 281 6,329 1,702 12.0% 246 14.5% 1,456 10.2% 1.61

​


New Microsoft Word Document_ibm_ex99_2_page_03.gif

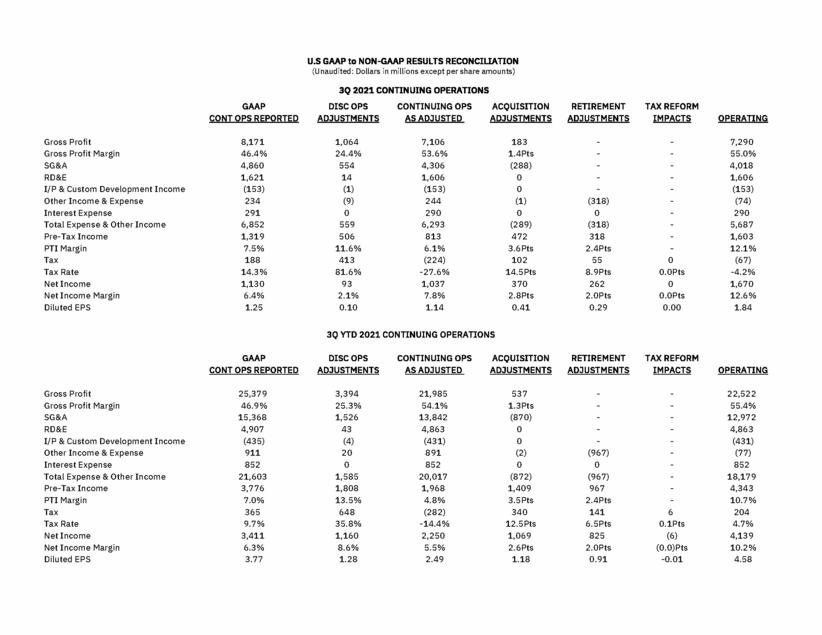
U.S GAAP to NON-GAAP RESULTS RECONCILIATION (Unaudited: Dollars in millions except per share amounts) 3Q 2021 CONTINUING OPERATIONS GAAP CONT OPS REPORTED DISC OPS ADJUSTMENTS CONTINUING OPS AS ADJUSTED ACQUISITION ADJUSTMENTS RETIREMENT ADJUSTMENTS TAX REFORM IMPACTS OPERATING Gross Profit Gross Profit Margin SG&A RD&E I/P & Custom Development Income Other Income & Expense Interest Expense Total Expense & Other Income Pre-Tax Income PTI Margin Tax Tax Rate Net Income Net Income Margin Diluted EPS 8,171 46.4% 4,860 1,621 (153) 234 291 6,852 1,319 7.5% 188 14.3% 1,130 6.4% 1.25 1,064 24.4% 554 14 (1) (9) 0 559 506 11.6% 413 81.6% 93 2.1% 0.10 7,106 53.6% 4,306 1,606 (153) 244 290 6,293 813 6.1% (224) -27.6% 1,037 7.8% 1.14 183 1.4Pts (288) 0 0 (1) 0 (289) 472 3.6Pts 102 14.5Pts 370 2.8Pts 0.41 - - - - - (318) 0 (318) 318 2.4Pts 55 8.9Pts 262 2.0Pts 0.29 - - - - - - - - - - 0 0.0Pts 0 0.0Pts 0.00 7,290 55.0% 4,018 1,606 (153) (74) 290 5,687 1,603 12.1% (67) -4.2% 1,670 12.6% 1.84 3Q YTD 2021 CONTINUING OPERATIONS GAAP CONT OPS REPORTED DISC OPS ADJUSTMENTS CONTINUING OPS AS ADJUSTED ACQUISITION ADJUSTMENTS RETIREMENT ADJUSTMENTS TAX REFORM IMPACTS OPERATING Gross Profit Gross Profit Margin SG&A RD&E I/P & Custom Development Income Other Income & Expense Interest Expense Total Expense & Other Income Pre-Tax Income PTI Margin Tax Tax Rate Net Income Net Income Margin Diluted EPS 25,379 46.9% 15,368 4,907 (435) 911 852 21,603 3,776 7.0% 365 9.7% 3,411 6.3% 3.77 3,394 25.3% 1,526 43 (4) 20 0 1,585 1,808 13.5% 648 35.8% 1,160 8.6% 1.28 21,985 54.1% 13,842 4,863 (431) 891 852 20,017 1,968 4.8% (282) -14.4% 2,250 5.5% 2.49 537 1.3Pts (870) 0 0 (2) 0 (872) 1,409 3.5Pts 340 12.5Pts 1,069 2.6Pts 1.18 - - - - - (967) 0 (967) 967 2.4Pts 141 6.5Pts 825 2.0Pts 0.91 - - - - - - - - - - 6 0.1Pts (6) (0.0)Pts -0.01 22,522 55.4% 12,972 4,863 (431) (77) 852 18,179 4,343 10.7% 204 4.7% 4,139 10.2% 4.58

​


New Microsoft Word Document_ibm_ex99_2_page_04.gif

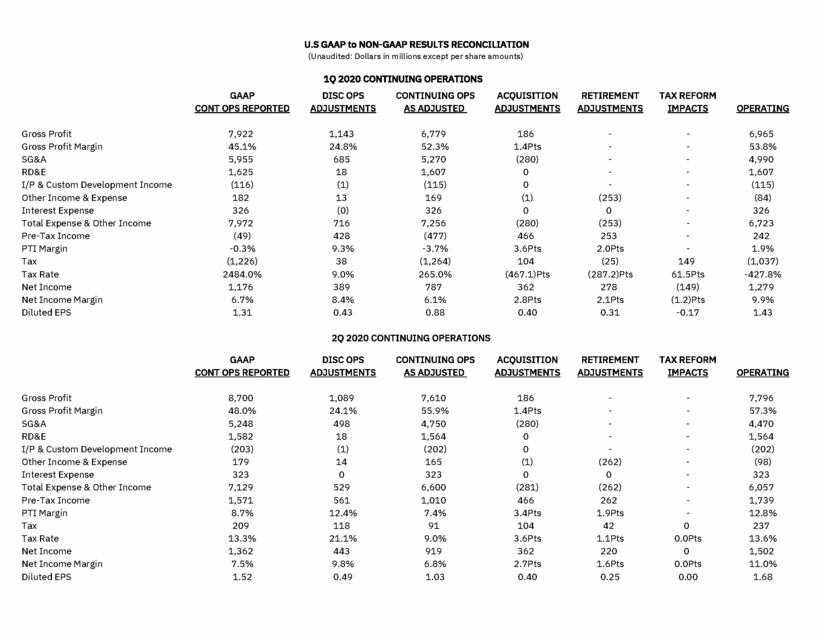
U.S GAAP to NON-GAAP RESULTS RECONCILIATION (Unaudited: Dollars in millions except per share amounts) 1Q 2020 CONTINUING OPERATIONS GAAP CONT OPS REPORTED DISC OPS ADJUSTMENTS CONTINUING OPS AS ADJUSTED ACQUISITION ADJUSTMENTS RETIREMENT ADJUSTMENTS TAX REFORM IMPACTS OPERATING Gross Profit Gross Profit Margin SG&A RD&E I/P & Custom Development Income Other Income & Expense Interest Expense Total Expense & Other Income Pre-Tax Income PTI Margin Tax Tax Rate Net Income Net Income Margin Diluted EPS 7,922 45.1% 5,955 1,625 (116) 182 326 7,972 (49) -0.3% (1,226) 2484.0% 1,176 6.7% 1.31 1,143 24.8% 685 18 (1) 13 (0) 716 428 9.3% 38 9.0% 389 8.4% 0.43 6,779 52.3% 5,270 1,607 (115) 169 326 7,256 (477) -3.7% (1,264) 265.0% 787 6.1% 0.88 186 1.4Pts (280) 0 0 (1) 0 (280) 466 3.6Pts 104 (467.1)Pts 362 2.8Pts 0.40 - - - - - (253) 0 (253) 253 2.0Pts (25) (287.2)Pts 278 2.1Pts 0.31 - - - - - - - - - - 149 61.5Pts (149) (1.2)Pts -0.17 6,965 53.8% 4,990 1,607 (115) (84) 326 6,723 242 1.9% (1,037) -427.8% 1,279 9.9% 1.43 2Q 2020 CONTINUING OPERATIONS GAAP CONT OPS REPORTED DISC OPS ADJUSTMENTS CONTINUING OPS AS ADJUSTED ACQUISITION ADJUSTMENTS RETIREMENT ADJUSTMENTS TAX REFORM IMPACTS OPERATING Gross Profit Gross Profit Margin SG&A RD&E I/P & Custom Development Income Other Income & Expense Interest Expense Total Expense & Other Income Pre-Tax Income PTI Margin Tax Tax Rate Net Income Net Income Margin Diluted EPS 8,700 48.0% 5,248 1,582 (203) 179 323 7,129 1,571 8.7% 209 13.3% 1,362 7.5% 1.52 1,089 24.1% 498 18 (1) 14 0 529 561 12.4% 118 21.1% 443 9.8% 0.49 7,610 55.9% 4,750 1,564 (202) 165 323 6,600 1,010 7.4% 91 9.0% 919 6.8% 1.03 186 1.4Pts (280) 0 0 (1) 0 (281) 466 3.4Pts 104 3.6Pts 362 2.7Pts 0.40 - - - - - (262) 0 (262) 262 1.9Pts 42 1.1Pts 220 1.6Pts 0.25 - - - - - - - - - - 0 0.0Pts 0 0.0Pts 0.00 7,796 57.3% 4,470 1,564 (202) (98) 323 6,057 1,739 12.8% 237 13.6% 1,502 11.0% 1.68

​


New Microsoft Word Document_ibm_ex99_2_page_05.gif

U.S GAAP to NON-GAAP RESULTS RECONCILIATION (Unaudited: Dollars in millions except per share amounts) 3Q 2020 CONTINUING OPERATIONS GAAP CONT OPS REPORTED DISC OPS ADJUSTMENTS CONTINUING OPS AS ADJUSTED ACQUISITION ADJUSTMENTS RETIREMENT ADJUSTMENTS TAX REFORM IMPACTS OPERATING Gross Profit Gross Profit Margin SG&A RD&E I/P & Custom Development Income Other Income & Expense Interest Expense Total Expense & Other Income Pre-Tax Income PTI Margin Tax Tax Rate Net Income Net Income Margin Diluted EPS 8,430 48.0% 4,647 1,515 (134) 253 323 6,603 1,827 10.4% 128 7.0% 1,698 9.7% 1.89 1,193 25.8% 361 17 (2) 14 0 390 802 17.4% 140 17.4% 663 14.3% 0.74 7,237 55.9% 4,286 1,498 (133) 238 323 6,213 1,024 7.9% (12) -1.1% 1,036 8.0% 1.15 179 1.4Pts (274) 0 0 (1) 0 (275) 454 3.5Pts 101 6.1Pts 352 2.7Pts 0.39 - - - - - (279) 0 (279) 279 2.2Pts 35 2.2Pts 244 1.9Pts 0.27 - - - - - - - - - - (21) (1.2)Pts 21 0.2Pts 0.02 7,416 57.3% 4,012 1,498 (133) (41) 323 5,659 1,756 13.6% 104 5.9% 1,653 12.8% 1.84 4Q 2020 CONTINUING OPERATIONS GAAP CONT OPS REPORTED DISC OPS ADJUSTMENTS CONTINUING OPS AS ADJUSTED ACQUISITION ADJUSTMENTS RETIREMENT ADJUSTMENTS TAX REFORM IMPACTS OPERATING Gross Profit Gross Profit Margin SG&A RD&E I/P & Custom Development Income Other Income & Expense Interest Expense Total Expense & Other Income Pre-Tax Income PTI Margin Tax Tax Rate Net Income Net Income Margin Diluted EPS 10,523 51.7% 7,232 1,611 (173) 247 317 9,234 1,289 6.3% 25 1.9% 1,264 6.2% 1.41 1,284 27.4% 976 19 (2) 17 0 1,010 275 5.9% 200 72.8% 75 1.6% 0.08 9,238 58.9% 6,256 1,592 (171) 230 317 8,224 1,014 6.5% (175) -17.3% 1,190 7.6% 1.32 176 1.1Pts (283) 0 0 (1) 0 (283) 459 2.9Pts 102 10.4Pts 357 2.3Pts 0.40 - - - - - (278) 0 (278) 278 1.8Pts 156 11.7Pts 122 0.8Pts 0.14 - - - - - - - - - - (18) (1.0)Pts 18 0.1Pts 0.02 9,414 60.0% 5,973 1,592 (171) (49) 317 7,662 1,752 11.2% 66 3.7% 1,686 10.8% 1.88

​


New Microsoft Word Document_ibm_ex99_2_page_06.gif

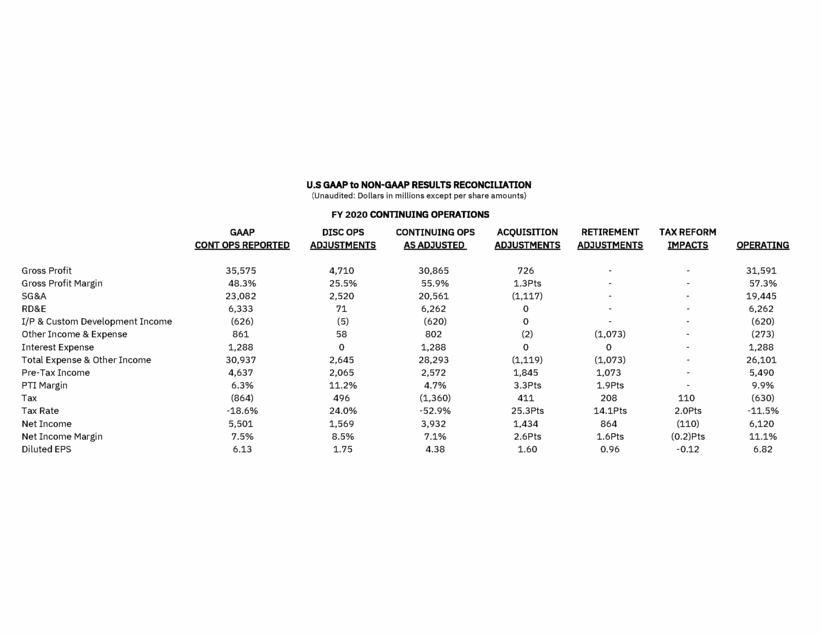
U.S GAAP to NON-GAAP RESULTS RECONCILIATION (Unaudited: Dollars in millions except per share amounts) FY 2020 CONTINUING OPERATIONS GAAP CONT OPS REPORTED DISC OPS ADJUSTMENTS CONTINUING OPS AS ADJUSTED ACQUISITION ADJUSTMENTS RETIREMENT ADJUSTMENTS TAX REFORM IMPACTS OPERATING Gross Profit Gross Profit Margin SG&A RD&E I/P & Custom Development Income Other Income & Expense Interest Expense Total Expense & Other Income Pre-Tax Income PTI Margin Tax Tax Rate Net Income Net Income Margin Diluted EPS 35,575 48.3% 23,082 6,333 (626) 861 1,288 30,937 4,637 6.3% (864) -18.6% 5,501 7.5% 6.13 4,710 25.5% 2,520 71 (5) 58 0 2,645 2,065 11.2% 496 24.0% 1,569 8.5% 1.75 30,865 55.9% 20,561 6,262 (620) 802 1,288 28,293 2,572 4.7% (1,360) -52.9% 3,932 7.1% 4.38 726 1.3Pts (1,117) 0 0 (2) 0 (1,119) 1,845 3.3Pts 411 25.3Pts 1,434 2.6Pts 1.60 - - - - - (1,073) 0 (1,073) 1,073 1.9Pts 208 14.1Pts 864 1.6Pts 0.96 - - - - - - - - - - 110 2.0Pts (110) (0.2)Pts -0.12 31,591 57.3% 19,445 6,262 (620) (273) 1,288 26,101 5,490 9.9% (630) -11.5% 6,120 11.1% 6.82

​


New Microsoft Word Document_ibm_ex99_2_page_07.gif

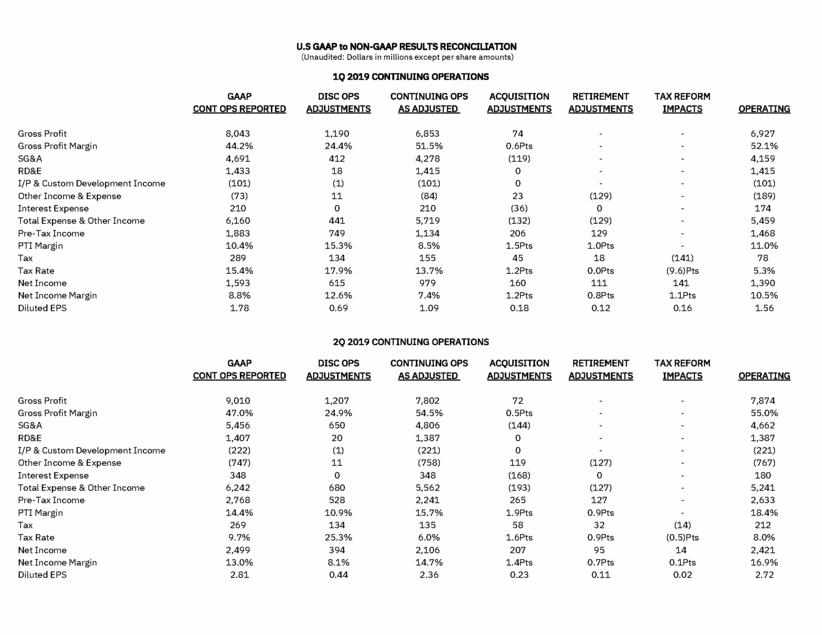
U.S GAAP to NON-GAAP RESULTS RECONCILIATION (Unaudited: Dollars in millions except per share amounts) 1Q 2019 CONTINUING OPERATIONS GAAP CONT OPS REPORTED DISC OPS ADJUSTMENTS CONTINUING OPS AS ADJUSTED ACQUISITION ADJUSTMENTS RETIREMENT ADJUSTMENTS TAX REFORM IMPACTS OPERATING Gross Profit Gross Profit Margin SG&A RD&E I/P & Custom Development Income Other Income & Expense Interest Expense Total Expense & Other Income Pre-Tax Income PTI Margin Tax Tax Rate Net Income Net Income Margin Diluted EPS 8,043 44.2% 4,691 1,433 (101) (73) 210 6,160 1,883 10.4% 289 15.4% 1,593 8.8% 1.78 1,190 24.4% 412 18 (1) 11 0 441 749 15.3% 134 17.9% 615 12.6% 0.69 6,853 51.5% 4,278 1,415 (101) (84) 210 5,719 1,134 8.5% 155 13.7% 979 7.4% 1.09 74 0.6Pts (119) 0 0 23 (36) (132) 206 1.5Pts 45 1.2Pts 160 1.2Pts 0.18 - - - - - (129) 0 (129) 129 1.0Pts 18 0.0Pts 111 0.8Pts 0.12 - - - - - - - - - - (141) (9.6)Pts 141 1.1Pts 0.16 6,927 52.1% 4,159 1,415 (101) (189) 174 5,459 1,468 11.0% 78 5.3% 1,390 10.5% 1.56 2Q 2019 CONTINUING OPERATIONS GAAP CONT OPS REPORTED DISC OPS ADJUSTMENTS CONTINUING OPS AS ADJUSTED ACQUISITION ADJUSTMENTS RETIREMENT ADJUSTMENTS TAX REFORM IMPACTS OPERATING Gross Profit Gross Profit Margin SG&A RD&E I/P & Custom Development Income Other Income & Expense Interest Expense Total Expense & Other Income Pre-Tax Income PTI Margin Tax Tax Rate Net Income Net Income Margin Diluted EPS 9,010 47.0% 5,456 1,407 (222) (747) 348 6,242 2,768 14.4% 269 9.7% 2,499 13.0% 2.81 1,207 24.9% 650 20 (1) 11 0 680 528 10.9% 134 25.3% 394 8.1% 0.44 7,802 54.5% 4,806 1,387 (221) (758) 348 5,562 2,241 15.7% 135 6.0% 2,106 14.7% 2.36 72 0.5Pts (144) 0 0 119 (168) (193) 265 1.9Pts 58 1.6Pts 207 1.4Pts 0.23 - - - - - (127) 0 (127) 127 0.9Pts 32 0.9Pts 95 0.7Pts 0.11 - - - - - - - - - - (14) (0.5)Pts 14 0.1Pts 0.02 7,874 55.0% 4,662 1,387 (221) (767) 180 5,241 2,633 18.4% 212 8.0% 2,421 16.9% 2.72

​


New Microsoft Word Document_ibm_ex99_2_page_08.gif

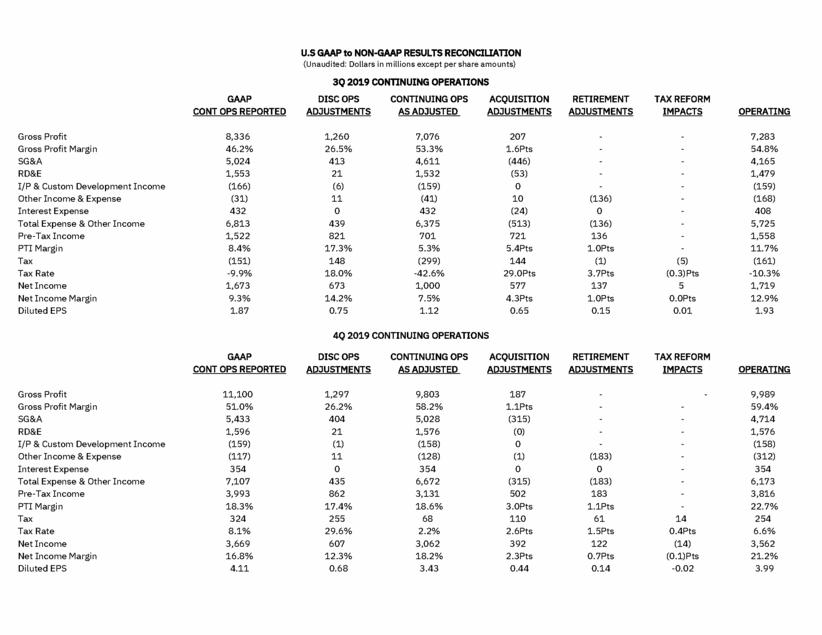
U.S GAAP to NON-GAAP RESULTS RECONCILIATION (Unaudited: Dollars in millions except per share amounts) 3Q 2019 CONTINUING OPERATIONS GAAP CONT OPS REPORTED DISC OPS ADJUSTMENTS CONTINUING OPS AS ADJUSTED ACQUISITION ADJUSTMENTS RETIREMENT ADJUSTMENTS TAX REFORM IMPACTS OPERATING Gross Profit Gross Profit Margin SG&A RD&E I/P & Custom Development Income Other Income & Expense Interest Expense Total Expense & Other Income Pre-Tax Income PTI Margin Tax Tax Rate Net Income Net Income Margin Diluted EPS 8,336 46.2% 5,024 1,553 (166) (31) 432 6,813 1,522 8.4% (151) -9.9% 1,673 9.3% 1.87 1,260 26.5% 413 21 (6) 11 0 439 821 17.3% 148 18.0% 673 14.2% 0.75 7,076 53.3% 4,611 1,532 (159) (41) 432 6,375 701 5.3% (299) -42.6% 1,000 7.5% 1.12 207 1.6Pts (446) (53) 0 10 (24) (513) 721 5.4Pts 144 29.0Pts 577 4.3Pts 0.65 - - - - - (136) 0 (136) 136 1.0Pts (1) 3.7Pts 137 1.0Pts 0.15 - - - - - - - - - - (5) (0.3)Pts 5 0.0Pts 0.01 7,283 54.8% 4,165 1,479 (159) (168) 408 5,725 1,558 11.7% (161) -10.3% 1,719 12.9% 1.93 4Q 2019 CONTINUING OPERATIONS GAAP CONT OPS REPORTED DISC OPS ADJUSTMENTS CONTINUING OPS AS ADJUSTED ACQUISITION ADJUSTMENTS RETIREMENT ADJUSTMENTS TAX REFORM IMPACTS OPERATING Gross Profit Gross Profit Margin SG&A RD&E I/P & Custom Development Income Other Income & Expense Interest Expense Total Expense & Other Income Pre-Tax Income PTI Margin Tax Tax Rate Net Income Net Income Margin Diluted EPS 11,100 51.0% 5,433 1,596 (159) (117) 354 7,107 3,993 18.3% 324 8.1% 3,669 16.8% 4.11 1,297 26.2% 404 21 (1) 11 0 435 862 17.4% 255 29.6% 607 12.3% 0.68 9,803 58.2% 5,028 1,576 (158) (128) 354 6,672 3,131 18.6% 68 2.2% 3,062 18.2% 3.43 187 1.1Pts (315) (0) 0 (1) 0 (315) 502 3.0Pts 110 2.6Pts 392 2.3Pts 0.44 - - - - - (183) 0 (183) 183 1.1Pts 61 1.5Pts 122 0.7Pts 0.14 - 9,989 59.4% 4,714 1,576 (158) (312) 354 6,173 3,816 22.7% 254 6.6% 3,562 21.2% 3.99 - - - - - - - - - 14 0.4Pts (14) (0.1)Pts -0.02

​


New Microsoft Word Document_ibm_ex99_2_page_09.gif

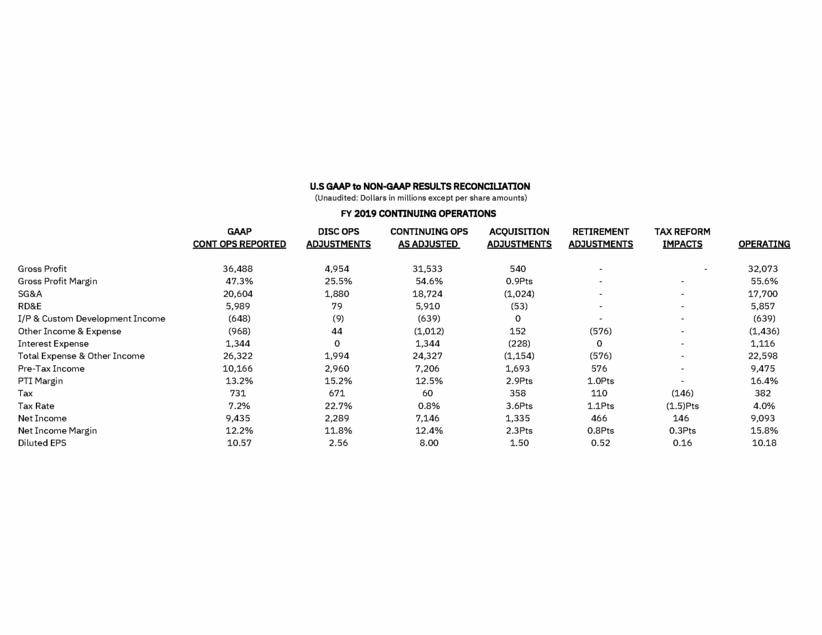
U.S GAAP to NON-GAAP RESULTS RECONCILIATION (Unaudited: Dollars in millions except per share amounts) FY 2019 CONTINUING OPERATIONS GAAP CONT OPS REPORTED DISC OPS ADJUSTMENTS CONTINUING OPS AS ADJUSTED ACQUISITION ADJUSTMENTS RETIREMENT ADJUSTMENTS TAX REFORM IMPACTS OPERATING Gross Profit Gross Profit Margin SG&A RD&E I/P & Custom Development Income Other Income & Expense Interest Expense Total Expense & Other Income Pre-Tax Income PTI Margin Tax Tax Rate Net Income Net Income Margin Diluted EPS 36,488 47.3% 20,604 5,989 (648) (968) 1,344 26,322 10,166 13.2% 731 7.2% 9,435 12.2% 10.57 4,954 25.5% 1,880 79 (9) 44 0 1,994 2,960 15.2% 671 22.7% 2,289 11.8% 2.56 31,533 54.6% 18,724 5,910 (639) (1,012) 1,344 24,327 7,206 12.5% 60 0.8% 7,146 12.4% 8.00 540 0.9Pts (1,024) (53) 0 152 (228) (1,154) 1,693 2.9Pts 358 3.6Pts 1,335 2.3Pts 1.50 - - - - - (576) 0 (576) 576 1.0Pts 110 1.1Pts 466 0.8Pts 0.52 - 32,073 55.6% 17,700 5,857 (639) (1,436) 1,116 22,598 9,475 16.4% 382 4.0% 9,093 15.8% 10.18 - - - - - - - - - (146) (1.5)Pts 146 0.3Pts 0.16

​


New Microsoft Word Document_ibm_ex99_2_page_10.gif

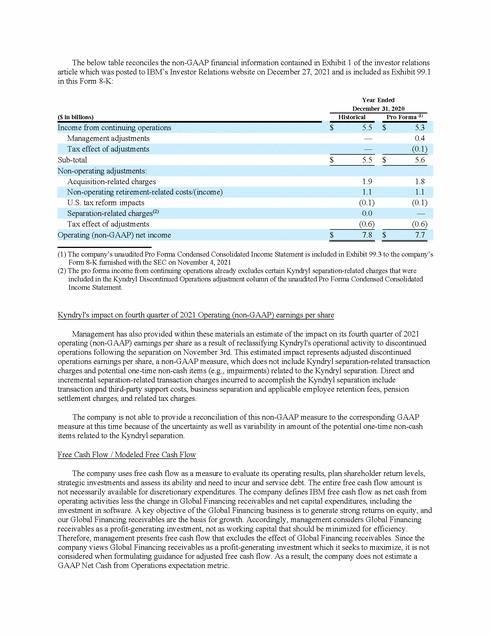
The below table reconciles the non-GAAP financial information contained in Exhibit 1 of the investor relations article which was posted to IBM’s Investor Relations website on December 27, 2021 and is included as Exhibit 99.1 in this Form 8-K: Year Ended December 31, 2020 ($ in billions) Historical Pro Forma (1) Management adjustments — 0.4 Sub-total $ 5.5 $ 5.6 Acquisition-related charges 1.9 1.8 U.S. tax reform impacts (0.1) (0.1) Tax effect of adjustments (0.6) (0.6) (1) The company’s unaudited Pro Forma Condensed Consolidated Income Statement is included in Exhibit 99.3 to the company’s Form 8-K furnished with the SEC on November 4, 2021 (2) The pro forma income from continuing operations already excludes certain Kyndryl separation-related charges that were included in the Kyndryl Discontinued Operations adjustment column of the unaudited Pro Forma Condensed Consolidated Income Statement. Kyndryl's impact on fourth quarter of 2021 Operating (non-GAAP) earnings per share Management has also provided within these materials an estimate of the impact on its fourth quarter of 2021 operating (non-GAAP) earnings per share as a result of reclassifying Kyndryl's operational activity to discontinued operations following the separation on November 3rd. This estimated impact represents adjusted discontinued operations earnings per share, a non-GAAP measure, which does not include Kyndryl separation-related transaction charges and potential one-time non-cash items (e.g., impairments) related to the Kyndryl separation. Direct and incremental separation-related transaction charges incurred to accomplish the Kyndryl separation include transaction and third-party support costs, business separation and applicable employee retention fees, pension settlement charges, and related tax charges. The company is not able to provide a reconciliation of this non-GAAP measure to the corresponding GAAP measure at this time because of the uncertainty as well as variability in amount of the potential one-time non-cash items related to the Kyndryl separation. Free Cash Flow / Modeled Free Cash Flow The company uses free cash flow as a measure to evaluate its operating results, plan shareholder return levels, strategic investments and assess its ability and need to incur and service debt. The entire free cash flow amount is not necessarily available for discretionary expenditures. The company defines IBM free cash flow as net cash from operating activities less the change in Global Financing receivables and net capital expenditures, including the investment in software. A key objective of the Global Financing business is to generate strong returns on equity, and our Global Financing receivables are the basis for growth. Accordingly, management considers Global Financing receivables as a profit-generating investment, not as working capital that should be minimized for efficiency. Therefore, management presents free cash flow that excludes the effect of Global Financing receivables. Since the company views Global Financing receivables as a profit-generating investment which it seeks to maximize, it is not considered when formulating guidance for adjusted free cash flow. As a result, the company does not estimate a GAAP Net Cash from Operations expectation metric. Operating (non-GAAP) net income$7.8$7.7 Separation-related charges(2)0.0— Non-operating retirement-related costs/(income)1.11.1 Non-operating adjustments: Tax effect of adjustments—(0.1) Income from continuing operations$5.5$5.3

​


​

​

Graphic

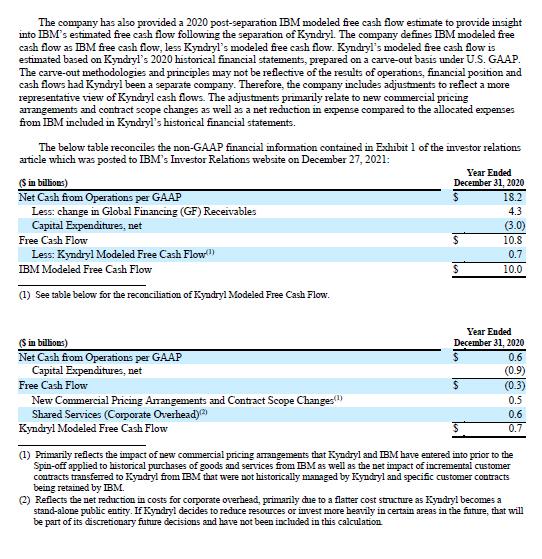
The company has also provided a 2020 post-separation IBM modeled free cash flow estimate to provide insight into IBM’s estimated free cash flow following the separation of Kyndryl. The company defines IBM modeled free cash flow as IBM free cash flow, less Kyndryl’s modeled free cash flow. Kyndryl’s modeled free cash flow is estimated based on Kyndryl’s 2020 historical financial statements, prepared on a carve-out basis under U.S. GAAP. The carve-out methodologies and principles may not be reflective of the results of operations, financial position and cash flows had Kyndryl been a separate company. Therefore, the company includes adjustments to reflect a more representative view of Kyndryl cash flows. The adjustments primarily relate to new commercial pricing arrangements and contract scope changes as well as a net reduction in expense compared to the allocated expenses from IBM included in Kyndryl’s historical financial statements. The below table reconciles the non-GAAP financial information contained in Exhibit 1 of the investor relations article which was posted to IBM’s Investor Relations website on December 27, 2021: Year Ended ($ in billions) December 31, 2020 Less: change in Global Financing (GF) Receivables 4.3 Free Cash Flow $ 10.8 IBM Modeled Free Cash Flow $ 10.0 (1) See table below for the reconciliation of Kyndryl Modeled Free Cash Flow. Year Ended December 31, 2020 ($ in billions) Capital Expenditures, net (0.9) New Commercial Pricing Arrangements and Contract Scope Changes(1) 0.5 Kyndryl Modeled Free Cash Flow $ 0.7 (1) Primarily reflects the impact of new commercial pricing arrangements that Kyndryl and IBM have entered into prior to the Spin-off applied to historical purchases of goods and services from IBM as well as the net impact of incremental customer contracts transferred to Kyndryl from IBM that were not historically managed by Kyndryl and specific customer contracts being retained by IBM. (2) Reflects the net reduction in costs for corporate overhead, primarily due to a flatter cost structure as Kyndryl becomes a stand-alone public entity. If Kyndryl decides to reduce resources or invest more heavily in certain areas in the future, that will be part of its discretionary future decisions and have not been included in this calculation. Shared Services (Corporate Overhead)(2)0.6 Free Cash Flow$(0.3) Net Cash from Operations per GAAP$0.6 Less: Kyndryl Modeled Free Cash Flow(1)0.7 Capital Expenditures, net(3.0) Net Cash from Operations per GAAP$18.2

​