ibm-20250423
0000051143falseCHX00000511432025-04-232025-04-230000051143exch:XNYSus-gaap:CommonStockMember2025-04-232025-04-230000051143exch:XCHIus-gaap:CommonStockMember2025-04-232025-04-230000051143exch:XNYSibm:Notes2.875PercentDue2025Member2025-04-232025-04-230000051143exch:XNYSibm:Notes0.950PercentDue2025Member2025-04-232025-04-230000051143exch:XNYSibm:Notes0.300PercentDue2026Member2025-04-232025-04-230000051143exch:XNYSibm:Notes1.250PercentDue2027Member2025-04-232025-04-230000051143exch:XNYSibm:A3375NotesDue2027Member2025-04-232025-04-230000051143exch:XNYSibm:Notes0.300PercentDue2028Member2025-04-232025-04-230000051143exch:XNYSibm:Notes1.750PercentDue2028Member2025-04-232025-04-230000051143exch:XNYSibm:Notes1.500PercentDue2029Member2025-04-232025-04-230000051143exch:XNYSibm:Notes0.875PercentDue2030Member2025-04-232025-04-230000051143exch:XNYSibm:A2.900NotesDue2030Member2025-04-232025-04-230000051143exch:XNYSibm:Notes1.750PercentDue2031Member2025-04-232025-04-230000051143exch:XNYSibm:A3625NotesDue2031Member2025-04-232025-04-230000051143exch:XNYSibm:Notes0.650PercentDue2032Member2025-04-232025-04-230000051143exch:XNYSibm:A3.150NotesDue2033Member2025-04-232025-04-230000051143exch:XNYSibm:Notes1.250PercentDue2034Member2025-04-232025-04-230000051143exch:XNYSibm:A3750NotesDue2035Member2025-04-232025-04-230000051143exch:XNYSibm:A3.450NotesDue2037Member2025-04-232025-04-230000051143exch:XNYSibm:A4875NotesDue2038Member2025-04-232025-04-230000051143exch:XNYSibm:Notes1.200PercentDue2040Member2025-04-232025-04-230000051143exch:XNYSibm:A4000NotesDue2043Member2025-04-232025-04-230000051143exch:XNYSibm:A3.800NotesDue2045Member2025-04-232025-04-230000051143exch:XNYSibm:Debentures7.00PercentDue2025Member2025-04-232025-04-230000051143exch:XNYSibm:Debentures6.22PercentDue2027Member2025-04-232025-04-230000051143exch:XNYSibm:Debentures6.50PercentDue2028Member2025-04-232025-04-230000051143exch:XNYSibm:Debentures5.875PercentDue2032Member2025-04-232025-04-230000051143exch:XNYSibm:Debentures7.00PercentDue2045Member2025-04-232025-04-230000051143exch:XNYSibm:Debentures7.125PercentDue2096Member2025-04-232025-04-23

UNITED STATES
SECURITIES AND EXCHANGE COMMISSION
WASHINGTON, D.C. 20549
FORM 8-K
CURRENT REPORT PURSUANT TO SECTION 13 OR 15 (d)
OF THE SECURITIES EXCHANGE ACT OF 1934
Date of Report: April 23, 2025
(Date of earliest event reported)
INTERNATIONAL BUSINESS MACHINES CORPORATION
(Exact name of registrant as specified in its charter)
New York 1-236013-0871985
(State of Incorporation)(Commission File Number)(IRS employer Identification No.)
One New Orchard Road
Armonk, New York
10504
(Address of principal executive offices)(Zip Code)
914-499-1900
(Registrant’s telephone number)
Check the appropriate box below if the Form 8-K filing is intended to simultaneously satisfy the filing obligation of the registrant under any of the following provisions:
Written communications pursuant to Rule 425 under the Securities Act (17 CFR 230.425)
Soliciting material pursuant to Rule 14a-12 under the Exchange Act (17 CFR 240.14a-12)
Pre-commencement communications pursuant to Rule 14d-2(b) under the Exchange Act (17 CFR 240.14d-2(b))
Pre-commencement communications pursuant to Rule 13e-4(c) under the Exchange Act (17 CFR 240.13e-4(c))
Securities registered pursuant to Section 12(b) of the Act:
Title of each classTrading symbol(s)Name of each exchange on which registered
Capital stock, par value $.20 per shareIBMNew York Stock Exchange
NYSE Chicago
2.875% Notes due 2025IBM 25ANew York Stock Exchange
0.950% Notes due 2025IBM 25BNew York Stock Exchange
0.300% Notes due 2026IBM 26BNew York Stock Exchange
1.250% Notes due 2027IBM 27BNew York Stock Exchange
3.375% Notes due 2027IBM 27FNew York Stock Exchange
0.300% Notes due 2028IBM 28BNew York Stock Exchange
1.750% Notes due 2028IBM 28ANew York Stock Exchange
1.500% Notes due 2029IBM 29New York Stock Exchange
0.875% Notes due 2030IBM 30ANew York Stock Exchange
2.900% Notes due 2030IBM 30CNew York Stock Exchange
1.750% Notes due 2031IBM 31New York Stock Exchange
3.625% Notes due 2031IBM 31BNew York Stock Exchange
0.650% Notes due 2032IBM 32ANew York Stock Exchange
3.150% Notes due 2033IBM 33ANew York Stock Exchange
1.250% Notes due 2034IBM 34New York Stock Exchange
3.750% Notes due 2035IBM 35New York Stock Exchange
3.450% Notes due 2037IBM 37New York Stock Exchange
4.875% Notes due 2038IBM 38New York Stock Exchange
1.200% Notes due 2040IBM 40New York Stock Exchange
4.000% Notes due 2043IBM 43New York Stock Exchange
3.800% Notes due 2045IBM 45ANew York Stock Exchange
7.00% Debentures due 2025IBM 25New York Stock Exchange
6.22% Debentures due 2027IBM 27New York Stock Exchange
6.50% Debentures due 2028IBM 28New York Stock Exchange
5.875% Debentures due 2032IBM 32DNew York Stock Exchange
7.00% Debentures due 2045IBM 45New York Stock Exchange
7.125% Debentures due 2096IBM 96New York Stock Exchange
Indicate by check mark whether the registrant is an emerging growth company as defined in Rule 405 of the Securities Act of 1933 (§230.405 of this chapter) or Rule 12b-2 of the Securities Exchange Act of 1934 (§240.12b-2 of this chapter).
Emerging growth company
If an emerging growth company, indicate by check mark if the registrant has elected not to use the extended transition period for complying with any new or revised financial accounting standards provided pursuant to Section 13(a) of the Exchange Act. ☐


Item 7.01. Regulation FD Disclosure.
Exhibit 99.1 of this Form 8-K contains the prepared remarks for IBM's Chairman, President and Chief Executive Officer Arvind Krishna and Chief Financial Officer Jim Kavanaugh's first-quarter 2025 earnings presentation to investors on April 23, 2025.
The slides for IBM's Chairman, President and Chief Executive Officer Arvind Krishna and Chief Financial Officer Jim Kavanaugh's first-quarter 2025 earnings presentation on April 23, 2025, are Exhibit 99.2 to this Form 8-K.
Reconciliations of non-GAAP financial measures discussed in the earnings presentation to the most directly comparable financial measures calculated and presented in accordance with GAAP are included in Exhibit 99.2 to this Form 8-K.
The information in this Item 7.01, including the corresponding Exhibits 99.1 and 99.2, is being furnished with the Commission and shall not be deemed “filed” for purposes of Section 18 of the Securities Exchange Act of 1934.
Item 9.01. Financial Statements and Exhibits.
(d)Exhibits
The following exhibits are being furnished as part of this report:
Exhibit No.Description of Exhibit
99.1
99.2

The following exhibit is being filed as part of this report:
Exhibit No.Description of Exhibit
104Cover Page Interactive Data File (embedded within the Inline XBRL Document)

IBM’s web site (www.ibm.com) contains a significant amount of information about IBM, including financial and other information for investors (www.ibm.com/investor/). IBM encourages investors to visit its various web sites from time to time, as information is updated and new information is posted.
2


SIGNATURE
Pursuant to the requirements of the Securities Exchange Act of 1934, the registrant has duly caused this report to be signed on its behalf by the undersigned, hereunto duly authorized.
Date: April 24, 2025
By:/s/ Nicolás A. Fehring
Nicolás A. Fehring
Vice President and Controller
3
IBM 1Q25 Earnings Prepared Remarks 1 Introduction Thank you. I’d like to welcome you to IBM’s first quarter 2025 earnings presentation. I’m Olympia McNerney, and I’m here today with Arvind Krishna, IBM’s Chairman, President and Chief Executive Officer, and Jim Kavanaugh, IBM’s Senior Vice President and Chief Financial Officer. We’ll post today’s prepared remarks on the IBM investor website within a couple of hours, and a replay will be available by this time tomorrow. To provide additional information to our investors, our presentation includes certain non-GAAP measures. For example, all of our references to revenue and signings growth are at constant currency. We’ve provided reconciliation charts for these and other non-GAAP financial measures at the end of the presentation, which is posted to our investor website. Finally, some comments made in this presentation may be considered forward looking under the Private Securities Litigation Reform Act of 1995. These statements involve factors that could cause our actual results to differ materially. Additional information about these factors is included in the company’s SEC filings. So with that, I’ll turn the call over to Arvind. Exhibit 99.1

 
IBM 1Q25 Earnings Prepared Remarks 2 CEO Perspective Thank you for joining us today. We’re off to a strong start in 2025, exceeding our expectations for the quarter, driven by solid revenue growth, profitability and cash flow generation. While sentiment and the operating environment have been rapidly shifting, our performance reflects the continued success of our focused strategy around hybrid cloud and AI—especially where clients are looking for cost savings, productivity gains, and trusted partners to help them move fast and scale. Those needs remain front and center in today’s market. Before going deeper into our results, let me start by saying that we appreciate the administration’s focus on economic growth and rational regulation which will strengthen the US competitive position. We believe this will result in long term value creation and make it easier for technology to contribute to economic growth. I’m going to now talk about our results for the quarter and then address the macro and how we are positioning within these conditions. Our performance this quarter reflects the flywheel for growth we discussed at our Investor Day. It all starts with client trust with a 100+ year history of delivering mission critical solutions and navigating different operating environments. Trust is complemented by the flexible solutions we offer in hybrid cloud and AI, the innovation value we provide, our domain expertise to help clients digitally transform and scale AI, and our partner ecosystem to broaden our reach and impact. We saw these play out in the first quarter. Our growth was led by Software, up 9%, with strength across Red Hat, Automation, Data and Transaction Processing. Our early leadership in generative AI and the Consulting Advantage platform, using digital assets to deliver client value, have positioned us well in today’s

 
IBM 1Q25 Earnings Prepared Remarks 3 evolving market. In Infrastructure, z16 is our most successful program in history, highlighting customer adoption and the value proposition of the mainframe. In generative AI, we continue to see strong traction. Our book of business is now over $6 billion inception-to-date, up over $1 billion in the quarter. Approximately one-fifth of this book of business comes from Software, and the remaining four-fifths is Consulting. This is similar to last quarter. The AI portfolio we have built is designed to give clients a comprehensive set of tools to deploy AI within their enterprise. In Software, the ability to deploy our AI assistants and agents, as well as AI middleware, in a hybrid environment, leveraging multi-model capabilities is resonating with clients. AI agents will accelerate the ability of many enterprises to turn the promise of generative AI into real value. Consulting is helping clients design and deploy AI strategies and use cases. We also continue to see our Infrastructure segment play a larger role as clients bring AI to their data. Our clients will see these solutions at length at our client conference, Think, in early May in Boston. We remain focused on accelerating innovation speed and impact. Earlier this month, we announced the upcoming launch of z17, which delivers enhanced AI acceleration through multi-model AI capabilities, new security features to protect data, and tools that leverage AI for improving system usability. z17’s value proposition particularly resonated with clients given significantly lower power requirements, higher capacity growth and increased performance over z16. In quantum, we’re proud to partner with the Basque Government to deploy Europe’s first IBM Quantum System Two in Spain—a milestone in global quantum leadership. M&A also remains a key enabler of our strategy. This quarter, we closed the acquisitions of HashiCorp and AST. HashiCorp brings leading

 
IBM 1Q25 Earnings Prepared Remarks 4 automation and security tools that integrate with our hybrid cloud strategy—and we’re excited about the synergy opportunities ahead. Let me now touch on the macro environment. Technology remains a key competitive advantage allowing businesses to drive cost efficiencies, productivity, and preserve their balance sheets. In the near term, uncertainty may cause clients to pause and take a wait and see approach. However, the value of hybrid cloud, automation, data sovereignty and on- prem solutions becomes even more critical in volatile windows. Recent conversations that I’ve had with clients reflect this view of the current environment. These conversations vary by industry, business and geography. For example, our containerization and virtualization pipeline continues to grow, with clients focused not only on near-term costs but also longer-term savings driven by our modernization capabilities. There are also areas of our business where volatility acts as a catalyst for demand, driving increased capacity requirements - particularly across our mainframe environments. This played out over the last couple of weeks amongst our financial services clients. However, for clients with a more direct impact from current policy, the slowdown may be more pronounced. Consulting is also more susceptible to discretionary pullbacks and DOGE related initiatives. While no one is immune to uncertainty, we enter this environment from a position of relative strength and resiliency. Our clients run the world’s most essential processes. Our diversity across businesses, geographies, industries, and large enterprise clients position us well to navigate the current climate. We have an experienced team that is focused on areas we can control around our supply chain, accelerating our productivity initiatives and maintaining the strength of our balance sheet.

 
IBM 1Q25 Earnings Prepared Remarks 5 With this backdrop, let me touch on our outlook. For the last several years, we have been strengthening our portfolio and building on our track record of execution, and our outperformance this quarter was another proof point. While it is still very early in the second quarter, we have not seen a material change in client buying behavior. With the caveat that the macro situation is fluid, based on what we know today, we are maintaining our full year guidance for accelerating revenue growth to 5% plus and about $13.5 billion of free cash flow. And over the longer term, I am confident in our ability to deliver on our Model presented at Investor Day for sustainable higher revenue growth and strong free cash flow. With that, I’ll turn it over to Jim to walk through the financials. Jim—over to you.

 
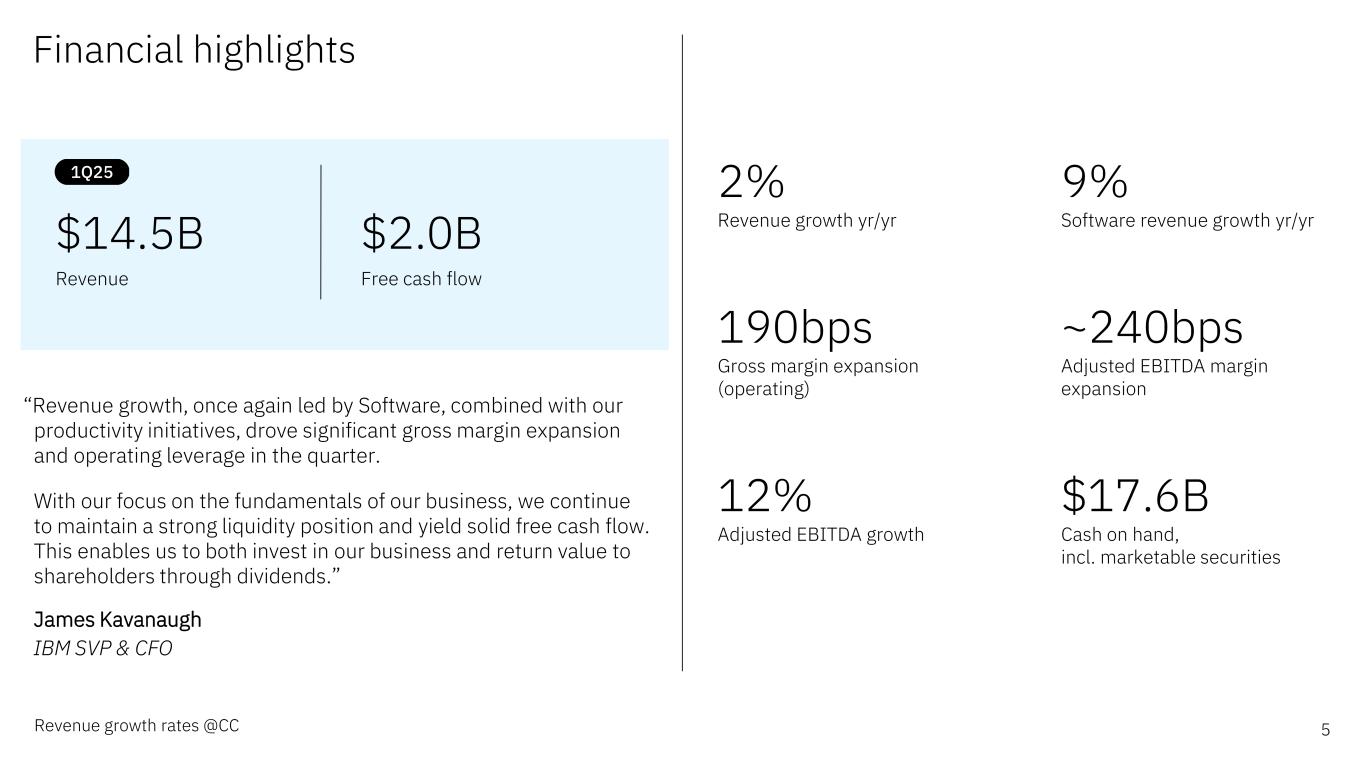
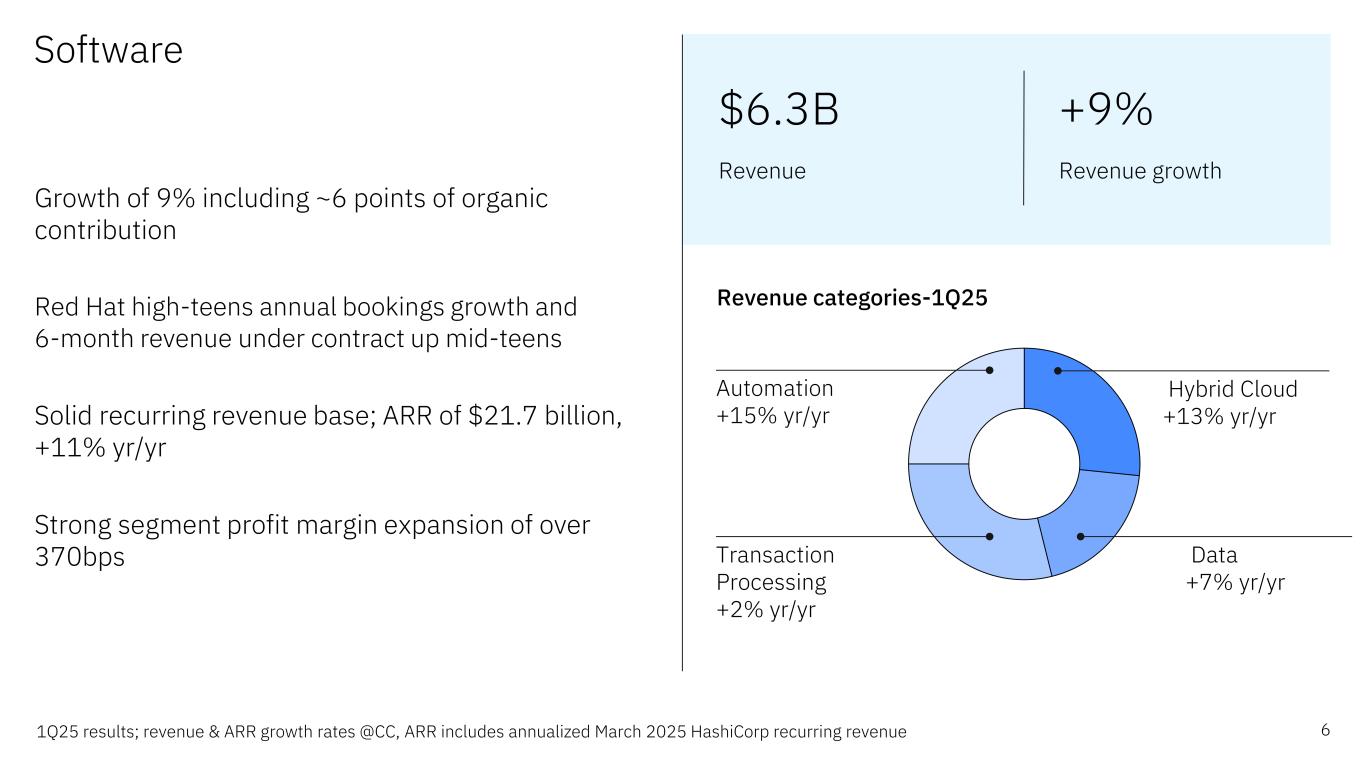
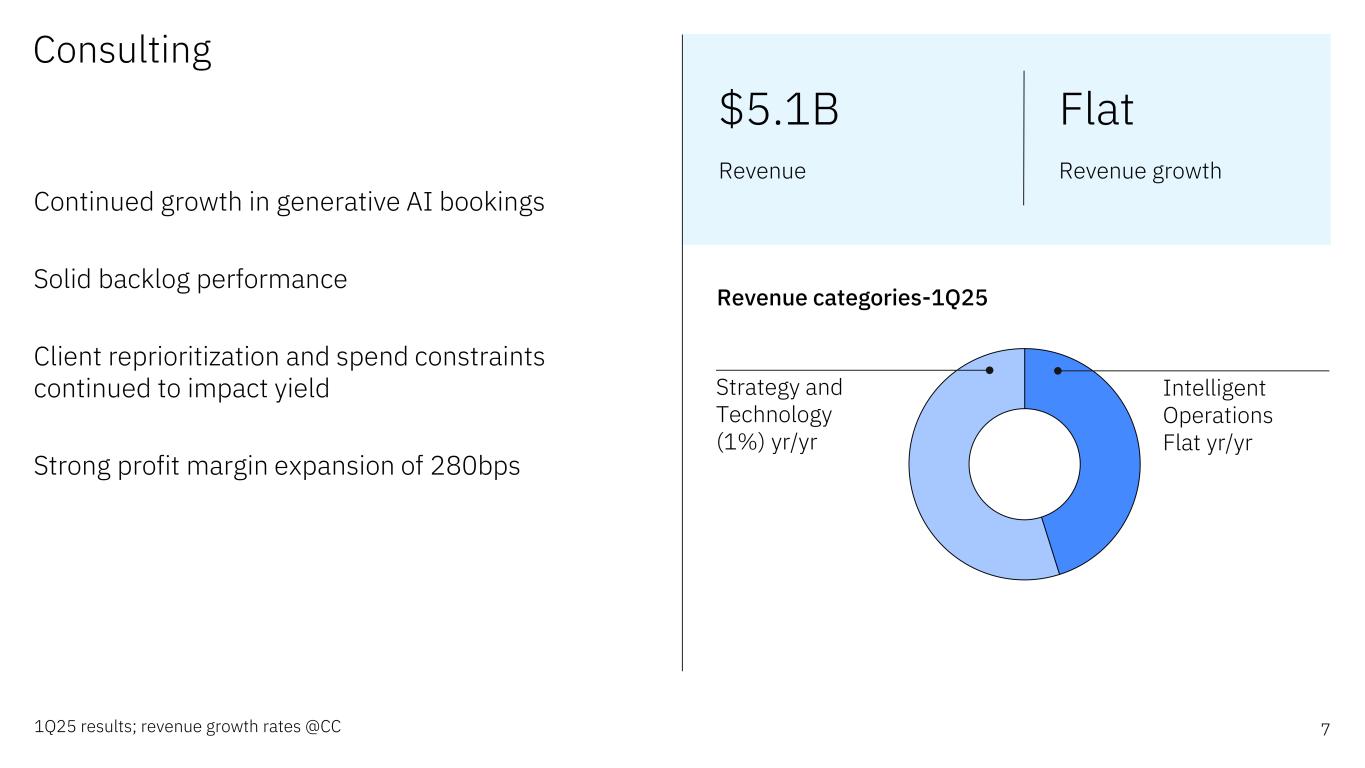
IBM 1Q25 Earnings Prepared Remarks 6 Financial Highlights Thanks Arvind. In the first quarter, we delivered $14.5 billion in revenue, $3.4 billion of Adjusted EBITDA, $1.7 billion of operating pre-tax income and operating earnings per share of $1.60. And we generated two billion dollars of free cash flow, our highest first quarter free cash flow in many years. Our revenue growth, scale and accelerating productivity drove 240 basis points of Adjusted EBITDA margin expansion and 12% Adjusted EBITDA growth. We exceeded our expectations on revenue, profitability, Adjusted EBITDA and earnings per share. Our revenue for the quarter was up 2% at constant currency. As we discussed at our Investor Day, our mix shift towards Software is driving growth. We saw this play out in the quarter with Software up 9%, driven by growth of 15% in Automation, 13% in Red Hat, 7% in Data, and 2% in Transaction Processing. This performance reflects demand for our focused portfolio that provides end-to-end hybrid cloud and AI capabilities. Red Hat delivered another strong quarter, driven by bookings growth in the high teens. And OpenShift is now at $1.5 billion ARR, growing about 25%. About six points of our growth in Software was organic, with contribution from our generative AI products like our AI assistants and agents and watsonx platform. We also benefitted from our high-value, recurring revenue base, which comprises about 80% of our annual Software revenue. Software’s annual recurring revenue grew to $21.7 billion, up 11% since last year. Consulting revenue was flat and a sequential growth improvement quarter to quarter with solid backlog growth of mid-single digits. Strategy and Technology revenue declined 1% and Intelligent Operations revenue was flat for the quarter. While we are seeing clients delay decision-making, especially in discretionary projects which impacted our in-period signings,

 
IBM 1Q25 Earnings Prepared Remarks 7 we had good growth in transformational offerings like hybrid cloud and data as well as application management and cloud platform engineering services. We also continue to build our Consulting generative AI book of business which is now over $5 billion inception-to-date. Infrastructure revenue declined 4%. Hybrid Infrastructure was down 7% driven by IBM Z, down 14%, as we wrapped up the twelfth and final quarter of the z16 program, which delivered strong performance in both revenue and capacity. Distributed Infrastructure revenue was down 4% with product cycle dynamics impacting Power while Storage delivered another quarter of double-digit growth as our latest innovations continue to address the rising data demands of our clients. Now turning to profitability. In the current environment, we are focused on taking action to control things we can, to protect supply chain, margin and free cash flow. IBM has been driving a productivity mindset for many years and this quarter’s margin performance reflects that intentional discipline and the flexibility of our operating model. During the quarter, operating leverage and yield from accelerated productivity initiatives drove expansion of operating gross profit margin of 190 basis points, Adjusted EBITDA margin of 240 basis points and operating pre-tax margin of 50 basis points. Excluding year-over-year divestiture dynamics, and net year- to-year workforce rebalancing, operating pre-tax margin was up 180 basis points, ahead of our expectations and well above our model. We delivered very strong segment profit margin expansion in Software and Consulting of over 370 basis points and 280 basis points, respectively, while Infrastructure was down about 150 basis points, reflecting product cycle dynamics and continued investments in innovation. Let me give you some more color on our productivity initiatives. As discussed at our Investor Day, we remain laser focused on accelerating

 
IBM 1Q25 Earnings Prepared Remarks 8 our productivity initiatives. We are transforming our enterprise operations leveraging technology and embedding AI across more than 70 workflows such as HR, IT Support, Procurement, Finance, Quote to Cash and more. We have built a best-in-class enterprise IT platform leveraging our own IBM software solutions across hybrid cloud, automation, and AI, decreased our vendor spend by more than one billion dollars by optimizing our supply chain and service delivery, and right-sized our physical infrastructure. We exited 2024 at $3.5 billion of annual run rate savings achieved, and we continue to see these efforts play out in our margin performance this quarter. These actions create a flywheel that allows us to invest back in our business – both organically and inorganically, increase our financial flexibility, and deliver margin expansion. Our ability to toggle these actions up or down, depending on the operating environment, adds significant flexibility to our financial model. The combination of our revenue scale and productivity enabled solid contribution to free cash flow generation. In the quarter, we generated two billion dollars of free cash flow, up about $100 million year over year, resulting in our highest first quarter free cash flow margin in reported history. The largest driver of this growth comes from Adjusted EBITDA, up over $350 million year-over-year. Partially offsetting this, given global trade dynamics, we proactively took actions to bolster our supply chain ahead of our z17 launch, resulting in higher inventory levels. Despite these actions, we are a couple points ahead of our three-year average attainment levels through the first quarter. Let me briefly address our supply chain dynamics. As Arvind mentioned, IBM has a long track record of operating globally and managing supply chain complexity. Over the last several years, we have strategically diversified and streamlined our supply chain. Goods imported to the U.S. represent less than 5% of our overall spend and under current U.S. tariff

 
IBM 1Q25 Earnings Prepared Remarks 9 policy, the impact to IBM is minimal. While we have limited direct exposure outside the United States, we are tactically evaluating alternative sources and other strategies to mitigate tariffs. We continue to maintain a strong liquidity position, solid investment grade balance sheet, and a disciplined capital allocation policy. We ended the quarter with cash of $17.6 billion, which is up $2.8 billion from the end of 2024, including spending of $7.1 billion on acquisitions, driven largely by the closing of HashiCorp. In February, we accessed the debt market raising over $8 billion at attractive terms. Our debt balance ending the quarter was over $63 billion, including $10 billion of debt for our financing business, with a receivables portfolio that is over 75% investment grade. In addition, we returned just over $1.5 billion to shareholders in the form of dividends.

 
IBM 1Q25 Earnings Prepared Remarks 10 Summary Now, let me talk about what we see going forward. As everyone knows, there is a level of macro uncertainty that exists and is hard to predict. That said, we are operating from a position of relative strength. The combination of our repositioned and focused portfolio, investment in innovation, and our diversity across businesses, geographies, industries, and large enterprise clients positions us to perform in a variety of macro scenarios. Our flywheel for growth begins with the incumbency and trust we have with clients from decades on the ground in over 175 countries, which is a real point of differentiation in the current environment. Our client base is diverse, operating across almost 20 industries, spanning 95% of the Fortune 500. Based on what we know today, we are maintaining our full year guidance for accelerating revenue growth of 5% plus and about $13.5 billion of free cash flow. Let me go through the drivers of these key metrics. As discussed at our Investor Day, our mix shift towards Software is a key driver of our growth acceleration. Software is now about 45% of our business, with 80% recurring revenue. As a reminder, in the first quarter, we generated $21.7 billion of ARR, growing 11%. The combination of our portfolio strength, investment in innovation and contribution from acquisitions should drive our full year performance in Software. And we continue to expect mid-teens growth for Red Hat, underpinned by six- month revenue under contract, which is growing in the mid-teens. In Consulting, we are encouraged by this quarter’s sequential growth in revenue, our solid backlog up 6% and our book of business in GenAI. But given the current environment, we are appropriately more cautious on Consulting’s contribution to IBM this year. With our new mainframe

 
IBM 1Q25 Earnings Prepared Remarks 11 launch, innovation across the portfolio, and capacity dynamics that could benefit our mainframe environments and storage needs, we expect Infrastructure to grow. While we feel good about the core growth drivers of our business, there are areas of our portfolio that could see greater variability in the event that the macroeconomic environment deteriorates. This includes Consulting which is more sensitive to discretionary pullbacks and DOGE related initiatives, consumption-based services in Software, including in Red Hat, and areas of Distributed Infrastructure. We continue to expect IBM’s full year operating pre-tax margin to expand by over half a point driven by productivity initiatives, revenue scale and mix, mitigated by the impact of dilution from acquisitions. And our tax rate expectation for the year remains in the mid-teens. As always, the timing of discrete items can cause the rate to vary within the year. For free cash flow, we expect to generate about $13.5 billion in 2025, driven primarily by growth in Adjusted EBITDA. The headwinds I discussed last quarter of higher cash taxes and higher capex remain the same. As I mentioned earlier, we have been accelerating our productivity initiatives to plan for various scenarios and to protect our profitability and free cash flow. As we look forward to the rest of the year, we will remain disciplined about managing our costs. The strength of our balance sheet and strong liquidity position allow us to make investments in our business for the longer term. As Arvind mentioned, while it is still early, through the first three weeks of the second quarter, we have not seen any material change in client buying behaviors. We expect revenue growth of at least 4% at constant currency, and given the increased currency volatility, a revenue range of $16.4 to

 
IBM 1Q25 Earnings Prepared Remarks 12 $16.75 billion. And second quarter operating pre-tax margin expansion should be consistent with the full year, with our tax rate in mid to high teens. Let me conclude by saying that we have a durable and differentiated business model that positions us well to navigate a range of economic environments. While there is uncertainty, we remain laser focused on taking actions to control what we can and executing our strategy to accelerate revenue growth and free cash flow. We believe our focused portfolio, disciplined investments in innovation, diverse set of businesses and clients, relentless focus on productivity and strong liquidity drive the durability of our performance. Arvind and I are now happy to take your questions. Olympia, let’s get started.

 
IBM 1Q25 Earnings Prepared Remarks 13 Closing Thank you, Jim. Before we begin the Q&A, I’d like to mention a couple of items. First, supplemental information is provided at the end of the presentation. And then second, as always, I’d ask you to refrain from multi-part questions. Operator, let’s please open it up for questions.
 
April 23, 2025 ibm.com/investor 1Q 2025 Earnings Exhibit 99.2


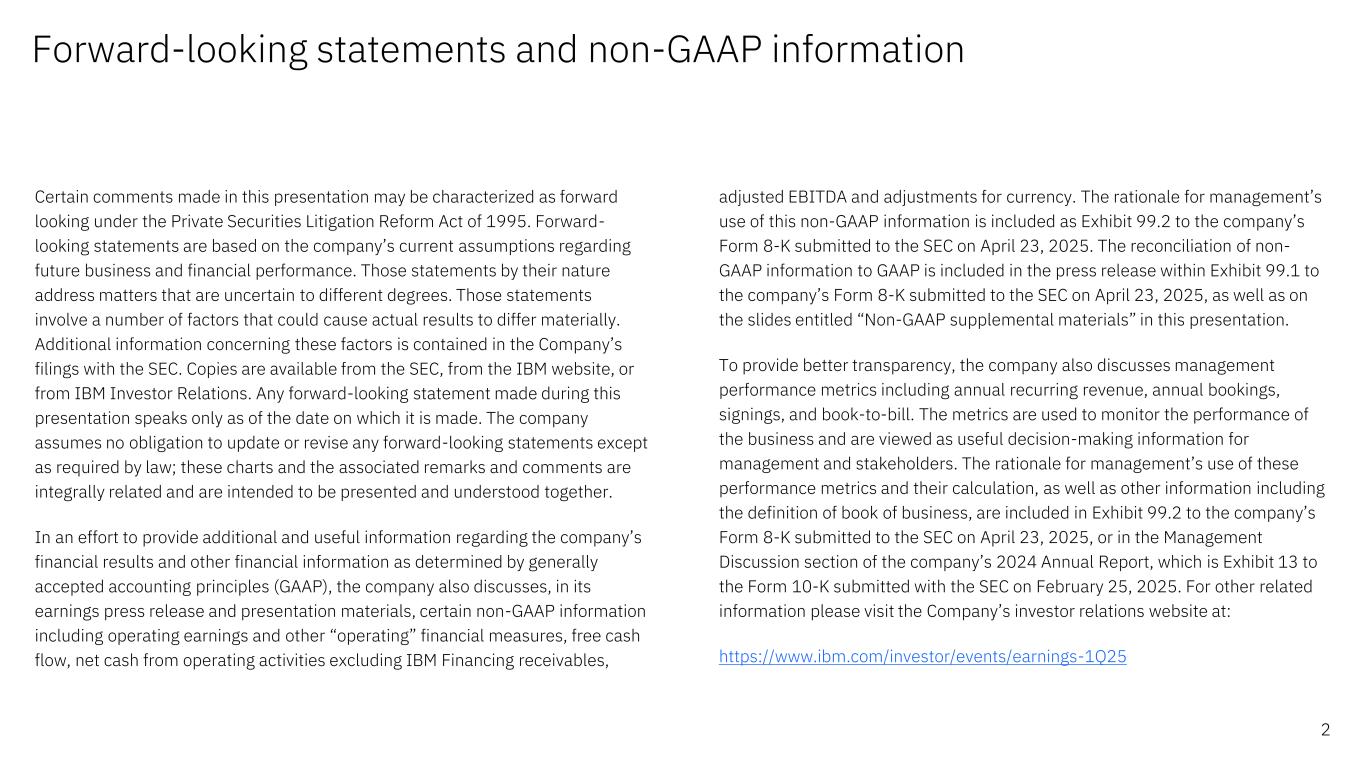
Forward-looking statements and non-GAAP information Certain comments made in this presentation may be characterized as forward looking under the Private Securities Litigation Reform Act of 1995. Forward- looking statements are based on the company’s current assumptions regarding future business and financial performance. Those statements by their nature address matters that are uncertain to different degrees. Those statements involve a number of factors that could cause actual results to differ materially. Additional information concerning these factors is contained in the Company’s filings with the SEC. Copies are available from the SEC, from the IBM website, or from IBM Investor Relations. Any forward-looking statement made during this presentation speaks only as of the date on which it is made. The company assumes no obligation to update or revise any forward-looking statements except as required by law; these charts and the associated remarks and comments are integrally related and are intended to be presented and understood together. In an effort to provide additional and useful information regarding the company’s financial results and other financial information as determined by generally accepted accounting principles (GAAP), the company also discusses, in its earnings press release and presentation materials, certain non-GAAP information including operating earnings and other “operating” financial measures, free cash flow, net cash from operating activities excluding IBM Financing receivables, adjusted EBITDA and adjustments for currency. The rationale for management’s use of this non-GAAP information is included as Exhibit 99.2 to the company’s Form 8-K submitted to the SEC on April 23, 2025. The reconciliation of non- GAAP information to GAAP is included in the press release within Exhibit 99.1 to the company’s Form 8-K submitted to the SEC on April 23, 2025, as well as on the slides entitled “Non-GAAP supplemental materials” in this presentation. To provide better transparency, the company also discusses management performance metrics including annual recurring revenue, annual bookings, signings, and book-to-bill. The metrics are used to monitor the performance of the business and are viewed as useful decision-making information for management and stakeholders. The rationale for management’s use of these performance metrics and their calculation, as well as other information including the definition of book of business, are included in Exhibit 99.2 to the company’s Form 8-K submitted to the SEC on April 23, 2025, or in the Management Discussion section of the company’s 2024 Annual Report, which is Exhibit 13 to the Form 10-K submitted with the SEC on February 25, 2025. For other related information please visit the Company’s investor relations website at: https://www.ibm.com/investor/events/earnings-1Q25 2


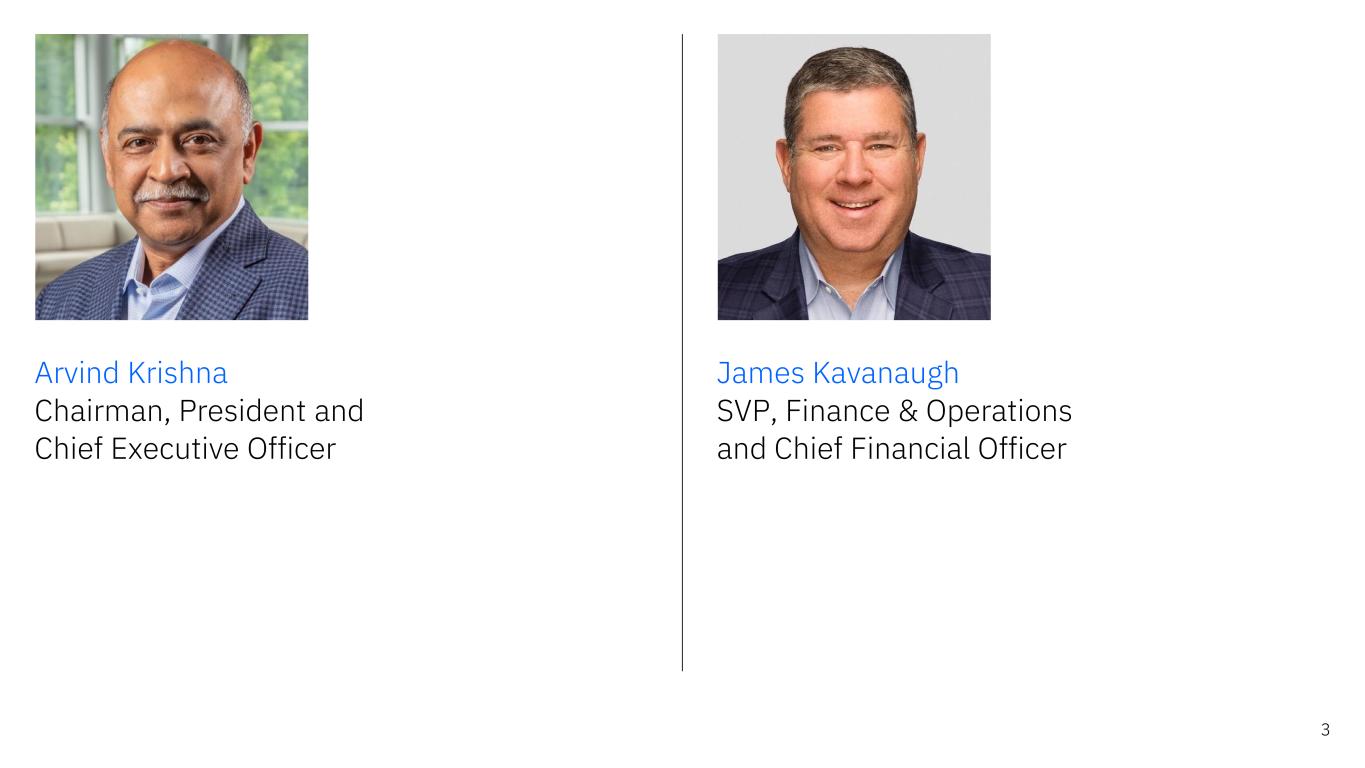
3 Arvind Krishna Chairman, President and Chief Executive Officer James Kavanaugh SVP, Finance & Operations and Chief Financial Officer


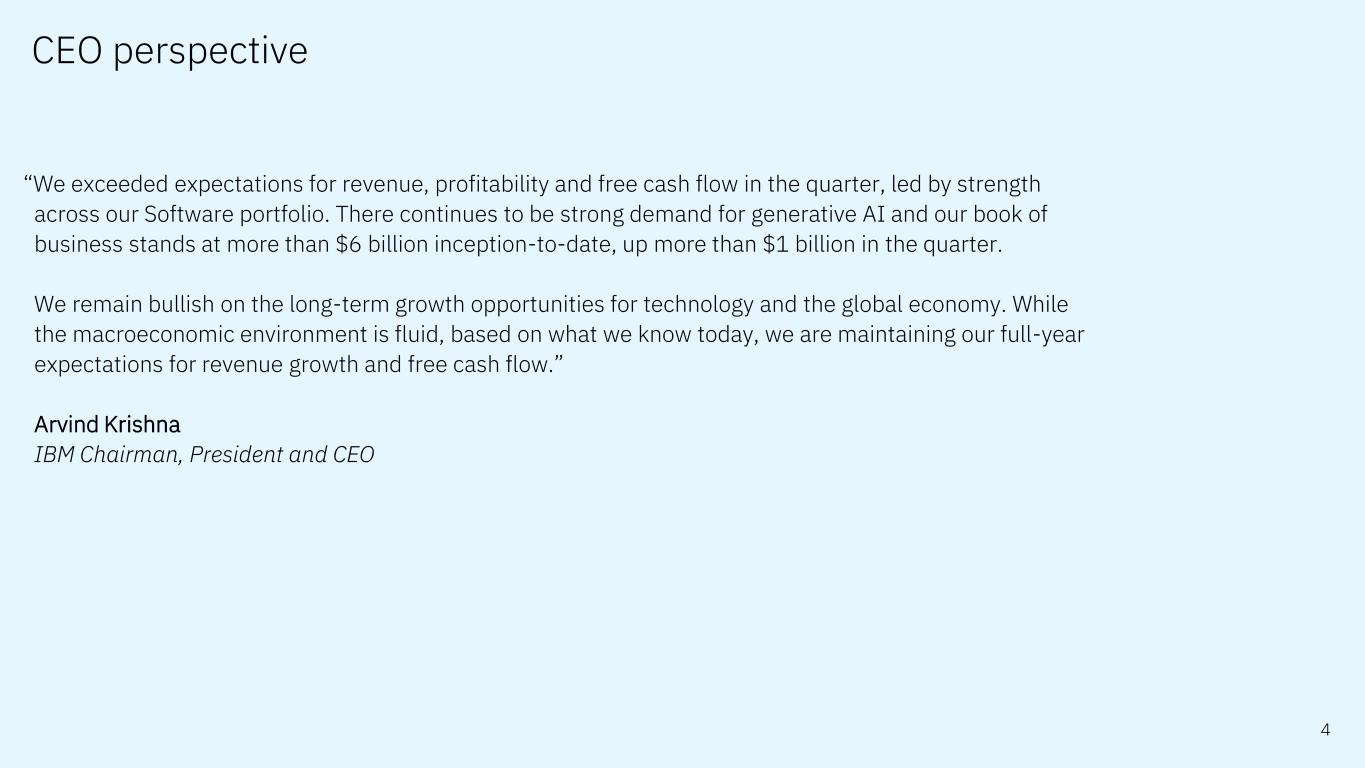
“We exceeded expectations for revenue, profitability and free cash flow in the quarter, led by strength across our Software portfolio. There continues to be strong demand for generative AI and our book of business stands at more than $6 billion inception-to-date, up more than $1 billion in the quarter. We remain bullish on the long-term growth opportunities for technology and the global economy. While the macroeconomic environment is fluid, based on what we know today, we are maintaining our full-year expectations for revenue growth and free cash flow.” Arvind Krishna IBM Chairman, President and CEO 4 CEO perspective


Financial highlights 5Revenue growth rates @CC $14.5B Revenue $2.0B Free cash flow 1Q25 “Revenue growth, once again led by Software, combined with our productivity initiatives, drove significant gross margin expansion and operating leverage in the quarter. With our focus on the fundamentals of our business, we continue to maintain a strong liquidity position and yield solid free cash flow. This enables us to both invest in our business and return value to shareholders through dividends.” James Kavanaugh IBM SVP & CFO 2% Revenue growth yr/yr 190bps Gross margin expansion (operating) 12% Adjusted EBITDA growth 9% Software revenue growth yr/yr ~240bps Adjusted EBITDA margin expansion $17.6B Cash on hand, incl. marketable securities


6 Revenue categories-1Q25 Software 1Q25 results; revenue & ARR growth rates @CC, ARR includes annualized March 2025 HashiCorp recurring revenue Growth of 9% including ~6 points of organic contribution Red Hat high-teens annual bookings growth and 6-month revenue under contract up mid-teens Solid recurring revenue base; ARR of $21.7 billion, +11% yr/yr Strong segment profit margin expansion of over 370bps $6.3B Revenue +9% Revenue growth Automation +15% yr/yr Hybrid Cloud +13% yr/yr Transaction Processing +2% yr/yr Data +7% yr/yr


7 Consulting 1Q25 results; revenue growth rates @CC Revenue categories-1Q25 Continued growth in generative AI bookings Solid backlog performance Client reprioritization and spend constraints continued to impact yield Strong profit margin expansion of 280bps Strategy and Technology (1%) yr/yr Intelligent Operations Flat yr/yr $5.1B Revenue Flat Revenue growth


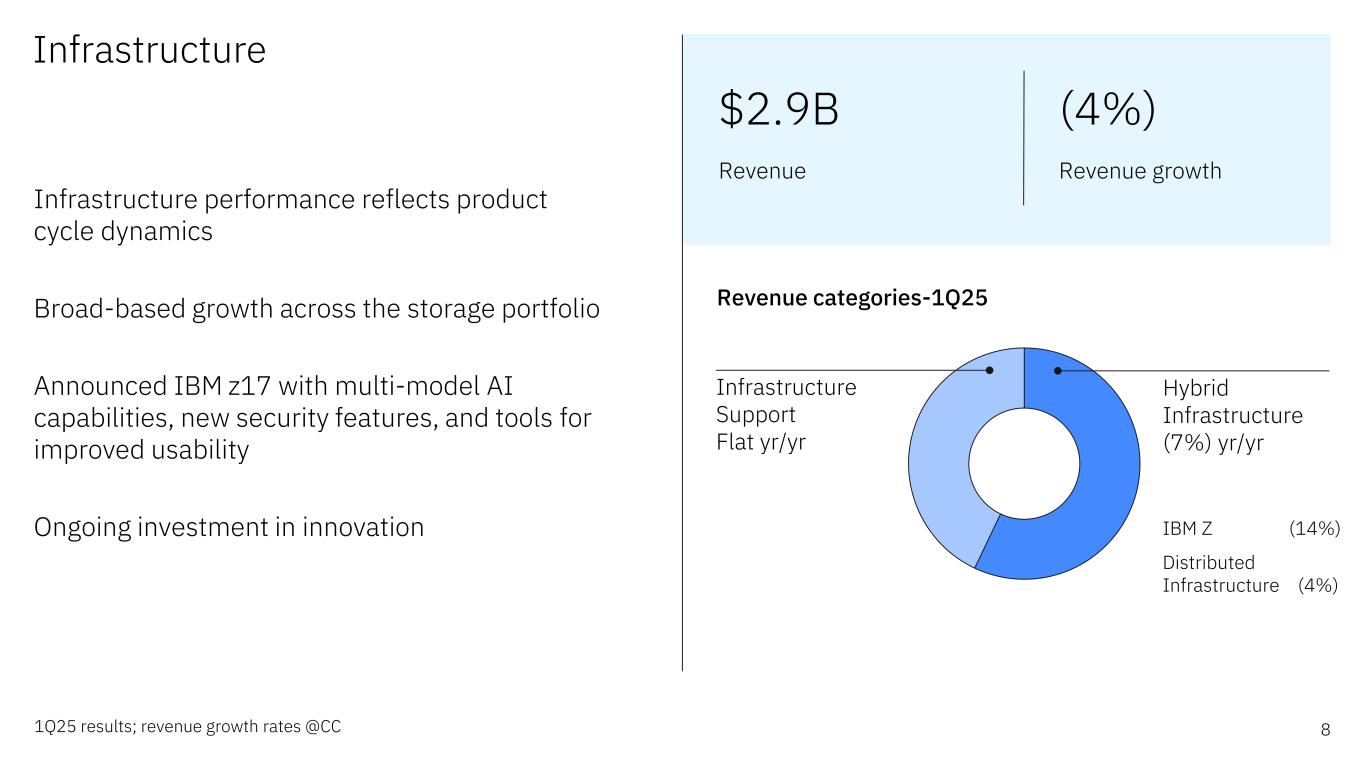
8 Infrastructure 1Q25 results; revenue growth rates @CC Revenue categories-1Q25 IBM Z (14%) Distributed Infrastructure (4%) Infrastructure Support Flat yr/yr Hybrid Infrastructure (7%) yr/yr Infrastructure performance reflects product cycle dynamics Broad-based growth across the storage portfolio Announced IBM z17 with multi-model AI capabilities, new security features, and tools for improved usability Ongoing investment in innovation $2.9B Revenue (4%) Revenue growth


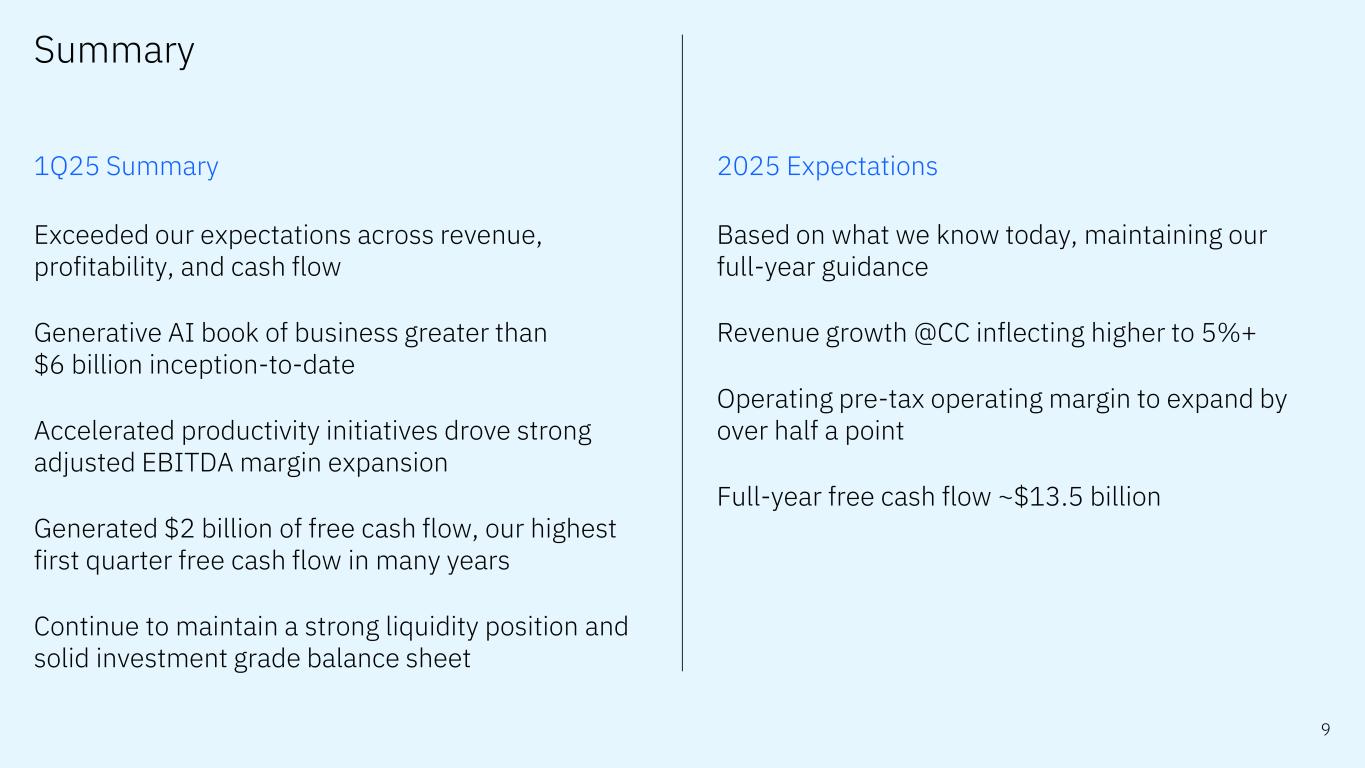
9 Summary 2025 Expectations Based on what we know today, maintaining our full-year guidance Revenue growth @CC inflecting higher to 5%+ Operating pre-tax operating margin to expand by over half a point Full-year free cash flow ~$13.5 billion 1Q25 Summary Exceeded our expectations across revenue, profitability, and cash flow Generative AI book of business greater than $6 billion inception-to-date Accelerated productivity initiatives drove strong adjusted EBITDA margin expansion Generated $2 billion of free cash flow, our highest first quarter free cash flow in many years Continue to maintain a strong liquidity position and solid investment grade balance sheet


ibm.com/investor


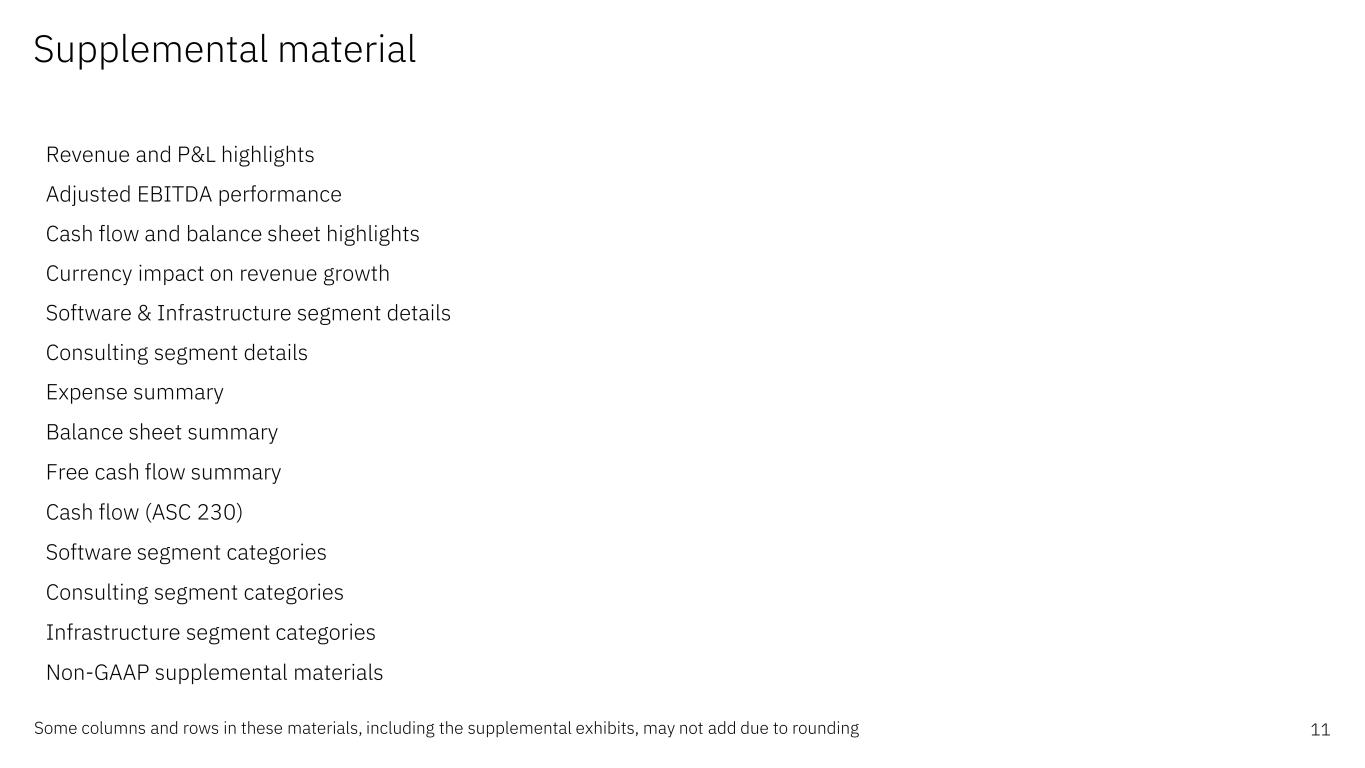
Supplemental material 11Some columns and rows in these materials, including the supplemental exhibits, may not add due to rounding Revenue and P&L highlights Adjusted EBITDA performance Cash flow and balance sheet highlights Currency impact on revenue growth Software & Infrastructure segment details Consulting segment details Expense summary Balance sheet summary Free cash flow summary Cash flow (ASC 230) Software segment categories Consulting segment categories Infrastructure segment categories Non-GAAP supplemental materials


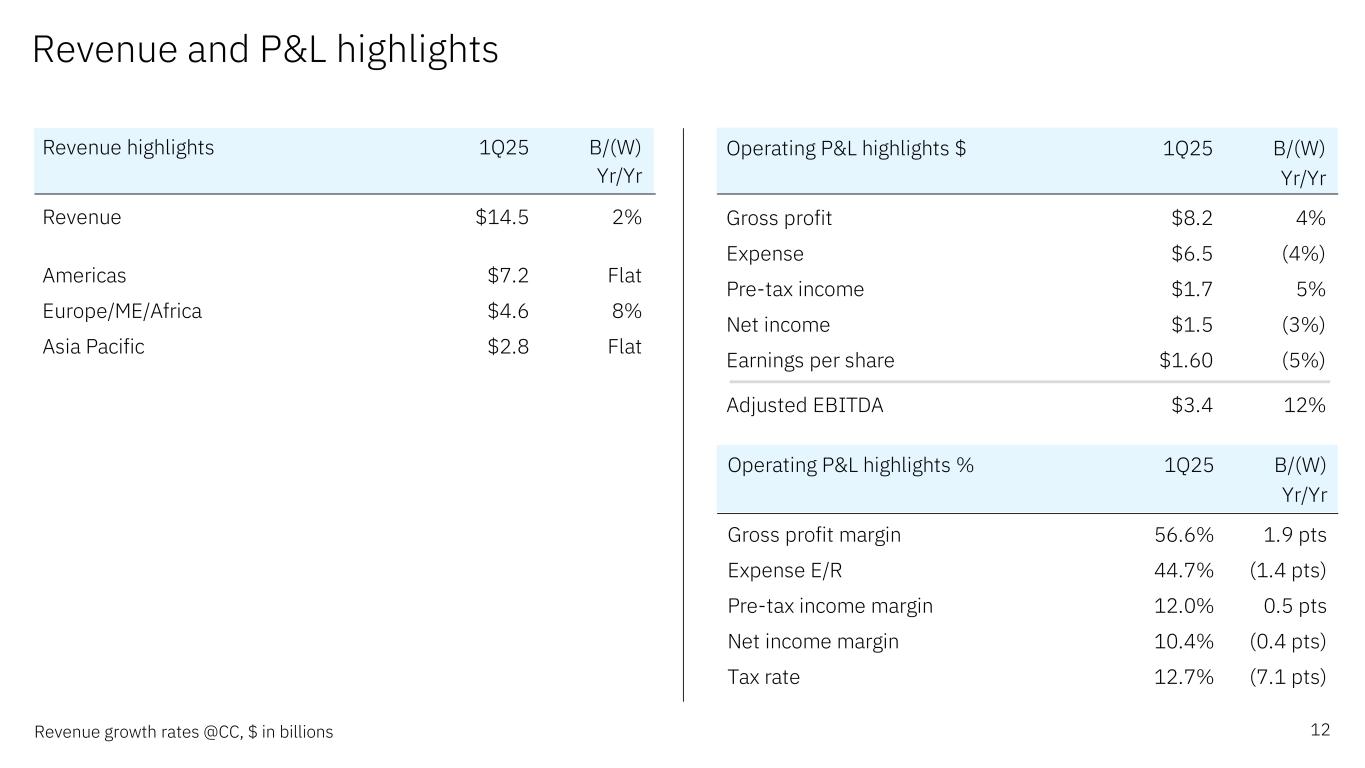
Revenue and P&L highlights 12Revenue growth rates @CC, $ in billions Revenue highlights 1Q25 B/(W) Yr/Yr Revenue $14.5 2% Americas $7.2 Flat Europe/ME/Africa $4.6 8% Asia Pacific $2.8 Flat Operating P&L highlights $ 1Q25 B/(W) Yr/Yr Gross profit $8.2 4% Expense $6.5 (4%) Pre-tax income $1.7 5% Net income $1.5 (3%) Earnings per share $1.60 (5%) Adjusted EBITDA $3.4 12% Operating P&L highlights % 1Q25 B/(W) Yr/Yr Gross profit margin 56.6% 1.9 pts Expense E/R 44.7% (1.4 pts) Pre-tax income margin 12.0% 0.5 pts Net income margin 10.4% (0.4 pts) Tax rate 12.7% (7.1 pts)


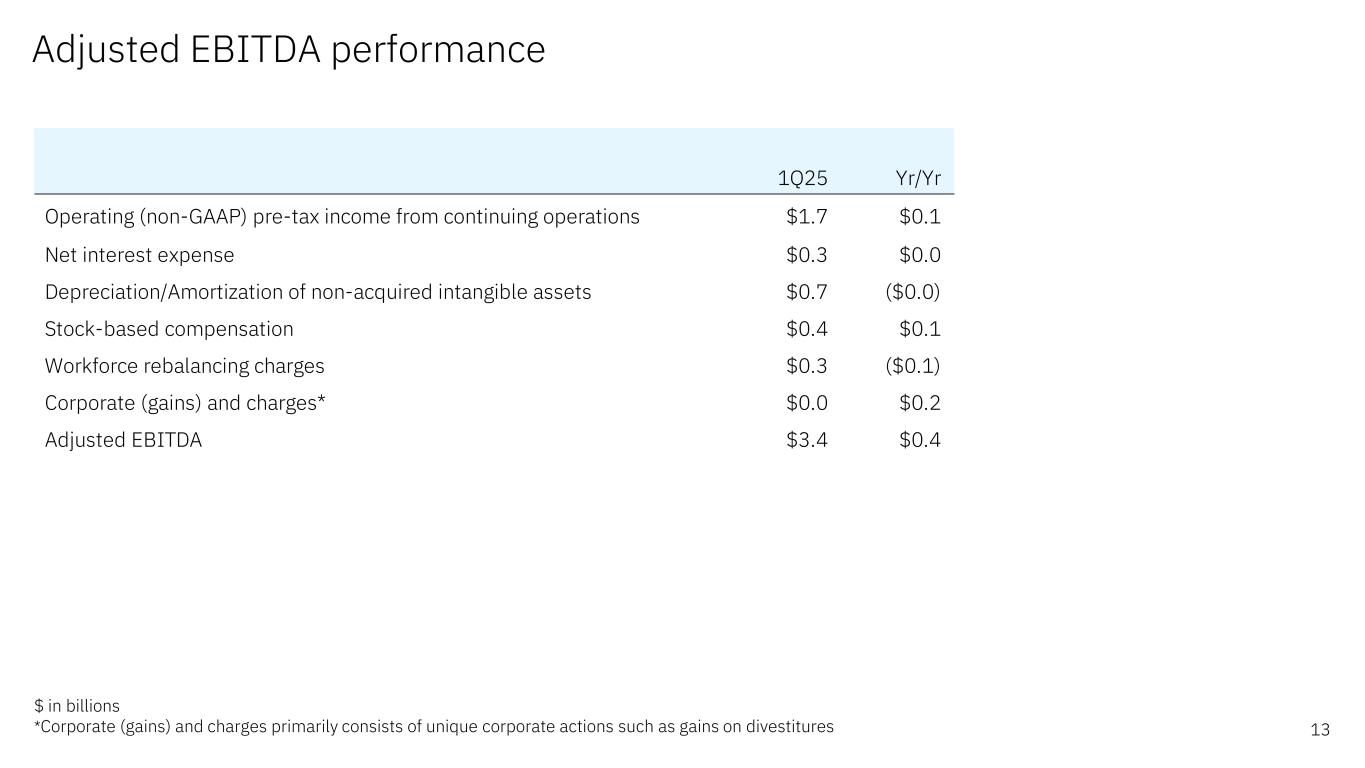
Adjusted EBITDA performance 13 $ in billions *Corporate (gains) and charges primarily consists of unique corporate actions such as gains on divestitures 1Q25 Yr/Yr Operating (non-GAAP) pre-tax income from continuing operations $1.7 $0.1 Net interest expense $0.3 $0.0 Depreciation/Amortization of non-acquired intangible assets $0.7 ($0.0) Stock-based compensation $0.4 $0.1 Workforce rebalancing charges $0.3 ($0.1) Corporate (gains) and charges* $0.0 $0.2 Adjusted EBITDA $3.4 $0.4


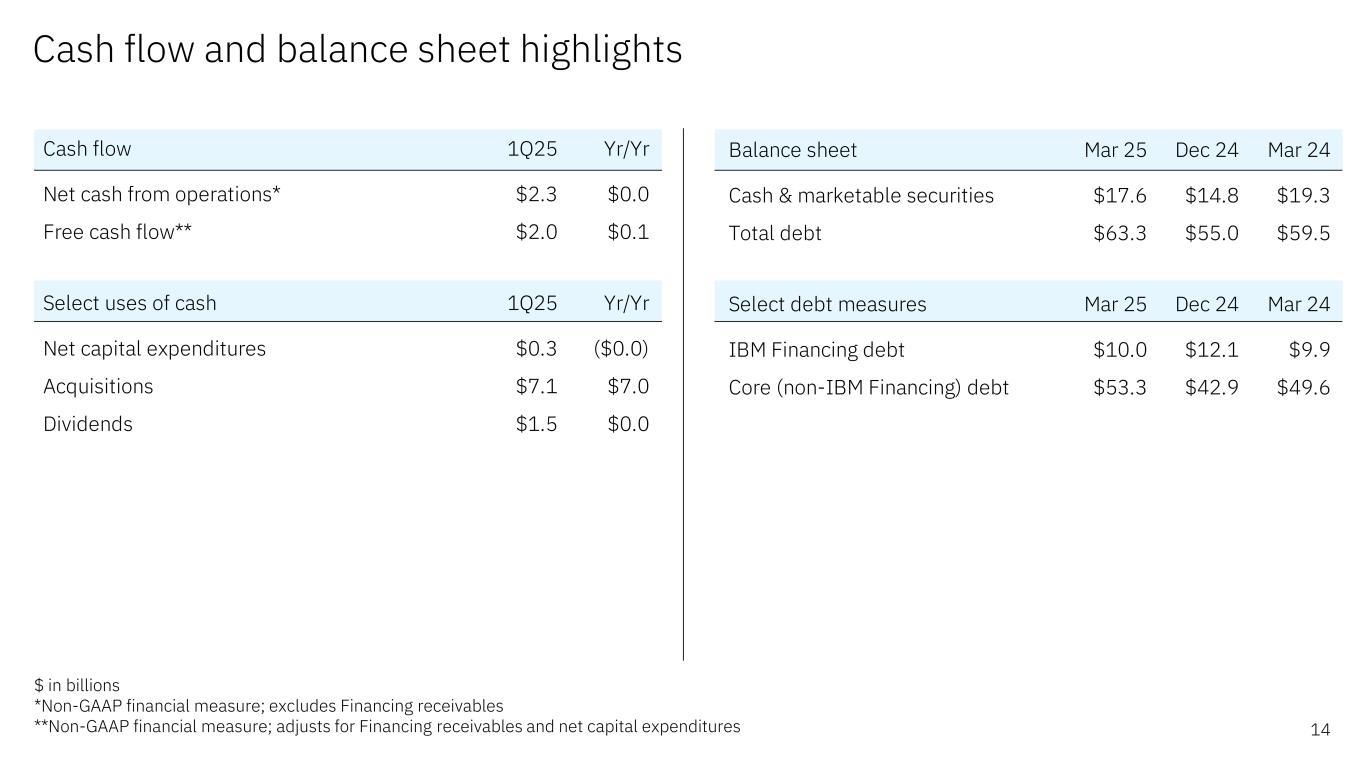
Cash flow and balance sheet highlights 14 $ in billions *Non-GAAP financial measure; excludes Financing receivables **Non-GAAP financial measure; adjusts for Financing receivables and net capital expenditures Cash flow 1Q25 Yr/Yr Net cash from operations* $2.3 $0.0 Free cash flow** $2.0 $0.1 Select uses of cash 1Q25 Yr/Yr Net capital expenditures $0.3 ($0.0) Acquisitions $7.1 $7.0 Dividends $1.5 $0.0 Balance sheet Mar 25 Dec 24 Mar 24 Cash & marketable securities $17.6 $14.8 $19.3 Total debt $63.3 $55.0 $59.5 Select debt measures Mar 25 Dec 24 Mar 24 IBM Financing debt $10.0 $12.1 $9.9 Core (non-IBM Financing) debt $53.3 $42.9 $49.6


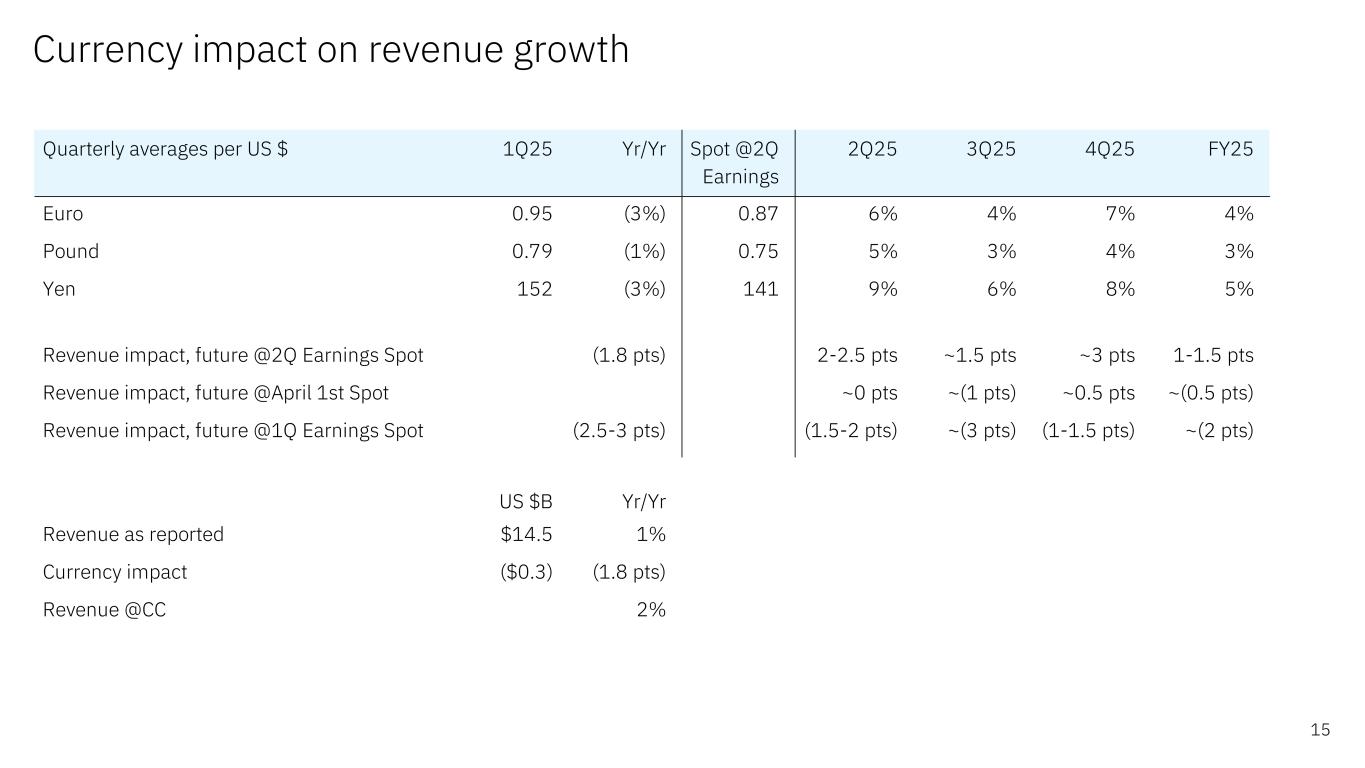
Currency impact on revenue growth 15 Quarterly averages per US $ 1Q25 Yr/Yr Spot @2Q 2Q25 3Q25 4Q25 FY25 Earnings Euro 0.95 (3%) 0.87 6% 4% 7% 4% Pound 0.79 (1%) 0.75 5% 3% 4% 3% Yen 152 (3%) 141 9% 6% 8% 5% Revenue impact, future @2Q Earnings Spot (1.8 pts) 2-2.5 pts ~1.5 pts ~3 pts 1-1.5 pts Revenue impact, future @April 1st Spot ~0 pts ~(1 pts) ~0.5 pts ~(0.5 pts) Revenue impact, future @1Q Earnings Spot (2.5-3 pts) (1.5-2 pts) ~(3 pts) (1-1.5 pts) ~(2 pts) US $B Yr/Yr Revenue as reported $14.5 1% Currency impact ($0.3) (1.8 pts) Revenue @CC 2%


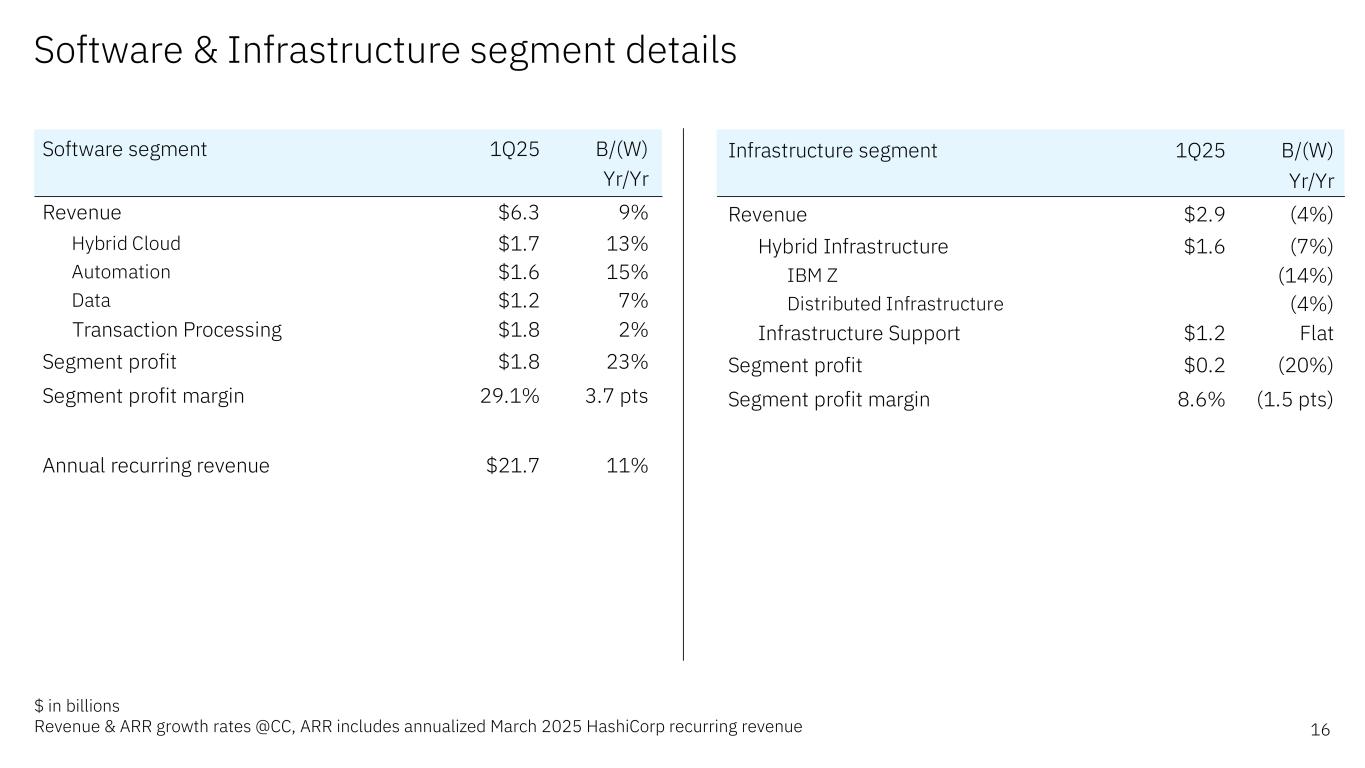
Software & Infrastructure segment details 16 $ in billions Revenue & ARR growth rates @CC, ARR includes annualized March 2025 HashiCorp recurring revenue Infrastructure segment 1Q25 B/(W) Yr/Yr Revenue $2.9 (4%) Hybrid Infrastructure $1.6 (7%) IBM Z (14%) Distributed Infrastructure (4%) Infrastructure Support $1.2 Flat Segment profit $0.2 (20%) Segment profit margin 8.6% (1.5 pts) Software segment 1Q25 B/(W) Yr/Yr Revenue $6.3 9% Hybrid Cloud $1.7 13% Automation $1.6 15% Data $1.2 7% Transaction Processing $1.8 2% Segment profit $1.8 23% Segment profit margin 29.1% 3.7 pts Annual recurring revenue $21.7 11%


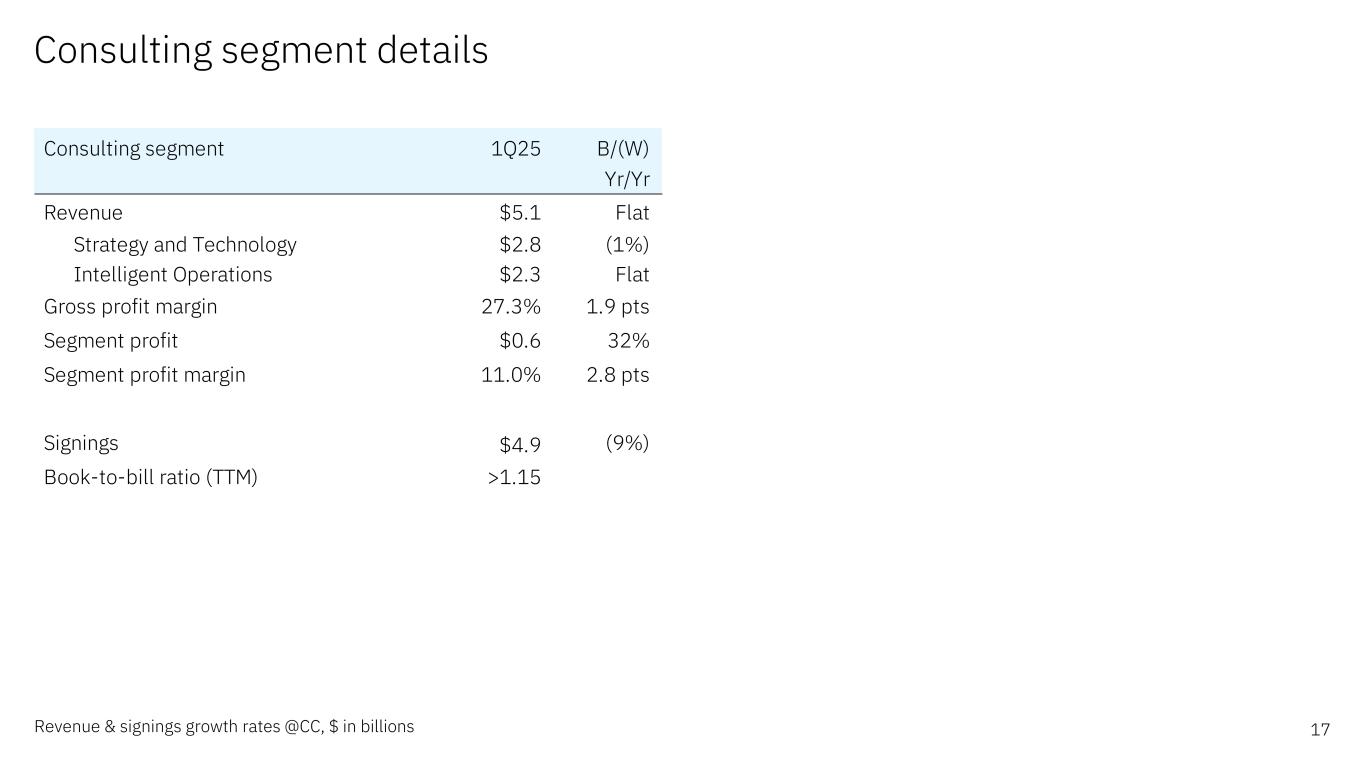
Consulting segment details 17Revenue & signings growth rates @CC, $ in billions Consulting segment 1Q25 B/(W) Yr/Yr Revenue $5.1 Flat Strategy and Technology $2.8 (1%) Intelligent Operations $2.3 Flat Gross profit margin 27.3% 1.9 pts Segment profit $0.6 32% Segment profit margin 11.0% 2.8 pts Signings $4.9 (9%) Book-to-bill ratio (TTM) >1.15


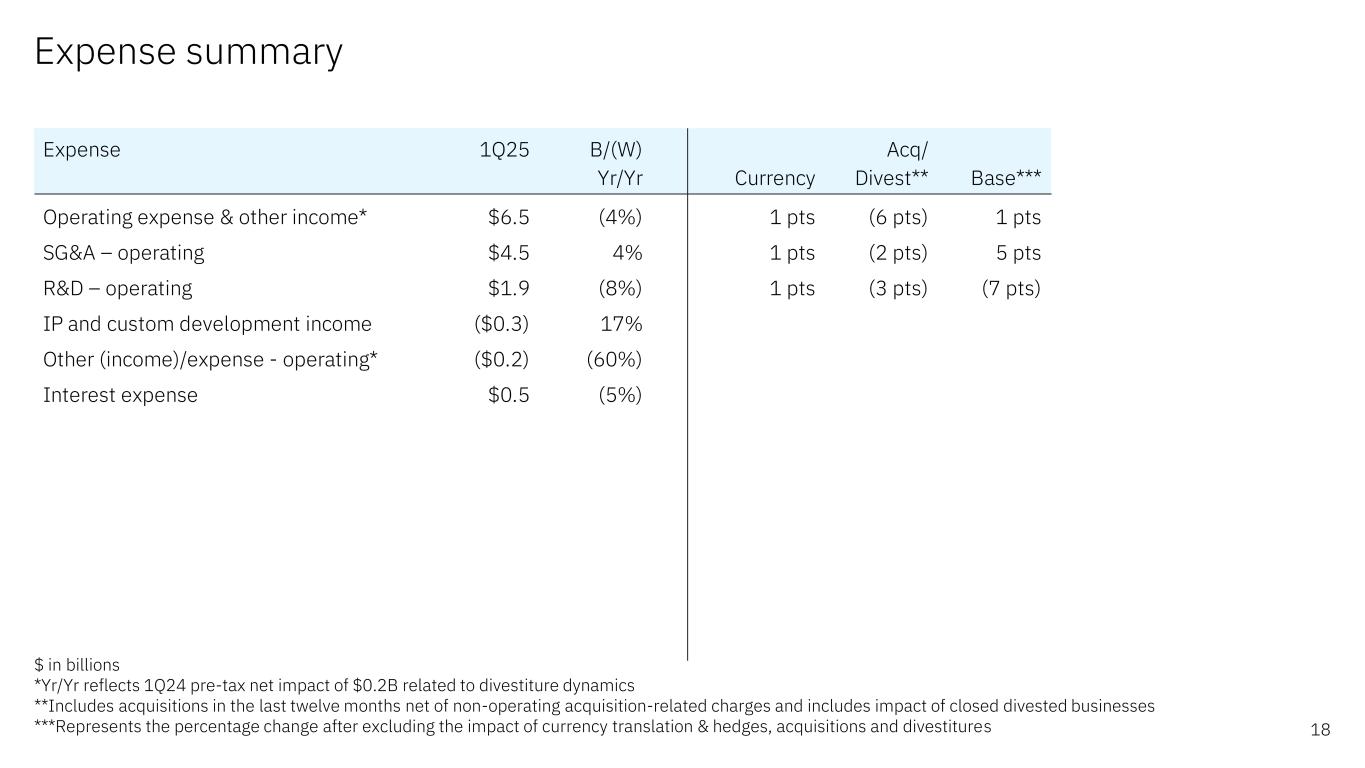
Expense summary 18 $ in billions *Yr/Yr reflects 1Q24 pre-tax net impact of $0.2B related to divestiture dynamics **Includes acquisitions in the last twelve months net of non-operating acquisition-related charges and includes impact of closed divested businesses ***Represents the percentage change after excluding the impact of currency translation & hedges, acquisitions and divestitures Expense 1Q25 B/(W) Acq/ Yr/Yr Currency Divest** Base*** Operating expense & other income* $6.5 (4%) 1 pts (6 pts) 1 pts SG&A – operating $4.5 4% 1 pts (2 pts) 5 pts R&D – operating $1.9 (8%) 1 pts (3 pts) (7 pts) IP and custom development income ($0.3) 17% Other (income)/expense - operating* ($0.2) (60%) Interest expense $0.5 (5%)


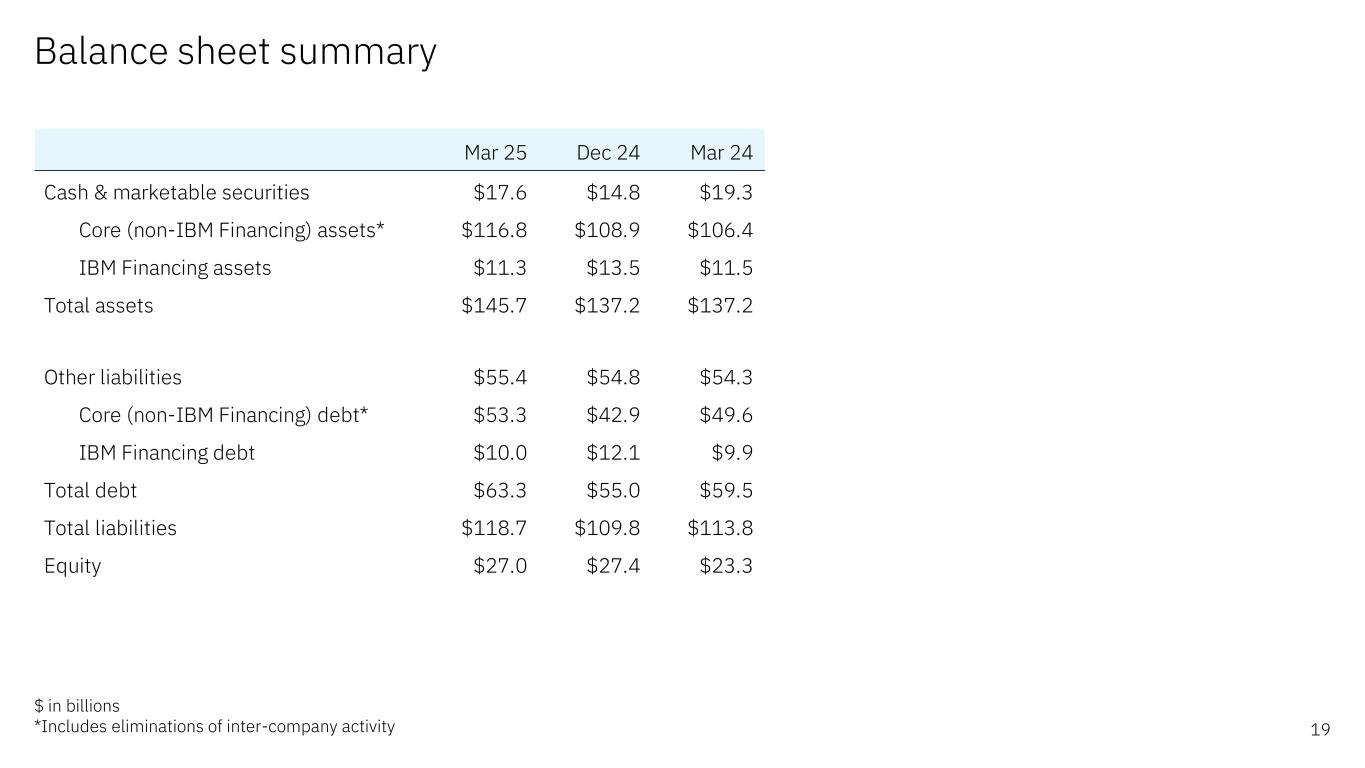
Balance sheet summary 19 $ in billions *Includes eliminations of inter-company activity Mar 25 Dec 24 Mar 24 Cash & marketable securities $17.6 $14.8 $19.3 Core (non-IBM Financing) assets* $116.8 $108.9 $106.4 IBM Financing assets $11.3 $13.5 $11.5 Total assets $145.7 $137.2 $137.2 Other liabilities $55.4 $54.8 $54.3 Core (non-IBM Financing) debt* $53.3 $42.9 $49.6 IBM Financing debt $10.0 $12.1 $9.9 Total debt $63.3 $55.0 $59.5 Total liabilities $118.7 $109.8 $113.8 Equity $27.0 $27.4 $23.3


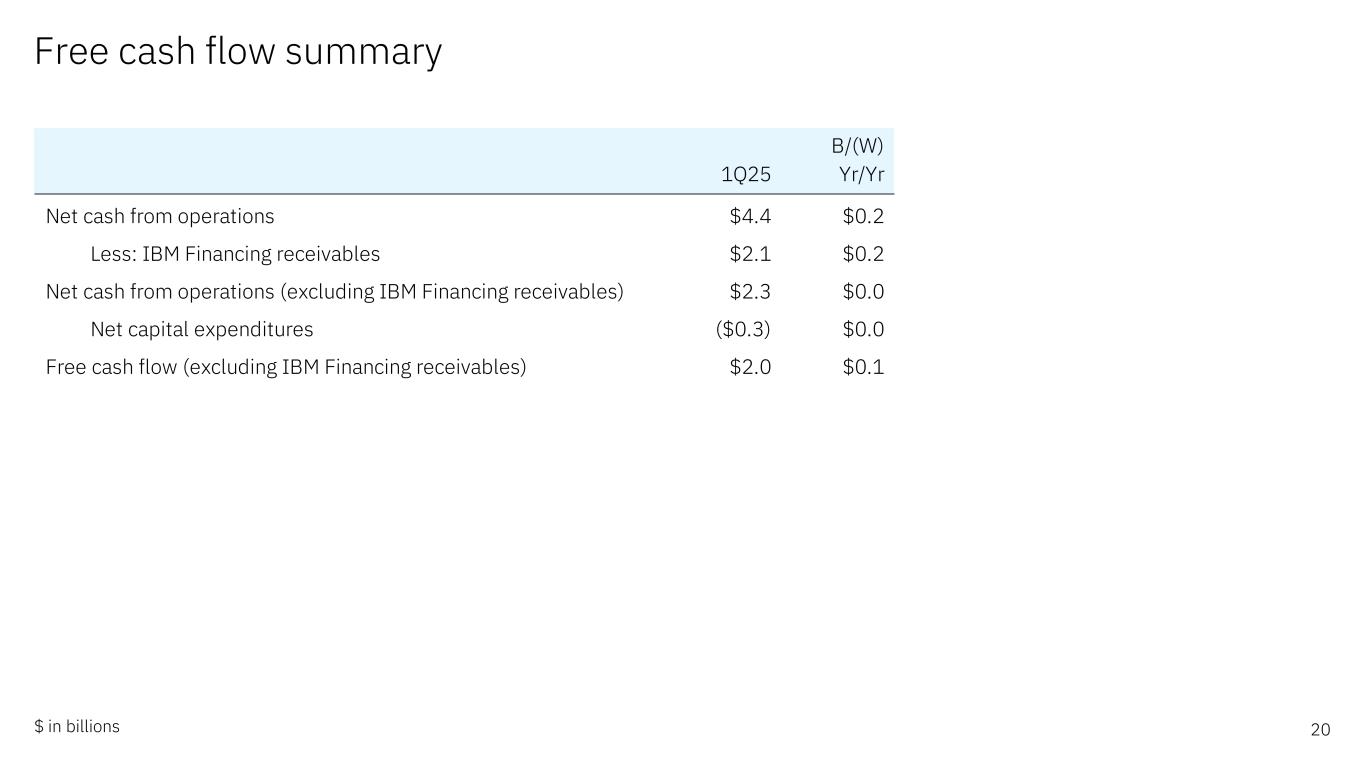
Free cash flow summary 20$ in billions B/(W) 1Q25 Yr/Yr Net cash from operations $4.4 $0.2 Less: IBM Financing receivables $2.1 $0.2 Net cash from operations (excluding IBM Financing receivables) $2.3 $0.0 Net capital expenditures ($0.3) $0.0 Free cash flow (excluding IBM Financing receivables) $2.0 $0.1


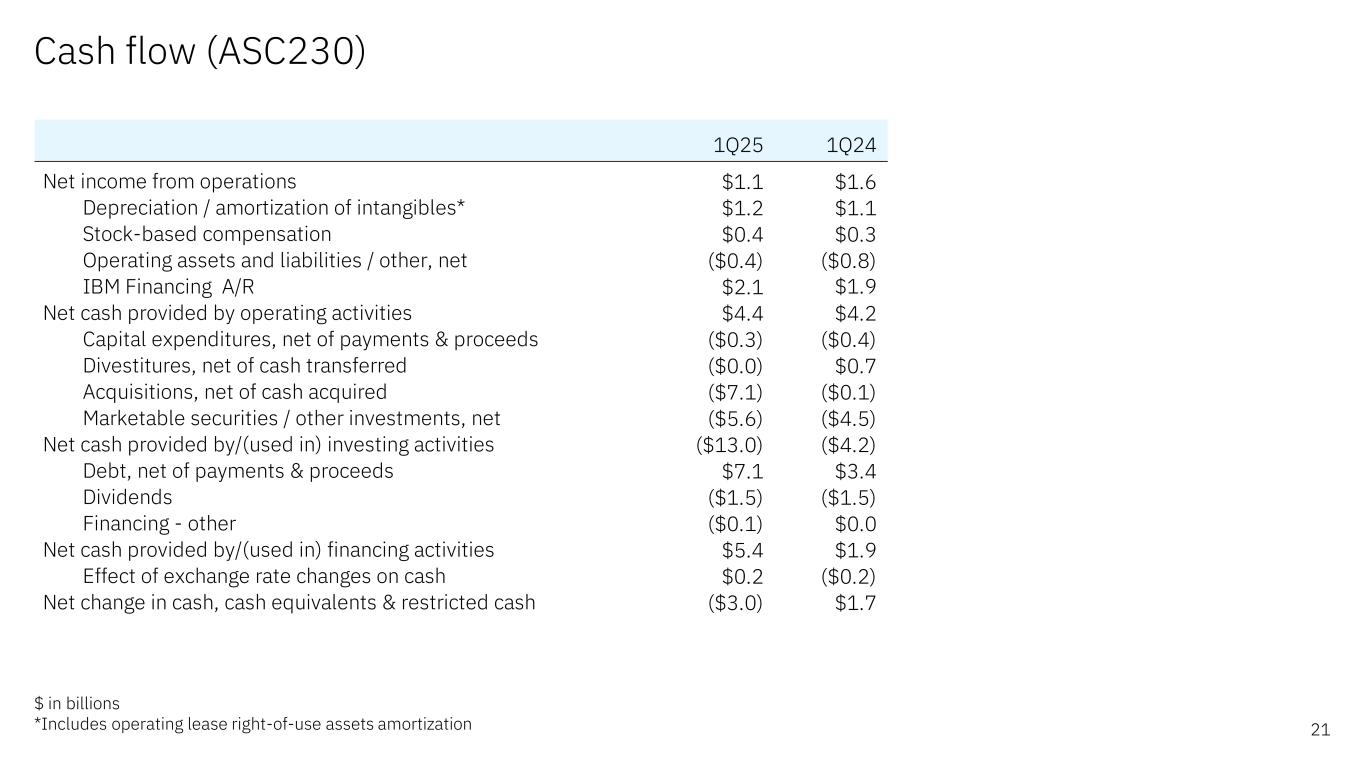
Cash flow (ASC230) 21 $ in billions *Includes operating lease right-of-use assets amortization 1Q25 1Q24 Net income from operations $1.1 $1.6 Depreciation / amortization of intangibles* $1.2 $1.1 Stock-based compensation $0.4 $0.3 Operating assets and liabilities / other, net ($0.4) ($0.8) IBM Financing A/R $2.1 $1.9 Net cash provided by operating activities $4.4 $4.2 Capital expenditures, net of payments & proceeds ($0.3) ($0.4) Divestitures, net of cash transferred ($0.0) $0.7 Acquisitions, net of cash acquired ($7.1) ($0.1) Marketable securities / other investments, net ($5.6) ($4.5) Net cash provided by/(used in) investing activities ($13.0) ($4.2) Debt, net of payments & proceeds $7.1 $3.4 Dividends ($1.5) ($1.5) Financing - other ($0.1) $0.0 Net cash provided by/(used in) financing activities $5.4 $1.9 Effect of exchange rate changes on cash $0.2 ($0.2) Net change in cash, cash equivalents & restricted cash ($3.0) $1.7


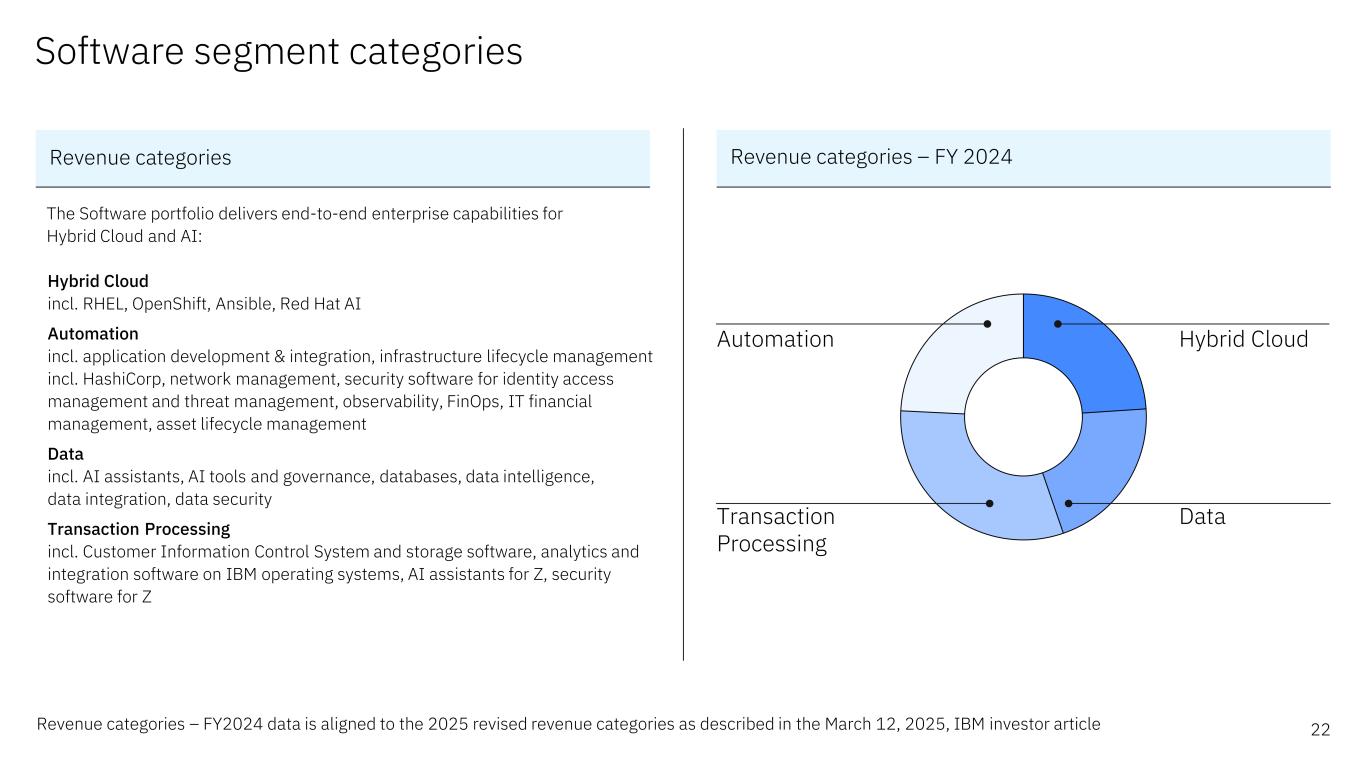
Software segment categories Revenue categories – FY 2024Revenue categories 22 The Software portfolio delivers end-to-end enterprise capabilities for Hybrid Cloud and AI: Hybrid Cloud incl. RHEL, OpenShift, Ansible, Red Hat AI Automation incl. application development & integration, infrastructure lifecycle management incl. HashiCorp, network management, security software for identity access management and threat management, observability, FinOps, IT financial management, asset lifecycle management Data incl. AI assistants, AI tools and governance, databases, data intelligence, data integration, data security Transaction Processing incl. Customer Information Control System and storage software, analytics and integration software on IBM operating systems, AI assistants for Z, security software for Z Hybrid Cloud Transaction Processing Data Automation Revenue categories – FY2024 data is aligned to the 2025 revised revenue categories as described in the March 12, 2025, IBM investor article


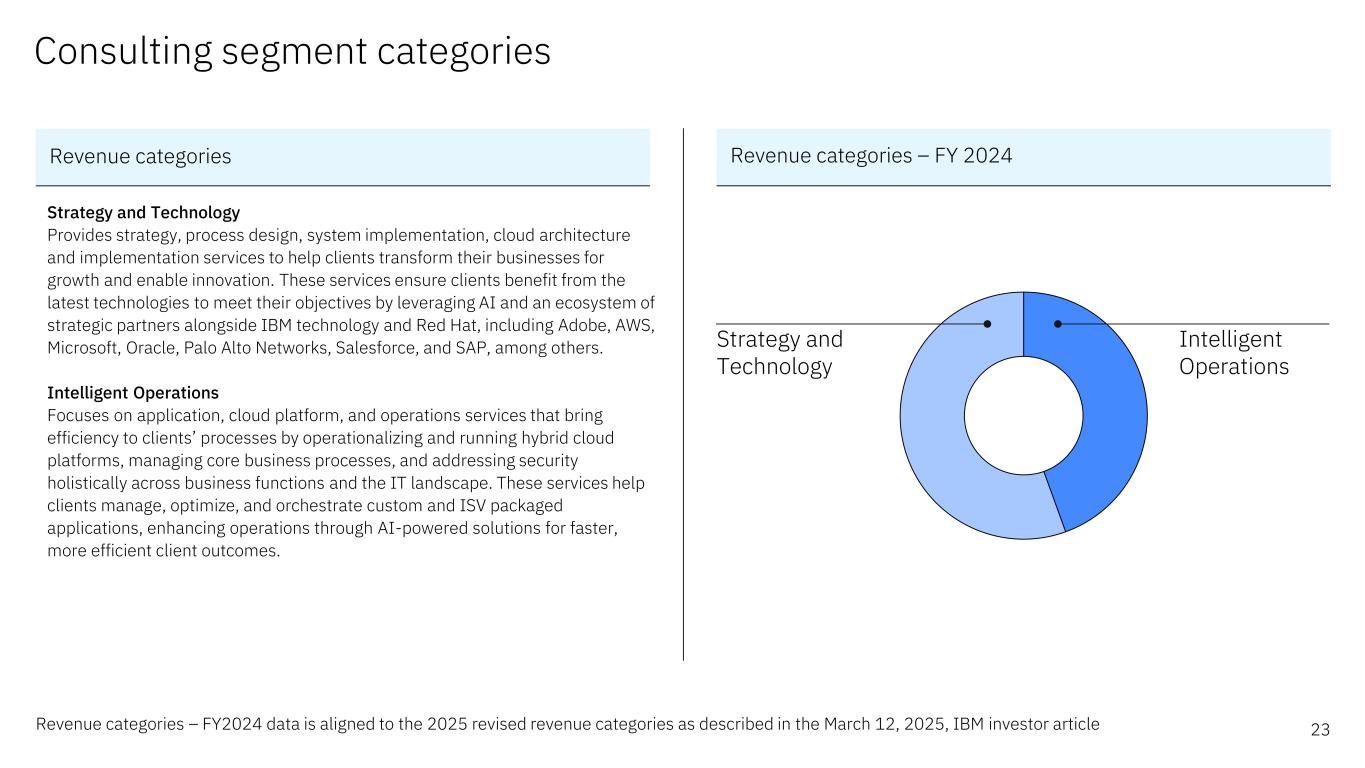
Consulting segment categories Revenue categories – FY 2024 23 Revenue categories Strategy and Technology Provides strategy, process design, system implementation, cloud architecture and implementation services to help clients transform their businesses for growth and enable innovation. These services ensure clients benefit from the latest technologies to meet their objectives by leveraging AI and an ecosystem of strategic partners alongside IBM technology and Red Hat, including Adobe, AWS, Microsoft, Oracle, Palo Alto Networks, Salesforce, and SAP, among others. Intelligent Operations Focuses on application, cloud platform, and operations services that bring efficiency to clients’ processes by operationalizing and running hybrid cloud platforms, managing core business processes, and addressing security holistically across business functions and the IT landscape. These services help clients manage, optimize, and orchestrate custom and ISV packaged applications, enhancing operations through AI-powered solutions for faster, more efficient client outcomes. Intelligent Operations Strategy and Technology Revenue categories – FY2024 data is aligned to the 2025 revised revenue categories as described in the March 12, 2025, IBM investor article


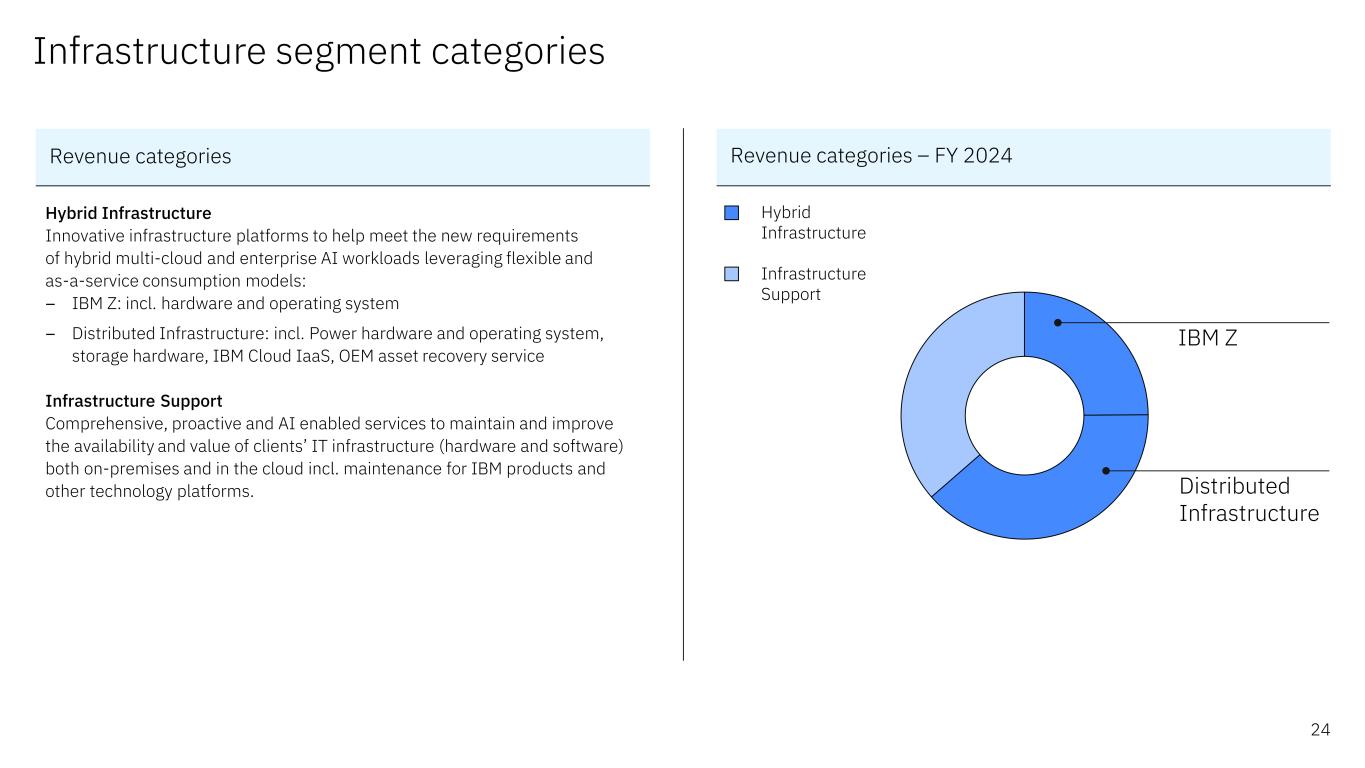
Infrastructure segment categories Hybrid Infrastructure Innovative infrastructure platforms to help meet the new requirements of hybrid multi-cloud and enterprise AI workloads leveraging flexible and as-a-service consumption models: – IBM Z: incl. hardware and operating system – Distributed Infrastructure: incl. Power hardware and operating system, storage hardware, IBM Cloud IaaS, OEM asset recovery service Infrastructure Support Comprehensive, proactive and AI enabled services to maintain and improve the availability and value of clients’ IT infrastructure (hardware and software) both on-premises and in the cloud incl. maintenance for IBM products and other technology platforms. Hybrid Infrastructure Infrastructure Support Revenue categories – FY 2024 24 Revenue categories IBM Z Distributed Infrastructure


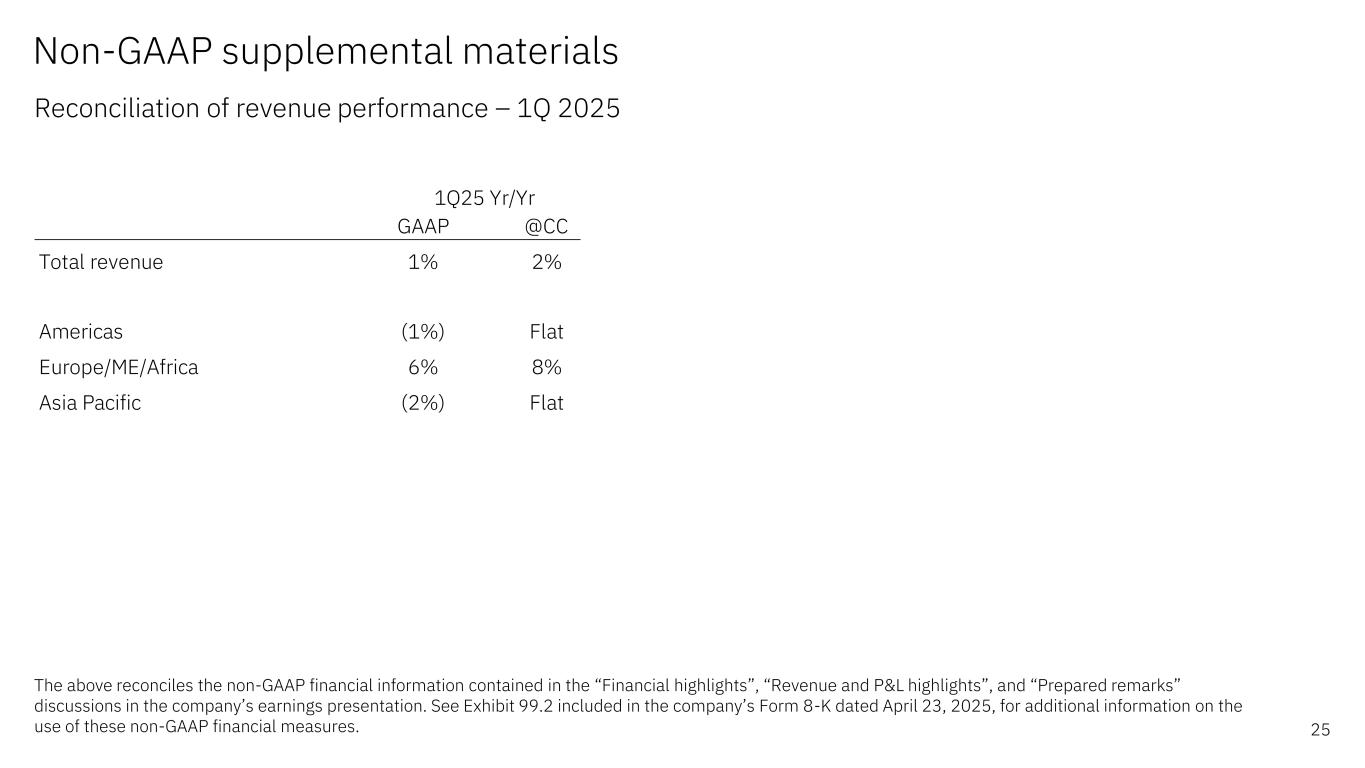
Non-GAAP supplemental materials Reconciliation of revenue performance – 1Q 2025 25 The above reconciles the non-GAAP financial information contained in the “Financial highlights”, “Revenue and P&L highlights”, and “Prepared remarks” discussions in the company’s earnings presentation. See Exhibit 99.2 included in the company’s Form 8-K dated April 23, 2025, for additional information on the use of these non-GAAP financial measures. GAAP @CC Total revenue 1% 2% Americas (1%) Flat Europe/ME/Africa 6% 8% Asia Pacific (2%) Flat 1Q25 Yr/Yr


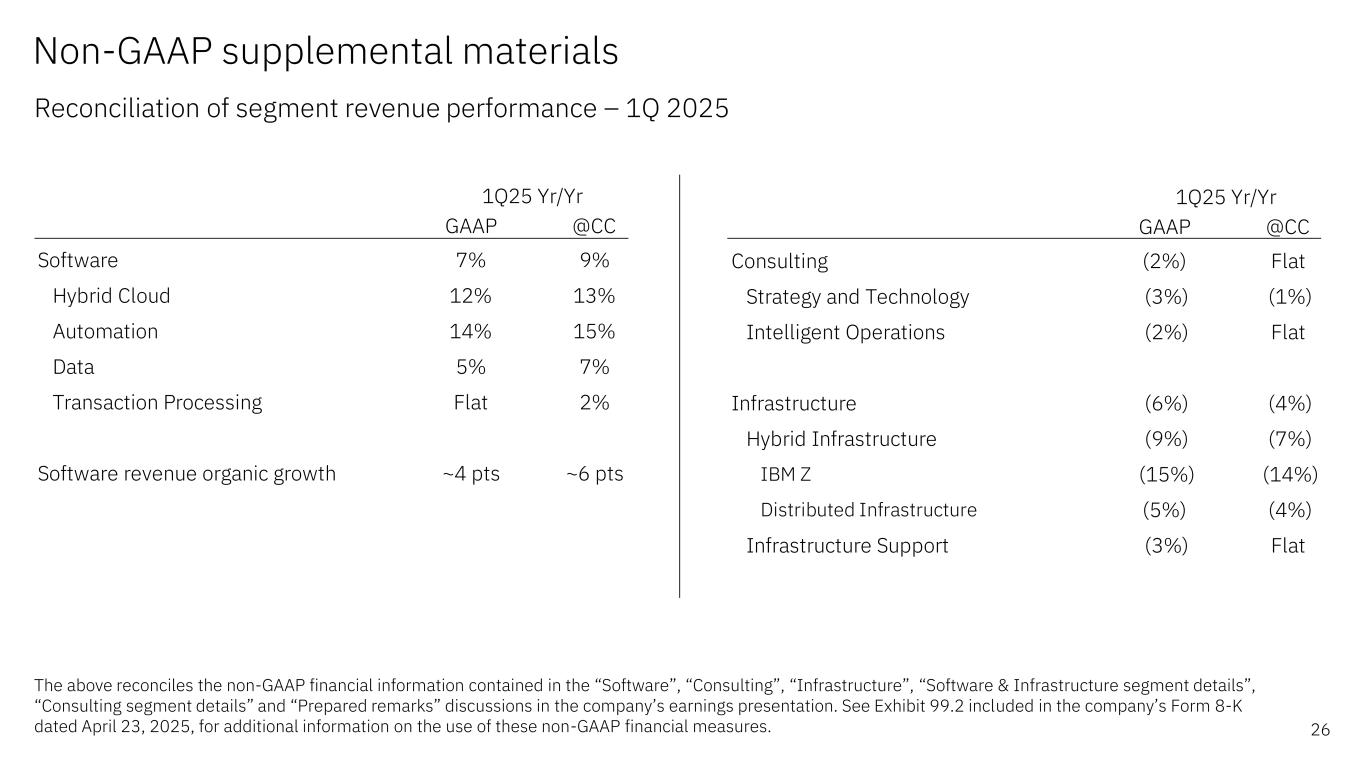
Non-GAAP supplemental materials Reconciliation of segment revenue performance – 1Q 2025 26 The above reconciles the non-GAAP financial information contained in the “Software”, “Consulting”, “Infrastructure”, “Software & Infrastructure segment details”, “Consulting segment details” and “Prepared remarks” discussions in the company’s earnings presentation. See Exhibit 99.2 included in the company’s Form 8-K dated April 23, 2025, for additional information on the use of these non-GAAP financial measures. GAAP @CC Consulting (2%) Flat Strategy and Technology (3%) (1%) Intelligent Operations (2%) Flat Infrastructure (6%) (4%) Hybrid Infrastructure (9%) (7%) IBM Z (15%) (14%) Distributed Infrastructure (5%) (4%) Infrastructure Support (3%) Flat 1Q25 Yr/Yr GAAP @CC Software 7% 9% Hybrid Cloud 12% 13% Automation 14% 15% Data 5% 7% Transaction Processing Flat 2% Software revenue organic growth ~4 pts ~6 pts 1Q25 Yr/Yr


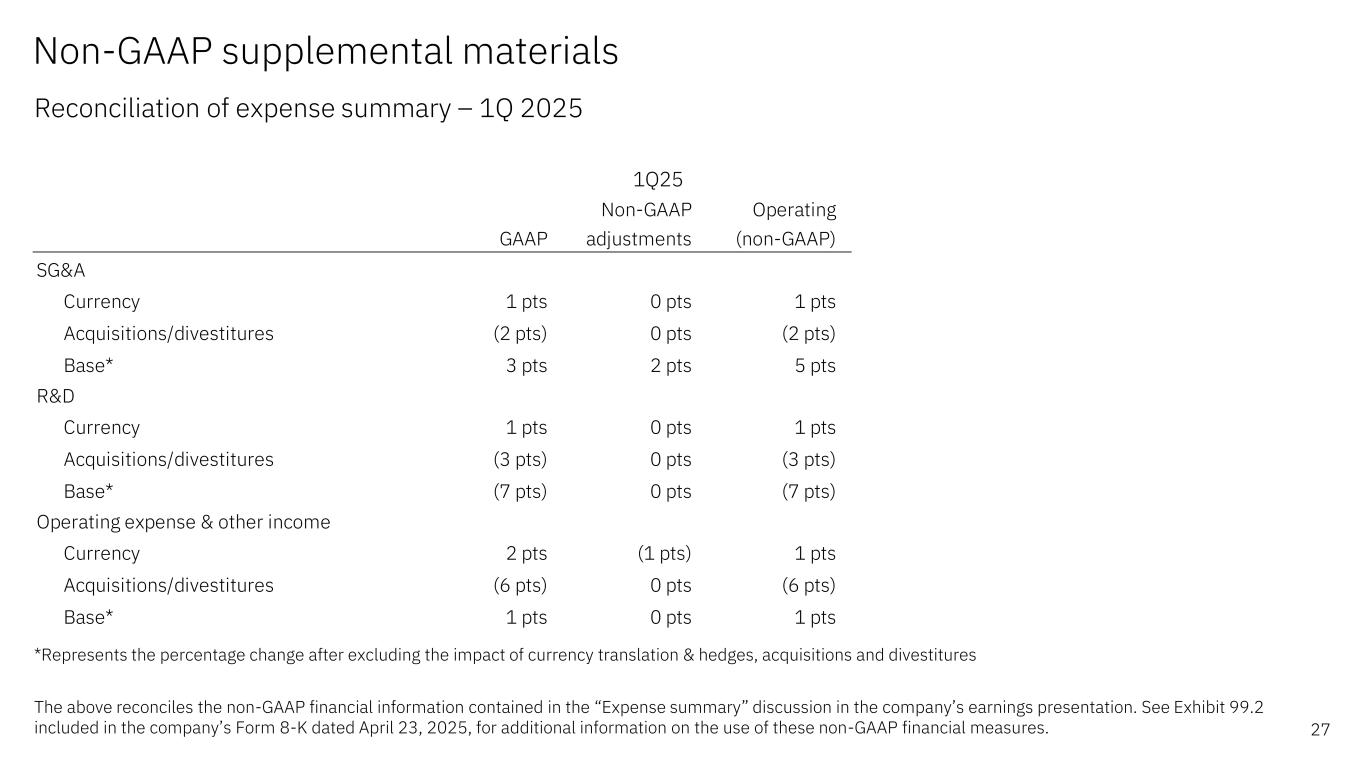
Non-GAAP supplemental materials Reconciliation of expense summary – 1Q 2025 27 *Represents the percentage change after excluding the impact of currency translation & hedges, acquisitions and divestitures The above reconciles the non-GAAP financial information contained in the “Expense summary” discussion in the company’s earnings presentation. See Exhibit 99.2 included in the company’s Form 8-K dated April 23, 2025, for additional information on the use of these non-GAAP financial measures. Non-GAAP Operating GAAP adjustments (non-GAAP) SG&A Currency 1 pts 0 pts 1 pts Acquisitions/divestitures (2 pts) 0 pts (2 pts) Base* 3 pts 2 pts 5 pts R&D Currency 1 pts 0 pts 1 pts Acquisitions/divestitures (3 pts) 0 pts (3 pts) Base* (7 pts) 0 pts (7 pts) Operating expense & other income Currency 2 pts (1 pts) 1 pts Acquisitions/divestitures (6 pts) 0 pts (6 pts) Base* 1 pts 0 pts 1 pts 1Q25


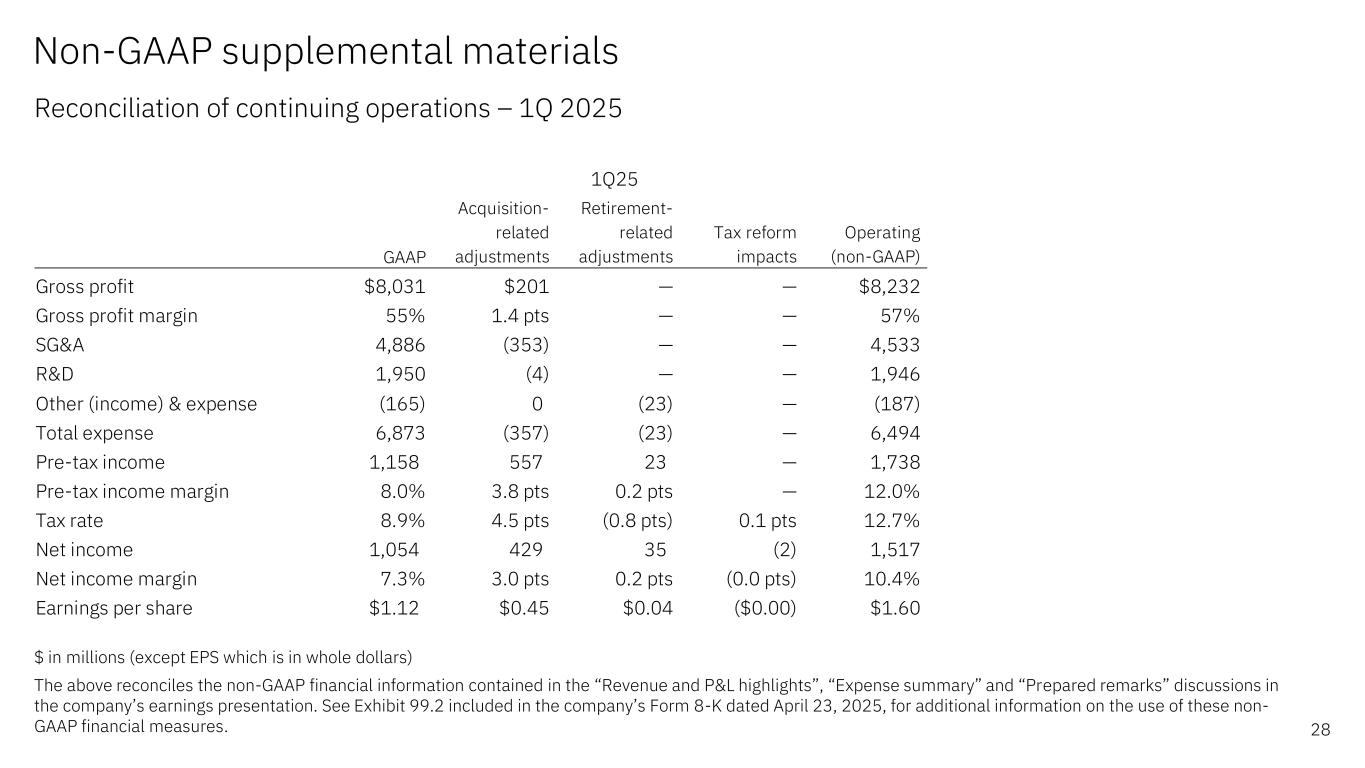
Non-GAAP supplemental materials Reconciliation of continuing operations – 1Q 2025 28 $ in millions (except EPS which is in whole dollars) The above reconciles the non-GAAP financial information contained in the “Revenue and P&L highlights”, “Expense summary” and “Prepared remarks” discussions in the company’s earnings presentation. See Exhibit 99.2 included in the company’s Form 8-K dated April 23, 2025, for additional information on the use of these non- GAAP financial measures. GAAP Acquisition- related adjustments Retirement- related adjustments Tax reform impacts Operating (non-GAAP) Gross profit $8,031 $201 — — $8,232 Gross profit margin 55% 1.4 pts — — 57% SG&A 4,886 (353) — — 4,533 R&D 1,950 (4) — — 1,946 Other (income) & expense (165) 0 (23) — (187) Total expense  6,873 (357) (23) — 6,494 Pre-tax income 1,158 557 23 — 1,738 Pre-tax income margin 8.0% 3.8 pts 0.2 pts — 12.0% Tax rate 8.9% 4.5 pts (0.8 pts) 0.1 pts 12.7% Net income 1,054 429 35 (2) 1,517 Net income margin 7.3% 3.0 pts 0.2 pts (0.0 pts) 10.4% Earnings per share $1.12 $0.45 $0.04 ($0.00) $1.60 1Q25


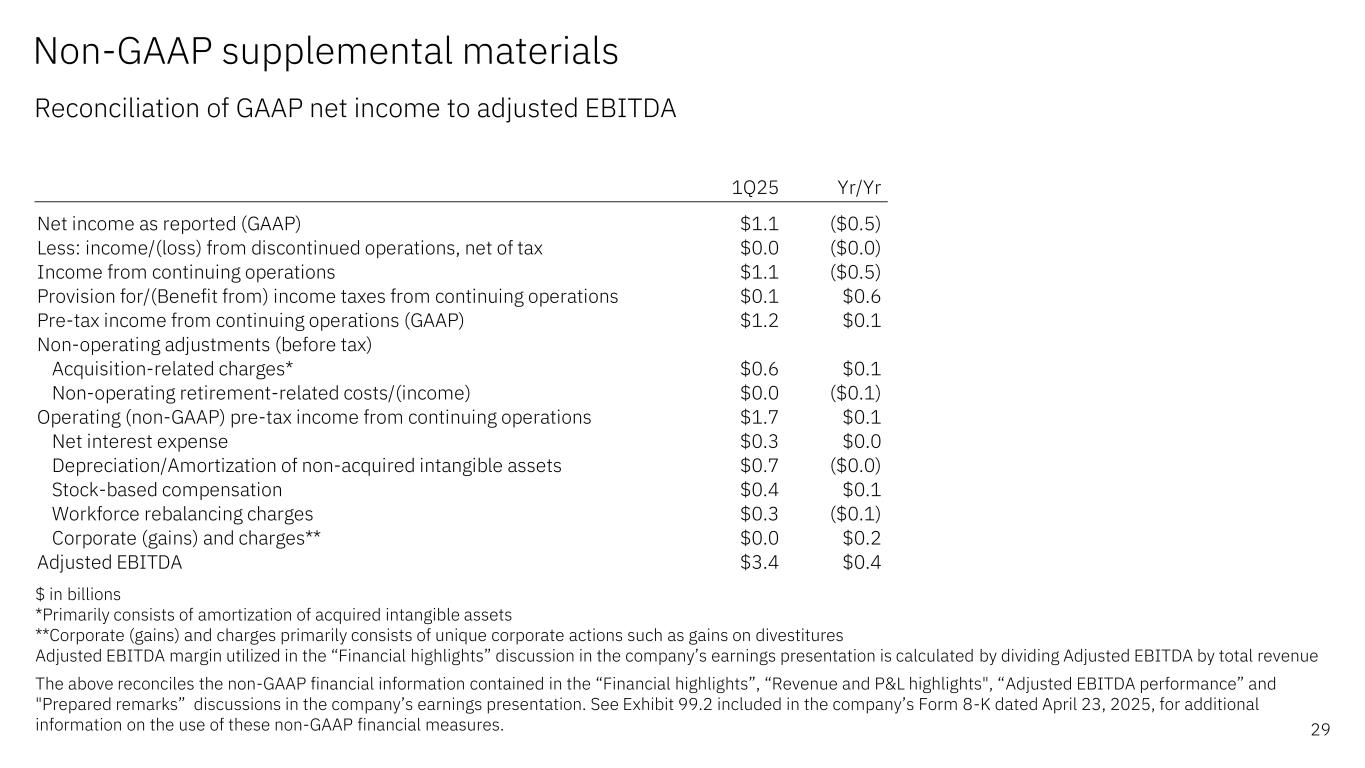
1Q25 Yr/Yr Net income as reported (GAAP) $1.1 ($0.5) Less: income/(loss) from discontinued operations, net of tax $0.0 ($0.0) Income from continuing operations $1.1 ($0.5) Provision for/(Benefit from) income taxes from continuing operations $0.1 $0.6 Pre-tax income from continuing operations (GAAP) $1.2 $0.1 Non-operating adjustments (before tax) Acquisition-related charges* $0.6 $0.1 Non-operating retirement-related costs/(income) $0.0 ($0.1) Operating (non-GAAP) pre-tax income from continuing operations $1.7 $0.1 Net interest expense $0.3 $0.0 Depreciation/Amortization of non-acquired intangible assets $0.7 ($0.0) Stock-based compensation $0.4 $0.1 Workforce rebalancing charges $0.3 ($0.1) Corporate (gains) and charges** $0.0 $0.2 Adjusted EBITDA $3.4 $0.4 Non-GAAP supplemental materials Reconciliation of GAAP net income to adjusted EBITDA 29 $ in billions *Primarily consists of amortization of acquired intangible assets **Corporate (gains) and charges primarily consists of unique corporate actions such as gains on divestitures Adjusted EBITDA margin utilized in the “Financial highlights” discussion in the company’s earnings presentation is calculated by dividing Adjusted EBITDA by total revenue The above reconciles the non-GAAP financial information contained in the “Financial highlights”, “Revenue and P&L highlights", “Adjusted EBITDA performance” and "Prepared remarks” discussions in the company’s earnings presentation. See Exhibit 99.2 included in the company’s Form 8-K dated April 23, 2025, for additional information on the use of these non-GAAP financial measures.


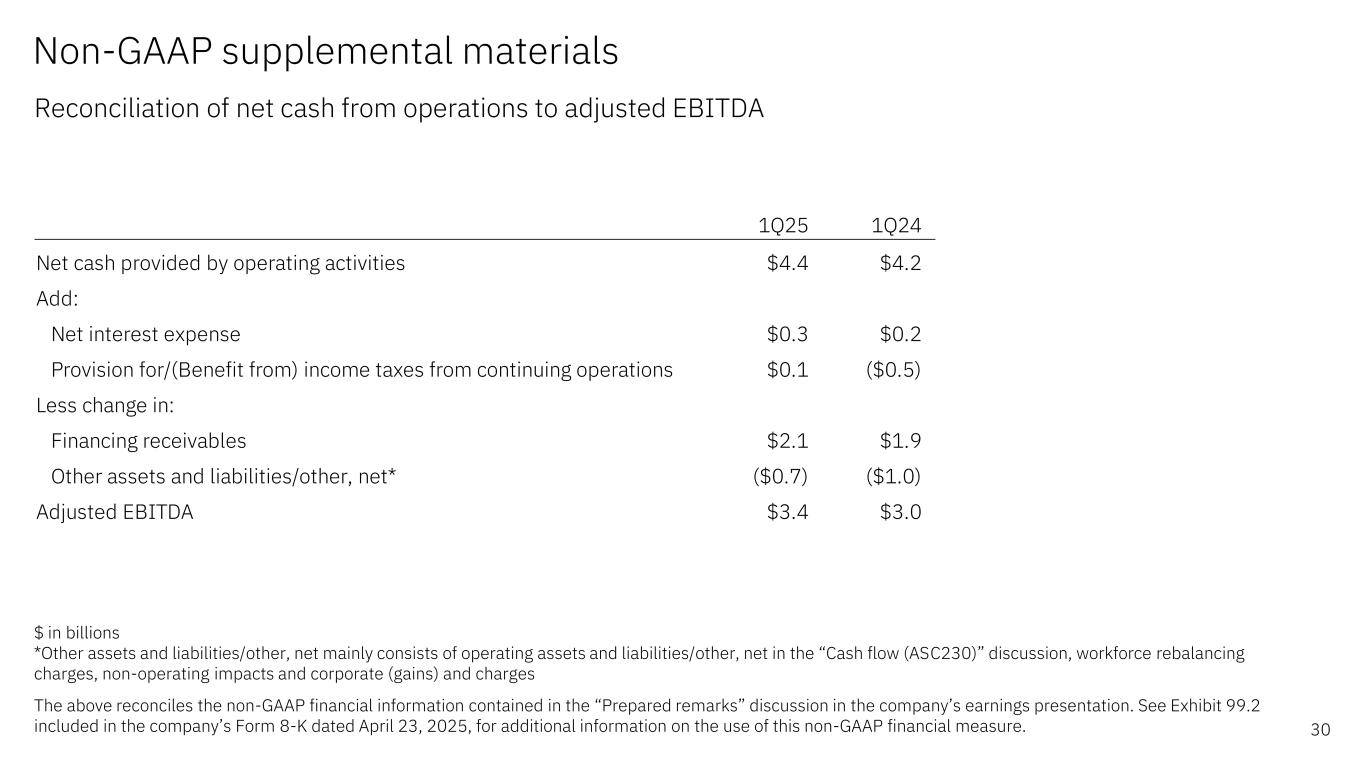
Non-GAAP supplemental materials Reconciliation of net cash from operations to adjusted EBITDA 30 $ in billions *Other assets and liabilities/other, net mainly consists of operating assets and liabilities/other, net in the “Cash flow (ASC230)” discussion, workforce rebalancing charges, non-operating impacts and corporate (gains) and charges The above reconciles the non-GAAP financial information contained in the “Prepared remarks” discussion in the company’s earnings presentation. See Exhibit 99.2 included in the company’s Form 8-K dated April 23, 2025, for additional information on the use of this non-GAAP financial measure. 1Q25 1Q24 Net cash provided by operating activities $4.4 $4.2 Add: Net interest expense $0.3 $0.2 Provision for/(Benefit from) income taxes from continuing operations $0.1 ($0.5) Less change in: Financing receivables $2.1 $1.9 Other assets and liabilities/other, net* ($0.7) ($1.0) Adjusted EBITDA $3.4 $3.0


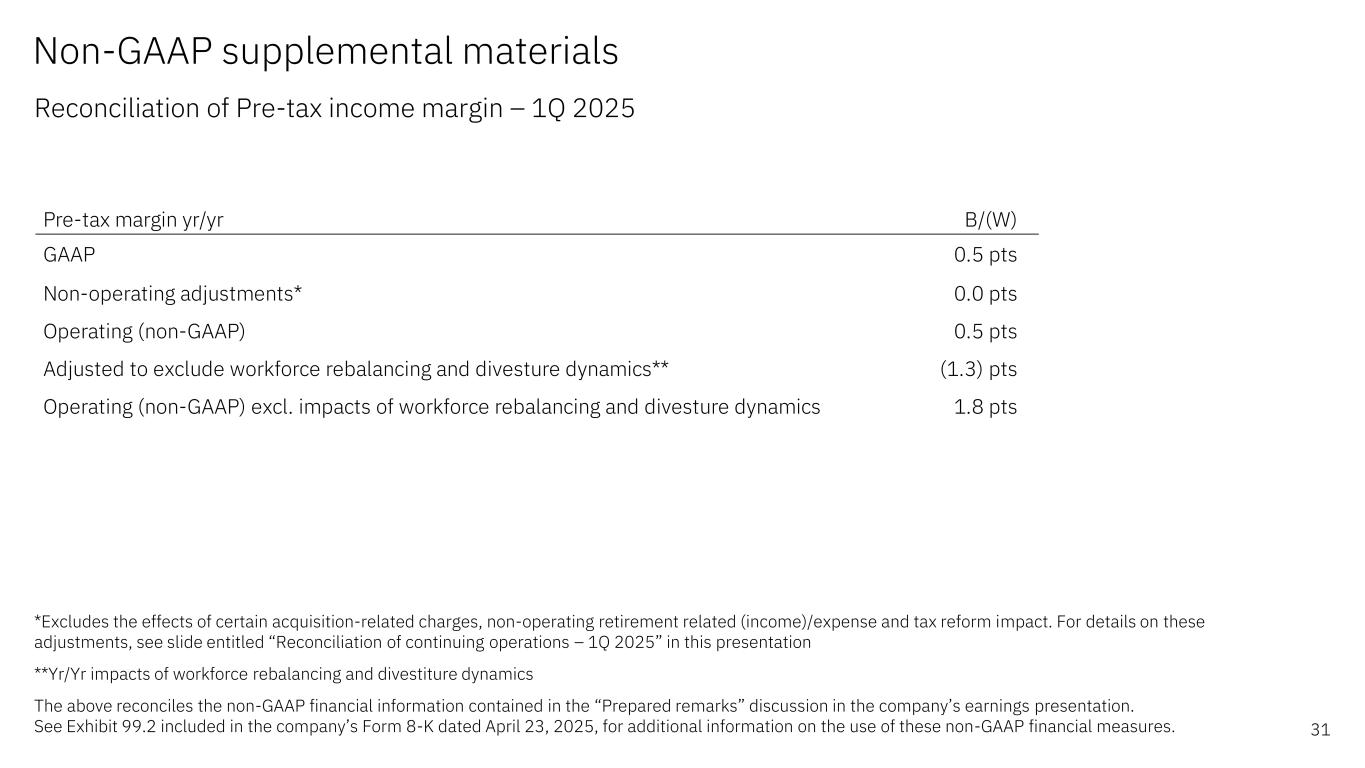
Non-GAAP supplemental materials Reconciliation of Pre-tax income margin – 1Q 2025 *Excludes the effects of certain acquisition-related charges, non-operating retirement related (income)/expense and tax reform impact. For details on these adjustments, see slide entitled “Reconciliation of continuing operations – 1Q 2025” in this presentation **Yr/Yr impacts of workforce rebalancing and divestiture dynamics The above reconciles the non-GAAP financial information contained in the “Prepared remarks” discussion in the company’s earnings presentation. See Exhibit 99.2 included in the company’s Form 8-K dated April 23, 2025, for additional information on the use of these non-GAAP financial measures. 31 Pre-tax margin yr/yr B/(W) GAAP 0.5 pts Non-operating adjustments* 0.0 pts Operating (non-GAAP) 0.5 pts Adjusted to exclude workforce rebalancing and divesture dynamics** (1.3) pts Operating (non-GAAP) excl. impacts of workforce rebalancing and divesture dynamics 1.8 pts


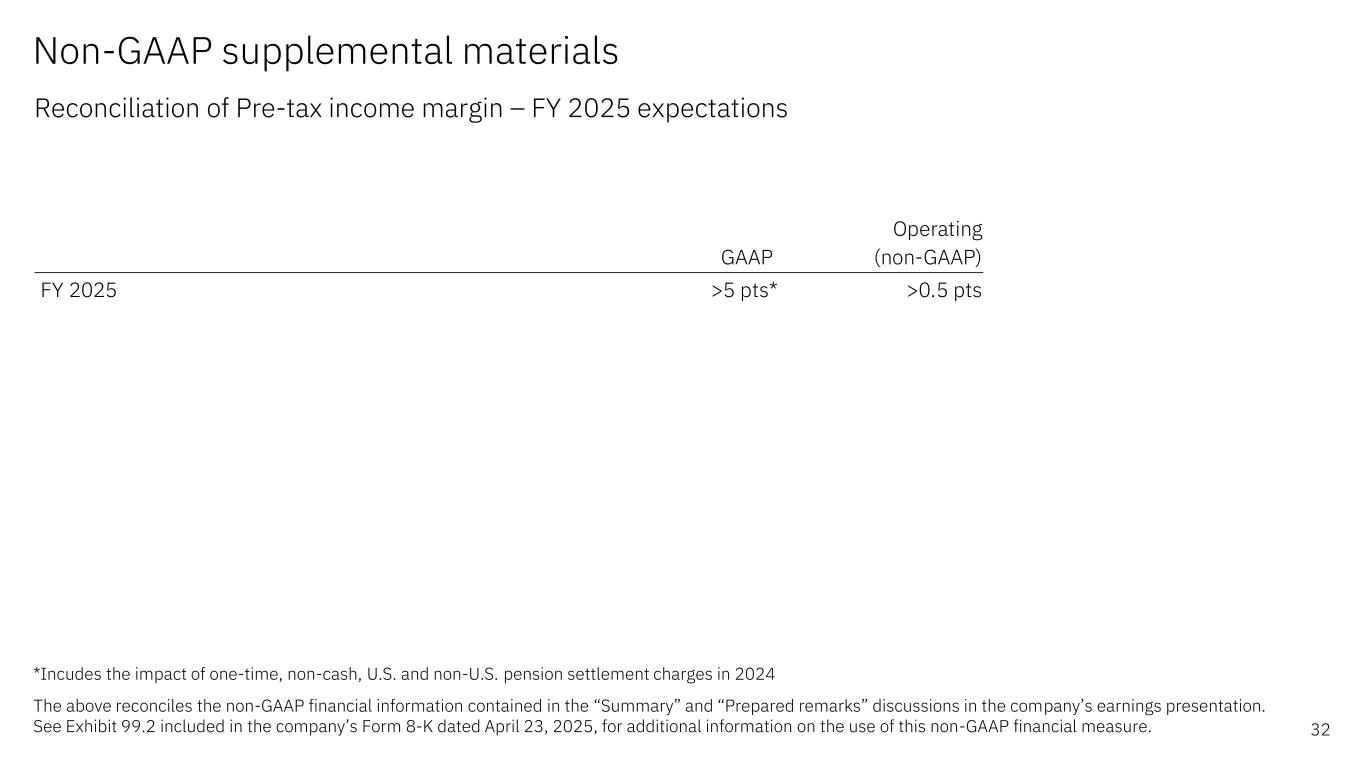
Non-GAAP supplemental materials Reconciliation of Pre-tax income margin – FY 2025 expectations *Incudes the impact of one-time, non-cash, U.S. and non-U.S. pension settlement charges in 2024 The above reconciles the non-GAAP financial information contained in the “Summary” and “Prepared remarks” discussions in the company’s earnings presentation. See Exhibit 99.2 included in the company’s Form 8-K dated April 23, 2025, for additional information on the use of this non-GAAP financial measure. 32 GAAP Operating (non-GAAP) FY 2025 >5 pts* >0.5 pts


ibm.com/investor