0000051143falseCapital stock, par value $.20 per shareIBMCHX0000051143exch:XNYSus-gaap:CommonStockMember2022-04-192022-04-190000051143exch:XNYSibm:Notes2.875PercentDue2025Member2022-04-192022-04-190000051143exch:XNYSibm:Notes2.625PercentDue2022Member2022-04-192022-04-190000051143exch:XNYSibm:Notes1.750PercentDue2031Member2022-04-192022-04-190000051143exch:XNYSibm:Notes1.750PercentDue2028Member2022-04-192022-04-190000051143exch:XNYSibm:Notes1.500PercentDue2029Member2022-04-192022-04-190000051143exch:XNYSibm:Notes1.25PercentDue2023Member2022-04-192022-04-190000051143exch:XNYSibm:Notes1.250PercentDue2034Member2022-04-192022-04-190000051143exch:XNYSibm:Notes1.250PercentDue2027Member2022-04-192022-04-190000051143exch:XNYSibm:Notes1.200PercentDue2040Member2022-04-192022-04-190000051143exch:XNYSibm:Notes1.125PercentDue2024Member2022-04-192022-04-190000051143exch:XNYSibm:Notes0.950PercentDue2025Member2022-04-192022-04-190000051143exch:XNYSibm:Notes0.875PercentDue2030Member2022-04-192022-04-190000051143exch:XNYSibm:Notes0.875PercentDue2025Member2022-04-192022-04-190000051143exch:XNYSibm:Notes0.650PercentDue2032Member2022-04-192022-04-190000051143exch:XNYSibm:Notes0.375PercentDue2023Member2022-04-192022-04-190000051143exch:XNYSibm:Notes0.300PercentDue2028Member2022-04-192022-04-190000051143exch:XNYSibm:Notes0.300PercentDue2026Member2022-04-192022-04-190000051143exch:XNYSibm:Debentures7.125PercentDue2096Member2022-04-192022-04-190000051143exch:XNYSibm:Debentures7.00PercentDue2045Member2022-04-192022-04-190000051143exch:XNYSibm:Debentures7.00PercentDue2025Member2022-04-192022-04-190000051143exch:XNYSibm:Debentures6.50PercentDue2028Member2022-04-192022-04-190000051143exch:XNYSibm:Debentures6.22PercentDue2027Member2022-04-192022-04-190000051143exch:XCHIus-gaap:CommonStockMember2022-04-192022-04-1900000511432022-04-192022-04-19

​

​

UNITED STATES

SECURITIES AND EXCHANGE COMMISSION

WASHINGTON, D.C. 20549

FORM 8-K

CURRENT REPORT PURSUANT TO SECTION 13 OR 15 (d)

OF THE SECURITIES EXCHANGE ACT OF 1934

Date of Report: April 19, 2022

(Date of earliest event reported)

INTERNATIONAL BUSINESS MACHINES CORPORATION

(Exact name of registrant as specified in its charter)

​

​

​

​

​

New York

​

1-2360

​

13-0871985

(State of Incorporation)

​

(Commission File Number)

​

(IRS employer Identification No.)

​

​

​

​

​

One New Orchard Road

Armonk, New York

​

​

10504

(Address of principal executive offices)

​

(Zip Code)

​

914-499-1900

(Registrant’s telephone number)

Check the appropriate box below if the Form 8-K filing is intended to simultaneously satisfy the filing obligation of the registrant under any of the following provisions:

​

​

☐

Written communications pursuant to Rule 425 under the Securities Act (17 CFR 230.425)

☐

Soliciting material pursuant to Rule 14a-12 under the Exchange Act (17 CFR 240.14a-12)

☐

Pre-commencement communications pursuant to Rule 14d-2(b) under the Exchange Act (17 CFR 240.14d-2(b))

☐

Pre-commencement communications pursuant to Rule 13e-4(c) under the Exchange Act (17 CFR 240.13e-4(c))

​

Securities registered pursuant to Section 12(b) of the Act:

​

​

​

​

​

Title of each class

​

Trading symbol(s)

​

Name of each exchange
on which registered

Capital stock, par value $.20 per share

​

IBM

​

New York Stock Exchange

​

​

​

​

NYSE Chicago

2.625% Notes due 2022

​

IBM 22A

​

New York Stock Exchange

1.250% Notes due 2023

​

IBM 23A

​

New York Stock Exchange

0.375% Notes due 2023

​

IBM 23B

​

New York Stock Exchange

1.125% Notes due 2024

​

IBM 24A

​

New York Stock Exchange

2.875% Notes due 2025

​

IBM 25A

​

New York Stock Exchange

0.950% Notes due 2025

​

IBM 25B

​

New York Stock Exchange

0.875% Notes due 2025

​

IBM 25C

​

New York Stock Exchange

0.300% Notes due 2026

​

IBM 26B

​

New York Stock Exchange

1.250% Notes due 2027

​

IBM 27B

​

New York Stock Exchange

0.300% Notes due 2028

​

IBM 28B

​

New York Stock Exchange

1.750% Notes due 2028

​

IBM 28A

​

New York Stock Exchange

1.500% Notes due 2029

​

IBM 29

​

New York Stock Exchange

0.875% Notes due 2030

​

IBM 30

​

New York Stock Exchange

1.750% Notes due 2031

​

IBM 31

​

New York Stock Exchange

0.650% Notes due 2032

​

IBM 32A

​

New York Stock Exchange

1.250% Notes due 2034

​

IBM 34

​

New York Stock Exchange

1.200% Notes due 2040

​

IBM 40

​

New York Stock Exchange

7.00% Debentures due 2025

​

IBM 25

​

New York Stock Exchange

6.22% Debentures due 2027

​

IBM 27

​

New York Stock Exchange

6.50% Debentures due 2028

​

IBM 28

​

New York Stock Exchange

7.00% Debentures due 2045

​

IBM 45

​

New York Stock Exchange

7.125% Debentures due 2096

​

IBM 96

​

New York Stock Exchange

​

Indicate by check mark whether the registrant is an emerging growth company as defined in Rule 405 of the Securities Act of 1933 (§230.405 of this chapter) or Rule 12b-2 of the Securities Exchange Act of 1934 (§240.12b-2 of this chapter).

Emerging growth company  ☐

If an emerging growth company, indicate by check mark if the registrant has elected not to use the extended transition period for complying with any new or revised financial accounting standards provided pursuant to Section 13(a) of the Exchange Act. ☐

​

​

​

​

​

​

Item 2.02. Results of Operations and Financial Condition.

The registrant’s press release dated April 19, 2022, regarding its financial results for the period ended March 31, 2022, including consolidated financial statements for the period ended March 31, 2022, is Exhibit 99.1 of this Form 8-K.

In an effort to provide investors with additional information regarding the company’s results as determined by generally accepted accounting principles (GAAP), the company has disclosed in the attached press release certain non-GAAP information which management believes provides useful information to investors. Reconciliations of these non-GAAP financial measures to the most directly comparable financial measures calculated and presented in accordance with GAAP are included in the press release, which is Exhibit 99.1 to this Form 8-K. The rationale for management’s use of non-GAAP measures is included in Exhibit 99.2 to this Form 8-K.

The information in this Item 2.02, including the corresponding Exhibits 99.1 and 99.2, is being furnished with the Commission and shall not be deemed “filed” for purposes of Section 18 of the Securities Exchange Act of 1934.

Item 7.01. Regulation FD Disclosure.

The slides for IBM’s Chairman and Chief Executive Officer Arvind Krishna and Chief Financial Officer Jim Kavanaugh’s first-quarter 2022 earnings presentation on April 19, 2022, are Exhibit 99.3 to this Form 8-K.

The information in this Item 7.01, including the corresponding Exhibit 99.3, is being furnished with the Commission and shall not be deemed “filed” for purposes of Section 18 of the Securities Exchange Act of 1934.

​

Item 9.01. Financial Statements and Exhibits.

(d) Exhibits

The following exhibits are being furnished as part of this report:

​

​

​

Exhibit No.

​

Description of Exhibit

99.1

​

Earnings Release of the Registrant, dated April 19, 2022

99.2

​

Non-GAAP Financial Information

99.3

​

Earnings Presentation of the Registrant, dated April 19, 2022

​

The following exhibit is being filed as part of this report:

​

​

​

Exhibit No.

​

Description of Exhibit

104

​

Cover Page Interactive Data File – the cover page interactive data file does not appear in the Interactive Data File because its XBRL tags are embedded within the Inline XBRL document

​

IBM’s web site (www.ibm.com) contains a significant amount of information about IBM, including financial and other information for investors (www.ibm.com/investor/). IBM encourages investors to visit its various web sites from time to time, as information is updated and new information is posted.

​

2

SIGNATURE

Pursuant to the requirements of the Securities Exchange Act of 1934, the registrant has duly caused this report to be signed on its behalf by the undersigned, hereunto duly authorized.

​

​

​

Date: April 19, 2022

​

​

​

​

​

​

​

By:

/s/ Robert F. Del Bene

​

​

Robert F. Del Bene

​

​

Vice President and Controller

​

​

​

3

Exhibit 99.1

​

IBM RELEASES FIRST QUARTER RESULTS

Double-Digit Software and Consulting Growth Led by Hybrid Cloud Adoption; Strong Profit Generation

ARMONK, N.Y., April 19, 2022 . . . IBM (NYSE: IBM) today announced first-quarter 2022 earnings results.

“Demand for hybrid cloud and AI drove growth in both Software and Consulting in the first quarter. Today we’re a more focused business and our results reflect the execution of our strategy," said Arvind Krishna, IBM chairman and chief executive officer. "We are off to a solid start for the year, and we now see revenue growth for 2022 at the high end of our model.”

First-Quarter Highlights

●Revenue
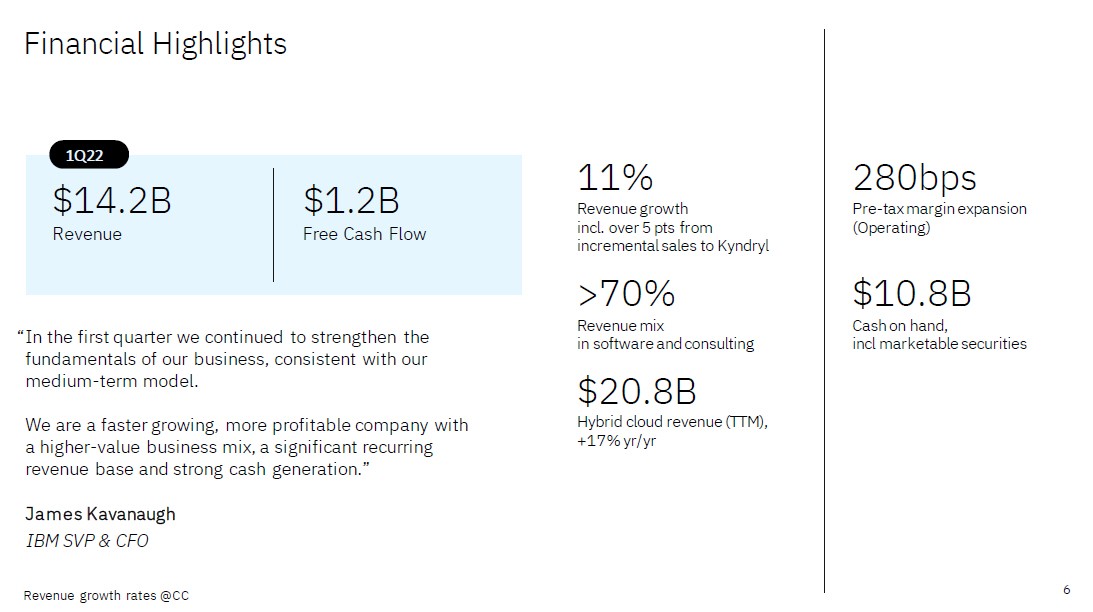
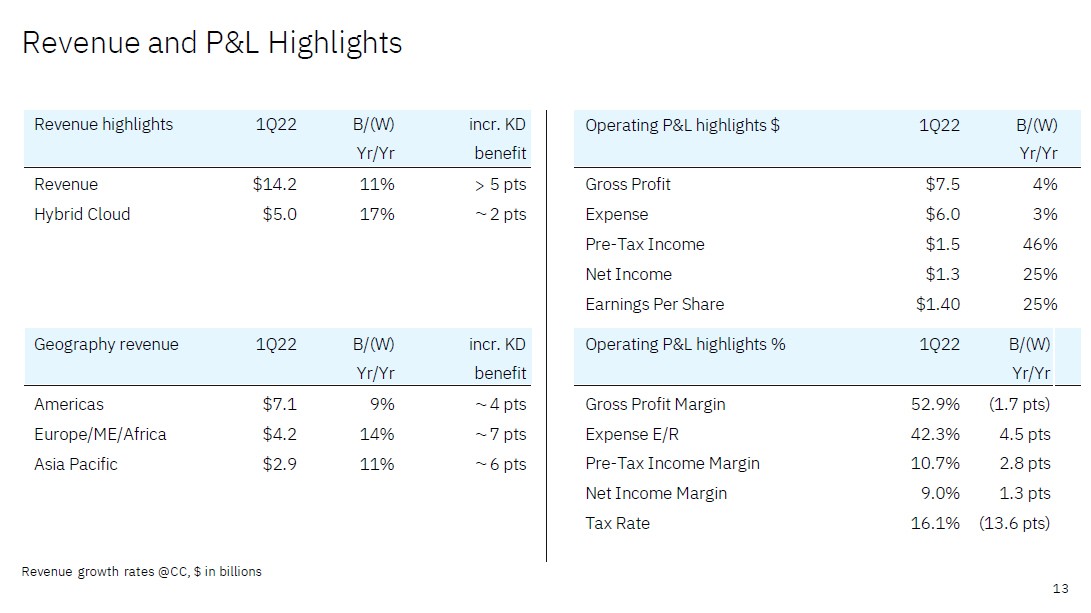
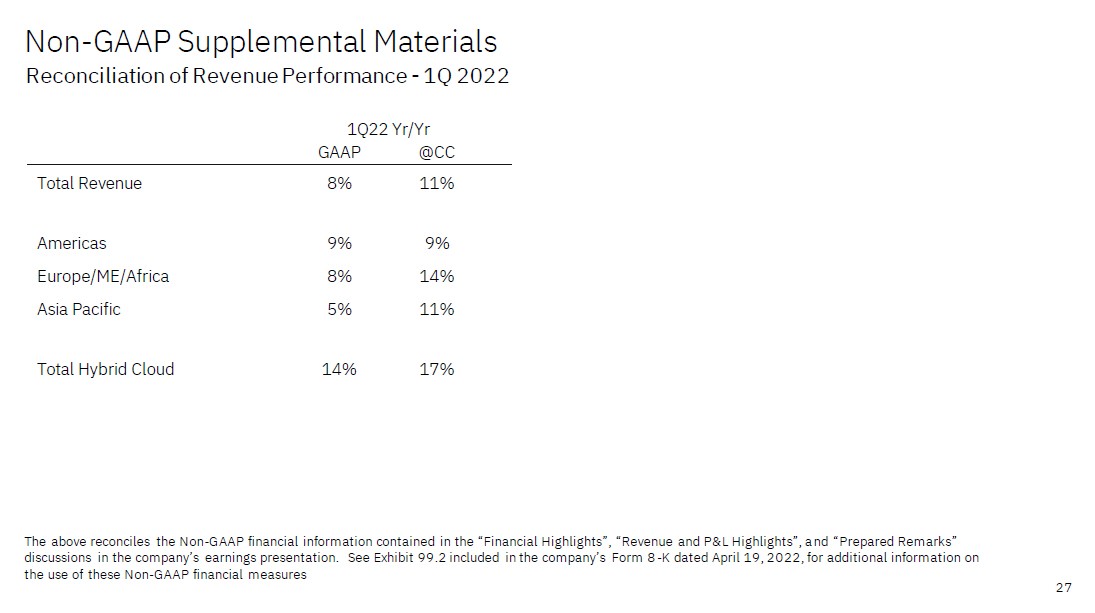
─Revenue of $14.2 billion, up 8 percent, up 11 percent at constant currency (over 5 points from incremental sales to Kyndryl)
─Software revenue up 12 percent, up 15 percent at constant currency (over 8 points from incremental sales to Kyndryl)
─Consulting revenue up 13 percent, up 17 percent at constant currency
─Infrastructure revenue down 2 percent, flat at constant currency (over 8 points from incremental sales to Kyndryl)
─Hybrid cloud revenue:

-- First Quarter: $5.0 billion, up 14 percent, up 17 percent at constant currency

-- Last 12 months: $20.8 billion, up 17 percent

●Free Cash Flow
─On a consolidated basis, net cash from operating activities of $3.2 billion; free cash flow of $1.2 billion

​

​

​

​

​

​

​

​

​

​

​

​

​

​

​

​

​

​

​

​

​

​

FIRST QUARTER 2022 INCOME STATEMENT SUMMARY

​


​

​


​

​


​

​


Pre-tax


​

​


​

​


​

​

​

​

​

​

Gross


​

Pre-tax

​

Income

​

​

Net

​

​

Diluted

​

​

​

​

Revenue

​

​

Profit


​

Income

​

Margin

​

​

Income

​

​

EPS

​

GAAP from Continuing Operations

​

$

14.2B

​

$

7.3B

​

$

0.6B


4.4

%  

$

0.7B

​

$

0.73

​

Year/Year

​


8

%*


4

%  


156

%  

2.5

Pts


64

%  


62

%  

Operating
(Non-GAAP)

​

​

​

​

$

7.5B

​

$

1.5B


10.7

%  

$

1.3B

​

$

1.40

​

Year/Year

​

​

​

​

​

4

%  


46

%  

2.8

Pts


25

%  


25

%  

* 11% at constant currency

“In the first quarter we continued to strengthen the fundamentals of our business, consistent with our medium-term model," said James Kavanaugh, IBM senior vice president and chief financial officer. "We are a faster growing, more profitable company with a higher-value business mix, a significant recurring revenue base and strong cash generation.”


Segment Results for First Quarter

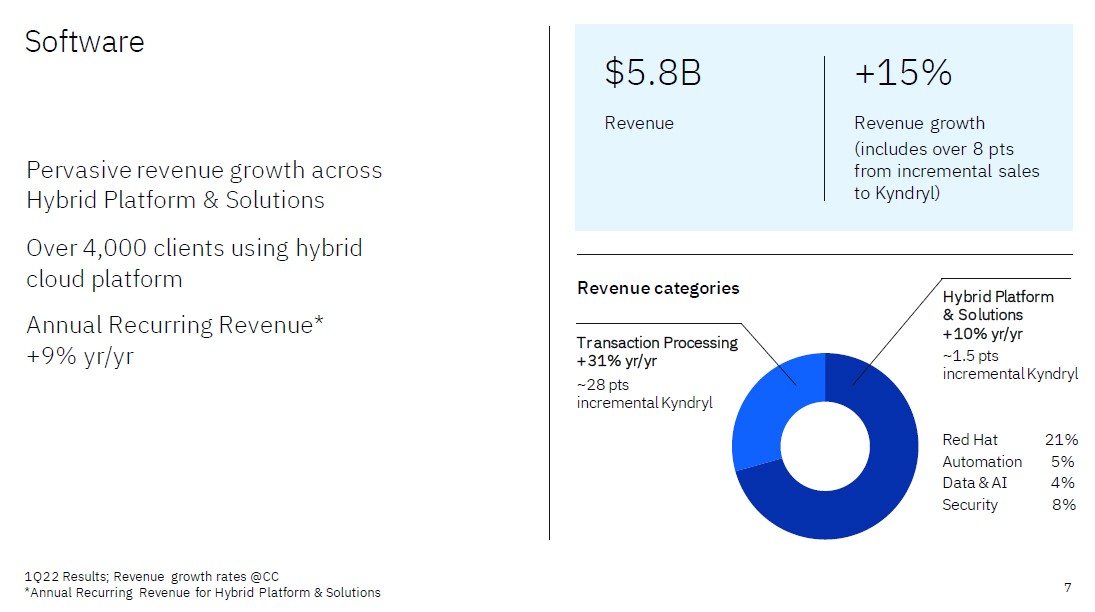
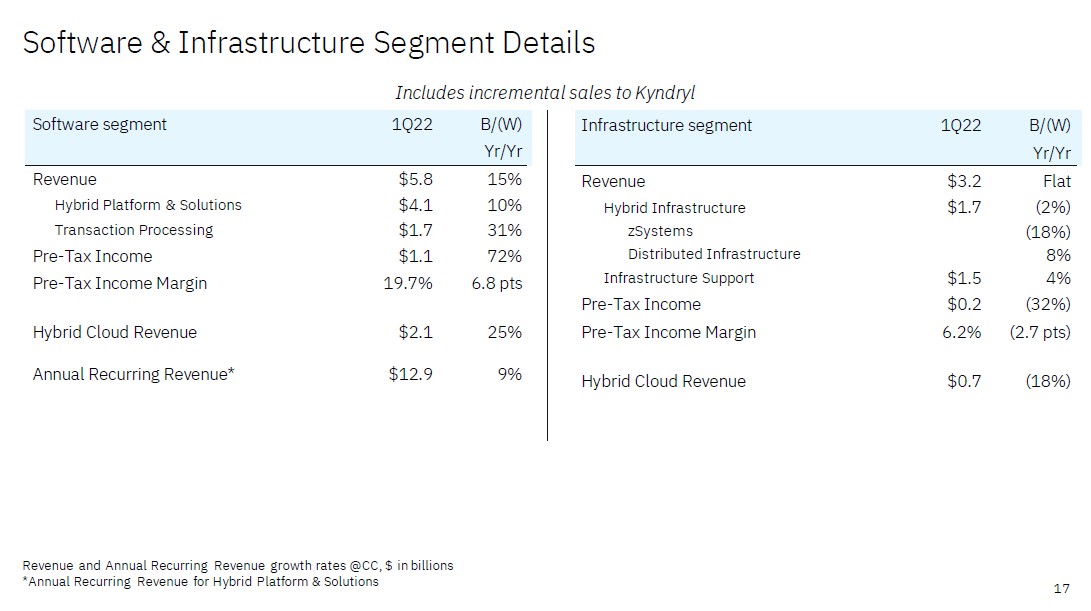
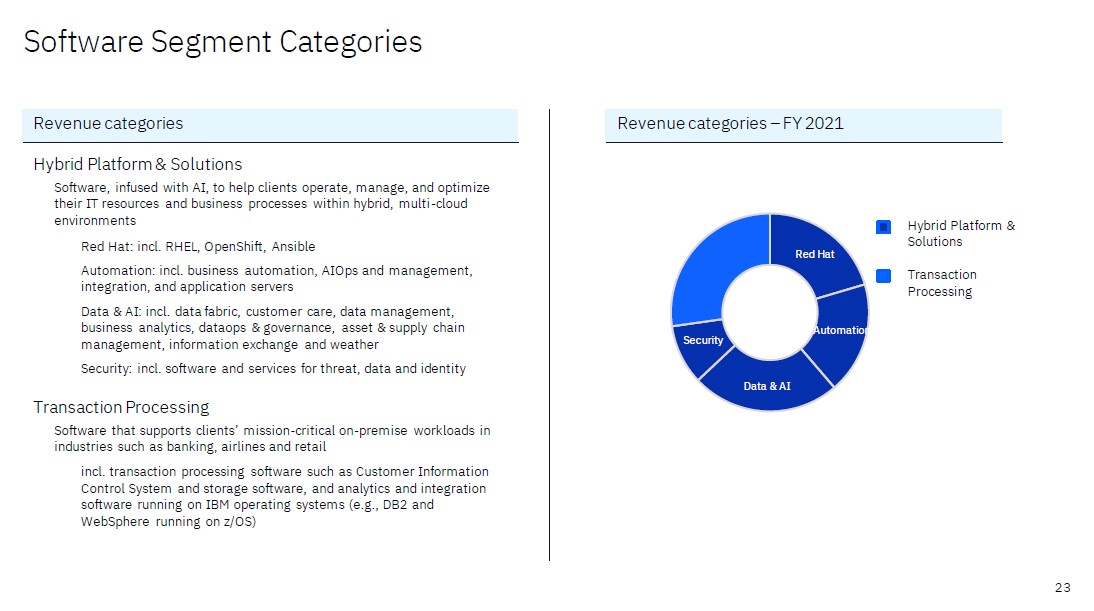
●Software (includes Hybrid Platform & Solutions, Transaction Processing)— revenues of $5.8 billion, up 12.3 percent, up 15.4 percent at constant currency (over 8 points from incremental sales to Kyndryl):

- Hybrid Platform & Solutions up 7 percent, up 10 percent at constant currency (about 1.5 points from incremental sales to Kyndryl):

-- Red Hat up 18 percent, up 21 percent at constant currency

-- Automation up 3 percent, up 5 percent at constant currency

-- Data & AI up 2 percent, up 4 percent at constant currency

-- Security up 5 percent, up 8 percent at constant currency

- Transaction Processing up 26 percent, up 31 percent at constant currency (about 28 points from incremental sales to Kyndryl)

- Software segment hybrid cloud revenue up 22 percent, up 25 percent at constant currency

​

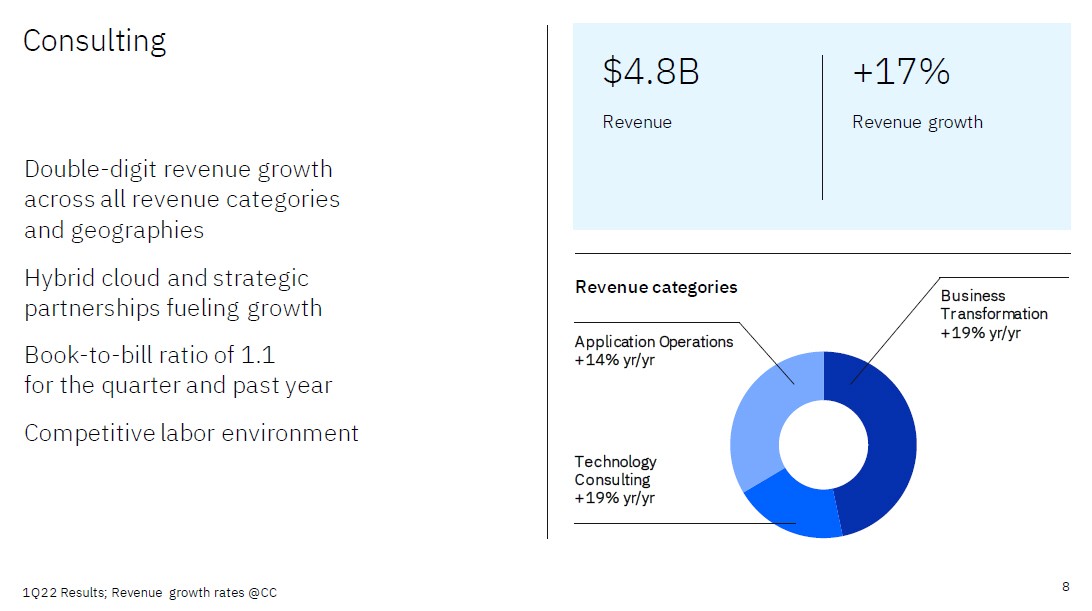
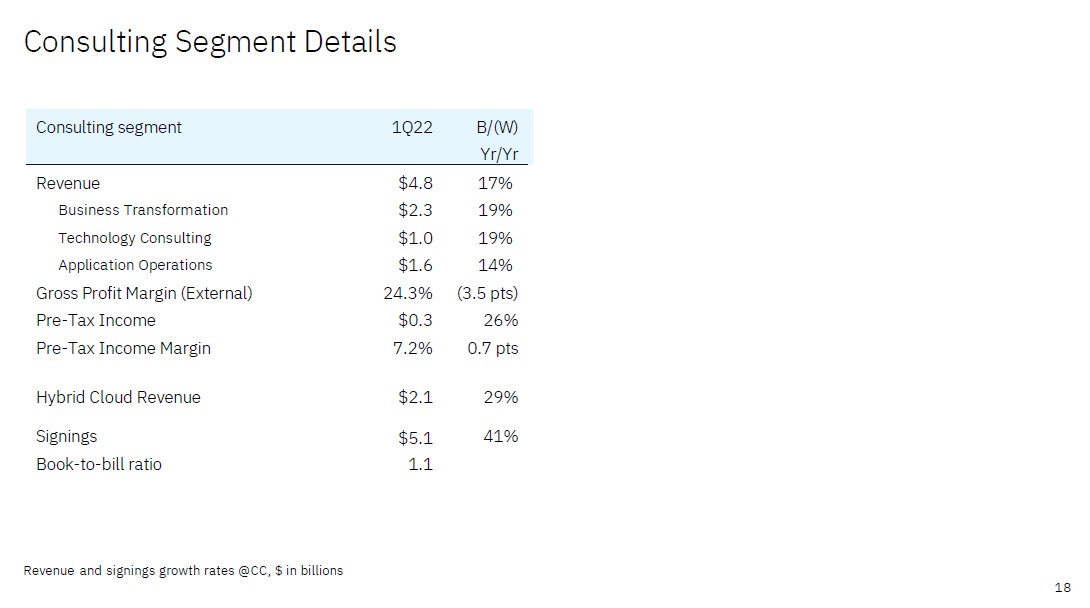
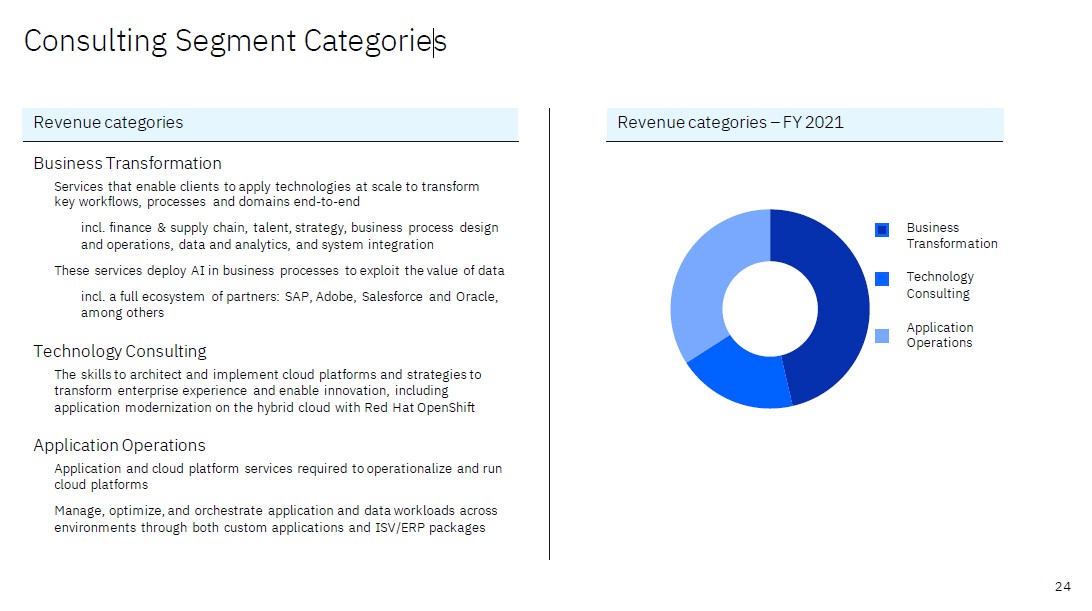
●Consulting (includes Business Transformation, Technology Consulting and Application Operations)— revenues of $4.8 billion, up 13.3 percent, up 17.4 percent at constant currency:

- Business Transformation up 15 percent, up 19 percent at constant currency

- Technology Consulting up 14 percent, up 19 percent at constant currency

- Application Operations up 10 percent, up 14 percent at constant currency

- Consulting segment hybrid cloud revenue up 24 percent, up 29 percent at constant currency

​

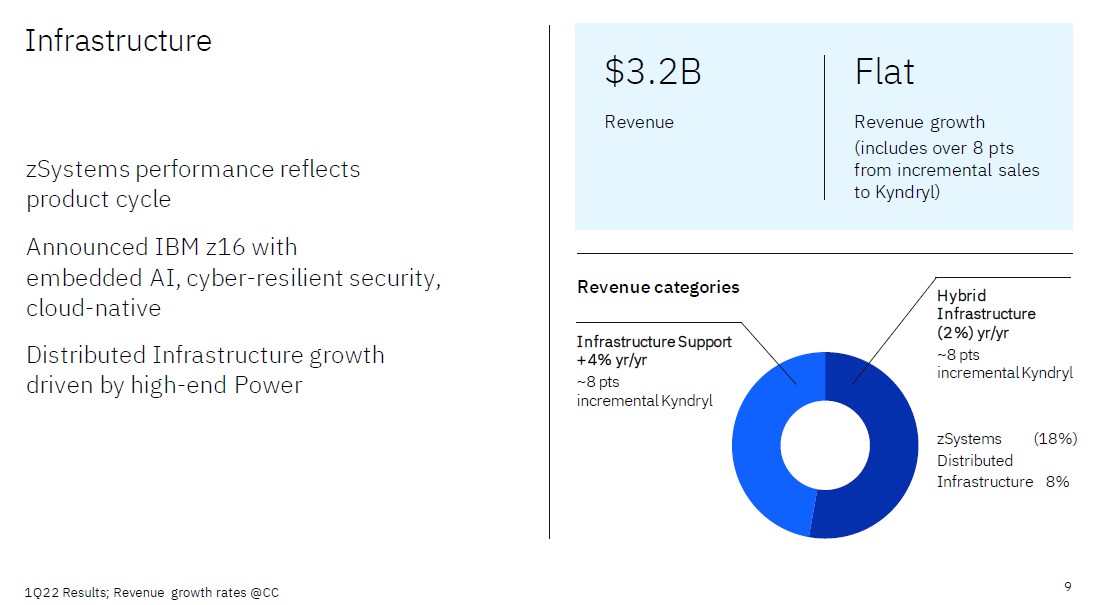
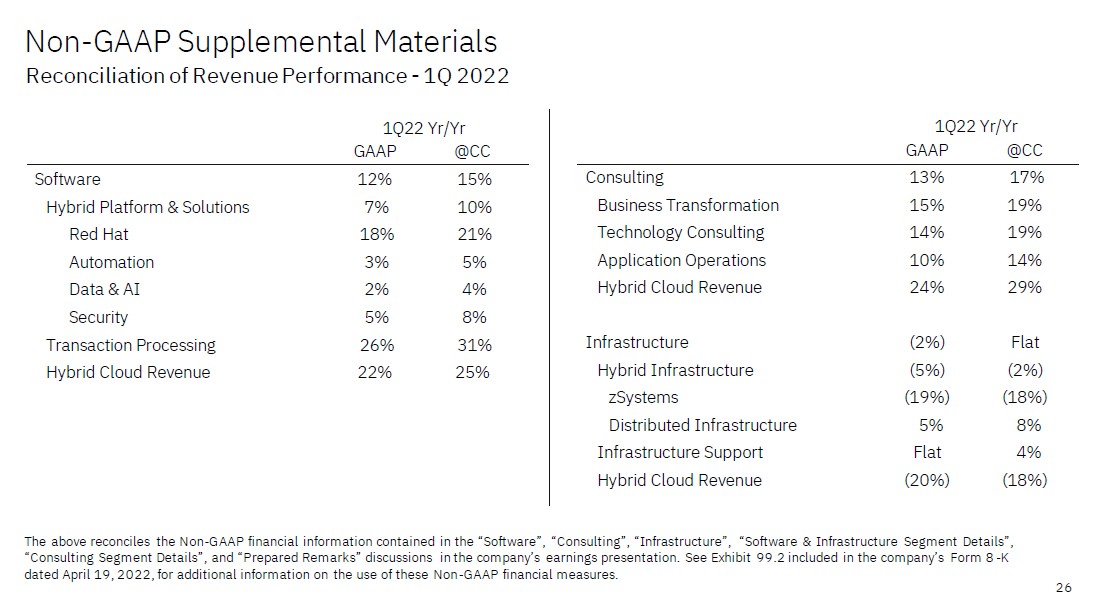
●Infrastructure (includes Hybrid Infrastructure, Infrastructure Support)— revenues of $3.2 billion, down 2.3 percent, up 0.3 percent at constant currency (over 8 points from incremental sales to Kyndryl):

- Hybrid Infrastructure down 5 percent, down 2 percent at constant currency (over 8 points from incremental sales to Kyndryl)

-- IBM z Systems down 19 percent, down 18 percent at constant currency

-- Distributed Infrastructure up 5 percent, up 8 percent at constant currency

- Infrastructure Support flat, up 4 percent at constant currency (over 8 points from incremental sales to Kyndryl)

- Infrastructure segment hybrid cloud revenue down 20 percent, down 18 percent at constant currency

​

●Financing (includes client and commercial financing)— revenues of $0.2 billion, down 26.2 percent, down 24.5 percent at constant currency

Cash Flow and Balance Sheet

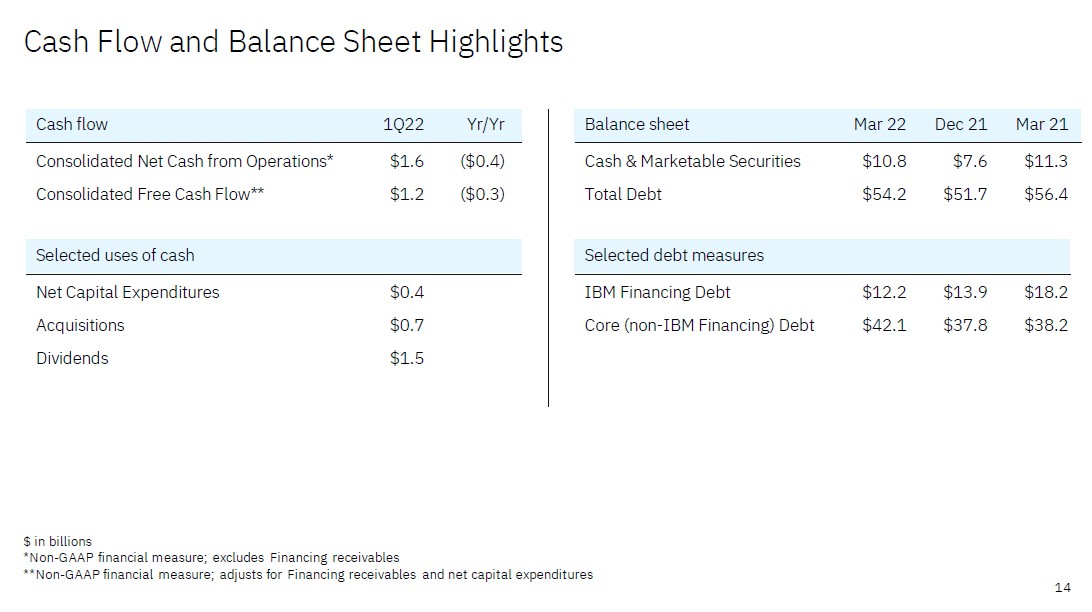
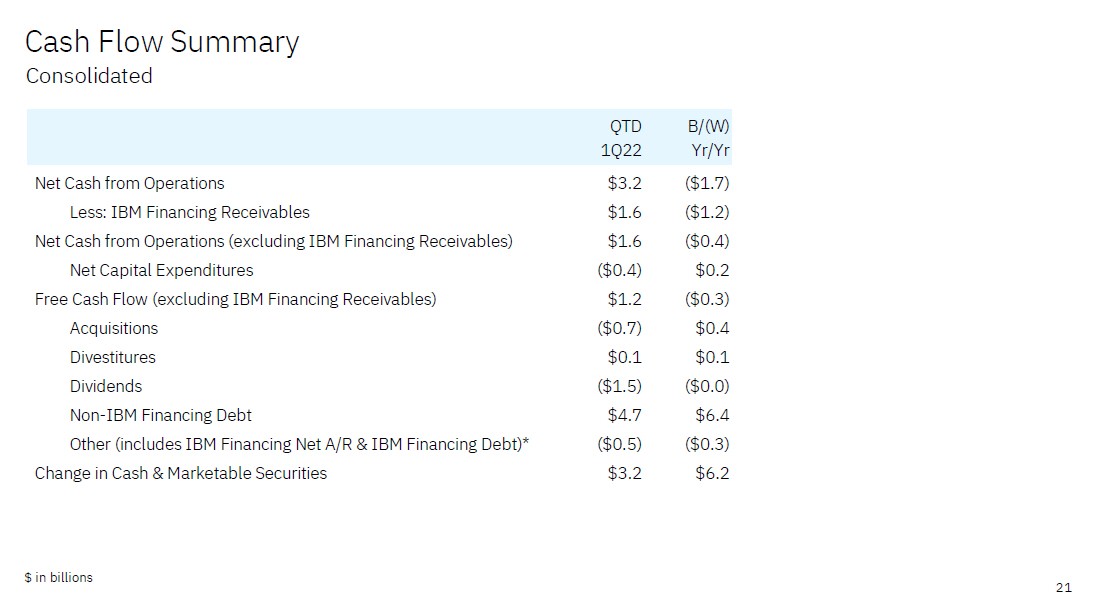
On a consolidated basis, in the first quarter, the company generated net cash from operating activities of $3.2 billion or $1.6 billion excluding IBM Financing receivables. IBM’s free cash flow was $1.2 billion, which includes cash impacts from the company’s structural actions initiated at the end of 2020.

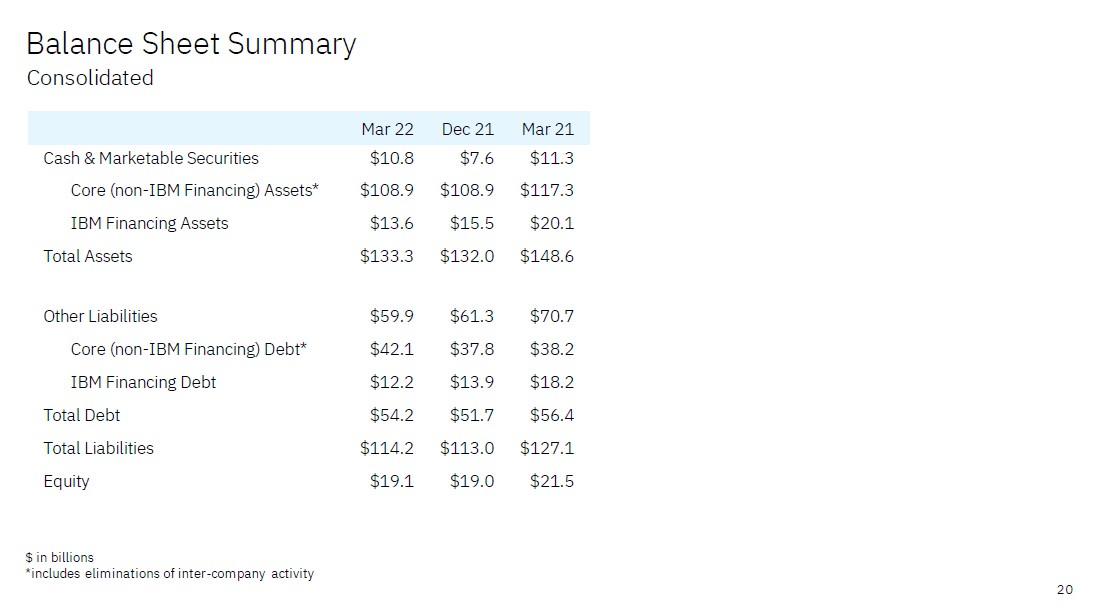
IBM ended the first quarter with $10.8 billion of cash on hand (which includes marketable securities), up $3.2 billion from year-end 2021. Debt, including IBM Financing debt of $12.2 billion, totaled $54.2 billion, up $2.5 billion since the end of 2021. The company returned $1.5 billion to shareholders in dividends in the first quarter.

​

Full-Year 2022 Expectations

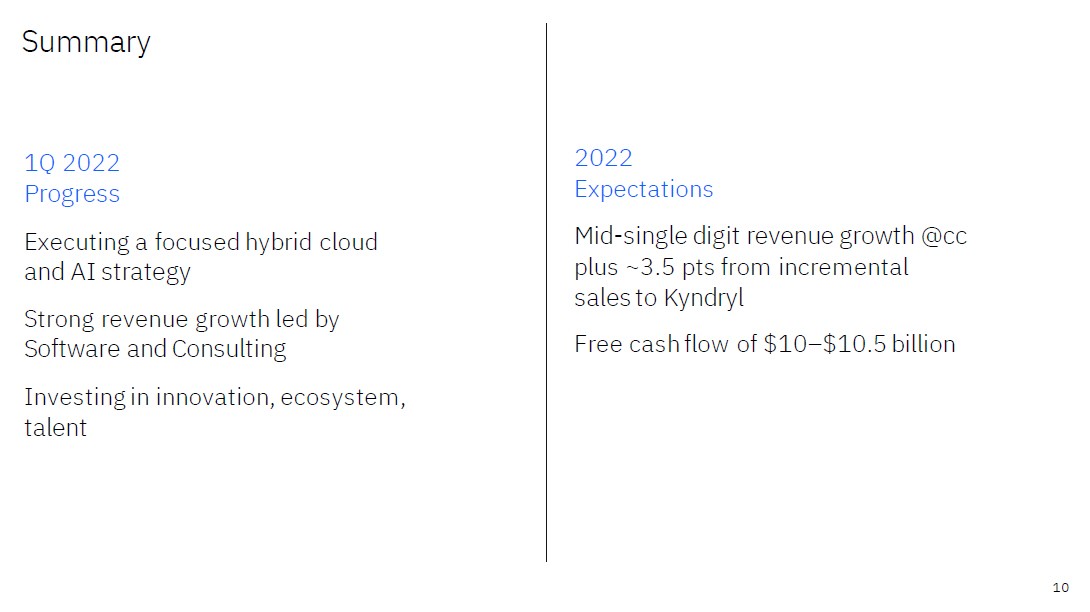
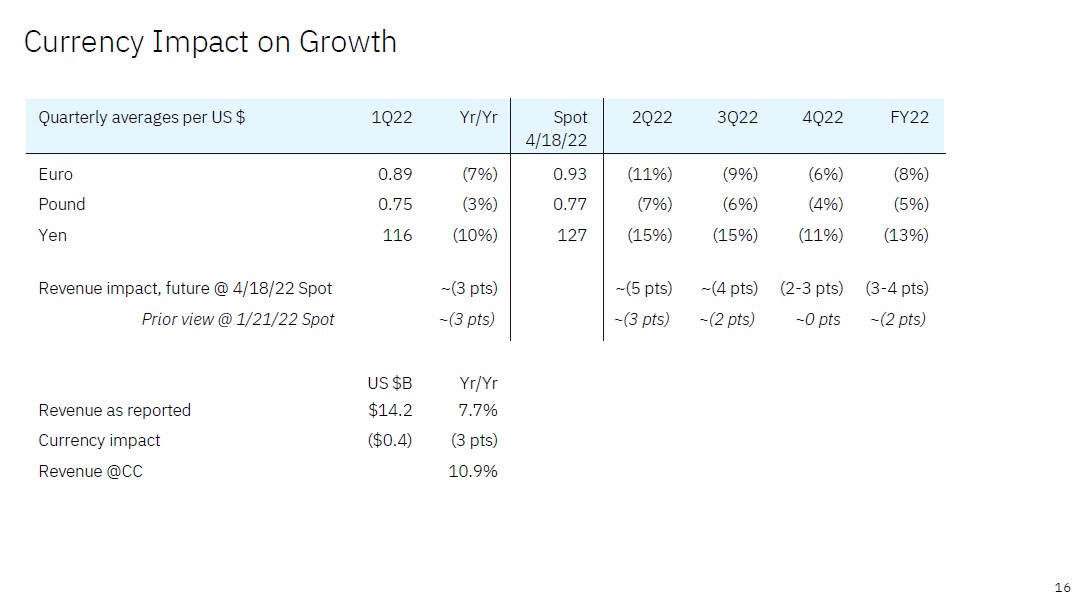
●Revenue growth: The company now expects constant currency revenue growth at the high end of the mid-single digit range. The company also expects an additional 3.5 point contribution from incremental sales to Kyndryl. At mid-April 2022 foreign exchange rates, currency is expected to be a three to four point headwind.
●Free Cash Flow: The company continues to expect $10 billion to $10.5 billion in consolidated free cash flow.

Forward-Looking and Cautionary Statements

Except for the historical information and discussions contained herein, statements contained in this release may constitute forward-looking statements within the meaning of the Private Securities Litigation Reform Act of 1995. Forward-looking statements are based on the company’s current assumptions regarding future business and financial performance. These statements involve a number of risks, uncertainties and other factors that could cause actual results to differ materially, including, but not limited to, the following: a downturn in economic environment and client spending budgets; a failure of the company’s innovation initiatives; damage to the company’s reputation;


risks from investing in growth opportunities; failure of the company’s intellectual property portfolio to prevent competitive offerings and the failure of the company to obtain necessary licenses; the company’s ability to successfully manage acquisitions, alliances and dispositions, including integration challenges, failure to achieve objectives, the assumption of liabilities, and higher debt levels; fluctuations in financial results; impact of local legal, economic, political, health and other conditions; the company’s failure to meet growth and productivity objectives; ineffective internal controls; the company’s use of accounting estimates; impairment of the company’s goodwill or amortizable intangible assets; the company’s ability to attract and retain key employees and its reliance on critical skills; impacts of relationships with critical suppliers; product quality issues; impacts of business with government clients; reliance on third party distribution channels and ecosystems; cybersecurity and data privacy considerations; adverse effects related to climate change and environmental matters, tax matters; legal proceedings and investigatory risks; the company’s pension plans; currency fluctuations and customer financing risks; impact of changes in market liquidity conditions and customer credit risk on receivables; potential failure of the separation of Kyndryl Holdings, Inc. to qualify for tax-free treatment; risk factors related to IBM securities; and other risks, uncertainties and factors discussed in the company’s Form 10-Qs, Form 10-K and in the company’s other filings with the U.S. Securities and Exchange Commission or in materials incorporated therein by reference. Any forward-looking statement in this release speaks only as of the date on which it is made. Except as required by law, the company assumes no obligation to update or revise any forward-looking statements.

Presentation of Information in this Press Release

On November 3, 2021, IBM completed the separation of Kyndryl. Unless otherwise specified, results are presented on a continuing operations basis.

In an effort to provide investors with additional information regarding the company’s results as determined by generally accepted accounting principles (GAAP), the company has also disclosed in this press release the following non-GAAP information, which management believes provides useful information to investors:

IBM results —

●adjusting for currency (i.e., at constant currency);
●presenting operating (non-GAAP) earnings per share amounts and related income statement items;
●consolidated free cash flow;
●consolidated cash from operating activities excluding IBM Financing receivables;

​

The rationale for management’s use of these non-GAAP measures is included in Exhibit 99.2 in the Form 8-K that includes this press release and is being submitted today to the SEC.

​

Conference Call and Webcast

IBM’s regular quarterly earnings conference call is scheduled to begin at 5:00 p.m. EDT, today. The Webcast may be accessed via a link at https://www.ibm.com/investor/events/earnings-1q22. Presentation charts will be available shortly before the Webcast.

Financial Results Below (certain amounts may not add due to use of rounded numbers; percentages presented are calculated from the underlying whole-dollar amounts).

​

​

Contact:

IBM

​

Sarah Meron, 347-891-1770

​

[email protected]

​

​

​

Tim Davidson, 914-844-7847

​

[email protected]

​

​


​

​

INTERNATIONAL BUSINESS MACHINES CORPORATION

COMPARATIVE FINANCIAL RESULTS

(Unaudited; Dollars in millions except per share amounts)

​

​

​

​

​

​

​

​

​

​

​

Three Months Ended


​

​

​

March 31, 


​

​


2022


2021*

​

​

REVENUE


​


​


​

​

Software

​

$

5,772

​

$

5,138

​

​

Consulting

​


4,829

​


4,262

​

​

Infrastructure

​


3,219

​


3,293

​

​

Financing

​


154

​


208

​

​

Other

​


224

​


284

​

​

TOTAL REVENUE

​


14,197

​


13,187

​

​

​

​

​

​

​

​

​

​

​

GROSS PROFIT

​


7,335

​


7,027

​

​

​

​

​

​

​

​

​

​

​

GROSS PROFIT MARGIN

​


​

​


​

​

​

Software

​


78.8

%


77.8

%

​

Consulting

​


24.3

%


27.8

%

​

Infrastructure

​


50.5

%


56.3

%

​

Financing

​


37.7

%


35.5

%

​

​

​

​

​

​

​

​

​

​

TOTAL GROSS PROFIT MARGIN

​


51.7

%  


53.3

%

​

​

​

​

​

​

​

​

​

​

EXPENSE AND OTHER INCOME

​


​

​


​

​

S,G&A

​


4,597

​


4,688

​

​

R,D&E

​


1,679

​


1,616

​

​

Intellectual property and custom development income

​


(121)

​


(146)

​

​

Other (income) and expense

​


246

​


346

​

​

Interest expense

​


311

​


280

​

​

TOTAL EXPENSE AND OTHER INCOME

​


6,712

​


6,784

​

​

​

​

​

​

​

​

​

​

​

INCOME/(LOSS) FROM CONTINUING OPERATIONS

​


​

​


​

​

​

BEFORE INCOME TAXES

​


623

​


244

​

​

Pre-tax margin

​


4.4

%  


1.8

%

​

Provision for/(Benefit from) income taxes

​


(39)

​


(160)

​

​

Effective tax rate

​


(6.3)

%  


(65.5)

%

​

​

​

​

​

​

​

​

​

​

INCOME FROM CONTINUING OPERATIONS

​

$

662

​

$

403

​

​

​

​

​

​

​

​

​

​

​

DISCONTINUED OPERATIONS

​


​

​


​

​

​

Income/(Loss) from discontinued operations, net of taxes

​


71

​


552

​

​

​

​

​

​

​

​

​

​

​

NET INCOME

​

$

733

​

$

955

​

​

​

​

​

​

​

​

​

​

​

EARNINGS/(LOSS) PER SHARE OF COMMON STOCK

​


​

​


​

​

Assuming Dilution

​


​

​


​

​

Continuing Operations

​

$

0.73

​

$

0.45

​

​

Discontinued Operations

​

$

0.08

​

$

0.61

​

​

TOTAL

​

$

0.81

​

$

1.06

​

​

​

​

​

​

​

​

​

​

​

Basic

​


​

​


​

​

​

Continuing Operations

​

$

0.74

​

$

0.45

​

​

Discontinued Operations

​

$

0.08

​

$

0.62

​

​

TOTAL

​

$

0.82

​

$

1.07

​

​

​

​

​

​

​

​

​

​

​

WEIGHTED-AVERAGE NUMBER OF COMMON SHARES OUTSTANDING (M’s)

​


​

​


​

​

​

Assuming Dilution

​


909.2

​


901.7

​

​

Basic

​


899.3

​


893.6

​

​


* Recast to conform with 2022 presentation.

​


INTERNATIONAL BUSINESS MACHINES CORPORATION

CONDENSED CONSOLIDATED BALANCE SHEET

(Unaudited)

​

​

​

​

​

​

​

​


At


At

​

​

March 31, 

​

December 31, 

(Dollars in Millions)

​

2022

​

2021

ASSETS:


​


​


Current Assets:


​


​


Cash and cash equivalents

​

$

9,934

​

$

6,650

Restricted cash

​


286

​


307

Marketable securities

​


550

​


600

Notes and accounts receivable - trade, net

​


5,963

​


6,754

Short-term financing receivables, net

​


7,169

​


8,014

Other accounts receivable, net

​


1,003

​


1,002

Inventories

​


1,776

​


1,649

Deferred costs

​


1,103

​


1,097

Prepaid expenses and other current assets

​


3,548

​


3,466

Total Current Assets

​


31,330

​


29,539

​

​

​

​

​

​

​

Property, plant and equipment, net

​


5,559

​


5,694

Operating right-of-use assets, net

​


3,108

​


3,222

Long-term financing receivables, net

​


4,610

​


5,425

Prepaid pension assets

​


9,995

​


9,850

Deferred costs

​


916

​


924

Deferred taxes

​


7,567

​


7,370

Goodwill

​


56,106

​


55,643

Intangibles, net

​

​

12,312

​

​

12,511

Investments and sundry assets

​


1,771

​


1,823

Total Assets

​

$

133,275

​

$

132,001

​

​

​

​

​

​

​

LIABILITIES:

​


​


Current Liabilities:

​


​


Taxes

​

$

1,798

​

$

2,289

Short-term debt

​


7,690

​


6,787

Accounts payable

​


3,453

​


3,955

Deferred income

​


13,526

​


12,518

Operating lease liabilities

​


954

​


974

Other liabilities

​


6,635

​


7,097

Total Current Liabilities

​


34,056

​


33,619

​

​

​

​

​

​

​

Long-term debt

​


46,545

​


44,917

Retirement related obligations

​


13,937

​


14,435

Deferred income

​


3,423

​


3,577

Operating lease liabilities

​


2,358

​


2,462

Other liabilities

​


13,844

​


13,996

Total Liabilities

​


114,162

​


113,005

​

​

​

​

​

​

​

EQUITY:

​


​

​


​

IBM Stockholders’ Equity:

​


​

​


​

Common stock

​


57,603

​


57,319

Retained earnings

​


153,401

​


154,209

Treasury stock — at cost

​


(169,422)

​


(169,392)

Accumulated other comprehensive income/(loss)

​


(22,532)

​


(23,234)

Total IBM Stockholders’ Equity

​


19,050

​


18,901

​

​

​

​

​

​

​

Noncontrolling interests

​


62

​


95

Total Equity

​


19,112

​


18,996

​

​

​

​

​

​

​

Total Liabilities and Equity

​

$

133,275

​

$

132,001

​


INTERNATIONAL BUSINESS MACHINES CORPORATION

CASH FLOW ANALYSIS

(Unaudited)

​

​

​

​

​

​

​

​

​

​

​

​

​

​

​

​

​

Three Months Ended

​

​

March 31, 

(Dollars in Millions)

​

2022


2021

Consolidated Net Cash from Operations per GAAP

​

$

3,248

​

$

4,914

​

​

​

​

​

​

​

Less: change in IBM Financing receivables

​


1,631

​

​

2,863

Capital Expenditures, net

​


(378)

​

​

(529)

​

​

​

​

​

​

​

Consolidated Free Cash Flow

​


1,240

​

​

1,522

​

​

​

​

​

​

​

Acquisitions

​


(698)

​

​

(1,120)

Divestitures

​


61

​

​

(15)

Dividends

​


(1,475)

​

​

(1,457)

Non-Financing Debt

​


4,675

​

​

(1,725)

Other (includes IBM Financing net receivables and debt)

​


(590)

​

​

(207)

​

​

​

​

​

​

​

Change in Cash, Cash Equivalents, Restricted Cash and Short-term Marketable Securities*

​

$

3,213

​

$

(3,002)


* Cash flows are presented on a consolidated basis.

​

​

​


INTERNATIONAL BUSINESS MACHINES CORPORATION

CASH FLOW

(Unaudited)

​

​

​

​

​

​

​

​

​

​

Three Months Ended

​

​

​

March 31, 

​

(Dollars in Millions)

​

2022


2021


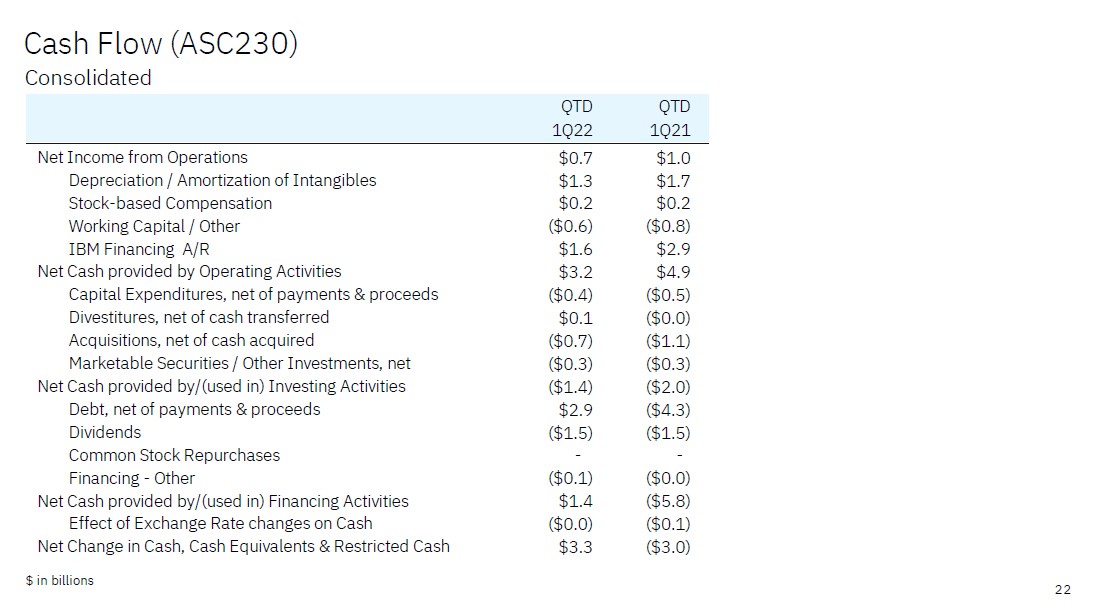
Net Income from Operations

​

$

733

​

$

955

​

Depreciation/Amortization of Intangibles

​


1,257

​


1,672

​

Stock-based Compensation

​


234

​


213

​

Working Capital / Other

​


(606)

​


(789)

​

IBM Financing A/R

​


1,631

​


2,863

​

Net Cash Provided by Operating Activities

​

$

3,248

​

$

4,914

​

Capital Expenditures, net of payments & proceeds

​


(378)

​


(529)

​

Divestitures, net of cash transferred

​


61

​


(15)

​

Acquisitions, net of cash acquired

​


(698)

​


(1,120)

​

Marketable Securities / Other Investments, net

​


(344)

​


(335)

​

Net Cash Provided by/(Used in) Investing Activities

​

$

(1,358)

​

$

(2,000)

​

Debt, net of payments & proceeds

​


2,948

​


(4,299)

​

Dividends

​


(1,475)

​


(1,457)

​

Financing - Other

​


(95)

​


(26)

​

Net Cash Provided by/(Used in) Financing Activities

​

$

1,377

​

$

(5,783)

​

Effect of Exchange Rate changes on Cash

​


(5)

​


(134)

​

Net Change in Cash, Cash Equivalents and Restricted Cash*

​

$

3,263

​

$

(3,002)

​


* Cash flows are presented on a consolidated basis.

​


INTERNATIONAL BUSINESS MACHINES CORPORATION

SEGMENT DATA

(Unaudited)

​

​

​

​

​

​

​

​

​

​

​

​

​

​

​

​

Three Months Ended March 31, 2022


​


​

​

​

​

​

​

​

​


(Dollars in Millions)

​

Software

​

Consulting

​

Infrastructure

​

Financing


Revenue

​

$

5,772

​

$

4,829

​

$

3,219

​

$

154

​

Pre-tax Income/(Loss) from Continuing Operations

​


1,134

​


348

​


199

​


84

​

Pre-tax Margin

​


19.7

%  


7.2

%  


6.2

%  


54.6

%

Change YTY Revenue

​


12.3

%  


13.3

%  


(2.3)

%  


(26.2)

%

Change YTY Revenue - constant currency

​


15.4

%  


17.4

%  


0.3

%  


(24.5)

%

​

​

​

​

​

​

​

​

​

​

​

​

​

​

​

​

​

​

Three Months Ended March 31, 2021*


​


​

​

​

​

​

​

​

​


(Dollars in Millions)

​

Software

​

Consulting

​

Infrastructure

​

Financing


Revenue

​

$

5,138

​

$

4,262

​

$

3,293

​

$

208

​

Pre-tax Income/(Loss) from Continuing Operations

​


658

​


277

​


292

​


98

​

Pre-tax Margin

​


12.8

%  


6.5

%  


8.9

%  


47.0

%


* Recast to conform with 2022 presentation.

​

​

​

​

​

​


INTERNATIONAL BUSINESS MACHINES CORPORATION

U.S. GAAP TO OPERATING (Non-GAAP) RESULTS RECONCILIATION

(Unaudited; Dollars in millions except per share amounts)

​

​

​

​

​

​

​

​

​

​

​

​

​

​

​

​

​

​

​

​

​

​

Three Months Ended March 31, 2022


​

​

Continuing Operations


​


​

​


Acquisition-


Retirement-


Tax


Kyndryl-


​

​


​

​

​

​

​

Related

​

Related

​

Reform

​

Related

​

Operating


​

​

GAAP

​

Adjustments (1)

​

Adjustments (2)

​

Impacts

​

Impacts (3)

​

(Non-GAAP)


Gross Profit

​

$

7,335

​

$

181

​

$

—

​

$

—

​

$

—

​

$

7,516

​

Gross Profit Margin

​


51.7

%  


1.3

pts.  

​

—

pts.  

​

—

pts.  

​

—

pts.


52.9

%

S,G&A

​

$

4,597

​

$

(286)

​

$

—

​

$

—

​

$

(0)

​

$

4,311

​

Other (Income) & Expense

​


246

​


(1)

​

​

(202)

​

​

—

​

​

(222)

​


(179)

​

Total Expense & Other (Income)

​


6,712

​


(287)

​

​

(202)

​

​

—

​

​

(222)

​


6,001

​

Pre-tax Income from Continuing Operations

​


623

​


468

​

​

202

​

​

—

​

​

222

​


1,515

​

Pre-tax Income Margin from Continuing Operations

​


4.4

%  


3.3

pts.  

​

1.4

pts.  

​

—

pts.  

​

1.6

pts.


10.7

%

Provision for/(Benefit from) Income Taxes (4)

​

$

(39)

​

$

109

​

$

58

​

$

116

​

$

—

​

$

244

​

Effective Tax Rate

​


(6.3)

%  


9.1

pts.  

​

4.6

pts.  

​

7.7

pts.  

​

0.9

pts.


16.1

%

Income from Continuing Operations

​

$

662

​

$

359

​

$

144

​

$

(116)

​

$

222

​

$

1,271

​

Income Margin from Continuing Operations

​


4.7

%  


2.5

pts.  

​

1.0

pts.  

​

(0.8)

pts.  

​

1.6

pts.


9.0

%

Diluted Earnings/(Loss) Per Share: Continuing Operations

​

$

0.73

​

$

0.39

​

$

0.16

​

$

(0.13)

​

$

0.24

​

$

1.40

​

​

​

​

​

​

​

​

​

​

​

​

​

​

​

​

​

​

​

​

​

​

​

​

​

​

Three Months Ended March 31, 2021

​

​

​

Continuing Operations

​

​


​

​


Acquisition-


Retirement-


Tax

​

Kyndryl-

​

​


​

​

​

​

​

​

Related

​

Related

​

Reform

​

Related

​

Operating

​

​

​

GAAP

​

Adjustments (1)

​

Adjustments (2)

​

Impacts

​

Impacts (3)


(Non-GAAP)

​

Gross Profit

​

$

7,027

​

$

174

​

$

—

​

$

—

​

$

—

​

$

7,201

​

Gross Profit Margin

​


53.3

%  


1.3

pts.  

​

—

pts.  

​

—

pts.  

​

—

pts.


54.6

%

S,G&A

​

$

4,688

​

$

(288)

​

$

—

​

$

—

​

$

—

​

$

4,399

​

Other (Income) & Expense

​


346

​


(1)

​

​

(332)

​

​

—

​

​

—

​


13

​

Total Expense & Other (Income)

​


6,784

​


(289)

​

​

(332)

​

​

—

​

​

—

​


6,162

​

Pre-tax Income/(Loss) from Continuing Operations

​


244

​


463

​

​

332

​

​

—

​

​

—

​


1,039

​

Pre-tax Income Margin from Continuing Operations

​


1.8

%  


3.5

pts.  

​

2.5

pts.  

​

—

pts.  

​

—

pts.


7.9

%

Provision for/(Benefit from) Income Taxes (4)

​

$

(160)

​

$

132

​

$

33

​

$

19

​

$

—

​

$

25

​

Effective Tax Rate

​


(65.5)

%  


41.9

pts.  

​

24.2

pts.  

​

1.8

pts.  

​

—

pts.


2.4

%

Income from Continuing Operations

​

$

403

​

$

330

​

$

299

​

$

(19)

​

$

—

​

$

1,013

​

Income Margin from Continuing Operations

​


3.1

%  


2.5

pts.  

​

2.3

pts.  

​

(0.1)

pts.  

​

—

pts.


7.7

%

Diluted Earnings/(Loss) Per Share: Continuing Operations

​

$

0.45

​

$

0.37

​

$

0.33

​

$

(0.02)

​

$

—

​

$

1.12

​


(1)  Includes amortization of purchased intangible assets, in process R&D, transaction costs, applicable restructuring and related expenses, tax charges related to acquisition integration and pre-closing charges, such as financing costs.

(2)  Includes amortization of prior service costs, interest cost, expected return on plan assets, amortized actuarial gains/losses, the impacts of any plan curtailments/settlements and pension insolvency costs and other costs.

(3) Primarily relates to fair value changes in shares of Kyndryl common stock that were retained by IBM.

(4)  Tax impact on operating (non-GAAP) pre-tax income from continuing operations is calculated under the same accounting principles applied to the As Reported pre-tax income under ASC 740, which employs an annual effective tax rate method to the results.


Exhibit 99.2

​

Non-GAAP Financial Information

​

Operating (non-GAAP) Earnings Per Share and Related Income Statement Items

​

In an effort to provide better transparency into the operational results of the business, supplementally, the company separates business results into operating and non-operating categories. Operating earnings from continuing operations is a non-GAAP measure that excludes the effects of certain acquisition-related charges, intangible asset amortization, expense resulting from basis differences on equity method investments, retirement-related costs, certain impacts from the Kyndryl separation and their related tax impacts. Due to the unique, non-recurring nature of the enactment of the U.S. Tax Cuts and Jobs Act (U.S. tax reform), the company characterizes the one-time provisional charge recorded in the fourth quarter of 2017 and adjustments to that charge as non-operating. Adjustments include true-ups, accounting elections and any changes to regulations, laws, audit adjustments, etc. that affect the recorded one-time charge. Management also characterizes direct and incremental charges incurred related to the Kyndryl separation as non-operating given their unique and non-recurring nature. These charges primarily relate to any unrealized gains or losses on Kyndryl common stock which are recorded in other (income) and expense in the Consolidated Income Statement as non-operating. The unrealized gains or losses reflect fair value changes in the shares that were retained by the company immediately following the separation, with the intent to dispose of such shares within twelve months after the distribution. For acquisitions, operating (non-GAAP) earnings exclude the amortization of purchased intangible assets and acquisition-related charges such as in-process research and development, transaction costs, applicable retention, restructuring and related expenses, tax charges related to acquisition integration and pre-closing charges, such as financing costs. These charges are excluded as they may be inconsistent in amount and timing from period to period and are significantly impacted by the size, type and frequency of the company’s acquisitions. All other spending for acquired companies is included in both earnings from continuing operations and in operating (non-GAAP) earnings. For retirement-related costs, the company characterizes certain items as operating and others as non-operating, consistent with GAAP. The company includes defined benefit plan and nonpension postretirement benefit plan service costs, multi-employer plan costs and the cost of defined contribution plans in operating earnings. Non-operating retirement-related costs include defined benefit plan and nonpension postretirement benefit plan amortization of prior service costs, interest cost, expected return on plan assets, amortized actuarial gains/losses, the impacts of any plan curtailments/settlements and pension insolvency costs and other costs. Non-operating retirement-related costs are primarily related to changes in pension plan assets and liabilities which are tied to financial market performance, and the company considers these costs to be outside of the operational performance of the business.


Overall, the company believes that supplementally providing investors with a view of operating earnings as described above provides increased transparency and clarity into both the operational results of the business and the performance of the company’s pension plans; improves visibility to management decisions and their impacts on operational performance; enables better comparison to peer companies; and allows the company to provide a long-term strategic view of the business going forward. In addition, these non-GAAP measures provide a perspective consistent with areas of interest the company routinely receives from investors and analysts. The company’s reportable segment financial results reflect pre-tax operating earnings from continuing operations, consistent with the company’s management and measurement system.

​

Consolidated Free Cash Flow

The company uses free cash flow as a measure to evaluate its operating results, plan shareholder return levels, strategic investments and assess its ability and need to incur and service debt. The entire free cash flow amount is not necessarily available for discretionary expenditures. The company defines consolidated free cash flow as consolidated net cash from operating activities less the change in Financing receivables and net capital expenditures, including the investment in software. A key objective of the Financing business is to generate strong returns on equity, and our Financing receivables are the basis for growth. Accordingly, management considers Financing receivables as a profit-generating investment, not as working capital that should be minimized for efficiency. Therefore, management presents free cash flow excluding the effect of Financing receivables. Consolidated free cash flow guidance is derived using an estimate of profit, working capital and operational cash flows. Since the company views Financing receivables as a profit-generating investment which it seeks to maximize, it is not considered when formulating guidance for free cash flow. As a result, the company does not estimate a GAAP consolidated net cash from operations expectation metric.

Constant Currency

​

When the company refers to growth rates at constant currency or adjusts such growth rates for currency, it is done so that certain financial results can be viewed without the impact of fluctuations in foreign currency exchange rates, thereby facilitating period-to-period comparisons of its business performance. Financial results adjusted for currency


are calculated by translating current period activity in local currency using the comparable prior year period’s currency conversion rate. This approach is used for countries where the functional currency is the local currency. Generally, when the dollar either strengthens or weakens against other currencies, the growth at constant currency rates or adjusting for currency will be higher or lower than growth reported at actual exchange rates.


Exhibit 99.3

​

Graphic

IBM 10 2022 Earnings April19, 2022 ibm.com/investor 1

​

​


Graphic

Forward-looking Statements and Non-GAAP Information Certain comments made in this presentation may be characterized as forward looking under the Private Securities Litigation Reform Act of 1995. Forward-looking statements are based on the company’s current assumptions regarding future business and financial performance. Those statements by their nature address matters that are uncertain to different degrees. Those statements involve a number of factors that could cause actual results to differ materially. Additional information concerning these factors is contained in the Company’s filings with the SEC. Copies are available from the SEC, from the IBM website, or from IBM Investor Relations. Any forward-looking statement made during this presentation speaks only as of the date on which it is made. The company assumes no obligation to update or revise any forward-looking statements except as required by law; these charts and the associated remarks and comments are integrally related and are intended to be presented and understood together. including operating earnings and other “operating” financial measures, consolidated free cash flow, net cash from operating activities excluding IBM Financing receivables, and adjustments for currency. The rationale for management’s use of this non-GAAP information is included as Exhibit 99.2 to the company’s Form 8-K submitted to the SEC on April 19, 2022. The reconciliation of non-GAAP information to GAAP is included on the slides entitled “Non-GAAP Supplemental Materials” in this presentation, as well as in Exhibit 99.1 to the company’s Form 8-K submitted to the SEC on April 19, 2022. To provide better transparency, the company also discusses management performance metrics including hybrid cloud revenue, annual recurring revenue, signings, and book-to-bill. The metrics are used to monitor the performance of the business and are viewed as useful decision-making information for management and stakeholders. The rationale for management’s use of these performance metrics and their calculation are included in the Management Discussion section of the company’s 2021 Annual Report, which is Exhibit 13 to the Form 10-K submitted with the SEC on February 22, 2022. For other related information please visit the Company’s investor relations website at: Unless otherwise specified, results are presented on a continuing operations basis. In an effort to provide additional and useful information regarding the company’s financial results and other financial information as determined by generally accepted accounting principles (GAAP), the company also discusses, in its earnings press release and presentation materials, certain non-GAAP information https://www.ibm.com/investor/events/earning s-1q22 2

​

​


Graphic

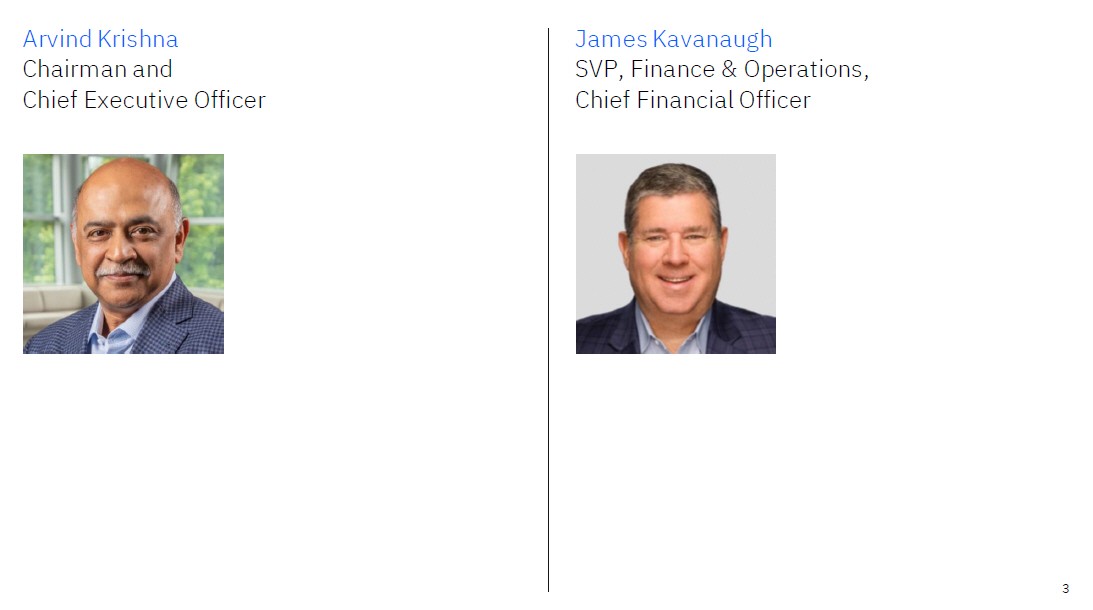
Arvind Krishna Chairman and Chief Executive Officer James Kavanaugh SVP, Finance & Operations, Chief FinancialOfficer 3

​

​


Graphic

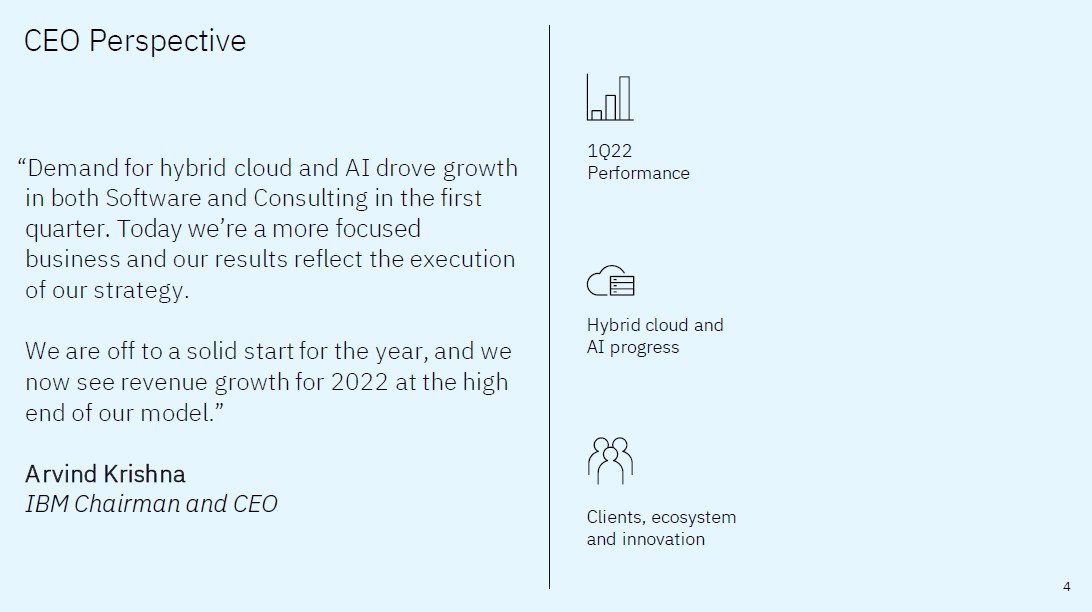
CEO Perspective 1Q22 Performance “Demand for hybrid cloud and AI drove growth in both Software and Consulting in the first quarter. Today we’re a more focused business and our results reflect the execution of our strategy. Hybrid cloud and AI progress We are off to a solid start for the year, and we now see revenue growth for 2022 at the high end of our model.” A rvind Krishna IBM Chairman and CEO Clients, ecosystem and innovation 4

​

​


Graphic

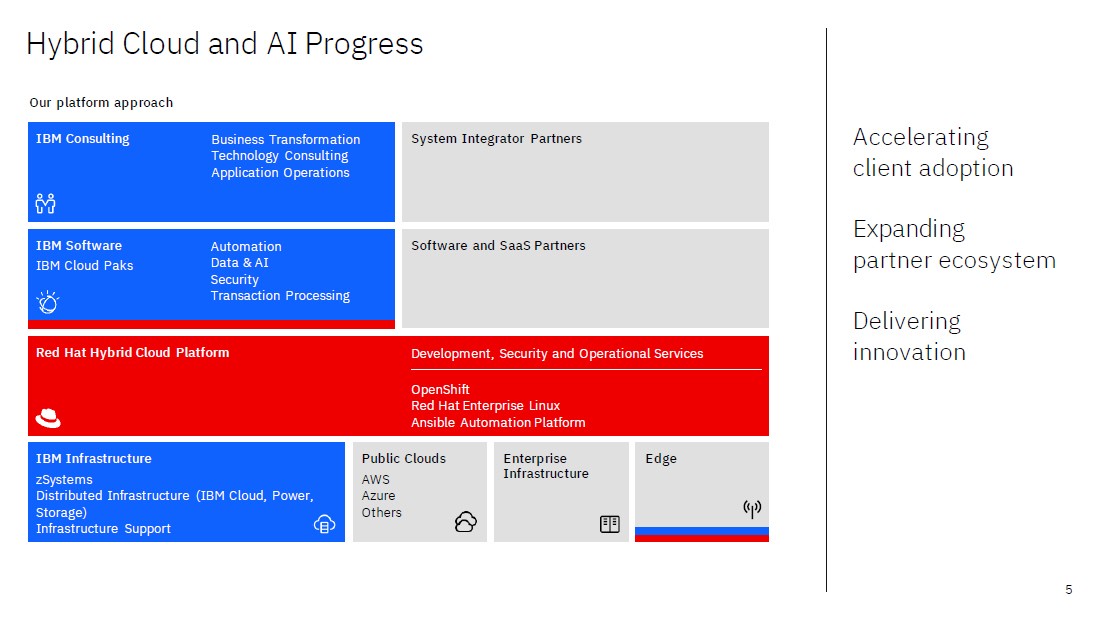
Hybrid Cloud and AI Progress Our platform approach Accelerating client adoption Expanding partner ecosystem Delivering innovation 5 Edge IBM Infrastructure zSystems Distributed Infrastructure (IBM Cloud, Power, Storage) Infrastructure Support Enterprise Infrastructure Public Clouds AWS Azure Others Red Hat Hybrid Cloud PlatformDevelopment, Security and Operational Services OpenShift Red Hat Enterprise Linux Ansible Automation Platform IBM Software Automation IBM Cloud PaksData & AI Security Transaction Processing Software and SaaS Partners System Integrator Partners IBM Consulting Business Transformation Technology Consulting Application Operations

​

​


Graphic

Financial Highlights 1Q22 11% Revenue growth incl. over 5 pts from incremental sales to Kyndryl 280bps Pre-tax margin expansion (Operating) >70% Revenue mix in software and consulting $10.8B Cash on hand, incl marketable securities “In the first quarter we continued to strengthen the fundamentals of our business, consistent with our medium-term model. $20.8B Hybrid cloud revenue (TTM), +17% yr/yr We are a faster growing, more profitable company with a higher-value business mix, a significant recurring revenue base and strong cash generation.” Ja mes Kavanaugh IBM SVP & CFO 6 Revenue growth rates @CC $14.2B $1.2B RevenueFree Cash Flow

​

​


Graphic

Software Pervasive revenue growth across Hybrid Platform & Solutions Over 4,000 clients using hybrid cloud platform Annual Recurring Revenue* +9% yr/yr Revenue categories Hybrid Platform & Solutions + 10% yr/yr ~1.5 pts incremental Kyndryl Tr ansaction Processing + 31% yr/yr ~28 pts incremental Kyndryl Red Hat Automation Data & AI Security 21% 5% 4% 8% 1Q22 Results; Revenue growth rates @CC *Annual Recurring Revenue for Hybrid Platform & Solutions 7 $5.8B +15% RevenueRevenue growth (includes over 8 pts from incremental sales to Kyndryl)

​

​


Graphic

Consulting Double-digit revenue growth across all revenue categories and geographies Hybrid cloud and strategic partnerships fueling growth Book-to-bill ratio of 1.1 for the quarter and past year Competitive labor environment Revenue categories Business Tr ansformation + 19% yr/yr Application Operations + 14% yr/yr Technology C onsulting + 19% yr/yr 8 1Q22 Results; Revenue growth rates @CC $4.8B +17% RevenueRevenue growth

​

​


Graphic

Infrastructure zSystems performance reflects product cycle Announced IBM z16 with embedded AI, cyber-resilient security, cloud-native Distributed Infrastructure growth driven by high-end Power Revenue categories Hybrid Infrastructure (2 %) yr/yr ~8 pts incremental Kyndryl I nfrastructure Support + 4% yr/yr ~8 pts incremental Kyndryl zSystems Distributed (18%) Infrastructure 8% 9 1Q22 Results; Revenue growth rates @CC $3.2B Flat RevenueRevenue growth (includes over 8 pts from incremental sales to Kyndryl)

​

​


Graphic

Summary 2022 Expectations Mid-single digit revenue growth @cc plus ~3.5 pts from incremental sales to Kyndryl Free cash flow of $10–$10.5 billion 1Q 2022 Progress Executing a focused hybrid cloud and AI strategy Strong revenue growth led by Software and Consulting Investing in innovation, ecosystem, talent 10

​

​


Graphic

ibm.com/investor .----- -_---.-·---- - ----_.._

​

​


Graphic

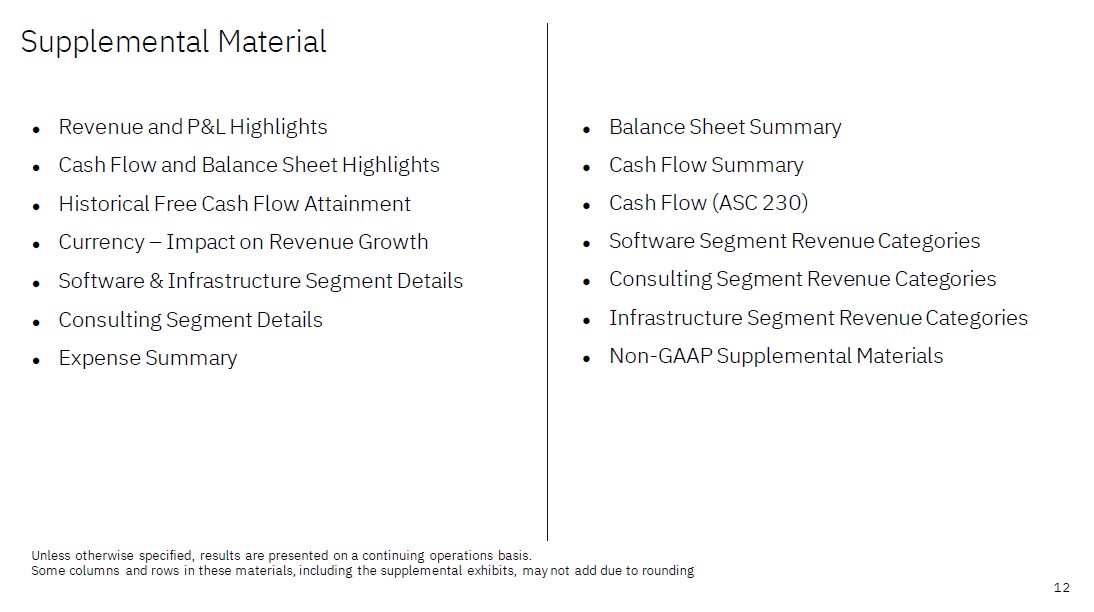
Supplemental Material Revenue and P&L Highlights Cash Flow and Balance Sheet Highlights Historical Free Cash Flow Attainment Currency – Impact on Revenue Growth Software & Infrastructure Segment Details Consulting Segment Details Expense Summary Balance Sheet Summary Cash Flow Summary Cash Flow (ASC 230) Software Segment Revenue Categories Consulting Segment Revenue Categories Infrastructure Segment Revenue Categories Non-GAAP Supplemental Materials ● ● ● ● ● ● ● ● ● ● ● ● ● ● Unless otherwise specified, results are presented on a continuing operations basis. Some columns and rows in these materials, including the supplemental exhibits, may not add due to rounding 12

​

​


Graphic

Revenue and P&L Highlights Revenue Hybrid Cloud $14.2 $5.0 11% 17% > 5 pts ~ 2 pts Gross Profit Expense Pre-Tax Income Net Income Earnings Per Share $7.5 $6.0 $1.5 $1.3 $1.40 4% 3% 46% 25% 25% ~ 4 pts ~ 7 pts ~ 6 pts Gross Profit Margin Expense E/R Pre-Tax Income Margin Net Income Margin Tax Rate 52.9% 42.3% 10.7% 9.0% 16.1% (1.7 pts) 4.5 pts 2.8 pts 1.3 pts (13.6 pts) Americas Europe/ME/Africa Asia Pacific $7.1 $4.2 $2.9 9% 14% 11% Revenue growth rates @CC, $ in billions 13 Operating P&L highlights % 1Q22 B/(W) Yr/Yr Geography revenue1Q22 B/(W)incr. KD Yr/Yrbenefit Operating P&L highlights $ 1Q22 B/(W) Yr/Yr Revenue highlights 1Q22 B/(W)incr. KD Yr/Yrbenefit

​

​


Graphic

Cash Flow and Balance Sheet Highlights Consolidated Net Cash from Operations* Consolidated Free Cash Flow** $1.6 $1.2 ($0.4) ($0.3) Cash & Marketable Securities Total Debt $10.8 $54.2 $7.6 $51.7 $11.3 $56.4 Net Capital Expenditures Acquisitions Dividends $0.4 $0.7 $1.5 IBM Financing Debt Core (non-IBM Financing) Debt $12.2 $42.1 $13.9 $37.8 $18.2 $38.2 $ in billions *Non-GAAP financial measure; excludes Financing receivables **Non-GAAP financial measure; adjusts for Financing receivables and net capital expenditures 14 Selected debt measures Selected uses of cash Balance sheet Mar 22 Dec 21 Mar 21 Cash flow 1Q22 Yr/Yr

​

​


Graphic

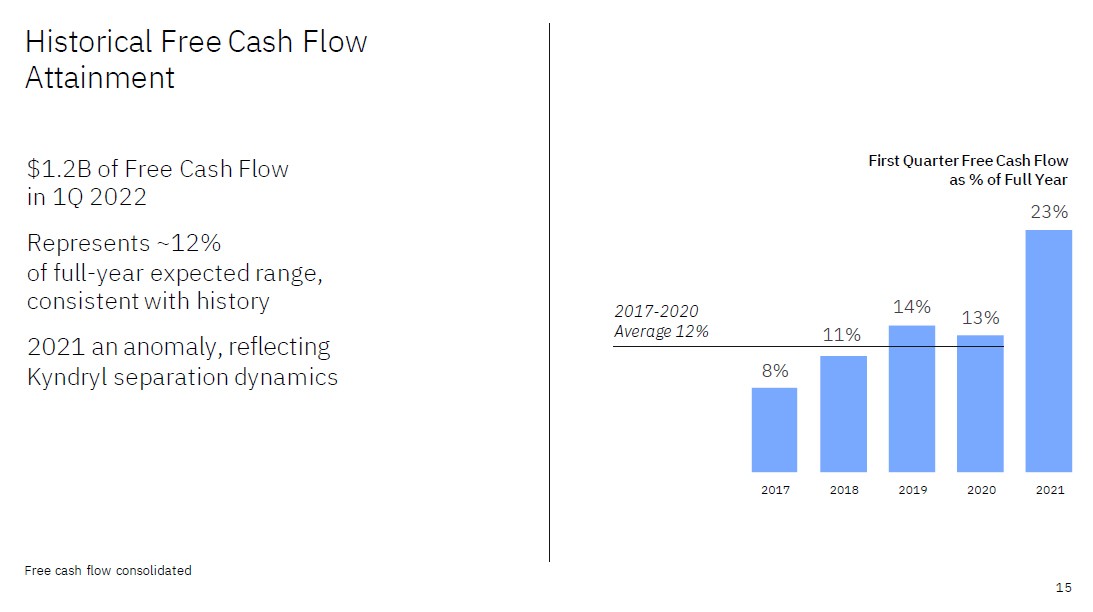
Historical Free Cash Attainment Flow First Quarter Free Cash Flow as % of Full Year 23% $1.2B of Free Cash Flow in 1Q 2022 Represents ~12% of full-year expected range, consistent with history 2021 an anomaly, reflecting Kyndryl separation dynamics 14% 2017-2020 13% 2017 2018 2019 2020 2021 Free cash flow consolidated 15 Average 12% 11% 8%

​

​


Graphic

Currency Impact on Growth US $B $14.2 ($0.4) Yr/Yr 7.7% (3 pts) 10.9% Revenue as reported Currency impact Revenue @CC 16 Quarterly averages per US $ 1Q22 Yr/Yr Spot 4/18/22 2Q22 3Q22 4Q22 FY22 Euro 0.89 (7%) Pound 0.75 (3%) Yen 116 (10%) Revenue impact, future @ 4/18/22 Spot ~(3 pts) Prior view @ 1/21/22 Spot~(3 pts) 0.93 0.77 127 (11%) (9%) (6%) (8%) (7%) (6%) (4%) (5%) (15%) (15%) (11%) (13%) ~(5 pts) ~(4 pts) (2-3 pts) (3-4 pts) ~(3 pts)~(2 pts)~0 pts~(2 pts)

​

​


Graphic

Software & Infrastructure Segment Details Includes incremental sales to Kyndryl Revenue Hybrid Platform & Solutions Transaction Processing Pre-Tax Income Pre-Tax Income Margin $5.8 $4.1 $1.7 $1.1 19.7% 15% 10% 31% 72% 6.8 pts Revenue Hybrid Infrastructure zSystems Distributed Infrastructure Infrastructure Support Pre-Tax Income Pre-Tax Income Margin $3.2 $1.7 Flat (2%) (18%) 8% 4% (32%) (2.7 pts) $1.5 $0.2 6.2% Hybrid Cloud Revenue $2.1 25% Annual Recurring Revenue* $12.9 9% Hybrid Cloud Revenue $0.7 (18%) Revenue and Annual Recurring Revenue growth rates @CC, $ in billions *Annual Recurring Revenue for Hybrid Platform & Solutions 17 Infrastructure segment 1Q22 B/(W) Yr/Yr Software segment 1Q22 B/(W) Yr/Yr

​

​


Graphic

Consulting Segment Details Revenue Business Transformation Technology Consulting Application Operations Gross Profit Margin (External) Pre-Tax Income Pre-Tax Income Margin $4.8 $2.3 $1.0 $1.6 24.3% $0.3 7.2% 17% 19% 19% 14% (3.5 pts) 26% 0.7 pts Hybrid Cloud Revenue $2.1 29% Signings Book-to-bill ratio 41% $5.1 1.1 Revenue and signings growth rates @CC, $ in billions 18 Consulting segment 1Q22 B/(W) Yr/Yr

​

​


Graphic

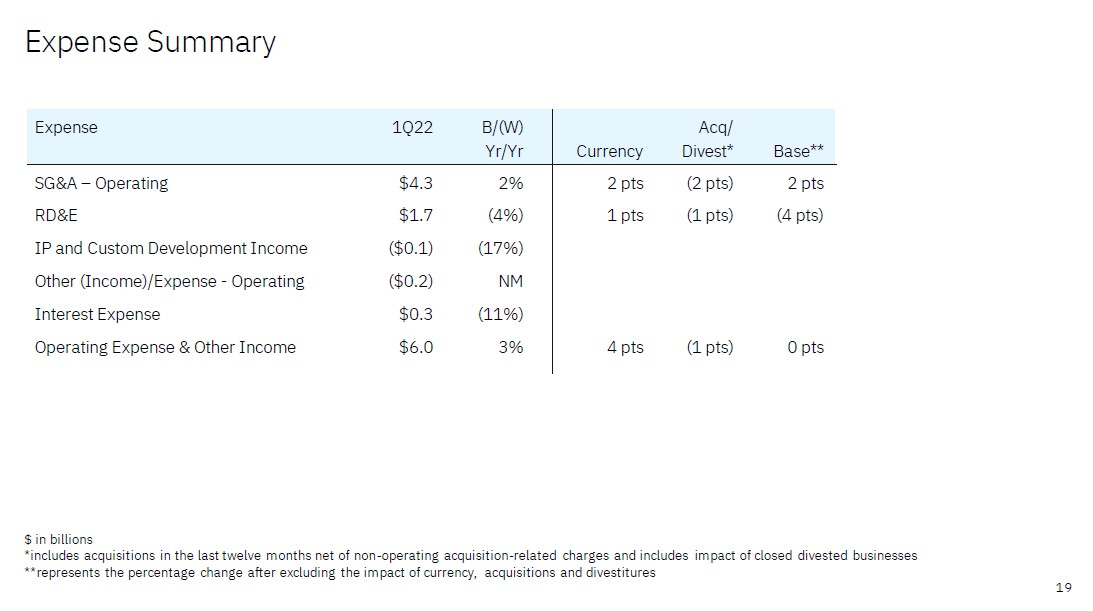
Expense Summary $ in billions *includes acquisitions in the last twelve months net of non-operating acquisition-related charges and includes impact of closed divested businesses **represents the percentage change after excluding the impact of currency, acquisitions and divestitures 19 Expense1Q22 B/(W) Yr/Yr Acq/ CurrencyDivest*Base** SG&A – Operating $4.3 2% RD&E $1.7 (4%) IP and Custom Development Income ($0.1) (17%) Other (Income)/Expense - Operating ($0.2) NM Interest Expense $0.3 (11%) Operating Expense & Other Income $6.0 3% 2 pts (2 pts) 2 pts 1 pts (1 pts) (4 pts) 4 pts (1 pts) 0 pts

​

​


Graphic

Balance Sheet Summary Consolidated Cash & Marketable Securities Core (non-IBM Financing) Assets* IBM Financing Assets Total Assets $10.8 $108.9 $13.6 $133.3 $7.6 $108.9 $15.5 $132.0 $11.3 $117.3 $20.1 $148.6 Other Liabilities Core (non-IBM Financing) Debt* IBM Financing Debt Total Debt Total Liabilities Equity $59.9 $42.1 $12.2 $54.2 $114.2 $19.1 $61.3 $37.8 $13.9 $51.7 $113.0 $19.0 $70.7 $38.2 $18.2 $56.4 $127.1 $21.5 $ in billions *includes eliminations of inter-company activity 20 Mar 22 Dec 21 Mar 21

​

​


Graphic

Cash Flow Summary Consolidated Net Cash from Operations Less: IBM Financing Receivables Net Cash from Operations (excluding IBM Financing Receivables) Net Capital Expenditures Free Cash Flow (excluding IBM Financing Receivables) Acquisitions Divestitures Dividends Non-IBM Financing Debt Other (includes IBM Financing Net A/R & IBM Financing Debt)* Change in Cash & Marketable Securities $3.2 $1.6 $1.6 ($0.4) $1.2 ($0.7) $0.1 ($1.5) $4.7 ($0.5) $3.2 ($1.7) ($1.2) ($0.4) $0.2 ($0.3) $0.4 $0.1 ($0.0) $6.4 ($0.3) $6.2 $ in billions 21 QTDB/(W) 1Q22Yr/Yr

​

​


Graphic

Cash Flow (ASC230) Consolidated Net Income from Operations Depreciation / Amortization of Intangibles Stock-based Compensation Working Capital / Other IBM Financing A/R Net Cash provided by Operating Activities Capital Expenditures, net of payments & proceeds Divestitures, net of cash transferred Acquisitions, net of cash acquired Marketable Securities / Other Investments, net Net Cash provided by/(used in) Investing Activities Debt, net of payments & proceeds Dividends Common Stock Repurchases Financing - Other Net Cash provided by/(used in) Financing Activities Effect of Exchange Rate changes on Cash Net Change in Cash, Cash Equivalents & Restricted Cash $0.7 $1.3 $0.2 ($0.6) $1.6 $3.2 ($0.4) $0.1 ($0.7) ($0.3) ($1.4) $2.9 ($1.5) - ($0.1) $1.4 ($0.0) $3.3 $1.0 $1.7 $0.2 ($0.8) $2.9 $4.9 ($0.5) ($0.0) ($1.1) ($0.3) ($2.0) ($4.3) ($1.5) - ($0.0) ($5.8) ($0.1) ($3.0) $ in billions 22 QTDQTD 1Q221Q21

​

​


Graphic

Software Segment Categories Hybrid Platform & Solutions Software, infused with AI, to help clients operate, manage, and optimize their IT resources and business processes within hybrid, multi -cloud environments Red Hat: incl. RHEL, OpenShift, Ansible Automation: incl. business automation, AIOps and management, integration, and application servers Data & AI: incl. data fabric, customer care, data management, business analytics, dataops & governance, asset & supply chain management, information exchange and weather Security: incl. software and services for threat, data and identity Hybrid Platform & Solutions Red Hat Transaction Processing Automation Security Data & AI Transaction Processing Software that supports clients’ mission-critical on-premise workloads in industries such as banking, airlines and retail incl. transaction processing software such as Customer Information Control System and storage software, and analytics and integration software running on IBM operating systems (e.g., DB2 and WebSphere running on z/OS) 23 Revenue categories – FY 2021 Revenue categories

​

​


Graphic

Consulting Segment Categories Business Transformation Services that enable clients to apply technologies at scale to transform key workflows, processes and domains end-to-end incl. finance & supply chain, talent, strategy, business process design and operations, data and analytics, and system integration These services deploy AI in business processes to exploit the value of data incl. a full ecosystem of partners: SAP, Adobe, Salesforce and Oracle, among others Business Transformation Technology Consulting Application Operations Technology Consulting The skills to architect and implement cloud platforms and strategies to transform enterprise experience and enable innovation, including application modernization on the hybrid cloud with Red Hat OpenShift Application Operations Application and cloud platform services required to operationalize and run cloud platforms Manage, optimize, and orchestrate application and data workloads across environments through both custom applications and ISV/ERP packages 24 Revenue categories – FY 2021 Revenue categories

​

​


Graphic

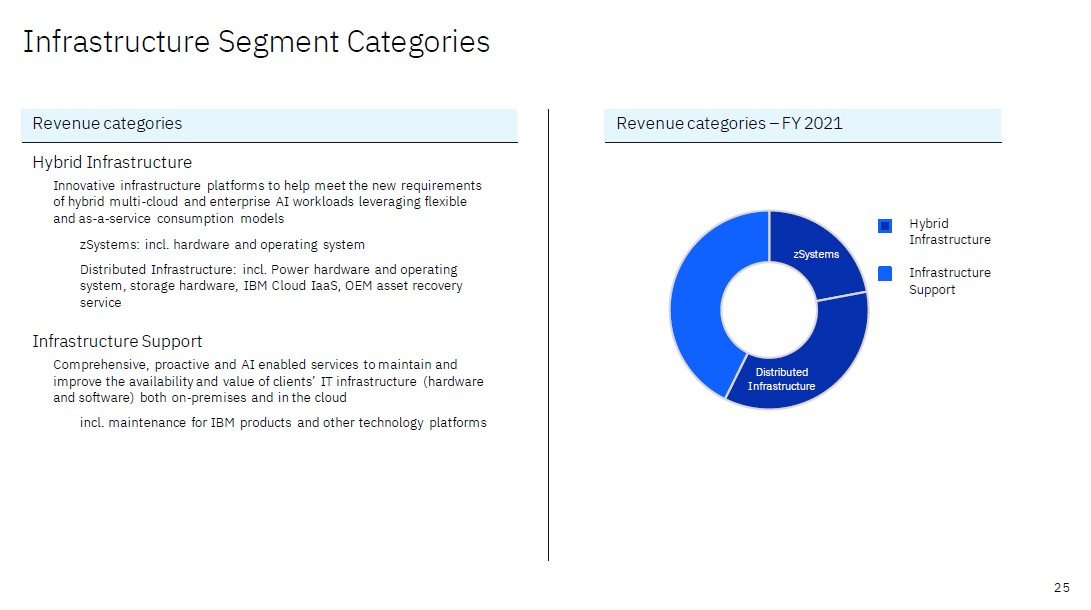
Infrastructure Segment Categories Hybrid Infrastructure Innovative infrastructure platforms to help meet the new requirements of hybrid multi-cloud and enterprise AI workloads leveraging flexible and as-a-service consumption models zSystems: incl. hardware and operating system Distributed Infrastructure: incl. Power hardware and operating system, storage hardware, IBM Cloud IaaS, OEM asset recovery service Hybrid Infrastructure zSystems Infrastructure Support Infrastructure Support Comprehensive, proactive and AI enabled services to maintain and improve the availability and value of clients’ IT infrastructure (hardware and software) both on-premises and in the cloud incl. maintenance for IBM products and other technology platforms Di tributed Infr structure 25 Revenue categories – FY 2021 Revenue categories

​

​


Graphic

Non-GAAP Supplemental Materials Reconciliation of Revenue Performance - 1Q 2022 1Q22 Yr/Yr 1Q22 Yr/Yr GAAP @CC GAAP @CC Consulting Business Transformation Technology Consulting Application Operations Hybrid Cloud Revenue 13% 15% 14% 10% 24% 17% 19% 19% 14% 29% Software Hybrid Platform & Solutions Red Hat Automation Data & AI Security Transaction Processing Hybrid Cloud Revenue 12% 7% 18% 3% 2% 5% 26% 22% 15% 10% 21% 5% 4% 8% 31% 25% Infrastructure Hybrid Infrastructure zSystems Distributed Infrastructure Infrastructure Support Hybrid Cloud Revenue (2%) (5%) (19%) 5% Flat (20%) Flat (2%) (18%) 8% 4% (18%) The above reconciles the Non-GAAP financial information contained in the “Software”, “Consulting”, “Infrastructure”, “Software & Infrastructure Segment Details”, “Consulting Segment Details”, and “Prepared Remarks” discussions in the company’s earnings presentation. See Exhibit 99.2 included in the company’s Form 8 -K dated April 19, 2022, for additional information on the use of these Non-GAAP financial measures. 26

​

​


Graphic

Non-GAAP Supplemental Materials Reconciliation of Revenue Performance - 1Q 2022 1Q22 Yr/Yr GAAP @CC Total Revenue 8% 11% Americas Europe/ME/Africa Asia Pacific 9% 8% 5% 9% 14% 11% Total Hybrid Cloud 14% 17% The above reconciles the Non-GAAP financial information contained in the “Financial Highlights”, “Revenue and P&L Highlights”, a nd “Prepared Remarks” discussions in the company’s earnings presentation. See Exhibit 99.2 included in the company’s Form 8 -K dated April 19, 2022, for additional information on the use of these Non-GAAP financial measures 27

​

​


Graphic

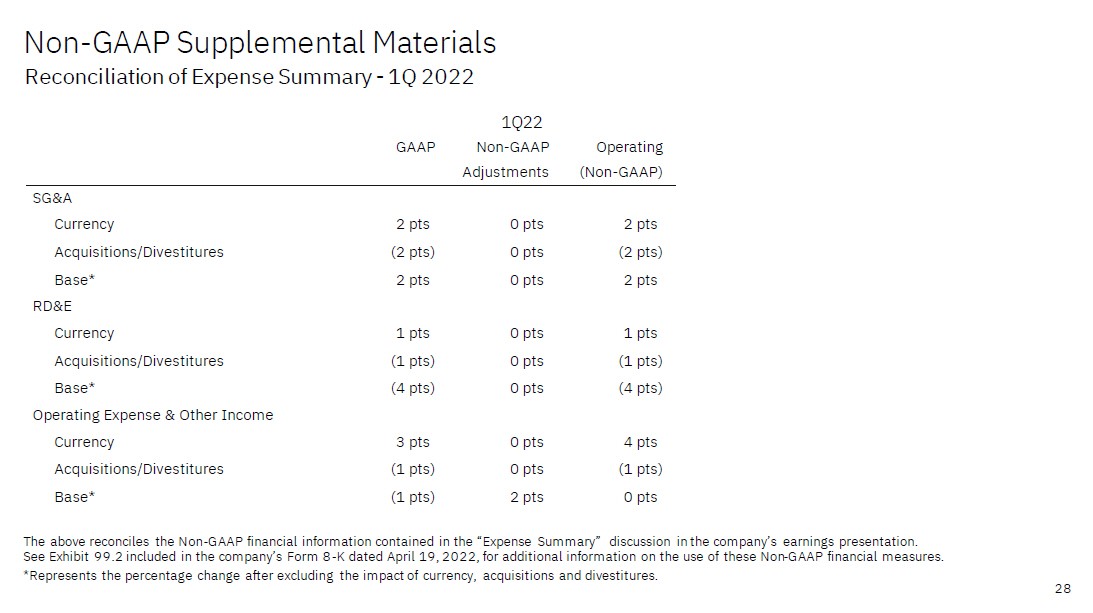
Non-GAAP Supplemental Materials Reconciliation of Expense Summary - 1Q 2022 1Q22 Non-GAAP Adjustments GAAP Operating (Non-GAAP) SG&A Currency Acquisitions/Divestitures Base* RD&E Currency Acquisitions/Divestitures Base* Operating Expense & Other Income Currency Acquisitions/Divestitures Base* 2 pts (2 pts) 2 pts 0 pts 0 pts 0 pts 2 pts (2 pts) 2 pts 1 pts (1 pts) (4 pts) 0 pts 0 pts 0 pts 1 pts (1 pts) (4 pts) 3 pts (1 pts) (1 pts) 0 pts 0 pts 2 pts 4 pts (1 pts) 0 pts The above reconciles the Non-GAAP financial information contained in the “Expense Summary” discussion in the company’s earnings presentation. See Exhibit 99.2 included in the company’s Form 8 -K dated April 19, 2022, for additional information on the use of these Non-GAAP financial measures. *Represents the percentage change after excluding the impact of currency, acquisitions and divestitures. 28

​

​


Graphic

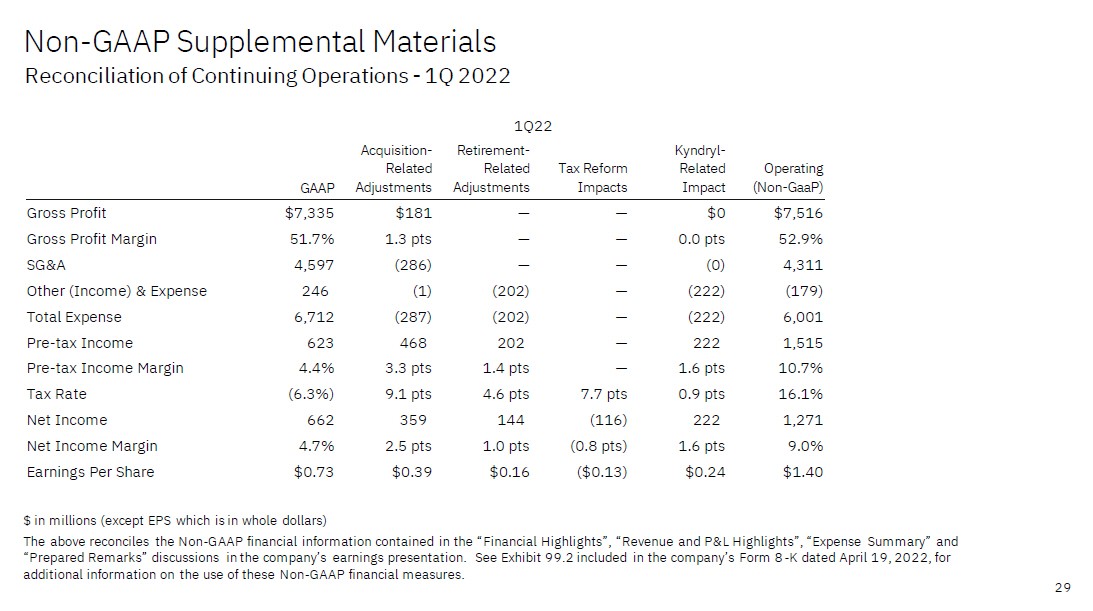
Non-GAAP Supplemental Materials Reconciliation of Continuing Operations - 1Q 2022 1Q22 Retirement-Related Adjustments Acquisition-Related Adjustments Kyndryl-Related Impact Tax Reform Impacts Operating (Non-GaaP) GAAP Gross Profit Gross Profit Margin SG&A Other (Income) & Expense Total Expense Pre-tax Income Pre-tax Income Margin Tax Rate Net Income Net Income Margin Earnings Per Share $7,335 51.7% 4,597 246 6,712 623 4.4% (6.3%) 662 4.7% $0.73 $181 1.3 pts (286) (1) (287) 468 3.3 pts 9.1 pts 359 2.5 pts $0.39 — — — (202) (202) 202 1.4 pts 4.6 pts 144 1.0 pts $0.16 — — — — — — — 7.7 pts (116) (0.8 pts) ($0.13) $0 0.0 pts (0) (222) (222) 222 1.6 pts 0.9 pts 222 1.6 pts $0.24 $7,516 52.9% 4,311 (179) 6,001 1,515 10.7% 16.1% 1,271 9.0% $1.40 $ in millions (except EPS which is in whole dollars) The above reconciles the Non-GAAP financial information contained in the “Financial Highlights”, “Revenue and P&L Highlights”, “Expense Summary” and “Prepared Remarks” discussions in the company’s earnings presentation. See Exhibit 99.2 included in the company’s Form 8 -K dated April 19, 2022, for additional information on the use of these Non-GAAP financial measures. 29

​

​


Graphic

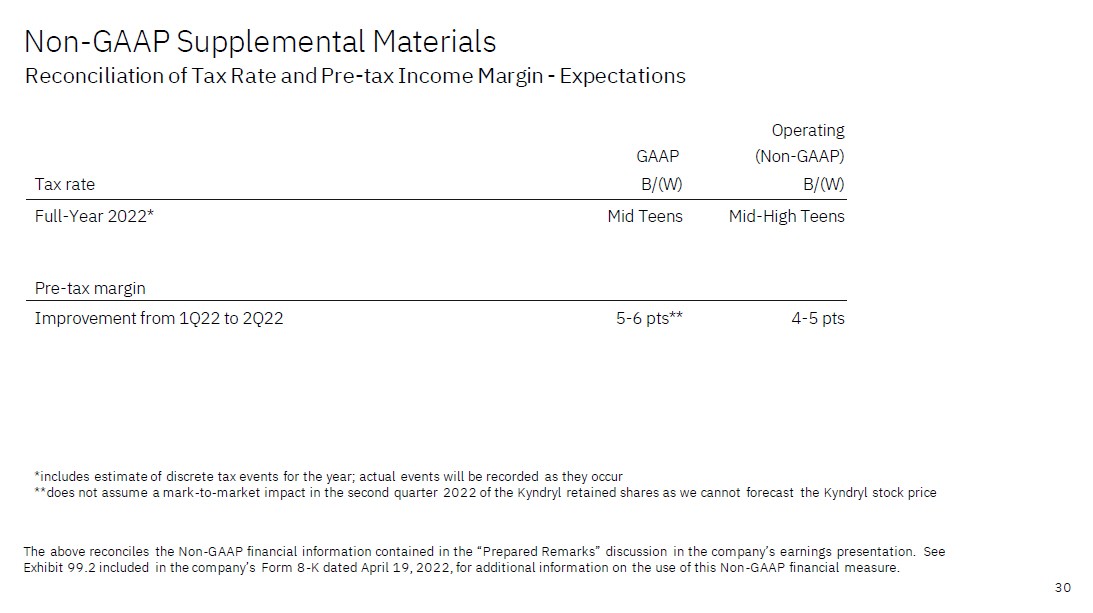
Non-GAAP Supplemental Materials Reconciliation of Tax Rate and Pre-tax Income Margin - Expectations Operating (Non-GAAP) B/(W) GAAP B/(W) Tax rate Full-Year 2022* Mid Teens Mid-High Teens Pre-tax margin Improvement from 1Q22 to 2Q22 5-6 pts** 4-5 pts *includes estimate of discrete tax events for the year; actual events will be recorded as they occur **does not assume a mark-to-market impact in the second quarter 2022 of the Kyndryl retained shares as we cannot forecast the Kyndryl stock price The above reconciles the Non-GAAP financial information contained in the “Prepared Remarks” discussion in the company’s earnings presentation. See Exhibit 99.2 included in the company’s Form 8 -K dated April 19, 2022, for additional information on the use of this Non-GAAP financial measure. 30

​

​


Graphic

ibm.com/investor .----- -_---.-·---- - ----_.._

​