i3 VERTICALS REPORTS FIRST QUARTER 2026 FINANCIAL RESULTS
Completes Acquisition of Motor Vehicle Insurance Verification Software Company
NASHVILLE, Tenn. (February 5, 2026) – i3 Verticals, Inc. (Nasdaq: IIIV) (“i3 Verticals” or the “Company”) today reported its financial results for the fiscal first quarter ended December 31, 2025.
Highlights from continuing operations1 for the three months ended December 31, 2025 vs. 2024
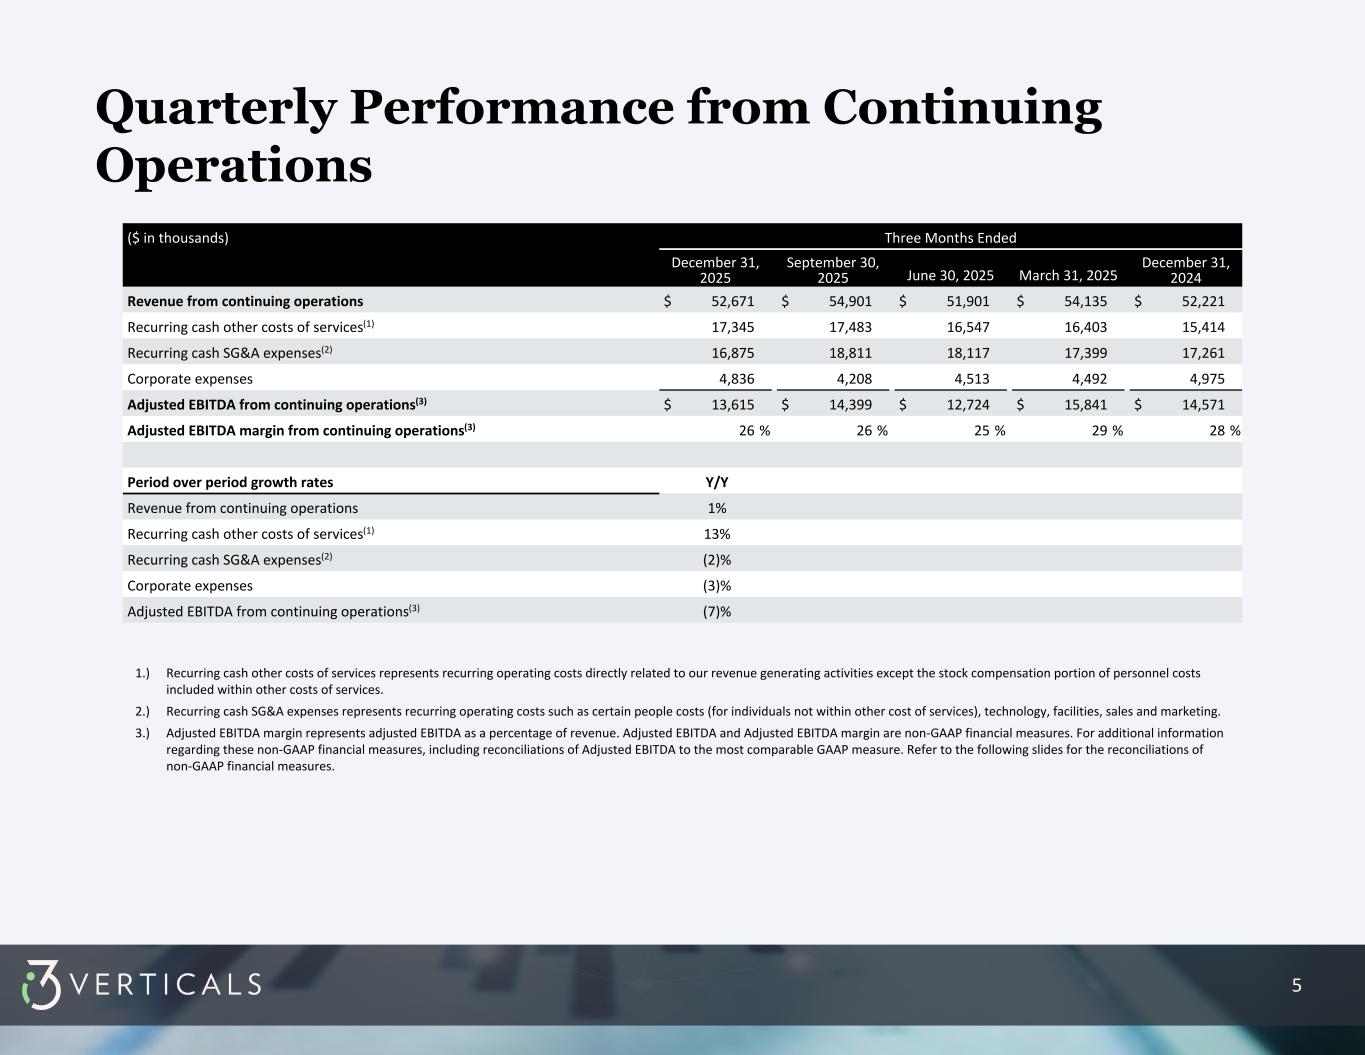
•Revenue from continuing operations was $52.7 million, an increase of 0.9% over the prior year's first quarter.
•Net income from continuing operations1 was $1.1 million, compared to net income from continuing operations1 of $2.8 million in the prior year's first quarter.
•Net income from continuing operations attributable to i3 Verticals, Inc.1 was $0.6 million, compared to net income from continuing operations attributable to i3 Verticals, Inc.1 of $1.9 million in the prior year's first quarter.
•Adjusted EBITDA from continuing operations1,2 was $13.6 million as compared to $14.6 million in the prior year's first quarter.
•Adjusted EBITDA from continuing operations1,2 as a percentage of revenue was 25.8%, compared to 27.9% in the prior year's first quarter.
•Diluted net income per share attributable to Class A common stock from continuing operations1,3 was $0.02, compared to diluted net income per share attributable to Class A common stock from continuing operations1,3 of $0.08 in the prior year's first quarter.
•Adjusted diluted earnings per share from continuing operations1,2,3, which gives effect to the Company's 25% estimated long-term effective tax rate4, was $0.26 compared to $0.27 for the prior year's first quarter.
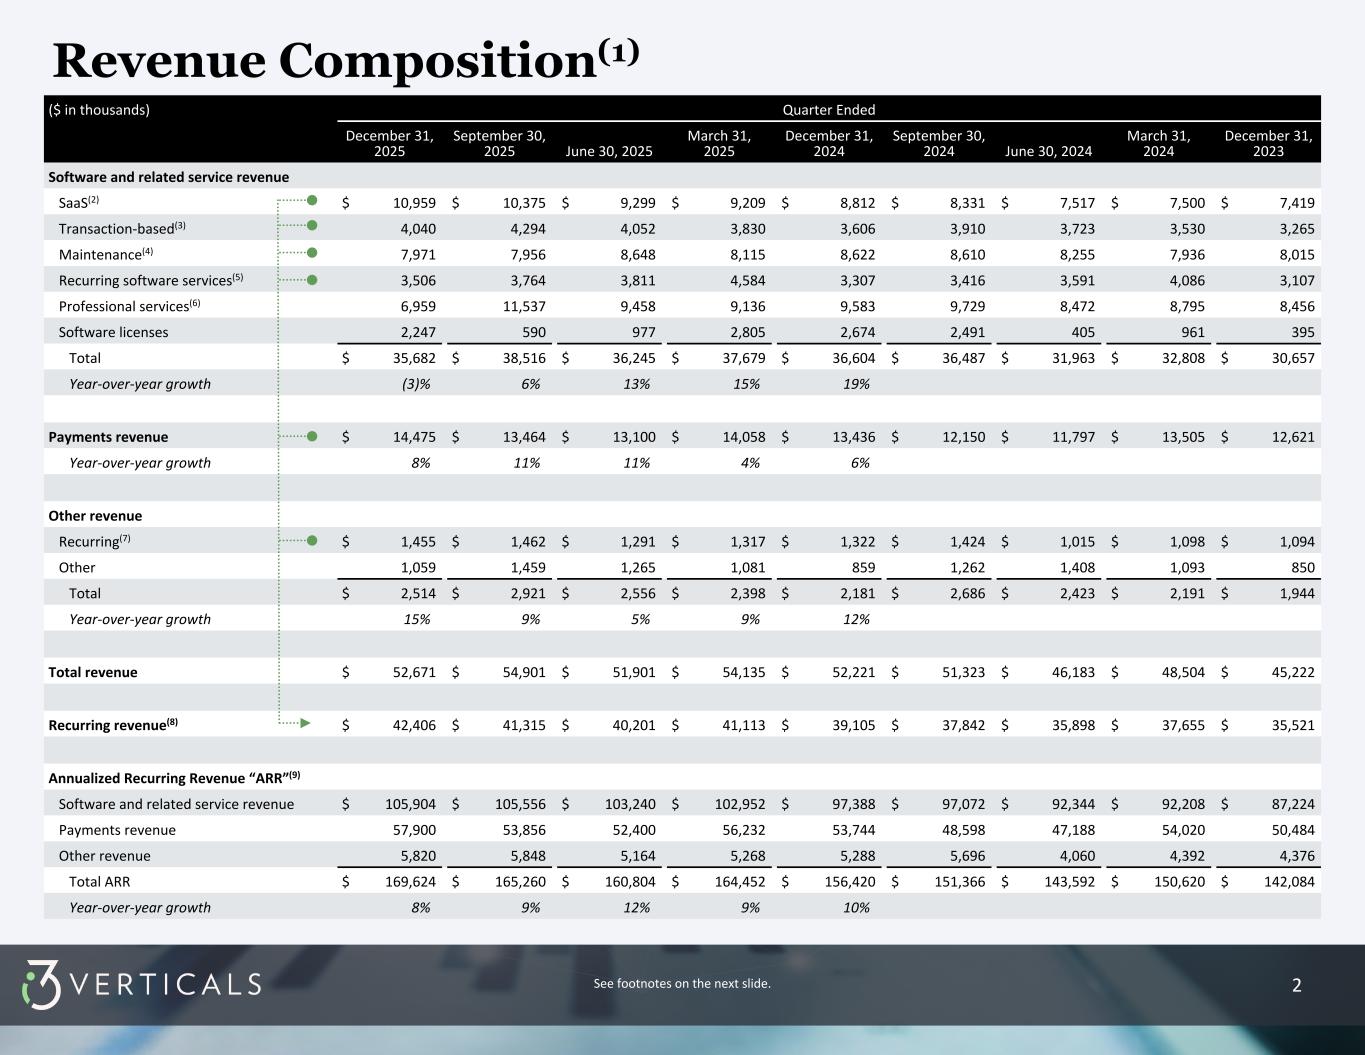
•Annualized Recurring Revenue ("ARR") from continuing operations1,5 for the three months ended December 31, 2025 and 2024 was $169.6 million and $156.4 million, respectively, representing a period-to-period growth rate of 8.4%.
•Effective January 1, 2026, the Company acquired a driver and motor vehicle insurance verification software company for $60.0 million in cash consideration, and an additional amount of cash contingent consideration in an amount not to exceed $20.0 million based on the performance of the acquired business for a period following the closing.
Greg Daily, Chairman and CEO of i3 Verticals, commented, "We are pleased to report our first quarter of fiscal 2026 results, which were in line with our expectations and market guidance. While total revenue grew modestly at 1% year over year, recurring revenue increased by more than 8%, reflecting our long-term growth strategy. SaaS growth in the first quarter rose to 24%.
"I am very excited to announce our latest acquisition, effective January 1, 2026, which is a perfect fit within our transportation market. We self-sourced this transaction, and our deep relationships within the market made it possible. We believe the product has a unique competitive advantage, and the company has never lost a customer. The team brings an incredible track record, and it has been a pleasure welcoming them to i3. We are excited to do great things together!
"While we’re pleased with our start to the fiscal year, we look forward to sharing more as the year progresses."
See footnotes on the following page.
IIIV Reports First Quarter 2026 Financial Results
Page 2
February 5, 2026
1.As a result of the sale of the Company’s merchant services business (the "Merchant Services Business"), which was completed on September 20, 2024, and the sale of the Company's Healthcare revenue cycle management business ("Healthcare RCM Business"), which was completed on May 5, 2025, the historical results of the Merchant Services Business and the Healthcare RCM Business have been reflected in discontinued operations in the consolidated statement of operations included in this earnings release, and continuing operations reflect the Company's remaining operations after giving effect to such classifications. Prior period results have been recast to reflect this presentation.
2.Represents a non-GAAP financial measure. For additional information regarding non-GAAP financial measures (including reconciliation information), see the attached schedules to this release.
3.Diluted net income (loss) per share attributable to Class A common stock from continuing operations and adjusted diluted earnings per share from continuing operations both exclude discontinued operations of the Merchant Services Business and the Healthcare RCM Business but include the consolidated cash interest expense.
4.Corporate income tax expense is based on non-GAAP adjusted income before taxes from continuing operations and is calculated using a tax rate of 25.0% for both the three months ended December 31, 2025 and 2024, based on the estimated long-term effective tax rate, considering blended federal and state tax rates.
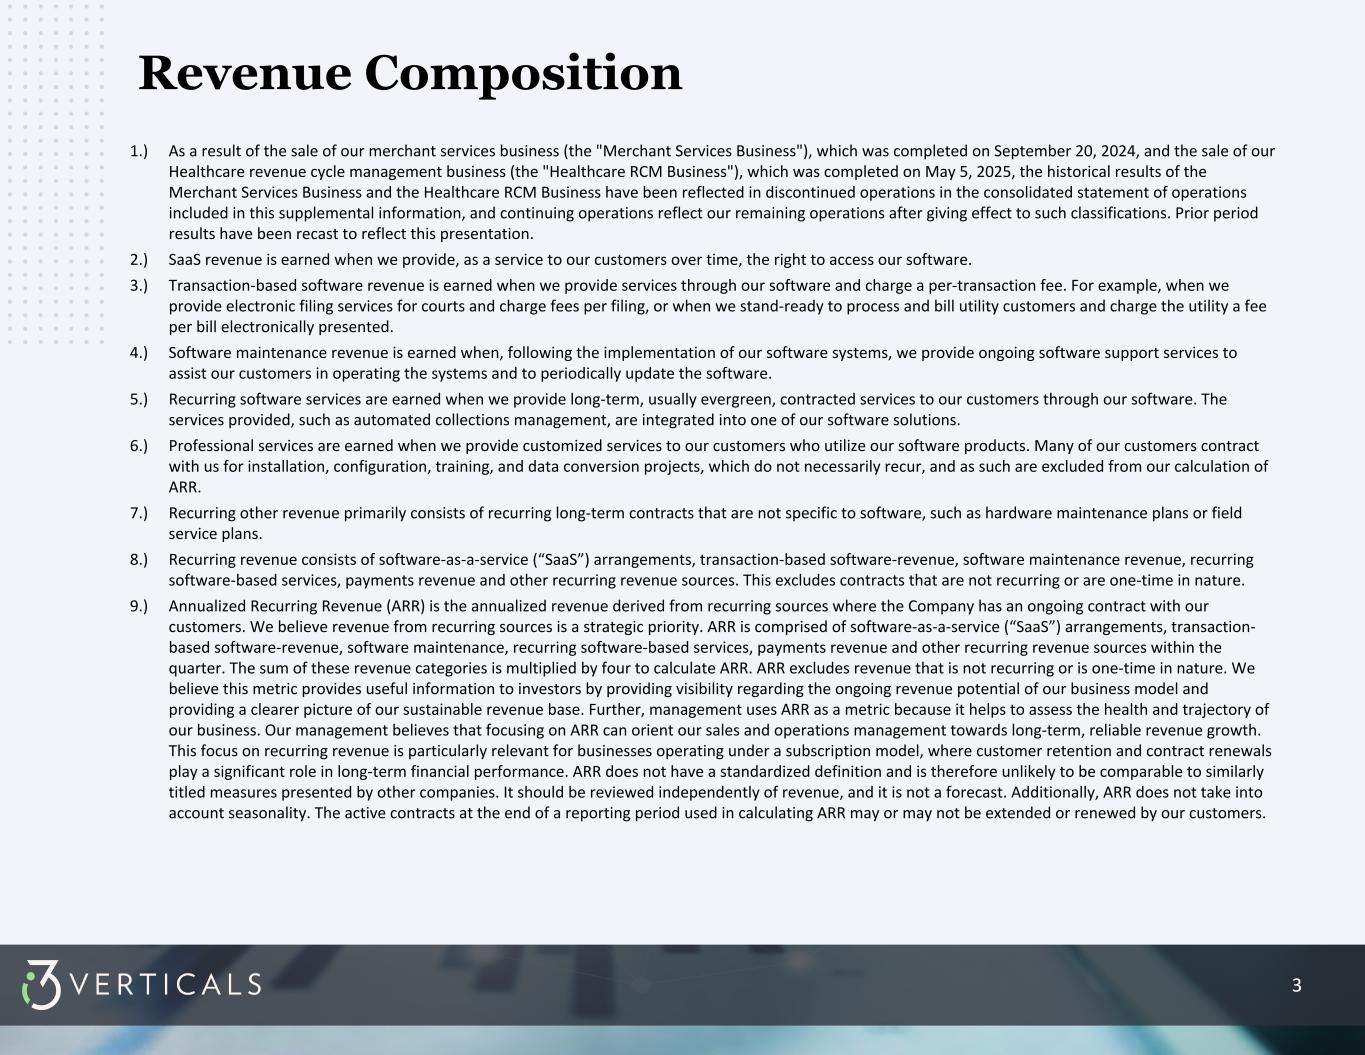
5.Annualized Recurring Revenue (ARR) is the annualized revenue derived from recurring sources where the Company has an ongoing contract with its customers. The Company believes revenue from recurring sources is a strategic priority. ARR is comprised of software-as-a-service (“SaaS”) arrangements, transaction-based software-revenue, software maintenance, recurring software-based services, payments revenue and other recurring revenue sources within the quarter. The sum of these revenue categories is multiplied by four to calculate ARR. ARR excludes revenue that is not recurring or is one-time in nature. The Company's management believes this metric provides useful information to investors by providing visibility regarding the ongoing revenue potential of the Company's business model and providing a clearer picture of its sustainable revenue base. Further, the Company's management uses ARR as a metric because it helps to assess the health and trajectory of the Company's business. The Company's management believes that focusing on ARR can orient the Company's sales and operations management towards long-term, reliable revenue growth. This focus on recurring revenue is particularly relevant for businesses operating under a subscription model, where customer retention and contract renewals play a significant role in long-term financial performance. ARR does not have a standardized definition and is therefore unlikely to be comparable to similarly titled measures presented by other companies. It should be reviewed independently of revenue, and it is not a forecast. Additionally, ARR does not take into account seasonality. The active contracts at the end of a reporting period used in calculating ARR may or may not be extended or renewed by the Company's customers.
IIIV Reports First Quarter Fiscal Year 2026 Financial Results
Page 3
February 5, 2026
2026 Outlook
The Company's practice is to provide annual guidance, excluding the impact of future acquisitions and transaction-related costs.
The Company is providing the following revised outlook for the fiscal year ending September 30, 2026:
| | | | | | | | | | | | | | | | | | | | | | | |
| (in thousands, except share and per share amounts) | Previous Outlook Range | | Revised Outlook Range |
| Fiscal year ending September 30, 2026 |
| Revenue | $ | 217,000 | | - | $ | 232,000 | | | $ | 223,000 | | - | $ | 234,000 | |
Adjusted EBITDA (non-GAAP) | $ | 58,500 | | - | $ | 65,000 | | | $ | 61,000 | | - | $ | 66,500 | |
Adjusted diluted earnings per share(1)(non-GAAP) | $ | 1.06 | | - | $ | 1.16 | | | $ | 1.08 | | - | $ | 1.16 | |
_______________________
1.Assumes an effective tax rate of 25.0% (non-GAAP), based on the estimated long-term effective tax rate, considering blended federal and state tax rates.
With respect to the “2026 Outlook” above, reconciliations of adjusted EBITDA from continuing operations and adjusted diluted earnings per share from continuing operations guidance to the closest corresponding GAAP measure on a forward-looking basis are not available without unreasonable efforts. This inability results from the inherent difficulty in forecasting generally and quantifying certain projected amounts that are necessary for such reconciliations. In particular, sufficient information is not available to calculate certain adjustments required for such reconciliations, including changes in the fair value of contingent consideration, income tax expense of i3 Verticals, Inc. and equity-based compensation expense. The Company expects these adjustments may have a potentially significant impact on future GAAP financial results.
Conference Call
The Company will host a conference call on Friday, February 6, 2026, at 8:30 a.m. EDT, to discuss financial results and operations. To listen to the call live via telephone, participants should dial (844) 887-9399 approximately 10 minutes prior to the start of the call. A telephonic replay will be available from 11:30 a.m. EDT on February 6, 2026, through February 13, 2026, by dialing (855) 669-9658 and entering Confirmation Code 6769466.
To listen to the call live via webcast, participants should visit the “Investors” section of the Company’s website, www.i3verticals.com, and go to the “Events” page approximately 10 minutes prior to the start of the call. The online replay will be available on this page of the Company’s website beginning shortly after the conclusion of the call and will remain available for 30 days.
Non-GAAP Measures
This press release contains information prepared in conformity with GAAP as well as non-GAAP information. It is management’s intent to provide non-GAAP financial information to enhance understanding of the Company's consolidated financial information as prepared in accordance with GAAP. This non-GAAP information should be considered by the reader in addition to, but not instead of, the financial statements prepared in accordance with GAAP. Each non-GAAP financial measure and the most directly comparable GAAP financial measure are presented for historical periods so as not to imply that more emphasis should be placed on the non-GAAP measure. The non-GAAP financial information presented may be determined or calculated differently by other companies.
Additional information about non-GAAP financial measures, and a reconciliation of those measures to the most directly comparable GAAP measures, is included in the financial schedules of this release.
About i3 Verticals
The Company provides mission-critical enterprise software solutions to public sector entities. These comprehensive cloud-native solutions address a broad range of government functions, including courts and public safety, public administration, utilities, transportation and schools. The Company’s mission is to enable state and local governments and related agencies to perform their functions and serve their constituents as effectively and efficiently as possible. With thousands of software installations across all 50 states and Canada, i3 Verticals is a leader in the public sector vertical. More information about the Company can be found at www.i3verticals.com.
IIIV Reports First Quarter Fiscal Year 2026 Financial Results
Page 4
February 5, 2026
Forward-Looking Statements
This release contains forward-looking statements that are subject to risks and uncertainties. All statements other than statements of historical fact or relating to present facts or current conditions included in this release are forward-looking statements, including any statements regarding the Company's fiscal 2026 financial outlook for continuing operations and statements of a general economic or industry specific nature. Forward-looking statements give the Company's current expectations and projections relating to its financial condition, results of operations, guidance, plans, objectives, future performance and business. You can identify forward-looking statements by the fact that they do not relate strictly to historical or current facts. These statements may include words such as “anticipate,” “estimate,” “expect,” “project,” “plan,” “intend,” “believe,” “may,” “will,” “should,” “could have,” “exceed,” “significantly,” “likely” and other words and terms of similar meaning in connection with any discussion of the timing or nature of future operating or financial performance or other events.
The forward-looking statements contained in this release are based on assumptions that we have made in light of the Company's industry experience and its perceptions of historical trends, current conditions, expected future developments and other factors we believe are appropriate under the circumstances. As you review and consider information presented herein, you should understand that these statements are not guarantees of future performance or results. They depend upon future events and are subject to risks, uncertainties (many of which are beyond the Company's control) and assumptions. Factors that could cause actual results to differ from those expressed or implied by our forward-looking statements include, among other things: ongoing and future economic and geopolitical conditions, including the impact of inflation, elevated interest rates, and tariff and trade-related developments, competition in our industry and our ability to compete effectively, regulatory developments, the successful integration of acquired businesses, our ability to execute on our strategy and achieve our goals following the completion of the sale of our Merchant Services Business and Healthcare RCM Business, and future decisions made by us and our competitors. All of these factors are difficult or impossible to predict accurately and many of them are beyond our control. For a further list and description of these and other important risks and uncertainties that may affect our future operations, see Part I, Item 1A - Risk Factors in our most recent Annual Report on Form 10-K filed with the Securities and Exchange Commission, which we may further update in Part II, Item 1A - Risk Factors in Quarterly Reports on Form 10-Q we will file hereafter, and the risks and uncertainties identified in other filings filed with the Securities and Exchange Commission from time to time.
Any forward-looking statement made by us in this release speaks only as of the date of this release and we undertake no obligation to publicly update any forward-looking statement, whether as a result of new information, future developments or otherwise, except as may be required by law.
| | | | | |
Contact: | |
| Clay Whitson | |
| Chief Strategy Officer | |
| (888) 251-0987 | |
| |
IIIV Reports First Quarter Fiscal Year 2026 Financial Results
Page 5
February 5, 2026
i3 Verticals, Inc. Consolidated Statements of Operations
(Unaudited)
($ in thousands, except share and per share amounts) | | | | | | | | | | | | | | | | | |
| Three Months Ended December 31, |
| 2025 | | 2024 | | % Change |
| | | | | |
| Revenue | $ | 52,671 | | | $ | 52,221 | | | 1% |
| | | | | |
| Operating expenses | | | | | |
| Other costs of services (excluding depreciation and amortization) | 17,582 | | | 15,576 | | | 13% |
| Selling, general and administrative | 26,989 | | | 26,479 | | | 2% |
| Depreciation and amortization | 6,865 | | | 6,861 | | | —% |
| Change in fair value of contingent consideration | (374) | | | 1,252 | | | n/m |
| Total operating expenses | 51,062 | | | 50,168 | | | 2% |
| | | | | |
| Income from operations | 1,609 | | | 2,053 | | | (22)% |
| | | | | |
| Other (income) expenses | | | | | |
| Interest expense | 381 | | | 680 | | | (44)% |
| Other income | (561) | | | (1,826) | | | (69)% |
| Total other income | (180) | | | (1,146) | | | (84)% |
| | | | | |
Income before income taxes | 1,789 | | | 3,199 | | | (44)% |
| | | | | |
| Provision for income taxes | 704 | | | 409 | | | 72% |
| | | | | |
Net income from continuing operations | 1,085 | | | 2,790 | | | |
| Net (loss) income from discontinued operations, net of income taxes | (138) | | | 318 | | | |
| Net income | 947 | | | 3,108 | | | (70)% |
| | | | | |
Net income from continuing operations attributable to non-controlling interest | 509 | | | 935 | | | |
Net (loss) income from discontinued operations attributable to non-controlling interest | (46) | | | 117 | | | |
| Net income attributable to non-controlling interest | 463 | | | 1,052 | | | (56)% |
| | | | | |
Net income from continuing operations attributable to i3 Verticals, Inc. | 576 | | | 1,855 | | | |
Net (loss) income from discontinued operations attributable to i3 Verticals, Inc. | (92) | | | 201 | | | |
| Net income attributable to i3 Verticals, Inc. | $ | 484 | | | $ | 2,056 | | | (76)% |
| | | | | |
Net income per share attributable to Class A common stockholders from continuing operations: | | | | | |
| Basic | $ | 0.02 | | | $ | 0.08 | | | |
| Diluted | $ | 0.02 | | | $ | 0.08 | | | |
| Net (loss) income per share attributable to Class A common stockholders from discontinued operations: | | | | | |
| Basic | $ | 0.00 | | | $ | 0.01 | | | |
| Diluted | $ | 0.00 | | | $ | 0.01 | | | |
Weighted average shares of Class A common stock outstanding: | | | | | |
Basic, for continuing operations | 23,675,075 | | | 23,551,352 | | | |
Diluted, for continuing operations | 25,091,754 | | | 34,057,196 | | | |
| Basic, for discontinued operations | 23,675,075 | | | 23,551,352 | | | |
| Diluted, for discontinued operations | 32,056,756 | | | 24,031,016 | | | |
n/m = not meaningful
IIIV Reports First Quarter Fiscal Year 2026 Financial Results
Page 6
February 5, 2026
i3 Verticals, Inc. Consolidated Balance Sheets
(Unaudited)
($ in thousands, except share and per share amounts) | | | | | | | | | | | |
| December 31, | | September 30, |
| 2025 | | 2025 |
| Assets | | | |
| Current assets | | | |
| Cash and cash equivalents | $ | 37,523 | | | $ | 66,672 | |
| Accounts receivable, net | 47,812 | | | 58,467 | |
| Settlement assets | 1,400 | | | 411 | |
| Prepaid expenses and other current assets | 13,654 | | | 12,075 | |
| Total current assets | 100,389 | | | 137,625 | |
| Property and equipment, net | 6,319 | | | 7,181 | |
| Restricted cash | 250 | | | 250 | |
| Capitalized software, net | 46,930 | | | 48,314 | |
| Goodwill | 248,469 | | | 248,469 | |
| Intangible assets, net | 132,938 | | | 135,797 | |
| Deferred tax asset | 48,378 | | | 49,058 | |
| Operating lease right-of-use assets | 4,473 | | | 4,577 | |
| Other assets | 7,785 | | | 7,140 | |
| Total assets | $ | 595,931 | | | $ | 638,411 | |
| | | |
| Liabilities and equity | | | |
| Liabilities | | | |
| Current liabilities | | | |
| Accounts payable | $ | 4,112 | | | $ | 6,248 | |
| Accrued expenses and other current liabilities | 20,743 | | | 24,525 | |
| Settlement obligations | 1,400 | | | 411 | |
| Deferred revenue | 34,198 | | | 37,678 | |
| Current portion of operating lease liabilities | 1,806 | | | 1,827 | |
| Total current liabilities | 62,259 | | | 70,689 | |
| Long-term tax receivable agreement obligations | 32,386 | | | 32,191 | |
| Operating lease liabilities, less current portion | 2,791 | | | 2,964 | |
| Other long-term liabilities | 15,154 | | | 14,844 | |
| Total liabilities | 112,590 | | | 120,688 | |
Commitments and contingencies | | | |
| Stockholders' equity | | | |
Preferred stock, par value $0.0001 per share, 10,000,000 shares authorized; 0 shares issued and outstanding as of December 31, 2025 and September 30, 2025 | — | | | — | |
Class A common stock, par value $0.0001 per share, 150,000,000 shares authorized; 22,609,537 and 23,983,125 shares issued and outstanding as of December 31, 2025 and September 30, 2025, respectively | 2 | | | 2 | |
Class B common stock, par value $0.0001 per share, 40,000,000 shares authorized; 8,381,681 and 8,381,681 shares issued and outstanding as of December 31, 2025 and September 30, 2025, respectively | 1 | | | 1 | |
| Additional paid-in capital | 239,749 | | | 271,310 | |
| Accumulated earnings | 118,754 | | | 118,270 | |
| Total stockholders' equity | 358,506 | | | 389,583 | |
| Non-controlling interest | 124,835 | | | 128,140 | |
| Total equity | 483,341 | | | 517,723 | |
| Total liabilities and equity | $ | 595,931 | | | $ | 638,411 | |
IIIV Reports First Quarter Fiscal Year 2026 Financial Results
Page 7
February 5, 2026
i3 Verticals, Inc. Consolidated Cash Flow Data
(Unaudited)
($ in thousands)
| | | | | | | | | | | |
| Three Months Ended December 31, |
| 2025 | | 2024 |
| | | |
Net cash provided by operating activities | $ | 14,123 | | | $ | 11,495 | |
| Net cash used in investing activities | $ | (1,832) | | | $ | (1,418) | |
| Net cash used in financing activities | $ | (40,451) | | | $ | (10,467) | |
Reconciliation of GAAP to Non-GAAP Financial Measures
The Company discloses the following non-GAAP financial measures in this earnings release:
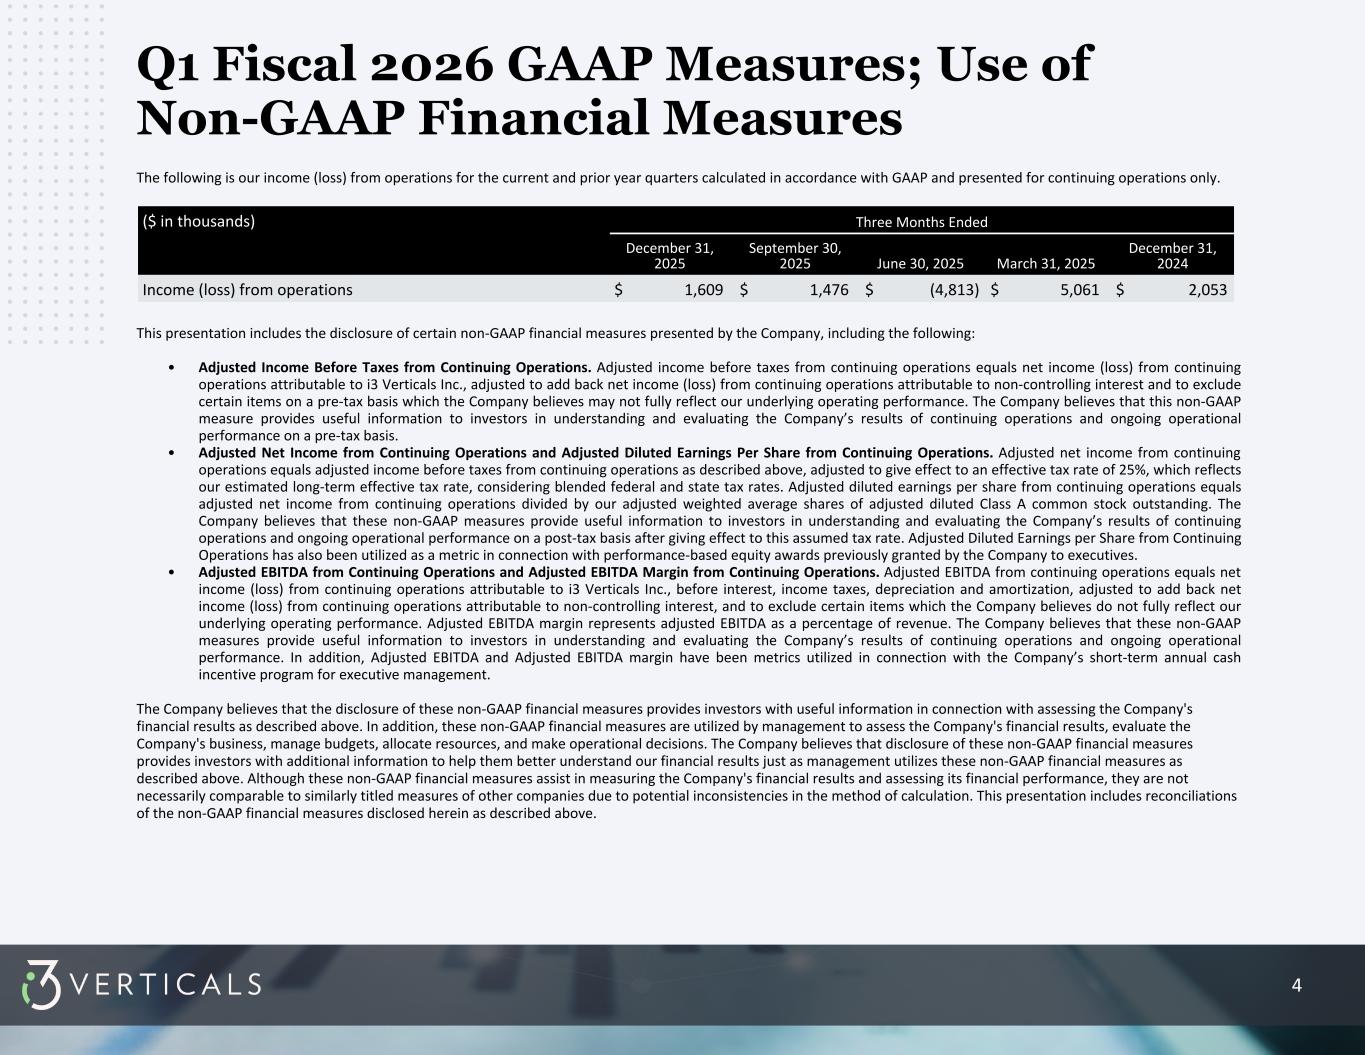
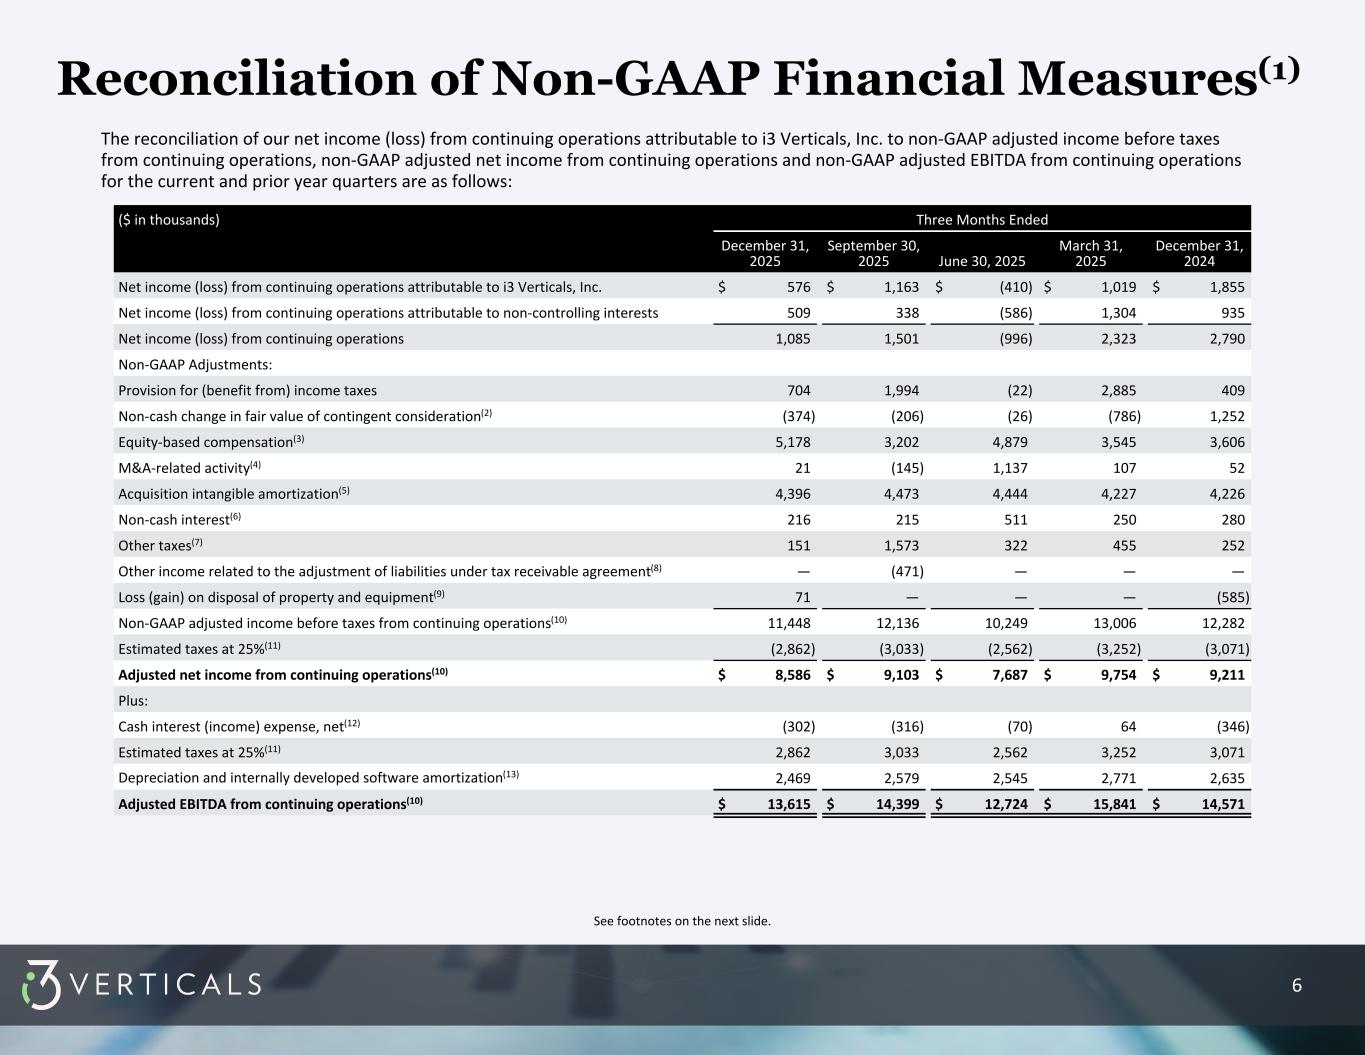
•Adjusted Income Before Taxes from Continuing Operations. Adjusted income before taxes from continuing operations equals net income (loss) from continuing operations attributable to i3 Verticals Inc., adjusted to add back net income (loss) from continuing operations attributable to non-controlling interest and to exclude certain items on a pre-tax basis which the Company believes may not fully reflect our underlying operating performance. The Company believes that this non-GAAP measure provides useful information to investors in understanding and evaluating the Company’s results of continuing operations and ongoing operational performance on a pre-tax basis.
•Adjusted Net Income from Continuing Operations and Adjusted Diluted Earnings per Share from Continuing Operations. Adjusted net income from continuing operations equals adjusted income before taxes from continuing operations as described above, adjusted to give effect to an effective tax rate of 25%, which reflects our estimated long-term effective tax rate, considering blended federal and state tax rates. Adjusted diluted earnings per share from continuing operations equals adjusted net income from continuing operations divided by our adjusted weighted average shares of adjusted diluted Class A common stock outstanding. The Company believes that these non-GAAP measures provide useful information to investors in understanding and evaluating the Company’s results of continuing operations and ongoing operational performance on a post-tax basis after giving effect to this assumed tax rate. Adjusted Diluted Earnings per Share from Continuing Operations has also been utilized as a metric in connection with performance-based equity awards previously granted by the Company to executives.
•Adjusted EBITDA from Continuing Operations and Adjusted EBITDA Margin from Continuing Operations. Adjusted EBITDA from continuing operations equals net income (loss) from continuing operations attributable to i3 Verticals Inc., before interest, income taxes, depreciation and amortization, adjusted to add back net income (loss) from continuing operations attributable to non-controlling interest, and to exclude certain items which the Company believes do not fully reflect our underlying operating performance. Adjusted EBITDA margin represents adjusted EBITDA as a percentage of revenue. The Company believes that these non-GAAP measures provide useful information to investors in understanding and evaluating the Company’s results of continuing operations and ongoing operational performance. In addition, Adjusted EBITDA and Adjusted EBITDA margin have been metrics utilized in connection with the Company’s short-term annual cash incentive program for executive management.
The Company believes that the disclosure of these non-GAAP financial measures provides investors with useful information in connection with assessing the Company's financial results as described above. In addition, these non-GAAP financial measures are utilized by management to assess the Company's financial results, evaluate the Company's business, manage budgets, allocate resources, and make operational decisions. The Company believes that disclosure of these non-GAAP financial measures provides investors with additional information to help them better understand our financial results just as management utilizes these non-GAAP financial measures as described above. Although these non-GAAP financial measures assist in measuring the Company's financial results and assessing its financial performance, they are not necessarily comparable to similarly titled measures of other companies due to potential inconsistencies in the method of calculation.
See below for reconciliations of the non-GAAP financial measures presented in this release.
IIIV Reports First Quarter Fiscal Year 2026 Financial Results
Page 8
February 5, 2026
i3 Verticals, Inc. Reconciliation of GAAP Net Income (Loss) from Continuing Operations to
Non-GAAP Adjusted Net Income from Continuing Operations and
Non-GAAP Adjusted EBITDA from Continuing Operations
(Unaudited)
($ in thousands) | | | | | | | | | | | |
| Three Months Ended December 31, |
| 2025 | | 2024 |
Net income from continuing operations attributable to i3 Verticals, Inc. | $ | 576 | | | $ | 1,855 | |
Net income from continuing operations attributable to non-controlling interest | 509 | | | 935 | |
Net income from continuing operations | $ | 1,085 | | | $ | 2,790 | |
| Non-GAAP adjustments: | | | |
| Provision for income taxes | 704 | | | 409 | |
Non-cash change in fair value of contingent consideration(1) | (374) | | | 1,252 | |
Equity-based compensation from continuing operations(2) | 5,178 | | | 3,606 | |
M&A-related activity(3) | 21 | | | 52 | |
Acquisition intangible amortization(4) | 4,396 | | | 4,226 | |
Non-cash interest expense(5) | 216 | | | 280 | |
Other taxes(6) | 151 | | | 252 | |
Loss (gain) on disposal of property and equipment(7) | 71 | | | (585) | |
Non-GAAP adjusted income before taxes from continuing operations(8) | $ | 11,448 | | | $ | 12,282 | |
Estimated taxes at 25%(9) | (2,862) | | | (3,071) | |
Adjusted net income from continuing operations(8) | $ | 8,586 | | | $ | 9,211 | |
Cash interest income, net(10) | (302) | | | (346) | |
Estimated taxes at 25%(9) | 2,862 | | | 3,071 | |
Depreciation and internally developed software amortization(11) | 2,469 | | | 2,635 | |
Adjusted EBITDA from continuing operations(8) | $ | 13,615 | | | $ | 14,571 | |
________________
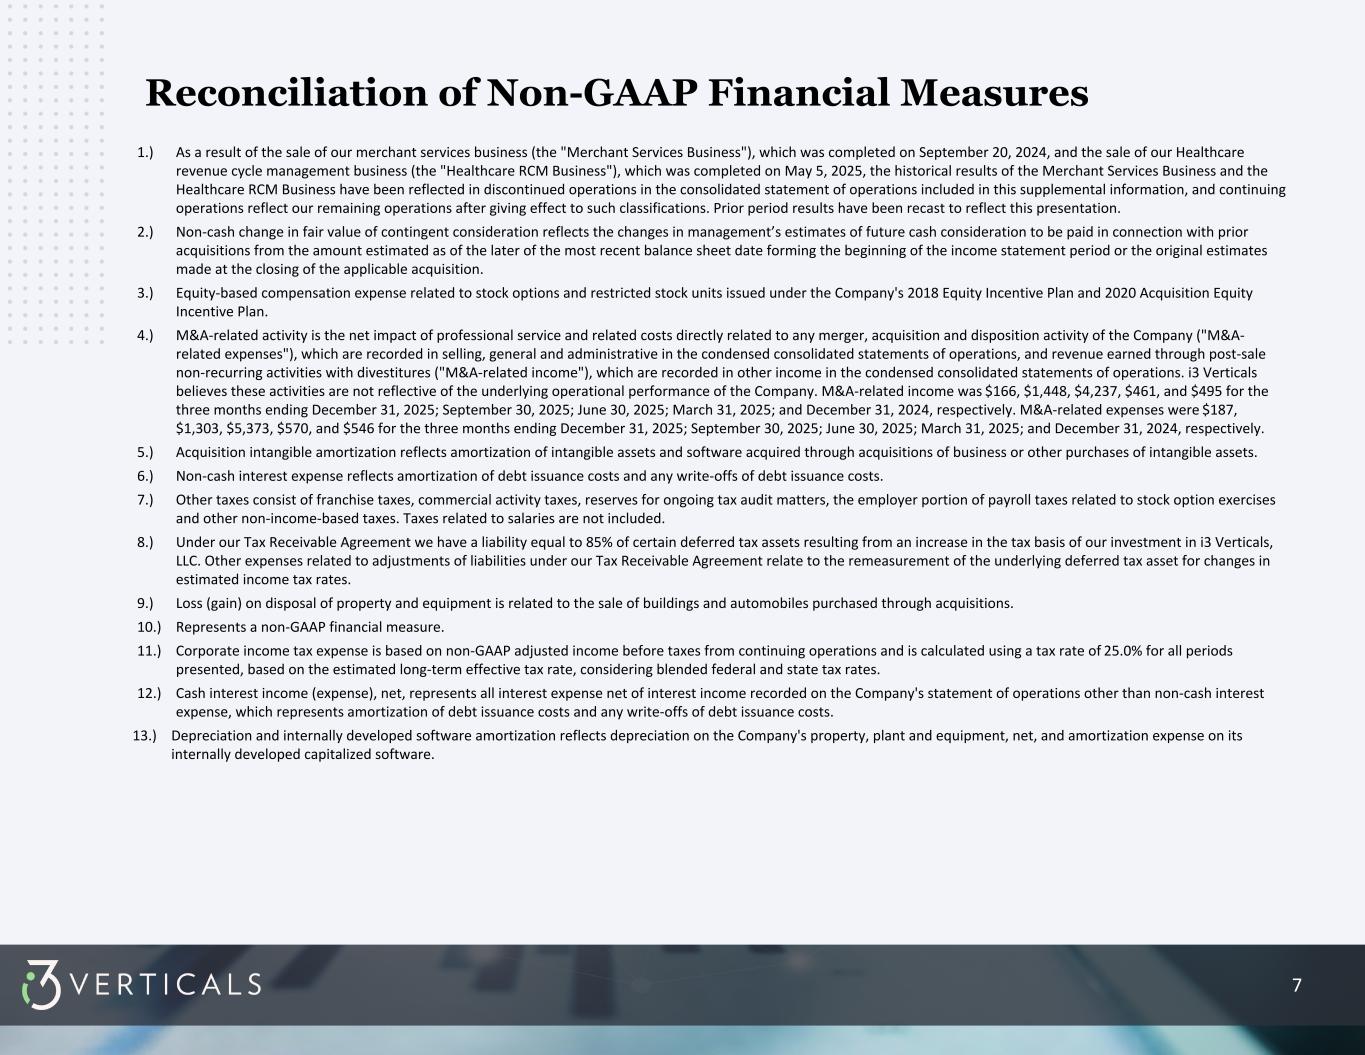
1.Non-cash change in fair value of contingent consideration reflects the changes in management’s estimates of future cash consideration to be paid in connection with prior acquisitions from the amount estimated as of the later of the most recent balance sheet date forming the beginning of the income statement period or the original estimates made at the closing of the applicable acquisition.
2.Equity-based compensation expense related to stock options and restricted stock units issued under the Company's 2018 Equity Incentive Plan and 2020 Acquisition Equity Incentive Plan.
3.M&A-related activity is the net impact of professional service and related costs directly related to any merger, acquisition and disposition activity of the Company ("M&A-related expenses"), which are recorded in selling, general and administrative in the condensed consolidated statements of operations, and revenue earned through post-sale non-recurring activities with divestitures ("M&A-related income"), which are recorded in other income in the condensed consolidated statements of operations. i3 Verticals believes these activities are not reflective of the underlying operational performance of the Company. M&A-related income for the three months ended December 31, 2025 and 2024, was $166, and $495 respectively. M&A-related expenses for the three months ended December 31, 2025 and 2024, were $187 and $546, respectively.
4.Acquisition intangible amortization reflects amortization of intangible assets and software acquired through acquisitions of business or other purchases of intangible assets.
5.Non-cash interest expense reflects amortization of debt issuance costs and any write-offs of debt issuance costs.
6.Other taxes consist of franchise taxes, commercial activity taxes, reserves for ongoing tax audit matters, the employer portion of payroll taxes related to stock option exercises and other non-income-based taxes. Taxes related to salaries are not included.
7.Loss (gain) on disposal of property and equipment is related to the sale of buildings and automobiles purchased through acquisitions.
8.Represents a non-GAAP financial measure.
9.Corporate income tax expense is based on non-GAAP adjusted income before taxes from continuing operations and is calculated using a tax rate of 25.0% for both the three months ended December 31, 2025 and 2024, based on the estimated long-term effective tax rate, considering blended federal and state tax rates.
10.Cash interest income, net, represents all interest expense net of interest income recorded on the Company's statement of operations other than non-cash interest expense, which represents amortization of debt issuance costs and any write-offs of debt issuance costs.
11.Depreciation and internally developed software amortization reflects depreciation on the Company's property, plant and equipment, net, and amortization expense on its internally developed capitalized software.
IIIV Reports First Quarter Fiscal Year 2026 Financial Results
Page 9
February 5, 2026
i3 Verticals, Inc. GAAP Diluted EPS from Continuing Operations and
Non-GAAP Adjusted Diluted EPS from Continuing Operations
(Unaudited)
($ in thousands, except share and per share amounts) | | | | | | | | | | | |
| Three Months Ended December 31, |
| 2025 | | 2024 |
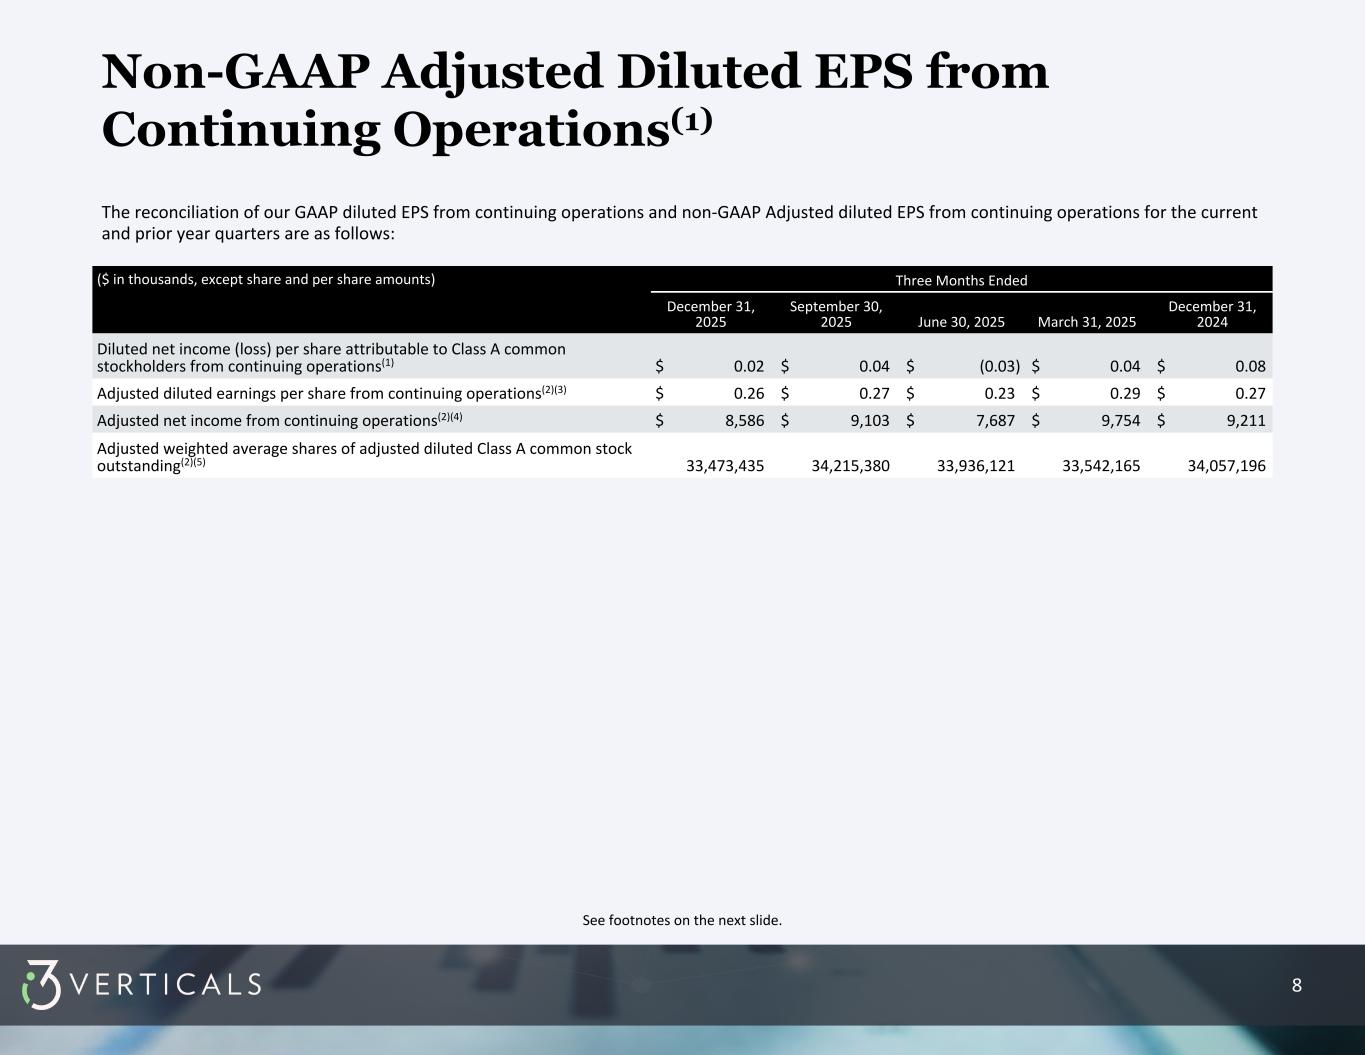
Diluted net income per share attributable to Class A common stockholders from continuing operations(1) | $ | 0.02 | | | $ | 0.08 | |
Adjusted diluted earnings per share from continuing operations(2)(3) | $ | 0.26 | | | $ | 0.27 | |
Adjusted net income from continuing operations(2)(4) | $ | 8,586 | | | $ | 9,211 | |
Adjusted weighted average shares of adjusted diluted Class A common stock outstanding(2)(5) | 33,473,435 | | | 34,057,196 | |
________________
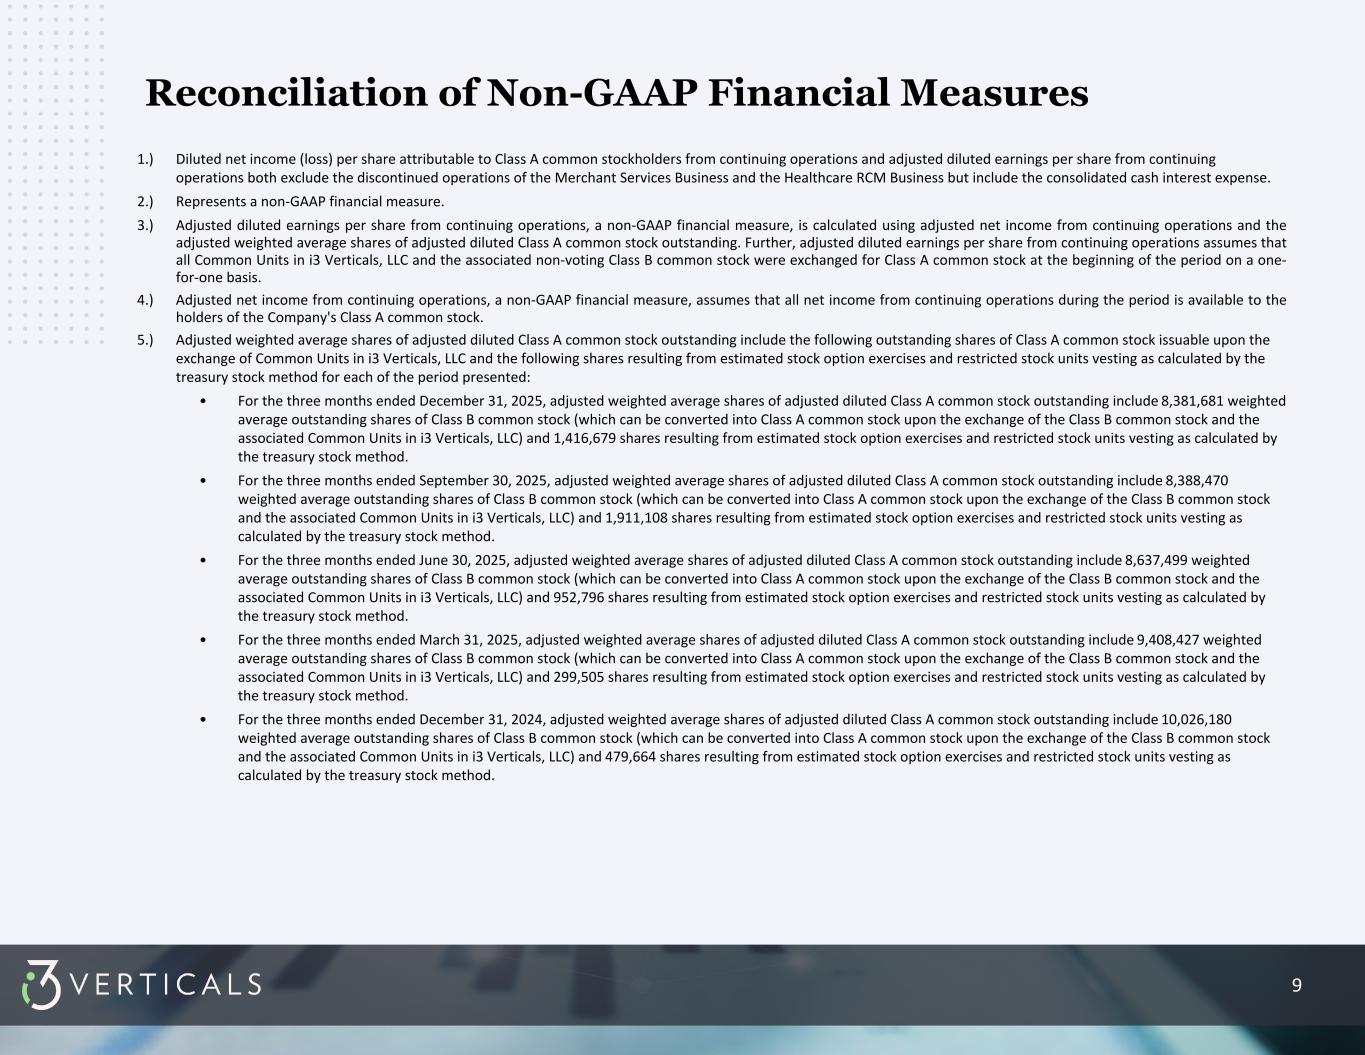
1.Diluted net income per share attributable to Class A common stockholders from continuing operations and adjusted diluted earnings per share from continuing operations both exclude the discontinued operations of the Merchant Services Business and the Healthcare RCM Business but include the consolidated cash interest expense.
2.Represents a non-GAAP financial measure.
3.Adjusted diluted earnings per share from continuing operations, a non-GAAP financial measure, is calculated using adjusted net income from continuing operations and the adjusted weighted average shares of adjusted diluted Class A common stock outstanding. Further, adjusted diluted earnings per share from continuing operations assumes that all Common Units in i3 Verticals, LLC and the associated non-voting Class B common stock were exchanged for Class A common stock at the beginning of the period on a one-for-one basis.
4.Adjusted net income from continuing operations, a non-GAAP financial measure, assumes that all net income from continuing operations during the period is available to the holders of the Company's Class A common stock.
5.Adjusted weighted average shares of adjusted diluted Class A common stock outstanding include 8,381,681 and 10,026,180 weighted average outstanding shares of Class B common stock (which can be converted into Class A common stock upon the exchange of the Class B common stock and the associated Common Units in i3 Verticals, LLC) and 1,416,679 and 479,664 shares resulting from estimated stock option exercises and restricted stock units vesting as calculated by the treasury stock method for the three months ended December 31, 2025 and 2024, respectively.