iiiv-20250508
0001728688FALSE00017286882025-05-082025-05-08


UNITED STATES
SECURITIES AND EXCHANGE COMMISSION
WASHINGTON, DC 20549  
 
FORM 8-K
 
CURRENT REPORT
PURSUANT TO SECTION 13 OR 15(d)
OF THE SECURITIES EXCHANGE ACT OF 1934
Date of Report (Date of earliest event reported): May 8, 2025
 
 
i3 Logo - no verticals word.jpg
i3 Verticals, Inc.
(Exact name of registrant as specified in its charter)  


Delaware
001-38532
82-4052852
(State or Other Jurisdiction
of Incorporation)
(Commission
File Number)
(I.R.S. Employer
Identification No.)
40 Burton Hills Blvd., Suite 415
Nashville, TN
37215
(Address of principal executive offices)
(Zip Code)
(615) 465-4487
(Registrant’s telephone number, including area code)

Not Applicable
(Former name or former address, if changed since last report)

Check the appropriate box if the Form 8-K filing is intended to simultaneously satisfy the filing obligation of the registrant under any of the following provisions (see General Instruction A.2. below):
 
Written communications pursuant to Rule 425 under the Securities Act (17 CFR 230.425)
Soliciting material pursuant to Rule 14a-12 under the Exchange Act (17 CFR 240.14a-12)
Pre-commencement communications pursuant to Rule 14d-2(b) under the Exchange Act (17 CFR 240.14d- 2(b))
Pre-commencement communications pursuant to Rule 13e-4(c) under the Exchange Act (17 CFR 240.13e- 4(c))
Securities registered pursuant to Section 12(b) of the Act:
Title of each classTrading Symbol(s)Name of each exchange on which registered
Class A Common Stock, $0.0001 Par ValueIIIVNasdaq Global Select Market
Indicate by check mark whether the registrant is an emerging growth company as defined in Rule 405 of the Securities Act of 1933 (§230.405 of this chapter) or Rule 12b-2 of the Securities Exchange Act of 1934 (§240.12b-2 of this chapter).
Emerging growth company.  

If an emerging growth company, indicate by check mark if the registrant has elected not to use the extended transition period for complying with any new or revised financial accounting standards provided pursuant to Section 13(a) of the Exchange Act.  ☐


As provided in General Instruction B.2 of Form 8-K, the information contained in Item 2.02 and 7.01 of this Current Report on Form 8-K (including Exhibits 99.1 and 99.2 hereto) shall not be deemed to be “filed” for purposes of Section 18 of the Securities Exchange Act of 1934, as amended, nor shall such information be deemed to be incorporated by reference in any filing under the Securities Act of 1933, as amended, except as shall be expressly set forth by specific reference in such a filing.
Item 2.02.    Results of Operations and Financial Condition.
On May 8, 2025, i3 Verticals, Inc. (the “Company”) issued a press release announcing the results of its operations for the three and six months ended March 31, 2025. A copy of the press release is furnished as Exhibit 99.1 hereto and is hereby incorporated by reference into this Item 2.02.
Item 7.01.    Regulation FD Disclosure.

The Company has also prepared a supplemental presentation (the “Supplemental Presentation”) providing certain supplemental financial information for the three months ended March 31, 2025. A copy of the Supplemental Presentation is furnished as Exhibit 99.2 hereto and is hereby incorporated by reference into this Item 7.01. A copy of the Supplemental Presentation is also available on the Investors section of the Company’s website, www.i3verticals.com.
Item 9.01.     Financial Statements and Exhibits.

(d) Exhibits:
Exhibit No.Description
104Cover Page Interactive Date File (embedded within the Inline XBRL document).


SIGNATURES
Pursuant to the requirements of the Securities Exchange Act of 1934, the registrant has duly caused this report to be signed on its behalf by the undersigned hereunto duly authorized.
Date: May 8, 2025

i3 VERTICALS, INC.
By:
/s/ Geoff Smith
Name:
Geoff Smith
Title:
Chief Financial Officer
(Principal Financial Officer and Principal Accounting Officer)


i3v_primaryxdarka.jpg

i3 VERTICALS REPORTS SECOND QUARTER 2025 FINANCIAL RESULTS
Completes Acquisition of Utility Billing Software Company
Completes Divestiture of Healthcare RCM Business
NASHVILLE, Tenn. (May 8, 2025) – i3 Verticals, Inc. (Nasdaq: IIIV) (“i3 Verticals” or the “Company”) today reported its financial results for the fiscal second quarter ended March 31, 2025.
Highlights from continuing operations1 for the three and six months ended March 31, 2025 vs. 2024
Second quarter revenue was $63.1 million, an increase of 8.8% over the prior year's second quarter. Revenue for the six months ended March 31, 2025, was $124.8 million, an increase of 10.4% over the prior year's first six months.
Second quarter net income from continuing operations1 was $1.1 million, compared to net loss from continuing operations1 of $2.3 million in the prior year's second quarter. Net income for the six months ended March 31, 2025, was $4.4 million, compared to a net loss of $6.5 million in the prior year's first six months.
Second quarter net income from continuing operations attributable to i3 Verticals, Inc.1 was $0.1 million, compared to net loss from continuing operations attributable to i3 Verticals, Inc.1 of $1.7 million in the prior year's second quarter. Net income from continuing operations attributable to i3 Verticals, Inc.1 for the six months ended March 31, 2025, was $2.3 million, compared to net loss from continuing operations attributable to i3 Verticals, Inc.1 of $4.6 million in the prior year's first six months.
Second quarter adjusted EBITDA from continuing operations1,2 was $17.1 million, an increase of 12.7% over the prior year's second quarter. Adjusted EBITDA from continuing operations1,2 for the six months ended March 31, 2025, was $33.5 million, an increase of 14.8% over the prior year's first six months.
Second quarter adjusted EBITDA from continuing operations1,2 as a percentage of revenue was 27.2%, compared to 26.2% in the prior year's second quarter. Adjusted EBITDA from continuing operations1 a percentage of revenue for the six months ended March 31, 2025, was 26.9%, compared to 25.8% in the prior year's first six months.
Second quarter diluted net income per share attributable to Class A common stockholders from continuing operations1,3 was $0.00, compared to diluted net loss per share attributable to Class A common stockholders from continuing operations1,3 of $0.07 in the prior year's second quarter. Diluted net income per share attributable to Class A common stockholders from continuing operations1,3 was $0.09 in the six months ended March 31, 2025, compared to diluted net loss per share attributable to Class A common stockholders from continuing operations1,3 of $0.20 in the prior year's first six months.
Second quarter non-GAAP adjusted diluted earnings per share from continuing operations1,2,3, which gives effect to the Company's 25% estimated long-term effective tax rate4, was $0.32 compared to $0.12 for the prior year's second quarter. Non-GAAP adjusted diluted earnings per share from continuing operations1,2,3 for the six months ended March 31, 2025, was $0.62 compared to $0.24 for the prior year's first six months.
Annualized Recurring Revenue ("ARR") from continuing operations1,5 for the three months ended March 31, 2025 and 2024 was $199.1 million and $186.8 million, respectively, representing a period-to-period growth rate of 6.5%.
On April 1, 2025, the Company acquired a utility billing software company for $9.0 million in cash consideration, and an additional amount of contingent consideration (in an amount not to exceed $5.0 million), which is still being valued.
On May 5, 2025, as previously disclosed, the Company sold its Healthcare Revenue Cycle Management business (the “Healthcare RCM Business”) to Infinx pursuant to the terms of a purchase agreement dated as of May 5, 2025, for $96.0 million in cash, subject to post-closing net working capital and other purchase price adjustments. The RCM business contributed $9.1 million and $18.9 million of revenue for the three and six months ended March 31, 2025, respectively.

See footnotes on the following page.
-MORE-

IIIV Reports Second Quarter 2025 Financial Results
Page 2
May 8, 2025
1.As a result of the sale of the Company’s merchant services business (the "Merchant Services Business"), which was completed on September 20, 2024, the historical results of the Merchant Services Business have been reflected in discontinued operations in the consolidated statement of operations included in this earnings release, and continuing operations reflect the Company's remaining operations after giving effect to such classification. Prior period results have been recast to reflect this presentation. In addition, the Healthcare RCM Business was not classified as held for sale according to GAAP as of March 31, 2025. Accordingly, the current period and historical results of the Healthcare RCM Business are presented within results from continuing operations.
2.Represents a non-GAAP financial measure. In addition, adjusted diluted earnings per share from continuing operations, a non-GAAP financial measure, is the same measure as pro forma adjusted diluted earnings per share from continuing operations as was disclosed by the Company in prior earnings releases. There has not been any change in the manner in which adjusted diluted earnings per share has been calculated in comparison to the calculation of pro forma adjusted diluted earnings per share from continuing operations as previously disclosed by the Company. For additional information regarding non-GAAP financial measures (including reconciliation information), see the attached schedules to this release.
3.Diluted net income per share attributable to Class A common stock from continuing operations and adjusted diluted earnings per share from continuing operations both exclude discontinued operations of the Merchant Services Business but include the consolidated cash interest expense.
4.Corporate income tax expense is based on non-GAAP adjusted income before taxes from continuing operations and is calculated using a tax rate of 25.0% for both the six months ended March 31, 2025 and 2024, based on the estimated long-term effective tax rate, considering blended federal and state tax rates.
5.Annualized Recurring Revenue (ARR) is the annualized revenue derived from recurring sources where the Company has an ongoing contract with its customers. The Company believes revenue from recurring sources is a strategic priority. ARR is comprised of software-as-a-service (“SaaS”) arrangements, transaction-based software-revenue, software maintenance, recurring software-based services, payments revenue and other recurring revenue sources within the quarter. The sum of these revenue categories is multiplied by four to calculate ARR. ARR excludes revenue that is not recurring or is one-time in nature. The Company's management believes this metric provides useful information to investors by providing visibility regarding the ongoing revenue potential of the Company's business model and providing a clearer picture of its sustainable revenue base. Further, the Company's management uses ARR as a metric because it helps to assess the health and trajectory of the Company's business. The Company's management believes that focusing on ARR can orient the Company's sales and operations management towards long-term, reliable revenue growth. This focus on recurring revenue is particularly relevant for businesses operating under a subscription model, where customer retention and contract renewals play a significant role in long-term financial performance. ARR does not have a standardized definition and is therefore unlikely to be comparable to similarly titled measures presented by other companies. It should be reviewed independently of revenue and it is not a forecast. Additionally, ARR does not take into account seasonality. The active contracts at the end of a reporting period used in calculating ARR may or may not be extended or renewed by the Company's customers.
-MORE-

IIIV Reports Second Quarter Fiscal Year 2025 Financial Results
Page 3
May 8, 2025
Greg Daily, Chairman and CEO of i3 Verticals, commented, “Two days ago, we announced the divestiture of our Healthcare Revenue Cycle Management (RCM) business. When we began our journey in vertical market software, healthcare was one of the end markets we specifically targeted, as it is in the midst of a long cycle of technological transformation which we were happy to be a part of.
“We believe that the public sector is even earlier stages of a similar transformation cycle. Lately, there has been a significant focus on government efficiency. We believe that transforming government services with best-in-class enterprise software is a critical part of that effort. There is no shortage of what we want to accomplish in this space and we believe that there are tangible benefits to narrowing our focus.
“We are grateful for all that our employees in the RCM business accomplished with us. They have a bright future with Infinx, an excellent partner who, with the help of their own scale and platforms, we believe will help the business realize its potential.
“Looking ahead we will be completely focused on bringing the best possible enterprise software to our public sector clients. The divestiture of the RCM business primes us for additional M&A. There remain many great businesses in this space. On April 1 we were fortunate to complete the acquisition of one such company, a utility billing and accounting platform which will be a great fit with our existing utilities practices. We can’t wait to get to work.”
2025 Outlook
The Company's practice is to provide annual guidance, excluding the impact of acquisitions, dispositions and transaction-related costs.
The Company is providing the following outlook for RemainCo operations, which excludes the Healthcare RCM Business, for the fiscal year ended September 30, 2025 (including for the period prior to the completion of the disposition of the Healthcare RCM Business):

(in thousands, except share and per share amounts)Previous Outlook RangeRevised Outlook Range
Fiscal year ending September 30, 2025
Revenue$243,000 -$263,000 $207,000 -$217,000 
Adjusted EBITDA (non-GAAP)
$63,000 -$71,500 $55,000 -$61,000 
Depreciation and internally developed software amortization$12,000 -$14,000 $11,000 -$12,000 
Cash interest expense, net$1,000 -$2,000 $— -$750 
Adjusted diluted earnings per share(1)(non-GAAP)
$1.05 -$1.25 $0.96 -$1.06 
_______________________
1.Assumes an effective tax rate of 25.0% (non-GAAP), based on the estimated long-term effective tax rate, considering blended federal and state tax rates. As disclosed above, adjusted diluted earnings per share from continuing operations, a non-GAAP financial measure, is the same measure as pro forma adjusted diluted earnings per share from continuing operations as was disclosed by the Company in prior earnings releases.

With respect to the “2025 Outlook” above, reconciliations of adjusted EBITDA from continuing operations and adjusted diluted earnings per share from continuing operations guidance to the closest corresponding GAAP measure on a forward-looking basis are not available without unreasonable efforts. This inability results from the inherent difficulty in forecasting generally and quantifying certain projected amounts that are necessary for such reconciliations. In particular, sufficient information is not available to calculate certain adjustments required for such reconciliations, including changes in the fair value of contingent consideration, income tax expense of i3 Verticals, Inc. and equity-based compensation expense. The Company expects these adjustments may have a potentially significant impact on future GAAP financial results.
Conference Call
The Company will host a conference call on Friday, May 9, 2025, at 8:30 a.m. ET, to discuss financial results and operations. To listen to the call live via telephone, participants should dial (844) 887-9399 approximately 10 minutes prior to the start of the call. A telephonic replay will be available from 11:30 a.m. ET on May 9, 2025, through May 16, 2025, by dialing (877) 344-7529 and entering Confirmation Code 5899364.
To listen to the call live via webcast, participants should visit the “Investors” section of the Company’s website, www.i3verticals.com, and go to the “Events” page approximately 10 minutes prior to the start of the call. The online replay will be available on this page of the Company’s website beginning shortly after the conclusion of the call and will remain available for 30 days.
-MORE-

IIIV Reports Second Quarter Fiscal Year 2025 Financial Results
Page 4
May 8, 2025
Non-GAAP Measures
This press release contains information prepared in conformity with GAAP as well as non-GAAP information. It is management’s intent to provide non-GAAP financial information to enhance understanding of the Company's consolidated financial information as prepared in accordance with GAAP. This non-GAAP information should be considered by the reader in addition to, but not instead of, the financial statements prepared in accordance with GAAP. Each non-GAAP financial measure and the most directly comparable GAAP financial measure are presented for historical periods so as not to imply that more emphasis should be placed on the non-GAAP measure. The non-GAAP financial information presented may be determined or calculated differently by other companies.
Additional information about non-GAAP financial measures, and a reconciliation of those measures to the most directly comparable GAAP measures, is included in the financial schedules of this release.
About i3 Verticals
The Company delivers seamless enterprise software to customers in strategic vertical markets. Building on its sophisticated and diverse platform of software and services solutions, the Company creates and acquires software products to serve the specific needs of public and private organizations in the Public Sector.
Forward-Looking Statements
This release contains forward-looking statements that are subject to risks and uncertainties. All statements other than statements of historical fact or relating to present facts or current conditions included in this release are forward-looking statements, including any statements regarding the Company's fiscal 2025 and fiscal 2025 financial outlook for continuing operations and statements of a general economic or industry specific nature. Forward-looking statements give the Company's current expectations and projections relating to its financial condition, results of operations, guidance, plans, objectives, future performance and business. You can identify forward-looking statements by the fact that they do not relate strictly to historical or current facts. These statements may include words such as “anticipate,” “estimate,” “expect,” “project,” “plan,” “intend,” “believe,” “may,” “will,” “should,” “could have,” “exceed,” “significantly,” “likely” and other words and terms of similar meaning in connection with any discussion of the timing or nature of future operating or financial performance or other events.
The forward-looking statements contained in this release are based on assumptions that we have made in light of the Company's industry experience and its perceptions of historical trends, current conditions, expected future developments and other factors we believe are appropriate under the circumstances. As you review and consider information presented herein, you should understand that these statements are not guarantees of future performance or results. They depend upon future events and are subject to risks, uncertainties (many of which are beyond the Company's control) and assumptions. Factors that could cause actual results to differ from those expressed or implied by our forward-looking statements include, among other things: ongoing and future economic and geopolitical conditions, including the impact of inflation, elevated interest rates, and tariff and trade-related developments, competition in our industry and our ability to compete effectively, and regulatory developments; the successful integration of acquired businesses; our ability to execute on our strategy and achieve our goals following the completion of the sale of our Healthcare RCM and merchant services businesses; and future decisions made by us and our competitors. All of these factors are difficult or impossible to predict accurately and many of them are beyond our control. For a further list and description of these and other important risks and uncertainties that may affect our future operations, see Part I, Item 1A - Risk Factors in our most recent Annual Report on Form 10-K filed with the Securities and Exchange Commission, which we have updated and may further update in Part II, Item 1A - Risk Factors in Quarterly Reports on Form 10-Q we have filed or will file hereafter.
Any forward-looking statement made by us in this release speaks only as of the date of this release and we undertake no obligation to publicly update any forward-looking statement, whether as a result of new information, future developments or otherwise, except as may be required by law.
Contact:
Clay Whitson
Chief Strategy Officer
(888) 251-0987
-MORE-

IIIV Reports Second Quarter Fiscal Year 2025 Financial Results
Page 5
May 8, 2025
i3 Verticals, Inc. Consolidated Statements of Operations
(Unaudited)
($ in thousands, except share and per share amounts)
Three Months Ended March 31,Six Months Ended March 31,
20252024% Change20252024% Change
Revenue$63,059 $57,968 9%$124,750 $113,022 10%
Operating expenses
Other costs of services (excluding depreciation and amortization)(1)
22,187 21,147 5%43,218 40,724 6%
Selling, general and administrative(1)
28,687 27,432 5%57,587 54,607 5%
Depreciation and amortization7,840 7,193 9%15,524 14,247 9%
Change in fair value of contingent consideration381 (290)n/m1,758 (527)n/m
Total operating expenses59,095 55,482 7%118,087 109,051 8%
Income from operations3,964 2,486 59%6,663 3,971 68%
Other (income) expenses
Interest expense446 7,714 (94)%1,126 14,401 (92)%
Other income(631)(2,257)(72)%(2,457)(2,150)14%
Total other (income) expenses(185)5,457 n/m(1,331)12,251 n/m
Income (loss) before income taxes4,149 (2,971)n/m7,994 (8,280)n/m
Provision for (benefit from) income taxes3,054 (669)n/m3,577 (1,763)n/m
Net income (loss) from continuing operations(2)
1,095 (2,302)4,417 (6,517)
Net (loss) income from discontinued operations, net of income taxes(326)5,650 (540)11,401 
Net income769 3,348 (77)%3,877 4,884 (21)%
Net income (loss) from continuing operations attributable to non-controlling interest(2)
1,022 (593)2,150 (1,923)
Net (loss) income from discontinued operations attributable to non-controlling interest(99)2,063 (175)3,831 
Net income attributable to non-controlling interest923 1,470 (37)%1,975 1,908 4%
Net income (loss) from continuing operations attributable to i3 Verticals, Inc.(2)
73 (1,709)2,267 (4,594)
Net (loss) income from discontinued operations attributable to i3 Verticals, Inc.(227)3,587 (365)7,570 
Net (loss) income attributable to i3 Verticals, Inc.$(154)$1,878 n/m$1,902 $2,976 (36)%
Net income (loss) per share attributable to Class A common stockholders from continuing operations(2):
Basic$0.00 $(0.07)$0.10 $(0.20)
Diluted$0.00 $(0.07)$0.09 $(0.20)
Net (loss) income per share attributable to Class A common stockholders from discontinued operations:
Basic$(0.01)$0.15 $(0.02)$0.32 
Diluted$(0.01)$0.15 $(0.02)$0.31 
Weighted average shares of Class A common stock outstanding:
Basic, for continuing operations(2)
23,834,233 23,331,239 23,691,648 23,299,214 
Diluted, for continuing operations(2)
24,133,738 23,331,239 24,081,232 23,299,214 
Basic, for discontinued operations23,834,233 23,331,239 23,691,648 23,299,214 
Diluted, for discontinued operations23,834,233 23,718,474 23,691,648 33,819,224 
See footnotes on the next page.
-MORE-

IIIV Reports Second Quarter Fiscal Year 2025 Financial Results
Page 6
May 8, 2025
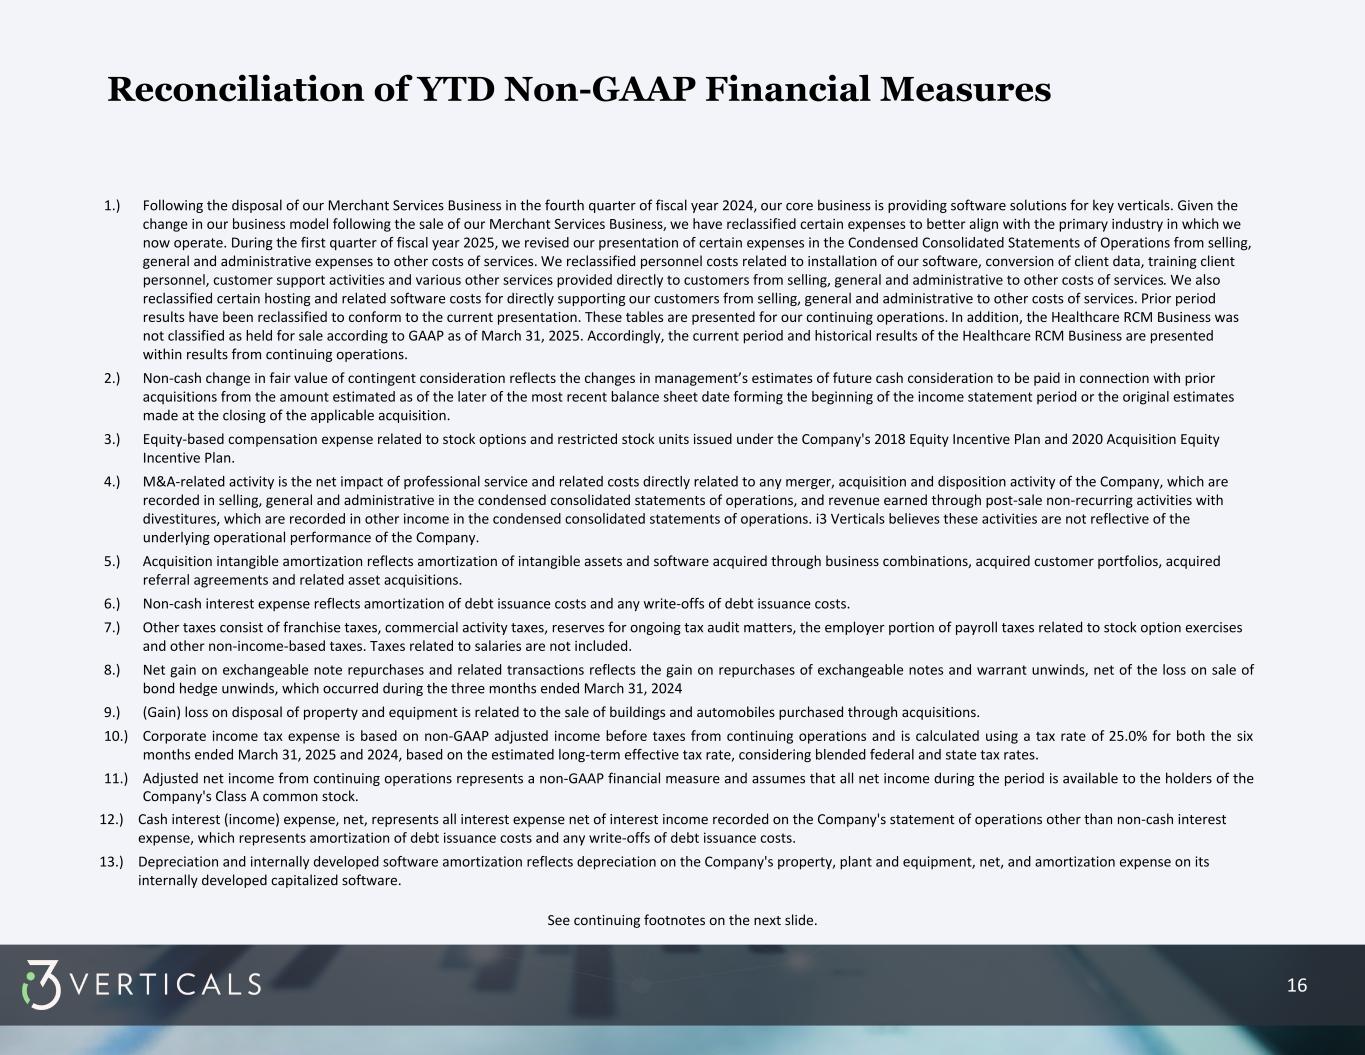
1.Following the disposal of the Company's Merchant Services Business in the fourth quarter of fiscal year 2024, the Company’s core business is providing software solutions for key verticals. Given the change in the Company's business model following the sale of the Company's Merchant Services Business, the Company has reclassified certain expenses to better align with the primary industry in which it now operates. During the first quarter of fiscal year 2025, the Company revised its presentation of certain expenses in the Condensed Consolidated Statements of Operations from selling, general and administrative expenses to other costs of services. The Company reclassified personnel costs related to installation of the Company's software, conversion of client data, training client personnel, customer support activities and various other services provided directly to customers from selling, general and administrative to other costs of services. The Company also reclassified certain hosting and related software costs for directly supporting the Company's customers from selling, general and administrative to other costs of services. Prior period results have been reclassified to conform to the current presentation.
2.In addition, the Healthcare RCM Business was not classified as held for sale according to GAAP as of March 31, 2025. Accordingly, the current period and historical results of the Healthcare RCM Business are presented within results from continuing operations.
-MORE-

IIIV Reports Second Quarter Fiscal Year 2025 Financial Results
Page 7
May 8, 2025
i3 Verticals, Inc. Consolidated Balance Sheets
(Unaudited)
($ in thousands, except share and per share amounts)
March 31,September 30,
20252024
Assets
Current assets
Cash and cash equivalents$7,749 $86,541 
Accounts receivable, net56,716 55,988 
Settlement assets67 632 
Prepaid expenses and other current assets15,467 10,232 
Total current assets79,999 153,393 
Property and equipment, net7,555 8,677 
Restricted cash2,450 2,424 
Capitalized software, net55,175 58,592 
Goodwill280,678 280,678 
Intangible assets, net156,331 162,816 
Deferred tax asset49,778 48,445 
Operating lease right-of-use assets7,807 8,954 
Other assets6,586 6,696 
Total assets$646,359 $730,675 
Liabilities and equity
Liabilities
Current liabilities
Accounts payable$4,319 $5,370 
Current portion of long-term debt— 26,223 
Accrued expenses and other current liabilities22,733 89,972 
Settlement obligations67 632 
Deferred revenue37,229 39,029 
Current portion of operating lease liabilities3,340 3,505 
Total current liabilities67,688 164,731 
Long-term debt, less current portion12,000 — 
Long-term tax receivable agreement obligations33,526 29,347 
Operating lease liabilities, less current portion4,721 6,317 
Other long-term liabilities14,765 14,921 
Total liabilities132,700 215,316 
Commitments and contingencies
Stockholders' equity
Preferred stock, par value $0.0001 per share, 10,000,000 shares authorized; 0 shares issued and outstanding as of March 31, 2025 and September 30, 2024
— — 
Class A common stock, par value $0.0001 per share, 150,000,000 shares authorized; 24,386,990 and 23,882,035 shares issued and outstanding as of March 31, 2025 and September 30, 2024, respectively
Class B common stock, par value $0.0001 per share, 40,000,000 shares authorized; 8,832,061 and 10,032,676 shares issued and outstanding as of March 31, 2025 and September 30, 2024, respectively
Additional paid-in capital282,872 279,335 
Accumulated earnings102,299 100,397 
Total stockholders' equity385,174 379,735 
Non-controlling interest128,485 135,624 
Total equity513,659 515,359 
Total liabilities and equity$646,359 $730,675 
-MORE-

IIIV Reports Second Quarter Fiscal Year 2025 Financial Results
Page 8
May 8, 2025
i3 Verticals, Inc. Consolidated Cash Flow Data
(Unaudited)
($ in thousands)
Six Months Ended March 31,
20252024
Net cash (used in) provided by operating activities(1)
$(15,627)$25,147 
Net cash used in investing activities$(3,675)$(12,369)
Net cash used in financing activities$(60,029)$(17,885)
___________________________________________________________
1.Cash used in operating activities during the six months ended March 31, 2025, included $34,157 in cash paid for income taxes, primarily driven by the sale of the Merchant Services Business in the fourth quarter of fiscal year 2024.

Reconciliation of GAAP to Non-GAAP Financial Measures
The Company discloses the following non-GAAP financial measures in this earnings release:

Adjusted Income Before Taxes from Continuing Operations. Adjusted income before taxes from continuing operations equals net income (loss) from continuing operations attributable to i3 Verticals Inc., adjusted to add back net income (loss) from continuing operations attributable to non-controlling interest and to exclude certain items on a pre-tax basis which the Company believes may not fully reflect our underlying operating performance. The Company believes that this non-GAAP measure provides useful information to investors in understanding and evaluating the Company’s results of continuing operations and ongoing operational performance on a pre-tax basis.

Adjusted Net Income from Continuing Operations and Adjusted Diluted Earnings per Share from Continuing Operations. Adjusted net income from continuing operations equals adjusted income before taxes from continuing operations as described above, adjusted to give effect to an effective tax rate of 25%, which reflects our estimated long-term effective tax rate, considering blended federal and state tax rates. Adjusted diluted earnings per share from continuing operations equals adjusted net income from continuing operations divided by our adjusted weighted average shares of adjusted diluted Class A common stock outstanding. The Company believes that these non-GAAP measures provide useful information to investors in understanding and evaluating the Company’s results of continuing operations and ongoing operational performance on a post-tax basis after giving effect to this assumed tax rate. Adjusted Diluted Earnings per Share from Continuing Operations has also been utilized as a metric in connection with performance-based equity awards previously granted by the Company to executives.

Adjusted EBITDA from Continuing Operations and Adjusted EBITDA Margin from Continuing Operations. Adjusted EBITDA from continuing operations equals net income (loss) from continuing operations attributable to i3 Verticals Inc., before interest, income taxes, depreciation and amortization, adjusted to add back net income (loss) from continuing operations attributable to non-controlling interest, and to exclude certain items which the Company believes do not fully reflect our underlying operating performance. Adjusted EBITDA margin represents adjusted EBITDA as a percentage of revenue. The Company believes that these non-GAAP measures provide useful information to investors in understanding and evaluating the Company’s results of continuing operations and ongoing operational performance. Adjusted EBITDA from continuing operations and Adjusted EBITDA margin as presented at a segment level are measures reported to the Company's management for purposes of making decisions about allocating resources and assessing the performance of our business segments, and these measures are presented in the Company's financial statement footnotes in accordance with ASC 280. Adjusted EBITDA and Adjusted EBITDA margin, as presented on a consolidated basis, are non-GAAP financial measures. In addition, Adjusted EBITDA and Adjusted EBITDA margin have been metrics utilized in connection with the Company’s short-term annual cash incentive program for executive management.

-MORE-

IIIV Reports Second Quarter Fiscal Year 2025 Financial Results
Page 9
May 8, 2025
The Company believes that the disclosure of these non-GAAP financial measures provides investors with useful information in connection with assessing the Company's financial results as described above. In addition, these non-GAAP financial measures are utilized by management to assess the Company's financial results, evaluate the Company's business, manage budgets, allocate resources, and make operational decisions. The Company believes that disclosure of these non-GAAP financial measures provides investors with additional information to help them better understand our financial results just as management utilizes these non-GAAP financial measures as described above. Although these non-GAAP financial measures assist in measuring the Company's financial results and assessing its financial performance, they are not necessarily comparable to similarly titled measures of other companies due to potential inconsistencies in the method of calculation.

See below for reconciliations of the non-GAAP financial measures presented in this release.

-MORE-

IIIV Reports Second Quarter Fiscal Year 2025 Financial Results
Page 10
May 8, 2025
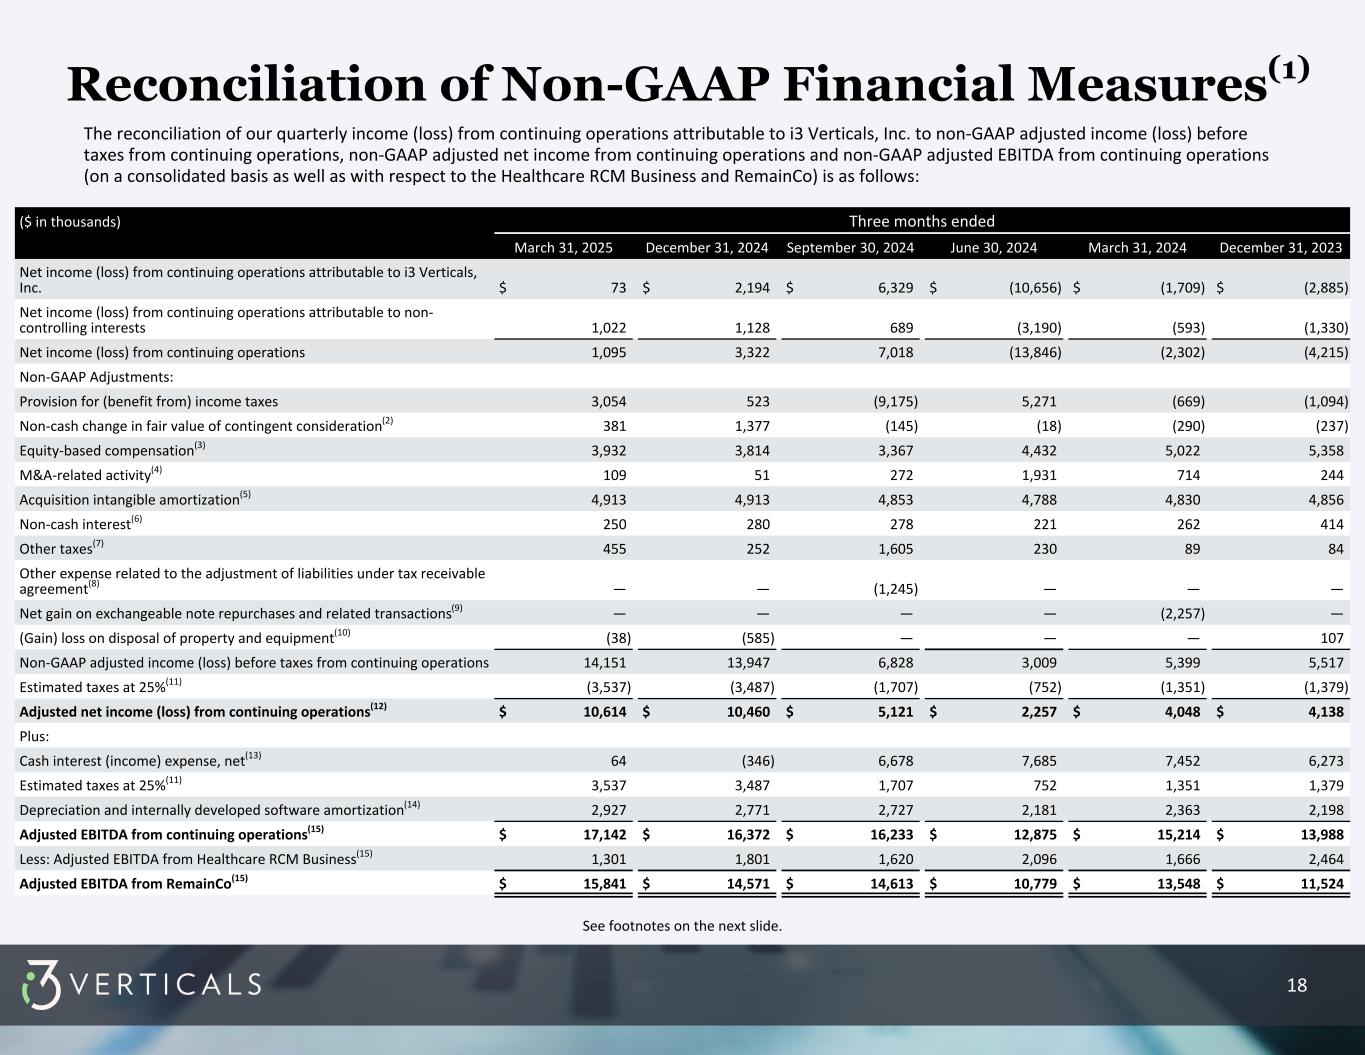
i3 Verticals, Inc. Reconciliation of GAAP Net Income (Loss) from Continuing Operations(1) to
Non-GAAP Adjusted Net Income from Continuing Operations(1) and
Non-GAAP Adjusted EBITDA from Continuing Operations(1)
(Unaudited)
($ in thousands)
Three Months Ended March 31,Six Months Ended March 31,
2025202420252024
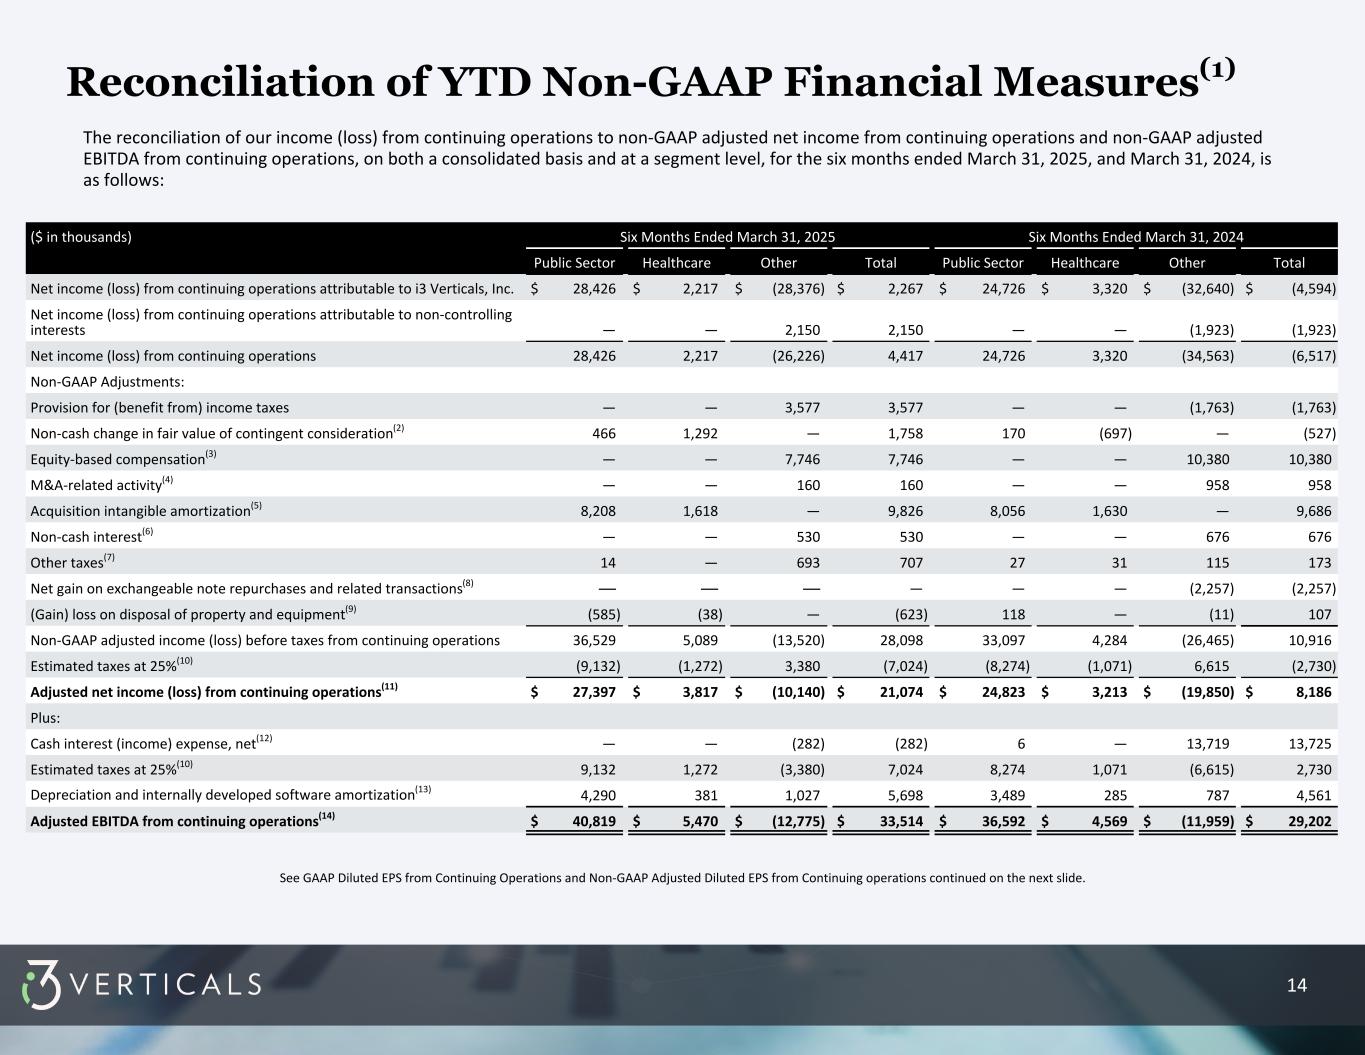
Net income (loss) from continuing operations attributable to i3 Verticals, Inc.$73 $(1,709)$2,267 $(4,594)
Net income (loss) from continuing operations attributable to non-controlling interest1,022 (593)2,150 (1,923)
Net income (loss) from continuing operations1,095 (2,302)4,417 (6,517)
Non-GAAP adjustments:
Provision for (benefit from) income taxes3,054 (669)3,577 (1,763)
Non-cash change in fair value of contingent consideration(2)
381 (290)1,758 (527)
Equity-based compensation from continuing operations(3)
3,932 5,022 7,746 10,380 
M&A-related activity(4)
109 714 160 958 
Acquisition intangible amortization(5)
4,913 4,830 9,826 9,686 
Non-cash interest expense(6)
250 262 530 676 
Other taxes(7)
455 89 707 173 
Net gain on exchangeable note repurchases and related transactions(8)
— (2,257)— (2,257)
(Gain) loss on disposal of property and equipment(9)
(38)— (623)107 
Non-GAAP adjusted income before taxes from continuing operations(10)
$14,151 $5,399 $28,098 $10,916 
Estimated taxes at 25%(11)
(3,537)(1,352)(7,024)(2,730)
Adjusted net income from continuing operations(12)
$10,614 $4,047 $21,074 $8,186 
Cash interest (income) expense, net(13)
64 7,452 (282)13,725 
Estimated taxes at 25%(11)
3,537 1,352 7,024 2,730 
Depreciation and internally developed software amortization(14)
2,927 2,363 5,698 4,561 
Adjusted EBITDA from continuing operations(15)
$17,142 $15,214 $33,514 $29,202 
________________
1.In addition, the Healthcare RCM Business was not classified as held for sale according to GAAP as of March 31, 2025. Accordingly, the current period and historical results of the Healthcare RCM Business are presented within results from continuing operations.
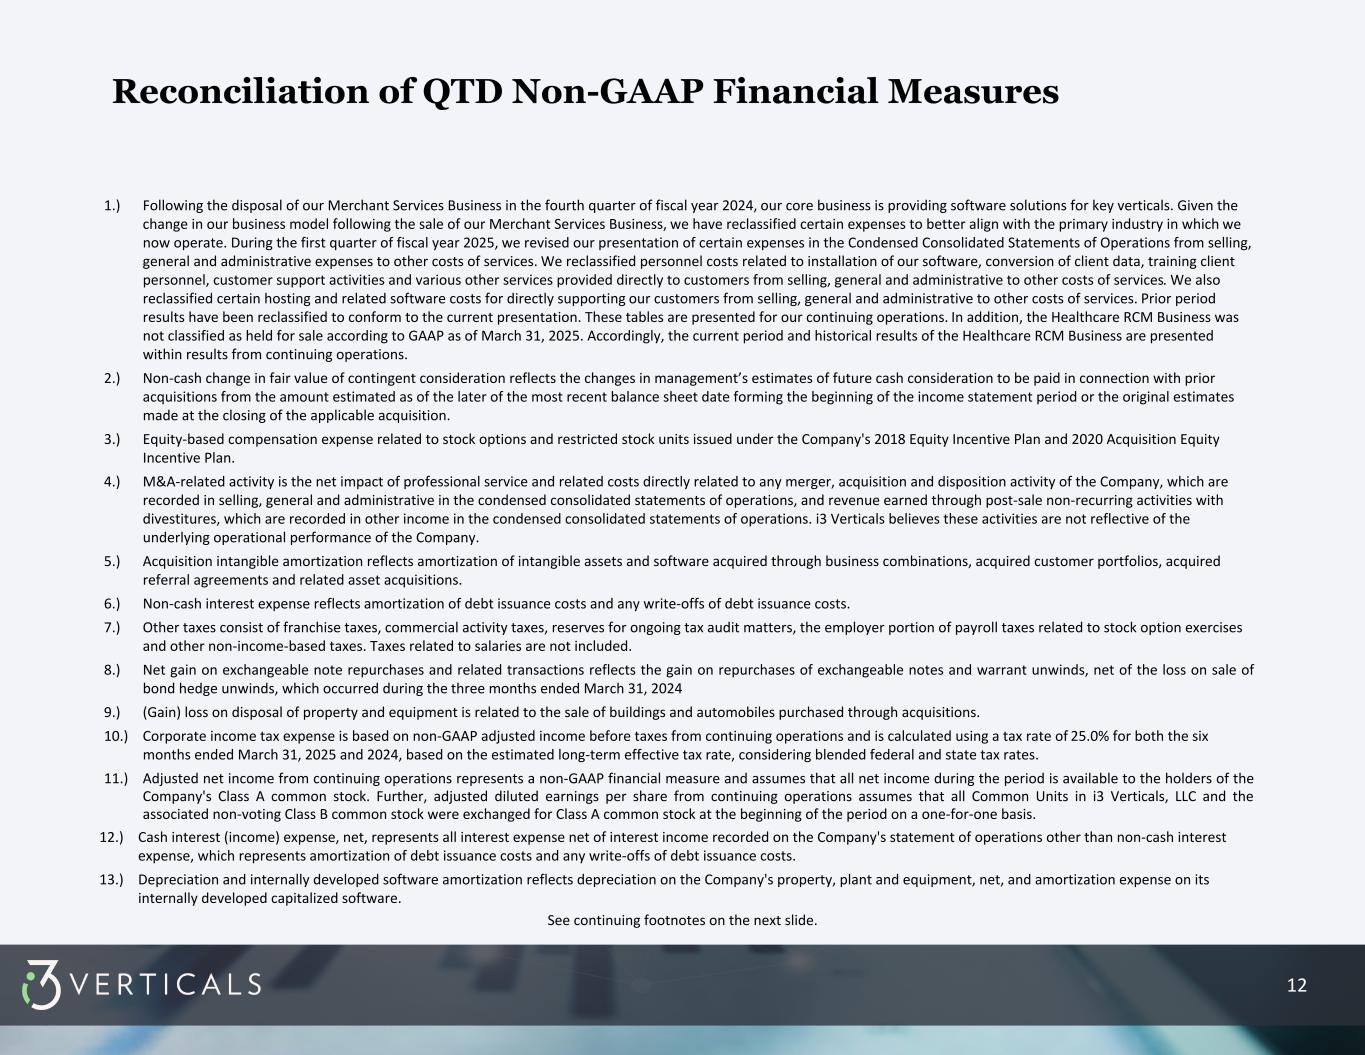
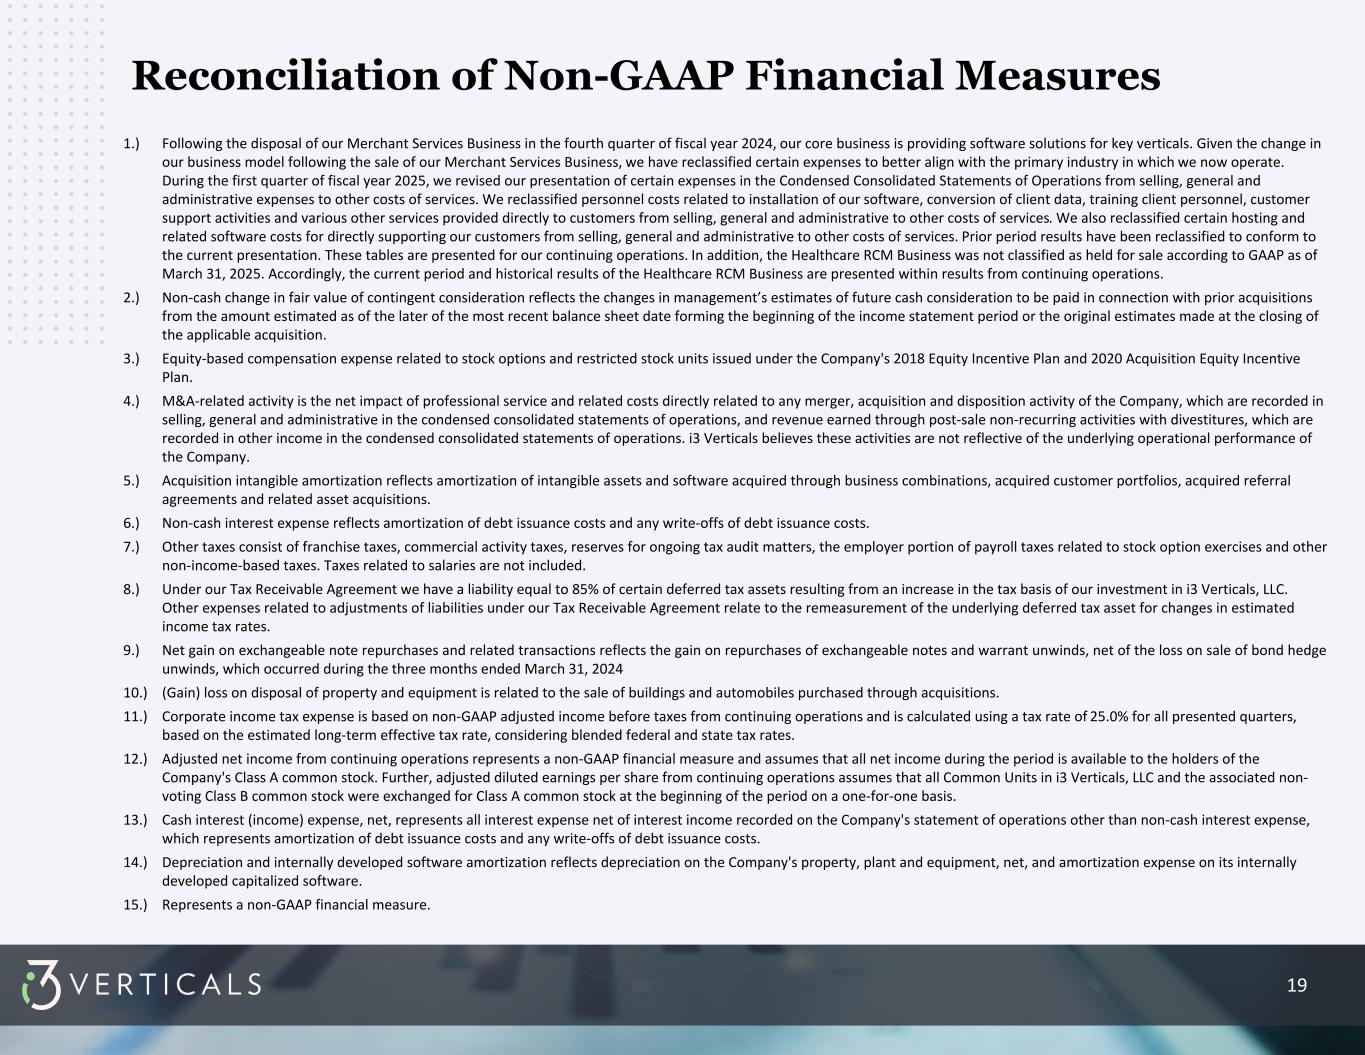
2.Non-cash change in fair value of contingent consideration reflects the changes in management’s estimates of future cash consideration to be paid in connection with prior acquisitions from the amount estimated as of the later of the most recent balance sheet date forming the beginning of the income statement period or the original estimates made at the closing of the applicable acquisition.
3.Equity-based compensation expense related to stock options and restricted stock units issued under the Company's 2018 Equity Incentive Plan and 2020 Acquisition Equity Incentive Plan.
4.M&A-related activity is the net impact of professional service and related costs directly related to any merger, acquisition and disposition activity of the Company, which are recorded in selling, general and administrative in the condensed consolidated statements of operations, and revenue earned through post-sale non-recurring activities with divestitures, which are recorded in other income in the condensed consolidated statements of operations. i3 Verticals believes these activities are not reflective of the underlying operational performance of the Company.
5.Acquisition intangible amortization reflects amortization of intangible assets and software acquired through business combinations, acquired customer portfolios, acquired referral agreements and related asset acquisitions.
6.Non-cash interest expense reflects amortization of debt issuance costs and any write-offs of debt issuance costs.
7.Other taxes consist of franchise taxes, commercial activity taxes, reserves for ongoing tax audit matters, the employer portion of payroll taxes related to stock option exercises and other non-income-based taxes. Taxes related to salaries are not included.
8.Net gain on exchangeable note repurchases and related transactions reflects the gain on repurchases of exchangeable notes and warrant unwinds, net of the loss on sale of bond hedge unwinds, which occurred during the three months ended March 31, 2024.
9.(Gain) loss on disposal of property and equipment is related to the sale of buildings and automobiles purchased through acquisitions.
-MORE-

IIIV Reports Second Quarter Fiscal Year 2025 Financial Results
Page 11
May 8, 2025
10.Adjusted income before taxes from continuing operations is the same measure as pro forma adjusted income before taxes from continuing operations as was disclosed by the Company in prior earnings releases. There has not been any change in the manner in which adjusted income before taxes from continuing operations has been calculated in comparison to the calculation of pro forma adjusted income before taxes from continuing operations as previously disclosed by the Company.
11.Corporate income tax expense is based on non-GAAP adjusted income before taxes from continuing operations and is calculated using a tax rate of 25.0% for both the six months ended March 31, 2025 and 2024, based on the estimated long-term effective tax rate, considering blended federal and state tax rates.
12.Adjusted net income from continuing operations represents a non-GAAP financial measure and assumes that all net income during the period is available to the holders of the Company's Class A common stock. Adjusted net income from continuing operations is the same measure as pro forma adjusted net income from continuing operations as was disclosed by the Company in prior earnings release. There has not been any change in the manner in which adjusted net income from continuing operations has been calculated in comparison to the calculation of pro forma adjusted net income from continuing operations as previously disclosed by the Company.
13.Cash interest (income) expense, net, represents all interest expense net of interest income recorded on the Company's statement of operations other than non-cash interest expense, which represents amortization of debt issuance costs and any write-offs of debt issuance costs.
14.Depreciation and internally developed software amortization reflects depreciation on the Company's property, plant and equipment, net, and amortization expense on its internally developed capitalized software.
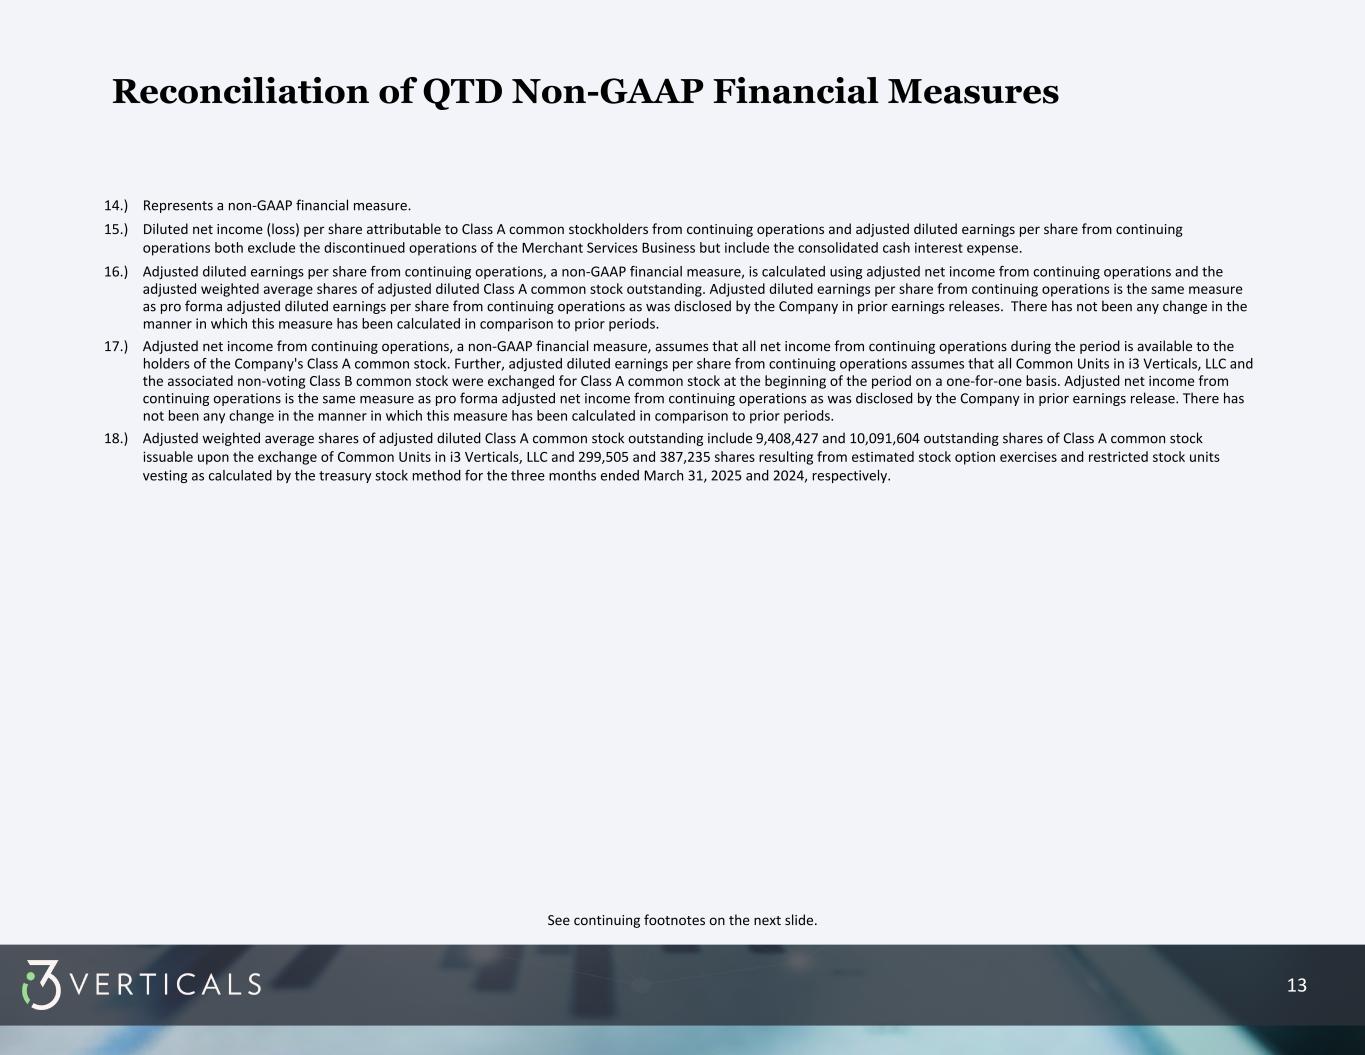
15.Represents a non-GAAP financial measure.
-MORE-

IIIV Reports Second Quarter Fiscal Year 2025 Financial Results
Page 12
May 8, 2025
i3 Verticals, Inc. GAAP Diluted EPS from Continuing Operations and
Non-GAAP Adjusted Diluted EPS from Continuing Operations(1)
(Unaudited)
($ in thousands, except share and per share amounts)
Three Months Ended March 31,Six Months Ended March 31,
2025202420252024
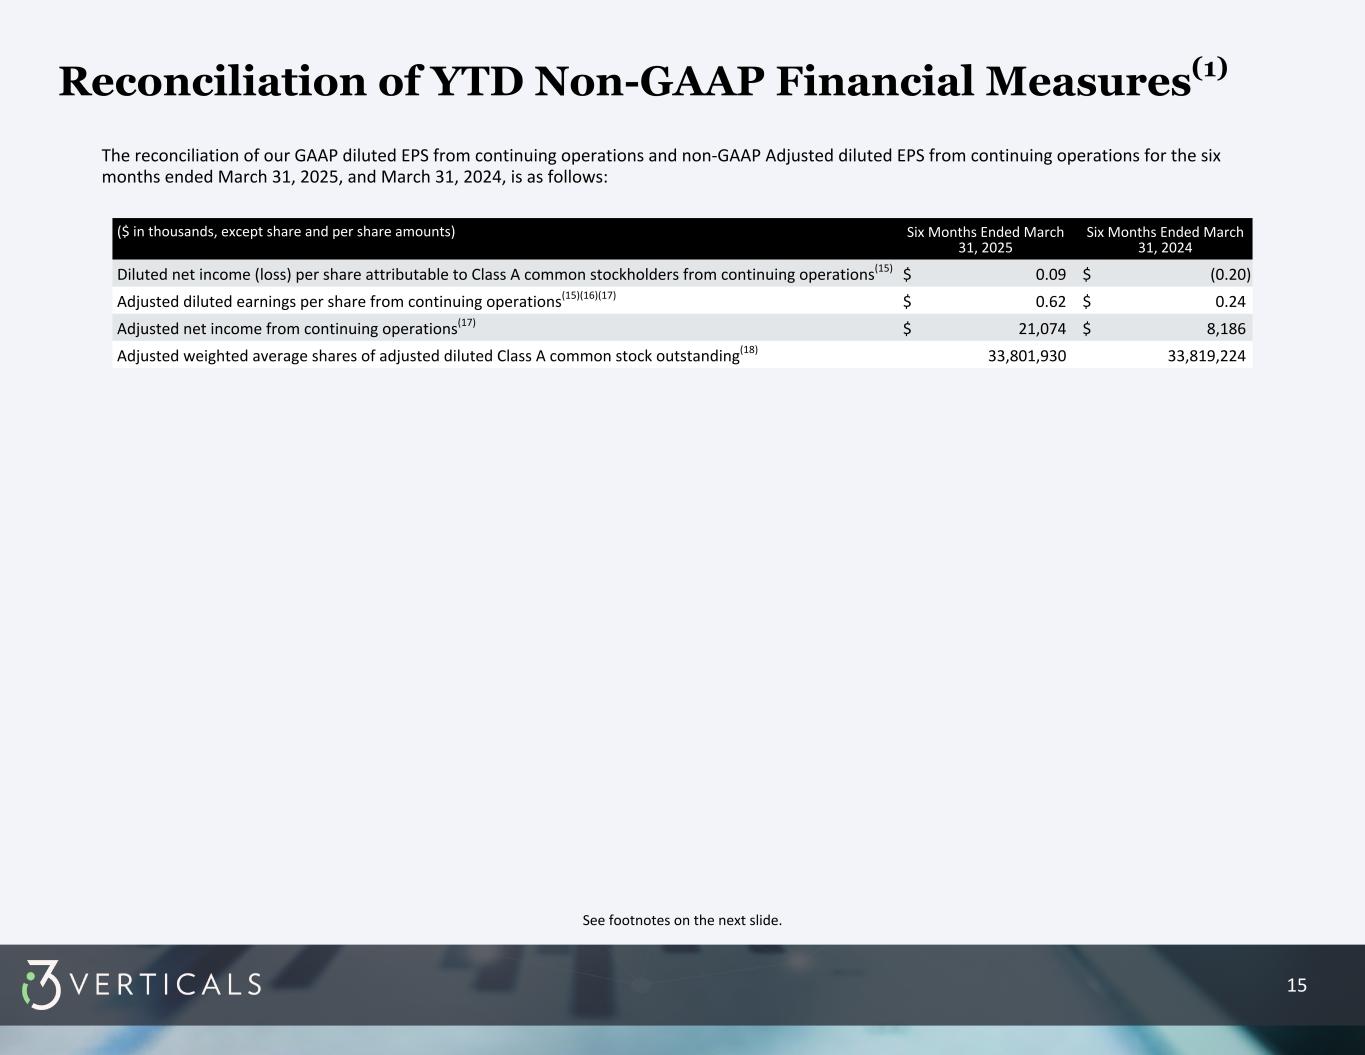
Diluted net income (loss) per share attributable to Class A common stockholders from continuing operations(2)
$0.00 $(0.07)$0.09 $(0.20)
Adjusted diluted earnings per share from continuing operations(2)(3)(4)
$0.32 $0.12 $0.62 $0.24 
Adjusted net income from continuing operations(4)
$10,614 $4,047 $21,074 $8,186 
Adjusted weighted average shares of adjusted diluted Class A common stock outstanding(5)
33,542,165 33,810,078 33,801,930 33,819,224 
________________
1.In addition, the Healthcare RCM Business was not classified as held for sale according to GAAP as of March 31, 2025. Accordingly, the current period and historical results of the Healthcare RCM Business are presented within results from continuing operations.
2.Diluted net income (loss) per share attributable to Class A common stockholders from continuing operations and adjusted diluted earnings per share from continuing operations both exclude the discontinued operations of the Merchant Services Business but include the consolidated cash interest expense.
3.Adjusted diluted earnings per share from continuing operations, a non-GAAP financial measure, is calculated using adjusted net income from continuing operations and the adjusted weighted average shares of adjusted diluted Class A common stock outstanding. Adjusted diluted earnings per share from continuing operations is the same measure as pro forma adjusted diluted earnings per share from continuing operations as was disclosed by the Company in prior earnings releases. There has not been any change in the manner in which this measure has been calculated in comparison to prior periods.
4.Adjusted net income from continuing operations, a non-GAAP financial measure, assumes that all net income from continuing operations during the period is available to the holders of the Company's Class A common stock. Further, adjusted diluted earnings per share from continuing operations assumes that all Common Units in i3 Verticals, LLC and the associated non-voting Class B common stock were exchanged for Class A common stock at the beginning of the period on a one-for-one basis. Adjusted net income from continuing operations is the same measure as pro forma adjusted net income from continuing operations as was disclosed by the Company in prior earnings release. There has not been any change in the manner in which this measure has been calculated in comparison to prior periods.
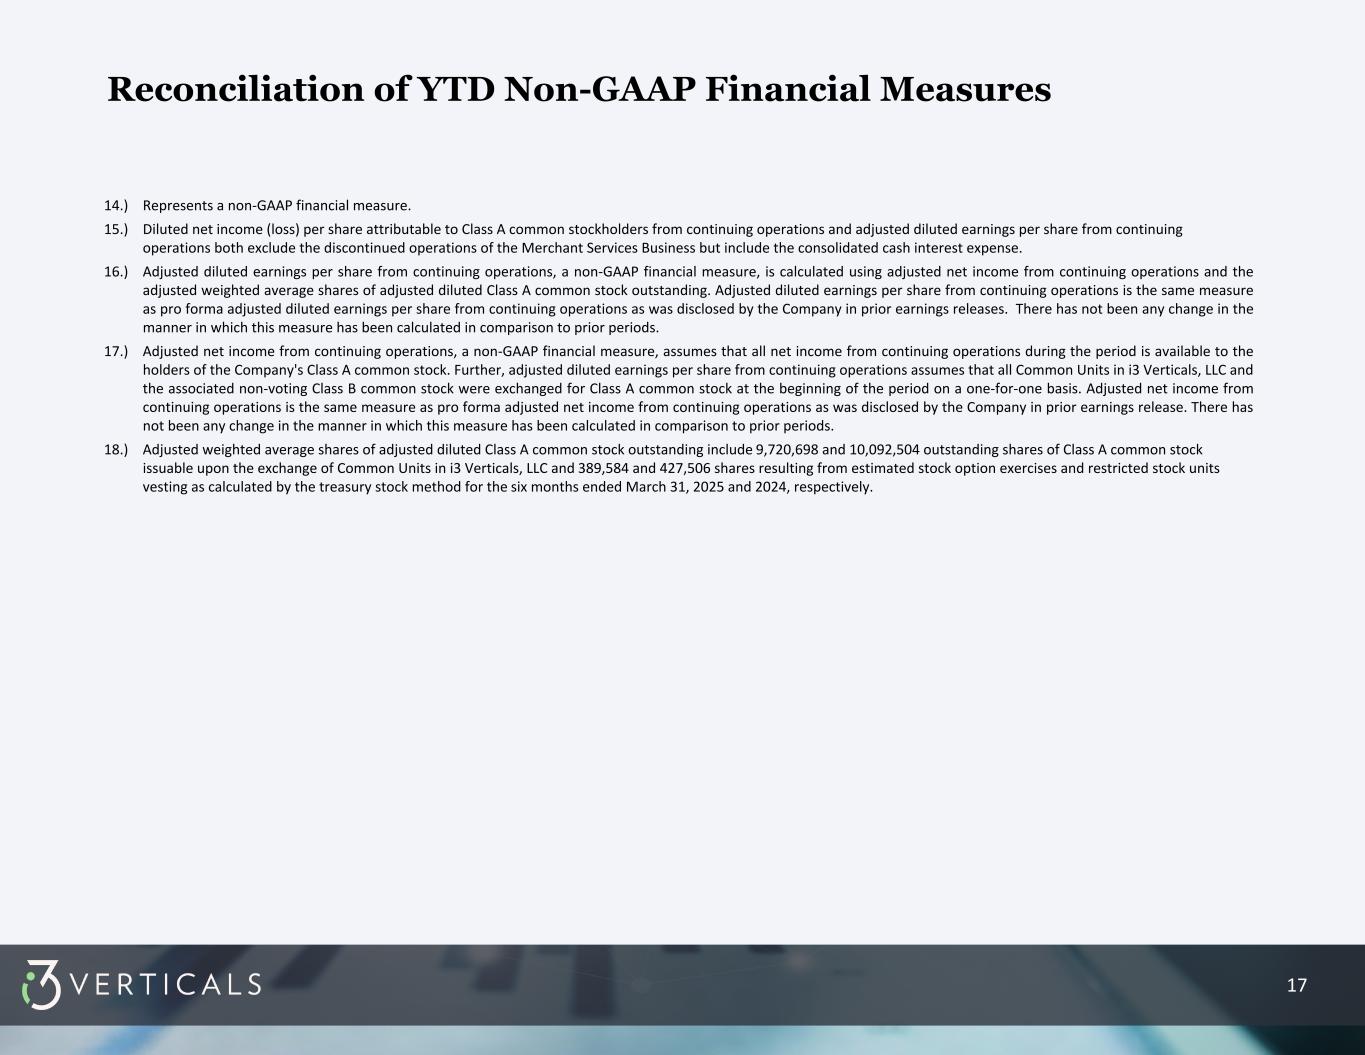
5.Adjusted weighted average shares of adjusted diluted Class A common stock outstanding include 9,408,427 and 10,091,604 outstanding shares of Class A common stock issuable upon the exchange of Common Units in i3 Verticals, LLC and 299,505 and 387,235 shares resulting from estimated stock option exercises and restricted stock units vesting as calculated by the treasury stock method for the three months ended March 31, 2025 and 2024, respectively. Adjusted weighted average shares of adjusted diluted Class A common stock outstanding include 9,720,698 and 10,092,504 outstanding shares of Class A common stock issuable upon the exchange of Common Units in i3 Verticals, LLC and 389,584 and 427,506 shares resulting from estimated stock option exercises and restricted stock units vesting as calculated by the treasury stock method for the six months ended March 31, 2025 and 2024, respectively. Adjusted weighted average shares of adjusted diluted Class A common stock outstanding is the same figure as pro forma weighted average shares of adjusted diluted Class A common stock outstanding as was disclosed by the Company in prior earnings release. There has not been any change in the manner in which this figure is calculated in comparison to prior periods.
-END-
1 Supplemental Information Q2 FISCAL YEAR 2025


2 ($ in thousands) Quarter Ended March 31, 2025 December 31, 2024 September 30, 2024 June 30, 2024 March 31, 2024 December 31, 2023 September 30, 2023 June 30, 2023 March 31, 2023 Software and related service revenue SaaS(2) $ 10,585 $ 10,182 $ 9,677 $ 8,834 $ 8,809 $ 8,742 $ 8,977 $ 8,523 $ 8,244 Transaction-based(3) 4,043 3,836 4,121 3,928 3,538 3,651 3,706 3,291 3,174 Maintenance(4) 8,288 8,796 8,783 8,433 8,125 8,207 7,970 8,336 8,039 Recurring software services(5) 11,092 10,343 10,497 10,913 11,263 10,205 10,303 11,127 10,567 Professional services(6) 9,410 9,841 10,062 8,906 9,199 8,881 10,777 10,039 10,634 Software licenses 2,805 2,677 2,498 405 963 417 2,714 2,380 3,193 Total $ 46,223 $ 45,675 $ 45,638 $ 41,419 $ 41,897 $ 40,103 $ 44,447 $ 43,696 $ 43,851 Year-over-year growth 10 % 14 % 3 % (5) % (4) % Payments revenue $ 14,141 $ 13,511 $ 12,225 $ 11,867 $ 13,572 $ 12,677 $ 11,296 $ 10,895 $ 12,903 Year-over-year growth 4 % 7 % 8 % 9 % 5 % Other revenue Recurring(7) $ 1,614 $ 1,646 $ 1,738 $ 1,343 $ 1,405 $ 1,423 $ 1,526 $ 1,445 $ 1,363 Other 1,081 859 1,263 1,408 1,094 851 1,315 1,224 1,050 Total $ 2,695 $ 2,505 $ 3,001 $ 2,751 $ 2,499 $ 2,274 $ 2,841 $ 2,669 $ 2,413 Year-over-year growth 8 % 10 % 6 % 3 % 4 % Total revenue $ 63,059 $ 61,691 $ 60,864 $ 56,037 $ 57,968 $ 55,054 $ 58,584 $ 57,260 $ 59,167 Recurring revenue(8) $ 49,763 $ 48,314 $ 47,040 $ 45,318 $ 46,712 $ 44,905 $ 43,778 $ 43,617 $ 44,290 Annualized Recurring Revenue “ARR”(9) Software and related service revenue $ 136,032 $ 132,628 $ 132,313 $ 128,432 $ 126,940 $ 123,220 $ 123,824 $ 125,108 $ 120,096 Payments revenue 56,564 54,044 48,898 47,468 54,288 50,708 45,184 43,580 51,612 Other revenue 6,456 6,584 6,951 5,372 5,620 5,692 6,104 5,780 5,452 Total ARR $ 199,052 $ 193,256 $ 188,162 $ 181,272 $ 186,848 $ 179,620 $ 175,112 $ 174,468 $ 177,160 Year-over-year growth 7 % 8 % 7 % 4 % 5 % Revenue Composition(1) See footnotes continued on the next slide.


3 1.) As a result of the sale of our merchant services business (the “Merchant Services Business”) on September 20, 2024, the historical results of our Merchant Services Business have been reflected in discontinued operations in the results of operations included in this supplemental information, and continuing operations reflect our remaining operations after giving effect to such classification. Prior period results have been recast to reflect this presentation. In addition, as previously announced, on May 5, 2025, the Company entered into a securities purchase agreement pursuant to which the Company sold its healthcare revenue cycle management business (the “Healthcare RCM Business”) on such date to Infinx, Inc. In addition, the Healthcare RCM Business was not classified as held for sale according to GAAP as of March 31, 2025. Accordingly, the current period and historical results of the Healthcare RCM Business are presented within results from continuing operations. On subsequent slides, we present certain revenue-related information (i) with respect to the Healthcare RCM Business, (ii) with respect to our remaining business after giving effect to the removal of the Healthcare RCM Business (“RemainCo”), and (iii) on a consolidated basis for reconciliation purposes. 2.) SaaS revenue is earned when we provide, as a service to our customers over time, the right to access our software, generally hosted in a cloud environment. 3.) Transaction-based software revenue is earned when we provide services through our software and charge a per-transaction fee. For example, when we provide electronic filing services for courts and charge fees per filing, or when we stand-ready to process and bill utility customers and charge the utility a fee per bill electronically presented. 4.) Software maintenance revenue is earned when, following the implementation of our software systems, we provide ongoing software support services to assist our customers in operating the systems and to periodically update the software. 5.) Recurring software services are earned when we provide long-term, usually evergreen, contracted services to our customers through our software. The services provided, such as healthcare revenue cycle management, or automated collections management, are integrated into one of our software solutions. 6.) Professional services are earned when we provide customized services to our customers who utilize our software products. Many of our customers contract with us for installation, configuration, training, and data conversion projects, which do not necessarily recur, and as such are excluded from our calculation of ARR. 7.) Recurring other revenue primarily consists of recurring long-term contracts that are not specific to software, such as hardware maintenance plans or field service plans. 8.) Recurring revenue consists of software-as-a-service (“SaaS”) arrangements, transaction-based software-revenue, software maintenance revenue, recurring software-based services, payments revenue and other recurring revenue sources. This excludes contracts that are not recurring or are one-time in nature. 9.) Annualized Recurring Revenue (ARR) is the annualized revenue derived from recurring sources where the Company has an ongoing contract with our customers. We believe revenue from recurring sources is a strategic priority. ARR is comprised of software-as-a-service (“SaaS”) arrangements, transaction- based software-revenue, software maintenance, recurring software-based services, payments revenue and other recurring revenue sources within the quarter. The sum of these revenue categories is multiplied by four to calculate ARR. ARR excludes revenue that is not recurring or is one-time in nature. We believe this metric provides useful information to investors by providing visibility regarding the ongoing revenue potential of our business model and providing a clearer picture of our sustainable revenue base. Further, management uses ARR as a metric because it helps to assess the health and trajectory of our business. Our management believes that focusing on ARR can orient our sales and operations management towards long-term, reliable revenue growth. This focus on recurring revenue is particularly relevant for businesses operating under a subscription model, where customer retention and contract renewals play a significant role in long-term financial performance. ARR does not have a standardized definition and is therefore unlikely to be comparable to similarly titled measures presented by other companies. It should be reviewed independently of revenue and it is not a forecast. Additionally, ARR does not take into account seasonality. The active contracts at the end of a reporting period used in calculating ARR may or may not be extended or renewed by our customers. Revenue Composition


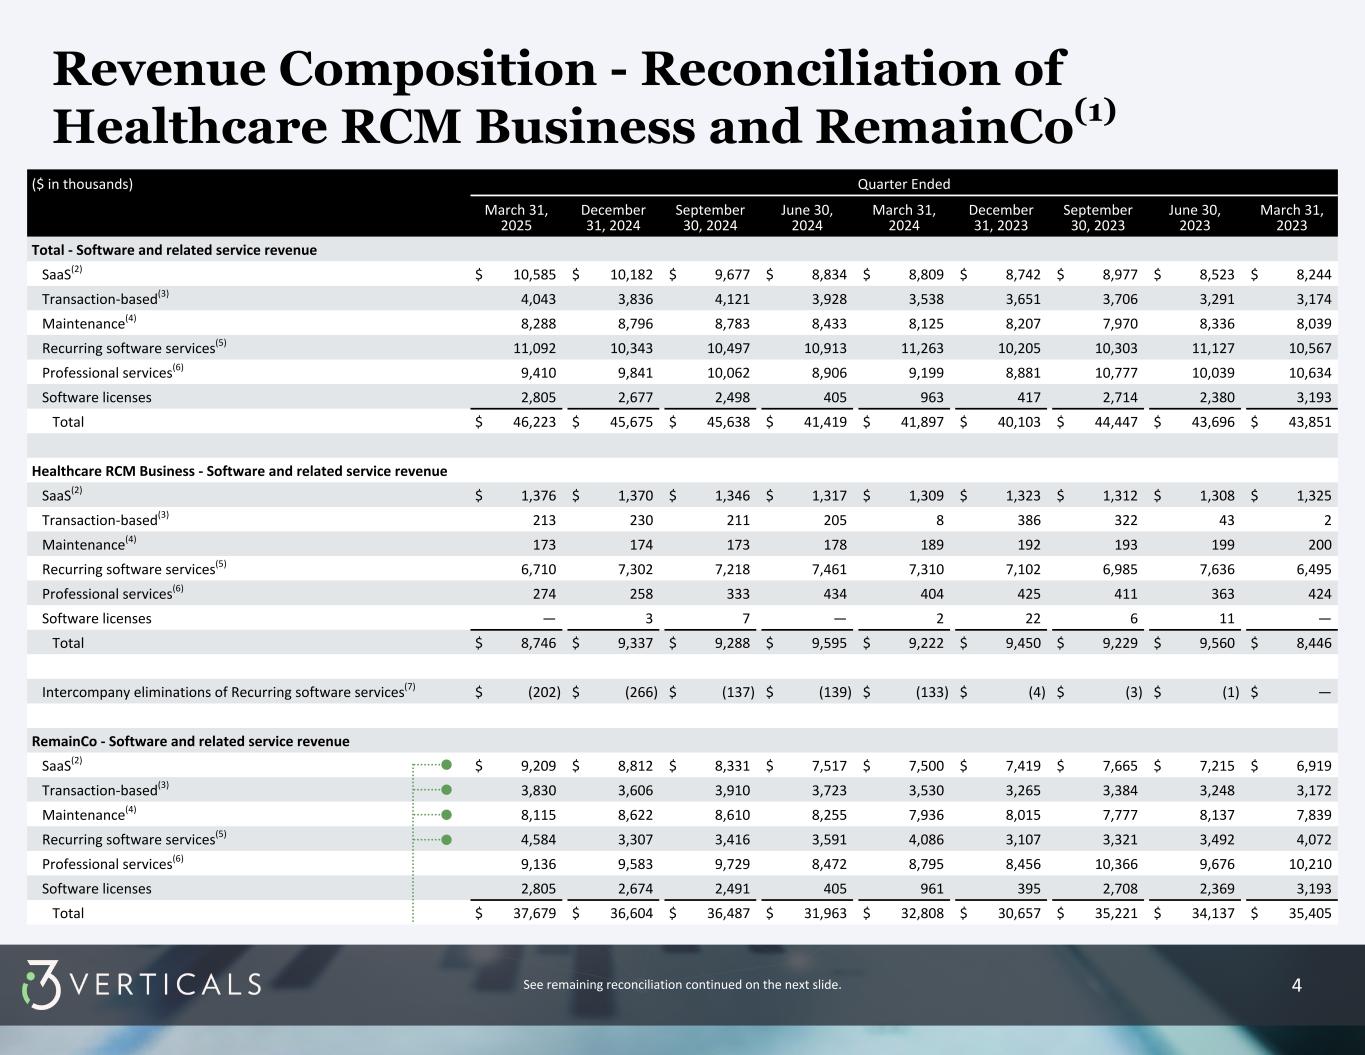
4 Revenue Composition - Reconciliation of Healthcare RCM Business and RemainCo(1) See remaining reconciliation continued on the next slide. ($ in thousands) Quarter Ended March 31, 2025 December 31, 2024 September 30, 2024 June 30, 2024 March 31, 2024 December 31, 2023 September 30, 2023 June 30, 2023 March 31, 2023 Total - Software and related service revenue SaaS(2) $ 10,585 $ 10,182 $ 9,677 $ 8,834 $ 8,809 $ 8,742 $ 8,977 $ 8,523 $ 8,244 Transaction-based(3) 4,043 3,836 4,121 3,928 3,538 3,651 3,706 3,291 3,174 Maintenance(4) 8,288 8,796 8,783 8,433 8,125 8,207 7,970 8,336 8,039 Recurring software services(5) 11,092 10,343 10,497 10,913 11,263 10,205 10,303 11,127 10,567 Professional services(6) 9,410 9,841 10,062 8,906 9,199 8,881 10,777 10,039 10,634 Software licenses 2,805 2,677 2,498 405 963 417 2,714 2,380 3,193 Total $ 46,223 $ 45,675 $ 45,638 $ 41,419 $ 41,897 $ 40,103 $ 44,447 $ 43,696 $ 43,851 Healthcare RCM Business - Software and related service revenue SaaS(2) $ 1,376 $ 1,370 $ 1,346 $ 1,317 $ 1,309 $ 1,323 $ 1,312 $ 1,308 $ 1,325 Transaction-based(3) 213 230 211 205 8 386 322 43 2 Maintenance(4) 173 174 173 178 189 192 193 199 200 Recurring software services(5) 6,710 7,302 7,218 7,461 7,310 7,102 6,985 7,636 6,495 Professional services(6) 274 258 333 434 404 425 411 363 424 Software licenses — 3 7 — 2 22 6 11 — Total $ 8,746 $ 9,337 $ 9,288 $ 9,595 $ 9,222 $ 9,450 $ 9,229 $ 9,560 $ 8,446 Intercompany eliminations of Recurring software services(7) $ (202) $ (266) $ (137) $ (139) $ (133) $ (4) $ (3) $ (1) $ — RemainCo - Software and related service revenue SaaS(2) $ 9,209 $ 8,812 $ 8,331 $ 7,517 $ 7,500 $ 7,419 $ 7,665 $ 7,215 $ 6,919 Transaction-based(3) 3,830 3,606 3,910 3,723 3,530 3,265 3,384 3,248 3,172 Maintenance(4) 8,115 8,622 8,610 8,255 7,936 8,015 7,777 8,137 7,839 Recurring software services(5) 4,584 3,307 3,416 3,591 4,086 3,107 3,321 3,492 4,072 Professional services(6) 9,136 9,583 9,729 8,472 8,795 8,456 10,366 9,676 10,210 Software licenses 2,805 2,674 2,491 405 961 395 2,708 2,369 3,193 Total $ 37,679 $ 36,604 $ 36,487 $ 31,963 $ 32,808 $ 30,657 $ 35,221 $ 34,137 $ 35,405


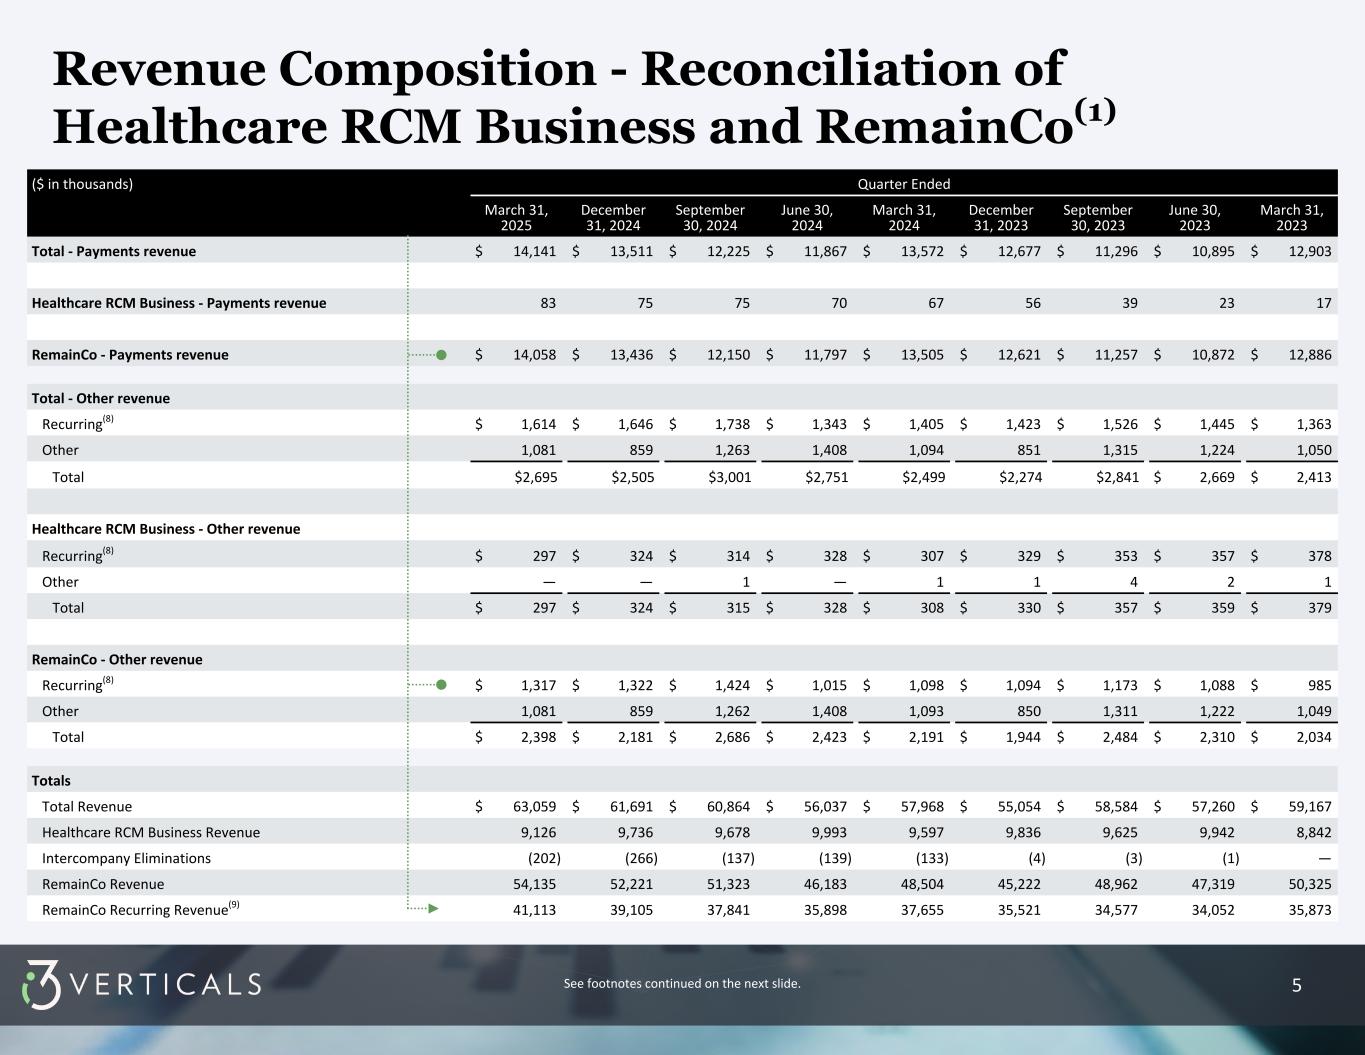
5 Revenue Composition - Reconciliation of Healthcare RCM Business and RemainCo(1) ($ in thousands) Quarter Ended March 31, 2025 December 31, 2024 September 30, 2024 June 30, 2024 March 31, 2024 December 31, 2023 September 30, 2023 June 30, 2023 March 31, 2023 Total - Payments revenue $ 14,141 $ 13,511 $ 12,225 $ 11,867 $ 13,572 $ 12,677 $ 11,296 $ 10,895 $ 12,903 Healthcare RCM Business - Payments revenue 83 75 75 70 67 56 39 23 17 RemainCo - Payments revenue $ 14,058 $ 13,436 $ 12,150 $ 11,797 $ 13,505 $ 12,621 $ 11,257 $ 10,872 $ 12,886 Total - Other revenue Recurring(8) $ 1,614 $ 1,646 $ 1,738 $ 1,343 $ 1,405 $ 1,423 $ 1,526 $ 1,445 $ 1,363 Other 1,081 859 1,263 1,408 1,094 851 1,315 1,224 1,050 Total $2,695 $2,505 $3,001 $2,751 $2,499 $2,274 $2,841 $ 2,669 $ 2,413 Healthcare RCM Business - Other revenue Recurring(8) $ 297 $ 324 $ 314 $ 328 $ 307 $ 329 $ 353 $ 357 $ 378 Other — — 1 — 1 1 4 2 1 Total $ 297 $ 324 $ 315 $ 328 $ 308 $ 330 $ 357 $ 359 $ 379 RemainCo - Other revenue Recurring(8) $ 1,317 $ 1,322 $ 1,424 $ 1,015 $ 1,098 $ 1,094 $ 1,173 $ 1,088 $ 985 Other 1,081 859 1,262 1,408 1,093 850 1,311 1,222 1,049 Total $ 2,398 $ 2,181 $ 2,686 $ 2,423 $ 2,191 $ 1,944 $ 2,484 $ 2,310 $ 2,034 Totals Total Revenue $ 63,059 $ 61,691 $ 60,864 $ 56,037 $ 57,968 $ 55,054 $ 58,584 $ 57,260 $ 59,167 Healthcare RCM Business Revenue 9,126 9,736 9,678 9,993 9,597 9,836 9,625 9,942 8,842 Intercompany Eliminations (202) (266) (137) (139) (133) (4) (3) (1) — RemainCo Revenue 54,135 52,221 51,323 46,183 48,504 45,222 48,962 47,319 50,325 RemainCo Recurring Revenue(9) 41,113 39,105 37,841 35,898 37,655 35,521 34,577 34,052 35,873 See footnotes continued on the next slide.


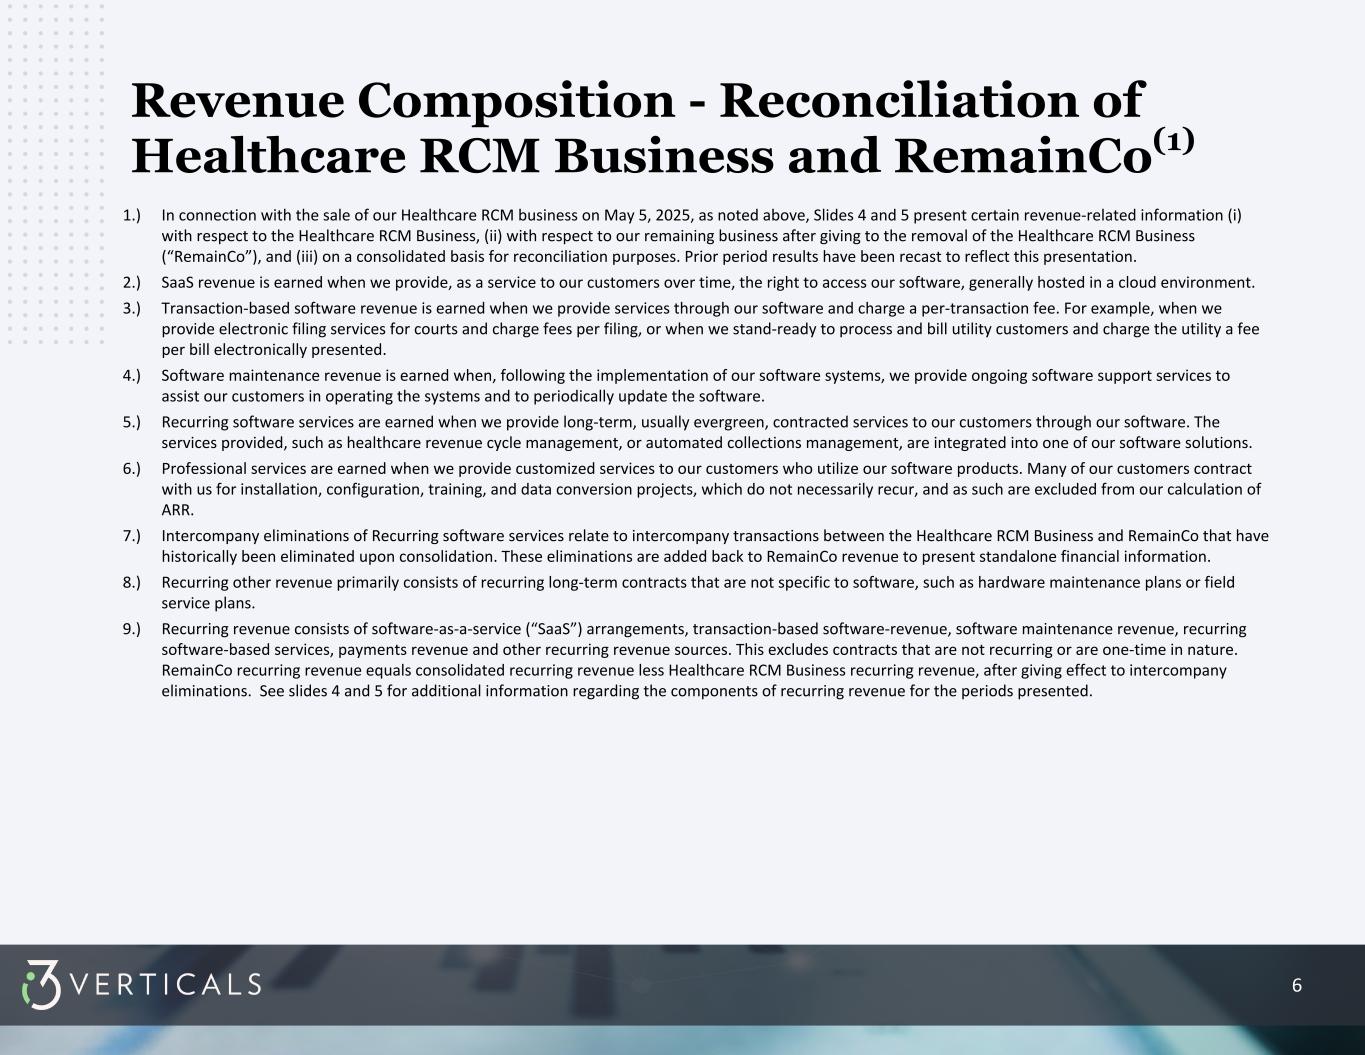
6 1.) In connection with the sale of our Healthcare RCM business on May 5, 2025, as noted above, Slides 4 and 5 present certain revenue-related information (i) with respect to the Healthcare RCM Business, (ii) with respect to our remaining business after giving to the removal of the Healthcare RCM Business (“RemainCo”), and (iii) on a consolidated basis for reconciliation purposes. Prior period results have been recast to reflect this presentation. 2.) SaaS revenue is earned when we provide, as a service to our customers over time, the right to access our software, generally hosted in a cloud environment. 3.) Transaction-based software revenue is earned when we provide services through our software and charge a per-transaction fee. For example, when we provide electronic filing services for courts and charge fees per filing, or when we stand-ready to process and bill utility customers and charge the utility a fee per bill electronically presented. 4.) Software maintenance revenue is earned when, following the implementation of our software systems, we provide ongoing software support services to assist our customers in operating the systems and to periodically update the software. 5.) Recurring software services are earned when we provide long-term, usually evergreen, contracted services to our customers through our software. The services provided, such as healthcare revenue cycle management, or automated collections management, are integrated into one of our software solutions. 6.) Professional services are earned when we provide customized services to our customers who utilize our software products. Many of our customers contract with us for installation, configuration, training, and data conversion projects, which do not necessarily recur, and as such are excluded from our calculation of ARR. 7.) Intercompany eliminations of Recurring software services relate to intercompany transactions between the Healthcare RCM Business and RemainCo that have historically been eliminated upon consolidation. These eliminations are added back to RemainCo revenue to present standalone financial information. 8.) Recurring other revenue primarily consists of recurring long-term contracts that are not specific to software, such as hardware maintenance plans or field service plans. 9.) Recurring revenue consists of software-as-a-service (“SaaS”) arrangements, transaction-based software-revenue, software maintenance revenue, recurring software-based services, payments revenue and other recurring revenue sources. This excludes contracts that are not recurring or are one-time in nature. RemainCo recurring revenue equals consolidated recurring revenue less Healthcare RCM Business recurring revenue, after giving effect to intercompany eliminations. See slides 4 and 5 for additional information regarding the components of recurring revenue for the periods presented. Revenue Composition - Reconciliation of Healthcare RCM Business and RemainCo(1)


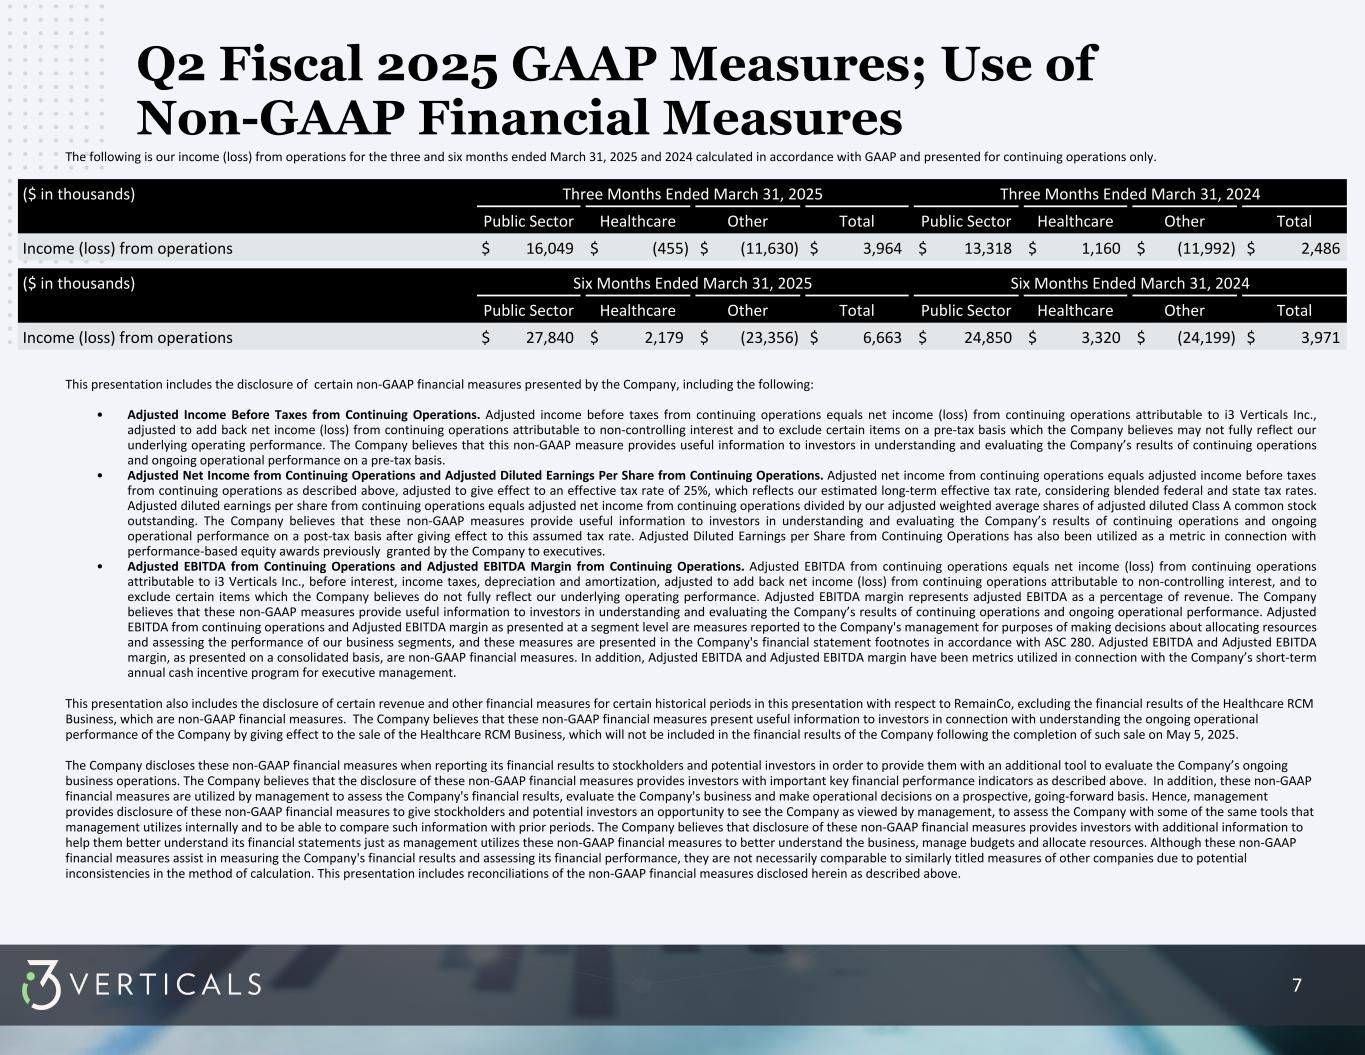
7 Q2 Fiscal 2025 GAAP Measures; Use of Non-GAAP Financial Measures ($ in thousands) Three Months Ended March 31, 2025 Three Months Ended March 31, 2024 Public Sector Healthcare Other Total Public Sector Healthcare Other Total Income (loss) from operations $ 16,049 $ (455) $ (11,630) $ 3,964 $ 13,318 $ 1,160 $ (11,992) $ 2,486 The following is our income (loss) from operations for the three and six months ended March 31, 2025 and 2024 calculated in accordance with GAAP and presented for continuing operations only. This presentation includes the disclosure of certain non-GAAP financial measures presented by the Company, including the following: • Adjusted Income Before Taxes from Continuing Operations. Adjusted income before taxes from continuing operations equals net income (loss) from continuing operations attributable to i3 Verticals Inc., adjusted to add back net income (loss) from continuing operations attributable to non-controlling interest and to exclude certain items on a pre-tax basis which the Company believes may not fully reflect our underlying operating performance. The Company believes that this non-GAAP measure provides useful information to investors in understanding and evaluating the Company’s results of continuing operations and ongoing operational performance on a pre-tax basis. • Adjusted Net Income from Continuing Operations and Adjusted Diluted Earnings Per Share from Continuing Operations. Adjusted net income from continuing operations equals adjusted income before taxes from continuing operations as described above, adjusted to give effect to an effective tax rate of 25%, which reflects our estimated long-term effective tax rate, considering blended federal and state tax rates. Adjusted diluted earnings per share from continuing operations equals adjusted net income from continuing operations divided by our adjusted weighted average shares of adjusted diluted Class A common stock outstanding. The Company believes that these non-GAAP measures provide useful information to investors in understanding and evaluating the Company’s results of continuing operations and ongoing operational performance on a post-tax basis after giving effect to this assumed tax rate. Adjusted Diluted Earnings per Share from Continuing Operations has also been utilized as a metric in connection with performance-based equity awards previously granted by the Company to executives. • Adjusted EBITDA from Continuing Operations and Adjusted EBITDA Margin from Continuing Operations. Adjusted EBITDA from continuing operations equals net income (loss) from continuing operations attributable to i3 Verticals Inc., before interest, income taxes, depreciation and amortization, adjusted to add back net income (loss) from continuing operations attributable to non-controlling interest, and to exclude certain items which the Company believes do not fully reflect our underlying operating performance. Adjusted EBITDA margin represents adjusted EBITDA as a percentage of revenue. The Company believes that these non-GAAP measures provide useful information to investors in understanding and evaluating the Company’s results of continuing operations and ongoing operational performance. Adjusted EBITDA from continuing operations and Adjusted EBITDA margin as presented at a segment level are measures reported to the Company's management for purposes of making decisions about allocating resources and assessing the performance of our business segments, and these measures are presented in the Company's financial statement footnotes in accordance with ASC 280. Adjusted EBITDA and Adjusted EBITDA margin, as presented on a consolidated basis, are non-GAAP financial measures. In addition, Adjusted EBITDA and Adjusted EBITDA margin have been metrics utilized in connection with the Company’s short-term annual cash incentive program for executive management. This presentation also includes the disclosure of certain revenue and other financial measures for certain historical periods in this presentation with respect to RemainCo, excluding the financial results of the Healthcare RCM Business, which are non-GAAP financial measures. The Company believes that these non-GAAP financial measures present useful information to investors in connection with understanding the ongoing operational performance of the Company by giving effect to the sale of the Healthcare RCM Business, which will not be included in the financial results of the Company following the completion of such sale on May 5, 2025. The Company discloses these non-GAAP financial measures when reporting its financial results to stockholders and potential investors in order to provide them with an additional tool to evaluate the Company’s ongoing business operations. The Company believes that the disclosure of these non-GAAP financial measures provides investors with important key financial performance indicators as described above. In addition, these non-GAAP financial measures are utilized by management to assess the Company's financial results, evaluate the Company's business and make operational decisions on a prospective, going-forward basis. Hence, management provides disclosure of these non-GAAP financial measures to give stockholders and potential investors an opportunity to see the Company as viewed by management, to assess the Company with some of the same tools that management utilizes internally and to be able to compare such information with prior periods. The Company believes that disclosure of these non-GAAP financial measures provides investors with additional information to help them better understand its financial statements just as management utilizes these non-GAAP financial measures to better understand the business, manage budgets and allocate resources. Although these non-GAAP financial measures assist in measuring the Company's financial results and assessing its financial performance, they are not necessarily comparable to similarly titled measures of other companies due to potential inconsistencies in the method of calculation. This presentation includes reconciliations of the non-GAAP financial measures disclosed herein as described above. ($ in thousands) Six Months Ended March 31, 2025 Six Months Ended March 31, 2024 Public Sector Healthcare Other Total Public Sector Healthcare Other Total Income (loss) from operations $ 27,840 $ 2,179 $ (23,356) $ 6,663 $ 24,850 $ 3,320 $ (24,199) $ 3,971


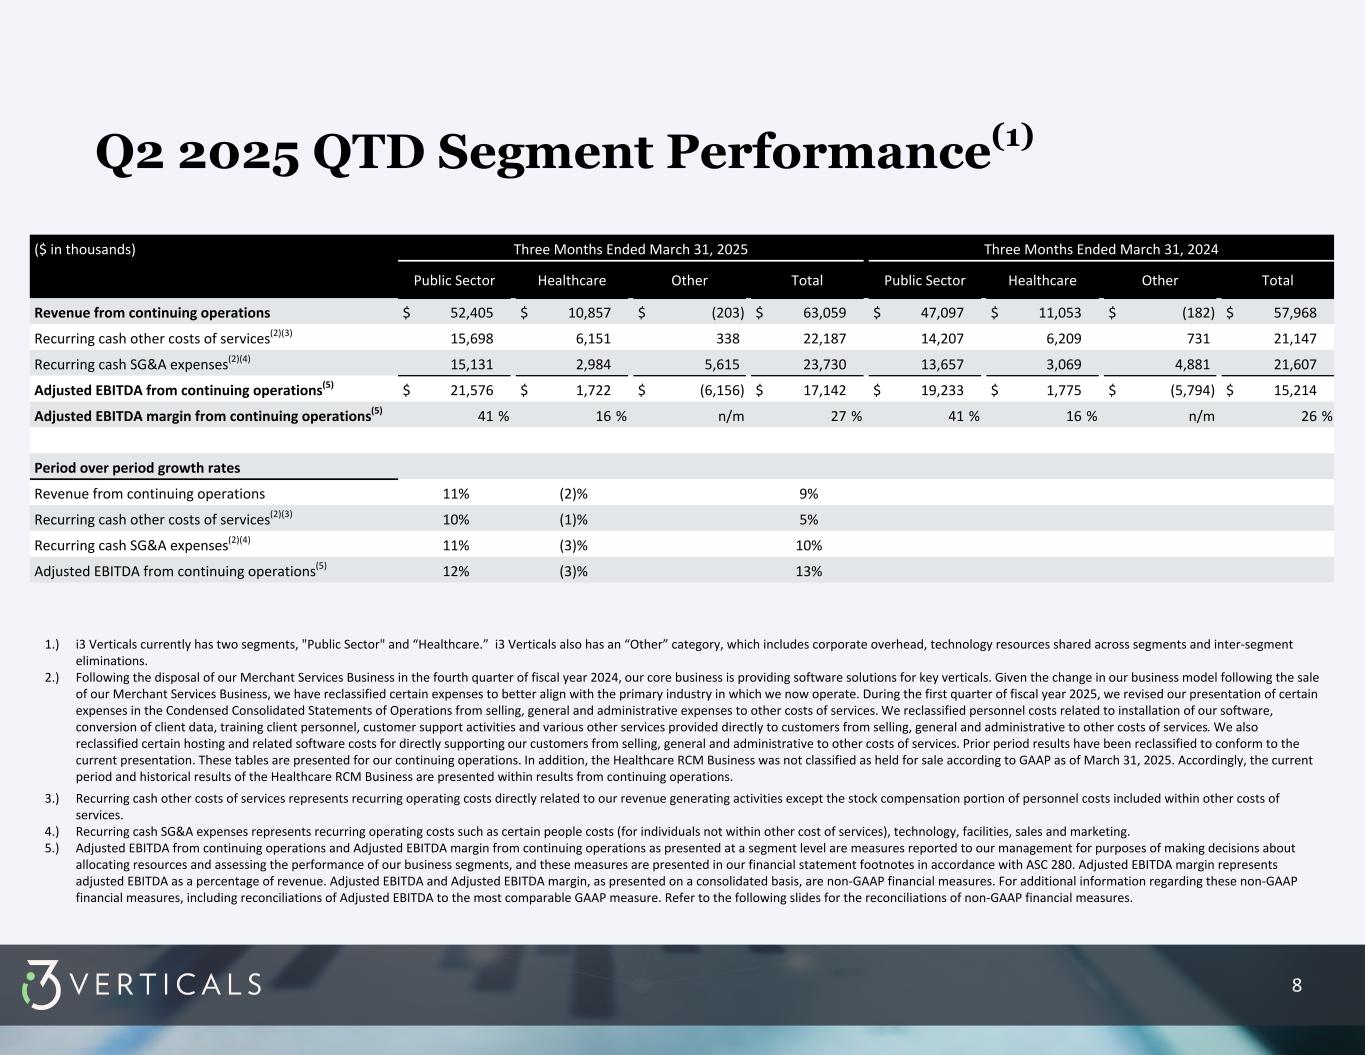
8 Q2 2025 QTD Segment Performance(1) 1.) i3 Verticals currently has two segments, "Public Sector" and “Healthcare.” i3 Verticals also has an “Other” category, which includes corporate overhead, technology resources shared across segments and inter-segment eliminations. 2.) Following the disposal of our Merchant Services Business in the fourth quarter of fiscal year 2024, our core business is providing software solutions for key verticals. Given the change in our business model following the sale of our Merchant Services Business, we have reclassified certain expenses to better align with the primary industry in which we now operate. During the first quarter of fiscal year 2025, we revised our presentation of certain expenses in the Condensed Consolidated Statements of Operations from selling, general and administrative expenses to other costs of services. We reclassified personnel costs related to installation of our software, conversion of client data, training client personnel, customer support activities and various other services provided directly to customers from selling, general and administrative to other costs of services. We also reclassified certain hosting and related software costs for directly supporting our customers from selling, general and administrative to other costs of services. Prior period results have been reclassified to conform to the current presentation. These tables are presented for our continuing operations. In addition, the Healthcare RCM Business was not classified as held for sale according to GAAP as of March 31, 2025. Accordingly, the current period and historical results of the Healthcare RCM Business are presented within results from continuing operations. 3.) Recurring cash other costs of services represents recurring operating costs directly related to our revenue generating activities except the stock compensation portion of personnel costs included within other costs of services. 4.) Recurring cash SG&A expenses represents recurring operating costs such as certain people costs (for individuals not within other cost of services), technology, facilities, sales and marketing. 5.) Adjusted EBITDA from continuing operations and Adjusted EBITDA margin from continuing operations as presented at a segment level are measures reported to our management for purposes of making decisions about allocating resources and assessing the performance of our business segments, and these measures are presented in our financial statement footnotes in accordance with ASC 280. Adjusted EBITDA margin represents adjusted EBITDA as a percentage of revenue. Adjusted EBITDA and Adjusted EBITDA margin, as presented on a consolidated basis, are non-GAAP financial measures. For additional information regarding these non-GAAP financial measures, including reconciliations of Adjusted EBITDA to the most comparable GAAP measure. Refer to the following slides for the reconciliations of non-GAAP financial measures. ($ in thousands) Three Months Ended March 31, 2025 Three Months Ended March 31, 2024 Public Sector Healthcare Other Total Public Sector Healthcare Other Total Revenue from continuing operations $ 52,405 $ 10,857 $ (203) $ 63,059 $ 47,097 $ 11,053 $ (182) $ 57,968 Recurring cash other costs of services(2)(3) 15,698 6,151 338 22,187 14,207 6,209 731 21,147 Recurring cash SG&A expenses(2)(4) 15,131 2,984 5,615 23,730 13,657 3,069 4,881 21,607 Adjusted EBITDA from continuing operations(5) $ 21,576 $ 1,722 $ (6,156) $ 17,142 $ 19,233 $ 1,775 $ (5,794) $ 15,214 Adjusted EBITDA margin from continuing operations(5) 41 % 16 % n/m 27 % 41 % 16 % n/m 26 % Period over period growth rates Revenue from continuing operations 11% (2)% 9% Recurring cash other costs of services(2)(3) 10% (1)% 5% Recurring cash SG&A expenses(2)(4) 11% (3)% 10% Adjusted EBITDA from continuing operations(5) 12% (3)% 13%


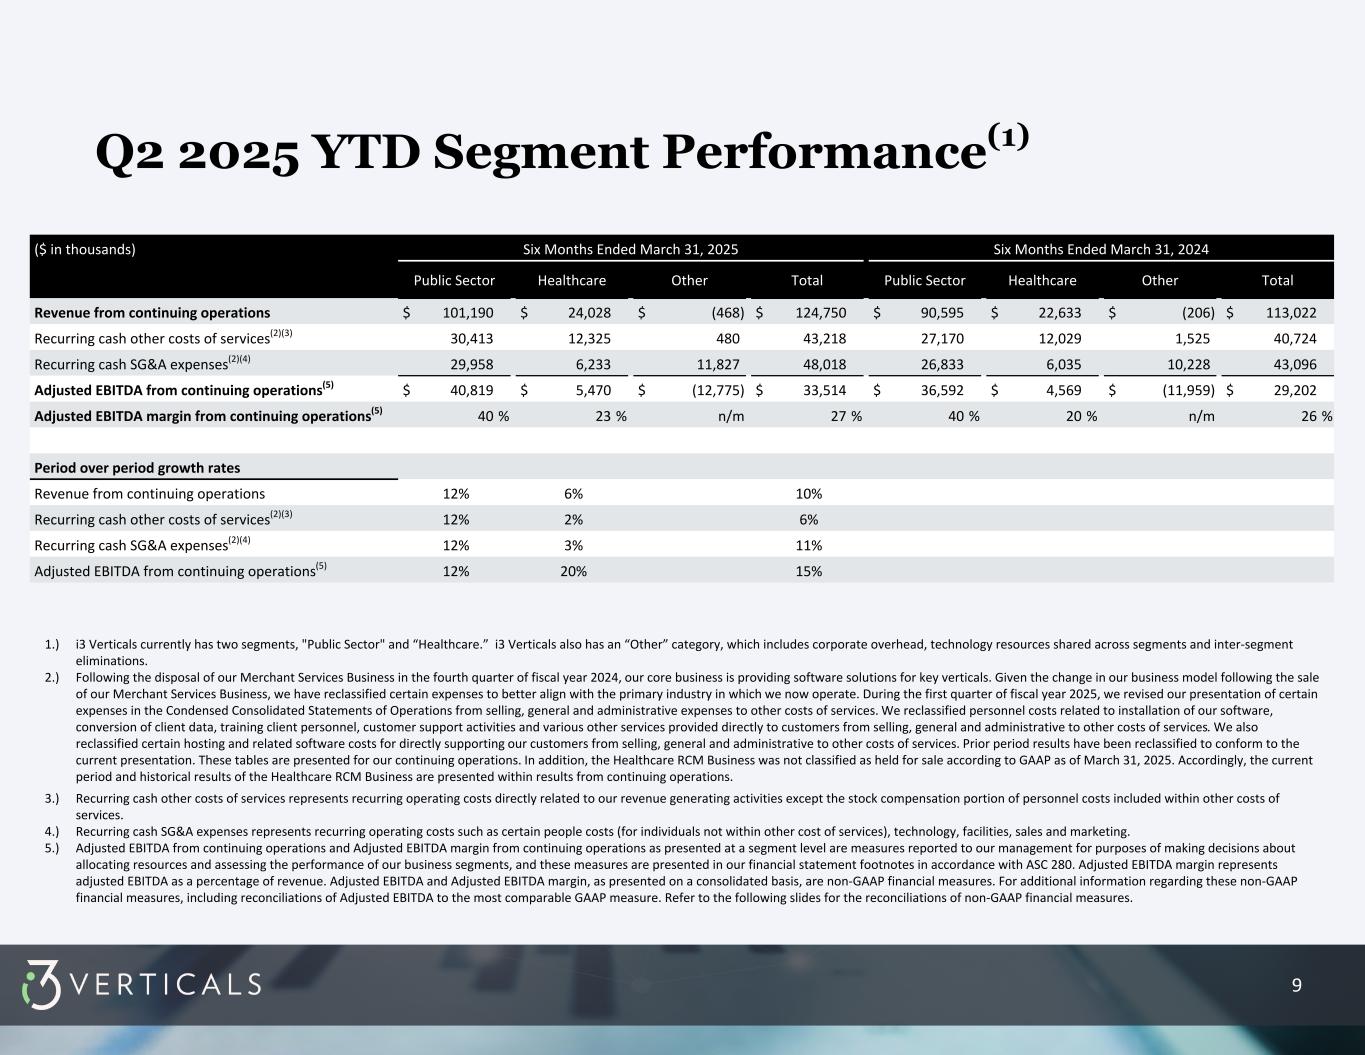
9 Q2 2025 YTD Segment Performance(1) 1.) i3 Verticals currently has two segments, "Public Sector" and “Healthcare.” i3 Verticals also has an “Other” category, which includes corporate overhead, technology resources shared across segments and inter-segment eliminations. 2.) Following the disposal of our Merchant Services Business in the fourth quarter of fiscal year 2024, our core business is providing software solutions for key verticals. Given the change in our business model following the sale of our Merchant Services Business, we have reclassified certain expenses to better align with the primary industry in which we now operate. During the first quarter of fiscal year 2025, we revised our presentation of certain expenses in the Condensed Consolidated Statements of Operations from selling, general and administrative expenses to other costs of services. We reclassified personnel costs related to installation of our software, conversion of client data, training client personnel, customer support activities and various other services provided directly to customers from selling, general and administrative to other costs of services. We also reclassified certain hosting and related software costs for directly supporting our customers from selling, general and administrative to other costs of services. Prior period results have been reclassified to conform to the current presentation. These tables are presented for our continuing operations. In addition, the Healthcare RCM Business was not classified as held for sale according to GAAP as of March 31, 2025. Accordingly, the current period and historical results of the Healthcare RCM Business are presented within results from continuing operations. 3.) Recurring cash other costs of services represents recurring operating costs directly related to our revenue generating activities except the stock compensation portion of personnel costs included within other costs of services. 4.) Recurring cash SG&A expenses represents recurring operating costs such as certain people costs (for individuals not within other cost of services), technology, facilities, sales and marketing. 5.) Adjusted EBITDA from continuing operations and Adjusted EBITDA margin from continuing operations as presented at a segment level are measures reported to our management for purposes of making decisions about allocating resources and assessing the performance of our business segments, and these measures are presented in our financial statement footnotes in accordance with ASC 280. Adjusted EBITDA margin represents adjusted EBITDA as a percentage of revenue. Adjusted EBITDA and Adjusted EBITDA margin, as presented on a consolidated basis, are non-GAAP financial measures. For additional information regarding these non-GAAP financial measures, including reconciliations of Adjusted EBITDA to the most comparable GAAP measure. Refer to the following slides for the reconciliations of non-GAAP financial measures. ($ in thousands) Six Months Ended March 31, 2025 Six Months Ended March 31, 2024 Public Sector Healthcare Other Total Public Sector Healthcare Other Total Revenue from continuing operations $ 101,190 $ 24,028 $ (468) $ 124,750 $ 90,595 $ 22,633 $ (206) $ 113,022 Recurring cash other costs of services(2)(3) 30,413 12,325 480 43,218 27,170 12,029 1,525 40,724 Recurring cash SG&A expenses(2)(4) 29,958 6,233 11,827 48,018 26,833 6,035 10,228 43,096 Adjusted EBITDA from continuing operations(5) $ 40,819 $ 5,470 $ (12,775) $ 33,514 $ 36,592 $ 4,569 $ (11,959) $ 29,202 Adjusted EBITDA margin from continuing operations(5) 40 % 23 % n/m 27 % 40 % 20 % n/m 26 % Period over period growth rates Revenue from continuing operations 12% 6% 10% Recurring cash other costs of services(2)(3) 12% 2% 6% Recurring cash SG&A expenses(2)(4) 12% 3% 11% Adjusted EBITDA from continuing operations(5) 12% 20% 15%


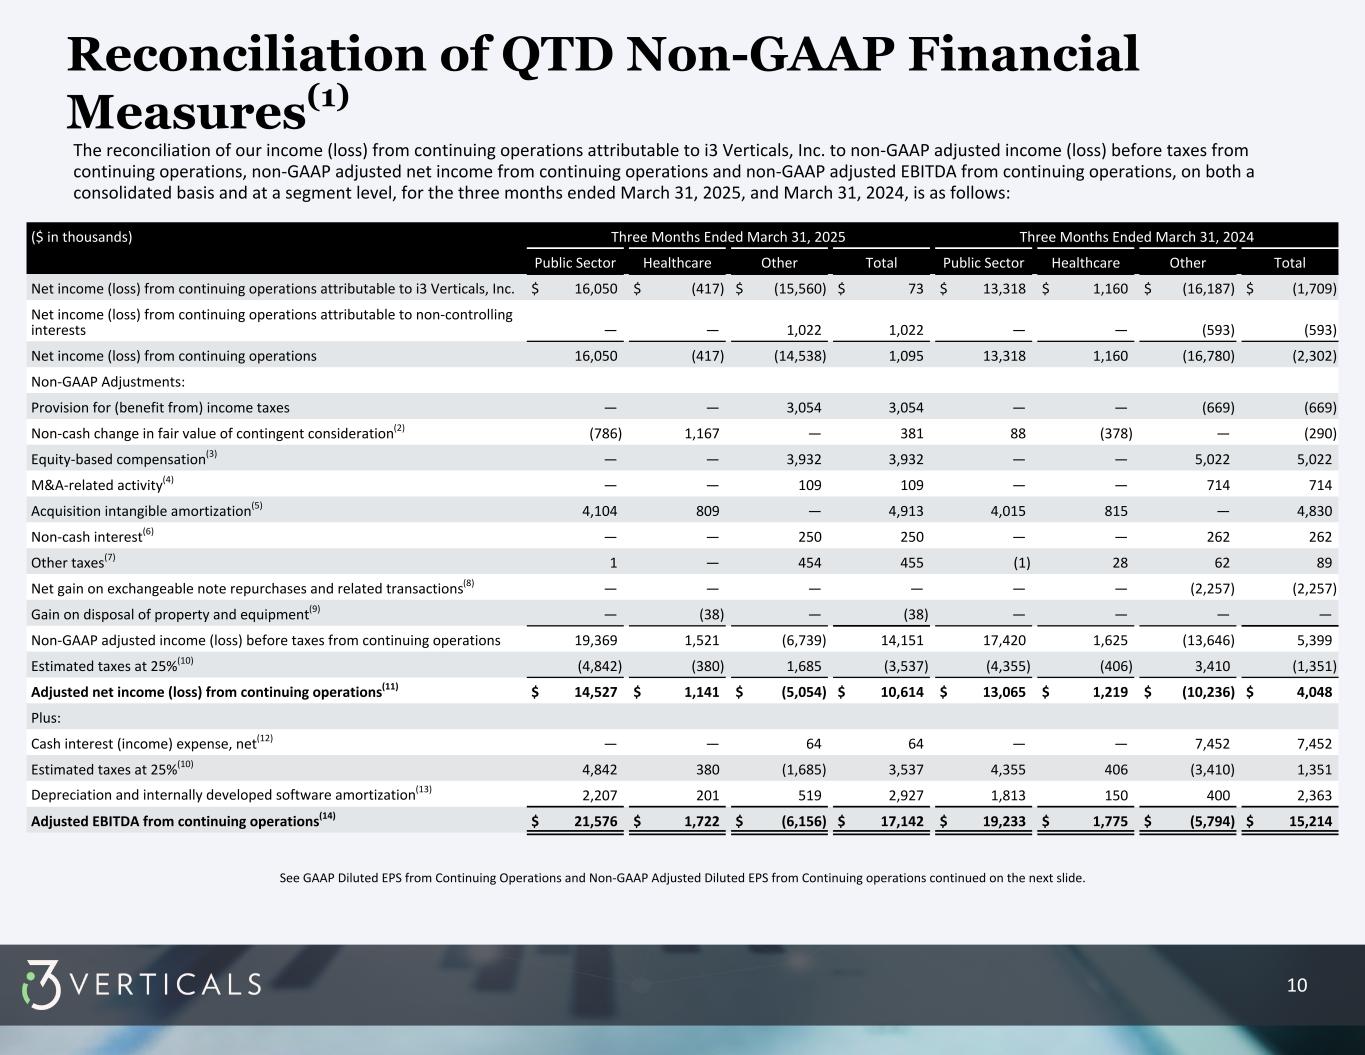
10 Reconciliation of QTD Non-GAAP Financial Measures(1) The reconciliation of our income (loss) from continuing operations attributable to i3 Verticals, Inc. to non-GAAP adjusted income (loss) before taxes from continuing operations, non-GAAP adjusted net income from continuing operations and non-GAAP adjusted EBITDA from continuing operations, on both a consolidated basis and at a segment level, for the three months ended March 31, 2025, and March 31, 2024, is as follows: See GAAP Diluted EPS from Continuing Operations and Non-GAAP Adjusted Diluted EPS from Continuing operations continued on the next slide. ($ in thousands) Three Months Ended March 31, 2025 Three Months Ended March 31, 2024 Public Sector Healthcare Other Total Public Sector Healthcare Other Total Net income (loss) from continuing operations attributable to i3 Verticals, Inc. $ 16,050 $ (417) $ (15,560) $ 73 $ 13,318 $ 1,160 $ (16,187) $ (1,709) Net income (loss) from continuing operations attributable to non-controlling interests — — 1,022 1,022 — — (593) (593) Net income (loss) from continuing operations 16,050 (417) (14,538) 1,095 13,318 1,160 (16,780) (2,302) Non-GAAP Adjustments: Provision for (benefit from) income taxes — — 3,054 3,054 — — (669) (669) Non-cash change in fair value of contingent consideration(2) (786) 1,167 — 381 88 (378) — (290) Equity-based compensation(3) — — 3,932 3,932 — — 5,022 5,022 M&A-related activity(4) — — 109 109 — — 714 714 Acquisition intangible amortization(5) 4,104 809 — 4,913 4,015 815 — 4,830 Non-cash interest(6) — — 250 250 — — 262 262 Other taxes(7) 1 — 454 455 (1) 28 62 89 Net gain on exchangeable note repurchases and related transactions(8) — — — — — — (2,257) (2,257) Gain on disposal of property and equipment(9) — (38) — (38) — — — — Non-GAAP adjusted income (loss) before taxes from continuing operations 19,369 1,521 (6,739) 14,151 17,420 1,625 (13,646) 5,399 Estimated taxes at 25%(10) (4,842) (380) 1,685 (3,537) (4,355) (406) 3,410 (1,351) Adjusted net income (loss) from continuing operations(11) $ 14,527 $ 1,141 $ (5,054) $ 10,614 $ 13,065 $ 1,219 $ (10,236) $ 4,048 Plus: Cash interest (income) expense, net(12) — — 64 64 — — 7,452 7,452 Estimated taxes at 25%(10) 4,842 380 (1,685) 3,537 4,355 406 (3,410) 1,351 Depreciation and internally developed software amortization(13) 2,207 201 519 2,927 1,813 150 400 2,363 Adjusted EBITDA from continuing operations(14) $ 21,576 $ 1,722 $ (6,156) $ 17,142 $ 19,233 $ 1,775 $ (5,794) $ 15,214


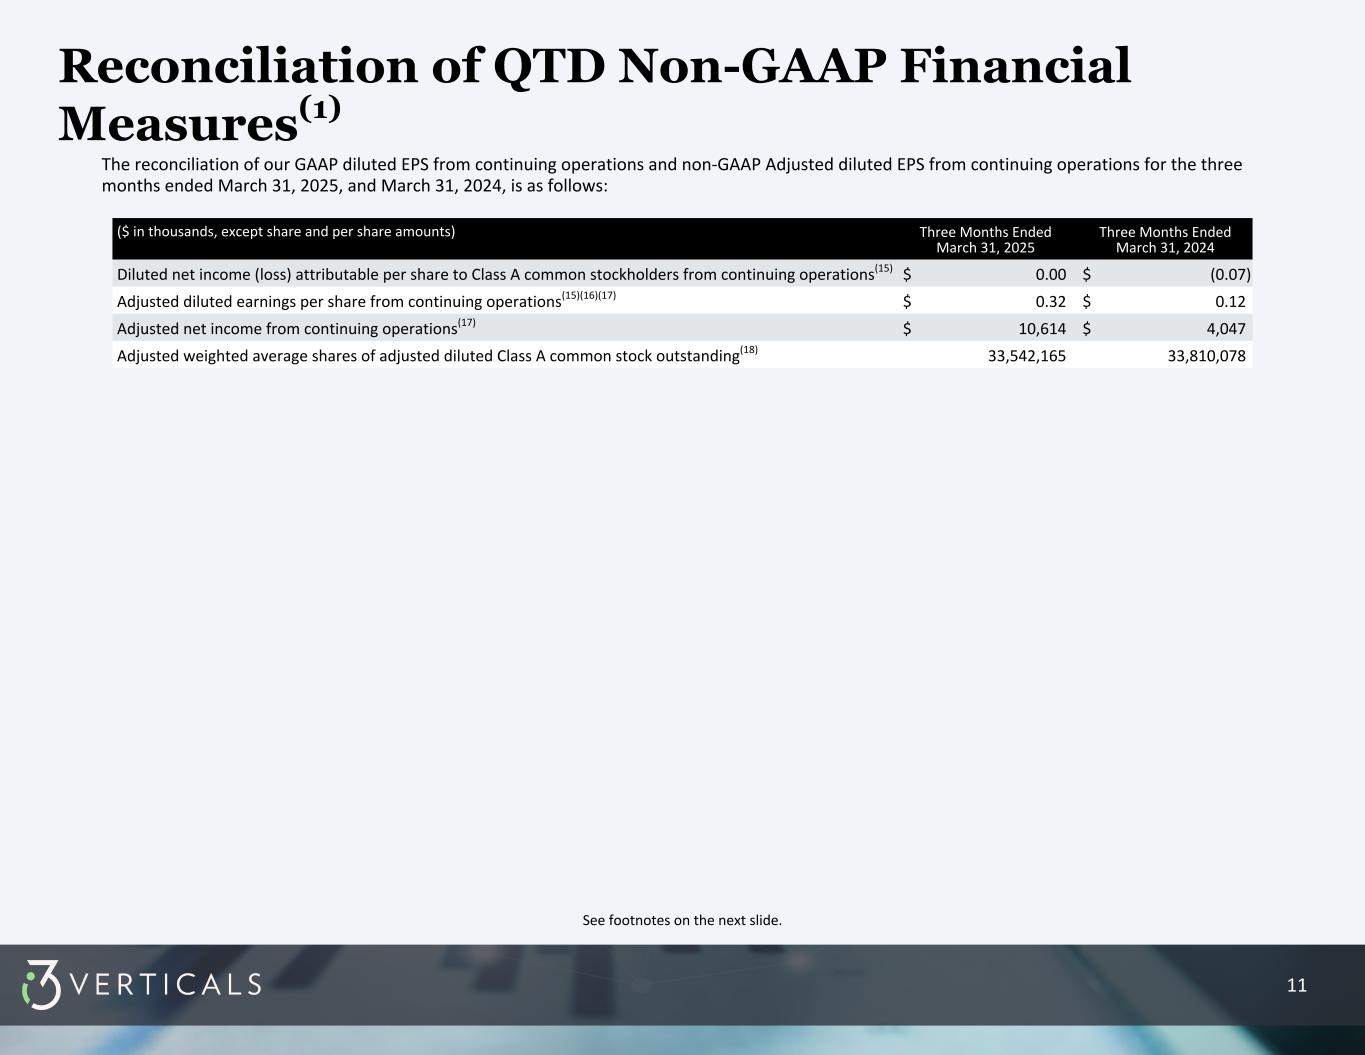
11 See footnotes on the next slide. Reconciliation of QTD Non-GAAP Financial Measures(1) The reconciliation of our GAAP diluted EPS from continuing operations and non-GAAP Adjusted diluted EPS from continuing operations for the three months ended March 31, 2025, and March 31, 2024, is as follows: ($ in thousands, except share and per share amounts) Three Months Ended March 31, 2025 Three Months Ended March 31, 2024 Diluted net income (loss) attributable per share to Class A common stockholders from continuing operations(15) $ 0.00 $ (0.07) Adjusted diluted earnings per share from continuing operations(15)(16)(17) $ 0.32 $ 0.12 Adjusted net income from continuing operations(17) $ 10,614 $ 4,047 Adjusted weighted average shares of adjusted diluted Class A common stock outstanding(18) 33,542,165 33,810,078


12 1.) Following the disposal of our Merchant Services Business in the fourth quarter of fiscal year 2024, our core business is providing software solutions for key verticals. Given the change in our business model following the sale of our Merchant Services Business, we have reclassified certain expenses to better align with the primary industry in which we now operate. During the first quarter of fiscal year 2025, we revised our presentation of certain expenses in the Condensed Consolidated Statements of Operations from selling, general and administrative expenses to other costs of services. We reclassified personnel costs related to installation of our software, conversion of client data, training client personnel, customer support activities and various other services provided directly to customers from selling, general and administrative to other costs of services. We also reclassified certain hosting and related software costs for directly supporting our customers from selling, general and administrative to other costs of services. Prior period results have been reclassified to conform to the current presentation. These tables are presented for our continuing operations. In addition, the Healthcare RCM Business was not classified as held for sale according to GAAP as of March 31, 2025. Accordingly, the current period and historical results of the Healthcare RCM Business are presented within results from continuing operations. 2.) Non-cash change in fair value of contingent consideration reflects the changes in management’s estimates of future cash consideration to be paid in connection with prior acquisitions from the amount estimated as of the later of the most recent balance sheet date forming the beginning of the income statement period or the original estimates made at the closing of the applicable acquisition. 3.) Equity-based compensation expense related to stock options and restricted stock units issued under the Company's 2018 Equity Incentive Plan and 2020 Acquisition Equity Incentive Plan. 4.) M&A-related activity is the net impact of professional service and related costs directly related to any merger, acquisition and disposition activity of the Company, which are recorded in selling, general and administrative in the condensed consolidated statements of operations, and revenue earned through post-sale non-recurring activities with divestitures, which are recorded in other income in the condensed consolidated statements of operations. i3 Verticals believes these activities are not reflective of the underlying operational performance of the Company. 5.) Acquisition intangible amortization reflects amortization of intangible assets and software acquired through business combinations, acquired customer portfolios, acquired referral agreements and related asset acquisitions. 6.) Non-cash interest expense reflects amortization of debt issuance costs and any write-offs of debt issuance costs. 7.) Other taxes consist of franchise taxes, commercial activity taxes, reserves for ongoing tax audit matters, the employer portion of payroll taxes related to stock option exercises and other non-income-based taxes. Taxes related to salaries are not included. 8.) Net gain on exchangeable note repurchases and related transactions reflects the gain on repurchases of exchangeable notes and warrant unwinds, net of the loss on sale of bond hedge unwinds, which occurred during the three months ended March 31, 2024 9.) (Gain) loss on disposal of property and equipment is related to the sale of buildings and automobiles purchased through acquisitions. 10.) Corporate income tax expense is based on non-GAAP adjusted income before taxes from continuing operations and is calculated using a tax rate of 25.0% for both the six months ended March 31, 2025 and 2024, based on the estimated long-term effective tax rate, considering blended federal and state tax rates. 11.) Adjusted net income from continuing operations represents a non-GAAP financial measure and assumes that all net income during the period is available to the holders of the Company's Class A common stock. Further, adjusted diluted earnings per share from continuing operations assumes that all Common Units in i3 Verticals, LLC and the associated non-voting Class B common stock were exchanged for Class A common stock at the beginning of the period on a one-for-one basis. 12.) Cash interest (income) expense, net, represents all interest expense net of interest income recorded on the Company's statement of operations other than non-cash interest expense, which represents amortization of debt issuance costs and any write-offs of debt issuance costs. 13.) Depreciation and internally developed software amortization reflects depreciation on the Company's property, plant and equipment, net, and amortization expense on its internally developed capitalized software. Reconciliation of QTD Non-GAAP Financial Measures See continuing footnotes on the next slide.


13 14.) Represents a non-GAAP financial measure. 15.) Diluted net income (loss) per share attributable to Class A common stockholders from continuing operations and adjusted diluted earnings per share from continuing operations both exclude the discontinued operations of the Merchant Services Business but include the consolidated cash interest expense. 16.) Adjusted diluted earnings per share from continuing operations, a non-GAAP financial measure, is calculated using adjusted net income from continuing operations and the adjusted weighted average shares of adjusted diluted Class A common stock outstanding. Adjusted diluted earnings per share from continuing operations is the same measure as pro forma adjusted diluted earnings per share from continuing operations as was disclosed by the Company in prior earnings releases. There has not been any change in the manner in which this measure has been calculated in comparison to prior periods. 17.) Adjusted net income from continuing operations, a non-GAAP financial measure, assumes that all net income from continuing operations during the period is available to the holders of the Company's Class A common stock. Further, adjusted diluted earnings per share from continuing operations assumes that all Common Units in i3 Verticals, LLC and the associated non-voting Class B common stock were exchanged for Class A common stock at the beginning of the period on a one-for-one basis. Adjusted net income from continuing operations is the same measure as pro forma adjusted net income from continuing operations as was disclosed by the Company in prior earnings release. There has not been any change in the manner in which this measure has been calculated in comparison to prior periods. 18.) Adjusted weighted average shares of adjusted diluted Class A common stock outstanding include 9,408,427 and 10,091,604 outstanding shares of Class A common stock issuable upon the exchange of Common Units in i3 Verticals, LLC and 299,505 and 387,235 shares resulting from estimated stock option exercises and restricted stock units vesting as calculated by the treasury stock method for the three months ended March 31, 2025 and 2024, respectively. Reconciliation of QTD Non-GAAP Financial Measures See continuing footnotes on the next slide.


 
14 Reconciliation of YTD Non-GAAP Financial Measures(1) The reconciliation of our income (loss) from continuing operations to non-GAAP adjusted net income from continuing operations and non-GAAP adjusted EBITDA from continuing operations, on both a consolidated basis and at a segment level, for the six months ended March 31, 2025, and March 31, 2024, is as follows: ($ in thousands) Six Months Ended March 31, 2025 Six Months Ended March 31, 2024 Public Sector Healthcare Other Total Public Sector Healthcare Other Total Net income (loss) from continuing operations attributable to i3 Verticals, Inc. $ 28,426 $ 2,217 $ (28,376) $ 2,267 $ 24,726 $ 3,320 $ (32,640) $ (4,594) Net income (loss) from continuing operations attributable to non-controlling interests — — 2,150 2,150 — — (1,923) (1,923) Net income (loss) from continuing operations 28,426 2,217 (26,226) 4,417 24,726 3,320 (34,563) (6,517) Non-GAAP Adjustments: Provision for (benefit from) income taxes — — 3,577 3,577 — — (1,763) (1,763) Non-cash change in fair value of contingent consideration(2) 466 1,292 — 1,758 170 (697) — (527) Equity-based compensation(3) — — 7,746 7,746 — — 10,380 10,380 M&A-related activity(4) — — 160 160 — — 958 958 Acquisition intangible amortization(5) 8,208 1,618 — 9,826 8,056 1,630 — 9,686 Non-cash interest(6) — — 530 530 — — 676 676 Other taxes(7) 14 — 693 707 27 31 115 173 Net gain on exchangeable note repurchases and related transactions(8) — — — — — — (2,257) (2,257) (Gain) loss on disposal of property and equipment(9) (585) (38) — (623) 118 — (11) 107 Non-GAAP adjusted income (loss) before taxes from continuing operations 36,529 5,089 (13,520) 28,098 33,097 4,284 (26,465) 10,916 Estimated taxes at 25%(10) (9,132) (1,272) 3,380 (7,024) (8,274) (1,071) 6,615 (2,730) Adjusted net income (loss) from continuing operations(11) $ 27,397 $ 3,817 $ (10,140) $ 21,074 $ 24,823 $ 3,213 $ (19,850) $ 8,186 Plus: Cash interest (income) expense, net(12) — — (282) (282) 6 — 13,719 13,725 Estimated taxes at 25%(10) 9,132 1,272 (3,380) 7,024 8,274 1,071 (6,615) 2,730 Depreciation and internally developed software amortization(13) 4,290 381 1,027 5,698 3,489 285 787 4,561 Adjusted EBITDA from continuing operations(14) $ 40,819 $ 5,470 $ (12,775) $ 33,514 $ 36,592 $ 4,569 $ (11,959) $ 29,202 See GAAP Diluted EPS from Continuing Operations and Non-GAAP Adjusted Diluted EPS from Continuing operations continued on the next slide.


15 See footnotes on the next slide. ($ in thousands, except share and per share amounts) Six Months Ended March 31, 2025 Six Months Ended March 31, 2024 Diluted net income (loss) per share attributable to Class A common stockholders from continuing operations(15) $ 0.09 $ (0.20) Adjusted diluted earnings per share from continuing operations(15)(16)(17) $ 0.62 $ 0.24 Adjusted net income from continuing operations(17) $ 21,074 $ 8,186 Adjusted weighted average shares of adjusted diluted Class A common stock outstanding(18) 33,801,930 33,819,224 The reconciliation of our GAAP diluted EPS from continuing operations and non-GAAP Adjusted diluted EPS from continuing operations for the six months ended March 31, 2025, and March 31, 2024, is as follows: Reconciliation of YTD Non-GAAP Financial Measures(1)


16 1.) Following the disposal of our Merchant Services Business in the fourth quarter of fiscal year 2024, our core business is providing software solutions for key verticals. Given the change in our business model following the sale of our Merchant Services Business, we have reclassified certain expenses to better align with the primary industry in which we now operate. During the first quarter of fiscal year 2025, we revised our presentation of certain expenses in the Condensed Consolidated Statements of Operations from selling, general and administrative expenses to other costs of services. We reclassified personnel costs related to installation of our software, conversion of client data, training client personnel, customer support activities and various other services provided directly to customers from selling, general and administrative to other costs of services. We also reclassified certain hosting and related software costs for directly supporting our customers from selling, general and administrative to other costs of services. Prior period results have been reclassified to conform to the current presentation. These tables are presented for our continuing operations. In addition, the Healthcare RCM Business was not classified as held for sale according to GAAP as of March 31, 2025. Accordingly, the current period and historical results of the Healthcare RCM Business are presented within results from continuing operations. 2.) Non-cash change in fair value of contingent consideration reflects the changes in management’s estimates of future cash consideration to be paid in connection with prior acquisitions from the amount estimated as of the later of the most recent balance sheet date forming the beginning of the income statement period or the original estimates made at the closing of the applicable acquisition. 3.) Equity-based compensation expense related to stock options and restricted stock units issued under the Company's 2018 Equity Incentive Plan and 2020 Acquisition Equity Incentive Plan. 4.) M&A-related activity is the net impact of professional service and related costs directly related to any merger, acquisition and disposition activity of the Company, which are recorded in selling, general and administrative in the condensed consolidated statements of operations, and revenue earned through post-sale non-recurring activities with divestitures, which are recorded in other income in the condensed consolidated statements of operations. i3 Verticals believes these activities are not reflective of the underlying operational performance of the Company. 5.) Acquisition intangible amortization reflects amortization of intangible assets and software acquired through business combinations, acquired customer portfolios, acquired referral agreements and related asset acquisitions. 6.) Non-cash interest expense reflects amortization of debt issuance costs and any write-offs of debt issuance costs. 7.) Other taxes consist of franchise taxes, commercial activity taxes, reserves for ongoing tax audit matters, the employer portion of payroll taxes related to stock option exercises and other non-income-based taxes. Taxes related to salaries are not included. 8.) Net gain on exchangeable note repurchases and related transactions reflects the gain on repurchases of exchangeable notes and warrant unwinds, net of the loss on sale of bond hedge unwinds, which occurred during the three months ended March 31, 2024 9.) (Gain) loss on disposal of property and equipment is related to the sale of buildings and automobiles purchased through acquisitions. 10.) Corporate income tax expense is based on non-GAAP adjusted income before taxes from continuing operations and is calculated using a tax rate of 25.0% for both the six months ended March 31, 2025 and 2024, based on the estimated long-term effective tax rate, considering blended federal and state tax rates. 11.) Adjusted net income from continuing operations represents a non-GAAP financial measure and assumes that all net income during the period is available to the holders of the Company's Class A common stock. 12.) Cash interest (income) expense, net, represents all interest expense net of interest income recorded on the Company's statement of operations other than non-cash interest expense, which represents amortization of debt issuance costs and any write-offs of debt issuance costs. 13.) Depreciation and internally developed software amortization reflects depreciation on the Company's property, plant and equipment, net, and amortization expense on its internally developed capitalized software. Reconciliation of YTD Non-GAAP Financial Measures See continuing footnotes on the next slide.


17 Reconciliation of YTD Non-GAAP Financial Measures 14.) Represents a non-GAAP financial measure. 15.) Diluted net income (loss) per share attributable to Class A common stockholders from continuing operations and adjusted diluted earnings per share from continuing operations both exclude the discontinued operations of the Merchant Services Business but include the consolidated cash interest expense. 16.) Adjusted diluted earnings per share from continuing operations, a non-GAAP financial measure, is calculated using adjusted net income from continuing operations and the adjusted weighted average shares of adjusted diluted Class A common stock outstanding. Adjusted diluted earnings per share from continuing operations is the same measure as pro forma adjusted diluted earnings per share from continuing operations as was disclosed by the Company in prior earnings releases. There has not been any change in the manner in which this measure has been calculated in comparison to prior periods. 17.) Adjusted net income from continuing operations, a non-GAAP financial measure, assumes that all net income from continuing operations during the period is available to the holders of the Company's Class A common stock. Further, adjusted diluted earnings per share from continuing operations assumes that all Common Units in i3 Verticals, LLC and the associated non-voting Class B common stock were exchanged for Class A common stock at the beginning of the period on a one-for-one basis. Adjusted net income from continuing operations is the same measure as pro forma adjusted net income from continuing operations as was disclosed by the Company in prior earnings release. There has not been any change in the manner in which this measure has been calculated in comparison to prior periods. 18.) Adjusted weighted average shares of adjusted diluted Class A common stock outstanding include 9,720,698 and 10,092,504 outstanding shares of Class A common stock issuable upon the exchange of Common Units in i3 Verticals, LLC and 389,584 and 427,506 shares resulting from estimated stock option exercises and restricted stock units vesting as calculated by the treasury stock method for the six months ended March 31, 2025 and 2024, respectively.
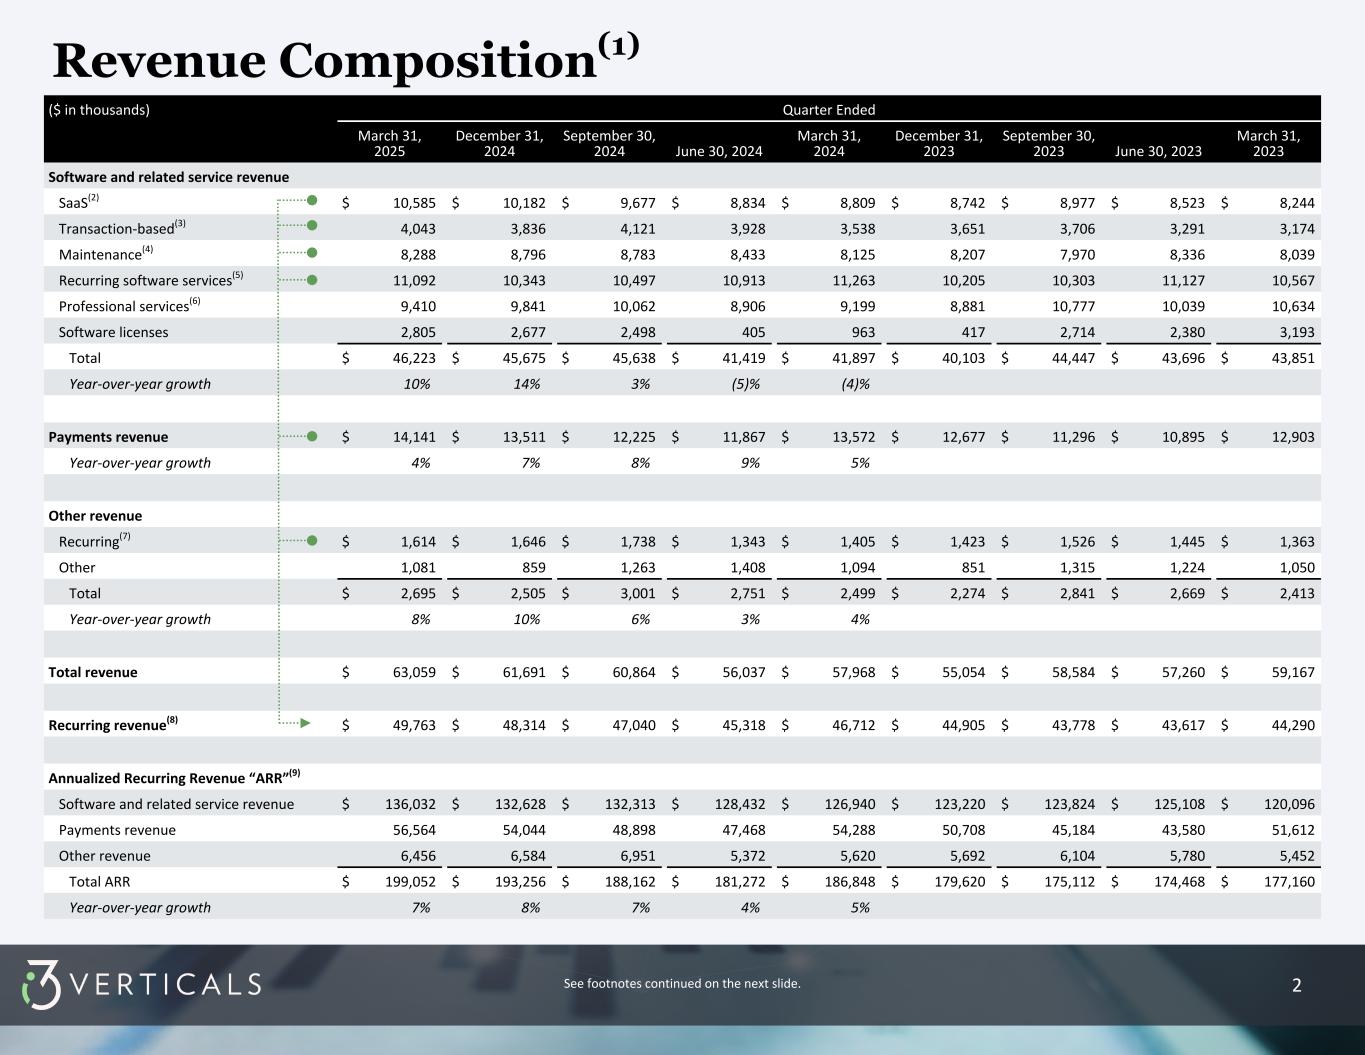
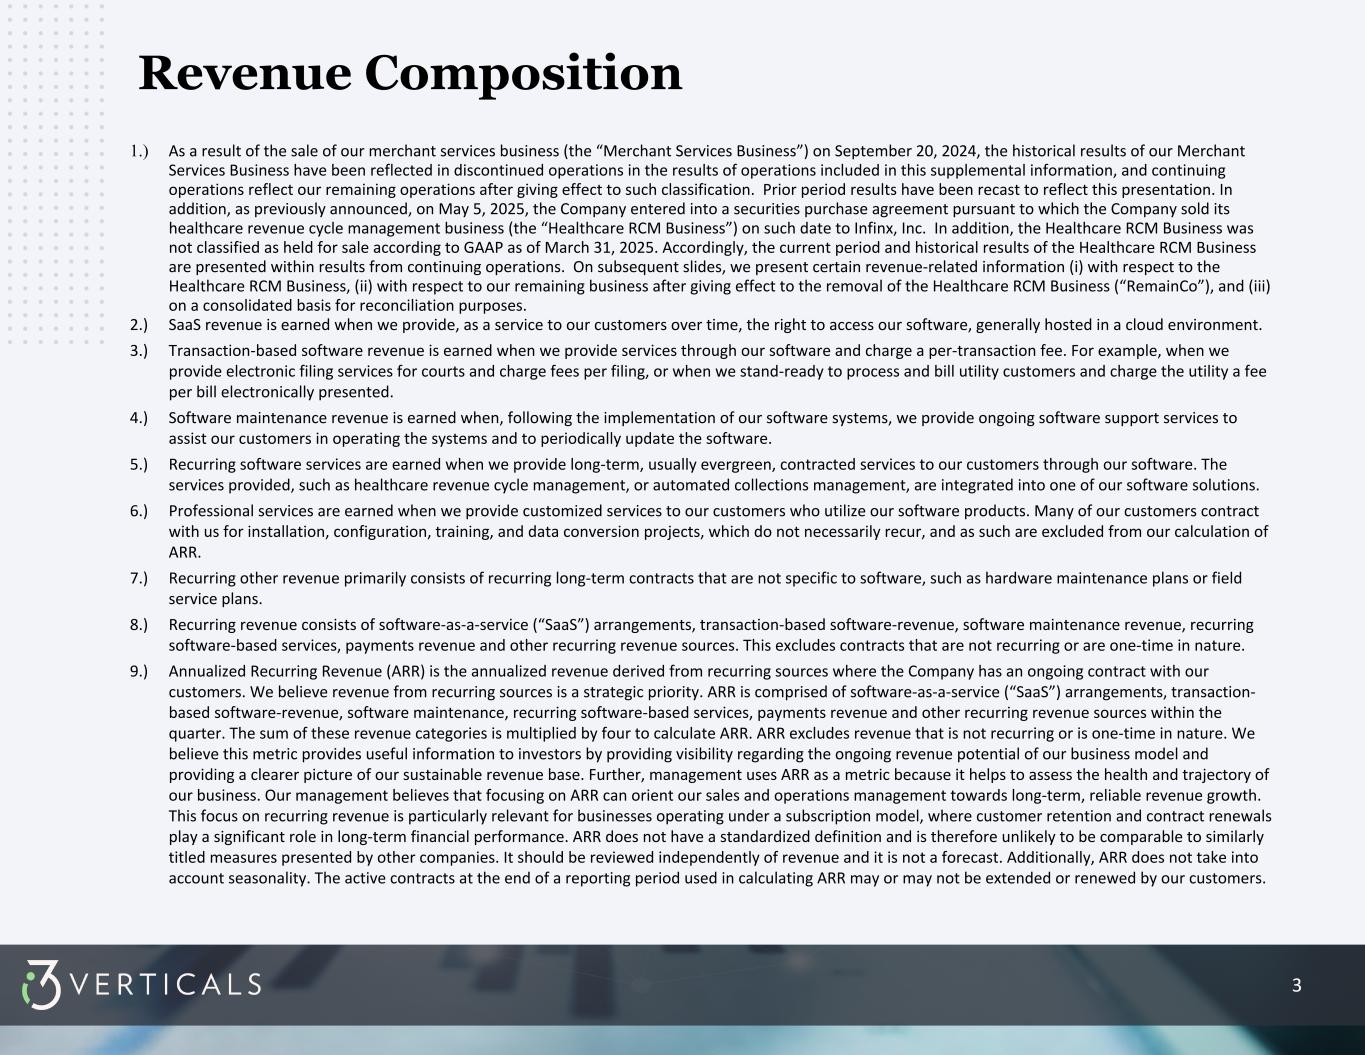

 
18 Reconciliation of Non-GAAP Financial Measures(1) The reconciliation of our quarterly income (loss) from continuing operations attributable to i3 Verticals, Inc. to non-GAAP adjusted income (loss) before taxes from continuing operations, non-GAAP adjusted net income from continuing operations and non-GAAP adjusted EBITDA from continuing operations (on a consolidated basis as well as with respect to the Healthcare RCM Business and RemainCo) is as follows: ($ in thousands) Three months ended March 31, 2025 December 31, 2024 September 30, 2024 June 30, 2024 March 31, 2024 December 31, 2023 Net income (loss) from continuing operations attributable to i3 Verticals, Inc. $ 73 $ 2,194 $ 6,329 $ (10,656) $ (1,709) $ (2,885) Net income (loss) from continuing operations attributable to non- controlling interests 1,022 1,128 689 (3,190) (593) (1,330) Net income (loss) from continuing operations 1,095 3,322 7,018 (13,846) (2,302) (4,215) Non-GAAP Adjustments: Provision for (benefit from) income taxes 3,054 523 (9,175) 5,271 (669) (1,094) Non-cash change in fair value of contingent consideration(2) 381 1,377 (145) (18) (290) (237) Equity-based compensation(3) 3,932 3,814 3,367 4,432 5,022 5,358 M&A-related activity(4) 109 51 272 1,931 714 244 Acquisition intangible amortization(5) 4,913 4,913 4,853 4,788 4,830 4,856 Non-cash interest(6) 250 280 278 221 262 414 Other taxes(7) 455 252 1,605 230 89 84 Other expense related to the adjustment of liabilities under tax receivable agreement(8) — — (1,245) — — — Net gain on exchangeable note repurchases and related transactions(9) — — — — (2,257) — (Gain) loss on disposal of property and equipment(10) (38) (585) — — — 107 Non-GAAP adjusted income (loss) before taxes from continuing operations 14,151 13,947 6,828 3,009 5,399 5,517 Estimated taxes at 25%(11) (3,537) (3,487) (1,707) (752) (1,351) (1,379) Adjusted net income (loss) from continuing operations(12) $ 10,614 $ 10,460 $ 5,121 $ 2,257 $ 4,048 $ 4,138 Plus: Cash interest (income) expense, net(13) 64 (346) 6,678 7,685 7,452 6,273 Estimated taxes at 25%(11) 3,537 3,487 1,707 752 1,351 1,379 Depreciation and internally developed software amortization(14) 2,927 2,771 2,727 2,181 2,363 2,198 Adjusted EBITDA from continuing operations(15) $ 17,142 $ 16,372 $ 16,233 $ 12,875 $ 15,214 $ 13,988 Less: Adjusted EBITDA from Healthcare RCM Business(15) 1,301 1,801 1,620 2,096 1,666 2,464 Adjusted EBITDA from RemainCo(15) $ 15,841 $ 14,571 $ 14,613 $ 10,779 $ 13,548 $ 11,524 See footnotes on the next slide.


19 1.) Following the disposal of our Merchant Services Business in the fourth quarter of fiscal year 2024, our core business is providing software solutions for key verticals. Given the change in our business model following the sale of our Merchant Services Business, we have reclassified certain expenses to better align with the primary industry in which we now operate. During the first quarter of fiscal year 2025, we revised our presentation of certain expenses in the Condensed Consolidated Statements of Operations from selling, general and administrative expenses to other costs of services. We reclassified personnel costs related to installation of our software, conversion of client data, training client personnel, customer support activities and various other services provided directly to customers from selling, general and administrative to other costs of services. We also reclassified certain hosting and related software costs for directly supporting our customers from selling, general and administrative to other costs of services. Prior period results have been reclassified to conform to the current presentation. These tables are presented for our continuing operations. In addition, the Healthcare RCM Business was not classified as held for sale according to GAAP as of March 31, 2025. Accordingly, the current period and historical results of the Healthcare RCM Business are presented within results from continuing operations. 2.) Non-cash change in fair value of contingent consideration reflects the changes in management’s estimates of future cash consideration to be paid in connection with prior acquisitions from the amount estimated as of the later of the most recent balance sheet date forming the beginning of the income statement period or the original estimates made at the closing of the applicable acquisition. 3.) Equity-based compensation expense related to stock options and restricted stock units issued under the Company's 2018 Equity Incentive Plan and 2020 Acquisition Equity Incentive Plan. 4.) M&A-related activity is the net impact of professional service and related costs directly related to any merger, acquisition and disposition activity of the Company, which are recorded in selling, general and administrative in the condensed consolidated statements of operations, and revenue earned through post-sale non-recurring activities with divestitures, which are recorded in other income in the condensed consolidated statements of operations. i3 Verticals believes these activities are not reflective of the underlying operational performance of the Company. 5.) Acquisition intangible amortization reflects amortization of intangible assets and software acquired through business combinations, acquired customer portfolios, acquired referral agreements and related asset acquisitions. 6.) Non-cash interest expense reflects amortization of debt issuance costs and any write-offs of debt issuance costs. 7.) Other taxes consist of franchise taxes, commercial activity taxes, reserves for ongoing tax audit matters, the employer portion of payroll taxes related to stock option exercises and other non-income-based taxes. Taxes related to salaries are not included. 8.) Under our Tax Receivable Agreement we have a liability equal to 85% of certain deferred tax assets resulting from an increase in the tax basis of our investment in i3 Verticals, LLC. Other expenses related to adjustments of liabilities under our Tax Receivable Agreement relate to the remeasurement of the underlying deferred tax asset for changes in estimated income tax rates. 9.) Net gain on exchangeable note repurchases and related transactions reflects the gain on repurchases of exchangeable notes and warrant unwinds, net of the loss on sale of bond hedge unwinds, which occurred during the three months ended March 31, 2024 10.) (Gain) loss on disposal of property and equipment is related to the sale of buildings and automobiles purchased through acquisitions. 11.) Corporate income tax expense is based on non-GAAP adjusted income before taxes from continuing operations and is calculated using a tax rate of 25.0% for all presented quarters, based on the estimated long-term effective tax rate, considering blended federal and state tax rates. 12.) Adjusted net income from continuing operations represents a non-GAAP financial measure and assumes that all net income during the period is available to the holders of the Company's Class A common stock. Further, adjusted diluted earnings per share from continuing operations assumes that all Common Units in i3 Verticals, LLC and the associated non- voting Class B common stock were exchanged for Class A common stock at the beginning of the period on a one-for-one basis. 13.) Cash interest (income) expense, net, represents all interest expense net of interest income recorded on the Company's statement of operations other than non-cash interest expense, which represents amortization of debt issuance costs and any write-offs of debt issuance costs. 14.) Depreciation and internally developed software amortization reflects depreciation on the Company's property, plant and equipment, net, and amortization expense on its internally developed capitalized software. 15.) Represents a non-GAAP financial measure. Reconciliation of Non-GAAP Financial Measures