ipx-20260630
false2026FYIPERIONX Ltd0001898601C3USxbrli:sharesiso4217:USDiso4217:USDxbrli:sharesutr:tipx:segmentipx:Patentutr:acreiso4217:AUDiso4217:AUDxbrli:sharesxbrli:pure00018986012025-07-012026-06-300001898601dei:BusinessContactMember2025-07-012026-06-3000018986012026-06-3000018986012024-07-012025-06-3000018986012023-07-012024-06-3000018986012025-06-300001898601ifrs-full:IssuedCapitalMember2024-06-300001898601ifrs-full:ReserveOfSharebasedPaymentsMember2024-06-300001898601ifrs-full:ReserveOfExchangeDifferencesOnTranslationMember2024-06-300001898601ifrs-full:RetainedEarningsMember2024-06-3000018986012024-06-300001898601ifrs-full:RetainedEarningsMember2024-07-012025-06-300001898601ifrs-full:ReserveOfExchangeDifferencesOnTranslationMember2024-07-012025-06-300001898601ifrs-full:IssuedCapitalMember2024-07-012025-06-300001898601ifrs-full:ReserveOfSharebasedPaymentsMember2024-07-012025-06-300001898601ifrs-full:IssuedCapitalMember2025-06-300001898601ifrs-full:ReserveOfSharebasedPaymentsMember2025-06-300001898601ifrs-full:ReserveOfExchangeDifferencesOnTranslationMember2025-06-300001898601ifrs-full:RetainedEarningsMember2025-06-300001898601ifrs-full:RetainedEarningsMember2025-07-012026-06-300001898601ifrs-full:ReserveOfExchangeDifferencesOnTranslationMember2025-07-012026-06-300001898601ifrs-full:IssuedCapitalMember2025-07-012026-06-300001898601ifrs-full:ReserveOfSharebasedPaymentsMember2025-07-012026-06-300001898601ifrs-full:IssuedCapitalMember2026-06-300001898601ifrs-full:ReserveOfSharebasedPaymentsMember2026-06-300001898601ifrs-full:ReserveOfExchangeDifferencesOnTranslationMember2026-06-300001898601ifrs-full:RetainedEarningsMember2026-06-3000018986012023-06-300001898601ipx:SharePlacementMember2026-07-070001898601ipx:DefenseProductionActDPAFundingProgramMember2023-10-310001898601ipx:U.S.DoWIndustrialBaseAnalysisAndSustainmentGrantProgramIBASMember2025-02-280001898601ipx:DefenseProductionActDPAFundingProgramAndU.S.DoWIndustrialBaseAnalysisAndSustainmentGrantProgramIBASMember2026-06-302026-06-300001898601ipx:DefenseProductionActDPAFundingProgramAndU.S.DoWIndustrialBaseAnalysisAndSustainmentGrantProgramIBASMember2026-06-300001898601ipx:DefenseProductionActDPAFundingProgramAndU.S.DoWIndustrialBaseAnalysisAndSustainmentGrantProgramIBASMember2025-08-310001898601ipx:SmallBusinessInnovationResearchSBIRFundingProgramMember2026-06-300001898601ipx:SmallBusinessInnovationResearchSBIRFundingProgramTaskOrder2Member2026-06-300001898601ipx:SmallBusinessInnovationResearchSBIRFundingProgramTaskOrder2Member2026-08-310001898601ipx:U.S.GovernmentOtherAwardsMember2026-06-300001898601ipx:PlantAndEquipmentMemberifrs-full:BottomOfRangeMember2025-07-012026-06-300001898601ipx:PlantAndEquipmentMemberifrs-full:TopOfRangeMember2025-07-012026-06-300001898601ipx:BuildingsAndLeaseholdImprovementsMemberifrs-full:BottomOfRangeMember2025-07-012026-06-300001898601ipx:BuildingsAndLeaseholdImprovementsMemberifrs-full:TopOfRangeMember2025-07-012026-06-300001898601ifrs-full:CopyrightsPatentsAndOtherIndustrialPropertyRightsServiceAndOperatingRightsMemberifrs-full:BottomOfRangeMember2025-07-012026-06-300001898601ifrs-full:CopyrightsPatentsAndOtherIndustrialPropertyRightsServiceAndOperatingRightsMemberifrs-full:TopOfRangeMember2025-07-012026-06-300001898601ifrs-full:CopyrightsPatentsAndOtherIndustrialPropertyRightsServiceAndOperatingRightsMemberifrs-full:WeightedAverageMember2025-07-012026-06-300001898601ipx:DefenseProductionActDPAFundingProgramMember2025-07-012026-06-300001898601ipx:DefenseProductionActDPAFundingProgramMember2024-07-012025-06-300001898601ipx:DefenseProductionActDPAFundingProgramMember2023-07-012024-06-300001898601ipx:GovernmentGrantsMemberipx:DefenseProductionActDPAFundingProgramMember2026-07-012026-09-220001898601ipx:U.S.DoWIndustrialBaseAnalysisAndSustainmentGrantProgramIBASMember2025-02-012025-02-280001898601ipx:U.S.DoWIndustrialBaseAnalysisAndSustainmentGrantProgramIBASMember2025-08-012025-08-310001898601ipx:U.S.DoWIndustrialBaseAnalysisAndSustainmentGrantProgramIBASMember2025-09-012025-09-300001898601ipx:U.S.DoWIndustrialBaseAnalysisAndSustainmentGrantProgramIBASMember2026-01-012026-01-310001898601ipx:U.S.DoWIndustrialBaseAnalysisAndSustainmentGrantProgramIBASMember2025-07-012026-06-300001898601ipx:U.S.DoWIndustrialBaseAnalysisAndSustainmentGrantProgramIBASMember2024-07-012025-06-300001898601ipx:SmallBusinessInnovationResearchSBIRFundingProgramMember2025-06-300001898601ipx:SmallBusinessInnovationResearchSBIRFundingProgramMember2025-07-012026-06-300001898601ipx:SmallBusinessInnovationResearchSBIRFundingProgramMember2024-07-012025-06-300001898601ifrs-full:RightofuseAssetsMember2026-06-300001898601ifrs-full:RightofuseAssetsMember2025-06-300001898601ifrs-full:RightofuseAssetsMember2024-06-300001898601ipx:UnusedTaxCreditsAccruedExpenditureMember2026-06-300001898601ipx:UnusedTaxCreditsAccruedExpenditureMember2025-06-300001898601ipx:UnusedTaxCreditsAccruedExpenditureMember2024-06-300001898601ifrs-full:AllowanceForCreditLossesMember2026-06-300001898601ifrs-full:AllowanceForCreditLossesMember2025-06-300001898601ifrs-full:AllowanceForCreditLossesMember2024-06-300001898601ipx:UnusedTaxCreditsLeaseLiabilitiesMember2026-06-300001898601ipx:UnusedTaxCreditsLeaseLiabilitiesMember2025-06-300001898601ipx:UnusedTaxCreditsLeaseLiabilitiesMember2024-06-300001898601ipx:UnusedTaxCreditsCapitalAllowancesMember2026-06-300001898601ipx:UnusedTaxCreditsCapitalAllowancesMember2025-06-300001898601ipx:UnusedTaxCreditsCapitalAllowancesMember2024-06-300001898601ifrs-full:UnusedTaxLossesMember2026-06-300001898601ifrs-full:UnusedTaxLossesMember2025-06-300001898601ifrs-full:UnusedTaxLossesMember2024-06-300001898601ifrs-full:PropertyPlantAndEquipmentMember2025-06-300001898601ifrs-full:RightofuseAssetsMember2025-06-300001898601ifrs-full:PropertyPlantAndEquipmentMember2025-07-012026-06-300001898601ifrs-full:RightofuseAssetsMember2025-07-012026-06-300001898601ifrs-full:PropertyPlantAndEquipmentMember2026-06-300001898601ifrs-full:RightofuseAssetsMember2026-06-300001898601ifrs-full:GrossCarryingAmountMemberifrs-full:PropertyPlantAndEquipmentMember2026-06-300001898601ifrs-full:GrossCarryingAmountMemberifrs-full:RightofuseAssetsMember2026-06-300001898601ifrs-full:GrossCarryingAmountMember2026-06-300001898601ifrs-full:AccumulatedDepreciationAmortisationAndImpairmentMemberifrs-full:PropertyPlantAndEquipmentMember2026-06-300001898601ifrs-full:AccumulatedDepreciationAmortisationAndImpairmentMemberifrs-full:RightofuseAssetsMember2026-06-300001898601ifrs-full:AccumulatedDepreciationAmortisationAndImpairmentMember2026-06-300001898601ifrs-full:PropertyPlantAndEquipmentMember2024-06-300001898601ifrs-full:RightofuseAssetsMember2024-06-300001898601ifrs-full:PropertyPlantAndEquipmentMember2024-07-012025-06-300001898601ifrs-full:RightofuseAssetsMember2024-07-012025-06-300001898601ifrs-full:GrossCarryingAmountMemberifrs-full:PropertyPlantAndEquipmentMember2025-06-300001898601ifrs-full:GrossCarryingAmountMemberifrs-full:RightofuseAssetsMember2025-06-300001898601ifrs-full:GrossCarryingAmountMember2025-06-300001898601ifrs-full:AccumulatedDepreciationAmortisationAndImpairmentMemberifrs-full:PropertyPlantAndEquipmentMember2025-06-300001898601ifrs-full:AccumulatedDepreciationAmortisationAndImpairmentMemberifrs-full:RightofuseAssetsMember2025-06-300001898601ifrs-full:AccumulatedDepreciationAmortisationAndImpairmentMember2025-06-300001898601ifrs-full:PropertyPlantAndEquipmentMember2023-06-300001898601ifrs-full:RightofuseAssetsMember2023-06-300001898601ifrs-full:PropertyPlantAndEquipmentMember2023-07-012024-06-300001898601ifrs-full:RightofuseAssetsMember2023-07-012024-06-300001898601ifrs-full:GrossCarryingAmountMemberifrs-full:PropertyPlantAndEquipmentMember2024-06-300001898601ifrs-full:GrossCarryingAmountMemberifrs-full:RightofuseAssetsMember2024-06-300001898601ifrs-full:GrossCarryingAmountMember2024-06-300001898601ifrs-full:AccumulatedDepreciationAmortisationAndImpairmentMemberifrs-full:PropertyPlantAndEquipmentMember2024-06-300001898601ifrs-full:AccumulatedDepreciationAmortisationAndImpairmentMemberifrs-full:RightofuseAssetsMember2024-06-300001898601ifrs-full:AccumulatedDepreciationAmortisationAndImpairmentMember2024-06-300001898601ifrs-full:CopyrightsPatentsAndOtherIndustrialPropertyRightsServiceAndOperatingRightsMember2025-06-300001898601ifrs-full:CopyrightsPatentsAndOtherIndustrialPropertyRightsServiceAndOperatingRightsMember2024-06-300001898601ifrs-full:CopyrightsPatentsAndOtherIndustrialPropertyRightsServiceAndOperatingRightsMember2025-07-012026-06-300001898601ifrs-full:CopyrightsPatentsAndOtherIndustrialPropertyRightsServiceAndOperatingRightsMember2024-07-012025-06-300001898601ifrs-full:CopyrightsPatentsAndOtherIndustrialPropertyRightsServiceAndOperatingRightsMember2026-06-300001898601ifrs-full:GrossCarryingAmountMemberifrs-full:CopyrightsPatentsAndOtherIndustrialPropertyRightsServiceAndOperatingRightsMember2026-06-300001898601ifrs-full:GrossCarryingAmountMemberifrs-full:CopyrightsPatentsAndOtherIndustrialPropertyRightsServiceAndOperatingRightsMember2025-06-300001898601ifrs-full:AccumulatedDepreciationAndAmortisationMemberifrs-full:CopyrightsPatentsAndOtherIndustrialPropertyRightsServiceAndOperatingRightsMember2026-06-300001898601ifrs-full:AccumulatedDepreciationAndAmortisationMemberifrs-full:CopyrightsPatentsAndOtherIndustrialPropertyRightsServiceAndOperatingRightsMember2025-06-300001898601ifrs-full:CopyrightsPatentsAndOtherIndustrialPropertyRightsServiceAndOperatingRightsMemberipx:BlacksandTechnologyLLCMember2024-07-012025-06-300001898601ipx:TitanProjectMember2025-06-300001898601ipx:TitanProjectMember2025-07-012026-06-300001898601ipx:TitanProjectMember2026-06-300001898601ipx:TitanProjectMember2024-06-300001898601ipx:TitanProjectMember2024-07-012025-06-300001898601ipx:TitanProjectMember2023-06-300001898601ipx:TitanProjectMember2023-07-012024-06-300001898601ipx:OtherLoansAndBorrowingsMember2025-06-300001898601ifrs-full:LeaseLiabilitiesMember2025-06-300001898601ipx:OtherLoansAndBorrowingsMember2025-07-012026-06-300001898601ifrs-full:LeaseLiabilitiesMember2025-07-012026-06-300001898601ipx:OtherLoansAndBorrowingsMember2026-06-300001898601ifrs-full:LeaseLiabilitiesMember2026-06-300001898601ipx:OtherLoansAndBorrowingsMember2024-06-300001898601ifrs-full:LeaseLiabilitiesMember2024-06-300001898601ipx:OtherLoansAndBorrowingsMember2024-07-012025-06-300001898601ifrs-full:LeaseLiabilitiesMember2024-07-012025-06-300001898601ifrs-full:GrossCarryingAmountMemberipx:OtherLoansAndBorrowingsMemberifrs-full:NotLaterThanOneYearMember2026-06-300001898601ifrs-full:GrossCarryingAmountMemberifrs-full:LeaseLiabilitiesMemberifrs-full:NotLaterThanOneYearMember2026-06-300001898601ifrs-full:GrossCarryingAmountMemberipx:OtherLoansAndBorrowingsMemberifrs-full:LaterThanOneYearAndNotLaterThanTwoYearsMember2026-06-300001898601ifrs-full:GrossCarryingAmountMemberifrs-full:LeaseLiabilitiesMemberifrs-full:LaterThanOneYearAndNotLaterThanTwoYearsMember2026-06-300001898601ifrs-full:GrossCarryingAmountMemberipx:OtherLoansAndBorrowingsMemberifrs-full:LaterThanTwoYearsAndNotLaterThanThreeYearsMember2026-06-300001898601ifrs-full:GrossCarryingAmountMemberifrs-full:LeaseLiabilitiesMemberifrs-full:LaterThanTwoYearsAndNotLaterThanThreeYearsMember2026-06-300001898601ifrs-full:GrossCarryingAmountMemberipx:OtherLoansAndBorrowingsMemberifrs-full:LaterThanThreeYearsAndNotLaterThanFourYearsMember2026-06-300001898601ifrs-full:GrossCarryingAmountMemberifrs-full:LeaseLiabilitiesMemberifrs-full:LaterThanThreeYearsAndNotLaterThanFourYearsMember2026-06-300001898601ifrs-full:GrossCarryingAmountMemberipx:OtherLoansAndBorrowingsMemberifrs-full:LaterThanFourYearsAndNotLaterThanFiveYearsMember2026-06-300001898601ifrs-full:GrossCarryingAmountMemberifrs-full:LeaseLiabilitiesMemberifrs-full:LaterThanFourYearsAndNotLaterThanFiveYearsMember2026-06-300001898601ifrs-full:GrossCarryingAmountMemberipx:OtherLoansAndBorrowingsMemberifrs-full:LaterThanFiveYearsMember2026-06-300001898601ifrs-full:GrossCarryingAmountMemberifrs-full:LeaseLiabilitiesMemberifrs-full:LaterThanFiveYearsMember2026-06-300001898601ifrs-full:GrossCarryingAmountMemberipx:OtherLoansAndBorrowingsMember2026-06-300001898601ifrs-full:GrossCarryingAmountMemberifrs-full:LeaseLiabilitiesMember2026-06-300001898601ipx:ImputedInterestMemberipx:OtherLoansAndBorrowingsMember2026-06-300001898601ipx:ImputedInterestMemberifrs-full:LeaseLiabilitiesMember2026-06-300001898601ifrs-full:IssuedCapitalMember2023-06-300001898601ipx:ClassAPerformanceSharesMemberifrs-full:IssuedCapitalMember2023-06-300001898601ipx:ClassBPerformanceSharesMemberifrs-full:IssuedCapitalMember2023-06-300001898601ifrs-full:IssuedCapitalMember2023-07-012024-06-300001898601ipx:ClassAPerformanceSharesMemberifrs-full:IssuedCapitalMember2024-06-300001898601ipx:ClassBPerformanceSharesMemberifrs-full:IssuedCapitalMember2024-06-300001898601ipx:ClassAPerformanceSharesMemberifrs-full:IssuedCapitalMember2024-07-012025-06-300001898601ipx:ClassAPerformanceSharesMemberifrs-full:IssuedCapitalMember2025-06-300001898601ipx:ClassBPerformanceSharesMemberifrs-full:IssuedCapitalMember2025-06-300001898601ipx:ClassBPerformanceSharesMemberifrs-full:IssuedCapitalMember2025-07-012026-06-300001898601ipx:ClassAPerformanceSharesMemberifrs-full:IssuedCapitalMember2026-06-300001898601ipx:ClassBPerformanceSharesMemberifrs-full:IssuedCapitalMember2026-06-300001898601ipx:ClassAPerformanceSharesMemberifrs-full:IssuedCapitalMember2025-07-012026-06-300001898601ipx:UnlistedOptionsMember2025-06-300001898601ipx:PerformanceRightsMember2025-06-300001898601ifrs-full:RestrictedShareUnitsMember2025-06-300001898601ifrs-full:ReserveOfSharebasedPaymentsMember2025-06-300001898601ipx:UnlistedOptionsMember2025-07-012026-06-300001898601ipx:PerformanceRightsMember2025-07-012026-06-300001898601ifrs-full:RestrictedShareUnitsMember2025-07-012026-06-300001898601ifrs-full:ReserveOfSharebasedPaymentsMember2025-07-012026-06-300001898601ipx:UnlistedOptionsMember2026-06-300001898601ipx:PerformanceRightsMember2026-06-300001898601ifrs-full:RestrictedShareUnitsMember2026-06-300001898601ifrs-full:ReserveOfSharebasedPaymentsMember2026-06-300001898601ipx:UnlistedOptionsMember2024-06-300001898601ipx:PerformanceRightsMember2024-06-300001898601ifrs-full:RestrictedShareUnitsMember2024-06-300001898601ifrs-full:ReserveOfSharebasedPaymentsMember2024-06-300001898601ipx:UnlistedOptionsMember2024-07-012025-06-300001898601ipx:PerformanceRightsMember2024-07-012025-06-300001898601ifrs-full:RestrictedShareUnitsMember2024-07-012025-06-300001898601ifrs-full:ReserveOfSharebasedPaymentsMember2024-07-012025-06-300001898601ipx:UnlistedOptionsMember2023-06-300001898601ipx:PerformanceRightsMember2023-06-300001898601ifrs-full:RestrictedShareUnitsMember2023-06-300001898601ifrs-full:ReserveOfSharebasedPaymentsMember2023-06-300001898601ipx:PerformanceRightsMember2023-07-012024-06-300001898601ifrs-full:RestrictedShareUnitsMember2023-07-012024-06-300001898601ipx:UnlistedOptionsMember2023-07-012024-06-300001898601ifrs-full:ReserveOfSharebasedPaymentsMember2023-07-012024-06-300001898601ipx:DirectorOptionsExpiringDecember52026Member2026-06-300001898601ipx:DirectorOptionsExpiringDecember52026Member2025-07-012026-06-300001898601ipx:UnlistedOptionsExpiringApril12027Member2026-06-300001898601ipx:UnlistedOptionsExpiringApril12027Member2025-07-012026-06-300001898601ipx:UnlistedOptionsExpiringJune302027Member2026-06-300001898601ipx:UnlistedOptionsExpiringJune302027Member2025-07-012026-06-300001898601ipx:EmployeeOptionsExpiringApril102029Member2026-06-300001898601ipx:EmployeeOptionsExpiringApril102029Member2025-07-012026-06-300001898601ipx:EmployeeOptionsExpiringApril22030Member2026-06-300001898601ipx:EmployeeOptionsExpiringApril22030Member2025-07-012026-06-300001898601ipx:DirectorAndEmployeeOptionsExpiringApril22031At18.00Member2026-06-300001898601ipx:DirectorAndEmployeeOptionsExpiringApril22031At18.00Member2025-07-012026-06-300001898601ipx:DirectorAndEmployeeOptionsExpiringApril22031At22.00Member2026-06-300001898601ipx:DirectorAndEmployeeOptionsExpiringApril22031At22.00Member2025-07-012026-06-300001898601ipx:EmployeePerformanceRightsExpiringDecember212028AndDecember312027Member2025-07-012026-06-300001898601ipx:EmployeePerformanceRightsExpiringDecember212028Member2025-07-012026-06-300001898601ipx:EmployeePerformanceRightsExpiringDecember312027Member2025-07-012026-06-300001898601ipx:DirectorAndEmployeePerformanceRightsExpiringApril22031Member2025-07-012026-06-300001898601ipx:EmployeePerformanceRightsExpiringApril102031VWAP6.00Member2025-07-012026-06-300001898601ipx:EmployeePerformanceRightsExpiringApril102031VWAP7.00Member2025-07-012026-06-300001898601ipx:EmployeePerformanceRightsExpiringApril102031VWAP8.00Member2025-07-012026-06-300001898601ipx:EmployeePerformanceRightsPerformanceVestingConditionExpiringDecember312026Member2025-07-012026-06-300001898601ipx:DirectorRestrictedShareUnitExpiringDecember232026Member2025-07-012026-06-300001898601ipx:DirectorAndEmployeeRestrictedShareUnitExpiringDecember312026Member2025-07-012026-06-300001898601ipx:DirectorRestrictedShareUnitExpiringDecember52027Member2025-07-012026-06-300001898601ipx:EmployeeRestrictedShareUnitExpiringDecember312027Member2025-07-012026-06-300001898601ipx:EmployeeRestrictedShareUnitExpiringMarch22028Member2025-07-012026-06-300001898601ipx:EmployeeRestrictedShareUnitExpiringApril22028Member2025-07-012026-06-300001898601ipx:DirectorRestrictedShareUnitExpiringDecember162028Member2025-07-012026-06-300001898601ipx:EmployeeRestrictedShareUnitExpiringDecember312028Member2025-07-012026-06-300001898601ipx:DirectorAndEmployeeRestrictedShareUnitExpiringApril102029Member2025-07-012026-06-300001898601ipx:EmployeeRestrictedShareUnitExpiringDecember312029Member2025-07-012026-06-300001898601ipx:EmployeeRestrictedShareUnitExpiringApril22030Member2025-07-012026-06-300001898601ifrs-full:ShareOptionsMember2025-07-012026-06-300001898601ipx:PerformanceRightsMember2025-07-012026-06-300001898601ifrs-full:RestrictedShareUnitsMember2025-07-012026-06-300001898601ifrs-full:MajorOrdinaryShareTransactionsMember2026-07-012026-09-220001898601ipx:RestrictedStockUnitsTransactionsMember2026-07-012026-09-220001898601ipx:OptionsTransactionsMember2026-07-012026-09-220001898601ipx:HyperionMetalsAustraliaPtyLtdMember2025-07-012026-06-300001898601ipx:HyperionMetalsAustraliaPtyLtdMember2024-07-012025-06-300001898601ipx:HyperionMetalsAustraliaPtyLtdMember2023-07-012024-06-300001898601ipx:IperionXCriticalMineralsLLCMember2025-07-012026-06-300001898601ipx:IperionXCriticalMineralsLLCMember2024-07-012025-06-300001898601ipx:IperionXCriticalMineralsLLCMember2023-07-012024-06-300001898601ipx:IperionXTechnologyLLCMember2025-07-012026-06-300001898601ipx:IperionXTechnologyLLCMember2024-07-012025-06-300001898601ipx:IperionXTechnologyLLCMember2023-07-012024-06-300001898601ipx:IperionXInc.Member2025-07-012026-06-300001898601ipx:IperionXInc.Member2024-07-012025-06-300001898601ipx:IperionXInc.Member2023-07-012024-06-300001898601ipx:ApolloGroupMember2023-07-012024-06-300001898601ipx:PerformanceIndustriesInc.Member2025-07-012026-06-300001898601ipx:PerformanceIndustriesInc.Member2024-07-012025-06-300001898601ipx:PerformanceIndustriesInc.Member2023-07-012024-06-300001898601ipx:BlacksandTechnologyLLCMember2024-06-300001898601ipx:BlacksandTechnologyLLCMember2024-01-012024-01-310001898601ipx:PerformanceRightsMarketConditionsMember2023-06-300001898601ipx:PerformanceRightsPerformanceConditionsMember2023-06-300001898601ipx:PerformanceRightsMarketConditionsMember2023-07-012024-06-300001898601ipx:PerformanceRightsPerformanceConditionsMember2023-07-012024-06-300001898601ipx:PerformanceRightsMarketConditionsMember2024-06-300001898601ipx:PerformanceRightsPerformanceConditionsMember2024-06-300001898601ipx:PerformanceRightsMarketConditionsMember2024-07-012025-06-300001898601ipx:PerformanceRightsPerformanceConditionsMember2024-07-012025-06-300001898601ipx:PerformanceRightsMarketConditionsMember2025-06-300001898601ipx:PerformanceRightsPerformanceConditionsMember2025-06-300001898601ipx:PerformanceRightsMarketConditionsMember2025-07-012026-06-300001898601ipx:PerformanceRightsPerformanceConditionsMember2025-07-012026-06-300001898601ipx:PerformanceRightsMarketConditionsMember2026-06-300001898601ipx:PerformanceRightsPerformanceConditionsMember2026-06-300001898601ipx:PerformanceRightsSeries1Member2025-07-012026-06-300001898601ipx:PerformanceRightsSeries1Member2026-06-300001898601ipx:RestrictedShareUnitsSeries2Member2025-07-012026-06-300001898601ipx:RestrictedShareUnitsSeries2Member2026-06-300001898601ipx:RestrictedShareUnitsSeries3Member2025-07-012026-06-300001898601ipx:RestrictedShareUnitsSeries3Member2026-06-300001898601ipx:ShareOptionsSeries30Member2025-07-012026-06-300001898601ipx:ShareOptionsSeries30Member2026-06-300001898601ipx:PerformanceRightsSeries5Member2025-07-012026-06-300001898601ipx:PerformanceRightsSeries5Member2026-06-300001898601ipx:RestrictedShareUnitsSeries6Member2025-07-012026-06-300001898601ipx:RestrictedShareUnitsSeries6Member2026-06-300001898601ipx:ShareOptionsSeries7Member2025-07-012026-06-300001898601ipx:ShareOptionsSeries7Member2026-06-300001898601ipx:ShareOptionsSeries8Member2025-07-012026-06-300001898601ipx:ShareOptionsSeries8Member2026-06-300001898601ipx:ShareOptionsSeries9Member2025-07-012026-06-300001898601ipx:ShareOptionsSeries9Member2026-06-300001898601ipx:PerformanceRightsSeries10Member2025-07-012026-06-300001898601ipx:PerformanceRightsSeries10Member2026-06-300001898601ipx:RestrictedShareUnitsSeries11Member2025-07-012026-06-300001898601ipx:RestrictedShareUnitsSeries11Member2026-06-300001898601ipx:RestrictedShareUnitsSeries12Member2025-07-012026-06-300001898601ipx:RestrictedShareUnitsSeries12Member2026-06-300001898601ipx:RestrictedShareUnitsSeries13Member2025-07-012026-06-300001898601ipx:RestrictedShareUnitsSeries13Member2026-06-300001898601ipx:ShareOptionsSeries14Member2025-07-012026-06-300001898601ipx:ShareOptionsSeries14Member2026-06-300001898601ipx:ShareOptionsSeries15Member2025-07-012026-06-300001898601ipx:ShareOptionsSeries15Member2026-06-300001898601ipx:PerformanceRightsSeries16Member2025-07-012026-06-300001898601ipx:PerformanceRightsSeries16Member2026-06-300001898601ipx:PerformanceRightsSeries1Member2024-07-012025-06-300001898601ipx:PerformanceRightsSeries1Member2025-06-300001898601ipx:PerformanceRightsSeries2Member2024-07-012025-06-300001898601ipx:PerformanceRightsSeries2Member2025-06-300001898601ipx:PerformanceRightsSeries3Member2024-07-012025-06-300001898601ipx:PerformanceRightsSeries3Member2025-06-300001898601ipx:PerformanceRightsSeries4Member2024-07-012025-06-300001898601ipx:PerformanceRightsSeries4Member2025-06-300001898601ipx:PerformanceRightsSeries5Member2024-07-012025-06-300001898601ipx:PerformanceRightsSeries5Member2025-06-300001898601ipx:RestrictedShareUnitsSeries6Member2024-07-012025-06-300001898601ipx:RestrictedShareUnitsSeries6Member2025-06-300001898601ipx:RestrictedShareUnitsSeries7Member2024-07-012025-06-300001898601ipx:RestrictedShareUnitsSeries7Member2025-06-300001898601ipx:PerformanceRightsSeries8Member2024-07-012025-06-300001898601ipx:PerformanceRightsSeries8Member2025-06-300001898601ipx:RestrictedShareUnitsSeries9Member2024-07-012025-06-300001898601ipx:RestrictedShareUnitsSeries9Member2025-06-300001898601ipx:RestrictedShareUnitsSeries10Member2024-07-012025-06-300001898601ipx:RestrictedShareUnitsSeries10Member2025-06-300001898601ipx:RestrictedShareUnitsSeries11Member2024-07-012025-06-300001898601ipx:RestrictedShareUnitsSeries11Member2025-06-300001898601ipx:RestrictedShareUnitsSeries12Member2024-07-012025-06-300001898601ipx:RestrictedShareUnitsSeries12Member2025-06-300001898601ipx:RestrictedShareUnitsSeries13Member2024-07-012025-06-300001898601ipx:RestrictedShareUnitsSeries13Member2025-06-300001898601ipx:ShareOptionsSeries14Member2024-07-012025-06-300001898601ipx:ShareOptionsSeries14Member2025-06-300001898601ipx:RestrictedShareUnitsSeries15Member2024-07-012025-06-300001898601ipx:RestrictedShareUnitsSeries15Member2025-06-300001898601ipx:RestrictedShareUnitsSeries16Member2024-07-012025-06-300001898601ipx:RestrictedShareUnitsSeries16Member2025-06-300001898601ipx:RestrictedShareUnitsSeries17Member2024-07-012025-06-300001898601ipx:RestrictedShareUnitsSeries17Member2025-06-300001898601ipx:PerformanceRightsSeries18Member2024-07-012025-06-300001898601ipx:PerformanceRightsSeries18Member2025-06-300001898601ipx:PerformanceRightsSeries19Member2024-07-012025-06-300001898601ipx:PerformanceRightsSeries19Member2025-06-300001898601ipx:PerformanceRightsSeries20Member2024-07-012025-06-300001898601ipx:PerformanceRightsSeries20Member2025-06-300001898601ipx:RestrictedShareUnitsSeries21Member2024-07-012025-06-300001898601ipx:RestrictedShareUnitsSeries21Member2025-06-300001898601ipx:RestrictedShareUnitsSeries22Member2024-07-012025-06-300001898601ipx:RestrictedShareUnitsSeries22Member2025-06-300001898601ipx:ShareOptionsSeries23Member2024-07-012025-06-300001898601ipx:ShareOptionsSeries23Member2025-06-300001898601ipx:RestrictedShareUnitsSeries24Member2024-07-012025-06-300001898601ipx:RestrictedShareUnitsSeries24Member2025-06-300001898601ipx:RestrictedShareUnitsSeries25Member2024-07-012025-06-300001898601ipx:RestrictedShareUnitsSeries25Member2025-06-300001898601ipx:RestrictedShareUnitsSeries26Member2024-07-012025-06-300001898601ipx:RestrictedShareUnitsSeries26Member2025-06-300001898601ipx:RestrictedShareUnitsSeries27Member2024-07-012025-06-300001898601ipx:RestrictedShareUnitsSeries27Member2025-06-300001898601ipx:ShareOptionsSeries28Member2024-07-012025-06-300001898601ipx:ShareOptionsSeries28Member2025-06-300001898601ipx:RestrictedShareUnitsSeries29Member2024-07-012025-06-300001898601ipx:RestrictedShareUnitsSeries29Member2025-06-300001898601ipx:ShareOptionsSeries30Member2024-07-012025-06-300001898601ipx:ShareOptionsSeries30Member2025-06-300001898601ipx:RestrictedShareUnitsSeries31Member2024-07-012025-06-300001898601ipx:RestrictedShareUnitsSeries31Member2025-06-300001898601ipx:PerformanceRightsSeries32Member2024-07-012025-06-300001898601ipx:PerformanceRightsSeries32Member2025-06-300001898601ipx:PerformanceRightsSeries33Member2024-07-012025-06-300001898601ipx:PerformanceRightsSeries33Member2025-06-300001898601ipx:PerformanceRightsSeries34Member2024-07-012025-06-300001898601ipx:PerformanceRightsSeries34Member2025-06-300001898601ipx:PerformanceSharesSeries1Member2023-07-012024-06-300001898601ipx:PerformanceSharesSeries1Member2024-06-300001898601ipx:PerformanceRightsSeries2Member2023-07-012024-06-300001898601ipx:PerformanceRightsSeries2Member2024-06-300001898601ipx:PerformanceRightsSeries3Member2023-07-012024-06-300001898601ipx:PerformanceRightsSeries3Member2024-06-300001898601ipx:PerformanceRightsSeries4Member2023-07-012024-06-300001898601ipx:PerformanceRightsSeries4Member2024-06-300001898601ipx:PerformanceRightsSeries5Member2023-07-012024-06-300001898601ipx:PerformanceRightsSeries5Member2024-06-300001898601ipx:PerformanceRightsSeries6Member2023-07-012024-06-300001898601ipx:PerformanceRightsSeries6Member2024-06-300001898601ipx:PerformanceRightsSeries7Member2023-07-012024-06-300001898601ipx:PerformanceRightsSeries7Member2024-06-300001898601ipx:PerformanceSharesSeries8Member2023-07-012024-06-300001898601ipx:PerformanceSharesSeries8Member2024-06-300001898601ipx:PerformanceSharesSeries9Member2023-07-012024-06-300001898601ipx:PerformanceSharesSeries9Member2024-06-300001898601ipx:RestrictedShareUnitsSeries10Member2023-07-012024-06-300001898601ipx:RestrictedShareUnitsSeries10Member2024-06-300001898601ipx:RestrictedShareUnitsSeries11Member2023-07-012024-06-300001898601ipx:RestrictedShareUnitsSeries11Member2024-06-300001898601ipx:RestrictedShareUnitsSeries12Member2023-07-012024-06-300001898601ipx:RestrictedShareUnitsSeries12Member2024-06-300001898601ipx:PerformanceRightsSeries13Member2023-07-012024-06-300001898601ipx:PerformanceRightsSeries13Member2024-06-300001898601ipx:PerformanceRightsSeries14Member2023-07-012024-06-300001898601ipx:PerformanceRightsSeries14Member2024-06-300001898601country:US2026-06-300001898601country:US2025-06-300001898601ipx:CashAndCashEquivalents1Memberifrs-full:CreditRiskMember2026-06-300001898601ipx:CashAndCashEquivalents1Memberifrs-full:CreditRiskMember2025-06-300001898601ifrs-full:TradeReceivablesMemberifrs-full:CreditRiskMember2026-06-300001898601ifrs-full:TradeReceivablesMemberifrs-full:CreditRiskMember2025-06-300001898601ifrs-full:CreditRiskMember2026-06-300001898601ifrs-full:CreditRiskMember2025-06-300001898601ifrs-full:AllowanceForCreditLossesMemberifrs-full:CreditRiskMember2026-06-300001898601ifrs-full:InterestRateRiskMember2026-06-300001898601ifrs-full:InterestRateRiskMember2025-06-300001898601ifrs-full:FloatingInterestRateMemberifrs-full:InterestRateRiskMember2025-07-012026-06-300001898601ifrs-full:FloatingInterestRateMemberifrs-full:InterestRateRiskMember2024-07-012025-06-300001898601ifrs-full:InterestRateRiskMember2025-07-012026-06-300001898601ipx:InterestRateRiskIncreaseMember2025-07-012026-06-300001898601ipx:InterestRateRiskDecreaseMember2025-07-012026-06-300001898601ipx:InterestRateRiskIncreaseMember2026-06-300001898601ipx:InterestRateRiskDecreaseMember2026-06-300001898601ipx:InterestRateRiskIncreaseMember2024-07-012025-06-300001898601ipx:InterestRateRiskDecreaseMember2024-07-012025-06-300001898601ipx:InterestRateRiskIncreaseMember2025-06-300001898601ipx:InterestRateRiskDecreaseMember2025-06-300001898601ipx:InterestRateRiskIncreaseMember2023-07-012024-06-300001898601ipx:InterestRateRiskDecreaseMember2023-07-012024-06-300001898601ipx:InterestRateRiskIncreaseMember2024-06-300001898601ipx:InterestRateRiskDecreaseMember2024-06-300001898601ipx:CashAndCashEquivalents1Memberifrs-full:CurrencyRiskMembercurrency:AUD2026-06-300001898601ipx:CashAndCashEquivalents1Memberifrs-full:CurrencyRiskMembercurrency:AUD2025-06-300001898601ipx:TradeAndOtherPayablesMemberifrs-full:CurrencyRiskMembercurrency:AUD2026-06-300001898601ipx:TradeAndOtherPayablesMemberifrs-full:CurrencyRiskMembercurrency:AUD2025-06-300001898601ifrs-full:CurrencyRiskMembercurrency:AUD2026-06-300001898601ifrs-full:CurrencyRiskMembercurrency:AUD2025-06-300001898601ipx:CurrencyRiskIncreaseMembercurrency:AUD2025-07-012026-06-300001898601ipx:CurrencyRiskDecreaseMembercurrency:AUD2025-07-012026-06-300001898601ipx:CurrencyRiskIncreaseMembercurrency:AUD2026-06-300001898601ipx:CurrencyRiskDecreaseMembercurrency:AUD2026-06-300001898601ipx:CurrencyRiskIncreaseMembercurrency:AUD2024-07-012025-06-300001898601ipx:CurrencyRiskDecreaseMembercurrency:AUD2024-07-012025-06-300001898601ipx:CurrencyRiskIncreaseMembercurrency:AUD2025-06-300001898601ipx:CurrencyRiskDecreaseMembercurrency:AUD2025-06-300001898601ifrs-full:CommodityPriceRiskMember2026-06-300001898601ifrs-full:MajorPurchasesOfAssetsMember2026-07-010001898601ipx:GovernmentGrantsMemberipx:SmallBusinessInnovationResearchSBIRFundingProgramMember2026-08-26
Table of Contents
As filed with the Securities and Exchange Commission on September 29, 2026
UNITED STATES
SECURITIES AND EXCHANGE COMMISSION
Washington, DC 20549
FORM 20-F
oREGISTRATION STATEMENT PURSUANT TO SECTION 12(b) OR (g) OF THE SECURITIES EXCHANGE ACT OF 1934
OR
xANNUAL REPORT PURSUANT TO SECTION 13 OR 15(d) OF THE SECURITIES EXCHANGE ACT OF 1934
For the fiscal year ended June 30, 2026
OR
oTRANSITION REPORT PURSUANT TO SECTION 13 OR 15(d) OF THE SECURITIES EXCHANGE ACT OF 1934
OR
oSHELL COMPANY REPORT PURSUANT TO SECTION 13 OR 15(d) OF THE SECURITIES EXCHANGE ACT OF 1934
Date of event requiring this shell company report
For the transition period from __________ to __________
Commission file number 001-41338
IPERIONX LIMITED
(Exact name of Registrant as specified in its charter)
N/A
AUSTRALIA
(Translation of Registrant’s name into English)(Jurisdiction of incorporation or organization)
1092 Confroy Drive,
South Boston, VA 24592
(Address of principal executive offices)
Anastasios Arima
Chief Executive Officer and Managing Director
(980) 237-8900 (telephone)
[email protected] (e-mail)
1092 Confroy Drive,
South Boston, VA 24592
(Name, Telephone, E-mail and/or Facsimile number and Address of Company Contact Person)
Securities registered or to be registered pursuant to Section 12(b) of the Act:
Title of each classTrading Symbol(s)Name of each exchange on which registered or to be registered:
American Depositary Shares each representing 10 Ordinary Shares, no par value(1)
IPX
The Nasdaq Capital Market
______________________________________
(1)Evidenced by American Depositary Receipts
Securities registered or to be registered pursuant to Section 12(g) of the Act:
None
Securities for which there is a reporting obligation pursuant to Section 15(d) of the Act:
None
______________________________________
Number of outstanding shares of each of the issuer’s classes of capital or common stock as of June 30, 2026:
339,384,066 ordinary shares
Indicate by check mark if the registrant is a well-known seasoned issuer, as defined in Rule 405 of the Securities Act.
Yes o No x
If this report is an annual or transition report, indicate by check mark if the registrant is not required to file reports pursuant to Section 13 or 15(d) of the Securities Exchange Act of 1934.
Yes o No x
Indicate by check mark whether the registrant (1) has filed all reports required to be filed by Section 13 or 15(d) of the Securities Exchange Act of 1934 during the preceding 12 months (or for such shorter period that the registrant was required to file such reports), and (2) has been subject to such filing requirements for the past 90 days.
Yes x No o
Indicate by check mark whether the registrant has submitted electronically every Interactive Data File required to be submitted pursuant to Rule 405 of Regulation S-T during the preceding 12 months (or for such shorter period that the registrant was required to submit such files).
Yes x No o
Indicate by check mark whether the registrant is a large accelerated filer, an accelerated filer, a non-accelerated filer, or an emerging growth company
Large accelerated filer
x
Accelerated filer
o
Non-accelerated filer
o
Emerging growth company
o
If an emerging growth company that prepares its financial statements in accordance with U.S. GAAP, indicate by check mark if the registrant has elected not to use the extended transition period for complying with any new or revised financial accounting standards provided pursuant to Section 13(a) of the Exchange Act. o
Indicate by check mark whether the registrant has filed a report on and attestation to its management’s assessment of the effectiveness of its internal control over financial reporting under Section 404(b) of the Sarbanes-Oxley Act (15 U.S.C. 7262(b)) by the registered public accounting firm that prepared or issued its audit report. x
If securities are registered pursuant to Section 12(b) of the Act, indicate by check mark whether the financial statements of the registrant included in the filing reflect the correction of an error to previously issued financial statements. o
Indicate by check mark whether any of those error corrections are restatements that required a recovery analysis of incentive-based compensation received by any of the registrant’s executive officers during the relevant recovery period pursuant to §240.10D-1(b). o
Indicate by check mark which basis of accounting the registrant has used to prepare the financial statements included in this filing:
o     U.S. GAAP
x    International Financial Reporting Standards as issued by the International Accounting Standards Board
o     Other
If “Other” has been checked in response to the previous question, indicate by check mark which financial statement item the registrant has elected to follow.        Item 17 o Item 18 o
If this is an annual report, indicate by check mark whether the registrant is a shell company (as defined in Rule 12b-2 of the Exchange Act).
Yes o No x
(APPLICABLE ONLY TO ISSUERS INVOLVED IN BANKRUPTCY PROCEEDINGS DURING THE PAST FIVE YEARS)
Indicate by check mark whether the registrant has filed all documents and reports required to be filed by Sections 12, 13 or 15(d) of the Securities Exchange Act of 1934 subsequent to the distribution of securities under a plan confirmed by a court.
Yes o No o


Table of Contents
TABLE OF CONTENTS
2

Table of Contents
3

Table of Contents

GLOSSARY OF TERMS AND DEFINITIONS
When the following terms and abbreviations appear in the text of this report, they have the meanings indicated below:
ADSsAmerican Depositary Shares
ALCAustralian land corporation
AMCAdvanced Manufacturing Center
Apollo GroupApollo Group Pty Ltd
ARHTM
IperionX proprietary technology for alkaline roasting and hydrolysis
ASICAustralian Securities and Investments Commission
ASXAustralian Securities Exchange
Atlas or Atlas ProjectMineral, property and infrastructure assets acquired from Covia Solutions LLC on July 1, 2026
BlacksandBlacksand Technology LLC
CAAClean Air Act
CCOChief Commercial Officer
CDICHESS Depositary Interests
CEOChief Executive Officer
CERCLAComprehensive Environmental Response, Compensation, and Liability Act
CFIConduit foreign income
CFOChief Financial Officer
CO2eCarbon dioxide equivalents
COGCut-Off Grade
COOChief Operating Officer
CSOChief Strategy Officer
CWAClean Water Act
DEVCOMU.S. Army Combat Capabilities Development Command
DFSDefinitive Feasibility Study
DoWDepartment of War, also referred to as "Department of Defense", renamed by Executive order 14347, “Restoring the United States Department of War”
DRSDirect Registration System
DTCDepository Trust Company
DPA Title IIIA provision of the Defense Production Act of 1950 that allows the President to expand the production and supply of critical materials necessary for national defense.
EBITDAEarnings before interest, taxes, depreciation and amortization
EPAUnited States Environmental Protection Agency
EPSEarnings per share
ERPEnterprise resource planning
ESAEndangered Species Act
Exchange ActU.S. Securities Exchange Act of 1934, as amended
FATAForeign Acquisition and Takeovers Act
FIPForeign Investment Policy
FIRBForeign Investment Review Board
FRFixed remuneration
GenXTM
IperionX's next-generation continuous HAMRTM platform
GHGsGreenhouse gases
4

Table of Contents
Green RutileTM
IperionX proprietary technology for low carbon titanium mineral enrichment
GSDTM
IperionX proprietary technology for the Granulation Sintering DeoxygenationTM process
GVSCDEVCOM Ground Vehicle Systems Center
HaHectare
HAMRTM
IperionX patented technology for Hydrogen Assisted Metallothermic ReductionTM
HMAPLHyperion Metals (Australia) Pty Ltd
HRECHeavy rare earth concentrate
HSPTTM
IperionX patented technology for hydrogen sintering and phase transformation process
HfO₂Hafnium Dioxide
IASInternational Accounting Standards
IASBInternational Accounting Standards Board
IBASU.S. DoW Industrial Base Analysis and Sustainment grant program
IDIQIndefinite delivery, indefinite quantity
IFRSInternational Financial Reporting Standards
IperionX Limited“Company” or “IperionX”, “Consolidated Entity” or “Group”
IPIntellectual property
IPFIndustrial Pilot Facility in West Valley City, Utah
IRRinternal rate of return
IRS CodeInternal Revenue Code of 1986, as amended
JLTVJoint Light Tactical Vehicle
JORC CodeAustralasian Code for Reporting of Exploration Results, Mineral Resources and Ore Reserves
kgkilogram
KMPKey Management Personnel
KPIKey performance indicators
LOMLife of mine
LTILong-term incentives
LTIPLong-term incentive plan
mmeter
m3cubic meter
MtMillion metric tons
N/ANot applicable
NasdaqNasdaq Capital Market
NEDsNon-Executive Directors
NEPANational Environmental Policy Act
NPVNet Present Value
NPV8
Net Present Value at an 8% discount rate
Ordinary SharesCommon shares, equity instruments that give shareholders voting rights and potential dividends
PCAOBPublic Company Accounting Oversight Board
Performance RightsEquity awards requiring achievement of relevant performance conditions
Performance SharesContingent stock awards that are vesting based on performance metrics
PFICPassive foreign investment company
QEFQualified Electing Fund
QPQualified Person
QEMSCANQuantitative Evaluation of Materials by Scanning Electron Microscopy
R&DResearch and development
RCRAResource Conservation and Recovery Act
5

Table of Contents
REERare earth elements
REORare earth oxide
ROMRun of mine
RSUsRestricted stock units
Regulation FD
Regulation Fair Disclosure
SAESociety of Automotive Engineers
SBIRSmall Business Innovation Research
SDWASafe Drinking Water Act
SECSecurities and Exchange Commission
Securities ActU.S. Securities Act of 1933
S-K 1300Regulation S-K, Subpart 1300, under the Securities Act of 1933, as amended
SPCC plans
Spill prevention, control and countermeasure plans
STIShort term incentives
TBOCTexas Business Organizations Code
TechnologiesIperionX's collection of patents to certain titanium and metal alloy production technologies
THMTotal heavy mineral(s)
THRMTM
IperionX patented technology for Thermo-Hydrogen Refinement of MicrostructureTM
TiCl4
Titanium tetrachloride
TiO2
Titanium dioxide
TiH2
Titanium hydride
Ti-6Al-4VGrade 5 titanium alloy
Titan ProjectTitan Critical Minerals Project in Tennessee
tpaMetric tons per annum
tphMetric tons per hour
TPFTitanium Production Facility
TREOTotal rare earth oxides
Treatythe Convention between the Government of the United States of America and the Government of Australia for the Avoidance of Double Taxation and the Prevention of Fiscal Evasion with Respect to Taxes on Income, as amended
TZMITZ Minerals International Pty Ltd
ULUnderwriters Laboratories
U.S.United States of America
USACEU.S. Army Corps of Engineers
U.S. GAAPU.S. generally accepted accounting principles
UICUnderground Injection Control
Unlisted OptionsUnquoted incentive options
VWAPVolume-weighted average price
WAWeighted average
ZrO2Zirconium Dioxide
6

Table of Contents
Image_1.jpg
INTRODUCTION
IperionX is an American-focused titanium metal and critical materials company building two mutually reinforcing growth platforms: a circular, low-cost titanium metal and advanced manufacturing business in Virginia, and a large-scale domestic critical-minerals platform in Tennessee. Together, they create a pathway from recycled titanium scrap and U.S. mineral feedstocks to high-performance titanium powder, mill products and finished components. The ambition is broader than re-shoring an existing supply chain. By breaking the cost and manufacturing constraints that have held titanium back for more than 80 years, IperionX aims to expand the market for one of the world’s best structural metals.
At the core of the titanium platform are IperionX’s patented HAMR™ refining technology and HSPT™ and Thermo-Hydrogen Refinement of Microstructure™ (THRM™) product technologies. Together, they bypass major parts of the conventional Kroll, melt-remelt and hot-working route, enabling fewer process steps, higher material utilization, lower energy intensity and a structurally lower projected cost base. The Atlas-Titan platform adds a future domestic source of titanium minerals, heavy rare earths and zircon, creating both standalone critical-minerals value and long-term vertical-integration potential.
Fiscal year 2026 marked IperionX’s transition from technology development and commissioning into commercial operations and production ramp-up. The Virginia Titanium Manufacturing Campus is now operating on a 24/7 production schedule, downstream component-manufacturing capacity is expanding and the focus has shifted to throughput, reliability, product qualification and revenue conversion.
A new American titanium platform is now operating
Titanium combines an exceptional strength-to-weight ratio with corrosion resistance and high-temperature performance, making it essential to defense, aerospace and advanced manufacturing.
The U.S. no longer has commercial titanium sponge production and remains dependent on imports for a metal critical to national security and industrial resilience. China and Russia together control approximately 80% of global titanium sponge production capacity, concentrating a strategically important supply chain outside the U.S.
IperionX is building a domestic alternative that can transform U.S. titanium scrap - and, over time, U.S. mineral feedstocks - into high-quality powder and finished titanium products. This integration creates greater control across feedstock, metal production, product manufacturing and recycling, while reducing the number of vulnerable links in the conventional supply chain.
Technology demonstrated; industrial execution now drives progress
HAMR™ powder production has consistently met or exceeded Grade 5 quality parameters, and Virginia operations transitioned to a 24/7 schedule during fiscal year 2026. IperionX is targeting an annualized titanium powder production run rate of approximately 200 tpa by the end of calendar year 2026, subject to completion of ramp-up and operating optimization. The operating priority is to translate demonstrated capability into reliable, repeatable and increasingly efficient production.
Capturing more value: from powder to finished products
The commissioned SACMI powder metallurgy press triples existing powder metallurgy capacity and materially expands component complexity and repeatability. Additional HSPT™ furnace capacity is being installed to increase downstream throughput and support customer qualification, low-rate initial production and higher-volume manufacturing. This downstream capacity is central to IperionX’s strategy of converting low-cost powder into higher-value products and deeper customer relationships.
The aggregate market value of the registrant's voting and non-voting shares held by non-affiliates of the registrant on December 31, 2025, the last business day of the registrant's most recently completed second fiscal quarter was approximately US$1.00 billion (assuming that the registrant's only affiliates are its officers, directors and non-institutional 10% shareholders) based upon the closing market price on that date of A$5.60 per ordinary share as reported on the Australian Securities Exchange, the principal market for the Company’s ordinary shares.
7

Table of Contents
ABOUT THIS ANNUAL REPORT
Unless otherwise indicated or the context implies otherwise, any reference in this annual report on Form 20-F to:
•“IperionX” refers to IperionX Limited, an Australian corporation;
•“the Company,” “the Group”, “we,” “us,” or “our” refer to IperionX and its consolidated subsidiaries, through which it conducts its business, unless otherwise indicated;
•“shares” or “ordinary shares” refers to ordinary shares of IperionX;
•“ADS” refers to the American Depositary Shares; and
•“ASX” refers to the Australian Securities Exchange.
Unless otherwise indicated, all references to “A$” are to Australian dollars, and all references to “US$” and “$” are to U.S. dollars. Our financial statements are presented in U.S. dollars which is the Company’s presentation currency. This annual report on Form 20-F contains references to U.S. dollars where the underlying transaction or event was denominated in U.S. dollars. This annual report on Form 20-F contains forward-looking statements that involve risks and uncertainties. See “Cautionary Note Regarding Forward-Looking Statements.”
CAUTIONARY NOTE TO UNITED STATES INVESTORS
We are subject to the reporting requirements of the applicable U.S. and Australian securities laws, and as a result we will report any mineral reserves and mineral resources as required by both of these standards. As an Australian listed public company, we are required to report in Australia any estimates of mineral resources and mineral reserves in terms of “Measured, Indicated and Inferred” Mineral Resources and “Proved and Probable” Ore Reserves in compliance with the JORC 2012, Australasian Code for Reporting of Exploration Results, Mineral Resources and Ore Reserves. The JORC Code was prepared by the Joint Ore Reserves Committee of The Australasian Institute of Mining and Metallurgy, Australian Institute of Geoscientists and Minerals Council of Australia. These defined terms contained within the JORC Code differ in some respects from the definitions under the U.S. Securities Act of 1933, as amended, including in Regulation S-K 1300.
Information about mineral reserves and resources, if any, contained in our filings with the SEC also will be presented in compliance with S-K 1300. While guidelines for reporting mineral resources, including subcategories of measured, indicated and inferred resources, are largely similar between JORC Code and S-K 1300 standards, information contained in our future SEC filings that describes mineral deposits may not be directly comparable to similar information made public by other U.S. companies under the SEC’s old reporting standard, Industry Guide 7, or to similar information published by other ASX-listed companies. Investors are cautioned that any public disclosure we make in Australia as to mineral reserves or resources in accordance with ASX Listing Rules will not form a part of our SEC filings except to the extent stated therein.
INDUSTRY AND MARKET DATA
This annual report includes information with respect to market and industry conditions and market share from third-party sources or that is based upon estimates using such sources when available. We believe that such information and estimates are reasonable and reliable. We also believe the information extracted from publications of third-party sources has been accurately reproduced. However, we have not independently verified any of the data from third-party sources. Similarly, our internal research is based upon the understanding of industry conditions, and such information has not been verified by any independent sources.
CAUTIONARY NOTE REGARDING FORWARD-LOOKING STATEMENTS
Certain information included in this annual report on Form 20-F may be deemed to be “forward-looking statements” within the meaning of Section 27A of the Securities Act, and Section 21E of the Exchange Act. Such forward-looking statements concern our anticipated results and progress of our operations in future periods, planned exploration and, if warranted, development of our properties, plans related to our business and other matters that may occur in the future. These statements relate to analyses and other information that are based on forecasts of future results, estimates of amounts not yet determinable and assumptions of management. All statements contained herein that are not clearly historical in nature are forward-looking, and the words “anticipate”, “believe”, “expect”, “estimate”, “may”, “will”, “could”, “leading”, “intend”, “contemplate”, “aim”, “shall” and similar expressions are generally intended to identify forward-looking
8

Table of Contents
statements. Forward-looking statements are subject to a variety of known and unknown risks, uncertainties and other factors which could cause actual events or results to differ from those expressed or implied by the forward-looking statements. Forward-looking statements in this annual report on Form 20-F include, but are not limited to, statements with respect to: risks related to our limited operating history in the titanium metal manufacturing industry; risks related to our ability to commercialize our titanium technologies; risks related to our ability to produce titanium metal powders and products to customers’ exact specification; risks related to our ability to identify and contract long-term offtake customers for our titanium metal products; risks related to our limited operating history in the minerals extraction industry; risks related to our status as an exploration stage company; risks related to our ability to identify mineralization and achieve commercial minerals extraction; risks related to minerals extraction, exploration and extraction site construction, if warranted, on our properties; risks related to our ability to fully achieve and maintain profitability and to develop positive cash flow from any minerals extraction activities; risks related to investment risk and operational costs associated with our exploration activities; risks related to our ability to access capital and the financial markets; risks related to compliance with government regulations; risks related to our ability to acquire necessary minerals extraction licenses, permits or access rights; risks related to environmental liabilities and reclamation costs; risks related to volatility in minerals and metals prices or demand for minerals and metals; risks related to stock price and trading volume volatility; risks relating to the development of an active trading market for the ADSs; risks related to ADS holders not having certain shareholder rights; risks related to ADS holders not receiving certain distributions; risks related to our status as a foreign private issuer; and risks related to the other matters described in the section titled “Risk Factors.”
All forward-looking statements reflect our beliefs and assumptions based on information available at the time the assumption was made. These forward-looking statements are not based on historical facts but rather on management’s expectations regarding future activities, results of operations, performance, future capital and other expenditures (including the amount, nature and sources of funding thereof), competitive advantages, business prospects and opportunities. By its nature, forward-looking information involves numerous assumptions, inherent risks and uncertainties, both general and specific, known and unknown, that contribute to the possibility that the predictions, forecasts, projections or other forward-looking statements will not occur. Although we have attempted to identify important factors that could cause actual results to differ materially from those described in forward-looking statements, there may be other factors that cause results not to be as anticipated, estimated or intended. Should one or more of these risks or uncertainties materialize, or should underlying assumptions prove incorrect, actual results may vary materially from those anticipated, believed, estimated or expected. We caution readers not to place undue reliance on any such forward-looking statements, which speak only as of the date made. Except as otherwise required by the securities laws of the U.S. and Australia, we disclaim any obligation to subsequently revise any forward-looking statements to reflect events or circumstances after the date of such statements or to reflect the occurrence of anticipated or unanticipated events. We qualify all the forward-looking statements contained in this annual report on Form 20-F by the foregoing cautionary statements.
PRESENTATION OF FINANCIAL INFORMATION
Our fiscal year ends on June 30. We designate our fiscal year by the year in which that fiscal year ends; for example, fiscal 2026 refers to our fiscal year ended June 30, 2026.
Unless otherwise indicated, the consolidated financial statements and related notes included in this annual report are presented in U.S. dollars and have been prepared in accordance with IFRS as issued by the IASB which differ in certain significant respects from generally accepted accounting principles in the U.S., or U.S. GAAP. As a result, our financial statements may not be comparable to the financial statements of U.S. companies. Because the U.S. SEC has adopted rules to accept financial statements prepared in accordance with IFRS as issued by the IASB without reconciliation to U.S. GAAP from foreign private issuers such as us, we will not be providing a description of the principal differences between U.S. GAAP and IFRS.
Our financial statements are presented in U.S. dollars, which is the Company’s presentation currency. This annual report contains translations of some Australian dollar amounts into U.S. dollars. Except as otherwise stated in this annual report, all translations from Australian dollars to U.S. dollars are based on the rates published by the Reserve Bank of Australia. No representation is made that the Australian dollar amounts referred to in this annual report could have been or could be converted into U.S. dollars at such rate.
QUALIFIED PERSON
Unless otherwise indicated, the disclosure of exploration results, mineral resources and mineral reserves included in this annual report is based on, and accurately reflects, information and supporting documentation prepared, reviewed and
9

Table of Contents
approved by the following Qualified Persons, each of whom is a qualified person as defined in S-K 1300 and none of whom is affiliated with the Company:
Marshall Miller & Associates, Inc., with respect to Mineral Resource and Mineral Reserve estimates, mine planning, and mining cost estimation, and acting as study integrator for the Titan Definitive Feasibility Study;
Karst Geo Solutions, LLC, with respect to Exploration Results;
Etienne Raffaillac at Mineral Technologies Pty Ltd, with respect to mineral processing and metallurgical testing; and
Primero Group Americas Inc., with respect to non-process infrastructure, related cost estimates, and financial model integration.
Each qualified person has consented to the inclusion of the matters based on their information in the form and context in which it appears in this annual report.
COMPETENT PERSONS STATEMENT
As required by Australian securities laws and the ASX Listing Rules, we hereby notify Australian investors that the information in this annual report that relates to Exploration Results and Mineral Resources was extracted from our ASX announcement dated June 4, 2026 which is available to view on the Company’s website at www.iperionx.com. We confirm to Australian investors that (a) we are not aware of any new information or data that materially affect the information included in the original ASX announcement; (b) all material assumptions and technical parameters underpinning the Mineral Resource estimate included in the original ASX announcement continue to apply and have not materially changed; and (c) the form and context in which the relevant Competent Persons’ findings are presented in this annual report have not been materially changed from the original ASX announcement. “Competent Person” under the Australian rules is a minerals industry professional who is a Member or Fellow of The Australasian Institute of Mining and Metallurgy, or of the Australian Institute of Geoscientists, or of a “Recognized Professional Organization”, as included in a list available on the JORC and ASX websites.
PART I.
ITEM 1    IDENTITY OF DIRECTORS, SENIOR MANAGEMENT AND ADVISERS
Not applicable.
ITEM 2    OFFER STATISTICS AND EXPECTED TIMETABLE
Not applicable.
ITEM 3    KEY INFORMATION
A.[Reserved]
B.Capitalization and Indebtedness
Not applicable.
C.Reasons for the Offer and Use of Proceeds
Not applicable.
10

Table of Contents
D.Risk Factors
You should carefully consider the risks described below, together with all of the other information in this annual report on Form 20-F. The risks described below are not the only risks we face. Additional risks and uncertainties that we do not presently know or that we currently deem immaterial may also impair our business. If any of these risks occurs, our business, financial condition, results of operations and prospects could be materially adversely affected, and the market price of our ADSs could decline. You could lose all or part of your investment.
Index of Risk Factors
The following is a summary of the principal risks described in this section. This summary does not contain all of the information that may be important to you and should be read together with the more detailed risk factors that follow.
Risks Related to Our Business
•We have a history of financial losses, expect to incur continuing losses as we increase and expand commercial production, and may not achieve or sustain profitability.
•Our continued growth depends on our ability to scale commercial titanium metal production and commercialize our closed-loop titanium production processes.
•Our ability to generate significant revenue depends on successful customer qualification and approval processes, which may be lengthy, costly and uncertain.
•Certain production plans may depend on a limited number of suppliers for certain specialized equipment, replacement parts, raw materials and services.
•Unanticipated costs or delays associated with the commercialization of our titanium metal technologies may materially and adversely affect our financial condition or results of operations.
•If our titanium metal products fail to perform as expected in our customers’ desired applications, our ability to develop, market and sell our products could be adversely affected.
•If we fail to accurately predict our manufacturing requirements and timelines, we could incur additional costs or experience delays.
•We may be adversely affected by fluctuations in demand for, and prices of, titanium metal and products.
•The success of our business will depend on the growth of existing and emerging uses for titanium.
•If we are unable to protect our rights to the Technologies, our business and competitive position could be adversely affected.
•Changes in international trade policies, tariffs, sanctions, export controls and domestic sourcing requirements may adversely affect our business.
•Changes in the U.S. political environment and federal policies, including changes in research grant funding policy or the potential critical materials designation of titanium metal may adversely affect our financial condition and results of operations.
•Certain assets used in the Titanium Production Facility and Advanced Manufacturing Center are acquired with federal government funds. The U.S. government holds the title with respect to such assets.
•Our mineral resource and reserve estimates are uncertain and may prove inaccurate.
•The Titan Project may not achieve the operating, capital cost, production or economic assumptions in the DFS.
•We face operational risks related to minerals extraction, exploration and site construction.
•Climate change may adversely affect our business operations.
•Cybersecurity incidents affecting our information technology or operational technology systems could disrupt operations.
•Our use of artificial intelligence and data-driven technologies may expose us to operational, cybersecurity, legal and reputational risks.
•We depend on key management employees.
11

Table of Contents
•Our success depends in part on relationships with local communities and other stakeholders.
•Our business could be adversely affected if our reputation is harmed.
•We may not realize the anticipated benefits of the Atlas acquisition and may face integration, permitting, environmental, reclamation and legacy-liability risks.
•Our mineral properties may be subject to defects in title.
•Our directors and officers may have conflicts of interest.
•Lawsuits or adverse rulings could adversely affect our business, liquidity or securities price.
Risks Related to Regulatory and Industry Matters
•We have incurred increased costs and become subject to additional regulations and requirements as a result of being a large accelerated filer, which could have a material adverse effect on our business, financial condition, and results of operations, and make it more difficult to run our business or divert management’s attention from our business.
•We will be subject to significant governmental regulations, including the U.S. Federal Mine Safety and Health Act.
•The acquired Camden properties and plant may involve permitting, environmental, reclamation and legacy-liability risks.
•We will be required to obtain and renew governmental permits in order to achieve our business plans, a process that is often costly and time-consuming.
•Compliance with environmental regulations and litigation based on environmental regulations could require significant expenditures.
•Mineral and metal prices are subject to unpredictable fluctuations.
•We are subject to risks associated with currency fluctuations, and changes in foreign currency exchange rates could impact our results of operations.
•We have had material weaknesses in internal control over financial reporting in the past and may identify additional material weaknesses in the future.
Risks Related to Our ADSs
•An active trading market for the ADSs may not develop or be sustained, and the ADS trading price may be volatile.
•ADS holders are not shareholders and have rights that differ from holders of ordinary shares.
•Distributions on ADSs may be delayed, reduced or impractical in certain circumstances.
•Holders of ADSs may have difficulty effecting service of process in the U.S. or enforcing U.S. judgments.
•ADS holders may not be entitled to a jury trial for claims arising under the deposit agreement.
•The dual listing of our ordinary shares and ADSs may adversely affect liquidity and value.
•Currency fluctuations may affect the ADS price relative to the price of our ordinary shares.
•As a foreign private issuer, we may follow certain home-country corporate governance practices rather than Nasdaq requirements applicable to domestic issuers.
•As a foreign private issuer, we may file less information with the SEC than a domestic issuer.
•Operating as a company whose ADSs are publicly traded in the U.S. increases our costs and compliance burden.
•We do not anticipate paying dividends in the foreseeable future.
•Lack of analyst coverage or adverse analyst reports could adversely affect the market price and trading volume of our securities.
•Transfers of ADSs may be subject to limitations.
•The deposit agreement may be amended or terminated without prior ADS-holder consent.
•ADS holders have limited recourse if we or the depositary fail to meet obligations under the deposit agreement.
12

Table of Contents
•Our Constitution and Australian laws may affect our ability to take actions that could benefit shareholders.
•Failure to maintain effective internal controls could impair our financial reporting and compliance.
•We may be, or may become, a passive foreign investment company, which could result in adverse U.S. federal income tax consequences for U.S. investors.
Risks Related to Proposed Redomiciliation
•The proposed redomiciliation may not be completed on the anticipated timeline, or at all.
•The proposed redomiciliation may result in adverse tax consequences for the Company or shareholders.
•Following the redomiciliation, we will no longer qualify as a foreign private issuer and will be subject to U.S. domestic issuer reporting, governance and compliance requirements.
•If the redomiciliation is completed, shareholder rights will change and may be less favorable in certain respects than current shareholder rights.
•Even if the redomiciliation is not completed, we may lose foreign private issuer status and become subject to U.S. domestic issuer reporting obligations.
Risks Related to Our Business
We have a history of financial losses, expect to incur continuing losses as we increase and expand commercial production, and may not achieve or sustain profitability.
We incurred net losses of $66.8 million and $35.3 million for fiscal 2026 and fiscal 2025, respectively. We incurred net cash outflows from operating and investing activities of $63.5 million and $46.1 million for fiscal 2026 and fiscal 2025, respectively. We expect to continue to incur net losses and negative cash flows as we increase commercial-scale titanium metal production. At June 30, 2026, we had cash and cash equivalents of $35.2 million and net assets of $88.3 million. We may not achieve profitability on the timeline we currently anticipate, if at all, and any profitability that we do achieve may not be sustained.
Our business strategy requires substantial additional capital. We expect to require financing to expand our titanium metal production capacity and, if a decision is made to proceed, to develop the Titan Project. Although we completed a definitive feasibility study for the Titan Project during fiscal 2026 and announced proven and probable reserves, we remain in the exploration phase because we have not secured the financing required for mine development and have not made a decision to proceed. Completion of the definitive feasibility study and the declaration of proven and probable reserves do not require, imply or ensure that the Titan Project will be developed or placed into commercial production. We continue to rely on capital markets as a significant source of financing for our capital and operating requirements and will require substantial additional capital for future expansion and any development of the Titan Project. Our ability to obtain financing will depend in part on prevailing capital-market conditions, including inflation, interest rates, banking-sector stress and adverse economic conditions, our business performance, project economics, commodity prices, regulatory developments, volatility in our securities, governmental support and other factors beyond our control. Financing may not be available when required, in sufficient amounts or on acceptable terms. If adequate financing is not available, we may be required to delay, reduce the scope of or discontinue future activities or relinquish rights to certain interests.
Although our financial statements for the year ended June 30, 2026 were prepared on a going-concern basis, failure to obtain additional funding on a timely basis could materially and adversely affect our expansion plans, results of operations, cash flows, and financial condition or prospects.
Our continued growth depends on our ability to complete the scale-up of our commercial titanium metal production capacity and failure to commercially scale our closed-loop titanium production processes could materially adversely affect our growth projections.
Sustained growth depends on our ability to complete the scale-up of our titanium metal production capacity. Events that could impede production include: an adverse event at a production facility; delays in procuring necessary processing equipment; and difficulties hiring and training qualified employees. If we do not reach and maintain expected production rates, including anticipated throughput, recoveries, uptimes, yields, or any combination thereof, within expected time frames or at all, we may be unable to build a sustainable or profitable metals technology business as currently expected or at all.
13

Table of Contents
In August 2024, we announced that we had successfully commissioned our HAMRTM furnace, marking the first titanium de-oxygenation product run at our Virginia facility. Despite this milestone, we may experience difficulty scaling our production processes at new or existing facilities to a level sufficient to generate meaningful revenue. Contributing factors may include difficulties hiring and training personnel, implementing or requalifying production processes, achieving repeatable processes and required yields, managing impurities or equipment and facility defects, completing construction and infrastructure work, and upgrading or expanding facilities or process technologies. Delays in scaling production could delay product deliveries, result in lost customers or sales, increase indemnification or production costs, prevent timely recovery of our investments and otherwise adversely affect our business and results of operations.
Our ability to generate significant revenue depends on successful customer qualification and approval processes, which may be lengthy, costly and uncertain.
Our titanium powders, near-net-shape components, forged products and other titanium products are intended for use in performance-sensitive applications, including aerospace, defense, consumer electronics, medical, automotive and industrial applications. Customers in these markets may require extensive qualification, testing, validation, certification and quality assurance procedures before approving our products, production processes or facilities for production volumes.
These processes may include sample production runs, product and process testing, customer audits, first article inspections, satisfaction of traceability requirements and extended evaluation periods. Qualification requirements may differ among customers and applications and may change over time. Qualification of a product or process by one customer does not assure qualification by another customer or for another application, and qualification does not assure that a customer will place orders or purchase anticipated volumes.
Delays in qualification, failure to satisfy customer specifications, changes in customer requirements or product redesigns could delay revenue, increase our costs, limit customer adoption, require additional capital investment or cause customers to obtain products from competitors. Any of these events could materially adversely affect our business, financial condition, results of operations and prospects.
Certain production plans may depend on a limited number of suppliers for certain specialized equipment, replacement parts, raw materials and services.
Our manufacturing and expansion activities require specialized furnaces, manufacturing equipment, automation and control systems, replacement parts, consumables, titanium feedstocks, alloying inputs and engineering and construction services. Certain items or services may be available from only one supplier or a limited number of qualified suppliers and may be subject to long lead times.
Supply disruptions, quality deficiencies, component shortages, transportation interruptions, vendor financial distress, labor disruptions, natural disasters, geopolitical developments, tariffs, sanctions, export controls or other trade restrictions could delay production or expansion and increase our costs. Alternative suppliers or substitute materials may not be available on acceptable terms, within required time frames, or at all, and changes in suppliers or inputs may require additional testing or customer requalification.
Any significant disruption in our supply chain could adversely affect production schedules, customer deliveries, margins, expansion plans and financial results.
Unanticipated costs or delays associated with the commercialization of our titanium metal technologies may materially and adversely affect our financial condition or results of operations.
The full commercialization and scale-up of the Technologies will require substantial resources and capital expenditures. The amount and timing of expenditures will depend on our ability to procure or repair equipment, obtain and maintain permits, implement consultants’ recommendations, negotiate and perform equipment, construction, labor, sales, offtake and strategic-partner arrangements, manage planned and unplanned shutdowns, address contractor disputes and respond to inflation, supply-chain disruption, public-health events, geopolitical conflict and other factors beyond our control. Many of these activities require significant lead times and must be advanced concurrently. Unanticipated costs or delays could materially and adversely affect our financial condition or results of operations and require additional capital.
If our titanium metal products fail to perform as expected in our customers’ desired applications, our ability to develop, market and sell our products could be adversely affected.
Our products and manufacturing processes may contain defects in design and manufacture that may cause them to not perform as expected in customer applications, or may fail to satisfy applicable specifications, standards or qualification
14

Table of Contents
requirements. Because our commercial operating history is limited, we have a limited basis from which to evaluate long-term product and process performance at increased production volumes. In addition, we may not identify defects or nonconformities before delivery. Product or process failures could result in rework, scrap, replacement, reclass, warranty or indemnification claims, delayed or terminated orders, loss of customer approvals, additional testing and qualification costs, litigation, regulatory action or reputational harm. Any of these consequences could adversely affect our business, prospects and results of operations.
We may be unable to adequately control the costs associated with continued expansion of our titanium metal production capacity.
We require significant capital to develop and grow our business, and expect to incur significant expenses for research and development, raw materials, labor, equipment, utilities, maintenance, leases, quality systems, sales and distribution. Our ability to become profitable will depend on successfully marketing and selling our titanium metal products while achieving targeted production rates, yields and unit costs. If we are unable to design, manufacture, market, sell and distribute our products cost-effectively, our margins, profitability and prospects could be materially and adversely affected.
Titanium mineral extraction and processing and the production of titanium products involves complex safety and operational risks.
The extraction and processing of titanium minerals and the production of titanium metal products involve serious safety and operational risks. Operational problems or errors with the machinery could result in personal injury to or death of workers, the loss of production equipment, damage to manufacturing facilities, monetary losses, delays and unanticipated fluctuations in production. In addition, operational problems may result in environmental damage, administrative fines, increased insurance costs and potential legal liabilities. All of these safety and operational problems could materially and adversely affect our business, results of operations, cash flows, financial condition or prospects.
If we fail to accurately predict our manufacturing requirements and timelines, we could incur additional costs or experience delays.
We have limited operating history at commercial scale and limited historical information with which to forecast demand, production requirements, product mix, inventory levels and delivery timing. If demand is below forecast, we may incur excess capacity, unrecovered fixed costs or excess and obsolete inventory. If demand exceeds forecast or product mix differs from our assumptions, we may be unable to obtain inputs, add capacity or meet customer delivery schedules.
We may be adversely affected by fluctuations in demand for, and prices of, titanium metal and products.
We expect to generate revenue from the sale of titanium products. As a result, our profitability could be adversely affected by changes in demand for, and the market price of, titanium products.
The success of our business will depend on the growth of existing and emerging uses for titanium.
Our business strategy principally relies on commercializing the Technologies to produce titanium products for markets including consumer electronics, aerospace, space, defense, medical, additive manufacturing and automotive. Our long-term success depends on the continued growth of these markets and successfully commercializing titanium metal products in such markets. Our estimates of market opportunity and market growth, whether derived from third-party sources or developed internally, are subject to significant uncertainty and are based on assumptions and estimates that may prove to be inaccurate. If these markets do not grow as we expect or if the demand for our intended products decreases, then our business, prospects, financial condition and operating results could be adversely affected.
If we are unable to protect our rights to the Technologies, our business and competitive position could be adversely affected.
We rely on licenses, patents, trademarks, trade secrets, confidentiality obligations and other contractual protections to establish, maintain and enforce our rights in the Technologies and other intellectual property. These measures may not prevent third parties from copying, misappropriating or independently developing similar technologies. Monitoring and enforcing our rights may be difficult and costly, particularly outside the U.S., and may divert management’s attention. Failure to adequately protect these rights could harm our competitive position, business, results of operations and financial condition.
In addition, companies holding patents or other intellectual property rights relating to titanium technologies may bring suits alleging infringement of such rights by us or otherwise asserting rights in or licenses to the Technologies. If we are
15

Table of Contents
determined to have infringed upon a third party’s intellectual property rights, we may be required to cease using the challenged intellectual property, to pay substantial damages or to obtain a license from the holder of the infringed rights. In the event of a successful claim of infringement against us, our business, prospects, operating results and financial condition could be materially adversely affected. In addition, any litigation or claims, whether or not valid, could result in substantial costs and diversion of resources and management’s attention.
Patent, trademark and trade secret laws vary significantly throughout the world. A number of foreign countries do not protect intellectual property rights to the same extent as do the laws of the U.S. Therefore, our intellectual property rights may not be as strong or as easily enforced outside of the U.S. and efforts to protect against the unauthorized use of our intellectual property rights, Technology and other proprietary rights may be more expensive and difficult outside of the U.S. Failure to adequately protect our intellectual property rights could result in our competitors using our intellectual property to offer products, potentially resulting in the loss of some of our competitive advantage and a decrease in our revenue which would adversely affect our business, prospects, financial condition and operating results.
Changes in international trade policies, tariffs, sanctions, export controls and domestic sourcing requirements may adversely affect our business.
Our operations, supply chain, customers and competitive position may be affected by changes in tariffs, import or export restrictions, sanctions, export controls, government procurement rules, domestic content requirements and other trade or industrial policies. These measures may affect the cost or availability of equipment, parts, feedstocks and other inputs, restrict access to customers or markets, alter competitive conditions or require changes to our sourcing and contracting arrangements. Trade measures may be adopted, withdrawn or modified with limited notice and may prompt retaliatory actions. Any of these developments could increase costs, delay expansion or production, reduce demand for our products or otherwise adversely affect our business and results of operations.
Changes in the U.S. political environment and federal policies, including changes in research grant funding policy or the potential critical materials designation of titanium metal may adversely affect our financial condition and results of operations.
Our business, growth strategy and commercialization activities may be affected by changes in the political, regulatory and funding environment in the U.S. We currently participate in, and may seek to benefit from, government programs, grants, contracts and other forms of public-sector support that are designed to strengthen domestic critical mineral and advanced manufacturing supply chains. Such programs are subject to evolving government priorities, legislative and budgetary processes, appropriations, administrative discretion, compliance requirements and performance milestones.
Changes in government policy, including modifications to research and development funding programs, procurement preferences, domestic manufacturing initiatives, critical materials designations, trade policies or industrial strategy objectives, could reduce the availability of funding, delay project implementation, alter eligibility requirements or otherwise diminish the benefits available to us. In addition, government awards and funding arrangements are often subject to audit, repayment, suspension, termination or other conditions that may be outside our control.
Any material reduction, delay, restructuring or cancellation of government support programs, or changes in the treatment of titanium metal or related products under federal policy frameworks, could adversely affect our business, growth prospects, financial condition and results of operations.
Certain assets used in the Titanium Production Facility and Advanced Manufacturing Center are acquired with federal government funds. The U.S. government holds the title with respect to such assets.
Our operations, particularly the Titanium Production Facility (TPF), and Advanced Manufacturing Center (AMC) rely on federal funds for the acquisition of certain assets, including equipment and real property. See “Item 5. Operating and Financial Review and Prospects – Liquidity and Capital Resources – Funding Requirements and Capital Expenditures.” Under the terms of this funding arrangement, title to all equipment and real property acquired with federal funds vests with the U.S. government. The U.S. government can elect to, but is not obliged to, transfer such title to all or a portion of the equipment or real property to the Company at the end of the agreement, if the Company’s performance is satisfactory and subject to other conditions. This arrangement presents several risks to our business:
•Loss of Use of Certain Assets: Because the title to these assets is held by the U.S. government, we do not have full control over them. Any changes in government policy or a decision by the U.S. government not to transfer title of some or all of these assets to the Company at the end of the agreement could adversely affect our operations. If the U.S. government were to exercise its rights to reclaim these assets, we might be unable to continue operating the TPF or AMC effectively.
16

Table of Contents
•Operational Disruptions: Some of the assets acquired with federal funds are integral to the operation of the TPF and AMC. If we are required to relinquish these assets to the U.S. government, it could jeopardize our ability to operate the facility. This could lead to operational disruptions, increased costs, and potential loss of revenue.
•Dependency on Federal Funding: Our reliance on federal funds for acquiring certain assets makes us dependent on continued government support. Any reduction in federal funding or changes in the terms of funding could impact our ability to acquire or operate certain assets in the future, thereby affecting our operational capabilities and financial performance. In addition, the DPA Title III and IBAS awards are reimbursable programs under which IperionX generally incurs eligible expenditure and subsequently seeks reimbursement following claim review and approval. This creates timing differences between program expenditures and associated cash receipts.
•Regulatory and Compliance Risks: The use of federal funds subjects us to additional regulatory and compliance requirements. Any failure to comply with these requirements could result in penalties, loss of funding, or other adverse consequences that could negatively impact our business operations.
Our mineral resources and reserve estimates are based on assumptions and interpretations that may prove to be inaccurate.
Although proven and probable reserves have been estimated on the DFS for the Titan Project, reserve estimates are inherently uncertain and depend on geological interpretation, drilling and sampling, metallurgical performance, commodity-price assumptions, operating and capital costs, recovery factors, modifying factors, permitting, environmental requirements and other judgments. There can be no assurance that the reserves disclosed in the DFS will ultimately be economically extracted.
Actual production results may differ materially from reserve estimates. Reserve estimates may require revision based on additional drilling, changes in economic conditions, changes in commodity prices, actual mining experience, metallurgical performance, permitting requirements, inflationary pressures, operating costs or other factors.
Any material reduction in reserve estimates, project economics or mine life could adversely affect the value of the Titan Project and our future financial condition and operating results.
The Titan Project may not achieve the operating, capital cost, production or economic assumptions contained in the Definitive Feasibility Study.
The Titan Project DFS includes estimates and assumptions relating to capital expenditures, operating costs, mining rates, processing recoveries, production rates, commodity prices, infrastructure development, permitting, labor availability, power costs, construction schedules. These assumptions are subject to significant uncertainty and may prove to be inaccurate. These assumptions were considered reasonable when the study was prepared; however, actual conditions may differ materially as market, financing, operating, regulatory and economic conditions evolve.
Actual project development costs may exceed estimates, construction schedules may be delayed and recovery rates, grades, operating costs and production levels may differ from expectations. Inflation, supply constraints, design changes, market conditions and regulatory requirements may adversely affect project economics.
If the assumptions used in the DFS prove to be incorrect or are not realized, the economic returns, project value and expected cash flows from the Titan Project could be materially lower than anticipated, and we may decide not to proceed with, or may suspend or discontinue development of the Titan Project.
We face operational risks related to minerals extraction, exploration and site construction.
We are subject to the operational risks normally encountered in the minerals extraction industry, such as: the discovery of unusual or unexpected geological formations; accidental fires, floods, earthquakes or other natural disasters; unplanned power outages and water shortages; controlling water and other similar extraction hazards; operating labor disruptions and labor disputes; the ability to obtain suitable or adequate machinery, equipment, or labor; our liability for pollution or other hazards; and other known and unknown risks involved in the conduct of exploration and operation of minerals extraction sites. The nature of these risks is such that liabilities could exceed any applicable insurance policy limits or could be excluded from coverage. There are also risks against which we cannot insure or against which we may elect not to insure. The potential costs which could be associated with any liabilities not covered by insurance, or in excess of insurance coverage, or compliance with applicable laws and regulations may cause substantial delays and require significant capital outlays, adversely affecting our results of operations and financial viability.
17

Table of Contents
Climate change may adversely affect our business operations.
We are subject to risks associated with climate change which could harm our results of operations and increase our costs and expenses. The occurrence of severe adverse weather conditions, including increased temperatures, hail, droughts, fires or floods, may have a potentially devastating impact on our operations. Adverse weather may result in physical damage to our operations, instability of our infrastructure and equipment, washed-out roads to our projects, and alter the supply of water and electricity to our mining sites. Increased temperatures may also decrease worker productivity at our projects and raise cooling costs. Should the impacts of climate change be material in nature or occur for lengthy periods of time, our financial condition or results of operations would be adversely affected.
Cybersecurity incidents affecting our information technology and operational technology systems could disrupt manufacturing operations and result in significant losses.
Our business depends on information technology systems and, increasingly, interconnected manufacturing equipment, industrial control systems, automation platforms, production planning systems and other operational technology systems. These systems may be vulnerable to cyberattacks, ransomware, malware, social engineering, insider threats, software or hardware vulnerabilities, supply chain compromises, unauthorized access, human error, equipment failure and other disruptions.
A cybersecurity incident could interrupt production, impair safety systems, alter process parameters, compromise product quality or traceability, delay customer deliveries, result in the loss of intellectual property or confidential information, or require us to suspend operations. Incidents affecting our suppliers, contractors, customers or service providers could have similar effects. We may not detect an incident promptly or accurately assess its scope and consequences.
Prevention, detection, response, remediation, business interruption, litigation, regulatory investigation and reputational costs could be significant. Our insurance may not cover all losses. Any material cybersecurity incident could adversely affect our business, financial condition, results of operations and reputation.
Our use of artificial intelligence and other data-driven technologies may expose us to operational, cybersecurity, legal and reputational risks.
We may use artificial intelligence, machine learning and advanced analytical tools in engineering, product development, manufacturing, quality control, production planning, procurement, forecasting, cybersecurity, finance and other business functions. Outputs from these tools may be inaccurate, incomplete, biased or unreliable and may lead to flawed decisions, operational disruption, product or quality issues, noncompliance or reputational harm.
The use of these technologies may also create or increase risks involving confidential information, intellectual property ownership and infringement, data privacy, record retention, cybersecurity, internal controls and third-party service providers. Threat actors may use artificial intelligence to enhance phishing, fraud, impersonation, malware and other attacks against us or our business partners. Laws, rules and standards governing artificial intelligence continue to evolve and may increase compliance costs or restrict uses of these technologies.
If we fail to implement appropriate governance, validation, access controls, monitoring and human oversight, or if these technologies do not perform as intended, our business, financial condition, results of operations and reputation could be adversely affected.
We depend on key management employees.
The responsibility of overseeing the day-to-day operations and strategic management of our business depends substantially on our senior management and key personnel. Loss of such personnel may have an adverse effect on our performance. The success of our operations will depend upon numerous factors, many of which are beyond our control, including our ability to attract and retain key employees and hire qualified management, technical, engineering and sales personnel. We currently depend upon a relatively small number of key persons to seek out and form strategic alliances and find and retain additional employees. We may not be successful in attracting and retaining the personnel required to grow and operate our business profitably.
Our success will depend in part on developing and maintaining relationships with local communities and other stakeholders.
Our success may depend in part on developing and maintaining productive relationships with the communities surrounding our operations and other stakeholders in our operating locations. Notwithstanding our ongoing efforts, local communities
18

Table of Contents
and stakeholders can become dissatisfied with our activities, which may result in legal or administrative proceedings or campaigns against us, which could materially adversely affect our financial condition, results of operations and cash flows.
Our business could be adversely affected if our reputation is harmed.
Our reputation is important to the success of our business. If our reputation is damaged as a result of our actions or by events outside of our control, our business and results of operations could be adversely affected. If we fail to address, or appear to fail to address, successfully and promptly, the underlying causes of any reputational harm, we may be unsuccessful in repairing any damage to our reputation and our future business prospects would likely be adversely affected.
We may not realize the anticipated benefits of the Atlas acquisition and may face integration, permitting, environmental, reclamation and legacy-liability risks.
On July 1, 2026, we completed the acquisition of additional mineral properties, leases, a plant and related infrastructure from Covia Solutions, LLC (the Atlas Project). The anticipated benefits of the transaction are subject to significant risks and uncertainties. We may encounter difficulties integrating the acquired assets, realizing anticipated operational efficiencies, achieving expected economic returns or using the acquired assets as currently planned. The acquisition may also divert management attention, increase the complexity of our business and expose us to liabilities associated with the acquired assets. If we cannot successfully integrate and use the assets or realize the anticipated benefits, our business, financial condition, results of operations, and cash flows could be adversely affected.
The acquired assets may require greater-than-expected capital expenditures, maintenance, permitting, environmental compliance, staffing, infrastructure improvements or operating costs. Geological, metallurgical, technical, environmental, title, operational, permitting or regulatory matters may differ from our expectations. Historical operations may also expose us to known or unknown environmental, reclamation, contractual, tax or other liabilities.
Our mineral properties may be subject to defects in title.
The ownership and validity or title of unpatented minerals extraction claims and concessions are often uncertain and may be contested. We also may not have, or may not be able to obtain, all necessary surface rights to develop a property. Although we have taken reasonable measures to ensure proper title to our properties, there is no guarantee that title to any of our properties will not be challenged or impugned. Title insurance is generally not available for mineral properties and our ability to ensure that we have obtained a secure claim to individual mineral properties or extraction concessions may be severely constrained. Our mineral properties may be subject to prior unregistered agreements, transfers or claims, and title may be affected by, among other things, undetected defects. We may incur significant costs related to defending the title to our properties. A successful claim contesting our title to a property may cause us to compensate other persons or perhaps reduce our interest in the affected property or lose our rights to explore and, if warranted, develop that property. This could result in us not being compensated for our prior expenditures relating to the property.
Our directors and officers may be in a position of conflict of interest.
Some of our directors and officers currently also serve as directors and officers of other companies involved in similar industries and any of our directors may in the future serve in such positions. There exists the possibility that they may in the future be in a position of conflict of interest. Any decision made by such persons involving us will be made in accordance with their duties and obligations to deal fairly and in good faith with us and such other companies. In addition, any such directors will declare, and refrain from voting on, any matter in which such directors may have a material interest.
Lawsuits may be filed against us and an adverse ruling in any such lawsuit may adversely affect our business, financial condition or liquidity or the market price of the ADSs.
The products we intend to supply may be used in potentially hazardous or critical applications that could result in death, personal injury, property damage, loss of production, punitive damages and consequential damages. Actual or claimed defects in the products we supply could result in our being named as a defendant in lawsuits asserting potentially large claims. The outcome of outstanding, pending or future proceedings cannot be predicted with certainty and may be determined adversely to us and as a result, could have a material adverse effect on our assets, liabilities, business, financial condition or results of operations. Even if we prevail in any such legal proceeding, the proceedings could be costly and time-consuming and may divert the attention of management and key personnel from our business operations, which could adversely affect our financial condition.
19

Table of Contents
Risks Related to Regulatory and Industry Matters
We have incurred increased costs and become subject to additional regulations and requirements as a result of being a large accelerated filer, which could have a material adverse effect on our business, financial condition, and results of operations, and make it more difficult to run our business or divert management’s attention from our business.
As a public company, we are required to commit significant resources and management time and attention to the requirements of being a public company, which have caused us to incur significant accounting and other expenses, associated with the Sarbanes-Oxley Act and related rules implemented by the SEC and Nasdaq, and compliance with these requirements place significant demands on our legal, accounting and finance staff and on our accounting, financial and information systems.
We intend to hire additional accounting and finance personnel with expertise in compliance with the Sarbanes-Oxley Act. We may be unable to locate and hire qualified professionals with requisite technical and public company experience when and as needed. In addition, new employees will require time and training to learn our business and operating processes and procedures. If we are unable to recruit and retain additional finance personnel or if our finance and accounting team is unable for any reason to respond adequately to the increased demands that will result from being a public company, the quality and timeliness of our financial reporting may suffer, which could result in the identification of material weaknesses in our internal controls. Any consequences resulting from inaccuracies or delays in our reported financial statements could cause our stock price to decline and could harm our business, financial condition, and results of operations.
We will be subject to significant governmental regulations, including the U.S. Federal Mine Safety and Health Act.
Minerals extraction activities in the U.S. are subject to extensive federal, state, local and foreign laws and regulations governing environmental protection, natural resources, prospecting, development, production, post-closure reclamation, taxes, labor standards and occupational health and safety laws and regulations, including mine safety, toxic substances and other matters. The costs associated with compliance with such laws and regulations are substantial. In addition, changes in such laws and regulations, or more restrictive interpretations of current laws and regulations by governmental authorities, could result in unanticipated capital expenditures, expenses or restrictions on or suspensions of our operations and delays in the development of our properties.
The acquired Camden properties and plant may involve permitting, environmental, reclamation and legacy-liability risks that were not identified before the acquisition.
Our ownership and use of the acquired properties may require new, transferred, modified or renewed permits and may subject us to environmental, reclamation and operational obligations. Conditions resulting from historical activities, including activities conducted before our ownership, may require investigation, remediation or other expenditures. Contractual protections or rights of recovery from sellers or other parties may be unavailable, insufficient or difficult to enforce. These matters could delay planned activities, increase costs, restrict use of the acquired assets or result in liabilities.
We will be required to obtain and renew governmental permits in order to achieve our business plans, a process that is often costly and time-consuming.
Obtaining and renewing governmental permits is a complex and time-consuming process. The timeliness and success of permitting efforts are contingent upon many variables not within our control, including the interpretation of permit approval requirements administered by the applicable permitting authority. We may not be able to obtain or renew permits that are necessary to our planned operations or we may find that the cost and time required to obtain or renew such permits exceeds our expectations, which in turn could materially adversely affect our business plans or our prospective or actual revenues and profitability. In addition, private parties, such as environmental activists, frequently attempt to intervene in the permitting process and to persuade regulators to deny necessary permits or seek to overturn permits that have been issued. These third-party actions can materially increase the costs and cause delays in the permitting process and could cause us to not proceed with the development or operation of a property.
Compliance with environmental regulations and litigation based on environmental regulations could require significant expenditures.
Environmental regulations mandate, among other things, the maintenance of air and water quality standards, land development and land reclamation, and set forth limitations on the generation, transportation, storage and disposal of solid and hazardous waste. In connection with our current business activities, we may incur environmental costs that could have a material adverse effect on financial condition and results of operations. Any failure to remedy an environmental problem
20

Table of Contents
could require us to suspend operations or enter into interim compliance measures pending completion of the required remedy. Moreover, governmental authorities and private parties may bring lawsuits based upon damage to property and injury to persons resulting from the environmental, health and safety impacts of prior and current operations, including operations conducted by other extraction companies many years ago at sites located on properties that we currently own or formerly owned. We cannot assure you that any such law, regulation, enforcement or private claim would not have a material adverse effect on our financial condition, results of operations or cash flows. If we violate or fail to comply with applicable environmental laws and regulations, we could be subject to penalties, restrictions on operations or other sanctions. Such liability could materially adversely affect our reputation, business, results of operations and financial condition.
Mineral and metal prices are subject to unpredictable fluctuations.
We expect our future revenues, if any, to be derived from the production and sale of titanium and titanium products and also in part from the extraction and sale of critical minerals including titanium, rare earth elements, and zircon-containing minerals. The price of such minerals and metals may fluctuate widely and is affected by numerous factors beyond our control, including international, economic and political trends, expectations of inflation, currency exchange fluctuations, interest rates, global or regional consumptive patterns, speculative activities, increased production due to new extraction developments and improved extraction and production methods and technological changes in the markets for the end products. The effect of these factors on metals prices, and therefore the economic viability of any of our exploration properties, cannot accurately be predicted. Additionally, new production of critical minerals including titanium, rare earth elements, and zircon from current or new competitors in the critical minerals markets could adversely affect prices. In recent years, new and existing competitors have increased the supply of certain critical minerals including titanium, rare earth elements, and zircon, which may have negatively affected their prices. Further production increases could negatively affect prices. We cannot make accurate projections regarding the capacities of possible new entrants into the market and the dates on which they could become operational.
The economic assumptions underlying the DFS may rely in part on revenues from rare earth minerals, zircon and other by-products. If market prices decline, recoveries are lower than expected, or downstream processing capacity is unavailable, project economics may be materially adversely affected.
We are subject to risks associated with currency fluctuations, and changes in foreign currency exchange rates could impact our results of operations.
Our operating expenses are denominated in U.S. dollars and Australian dollars. Our cash and cash equivalents are denominated in U.S. dollars and Australian dollars. Because we have multiple functional currencies across different jurisdictions, changes in the exchange rate between these currencies and the foreign currencies of the transactions recorded in our accounts could materially impact our reported results of operations and distort period-to-period comparisons. More specifically, as a result of our cash and cash equivalents that are denominated in Australian dollars, any appreciation of the U.S. dollar against the Australian dollar would have a negative effect on the U.S. dollar amount available to us. Appreciation or depreciation in the value of the Australian dollar relative to the U.S. dollar would affect our financial results reported in U.S. dollar terms without giving effect to any underlying change in our business or results of operations. As a result of such foreign currency fluctuations, it could be more difficult to detect underlying trends in our business and results of operations.
We have had material weaknesses in internal control over financial reporting in the past and may identify additional material weaknesses in the future.
A material weakness is a deficiency, or combination of deficiencies, in internal control over financial reporting such that there is a reasonable possibility that a material misstatement of annual or interim financial statements will not be prevented or detected on a timely basis. Management assessed, and our independent registered public accounting firm audited, our internal control over financial reporting for the year ended June 30, 2026 and concluded that it was effective. See “Part II, Item 15. Controls and Procedures.” There can be no assurance that additional deficiencies or material weaknesses will not be identified or that any future material weakness will be remediated on a timely basis.
If we identify future material weaknesses in our internal control over financial reporting, we may be unable to accurately report our financial results or report them within the timeframes required by law or stock exchange regulations. Failure to comply with Section 404 of the Sarbanes-Oxley Act could also potentially subject us to sanctions or investigations by the SEC or other regulatory authorities. If additional material weaknesses exist or are discovered in the future, and we are unable to remediate any such material weakness, our reputation, results of operations and financial condition could suffer.
21

Table of Contents
Risks Related to Our ADSs
An active trading market for the ADSs may not be developed or sustained, and the trading price for the ADSs may be volatile and affected by economic conditions beyond our control.
We listed the ADSs on Nasdaq in June 2022. However, a liquid public market in the U.S. for your ADSs may not develop or be sustained, which means you may experience a decrease in the value of the ADSs regardless of our operating performance. In addition, the market price of the ADSs may be highly volatile and subject to wide fluctuations. For instance, during fiscal 2026, the closing price of our ADSs ranged from $21.98 to $60.11. We cannot assure you that the market price of the ADSs will not fluctuate or decline significantly in the future. Some specific factors that could adversely affect the price of the ADSs or trading volumes include actual or expected changes in our prospects or operating results; changes in actual or anticipated demand for our products; general economic conditions; and the liquidity of U.S. and Australian trading markets. In the past, following periods of volatility in the market price of a company’s securities, shareholders often instituted securities class action litigation against that company. If we were involved in a class action suit, it could divert the attention of senior management and, if adversely determined, could have a material adverse effect on our results of operations and financial condition.
ADS holders are not shareholders and do not have shareholder rights.
The Bank of New York Mellon, as depositary, issues and delivers ADSs. ADS holders will not be treated as shareholders and will not have shareholders rights. The depositary will be the holder of our ordinary shares represented by the ADSs. Holders of ADSs will have ADS holder rights. A deposit agreement among us, the depositary, and the beneficial owners and holders of ADSs, sets out ADS holder rights as well as the rights and obligations of the depositary. New York law governs the deposit agreement and the ADSs. We and the depositary may amend or terminate the deposit agreement without the ADS holders’ consent in a manner that could prejudice ADS holders. For a description of ADS holder rights, see “Item 12. Description of Securities Other Than Equity Securities-D. American Depositary Shares.” Our shareholders have shareholder rights. Australian law and our Constitution govern shareholder rights. For a description of ADS holder rights and the rights of our ordinary shares, see “Item 10. Additional Information-A. Share Capital.”
ADS holders do not have the same voting rights as our shareholders. Shareholders are entitled to receive our notices of general meetings and to attend and vote at our general meetings of shareholders. At a general meeting, every shareholder present (in person or by proxy, attorney or representative) and entitled to vote has one vote on a show of hands. Every shareholder present (in person or by proxy, attorney or representative) and entitled to vote has one vote per fully paid ordinary share on a poll. This is subject to any other rights or restrictions which may be attached to any shares. ADS holders may instruct the depositary to vote the ordinary shares underlying their ADSs, but only if we ask the depositary to ask for their instructions. If we do not ask the depositary to ask for the instructions, our ADS holders are not entitled to receive our notices of general meeting. ADS holders will not be entitled to attend and vote at a general meeting unless they surrender their ADSs and withdraw the ordinary shares. However, our ADS holders may not have sufficient advance notice about the meeting to surrender their ADSs and withdraw the shares. If we ask for ADS holders’ instructions, the depositary will notify ADS holders of the upcoming vote and arrange to deliver our voting materials and form of notice to them. The depositary will try, as far as practical, subject to Australian law and the provisions of the deposit agreement, to vote the shares as ADS holders instruct. The depositary will not vote or attempt to exercise the right to vote other than in accordance with the instructions of the ADS holders. We cannot assure ADS holders that they will receive the voting materials in time to ensure that they can instruct the depositary to vote their shares. In addition, there may be other circumstances in which ADS holders may not be able to exercise voting rights.
ADS holders do not have the same rights to receive dividends or other distributions as our shareholders. Subject to any special rights or restrictions attached to any shares, the directors may determine that a dividend will be payable on our ordinary shares and fix the amount, the time for payment and the method for payment (although we have never declared or paid any cash dividends on our ordinary shares, and we do not anticipate paying any cash dividends in the foreseeable future). Dividends may be paid on our ordinary shares of one class but not another and at different rates for different classes. Dividends and other distributions payable to our shareholders with respect to our ordinary shares generally will be payable directly to them. Any dividends or distributions payable with respect to ordinary shares will be paid to the depositary, which has agreed to pay to ADS holders the cash dividends or other distributions it or the custodian receives on shares or other deposited securities, after deducting its fees and expenses and subject to the provisions of the deposit agreement. Before the depositary makes a distribution to you on behalf of your ADSs, any withholding taxes that must be paid will be deducted. Additionally, if the exchange rate fluctuates during a time when the ADS depositary cannot convert the foreign currency, you may lose some or all of the value of the distribution. ADS holders will receive these distributions in proportion to the number of ordinary shares their ADSs represent. In addition, there may be certain circumstances in which the depositary may not pay to ADS holders amounts distributed by us as a dividend or distribution.
22

Table of Contents
There are circumstances where it may be unlawful or impractical to make distributions to the holders of ADSs.
The deposit agreement allows the depositary to distribute the foreign currency only to those ADS holders to whom it is possible to do so. If a distribution is payable by us in Australian dollars, the depositary will hold the foreign currency it cannot convert for the account of the ADS holders who have not been paid. It will not invest the foreign currency and it will not be liable for any interest. If the exchange rates fluctuate during a time when the depositary cannot convert the foreign currency, ADS holders may lose some of the value of the distribution. The depositary is not responsible if it decides that it is unlawful or impractical to make a distribution available to any ADS holders. This means that ADS holders may not receive the distributions we make on our ordinary shares or any value for them if it is illegal or impractical for us to make them available to them.
Holders of the ADSs may have difficulty in effecting service of process in the U.S. or enforcing judgments obtained in the U.S.
We are a public company incorporated under the laws of Australia. Therefore, the rights of holders of our ordinary shares are governed by Australian law and our Constitution. These rights differ from the typical rights of shareholders in U.S. corporations. The rights of holders of ADSs are affected by Australian law and our Constitution but are governed by U.S. law. Circumstances that under U.S. law may entitle a shareholder in a U.S. company to claim damages may also give rise to a cause of action under Australian law entitling a shareholder in an Australian company to claim damages. However, this will not always be the case.
Holders of the ADSs may have difficulties enforcing, in actions brought in courts in jurisdictions located outside the U.S., liabilities under U.S. securities laws. In particular, if such a holder sought to bring proceedings in Australia based on U.S. securities laws, the Australian court might consider whether:
•it did not have jurisdiction;
•it was not an appropriate forum for such proceedings;
•applying Australian conflict of laws rule, U.S. law (including U.S. securities laws) did not apply to the relationship between holders of our ordinary shares or ADSs and us or our directors and officers; or
•the U.S. securities laws were of a public or penal nature and should not be enforced by the Australian court.
Certain of our directors and executive officers are residents of countries other than the U.S. Furthermore, a portion of our and their assets are located outside the U.S. As a result, it may not be possible for a holder of our ordinary shares or ADSs to:
•effect service of process within the U.S. upon certain directors and executive officers or on us;
•enforce in U.S. courts judgments obtained against any of our directors and executive officers or us in the U.S. courts in any action, including actions under the civil liability provisions of U.S. securities laws;
•enforce in U.S. courts judgments obtained against any of our directors and senior management or us in courts of jurisdictions outside the U.S. in any action, including actions under the civil liability provisions of U.S. securities laws; or
•bring an action in an Australian court to enforce liabilities against any of our directors and executive officers or us based upon U.S. securities laws.
Holders of our ordinary shares and ADSs may also have difficulties enforcing in courts outside the U.S. judgments obtained in the U.S. courts against any of our directors and executive officers or us, including actions under the civil liability provisions of the U.S. securities laws.
ADS holders may not be entitled to a jury trial with respect to claims arising under the deposit agreement, which could result in less favorable outcomes to the plaintiff(s) in any such action.
The deposit agreement governing the ADSs provides that, to the fullest extent permitted by law, ADS holders waive the right to a jury trial of any claim they may have against us or the depositary arising out of or relating to our ordinary shares, the ADSs or the deposit agreement, including any claim under the U.S. federal securities laws. The waiver of jury trial provision applies to all holders of ADSs, including purchasers who acquire the ADSs on the open market. If we or the depositary opposed a jury trial demand based on the waiver, the court would determine whether the waiver was enforceable based on the facts and circumstances of that case in accordance with the applicable state and federal law. To our knowledge, the enforceability of a contractual pre-dispute jury trial waiver in connection with claims arising under the
23

Table of Contents
federal securities laws has not been finally adjudicated by the U.S. Supreme Court. However, we believe that a contractual pre-dispute jury trial waiver provision is generally enforceable, including under the laws of the State of New York, which govern the deposit agreement, by a federal or state court in the City of New York, which has non-exclusive jurisdiction over matters arising under the deposit agreement. In determining whether to enforce a contractual pre-dispute jury trial waiver provision, courts will generally consider whether a party knowingly, intelligently and voluntarily waived the right to a jury trial. We believe that this is the case with respect to the deposit agreement and the ADSs. In addition, New York courts will not enforce a jury trial waiver provision in order to bar a viable setoff or counterclaim sounding in fraud or one which is based upon a creditor’s negligence in failing to liquidate collateral upon a guarantor’s demand, or in the case of an intentional tort claim (as opposed to a contract dispute), none of which we believe are applicable in the case of the deposit agreement or the ADSs. It is advisable that you consult legal counsel regarding the jury waiver provision before entering into the deposit agreement.
If you or any other owner or holder of ADSs bring a claim against us or the depositary in connection with matters arising under the deposit agreement or the ADSs, including claims under federal securities laws, you or such other owner or holder may not be entitled to a jury trial with respect to such claims, which may have the effect of limiting and discouraging lawsuits against us and/or the depositary. If a lawsuit is brought against us and/or the depositary under the deposit agreement, it may be heard only by a judge or justice of the applicable trial court, which would be conducted according to different civil procedures and may result in different outcomes than a trial by jury would have had, including results that could be less favorable to the plaintiff(s) in any such action. Nevertheless, if this jury trial waiver provision is not permitted by applicable law, an action could proceed under the terms of the deposit agreement with a jury trial. No condition, stipulation or provision of the deposit agreement or ADSs serves as a waiver by any owner or holder of ADSs or by us or the depositary of compliance with any substantive provision of the U.S. federal securities laws and the rules and regulations promulgated thereunder. By agreeing to the jury trial waiver provision in the deposit agreement, investors will not be deemed to have waived our compliance with or the depositary’s compliance with the federal securities laws and the rules and regulations promulgated thereunder.
The dual listing of our ordinary shares and the ADSs may adversely affect the liquidity and value of the ADSs.
Our ordinary shares are listed on the ASX and the ADSs are listed on Nasdaq. We cannot predict the effect of this dual listing on the value of our ordinary shares and ADSs. However, the dual listing of our ordinary shares and ADSs may dilute the liquidity of these securities in one or both markets and may adversely affect the development of an active trading market for the ADSs in the U.S. The price of the ADSs could also be adversely affected by trading in our ordinary shares on the ASX.
Currency fluctuations may adversely affect the price of the ADSs relative to the price of our ordinary shares.
The price of our ordinary shares is quoted in Australian dollars, and the price of the ADSs is quoted in U.S. dollars. Movements in the Australian dollar/U.S. dollar exchange rate may adversely affect the U.S. dollar price of the ADSs and the U.S. dollar equivalent of the price of our ordinary shares. If the Australian dollar weakens against the U.S. dollar, the U.S. dollar price of the ADSs could decline, even if the price of our ordinary shares in Australian dollars increases or remains unchanged. If we pay dividends, we will likely calculate and pay any cash dividends in Australian dollars and, as a result, exchange rate movements will affect the U.S. dollar amount of any dividends holders of the ADSs will receive from the depositary.
As a foreign private issuer, we are permitted and expect to follow certain home-country corporate governance practices in lieu of certain Nasdaq requirements applicable to domestic issuers.
As a foreign private issuer listed on Nasdaq, we are permitted to follow certain home-country corporate governance practices in lieu of certain Nasdaq practices. Following our home-country corporate governance practices, as opposed to the requirements that would otherwise apply to a U.S. company listed on Nasdaq, may provide less protection than is afforded to investors under the Nasdaq rules applicable to domestic issuers.
In particular, we follow home country law instead of Nasdaq practice regarding:
•Nasdaq’s requirement that an issuer provide for a quorum as specified in its by laws for any meeting of the holders of ordinary shares, which quorum may not be less than 33 1/3% of the outstanding shares of an issuer’s voting ordinary shares. In compliance with Australian law, our Constitution provides that two shareholders present shall constitute a quorum for a general meeting.
•Nasdaq’s requirement that issuers obtain shareholder approval prior to the issuance of securities in connection with certain acquisitions, changes of control or private placements of securities, or the establishment or amendment of
24

Table of Contents
certain stock option, purchase or other compensation plans. Applicable Australian law and rules differ from Nasdaq requirements, with the ASX Listing Rules providing generally for prior shareholder approval in numerous circumstances, including (i) issuance of equity securities exceeding 15% (or an additional 10% capacity to issue equity securities for the preceding 12-month period if shareholder approval by special resolution is sought at the Company’s annual general meeting) of our issued share capital in any 12-month period (but, in determining the available issue limit, securities issued under an exception to the rule or with shareholder approval are not counted), (ii) issuance of equity securities to related parties (as defined in the ASX Listing Rules) and (iii) directors or their associates acquiring securities under an employee incentive plan.
As a foreign private issuer, we are permitted to file less information with the SEC than a domestic issuer.
As a foreign private issuer, we are exempt from certain rules under the Exchange Act, that impose requirements for proxy solicitations under Section 14 of the Exchange Act. In addition, our officers, directors and principal shareholders are exempt from the reporting and “short-swing” profit recovery provisions of Section 16 of the Exchange Act. Moreover, we are not required to file periodic reports and financial statements with the SEC as frequently or as promptly as a domestic issuer, nor are we generally required to comply with the SEC’s Regulation FD, which restricts the selective disclosure of material non-public information.
Under Australian law, we prepare financial statements on an annual and semi-annual basis, we are not required to prepare or file quarterly financial information other than quarterly updates. Our quarterly updates have consisted of a brief review of operations for the quarter together with a statement of cash expenditure during the quarter and the cash and cash equivalents balance as at the end of the quarter.
For as long as we are a “foreign private issuer,” we intend to file our annual financial statements on Form 20-F and furnish our semi-annual financial statements and quarterly updates on Form 6-K to the SEC as long as we are subject to the reporting requirements of Section 13 or 15(d) of the Exchange Act. However, the information we file or furnish is not the same as the information that is required in annual and quarterly reports on Form 10-K or Form 10-Q for U.S. domestic issuers. Accordingly, there may be less information publicly available concerning us than there is for a company that files as a domestic issuer.
We will incur significant costs as a result of operating as a company whose ADSs are publicly traded in the U.S., and our management is required to devote substantial time to compliance initiatives.
We originally listed the ADSs in the U.S. in June 2022 and, as a result, we expect to incur significant legal, accounting, insurance and other expenses in the future periods that we did not incur prior to listing in the U.S. In addition, the Sarbanes-Oxley Act, Dodd-Frank Wall Street Reform and Consumer Protection Act and related rules implemented by the SEC, have imposed various requirements on public companies including requiring establishment and maintenance of effective disclosure and internal controls. Our management and other personnel will need to devote a substantial amount of time to these compliance initiatives. Moreover, these rules and regulations increase our legal and financial compliance costs and make some activities more time consuming and costly. These laws and regulations could also make it more difficult and expensive for us to attract and retain qualified persons to serve on our board of directors, our board committees or as our senior management. Furthermore, if we are unable to satisfy our obligations as a public company in the U.S., we could be subject to delisting of the ADSs, fines, sanctions and other regulatory action and potentially civil litigation.
We do not anticipate paying dividends in the foreseeable future.
We have not declared any dividends during the last three fiscal years and do not anticipate that we will do so in the foreseeable future. We currently intend to retain future earnings, if any, to finance the development of our business. Dividends, if any, on our outstanding ordinary shares will be declared by and subject to the discretion of the Board on the basis of our earnings, financial requirements and other relevant factors, and subject to Australian law. As a result, a return on your investment will only occur if the ADS price appreciates. We cannot assure you that the ADSs will appreciate in value or even maintain the price at which you purchase the ADSs. You may not realize a return on your investment in the ADSs and you may even lose your entire investment in the ADSs.
If U.S. securities or industry analysts do not publish research reports about our business, or if they issue an adverse opinion about our business, the market price and trading volume of our ordinary shares or ADSs could decline.
The trading market for our ordinary shares and ADSs will be influenced by the research and reports that U.S. securities or industry analysts publish about us or our business. Securities and industry analysts may discontinue research on us, to the extent such coverage currently exists, or in other cases, may never publish research on us. If no or too few U.S. securities
25

Table of Contents
or industry analysts commence coverage of our Company, the trading price for the ADSs would likely be negatively affected. In the event securities or industry analysts initiate coverage, if one or more of the analysts who cover us downgrade the ADSs or publish inaccurate or unfavorable research about our business, the market price of the ADSs would likely decline. If one or more of these analysts cease coverage of us or fail to publish reports on us regularly, demand for the ADSs could decrease, which might cause our price and trading volume to decline. In addition, research and reports that Australian securities or industry analysts publish about us, our business or our ordinary shares may impact the market price of the ADSs.
You may be subject to limitations on transfers of your ADSs.
Your ADSs are transferable on the books of the depositary. However, the depositary may close its transfer books at any time or from time to time when it deems expedient in connection with the performance of its duties. In addition, the depositary may refuse to deliver, transfer or register transfers of ADSs generally when our books or the books of the depositary are closed, or at any time if we or the depositary deems it advisable to do so because of any requirement of law or of any government or governmental body, or under any provision of the deposit agreement, or for any other reason.
We and the depositary are entitled to amend the deposit agreement and to change the rights of ADS holders under the terms of such agreement, and we may terminate the deposit agreement, without the prior consent of the ADS holders.
We and the depositary are entitled to amend the deposit agreement and to change the rights of the ADS holders under the terms of such agreement, without the prior consent of the ADS holders. In the event that the terms of an amendment are materially prejudicial to ADS holders’ substantial rights, ADS holders will only receive 30 days’ advance notice of the amendment, and no prior consent of the ADS holders is required under the deposit agreement. Furthermore, we may decide to terminate the ADS facility at any time for any reason, or the depositary agent may on its own initiative terminate the deposit agreement. If the ADS facility is terminated, ADS holders will receive at least 90 days’ prior notice, but no prior consent is required from them. Under the circumstances that we decide to make an amendment to the deposit agreement that is materially prejudicial to the substantial rights of the ADS holders or terminate the deposit agreement, the ADS holders may choose to sell their ADSs or surrender their ADSs and become direct holders of the underlying ordinary shares but will have no right to any compensation whatsoever.
ADS holders have limited recourse if we or the depositary fail to meet our respective obligations under the deposit agreement.
The deposit agreement expressly limits our obligations and liability and those of the depositary. We and the depositary are only obligated to take the actions specifically set forth in the deposit agreement without negligence or bad faith, and the depositary will not be a fiduciary or have any fiduciary duty to holders of ADSs; are not liable if we are or it is prevented or delayed by law or by events or circumstances beyond our or its ability to prevent or counteract with reasonable care or effort from performing our or its obligations under the deposit agreement; are not liable if we or it exercises discretion permitted under the deposit agreement; are not liable for the inability of any holder of ADSs to benefit from any distribution on deposited securities that is not made available to holders of ADSs under the terms of the deposit agreement, or for any special, consequential or punitive damages for any breach of the terms of the deposit agreement; have no obligation to become involved in a lawsuit or other proceeding related to the ADSs or the deposit agreement on your behalf or on behalf of any other person; and are not liable for the acts or omissions of any securities depository, clearing agency or settlement system.
Our Constitution and Australian laws and regulations applicable to us may adversely affect our ability to take actions that could be beneficial to our shareholders.
As an Australian company we are subject to different corporate requirements than a corporation organized under the laws of the U.S. Our Constitution, as well as the Australian Corporations Act, set forth various rights and obligations that are unique to us as an Australian company and which may not apply to a U.S. corporation. These requirements may operate differently than those of many U.S. companies.
If we fail to maintain proper internal controls, our ability to produce accurate financial statements or comply with applicable regulations could be impaired.
We are subject to the reporting obligations under the U.S. securities laws. The SEC, as required under Section 404 of the Sarbanes-Oxley Act, has adopted rules requiring a public company to include a report of management on the effectiveness of such company’s internal control over financial reporting in its annual report on Form 20-F. In addition, an independent registered public accounting firm for a public company must issue an attestation report on the effectiveness of our internal control over financial reporting. If in the future, we are unable to conclude that we have effective internal controls over
26

Table of Contents
financial reporting or our independent auditors are unwilling or unable to provide us with an unqualified report on the effectiveness of our internal controls over financial reporting as required by the Sarbanes-Oxley Act, investors may lose confidence in our operating results, the price of the ADSs could decline and we may be subject to litigation or regulatory enforcement actions. In addition, if we are unable to meet the requirements of the Sarbanes-Oxley Act, we may not be able to remain listed on Nasdaq.
We may be, or may become, a passive foreign investment company, or PFIC, which could result in adverse U.S. federal income tax consequence to U.S. investors.
There is a risk that we will be a PFIC for any taxable year, which could result in adverse U.S. federal income tax consequences to U.S. Holders (as defined in “Item 10. Additional Information-E. Taxation-Material U.S. Federal Income Tax Considerations”). Under the IRS Code, in general, a non-U.S. corporation is a PFIC for any taxable year in which, after the application of certain “look-through” rules with respect to its subsidiaries, either (i) 75% or more of its gross income consists of “passive income,” or (ii) 50% or more of the average quarterly value of its assets consist of assets that produce, or are held for the production of, “passive income.” Passive income generally includes interest, dividends, rents, certain non-active royalties and capital gains.
Based on the composition of our income and assets and the value of our assets, we do not believe that we were a PFIC for the taxable year ended June 30, 2026. Our status in future years will depend on our income, assets, and activities in those years, and there can be no assurance that we will not be classified as a PFIC for future taxable years. However, the proper application of the PFIC rules to a company with a business such as ours is not entirely clear. Because the proper characterization of certain components of our income and assets is not entirely clear and because our PFIC status for any taxable year will depend on the composition of our income and assets and the value of our assets from time to time (which may be determined, in part, by reference to the market price of our shares, which could be volatile), there can be no assurance that we were not a PFIC for the taxable year ended June 30, 2026.
Additionally, even if we are not a PFIC for a particular taxable year, we could become a PFIC for future years based on changes in our assets or the value thereof, including the value of our goodwill as indicated by our market capitalization, and based on changes in our activities and income, particularly given the fact that it is not entirely clear how the asset and income tests should apply to us. For these reasons, and since a non-U.S. corporation’s annual PFIC status can be determined only after the end of each taxable year, we cannot express a view as to whether we will be a PFIC for the current or any future taxable year.
If we are characterized as a PFIC for any taxable year during which a U.S. Holder holds ADSs, we generally would continue to be treated as a PFIC with respect to that U.S. Holder for all succeeding years during which the U.S. Holder holds ADSs or ordinary shares, even if we ceased to meet the threshold requirements for PFIC status.
U.S. Holders should consult their own tax advisors regarding all aspects of the possible application of the PFIC rules to our ADSs and ordinary shares. For a more detailed explanation of the tax consequences of PFIC classification to U.S. Holders, see “Item 10. Additional Information-E. Taxation-Material U.S. Federal Income Tax Considerations-Passive Foreign Investment Company.”
Risks Related to Proposed Redomiciliation
The proposed redomiciliation may not be completed on the anticipated timeline, or at all.
On August 3, 2026, we announced that IperionX intends to pursue a redomiciliation to the U.S. through a proposed scheme of arrangement (the “redomiciliation”). If the scheme is implemented, IperionX Limited will become a direct wholly owned subsidiary of IperionX Inc., a newly formed corporation incorporated in the State of Texas (“IperionX US”) solely for the purpose of effecting the change of domicile. Holders of our ordinary shares would receive CHESS Depositary Interests (CDIs) of IperionX US quoted on the ASX, and holders of the ADSs would receive shares of IperionX US common stock listed on the Nasdaq, in each case at the applicable exchange ratio described in the scheme booklet. Implementation of the redomiciliation is subject to the satisfaction or waiver of a number of conditions, including, among others:
•approval of the scheme of arrangement by (i) unless the Federal Court of Australia (the “Court”) orders otherwise, a majority in number (more than 50%) of shareholders present and voting at the scheme meeting (in person or by proxy, corporate representative or attorney) and (ii) at least 75% of the total number of votes cast on the resolution;
•approval of the scheme of arrangement by the Court;
•approval for listing of shares of IperionX US common stock on Nasdaq; and
27

Table of Contents
•approvals, confirmations and waivers from ASX, including approval for official quotation of IperionX US CDIs.
We cannot assure you that these approvals will be obtained or that the other conditions to the redomiciliation will be satisfied or waived, or that the redomiciliation will be completed on the timetable we currently anticipate, or at all. Court dates, the scheme meeting date and the implementation date may be delayed, including as a result of supplementary disclosure, regulatory review or intervening corporate actions. If the requisite conditions are not satisfied or waived, or if the redomiciliation is otherwise abandoned, we will remain incorporated in Australia and will nonetheless have incurred significant transaction costs and substantial diversion of management time and attention, without realizing any of the anticipated benefits of the redomiciliation. The announcement of, or any delay in or abandonment of, the redomiciliation could also adversely affect the trading prices of our ordinary shares and ADSs.
The proposed redomiciliation may result in adverse tax consequences for the Company or our shareholders.
The tax consequences of the proposed redomiciliation are complex and will depend on the structure of the transaction, the jurisdictions involved, future legislative developments and the particular circumstances of individual shareholders.
The transaction may result in taxable events for certain shareholders under U.S., Australian or other tax laws. In addition, tax authorities may disagree with tax positions taken by us or our shareholders in connection with the redomiciliation.
Changes in tax laws, regulations, interpretations or administrative practices in the U.S., Australia or other jurisdictions could result in increased tax liabilities or compliance costs following completion of the redomiciliation.
Prospective and existing investors should consult their own tax advisers regarding the specific tax consequences applicable to their particular circumstances.
Following the redomiciliation, we will no longer qualify as a foreign private issuer, which will require us to comply with the Exchange Act’s domestic reporting regime and U.S. corporate governance requirements and will increase our legal, accounting and compliance costs.
We currently report with the SEC as a foreign private issuer, including by filing annual reports on Form 20-F and furnishing reports on Form 6-K. Upon implementation of the redomiciliation, IperionX Inc., as a Texas corporation, will not qualify as a foreign private issuer and will be required to comply with the reporting and other requirements of the Exchange Act, applicable to U.S. domestic issuers, which are more detailed and extensive than the requirements applicable to foreign private issuers. These include the requirements to file annual reports on Form 10-K, quarterly reports on Form 10-Q and current reports on Form 8-K on accelerated timelines, to comply with the SEC’s proxy rules in connection with shareholder meetings, and to comply with Regulation FD. Our directors, officers and principal shareholders will become subject to the reporting and “short-swing” profit recovery provisions of Section 16 of the Exchange Act. IperionX US will also be required to comply with Nasdaq corporate governance standards applicable to U.S. domestic issuers, without the ability to rely on home country practice exemptions available to foreign private issuers. In addition, IperionX US will be required to prepare its financial statements in accordance with U.S. GAAP rather than IFRS as issued by the IASB. The regulatory and compliance costs associated with reporting as a U.S. domestic issuer are expected to be higher than the costs we currently incur as a foreign private issuer, and these changes will increase our legal, accounting, insurance and financial compliance costs and may divert management’s attention.
If the redomiciliation is completed, shareholder rights will change as a result of becoming a holder of securities of a Texas corporation, and those rights may be less favorable in certain respects than current shareholder rights.
IperionX Limited is an Australian public company subject to the Australian Corporations Act, and the rights of our shareholders are currently governed by that statute, our constitution and applicable ASX Listing Rules. Following implementation of the redomiciliation, IperionX US will be a corporation incorporated in the State of Texas, and the rights of holders of IperionX US common stock and CDIs will be governed primarily by the Texas Business Organizations Code (TBOC), U.S. federal securities laws and the certificate of formation and bylaws of IperionX US, rather than by the Corporations Act and our current constitution. IperionX US will remain subject to certain provisions of the Corporations Act as a registered foreign company in Australia and to the ASX Listing Rules (subject to waivers granted by ASX) for so long as IperionX US CDIs are quoted on ASX.
There are material differences between the Australian and Texas legal regimes, including with respect to takeover regulation (holders will no longer have the benefit of the takeover protections in Chapter 6 of the Corporations Act, and will instead be subject to the regime under the TBOC, the IperionX US charter documents and U.S. federal law), the ability of shareholders to requisition meetings and propose resolutions, related party transaction approvals, statutory oppression and other minority protection remedies, directors’ duties and shareholder litigation. Certain provisions of the IperionX US
28

Table of Contents
certificate of formation and bylaws could also make it more difficult for a third party to acquire IperionX US or for shareholders to influence corporate matters. In addition, the U.S. is generally a more litigious environment than Australia, and shareholders of a Texas corporation may bring direct and class action claims where the applicable requirements are met; any material or costly dispute or litigation could adversely affect our reputation, financial performance or value. As a result of these and other differences, shareholder rights following the redomiciliation may be less favorable in certain respects than those currently in effect.
Even if the proposed redomiciliation is not completed, we may lose our foreign private issuer status as a result of the changes in the U.S. ownership of our securities or other changes in our circumstances, which would require us to comply with the Exchange Act’s domestic reporting regime and cause us to incur additional legal, accounting and other expenses.
We are required to determine our status as a foreign private issuer annually as of the end of our second fiscal quarter. To maintain that status, either a majority of our outstanding voting securities must be directly or indirectly owned of record by non-U.S. residents or, if more than 50% are owned by U.S. residents, we must satisfy the applicable business-contacts tests concerning the citizenship and residency of our officers and directors, the location of our assets and the principal administration of our business. Changes in the overall U.S. ownership of our securities or in our business contacts could cause us to lose foreign private issuer status even if the proposed redomiciliation is not completed. If we lose that status, we would become subject to the more extensive reporting, governance and compliance requirements applicable to U.S. domestic issuers. Following the redomiciliation, we will no longer qualify as a “foreign private issuer” and will therefore be required to prepare our financial statements under U.S. GAAP rather than IFRS as issued by the IASB. This transition could increase compliance costs, require changes to our systems and controls, divert management attention and result in accelerated reporting deadlines.
29

Table of Contents
ITEM 4.    INFORMATION ON THE COMPANY
A.History and Development of the Company
Our head office is located at 1092 Confroy Drive, South Boston, Virginia 24592, U.S. Our registered office is located at 56 Pitt Street, Level 5, Sydney NSW 2000, Australia. The telephone number of our registered office is +(61) 2-8823-3179.
IperionX was originally incorporated in Western Australia on May 5, 2017. We are an Australian public company subject to the provisions of the Australian Corporations Act.
Our ordinary shares have been listed on the Australian Securities Exchange since 2018, previously under the symbols “TAO” and “HYM” and currently under the symbol “IPX.” Our ADSs, each representing 10 of our ordinary shares, are listed on the Nasdaq under the symbol “IPX.” The Bank of New York Mellon acts as depositary for the ADSs.
The Securities and Exchange Commission (SEC) maintains an internet site at http://www.sec.gov that contains reports, information statements, and other information regarding issuers that file electronically with the SEC. We also maintain a web site at www.iperionx.com. The information contained on our website or available through our website is not incorporated by reference into and should not be considered a part of this annual report on Form 20-F, and the reference to our website in this annual report on Form 20-F is an inactive textual reference only.
B.Business Overview
Our mission
During the fiscal year ended June 30, 2026, IperionX moved from commissioning into commercial operations and production ramp-up at its Virginia Titanium Manufacturing Campus. The Group’s operational focus is now on reliability, throughput, yield and quality; commissioning additional product-manufacturing capacity; and converting customer programs into repeatable production and revenue.
IperionX operates across two connected platforms: titanium metal operations in Virginia and Utah, and critical mineral operations through the Atlas-Titan platform in Tennessee. Together, these assets support the Group’s strategy to establish a domestic U.S. supply chain from recycled scrap and mineral feedstocks through titanium powder, mill products and finished components.
The Virginia platform uses proprietary HAMR™ technology to produce high-quality titanium powder and HSPT™ / THRM™ technologies, powder metallurgy and additive manufacturing to produce near-net-shape parts and other titanium products. The Titan and Atlas assets provide the potential for future domestic titanium mineral feedstocks together with heavy rare earth and zircon products.
The incumbent titanium supply chain is based on the Kroll process and generally requires chlorination, batch reduction, vacuum distillation, multiple melting and remelting steps, extensive hot working and machining. This route is capital- and energy-intensive, has long lead times and can result in substantial material losses. IperionX’s technologies are designed to remove or shorten many of these steps and improve material utilization.
The U.S. has no commercial titanium sponge production and depends on imported primary titanium for defense and advanced industries. IperionX is addressing this strategic vulnerability through two principal value drivers:
•Titanium metal operations: Virginia operations transitioned to a 24/7 production schedule during fiscal year 2026. HAMR™ powder consistently met or exceeded Grade 5 parameters, the commissioned SACMI press tripled powder metallurgy capacity, and additional HSPT™ furnace capacity entered installation. IperionX is targeting an annualized production run rate of approximately 200 tpa by the end of calendar year 2026, subject to ramp-up and operating optimization; and
•Critical mineral operations: The Titan DFS completed in June 2026 defined a staged development, with key mine-area permits in place, producing HREC, titanium minerals and zircon from a domestic resource. Subsequent to year-end, IperionX completed the $3.0 million Atlas acquisition, adding surface stockpiles, pre-stripped mineralization and established infrastructure adjacent to Titan. The Atlas assets are not included in the mineral resource and
30

Table of Contents
mineral reserve estimates reported in this report and no mineral resources or reserves have been determined for Atlas under S-K 1300.
All critical systems at the Titanium Production Facility (TPF) were fully commissioned during the fiscal year. Technology and operating improvements increased nameplate titanium powder capacity from 125 tpa to approximately 200 tpa without additional capital expenditure, with projected steady-state unit costs of approximately $55/kg at full utilization. Planning, design and long-lead procurement are underway for an expansion to approximately 1,400 tpa of installed HAMRTM powder equipment capacity targeted during 2027.
Customer and government-supported programs advanced across fasteners, impellers, ground-vehicle components, titanium plate, consumer electronics, automotive and other defense and industrial products. The customer pipeline is increasingly progressing from material qualification into finished-component testing, prototype purchase orders and funded scale-up activities.
The Group’s longer-term strategy is to integrate domestic feedstocks with titanium metal and product manufacturing, targeting more than 10,000 tpa of high-performance titanium components by 2030 and progressively improving titanium’s value-in-use competitiveness with stainless steel and aluminum in selected applications.
The achievement of these objectives remains subject to successful production ramp-up, customer qualification and orders, financing, construction, commissioning and other operational and market conditions.
Why Titanium?
Titanium combines high strength-to-weight performance, corrosion resistance and high-temperature capability. These characteristics make titanium important to defense, aerospace, marine, medical, industrial, automotive and consumer-electronics applications. However, high production and manufacturing costs have historically limited its use relative to stainless steel and aluminum.
Primary titanium is generally produced through the Kroll process, a capital- and energy-intensive batch route that reduces titanium tetrachloride with magnesium. The resulting titanium sponge must then be melted, alloyed and remelted into ingots before further processing.
Ingots are converted into mill products through repeated forging, rolling, extrusion and heat-treatment steps. Finished parts are commonly machined from these products, often removing a large proportion of the titanium as scrap. Spherical titanium powders may require additional conversion of mill products into wire followed by atomization.
The U.S. relies on imported titanium to support defense and critical infrastructure. China and Russia’s share of global titanium sponge production capacity increased from approximately 61% in 2018 to approximately 80% in 2026, increasing the strategic importance of a secure domestic alternative.
IperionX’s integrated route is designed to replace major elements of the incumbent chain by converting recycled scrap or mineral-derived feedstock into titanium powder and then into near-net-shape components and mill products. The objective is to reduce process steps, energy use, material loss, cost and lead time while maintaining high product performance.
Titanium Products
IperionX's commercial strategy is value-led: prioritize manufactured titanium products where vertical integration can materially reduce waste, shorten lead times and lower projected end-product cost. The largest opportunities are repeat-order products with high conventional 'buy-to-fly' ratios, long lead times or concentrated offshore supply chains. In each category, the objective is the same: replace a slower, more wasteful and often imported incumbent with an American-made titanium product that performs better, can be delivered faster and, at scale, is more affordable.
Titanium powder remains a strategically important product for additive manufacturing and powder metallurgy. However, converting powder into near-net-shape components and mill products captures a greater share of the value chain, differentiates IperionX from commodity powder suppliers and gives customers a more complete domestic supply-chain solution.
31
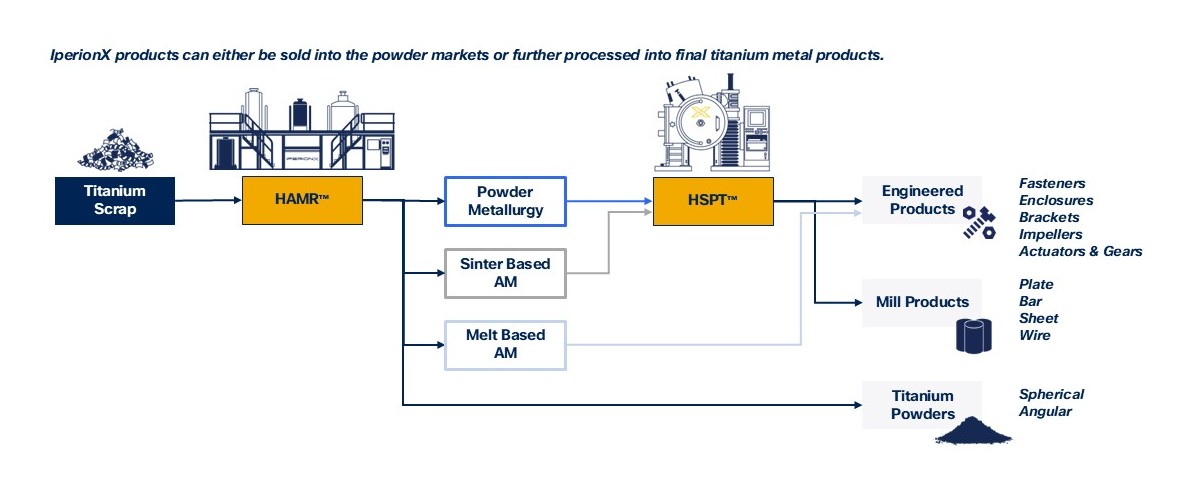
Table of Contents
Slide1.jpg

Fasteners and high-volume hardware
Titanium fasteners are a large, repeat-order product category across defense, aerospace, marine and industrial markets. Independent testing by U.S. Army Combat Capabilities Development Command (DEVCOM) Ground Vehicle Systems Center (GVSC) and Westmoreland validated IperionX Ti-6Al-4V fasteners at performance levels above comparable SAE Grade 8 steel and standard aerospace titanium fastener benchmarks. The results demonstrate that IperionX’s manufacturing pathway can deliver performance as well as cost and supply-chain advantages.
The commissioned SACMI press can operate at up to 24 pressing cycles per minute, equivalent to approximately 11 million single-cavity parts per year under stated operating assumptions before downstream sintering. This establishes a scalable manufacturing pathway for suitable high-volume component categories.
The combination of high performance, lower component weight, corrosion resistance and scalable domestic manufacturing creates a pathway for titanium to substitute into selected applications currently served by high-strength steel.
Defense and industrial components
Current programs include titanium impellers for Carver Pump and U.S. Navy applications, lightweight ground-vehicle components with American Rheinmetall, and development work across track pins, brackets, gears, actuators and other defense and industrial components. These applications value resilience and performance, but also provide repeat-order potential if qualification and production milestones are achieved.
IperionX's integrated powder-to-product route is designed to replace selected cast, forged and extensively machined components with near-net-shape alternatives that can reduce lead times and material loss while retaining high mechanical performance. The commercial advantage arises from the complete manufacturing route, not powder cost alone.
Automotive and consumer electronics
Programs with Ford and consumer-electronics customers demonstrate the flexibility of the platform to supply both titanium powder and manufactured components. These markets also generate high-quality titanium scrap, creating the potential for closed-loop customer relationships in which scrap is returned to IperionX and converted into new products.
Titanium plate and mill products
IperionX is scaling production of titanium plate and large-format military components to extend the product platform beyond engineered parts into plate, sheet, bar and other mill-product pathways, materially broadening the addressable market.
32

Table of Contents
Additive manufacturing and direct powder sales
IperionX produces angular and spherical titanium powders for powder metallurgy and additive manufacturing. Direct powder sales remain part of the product mix, providing customer access and near-term revenue opportunities, while the Company prioritizes conversion into higher-value products where its manufacturing technologies can create the greatest commercial advantage.
A product platform designed to scale
The customer pipeline is increasingly moving beyond material sampling into finished-component validation, prototype purchase orders and funded scale-up programs. Commercialization remains a staged process: customer testing and qualification must be followed by stable manufacturing parameters, repeatable quality and dependable delivery. Near-term execution is therefore focused on delivering current orders, incorporating test feedback, commissioning sufficient HSPT™ capacity and moving priority products toward repeatable production.
Titanium Markets
Titanium and its alloys are used across defense, aerospace, automotive, energy, medical, consumer and advanced industrial markets. The metal's exceptional strength-to-weight ratio, corrosion resistance and high-temperature performance make it technically superior to incumbent materials in many demanding applications.
Today's titanium market reflects the economics of the legacy supply chain: titanium is generally used only where its performance justifies a significant cost premium. IperionX's opportunity is therefore larger than capturing share of the existing market. By lowering end-to-end production cost and scaling near-net-shape manufacturing, IperionX seeks to open applications currently served by high-strength steel, stainless steel and aluminum. Each reduction in cost moves the boundary of where titanium can win on value as well as performance.

2026 IperionX-AR-09 12.jpg
Automotive and transport - Consumer electronics - Aerospace and defense - Energy
Medical - Luxury goods -Industrial - Robotics
33

Table of Contents
IperionX’s Titanium Technologies
IperionX has assembled a portfolio of more than 40 global patents developed and enhanced through over a decade of research and development. The technologies are not isolated inventions; they form an integrated platform spanning mineral and scrap feedstocks, titanium refining, powder production, alloy development, near-net-shape manufacturing and mill products.
The platform provides two complementary feedstock pathways. In the near term, HAMR™ can recycle a broad range of titanium scrap, including high-oxygen material that conventional routes struggle to return to high-value use. Over time, Green Rutile™ and ARH™ can upgrade domestic titanium minerals from Atlas-Titan into high-purity feedstock for HAMR™. Both pathways converge in the same low-cost American powder and product platform.
This architecture addresses the principal constraint on titanium adoption: the cost, complexity and waste embedded across the conventional supply chain.
The incumbent Kroll route requires multiple capital and energy-intensive stages, including chlorination, reduction, vacuum distillation, melting and remelting, followed by extensive hot working and machining. These steps create long lead times, high costs and significant material loss, restricting titanium largely to applications that can absorb a substantial price premium.
IperionX's technologies bypass or shorten major parts of that route. HAMR™ produces low-oxygen titanium powder from recycled or mineral-derived feedstocks; GSD™ creates high-quality spherical powder for additive manufacturing; and HSPT™ and THRM™ convert powder into high-performance products with fewer processing steps and higher material utilization.
The value of the portfolio lies in how the technologies connect. Lower-cost domestic feedstock flows into lower-cost powder; powder is converted into higher-value components and mill products; and process or customer scrap can be recycled back into new titanium. Each link reduces dependence on foreign-controlled supply chains and captures more value within IperionX.
The result is a near-term circular scrap-to-product platform and a longer-term mineral-to-product pathway. Together, they provide IperionX with a differentiated route to re-shore a complete titanium supply chain to the U.S.
IperionX has already demonstrated the integration of these technologies by upgrading titanium minerals from the Titan Project to high-grade +99% TiO₂ feedstock and using that enriched material to manufacture high-quality spherical Ti-6Al-4V powder. Testing confirmed oxygen content that met or surpassed the requirements of industry-standard Grade 5 specifications.
Slide1.jpg
34

Table of Contents
HAMRTM Titanium Technologies
HAMRTM, or Hydrogen Assisted Metallothermic Reduction, is IperionX's foundational titanium refining technology. Originally developed at the University of Utah with funding from the U.S. Department of Energy's Advanced Research Projects Agency-Energy program, HAMR™ provides a direct pathway from titanium oxide or scrap to low-oxygen titanium powder.
The process uses hydrogen to destabilize titanium dioxide, allowing magnesium reduction to occur under thermodynamically favorable conditions. The resulting titanium hydride can then be deoxygenated, alloyed and processed into high-quality titanium powder with controlled chemistry and particle characteristics.
HAMR™ can accept a broad range of feedstocks, including titanium minerals, manufacturing scrap and high-oxygen scrap that we believe is difficult to recycle through conventional routes. This feedstock flexibility is central to IperionX's ability to build a secure, circular and lower-cost domestic supply chain.
By avoiding the need to chlorinate TiO₂ into TiCl₄ and removing vacuum distillation and multiple melting stages, HAMR™ can materially reduce process steps, energy use, capital intensity and emissions. It is the technology that connects recycled scrap and, over time, U.S. titanium minerals to IperionX's downstream product platform.
HSPTTM Titanium Forging Technologies
HSPTTM, or Hydrogen Sintering and Phase Transformation, addresses a central challenge in titanium powder metallurgy: achieving wrought-like mechanical performance without the full cost and complexity of conventional forging and hot working.
Traditional titanium manufacturing typically converts sponge into ingot through repeated melting, then into bar, plate or sheet through energy-intensive forging and rolling. Finished components are subsequently machined from this stock, often generating high levels of scrap and long production lead times.
Powder metallurgy and additive manufacturing can create near-net-shape products with much less waste, but conventional powder routes may not achieve the microstructure and fatigue performance required for demanding applications without further thermomechanical processing.
IperionX's patented HSPT™ technology uses hydrogen-enabled sintering and phase transformation to develop an ultra-fine, wrought-like microstructure. This provides a pathway to high-performance titanium products with superior fatigue properties compared with traditional titanium powder metallurgy methods.
When combined, HAMR™ and HSPT™ connect lower-cost titanium powder directly to high-performance near-net-shape products. THRM™ extends the same phase-transformation principles to plate, sheet, bar and other mill-product pathways.
The commercial significance is fewer manufacturing steps, less machining waste and shorter lead times, while targeting material properties associated with conventionally forged or wrought titanium. This is the bridge between IperionX's powder cost advantage and higher-value customer products.

HSPT Microstructure(1).jpg
Traditional PM Microstructure(1).jpg
Microstructure of IperionX HSPT (5μm) and Traditional Powder Metallurgy (40μm) titanium products.
35

Table of Contents
GSDTM Technologies
GSDTM, or Granulation-Sintering-Deoxygenation, is a patented thermochemical technology designed to produce spherical titanium powders for additive manufacturing. The process provides low oxygen content, controlled particle size and strong flowability while increasing usable powder yield.
Conventional spherical powder methods, including gas atomization, plasma atomization and plasma rotating electrode processing, can produce high-quality powder but often generate relatively low yields within the fine particle-size ranges required by additive manufacturing. That yield loss is an important contributor to the high cost of spherical titanium powder.
GSD™ addresses this constraint by increasing powder yield by up to 50% and providing a potentially more efficient route to additive-manufacturing feedstock. It expands IperionX's addressable product mix and supports both direct powder sales and internally manufactured components.
HAMR™ also offers flexibility in alloy design by introducing alloying elements from oxide feedstocks. This creates a pathway to advanced titanium and metal alloys containing elements such as iron, niobium, zirconium and molybdenum, including compositions that can be difficult to manufacture efficiently through conventional melt processing.
Green RutileTM & ARHTM Technologies
Green RutileTM and ARHTM provide the technology link between IperionX's Tennessee mineral assets and its titanium metal platform. Together, they are designed to upgrade lower-grade U.S. titanium minerals into high-purity feedstock suitable for HAMR™.
The Green Rutile™ process upgrades ilmenite into a higher-grade synthetic rutile titanium product and a purified iron oxide co-product. The iron oxide may have value in metal-alloying applications or as a precursor for lithium iron phosphate batteries.
Most global synthetic rutile production relies on the Becher process, which uses coal as a reductant and operates rotary kilns at temperatures above 1,100°C before removing metallic iron through an aerated salt-solution process.
The Scope 1 and 2 emissions associated with conventional synthetic rutile and titanium slag production are significant, estimated at approximately 3.3 tons and 2 tons of carbon dioxide equivalents (CO₂e) per ton of product, respectively. Green Rutile™ does not use coal as a reductant and, when paired with renewable or low-carbon electricity, has the potential to produce high-quality titanium feedstock with materially lower emissions.
IperionX is advancing plans to scale Green Rutile™ to upgrade ilmenite from the Atlas-Titan platform into a high-quality synthetic rutile product and iron oxide co-product. This would create an additional value-adding step in Tennessee before titanium feedstock enters the metal-production pathway.
ARH™, or Alkaline Roasting and Hydrolysis, can further upgrade rutile and Green Rutile™ into +99% TiO₂ feedstock suitable for HAMR™. This completes the technical pathway from domestic titanium minerals to American-made titanium metal and finished products.
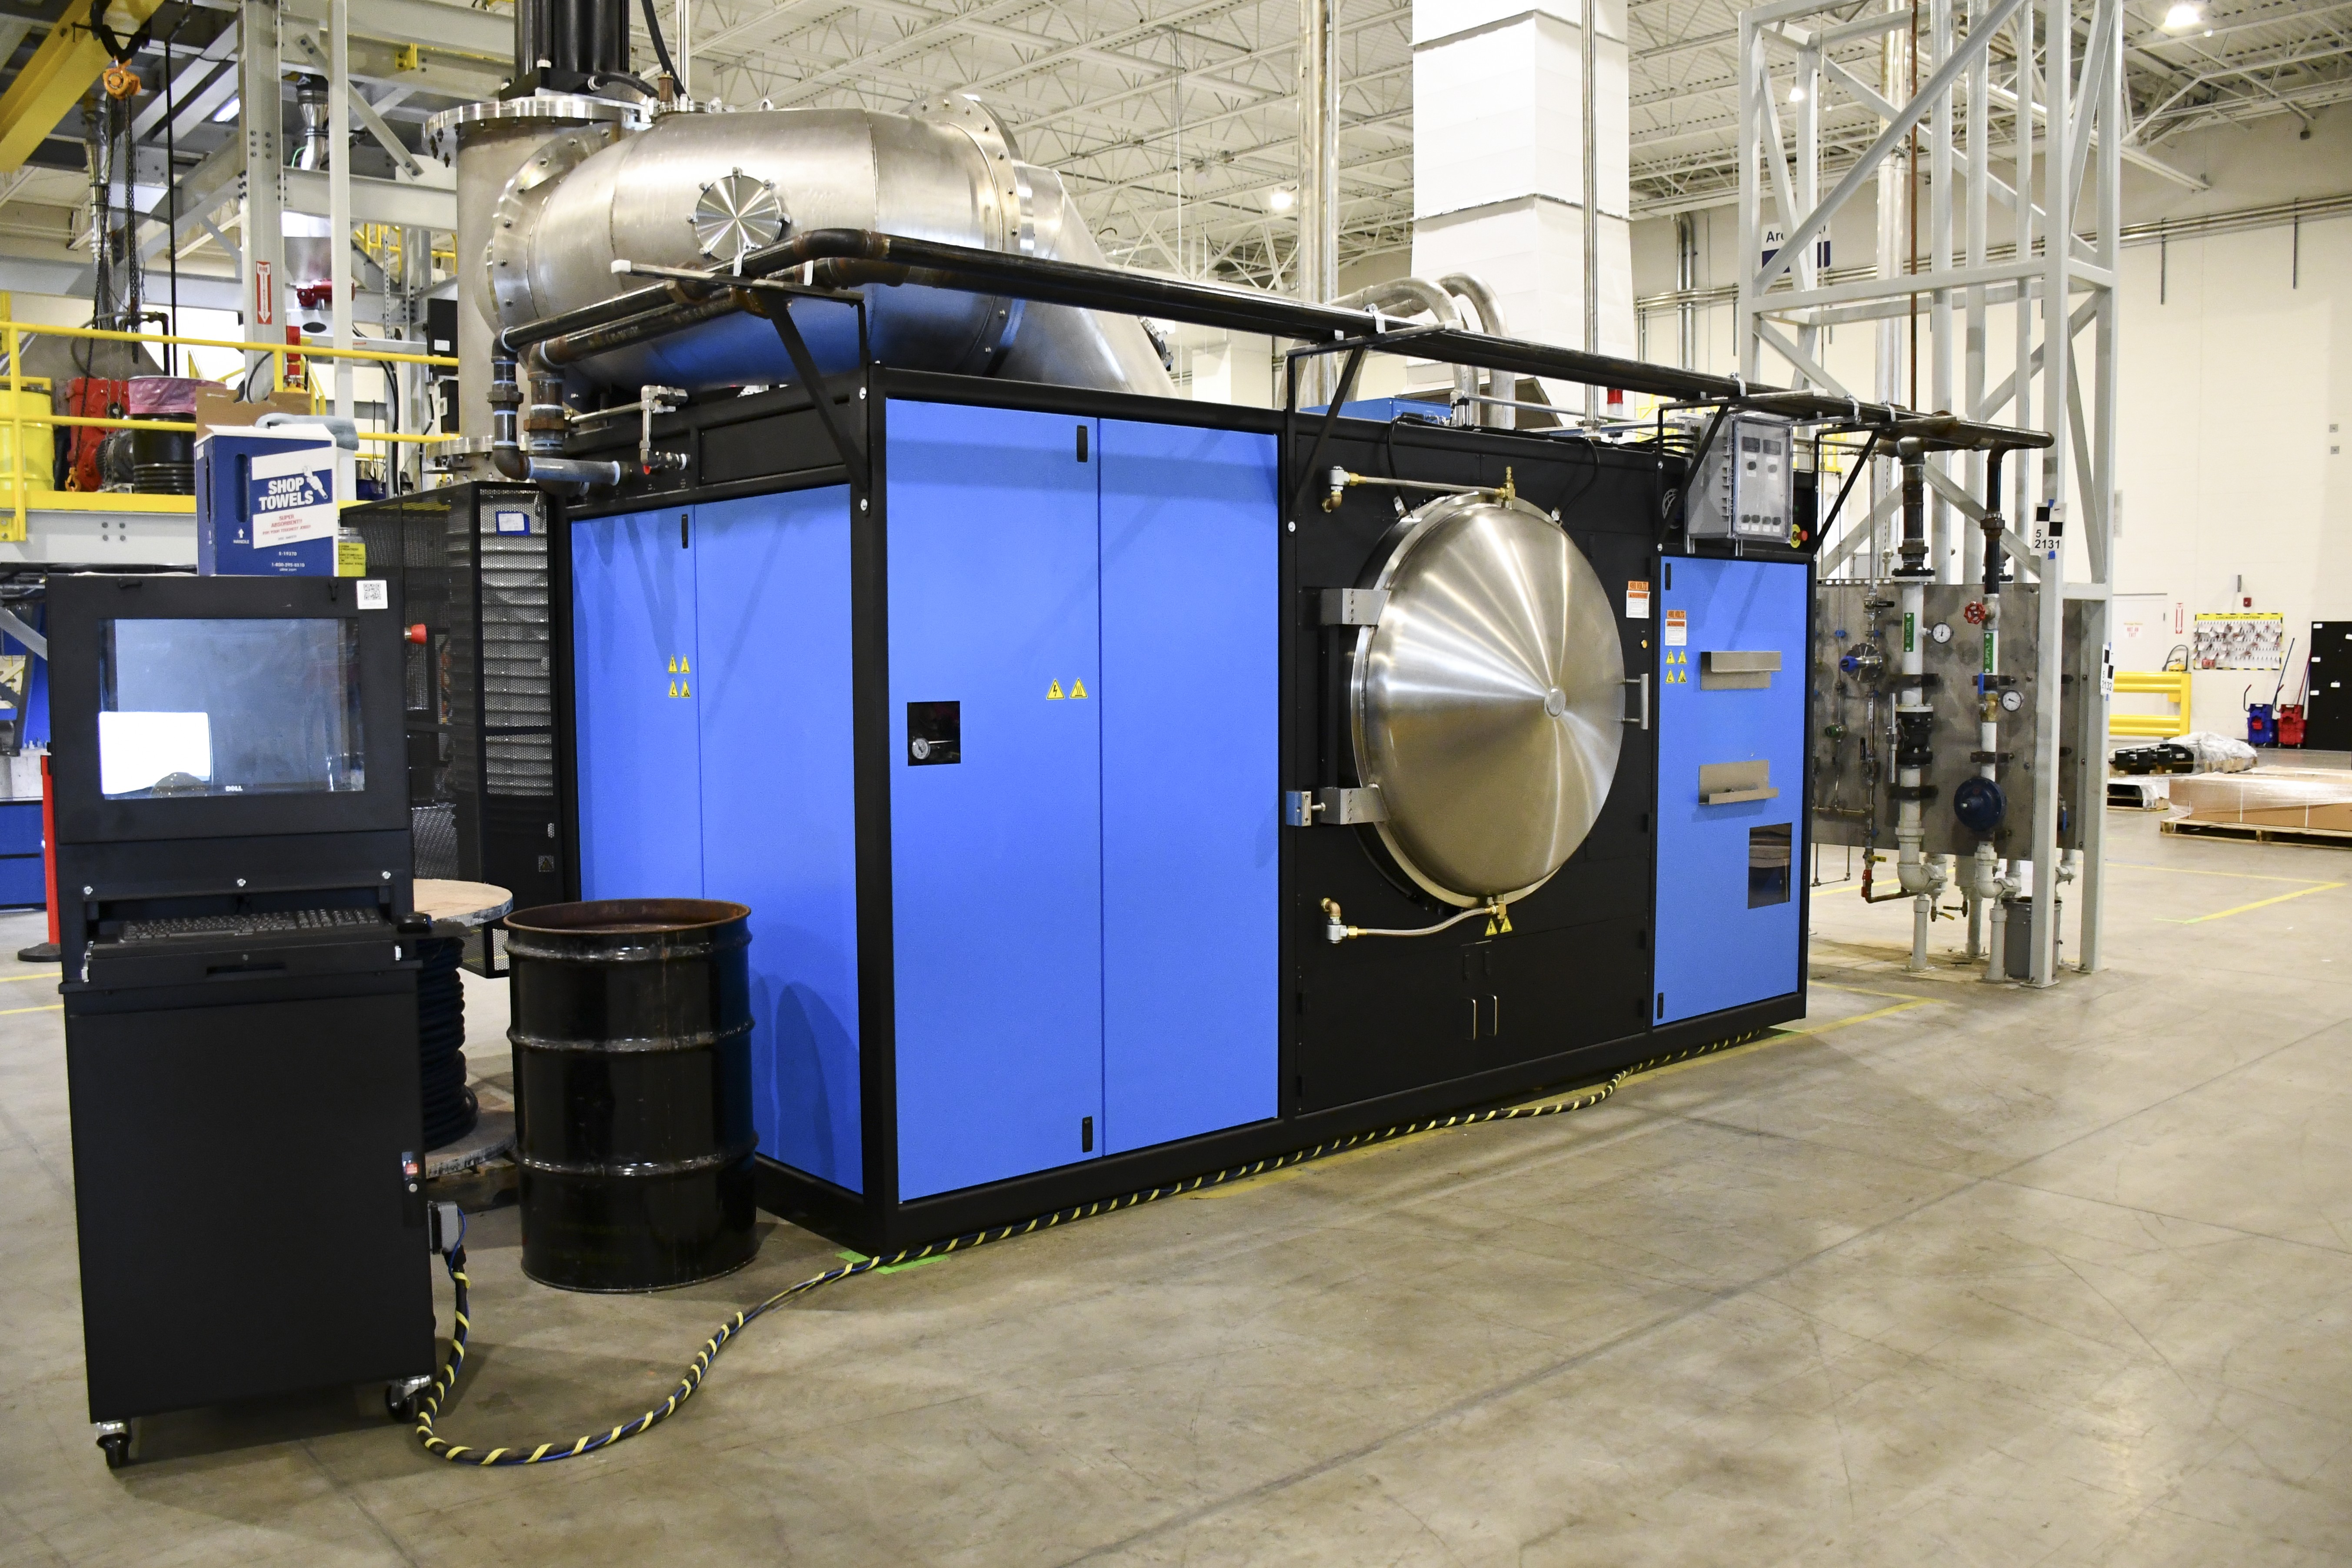
HSPT Furnace (3).jpg
36

Table of Contents
Sustainability
Sustainability as an operating advantage
IperionX was founded to build a lower-cost, lower-carbon and more resilient American titanium supply chain. Sustainability is embedded in that business model rather than treated as a separate objective: recycled feedstocks can lower input cost and reduce import dependence; near-net-shape manufacturing can improve material utilization; renewable electricity can reduce operating emissions; and closed-loop recycling can deepen customer relationships. These attributes strengthen the commercial and strategic case for the platform.
Sustainability governance and disclosures
Sustainability is overseen at Board and executive-management level, with the Sustainability Sub-Committee of the Nominating and Governance Committee coordinating related initiatives, annual reporting and performance goals. Day-to-day sustainability activities are led by the Vice President of Sustainability. IperionX reports its sustainability progress with reference to the Global Reporting Initiative and the Sustainability Accounting Standards Board.
People, safety and communities
IperionX values its employees and the communities in Virginia, Utah and Tennessee in which it operates. Protecting employees, contractors, visitors and local stakeholders is a core operating responsibility and fundamental to successful scale-up. The Company is committed to safe workplaces, compliance with applicable occupational and environmental laws and constructive, long-term relationships with host communities.
Circular titanium technologies
IperionX’s patented technologies can use 100% titanium scrap, including high-oxygen material that many conventional processes cannot readily recycle into high-quality metal. The resulting low-oxygen titanium powder can be manufactured into a broad range of products and, at the end of their useful lives, returned to the same platform as feedstock for future production.
This closed-loop capability can divert valuable titanium from downcycling or disposal and return it to high-value use. It provides customers with a pathway to reduce embedded carbon, improve product circularity and secure domestic feedstock while strengthening IperionX's long-term cost and supply position.
Lower-carbon production
IperionX’s Virginia titanium production platform procures renewable electricity, resulting in zero market-based Scope 2 emissions from purchased electricity. The Company continues to assess and manage Scope 3 emissions, including opportunities to procure lower-carbon process inputs as production scales.
A comparative life-cycle assessment found that 100% recycled spherical titanium powder produced at IperionX's Virginia facility has the potential for a life-cycle carbon footprint as low as 7.8 kilograms of CO₂e per kg of powder. This represents a reduction of more than 90% compared with conventionally produced titanium powder using plasma atomization, estimated at 88.8 kg CO₂e per kg of powder. The combination of lower emissions and domestic circularity can become an important point of differentiation for customers.
UL Certified 100% recycled titanium powder
IperionX's low-carbon titanium metal powder became the first product globally to achieve an Underwriters Laboratories (UL) 2809 Recycled Content Certification Platinum rating for a 100% recycled mono-material, validating that it meets the highest tier of recycled content requirements under the new UL standard introduced during fiscal year 2026. As one of the world's most trusted independent safety and standards organizations, UL provides rigorous third-party verification of product claims. This certification further demonstrates the unique sustainability attributes of IperionX's titanium products and reinforces our commitment to independent validation and transparency.
37

Table of Contents
Responsible mineral development
IperionX is committed to resource efficiency, responsible land management and biodiversity at the Atlas-Titan platform in Tennessee. The near-surface mineral-sands development pathway requires no blasting or hard-rock crushing. A phased approach with progressive reclamation is intended to limit the active disturbance footprint, while work with the University of Tennessee Institute of Agriculture is evaluating restoration methods designed to improve soil fertility and support a biodiverse ecosystem. The objective is to establish a model for responsible American critical-minerals development.
Environmental compliance
IperionX's operations are subject to applicable environmental laws, regulations and permit conditions. Compliance is treated as the minimum operating standard, supported by internal systems and, where applicable, external audits and inspections.
There were no known breaches of applicable environmental requirements by IperionX during the fiscal year ended June 30, 2026.
Our Production Facilities
Titanium Manufacturing Campus – Virginia
The Titanium Manufacturing Campus in South Boston, Virginia comprises the TPF and the Advanced Manufacturing Center (AMC). During fiscal year 2026, titanium powder operations transitioned to a 24/7 schedule, producing angular and spherical powders for customer qualification, direct powder requirements and downstream product manufacturing.
The TPF supplies the AMC, where IperionX uses powder metallurgy, HSPT™ / THRM™ and additive manufacturing to produce near-net-shape components, mill products and other high-value titanium products. The commissioned SACMI press and additional HSPT™ furnaces materially expand downstream capacity and product flexibility.
Titanium Production Facility – from commissioning to 24/7 operations
The first HAMR™ titanium deoxygenation run at the Virginia facility was completed in August 2024, followed by the first end-to-end commercial production cycle in December 2024. All critical production systems were fully commissioned in September 2025, completing the transition from construction and commissioning into commercial operations and ramp-up.
The initial production run used 100% Ti-6Al-4V scrap and reduced oxygen content from 3.42% to below 0.07%, compared with the American Society for Testing and Materials maximum of 0.20% for Grade 5 titanium. During fiscal year 2026, HAMR™ production continued to meet or exceed Grade 5 quality parameters.
IperionX remains focused on achieving an annualized production run rate of approximately 200 tpa, equivalent to 16.7 metric tons per month, by the end of 2026, subject to completion of ramp-up and operating optimization. GenX™ development continues as a longer-term continuous-production pathway and is not required for the current ramp.
The Virginia scale-up program is designed to expand titanium powder capacity to approximately 1,400 tpa and, over time, support IperionX’s objective of more than 10,000 tpa of high-performance titanium components by 2030.
Advanced Manufacturing Center – High-performance Titanium Product Manufacturing
The AMC applies IperionX’s titanium powder, powder metallurgy, HSPT™ / THRM™ and additive manufacturing capabilities to produce near-net-shape components, mill products and other high-performance titanium products.
During fiscal year 2026, IperionX commissioned the 300-ton, six-axis SACMI powder metallurgy press and commenced installation of additional HSPT™ sintering capacity. These investments are intended to support customer qualification, low-rate initial production and higher-volume manufacturing.
1.The SACMI press triples existing powder metallurgy capacity, improves repeatability and geometry control, and can operate at up to 24 pressing cycles per minute, equivalent to approximately 11 million single-cavity parts per year under stated operating assumptions before downstream sintering.
38

Table of Contents
2.Additional HSPT™ furnaces are expected to relieve a downstream production constraint, increase throughput and provide greater scheduling flexibility across customer and product-development programs.
Independent U.S. Army and third-party testing of IperionX Ti-6Al-4V fasteners provided product-level validation of the manufacturing platform, with yield torque up to approximately 20% above comparable SAE Grade 8 steel benchmarks and tensile strength approximately 15% above standard aerospace titanium fastener benchmarks.
The AMC is being expanded in parallel with powder production so that a greater proportion of output can be converted into higher-value products where IperionX’s integrated process can provide the strongest commercial advantage.
Industrial Pilot Facility – Utah
The Salt Lake City facility has produced angular and spherical titanium powders and supported customer prototyping since 2019. It was the industrial pilot platform used to develop and validate the technologies before commercial-scale deployment in Virginia.
Following the commissioning of Virginia operations, the Utah facility has been repurposed and expanded to approximately 15,000 square feet as a research and development center focused on HSPT™, THRM™, titanium plate, other mill products and additional titanium alloy and product pathways.
Re-shoring U.S. Critical Mineral Production with Atlas-Titan
IperionX plans to use recycled titanium scrap as the principal near-term feedstock for Virginia. Over the longer term, the Group intends to evaluate integration of upgraded titanium mineral feedstocks from the Atlas-Titan platform in Tennessee.
The Titan DFS completed in June 2026 defined an initial 14-year staged development producing HREC, ilmenite, rutile and zircon concentrate from a single domestic resource. The Study delivered an after-tax NPV₈ of $813 million, an after-tax IRR of 39.4% and forecast after-tax free cash flow of $1.9 billion.
Subsequent to year-end, IperionX completed the Atlas acquisition adjacent to Titan for $3.0 million. Atlas adds high-grade surface stockpiles, pre-stripped Lower McNairy mineralization and established utilities and rail infrastructure, creating the potential for an accelerated and lower-capital integrated development pathway.
The U.S. DoW allocated $5.0 million of the IBAS award to the Titan DFS. IperionX is advancing drilling, mineralogy, metallurgy, commercial qualification and an integrated Atlas-Titan economic study targeted for completion by the end of 2026, together with engagement on potential U.S. Government funding pathways.
39

Table of Contents
The Titan Project’s Mineral Resources are as follows:
Titan Project - Mineral Resources
at the End of the Fiscal Year Ended June 30, 2026
Based on Prices Set Forth in Footnote 3 Below
Resource
Category
In situ Metric TonsGrade
(THM
%)
THM
(million
metric tons)
Cut-off
grade
(THM
%)
THM assemblage
Zircon
(% of
THM)
Rutile
(% of
THM)
Ilmenite
(% of
THM)
REE
(% of
THM)
Measured96,851,0001.51.50.410.49.240.11.2
Indicated102,190,0002.02.00.49.810.238.91.5
Measured and Indicated199,041,0001.83.50.410.09.839.41.4
Inferred97,832,0001.81.80.49.39.638.01.2
Total296,872,0001.85.30.49.89.739.01.3
1.Mineral resources are reported using the definitions set out in Regulation S-K 1300 and are current as at June 30, 2026. Mineral resources are reported exclusive of the mineral reserves.
2.The third-party firm responsible for the estimate is Marshall Miller & Associates, Inc.
3.Mineral resources are reported within a conceptual pit shell that uses the key Optimization Parameters summarized in Item 4D Property - Optimization Parameters.
4.Mineral resources are reported above a cut-off grade of 0.4% THM.
5.Property contains 199.0 Mt of mineral resources (Measured + Indicated) exclusive of mineral reserves.
6.Estimates may not foot due to rounding.
The Titan Project’s Mineral Reserves are as follows:
Titan Project Mineral Reserves
at the End of the Fiscal Year Ended June 30, 2026
Based on Prices Set Forth in Footnote 3 Below
UnitGrand Total ROM Metric TonsTHM assemblage
THMTHMZirconRutileIlmeniteREE
ProvenProbableTotal(%)(t)(%)(%)(%)(%)
Upper McNairy24,565,000 2,415,000 26,980,000 2.3620,000 6.26.223.60.2
Lower McNairy68,740,000 21,307,000 90,047,000 3.433,086,000 12.710.548.31.9
Total93,306,000 23,722,000 117,027,000 3.23,706,000 11.69.844.21.6
1.Mineral reserves are reported using the definitions set out in Regulation S-K 1300 and are current as at June 30, 2026. Mineral reserves are reported on a ROM basis.
2.The third-party firm responsible for the estimate is Marshall Miller & Associates, Inc.
3.Mineral reserves are reported within a finalized mine design pit shell that uses the key Optimization Parameters summarized in Item 4D Property - Optimization Parameters.
4.Mineral reserves are reported above a COG of 0.85% THM.
5.Ilmenite includes leucoxene, pseudorutile, and ilmenite and REE includes monazite, xenotime, and unclassified REE.
6.Estimates may not foot due to rounding.

40

Table of Contents
Our Strategies
The objective of the Group is to create long-term shareholder value by combining its patented titanium technologies to continue to scale a low-cost titanium supply chain business in the U.S. and, in time, globally.
IperionX has transitioned from a pilot scale to be a commercial producer of 100% recycled titanium metal products in the U.S., based on the Virginia Titanium Manufacturing Campus. IperionX produces low-cost and high-quality angular and spherical titanium powder, which is used to produce near-net-shape and final titanium parts through powder metallurgy or additive manufacturing. These technologies provide IperionX with a sustainable competitive advantage and significant value uplift from upgrading raw titanium materials through to finished high-performance titanium products when compared to traditional titanium industry supply chains.
To achieve its objective, the Group currently has the following business strategies and prospects over the medium to long-term:
•commercialize the Technologies to produce titanium metal and metal powders for key markets, including consumer electronics, aerospace, defense, medical, bicycles, additive manufacturing and automotive;
•continue to investigate alternative applications of the Technologies to additional value-added metal closed-loop production capabilities, including zircon and synthetic rutile, and the potential production of rare earth elements;
•continue discussions with current and potential customers and strategic partners for future production and sale of titanium metal products, titanium minerals and other critical minerals, including, but not limited to, rare earth elements;
•continue to expand IperionX’s critical mineral land position in the U.S., explore for additional critical minerals and secure final permit and zoning approvals;
•continue the development of the Atlas-Titan project, with an integrated economic assessment targeted for completion by the end of 2026. The combination has the potential to reduce upfront capital and operating costs and accelerate first production relative to a standalone Titan development; and
•vertically integrate the Technologies with titanium material feedstocks from the Titan Project to develop an end-to-end U.S.-based titanium and critical mineral supply chain.
These activities are inherently risky and the Board is unable to provide certainty of the expected results of these activities, or that any or all of these likely developments will be achieved. The material business risks faced by the Group that could have an effect on the Group’s future prospects, and how the Group manages these risks, include:
Mineral development risk – The exploration for, and development of, mineral deposits involves a high degree of risk. Few properties that are explored are ultimately developed into producing mines. To mitigate this risk, the Company will undertake systematic and staged exploration and testing programs on its mineral properties and, subject to the results of these exploration programs, the Company will then progressively undertake a number of technical and economic studies with respect to its projects prior to making a decision to mine. However there can be no guarantee that the studies will confirm the technical and economic viability of the Company’s mineral properties or that the properties will be successfully brought into production;
Capital and funding risk – Future expansion of the Company’s titanium facilities and any future development of the Company’s mineral properties will require substantial additional financing. Failure to obtain sufficient additional financing may result in delay or postponement of further development of the Company’s titanium facilities and/or mineral properties or even a loss of property interest. There can be no assurance that additional capital or other types of financing will be available if needed or that, if available, the terms of such financing will be favorable to the Company;
Commodity price risk – The price of titanium metal and other critical minerals, including titanium feedstocks, rare earth elements, silica sand and zircon fluctuate widely and are affected by numerous factors beyond the control of the Group. Future production from the Group’s titanium metal facilities or mineral properties will be affected by commodity prices being adequate to make these facilities or properties economic. The Group currently does not engage in any hedging or derivative transactions to manage commodity price risk. As the Group’s operations change, this policy will be reviewed periodically going forward; and
41

Table of Contents
Competition risk – The Group competes with other domestic and international companies in the titanium technology and critical minerals industries, some of whom have larger financial and operating resources. Increased competition could lead to higher supply or lower overall pricing. There can be no assurance that the Company will not be materially affected by increased competition. In addition, while the Group is continuing to secure additional surface and mineral rights, there can be no guarantee that the Group will succeed in these efforts, which could affect the results of the Group’s operations.
Strategic Advantages
IperionX's advantage is not a single technology or asset; it is an integrated system. Patented process technologies, feedstock flexibility, closed-loop recycling, U.S. Government partnership, customer-qualified product pathways and vertical integration from mineral or scrap to finished product reinforce one another. The result is a platform that is difficult to replicate and whose economic and strategic advantages are designed to compound as it scales.
An integrated flywheel; from domestic feedstock to finished product
HAMR™ can use a broad range of titanium scrap and mineral-derived feedstocks to produce high-quality titanium powder while bypassing chlorination, vacuum distillation and multiple melting steps. This reduces process complexity and energy intensity, increases material utilization and enables more titanium scrap to remain within a high-value domestic supply chain.
HSPT™ and THRM™ are non-melt thermal and phase-transformation technologies that develop refined, wrought-like microstructures and high mechanical performance without the full conventional forging and hot-working route.
Combined with powder metallurgy and additive manufacturing, these technologies convert lower-cost domestic powder into near-net-shape components and mill products with less waste and shorter lead times. Each downstream step captures more value, while process scrap can be returned to HAMR™ and recycled into new titanium.
IperionX's Green Rutile™ and Alkaline Roasting and Hydrolysis™ (ARH™) mineral-upgrading technologies provide the connection to the Atlas-Titan platform. They offer a future pathway to convert U.S. titanium minerals into high-purity feedstock suitable for HAMR™, completing a fully integrated American mineral-to-product titanium supply chain.
Commercial-scale capability; execution becomes the value driver
Following more than a decade of research, pilot operations and industrialization, IperionX's Virginia campus has demonstrated the commercial-scale capability of HAMR™. Operations transitioned to a 24/7 schedule during fiscal year 2026, and powder production consistently met or exceeded Grade 5 quality parameters. IperionX continues to target an annualized run rate of approximately 200 tpa by the end of 2026, subject to ramp-up and operating optimization. The principal value drivers are now throughput, yield, reliability, product qualification and customer conversion.
Scaling product capacity around low-cost titanium powder
The 300-ton, six-axis SACMI powder metallurgy press was commissioned in May 2026, tripling IperionX's existing powder metallurgy capacity and expanding the range, complexity and repeatability of near-net-shape components that can be manufactured in Virginia. Its high-cycle capability also creates a pathway toward materially higher-volume production for suitable component geometries.
The first of two additional HSPT™ sintering furnaces arrived during the quarter ended June 30, 2026 and entered installation and commissioning, with further furnace capacity expected to follow. These assets are designed to expand throughput, relieve downstream constraints and move customer programs from prototype production toward qualification, low-rate initial production and repeatable manufacturing.
The current platform supports the expansion toward approximately 1,400 tpa and the longer-term target of more than 10,000 tpa of high-performance titanium components by 2030. GenX™, IperionX's next-generation continuous HAMR™ development platform, provides additional long-term upside through the potential for higher throughput, lower cost and improved capital efficiency; it is not required for the current 200 tpa ramp.
42

Table of Contents
Titan and Atlas: a second, high-value American platform
The Titan Critical Minerals Project in Tennessee, with key mine-area permits already in place, is a district-scale domestic resource of titanium minerals, zircon and rare earth-bearing minerals. In June 2026, IperionX completed a U.S. Government-supported DFS based entirely on Proven and Probable Mineral Reserves, establishing a technically defined development pathway and compelling project economics.
Titan is designed to produce a heavy rare earth concentrate (HREC) containing strategically important dysprosium, terbium and yttrium, together with ilmenite, rutile and zircon concentrate. These products address upstream supply gaps for U.S. defense, permanent magnets, advanced manufacturing and titanium metal supply chains. Titan is therefore both a standalone critical-minerals opportunity and the upstream cornerstone of IperionX's longer-term mineral-to-product strategy.
The DFS delivered an after-tax NPV₈ of $813 million, an after-tax IRR of 39.4%, a 3.6-year payback and forecast after-tax free cash flow of $1.9 billion over an initial 14-year mine plan. We believe these economics create material standalone value before considering the strategic benefits of integration with IperionX's downstream titanium platform.
Atlas Acquisition can accelerate and enhance the upstream pathway
On June 15, 2026, IperionX entered into an agreement to acquire mineral, property and infrastructure assets from Covia Solutions LLC adjacent to Titan for $3.0 million. The acquisition, previously referred to as the Camden acquisition and now named Atlas, was completed subsequent to year-end on July 1, 2026. The modest acquisition cost provides IperionX with control of assets that have the potential to materially improve the sequencing and economics of the broader development pathway.
Atlas adds approximately 70 acres of at-surface, historically processed critical-mineral stockpiles; approximately 180 acres of pre-stripped Lower McNairy mineralization; mineral and property rights; mining and processing equipment; and established grid power, industrial water, natural gas and heavy-haul rail infrastructure. These features have the potential to reduce the time, capital and operating complexity required to establish initial production.
Atlas and Titan are located within the same McNairy mineral-sand system and are highly complementary. Titan provides a permitted, district-scale resource and defined project economics; Atlas adds high-grade stockpiles, pre-stripped mineralization and established infrastructure.
IperionX is advancing sonic drilling, stockpile surveys, mineral assemblage and metallurgical test work, commercial qualification and an integrated economic assessment targeted for completion by the end of 2026. The combination has the potential to reduce upfront capital and operating costs, accelerate first production and improve overall economics relative to a standalone Titan development.
The integrated Atlas-Titan platform strengthens IperionX's ability to connect Tennessee feedstocks containing titanium, zircon and heavy rare earth-bearing minerals with downstream U.S. processing, titanium metal production and advanced manufacturing. It also gives shareholders exposure to a critical-minerals platform with development value distinct from the pace of the Virginia titanium ramp.
U.S. Government support to accelerate our growth plans
The U.S. government has invested significant resources to re-shore to the U.S. a secure domestic titanium supply chain. As of June 30, 2026, IperionX’s U.S. Government support includes the $12.7 million DPA Title III award, the fully obligated $47.1 million IBAS award, and the SBIR Phase III contracting pathway of up to $99 million.
DPA Title III funding of Equipment for Virginia Titanium Manufacturing Facilities
In October 2023, IperionX executed a $12.7 million contract in funding under the U.S. DoW DPA Title III authorities to address the U.S. titanium supply chain vulnerabilities. The government share will be matched with $13.4 million in funding from IperionX, for a total funding amount of $26.1 million. This funding is being applied towards the Group’s TPF in Virginia. The agreement has an initial term of 39 months, scheduled to terminate on January 30, 2027, and provides that it may be extended by mutual agreement. Under the agreement, the Company and the U.S. government have agreed to use
43

Table of Contents
best efforts to achieve the goals of the agreement, which include the Company conducting a research and development program with respect to titanium technology.
Pursuant to the terms of the agreement, the cost principles applicable to the agreement are contained in 2 CFR 200, Subpart E, Cost Principles. Costs must meet the following criteria to be allowable under federal awards: (i) be necessary and reasonable for the performance of the awards; (ii) conform to any applicable limitations or exclusion as to types and amounts; (iii) be consistent with policies and procedures that apply uniformly to both federally financed and other activities of the recipient; (iv) be accorded consistent treatment; (v) be determined in accordance with generally accepted accounting principles; (vi) not be included as a cost or used to meet cost sharing requirements of any federally-financed program in the current or prior period; (vii) be adequately documented; and (viii) in relation to administrative close out costs, be incurred until the due date of the final report. Additionally, the Company uses the Federal Acquisition Regulation Part 31 and its internal regulations entitled “unallowable Cost Policy” to determine which costs are reimbursable. To the extent designated as the government’s share, the Company is entitled to request reimbursement from time to time of the cost to purchase.
As of June 30, 2026, the Company procured assets on behalf of the government that cost approximately $12.7 million, of which $2.4 million was invoiced in 2026 (2025: $4.0 million), (2024: $6.3 million). We received cash reimbursements for the reimbursement of equipment from the U.S. DoW of nil during the twelve months ended June 30, 2026 (2025: $5.6 million) (2024: $4.7 million). The remaining $2.4 million receivable was reimbursed subsequent to year end.
Title to all equipment and real property acquired with federal funds vests with the government throughout the agreement. The government can elect to, but is not obliged to, transfer such title to all or a portion of the equipment or real property to the Company at the end of the agreement, which is scheduled to terminate on January 30, 2027, if the Company’s performance is satisfactory and provided that (a) the Company has used the equipment or real property for the authorized purposes of the project funding until funding for the project ceases, (b) the Company has not encumbered the equipment or real property without approval of the government, and (c) the Company has otherwise complied with the terms of the agreement. All equipment acquired with federal funds is tagged and segregated from equipment acquired with Company funds using a Property Control List that tracks all equipment purchased under the agreement. The Property Control List is submitted quarterly to the government and includes a description of the equipment, an asset number, manufacturer's serial number, ordered date, received date, installed date, location of the asset, and disposition date (if applicable). When the equipment arrives at our Virginia facility, it is tagged with an identification tag marked “Property of the Government of the United States” and which also included the serial number, asset number, and date received.
Through June 30, 2026, the Company used government funds primarily to acquire equipment used to produce titanium powder from recycled sources of scrap at the construction site. The assets acquired are designed to establish, outfit and operationalize the TPF in accordance with the Statement of Work included in the DPA agreement. Although these assets are integral to the operation of the TPF, if the U.S. government does not relinquish these assets to the Company at the end of the agreement, the Company would seek to acquire or lease such equipment from the government, replace such equipment with new equipment using the Company’s existing cash reserves, or consider other options. See “Item 3. Key Information - D. Risk Factors.”
IBAS Funding to Advance the Titan Critical Mineral Project
In February 2025, the Company was awarded up to $47.1 million by the U.S. DoW to strengthen the U.S. Defense Industrial Base by accelerating the scale-up of a resilient, low-cost, and fully-integrated U.S. mineral-to-metal titanium supply chain. The program will be matched with $49.2 million in funding by IperionX, for a total funding amount of $96.3 million. This funding aims to bolster the U.S. defense industrial base by developing a fully integrated, low-cost titanium supply chain sourced domestically. The project scope under the IBAS program had been revised to prioritize accelerated expansion of IperionX’s titanium metal and manufacturing production capacity at IperionX’s Virginia Titanium Manufacturing Campus.
As part of the initial phase, the DoW obligated $5.0 million, and IperionX contributed $1.0 million, to expedite the Titan Project in Tennessee to ‘shovel-ready’ status, an important milestone in securing a new domestic source of titanium, rare earths and zircon critical minerals. Government reimbursements provided as grants are subject to conditional funding provisions. Grants for the initial phase are recognized as “Other income and expenses” in the consolidated statements of profit or loss and other comprehensive income (loss), once all conditions for reimbursement are met.
44

Table of Contents
The DoW obligated an additional $12.5 million in August of 2025, $25.0 million in September of 2025 and $4.6 million in January of 2026, through the IBAS program to purchase orders for long-lead, major capital equipment required for the next stage of capacity scale-up to approximately 1,400 metric tons per year at the Virginia Titanium Manufacturing Campus.
As of June 30, 2026, the entire $47.1 million has been obligated by the DoW. Of that, the Company has incurred costs of $5.0 million toward the Titan Project DFS and has requested reimbursements from U.S. DoW in the amount of $4.1 million (2025: $0.9 million) which is recognized as “Other income and expenses” in the consolidated statements of profit or loss and other comprehensive income. We have received cash reimbursements from the U.S. DoW of $4.6 million during the twelve months ended June 30, 2026. (2025: $0.1 million).
SBIR Phase III
In June 2025, IperionX received the first task order for $1.3 million from the U.S. Army under a SBIR Phase III Indefinite Delivery Indefinite Quantity contract with the U.S. DoW. The task order facilitates the purchase of equipment to aid in the production and delivery of titanium parts for U.S. Army ground programs. The SBIR Phase III IDIQ contract provides a contracting pathway for project-specific task orders for low-cost domestic titanium for defense applications up to a ceiling of $99 million.
As of June 30, 2026, the Company has procured assets on behalf of the government that cost approximately $0.3 million (2025: nil). We expect to utilize the remaining $1.0 million of available funding by the end of fiscal year 2027.
In addition, subsequent to year end, IperionX received Task Order 2 under its U.S. Army SBIR Phase III contract for Low-Cost, Domestic Titanium for Defense Applications that has a based value of $18.5 million, with options up to $25.4 million, and builds upon the previously announced $1.3 million task order, lifting the aggregate potential value of task orders issued under the Company’s $99 million SBIR Phase III contract up to $26.7 million.
The criteria that defines permissible expenditures for IBAS Funding and SBIR Phase III are the same as the DPA Title III program mentioned above (the cost principles contained in 2 CFR 200, Subpart E, Cost Principles, and the cost principles or standards in accordance with 32 CFR 37.625).
A range of other U.S. Government funding opportunities is also available as potential funding sources for further scale-up and these are currently being actively progressed.
The DPA Title III and IBAS awards are reimbursable programs under which IperionX generally incurs eligible expenditure and subsequently seeks reimbursement following claim review and approval. This creates timing differences between program expenditure and associated cash receipts.
ProgramAwardObligatedReimbursed
to date
Remaining reimbursable fundingIncurred, not yet reimbursed
DPA Title III$12.7m$12.7m$10.3m$2.4m$2.4m
IBAS$47.1m$47.1m$12.4m$34.7m$0.5m
Total program$59.8m$59.8m$22.7m$37.1m$2.9m
ContractContract ceilingTask orders receivedContract balance
SBIR Phase IIIUp to$99.0m$19.8mUp to$79.2m
Customer and Product Programs
Carver Pump – U.S. Navy impeller prototypes
On December 15, 2025, IperionX announced an initial purchase order of approximately $100,000 from Carver Pump for four prototype titanium impellers for pumps on U.S. Navy surface vessels. During the quarter ended June 30, 2026, IperionX advanced production of the prototypes. Each component can be produced in less than one week, compared with conventional casting lead times that often exceed 12 months, and successful validation could support larger production programs.
45

Table of Contents
American Rheinmetall – U.S. Army ground-vehicle components
In January 2026, IperionX received a $0.3 million prototype purchase order from American Rheinmetall for 700 lightweight titanium components for U.S. Army heavy ground combat systems. The components are produced from 100% recycled titanium using HAMR™ and HSPT™ technologies, targeting weight reductions of approximately 40–45% per component compared with incumbent steel parts.
The program targets lower vehicle weight, improved mobility, corrosion resistance and supply-chain resilience. Successful delivery and validation of the initial scope may provide a pathway to larger-scale production opportunities.
Fasteners, Ford and other customer programs
Independent testing by U.S. Army DEVCOM GVSC and Westmoreland validated IperionX Ti-6Al-4V fasteners at performance levels above comparable SAE Grade 8 steel and standard aerospace titanium fastener benchmarks.
In addition, the U.S. Army extended the fastener program through a prototype purchase order for the JLTV and associated trailer. Other active programs include automotive components for Ford, consumer-electronics powder qualification and additional defense, aerospace and industrial products.
The customer pipeline is increasingly moving from material samples into finished-component testing, prototype purchase orders and funded scale-up programs, providing clearer milestones toward low-rate and potentially longer-duration supply arrangements.
Near-term execution is focused on delivering current orders and prototypes, incorporating customer test feedback, commissioning sufficient HSPT™ capacity and establishing repeatable manufacturing parameters for priority products.
The developing product portfolio includes fasteners, impellers, track pins, brackets, gears, actuators, enclosures, titanium plate and other mill products, together with angular and spherical titanium powders.
Competition
IperionX’s principal competition is the high-carbon, high-cost incumbent titanium and critical mineral producers outside of the U.S., including from China and Russia. Many of our competitors have been in business longer than we have and have established more strategic partnerships and relationships and have greater financial accessibility than we have.
While we compete with other companies in the metals and natural resource space, we believe that there may be interested customers for our critical materials, including titanium metal, titanium minerals and rare earth minerals, if we can successfully develop the Titan Project. The price of metals and minerals can be affected by factors beyond our control, including:
•Fluctuations in the market prices for critical materials, titanium metal, titanium minerals and rare earth minerals;
•Fluctuating supplies of critical materials, titanium metal, titanium minerals and rare earth minerals;
•Fluctuating demand for critical materials, titanium metal, titanium minerals and rare earth minerals; and
•Metals and extraction activities of others.
EXPLORATION RESULTS
Since securing the initial Titan Project land position in late-2020, we have focused on proving the project’s potential. We have conducted multiple drilling programs at the Titan Project, with the most recent study comprising 156 drill holes, including 140 roto-sonic drill holes totaling approximately 5,644 meters (18,517 feet) and 16 reverse circulation drill holes totaling approximately 837 meters (2,746 feet). Across the broader Titan property, IperionX has drilled 313 holes totaling approximately 11,382 meters (37,343 feet). All drilling used in the Mineral Resource estimate was sonic drilling. Reverse circulation holes, hydrogeological holes and geotechnical holes were excluded from Mineral Resource estimation where appropriate due to concerns over sample representativeness or because the holes were drilled for purposes other than resource estimation.
46

Table of Contents
On June 4, 2026, IperionX announced the results of the DFS for its 100%-owned Titan Critical Minerals Project near Camden, Tennessee. The Study confirms Titan as a large-scale, technically robust and high-return project designed to produce titanium minerals, zircon and a HREC from a single domestic resource.
The DFS was prepared in accordance with S-K 1300 and considered mining, processing, metallurgical, infrastructure, economic, marketing, legal, environmental, social and governmental factors.
See “Item 4. Information on the Company – D. Property, Plant and Equipment” for additional information relating to the Titan Project, including the relevant exploration results, which information is incorporated by reference.
EXPLORATION AND DEVELOPMENT PLANS
We are required by ASX Listing Rules to report ore reserves and mineral resources in Australia in compliance with the Australasian Code for Reporting of Exploration Results, Mineral Resources and Ore Reserves (the JORC Code 2012 Edition) prepared by JORC. In contrast, the SEC generally requires disclosure of extraction reserves in accordance with S-K 1300.
The Titan DFS reports proven and probable mineral reserves as defined under both JORC and S-K 1300. We are a development stage issuer as defined under S-K 1300. See “Cautionary Note to United States Investors.” As of the reporting date, management has not yet committed to proceed with development. Advancement of these projects remains dependent upon securing adequate financing and/or a strategic development partner, as well as management's final approval to proceed. Accordingly, the related expenditures continue to be classified as exploration and evaluation. See Note 1(k) in the accompanying financial statements to this Annual Report for further discussion.
We are incorporating by reference the Technical Report Summary on Feasibility Study for the Titan Project, dated June 4, 2026, which supports our Mineral Resource and Mineral Reserve estimates.
Titan is a near-surface, free-dig mineral sands project using conventional wet concentration, flotation and dry mineral separation, with no blasting or hard-rock crushing. Key mine-area permits and established regional infrastructure support a staged development pathway. The HREC contains strategically important dysprosium, terbium and yttrium.
The initial 14-year production target is based entirely on Proven and Probable Mineral Reserves, with no Inferred Mineral Resources included. Titan provides a potential domestic upstream source of titanium, heavy rare earth and zircon critical minerals that can complement IperionX’s downstream Virginia titanium platform.
The DFS production targets and financial forecasts remain subject to the assumptions, qualifications and risks set out in the June 4, 2026 announcement. Development requires financing, procurement, construction, commissioning, operating performance and other approvals and conditions consistent with those assumptions, including final approval by management and our Board of Directors. Although the DFS includes a defined mine plan, we have not approved project development, secured the financing necessary to proceed with construction or commenced mine construction.
On June 15, 2026, IperionX entered into an agreement to acquire key mineral, property and infrastructure assets from Covia Solutions LLC adjacent to Titan for $3.0 million. The transaction, previously referred to as the Camden acquisition and now named Atlas, was completed subsequent to year-end on July 1, 2026.
Atlas is located within the same McNairy mineral-sand system as Titan and provides several potential development advantages:
•Additional feedstock optionality from high-grade, historically processed surface stockpiles;
•Potential access to pre-stripped Lower McNairy mineralization and integrated mine planning with Titan;
•Established industrial infrastructure that may reduce development complexity, capital requirements and time to first production; and
•Potential recovery of titanium minerals, zircon and heavy rare earth-bearing monazite and xenotime containing dysprosium, terbium and yttrium.
IperionX is advancing sonic drilling, stockpile and pre-stripped-zone evaluation, detailed mineral assemblage and metallurgical test work, commercial qualification and an integrated Atlas-Titan economic assessment targeted for
47

Table of Contents
completion by the end of 2026. The combination has the potential to reduce upfront capital and operating costs and accelerate first production relative to a standalone Titan development.
Subject to market conditions and our ability to secure funding, our separate business plan for the Titan Project is to become a strategic, U.S. domestic source of high-quality and sustainable titanium and other critical mineral feedstocks, including rare earths, to the U.S. The titanium minerals could form an important sustainable feedstock for the Technologies and assist in the scale-up of the Technologies to meet potential future market demand. We believe that vertical integration with U.S.-based resource operations is a major competitive advantage for IperionX, providing a potential source of critical mineral feedstock.
We plan to effect our business plan for the Titan Project by:
•continue to expand IperionX’s critical mineral land position in the U.S., explore for additional critical minerals and secure final permit and zoning approvals;
•continue the development of the Atlas-Titan project, with an integrated economic assessment targeted for completion by the end of 2026. The combination has the potential to reduce upfront capital and operating costs and accelerate first production relative to a standalone Titan development;
•completing required permitting and zoning activities;
•undertaking discussions with potential customers for future sale of titanium and other critical minerals, including rare earths;
•completing required financing activities;
•completing construction of the Titan Project’s minerals extraction and processing facilities; and
•commencing minerals extraction and processing activities to supply the U.S. demand for clean, low-cost domestic sources of titanium and other critical minerals, including rare earths.
Extraction Permits and Approvals
In August 2023, we received what we believe are the requisite development permits required to start construction and operations of our planned Wet Concentrator Plant at the Titan Project, including the National Pollutant Discharge Elimination System Permit and Surface Mining Permit, which were issued by the Tennessee Department of Environment & Conservation.
We will require additional governmental permits to construct our planned dry Mineral Separation Plant. We also will be required to renew our permits from time to time. Obtaining and renewing governmental permits is a complex and time-consuming process. The timeliness and success of permitting efforts are contingent upon many variables not within our control, including the interpretation of permit approval requirements administered by the applicable permitting authority. We may not be able to obtain or renew permits that are necessary to our planned operations or we may find that the cost and time required to obtain or renew such permits exceeds our expectations, which in turn could materially adversely affect our business plans or our prospective or actual revenues and profitability. In addition, private parties, such as environmental activists, frequently attempt to intervene in the permitting process and to persuade regulators to deny necessary permits or seek to overturn permits that have been issued. These third-party actions can materially increase the costs and cause delays in the permitting process and could cause us to not proceed with the development or operation of a property.
Our exploration operations are subject to extensive laws and regulations, which are overseen and enforced by multiple U.S. federal, state and local authorities. These laws govern exploration, development, production, exports, various taxes, labor standards, occupational health and safety, waste disposal, protection and remediation of the environment, protection of endangered and protected species and other matters. Mineral exploration operations are also subject to U.S. federal and state laws and regulations that seek to maintain health and safety standards by regulating the design and use of drilling methods and equipment. Various permits from government bodies are required for drilling operations to be conducted, and we cannot assure you such permits will be received. Environmental laws and regulations may also, among other things:
•Require notice to stakeholders of proposed and ongoing operations.
•Require the installation of pollution control equipment.
48

Table of Contents
•Restrict the types, quantities and concentration of various substances that can be released into the environment in connection with minerals extraction or drilling activities.
•Limit or prohibit extraction or drilling activities on lands located within wetlands, areas inhabited by endangered species and other protected areas, or otherwise restrict or prohibit activities that could impact the environment, including water resources.
•Impose substantial liabilities for pollution resulting from current or former operations on or for any preexisting environmental impacts at the Titan Project site.
•Require preparation of an Environmental Assessment or an Environmental Impact Statement.
Environmental Regulation
IperionX’s operations are subject to various environmental laws and regulations under the relevant government’s legislation. Full compliance with these laws and regulations is regarded as a minimum standard for all operations to achieve. Instances of environmental non-compliance by an operation are identified either by external compliance audits or inspections by relevant government authorities. There have been no known breaches by the Group during the financial year ended June 30, 2026. For more information, see “Government Regulations” below.
As of the date hereof, other than with respect to the acquisition of the Titan Project and related permitting activities, we have not been required to spend material amounts on compliance with environmental regulations. However, compliance with these laws and regulations may impose substantial costs on us, subject us to significant potential liabilities, and have an adverse effect upon our capital expenditures, results of operations or competitive position. Violations and liabilities with respect to these laws and regulations could result in significant administrative, civil, or criminal penalties, remedial clean-ups, natural resource damages, permit modifications or revocations, operational interruptions or shutdowns and other liabilities. The costs of remedying such conditions may be significant, and remediation obligations could adversely affect our business, results of operations and financial condition. Additionally, Congress and federal and state agencies frequently revise environmental laws and regulations, and any changes in these regulations or the interpretations thereof could require us to expend significant resources to comply with new laws or regulations or changes to current requirements and could have a material adverse effect on our business operations.
GOVERNMENTAL REGULATIONS
U.S. Securities Regulations
The Company became a large accelerated filer during the fiscal year 2025 and this status was maintained as of June 30, 2026.
Foreign Private Issuer Status
We are also considered a “foreign private issuer” pursuant to Rule 405 under the Securities Act. As a foreign private issuer, we are exempt from certain rules under the Exchange Act that impose certain disclosure obligations and procedural requirements for proxy solicitations under Section 14 of the Exchange Act. In addition, our officers, directors and principal shareholders are exempt from the reporting and “short-swing” profit recovery provisions of Section 16 of the Exchange Act and the rules under the Exchange Act with respect to their purchases and sales of our ordinary shares or ADSs. Moreover, we are not required to file periodic reports and financial statements with the SEC as frequently or as promptly as U.S. companies whose securities are registered under the Exchange Act. In addition, we are not required to comply with Regulation FD, which restricts the selective disclosure of material information.
Nasdaq also allows us as a foreign private issuer to elect to follow certain home country laws instead of Nasdaq practices applicable to U.S. companies. In particular, we follow home country law instead of Nasdaq practice regarding:
•Nasdaq’s requirement that our independent directors meet regularly in executive sessions. The ASX Listing Rules and the Corporations Act do not require the independent directors of an Australian company to have such executive sessions and, accordingly, we have claimed this exemption.
•Nasdaq’s requirement that an issuer provide for a quorum as specified in its bylaws for any meeting of the holders of ordinary shares, which quorum may not be less than 33 1/3% of the outstanding shares of an issuer’s voting ordinary shares. In compliance with Australian law, our Constitution provides that two shareholders present shall constitute a quorum for a general meeting.
49

Table of Contents
•Nasdaq’s requirement that issuers obtain shareholder approval prior to the issuance of securities in connection with certain acquisitions, changes of control or private placements of securities, or the establishment or amendment of certain stock option, purchase or other compensation plans. Applicable Australian law and rules differ from Nasdaq requirements, with the ASX Listing Rules providing generally for prior shareholder approval in numerous circumstances, including (i) issuance of equity securities exceeding 15% (or an additional 10% capacity to issue equity securities for the preceding 12-month period if shareholder approval by special resolution is sought at the Company’s annual general meeting) of our issued share capital in any 12-month period (but, in determining the available issue limit, securities issued under an exception to the rule or with shareholder approval are not counted), (ii) issuance of equity securities to related parties (as defined in the ASX Listing Rules) and (iii) directors or their associates acquiring securities under an employee incentive plan.
For as long as we are a “foreign private issuer” we intend to file our annual financial statements on Form 20-F and furnish our semi-annual financial statements and quarterly updates on Form 6-K to the SEC for so long as we are subject to the reporting requirements of Section 13(g) or 15(d) of the Exchange Act. However, the information we file or furnish is not the same as the information that is required in annual and quarterly reports on Form 10-K or Form 10-Q for U.S. domestic issuers. Accordingly, there may be less information publicly available concerning us than there is for a company that files as a domestic issuer.
We may take advantage of these exemptions until such time as we are no longer a foreign private issuer. We are required to determine our status as a foreign private issuer on an annual basis at the end of our second fiscal quarter. We would cease to be a foreign private issuer at such time as more than 50% of our outstanding voting securities are held by U.S. residents and any of the following three circumstances applies: (1) the majority of our executive officers or directors are U.S. citizens or residents; (2) more than 50% of our assets are located in the U.S.; or (3) our business is administered principally in the U.S. Since more than 50% of our assets are located in the U.S., we will lose our status as a foreign private issuer if more than 50% of our outstanding voting securities are held by U.S. residents as of the last day of our second fiscal quarter in any year. In addition, on August 3, 2026, we announced that IperionX intends to pursue a redomiciliation to the United States through a proposed scheme of arrangement (the “redomiciliation”). If the scheme is implemented, we will no longer qualify as a foreign private issuer. Implementation of the redomiciliation is subject to the satisfaction or waiver of a number of conditions, including, approval of the scheme of arrangement by the Federal Court of Australia.
For information on the risks that accompany our status as a foreign private issuer, see “Item 3. Key Information – D. Risk Factors – Risks Related to Our ADSs – As a foreign private issuer, we are permitted to file less information with the SEC than a domestic issuer” and “Item 3. Key Information-D. Risk Factors – Risks Related to Our Proposed Redomiciliation – “Even if the proposed redomiciliation is not completed, we may lose our foreign private issuer status as a result of the changes in the U.S. ownership of our securities or other changes in our circumstances, which would require us to comply with the Exchange Act’s domestic reporting regime and cause us to incur additional legal, accounting and other expenses.”
U.S. Environmental, Health and Safety Laws
IperionX’s business operations, including the Technologies and the Titan Project, will be required to comply with applicable environmental protection laws and regulations and licensing and permitting requirements. The material environmental, health and safety laws and regulations that we must comply with include, among others, the following U.S. federal laws and regulations:
•National Environmental Policy Act, which requires careful evaluation of the environmental impacts of major federal actions;
•Clean Air Act and its amendments, which governs air emissions;
•Clean Water Act, which governs discharges to and excavations within the waters of the U.S.;
•Safe Drinking Water Act, which governs the underground injection and disposal of wastewater;
•Resource Conservation and Recovery Act, which governs the management of both hazardous and non-hazardous solid waste;
•Comprehensive Environmental Response, Compensation, and Liability Act, which imposes liability where hazardous substances have been released into the environment (commonly known as Superfund);
•Department of Transportation Hazardous Materials Regulations, which govern the handling and transportation of hazardous materials to ensure safety and security across all modes of transportation;
50

Table of Contents
•Endangered Species Act, which establishes protections for fish, wildlife, and plants that are listed as threatened or endangered;
•Occupational Safety and Health Act, which governs the safe and healthful working conditions for private sector workers; and the
•Federal Mine Safety and Health Act, which established the primary safety and health standards regarding working conditions of employees engaged in extraction, related operations, and preparation and milling of the minerals extracted.
Our operations may also be subject to state and local environmental laws and regulations, including but not limited to laws and regulations related to the air emissions, wastewater discharges, and reclamation of mined lands, which may require reclamation permits to be acquired prior to the commencement of minerals extraction operations and may require substantial financial guarantees to cover the cost of future reclamation activities.
Solid and Hazardous Waste
The Resource Conservation and Recovery Act (RCRA), and comparable state statutes, affect our operations by imposing regulations on the generation, transportation, treatment, storage, disposal and cleanup of hazardous wastes and on the disposal of non-hazardous wastes. Under the auspices of the Environmental Protection Agency (EPA), the individual states administer some or all of the provisions of RCRA, sometimes in conjunction with their own, more stringent requirements.
In addition, the federal Comprehensive Environmental Response, Compensation, and Liability Act (CERCLA) - Superfund law - can impose joint and several liability without regard to fault or legality of conduct on classes of persons who are statutorily responsible for the release of a hazardous substance into the environment. These persons can include the current and former owners, lessees or operators of a site where a release occurs, and anyone who disposes or arranges for the disposal of a hazardous substance. Under CERCLA, such persons may be subject to strict, joint and several liability for the entire cost of cleaning up hazardous substances that have been released into the environment and for other costs, including response costs, alternative water supplies, damage to natural resources and for the costs of certain health studies. Moreover, it is not uncommon for neighboring landowners, workers and other third parties to file claims for personal injury and property damage allegedly caused by hazardous substances released into the indoor or outdoor environment. Each state also has environmental cleanup laws analogous to CERCLA. Hazardous wastes may have been previously handled, disposed of, or released on or under properties currently or formerly owned or leased by us or on or under other locations to which we sent waste for disposal. These properties and any materials disposed or released on them may subject us to liability under CERCLA, RCRA and analogous state laws. Under such laws, we could be required to remove or remediate disposed wastes or property contamination, to contribute to remediation costs, or to perform remedial activities to prevent future environmental harm.
Air Emissions
The federal Clean Air Act (CAA) and comparable state and local laws restrict the emission of air pollutants from numerous sources through the issuance of permits and the imposition of other requirements. Major sources of air pollutants are subject to more stringent, federally imposed permitting requirements. Air pollution regulations may require us to obtain pre-approval for the construction or modification of certain projects or facilities expected to produce or significantly increase air emissions, obtain air permits and comply with stringent permit requirements or utilize specific equipment or technologies to control emissions of certain pollutants. The need to obtain permits has the potential to delay our operations, and we may be required to incur capital expenditures for air pollution control equipment or other air emissions related obligations. Administrative enforcement actions for failure to comply strictly with air pollution regulations or permits are generally resolved by payment of monetary fines and correction of any identified deficiencies. Alternatively, regulatory agencies could require us to forego construction, modification or operation of certain air emission sources.
Climate Change
Numerous regulatory initiatives have been enacted, and additional regulatory, legislative, and policy developments may continue to emerge at the international, federal, state, and local levels to monitor, report, reduce, or otherwise regulate GHG emissions.
In 2009, the U.S. EPA issued its Greenhouse Gas Endangerment Finding under the CAA, concluding that certain GHG emissions endanger public health and welfare. The Endangerment Finding subsequently served as a basis for various
51

Table of Contents
federal GHG regulatory programs. In February 2026, the EPA finalized a rule rescinding the 2009 Endangerment Finding and repealing certain federal GHG emission standards applicable to motor vehicles and engines. These actions may be subject to judicial review, and the future scope of federal GHG regulation remains uncertain.
In addition, Congress, federal agencies, and state governments may continue to consider legislation, regulations, or other initiatives relating to climate change, GHG emissions, energy transition, sustainability reporting, or related matters. Various states and regional organizations have adopted, or may in the future adopt, programs designed to monitor, report, limit, or price GHG emissions, including cap-and-trade and other market-based regulatory mechanisms.
Any future climate-related legislation, regulation, reporting requirements, or other governmental actions could increase our compliance, capital, operating, monitoring, or reporting costs, require changes to our operations, or otherwise adversely affect our business, financial condition, results of operations, or cash flows. The extent and timing of any such impacts remain uncertain and will depend on the nature of future regulatory developments and their applicability to our operations.
Clean Water Act
The CWA imposes restrictions and strict controls regarding the discharge of wastes, including mineral processing wastes, into waters of the U.S., a term broadly defined to include, among other things, certain wetlands. Permits must be obtained to discharge pollutants into federal waters. The CWA provides for civil, criminal and administrative penalties for unauthorized discharges, both routine and accidental, of pollutants. It imposes substantial potential liability for the costs of removal or remediation associated with discharges of oil or hazardous substances. State laws governing discharges to water also provide varying civil, criminal and administrative penalties, and impose liabilities in the case of a discharge of petroleum or its derivatives, or other hazardous substances, into state waters. In addition, the EPA has promulgated regulations that require permits to discharge storm water runoff, including discharges associated with construction activities. In the event of an unauthorized discharge of industrial wastes, we may be liable for penalties and costs.
Pursuant to these laws and regulations, we may also be required to develop and implement spill prevention, control and countermeasure plans. Some states also maintain groundwater protection programs that require permits for discharges or operations that may impact groundwater conditions. The CWA also prohibits the discharge of fill materials to regulated waters including wetlands without a permit from the U.S. Army Corps of Engineers.
The scope of federal jurisdiction under the CWA has been subject to significant regulatory and judicial developments in recent years. In May 2023, the U.S. Supreme Court issued its decision in Sackett v. EPA, which narrowed the categories of wetlands and other waters subject to federal regulation under the CWA. Following that decision, the EPA and the U.S. Army Corps of Engineers amended their regulations defining "Waters of the United States" to conform to the Court's ruling. Additional rulemaking activities and litigation concerning the scope of federal CWA jurisdiction remain ongoing, and differing regulatory frameworks may apply in various states. As a result, the extent of federal permitting and compliance obligations applicable to our operations may continue to evolve. We could face increased costs, project delays, or additional permitting requirements with respect to activities affecting wetlands or other waters that are determined to be subject to federal, state, or local regulation.
Underground Injection Control Permits
The federal Safe Drinking Water Act (SDWA) creates a nationwide regulatory program protecting groundwater. This act is administered by the EPA. However, to avoid the burden of dual federal and state (or Indian tribal) regulation, the SDWA allows for the Underground Injection Control (UIC) permits issued by states (and Indian tribes determined eligible for treatment as states) to satisfy the UIC permit required under the SDWA under two conditions. First, the state’s program must have been granted primacy. Second, the EPA must have granted, upon request by the state, an aquifer exemption. The EPA may delay or decline to process the state’s application if the EPA questions the state’s jurisdiction over the mine site. Permits must be obtained before developing and using deep injection wells for the disposal or storage of produced fluids, and well casing integrity monitoring must be conducted periodically to ensure the well casing is not leaking produced fluids to groundwater. Contamination of groundwater by natural gas and oil drilling, production and related operations may result in fines, penalties, remediation costs and natural resource damages, among other sanctions and liabilities under the SDWA and other federal and state laws. In addition, third-party claims may be filed by landowners and other parties claiming damages for groundwater contamination, alternative water supplies, property impacts and bodily injury.
52

Table of Contents
NEPA
The National Environmental Policy Act (NEPA) requires federal agencies to evaluate major agency actions having the potential to significantly impact the environment. The NEPA process may involve public input through comments which can alter the nature of a proposed project either by limiting the scope of the project or requiring resource-specific mitigation. NEPA decisions can be appealed through the court system by process participants. The NEPA process may result in delaying the funding, permitting, or development of projects or increase the costs of permitting and developing some facilities.
Endangered Species Act
The federal Endangered Species Act (ESA) restricts activities that may affect endangered and threatened species or their habitats. Some of our operations may be located in areas that are designated as habitats for endangered or threatened species. A critical habitat designation could result in further material restrictions to federal and private land use and could delay or prohibit land access or development. The U.S. Fish and Wildlife Service continues its effort to make listing decisions and critical habitat designations where necessary. The ESA has not previously had a significant impact on our operations. However, the designation of previously unprotected species as being endangered or threatened could cause us to incur additional costs or become subject to operating restrictions in areas where the species are known to exist.
Extraction Permits and Approvals
We currently have permits authorizing the initial mineral extraction activities with respect to the Titan Project. We are required to obtain governmental permits for some of our exploration and future mineral extraction activities and may be required to renew the permits we already have. Prior to developing or extracting any mineralization that we discover, we will be required to obtain and renew additional governmental permits authorizing, among other things, further site development activities and site operating activities. Obtaining and renewing governmental permits is a complex and time-consuming process and involves numerous jurisdictions, public hearings and possibly costly undertakings. The timeliness and success of permitting efforts are contingent upon many variables not within our control, including the interpretation of permit approval requirements administered by the applicable permitting authority. We may not be able to obtain or renew permits that are necessary to our planned operations or the cost and time required to obtain or renew such permits may exceed our expectations. Any unexpected delays or costs associated with the permitting process could delay the exploration, development or operation of our properties.
See “Item 3. Key Information – D. Risk Factors – Risks Related to Regulatory and Industry Matters – We will be required to obtain and renew governmental permits in order to conduct development and minerals extraction operations, a process which is often costly and time-consuming.”
Our exploration and future mineral extraction operations are subject to extensive laws and regulations, which are overseen and enforced by multiple U.S. federal, state and local authorities. These laws govern exploration, development, production, exports, various taxes, labor standards, occupational health and safety, waste disposal, protection and remediation of the environment, protection of endangered and protected species and other matters. Mineral exploration and extraction operations are also subject to U.S. federal and state laws and regulations that seek to maintain health and safety standards by regulating the design and use of drilling methods and equipment. Various permits from government bodies are required for drilling and extraction operations to be conducted, and we cannot assure that such permits will be received. Environmental laws and regulations may also, among other things:
•Require notice to stakeholders of proposed and ongoing operations.
•Require the installation of pollution control equipment.
•Restrict the types, quantities and concentration of various substances that can be released into the environment in connection with minerals extraction or drilling activities.
•Limit or prohibit extraction or drilling activities on lands located within wetlands, areas inhabited by endangered species and other protected areas, or otherwise restrict or prohibit activities that could impact the environment, including water resources.
•Impose substantial liabilities for pollution resulting from current or former operations on or for any preexisting environmental impacts at the Titan Project site.
•Require preparation of an Environmental Assessment or an Environmental Impact Statement.
53

Table of Contents
C.Organizational Structure
The following reflects our organizational structure as of June 30, 2026. All our subsidiaries are wholly-owned.
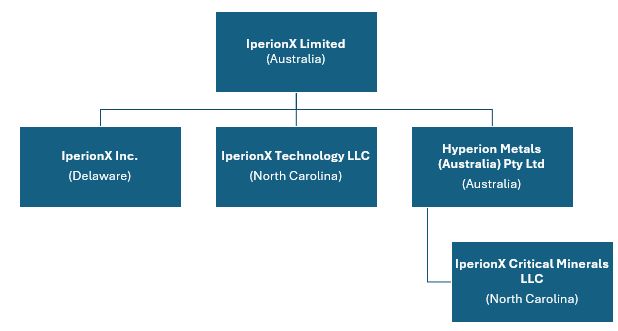
Image_7.jpg
54

Table of Contents
D.Property, Plant and Equipment
Our executive offices are located at 1092 Confroy Drive, South Boston, Virginia, 24592. We lease multiple facilities in South Boston, Virginia totaling 97,800 square feet that are used for executive offices and as the Company’s titanium production hub. The leases for the operating facilities expire between 2033 and 2034, while an additional administrative office space lease expires on June 15, 2027. We previously leased 3,326 square feet of office space in Charlotte, North Carolina, under an agreement that expired on August 31, 2026. In addition, we lease approximately 15,000 square feet of laboratory and office space in West Valley City, UT, which is used for research and development activities. The lease for this facility expires December 31, 2030.
Titan Project
Overview
The Titan Critical Minerals Project (“Titan” or the “Project”) is IperionX Limited’s wholly owned, principal mineral development asset and is located near Camden, Tennessee, U.S., covering more than 10,000 acres. Titan is a heavy mineral sands and critical minerals project designed to produce titanium minerals, zircon concentrate and a HREC from a domestic U.S. mineral resource base. The Project is owned through IperionX Critical Minerals, LLC, a wholly owned subsidiary of IperionX Limited.
The technical information in this annual report relating to Titan is derived from the DFS titled “Titan Project, Tennessee, U.S. Technical Report Summary on Feasibility Study”, dated June 4, 2026 (Titan DFS), prepared in accordance with Subpart 1300 of Regulation S-K (S-K 1300). The Titan DFS supports the Project’s Mineral Resource estimate, Mineral Reserve estimate, mine plan, processing flowsheet, capital and operating cost estimates, economic analysis and principal technical assumptions.
The feasibility study contemplates a staged development strategy, consisting of an initial Phase 1 operation followed by a Phase 2 expansion. Phase 1 is designed around approximately 400 metric tons per hour of rougher spiral feed capacity, while Phase 2 contemplates an incremental 800 metric tons per hour expansion, resulting in total rougher spiral feed capacity of approximately 1,200 metric tons per hour. Development of the Project remains subject to final investment decision, financing, permitting, detailed engineering, procurement, construction, commissioning and other customary project development risks.
At June 30, 2026, the book carrying value of the Titan Project was $7.8 million. See Note 11 to our audited consolidated financial statements for the fiscal period ended June 30, 2026 included in this annual report for further details.
Property Description, Location and Ownership
Titan is located in western Tennessee approximately 128 kilometers (80 miles) west of Nashville and approximately 11 kilometers (7 miles) northwest of Camden. The Study Area is centered at approximately 36.147349°N latitude and 88.20974°W longitude and is located on the Mansfield, Manleyville, Vale and Bruceton U.S. Geological Survey quadrangles.
The broader Titan properties comprise over 10,000 acres of surface and associated mineral rights in Tennessee held through a combination of owned, leased, and optioned interests are as follows:
•Owned: ~1,500 acres are owned by the Company or its wholly owned subsidiary.
•Leased: ~1,200 acres are under long-term lease arrangements. These leases grant exclusive rights to explore, develop, and mine. The leases expire between October 24, 2043 and January 6, 2051. We will pay an annual minimum royalty, generally $75.00 per acre, or an extraction royalty, generally 5% of net revenues from products sold.
•Optioned: ~7,500 acres are subject to exclusive option agreements, which upon exercise, allow us to lease the surface property and associated mineral rights from the local landowners, and generally have expiry dates between January 15, 2027 and January 2, 2051. During the option period, our option to lease agreements provide us with exclusive right to access, enter, occupy and use the surface property for all purposes related to exploring for and evaluating all minerals in return for making annual option payments and bonus payments during periods when we conduct drilling. Our annual option payments are generally $75.00 per acre and our drilling bonuses generally average approximately $1.00 per drill foot. Our obligation to make annual option payments and drilling bonus
55

Table of Contents
payments cease if we exercise our option to lease. Upon exercise, in the case of an option to lease, we will pay an annual minimum royalty, generally $75.00 per acre, or an extraction royalty, generally 5% of net revenues from products sold.
All properties owned by IperionX will not incur a royalty. The Study Area supporting the current Mineral Resource and Mineral Reserve estimates comprised approximately 3,317 acres of surface and associated mineral rights. There are no known encumbrances and no current material mining regulatory violations or fines applicable to the Project.
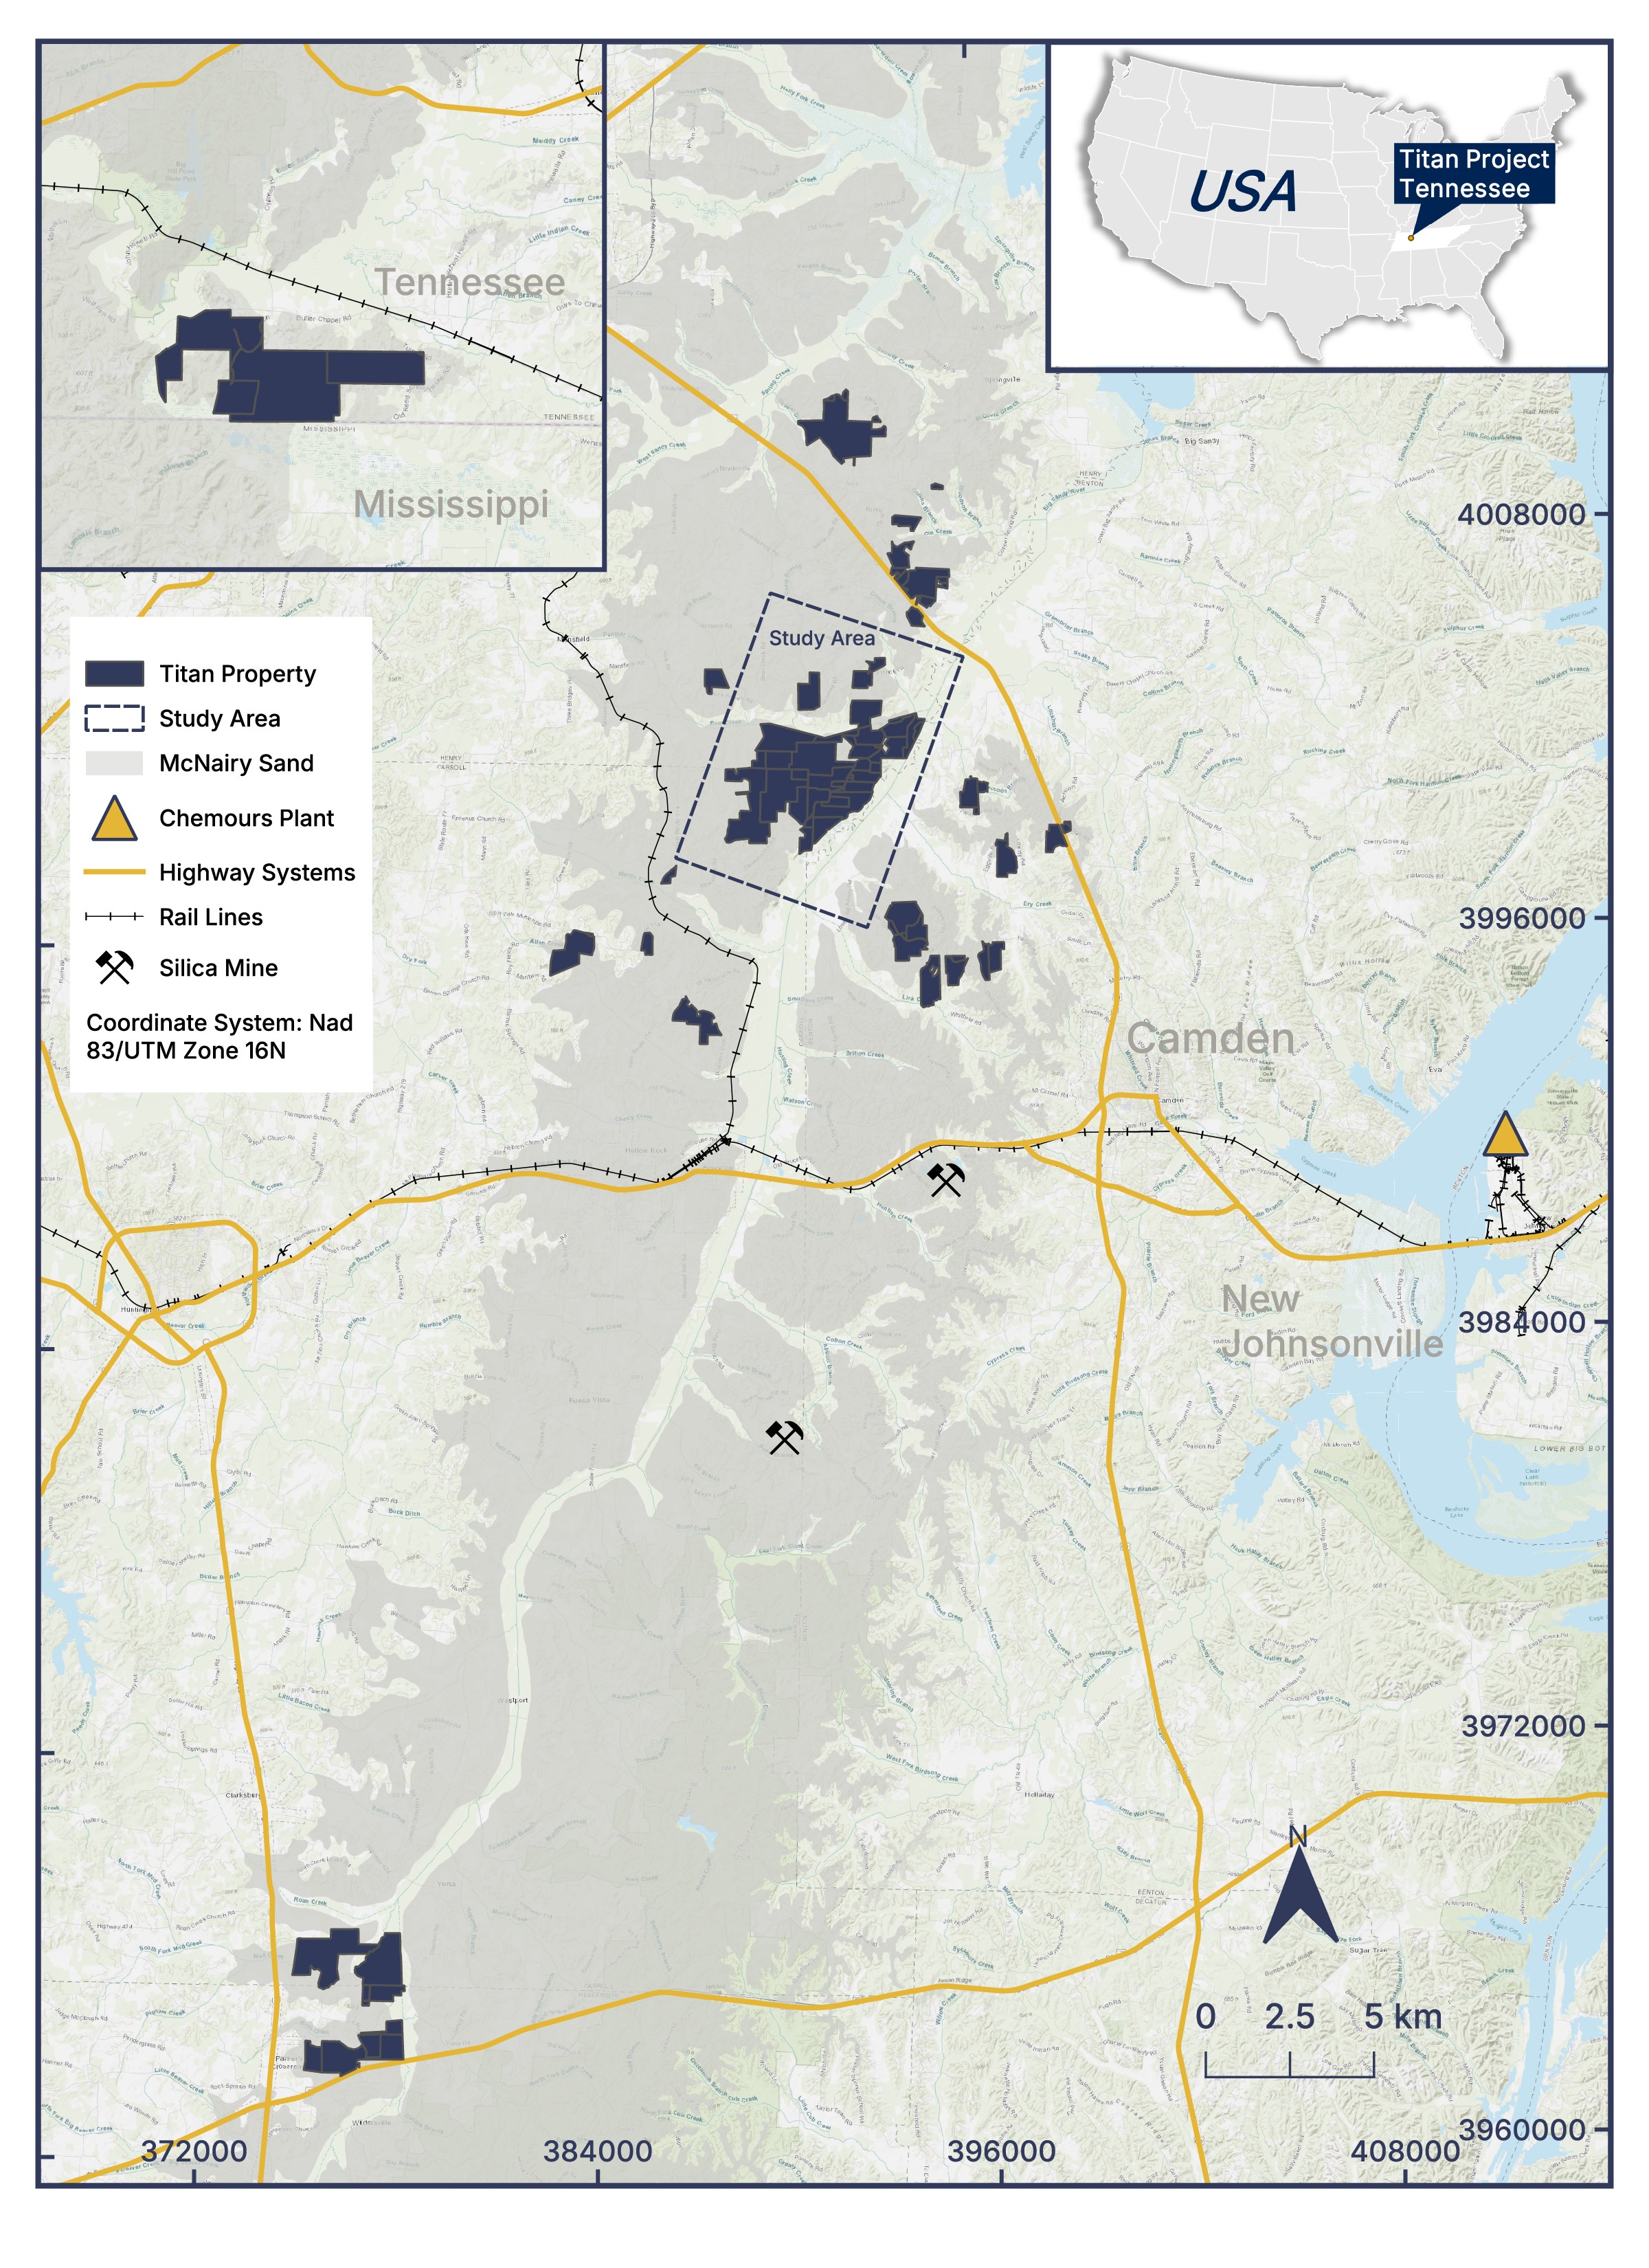
260527 - Titan Property and Study Area.jpg
Figure 1: Titan Project location of properties
56
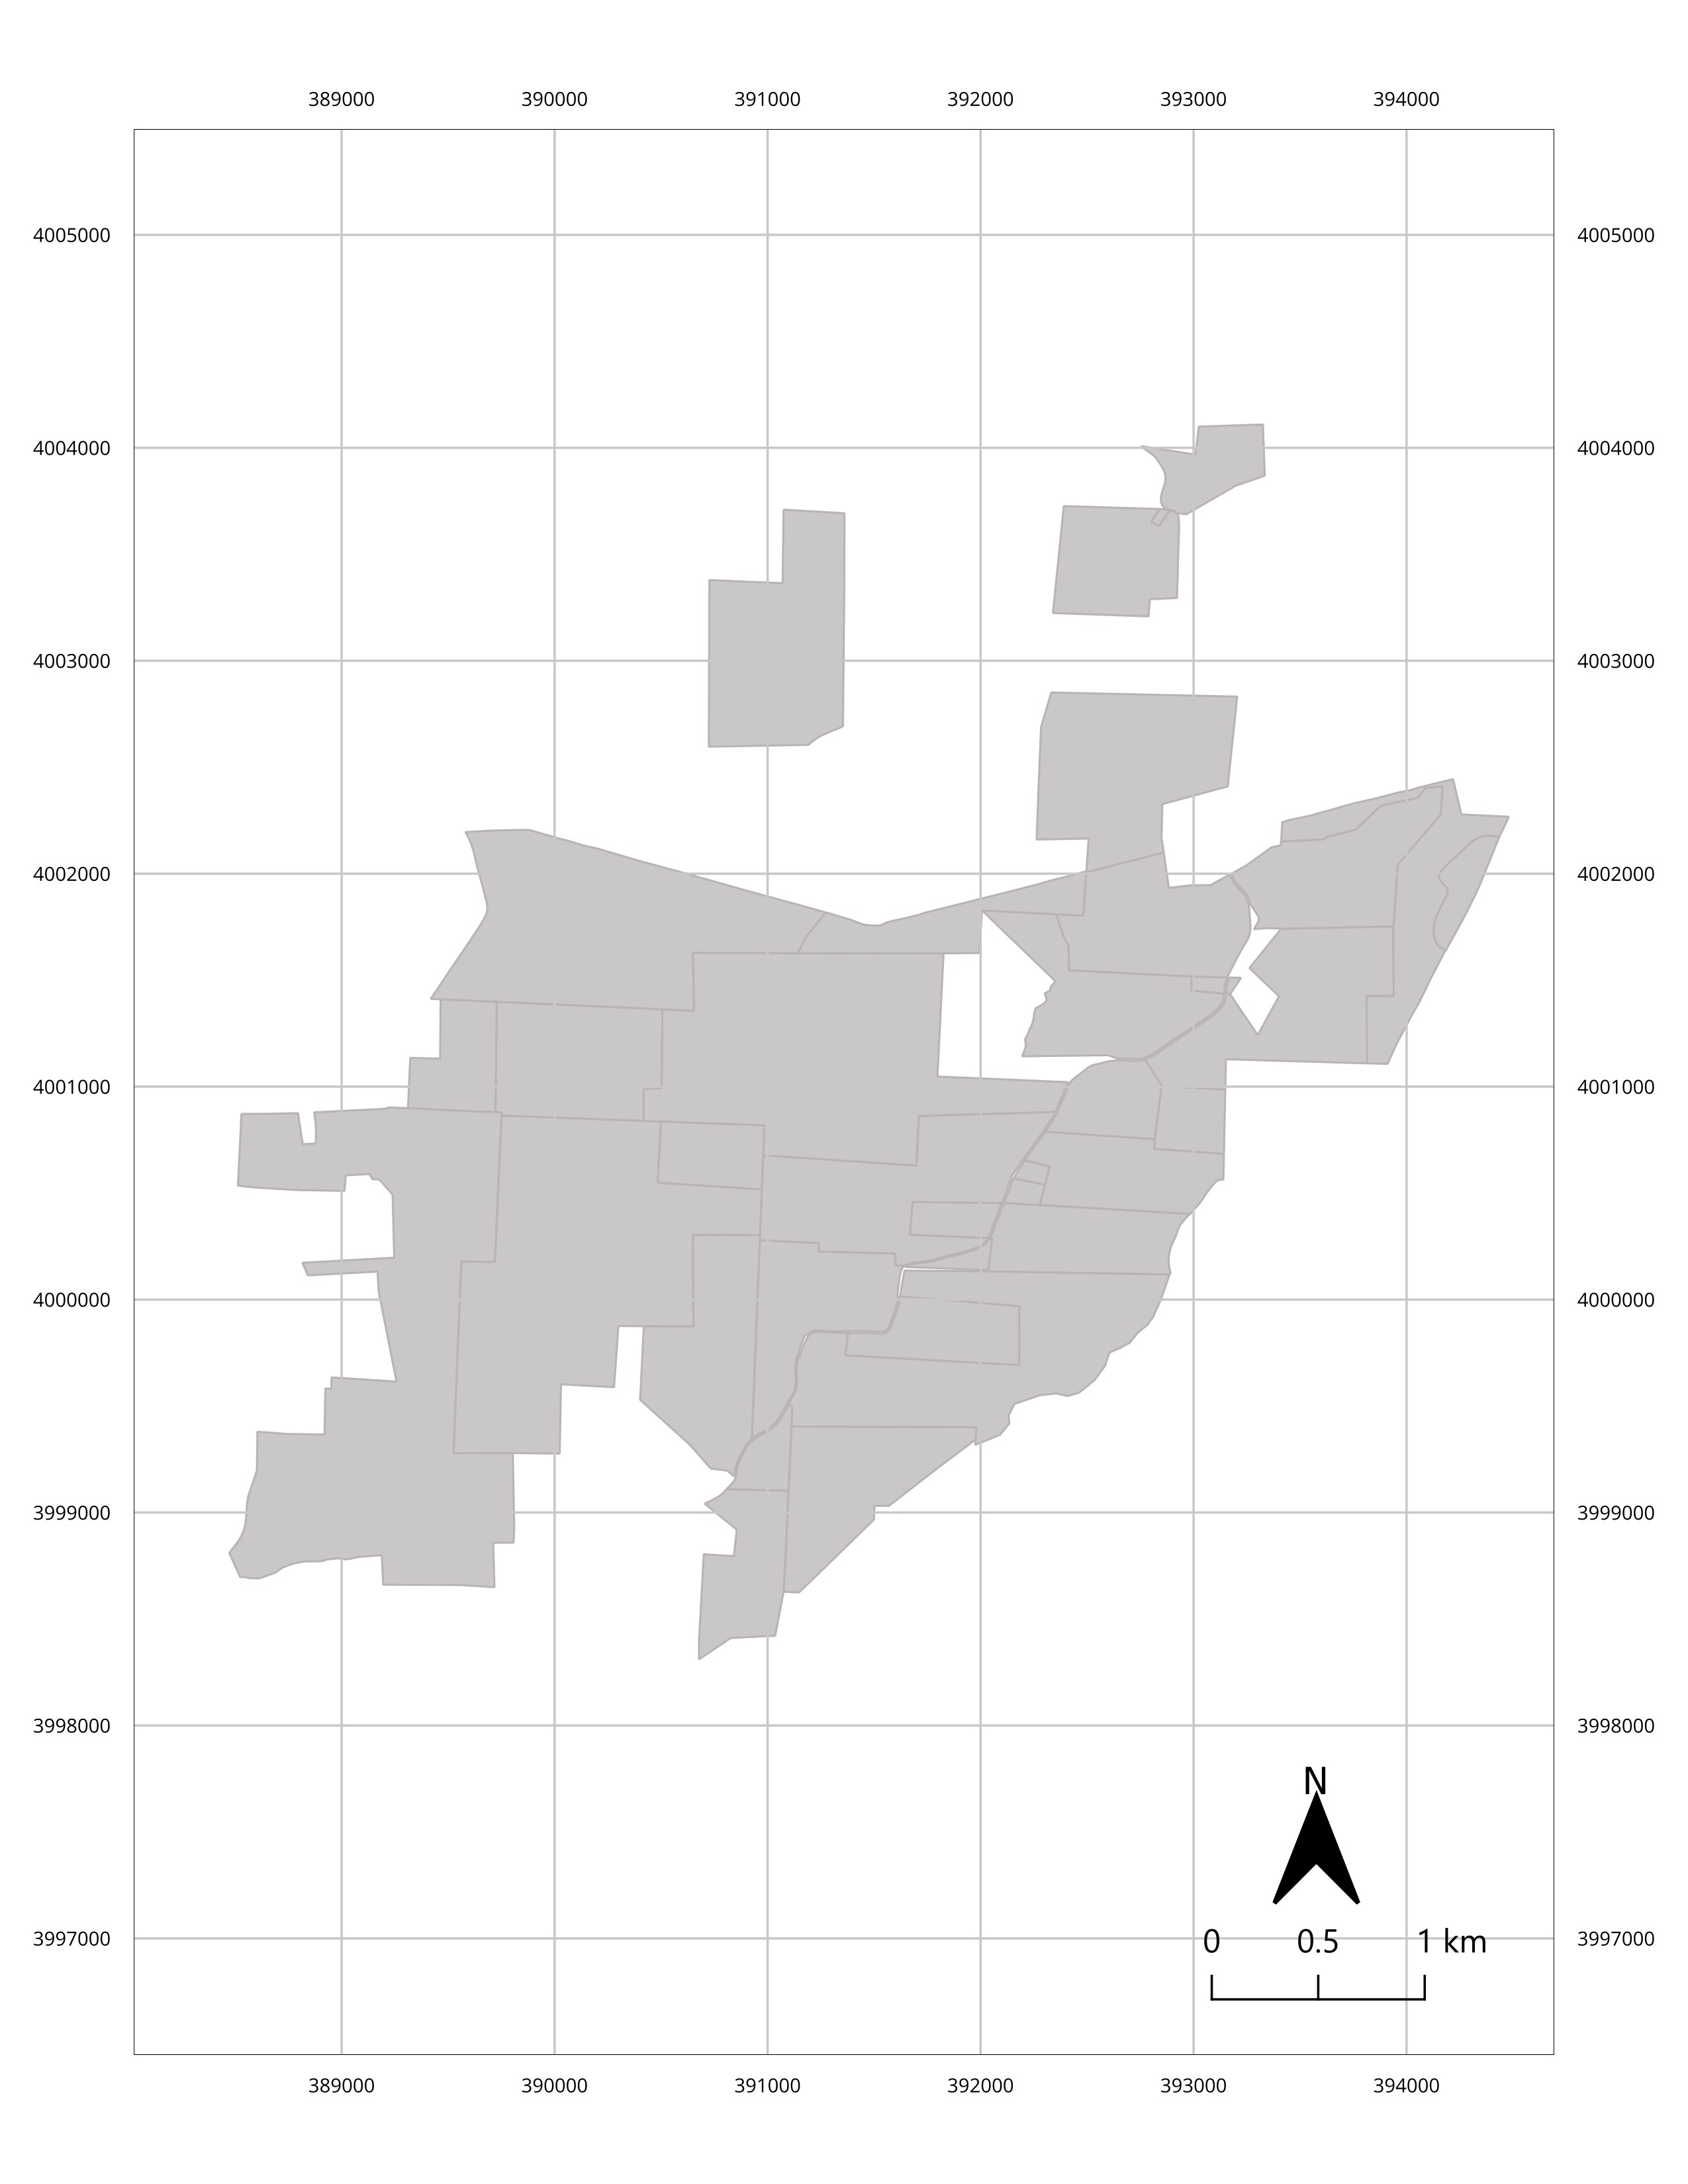
Table of Contents
Titan Resource_09_11_26.jpg
Figure 2: Titan Project location of properties containing mineral resources (the coordinate system and datum used for modeling is UTMZ16N, NAD83)
Accessibility, Climate, Local Resources and Infrastructure
The Project is accessible by a developed network of primary and secondary roads. Site access is available from Interstate 40 via Highway 641, Reynoldsburg Road, Pleasant Hill Road and Little Benton Road. The region benefits from established transportation infrastructure, including highway and rail access, with the CSX Transportation Memphis subdivision mainline running through Camden and a CSX railyard located approximately 7 miles from the planned mineral separation and rare earth processing facilities.
The climate is temperate with warm summers and cold winters including the potential for snow and ice. Annual rainfall for the area is 54 inches. It is expected that any future mining activity will operate year-round.
Existing infrastructure in the region includes power and gas services, with 161-kV transmission lines located near the Project area. The Company intends to evaluate and implement renewable power sourcing options, including on-grid
57

Table of Contents
renewable solutions supplied by existing regional power providers. Water supply for mining and processing is expected to be sourced from nearby surface water bodies, supplemented by shallow groundwater and pit inflows where appropriate. The Project does not contemplate a construction or operations accommodation camp, as personnel are expected to reside in surrounding communities.
Geology and geological interpretation
The Study Area location in western Tennessee represents the eastern flank of the Mississippi Embayment, a large, southward-plunging syncline within the Gulf Coastal Plain. The McNairy Formation represents a pro-grading deltaic environment during a regressive marine sequence. This deposition model is supported by the coarsening upward sequence grading from the glauconitic clay-rich Coon Creek Formation to the finer grained lower member of the McNairy Formation to the coarser grained upper member of the McNairy Formation.
The main mineralized zone at the Study Area is hosted stratigraphically in the lower member of the McNairy Formation, which dips gently to the west in the Study Area. The upper zone is also mineralized in some areas. Mineralization in the lower member had been traced for over 6.0 km along strike.
The base of mineralization range is relatively level from 266 feet to 367 feet above current sea level. Mineralization varies from 16 feet to 220 feet thick and averages 92 feet in thickness. Mineralization primarily occurs in two zones within the McNairy Formation. The main mineralized zones are interrupted by low-grade sand. The Gangue minerals are predominantly quartz and clays. The primary minerals associated with the mineralized horizons are altered ilmenite, zircon, rutile, staurolite, kyanite, monazite and xenotime.
Exploration, Drilling, Sampling and Data Verification
Exploration drilling within the Study Area comprises 156 drill holes, including 140 roto-sonic drill holes totaling approximately 18,517 feet and 16 reverse circulation drill holes totaling approximately 2,746 feet. Across the broader Titan property, IperionX has drilled 313 holes totaling approximately 37,343 feet. All drilling used in the Mineral Resource estimate was sonic drilling. Reverse circulation holes, hydrogeological holes and geotechnical holes were excluded from Mineral Resource estimation where appropriate due to concerns over sample representativeness or because the holes were drilled for purposes other than resource estimation.
Drill core samples were typically collected at 1.5-meter intervals unless geological contacts required alternative sample lengths. Samples were collected using industry-standard procedures for unconsolidated mineral sands material. Samples were placed in sealed bags, secured, and shipped to independent laboratories, including SGS Lakefield in Ontario, Canada and Bureau Veritas in Perth, Australia.
Analytical procedures included size fraction analysis, heavy liquid separation, X-ray fluorescence, laser ablation inductively coupled plasma mass spectrometry and QEMSCAN mineralogical analysis. Quality assurance and quality control procedures included matrix-matched in-house standards, blanks, field duplicates and laboratory duplicates. The Qualified Persons (QP) concluded that the sample preparation, security, analytical procedures and database are sufficient to support Mineral Resource and Mineral Reserve estimation.
Mineral resources
The mineral resource figures presented herein are estimates based on information available at the time of calculation. A “mineral resource” is a concentration or occurrence of solid material of economic interest in or on the earth’s crust in such form, grade, or quality and quantity that there are reasonable prospects for eventual economic extraction. The location, quantity, grade or quality, continuity and other geological characteristics of a mineral resource are known, estimated or interpreted from specific geological evidence and knowledge, including sampling. Mineral resources are reported on an in situ basis, exclusive of mineral reserves. Mineral resources are subdivided in order of increasing geological confidence into inferred, indicated and measured categories. Metric tons of mineral resources containing total heavy minerals, included in the measured, indicated, and inferred resources, are those contained prior to losses during metallurgical treatment. The terms “measured resource”, “indicated resource”, and “inferred resource” mean the part of a mineral resource for which quantity and grade or quality are estimated on the basis of geological evidence and sampling that is considered to be comprehensive, adequate, or limited, respectively.
58

Table of Contents
Market fluctuations in the price of the underlying minerals which make up THM, as well as increased production costs or reduced metallurgical recovery rates, could change future estimates of resources.
We have reported mineral resources and mineral reserves in accordance with the requirements of S-K 1300. The Titan DFS is incorporated by reference as an exhibit to this annual report on Form 20-F. As of June 30, 2026, based on the Titan DFS, we have reported 296.9 million metric tons of mineral resources (exclusive of reserves) at a grade of 1.8% THM, containing 5.3 million metric tons of THM at a 0.4% THM cut-off, and 117.0 million metric tons of proven and probable mineral reserves as a grade of 3.2% THM, containing approximately 3.7 million metric tons of THM at a 0.85% THM cut-off. Mineralization occurs as a large and coherent near-surface deposit. The valuable heavy mineral component of the THM assemblage consists of zircon, rutile, ilmenite and rare earth element-bearing minerals (monazite and xenotime).
Mineral resources are reported above a cut-off grade of 0.4% THM. All material at or above the bottom cut-off grade of 0.4% used in a constraining pit shell is expected to be processed, on the basis that the incremental cost of selectively extracting this material, hauling it to a long- term stockpile, and subsequently reclaiming and re-placing the material into a mine void for progressive rehabilitation would be higher than the net cost (operating cost less revenue) of the central case method, being the processing of this material, extracting the contained valuable critical minerals for sale and immediately returning the remaining material, mostly silica sand, back to the deposit void.
The mineral resources were constrained within a conceptual pit shell that used the assumptions listed in the table below. An assumed vertical slope was applied to the pit shells. The vertical slopes are attainable due to low depths of mineralization, unconsolidated material and the active reclamation process.
Mineral Resource Estimate
The Mineral Resource estimate for Titan was prepared by Marshall Miller & Associates, Inc. in accordance with S-K 1300 and is current as at June 30, 2026. Mineral Resources are reported above a 0.4% THM cut-off grade and are reported on an in situ basis. Mineral Resources are reported exclusive of Mineral Reserves.
Mineral Resources are based on sonic drill data collected in 2020, 2021 and 2022, including 140 drill holes, 3,360 heavy mineral assay samples and 269 QEMSCAN mineralogical determinations. The block model was developed using Vulcan software and grade interpolation was completed using inverse distance weighting to the second power. The geological model includes overburden, waste, Upper McNairy, Lower McNairy and Coon Creek Formation units.
The reasonable prospects for economic extraction for the mineral resources were based on the parameters listed in the table below.
Mineral resources are reported exclusive of mineral reserves. Portions of the reported mineral resources may be converted to mineral reserves in the future; however, mineral resources do not have demonstrated economic viability and there can be no assurance that all or any part of a mineral resource will ultimately be converted to a mineral reserve.
59

Table of Contents
Assumptions Used in Defining Prospects of Economic Extraction
ParameterUnitsValue
Commodity price
RutileUS$/t1,425
IlmeniteUS$/t340
Rare earth mineral concentrateUS$/t10,678
Zircon ConcentrateUS$/t912
Metallurgical recovery
Rutile%70.6 (81.2% mineral in product)
Ilmenite%85.0 (95.8% mineral in product)
Heavy rare earth concentrate%89.5 (87.8% mineral in product)
Zircon concentrate%91.2 (46.9% mineral in product)
Operating costs
Mining costUS$/m37.23
Processing costUS$/ROM t3.09
Transport costUS$/ROM t1.00
Reclaim/rehandleUS$/ROM tIncluded in Mining cost
Incremental in pit managementUS$/ROM tIncluded in Mining cost
General and administrative costUS$/ROM t0.95
DewateringUS$/ROM t0.30
Wetlands mitigation costUS$/Ha60,000
Stream mitigation costUS$/linear m1,425
Royalty%5
Mineral Resources that are not Mineral Reserves do not have demonstrated economic viability. Inferred Mineral Resources are subject to greater uncertainty and may not be converted to Mineral Reserves.
Titan Project - Mineral Resources as of June 30, 2026
Mineral Resource EstimateTHM assemblage
In situ Metric TonsTHMTHMZirconRutileIlmeniteREE
(%)(t)(%)(%)(%)(%)
Exclusive of Reserve
Measured (M)96,851,000 1.51,489,000 10.49.240.11.2
Indicated (I)102,190,000 2.02,013,000 9.810.238.91.5
Total M+I199,041,000 1.83,502,000 10.09.839.41.4
Inferred (Inf)97,832,000 1.81,774,000 9.39.638.01.2
Total M+I+Inf296,872,000 1.85,276,000 9.89.739.01.3
1.Mineral resources are reported using the definitions set out in Regulation S-K 1300 and are current as at June 30, 2026. Mineral resources are reported on an in-situ basis, exclusive of mineral reserves.
2.The third-party firm responsible for the estimate is Marshall Miller & Associates, Inc.
3.Mineral resources are reported within a conceptual pit shell that uses the key assumptions summarized in the table above.
4.Mineral resources are reported above a COG of 0.4% THM.
5.Property contains 199.0 Mt of mineral resources (Measured + Indicated) exclusive of mineral reserves.
6.Estimates have been rounded.
60

Table of Contents
Mineral Reserve Estimate
The Mineral Reserve estimate for Titan was prepared by Marshall Miller & Associates, Inc. in accordance with S-K 1300 and is current as at June 30, 2026. QPs considered pertinent modifying factors, inclusive of geological, environmental, regulatory, and legal factors, in converting a portion of the measured and indicated mineral resources to mineral reserves.
Optimization Parameters
ItemUnitValue
Geometry
Coordinate System
-UTM-16N
Overburden slope
°26.6
Face slopes
°35
Inter-ramp slope
°29
Overall slope
°27.4
Berm width
m5
Batter angle
°35
Berm (batter) height (working)
m10
Berm (batter) height (final wall)
m10
Minimum mining width
m25
Ramp width
m25
Total depth
m55
Block dimension X
m25
Block dimension Y
m25
Block dimension Z
m1.542
Mining
Production rate
ton/year3,529,000 to 10,588,000
Production schedule
Hours/Year8,760
Production schedule efficiency
%85
Ramp grade
%10
Concentrator recovery
Rutile
%70.6 (81.2% mineral in product)
Ilmenite
%85.0 (95.8% mineral in product)
Heavy rare earth concentrate
%89.5 (87.8% mineral in product)
Zircon
%91.2 (46.9% mineral in product)
Cutoff grade (COG)
%0.85 THM
Specific gravity (ore)
-1.57
Specific gravity (waste rock)
-1.72
Specific gravity (Coon Creek Formation)
-1.54
Specific gravity (soil)
-1.72
Restrictions
-floodplain & wetlands
Swell factor
%12
Pit Loss/Dilution
%10 (in addition to low-grade interburden)
Vertical rate of advance
m90
Battery limits
locationROM Pile
Financial
Mining cost
US$/m37.23
Transportation cost
US$/ROM t1.00
61

Table of Contents
Processing cost
US$/ROM t3.09
Reclaim/rehandle
US$/ROM tIncluded in mining cost
Incremental in pit management
US$/ROM tIncluded in mining cost
General and administrative cost
US$/ROM t0.95
Dewatering
US$/ROM t0.30
Wetlands mitigation cost
US$/ha60,000
Stream mitigation cost
US$/ linear m1,425
Royalty
%5
Sales price rutile
US$/t1,425
Sales price ilmenite
US$/t340
Sales price rare earth concentrate
US$/t10,678
Sales price zircon concentrate
US$/t912
Mineral Reserves are reported on a run-of-mine basis at a 0.85% THM cut-off grade. The reference point for the Mineral Reserve estimate is material delivered to the process facilities. The Mineral Reserve estimate is based only on Measured and Indicated Mineral Resources. Inferred Mineral Resources were treated as waste and were not used to support Mineral Reserves or economic viability. The Titan DFS reports total Proven and Probable Mineral Reserves of 117.0 million metric tons at 3.2% THM containing approximately 3.7 million metric tons of THM at a 0.85% THM cut-off. Approximately 80% of the Mineral Reserve estimate is classified as Proven.
Titan Project Mineral Reserve Estimate

UnitGrand Total ROM Metric TonsTHM assemblage
THMTHMZirconRutileIlmeniteREE
ProvenProbableTotal(%)(t)(%)(%)(%)(%)
Upper McNairy24,565,000 2,415,000 26,980,000 2.3620,000 6.26.223.60.2
Lower McNairy68,740,000 21,307,000 90,047,000 3.433,086,000 12.710.548.31.9
Total93,306,000 23,722,000 117,027,000 3.23,706,000 11.69.844.21.6
1.Mineral reserves are reported using the definitions set out in Regulation S-K 1300 and are current as at June 30, 2026. Mineral reserves are reported on a ROM basis.
2.The third-party firm responsible for the estimate is Marshall Miller & Associates, Inc.
3.Mineral reserves are reported within a finalized mine design pit shell that uses the key Optimization Parameters summarized in the table above.
4.Mineral reserves are reported above a COG of 0.85% THM.
5.Ilmenite includes leucoxene, pseudorutile, and ilmenite and REE includes monazite, xenotime, and unclassified REE.
6.Estimates have been rounded.

Mining Methods
The Titan mine plan contemplates conventional surface mining using excavators and articulated haul trucks. Mining activities are expected to be conducted by a mining contractor. Mining contractors are expected to provide mobile mining equipment, operating labor and related support equipment.
The mine plan supports an initial 14-year mine life based entirely on Proven and Probable Mineral Reserves. Phase 1 production is planned at approximately 3.5 million metric tons per year of run-of-mine ore during Years 1 through 4. Phase 2 production is planned at approximately 10.0 million metric tons per year of run-of-mine ore during Years 5 through 14.
Run-of-mine material is expected to be transported from the mining areas to the Wet Concentrator Plant using conveyor systems. Dewatered tailings and waste material will be progressively returned to mined-out pits for backfilling and rehabilitation, reducing the long-term surface footprint associated with tailings storage.
62

Table of Contents
Mineral Processing and Metallurgical Testing
Metallurgical testwork completed in 2021 and 2023 supports the selected processing flowsheet. The testwork demonstrated that Titan mineralization is amenable to conventional mineral sands processing technologies and that saleable ilmenite, rutile, zircon concentrate and HREC products can be produced.
The process plant is divided across two principal sites: the Wet Concentrator Plant site and the Mineral Separation Plant and Rare Earth Plant site. The main process areas include the Mining Unit Plant, Feed Preparation Plant, Wet Concentrator Plant, Concentrate Upgrade Plant, Tailings Dewatering Circuit, Rare Earth Plant and Mineral Separation Plant.
The flowsheet uses conventional mineral sands technologies, including scrubbing, screening, desliming, wet gravity concentration, flotation, wet shaking tables, electrostatic separation and magnetic separation. The Rare Earth Plant is designed to recover an HREC that is heavy rare earth-dominant by value. The Mineral Separation Plant is designed to produce ilmenite, rutile and zircon products.
Metallurgical Recoveries and Product Quality
The overall performance estimates assume run-of-mine material containing approximately 3.2% in-size heavy mineral, including approximately 11.7% zircon, 9.8% rutile, 44.1% ilmenite and 1.6% rare earth elements within the heavy mineral assemblage, together with approximately 1.3% oversize material (>600 microns) and 14.8% slimes (<44 microns).
These overall performance estimates used the modelled grades and recoveries, as well as data estimated from metallurgical testwork for distribution of TiO2 between ilmenite/leucoxene and rutile and ratio of CeO2 to TREO, and are outlined below:
Metallurgical Recovery and Product Quality Summary

ProductRecoveryProduct Quality
Rutile64.3%91.1% TiO2
Ilmenite80.7%62.5% TiO2
HREC91.4%61.4% TREO
Zircon concentrate91.8%34.4% ZrO2

Titan HREC Estimated TREO Distribution (%)

CeO₂
Dy₂O3
Er₂O3
Eu₂O3
Gd₂O3
Ho₂O3
La₂O3
Lu₂O3
Nd₂O3
Pr₆O11
Sc₂O3
Sm₂O3
Tb₄O7
Tm₂O3
Y₂O3
Yb₂O3
TREO
25.150.900.390.161.490.1611.720.0411.303.080.0042.050.200.054.390.3261.40
Infrastructure

The planned Project infrastructure includes mining areas, conveyor systems, Wet Concentrator Plant, Mineral Separation Plant, Rare Earth Plant, water systems, electrical systems, process and non-process infrastructure, administration and maintenance facilities, laboratories and product handling facilities.
The Wet Concentrator Plant and mining pits are located in Benton and Carroll Counties, Tennessee, with the proposed Wet Concentrator Plant located in Carroll County. The proposed Rare Earth Plant and Mineral Separation Plant are located in Benton County outside the municipal limits of Camden. The distance between the Wet Concentrator Plant and the Rare Earth Plant / Mineral Separation Plant site is approximately 29 kilometers using county, state and U.S. routes.
The Project is expected to use existing regional infrastructure where available. Electricity is expected to be supplied via 161-kV transmission infrastructure near the Project area. The Company intends to evaluate renewable power options from regional power suppliers. Water is expected to be sourced from a combination of surface water and groundwater inflows, with potable water supplied through a well at the Wet Concentrator Plant site and municipal water at the Mineral Separation Plant site.
63

Table of Contents
Market Studies and Product Pricing

Market analysis and commodity price projections provided by IperionX are derived from independent third-party market studies. Titanium and zircon mineral sands market conditions and price forecasts are based on the Titanium Feedstock Price Forecast (Issue 3, 2025) prepared by TZ Minerals International Pty Ltd (TZMI). HREC pricing is based on the IperionX Rare Earth Concentrate Calculations (April 2026) prepared by Argus Media and Expected Payability for Rare Earth Concentrates from IperionX's Titan Project (April 30, 2026) prepared by Mine Value Partners. Magnet rare earth oxide supply and demand data referenced in this sub-section are based on the ‘Rare Earth Magnet Market Outlook to 2040’ report (Q4 2025) prepared by Adamas Intelligence.
The Titan DFS describes Titan as strategically significant to U.S. critical minerals supply chains because it is expected to produce titanium minerals, zircon and rare earth products from a domestic U.S. mineral resource base. The Project’s HREC contains strategically important rare earth elements, including dysprosium, terbium and yttrium.
Titan Product Prices
Titan Product Prices used in economic analysis
Value (US$/t)(1)
Rutile LOM Average Price 1,471
Ilmenite LOM Average Price 353
HREC LOM Average Price 41,759
Zircon Concentrate LOM Average Price 829
Note:
(1) Real 2026 terms

Environmental, Permitting and Social Considerations

Environmental baseline studies were completed between 2020 and 2025 and included wetland delineation, hydrologic field work, threatened and endangered species habitat surveys, cultural resources background research, groundwater and surface water studies, waste and tailings characterization and other environmental studies.
The Tennessee Department of Environment and Conservation granted the Company a Surface Mining Permit (OM-70711-01) and a National Pollutant Discharge Elimination System Permit (TN0070711) on August 14, 2023. The Surface Mining Permit is a five-year permit and will require renewal and updates, with the first renewal required by August 14, 2028. The Titan DFS states that the Mineral Separation Plant and Rare Earth Plant are not currently permitted and will require additional permits and authorizations.
The Company expects that existing permits and agency approvals will require modification to incorporate the full mine plan. Additional permits and approvals may be required under federal, state and local laws, including those relating to wetlands, streams, water discharge, air emissions, endangered species, cultural resources, water withdrawal, construction and industrial stormwater and mine reclamation.
The waste and tailings disposal plan is integrated with the mine plan. Tailings are expected to be filtered and placed as backfill into mined-out pits as mining progresses, supporting progressive reclamation and reducing the long-term surface disturbance footprint.
Capital Costs
The Titan DFS capital cost estimate was prepared in accordance with the Project’s phased development approach and is reported in U.S. dollars. The estimate is described as a Class 3 estimate with a target accuracy range of ±15% and includes a nominal 10% contingency allowance applied to the direct and indirect costs of the design and supply estimate. Total Project capital is estimated at $381.3 million, consisting of Phase 1 capital of $228.1 million and Phase 2 incremental capital of $153.2 million.
64

Table of Contents
Capital Cost Summary
Item
Phase 1
400 tph(1)
(US$)
Phase 2
Incremental 800 tph
(US$)
Total
Phase 1 + Phase 2
 (US$)
Direct Costs
1000 - Site Wide - Mining23,237,857 347,042 23,584,929 
1000 - Site Wide - Non process infrastructure18,316,630 - 18,316,630 
1000 - Site Wide - Balance of Scope18,499,189 3,191,001 21,690,190 
2000 - Feed Preparation Plant10,086,726 15,587,107 25,673,833 
3000 - Wet Concentrator Plant44,143,921 62,212,480 106,356,401 
4000 - Mineral Separation Plant25,058,422 33,435,617 58,494,039 
5000 - Rare Earth Plant33,181,069 1,240,555 34,421,625 
8000 - Mining Unit Plant1,304,793 2,133,248 3,438,041 
Direct Costs Sub-total173,828,608 118,147,079 291,975,688 
Indirect Costs
EPCM22,414,018 14,663,588 37,077,606 
Temporary Facilities and Services2,240,370 1,247,800 3,488,170 
Vendor's ME Installation Assistance 250,000 190,000 440,000 
Contractor's Pre-Commissioning Assistance186,342 244,769 431,111 
Commissioning & Testing1,898,000 1,620,320 3,518,320 
Spare Parts928,893 1,196,017 2,124,910 
First Fills143,330 223,407 366,737 
Indirect Costs Sub-total28,060,953 19,385,901 47,446,854 
TOTAL No CONTINGENCY nor OWNER'S COSTS201,889,562 137,532,980 339,422,542 
Owner's Costs5,598,338 1,637,627 7,235,964 
Contingency20,638,419 14,027,432 34,665,851 
TOTAL CAPEX 400tph and 800tph228,126,319 153,198,038 381,324,357 
Notes:
(1) metric tons per hour (tph)
Totals may not sum due to rounding.

Operating Costs
Operating cost estimates include mining, process plant operations, product transport and royalties. The operating cost estimate was prepared in U.S. dollars and has an expected accuracy of ±15%. Average Phase 1 operating costs are estimated at $13.31 per metric ton of ore. Average Phase 2 operating costs are estimated at $10.57 per metric ton of ore, reflecting the benefits of increased production scale.
Contingency
A nominal 10% contingency allowance was applied to the direct and indirect costs of the design and supply estimate. Contingency was not added to budget-estimate items. This allowance represents contractor’s contingency applicable to a fixed-price design and supply contract and sits outside of Owner’s contingency risk. Total contingency included in the capital cost estimate is approximately $34.7 million (Phase 1: $20.6 million; Phase 2 incremental: $14.0 million).
65

Table of Contents
Operating Cost Summary

Operating CostsUS$/yearUS$/t ore
Phase 1 AveragePhase 2 AveragePhase 1 AveragePhase 2 Average
Mining 21,505,614 64,334,874 6.32 6.22 
Process Plant15,520,852 27,967,350 4.56 2.70 
Product Transport3,558,600 8,900,738 1.05 0.86 
Royalties4,747,628 8,052,134 1.39 0.78 
Total Operating Costs45,332,694 109,255,096 13.31 10.57 
Note: Totals may not sum due to rounding.

Economic Analysis

The economic analysis in the Titan DFS was prepared on an unlevered basis and assumes 100% equity financing. All financial results are expressed in real U.S. dollars. A real discount rate of 8% was applied. The analysis used product pricing derived from external market studies and Company analysis.
The Titan DFS reports that the Project generates approximately $1.93 billion of free cash flow over the life of mine and total EBITDA of approximately $2.80 billion. The after-tax financial model yields an NPV at an 8% discount rate (NPV8) of $813 million, an after-tax internal rate of return of 39.4% and an after-tax payback period of 3.63 years.
The Project is most sensitive to product pricing and grade, followed by operating costs and capital costs. Actual financial outcomes may differ materially from the feasibility study results due to changes in product prices, capital costs, operating costs, permitting conditions, financing terms, tax assumptions, metallurgical recoveries, production rates, construction schedule and other factors.
Feasibility Study Financial Results

DFS Financial ResultsUoMValue
Total EBITDAUS$ million2,804
Pre-Tax NPV8
US$ million1,016
Pre-Tax IRR%42.6
Pre-Tax Payback PeriodYear3.49
After-Tax NPV8
US$ million813
After-Tax IRR%39.4
After-Tax Payback PeriodYear3.63
NPV/Initial CapitalUS$3.56
NPV/Total CapitalUS$2.13

Principal Risks and Uncertainties

The Titan Project is subject to risks typical of mineral development projects. The most significant risks include commodity price volatility; changes to market demand and product payability; permitting delays or conditions; uncertainty regarding wetlands, streams, water management and environmental compliance; contractor performance; availability of sufficient electrical power for the Phase 2 expansion; process performance, particularly in desliming, tailings dewatering and mineral separation; cost escalation; logistics constraints; supply chain availability; construction execution; financing availability; and changes in law, regulation, taxation or government policy.
The Titan DFS specifically identifies risks relating to potential commodity pricing declines, water discharge compliance, mining contractor underperformance, permitting or mitigation measures associated with streams and wetlands, Tennessee Valley Authority power availability, desliming circuit performance, high slimes material affecting throughput, and the ability to maintain appropriate building temperature and humidity for mineral separation plant performance.
66

Table of Contents
Development of Titan remains subject to final investment decision, securing financing on acceptable terms, completion of detailed engineering, procurement and construction planning, receipt or modification of required permits and approvals, successful construction and commissioning, and achievement of expected operating performance.
Opportunities
The Titan DFS identifies several project opportunities, including potential expansion of property holdings, upgrading Inferred Mineral Resources through additional drilling and mining study work, review of floodplain buffer allocations, potential variation of cut-off grade to optimize annual run-of-mine tonnage, expansion of optimized pit shells under different revenue factor assumptions, and additional resource potential in areas outside the current Study Area.
Processing opportunities include further modularization, optimization of piping pre-assembly and pipe rack design, additional logistics and transport studies, and further confirmatory metallurgical testwork to support detailed design, vendor guarantees and execution readiness.
Historic Pricing
Historic and forecast product prices ($/t, 2026 real terms, rounded).
ProductHistoric
2021 – 2025*
(annual average,
US$/t)
Forecast
2028 – 2042*
(annual average
US$/t)
Rutile1,335 1,471 
Chloride Ilmenite318 353 
Zircon (premium)1,818 1,907 
*Source: Argus Media and TZMI. Historic prices converted to real 2026 U.S. dollars. Forecast averages derived from TZMI (Issue 3, 2025) base case. Zircon prices were used to calculate zircon concentrate prices.

67

Table of Contents
Historic and forecast individual REO prices ($/kg, 2026 real terms, rounded).
Rare Earth OxideHistoric
2021 – 2025*
(annual average
US$/kg)
Forecast
2028 – 2042*
(annual average
US$/kg)
La₂O₃1.0 0.70 
CeO₂1.3 2.24 
Pr₆O₁₁93.7 158.64 
Nd₂O₃97.3 151.98 
Sm₂O₃2.6 7.65 
Eu2O3
30.1 17.32 
Gd₂O₃46.4 692.41 
Tb₄O₇1,429 3,462 
Dy₂O₃355 952.07 
Ho₂O₃123 73.99 
Er₂O₃45.9 66.14 
Yb₂O₃15.5 20.53 
Lu₂O₃871 1,074 
Y₂O₃8.2 778.96 
*Source: Historic REO prices from Argus Media (2021-2025 annual averages, real 2026 US dollars); Forecasted prices from Argus Media, IperionX Rare Earth Concentrate Calculations (April 2026), 2028-2042 simple average with 2041-2042 held flat at 2040 values.
Qualified Persons and Technical Report Summary Reference
The Titan DFS was prepared by Marshall Miller & Associates, Inc., Karst Geo Solutions, LLC, Mineral Technologies Pty Ltd and Primero Group Americas Inc. Marshall Miller & Associates, Inc. fulfilled the role of report integrator and was responsible for Mineral Resource and Mineral Reserve estimates, mine planning and mining cost estimation. Karst Geo Solutions, LLC was responsible for exploration results. Mineral Technologies Pty Ltd was responsible for mineral processing and metallurgical testing, with Etienne Raffaillac, MAusIMM acting as individual QP for the processing sections. Primero Group Americas Inc. was responsible for non-process infrastructure, related cost estimates and integration of the financial model.
The technical disclosure contained in this section is derived from the Titan DFS and should be read together with the complete Titan DFS, which is incorporated by reference as an exhibit to this annual report. Each QP is responsible only for the technical disclosure within such QP’s area of responsibility as set forth in the Titan DFS.
Cautionary Note Regarding Forward-Looking Technical Information
The Mineral Resource estimates, Mineral Reserve estimates, production targets, mine plan, metallurgical recovery assumptions, product specifications, capital cost estimates, operating cost estimates, economic analysis, development schedule and other technical information regarding Titan include forward-looking statements. These statements are based on assumptions contained in the Titan DFS and are subject to known and unknown risks, uncertainties and other factors that may cause actual results to differ materially from those expressed or implied.
Factors that could cause actual results to differ materially include changes in geological interpretation; changes in Mineral Resource and Mineral Reserve estimates; uncertainty regarding mining conditions; metallurgical performance; construction and commissioning performance; product pricing; product payability; capital and operating costs; inflation; foreign exchange; permitting, regulatory and environmental requirements; availability and terms of financing; contractor performance; supply chain disruption; availability of power, water, labor and equipment; weather events; and other risks described under “Risk Factors” and elsewhere in this annual report.
68

Table of Contents
The Company does not undertake any obligation to update forward-looking technical information except as required by applicable securities laws.
Comparison of mineral resources as of June 30, 2026 and June 30, 2025
During fiscal 2026, the Company completed the Titan DFS and reported its maiden Proven and Probable Mineral Reserve estimate of 117.0 Mt at 3.2% THM. No Mineral Reserves were reported in the prior year. The Mineral Reserve estimate was derived from portions of the Measured and Indicated Mineral Resources following application of the modifying factors and feasibility-level technical and economic analysis described in the Titan Project Technical Report Summary.
The Company's Mineral Resources, which are reported exclusive of Mineral Reserves in accordance with S-K 1300 of Regulation S-K, decreased from 431 Mt at 2.2% THM in the prior year (when no Mineral Reserves had been declared) to 296.9 Mt at 1.8% THM as of June 30, 2026. The decrease was primarily attributable to the conversion of a portion of the Measured and Indicated Mineral Resources to Mineral Reserves following completion of the DFS. Additional changes resulted from updates to the geological model, mineral assemblage data, resource estimation methodology and resource classification criteria incorporated into the June 2026 Mineral Resource estimate.
The updated estimate also introduced a Measured Mineral Resource category of 96.9 Mt at 1.5% THM and revised the distribution of metric tons among the Measured, Indicated and Inferred classifications based on the QPs' assessment of geological confidence and continuity. There was no depletion attributable to mining activities as the Titan Project was not in production during the reporting period.
69

Table of Contents
Comparison of Current and Prior Year Mineral Resource and Mineral Reserve Estimates (exclusive of reserves)
CategoryJune 30, 2026Prior YearExplanation of Material Change
Measured Mineral Resource
(exclusive of reserves)
96.9 Mt at
1.5% THM
Nil / N.A.
Initial classification of Measured Mineral Resources following completion of the June 2026 DFS and incorporation of updated geological modeling, mineral assemblage data and resource classification criteria.
Indicated Mineral Resource
(exclusive of reserves)
102.2 Mt at 2.0% THM241 Mt at
2.2% THM
Decrease reflects conversion of portions of the Indicated Mineral Resource to Mineral Reserves together with reclassification based on updated geological interpretation and resource modeling completed for the June 2026 DFS.
Total Measured +
Indicated Mineral Resource
(exclusive of reserves)
199.0 Mt at 1.8% THM241 Mt at
2.2% THM
Change reflects reserve conversion and revisions arising from updated geological modeling, mineral assemblage data and resource classification associated with the June 2026 DFS.
Inferred Mineral Resource
(exclusive of reserves)
97.8 Mt at
1.8% THM
190 Mt at
2.2% THM
Decrease reflects updated geological interpretation, resource estimation methodology and reclassification of certain areas supported by additional technical information incorporated into the June 2026 DFS.
Total Mineral Resource
(exclusive of reserves)
296.9 Mt at 1.8% THM431 Mt at
2.2% THM
Decrease primarily reflects conversion of Measured and Indicated Mineral Resources into newly established Mineral Reserves, together with revisions resulting from updated geological modeling, mineral assemblage data and resource classification. Mineral Resources are reported exclusive of Mineral Reserves.
Proven Mineral Reserve93.3 Mt Nil / N.A.
Maiden Proven Mineral Reserve estimate established following completion of the June 2026 DFS and application of modifying factors to Measured Mineral Resources.
Probable Mineral Reserve23.7 MtNil / N.A.
Maiden Probable Mineral Reserve estimate established following completion of the June 2026 DFS and application of modifying factors to Indicated Mineral Resources.
Total Proven +
Probable Mineral Reserve
117.0 Mt at 3.2% THMNil / N.A.
Reflects establishment of the Company's first Mineral Reserve estimate following completion of the June 2026 DFS. No Mineral Reserves were reported in the prior year.
Note: Totals may not sum due to rounding.
Mineral resource internal controls
We maintain internal controls and procedures designed to support the preparation, review and documentation of the information used in the estimation of our Mineral Resources and Mineral Reserves. Geological, geotechnical, metallurgical, mining, environmental, permitting and economic data utilized in resource and reserve estimation are reviewed by appropriately qualified personnel, including QPs engaged by us, and are subject to established internal review and peer-review processes.
QPs evaluate the appropriateness of the assumptions, methodologies, input parameters and modifying factors used in the estimation and classification of Mineral Resources and Mineral Reserves and assess whether such estimates are reasonable based on the available data and prevailing technical and economic conditions.
Mineral Resource and Mineral Reserve estimates are inherently uncertain and are based on the interpretation of geological data, sampling results, engineering analyses, commodity price assumptions, operating and capital cost estimates, recovery assumptions and other factors that may prove to be inaccurate. Inferred Mineral Resources have the lowest level of geological confidence and may not be converted to Mineral Reserves. In addition, Mineral Reserves are based on the application of modifying factors and assumptions that may change over time.
70

Table of Contents
As additional information becomes available through exploration, development, mining operations, technical studies or changes in economic, regulatory, environmental or market conditions, Mineral Resource and Mineral Reserve estimates may be revised. Any material reduction in our Mineral Resources or Mineral Reserves, or a failure to realize the estimated grade, tonnage, recovery rates or economic assumptions underlying such estimates, could adversely affect our business, financial condition, results of operations, cash flows and future profitability.
Exploration and development plans
During the next twelve months, we may undertake further drilling to expand and increase confidence in the Titan Project deposit, as well as further metallurgical test work, hydrology and geotechnical studies, and the integrated Atlas-Titan economic assessment targeted for completion by the end of 2026, which may result in updates to our Mineral Resource and Mineral Reserve estimates.
The Titan DFS, which is current as at June 30, 2026, is incorporated by reference as an exhibit to this annual report on Form 20-F and supports our Mineral Resource and Mineral Reserve estimates. The Titan DFS demonstrates the Titan Project’s potential to be a domestic U.S. producer of titanium minerals, zircon concentrate and heavy rare earth concentrate for U.S. defense, permanent magnet, advanced manufacturing and titanium metal supply chains.
Following completion of the DFS, our project execution strategy is centered on a modular plant delivery approach designed to optimize schedule, cost certainty, and risk management. Subject to a Final Investment Decision, activities will progress through permitting, financing, and detailed engineering, with priority placed on early finalization of modular design packages to support off-site fabrication. Module fabrication and assembly will be undertaken in parallel with site civil works and infrastructure development, enabling a streamlined construction phase through staged delivery and rapid on-site installation. We will also prioritize long-lead equipment procurement and integrated logistics planning to ensure alignment between fabrication, transport, and site readiness. This approach is expected to reduce overall construction duration and facilitate efficient commissioning and ramp-up to steady-state operations, while maintaining appropriate contingencies and interface management across all workstreams.
Subject to market conditions and our ability to obtain financing and the required permits and approvals, our business plan for the Titan Project is to become a strategic, U.S. domestic source of high-quality and sustainable titanium and other critical mineral feedstocks, including rare earths, to the U.S.
We plan to effect our business plan as described in “Item 4. Information on the Company - B. Business Overview - Exploration and Development Plans.”
ITEM 4A.    UNRESOLVED STAFF COMMENTS
Not applicable.
ITEM 5.    OPERATING AND FINANCIAL REVIEW AND PROSPECTS
The following discussion and analysis should be read in conjunction with our financial statements and related notes included elsewhere in this annual report on Form 20-F. The following discussion contains forward-looking statements that reflect our plans, estimates and beliefs. Our actual results could differ materially from those discussed in the forward-looking statements. Factors that could cause or contribute to these differences include those discussed below and elsewhere in this annual report on Form 20-F, particularly those in the section of this annual report on Form 20-F entitled “Risk Factors.” The consolidated general purpose financial statements of the consolidated Company have been prepared in accordance with IFRS as issued by the IASB.
Critical accounting policies adopted in the preparation of this financial report are presented below and have been consistently applied unless otherwise stated.
Our financial statements for fiscal 2026 are presented in U.S. dollars and have been prepared in accordance with IFRS.
This annual report includes consolidated financial statements for the years ended June 30, 2026, 2025, and 2024. However, as permitted by Instruction 6 to Item 5 of Form 20-F, a discussion of the year ended June 30, 2025 and 2024 has been omitted because such discussion was already included in Item 5 of IperionX’s annual report on Form 20-F for the year ended June 30, 2025.
71

Table of Contents
Business Strategy
IperionX is building a leading American titanium metal and critical material company - using patented titanium technologies to produce high performance titanium alloys, from titanium minerals or scrap titanium, at lower energy, cost and carbon emissions.
We are no longer seeking to establish whether HAMR™ can produce high-quality titanium at commercial scale; we are focused on how quickly and reliably we can ramp production, convert powder into qualified products and build recurring customer revenues. Following year-end, we strengthened the balance sheet through a capital raise, completed the Atlas acquisition and announced our intention to pursue a U.S. redomiciliation, subject to the required approvals, to align our corporate structure with our American operations and growth strategy. What makes IperionX unusual is the combination of proven breakthrough technology, a government-backed scale-up pathway, a domestic feedstock strategy, high-performance customer products and a second, high-value critical-minerals platform. These capabilities reinforce one another and provide multiple pathways to create long-term value.
Our commercial strategy prioritizes high-value, repeat-order products for which incumbent titanium supply chains are expensive, slow and material-intensive. Fasteners, impellers, track pins, brackets, gears, enclosures, plate and other products are attractive because IperionX's low-cost domestic powder and near-net-shape manufacturing can reduce machining, shorten lead times and generate materially less titanium waste while delivering high performance.
Customer programs advanced from material samples into finished-component testing, prototype purchase orders and funded scale-up development. U.S. Army and independent testing validated IperionX fasteners above comparable Society of Automotive Engineers (SAE) Grade 8 steel and standard aerospace titanium benchmarks. We also advanced programs with Carver Pump, American Rheinmetall, Ford and consumer-electronics customers. The U.S. Army extended the fastener program through a prototype purchase order for the Joint Light Tactical Vehicle (JLTV) and associated trailer. In addition, the U.S. Army extended funding for scaling production of a range of titanium mill products and components. This is the commercialization pathway: prove performance, qualify the product, establish repeatable manufacturing and convert validated programs into recurring production.
We plan to effect our business plan as described in “Item 4B. Information on the Company – Strategies.”
A.Operating Results
Financial Overview of IperionX
The following discussion relates to our consolidated results of operations, financial condition and capital resources. You should read this discussion in conjunction with our consolidated financial statements and the notes thereto incorporated by reference in this annual report.
Year ended
June 30,
2026
Year ended
June 30,
2025
US$US$
Continuing operations
Research and development costs(25,193,985)(12,748,973)
Exploration and evaluation expenses(5,380,636)(2,894,369)
Corporate and administrative expenses(25,917,366)(10,686,376)
Business development expenses(4,049,905)(3,373,992)
Share-based payment expenses(9,166,334)(9,568,191)
Finance income1,871,307 3,550,633 
Finance costs(3,465,223)(306,250)
Other income and expenses4,534,380 678,843 
Loss before income tax(66,767,762)(35,348,675)
72

Table of Contents
Year Ended June 30, 2026 Compared to Year Ended June 30, 2025
Research and development expenses
Research and development expenses encompass expenditures incurred by the Company in connection with the research and development of the Company’s titanium processing technologies, including salaries and related personnel expenses, subcontractor expenses, patent registration expenses, materials, and other related research and development expenses associated with processing operations.
Research and development costs have increased by $12.4 million from $12.7 million for fiscal 2025 to $25.2 million for fiscal 2026 principally due to increased staff costs and overheads to support our increased processing operations at our IPF in Utah and our TPF and AMC in Virginia, including commercialization and scale-up activities, materials, development of the GenX™ next-generation continuous HAMR™ platform, expansion of manufacturing capabilities and advancement of customer qualification programs.
Exploration and evaluation expenses
Exploration and evaluation expenses encompass expenditures incurred by the Company in connection with the exploration for and evaluation of mineral resources before the technical feasibility and commercial viability of extracting a mineral resource are demonstrable (other than costs associated with acquiring our exploration properties, which are capitalized), including drilling and sampling costs, technical and engineering studies, permitting costs and overhead costs associated with maintaining our exploration headquarters.
Exploration and evaluation expenses increased by $2.5 million from $2.9 million for fiscal 2025 to $5.4 million for fiscal 2026 principally due to an increase in technical and engineering work associated with the Titan Project.
Corporate and administrative expenses
Corporate and administrative expenses encompass overhead costs, such as maintaining our corporate headquarters, public company costs, audit and other fees for professional services, IT licenses and legal compliance.
Corporate and administrative expenses increased by $15.2 million from $10.7 million for fiscal 2025 to $25.9 million for fiscal 2026, principally reflecting increased personnel and employee-related costs, ERP system implementation and process enhancement initiatives, higher professional fees related to legal, audit, accounting and regulatory compliance matters, additional corporate infrastructure and overhead expenses required to support the continued growth, operational scale-up and strategic initiatives of the Company during fiscal 2026, and a non-recurring non-cash expenditure settled with share issuance.
Business development expenses
Business development expenses encompass costs of our customer engagement expenses, our secondary listing on Nasdaq, our investor relations expenses, including costs for press releases, maintenance of the Company’s website and our other investor marketing and information initiatives, and other fees for corporate advisory services.
Business development expenses increased by $0.7 million from $3.4 million for fiscal 2025 to $4.0 million for fiscal 2026. The nature and level of business development expenses remained largely consistent between both financial periods.
Share-based payment expense
Share-based payment expense encompasses expenses incurred by the Company in connection with ordinary shares, Restricted Stock Units, Unlisted Options and Performance Rights granted by the Company to officers, employees, consultants and other key advisors as part of remuneration and incentive arrangements.
Share-based payment expenses from such remuneration arrangements decreased by $0.4 million from $9.6 million for fiscal 2025 to $9.2 million for fiscal 2026, principally due to the ongoing expensing of existing equity awards over their vesting period and the decision to grant approximately 10.2 million additional equity awards during fiscal 2025 to secure the services of directors, employees and consultants to support our continued growth.
73

Table of Contents
Finance income
Finance income encompasses interest income and foreign exchange gains.
Finance income decreased by $1.7 million from $3.6 million for fiscal 2025 to $1.9 million for fiscal 2026, principally due to a decrease of $1.3 million in foreign exchange gain related to transactions denominated in currencies other than the functional currency for each of our subsidiaries. In addition, we had a decrease of interest income of $0.3 million due to our decreased cash balances. We expect our foreign currency exchange gains and losses to continue to fluctuate in the future as foreign currency exchange rates change.
Finance costs
Finance costs encompass interest expenses and foreign exchange losses.
Finance costs increased by $3.2 million from $0.3 million for fiscal 2025 to $3.5 million for fiscal 2026, principally due to an increase of $3.2 million in foreign exchange losses related to transactions denominated in currencies other than the functional currency for each of our subsidiaries.
Other income and expenses
For fiscal 2026, we had $4.6 million in other income primarily related to income from the U.S. DoW for reimbursements for expenditures related to the Titan Project DFS in conjunction with the IBAS agreement. See Note 1(aa) to our audited consolidated financial statements for fiscal 2026, included in this annual report. The income was offset by a loss of $0.1 million relating to certain property, plant and equipment. For fiscal 2025, we had other income of $0.9 million principally from the IBAS program noted above, which was offset by a loss of $0.3 million relating to certain plant and equipment.
B.Liquidity and Capital Resources
The liquidity and capital resources discussion that follows contains certain estimates as of the date of this annual report of our estimated future sources and uses of liquidity (including estimated future capital resources and capital expenditures) and future financial and operating results. These estimates reflect numerous assumptions made by us with respect to general business, economic, regulatory, market and financial conditions, industry conditions and other future events, and matters specific to our businesses, all of which are difficult or impossible to predict and many of which are beyond our control. Please carefully read the risks discussed in “Risk Factors” contained in this annual report which describe significant risks and uncertainties that may affect us and our financial conditions.
Sources and Uses of Liquidity
We have commenced commercial titanium manufacturing operations but have not yet achieved production volumes sufficient to generate significant revenue or positive operating cash flow and expect to continue to incur losses during the research and development of our metals technologies, the commissioning and scale-up of our metals production facilities, and the exploration and evaluation of our mineral properties. Our operations have been financed by proceeds from issuances of ordinary shares and government funding.
At June 30, 2026, we had cash reserves of $35.2 million and net assets of $88.3 million. Our primary use of cash currently comprises the research and development of our metals technologies, the commissioning and scale-up of our metals production facilities, the exploration and evaluation expenditures relating to our mineral properties in the U.S. and administrative and corporate costs.
On July 7, 2026, we completed the placement of 2,275,000 new fully paid ADSs; each representing 10 ordinary shares, to raise gross proceeds of approximately $50 million before costs.
We incurred net losses of $66.8 million and $35.3 million for fiscal 2026 and fiscal 2025, respectively. We incurred net cash outflows from operating and investing activities of $63.5 million and $46.1 million for fiscal 2026 and fiscal 2025, respectively. We believe that we will continue to incur net losses until such time as we commence commercial scale production of titanium metals and/or critical minerals.
74

Table of Contents
If we decide to expand the capacity of our Titanium Manufacturing Campus, this might require significant additional funds, which would require future debt or equity financings. Similarly, if we ultimately make a decision to develop the Titan Project, this will require significant additional funds, which might require future debt or equity financings.
We may decide to pursue additional financing activities to facilitate development activities at the Titan Project and to fund working capital and expansion projects. We expect that such financing would result in additional sales or issuances of our ordinary shares or ADSs, but we also may engage in debt financing.
If we decide to raise capital by issuing equity securities, the issuance of additional ordinary shares or ADSs would result in dilution to our existing shareholders. We cannot assure you that we will be successful in completing any financings or that any such equity or debt financing will be available to us if and when required or on satisfactory terms.
Funding Requirements and Capital Expenditures
Our capital expenditures amounted to $19.0 million for fiscal 2026 and $17.6 million for fiscal 2025 which represents the purchase of property, plant, and equipment and exploration and evaluation properties.
Using our technologies, we have now transitioned to be a commercial producer of titanium metal products in the U.S. Titanium powder production commenced in 2024 and, by 2025, nameplate capacity has increased by 60% from 125 metric tons per year (tpa) to 200 tpa, driven by operational and technology process improvements with no additional capex.
During fiscal 2024, the U.S. DoW contracted to award the Company $12.7 million in funding under the DPA Title III authorities. This funding has been or will be applied towards the Titanium Manufacturing Campus to reach its initial Phase I production capacity of 125 tpa. Title to all assets purchased by IperionX with funds from the U.S. government vests with the U.S. government during the term of the technology investment agreement. At the end of the agreement, title may be transferred back to the Company subject to certain conditions.
The Company can acquire equipment or real property and designate the related purchase price as reflecting the U.S. government’s share of funding or the Company’s share of funding. To the extent designated as the U.S. government’s share, the Company is entitled to request reimbursement from time to time of the cost to purchase. Title to all equipment and real property acquired with federal funds vests with the U.S. government throughout the agreement. The U.S. government can elect to, but is not obliged to, transfer such title to all or a portion of the equipment or real property to the Company at the end of the agreement, which is scheduled to terminate on January 30, 2027, if the Company’s performance is satisfactory and provided that (a) the Company has used the equipment or real property for the authorized purposes of the project funding until funding for the project ceases, (b) the Company has not encumbered the equipment or real property without approval of the U.S. government, and (c) the Company has otherwise complied with the terms of the agreement. All equipment acquired with federal funds is tagged and segregated from equipment acquired with Company funds using a Property Control List that tracks all equipment purchased under the agreement. The Property Control List is submitted quarterly to the U.S. government and includes a description of the equipment, an asset number, manufacturer's serial number, ordered date, received date, installed date, location of the asset, and disposition date (if applicable). When the equipment arrives at our Virginia facility, it is tagged with an identification tag marked “Property of the Government of the United States” and which also included the serial number, asset number, and date received.
Through June 30, 2026, the Company has used government funds primarily to acquire equipment used to produce titanium powder from recycled sources of scrap at the construction site. The assets acquired are designed to establish, outfit and operationalize the TPF in accordance with the Statement of Work included in the DPA agreement. Although these assets are integral to the operation of the TPF, in the scenario in which the U.S. government does not relinquish these assets to the Company at the end of the agreement, the Company would seek to acquire or lease such equipment from the U.S. government, replace such equipment with new equipment using the Company’s existing cash reserves, or consider other options. See “Item 3. Key Information – D. Risk Factors - Risks Related to Our Business - Some of our assets used in the TPF are acquired with federal government funds. The U.S. government holds the title with respect to such assets.”
In February 2025, the Company was awarded up to $47.1 million by the U.S. DoW to strengthen the U.S. Defense Industrial Base by accelerating the scale-up of a resilient, low-cost, and fully-integrated U.S. mineral-to-metal titanium supply chain. The program will be matched with $49.2 million in funding by IperionX, for a total funding amount of $96.3 million. This funding aims to bolster the U.S. defense industrial base by developing a fully integrated, low-cost titanium supply chain sourced domestically. The project scope under the IBAS program had been revised to prioritize accelerated expansion of IperionX’s titanium metal and manufacturing production capacity at IperionX’s Virginia Titanium
75

Table of Contents
Manufacturing Campus. As part of the initial phase, the DoW obligated $5.0 million, and IperionX contributed $1.0 million, to expedite the Titan Project in Tennessee to ‘shovel-ready’ status, an important milestone in securing a new domestic source of titanium, rare earths and zircon critical minerals. Government reimbursements provided as grants are subject to conditional funding provisions. Grants for the initial phase are recognized as “Other income and expenses” in the consolidated statements of profit or loss and other comprehensive income (loss), once all conditions for reimbursement are met.
The DoW obligated an additional $12.5 million in August of 2025, $25.0 million in September of 2025 and $4.6 million in January of 2026, through the IBAS program to purchase orders for long-lead, major capital equipment required for the next stage of capacity scale-up to approximately 1,400 metric tons per year at the Virginia Titanium Manufacturing Campus.
As of June 30, 2026, the Company has incurred costs of $5.0 million toward the Titan Project DFS and has requested reimbursements from U.S. DoW in the amount of $4.1 million (2025: $0.9 million) which is recognized as “Other income and expenses” in the consolidated statements of profit or loss and other comprehensive income. We have received cash reimbursements from the U.S. DoW of $4.6 million during the twelve months ended June 30, 2026 (2025: $0.1 million).
We retain optionality to expand the capacity of the TPF to approximately 1,400 tpa of angular titanium powder. Comprehensive engineering, commercial, and financial studies are underway to review potential product mix, production scale, and associated capital and operational expenditures at higher production levels. If we ultimately decide to expand the capacity of the TPF to approximately 1,400 tpa, this will require additional funds, which may require future debt, government or equity financings.
If we make a Final Investment Decision to develop the Titan Project, this will require substantial additional funding, which may require future debt or equity financings or joint venture partnership.
Cash Flows
The following table summarizes our sources and uses of cash for the years ended June 30, 2026 and 2025:
Year ended
June 30, 2026
Year ended
June 30, 2025
US$US$
Net cash provided by (used in):
Operating activities(44,954,662)(21,797,685)
Investing activities(18,561,056)(24,277,010)
Financing activities43,181,569 67,991,632 
Net (decrease) increase in cash and cash equivalents(20,334,149)21,916,937 
Operating Activities
For fiscal 2026, net cash used in operating activities was $45.0 million ($21.8 million for 2025). Net cash used in operating activities represents payments to suppliers and employees and interest paid and received.
Investing Activities
For fiscal 2026, net cash used in investing activities was $18.6 million ($24.3 million for 2025). Net cash used in investing activities represents the purchase of exploration and evaluation properties, the purchase of property, plant and equipment, and payments related to the IP acquisition.
Financing Activities
For fiscal 2026, net cash provided by financing activities was $43.2 million ($68.0 million for 2025). Net cash provided by financing activities primarily represents proceeds and costs from the issuance of ordinary shares, and payment of the principal portion of lease liabilities.
76

Table of Contents
Off-balance sheet arrangements
During fiscal 2026 and 2025, we did not have any off-balance sheet arrangements.
C.Research and Development, Patents and Licenses
IperionX’s R&D policies are focused on optimizing its R&D resources relating to human talent, infrastructure, and working with select partners including leading academic institutions to bring specific, high-level skills to its core R&D projects. These projects include the commercialization of patented technologies to produce low-cost, low-carbon titanium products and powders, as well as recycled scrap. The core technologies behind IperionX’s products were discovered by researchers at the University of Utah. IperionX acquired and holds the exclusive rights to commercialize these technologies. IperionX’s R&D activities may also extend to its Titan Project in Tennessee, which will incorporate surface mining activities and mineral processing activities at a nearby Wet Concentrator Plant and dry Mineral Separation Plant.
D.Trend Information
Key trends affecting our operating results and capital requirements include the ramp-up of titanium manufacturing operations in Virginia, customer qualification activity, expansion of titanium production and downstream manufacturing capacity, inventory associated with commercial operations, completion of the Titan Project DFS, establishment of Proven and Probable Mineral Reserves, and advancement of the Atlas-Titan integration strategy. Our future operating results will depend in part on our ability to execute these initiatives, achieve targeted production rates and yields, qualify products with customers, secure additional financing and, if approved, advance development of the Titan Project.
E.Critical Accounting Policies and Estimates
See Note 1 to our audited consolidated financial statements for fiscal 2026, included in this annual report.
77

Table of Contents
ITEM 6.    DIRECTORS, SENIOR MANAGEMENT AND EMPLOYEES
A.Directors and Senior Management
The following discussion sets forth information regarding our directors and executive officers as of the date of this annual report on Form 20-F. In accordance with the ASX Listing Rules, a Director (other than the Managing Director) must not hold office, without re-election, past the third annual general meeting following the Director’s appointment or three years, whichever is longer. The following table lists the names of our directors and executive officers. The business address for each director and member of senior management is c/o Level 5, 56 Pitt Street, Sydney NSW 2000, Australia.
NameAgePosition
Todd W. Hannigan52Executive Chairman
Anastasios (Taso) Arima42Chief Executive Officer and Managing Director
Lorraine M. Martin64Lead Independent Non-Executive Director
Vaughn W. Taylor41Independent Non-Executive Director
Tony Tripeny67Independent Non-Executive Director
Melissa G. Waller56Independent Non-Executive Director
Beverly M. Wyse63Independent Non-Executive Director
Michael J. Loparco55
Independent Non-Executive Director (appointed August 3, 2026)
Toby E. Symonds57President and Chief Strategy Officer
W. Scott Sparks64Chief Operating Officer
Dominic P. Allen42Chief Commercial Officer
Marcela R. Castro54Chief Financial Officer
Note: Unless otherwise stated, Directors held their office from July 1, 2025 until the date of this report. Board Committee composition noted below was effective as of August 3, 2026.
Todd Hannigan (52 years of age) – Executive Chairman
Mr. Hannigan was appointed as Non-Executive Chairman of IperionX on February 1, 2021, and as Executive Chairman on May 24, 2021.
Todd Hannigan has over 29 years of global experience in natural resources as company founder, chief executive officer, private capital investor and non-executive director. Mr. Hannigan has worked internationally in the natural resources sector including for Piedmont Lithium Inc., Aston Resources, Hanson PLC and BHP Billiton. Mr. Hannigan holds a Bachelor of Engineering (Mining) from The University of Queensland and an MBA from INSEAD.
Other Public Directorships:
•Brazilian Rare Earths (January 2023 – present)
•Alurion Resources Limited (May 2026 - present)
Anastasios (Taso) Arima (42 years of age) – Chief Executive Officer and Managing Director
Mr. Arima is a founder of IperionX and was appointed as Executive Director on December 1, 2020, and as Managing Director and CEO of the Company on March 1, 2021.
Anastasios (Taso) Arima has over 16 years of experience in founding and developing critical material companies in North America. Mr. Arima was a founder and director of Piedmont Lithium and was instrumental in the development of the company. Mr. Arima attended the University of Western Australia and earned a Bachelor of Commerce whilst studying for a Bachelor of Engineering.
Other Public Directorships: InVert Graphite Limited (November 2021 – present)
78

Table of Contents
Lorraine M. Martin (64 years of age) – Lead Independent Non-Executive Director
President and CEO of the National Safety Council
IperionX Director since September 13, 2021
Lorraine M. Martin is a director, President and CEO of the National Safety Council, serving in this position since June 2019. She is also co-founder and President of Pegasus Springs Foundation, a non-profit organization focused on education and mentoring. Ms. Martin is the retired Executive Vice President and Deputy of Rotary and Mission Systems (“RMS”) for Lockheed Martin Corporation, a global aerospace, defense, security and advanced technologies company. Prior to RMS, Ms. Martin was Executive Vice President and General Manager for the F-35 Lightning II Program for Lockheed Martin Aeronautics Company. Her leadership of the F-35 program earned Pentagon recognition for reducing program costs while increasing production and fielding more aircraft worldwide. She joined Lockheed Martin in 1988 and during her tenure, held a variety of high visibility leadership positions across the corporation. Prior to joining Lockheed Martin, she served as an officer in the U.S. Air Force, holding various leadership positions for software intensive technology and development programs. She has a Master of Science degree in Computer Science from Boston University and a Bachelor of Arts degree in Computational Mathematics from DePauw University.
Other Public Directorships: Kennametal Inc. (July 2018 – present)
IperionX Board Committees: Lead Independent Director, Nominating and Governance Committee
Vaughn Taylor (41 years of age) – Independent Non-Executive Director
Former Executive Director and Chief Investment Officer of AMB Capital Partners
IperionX Director since March 3, 2021
Vaughn Taylor previously served as Executive Director and Chief Investment Officer of AMB Capital Partners, (“AMB”) the global investment platform of the Bennett Family. Mr. Taylor was responsible for executing on the investment strategy, expanding the investment portfolio into international markets and sourcing new investment opportunities. Mr. Taylor is an active global investor and is a board member of a number of listed and private market organizations both in Australia and the U.S. across a range of sectors. Mr. Taylor holds a Bachelor of Business (Accounting) and a Master of Business (Real Estate) from RMIT University. Mr. Taylor also holds a Graduate Diploma in Applied Finance and Investment from Financial Services Professional Body, (FINSIA).
Other Public Directorships: Mixed Martial Arts Group Limited (formerly Alta Global Group Ltd) (August 2021 – present)
IperionX Board Committees: Compensation Committee (chair)
Tony Tripeny (67 years of age) – Independent Non-Executive Director
Former Executive Vice President and Chief Financial Officer of Corning Incorporated
IperionX Director since March 17, 2025
Tony Tripeny brings over 40 years of financial and operational leadership in advanced manufacturing, technology and materials science. Mr. Tripeny’s successful 36-year career at Corning Incorporated, a global innovator and leader in advanced materials science, included senior roles of Executive Vice President and Chief Financial Officer, as well as Senior Vice President and Corporate Controller, until his retirement in 2022. Mr. Tripeny currently serves as a Director at Mesa Laboratories and Origin Materials. He holds an economics degree from the Wharton School of Business at the University of Pennsylvania.
Other Public Directorships:
•Mesa Laboratories, Inc. (NASDAQ: MLAB) (2022 – present),
•Origin Materials, Inc. (NASDAQ: ORGN) (May 2023 - present)
IperionX Board Committees: Audit Committee (chair), Compensation Committee
79

Table of Contents
Melissa G. Waller (56 years of age) – Independent Non-Executive Director
Former Deputy Treasurer and Chief of Staff for the North Carolina Department of State Treasury
IperionX Director since September 13, 2021
Melissa G. Waller has over 30 years’ experience as a senior finance executive and is President for the AIF Institute, providing essential education, research and resources to investors and investment firms globally with over US$50 trillion assets under management. Ms. Waller is the former Deputy Treasurer and Chief of Staff for the North Carolina Department of State Treasury, where she successfully oversaw Department strategic planning, operations, and public-policy implementation, along with a staff of more than 400 employees, including the North Carolina Retirement Systems, the pension fund for the state and the tenth largest public pension fund in the U.S., with assets in excess of US$90 billion. Ms. Waller has served as Chair of the Department’s Corporate Governance Committee, as well as on the Council of Institutional Investors Board of Directors and the Governor’s Board of Innovation for the North Carolina University System. She currently serves as Executive Program Director for the National Institute of Public Finance, as well as Director of Public and Private Partnerships for the Kenan Institute. Ms. Waller has a bachelor’s degree in journalism and mass communications from the University of North Carolina.
IperionX Board Committees: Nominating and Governance Committee (chair), Audit Committee
Beverly M. Wyse (63 years of age) – Independent Non-Executive Director
Former President of Shared Services, Boeing
IperionX Director since September 13, 2021
Beverly M. Wyse worked for over 30 years at Boeing, most recently as President of Shared Services, a multi-billion dollar operating group. In that role, she refocused and restructured the organization and also delivered improved efficiency and performance. Previously, she was Vice-President & General Manager of Boeing South Carolina, a major manufacturing, assembly and delivery site for Boeing where she led the team through successful production rate increases, major improvements in workforce relations and significant reductions in operating costs. Throughout her extensive career at Boeing, Ms. Wyse also successfully led the 737, 767 and 787 Charleston programs. Ms. Wyse holds an MBA and a B.Sc. in Mechanical Engineering from the University of Washington.
Other Public Directorships: Héroux-Devtek Inc. (February 2019 – February 2025)
IperionX Board Committees: Audit Committee, Compensation Committee
Michael J. Loparco (55 years of age) - Independent Non-Executive Director
Chief Executive Officer and Co-Founder of OrcaWorcs.ai; former Chief Executive Officer of Symbotic Inc.
IperionX Director since August 3, 2026
Michael J. Loparco is the Chief Executive Officer and Co-Founder of OrcaWorcs.ai and the former Chief Executive Officer of Symbotic Inc. (Nasdaq: SYM), where he led the company through its 2022 public listing. Mr. Loparco previously spent more than 20 years at Jabil Inc., including as Chief Executive Officer of Jabil EMS and Executive Vice President, overseeing global manufacturing and supply chain operations across 25 countries. Prior to this, he served as Chief Executive Officer of Jabil’s Engineered Solutions Group. He began his career as a corporate attorney at Holland & Knight LLP. Mr. Loparco holds a Bachelor of Arts in International Business from Eckerd College and a Juris Doctor, cum laude, from Stetson University College of Law.
Other Public Directorships:
•Sanmina Corporation (NASDAQ: SANM) (March 2025 to present)
•iRobot Corp (August 2024 - January 2026)
IperionX Board Committees: Nominating and Governance Committee, Compensation Committee

80

Table of Contents
Toby E. Symonds (57 years of age) – President and Chief Strategy Officer
Toby E. Symonds has over 30 years of experience in finance and asset management. This includes advisory board roles across private equity and real estate investment firms and executive leadership positions within global hedge fund firms and investment banking firms based in London, New York and San Francisco. Mr. Symonds has core competencies in capital markets, corporate strategy, product development, business development, management information systems and project and team management. Mr. Symonds graduated from North Carolina State University. Mr. Symonds was appointed President and Chief Strategy officer effective November 1, 2022.
Scott Sparks (64 years of age) – Chief Operating Officer
Scott Sparks brings more than 30 years of experience as an engineer and senior executive to the design, construction, and operations of industrial plant facilities in the critical resources industry. He has been a founder and senior management team member at several companies, most recently at Performance Industries, a construction and contract operations firm in West Virginia and at DRA Taggart, a Pennsylvania-based provider of construction and engineering services to the resources industry. Mr. Sparks earned a B.S. degree in Mining Engineering from West Virginia Institute of Technology. Mr. Sparks was appointed as an executive officer effective September 1, 2022.
Dominic Allen (42 years of age) – Chief Commercial Officer
Dominic Allen has over 15 years’ commercial experience, including senior roles with Sovereign Metals Limited, Rio Tinto Limited and Oyu Tolgoi LLC. Mr. Allen previously worked for Ernst & Young Transaction Advisory Services, completing resource and industrial transactions both in Australia and internationally. Mr. Allen holds a Bachelor of Commerce and a Bachelor of Science (Hons) from the University of Western Australia and is a Member of the Chartered Accountants Australia and New Zealand. Mr. Allen was appointed as Chief Commercial Officer of the Company effective December 1, 2020.
Marcela Castro (54 years of age) – Chief Financial Officer
Marcela Castro is an experienced finance professional with over 25 years’ experience in global finance leadership for companies across multiple industries, including green technology, manufacturing, mining and industrial and consumer products. Ms. Castro has expertise in U.S. public company accounting, financial analysis and strategic planning. Ms. Castro started her career at Arthur Andersen and progressed across international finance roles with Colgate-Palmolive, Jaguar Mining, the Rev Group and Proterra Inc. Ms. Castro holds a Bachelor of Business Administration with Pontificia Universidade Catolica and an Executive MBA with IBMEC. Ms. Castro was appointed Chief Financial Officer effective from December 21, 2023.
Family Relationships
There are no family relationships between any members of our executive management and our directors.
Arrangements for Election of Directors and Members of Management
There are no contracts or other arrangements pursuant to which directors have been or must be selected.
B.Compensation
Overview
IperionX is a U.S.–based titanium technology and manufacturing company listed on both the ASX and Nasdaq. Our executives, employees, customers, and operating assets are overwhelmingly in the U.S., and our strategy is anchored in building a low-cost and resilient U.S. titanium supply chain.
The Remuneration Framework for KMP is developed by the Board and its Compensation Committee, with independent advice from Pearl Meyer (U.S.). It is designed to:
•Compete for U.S. leadership talent in advanced manufacturing and hard-tech;
•Align rewards to long-term shareholder value, strategic execution, and long-term success;
•Reinforce multi-year commitment to scaling operations safely, reliably and profitably; and
•Drive performance while managing risk, particularly during rapid commercial scale-up.
81

Table of Contents
Our structure combines fixed remuneration with a meaningful “at-risk” component across short- and long-term incentives. Deliberately lower fixed pay and a higher proportion of performance-based long-term equity ensure executive outcomes closely mirror shareholder outcomes. A significant share of total compensation is contingent on achieving clearly defined milestones tied to value creation.
Remuneration Benchmarking Overview
As noted in our FY 2025 Annual Report, from late 2024 to April 2025, the Compensation Committee engaged Pearl Meyer, a U.S.-based independent remuneration consultant, to review IperionX’s remuneration structure, policy, and strategy for executives and employees. This review was prompted by the Company’s significant growth since the last benchmarking exercise and by stakeholder feedback on previous Remuneration Reports.
Pearl Meyer benchmarked IperionX against comparable U.S. businesses, reflecting IperionX’s position as a U.S.-based technology and metals manufacturing company rather than an ASX resource company.
Executive Remuneration
The Group’s executive remuneration policy is to provide a fixed remuneration component and a performance-based component (STIs and LTIs). The Board believes that this remuneration policy is appropriate given the considerations discussed in the section above and is appropriate in aligning executives’ objectives with shareholder and business objectives.
In a significant year for IperionX, executive KMP demonstrated strong performance, and their remuneration outcomes reflect their performance and significant contributions in fiscal 2026.
Fixed Remuneration
Fixed remuneration consists of base salaries, as well as employer 401(k) contributions or contributions to superannuation funds and other non-cash benefits. Non-cash benefits may include provision of motor vehicles, rental allowance, health care benefits, health insurance, and life insurance.
Fixed remuneration is reviewed annually by the Board. The process consists of a review of company and individual performance, relevant comparative remuneration externally and internally and, where appropriate, external advice on policies and practices.
As outlined above, the fixed remuneration of Executive KMP was benchmarked to peer comparator groups, with an average increase of 5% across KMP as per the below table:
Executive KMPPrevious (US$)Current (US$)Increase (US$)Increase (%)
Todd Hannigan (Executive Chairman)385,000402,00017,0004%
Anastasios Arima (CEO)550,000575,00025,0005%
Toby Symonds (President and CSO)523,000546,00023,0004%
W. Scott Sparks (COO)315,000325,00010,0003%
Dominic Allen (CCO)315,000325,00010,0003%
Marcela Castro (CFO)290,000325,00035,00012%
Performance Based Remuneration – Short-Term Incentive
Some executive KMP are entitled to an annual cash bonus upon achieving various KPIs, as set by the Board. Having regard to the current size, nature and opportunities of the Group, the Board has determined that these KPIs will include measures related to successful completion of activities as outlined in the below table. Prior to the end of each financial year, the Board assesses performance against these criteria.
82

Table of Contents
The following table sets out the key criteria which were set by the Board and used to determine executive STI outcomes paid during the fiscal year 2026:
FeatureDescription
EligibilityLimited to select employees, as determined by the Board.
OpportunityThe target opportunity as a percentage of fixed remuneration is set out below:
Executive KMPTarget STI (% of FR)
Todd Hannigan (Executive Chairman)70%
Anastasios Arima (CEO)70%
Toby Symonds (President and CSO)70%
W. Scott Sparks (COO)50%
Dominic Allen (CCO)50%
Marcela Castro (CFO)50%
Payout MethodologyThe total payout is calculated based on incremental objectives completed. To receive a payout, the total completion percentage must exceed 50% and is capped at 200% of target. The relationship between weighted score card achievement and payout is reflected in the chart below:
Weighted Scorecard
Achievement
Payout % of
Target STI
Threshold0% - 50%–%
Target75%100%
Maximum100%200%
Performance Assessment
IperionX utilizes a weighted scorecard methodology to award annual cash bonuses to executive KMP, which enhances transparency on the determination of annual cash bonuses. This approach links short-term incentives for executive KMP to clearly defined Company objectives to create a performance-based compensation opportunity that furthers stockholders’ interests while motivating and challenging our executive talent to achieve strategic priorities.
The cash bonus scorecard for the STI paid in fiscal year 2026 comprises of four primary strategic goals, each weighted between 20-30%. Each of these goals contained a number of defined objectives. As part of the methodology, scorecard completion determines the total payout.
MeasureMeasureWeighting
Product Innovation / R&D / IPOngoing innovation and protection of existing IP20%
Commercial and Government EngagementsFocus on progressing various commercial and government contracts30%
OperationsFocus on delivery of key scale-up targets, recruitment and retention of key talent, execute on safety plans and promote sustainable development25%
Funding, Corporate, Financial and Investor RelationsFocus on securing funding to support the Company's strategic plans and drive key corporate initiatives25%
PaymentThe STI awards were paid in cash after the completion of reviews at December 31, 2025.
83

Table of Contents
The following table outlines performance against the above short-term incentive criteria for calendar year 2025:
MeasureWeightingDescriptionAchievementScoreAchievement
Product Innovation / R&D / IP20%Ongoing innovation and protection of existing IP
•Significant advancement in GenXTM technology
•Ongoing reviews and careful maintenance of existing patent portfolio - securing IP critical for commercialization and long-term success
100%20.0%
Commercial and Government Engagements30%Focus on progressing various commercial and government contracts
•Significant progress above expectation on publicly announced and confidential commercial engagements
•Secured SBIR Phase III IDIQ contract enabling task orders up to $99M
60%18.0%
Operations25%Focus on delivery of key scale-up targets, recruitment and retention of key talent, execute on safety plans and promote sustainable development
•Completed commissioning and increased nameplate powder capacity 60% to 200 metric tons per annum through operational process improvements.
•Hired full-time Environmental, Health and Safety manager
•Issued our annual Sustainability Report highlighting additional accomplishments for FY 2025
•Achieved zero recordable injuries in 2025
•Progressed the Titan Project DFS (completed on schedule in June 2026)
62%15.5%
Funding, Corporate, Financial and Investor Relations25%Focus on securing funding to support the Company's strategic plans and drive key corporate initiatives
•Raised $46 million in capital from existing investors
•Awarded $47.1 million by the U.S. DoW’s IBAS program to develop a secure, low-cost, mineral-to-metal titanium supply chain
•Completed the deployment of an ERP system and related upgrades to support compliance with the Sarbanes-Oxley Act
100%25.0%
Total
100%78.5%
NOTE: The Committee does not disclose the individual objectives beneath each scorecard measure. They relate to customer qualification programs and commercial agreements carrying confidentiality obligations, to contracting and funding arrangements with agencies of the U.S. Government, and to the timing and scope of patent filings. Where an objective ceases to be commercially sensitive, the Committee will disclose it retrospectively.
The total weighted average score of 78.5% corresponds to a STI payment equal to 114% of target. Based on these performance outcomes, the table below outlines the STI awarded to executive KMP with respect to performance in calendar year 2025. During fiscal 2026, cash bonuses of $1,383,000 (2025: $1,486,000) were paid to executive KMP.
84

Table of Contents
Executive KMPTarget STI (%
 of FR)
Target STI
 (US$)
STI Awarded
 for 2026 (US$)
% of Target
 STI Awarded
Todd Hannigan (Executive Chairman)(1)
70%270,000--%
Anastasios Arima (CEO)70%385,000440,000114%
Toby Symonds (President and CSO)70%366,000418,000114%
W. Scott Sparks (COO)50%158,000180,000114%
Dominic Allen (CCO)50%158,000180,000114%
Marcela Castro (CFO) 50%145,000165,000114%
Note:
(1) Mr. Hannigan declined his entitlement to a cash STI.
Performance Based Remuneration – Long-Term Incentive
The Group has a LTIP to reward executive KMP and other key employees and contractors for long-term performance. This plan is based on best practice for companies operating in the U.S. This LTIP was designed in consultation with Pearl Meyer, our U.S.-based remuneration consultant.
The Plan provides for the issuance of Performance Rights, RSUs and Unlisted Options to eligible employees and contractors as part of their remuneration and incentive arrangements in order to attract and retain their services and to provide an incentive linked to the performance of the Group. The allocation to Performance Rights, RSUs and/or Options is determined by the Board based on the assessment of the contribution by the executive KMP to all aspects of the company’s growth.
To achieve its corporate objectives, the Group needs to attract, incentivize, and retain its executive KMP and other key employees and contractors. The Board believes that grants made to eligible participants under the Plan will provide a useful tool to underpin the Group’s employment and engagement strategy, and enables the Group to:
•recruit, incentivize and retain KMP and other key employees and contractors needed to achieve the Group’s business objectives;
•link the reward of key staff with the achievement of strategic goals and the long-term performance of the Group;
•align the financial interest of participants of the Plan with those of Shareholders; and
•provide incentives to participants of the Plan to focus on superior performance that creates shareholder value.
The issuance of Performance Rights, RSUs and Options for fiscal 2026 is considered in line with U.S.-based peer group comparators and aligned with linking sustained Company performance, retention and long-term shareholder value.
The table below summarizes RSUs, Performance Rights and Options that were granted, vested or lapsed relating to executive KMP remuneration during fiscal 2026:
Granted during
2026
Vested/exercised during
2026
Lapsed or expired
 during 2026
RSUs156,774(1,019,668)-
Performance Rights660,077--
Options3,723,878(625,000)(2,560,000)
As at June 30, 2026, the Company had a total of 18,031,866 outstanding Performance Rights, RSUs and Unlisted Options on issue that had been granted to employees and contractors of the Company as part of their remuneration arrangements, representing 5.05% of the Company’s total shares on issue (on a fully diluted basis). The Board considers this reasonable and in-line with peer group comparators.
85

Table of Contents
(i) Performance Rights
The LTIP provides for the issuance of Performance Rights to eligible participants which, upon satisfaction of the relevant performance conditions attached to the Performance Rights, will result in the issue of an Ordinary Share for each Performance Right. Performance Rights are issued for no consideration and no amount is payable upon conversion thereof.
Performance Rights granted under the Plan to eligible participants will be linked to the achievement by the Group of certain performance conditions as determined by the Board from time to time. These performance conditions must be satisfied in order for the Performance Rights to vest. Upon Performance Rights vesting, Ordinary Shares are automatically issued for no consideration. If a performance condition of a Performance Right is not achieved by the expiry date, then the Performance Right will lapse.
During fiscal 2026, 660,077 Performance Rights were granted to executive KMP as outlined in the table below. These Performance Rights were granted to selected executive KMP as one-off grants as retention awards. These awards are linked to the creation of shareholder value growth through the utilization of “out of the money” share price hurdles and continuous service periods acting as a retention tool for our executives.
The Compensation Committee has received commentary from certain investors that their preference is to have operating metrics alongside share price hurdles and that share price hurdles create an opportunity for management awards to vest in situations where the stock price increases (beyond management control). The Compensation Committee has taken this into consideration and in addition to performance criteria, these Performance Rights also had a 4-year continuous service period requirement, as well as an additional 1-year lock-up period, meaning even if the vesting condition was achieved, the KMP is required to be in continuous service until April 2, 2031. Given the stage of business, operating metrics are not yet included in LTIP targets, however will likely be in the future.
Further, the Compensation Committee is of the view that if the share price does remain above the A$18.00 hurdle for more than 30 days, given trading volume in the stock is relatively liquid, shareholders will have the opportunity to exit and crystallize any gains. To achieve the current A$18.00 hurdle, the share price would have to increase 3.4x from the closed date as of June 30, 2026 and 1.7x from the February 2, 2026 effective date of board approval, creating strong shareholder alignment to value creation and share price growth.
86

Table of Contents
KMPNo.
Performance
Rights
awarded 2026
RationaleVesting Conditions
Todd Hannigan (Executive Chairman)196,086Tied to performance and shareholder value creation. The A$18.00 share price hurdle for a period of 30 days represents a premium of over 166% to the closing share price of A$6.76 at the time of Board approval (February 2, 2026).

Represents 25% of LTIP award for 2026
Vest upon four years of continuous service and the Company achieving a 30-day VWAP of at least A$18.00 per share, expiring April 2, 2031
Anastasios Arima (CEO)237,944Tied to performance and shareholder value creation. The A$18.00 share price hurdle for a period of 30 days represents a premium of over 166% to the closing share price of A$6.76 at the time of Board approval (February 2, 2026).

Represents 25% of LTIP award for 2026
Vest upon four years of continuous service and the Company achieving a 30-day VWAP of at least A$18.00 per share, expiring April 2, 2031
Toby Symonds (President and CSO)226,047Tied to performance and shareholder value creation. The A$18.00 share price hurdle for a period of 30 days represents a premium of over 166% to the closing share price of A$6.76 at the time of Board approval (February 2, 2026).

Represents 25% of LTIP award for 2026
Vest upon four years of continuous service and the Company achieving a 30-day VWAP of at least A$18.00 per share, expiring April 2, 2031
(ii) Restricted Stock Units
In fiscal 2026, the Board chose to grant RSUs to attract and retain executives. The use of RSUs aligns with the long-term incentive vehicles used by peer group comparators.
The RSUs vest and convert into an equivalent number of Ordinary Shares over a three-year period with a three-year vesting cliff. If the relevant service-based vesting condition is not met by the applicable expiry date, the RSUs will automatically lapse.
During fiscal 2026, 156,774 RSUs were granted to executive KMP as outlined in the table below:
Executive KMPNo. RSUs Awarded 2026
W. Scott Sparks (COO)52,258
Dominic Allen (CCO)52,258
Marcela Castro (CFO)52,258
(iii) Unlisted Options
The LTIP provides for the issuance of Unlisted Options to eligible participants. The Board’s policy is to grant Unlisted Options to KMP with exercise prices at or above market share price (at the time of agreement). As such, the Unlisted Options granted to KMP are generally only of benefit if the KMP performs to the level whereby the value of the Group increases sufficiently to warrant exercising the Unlisted Options granted.
Other than service-based vesting conditions (if any) and the exercise price required to exercise the Unlisted Options, there are no additional performance criteria on the Unlisted Options granted to KMP. The Group prohibits executive KMP from entering into arrangements to limit their exposure to Unlisted Options granted as part of their remuneration package.
87

Table of Contents
In determining the size of grant, the Board engaged a third-party consultant to value the Unlisted Options utilizing a Black Scholes model, with a start date of February 2, 2026 (effective date of board approval). This resulted in a fair value (as of February 2, 2026) of the A$11.00 strike, A$18.00 strike and A$22.00 strike options of A$2.76, A$2.49 and A$2.22 respectively. The fair value of these unlisted options was updated when the unlisted options were actually issued. For accounting purposes, the share price as of the grant date was utilized in the financial statements.
During fiscal 2026, Unlisted Options were granted to executive KMP as outlined in the table below:
KMPNo. Unlisted Options awarded 2026RationaleVesting Conditions
Todd Hannigan (Executive Chairman)992,170Tied to performance and shareholder value creation. The A$18.00 and A$22.00 option exercise price exceeded the A$6.76 spot price at the time of board approval by ~166% and 225%, respectively.

Represents 75% of LTIP award for 2026
Vest upon four years of continuous service. 526,760 exercisable at A$22.00 each, and 465,410 exercisable at A$18.00 each, expiring April 2, 2031
Anastasios Arima (CEO)
1,203,964Tied to performance and shareholder value creation. The A$18.00 and A$22.00 option exercise price exceeded the A$6.76 spot price at the time of board approval by ~166% and 225%, respectively.

Represents 75% of LTIP award for 2026
Vest upon four years of continuous service. 639,205 exercisable at A$22.00 each, and 564,759 exercisable at A$18.00 each, expiring April 2, 2031
Toby Symonds (President and CSO)1,143,765Tied to performance and shareholder value creation. The A$18.00 and A$22.00 option exercise price exceeded the A$6.76 spot price at the time of board approval by ~166% and 225%, respectively.

Represents 75% of LTIP award for 2026
Vest upon four years of continuous service. 607,244 exercisable at A$22.00 each, and 536,521 exercisable at A$18.00 each, expiring April 2, 2031
W. Scott Sparks (COO)127,993Tied to performance and shareholder value creation. The A$11.00 option exercise price exceeded the A$6.76 spot price at the time of board approval by ~63%

Represents 50% of LTIP award for 2026
Vest upon three years of continuous service and are exercisable at A$11.00 each, expiring April 2, 2030
Dominic Allen (CCO)127,993Tied to performance and shareholder value creation. The A$11.00 option exercise price exceeded the A$6.76 spot price at the time of board approval by ~63%

Represents 50% of LTIP award for 2026
Vest upon three years of continuous service and are exercisable at A$11.00 each, expiring April 2, 2030
Marcela Castro (CFO)127,993Tied to performance and shareholder value creation. The A$11.00 option exercise price exceeded the A$6.76 spot price at the time of board approval by ~63%

Represents 50% of LTIP award for 2026
Vest upon three years of continuous service and are exercisable at A$11.00 each, expiring April 2, 2030
88

Table of Contents
Non-Executive Director Remuneration
The Board’s policy is to remunerate NEDs at market rates for comparable companies for time, commitment and responsibilities. Given the current size, nature and risks of the Group, RSUs, Unlisted Options, and Performance Rights have been used to attract and retain NEDs, where deemed appropriate. The Board determines payments to the NEDs and reviews their remuneration annually, based on market practice, duties and accountability. Independent external advice is sought when required.
The maximum aggregate amount of fees that can be paid to NEDs is subject to approval by shareholders at a General Meeting. Directors’ fees paid to NEDs accrue on a daily basis. Fees for NEDs are not linked to the performance of the economic entity. However, to align Directors’ interests with shareholder interests, the Directors are encouraged to hold shares in the Company and, subject to shareholder approval, on an annual basis, the Company grants each NED such number of RSUs calculated by dividing $125,000 by the VWAP of a share on the ASX over the five trading days immediately prior to the date of the notice of AGM of shareholders. The Lead Independent Director receives such number of RSUs calculated by dividing $155,000 by the five-day VWAP. The Company prohibits NEDs from entering into arrangements to limit their exposure to options granted as part of their remuneration package. The issuance of RSUs is in-line with U.S.-based peer group comparators and aligned with linking sustained Company performance, retention and long-term shareholder value.
Fees for NEDs have been set at $50,000 (2025: $50,000) per annum. The Lead Director fee has been set at an additional $30,000 per annum. These fees cover main board activities only. NEDs may receive additional remuneration for other services provided to the Company, including but not limited to, membership of committees.
Committee fees have been set at $15,000 for the Chair of each committee ($30,000 for the Audit Committee Chair) and $10,000 for committee members. The Company reimburses NEDs for reasonable expenses incurred in performing their duties (including in relation to any authorized independent professional advice sought by the NEDs to assist them in carrying out their duties as Directors). These fees are in line with the median of the benchmarked peer comparator groups.
During fiscal 2026, 118,875 RSUs were granted to Non-Executive Directors as set out below:
Non-Executive DirectorDirector Fees 2026
(US$)
No. RSUs Awarded
2026
Lorraine Martin100,000 28,131
Vaughn Taylor75,000 22,686
Tony Tripeny80,000 22,686
Melissa Waller75,000 22,686
Beverly Wyse80,000 22,686
During fiscal 2026, 347,306 RSUs held by Non-Executive Directors vested and converted into Ordinary Shares. 918,279 unlisted Options were exercised by NEDs during fiscal 2026. No RSUs, Unlisted Options or Performance Rights held by Non-Executive Directors lapsed during fiscal 2026.
Relationship between Remuneration of KMP and Shareholder Wealth
IperionX is a U.S.-based titanium technology and manufacturing company in the scale-up phase of its business. The Board anticipates that the Group will retain its cash resources to expand titanium production capacity at the Virginia Titanium Campus, to advance the Titan Project following completion of its DFS in June 2026, and to fund continued product development and qualification. The Group does not have a policy with respect to the payment of dividends or returns of capital, and no dividends were paid and no capital was returned during the current or previous four financial years. There is accordingly no relationship between the Board’s remuneration policy and dividends or returns of capital over that period.
At this stage of the Company’s development, shareholder wealth is created through share price growth, and the remuneration framework is built around it. Between 84% and 86% of target total compensation for the Executive Chairman, Chief Executive Officer and President is performance-related. The long-term incentives granted during fiscal 2026 deliver value only at share prices of A$18.00 and A$22.00 — premiums of approximately 166% and 225% to the
89

Table of Contents
closing share price of A$6.76 at the date of Board approval — and also require four years of continuous service, with the Performance Rights subject to a further one-year holding lock. Total shareholder return over the one, three and five years to June 30, 2026 was -14%, 266% and 332% respectively.
Short-term incentives are assessed against a weighted scorecard of four measures — Product Innovation / R&D / IP; Commercial and Government Engagements; Operations; and Funding, Corporate, Financial and Investor Relations — which are operational and strategic rather than share price based, as described under “Performance Based Remuneration – Short-Term Incentive”.
Relationship between Remuneration of KMP and Earnings
The Group is in the scale-up phase of its business. Titanium production at the Virginia Titanium Campus is currently directed to prototype production, product development, qualification testing and low-rate initial production, and the Group did not recognize revenue in the current or any of the previous four financial years. The Group recorded a net loss after tax of $66.8 million for fiscal 2026 (2025: $35.3 million), and a basic and diluted loss per share of $0.20 (2025: $0.12). Earnings are therefore not yet a meaningful measure of management performance, and the Board did not have regard to earnings in determining the nature and amount of remuneration of KMP over that period.
The Board expects this to change. As the business moves toward steady-state production, the Committee intends to introduce financial and operational measures into the short-term incentive scorecard, consistent with the response to shareholder and proxy adviser feedback.
Remuneration Governance
The Board has overall accountability for the oversight of the Company’s remuneration approach for Executive KMP and NEDs, having regard to the recommendations made by the Compensation Committee. The Compensation Committee reviews and makes recommendations to the Board on remuneration and at-risk remuneration policies, taking into account the Company’s strategic objectives, corporate governance principles, market practice and stakeholder interests.
The diagram below shows the Company’s remuneration governance framework, the key responsibilities of the Board, Compensation Committee and management.
90
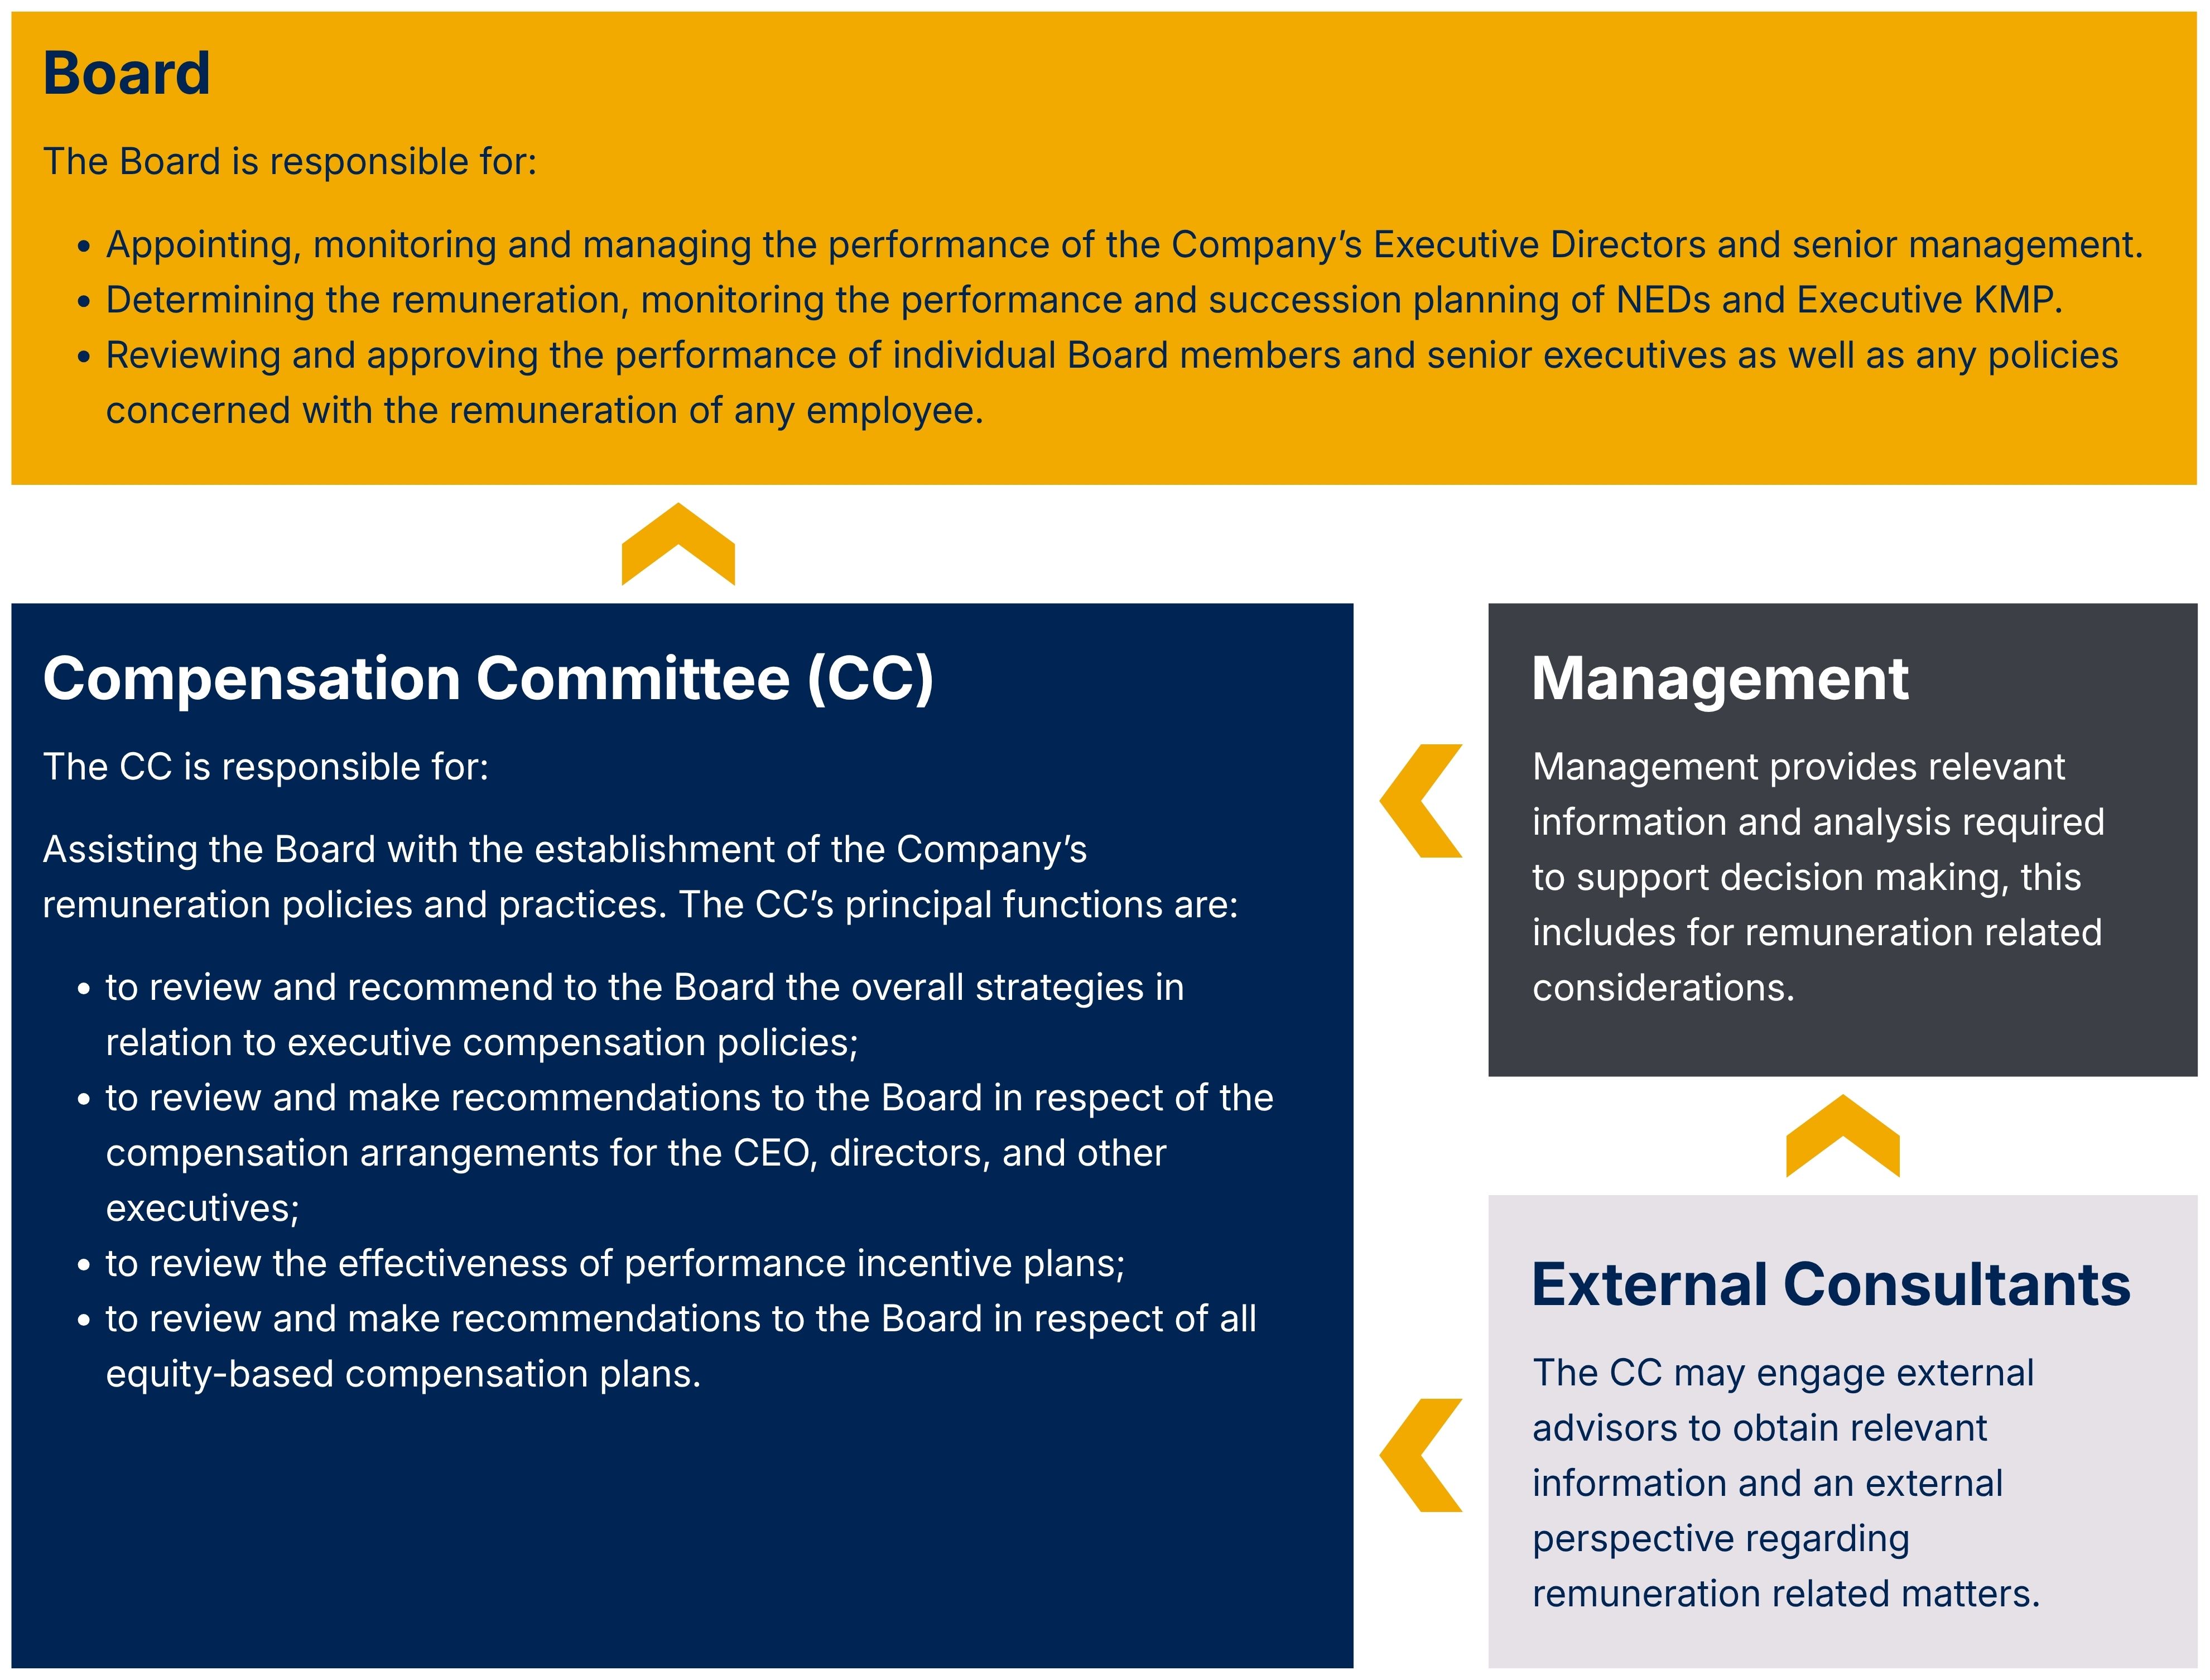
Table of Contents
Rem Report Framework.jpg
Clawback Policy
In order to prevent a covered executive from retaining an inappropriate benefit arising from an accounting restatement due to the Company’s material non-compliance with any financial reporting requirement under the federal securities laws, the Compensation Committee may determine that excess incentive-based compensation received by a covered executive is subject to recovery (clawback). The Company will recover such excess amounts on a reasonably prompt basis. Recovery may be effected by requiring repayment to the Company, set-off, reduction of future compensation, or such other means as the Compensation Committee determines to be appropriate.
The clawback policy applies to incentive-based compensation (compensation granted, earned or vested based in whole or in part on the attainment of a financial reporting measure) that was received by a covered executive on or after October 2, 2023, after the person began service as a covered executive, and who served as a covered executive at any time during the relevant performance period. The recovery period is the three completed fiscal years immediately preceding the date the Company is required to prepare the accounting restatement (plus any applicable transition period of less than nine months).
Our Clawback Policy is incorporated by reference as Exhibit 97.1 to this Annual Report on Form 20-F.
Remuneration Advisors
As detailed in the 2025 Annual Report, the Compensation Committee engaged Pearl Meyer to provide remuneration recommendations regarding the remuneration quantum for KMP and advise on LTIP and STI structures. The executive remuneration framework has not changed for fiscal year 2026, but Pearl Meyer was consulted regarding appropriate market-based salary increases for KMP and for LTIP performance award calculations. The Compensation Committee considered the recommendations, along with other factors, in making its remuneration decisions. The Compensation Committee is satisfied the advice received from Pearl Meyer is free from undue influence from the KMP to whom the
91

Table of Contents
remuneration recommendations apply. $12,100 was paid to remuneration advisors during the 2026 fiscal year. Pearl Meyer was engaged by, and reported directly to, the Compensation Committee, provided no other services to the Company during the year, and management had no role in the engagement or in the preparation of the recommendations.
Emoluments of KMP
Details of the nature and amount of each element of the emoluments of each KMP of the Group for the year ended June 30, 2026 are as follows:
Short-term benefits
2026Salary & fees
US$
Cash bonus
US$
Other
US$
Post-
employment
benefits
US$
Share-based
payment
expense
US$
Total
US$
Performance
 related
%
Directors
Todd Hannigan393,500 - - 20,375 1,220,955 1,634,830 75
Anastasios Arima562,500 440,000 9,012 - 1,813,143 2,824,655 80
Lorraine Martin100,000 - - - 127,352 227,352 56
Vaughn Taylor75,000 - - 9,007 117,312 201,319 58
Tony Tripeny80,000 - - - 91,318 171,318 53
Melissa Waller(1)
75,000 - - - 117,312 192,312 61
Beverly Wyse80,000 - - - 117,315 197,315 59
Other KMP
Toby Symonds534,500 418,000 22,170 9,357 1,544,196 2,528,223 78
W. Scott Sparks320,000 180,000 12,299 6,841 688,004 1,207,144 72
Dominic Allen(2)
320,000 180,000 - - 536,289 1,036,289 69
Marcela Castro307,500 165,000 22,170 8,432 287,898 791,000 57
Total2,848,000 1,383,000 65,651 54,012 6,661,094 11,011,757 
Notes:
(1) Melissa Waller is paid through Arete Innovative Resources LLC, a company in which she has a controlling interest.
(2) Dominic Allen is paid through Westoz Services Trust, of which he is a trustee.
No termination benefits were paid or payable to KMPs during the year.
Loans with Key Management Personnel
No loans were provided to or received from KMP during the year ended June 30, 2026 (2025: Nil).
Other Transactions with Key Management Personnel
Performance Industries, Inc., a company associated with Mr. W. Scott Sparks, Chief Operating Officer of the Company, was paid or is payable $70,660 during fiscal 2026 (2025: nil) for the provision of engineering and construction services to the Company. The Company considers that the services provided by Performance Industries, Inc. were provided on an arm’s length or better basis.
92

Table of Contents
Options, Rights and RSUs Granted to Key Management Personnel
Details of Unlisted Options, Performance Rights and RSUs granted, exercised or lapsed for each KMP of the Group during the 2026 financial year are as follows:
2026No. of options, rights
and RSUs
 granted
during year
#
No. of
options, rights
and RSUs
exercised during
year
#
No. of
options, rights
 and RSU’s
lapsed during
year
#
Value of options,
rights and
RSUs granted
during year(1)
US$
Value of
options, rights
and RSUs
exercised
during year(2)
US$
Value of
 options, rights
and RSUs
 included in
remuneration
for year
US$
Directors
Todd Hannigan1,188,256(159,333)(560,000)923,007 758,117 1,220,955 
Anastasios Arima1,441,908(318,667)(1,000,000)1,120,038 1,516,238 1,813,143 
Lorraine Martin28,131(389,379)-97,591 1,606,172 127,352 
Vaughn Taylor22,686(189,379)-78,701 757,104 117,312 
Tony Tripeny22,686(14,162)-78,701 67,384 91,318 
Melissa Waller22,686(389,379)-78,701 1,746,210 117,312 
Beverly Wyse22,686(283,286)-78,701 1,239,478 117,315 
Other KMP
Toby Symonds1,369,812(302,667)-2,557,914 1,440,109 1,544,196 
W. Scott Sparks180,251(279,667)(320,000)486,981 1,330,674 688,004 
Dominic Allen180,251(504,667)(680,000)486,981 2,112,264 536,289 
Marcela Castro180,251(79,667)-486,981379,061 287,898 
Total4,659,604(2,910,253)(2,560,000)6,474,297 12,952,811 6,661,094 
Notes:
(1)Determined at the time of grant per IFRS 2 - Share-based Payment, using an exchange rate of US$0.6789=A$1.00, being the average exchange rate for 2026.
(2)Determined at the time of exercise or conversion at the intrinsic value using the exchange rate on the date of exercise.
93

Table of Contents
Details of Unlisted Options, Performance Rights and RSUs granted by the Company to each KMP of the Group for the year ended June 30, 2026 are as follows:
2026Security
class
Grant
date
Expiry
date
Service
vesting
date
Exercise price
A$
Vesting
hurdle (30-
day VWAP)
Grant date
fair value(1)
A$
Number
 granted
Todd HanniganRights19-Mar-262-Apr-3119-Mar-30-A$18.00A$1.72196,086
Options19-Mar-262-Apr-3119-Mar-30A$18.00-A$1.11465,410
Options19-Mar-262-Apr-3119-Mar-30A$22.00-A$0.96526,760
Anastasios ArimaRights19-Mar-262-Apr-3119-Mar-30-A$18.00A$1.72237,944
Options19-Mar-262-Apr-3119-Mar-30A$18.00-A$1.11564,759
Options19-Mar-262-Apr-3119-Mar-30A$22.00-A$0.96639,205
Lorraine MartinRSUs28-Nov-2523-Dec-2623-Dec-26--A$5.1128,131
Vaughn TaylorRSUs28-Nov-2523-Dec-2623-Dec-26--A$5.1122,686
Tony TripenyRSUs28-Nov-2523-Dec-2623-Dec-26--A$5.1122,686
Melissa WallerRSUs28-Nov-2523-Dec-2623-Dec-26--A$5.1122,686
Beverly WyseRSUs28-Nov-2523-Dec-2623-Dec-26--A$5.1122,686
Toby SymondsRights8-Mar-262-Apr-318-Mar-30-A$18.00A$4.47226,047
Options8-Mar-262-Apr-318-Mar-30A$18.00-A$2.57536,521
Options8-Mar-262-Apr-318-Mar-30A$22.00-A$2.27607,244
W. Scott SparksOptions8-Mar-262-Apr-308-Mar-29A$11.00-A$2.93127,993
RSUs8-Mar-262-Apr-302-Apr-29--A$6.5552,258
Dominic AllenOptions8-Mar-262-Apr-308-Mar-29A$11.00-A$2.93127,993
RSUs8-Mar-262-Apr-302-Apr-29--A$6.5552,258
Marcela CastroOptions8-Mar-262-Apr-308-Mar-29A$11.00-A$2.93127,993
RSUs8-Mar-262-Apr-302-Apr-29--A$6.5552,258
Note:
(1)For details on the valuation of Unlisted Options, RSUs, and Performance Rights, including models and assumptions used, please refer to Note 21 of the financial statements.
94

Table of Contents
Option, Right, and RSU holdings of Key Management Personnel
2026Held at
July 1, 2025
Granted as
remuneration
Exercise of
options, rights
and RSUs
Net change
other
Held at
June 30, 2026
Vested and
exercisable at
June 30, 2026
Directors
Todd Hannigan2,092,7031,188,256(159,333)(560,000)2,561,626-
Anastasios Arima3,364,6611,441,908(318,667)(1,000,000)3,487,902-
Lorraine Martin451,46428,131(389,379)-90,216-
Vaughn Taylor251,46422,686(189,379)-84,771-
Tony Tripeny42,48622,686(14,162)-51,010-
Melissa Waller451,46422,686(389,379)-84,771-
Beverly Wyse451,46422,686(283,286)-190,864106,093
Other KMP
Toby Symonds3,362,9511,369,812(302,667)-4,430,096-
W. Scott Sparks2,218,900180,251(279,667)(320,000)1,799,484-
Dominic Allen1,913,900180,251(504,667)(680,000)909,484-
Marcela Castro458,340180,251(79,667)-558,924-
Total15,059,7974,659,604(2,910,253)(2,560,000)14,249,148106,093

Shareholdings of Key Management Personnel
2026Held at
July 1, 2025
Exercise of
options and rights
Net change
other
Held at
June 30, 2026
Ord (1)
Perf (2)
Ord (1)(3)
Perf (2)
Ord (1)(4)
Perf (2)
Ord (1)
Perf (2)
Directors
Todd Hannigan25,443,7751,260,000159,333-1,005,226(1,260,000)26,608,334-
Anastasios Arima11,405,1132,250,000318,667-721,002(2,250,000)12,444,782-
Lorraine Martin763,144-389,379-72,165-1,224,688-
Vaughn Taylor931,318-176,139-(134,000)-973,457-
Tony Tripeny--14,162-66,485-80,647-
Melissa Waller304,489-331,829-(150,000)-486,318-
Beverly Wyse304,489-283,286-52,000-639,775-
Other KMP
Toby Symonds3,188,146-302,667-7,276-3,498,089-
W. Scott Sparks1,393,971720,000279,667-(39,039)(720,000)1,634,599-
Dominic Allen4,507,1681,530,000504,667-1(1,530,000)5,011,836-
Marcela Castro340,795-79,667-(38,621)-381,841-
Total48,582,4085,760,0002,839,463-1,562,495(5,760,000)52,984,366-
Notes:
(1)‘Ord’ means Ordinary Shares.
(2)‘Perf’ means Performance Shares issued to the original vendors of HMAPL as consideration for the Company’s acquisition of HMAPL in fiscal 2021. For the avoidance of doubt, these Performance Shares do not form part of remuneration.
(3)Exercise of Options and Rights are shown net of shares surrendered to settle the exercise price under net settlement arrangements.
(4)     Includes shares sold to cover withholding tax obligations.
95

Table of Contents
Employment Contracts with Key Management Personnel
Mr. Arima, CEO and Managing Director, has an employment agreement with the Group which may be terminated upon six months’ advance written notice, unless mutually agreed upon with the Company. Mr. Arima receives a fixed remuneration component of $575,000 starting in January 2026, (2025: $550,000) per annum and a discretionary target annual bonus of up to $403,000 (2025: $385,000) to be paid upon the successful completion of KPIs as determined by the Board and is entitled to participate in the LTIP on terms to be determined by the Board.
Mr. Symonds, President and CSO, has an employment agreement with the Group which may be terminated upon six months’ advance written notice, unless mutually agreed upon with the Company. Mr. Symonds receives a fixed remuneration component of $546,000 starting in January 2026, (2025: $523,000) per annum and a discretionary annual target bonus of up to $382,000 (2025: $366,000) to be paid upon the successful completion of KPIs as determined by the Board and is entitled to participate in the LTIP on terms to be determined by the Board.
Mr. Hannigan, Executive Chairman, has a director appointment letter with the Group. Mr. Hannigan receives a fixed remuneration component of $402,000 starting in January 2026, (2025: $385,000) per annum and a discretionary annual target bonus of up to $282,000 (2025: $270,000) to be paid upon the successful completion of KPIs as determined by the Board and is entitled to participate in the LTIP on terms to be determined by the Board.
Mr. Allen, CCO, has a service agreement, as a Trustee for Westoz Services Trust, with the Group which may be terminated upon three months’ advance written notice, unless mutually agreed upon with the Company. Mr. Allen receives a fixed remuneration component of $325,000 starting in January 2026, (2025: $315,000) per annum and a discretionary annual target bonus of up to $163,000 (2025: $158,000) to be paid upon the successful completion of KPIs as determined by the Board and is entitled to participate in the LTIP on terms to be determined by the Board.
Mr. Sparks, COO, has an employment agreement with the Group which may be terminated upon six months’ advance written notice, unless mutually agreed upon with the Company. Mr. Sparks receives a fixed remuneration component of $325,000 starting in January 2026, (2025: $315,000) per annum and a discretionary annual target bonus of up to $163,000 (2025: $158,000) to be paid upon the successful completion of KPIs as determined by the Board and is entitled to participate in the LTIP on terms to be determined by the Board.
Ms. Castro, CFO, has an employment agreement with the Group which may be terminated upon four weeks’ advance written notice, unless mutually agreed upon with the Company. Ms. Castro receives a fixed remuneration component of $325,000 starting in January 2026, (2025: $290,000) per annum, a discretionary annual target bonus of up to $163,000 (2025: $145,000) to be paid upon the successful completion of KPIs as determined by the Board and is entitled to participate in the LTIP on terms to be determined by the Board.
All NEDs have a letter of appointment confirming the terms and conditions of their appointment as Director of the Company.
C.Board Practices
The Board is responsible for guiding all matters relating to the strategic direction, policies, practices, establishing goals for management and the operation of the Company. The functions and responsibilities reserved for the Board and those delegated to the Managing Director and executive management are set out in our Board Charter.
Nasdaq listing standards require that a majority of the Board be independent. An “independent director” is defined generally as a person other than an officer or employee of the company or its subsidiaries or any other individual having a relationship which in the opinion of the Board, would interfere with the director’s exercise of independent judgment in carrying out the responsibilities of a director. The Board has determined that Mses. Martin, Waller and Wyse and Messrs. Taylor and Tripeny are “independent directors” as defined in the Nasdaq listing standards and applicable SEC rules.
In addition to being set out in the Board Charter, the roles and responsibilities of our directors are also formalized in the letter of appointment which each director receives and commits to on their appointment. The letters of appointment specify the term of appointment, time commitment envisaged, expectations in relations to committee work or any other special duties attaching to the position, reporting lines, remuneration arrangements, disclosure obligations in relation to personal interests, confidentiality obligations, insurance and indemnity entitlements and details of the Company’s key governance
96

Table of Contents
policies. Each KMP enters into a service contract which sets out the material terms of employment, including a description of position and duties, reporting lines, remuneration arrangement and termination rights and entitlement.
The Constitution of the Company requires the Company, to the extent permitted by law, to indemnify any person who is or has been a director or officer of the Company for any liability caused by such a director or officer and any legal costs incurred by a director or officer in defending an action for any liability caused by such a director or officer. During or since the end of fiscal year 2026, no amounts have been paid by the Company in relation to the above indemnities. During fiscal year 2026, an insurance premium of $405,650 was paid by the Company to insure against a liability incurred by a person who is or has been a director or officer of the Company or the Group.
Board Committees
The Board has three standing committees, being an audit committee, a compensation committee, and nominating and governance committee.
Audit Committee
The Board has established an Audit Committee. Assignments to, and chairs of, audit committee will be selected by the Board. The audit committee operates under a charter approved by the Board and reports on its activities to the Board. The audit committee monitors the integrity of our financial statements, the independence and qualifications of our independent auditors, the performance of our accounting staff and independent auditors, our compliance with legal and regulatory requirements and the effectiveness of our internal controls. The audit committee is responsible for selecting, retaining (subject to shareholder approval), evaluating, setting the remuneration of, and, if appropriate, recommending the termination of our independent auditors. The audit committee is established in accordance with Section 10A(m) of the Exchange Act. Under the Nasdaq listing standards and applicable SEC rules, we are required to have at least three members of the audit committee, all of whom must be independent. As of June 30, 2026, the audit committee consists of Mr. Tony Tripeny (chairperson), Mr. Vaughn Taylor and Ms. Beverly Wyse, all of whom are considered independent under the listing standards of the Nasdaq Capital Market for audit committee members and the heightened independence requirement for audit committee members required by Rule 10A-3 under the Exchange Act. Mr. Tony Tripeny is also an audit committee financial expert.
Compensation Committee
The Board has established a separate Compensation Committee. The compensation committee operates under a charter approved by the Board and reports on its activities to the Board. The compensation committee charter sets out the processes the Board employs for setting the level and composition of compensation for directors and senior executives and ensuring that such compensation is appropriate and not excessive. Under the Nasdaq listing standards and applicable SEC rules, we are required to have at least two members of the Compensation Committee, all of whom must be independent. As of June 30, 2026, the compensation committee consists of Mr. Vaughn Taylor (chairperson), Ms. Beverly Wyse and Ms. Melissa Waller, all of whom are considered independent under the Nasdaq listing standards and applicable SEC rules.
Nominating and Governance Committee
The Board has established a separate Nominating and Governance Committee. The Nominating and Governance Committee operates under a charter approved by the Board and reports on its activities to the Board. The Nominating and Governance Committee charter sets out the processes the Board employs to oversee and to assist the Board in fulfilling its responsibilities relating to Board member recruitment, succession planning and overseeing and improving the Company’s governance policies and practices. As of June 30, 2026, the Nominating and Governance Committee consists of Ms. Melissa Waller (chairperson), Ms. Beverly Wyse, Ms. Lorraine Martin, and Mr. Tony Tripeny.
Code of Conduct
The Company has adopted a Code of Conduct which provides a framework for decisions and actions in relation to ethical conduct in employment. It aims to encourage the appropriate standards of conduct and behavior of the directors, officers, employees and contractors of the Company. The document sets out the principles covering appropriate conduct in a variety of contexts and outlines the minimum standard of behavior expected from employees, including to:
•act honestly, in good faith and in the best interests of the Company as a whole;
97

Table of Contents
•exercise their duty to use due care and diligence in fulfilling the functions of their position;
•recognize that their primary responsibility is to the Company’s shareholders as a whole;
•not take advantage of their position for personal gain, or the gain of their associates; and
•preserve the confidentiality of sensitive information of the Company.
The directors and executives also have a fiduciary relationship with shareholders of the Company, making it unlawful to improperly use their position to gain advantage for themselves. At all times, directors and officers must act in the best interest of the Company and eliminate or abstain from participating in any discussion or decision-making process in relation to matters which they have a conflict of interest, not engage in insider trading and comply with all applicable anti-bribery laws.
D.Employees
As of June 30, 2026, we had 139 employees and 3 employee contractors based in 3 different countries, as shown in the chart below:
United
States
AustraliaCanada
Employees1381-
Employee Contractors-12
The workforce is non-unionized.
E.Share Ownership
The following table lists as of June 30, 2026, the number of our shares beneficially owned by each of our directors, our chief executive officer and other members of our senior management as a group. Beneficial ownership is calculated based on 339,384,066 ordinary shares outstanding as of June 30, 2026.
Ordinary Shares
Beneficially Owned(1)
ShareholderNumberPercent
Officers and Directors
Todd Hannigan26,608,3347.8%
Anastasios Arima12,444,7823.7%
Lorraine Martin1,224,688*
Vaughn Taylor973,457*
Tony Tripeny80,647*
Melissa Waller486,318*
Beverly Wyse745,868*
Toby Symonds3,498,0891.0%
W. Scott Sparks1,634,599*
Dominic Allen5,011,8361.5%
Marcela Castro381,841*
Officers and directors as a group (11 persons)53,090,45915.6%
Notes:
*Represents beneficial ownership of less than 1% of the outstanding ordinary shares of IperionX.
(1)Beneficial ownership is determined according to the rules of the SEC and generally means that a person has beneficial ownership of a security if he, she or it possesses sole or shared voting or investment power of that security, including options, RSUs, and performance rights that are currently exercisable or exercisable within 60 days of June 30, 2026.
98

Table of Contents
F.Disclosure of a registrant’s action to recover erroneously awarded compensation
Not applicable.
ITEM 7.    MAJOR SHAREHOLDERS AND RELATED PARTY TRANSACTIONS
A.Major Shareholders
The following table and accompanying footnotes set forth, as of June 30, 2026, information regarding beneficial ownership of our ordinary shares by each person known by us to be the beneficial owner of more than 5% of our ordinary shares. In preparing the disclosure below, we have relied to the extent we believe appropriate on substantial shareholder notices provided to us by our substantial shareholders and released to ASX.
Beneficial ownership is determined according to the rules of the SEC and generally means that a person has beneficial ownership of a security if he, she or it possesses sole or shared voting or investment power of that security, including options and performance rights that are currently exercisable or exercisable within 60 days of June 30, 2026. Ordinary shares subject to options and performance rights currently exercisable or exercisable within 60 days of June 30, 2026 are deemed to be outstanding for computing the percentage ownership of the person holding these options and/or performance rights and the percentage ownership of any group of which the holder is a member, but are not deemed outstanding for computing the percentage of any other person.
Our calculation of the percentage of beneficial ownership is based on 339,384,066 ordinary shares issued and outstanding as at June 30, 2026. A large number of our ordinary shares are held by nominee companies so we cannot be certain of the identity of those beneficial owners.
Unless otherwise indicated, to our knowledge each shareholder possesses sole voting and investment power over the ordinary shares listed subject to community property laws, where applicable. None of our shareholders has different voting rights from other shareholders.
Ordinary Shares
Beneficially Owned
ShareholderNumberPercent
FMR LLC (1 St. Martin’s Le Grand, London, EC1A 4AS, United Kingdom)26,097,5787.7%
DITM Holdings Pty Ltd (15 Lennox Street, Mosman, NSW, 2088, Australia)(1)
26,608,3347.8%
State Street Corporation (One Congress Street, Boston, MA, 02441, United States)22,764,7086.7%
Note:
(1)DITM Holdings Pty Limited is an Australian corporation controlled by Mr. Todd Hannigan.
To our knowledge, there have not been any significant changes in the ownership of our ordinary shares by major shareholders over the past three years, except as follows (which is based upon substantial shareholder notices filed with the ASX and beneficial ownership reports on Schedule 13G filed with the SEC):
•FMR LLC became a substantial shareholder on August 31, 2021, when it acquired 13,499,999 ordinary shares, or 9.7% of the total voting power, pursuant to a private placement by the Company. On February 9, 2023, FMR LLC reported it beneficially owned 16,789,000 ordinary shares, or 9.8% of the total voting power, as of December 31, 2022. On February 9, 2024, FMR LLC reported it beneficially owned 21,131,763 ordinary shares, or 9.4% of the total voting power, as of December 29, 2023. On November 21, 2024, FMR LLC reported that it had a change in substantial holding and reported it held 26,097,578 ordinary shares, or 8.7% of the total voting power, as of that date. The percentage ownership has been updated for the number of shares on issue as June 30, 2026;
•DITM Holdings Pty Ltd became a substantial shareholder on December 1, 2020, when it reported that it held 4,618,357 ordinary shares, or 5.3% of the total voting power, as of that date. On January 27, 2021, DITM Holdings Pty Ltd had a change in substantial holding (due to additional purchases) and reported it held 7,951,691 ordinary shares, or 8.1% of the total voting power, as of that date. On August 31, 2021, DITM Holdings Pty Ltd had a change in substantial holding (due to additional purchases) and reported it held 9,069,086 ordinary shares, or 6.5% of the total voting power, as of that date. On December 13, 2021, DITM Holdings Pty Ltd had a change in holding (due to additional purchases) and reported it held 9,415,927 ordinary shares, or 6.8% of the total voting power, as of that date. On May 5, 2022, DITM Holdings Pty Ltd had a change in holding (due to additional purchases) and reported it
99

Table of Contents
held 10,412,842 ordinary shares, or 7.4% of the total voting power, as of that date. On February 14, 2023, DITM Holdings Pty Ltd reported it beneficially owned 15,031,747 ordinary shares, or 8.6% of the total voting power, as of December 31, 2022 (consisting of 12,931,747 ordinary shares and 2,100,000 ordinary shares underlying options that are exercisable within 60 days of December 31, 2022). On May 8, 2023, DITM Holdings Pty Ltd reported it had purchased an additional 847,970 ordinary shares. On June 26, 2023, DITM Holdings Pty Ltd reported it had purchased an additional 700,000 ordinary shares, and beneficially owned 16,579,717 ordinary shares, or 8.5% of the total voting power, as of that date (consisting of 14,479,717 ordinary shares and 2,100,000 ordinary shares underlying options that are exercisable within 60 days). On November 13, 2023, DITM Holdings Pty Ltd reported it had purchased an additional 520,096 ordinary shares, and beneficially owned 17,099,813 ordinary shares, or 8.5% of the total voting power, as of that date (consisting of 14,999,813 ordinary shares and 2,100,000 ordinary shares underlying options that are exercisable within 60 days). On December 21, 2023, DITM Holdings Pty Ltd reported it had exercised 2,100,000 share options, and beneficially owned 17,099,813 ordinary shares as of that date. On January 4, 2024, DITM Holdings Pty Ltd reported it had purchased an additional 465,442 ordinary shares, and beneficially owned 17,565,255 ordinary shares as of that date. On July 9, 2024, DITM Holdings Pty Ltd reported it had purchased an additional 3,173,092 ordinary shares, and beneficially owned 20,738,347 ordinary shares as of that date. On December 9, 2024, DITM Holdings Pty Ltd reported it had received 1 ordinary share upon the conversion of its performance shares, and beneficially owned 20,738,348 ordinary shares as of that date. On December 16, 2024, DITM Holdings Pty Ltd reported it had exercised 3,500,000 performance rights, and beneficially owned 24,238,348 ordinary shares as of that date. On December 18, 2024, DITM Holdings Pty Ltd reported it had purchased an additional 593,750 ordinary shares, and beneficially owned 24,832,098 ordinary shares as of that date. On March 14, 2025, DITM Holdings Pty Ltd reported it had exercised 159,333 RSUs, and beneficially owned 24,991,431 ordinary shares as of that date. On April 16, 2025, DITM Holdings Pty Ltd reported it had purchased an additional 310,500 ordinary shares, and beneficially owned 25,301,931 ordinary shares as of that date. On June 27, 2025, DITM Holdings Pty Ltd reported it had been issued an additional 141,844 ordinary shares, and beneficially owned 25,443,775 ordinary shares as of that date. On 8 October 2025, DITM Holdings Pty Ltd reported it had purchased 300,000 ordinary shares as a result of its participation in the Company’s share placement and beneficially owned 25,743,775 ordinary shares as of that date. On December 23, 2025 DITM Holdings Pty Ltd reported it had received 1 ordinary share upon the conversion of its performance shares and beneficially owned 25,743,776 ordinary shares as of that date. On February 3, 2026 DITM Holdings Pty Ltd reported it had exercised 159,333 RSUs and beneficially owned 25,903,109 ordinary shares as of that date. On March 30, 2026 and April 30, 2026, DITM Holdings Pty Ltd reported it had purchased an additional 225,225 ordinary shares and 480,000 ordinary shares respectively and beneficially owned 26,128,334 and 26,608,334 ordinary shares respectively as of those dates. DITM Holdings Pty Ltd is an entity associated with Mr. Todd Hannigan, Director of the Company; and
•State Street Corporation (State Street) became a substantial shareholder on September 19, 2025, when it reported that it held 18,920,854 ordinary shares, or 5.6% of the total voting power, as of that date. On September 24, 2025, State Street had a change in substantial holding (due to additional purchases) and reported it held 22,369,314 ordinary shares, or 6.7% of the total voting power, as of that date. On March 18, 2026 State Street reported it beneficially owned 26,328,091 ordinary shares, or 7.8% of the total voting power as of that date. On May 21, 2026 State Street reported it beneficially owned 22,764,708 ordinary shares, or 6.7% of the total voting power, as of that date.
Record Holders
As of June 30, 2026, we had 339,384,066 ordinary shares issued and outstanding. Based on information known to us, as of June 30, 2026, 141,737,775 of our ordinary shares were being held in the U.S. by 96 shareholders of record. A number of our ordinary shares are held by nominee companies so we cannot be certain of the identity of those beneficial owners. In addition, based on information known to us, as of June 30, 2026, approximately 73,305,940 of our outstanding ordinary shares are held in the form of ADSs.
We are not controlled by another corporation, by any foreign government or by any natural or legal persons except as set forth herein, and there are no arrangements known to us which would result in a change in control of us at a subsequent date.
B.Related Party Transactions
Other than as disclosed below, since July 1, 2025, other than employment and remuneration matters described in “Item 6. Directors, Senior Management and Employees – Compensation” we did not enter into any transactions or loans with any: (i) enterprises that directly or indirectly, through one or more intermediaries, control, are controlled by or are under
100

Table of Contents
common control with us; (ii) associates; (iii) individuals owning, directly or indirectly, an interest in our voting power that gives them significant influence over us, and close members of any such individual’s family; (iv) key management personnel and close members of such individuals’ families; or (v) enterprises in which a substantial shareholder interest in our voting power is owned, directly or indirectly, by any person described in (iii) or (iv) or over which such person is able to exercise significant influence.
Performance Industries, Inc., a company associated with Mr. W. Scott Sparks, Chief Operating Officer of the Company, was paid or is payable $70,660 during fiscal 2026 (2025: nil) (2024: $53,138) for the provision of engineering and construction services to the Company. The Company considers that the services provided by Performance Industries, Inc. were provided on an arm’s length or better basis.
C.Interests of Experts and Counsel
Not applicable.
ITEM 8.    FINANCIAL INFORMATION.
A.Consolidated Statements and Other Financial Information.
See “Item 18. Financial Statements.”
Legal Proceedings
We are not a party to any material legal proceedings.
Dividends
We have not declared any dividends during fiscal 2026, 2025 or 2024 and do not anticipate that we will do so in the foreseeable future. We currently intend to retain future earnings, if any, to finance the development of our business. Dividends, if any, on our outstanding ordinary shares will be declared by and subject to the discretion of our Board of Directors on the basis of our earnings, financial requirements and other relevant factors, and subject to Australian law.
Any dividend we declare will be paid to the holders of ADSs, subject to the terms of the deposit agreement, to the same extent as holders of our ordinary shares, to the extent permitted by applicable laws and regulations, less the fees and expenses payable under the deposit agreement. Any dividend we declare will be distributed by the depositary bank to the holders of the ADSs, subject to the terms of the deposit agreement. See “Item 12. Description of Securities Other Than Equity Securities-D. American Depositary Shares.”
B.Significant Changes
No significant change, other than as otherwise described in this annual report on Form 20-F, has occurred in our operations since the date of our consolidated financial statements included in this annual report on Form 20-F.
ITEM 9.    THE OFFER AND LISTING
A.Offer and Listing Details
The principal trading market for our ordinary shares is the ASX in Australia. Our ordinary shares trade under the symbol “IPX.” Our ADSs are publicly traded in the U.S. on the Nasdaq Capital Market under the symbol “IPX.”
B.Plan of Distribution
Not applicable.
C.Markets
Our ordinary shares are publicly traded on the ASX under the symbol “IPX.” Our ADSs are publicly traded on the Nasdaq Capital Market under the symbol “IPX.”
101

Table of Contents
D.Selling Shareholders
Not applicable.
E.Dilution
Not applicable.
F.Expenses of the Issue
Not applicable.
ITEM 10.    ADDITIONAL INFORMATION
A.Share Capital
Not applicable.
B.Constitutional Documents
The following description of our ordinary shares is only a summary. We encourage you to read our Constitution, which is included as an exhibit to our Annual Report on Form 20-F. All references to the “Company,” “we,” “us,” “our” and “ours” refer to IperionX Limited and its consolidated subsidiaries.
General
We are a public company limited by shares registered under the Corporations Act by the ASIC. Our corporate affairs are principally governed by our Constitution, the Corporations Act and the ASX Listing Rules. Our ordinary shares trade on the ASX. Our ADSs, each representing 10 of our ordinary shares, are listed on the Nasdaq, under the symbol “IPX.” The Bank of New York Mellon, acting as depositary, registers and delivers the ADSs.
The Australian law applicable to our Constitution is not significantly different than a U.S. company’s charter documents except we do not have a limit on our authorized share capital and the concept of par value is not recognized under Australian law.
Subject to restrictions on the issue of securities in our Constitution, the Corporations Act and the ASX Listing Rules and any other applicable law, we may at any time issue shares and grant options or warrants on any terms, with the rights and restrictions and for the consideration that the Board determine.
The rights and restrictions attaching to ordinary shares are derived through a combination of our Constitution, the common law applicable to Australia, the ASX Listing Rules, the Corporations Act and other applicable law. A general summary of some of the rights and restrictions attaching to our ordinary shares are summarized below. Each ordinary shareholder is entitled to receive notice of, and to be present, vote and speak at, general meetings.
Our Constitution
Our constituent document is our Constitution. Our Constitution is subject to the terms of the ASX Listing Rules and the Corporations Act. It does not provide for or prescribe any specific objectives or purposes of IperionX. It may be amended or repealed and replaced by special resolution of shareholders, which is a resolution passed by at least 75% of the votes cast by shareholders entitled to vote on the resolution. Where there is an inconsistency between the provisions of the Constitution and the Corporations Act, the provisions of the Australian Corporations Act will prevail over any inconsistent provisions of the Constitution.
Under Australian law, a company has the legal capacity and powers of an individual both within and outside Australia. The material provisions of our Constitution are summarized below. This summary is not intended to be complete nor to constitute a definitive statement of the rights and liabilities of our shareholders.
102

Table of Contents
Interested Directors
Except where permitted by the Corporations Act, a director may not vote in respect of any contract or arrangement in which the director has, directly or indirectly, any material interest. Such director must not be counted in a quorum, must not vote on the matter and must not be present at the meeting while the matter is being considered.
Unless a relevant exception applies, the Corporations Act requires our directors to provide disclosure of certain interests and prohibits directors of companies listed on the ASX from voting on matters in which they have a material personal interest and from being present at the meeting while the matter is being considered. In addition, the Corporations Act and the ASX Listing Rules require shareholder approval of any provision of related party benefits to our directors.
Directors’ Compensation
The fixed sum remuneration for non-executive directors may not be increased except at a general meeting of shareholders and the particulars of the proposed increase are required to have been provided to shareholders in the notice convening the meeting. The aggregate, fixed sum for non-executive directors’ remuneration is to be divided among the non-executive directors in such proportion as the Board of Directors agree and in accordance with our Constitution. Remuneration payable to executive directors, such as the Managing Director, does not form part of the aggregate remuneration pool through which non-executive directors are paid. Executive directors may be paid remuneration as employees of IperionX.
Pursuant to our Constitution, any director who performs extra or special services that in the opinion of the Board, are outside the scope of the ordinary duties of a director may be paid additional remuneration or provide benefits to that director, which is determined by the Board.
The Company must also pay all reasonable travel, accommodation and other expenses properly incurred by the directors in attending general meetings, Board meetings, committee meetings or otherwise in connection with our business.
In addition, in accordance with our Constitution, a director may be paid a retirement benefit as determined by the Board, subject to the limits set out in the Corporations Act and the ASX Listing Rules.
Borrowing Powers Exercisable by Directors
Pursuant to our Constitution, the management and control of our business affairs are vested in the Board. Subject to the Corporations Act and the ASX Listing Rules, the Board has the power to raise or borrow money, and charge any of our property or business or any uncalled capital, and may issue debentures or give any other security for any of our debts, liabilities or obligations or of any other person, in each case, in the manner and on terms it deems fit.
Retirement of Directors
Pursuant to our Constitution, one-third of our directors, other than the managing director, must retire from office at every annual general meeting. If the number of directors is not a multiple of three, then the number nearest to, but not exceeding, one-third must retire from office. The directors who retire in this manner are required to be the directors or director longest in office since last being elected. A director, other than the director who is the managing director, must retire from office at the conclusion of the third annual general meeting after which the director was elected. Retired directors are eligible for re-election to the Board of Directors.
Rights and Restrictions on Classes of Shares
Subject to the Corporations Act and the ASX Listing Rules, the rights attaching to our Ordinary Shares are detailed in our Constitution. Subject to the Corporations Act, ASX Listing Rules and any rights or restrictions attached to a class of shares, the Company may issue further shares or grant options over shares on any terms, at any time and for any consideration as the Board resolve. Currently, our outstanding share capital consists of only one class of Ordinary Shares.
Voting Rights
Subject to our Constitution and any rights or restrictions attached to a class of shares, at a meeting of shareholders each shareholder has one vote determined by a show of hands. On a poll vote, each shareholder shall have one vote for each
103

Table of Contents
fully paid share and a fractional vote for each share that is not fully paid, such fraction being equivalent to the proportion of the amount that has been paid to such date on that share. Shareholders may vote by proxy, attorney or representative.
Right to Share in Our Profits
Subject to the Corporations Act, the ASX Listing Rules and the rights of the holders of any shares created or raised under any special arrangements as to dividends, the directors may from time to time declare a dividend to shareholders entitled to the dividend. Under the Corporations Act, we must not pay a dividend unless: (a) our assets exceed our liabilities immediately before the dividend is declared and the excess is sufficient for the payment of the dividend; (b) the payment of the dividend is fair and reasonable to our shareholders as a whole; and (c) the payment of the dividend does not materially prejudice our ability to pay our creditors. Unless any share is issued on terms providing to the contrary, the dividends declared will be payable on all shares according to the proportion that the amount paid (not credited) is of the total amounts paid and payable (excluding amounts credited) in respect of such shares.
Rights to Share in the Surplus in the Event of Liquidation
Our Constitution provides for the right of shareholders to participate in a surplus in the event of our liquidation.
No Redemption Provision for Ordinary Shares
There are no redemption provisions in our Constitution in relation to Ordinary Shares. Under our Constitution and subject to the Corporations Act, any preference shares may be issued on the terms that they are, or may at our option be, liable to be redeemed.
Variation or Cancellation of Share Rights
The rights attached to shares in a particular class of shares may only be varied or cancelled by a special resolution of IperionX, together with either:
•a special resolution passed by members holding shares in that class; or
•the written consent of members who are entitled to at least 75% of the votes that may be cast in respect of shares in that class.
Liability for Further Capital Calls
According to our Constitution, the Board of Directors may make any calls from time to time upon shareholders in respect of all monies unpaid or partly-paid shares (if any), subject to the terms upon which any of the partly-paid shares have been issued. Each shareholder is liable to pay the amount of each call in the manner, at the time, and at the place specified by the Board of Directors. Calls may be made payable by installment. Failure to pay a call will result in interest becoming payable on the unpaid amount and ultimately, forfeiture of those shares. As of the date of this annual report, all of our issued shares are fully paid.
Annual General Meetings
Under the Corporations Act, our directors must convene an annual meeting of shareholders at least once every calendar year and within five months after the end of our last financial year. Notice of the proposed meeting of our shareholders is required at least 28 days prior to such meeting under the Corporations Act.
General Meetings of Shareholders
General meetings of shareholders may be called by the Board. Notice of the proposed meeting of our shareholders is required at least 28 days prior to such meeting under the Corporations Act. Except as permitted under the Corporations Act, shareholders may not convene a meeting. Under the Corporations Act, any director or one or more shareholders holding in aggregate at least 5% of the votes that may be cast at a general meeting may call and arrange to hold a general meeting. The meeting must be called in the same way in which general meetings of the company may be called, including the dispatch of a notice of meeting including the matters to be voted upon. The shareholders calling the meeting must pay the expenses of calling and holding the meeting.
104

Table of Contents
The Corporations Act requires the directors to call and arrange to hold a general meeting on the request of shareholders with at least 5% of the votes that may be cast at a general meeting. The request must be made in writing, state any resolution to be proposed at the meeting, be signed by the shareholders making the request and be given to the company. The Board of Directors must call the meeting not more than 21 days after the request is made. The meeting must be held not later than two months after the request is given.
The quorum required for a general meeting of shareholders consists of at least two shareholders present in person, or by proxy, attorney or representative. A meeting (excluding a meeting convened on the requisition of shareholders) which is adjourned for lack of a quorum will be adjourned to the date, time and place as the Directors may by notice to shareholders appoint, or failing any appointment, to the same day in the following week at the same time and place. At the reconvened meeting, the required quorum consists of any two members present in person, or by proxy, attorney or representative appointed pursuant to our Constitution. The meeting is dissolved if a quorum is not present within 30 minutes from the time appointed for the reconvened meeting.
A meeting of shareholders may be held virtually using any technology that gives shareholders as a whole a reasonable opportunity to participate in the meeting.
An ordinary resolution requires approval by the shareholders by a simple majority of votes cast (namely, a resolution passed by more than 50% of the votes cast by shareholders entitled to vote on the resolution). A special resolution (such as in relation to amending our Constitution, approving any variation of rights attached to any class of shares or our voluntary winding-up), requires approval of a special majority (namely, a resolution that has been passed by at least 75% of the votes cast by shareholders entitled to vote on the resolution).
The Foreign Acquisitions and Takeovers Act 1975
Overview
Australia’s foreign investment regime is set out in the Foreign Acquisition and Takeovers Act (FATA) and Australia’s Foreign Investment Policy. The Australian Treasurer administers the FATA and the Foreign Investment Policy (FIP) with the advice and assistance of the Foreign Investment Review Board (FIRB).
In the circumstances set out below in the section entitled ‘Mandatory Notification Requirements’, foreign persons are required to notify and receive a prior statement of no objection, or FIRB clearance, from the Australian Treasurer. In the circumstances set out below in the section entitled ‘Other circumstances in which FIRB may be sought’, it is generally recommended that foreign persons obtain FIRB clearance.
The Australian Treasurer has powers under the FATA to make adverse orders, including prohibition of a proposal, ordering disposal of an interest acquired or imposing conditions on a proposed transaction, in respect of a relevant acquisition if he or she considers it to be contrary to Australia’s national interest.
The obligation to notify and obtain FIRB clearance is upon the acquirer of the interest, and not the Company. The failure to obtain FIRB clearance may be an offense under Australian law.
Investor’s Responsibility
It is the responsibility of any persons who wish to acquire shares of the Company to satisfy themselves as to their compliance with the FATA, regulations made under the FATA, the FIP, guidelines issued by the FIRB and with any other necessary approval and registration requirement or formality, before acquiring an interest in the Company.
Mandatory Notification Requirements
Broadly, FIRB clearance is required for the following transactions involving the acquisition of shares in an Australian corporation:
•the acquisition of a substantial interest if the Australian corporation is valued in excess of the applicable monetary threshold (see below);
•any direct investment by a foreign government investor;
•any acquisition of shares in an Australian land corporation; and
105

Table of Contents
•any proposed direct investment in a national security business (including starting such a business) or proposed investment in national security land.
Currently, the prescribed threshold is A$347 million though a higher threshold of A$1.498 billion applies for certain countries which Australia has a free trade agreement with. These countries include the U.S., New Zealand, China, Japan, Hong Kong, Peru, South Korea, Singapore, United Kingdom, Chile, Peru and others.
Application of these Requirements to the Company
As at June 30, 2026, the Company did not have any interests in Australian land and hence is not an Australian land corporation, and the Company’s gross assets were valued below A$347 million. Accordingly, the only circumstance in which an investor in the Company would currently be subject to the mandatory notification regime is if they are a foreign government investor making a direct investment in the Company. Applications for FIRB clearance may be made by prospective investors in accordance with the information on FIRB’s website.
Other Situations Where FIRB Clearance Might be Sought
In addition to those circumstances where it is mandatory under the FATA for a foreign person to notify FIRB and seek FIRB clearance for a particular transaction (see above), there are other instances where, despite there being no mandatory notification obligation, the Australian Treasurer may make adverse orders under the FATA (e.g., if he or she considers a particular transaction to have national security concerns).
National Security Related Transactions
Under Australia’s foreign investment regime, the Australian Treasurer may ‘call in’ certain transactions for screening on national security grounds and allow investors to voluntarily notify these transactions to obtain certainty about the investment. Where national security concerns are identified, the Australian Treasurer has the power to impose conditions, vary existing conditions, or, as a last resort, force the divestment of any realized investment which was subject to the FATA from January 1, 2021.
Transactions falling within the scope of the national security test are subject to a $0 monetary threshold.
The Company as a Foreign Person
If foreign persons have a substantial interest in the Company, it would be considered to be a foreign person under the FATA. In such event, we would be required to obtain the approval of the Australian Treasurer for our own transactions involving the acquisitions of interests in Australian land and some acquisitions of interests in Australian corporations. FIRB clearance may be required for such acquisitions (which may or may not be given or may be given subject to conditions). If FIRB clearance is required and not given in relation to a proposed investment, we may not be able to proceed with that investment. There can be no assurance that we will be able to obtain any required FIRB clearances in the future.
Defined Terms Used in this Section
Foreign Persons
Under Australia’s foreign investment regime, it is the responsibility of any person (including, without limitation, nominees and trustees) who is:
•a natural person not ordinarily resident in Australia;
•a corporation in which a natural person not ordinarily resident in Australia, or a corporation incorporated outside of Australia, holds direct or indirect, actual or potential, voting power of 20% or more;
•a corporation in which two or more persons, each of whom is either a non-Australian resident or a non-Australian corporation, hold direct or indirect, actual or potential, voting power in aggregate of 40% or more;
•a trustee of a trust estate in which a non-Australian resident or non-Australian corporation holds 20% or more of the corpus or income of the trust estate;
106

Table of Contents
•a trustee of a trust estate in which two or more persons, each of whom is either a non-Australian resident or a non-Australian corporation, hold in aggregate 40% or more of the corpus or income of the trust estate; or
•a foreign government investor,
to ascertain if they may be required to notify the Australian Treasurer of their investment.
Associates
Associate is broadly defined to include:
•the person’s spouse or de facto partner, lineal ancestors and descendants, and siblings;
•any partner of the person;
•any corporation of which the person is an officer, any officer of a corporation (where the person is a corporation), employers and employees, any employee of a natural person of whom the person is an employee;
•any corporation whose directors are accustomed or under an obligation, whether formal or informal, to act in accordance with the directions, instructions or wishes of the person or, where the person is a corporation, of the directors of the person;
•any corporation in accordance with the directions, instructions or wishes of which, or of the directors of which, the person is accustomed or under an obligation, whether formal or informal, to act;
•any corporation in which the person holds a substantial interest;
•where the person is a corporation-a person who holds a substantial interest in the corporation;
•the trustee of a trust estate in which the person holds a substantial interest;
•where the person is the trustee of a trust estate-a person who holds a substantial interest in the trust estate; or
•any person who is an associate of any other person who is an associate of the person.
Australian Land Corporation
An Australian Land Corporation (ALC), is a corporation where the value of its total assets comprising interests in Australian land exceeds 50% of the value of its total gross assets. An ALC is not necessarily a company registered in Australia. It may be registered anywhere. It is the composition of the assets of the corporation that will make it an ALC for the purposes of the Australian foreign investment regime.
Substantial Interest
A substantial interest is:
•control of 20% or more of the actual or potential voting power or issued shares in a target by a single foreign person (together with associates); or
•control of 40% or more of the actual or potential voting power or issued shares in a target by multiple foreign persons (together with associates).
Direct Investment
Any investment of an interest of 10% or more is considered to be a direct investment. Investments that involve interests below 10% may also be considered direct investments if the acquiring foreign government investor is building a strategic stake in the target, or can use that investment to influence or control the target. In particular, it includes investments of less than 10% which include any of the following:
•preferential, special or veto voting rights;
•the ability to appoint directors or asset managers;
•contractual agreements including, but not restricted to, agreements for loans, provision of services and off take agreements; or
•building or maintaining a strategic or long-term relationship with a target entity.
107

Table of Contents
Foreign Government Investor
A Foreign Government Investor is:
•a body politic of a foreign country;
•entities in which governments, their agencies or related entities from a single foreign country have an aggregate interest (direct or indirect) of 20% or more;
•entities in which governments, their agencies or related entities from more than one foreign country have an aggregate interest (direct or indirect) of 40% or more; or
•entities that are otherwise controlled by foreign governments, their agencies or related entities, and any associates, or could be controlled by them including as part of a controlling Company.
At this time, our total assets do not exceed any of the above thresholds and therefore no approval would be required from the Australian Treasurer. Nonetheless, should our total assets exceed the threshold in the future, we will need to be mindful of the number of ordinary shares that can be made available, and monitor the 40% aggregate shareholding threshold for foreign persons (together with their associates) to ensure that it will not be exceeded without an application to the Australian Treasurer’s for approval having been contemplated and submitted if considered necessary. Our Constitution does not contain any additional limitations on a nonresident’s right to hold or vote our securities.
National Security Business
A business is a national security business if it:
•is a responsible entity (within the meaning of the Security of Critical Infrastructure Act 2018 as enacted) for an asset;
•is an entity that is a direct interest holder in relation to a critical infrastructure asset (within the meaning of those terms in the Security of Critical Infrastructure Act 2018 as enacted);
•is a carrier or nominated carriage service provider to which the Telecommunications Act 1997 applies;
•develops, manufacturers or supplies critical goods or critical technology that are, or are intended to be, for a military use, or an intelligence use, by defense and intelligence personnel, the defense force of another country, or a foreign intelligence agency;
•provides, or intends to provide, critical services to defense and intelligence personnel, the defense force of another country, or a foreign intelligence agency;
•stores or has access to information that has a security classification;
•stores or maintains personal information of defense and intelligence personnel collected by the Australian Defence Force, the Defence Department or an agency in the national intelligence community which, if accessed, could compromise Australia’s national security;
•collects, as part of an arrangement with the Australian Defence Force, the Defence Department or an agency in the national intelligence community, personal information on defence and intelligence personnel which, if disclosed, could compromise Australia’s national security; or
•stores, maintains or has access to personal information on defense and intelligence personnel which, if disclosed, could compromise Australia’s national security.
National Security Land
Land is national security land if it is:
•“Defence” premises within the meaning of section 71A of the Defence Act 1903. This includes all land owned or occupied by Defence, including buildings, structures and Defence prohibited areas. The definition excludes subparagraph (a)(iii) of the definition which relates to vehicles, vessels or aircraft; or
•land in which an agency in the national intelligence community has an interest, if the existence of the interest is publicly known or could be known upon the making of reasonable inquiries.
108

Table of Contents
Ownership Threshold
There are no provisions in our Constitution that require a shareholder to disclose ownership above a certain threshold. Under the Corporations Act, in relation to a company, a person has a “substantial holding” if (i) the total votes attached to voting shares in the company in which they (or their associates) have a relevant interest in is 5 percent or more of the total number of votes attached to voting shares in the company or (ii) the person has made a takeover bid for voting shares in the company and the bid period has started but not yet ended.
A person who:
•begins to have, or ceases to have, a substantial holding in a listed company;
•has a substantial holding in a listed company and there is movement by at least 1 percent in their holding; or
•makes a takeover bid for securities of the listed company, must give notice to the company and to the ASX.
Issues of Shares and Change in Capital
Subject to the Corporations Act, ASX Listing Rules and any rights or restrictions attached to a class of shares, the Company may issue further shares or grant options over shares on any terms, at any time and for any consideration as the Board resolve. Pursuant to the ASX Listing Rules, we may in our discretion issue securities without the approval of shareholders, if such issue of securities, when aggregated with securities issued by us during the previous 12-month period would be an amount that would not exceed 15% of our issued capital at the commencement of the 12-month period. The Company may seek shareholder approval by special resolution at its annual general meeting to increase its capacity to issue equity securities by an additional 10% for the preceding 12-month period. Issues of securities in excess of this limit or the issue of securities to our related parties require approval of shareholders (unless otherwise permitted under the ASX Listing Rules or unless we have obtained a waiver from the ASX in relation to the 15% limit).
Subject to the requirements of our Constitution, the Corporations Act, the ASX Listing Rules and any other applicable law, including relevant shareholder approvals, we may consolidate or divide our share capital into a larger or smaller number by resolution, reduce our share capital (provided that the reduction is fair and reasonable to our shareholders as a whole and does not materially prejudice our ability to pay creditors) or buy back our Ordinary Shares whether under an equal access buy-back or on a selective basis.
Member Approval to Significant Changes
We must not make a significant change (either directly or indirectly) to the nature and scale of our activities except after having disclosed full details to the ASX in accordance with the requirements of the ASX Listing Rules (and, if required by ASX, subject to us obtaining the approval of shareholders in a general meeting). We must not sell or otherwise dispose of the main undertaking of our company without the approval of shareholders in a general meeting. We need not comply with the above obligations if the ASX grants us an applicable waiver to be relieved of our obligations.
Change of Control
Takeovers of listed Australian public companies, such as IperionX, are regulated by the Corporations Act, which prohibits the acquisition of a “relevant interest” in issued voting shares in a listed company if the acquisition will lead to that person’s or someone else’s voting power in IperionX increasing from 20% or below to more than 20% or increasing from a starting point that is above 20% and below 90%, subject to a range of exceptions.
Generally, a person will have a relevant interest in securities if the person:
•is the holder of the securities;
•has power to exercise, or control the exercise of, a right to vote attached to the securities; or
•has the power to dispose of, or control the exercise of a power to dispose of, the securities (including any indirect or direct power or control).
If, at a particular time, a person has a relevant interest in issued securities and the person:
•has entered or enters into an agreement with another person with respect to the securities;
109

Table of Contents
•has given or gives another person an enforceable right, or has been or is given an enforceable right by another person, in relation to the securities; or
•has granted or grants an option to, or has been or is granted an option by, another person with respect to the securities, and the other person would have a relevant interest in the securities if the agreement were performed, the right enforced or the option exercised, the other person is taken to already have a relevant interest in the securities.
There are a number of exceptions to the above prohibition on acquiring a relevant interest in issued voting shares above 20%. In general terms, some of the more significant exceptions include:
•when the acquisition results from the acceptance of an offer under a formal takeover bid;
•when the acquisition is conducted on market by or on behalf of the bidder under a takeover bid and the acquisition occurs during the bid period;
•when shareholders of IperionX approve the takeover by resolution passed at general meeting;
•an acquisition by a person if, throughout the six months before the acquisition, that person or any other person has had voting power in IperionX of at least 19% and, as a result of the acquisition, none of the relevant persons would have voting power in IperionX more than three percentage points higher than they had six months before the acquisition;
•as a result of a rights issue;
•as a result of dividend reinvestment schemes;
•as a result of underwriting arrangements;
•through operation of law;
•an acquisition that arises through the acquisition of a relevant interest in another listed company;
•arising from an auction of forfeited shares conducted on market; or
•arising through a compromise, arrangement, liquidation or buy-back.
Breaches of the takeovers provisions of the Corporations Act are criminal offenses. ASIC and the Australian Takeover Panel have a wide range of powers relating to breaches of takeover provisions, including the ability to make orders cancelling contracts, freezing transfers of, and rights attached to, securities, and forcing a party to dispose of securities. There are certain defenses to breaches of the takeover provisions provided in the Corporations Act.
Access to and Inspection of Documents
Inspection of our records is governed by the Corporations Act. Any member of the public has the right to inspect or obtain copies of our registers on the payment of a prescribed fee. Shareholders are not required to pay a fee for inspection of our registers or minute books of the meetings of shareholders. Other corporate records, including minutes of directors’ meetings, financial records and other documents, are not open for inspection by shareholders. Where a shareholder is acting in good faith and an inspection is deemed to be made for a proper purpose, a shareholder may apply to the court to make an order for inspection of our books.
American Depositary Shares
The Bank of New York Mellon, as depositary, registers and delivers American Depositary Shares, also referred to as ADSs. Each ADS represents 10 shares (or a right to receive 10 shares) deposited with The Hong Kong and Shanghai Banking Corporation Limited, as custodian for the depositary in Sydney, Australia. Each ADS also represents any other securities, cash or other property that may be held by the depositary. The deposited shares together with any other securities, cash or other property held by the depositary are referred to as the deposited securities. The depositary’s office at which the ADSs are administered and its principal executive office are located at 240 Greenwich Street, New York, New York 10286.
You may hold ADSs either (A) directly (i) by having an American Depositary Receipt, also referred to as an ADR, which is a certificate evidencing a specific number of ADSs, registered in your name, or (ii) by having uncertificated ADSs registered in your name, or (B) indirectly by holding a security entitlement in ADSs through your broker or other financial institution that is a direct or indirect participant in The Depository Trust Company, also called DTC. If you hold ADSs
110

Table of Contents
directly, you are a registered ADS holder, also referred to as an ADS holder. This description assumes you are an ADS holder. If you hold the ADSs indirectly, you must rely on the procedures of your broker or other financial institution to assert the rights of ADS holders described in this section. You should consult with your broker or financial institution to find out what those procedures are.
Registered holders of uncertificated ADSs receive statements from the depositary confirming their holdings.
As an ADS holder, we will not treat you as one of our shareholders and you will not have shareholder rights. Australian law governs shareholder rights. The depositary will be the holder of the shares underlying your ADSs. As a registered holder of ADSs, you will have ADS holder rights. A deposit agreement among us, the depositary, ADS holders and all other persons indirectly or beneficially holding ADSs sets out ADS holder rights as well as the rights and obligations of the depositary. New York law governs the deposit agreement and the ADSs.
The following is a summary of the material provisions of the deposit agreement. For more complete information, you should read the entire deposit agreement and the form of ADR.
Dividends and Other Distributions
How will you receive dividends and other distributions on the shares?
The depositary has agreed to pay or distribute to ADS holders the cash dividends or other distributions it or the custodian receives on shares or other deposited securities, upon payment or deduction of its fees and expenses. You will receive these distributions in proportion to the number of shares your ADSs represent.
•Cash. The depositary will convert any cash dividend or other cash distribution we pay on the shares into U.S. dollars, if it can do so on a reasonable basis and can transfer the U.S. dollars to the U.S. If that is not possible or if any government approval is needed and cannot be obtained, the deposit agreement allows the depositary to distribute the foreign currency only to those ADS holders to whom it is possible to do so. It will hold the foreign currency it cannot convert for the account of the ADS holders who have not been paid. It will not invest the foreign currency and it will not be liable for any interest.
Before making a distribution, any withholding taxes, or other governmental charges that must be paid will be deducted. The depositary will distribute only whole U.S. dollars and cents and will round fractional cents to the nearest whole cent. If the exchange rates fluctuate during a time when the depositary cannot convert the foreign currency, you may lose some of the value of the distribution.
•Shares. The depositary may distribute additional ADSs representing any shares we distribute as a dividend or free distribution. The depositary will only distribute whole ADSs. It will sell shares which would require it to deliver a fraction of an ADS (or ADSs representing those shares) and distribute the net proceeds in the same way as it does with cash. If the depositary does not distribute additional ADSs, the outstanding ADSs will also represent the new shares. The depositary may sell a portion of the distributed shares (or ADSs representing those shares) sufficient to pay its fees and expenses in connection with that distribution.
•Rights to purchase additional shares. If we offer holders of our securities any rights to subscribe for additional shares or any other rights, the depositary may (i) exercise those rights on behalf of ADS holders, (ii) distribute those rights to ADS holders or (iii) sell those rights and distribute the net proceeds to ADS holders, in each case after deduction or upon payment of its fees and expenses. To the extent the depositary does not do any of those things, it will allow the rights to lapse. In that case, you will receive no value for them. The depositary will exercise or distribute rights only if we ask it to and provide satisfactory assurances to the depositary that it is legal to do so. If the depositary will exercise rights, it will purchase the securities to which the rights relate and distribute those securities or, in the case of shares, new ADSs representing the new shares, to subscribing ADS holders, but only if ADS holders have paid the exercise price to the depositary. U.S. securities laws may restrict the ability of the depositary to distribute rights or ADSs or other securities issued on exercise of rights to all or certain ADS holders, and the securities distributed may be subject to restrictions on transfer.
•Other Distributions. The depositary will send to ADS holders anything else we distribute on deposited securities by any means it thinks is legal, fair and practical. If it cannot make the distribution in that way, the depositary has a choice. It may decide to sell what we distributed and distribute the net proceeds, in the same way as it does with
111

Table of Contents
cash. Or, it may decide to hold what we distributed, in which case ADSs will also represent the newly distributed property. However, the depositary is not required to distribute any securities (other than ADSs) to ADS holders unless it receives satisfactory evidence from us that it is legal to make that distribution. The depositary may sell a portion of the distributed securities or property sufficient to pay its fees and expenses in connection with that distribution. U.S. securities laws may restrict the ability of the depositary to distribute securities to all or certain ADS holders, and the securities distributed may be subject to restrictions on transfer.
The depositary is not responsible if it decides that it is unlawful or impractical to make a distribution available to any ADS holders. We have no obligation to register ADSs, shares, rights or other securities under the Securities Act. We also have no obligation to take any other action to permit the distribution of ADSs, shares, rights or anything else to ADS holders. This means that you may not receive the distributions we make on our shares or any value for them if it is illegal or impractical for us to make them available to you.
Deposit, Withdrawal and Cancellation
How are ADSs issued?
The depositary will deliver ADSs if you or your broker deposits shares or evidence of rights to receive shares with the custodian. Upon payment of its fees and expenses and of any taxes or charges, such as stamp taxes or stock transfer taxes or fees, the depositary will register the appropriate number of ADSs in the names you request and will deliver the ADSs to or upon the order of the person or persons that made the deposit.
How can ADS holders withdraw the deposited securities?
You may surrender your ADSs to the depositary for the purpose of withdrawal. Upon payment of its fees and expenses and of any taxes or charges, such as stamp taxes or stock transfer taxes or fees, the depositary will deliver the shares and any other deposited securities underlying the ADSs to the ADS holder or a person the ADS holder designates at the office of the custodian. Or, at your request, risk and expense, the depositary will deliver the deposited securities at its office, if feasible. However, the depositary is not required to accept surrender of ADSs to the extent it would require delivery of a fraction of a deposited share or other security. The depositary may charge you a fee and its expenses for instructing the custodian regarding delivery of deposited securities.
How do ADS holders interchange between certificated ADSs and uncertificated ADSs?
You may surrender your ADR to the depositary for the purpose of exchanging your ADR for uncertificated ADSs. The depositary will cancel that ADR and will send to the ADS holder a statement confirming that the ADS holder is the registered holder of uncertificated ADSs. Upon receipt by the depositary of a proper instruction from a registered holder of uncertificated ADSs requesting the exchange of uncertificated ADSs for certificated ADSs, the depositary will execute and deliver to the ADS holder an ADR evidencing those ADSs.
Voting Rights
How do you vote?
ADS holders may instruct the depositary how to vote the number of deposited shares their ADSs represent. If we request the depositary to solicit your voting instructions (and we are not required to do so), the depositary will notify you of a shareholders’ meeting and send or make voting materials available to you. Those materials will describe the matters to be voted on and explain how ADS holders may instruct the depositary how to vote. For instructions to be valid, they must reach the depositary by a date set by the depositary. The depositary will try, as far as practical, subject to the laws of Australia and the provisions of our constitution or similar documents, to vote or to have its agents vote the shares or other deposited securities as instructed by ADS holders. If we do not request the depositary to solicit your voting instructions, you can still send voting instructions, and, in that case, the depositary may try to vote as you instruct, but it is not required to do so.
Except by instructing the depositary as described above, you won’t be able to exercise voting rights unless you surrender your ADSs and withdraw the shares. However, you may not know about the meeting enough in advance to withdraw the shares. In any event, the depositary will not exercise any discretion in voting deposited securities and it will only vote or attempt to vote as instructed.
112

Table of Contents
We cannot assure you that you will receive the voting materials in time to ensure that you can instruct the depositary to vote the shares represented by your ADSs. In addition, the depositary and its agents are not responsible for failing to carry out voting instructions or for the manner of carrying out voting instructions. This means that you may not be able to exercise voting rights and there may be nothing you can do if the shares represented by your ADSs are not voted as you requested.
In order to give you a reasonable opportunity to instruct the depositary as to the exercise of voting rights relating to Deposited Securities, if we request the Depositary to act, we agree to give the depositary notice of any such meeting and details concerning the matters to be voted upon at least 30 days in advance of the meeting date.
Payment of Taxes
You will be responsible for any taxes or other governmental charges payable on your ADSs or on the deposited securities represented by any of your ADSs. The depositary may refuse to register any transfer of your ADSs or allow you to withdraw the deposited securities represented by your ADSs until those taxes or other charges are paid. It may apply payments owed to you or sell deposited securities represented by your ADSs to pay any taxes owed and you will remain liable for any deficiency. If the depositary sells deposited securities, it will, if appropriate, reduce the number of ADSs to reflect the sale and pay to ADS holders any proceeds, or send to ADS holders any property, remaining after it has paid the taxes.
Tender and Exchange Offers; Redemption, Replacement or Cancellation of Deposited Securities
The depositary will not tender deposited securities in any voluntary tender or exchange offer unless instructed to do so by an ADS holder surrendering ADSs and subject to any conditions or procedures the depositary may establish.
If deposited securities are redeemed for cash in a transaction that is mandatory for the depositary as a holder of deposited securities, the depositary will call for surrender of a corresponding number of ADSs and distribute the net redemption money to the holders of called ADSs upon surrender of those ADSs.
If there is any change in the deposited securities such as a sub-division, combination or other reclassification, or any merger, consolidation, recapitalization or reorganization affecting the issuer of deposited securities in which the depositary receives new securities in exchange for or in lieu of the old deposited securities, the depositary will hold those replacement securities as deposited securities under the deposit agreement. However, if the depositary decides it would not be lawful and practical to hold the replacement securities because those securities could not be distributed to ADS holders or for any other reason, the depositary may instead sell the replacement securities and distribute the net proceeds upon surrender of the ADSs.
If there is a replacement of the deposited securities and the depositary will continue to hold the replacement securities, the depositary may distribute new ADSs representing the new deposited securities or ask you to surrender your outstanding ADSs in exchange for new ADSs identifying the new deposited securities.
If there are no deposited securities underlying ADSs, including if the deposited securities are cancelled, or if the deposited securities underlying ADSs have become apparently worthless, the depositary may call for surrender of those ADSs or cancel those ADSs upon notice to the ADS holders.
Amendment and Termination
How may the deposit agreement be amended?
We may agree with the depositary to amend the deposit agreement and the ADRs without your consent for any reason. If an amendment adds or increases fees or charges, except for taxes and other governmental charges or expenses of the depositary for registration fees, facsimile costs, delivery charges or similar items, or prejudices a substantial right of ADS holders, it will not become effective for outstanding ADSs until 30 days after the depositary notifies ADS holders of the amendment. At the time an amendment becomes effective, you are considered, by continuing to hold your ADSs, to agree to the amendment and to be bound by the ADRs and the deposit agreement as amended.
113

Table of Contents
How may the deposit agreement be terminated?
The depositary will initiate termination of the deposit agreement if we instruct it to do so. The depositary may initiate termination of the deposit agreement if:
•60 days have passed since the depositary told us it wants to resign but a successor depositary has not been appointed and accepted its appointment;
•we delist the ADSs from an exchange in the U.S. on which they were listed and do not list the ADSs on another exchange in the U.S. or make arrangements for trading of ADSs on the U.S. over-the-counter market;
•we delist our shares from an exchange outside the U.S. on which they were listed and do not list the shares on another exchange outside the U.S.;
•the depositary has reason to believe the ADSs have become, or will become, ineligible for registration on Form F-6 under the Securities Act of 1933;
•we appear to be insolvent or enter insolvency proceedings;
•all or substantially all the value of the deposited securities has been distributed either in cash or in the form of securities;
•there are no deposited securities underlying the ADSs or the underlying deposited securities have become apparently worthless; or
•there has been a replacement of deposited securities.
If the deposit agreement will terminate, the depositary will notify ADS holders at least 90 days before the termination date. At any time after the termination date, the depositary may sell the deposited securities. After that, the depositary will hold the money it received on the sale, as well as any other cash it is holding under the deposit agreement, unsegregated and without liability for interest, for the pro rata benefit of the ADS holders that have not surrendered their ADSs. Normally, the depositary will sell as soon as practicable after the termination date.
After the termination date and before the depositary sells, ADS holders can still surrender their ADSs and receive delivery of deposited securities, except that the depositary may refuse to accept a surrender for the purpose of withdrawing deposited securities or reverse previously accepted surrenders of that kind that have not settled if it would interfere with the selling process. The depositary may refuse to accept a surrender for the purpose of withdrawing sale proceeds until all the deposited securities have been sold. The depositary will continue to collect distributions on deposited securities, but, after the termination date, the depositary is not required to register any transfer of ADSs or distribute any dividends or other distributions on deposited securities to the ADSs holder (until they surrender their ADSs) or give any notices or perform any other duties under the deposit agreement except as described in this paragraph.
Limitations on Obligations and Liability
Limits on our Obligations and the Obligations of the Depositary; Limits on Liability to Holders of ADSs
The deposit agreement expressly limits our obligations and the obligations of the depositary. It also limits our liability and the liability of the depositary. We and the depositary:
•are only obligated to take the actions specifically set forth in the deposit agreement without negligence or bad faith, and the depositary will not be a fiduciary or have any fiduciary duty to holders of ADSs;
•are not liable if we are or it is prevented or delayed by law or by events or circumstances beyond our or its ability to prevent or counteract with reasonable care or effort from performing our or its obligations under the deposit agreement;
•are not liable if we or it exercises discretion permitted under the deposit agreement;
•are not liable for the inability of any holder of ADSs to benefit from any distribution on deposited securities that is not made available to holders of ADSs under the terms of the deposit agreement, or for any special, consequential or punitive damages for any breach of the terms of the deposit agreement;
•have no obligation to become involved in a lawsuit or other proceeding related to the ADSs or the deposit agreement on your behalf or on behalf of any other person;
114

Table of Contents
•may rely upon any documents we believe or it believes in good faith to be genuine and to have been signed or presented by the proper person;
•are not liable for the acts or omissions of any securities depository, clearing agency or settlement system; and
•the depositary has no duty to make any determination or provide any information as to our tax status, or any liability for any tax consequences that may be incurred by ADS holders as a result of owning or holding ADSs or be liable for the inability or failure of an ADS holder to obtain the benefit of a foreign tax credit, reduced rate of withholding or refund of amounts withheld in respect of tax or any other tax benefit.
In the deposit agreement, we and the depositary agree to indemnify each other under certain circumstances.
Requirements for Depositary Actions
Before the depositary will deliver or register a transfer of ADSs, make a distribution on ADSs, or permit withdrawal of shares, the depositary may require:
•payment of stock transfer or other taxes or other governmental charges and transfer or registration fees charged by third parties for the transfer of any shares or other deposited securities;
•satisfactory proof of the identity and genuineness of any signature or other information it deems necessary; and
•compliance with regulations it may establish, from time to time, consistent with the deposit agreement, including presentation of transfer documents.
The depositary may refuse to deliver ADSs or register transfers of ADSs when the transfer books of the depositary or our transfer books are closed or at any time if the depositary or we think it advisable to do so.
Your Right to Receive the Shares Underlying your ADSs
ADS holders have the right to cancel their ADSs and withdraw the underlying shares at any time except:
•when temporary delays arise because: (i) the depositary has closed its transfer books, or we have closed our transfer books; (ii) the transfer of shares is blocked to permit voting at a shareholders’ meeting; or (iii) we are paying a dividend on our ordinary shares;
•when you owe money to pay fees, taxes and similar charges; or
•when it is necessary to prohibit withdrawals in order to comply with any laws or governmental regulations that apply to ADSs or to the withdrawal of ordinary shares or other deposited securities.
This right of withdrawal may not be limited by any other provision of the deposit agreement.
Direct Registration System
In the deposit agreement, all parties to the deposit agreement acknowledge that the Direct Registration System, also referred to as DRS, and Profile Modification System, also referred to as Profile, will apply to the ADSs. DRS is a system administered by DTC that facilitates interchange between registered holding of uncertificated ADSs and holding of security entitlements in ADSs through DTC and a DTC participant. Profile is a feature of DRS that allows a DTC participant, claiming to act on behalf of a registered holder of uncertificated ADSs, to direct the depositary to register a transfer of those ADSs to DTC or its nominee and to deliver those ADSs to the DTC account of that DTC participant without receipt by the depositary of prior authorization from the ADS holder to register that transfer.
In connection with and in accordance with the arrangements and procedures relating to DRS/Profile, the parties to the deposit agreement understand that the depositary will not determine whether the DTC participant that is claiming to be acting on behalf of an ADS holder in requesting registration of transfer and delivery as described in the paragraph above has the actual authority to act on behalf of the ADS holder (notwithstanding any requirements under the Uniform Commercial Code). In the deposit agreement, the parties agree that the depositary’s reliance on and compliance with instructions received by the depositary through the DRS/Profile system and in accordance with the deposit agreement will not constitute negligence or bad faith on the part of the depositary.
115

Table of Contents
Shareholder Communications; Inspection of Register of Holders of ADSs
The depositary will make available for your inspection at its office all communications that it receives from us as a holder of deposited securities that we make generally available to holders of deposited securities. The depositary will send you copies of those communications or otherwise make those communications available to you if we ask it to. You have a right to inspect the register of holders of ADSs, but not for the purpose of contacting those holders about a matter unrelated to our business or the ADSs.
C.Material Contracts
There are no contracts, other than those disclosed in this annual report on Form 20-F and those entered into in the ordinary course of our business, that are material to us, and which were entered into in the last two completed fiscal years or which were entered into before the two most recently completed fiscal years but are still in effect as of the date of this annual report on Form 20-F.
D.Exchange Controls
Australia has largely abolished exchange controls on investment transactions. The Australian dollar is freely convertible into U.S. dollars or other currencies. In addition, there are currently no specific rules or limitations regarding the export from Australia of profits, dividends, capital or similar funds belonging to foreign investors, except that certain payments to non-residents must be reported to the Australian Cash Transaction Reports Agency, which monitors such transaction, and amounts on account of potential Australian tax liabilities may be required to be withheld unless a relevant taxation treaty can be shown to apply and under such there are either exemptions or limitations on the level of tax to be withheld.
E.Taxation
The following is a summary of material U.S. federal and Australian income tax considerations to U.S. Holders, as defined below, of the ownership and disposition of ADSs and ordinary shares. This discussion is based on the laws as of the date of this annual report, and is subject to changes in the relevant income tax law, including changes that could have retroactive effect. The following summary does not take into account or discuss the tax laws of any country or other taxing jurisdiction other than the U.S. and Australia. Holders are advised to consult their tax advisors concerning the overall tax consequences of the ownership and disposition of ADSs and ordinary shares in their particular circumstances. This discussion is not intended, and should not be construed, as legal or professional tax advice.
This summary does not address the 3.8% U.S. federal Medicare Tax on net investment income, the effects of U.S. federal estate and gift tax laws, the alternative minimum tax, or any state and local tax considerations within the U.S., and is not a comprehensive description of all U.S. federal or Australian income tax considerations that may be relevant to a decision to own or dispose of ADSs or ordinary shares. Furthermore, this summary does not address U.S. federal or Australian income tax considerations relevant to holders subject to taxing jurisdictions other than, or in addition to, the U.S. and Australia, and does not address all possible categories of holders, some of which may be subject to special tax rules.
Material U.S. Federal Income Tax Considerations
The following summary, subject to the limitations set forth below, describes the material U.S. federal income tax consequences to a U.S. Holder (as defined below) of the ownership and disposition of our ADSs and ordinary shares as of the date hereof. This summary is limited to U.S. Holders that hold our ADSs or ordinary shares as capital assets within the meaning of Section 1221 of the IRS Code.
This section does not discuss the tax consequences to any particular holder, nor any tax considerations that may apply to U.S. Holders subject to special tax rules, such as:
•insurance companies;
•banks or other financial institutions;
•individual retirement and other tax-deferred accounts;
•regulated investment companies;
•real estate investment trusts;
116

Table of Contents
•individuals who are former U.S. citizens or former long-term U.S. residents;
•brokers, dealers or traders in securities, commodities or currencies;
•traders that elect to use a mark-to-market method of accounting;
•persons holding our ADSs or ordinary shares through a partnership (including an entity or arrangement treated as a partnership for U.S. federal income tax purposes) or S corporation;
•persons that received ADSs or ordinary shares as compensation for the performance of services;
•grantor trusts;
•tax-exempt entities;
•persons that hold ADSs or ordinary shares as a position in a straddle or as part of a hedging, constructive sale, conversion or other integrated transaction for U.S. federal income tax purposes;
•persons that have a functional currency other than the U.S. dollar;
•persons that own (directly, indirectly or constructively) 10% or more of our equity (by vote or value); or
•persons that are not U.S. Holders.
In this section, a “U.S. Holder” means a beneficial owner of ADSs or ordinary shares that is, for U.S. federal income tax purposes:
•an individual who is a citizen or resident of the U.S.;
•a corporation created or organized in or under the laws of the U.S. or any state thereof or the District of Columbia;
•an estate the income of which is subject to U.S. federal income taxation regardless of its source; or
•a trust (i) the administration of which is subject to the primary supervision of a court in the U.S. and for which one or more U.S. persons have the authority to control all substantial decisions or (ii) that has an election in effect under applicable income tax regulations to be treated as a U.S. person for U.S. federal income tax purposes.
In addition, we have not received, nor do we expect to seek a ruling from the U.S. Internal Revenue Service, or the IRS, regarding any matter discussed herein. No assurance can be given that the IRS would not assert, or that a court would not sustain, a position contrary to any of those set forth below. Each U.S. Holder should consult its tax advisors with respect to the U.S. federal, state and local and non-U.S. tax consequences of owning and disposing of our ADSs and ordinary shares.
If an entity or arrangement treated as a partnership for U.S. federal income tax purposes acquires, owns or disposes of ADSs or ordinary shares, the U.S. federal income tax treatment of a partner in such partnership generally will depend on the status of the partner and the activities of the partnership. Such a partner or partnership should consult its own tax advisor as to the U.S. federal income tax consequences of owning and disposing of our ADSs or ordinary shares.
The discussion below is based upon the provisions of the IRS Code, and the U.S. Treasury regulations, rulings and judicial decisions thereunder as of the date hereof, and such authorities may be replaced, revoked or modified, possibly with retroactive effect, so as to result in U.S. federal income tax consequences different from those discussed below. In addition, this summary is based, in part, upon representations made by the depositary to us and assumes that the deposit agreement, and all other related agreements, will be performed in accordance with their terms.
You are urged to consult your tax advisor with respect to the U.S. federal, as well as state, local and non-U.S., tax consequences to you of owning and disposing of ADSs or ordinary shares in light of your particular circumstances, including the possible effects of changes in U.S. federal and other tax laws.
Ownership of ADSs in General

In general, for U.S. federal income tax purposes, U.S. Holders of ADSs will be treated as the beneficial owners of the ordinary shares represented by such ADSs. Accordingly, unless explicitly stated otherwise, the discussion below of the material U.S. federal income tax consequences with respect to owning ADSs also applies to owning ordinary shares.

117

Table of Contents
Passive Foreign Investment Company
In general, a corporation organized outside the U.S. will be treated as a PFIC for any taxable year if (i) at least 75% of its gross income for the taxable year consists of certain types of passive income or (ii) at least 50% of its gross assets during the taxable year, based on a quarterly average and generally determined by value, produce or are held for the production of passive income. Passive income for this purpose generally includes, among other things, dividends, interest, rents, royalties, gains from commodities and securities transactions and gains from the disposition of assets that produce or are held for the production of passive income. In determining whether a non-U.S. corporation is a PFIC, a pro-rata portion of the income and assets of each corporation in which it owns, directly or indirectly, at least a 25% interest (by value) is taken into account. Under this rule, we should be deemed to own the assets and to receive the income of our wholly-owned subsidiaries for purposes of the PFIC determination. Additionally, if we are classified as a PFIC in any taxable year with respect to which you own ADSs, we generally will continue to be treated as a PFIC with respect to you in all succeeding taxable years, regardless of whether we continue to meet the tests described above, unless we cease to be a PFIC and you make the “deemed sale election” described below. Furthermore, if we are treated as a PFIC, then one or more of our subsidiaries may also be treated as PFICs.
Although we do not believe that we were a PFIC for the year ended June 30, 2026, our determination depends, in part, on the application of complex U.S. federal income tax rules, which are subject to differing interpretations. Accordingly, the IRS could challenge any determination made by us (or any of our subsidiaries) concerning PFIC status in any taxable year, and a court could sustain such challenge. Additionally, even if we are not a PFIC for a particular taxable year, we could become a PFIC for future years based on changes in our assets or the value thereof, including the value of our goodwill as indicated by our market capitalization, and based on changes in our activities and income. The determination of our PFIC status for any taxable year, however, will not be determinable until after the end of the taxable year, and will depend on, among other things, the composition of our income and assets (which could change significantly during the course of a taxable year) and the market value of our assets for such taxable year, which may be, in part, based on the market price of our ADSs (which may be especially volatile). However, the PFIC rules are complex and in some cases their application can be uncertain. In light of the foregoing, and because we must make a separate determination after the close of each taxable year as to whether we were a PFIC for that year, our PFIC status is subject to substantial uncertainty. Even if we determine that we are not a PFIC for a taxable year, there can be no assurance that the IRS will agree with our conclusion and that the IRS would not successfully challenge our position. Accordingly, we cannot assure you that we will not be a PFIC for our current or any future taxable year. In addition, our U.S. counsel expresses no opinion with respect to our PFIC status for our taxable year ended June 30, 2026, our current taxable year or future taxable years. Therefore, U.S. investors should invest in our ADSs only if they are willing to bear the U.S. federal income tax consequences (described below) of an investment in a PFIC. You should consult your own tax advisor regarding our PFIC status.
U.S. Federal Income Tax Treatment of a Shareholder of a PFIC
If we are determined to be a PFIC for any taxable year (or portion thereof) during which you hold ADSs, absent certain elections (including the mark-to-market election or qualified electing fund election described below), you generally will be subject to adverse rules (regardless of whether we continue to be classified as a PFIC) with respect to (1) any “excess distribution” (generally, any distributions you receive on your ADSs in a taxable year that are greater than 125% of the average annual distributions you receive in the three preceding taxable years or, if shorter, your holding period) and (2) any gain recognized from a sale. exchange or other taxable disposition of such ADSs. Under these special tax rules:
•the excess distribution or gain will be allocated ratably over your holding period for the ADSs;
•the amount allocated to the current taxable year, and any taxable year prior to the first taxable year in which we were classified as a PFIC in your holding period, will be treated as ordinary income arising in the current taxable year (and would not be subject to the interest charge discussed below); and
•the amount allocated to each other taxable year during your holding period in which we were classified as a PFIC (i) will be subject to income tax at the highest rate in effect for that year and applicable to you and (ii) will be subject to an interest charge generally applicable to underpayments of tax with respect to the resulting tax attributable to each such year.
In addition, if you are a non-corporate U.S. Holder, you will not be eligible for reduced rates of taxation on any dividends that we pay if we are a PFIC for either the taxable year in which the dividend is paid or the preceding year.
If we are determined to be a PFIC for any taxable year during which you hold ADSs, the tax liability for amounts allocated to years prior to the year of disposition or excess distribution cannot be offset by any net operating loss, and gains (but not
118

Table of Contents
losses) recognized on the transfer of the ADSs cannot be treated as capital gains, even if the ADSs are held as capital assets. Furthermore, unless otherwise provided by the U.S. Treasury Department, if we are determined to be a PFIC for any taxable year during which you hold ADSs, you will be required to file an annual report (currently Form 8621) describing your interest in us, making an election on how to report PFIC income, and providing other information about your share of our income.
Under certain attribution rules, if we are determined to be a PFIC, you generally will be deemed to own your proportionate share of our direct or indirect equity interest in any company that is also a PFIC (a “Subsidiary PFIC”), and generally will be subject to U.S. federal income tax on your proportionate share of (i) any “excess distributions,” as described above, on the stock of a Subsidiary PFIC and (ii) a disposition or deemed disposition of the stock of a Subsidiary PFIC by us or another Subsidiary PFIC, both as if you directly held the shares of such Subsidiary PFIC. In addition, you may be subject to U.S. federal income tax on any indirect gain realized on the stock of a Subsidiary PFIC on the sale, exchange or other taxable disposition of our ADSs. Accordingly, U.S. Holders should be aware that they could be subject to tax under the PFIC rules even if no distributions are received on our ADSs and no redemptions or other dispositions are made. You should consult your tax advisor regarding the tax consequences if the PFIC rules apply to any of our subsidiaries.
If we are classified as a PFIC and then cease to be so classified, you may make an election (a “deemed sale election”) to be treated for U.S. federal income tax purposes as having sold your ADSs on the last day of our taxable year during which we were a PFIC. A U.S. Holder that makes a deemed sale election would then cease to be treated as owning stock in a PFIC. However, gain recognized as a result of making the deemed sale election would be subject to the adverse rules described above, and loss would not be recognized.
“Mark-to-Market” Election, QEF Election and Purging Election
In certain circumstances, a holder of “marketable stock” of a PFIC can avoid certain of the adverse rules described above by making a mark-to-market election with respect to such stock. For purposes of these rules, “marketable stock” is stock which is “regularly traded” (traded in greater than de minimis quantities on at least 15 days during each calendar quarter) on a “qualified exchange” or other market within the meaning of applicable U.S. Treasury Regulations. A “qualified exchange” includes a national securities exchange that is registered with the SEC. A foreign securities exchange is a “qualified exchange” if (1) it is regulated or supervised by a governmental authority of the country in which the market is located, (2) it satisfies certain trading volume, listing, financial disclosure, surveillance, and other requirements, (3) the laws of the country ensure such requirements described in (2) are met, and (4) the rules of the exchange effectively promote active trading of listed stocks.
If a mark-to-market election is in effect, you generally would include in gross income, as ordinary income, for each taxable year that we are determined to be a PFIC an amount equal to the excess, if any, of the fair market value of your ADSs that are “marketable stock” at the close of the taxable year over your adjusted tax basis in such ADSs. If you make such election, you may also claim a deduction as an ordinary loss in each such year for the excess, if any, of your adjusted tax basis in such ADSs over their fair market value at the end of the year, but only to the extent of the net amount previously included in income as a result of the mark-to-market election. The adjusted tax basis of your ADSs with respect to which the mark-to-market election applies would be adjusted to reflect amounts included in gross income or allowed as a deduction because of such election. If you make an effective mark-to-market election, any gain you recognize upon the sale, exchange or other taxable disposition of your ADSs in a year that we are determined to be a PFIC will be treated as ordinary income and any loss will be treated as ordinary loss, but only to the extent of the net amount previously included in income as a result of the mark-to-market election.
Under current law, the mark-to-market election may be available to U.S. Holders of ADSs if the ADSs remain listed on the Nasdaq, which constitutes a qualified exchange, although there can be no assurance that the ADSs will be “regularly traded” for purposes of the mark-to-market election. While we would expect the Australian Securities Exchange, on which the ordinary shares are listed, to be considered a qualified exchange, no assurance can be given as to whether the Australian Securities Exchange is a qualified exchange, or that the ordinary shares would be traded in sufficient frequency to be considered regularly traded for these purposes. Additionally, because a mark-to-market election cannot be made for equity interests in any lower-tier PFIC that we may own, if we are determined to be a PFIC and you make a mark-to-mark election with respect to us, you may continue to be subject to the PFIC rules with respect to any indirect investments held by us that are treated as an equity interest in a PFIC for U.S. federal income tax purposes.
If a mark-to-market election is in effect, it will be effective for the taxable year for which the election is made and all subsequent taxable years unless the ADSs are no longer regularly traded on a qualified exchange or the IRS consents to the
119

Table of Contents
revocation of the election. A mark-to-market election will not apply to our ADSs for any taxable year during which we are not a PFIC, but will remain in effect with respect to any subsequent taxable year in which we become a PFIC. You are urged to consult your tax advisors about the availability of the mark-to-market election, and whether making the election would be advisable in your particular circumstances.
The tax consequences that would apply if we are a PFIC would also be different from those described above if a U.S. Holder were able to obtain certain information from us and elect to treat us as a “qualified electing fund”, or QEF, under Section 1295 of the IRS Code. Pursuant to the QEF election, you generally will be required to include in income your pro-rata share of our net capital gains (as long-term capital gain) and other earnings and profits (as ordinary income), on a current basis, in each case whether or not distributed, in the taxable year in which or with which our taxable year ends if we qualified as a PFIC in that taxable year.
A U.S. Holder that does not make a timely QEF election in the first taxable year (or portion thereof) in which we are a PFIC that is included in the holding period of such U.S. Holder may be able to mitigate the adverse PFIC tax consequences by making a QEF election in a subsequent taxable year and simultaneously making a purging election under the PFIC rules. Under one type of purging election, the U.S. Holder will be deemed to have sold its ADSs at their fair market value, and any gain recognized on such deemed sale will be treated in the same manner as an excess distribution, taxed as described above. As a result of this purging election, the U.S. Holder will have additional basis (to the extent of any gain recognized on the deemed sale). U.S. Holders are strongly urged to consult with and rely solely upon their tax advisors regarding the application of the rules governing purging elections to their particular circumstances.
U.S. Holders should be aware that there can be no assurances that we will satisfy the record keeping requirements that apply to a QEF, or that we will supply U.S. Holders with information that such U.S. Holders are required to report under the QEF rules, in the event that we are a PFIC. Thus, U.S. Holders may not be able to make a QEF Election, including a purging election, with respect to their ADSs.
PFIC Reporting Requirements
If we are a PFIC, each U.S. Holder would generally be required to file an annual information return on IRS Form 8621 containing such information as the U.S. Treasury Department may require. The failure to file IRS Form 8621 could result in the imposition of penalties and the extension of the statute of limitations with respect to U.S. federal income tax.
The U.S. federal income tax rules relating to PFICs, mark-to-market elections, and QEF elections are very complex and are affected by various factors in addition to those described above. You are strongly urged to consult your own tax advisor with respect to the impact of PFIC status on the purchase, ownership and disposition of our ADSs, the consequences to you of an investment in a PFIC, any elections available with respect to our ADSs and the IRS information reporting obligations with respect to the ownership and disposition of our ADSs.
Distributions
We do not currently anticipate paying any distributions on our ADSs or ordinary shares in the foreseeable future. However, to the extent there are any distributions made with respect to our ADSs or ordinary shares in the foreseeable future, and subject to the PFIC rules discussed above, the gross amount of any such distributions (without deduction for any withholding tax) made out of our current or accumulated earnings and profits (as determined for U.S. federal income tax purposes) generally will be taxable to you as ordinary dividend income on the date such distribution is actually or constructively received. Distributions in excess of our current and accumulated earnings and profits, as so determined, will be treated first as a tax-free return of capital to the extent of your adjusted tax basis in the ADSs or ordinary shares, as applicable, and thereafter as capital gain. Notwithstanding the foregoing, we do not intend to maintain calculations of earnings and profits, as determined for U.S. federal income tax purposes. Consequently, you should expect to treat any distributions paid with respect to our ADSs or ordinary shares as dividend income. (See “-Backup Withholding Tax and Information Reporting Requirements” below).
If you are a corporate U.S. Holder, dividends paid to you generally will not be eligible for the dividends-received deduction generally allowed under the IRS Code. If you are a non-corporate U.S. Holder, dividends paid to you by a “qualified foreign corporation” may be subject to taxation at a maximum rate of 20% if the dividends are “qualified dividends.” Dividends will be treated as qualified dividends if (a) certain holding period requirements are satisfied, (b) we are eligible for benefits under the tax Treaty, or our ADSs or ordinary shares are readily tradable on an established U.S. securities market, and (c) we were not, in the taxable year prior to the year in which the dividend was paid, and are not, in the taxable
120

Table of Contents
year in which the dividend is paid, a PFIC (see the discussion above under “-Passive Foreign Investment Company”). You are urged to consult your tax advisors regarding the availability of the reduced tax rate on dividends with regard to your particular circumstances.
The amount of any distributions paid in Australian dollars, including any Australian withholding taxes, will be included in your gross income in a U.S. dollar amount calculated by reference to the spot exchange rate in effect on the date of actual or constructive receipt, regardless of whether the Australian dollars are converted into U.S. dollars at that time. If Australian dollars are converted into U.S. dollars on the date of actual or constructive receipt, your tax basis in those Australian dollars generally will be equal to their U.S. dollar value on that date and, as a result, you generally should not be required to recognize any foreign exchange gain or loss.
If Australian dollars so received are not converted into U.S. dollars on the date of receipt, you will have a basis in the Australian dollars equal to their U.S. dollar value on the date of receipt. Any gain or loss on a subsequent conversion or other disposition of the Australian dollars generally will be treated as ordinary income or loss to you and generally will be income or loss from sources within the U.S. for foreign tax credit limitation purposes.
Dividends you receive with respect to ADSs generally will be treated as foreign source income, which may be relevant in calculating your foreign tax credit limitation. The limitation on foreign taxes eligible for credit is calculated separately with respect to specific classes of income. For these purposes, dividends generally will be categorized as “passive” income, or in the case of certain U.S. Holders, “general category” income. Subject to certain limitations, you generally will be entitled, at your option, to claim either a credit against your U.S. federal income tax liability or a deduction in computing its U.S. federal taxable income in respect of any Australian taxes withheld. If you elect to claim a deduction, rather than a foreign tax credit, for Australian taxes withheld for a particular taxable year, the election will apply to all foreign taxes paid or accrued by you or on your behalf in the particular taxable year.
The availability of the foreign tax credit and the limitations on its availability are fact-specific and are subject to complex rules. You are urged to consult your tax advisor as to the consequences of Australian withholding taxes and the availability of a foreign tax credit or deduction. See “Australian Tax Considerations-Taxation of Dividends.” You should also consult your tax advisor regarding the application of the foreign tax credit rules to the QEF and mark-to-market regimes described above in the event we are a PFIC.
Sale, Exchange or Other Taxable Disposition of ADSs
Subject to the discussion above under “-Passive Foreign Investment Company,” you will, for U.S. federal income tax purposes, recognize gain or loss on a sale, exchange or other taxable disposition of ADSs in an amount equal to the difference between the amount realized on the sale, exchange or other taxable disposition (determined in the case of sales, exchange or other taxable dispositions in currencies other than U.S. dollars by reference to the spot exchange rate in effect on the date of the sale, exchange or, other taxable disposition or, in the case of a sale, exchange or other taxable disposition on an established securities market by a cash basis taxpayer or an electing accrual basis taxpayer, the spot exchange rate in effect on the settlement date) and your adjusted tax basis (as determined in U.S. dollars) in the ADSs. Your initial tax basis will be your U.S. dollar purchase price for such ADSs.
Such gain or loss generally will be capital gain or loss. Capital gains of a non-corporate U.S. Holder, including an individual, which has held the ADSs for more than one year are currently eligible for reduced tax rates. For foreign tax credit limitation purposes, gain or loss recognized upon a disposition generally will be treated as from sources within the U.S. However, in limited circumstances, the Treaty can re-source U.S. source income as Australian source income. The deductibility of capital losses is subject to limitations for U.S. federal income tax purposes.
You should consult your own tax advisor regarding the availability of a foreign tax credit or deduction in respect of any Australian tax imposed on a sale, exchange or other taxable disposition of ADSs. See “Australian Tax Considerations-Tax on Sales or other Dispositions of Shares.”
Backup Withholding Tax and Information Reporting Requirements
Payments of dividends with respect to the ADSs and proceeds from the sale, exchange or other taxable disposition of the ADSs, by a U.S. paying agent or other U.S. intermediary, or made into the U.S., will be reported to the IRS and to you as may be required under applicable Treasury regulations. Backup withholding may apply to these payments if you fail to provide an accurate taxpayer identification number or certification of exempt status or otherwise fail to comply with
121

Table of Contents
applicable certification requirements. Certain U.S. Holders (including, among others, corporations) are not subject to backup withholding and information reporting. Backup withholding is not an additional tax. Any amounts withheld under the backup withholding rules from a payment to you will be refunded (or credited against your U.S. federal income tax liability, if any), provided the required information is timely furnished to the IRS. Prospective investors should consult their own tax advisors as to their qualification for exemption from backup withholding and the procedure for establishing an exemption.
Certain individual U.S. Holders (and under Treasury regulations, certain entities) may be required to report to the IRS (on Form 8938) information with respect to their investment in the ADSs not held through an account with a U.S. financial institution. You are urged to consult with your tax advisor regarding the reporting obligations that may arise from the ownership or disposition of our ADSs.
The discussion above is not intended to constitute a complete analysis of all tax considerations applicable to an investment in ADSs. You should consult with your tax advisor concerning the tax consequences to you in your particular situation.
Australian Tax Considerations
In this section, we discuss the material Australian income tax, stamp duty and goods and services tax considerations related to the ownership and disposal by the absolute beneficial owners of the ADSs.
It is based upon existing Australian tax law as of the date of this annual report, which is subject to change, possibly retrospectively. This discussion does not address all aspects of Australian tax law which may be important to particular investors in light of their individual investment circumstances, such as shares held by investors subject to special tax rules (for example, financial institutions, insurance companies or tax exempt organizations). In addition, this summary does not discuss any foreign or state tax considerations, other than stamp duty and goods and services tax.
Prospective investors are urged to consult their tax advisors regarding the Australian and foreign income and other tax considerations of the ownership and disposition of the shares. As used in this summary a “Non-Australian Shareholder” is a holder that is not an Australian tax resident and is not carrying on business in Australia through a permanent establishment.
Taxation of Dividends
Australia operates a dividend imputation system under which dividends may be declared to be “franked” to the extent of tax paid on company profits. Fully franked dividends are not subject to dividend withholding tax. An exemption for dividend withholding tax can also apply to unfranked dividends that are declared to be conduit foreign income (CFI), and paid to Non-Australian Shareholders. Dividend withholding tax will be imposed at 30%, unless a shareholder is a resident of a country with which Australia has a double taxation agreement and qualifies for the benefits of the Treaty. Under the provisions of the current Treaty, the Australian tax withheld on unfranked dividends that are not declared to be CFI paid by us to a resident of the U.S. which is beneficially entitled to that dividend is limited to 15% where that resident is a qualified person for the purposes of the Treaty.
If a Non-Australian Shareholder is a company and owns a 10% or more interest, the Australian tax withheld on dividends paid by us to which a resident of the U.S. is beneficially entitled is limited to 5%. In limited circumstances the rate of withholding can be reduced to zero.
Tax on Sales or other Dispositions of Shares-Capital gains tax
Non-Australian Shareholders will not be subject to Australian capital gains tax on the gain made on a sale or other disposal of ADSs, unless they, together with associates, hold 10% or more of our issued capital, at the time of disposal or for 12 months of the last 2 years prior to disposal.
Non-Australian Shareholders who own a 10% or more interest would be subject to Australian capital gains tax if more than 50% of our direct or indirect assets, determined by reference to market value, consists of Australian land, leasehold interests or Australian extraction, quarrying or prospecting rights. The Treaty is unlikely to limit Australia’s right to tax any gain in these circumstances. Net capital gains are calculated after reduction for capital losses, which may only be offset against capital gains.
122

Table of Contents
Tax on Sales or other Dispositions of Shares-Shareholders Holding Shares on Revenue Account
Some Non-Australian Shareholders may hold shares on revenue rather than on capital account for example, share traders. These shareholders may have the gains made on the sale or other disposal of the shares included in their assessable income under the ordinary income taxing provisions of the income tax law, if the gains are sourced in Australia.
Non-Australian Shareholders assessable under these ordinary income provisions in respect of gains made on shares held on revenue account would be assessed for such gains at the Australian tax rates for non-Australian residents, which start at a marginal rate of 30%. Some relief from Australian income tax may be available to Non-Australian Shareholders under the Treaty. Non-Australian Shareholders that are companies will be assessed at a rate of 30%.
To the extent an amount would be included in a Non-Australian Shareholder’s assessable income under both the capital gains tax provisions and the ordinary income provisions, the capital gain amount would generally be reduced, so that the shareholder would not be subject to double tax on any part of the income gain or capital gain.
Dual Residency
If a shareholder is a resident of both Australia and the U.S. under those countries’ domestic taxation laws, that shareholder may be subject to tax as an Australian resident. If, however, the shareholder is determined to be a U.S. resident for the purposes of the Treaty, the Australian tax would be subject to limitation by the Treaty. Shareholders should obtain specialist taxation advice in these circumstances.
Stamp Duty
No stamp duty is payable by Australian residents or non-Australian residents on the issue and trading of shares that are quoted on the ASX or Nasdaq at all relevant times and the shares do not represent 90% or more of all of our issued shares.
Australian Death Duty
Australia does not have estate or death duties. As a general rule, no capital gains tax liability is realized upon the inheritance of a deceased person’s shares. The disposal of inherited shares by beneficiaries may, however, give rise to a capital gains tax liability if the gain falls within the scope of Australia’s jurisdiction to tax.
Goods and Services Tax
The issue or transfer of shares to a non-Australian resident investor will not incur Australian goods and services tax.
F.Dividends and Paying Agents
Not applicable.
G.Statement by Experts
Not applicable.
H.Documents on Display
We are subject to the information reporting requirements of the Exchange Act applicable to foreign private issuers and under those requirements file reports with the SEC. We file reports, including Annual Reports on Form 20-F, furnish Current Reports on Form 6-K and disclose other information with the SEC pursuant to the rules and regulations of the SEC. The SEC maintains a website that contains reports and information statements regarding issuers that file electronically with the SEC. Our reports (including this Form 20-F) can be downloaded from the SEC’s website at www.sec.gov or our website at https://iperionx.com/investor-center/sec-filings.

As a foreign private issuer, we are exempt from the rules under the Exchange Act related to the furnishing and content of proxy statements, and our officers, directors and principal shareholders are exempt from the reporting and short-swing profit recovery provisions contained in Section 16 of the Exchange Act. In addition, we are not required under the Exchange Act to file annual, quarterly and current reports and financial statements with the SEC as frequently or as
123

Table of Contents
promptly as U.S. domestic companies whose securities are registered under the Exchange Act. However, we will file with the SEC, within 120 days after the end of each fiscal year, or such applicable time as required by the SEC, an annual report on Form 20-F containing financial statements audited by an independent registered public accounting firm, and may submit to the SEC, on a Form 6-K, unaudited quarterly financial information.
In addition, since our ordinary shares are traded on the ASX, we have filed annual and semi-annual reports with, and furnish information to, the ASX, as required under the ASX Listing Rules and the Corporations Act. Copies of our filings with the ASX can be retrieved electronically at www.asx.com.au under our symbol “IPX”. We also maintain a web site at www.iperionx.com. The information contained on our website or available through our website is not incorporated by reference into and should not be considered a part of this annual report on Form 20-F, and the reference to our website in this annual report on Form 20-F is an inactive textual reference only.
I.Subsidiary Information.
Not applicable.
J.Annual Report to Security Holders.
Not applicable.
ITEM 11.    QUANTITATIVE AND QUALITATIVE DISCLOSURES ABOUT MARKET RISK
Our principal financial instruments comprise cash, receivables, other financial assets, payables, loans and borrowings, and lease liabilities. The main risks arising from the Company's financial instruments are interest rate risk, foreign currency risk, credit risk and liquidity risk.
We manage our exposure to key financial risks in accordance with our financial risk management policy. Key risks are monitored and reviewed as circumstances change (e.g., acquisition of a new project) and policies are revised as required. The overall objective of our financial risk management policy is to support the delivery of our financial targets while protecting future financial security.
Given the nature and size of the business and uncertainty as to the timing and amount of cash inflows and outflows, we do not enter into derivative transactions to mitigate the financial risks. In addition, our policy is that no trading in financial instruments shall be undertaken for the purposes of making speculative gains. As our operations change going forward, we expect that our Board will review this policy periodically.
Our Board has overall responsibility for the establishment and oversight of the risk management framework. The Board reviews and agrees policies for managing our financial risks as summarized below. For additional information about our financial risk management objectives and policies, see Note 23 to our audited consolidated financial statements for fiscal 2026, included in this annual report.
Interest Rate Risk
Our exposure to the risk of changes in market interest rates relates primarily to the cash and short-term deposits with a floating interest rate. These financial assets with variable rates expose us to cash flow interest rate risk. All other financial assets and liabilities are either non-interest bearing (for example, receivables and payables) or have fixed interest rates (for example, lease liabilities, sub-lease receivables, and loans and borrowings).
Our cash at bank and on hand and short-term deposits had a weighted average floating interest rate at June 30, 2026 of 2.89% (2025: 3.48%).
We currently do not engage in any hedging or derivative transactions to manage interest rate risk.
Foreign Currency Risk
Foreign currency risk is the risk that the fair value of future cash outflows will fluctuate because of changes in foreign currency exchange rates.
124

Table of Contents
Our exposure to the risk of changes in foreign exchange rate relates primarily to assets and liabilities that are denominated in currencies other than U.S. dollars. We also have transactional currency exposures relating to transactions denominated in currencies other than U.S. dollars. The currency in which these transactions primarily are denominated is Australian dollars. In addition, our Australian parent company, whose functional currency is Australian dollars, holds U.S. dollar-denominated cash balances to fund the Group's U.S. operations and growth initiatives. As a result, fluctuations in the U.S. dollar to Australian dollar exchange rate may give rise to foreign exchange gains or losses upon remeasurement of these monetary assets and liabilities and may affect our reported results of operations and financial position.
It is our policy not to enter into any hedging or derivative transactions to manage foreign currency risk.
Credit Risk
Credit risk is the risk of financial loss to us if a customer or counterparty to a financial instrument fails to meet its contractual obligations. This arises principally from cash and cash equivalents, receivables, and other financial assets.
We did not have significant concentrations of credit risk as of June 30, 2026. With respect to credit risk arising from cash and cash equivalents, our exposure arises from default of the counter party, with a maximum exposure equal to the carrying amount of these instruments.
Trade and other receivables comprise primarily receivables from government funding programs, deposits, accrued interest and goods and services tax refunds due. Where possible we trade only with recognized, creditworthy third parties. It is our policy that all customers who wish to trade on credit terms are subject to credit verification procedures. In addition, receivable balances are monitored on an ongoing basis with the result that our exposure to bad debts is not significant. There were no past due receivables at the date of this report.
Liquidity Risk
Liquidity risk is the risk that we will not be able to meet our financial obligations as they fall due. The Board’s approach to managing liquidity is to ensure, as far as possible, that we will have sufficient liquidity to meet our liabilities when due. At June 30, 2026, we determined that we had sufficient liquid assets to meet our financial obligations.
ITEM 12.    DESCRIPTION OF SECURITIES OTHER THAN EQUITY SECURITIES
A.Debt Securities.
Not applicable.
B.Warrants and rights.
Not applicable.
C.Other Securities.
Not applicable.
125

Table of Contents
D.American Depositary Shares
Fees and Expenses
Persons depositing or withdrawing ordinary shares or ADS holders must pay the depositary:For:
US$5.00 (or less) per 100 ADSs (or portion of 100 ADSs)
•Issuance of ADSs, including issuances resulting from a distribution of shares or rights or other property
•Cancellation of ADSs for the purpose of withdrawal, including if the deposit agreement terminates
US$0.05 (or less) per ADS
•Any cash distribution to ADS holders
A fee equivalent to the fee that would be payable if securities distributed to you had been shares and the shares had been deposited for issuance of ADSs
•Distribution of securities distributed to holders of deposited securities (including rights) that are distributed by the depositary to ADS holders
US$0.05 (or less) per ADS per calendar year
•Depositary services
Registration or transfer fees
•Transfer and registration of shares on our share register to or from the name of the depositary or its agent when you deposit or withdraw shares
Expenses of the depositary
•Cable (including SWIFT) and facsimile transmissions (when expressly provided in the deposit agreement)
•Converting foreign currency to U.S. dollars
Taxes and other governmental charges the depositary or the custodian has to pay on any ADSs or shares underlying ADSs, such as stock transfer taxes, stamp duty or withholding taxes
•As necessary
Any charges incurred by the depositary or its agents for servicing the deposited securities
•As necessary
The depositary collects its fees for delivery and surrender of ADSs directly from investors depositing shares or surrendering ADSs for the purpose of withdrawal or from intermediaries acting for them. The depositary collects fees for making distributions to investors by deducting those fees from the amounts distributed or by selling a portion of distributable property to pay the fees. The depositary may collect its annual fee for depositary services by deduction from cash distributions or by directly billing investors or by charging the book-entry system accounts of participants acting for them. The depositary may collect any of its fees by deduction from any cash distribution payable (or by selling a portion of securities or other property distributable) to ADS holders that are obligated to pay those fees. The depositary may generally refuse to provide fee-attracting services until its fees for those services are paid.
From time to time, the depositary may make payments to us to reimburse us for costs and expenses generally arising out of establishment and maintenance of the ADS program, waive fees and expenses for services provided to us by the depositary or share revenue from the fees collected from ADS holders. In performing its duties under the deposit agreement, the depositary may use brokers, dealers, foreign currency dealers or other service providers that are owned by or affiliated with the depositary and that may earn or share fees, spreads or commissions.
126

Table of Contents
The depositary may convert currency itself or through any of its affiliates, or the custodian or we may convert currency and pay U.S. dollars to the depositary. Where the depositary converts currency itself or through any of its affiliates, the depositary acts as principal for its own account and not as agent, advisor, broker or fiduciary on behalf of any other person and earns revenue, including, without limitation, transaction spreads, that it will retain for its own account. The revenue is based on, among other things, the difference between the exchange rate assigned to the currency conversion made under the deposit agreement and the rate that the depositary or its affiliate receives when buying or selling foreign currency for its own account. The depositary makes no representation that the exchange rate used or obtained by it or its affiliate in any currency conversion under the deposit agreement will be the most favorable rate that could be obtained at the time or that the method by which that rate will be determined will be the most favorable to ADS holders, subject to the depositary’s obligation to act without negligence or bad faith. The methodology used to determine exchange rates used in currency conversions made by the depositary is available upon request. Where the custodian converts currency, the custodian has no obligation to obtain the most favorable rate that could be obtained at the time or to ensure that the method by which that rate will be determined will be the most favorable to ADS holders, and the depositary makes no representation that the rate is the most favorable rate and will not be liable for any direct or indirect losses associated with the rate. In certain instances, the depositary may receive dividends or other distributions from us in U.S. dollars that represent the proceeds of a conversion of foreign currency or translation from foreign currency at a rate that was obtained or determined by us and, in such cases, the depositary will not engage in, or be responsible for, any foreign currency transactions and neither it nor we make any representation that the rate obtained or determined by us is the most favorable rate and neither it nor we will be liable for any direct or indirect losses associated with the rate.
127

Table of Contents
PART II.
ITEM 13.    DEFAULTS, DIVIDEND ARREARAGES AND DELINQUENCIES
None.
ITEM 14.    MATERIAL MODIFICATIONS TO THE RIGHTS OF SECURITY HOLDERS AND USE OF PROCEEDS
None.
ITEM 15.    CONTROLS AND PROCEDURES
Disclosure Controls and Procedures
Our management, with the participation of our Chief Executive Officer and our Chief Financial Officer, evaluated the effectiveness of our disclosure controls and procedures as of June 30, 2026. “Disclosure controls and procedures,” as defined in Rules 13a-15(e) and 15d-15(e) under the Exchange Act, are designed to ensure that information required to be disclosed by a company in the reports that it files or submits under the Exchange Act is (i) recorded, processed, summarized and reported within the time periods specified in the Securities and Exchange Commission’s rules and forms and (ii) accumulated and communicated to the company’s management, including its principal executive officer and principal financial officer, as appropriate to allow timely decisions regarding required disclosure. Based on the evaluation of our disclosure controls and procedures, our Chief Executive Officer and our Chief Financial Officer have concluded that, as of June 30, 2026, our disclosure controls and procedures were effective. Our Chief Executive Officer and Chief Financial Officer have concluded that the consolidated financial statements included elsewhere in this Annual Report fairly present, in all material respects, our financial condition, results of operations and cash flows for the periods presented.
Management’s Report on Internal Control over Financial Reporting
Our management, including our Chief Executive Officer and Chief Financial Officer, is responsible for establishing and maintaining adequate internal control over financial reporting, as defined under Exchange Act Rules 13a-15(f) and 15d-15(f). Our internal control over financial reporting is a process designed to provide reasonable assurance regarding the reliability of financial reporting and the preparation of financial statements in accordance with IFRS as issued by the IASB. Internal control over financial reporting includes those policies and procedures that: (1) pertain to the maintenance of records that, in reasonable detail, accurately and fairly reflect the transactions and dispositions of our assets; (2) provide reasonable assurance that transactions are recorded as necessary to permit preparation of financial statements in accordance with IFRS as issued by the IASB, and that our receipts and expenditures are being made only in accordance with authorizations of our management and directors; and (3) provide reasonable assurance regarding prevention or timely detection of unauthorized acquisition, use, or disposition of our assets that could have a material effect on the financial statements.
Because of its inherent limitations, internal control over financial reporting may not prevent or detect all misstatements, including the possibility of human error and the circumvention or overriding of controls. Additionally, projections of any evaluation of effectiveness to future periods are subject to the risk that controls may become inadequate because of changes in conditions, or that the degree of compliance with the policies or procedures may deteriorate.
Our management, with participation of our Chief Executive Officer and Chief Financial Officer, assessed the effectiveness of our internal control over financial reporting as of the end of the period covered by this Annual Report based on the criteria established in Internal Control—Integrated Framework (2013) issued by the Committee of Sponsoring Organizations of the Treadway Commission. Management’s assessment included an evaluation of the design of our internal control over financial reporting and testing of the operational effectiveness of our internal control over financial reporting. Based on that assessment, our Chief Executive Officer and Chief Financial Officer concluded that as of June 30, 2026, our internal control over financial reporting was effective.
128

Table of Contents
Attestation Report of the Registered Public Accounting Firm
PricewaterhouseCoopers, our independent registered public accounting firm, has audited the consolidated financial statements of IperionX Limited as of and for the year ended June 30, 2026, included herein, and has issued an audit report on our internal control over financial reporting, which is included elsewhere in this Form 20-F.
Changes in Internal Control over Financial Reporting
During the fiscal year ended June 30, 2026, we implemented a new enterprise resource planning (ERP) system as part of our ongoing initiative to strengthen the control environment and modernize our financial reporting infrastructure. The ERP implementation represents a significant change in our information technology systems and has resulted in changes to certain of our business processes and related internal controls over financial reporting.
In connection with the ERP transition, we are continuing to migrate away from manual controls toward automated, system-based controls embedded within the new platform. This includes the replacement of manual review and approval processes with system-enforced workflows, automated three-way matching, and configurable access and segregation of duties controls built into the system architecture. Management believes this transition will further enhance the reliability and efficiency of our internal control environment and reduce the risk of error or omission associated with manual processes.
We have implemented additional monitoring procedures during this transition period to ensure that controls continued to operate effectively throughout the migration and that no gaps in the control environment arose as a result of the change in systems. As of June 30, 2026, management has evaluated the effect of these changes on our internal control over financial reporting and concluded that the ERP implementation did not adversely impact the effectiveness of our internal controls.
Other than the ERP system implementation described above, there were no changes in our internal control over financial reporting during the fiscal year ended June 30, 2026 that have materially affected, or are reasonably likely to materially affect, our internal control over financial reporting.
ITEM 16.    [RESERVED]
ITEM 16A.    AUDIT COMMITTEE FINANCIAL EXPERT
Our board of directors has determined that Mr. Tony Tripeny is an audit committee financial expert and is independent under the listing standards of the Nasdaq Capital Market for audit committee members and the heightened independence requirement for audit committee members required by Rule 10A-3 under the Exchange Act.
ITEM 16B.    CODE OF ETHICS
We have adopted a code of conduct that applies to our directors, officers, employees and contractors (collectively called the employees) of the Company. The code of conduct is publicly available under the “Company Overview” section of our website at www.iperionx.com. Written copies are available upon request. If we make any substantive amendment to the code of conduct or grant any waivers, including any implicit waiver, from a provision of the codes of conduct, we will disclose the nature of such amendment or waiver on our website.
ITEM 16C.    PRINCIPAL ACCOUNTANT FEES AND SERVICES
The following table sets forth, for each of the years indicated, the fees billed by PricewaterhouseCoopers, which has served as our independent registered public accounting firm for the last three completed fiscal years.
Services RenderedFiscal 2026
US$
Fiscal 2025
US$
Fiscal 2024
US$
Audit or review of financial reports595,000400,000270,955
Audit-related services212,339--
Total807,339400,000270,955
129

Table of Contents
Pre-Approval Policies and Procedures
Our Audit Committee has adopted policies and procedures for the pre-approval of audit and non-audit services rendered by our independent registered public accounting firm. Pre-approval of an audit or non-audit service may be given as a general pre-approval, as part of the audit committee’s approval of the scope of the engagement of our independent registered public accounting firm, or on an individual basis. Any proposed services exceeding general pre-approved levels also requires specific pre-approval by our audit committee. All of the fees described above were pre-approved by our board of directors.
ITEM 16D.    EXEMPTIONS FROM THE LISTING STANDARDS FOR AUDIT COMMITTEES
Not applicable.
ITEM 16E.    PURCHASES OF EQUITY SECURITIES BY THE ISSUER AND AFFILIATED PURCHASERS
Neither we, nor any affiliated purchaser of us, purchased any of our securities during the year ended June 30, 2026.
ITEM 16F.    CHANGE IN REGISTRANT’S CERTIFYING ACCOUNTANT
None.
ITEM 16G.    CORPORATE GOVERNANCE
Additional Corporate Governance Differences
The Nasdaq Capital Market allows a foreign private issuer, such as IperionX, to follow its home country practices in lieu of certain of Nasdaq’s corporate governance standards. In particular, we follow home country law instead of Nasdaq practice regarding:
•Nasdaq’s requirement that an issuer provide for a quorum as specified in its bylaws for any meeting of the holders of ordinary shares, which quorum may not be less than 33 1/3% of the outstanding shares of an issuer’s voting ordinary shares. In compliance with Australian law, our Constitution provides that two shareholders present shall constitute a quorum for a general meeting.
•Nasdaq’s requirement that issuers obtain shareholder approval prior to the issuance of securities in connection with certain acquisitions, changes of control or private placements of securities, or the establishment or amendment of certain stock option, purchase or other compensation plans. Applicable Australian law and rules differ from Nasdaq requirements, with the ASX Listing Rules providing generally for prior shareholder approval in numerous circumstances, including (i) issuance of equity securities exceeding 15% (or an additional 10% capacity to issue equity securities for the preceding 12-month period if shareholder approval by special resolution is sought at the Company’s annual general meeting) of our issued share capital in any 12-month period (but, in determining the available issue limit, securities issued under an exception to the rule or with shareholder approval are not counted), (ii) issuance of equity securities to related parties (as defined in the ASX Listing Rules) and (iii) directors or their associates acquiring securities under an employee incentive plan.
Following our home country governance practices, as opposed to the requirements that would otherwise apply to a U.S. company listed on the Nasdaq Capital Market, may provide less protection than is accorded to investors in a U.S. issuer.
ITEM 16H.    MINE SAFETY DISCLOSURE
Not applicable because we do not currently operate any mines subject to the U.S. Federal Mine Safety and Health Act of 1977.
ITEM 16J.    INSIDER TRADING POLICIES
Our Securities Trading Policy governs purchases, sales and other dispositions of our securities by our directors, executive officers and employees. We believe our Securities Trading Policy is reasonably designed to promote compliance with applicable insider trading laws, rules and regulations. Our Securities Trading Policy prohibits purchases, sales and other dispositions of our securities while in possession of material nonpublic information about us and from disclosing such
130

Table of Contents
information to others. The foregoing summary does not purport to be complete and is qualified in its entirety by our Securities Trading Policy, a copy of which is filed as exhibit 11.1 to this annual report.
ITEM 16K.    CYBERSECURITY
As part of our risk management approach, our cyber security program includes monitoring and implementing various protective systems and incident reporting procedures. We engage managed service providers under strict oversight from our internal IT team to ensure alignment with organization standards and security protocols.
Within the last 12 months, we have not identified risks from known cybersecurity threats, including as a result of any previous cybersecurity incidents, that have materially affected or are reasonably likely to materially affect the Company, including its business strategy, results of operations, or financial condition.
Our audit committee is responsible for oversight of risks, including risks from cybersecurity threats. The Company’s executive officers oversee the overall processes to safeguard data and comply with relevant regulations and will report material cybersecurity incidents to the audit committee. The Company possesses internal IT resources to manage and remediate cybersecurity risks, and the internal team will engage external advisors when deemed necessary.
131

Table of Contents
PART III.
ITEM 17.    FINANCIAL STATEMENTS
We have elected to provide financial statements and related information pursuant to Item 18.
ITEM 18.    FINANCIAL STATEMENTS
The consolidated financial statements and the related notes required by this Item are included in this annual report on Form 20-F beginning on page F-1.
ITEM 19.    EXHIBITS.
Exhibit
Number
Description
Certificate of the Registration of IperionX Limited (formerly Hyperion Metals Limited) (incorporated by reference to Exhibit 1.1 to the Company’s Registration Statement on Form 20-F, filed on March 29, 2022)
Constitution of IperionX Limited (formerly Hyperion Metals Limited) (incorporated by reference to Exhibit 1.2 to the Company’s Registration Statement on Form 20-F, filed on March 29, 2022)
Deposit Agreement among IperionX Limited, The Bank of New York Mellon, and Owners and Holders of American Depositary Shares (incorporated by reference to Exhibit 2.1 to the Company’s Amendment No. 1 to Registration Statement on Form 20-F, filed on May 4, 2022)
Form of American Depositary Receipt evidencing American Depositary Shares (included in Exhibit 2.1)
Description of Share Capital (incorporated by reference to Exhibit 2.3 to the Company’s Annual Report on Form 20-F, filed on August 26, 2022)
IperionX Limited (formerly Hyperion Metals Limited) Employee Incentive Plan (incorporated by reference to Exhibit 4.4 to the Company’s Registration Statement on Form 20-F, filed on March 29, 2022)
Form of Indemnity, Insurance and Access for Directors (incorporated by reference to Exhibit 4.5 to the Company’s Registration Statement on Form 20-F, filed on March 29, 2022)
List of Subsidiaries of IperionX Limited
Securities Trading Policy (incorporated by reference to Exhibit 99.1 to the Company’s Report on Form 6-K, filed on May 23, 2024)
Section 302 Certification of Chief Executive Officer
Section 302 Certification of Chief Financial Officer
Section 906 Certification of Chief Executive Officer
Section 906 Certification of Chief Financial Officer
Technical Report Summary on the Titan Project, dated June 4, 2026
Consent of PricewaterhouseCoopers
Consent of Etienne Raffaillac as Qualified Person
Consent of Marshall Miller & Associates, Inc. as Qualified Person
Consent of Primero Group Americas Inc. as Qualified Person
Consent of Karst Geo Solutions, LLC as Qualified Person
Clawback Policy (incorporated by reference to Exhibit 97.1 to the Company's Annual Report on Form 20-F, filed on October 30, 2024)
101.1The following financial statements from the Company’s Annual Report on Form 20-F for the year ended June 30, 2026, formatted in Inline XBRL: (i) Consolidated Statements of Profit or Loss and Other Comprehensive Income, (ii) Consolidated Statement of Financial Position, (iii) Consolidated Statements of Changes in Equity, (iv) Consolidated Statements of Cash Flows, and (v) Notes to Consolidated Financial Statements, tagged as blocks of text and including detailed tags.
104Cover Page Interactive Data File (formatted as Inline XBRL and contained in Exhibit 101).
*Filed herewith.
132

Table of Contents
SIGNATURES
The registrant hereby certifies that it meets all of the requirements for filing on Form 20-F and that it has duly caused and authorized the undersigned to sign this annual report on Form 20-F filed on its behalf.
IPERIONX LIMITED
By:/s/ Marcela Castro
Marcela Castro
Chief Financial Officer
Date: September 29, 2026
133

Table of Contents
IperionX Limited
ANNUAL CONSOLIDATED FINANCIAL STATEMENTS
for the year ended June 30, 2026
PAGE
F-2
F-4
F-5
F-6
F-7
F-8
F-1

Table of Contents
IperionX Limited
REPORT OF INDEPENDENT REGISTERED PUBLIC ACCOUNTING FIRM
To the Board of Directors and Shareholders of IperionX Limited
Opinions on the Financial Statements and Internal Control over Financial Reporting
We have audited the accompanying consolidated statement of financial position of IperionX Limited and its subsidiaries (the “Company”) as of June 30, 2026 and 2025, and the related consolidated statements of profit or loss and other comprehensive income, of changes in equity and of cash flows for each of the three years in the period ended June 30, 2026, including the related notes (collectively referred to as the “consolidated financial statements”). We also have audited the Company’s internal control over financial reporting as of June 30, 2026, based on criteria established in Internal Control - Integrated Framework (2013) issued by the Committee of Sponsoring Organizations of the Treadway Commission (COSO).
In our opinion, the consolidated financial statements referred to above present fairly, in all material respects, the financial position of the Company as of June 30, 2026 and 2025, and the results of its operations and its cash flows for each of the three years in the period ended June 30, 2026 in conformity with International Financial Reporting Standards as issued by the International Accounting Standards Board (“IFRS”). Also in our opinion, the Company maintained, in all material respects, effective internal control over financial reporting as of June 30, 2026, based on criteria established in Internal Control - Integrated Framework (2013) issued by the COSO.
Basis for Opinions
The Company's management is responsible for these consolidated financial statements, for maintaining effective internal control over financial reporting, and for its assessment of the effectiveness of internal control over financial reporting, included in Management’s Report on Internal Control over Financial Reporting appearing under Item 15. Our responsibility is to express opinions on the Company’s consolidated financial statements and on the Company's internal control over financial reporting based on our audits. We are a public accounting firm registered with the Public Company Accounting Oversight Board (United States) (PCAOB) and are required to be independent with respect to the Company in accordance with the U.S. federal securities laws and the applicable rules and regulations of the Securities and Exchange Commission and the PCAOB.
We conducted our audits in accordance with the standards of the PCAOB. Those standards require that we plan and perform the audits to obtain reasonable assurance about whether the consolidated financial statements are free of material misstatement, whether due to error or fraud, and whether effective internal control over financial reporting was maintained in all material respects.
Our audits of the consolidated financial statements included performing procedures to assess the risks of material misstatement of the consolidated financial statements, whether due to error or fraud, and performing procedures that respond to those risks. Such procedures included examining, on a test basis, evidence regarding the amounts and disclosures in the consolidated financial statements. Our audits also included evaluating the accounting principles used and significant estimates made by management, as well as evaluating the overall presentation of the consolidated financial statements. Our audit of internal control over financial reporting included obtaining an understanding of internal control over financial reporting, assessing the risk that a material weakness exists, and testing and evaluating the design and operating effectiveness of internal control based on the assessed risk. Our audits also included performing such other procedures as we considered necessary in the circumstances. We believe that our audits provide a reasonable basis for our opinions.
Definition and Limitations of Internal Control over Financial Reporting
A company’s internal control over financial reporting is a process designed to provide reasonable assurance regarding the reliability of financial reporting and the preparation of financial statements for external purposes in accordance with generally accepted accounting principles. A company’s internal control over financial reporting includes those policies and procedures that (i) pertain to the maintenance of records that, in reasonable detail, accurately and fairly reflect the transactions and dispositions of the assets of the company; (ii) provide reasonable assurance that transactions are recorded as necessary to permit preparation of financial statements in accordance with generally accepted accounting principles, and that receipts and expenditures of the company are being made only in accordance with authorizations of management and
F-2

Table of Contents
directors of the company; and (iii) provide reasonable assurance regarding prevention or timely detection of unauthorized acquisition, use, or disposition of the company’s assets that could have a material effect on the financial statements.
Because of its inherent limitations, internal control over financial reporting may not prevent or detect misstatements. Also, projections of any evaluation of effectiveness to future periods are subject to the risk that controls may become inadequate because of changes in conditions, or that the degree of compliance with the policies or procedures may deteriorate.
Critical Audit Matters
The critical audit matter communicated below is a matter arising from the current period audit of the consolidated financial statements that was communicated or required to be communicated to the audit committee and that (i) relates to accounts or disclosures that are material to the consolidated financial statements and (ii) involved our especially challenging, subjective, or complex judgments. The communication of critical audit matters does not alter in any way our opinion on the consolidated financial statements, taken as a whole, and we are not, by communicating the critical audit matter below, providing a separate opinion on the critical audit matter or on the accounts or disclosures to which it relates.
Valuation of share-based payments
As described in Notes 1(y) and 21 to the consolidated financial statements, the Company recognised share-based payment expenses of $9.2 million for the year ended June 30, 2026. The share-based payments are measured by management at fair value using valuation models that involved the use of significant assumptions including risk-free interest rate and share price volatility.
The principal considerations for our determination that performing procedures relating to the valuation of share-based payments is a critical audit matter are (i) the significant judgment by management, including the use of management’s specialist, in determining the fair value of the share-based payments; (ii) a high degree of auditor judgment, subjectivity and effort in performing procedures and evaluating audit evidence related to management’s (a) valuation models and (b) significant assumptions related to risk-free interest rate and share price volatility; and (iii) the audit effort involved the use of professionals with specialized skill and knowledge.
Addressing the matter involved performing procedures and evaluating audit evidence in connection with forming our overall opinion on the consolidated financial statements. These procedures included testing the effectiveness of controls relating to the valuation of share-based payments, including controls over the valuation models, significant assumptions, and underlying data. These procedures also included, among others (i) testing management’s process for determining the fair value of the share-based payments; (ii) testing the completeness and accuracy of the underlying data used in the estimate; (iii) evaluating the work of management’s specialist involved in the determination of significant judgments and assumptions; (iv) the involvement of professionals with specialized skill and knowledge to assist in evaluating the appropriateness of management’s valuation models and reasonableness of certain significant assumptions; and (v) evaluating the disclosures made regarding the share-based payment expenses recognized in the consolidated financial statements against the requirements of IFRS.

/s/ PricewaterhouseCoopers
Melbourne, Australia
September 29, 2026
We have served as the Company's auditor since 2021.
F-3

Table of Contents
IperionX Limited
CONSOLIDATED STATEMENT OF PROFIT OR LOSS AND OTHER COMPREHENSIVE INCOME
FOR THE YEAR ENDED JUNE 30,
Notes202620252024
US$ US$US$
Continuing operations
Research and development costs2(25,193,985)(12,748,973)(8,712,610)
Exploration and evaluation expenses(5,380,636)(2,894,369)(1,950,583)
Corporate and administrative expenses2(25,917,366)(10,686,376)(4,516,393)
Business development expenses(4,049,905)(3,373,992)(3,646,141)
Share-based payment expenses21(a)(9,166,334)(9,568,191)(3,791,541)
Finance income21,871,307 3,550,633 546,029 
Finance costs2(3,465,223)(306,250)(187,119)
Other income and expenses24,534,380 678,843 414,712 
Loss before income tax(66,767,762)(35,348,675)(21,843,646)
Income tax expense3- - - 
Loss for the year(66,767,762)(35,348,675)(21,843,646)
Loss attributable to shareholders of IperionX Limited(66,767,762)(35,348,675)(21,843,646)
Other comprehensive income
Items that may be reclassified subsequently to profit or loss:
Exchange differences arising on translation into presentation currency 17(f)3,709,446 (1,602,139)(170,014)
Other comprehensive income (loss) for the year, net of tax3,709,446 (1,602,139)(170,014)
Total comprehensive loss for the year(63,058,316)(36,950,814)(22,013,660)
Total comprehensive loss attributable to shareholders of IperionX Limited(63,058,316)(36,950,814)(22,013,660)
Basic loss per share (US$ per share)19(0.20)(0.12)(0.10)
Diluted loss per share (US$ per share)19(0.20)(0.12)(0.10)

The above Consolidated Statement of Profit or Loss and Other Comprehensive Income should be read in conjunction with the accompanying notes.
F-4

Table of Contents
IperionX Limited
CONSOLIDATED STATEMENT OF FINANCIAL POSITION
AS OF JUNE 30,
Notes20262025
US$US$
ASSETS
Current Assets
Cash and cash equivalents535,244,220 54,814,125 
Trade and other receivables63,282,481 823,268 
Prepayments71,533,721 3,238,894 
Inventories83,907,597 - 
Total Current Assets43,968,019 58,876,287 
Non-Current Assets
Property, plant and equipment941,185,930 25,197,638 
Intangible assets1012,268,824 13,550,993 
Exploration and evaluation assets117,768,418 6,512,326 
Prepayments7559,834 897,735 
Total Non-Current Assets61,783,006 46,158,692 
TOTAL ASSETS105,751,025 105,034,979 
LIABILITIES
Current Liabilities
Trade and other payables1210,449,787 7,489,397 
Deferred income131,771,531 - 
Loans and borrowings14628,933 472,018 
Provisions12738,039 467,001 
Total Current Liabilities13,588,290 8,428,416 
Non-Current Liabilities
Other long-term liabilities12333,000 700,000 
Loans and borrowings143,530,046 3,462,564 
Total Non-Current Liabilities3,863,046 4,162,564 
TOTAL LIABILITIES17,451,336 12,590,980 
NET ASSETS88,299,689 92,443,999 
EQUITY
Contributed equity16250,976,753 197,985,920 
Reserves1713,321,423 3,688,804 
Accumulated losses18(175,998,487)(109,230,725)
TOTAL EQUITY88,299,689 92,443,999 
The above Consolidated Statement of Financial Position should be read in conjunction with the accompanying notes.
F-5

Table of Contents
IperionX Limited
CONSOLIDATED STATEMENT OF CHANGES IN EQUITY
FOR THE YEAR ENDED June 30, 2026
Contributed
 Equity
Share-Based Payments ReserveForeign Currency Translation
Reserve
Accumulated LossesTotal
 Equity
US$US$US$US$US$
Balance at June 30, 2024112,959,638 13,440,265 (1,178,258)(73,882,050)51,339,595 
Net loss for the year - - - (35,348,675)(35,348,675)
Exchange differences arising on translation into presentation currency - - (1,602,139)- (1,602,139)
Total comprehensive loss for the year - - (1,602,139)(35,348,675)(36,950,814)
Issue of shares – share placement 70,919,564 - - - 70,919,564 
Issue of shares – exercise of options 205,525 - - - 205,525 
Issue of shares – conversion of RSUs2,094,041 (2,094,041)- - - 
Issue of shares – conversion of rights13,724,952 (13,724,952)- - - 
Issue of shares to consultants470,262 (470,262)- - - 
Issue of shares to director in lieu of bonus250,000 (250,000)- - - 
Share issue costs(2,638,062)- - - (2,638,062)
Share-based payment expense - 9,568,191 - - 9,568,191 
Balance at June 30, 2025197,985,920 6,469,201 (2,780,397)(109,230,725)92,443,999 
Net loss for the year- - - (66,767,762)(66,767,762)
Exchange differences arising on translation into presentation currency- - 3,709,446 - 3,709,446 
Total comprehensive loss for the year- - 3,709,446 (66,767,762)(63,058,316)
Issue of shares - share placement45,717,352 - - - 45,717,352 
Issue of shares - exercise of options971,471 (405,315)- - 566,156 
Issue of shares - conversion of RSUs2,234,348 (2,234,348)- - - 
Issue of shares - conversion of rights603,498 (603,498)- - - 
Issue of shares - payment of expenses5,230,000 - - - 5,230,000 
Share issue costs(1,765,836)- - - (1,765,836)
Share-based payment expense- 9,166,334 - - 9,166,334 
Balance at June 30, 2026250,976,753 12,392,374 929,049 (175,998,487)88,299,689 
The above Consolidated Statement of Changes in Equity should be read in conjunction with the accompanying notes.
F-6

Table of Contents
IperionX Limited
CONSOLIDATED STATEMENT OF CASH FLOWS
FOR THE YEAR ENDED JUNE 30,
Notes202620252024
 US$  US$US$
Operating activities
Payments to suppliers and employees(51,173,711)(24,336,800)(19,215,938)
Government reimbursements for Titan Project DFS4,623,906 96,151 - 
Receipts from third parties63,480 569,484 183,159 
Interest paid(327,019)(329,740)(120,313)
Interest received1,871,307 2,203,220 546,029 
Taxes paid(12,625)- - 
Net cash flows used in operating activities5(44,954,662)(21,797,685)(18,607,063)
Investing activities
Purchase of property, plant and equipment9(17,781,134)(16,963,016)(5,018,093)
Proceeds from sale of property, plant and equipment91,903,700 9,417 2,040,083 
Purchases of intangible assets10(1,353,836)(6,678,750)- 
Purchase of exploration and evaluation assets11(1,256,092)(644,661)(3,051,559)
Blacksand option prepayments 7- - (500,000)
Other investing(73,694)- - 
Net cash flows used in investing activities(18,561,056)(24,277,010)(6,529,569)
Financing activities
Proceeds from issue of shares46,283,506 71,125,089 48,331,724 
Share issue costs(1,787,964)(2,615,882)(1,315,725)
Repayment of borrowings(792,031)(5,826)(5,970)
Payment of principal portion of lease liabilities(521,942)(511,749)(417,866)
Net cash flows from financing activities43,181,569 67,991,632 46,592,163 
Net (decrease) increase in cash and cash equivalents(20,334,149)21,916,937 21,455,531 
Net foreign exchange differences764,244 (260,168)(236,116)
Cash and cash equivalents at beginning of the year54,814,125 33,157,356 11,937,941 
Cash and cash equivalents at the end of the year535,244,220 54,814,125 33,157,356 
Supplemental cash flow information:
Property, plant, equipment additions in accounts payable and other accrued liabilities4,568,067 2,508,971 734,708 
Intangible additions in accounts payable, other accrued liabilities and other long-term liabilities804,912 2,140,371 - 
The above Consolidated Statement of Cash Flows should be read in conjunction with the accompanying notes.
F-7

Table of Contents
IperionX Limited
NOTES TO THE CONSOLIDATED FINANCIAL STATEMENTS
FOR THE YEAR ENDED JUNE 30, 2026
1.    STATEMENT OF MATERIAL ACCOUNTING POLICIES
The material accounting policies adopted in preparing the consolidated financial statements of IperionX Limited (“IperionX” or “Company”) and its consolidated entities (“Consolidated Entity” or “Group”) for the years ended June 30, 2026, 2025 and 2024 are stated to assist in a general understanding of the consolidated financial statements.
IperionX is a for-profit company limited by shares, incorporated and domiciled in Australia. Our ordinary shares are listed on the Australian Securities Exchange, or ASX, under the symbol “IPX”, and our American Depositary Shares, or ADSs, each representing ten (10) of our ordinary shares, are listed on the Nasdaq Capital Market, or Nasdaq, under the symbol “IPX”.
The principal activities of the Group during the year consisted of the development of its titanium metal technologies and the exploration of its mineral properties in the U.S.
The Group is operating a U.S. based, integrated titanium business to support a range of advanced industries, including consumer electronics, aerospace, defense, medical, bicycles, additive manufacturing, and automotive. We expect to offer a range of titanium products and alloys for customers across these key industries.
Our portfolio of assets includes our operations at the Titanium Manufacturing Campus in Halifax County, Virginia; our Atlas-Titan platform in Tennessee, and Industrial Pilot Facility (IPF) in Salt Lake City, Utah, that together are re-shoring a sustainable titanium supply chain in the U.S.
IperionX owns patents to certain titanium and metal alloy production technologies and holds exclusive global licenses over the Technologies, including Hydrogen Assisted Metallothermic Reduction™, Granulation Sintering Deoxygenation™, low carbon titanium mineral enrichment, Hydrogen Sintering and Phase Transformation™, Alkaline Roasting and Hydrolysis™, and other titanium alloying technologies.
(a)    Basis of Preparation
The financial report is a general purpose financial report, which has been prepared in accordance with IFRS as issued by the IASB.
The consolidated financial report has also been prepared on a historical cost basis, except for other financial assets and inventory received through government program (See Note 1(h)), which have been measured at fair value. The consolidated financial statements are presented in U.S. dollars (US$ or $).
Certain prior year expense balances have been reclassified and presented on a more disaggregated basis to conform to the current year presentation. These reclassifications were immaterial and had no effect on previously reported net income, total assets, or stockholders’ equity.
Going Concern
The financial statements have been prepared on the going concern basis, which contemplates the continuity of normal business activity and the realization of assets and the settlement of liabilities in the normal course of business.
At June 30, 2026, the Group has cash and cash equivalents of $35.2 million (2025: $54.8 million) and net assets of $88.3 million (2025: $92.4 million). The Group had net outflows from operating and investing activities of $63.5 million for fiscal 2026 (2025: $46.1 million) (2024: $25.1 million). On July 7, 2026, the Company completed the placement of 2,275,000 new fully paid ADSs, each representing 10 ordinary shares, to raise gross proceeds of $50 million before costs.
IperionX's principal committed source of non-dilutive funding is the U.S. DoW industrial-base programs under which its Virginia titanium production facility is being built: the DPA Title III award ($12.7 million) and the IBAS award ($47.1 million) are fully obligated by the Government, $22.7 million had been reimbursed at June 30, 2026 and $37.1 million of
F-8

Table of Contents
obligated, reimbursable funding remained available to be drawn against qualifying expenditure over the expansion to approximately 1,400 tons per annum. In addition, IperionX holds a U.S. Army SBIR Phase III indefinite-delivery contract with a ceiling of $99.0 million, under which two firm-fixed-price task orders totaling approximately $19.8 million have been awarded (Task Order 2, awarded in August 2026, has a base value of $18.5 million of which $11.5 million was funded at award, with options to $25.4 million), plus other U.S. Government awards of up to $6.6 million. The U.S. Government has also transferred approximately 290 metric tons of titanium alloy scrap to IperionX at no cost, reducing feedstock purchases for approximately eighteen months of production at the current 200 tons per annum capacity.
Beyond these contracted sources, IperionX has a number of potential sources of liquidity: Customer receipts are expected to grow as the Virginia facility moves from prototype and qualification work into low-rate production; IperionX has purchase orders and supply arrangements with the U.S. Army (DEVCOM Ground Vehicle Systems Center), American Rheinmetall, Ford Motor Company and Carver Pump, among others. The remaining $79.2 million of ceiling under the SBIR Phase III task order awarded and other awards referred to above may be accessed through further task orders at the Government's discretion. IperionX has demonstrated continuing access to equity capital markets, having raised more than $250 million through the date of filing, from institutional and retail investors since listing, and its Nasdaq and ASX listings provide the ability to raise further capital. Finally, a substantial portion of IperionX’s forecast expenditure, including GenX™ development, Titan and Atlas development work and the pace of the 1,400 tons per annum expansion, is discretionary and can be deferred or reduced if necessary.
Further, the U.S. Government has materially expanded the capital available to domestic critical-minerals and metals producers, including through the DoW’s Office of Strategic Capital, which since July 2025 has committed loans of approximately $2.5 billion to domestic rare earth, magnet and scandium metal projects under loan authority of up to approximately $100 billion, and through two 2026 Defense Industrial Base Consortium solicitations for domestic critical-minerals processing capacity, the most recent of which specifically names titanium, including sponge and sponge substitutes, for which IperionX has submitted proposals.
Based on the assessment of the Company’s financial position, cash flows, and future projections, management has concluded that there are no conditions or events that raise substantial doubt about the Company’s ability to continue as a going concern for the foreseeable future, which is defined as at least twelve months from the date of issuance of the financial statements. No adjustments are required to the carrying amounts or classification of assets and liabilities in the financial statements.
(b)    New Standards, Interpretations and Amendments
In the current year, the Group has adopted all of the new and revised Accounting Standards and Interpretations effective from July 1, 2025 that are mandatory.
The adoption of the aforementioned standards has had no impact on the financial statements of the Company as at June 30, 2026. The Group has not early adopted any other standard, interpretation or amendment that has been issued but is not yet effective.
Issued standards and interpretations not early adopted
International Financial Reporting Standards and Interpretations that have recently been issued or amended but are not yet effective have not been adopted by the Group for the year ended June 30, 2026. Those which may be relevant to the Group are set out in the table below, but these are not expected to have any significant impact on the Group’s financial statements:
Standard/InterpretationApplication Date
 of Standard
Application Date
for the Group
IFRS 18 Presentation and Disclosure in Financial StatementsJanuary 1, 2027July 1, 2027
IFRS 19 Subsidiaries without Public AccountabilityJanuary 1, 2027July 1, 2027
IFRS 20 Regulatory Assets and Regulatory LiabilitiesJanuary 1, 2029July 1, 2029
A discussion on the impact of the adoption of IFRS 18 - Presentation and Disclosure in Financial Statements is included below. The adoption of the other aforementioned standards is not expected to have any significant impact on the Group’s financial statements.
F-9

Table of Contents
IFRS 18 - Presentation and Disclosure in Financial Statements
IFRS 18 - Presentation and Disclosure in Financial Statements replaces IAS 1 - Presentation of Financial Statements and introduces new requirements for the presentation of financial statements. IFRS 18 will not change the recognition and measurement of items in the financial statements but will affect presentation and disclosure in the financial statements, including introducing new categories and subtotals in the statement of profit or loss and other comprehensive income, requiring the disclosure of management defined performance measures, and changing the grouping of information in the financial statements.
(c)    Principles of Consolidation
The consolidated financial statements incorporate the assets and liabilities of all subsidiaries of the Company.
Control is achieved when the Company has power over the investee, is exposed, or has rights, to variable returns from its involvement with the investee and has the ability to use its power to affect its returns. The Company reassesses whether or not it controls an investee if facts and circumstances indicate that there are changes to one or more of the three elements of control listed above. When the Company has less than a majority of the voting rights of an investee, it has power over the investee when the voting rights are sufficient to give it the practical ability to direct the relevant activities of the investee unilaterally. The Company considers all relevant facts and circumstances in assessing whether or not the Company’s voting rights in an investee are sufficient to give it power.
Subsidiaries are all those entities (including special purpose entities) over which the Company has the power to govern the financial and operating policies, so as to obtain benefits from its activities, generally accompanying a shareholding of more than one-half of the voting rights. The existence and effect of potential voting rights that are currently exercisable or convertible are considered when assessing whether the Company controls another entity.
The financial statements of the subsidiaries are prepared for the same reporting period as the Company, using consistent accounting policies. Accounting policies of subsidiaries have been changed where necessary to ensure consistency with the policies adopted by the Company.
Subsidiaries are fully consolidated from the date on which control is transferred to the Company. They are de-consolidated from the date that control ceases.
Intercompany transactions and balances, income and expenses and profits and losses between Group companies, are eliminated.
(d)    Foreign Currencies
(i)Functional and Presentation Currency
The functional currency of each of the Group’s entities is measured using the currency of the primary economic environment in which that entity operates. The parent Company’s functional currency is Australian dollars.
The Group’s financial statements are presented in U.S. dollars which is the Group’s presentation currency. U.S. dollars have been chosen as the Group’s presentation currency to better reflect the Groupʼs business activities in the U.S. and to enhance comparability with its industry peer group, the majority of which report in U.S. dollars.
(ii)Transactions and Balances
Foreign currency transactions are translated into functional currency using the exchange rates prevailing at the date of the transaction. Foreign currency monetary items are translated at the year-end exchange rate. Non-monetary items measured at historical cost continue to be carried at the exchange rate at the date of the transaction. Non-monetary items measured at fair value are reported at the exchange rate at the date when fair values were determined.
Exchange differences arising on the translation of monetary items are recognized in the income statement, except where deferred in equity as a qualifying cash flow or net investment hedge.
F-10

Table of Contents
Exchange differences arising on the translation of non-monetary items are recognized directly in equity to the extent that the gain or loss is directly recognized in equity, otherwise the exchange difference is recognized in the income statement.
(iii)Group Companies
The financial results and position of operations whose functional currency is different from the Group’s presentation currency are translated as follows:
•assets and liabilities are translated at year-end exchange rates prevailing at that reporting date;
•income and expenses are translated at average exchange rates for the year; and
•retained earnings are translated at the exchange rates prevailing at the date of the transaction.
Exchange differences arising on translation into the presentation currency are transferred directly to the Group’s foreign currency translation reserve in equity. These differences are recognized in profit or loss in the year in which the operation is disposed.
(e)    Cash and Cash Equivalents
Cash and cash equivalents include cash on hand, deposits held at call with banks and other short-term highly liquid investments with original maturities of three months or less.
(f)    Trade and Other Receivables
Trade receivables are recognized initially at fair value and subsequently measured at amortized cost using the effective interest method, less allowance for any expected credit loss applying the simplified approach. If collection of the amounts is expected in one year or less, they are classified as current assets. If not, they are presented as non-current assets. Trade receivables are generally due for settlement within 30 days and therefore are all classified as current.
As the majority of receivables are short term in nature, their carrying amount is assumed to be the same as their fair value.
An estimate for the expected credit loss is made based on the historical risk of default and expected loss rates at the inception of the transaction. Inputs are selected for the expected credit loss impairment calculation based on the Group’s past history, existing market conditions as well as forward looking estimates.
(g)    Prepayments
Prepayments represent payments in advance of receipt of goods or services. The Group recognizes a prepayment as an asset within other current and non-current assets when payment for goods or services has been made in advance of the Group obtaining a right to access those goods or services. These prepayments are assessed for indicators of impairment each year. If future economic benefits are no longer expected to occur, and economic benefits cannot be derived from the prepayment in any other way, the prepayment will be derecognized.
(h)    Inventory
Inventories are stated at the lower of cost and net realizable value. Cost is determined on a first-in, first-out basis.
Raw materials are valued at cost of purchase. For work-in-process and finished goods, cost includes the cost of purchase and costs of conversion, with labor and manufacturing overhead applied using standard costing techniques that approximate actual cost. Unallocated overhead associated with abnormally low production levels, including costs incurred during the commissioning and ramp-up of manufacturing operations, is expensed as incurred and excluded from the cost of inventory.
Costs incurred with respect to raw materials, work-in-process, and finished goods are expensed as research and development expense as incurred when such materials or products are used in research and development activities. Costs are capitalized as inventory when they are incurred in bringing inventories to their present location and condition and are expected to be recovered through sale.
F-11

Table of Contents
Titanium powder held for consumption in the production of engineered products is classified as raw materials.
The Company reviews inventory each reporting period and writes down excess, slow-moving, or obsolete items to net realizable value where required, with such write-downs recognized in operating expenses. Net realizable value is the estimated selling price in the ordinary course of business, less estimated costs of completion and costs necessary to make the sale.
Titanium scrap and feedstock received from U.S. Government programs at no cost, and without the transfer of a distinct good or service to the Government, are accounted for as non-monetary government grants. Such grants are recognized at fair value upon receipt and presented as deferred income in the statement of financial position. Refer to Note 1(n).
(i)    Property, Plant and Equipment
Property, plant and equipment are stated at cost less accumulated depreciation and impairment charges. Depreciation is provided on a straight-line basis over the estimated useful lives of the assets, except for land which is not depreciated. Depreciation commences when an asset is available for use. Where assets are under construction or yet to be commissioned, judgment is applied in determining the point at which the asset is in the location and condition necessary for it to be capable of operating in the manner intended by management. Currently the Group only has plant and equipment, buildings and leasehold improvements. Plant and equipment is depreciated over a period between 2 and 20 years. Buildings and leasehold improvements are depreciated over a period between 8 and 10 years.
The carrying amounts of property, plant and equipment are reviewed for impairment in accordance with the policy described in Note 1(u).
(j)    Intangible Assets
Intangible assets are stated at cost, net of accumulated amortization and accumulated impairment losses, if any. Cost in relation to patents includes registration, documentation and other legal fees associated with obtaining the patent. The costs of internally generated intangible assets are not capitalized and the expense is reflected as research and development costs in the statement of profit or loss as it is incurred.
The cost of intangible assets is amortized on a straight-line basis over their estimated useful lives, which are reviewed at least annually. The expected changes in the useful life or in the pattern of consumption of the future economic benefits of the asset are accounted for when changing the period or amortization method, as appropriate, and they are treated as changes in the accounting estimates. Amortization expense is recognized in the statement of profit or loss as research and development costs.
The Group’s primary patents each have a useful life between 8 and 20 years, with a remaining weighted-average useful life of 10.7 years. Additional patents granted in various jurisdictions will be used to extend the territorial coverage of the primary patent. Intangible assets are tested for impairment when there is an indicator of impairment, as well as possible reversal of previous impairment losses.
(k)    Exploration and Evaluation Expenditures
Exploration and evaluation expenditures are accounted for in accordance with the ‘area of interest’ method and with IFRS 6 - Exploration for and Evaluation of Mineral Resources.
Exploration and evaluation expenditures comprise costs incurred in connection with the exploration for and evaluation of mineral resources before the technical feasibility and commercial viability of extracting a mineral resource have been demonstrated.
For each area of interest, costs incurred to acquire rights to explore are capitalized and recognized as exploration and evaluation assets. Such costs include option payments made to landowners under the Group's option agreements, to the extent they are directly attributable to the acquisition of exploration rights.
F-12

Table of Contents
Exploration and evaluation assets are initially measured at cost and are carried forward where the Group's rights of tenure are current and one of the following conditions is met:
•the expenditures are expected to be recovered through the successful development and commercial exploitation of the area of interest, or alternatively through its sale; or
•exploration and evaluation activities in the area of interest have not yet reached a stage that permits technical feasibility and commercial viability to be demonstrated, and active and significant operations are continuing.
The Group has identified proven and probable reserves within certain areas of interest and has completed a DFS for these properties. However, as of the reporting date, management has not yet committed to proceed with development. Advancement of these projects remains dependent upon securing adequate financing and/or a strategic development partner, as well as management's final approval to proceed. Accordingly, the related expenditures continue to be classified as exploration and evaluation.
Once management has committed to proceed with development, the related exploration and evaluation assets are assessed for impairment and reclassified to mine development properties.
Following commencement of commercial production, mine development properties are amortized over the expected life of the economically recoverable reserves associated with the relevant area of interest.
The recoverability of exploration and evaluation assets is dependent upon the successful development and commercial exploitation of the relevant properties, or alternatively their sale.
Impairment
Capitalized exploration costs are reviewed each reporting date to establish whether an indication of impairment exists. If any such indication exists, the recoverable amount of the capitalized exploration costs is estimated to determine the extent of the impairment loss (if any). Where an impairment loss subsequently reverses, the carrying amount of the asset is increased to the revised estimate of its recoverable amount, but only to the extent that the increased carrying amount does not exceed the carrying amount that would have been determined had no impairment loss been recognized for the asset.
(l)    Research and Development Expenditure
All costs associated with research and development are expensed as incurred. Research and development activities are directed toward the development of new products as well as improvements in existing titanium processing technologies. These costs primarily include salaries and related personnel expenses, subcontractor expenses, patent registration expenses, materials, depreciation and amortization, allocated overhead, and other development expenses associated with processing operations at our IPF in Utah and TPF in Virginia.
(m)    Trade and Other Payables
These amounts represent liabilities for goods and services provided to the Group prior to the end of the financial year which are unpaid. The amounts are unsecured and are usually paid within 60 days of recognition. Trade and other payables are presented as current liabilities unless payment is not due within 12 months from the reporting date.
They are recognized initially at their fair value and subsequently measured at amortized cost using the effective interest method. The carrying amounts of trade and other payables are considered to be the same as their fair values, due to their short-term nature.
(n)    Deferred Income
Deferred income represents amounts received or receivable from customers for which the related performance obligations have not yet been satisfied, or where the conditions for revenue recognition have not been met as of the reporting date. These amounts are recognized as contract liabilities in the statement of financial position.
Deferred income arising from contracts with customers is recognized as revenue when, or as, the related performance obligations are satisfied. Revenue is recognized either at a point in time or over time, depending on the nature of the
F-13

Table of Contents
underlying performance obligation. The amount recognized reflects the consideration to which the Company expects to be entitled in exchange for transferring the promised goods or services to the customer.
Deferred income may also arise from government grants, including grants received in the form of non-monetary assets such as inventory. In accordance with IAS 20 - Accounting for Government Grants and Disclosure of Government Assistance, non-monetary government grants are measured at fair value on initial recognition, with the corresponding grant recognized as deferred income in the statement of financial position. Deferred income is subsequently recognized in profit or loss on a systematic basis over the periods in which the related costs are incurred or the applicable grant conditions are satisfied. Refer to Note 1(aa) for further discussion.
(o)    Provisions
Provisions are recognized when the Group has a legal or constructive obligation, as a result of past events, for which it is probable that an outflow of economic benefits will result and that outflow can be reliably measured. Provisions include the Group’s liability for employee benefits arising from services rendered by employees to balance date. Employee benefits that are expected to be settled wholly within 12 months have been measured at the amounts expected to be paid when the liability is settled, plus related on-costs.
(p)    Interest Income
Interest income is recognized on a time proportionate basis that takes into account the effective yield on the financial asset.
(q)    Income Tax
The income tax expense for the year is the tax payable on the current year’s taxable income based on the national income tax rate for each jurisdiction adjusted by changes in deferred tax assets and liabilities attributable to temporary differences between the tax bases of assets and liabilities and their carrying amounts in the financial statements, and to unused tax losses.
Deferred tax assets and liabilities are recognized for temporary differences at the tax rates expected to apply when the assets are recovered or liabilities are settled, based on those tax rates which are enacted or substantively enacted for each jurisdiction. The relevant tax rates are applied to the cumulative amounts of deductible and taxable temporary differences to measure the deferred tax asset or liability. An exception is made for certain temporary differences arising from the initial recognition of an asset or a liability. No deferred tax asset or liability is recognized in relation to these temporary differences if they arose on goodwill or in a transaction, other than a business combination, that at the time of the transaction did not affect either accounting profit or taxable profit or loss.
Deferred tax liabilities and assets are not recognized for temporary differences between the carrying amount and tax bases of investments in controlled entities where the Company is able to control the timing of the reversal of the temporary differences and it is probable that the differences will not reverse in the foreseeable future.
Deferred tax assets are recognized for deductible temporary differences and unused tax losses only if it is probable that future taxable amounts will be available to utilize those temporary differences and losses.
The carrying amount of deferred income tax assets is reviewed at each reporting date and reduced to the extent that it is no longer probable that sufficient taxable profit will be available to allow all or part of the deferred income tax asset to be utilized.
Unrecognized deferred income tax assets are reassessed at each balance date and are recognized to the extent that it has become probable that future taxable profit will allow the deferred tax asset to be recovered.
Current and deferred tax balances attributable to amounts recognized directly in equity are also recognized directly in equity.
Deferred tax assets and deferred tax liabilities are offset only if a legally enforceable right exists to set off current tax assets against tax liabilities and the deferred tax liabilities relate to the same taxable entity and the same taxation authority.
F-14

Table of Contents
(r)    Earnings per Share
Basic EPS is calculated by dividing the net profit attributable to members of the Company for the reporting period, after excluding any costs of servicing equity, by the weighted average number of ordinary shares of the Company, adjusted for any bonus issue.
Diluted EPS is calculated by dividing the basic EPS earnings, adjusted by the after tax effect of financing costs associated with dilutive potential Ordinary Shares and the effect on revenues and expenses of conversion to Ordinary Shares associated with dilutive potential Ordinary Shares, by the weighted average number of Ordinary Shares and dilutive Ordinary Shares adjusted for any bonus issue. Diluted earnings per share excludes all dilutive potential shares if their effect is anti-dilutive.
(s)    Use and Revision of Accounting Estimates, Judgments and Assumptions
The preparation of the financial report requires management to make judgements, estimates and assumptions that affect the application of accounting policies and the reported amounts of assets, liabilities, income and expenses. Actual results may differ from these estimates. The estimates and underlying assumptions are reviewed on an ongoing basis. Revisions to accounting estimates are recognized in the year in which the estimate is revised if the revision affects only that year, or in the year of the revision and future years if the revision affects both current and future years.
In particular, information about significant areas of estimation uncertainty and critical judgments in applying accounting policies that have the most significant effect on the amount recognized in the financial statements are described in Note 21: Share-Based Payments.
(t)    Operating Segments
An operating segment is a component of an entity that engages in business activities from which it may earn revenues and incur expenses (including revenues and expenses relating to transactions with other components of the same entity), whose operating results are regularly reviewed by the entity’s chief operating decision maker to make decisions about resources to be allocated to the segment and assess its performance and for which discrete financial information is available. This includes start up operations which are yet to earn revenues. Management will also consider other factors in determining operating segments such as the existence of a line manager and the level of segment information presented to and reviewed by the chief operating decision maker.
Operating segments have been identified based on the information provided to the chief operating decision makers.
The Group aggregates two or more operating segments when they have similar economic characteristics, and the segments are similar in each of the following respects:
•Nature of the products and services;
•Nature of the production processes;
•Type or class of customer for the products and services;
•Methods used to distribute the products or provide the services; and if applicable
•Nature of the regulatory environment.
Operating segments that meet the quantitative criteria as prescribed by IFRS 8 - Operating Segments are reported separately. However, an operating segment that does not meet the quantitative criteria is still reported separately where information about the segment would be useful to users of the financial statements.
Information about other business activities and operating segments that are below the quantitative criteria are combined and disclosed in a separate category for “all other segments”.
Currently, the Group has only one operating segment, being exploration and development of minerals and metals in the U.S.
F-15

Table of Contents
(u)    Impairment of Non-Financial Assets
The Group assesses at each reporting date whether there is an indication that an asset may be impaired. If any such indication exists, or when annual impairment testing for an asset is required, the Group makes an estimate of the asset’s recoverable amount. An asset’s recoverable amount is the higher of its fair value less costs of disposal and its value in use and is determined for an individual asset, unless the asset does not generate cash inflows that are largely independent of those from other assets or groups of assets and the asset’s value in use cannot be estimated to be close to its fair value. In such cases the asset is tested for impairment as part of the cash-generating unit to which it belongs. When the carrying amount of an asset or cash-generating unit exceeds its recoverable amount, the asset or cash-generating unit is considered impaired and is written down to its recoverable amount.
In assessing the value in use, the estimated future cash flows are discounted to their present value using a pre-tax discount rate that reflects current market assessments of the time value of money and the risks specific to the asset.
An assessment is also made at each reporting date as to whether there is any indication that previously recognized impairment losses may no longer exist or may have decreased. If such indication exists, the recoverable amount is estimated. A previously recognized impairment loss is reversed only if there has been a change in the estimates used to determine the asset’s recoverable amount since the last impairment loss was recognized. If that is the case the carrying amount of the asset is increased to its recoverable amount. That increased amount cannot exceed the carrying amount that would have been determined, net of depreciation, had no impairment loss been recognized for the asset in prior years. After such a reversal the depreciation charge is adjusted in future years to allocate the asset’s revised carrying amount, less any residual value, on a systematic basis over its remaining useful life.
(v)    Fair Value Estimation
The fair value of financial assets and financial liabilities must be estimated for recognition and measurement or for disclosure purposes.
The fair value of financial instruments traded in active markets (such as publicly traded derivatives, and equity securities classified as fair value through other comprehensive income) is based on quoted market prices at the reporting date. The quoted market price used for financial assets held by the Group is the current bid price; the appropriate quoted market price for financial liabilities is the current ask price.
The nominal value less estimated credit adjustments of trade receivables and payables are assumed to approximate their fair values. The fair value of financial liabilities for disclosure purposes is estimated by discounting the future contractual cash flows at the current market interest rate that is available to the Group for similar financial instruments.
(w)    Issued and Unissued Capital
Ordinary Shares and Performance Shares are classified as equity. Issued and paid up capital is recognized at the fair value of the consideration received by the Company. Incremental costs directly attributable to the issue of new shares or options are shown in equity as a deduction, net of tax, from the proceeds.
(x)    Dividends
Provision is made for the amount of any dividend declared on or before the end of the year but not distributed at balance date.
(y)    Share-Based Payments
Equity-settled share-based payments are provided to officers, employees, consultants and other advisors. These share-based payments are measured at the fair value of the equity instrument at the grant date. The fair value of options is estimated using the Black Scholes option valuation model. The fair value of performance rights that have market-based vesting conditions is estimated using a trinomial valuation model. The fair value of restricted stock units and performance rights that do not have market-based vesting conditions is estimated based on the underlying share price. The fair value determined at the grant date is expensed on a straight-line basis over the vesting period, based on the Company’s estimate of equity instruments that will eventually vest. At each reporting date, the Company revises its estimate of the number of
F-16

Table of Contents
equity instruments expected to vest. The impact of the revision of the original estimates, if any, is recognized in profit or loss over the remaining vesting period, with a corresponding adjustment to the share-based payments reserve.
Equity-settled share-based payments may also be provided as consideration for the acquisition of assets. Where ordinary shares are issued, the transaction is recorded at fair value based on the quoted price of the ordinary shares at the date of issue. The acquisition is then recorded as an asset or expensed in accordance with accounting standards.
(z)    Leases
The Group assesses at contract inception whether a contract is, or contains, a lease. That is, if the contract conveys the right to control the use of an identified asset for a period of time in exchange for consideration.
The Group applies a single recognition and measurement approach for all leases, except for short-term leases and leases of low-value assets. The Group recognizes lease liabilities to make lease payments and right-of-use assets representing the right to use the underlying assets.
Right-of-use assets
The Group recognizes right-of-use assets at the commencement date of the lease (i.e. the date the underlying asset is available for use). Right-of-use assets are measured at cost, less any accumulated depreciation and impairment losses, and adjusted for any remeasurement of lease liabilities. The cost of right-of-use assets includes the amount of lease liabilities recognized, initial direct costs incurred, and lease payments made at or before the commencement date less any lease incentives received. Right-of-use assets are depreciated on a straight-line basis over the shorter of the lease term and the estimated useful lives of the assets. If ownership of the leased asset transfers to the Group at the end of the lease term or the cost reflects the exercise of a purchase option, depreciation is calculated using the estimated useful life of the asset. The right-of-use assets are also subject to impairment.
Lease liabilities
At the commencement date of the lease, the Group recognizes lease liabilities measured at the present value of lease payments to be made over the lease term. The lease payments include fixed payments (including in-substance fixed payments) less any lease incentives receivable, variable lease payments that depend on an index or a rate, and amounts expected to be paid under residual value guarantees. The lease payments also include the exercise price of a purchase option reasonably certain to be exercised by the Group and payments of penalties for terminating the lease, if the lease term reflects the Group exercising the option to terminate.
In calculating the present value of lease payments, the Group uses its incremental borrowing rate at the lease commencement date because the interest rate implicit in the lease is not readily determinable. After the commencement date, the amount of lease liabilities is increased to reflect the accretion of interest and reduced for the lease payments made. In addition, the carrying amount of lease liabilities is remeasured if there is a modification, a change in the lease term, a change in the lease payments (e.g. changes to future payments resulting from a change in an index or rate used to determine such lease payments) or a change in the assessment of an option to purchase the underlying asset.
Short-term leases and leases of low-value assets
The Group applies the short-term lease recognition exemption to its short-term leases of machinery and equipment (i.e. those leases that have a lease term of 12 months or less from the commencement date and do not contain a purchase option). It also applies the lease of low-value assets recognition exemption to leases of office equipment that are considered to be low value. Lease payments on short-term leases and leases of low-value assets are recognized as expense on a straight-line basis over the lease term.
(aa) Accounting for Government Funding Arrangements
The U.S. government has invested significant resources to re-shore to the U.S. a secure domestic titanium supply chain. As of June 30, 2026, IperionX’s U.S. Government support includes the $12.7 million DPA Title III award, the fully obligated $47.1 million IBAS award, and the SBIR Phase III contracting pathway of up to $99 million.
F-17

Table of Contents
Depending on the substance of contractual terms, some of these arrangements are accounted for under IAS 20 - Accounting for Government Grants and Disclosure of Government Assistance, while others may be accounted for under IFRS 15 - Revenue from Contracts with Customers. For other arrangements, the Company may act as an agent in procuring equipment on behalf of the government. As the Company does not obtain control of the equipment, a receivable is recognized for the reimbursement due from the government, and no corresponding asset, expense, or grant income is recognized.
Title to all assets purchased by the Group with funds from the U.S. government vests with the U.S. government during the term of the technology investment agreement. The U.S. government can elect to, but is not obliged to, transfer such title to all (or some) of the assets to the Company at the end of the agreement, which is scheduled to terminate on January 30, 2027, if the Group's performance is satisfactory. Accordingly, the Company does not have an enforceable right to the assets acquired with federal funds, even where the conditions of the agreement are complied with, and so there is no current grant to be recognized. Instead, for accounting purposes, the Company’s role with respect to the equipment is to acquire it on behalf of the U.S. government in an agency capacity. Upon procurement of the asset for the U.S. government, only a receivable is recognized reflecting the reimbursement due from the U.S. government. If, per the agreement, the government subsequently decides to transfer title of the assets to the Company at the end of the program, this is the point at which a grant would crystallize and the Company would record a non-monetary government grant.
Funding under DPA $12.7 million
In October 2023, IperionX executed a $12.7 million contract in funding under the U.S. DoW DPA Title III authorities to address the U.S. titanium supply chain vulnerabilities. The government share will be matched with $13.4 million in funding from IperionX, for a total funding amount of $26.1 million. This funding is being applied towards the Group’s TPF in Virginia. The agreement has an initial term of 39 months, scheduled to terminate on January 30, 2027, and provides that it may be extended by mutual agreement. Under the agreement, the Company and the U.S. government have agreed to use best efforts to achieve the goals of the agreement, which include the Company conducting a research and development program with respect to titanium technology.
As of June 30, 2026, the Company procured assets on behalf of the government that cost approximately $12.7 million, of which $2.4 million was invoiced in 2026 (2025: $4.0 million), (2024: $6.3 million). We received cash reimbursements for the reimbursement of equipment from the U.S. DoW of nil during the twelve months ended June 30, 2026 (2025: $5.6 million) (2024: $4.7 million). The remaining $2.4 million receivable was reimbursed subsequent to year end.
Funding under IBAS $47.1 million
In February 2025, the Company was awarded up to $47.1 million by the U.S. DoW to strengthen the U.S. Defense Industrial Base by accelerating the scale-up of a resilient, low-cost, and fully-integrated U.S. mineral-to-metal titanium supply chain. The program will be matched with $49.2 million in funding by IperionX, for a total funding amount of $96.3 million. This funding aims to bolster the U.S. defense industrial base by developing a fully integrated, low-cost titanium supply chain sourced domestically. The project scope under the IBAS program had been revised to prioritize accelerated expansion of IperionX’s titanium metal and manufacturing production capacity at IperionX’s Virginia Titanium Manufacturing Campus.
As part of the initial phase, the DoW obligated $5.0 million, and IperionX contributed $1.0 million, to expedite the Titan Project in Tennessee to ‘shovel-ready’ status, an important milestone in securing a new domestic source of titanium, rare earths and zircon critical minerals. Government reimbursements provided as grants are subject to conditional funding provisions. Grants for the initial phase are recognized as “Other income and expenses” in the consolidated statements of profit or loss and other comprehensive income, once all conditions for reimbursement are met.
The DoW obligated an additional $12.5 million in August of 2025, $25.0 million in September of 2025 and $4.6 million in January of 2026, through the IBAS program to purchase orders for long-lead, major capital equipment required for the next stage of capacity scale-up to approximately 1,400 metric tons per year at the Virginia Titanium Manufacturing Campus.
As of June 30, 2026, the entire $47.1 million has been obligated by the DoW. Of that, the Company has incurred costs of $5.0 million toward the Titan Project DFS and has requested reimbursements from U.S. DoW in the amount of $4.1 million (2025: $0.9 million) which is recognized as “Other income and expenses” in the consolidated statements of profit or loss and other comprehensive income. We have received cash reimbursements from the U.S. DoW of $4.6 million during the
F-18

Table of Contents
twelve months ended June 30, 2026. (2025: $0.1 million). Cash receipts from government reimbursements for the Titan Project DFS and the related qualifying expenditures are presented on a gross basis in the consolidated statements of cash flows, with government reimbursements reflected as operating cash inflows and the associated expenditures reflected within operating cash outflows.
Funding under SBIR Phase III $99.0 million
In June 2025, IperionX received the first task order for $1.3 million, from the U.S. Army under a SBIR Phase III Indefinite Delivery Indefinite Quantity contract with the U.S. DoW. The task order facilitates the purchase of equipment to aid in the production and delivery of titanium parts for U.S. Army ground programs.
As of June 30, 2026, the Company has procured assets on behalf of the government that cost approximately $0.3 million (2025: nil). We expect to utilize the remaining $1.0 million of available funding by the end of fiscal year 2027.

F-19

Table of Contents
2.    INCOME AND EXPENSES
Notes202620252024
US$US$US$
Research & development costs
Wages and benefits(9,235,933)(5,519,763)(3,232,758)
Payroll taxes on stock compensation benefits- (183,373)(49,118)
Depreciation of property, plant and equipment9(1,764,132)(683,678)(113,224)
Amortization of patents10(1,300,546)(768,128)- 
Amortization of right-of-use assets9(621,874)(710,678)(427,666)
Other operating expenses(1)
(12,271,500)(4,883,353)(4,889,844)
(25,193,985)(12,748,973)(8,712,610)
Corporate and administrative expenses
Wages and benefits(8,874,230)(4,956,272)(2,047,386)
Non-cash expenses settled with share issuance(5,230,000)- - 
Professional fees and system implementation costs(5,115,183)(2,456,898)(1,044,377)
Legal expenses(1,432,661)(246,546)(237,891)
Payroll taxes on stock compensation benefits(218,105)(994,640)(160,058)
Other operating expenses(2)
(5,047,187)(2,032,020)(1,026,681)
(25,917,366)(10,686,376)(4,516,393)
Employee benefits expense
Salaries, wages and benefits(21,501,910)(14,578,178)(8,650,534)
Post-employment benefits(411,210)(252,005)(180,661)
Share-based payment expenses21(9,166,334)(9,568,191)(3,791,541)
(31,079,454)(24,398,374)(12,622,736)
Finance income
Interest income1,871,307 2,203,220 546,029 
Net foreign exchange gain- 1,347,413 - 
1,871,307 3,550,633 546,029 
Finance costs
Interest expense(311,744)(279,541)(122,736)
Net foreign exchange loss(3,153,479)- (48,588)
Other finance costs- (26,709)(15,795)
(3,465,223)(306,250)(187,119)
Other income and expenses
Other income(3)
4,584,952 939,412 629,815 
Impairment of property, plant and equipment- - (198,750)
Loss on disposal of property, plant and equipment(50,572)(260,569)(16,353)
4,534,380 678,843 414,712 
Notes:
(1) R&D other operating expenses primarily includes expenses for R&D facilities, materials, consumables, and consulting fees for continuous technology research, including commercialization and scale-up activities, materials, development of the GenX™ next-generation continuous HAMR™ platform, expansion of manufacturing capabilities and advancement of customer qualification programs.
(2) Corporate and administrative other operating expenses primarily includes insurance, software licenses, rents and other corporate fees related to operating a public company.
(3) Other income includes $4,130,072 (2025: $869,928) for government grant income billed to the U.S. DoW under the IBAS program. See Note 1(aa) for additional details.
F-20

Table of Contents
3.    INCOME TAX
202620252024
 US$US$US$
Recognized in profit or loss
Current income tax:
Current income tax benefit in respect of the current year- - - 
Deferred income tax:
Origination and reversal of temporary differences- - - 
Income tax expense reported in profit or loss- - - 
Reconciliation between tax expense and accounting loss before income tax
Accounting loss before income tax(66,767,762)(35,348,675)(21,843,646)
Tax benefit at the Australian income tax rate of 30%(20,030,329)(10,604,603)(6,553,094)
Effect of lower income tax rate in the United States177,763 1,032,615 631,007 
Expenditure not allowable for income tax purposes5,387,521 2,885,033 1,427,582 
Income not assessable for income tax purposes- (404,224)- 
Exchange differences- (639)(2,369)
Adjustments in respect of deferred tax of previous years(1,335,225)(738,316)583,422 
Effect of deferred tax assets not brought to account15,800,270 7,830,134 3,913,452 
Income tax expense reported in profit or loss- - - 
Deferred tax assets and liabilities
Deferred tax liabilities:
Right-of-use assets1,297,345 980,747 414,270 
Deferred tax assets used to offset deferred tax liabilities(1,297,345)(980,747)(414,270)
Net deferred tax liabilities- - - 
Deferred tax assets:
Accrued expenditures51,793 117,578 70,662 
Provisions192,887 122,051 75,215 
Lease liabilities1,036,572 1,023,320 383,082 
Capital allowances31,742,587 10,394,779 10,896,126 
Tax losses available to offset against future taxable income5,486,228 9,668,204 1,556,178 
Deferred tax assets used to offset deferred tax liabilities(1,297,345)(980,747)(414,270)
Other deferred tax assets not brought to account(1)
(37,212,722)(20,345,185)(12,566,993)
Net deferred tax assets- - - 
Note:
(1)The benefit of deferred tax assets not brought to account will only be subsequently recognized if: (a) future assessable income is derived of a nature and of an amount sufficient to enable the benefit to be realized; (b) the conditions for deductibility imposed by tax legislation continue to be complied with; and (c) no changes in tax legislation adversely affect the Group in realizing the benefit.
4.    DIVIDENDS PAID OR PROVIDED FOR ON ORDINARY SHARES
No dividends have been paid or proposed for the year ended June 30, 2026 (2025: nil) (2024: nil).
F-21

Table of Contents
5.    CASH AND CASH EQUIVALENTS
202620252024
US$US$US$
Cash at bank and on hand35,244,220 54,814,125 33,157,356 
Reconciliation of loss before income tax to net cash flows from operations
Loss for the year(66,767,762)(35,348,675)(21,843,646)
Adjustment for non-cash income and expense items
Share-based payments expense9,166,334 9,568,191 3,791,541 
Non-cash expenses settled with share issuance5,230,000 - - 
Amortization of right-of-use assets771,147 793,981 521,099 
Amortization of intangibles1,300,546 768,128 - 
Depreciation of property, plant and equipment2,278,003 716,147 124,752 
Net foreign exchange (gain)/loss3,153,479 (1,347,413)48,588 
Loss on disposal of property, plant and equipment50,572 260,569 16,353 
Impairment loss- - 198,750 
Changes in assets and liabilities
Inventory(1,149,702)- - 
Receivables and prepayments(282,576)1,121,984 (2,073,615)
Payables and provisions1,295,297 1,669,403 609,115 
Net cash outflow from operating activities(44,954,662)(21,797,685)(18,607,063)
6.    TRADE AND OTHER RECEIVABLES
20262025
US$US$
Current
Receivables from U.S. Government(1)
3,175,925 774,248 
Receivables from other third-parties 106,556 49,020 
Total trade and other receivables3,282,481 823,268 
Note:
(1)As disclosed in Note 1(aa), receivables from the U.S. Government comprise amounts due for reimbursement of equipment purchases made under government programs, and qualifying expenditures incurred in connection with the Titan DFS.
F-22

Table of Contents
7.    PREPAYMENTS
20262025
US$US$
Current
Construction prepayments731,202 2,741,220 
Other prepayments802,519 497,674 
Total current prepayments1,533,721 3,238,894 
Non-current
Security deposits559,834 438,704 
Other non-current prepayments- 459,031 
Total non-current prepayments559,834 897,735 

8.    INVENTORY
Inventories are stated at the lower of cost and net realizable value as described in Note 1(h). During the half year ended December 31, 2025, the Company began capitalizing raw material costs as inventory following commercial milestones achieved during the period. Prior to that point, all such costs were expensed as research and development expense.

No write-down charges were recorded, during the periods ended June 30, 2026 and 2025.

As of June 30, 2026, the Company had $3,907,597 in inventory, primarily related to raw material, including the scrap and feedstock received from the government as described in Note 1(h) (2025: nil). No inventory was pledged as security for liabilities.

F-23

Table of Contents
9.    PROPERTY, PLANT AND EQUIPMENT
Plant and
 equipment
Right-of-use assetsTotal
US$US$US$
2026
Carrying amount at June 30, 202521,445,038 3,752,600 25,197,638 
Additions20,813,687 1,982,560 22,796,247 
Disposals(1)
(3,758,805)- (3,758,805)
Depreciation(2,278,003)(771,147)(3,049,150)
Carrying amount at June 30, 2026(2)
36,221,917 4,964,013 41,185,930 
 - at cost40,072,636 6,361,118 46,433,754 
 - accumulated depreciation and impairment
(3,850,719)(1,397,105)(5,247,824)
Notes:
(1) During the twelve months ended June 30, 2026, proceeds of $1,903,700 were received, with the outstanding balance recorded as a current receivable.
(2) During the twelve months ended June 30, 2026, a non-cash reclassification of approximately $667,000 related to an equipment lease that was finalized during the year. The fully amortized leased asset was transferred to property, plant and equipment, resulting in an increase to gross cost and accumulated depreciation with no corresponding impact on net property, plant and equipment.
2025
Carrying amount at June 30, 20246,188,697 1,585,115 7,773,812 
Additions15,996,078 2,961,466 18,957,544 
Disposals(23,590)- (23,590)
Depreciation
(716,147)(793,981)(1,510,128)
Carrying amount at June 30, 202521,445,038 3,752,600 25,197,638 
 - at cost22,350,584 5,444,538 27,795,122 
 - accumulated depreciation and impairment
(905,546)(1,691,938)(2,597,484)
2024
Carrying amount at June 30, 20232,822,765 1,167,018 3,989,783 
Additions5,745,871 939,196 6,685,067 
Disposals(2,056,437)- (2,056,437)
Impairment(198,750)- (198,750)
Depreciation
(124,752)(521,099)(645,851)
Carrying amount at June 30, 20246,188,697 1,585,115 7,773,812 
 - at cost6,508,437 2,483,072 8,991,509 
 - accumulated depreciation and impairment
(319,740)(897,957)(1,217,697)
F-24

Table of Contents
10.    INTANGIBLES
20262025
Intellectual property rightsUS$US$
Balance at the beginning of the year13,550,993 - 
Transfers from prepayments- 5,500,000 
Additions18,377 8,819,121 
Amortization(1,300,546)(768,128)
Balance at June 3012,268,824 13,550,993 
- at cost14,337,498 14,319,121 
- accumulated amortization(2,068,674)(768,128)

During the fiscal year 2025, the Group exercised its exclusive option to purchase intellectual property rights of Blacksand Technology, LLC. The group now holds the exclusive commercial rights for more than 40 global patents through a license agreement with the University of Utah including the global patents for patented technologies that can produce low-cost and low-carbon titanium metal.
11.    EXPLORATION AND EVALUATION ASSETS
Titan Project (1)
US$
2026
Carrying amount at June 30, 20256,512,326 
Additions1,256,092 
Carrying amount at June 30, 2026(1) (2)
7,768,418 
2025
Carrying amount at June 30, 20246,114,061 
Additions644,661 
Write-offs(246,396)
Carrying amount at June 30, 20256,512,326 
2024
Carrying amount at June 30, 20233,059,021 
Additions3,055,040 
Carrying amount at June 30, 2024
6,114,061 
Notes:
(1)At June 30, 2026, the Titan Project comprised over 10,000 acres of surface and associated mineral rights in Tennessee prospective for heavy mineral sands, including titanium, rare earth minerals, high grade silica sand, and zircon, of which approximately 1,500 acres are owned by IperionX, approximately 1,200 acres are subject to long-term lease by IperionX, and approximately 7,500 acres are subject to exclusive option agreements with IperionX. These exclusive option agreements, upon exercise, allow the Group to lease, or in some cases purchase, the surface property and associated mineral rights.
(2)The ultimate recoupment of costs carried forward for exploration and evaluation is dependent on the successful development and commercial exploitation or sale of the respective areas of interest.
F-25

Table of Contents
12.    TRADE AND OTHER PAYABLES, PROVISIONS AND OTHER LONG-TERM LIABILITIES
Trade and other payables
20262025
US$US$
Current
Trade payables8,746,938 6,004,071 
Accruals1,687,214 1,307,087 
Other payables15,635 178,239 
Total trade and other payables10,449,787 7,489,397 
Provisions
The current provisions balance of $738,039 (2025: $467,001) represents the Group's best estimate of employee entitlement obligations, including annual leave and other short-term benefit accruals that are expected to be settled within twelve months of the reporting date.
Other Long-term liabilities
The other long-term liability of $333,000 (2025: $700,000) relates to the remaining deferred consideration payable in connection with the Group's acquisition of exclusive intellectual property rights from Blacksand Technology, LLC. See Note 10 for further discussion.
13.    DEFERRED INCOME
During the period, the Government transferred approximately 290 metric tons of high-quality titanium scrap metal to the Company at no cost. The material was surplus to government needs and was transferred in connection with the IBAS grant program, which is intended to strengthen U.S. defense supply chains by fostering a resilient, low-cost, titanium platform that reduces reliance on imports and establishes a secure, domestic source of critical materials.
The Company recognizes government grants related to non-monetary assets by recording the fair value of the inventory received and establishing a corresponding deferred income liability. Deferred income is recognized in profit or loss on a systematic basis over the periods in which the related costs are incurred or the inventory is consumed.
The deferred income related to the inventory received was measured at its fair value of $2,757,895 on the date of receipt, based on prevailing market prices for titanium scrap.
20262025
US$US$
Deferred Income at June 30, 2025––
Grant recognized during the period2,757,895–
Amounts released to profit or loss(986,364)–
Deferred Income at June 30, 20261,771,531–
As of the reporting date, the Company has complied with all conditions attached to the Grant, and no repayment obligation has been recognized.
F-26

Table of Contents
14.    LOANS AND BORROWINGS
Other Loans and BorrowingsLease LiabilitiesTotal Loans and Borrowings
US$US$US$
2026
Carrying amount at June 30, 202519,067 3,915,515 3,934,582 
Additions(1)
965,723 572,647 1,538,370 
Repayments(792,031)(521,942)(1,313,973)
Carrying amount at June 30, 2026
192,759 3,966,220 4,158,979 
Current187,040 441,893 628,933 
Non-Current5,719 3,524,327 3,530,046 
2025
Carrying amount at June 30, 202424,893 1,465,780 1,490,673 
Additions- 2,961,565 2,961,565 
Repayments(5,826)(511,830)(517,656)
Carrying amount at June 30, 202519,067 3,915,515 3,934,582 
Current6,764 465,254 472,018 
Non-Current12,303 3,450,261 3,462,564 
Note:
(1)Relates to non cash additions for insurance premiums financed.
The following table sets forth the maturity schedule of the Company’s loans and borrowings:
Other Loans and Borrowings
US$
Lease Liabilities
US$
2027188,836 738,331 
20285,769 700,937 
2029- 698,734 
2030- 688,568 
2031- 637,881 
Thereafter- 1,760,943 
Total payments194,605 5,225,394 
Less: imputed interest(1,846)(1,259,174)
Present value of loans and borrowings192,759 3,966,220 
F-27

Table of Contents
15.    LEASES
The Group leases office facilities, storage facilities, vehicles, and plant and equipment in the U.S. The lease arrangements do not contain any material restrictive covenants or other significant restrictions.
The carrying amounts of right-of-use assets (included under property, plant and equipment) and the movements during the year are in Note 9.
The carrying amounts of lease liabilities (included under financial liabilities) and the movements during the year are set out in Note 14.
The following are the amounts recognized in profit or loss in respect of leases:
Notes202620252024
US$US$US$
Amortization of right-of-use assets9(771,147)(793,981)(521,099)
Interest expense on lease liabilities(282,870)(278,186)(106,474)
Expense relating to short-term leases and leases of low-value assets(326,442)(143,789)(72,542)
Net amount recognized in profit or loss(1,380,459)(1,215,956)(700,115)
F-28

Table of Contents
16.    CONTRIBUTED EQUITY
Notes20262025
US$US$
Issued capital
339,384,066 (2025: 319,927,854) fully paid ordinary shares
16(a)250,976,753 197,985,920 
We do not have a limit on our authorized share capital and the concept of par value is not recognized under Australian law.
(a)    Movements in Issued Capital
Number of
 Ordinary
Shares
Number of
 Class A
 Performance
Shares
Number of
 Class B
 Performance
Shares
US$
Opening balance at June 30, 2023193,493,97319,800,00019,800,00058,764,248 
Issue of shares – share placements43,476,381--45,740,157 
Issue of shares – exercise of options11,231,823--4,335,005 
Issue of shares – conversion of RSUs341,461--225,734 
Issue of shares – conversion of rights5,140,420--2,757,730 
Issue of shares to consultants554,538--470,000 
Issue of shares to Blacksand in lieu of cash3,006,163--2,000,000 
Share issue costs---(1,333,236)
Closing balance at June 30, 2024257,244,75919,800,00019,800,000112,959,638
Issue of shares – share placements
34,951,630--70,919,564 
Issue of shares – exercise of options1,525,000--205,525 
Issue of shares – conversion of RSUs1,639,496--2,094,041 
Issue of shares – conversion of rights24,273,335--13,724,952 
Issue of shares to consultants151,760--470,262 
Issue of shares to Director in lieu of cash bonus141,844--250,000 
Conversion of performance shares30(19,800,000)-- 
Share issue costs---(2,638,062)
Closing balance at June 30, 2025319,927,854-19,800,000197,985,920
Issue of shares – share placements14,000,000- -45,717,352 
Issue of shares – exercise of options2,047,487- -971,471 
Issue of shares – conversion of RSUs1,540,516- -2,234,348 
Issue of shares – conversion of rights595,000- -603,498 
Issue of shares – payment of expenses1,273,179- -5,230,000 
Conversion of performance shares30- (19,800,000)- 
Share issue costs---(1,765,836)
Closing balance at June 30, 2026339,384,066--250,976,753 
Note: Shares issued upon exercise of options are shown net of shares surrendered to settle the exercise price under net settlement arrangements.
F-29

Table of Contents
16.CONTRIBUTED EQUITY (continued)
(b)    Rights Attaching to Ordinary Shares
The rights attaching to fully paid Ordinary Shares arise from a combination of the Company’s Constitution, statute and general law:
•Shares - The issue of shares in the capital of the Company and options over unissued shares by the Company is under the control of the directors, subject to the Corporations Act 2001, ASX Listing Rules and any rights attached to any special class of shares.
•Meetings of Members - Directors may call a meeting of members whenever they think fit. Members may call a meeting as provided by the Corporations Act 2001. The Constitution contains provisions prescribing the content requirements of notices of meetings of members and all members are entitled to a notice of meeting. A meeting may be held in two or more places linked together by audio-visual communication devices. A quorum for a meeting of members is two shareholders. The Company holds annual general meetings in accordance with the Corporations Act 2001 and the Listing Rules.
•Voting - Subject to any rights or restrictions attached at the time to any shares or class of shares of the Company, each member of the Company is entitled to receive notice of, attend and vote at a general meeting. Under the Company’s constitution, resolutions of members will be decided by a show of hands unless a poll is demanded. However, in accordance with the Corporations Act 2001 (Commonwealth - Cth), the Company decides all resolutions proposed at its shareholder meetings by poll. On a show of hands each eligible voter present has one vote. Where a person present at a general meeting represents personally or by proxy, attorney or representative more than one member, on a show of hands the person is entitled to one vote only despite the number of members the person represents. On a poll each eligible member has one vote for each fully paid share held and a fraction of a vote for each partly paid share determined by the amount paid up on that share.
•Changes to the Constitution - The Company’s Constitution can only be amended by a special resolution passed by at least 75% of the votes cast by members entitled to vote. At least 28 days’ written notice specifying the intention to propose the resolution as a special resolution must be given.
•Listing Rules - Provided the Company remains admitted to the Official List, then despite anything in its Constitution, no act may be done that is prohibited by the Listing Rules, and authority is given for acts required to be done by the Listing Rules. The Company’s Constitution will be deemed to comply with the Listing Rules as amended from time to time.
(c)    Rights Attaching to Performance Shares
As of June 30, 2024, Performance Shares comprised of 19,800,000 Class A and 19,800,000 Class B Performance Shares issued in relation to the acquisition of HMAPL and could have been issued based upon the following terms and conditions:
•The Performance Shares could convert into Ordinary Shares as follows:
◦Each Class A Performance Share could convert into one (1) Ordinary Share upon completion of a positive pre-feasibility study (prepared in accordance with the JORC Code and independently verified by a Competent Person) for heavy mineral sands mining and processing on any of the Titan Project area which demonstrates a net present value of at least A$200,000,000 before September 17, 2024 (the “Pre-Feasibility Study Milestone”). The Pre-Feasibility Study Milestone was not met by September 17, 2024.
◦Each Class B Performance Share could convert into one (1) Ordinary Share upon the commencement of commercial production from the Titan Project area before September 17, 2025 (the “First Production Milestone”). The First Production Milestone was not met by September 17, 2025;
◦As the Performance Shares did not convert into Ordinary Shares by the applicable expiry date, (being December 1, 2024 for the Class A Performance Shares and December 1, 2025 for the Class B Performance Shares), all such Performance Shares for each holder automatically lapsed and were combined into one (1) single Performance Share that was then converted into one (1) single Ordinary Share;
◦The 19,800,000 Class A Performance Shares did not convert into Ordinary Shares by the applicable expiry date of December 1, 2024, so the 19,800,000 Class A Performance Shares lapsed and converted into 30 Ordinary Shares during fiscal 2025; and
F-30

Table of Contents
16.CONTRIBUTED EQUITY (continued)
◦The 19,800,000 Class B Performance Shares did not convert into Ordinary Shares by the applicable expiry date of December 1, 2025, so the 19,800,000 Class B Performance Shares lapsed and converted into 30 Ordinary Shares during fiscal 2026.
17.    RESERVES
Notes20262025
US$US$
Share-based payments reserve17(b)12,392,374 6,469,201 
Foreign currency translation reserve17(f)929,049 (2,780,397)
13,321,423 3,688,804 
(a)    Nature and Purpose of Reserves
(i)Share-based payments reserve
The share-based payments reserve is used to record the fair value of Unlisted Options, RSUs and Performance Rights issued by the Group.
(ii)Foreign currency translation reserve
Exchange differences arising on translation of entities whose functional currency is different to the Group’s presentation currency are taken to the foreign currency translation reserve, as described in Note 1(d).
(b)    Movements in Share-Based Payments Reserve During the Year
Number of
Unlisted
Options
 (Note 17(c))
Number of
Performance
Rights
 (Note 17(d))
No. of
Restricted Stock
Units
 (Note 17(e))
US$
2026
June 30, 202512,904,1187,504,4094,798,2256,469,201 
Grant of employee options, rights and RSUs4,086,871769,077853,979- 
Exercise of options, rights and RSUs(2,118,279)(595,000)(1,540,516)(3,243,161)
Lapse/forfeiture of employee options, rights and RSUs(8,000,000)(630,000)(1,018)- 
Share-based payment expense---9,166,334 
June 30, 20266,872,7107,048,4864,110,67012,392,374 
2025
June 30, 202411,749,37227,469,3354,377,03413,440,265 
Grant of employee options, rights and RSUs2,679,7465,288,4092,220,020- 
Exercise of options, rights and RSUs(1,525,000)(24,273,335)(1,639,496)(15,818,993)
Issue of shares to consultants---(470,262)
Issue of shares to Director in lieu of bonus---(250,000)
Lapse/forfeiture of employee rights and RSUs-(980,000)(159,333)- 
Share-based payment expense---9,568,191 
June 30, 202512,904,1187,504,4094,798,2256,469,201 
F-31

Table of Contents
17.RESERVES (continued)
2024
June 30, 202323,011,372 29,146,000 824,371 15,004,052 
Grant of employee rights and RSUs- 4,021,000 3,894,124 - 
Exercise of options, rights and RSUs(11,262,000)(5,147,665)(341,461)(4,726,904)
Issue of shares to consultants- - - (470,000)
Expiry of employee rights- (550,000)- (158,424)
Share-based payment expense- - - 3,791,541 
June 30, 202411,749,37227,469,3354,377,03413,440,265 
Note: For details on the valuation of Unlisted Options, Performance Rights and RSUs, including models and assumptions used, refer to Note 21 of the financial statements.
(c)    Terms and Conditions of Unlisted Options
Unlisted Options granted as share-based payments have the following terms and conditions:
•Each Unlisted Option entitles the holder to the right to subscribe for one share upon the exercise of each Unlisted Option;
•The Unlisted Options outstanding at the end of the financial year have the following exercise prices and expiry dates:
◦106,093 director options exercisable at A$0.87 each on or before December 5, 2026;
◦235,000 unlisted options exercisable at A$10.00 each on or before April 1, 2027;
◦1,305,000 unlisted options exercisable at A$8.00 each on or before June 30, 2027;
◦1,374,746 employee options exercisable at A$5.00 each on or before April 10, 2029;
◦511,972 employee options exercisable at A$11.00 each on or before April 2, 2030;
◦1,566,690 director and employee options exercisable at A$18.00 each on or before April 2, 2031; and
◦1,773,209 director and employee options exercisable at A$22.00 each on or before April 2, 2031.
•The Unlisted Options are exercisable at any time prior to the Expiry Date, subject to vesting conditions being satisfied (if applicable);
•Shares issued on exercise of the Unlisted Options rank equally with the then Shares of the Company;
•Application will be made by the Company to ASX for official quotation of the Shares issued upon the exercise of the Unlisted Options;
•If there is any reconstruction of the issued share capital of the Company, the rights of the Unlisted Option holders may be varied to comply with the ASX Listing Rules which apply to the reconstruction at the time of the reconstruction; and
•No application for quotation of the Unlisted Options will be made by the Company.
(d)    Terms and Conditions of Performance Rights
Performance Rights granted as share-based payments have the following terms and conditions:
•Each Performance Right automatically converts into one Share upon vesting of the Performance Right;
•Each Performance Right is subject to performance conditions (as determined by the Board from time to time) which must be satisfied in order for the Performance Right to vest;
F-32

Table of Contents
17.RESERVES (continued)
•The Performance Rights outstanding at the end of the financial year have the following performance conditions and expiry dates:
◦2,885,000 employee performance rights that vest upon achieving a 30-day VWAP of A$4.00 per share (2,440,000 expiring December 21, 2028 and 445,000 expiring December 31, 2027);
◦660,077 director and employee performance rights that vest upon achieving a 30-day VWAP of A$18.00 expiring April 2, 2031;
◦1,157,803 employee performance rights that vest upon achieving a 30-day VWAP of A$6.00 expiring April 10, 2031;
◦1,157,803 employee performance rights that vest upon achieving a 30-day VWAP of A$7.00 per share expiring April 10, 2031;
◦1,157,803 employee performance rights that vest upon achieving a 30-day VWAP of A$8.00 per share expiring April 10, 2031; and
◦30,000 employee performance rights that vest upon achieving various (non-market based) performance conditions expiring December 31, 2026.
•Application will be made by the Company to ASX for official quotation of the Shares issued upon conversion of the Performance Rights;
•If there is any reconstruction of the issued share capital of the Company, the rights of the Performance Right holders may be varied to comply with the ASX Listing Rules which apply to the reconstruction at the time of the reconstruction;
•No application for quotation of the Performance Rights will be made by the Company; and
•Without approval of the Board, Performance Rights may not be transferred, assigned or novated, except, upon death, a participant’s legal personal representative may elect to be registered as the new holder of such Performance Rights and exercise any rights in respect of them.
(e)    Terms and Conditions of Restricted Stock Units
RSUs granted as share-based payments have the following terms and conditions:
•Each RSU automatically converts into one Share upon vesting of the RSU;
•Each RSU is subject to service-based performance conditions (as determined by the Board from time to time) which must be satisfied in order for the RSU to vest;
•The RSUs outstanding at the end of the financial year have the following conditions and expiry dates:
◦118,875 director RSUs that vest upon achieving various service-based conditions, expiring December 23, 2026;
◦1,095,330 director and employee RSUs that vest upon achieving various service-based conditions, expiring December 31, 2026;
◦135,044 director RSUs that vest upon achieving various service-based conditions, expiring December 5, 2027;
◦16,755 employee RSUs that vest upon achieving various service-based conditions, expiring December 31, 2027;
◦20,820 employee RSUs that vest upon achieving various service-based conditions, expiring March 2, 2028;
◦15,500 employee RSUs that vest upon achieving various service-based conditions, expiring April 2, 2028;
◦141,620 director RSUs that vest upon achieving various service-based conditions, expiring December 16, 2028;
◦242,985 employee RSUs that vest upon achieving various service-based conditions, expiring December 31, 2028;
◦1,637,975 director and employee RSUs that vest upon achieving various service-based conditions, expiring April 10, 2029;
◦476,734 employee RSUs that vest upon achieving various service-based conditions, expiring December 31, 2029; and
◦209,032 employee RSUs that vest upon achieving various service-based conditions, expiring April 2, 2030.
F-33

Table of Contents
17.RESERVES (continued)
•Application will be made by the Company to ASX for official quotation of the Shares issued upon conversion of the RSUs;
•If there is any reconstruction of the issued share capital of the Company, the rights of the RSU holders may be varied to comply with the ASX Listing Rules which apply to the reconstruction at the time of the reconstruction;
•No application for quotation of the RSUs will be made by the Company; and
•Without approval of the Board, RSUs may not be transferred, assigned or novated, except, upon death, a participant’s legal personal representative may elect to be registered as the new holder of such RSUs and exercise any rights in respect of them.
(f)    Movements in Foreign Currency Translation Reserve During the Year
202620252024
US$US$US$
Balance at beginning of the year(2,780,397)(1,178,258)(1,008,244)
Exchange differences arising on translation into presentation currency3,709,446 (1,602,139)(170,014)
Balance at June 30929,049 (2,780,397)(1,178,258)
18.    ACCUMULATED LOSSES
202620252024
US$US$US$
Balance at beginning of the year(109,230,725)(73,882,050)(52,196,828)
Net loss for the year(66,767,762)(35,348,675)(21,843,646)
Adjustment for expiry of employee rights- - 158,424 
Balance at June 30(175,998,487)(109,230,725)(73,882,050)

F-34

Table of Contents
19.    LOSS PER SHARE
202620252024
US$US$US$
Basic loss per share(0.20)(0.12)(0.10)
Diluted loss per share(0.20)(0.12)(0.10)
The following reflects the income and share data used in the calculations of basic earnings per share:
202620252024
US$US$US$
Net loss used in calculating basic and dilutive earnings per share(66,767,762)(35,348,675)(21,843,646)
202620252024
Share #Share #Share #
Weighted average number of Ordinary Shares used in calculating basic and dilutive earnings per share335,741,001296,887,872217,842,947
(a)    Anti-Dilutive Securities
As at June 30, 2026, 6,872,710 Unlisted Options, 7,048,486 Performance Rights, and 4,110,670 RSUs, which together represent 18,031,866 potential Ordinary Shares (2025: 45,006,752), (2024: 83,195,741), were not included in the calculation of diluted loss per share because they are considered anti-dilutive as they would decrease the loss per share for the years presented.
(b)    Conversions, Calls, Subscriptions or Issues after June 30, 2026
Subsequent to June 30, 2026, the Company has:
•issued 22,750,000 ordinary shares pursuant to a placement of ordinary shares;
•issued 106,093 ordinary shares pursuant to the exercise of unlisted options;
•issued 58,584 unlisted RSUs to a director; and
•issued 947,062 unlisted options to a contractor.
Other than as above, there have been no other conversions to, calls of, or subscriptions for Ordinary Shares or issues of potential Ordinary Shares since the reporting date and before the completion of this financial report.

F-35

Table of Contents
20.    RELATED PARTIES
(a)    Subsidiaries
Equity Interest
Country of202620252024
Incorporation%%%
Hyperion Metals (Australia) Pty LtdAustralia100100100
IperionX Critical Minerals LLCUnited States100100100
IperionX Technology LLCUnited States100100100
IperionX Inc.United States100100100
(b)    Ultimate Parent
IperionX Limited is the ultimate parent of the Group.
(c)    Key Management Personnel
The aggregate compensation made to KMP of the Group is set out below:
202620252024
US$US$US$
Short-term employee benefits4,296,651 4,012,976 3,100,958 
Post-employment benefits54,012 62,632 68,300 
Share-based payments6,661,094 5,496,070 2,749,346 
Total compensation11,011,757 9,571,678 5,918,604 
No loans were provided to or received from KMP during the year ended June 30, 2026 (2025: nil) (2024: nil).
Mr. Gregory Swan, former Company Secretary, provided services through a services agreement with the Apollo Group. During the 2024 fiscal year, Apollo Group was paid $270,763 (A$413,000) for the provision of serviced office facilities and administrative, accounting and company secretarial services to the Group.
(d)    Other transactions with Related Parties
Performance Industries, Inc., a company associated with Mr. Scott Sparks, COO of the Company, was paid $70,660 during the fiscal year 2026 (2025: nil) (2024: $53,138) for the provision of engineering and construction services to the Group. The Company considers that the services provided by Performance Industries, Inc. were provided on an arm’s length or better basis.
Balances and transactions between the Company and its subsidiaries, which are related parties of the Company, have been eliminated on consolidation and are not disclosed in this note.
F-36

Table of Contents
21.    SHARE-BASED PAYMENTS
(a)    Recognized share-based payment expense
From time to time, the Group grants ordinary shares, unlisted options, performance rights, and RSUs to officers, employees, consultants and other key advisors as part of remuneration and incentive arrangements. The number of Shares, Options, Rights, and RSUs granted, and the terms of the Shares, Options, Rights, and RSUs granted are determined by the Board. Shareholder approval is sought where required.
During fiscal 2026, fiscal 2025, and fiscal 2024 the following equity-settled share-based payments have been recognized in profit or loss:
202620252024
US$US$US$
Expense arising from staff remuneration arrangements(9,166,334)(9,568,191)(3,791,541)
Total expense arising from equity-settled share-based payment transactions(9,166,334)(9,568,191)(3,791,541)
In addition to share-based payment expenses recognized through profit or loss, a share-based payment of $2 million was recognized as an asset (prepayments) during the 2024 financial year, relating to the issue of 3,006,163 new fully paid ordinary shares to nominees of Blacksand in lieu of future cash option payments totalling $2 million owed to Blacksand under the option agreement between the Company and Blacksand.
(b)    Summary of securities granted as share-based payments
The following table illustrates the number and weighted-average exercise price of Options, and weighted-average grant date fair value for Rights and RSUs granted as share-based payments during fiscal 2026, fiscal 2025, and fiscal 2024:
Stock Option AwardsWA - Exercise Price A$Restricted Stock UnitsWA - Grant Date Fair Value A$Performance Rights Awards (market-based conditions)WA - Grant Date Fair Value A$Performance Rights Awards (performance conditions)WA - Grant Date Fair Value A$
June 30, 202323,011,3720.32 824,3710.95 26,910,0000.69 2,236,0001.04 
Granted-- 3,894,1242.18 3,980,0000.99 41,0001.10 
Exercised/Converted(11,262,000)(0.35)(341,461)(0.99)(4,726,665)(0.71)(421,000)(0.89)
Forfeited-- -- (550,000)(0.66)-- 
June 30, 202411,749,3720.28 4,377,0342.04 25,613,3350.74 1,856,0001.08 
Granted2,679,7466.46 2,220,0203.99 4,938,4093.49 350,0003.81 
Exercised/Converted(1,525,000)(0.20)(1,639,496)(1.93)(23,273,335)(0.79)(1,000,000)(1.24)
Forfeited-- (159,333)(2.27)(920,000)(0.98)(60,000)(0.91)
June 30, 202512,904,1181.57 4,798,2252.97 6,358,4092.66 1,146,0001.78 
Granted4,086,87118.40 853,9796.53 660,0772.66 109,0005.43 
Exercised/Converted(2,118,279)(0.62)(1,540,516)(2.23)-- (595,000)(1.53)
Forfeited(8,000,000)(0.20)(1,018)(6.91)-- (630,000)(2.45)
June 30, 20266,872,71013.47 4,110,6703.99 7,018,4862.66 30,0005.99 
F-37

Table of Contents
21.SHARE-BASED PAYMENTS (continued)
(b)    Summary of securities granted as share-based payments (continued)
The following Options, Rights and RSUs were granted as share-based payments during fiscal 2026, fiscal 2025, and fiscal 2024:
2026Security
 Type
NumberGrant DateExpiry
Date
Exercise
Price
A$
Vesting Hurdle
(30-day VWAP)
A$
Fair
Value
 A$
Series 1Rights45,0006-Aug-2531-Dec-26- 5.99 
Series 2RSUs118,87528-Nov-2523-Dec-26- - 5.11 
Series 3RSUs12,0005-Dec-2531-Dec-26- - 5.02 
Series 4Options235,0005-Dec-251-Apr-2710.00 - 0.40 
Series 5Rights64,00020-Dec-2531-Dec-25- - 5.03 
Series 6RSUs477,7525-Mar-2631-Dec-29- - 6.91 
Series 7Options511,9728-Mar-262-Apr-3011.00 - 2.93 
Series 8Options607,2448-Mar-262-Apr-3122.00 - 2.27 
Series 9Options536,5218-Mar-262-Apr-3118.00 - 2.57 
Series 10Rights226,0478-Mar-262-Apr-31- 18.00 4.47 
Series 11RSUs209,0328-Mar-262-Apr-30- - 6.55 
Series 12RSUs20,8209-Mar-262-Mar-28- - 6.55 
Series 13RSUs15,5009-Mar-262-Apr-28- - 6.55 
Series 14Options1,165,96519-Mar-262-Apr-3122.00 - 0.96 
Series 15Options1,030,16919-Mar-262-Apr-3118.00 - 1.11 
Series 16Rights434,03019-Mar-262-Apr-31- 18.00 1.72 
F-38

Table of Contents
21.SHARE-BASED PAYMENTS (continued)
2025Security
 Type
NumberGrant DateExpiry
Date
Exercise
Price
A$
Vesting Hurdle
(30-day VWAP)
A$
Fair
Value
 A$
Series 1Rights445,0001-Nov-2431-Dec-27- 4.00 2.98 
Series 2Rights435,0001-Nov-2423-Apr-26- 3.00 3.12 
Series 3Rights585,0001-Nov-2423-Apr-26- 4.00 2.53 
Series 4Rights30,0001-Nov-2431-Dec-25- - 3.40 
Series 5Rights200,0001-Nov-2423-Apr-26- - 3.40 
Series 6RSUs25,1321-Nov-2431-Dec-27- - 3.40 
Series 7RSUs169,94422-Nov-2416-Dec-28- - 4.40 
Series 8Rights120,00020-Dec-2431-Dec-25- - 4.60 
Series 9RSUs42,4869-Mar-2516-Dec-28- - 3.37 
Series 10RSUs40,0006-May-2531-Dec-28- - 3.49 
Series 11RSUs113,4758-May-2531-Dec-28- - 3.40 
Series 12RSUs56,7389-May-2531-Dec-28- - 3.55 
Series 13RSUs82,33510-May-2510-Apr-29- - 3.55 
Series 14Options216,67210-May-2510-Apr-295.00 - 1.87 
Series 15RSUs13,61712-May-2531-Dec-28- - 3.41 
Series 16RSUs8,51113-May-2531-Dec-28- - 3.17 
Series 17RSUs400,53315-May-2510-Apr-29- - 3.11 
Series 18Rights415,69515-May-2510-Apr-31- 6.00 2.76 
Series 19Rights415,69515-May-2510-Apr-31- 7.00 2.68 
Series 20Rights415,69515-May-2510-Apr-31- 8.00 2.60 
Series 21RSUs48,22716-May-2531-Dec-28- - 3.20 
Series 22RSUs82,33523-May-2510-Apr-29- - 3.55 
Series 23Options216,67223-May-2510-Apr-295.00 - 1.86 
Series 24RSUs24,82329-May-2531-Dec-28- - 3.58 
Series 25RSUs9,36230-May-2531-Dec-28- - 3.69 
Series 26RSUs26,32631-May-2531-Dec-28- - 3.69 
Series 27RSUs357,73212-Jun-2510-Apr-29- - 4.10 
Series 28Options941,40212-Jun-2510-Apr-295.00 - 2.26 
Series 29RSUs3,40412-Jun-2531-Dec-28- - 4.10 
Series 30Options1,305,00026-Jun-2530-Jun-278.00 - 1.09 
Series 31RSUs715,04027-Jun-2510-Apr-29- - 4.75 
Series 32Rights742,10827-Jun-2510-Apr-31- 6.00 4.48 
Series 33Rights742,10827-Jun-2510-Apr-31- 7.00 4.38 
Series 34Rights742,10827-Jun-2510-Apr-31- 8.00 4.29 
F-39

Table of Contents
21.SHARE-BASED PAYMENTS (continued)
2024Security
Type
NumberGrant DateExpiry
 Date
Exercise
Price
A$
Vesting Hurdle
(30-day VWAP)
A$
Fair
Value
A$
Series 1Shares116,53815-Aug-23-- - 0.98 
Series 2Rights21,00015-Aug-2322-Dec-24- - 1.10 
Series 3Rights10,00015-Aug-2322-Dec-25- - 1.10 
Series 4Rights10,00015-Aug-2322-Dec-26- - 1.10 
Series 5Rights200,00018-Dec-2323-Apr-26- 3.00 0.79 
Series 6Rights300,00018-Dec-2323-Apr-26- 4.00 0.63 
Series 7Rights3,330,00018-Dec-2321-Dec-28- 4.00 1.01 
Series 8Shares388,00030-Jan-24-- - 1.37 
Series 9Shares50,00030-Jan-24-- - 1.37 
Series 10RSUs1,434,00026-Mar-2431-Dec-27- - 2.27 
Series 11RSUs2,055,0009-Apr-2431-Dec-27- - 2.27 
Series 12RSUs405,12422-Nov-235-Dec-27- - 1.42 
Series 13Rights75,00021-May-2423-Apr-26- 3.00 1.61 
Series 14Rights75,00021-May-2423-Apr-26- 4.00 1.32 
(c)    Weighted Average Remaining Contractual Life
At June 30, 2026, the weighted average remaining contractual life of Unlisted Options was 3.37 years (2025: 0.96 years) (2024: 1.45 years).
(d)    Option, Right and RSU Pricing Models
The fair value of granted RSUs and Rights that do not have market-based vesting conditions is estimated as at the date of grant based on the underlying share price.
The fair value of granted Options is estimated as at the date of grant using the Black Scholes option valuation model taking into account the terms and conditions upon which the Unlisted Options were granted. The table below lists the inputs to the valuation models used for Options granted by the Group during fiscal 2026, fiscal 2025 and fiscal 2024:
202620252024
Expected life (weighted average)
4.16 years
2.96 years-
Risk-free interest rate (weighted average)
3.7%
3.28%-
Expected volatility (weighted average)
73%
80%-
Expected dividend yield
-%-%-
F-40

Table of Contents
21.SHARE-BASED PAYMENTS (continued)
The fair value of granted Rights that have market-based vesting conditions is estimated as at the date of grant using a trinomial valuation model taking into account the market-based vesting criteria upon which the Rights were granted. The table below lists the inputs to the valuation models used for the Rights that have market-based vesting conditions granted by the Group during fiscal 2026, fiscal 2025 and fiscal 2024:
202620252024
Expected life (weighted average)
4.98 years4.69 years4.56 years
Risk-free interest rate (weighted average)4.62%3.73%3.75%
Expected volatility (weighted average)75%77%80%
Fair value at grant date (weighted average)A$2.66A$3.49A$0.99
Share price at grant date (weighted average)A$4.58A$3.94A$1.36
Vesting hurdle (30-day VWAP) (weighted average)A$18.00A$6.02A$3.93
Expected volatility was determined by reference to historical share price volatility over a period consistent with the expected life of the Options or Rights.
22.    SEGMENT INFORMATION
IFRS 8 requires operating segments to be identified on the basis of internal reports about components of the Consolidated Entity that are regularly presented to and reviewed by the chief operating decision maker in order to allocate resources to the segment and to assess its performance. The Consolidated Entity operates in one segment, being exploration and development of minerals and metals in the U.S.
(a)    Reconciliation of non-current assets by geographical location
20262025
US$US$
United States of America61,223,170 45,719,988 
61,223,170 45,719,988 
23.    FINANCIAL RISK MANAGEMENT OBJECTIVES AND POLICIES
(a)    Overview
The Group’s principal financial instruments comprise cash, receivables, other financial assets, payables, loans and borrowings and lease liabilities. The main risks arising from the Group’s financial instruments are interest rate risk, foreign currency risk, credit risk and liquidity risk.
The Group manages its exposure to key financial risks in accordance with the Group’s financial risk management policy. Key risks are monitored and reviewed as circumstances change and policies are revised as required. The overall objective of the Group’s financial risk management policy is to support the delivery of the Group’s financial targets whilst protecting future financial security.
Given the nature and size of the business and uncertainty as to the timing and amount of cash inflows and outflows, the Group does not enter into derivative transactions to mitigate the financial risks. In addition, the Group’s policy is that no trading in financial instruments shall be undertaken for the purposes of making speculative gains. As the Group’s operations change, the Directors will review this policy periodically going forward.
The Board of Directors has overall responsibility for the establishment and oversight of the risk management framework. The Board reviews and agrees policies for managing the Group’s financial risks as summarised below.
F-41

Table of Contents
23.FINANCIAL RISK MANAGEMENT OBJECTIVES AND POLICIES (continued)
(b)    Credit Risk
Credit risk is the risk of financial loss to the Group if a customer or counterparty to a financial instrument fails to meet its contractual obligations. This arises principally from cash and cash equivalents, receivables, and other financial assets.
There are no significant concentrations of credit risk within the Group. The carrying amount of the Group’s financial assets represents the maximum credit risk exposure, as represented below:
Notes20262025
US$US$
Cash and cash equivalents535,244,220 54,814,125 
Trade and other receivables63,282,481 823,268 
38,526,701 55,637,393 
With respect to credit risk arising from cash and cash equivalents, the Group’s exposure arises from default of the counter party, with a maximum exposure equal to the carrying amount of these instruments. The credit risk for cash and cash equivalents is considered negligible, since the counterparties are reputable banks with high quality external credit ratings.
Trade and other receivables comprise primarily receivables from government funding programs, deposits, accrued interest and GST refunds due. Where possible the Group trades only with recognized, creditworthy third parties. It is the Group’s policy that all customers who wish to trade on credit terms are subject to credit verification procedures. In addition, receivable balances are monitored on an ongoing basis with the result that the Group’s exposure to bad debts is not significant. There were no past due receivables at the date of this report.
(c)    Liquidity Risk
Liquidity risk is the risk that the Group will not be able to meet its financial obligations as they fall due. The Board’s approach to managing liquidity is to ensure, as far as possible, that the Group will always have sufficient liquidity to meet its liabilities when due. At June 30, 2026, the Group had sufficient liquid assets to meet its financial obligations.
The Group had no financial covenants during the 2026 and 2025 financial periods, as the Group’s lease liabilities and other loans and borrowings do not impose any financial covenants other than the security interests in the leased assets that are held by the lessor. Leased assets may not be used as security for borrowing purposes.
The contractual maturities of financial liabilities are provided in Note 14 - Loans and Borrowings. There are no netting arrangements in respect of financial liabilities.
(d)    Interest Rate Risk
The Group’s exposure to the risk of changes in market interest rates relates primarily to the cash and short-term deposits with a floating interest rate. These financial assets with variable rates expose the Group to cash flow interest rate risk. All other financial assets and liabilities are either non-interest bearing (for example, receivables and payables) or have fixed interest rates (for example, lease liabilities, sub-lease receivables, and loans and borrowings).
At the reporting date, the interest rate profile of the Group’s financial instruments was:
Notes20262025
US$US$
Cash at bank and on hand535,244,220 54,814,125 
35,244,220 54,814,125 
The Group’s cash at bank and on hand and short-term deposits had a weighted average floating interest rate at year-end of 2.89% (2025: 3.48%).
The Group currently does not engage in any hedging or derivative transactions to manage interest rate risk.
F-42

Table of Contents
23.FINANCIAL RISK MANAGEMENT OBJECTIVES AND POLICIES (continued)
Interest rate sensitivity
A sensitivity of 0.5% (50 basis points) has been selected as this is considered reasonable given the current level of both short term and long-term interest rates. A 0.5% (50 basis points) movement in interest rates at the reporting date would have increased (decreased) equity and profit or loss by the amounts shown below. This analysis assumes that all other variables, in particular foreign currency rates, remain constant.
Profit or lossEquity
+0.5%-0.5%+0.5%-0.5%
US$US$US$US$
2026
Cash and cash equivalents176,221(176,221)176,221(176,221)
2025
Cash and cash equivalents274,071(274,071)274,071(274,071)
2024
Cash and cash equivalents165,787(165,787)165,787(165,787)
(e)    Foreign Currency Risk
Foreign currency risk is the risk that the fair value of future cash outflows will fluctuate because of changes in foreign currency exchange rates.
The Group’s exposure to the risk of changes in foreign exchange rate relates primarily to assets and liabilities that are denominated in currencies other than the functional currency of the group entity.
The Parent Company’s functional currency is Australian dollars. The financial statements are presented in U.S. dollars which is the Group’s presentation currency.
The Group also has transactional currency exposures relating to transactions denominated in currencies other than the functional currency of the entity.
It is the Group’s policy not to enter into any hedging or derivative transactions to manage foreign currency risk.
At the reporting date, the Group’s exposure to financial instruments denominated in currencies other than the functional currency of the group entity:
Assets and liabilities denominated in currencies other than the functional currency of the group entity2026
US$ Equivalent
2025
US$ Equivalent
Financial assets
Cash and cash equivalents26,592,658 29,417,896 
Financial liabilities
Trade and other payables(2,985)(1,130,814)
Net exposure26,589,673 28,287,082 
F-43

Table of Contents
23.FINANCIAL RISK MANAGEMENT OBJECTIVES AND POLICIES (continued)
Foreign exchange rate sensitivity
At the reporting date, had the US$ appreciated or depreciated against the A$, as illustrated in the table below, profit or loss and equity would have been affected by the amounts shown below. This analysis assumes that all other variables remain constant.
Profit or lossEquity
+10%-10%+10%-10%
US$US$US$US$
2026
Group2,658,967(2,658,967)2,658,967(2,658,967)
2025
Group2,828,707(2,828,707)2,828,707(2,828,707)
(f)    Commodity Price Risk
The Group’s major commodity price exposure is to the price of titanium and titanium products. The price of titanium is affected by numerous factors beyond the control of the Group. The Group is currently researching, developing and commercializing its titanium metal technologies and exploring its mineral properties in the U.S. To date, the Group has not had significant sales of titanium and titanium products, but anticipates product sales now that the Group's Titanium Manufacturing Campus in Virginia has started operations. We currently do not enter into hedging or derivative transactions to manage commodity price risk.
(g)    Capital Management
The Board’s policy is to maintain a strong capital base so as to maintain investor, creditor and market confidence and to sustain future development of the business. Given the stage of development of the Group, the Board’s objective is to minimize debt and to raise funds as required through the issue of new shares. The Group is not subject to externally imposed capital requirements.
There were no changes in the Group’s approach to capital management during the year.
(h)    Fair Value
The fair value of financial assets and financial liabilities approximates their carrying value. The methods for estimating fair value are outlined in the relevant notes to the consolidated financial statements.

F-44

Table of Contents
24.    CONTINGENT ASSETS AND LIABILITIES
Titan Project
The Titan Project is prospective for critical mineral sands including titanium minerals, rare earth minerals, high grade silica sand and zircon minerals. At June 30, 2026, the Group had entered into exclusive option agreements with local landowners in Tennessee, in relation to its Titan Project, which upon exercise, allows the Group to lease or, in some cases purchase, the acres of surface property and the associated mineral rights from the local landowners. As of June 30, 2026, the Titan Project comprised over 10,000 acres of surface and associated mineral rights in Tennessee, of which approximately 1,500 acres are owned by IperionX, approximately 1,200 acres are subject to long-term lease by IperionX, and approximately 7,500 acres are subject to exclusive option agreements with IperionX. During the option period, our option agreements provide us with exclusive right to access, enter, occupy and use the surface property for all purposes related to exploring for and evaluating all minerals in return for making annual option payments and bonus payments during periods when we conduct drilling. Upon exercise, in the case of an option to lease, the Company will pay a production royalty to the landowners, subject to a minimum royalty. Upon exercise, in the case of a purchase, the Company will pay cash consideration approximating the fair market value of the property, excluding the value of any minerals, plus a premium.
On June 15, 2026, the Company entered into an agreement to acquire certain mining and infrastructure assets associated with Covia Solutions LLC’s Camden silica sand operation in Camden, Tennessee, adjacent to the Company’s Titan Project. The assets include mineral rights, at-surface pre-processed mineral stockpiles, mining and processing equipment, an existing rail spur, approximately 1,200 acres of owned property, approximately 1,300 acres of leased property, buildings and structures, and associated electrical, water, and gas infrastructure.
The purchase price for the assets is $3 million in cash. The acquisition was completed on July 1, 2026.
In connection with the acquisition, the Company has agreed to assume Covia’s existing reclamation obligations related to certain disturbed property, which primarily consist of re-grading, re-vegetation, and stabilization of affected land. The Company is in the process of assessing the timing and estimated cost of these obligations, which will be recognized as a liability upon closing of the acquisition in accordance with applicable accounting standards.
The acquisition is expected to provide strategic synergies with the Titan Project through consolidated mineral rights within the McNairy Formation, additional feedstock optionality from existing stockpiles and pre-stripped horizons, and utilization of established infrastructure. There are no material contingencies related to the purchase price; however, the assumed reclamation obligations represent a commitment that may result in future cash outflows.
No other material commitments or contingencies related to this transaction have been identified as of the date of this report.
F-45

Table of Contents
25.    EVENTS SUBSEQUENT TO BALANCE DATE
(a)On July 1, 2026, the Company completed the acquisition of key assets from Covia Solutions LLC’s Camden, Tennessee silica sand operation for $3 million. The assets include mineral rights, at-surface pre-processed mineral stockpiles, mining and processing equipment, an existing rail spur, approximately 1,200 acres of owned property, approximately 1,300 acres of leased property, buildings and structures, and associated electrical, water, and gas infrastructure.
As of the date of issuance of these financial statements, management has not yet completed its determination of the fair values of the individual assets acquired.
(b)On July 7, 2026, the Company completed the placement of 2,275,000 new fully paid ADSs, each representing 10 ordinary shares, to raise gross proceeds of $50 million before costs. Proceeds from the offering will be used to continue the commercialization and scale-up of certain of our titanium and metal alloy production technologies, including continued scale-up and expansion of the Company’s Titanium Manufacturing Campus in Virginia and associated titanium metal research and development activities, continued development of the Atlas-Titan Project in Tennessee, and for general corporate purposes.
(c)On August 3, 2026, the Company announced a proposed redomiciliation of its ultimate parent company to Texas, U.S., subject to shareholder, court, regulatory and other customary approvals. Subject to completion of the transaction and applicable exchange approvals, the Company expects the common stock of the new U.S. parent company to be listed directly on Nasdaq, replacing the existing ADS structure. The proposed redomiciliation is not expected to impact the Company's underlying assets, operations or strategic priorities.
On that same announcement, the Company announced the appointment of Michael J. Loparco as an independent non-executive director effective August 3, 2026.
(d)On August 26, 2026, IperionX received Task Order 2 under its U.S. Army SBIR Phase III contract for Low-Cost, Domestic Titanium for Defense Applications that builds upon the previously announced $1.3 million task order, lifting the aggregate potential value of task orders issued under the Company’s $99 million SBIR Phase III contract up to $26.7 million. This additional task order will fund the physical equipment and manufacturing systems required to increase throughput, bring critical production steps in-house, reduce acquisition and production costs, and accelerate delivery of titanium components for U.S. defense applications.
Other than the above, as at the date of this report there are no other matters or circumstances which have arisen since June 30, 2026 that have significantly affected or may significantly affect:
•the operations, in financial years subsequent to June 30, 2026, of the Group;
•the results of those operations, in financial years subsequent to June 30, 2026, of the Group; or
•the state of affairs, in financial years subsequent to June 30, 2026, of the Group.
F-46

Exhibit 8.1
List of Subsidiaries


NameJurisdiction of OrganizationOwnership Percentage
Hyperion Metals (Australia) Pty LtdAustralia100%
IperionX Critical Minerals LLCUnited States100%
IperionX Technology LLCUnited States100%
IperionX Inc.United States100%


Exhibit 12.1
CERTIFICATION PURSUANT TO RULES 13a-14(a) AND 15d-14(a)
UNDER THE SECURITIES EXCHANGE ACT OF 1934
AS ADOPTED PURSUANT TO SECTION 302 OF THE SARBANES-OXLEY ACT OF 2002
I, Anastasios Arima, certify that:
1.I have reviewed this annual report on Form 20-F of IperionX Limited;
2.Based on my knowledge, this report does not contain any untrue statement of a material fact or omit to state a material fact necessary to make the statements made, in light of the circumstances under which such statements were made, not misleading with respect to the period covered by this report;
3.Based on my knowledge, the financial statements, and other financial information included in this report, fairly present in all material respects the financial condition, results of operations and cash flows of the company as of, and for, the periods presented in this report;
4.The company’s other certifying officers and I are responsible for establishing and maintaining disclosure controls and procedures (as defined in Exchange Act Rules 13a-15(e) and 15d-15(e)) and internal control over financial reporting (as defined in Exchange Act Rules 13a-15(f) and 15d-15(f)) for the company and have:
(a)Designed such disclosure controls and procedures, or caused such disclosure controls and procedures to be designed under our supervision, to ensure that material information relating to the company, including its consolidated subsidiaries, is made known to us by others within those entities, particularly during the period in which this report is being prepared;
(b)Designed such internal control over financial reporting, or caused such internal control over financial reporting to be designed under our supervision, to provide reasonable assurance regarding the reliability of financial reporting and the preparation of financial statements for external purposes in accordance with generally accepted accounting principles;
(c)Evaluated the effectiveness of the company’s disclosure controls and procedures and presented in this report our conclusions about the effectiveness of the disclosure controls and procedures, as of the end of the period covered by this report based on such evaluation; and
(d)Disclosed in this report any change in the company’s internal control over financial reporting that occurred during the period covered by the annual report that has materially affected, or is reasonably likely to materially affect, the company’s internal control over financial reporting; and
5.The company’s other certifying officer(s) and I have disclosed, based on our most recent evaluation of internal control over financial reporting, to the company’s auditors and the audit committee of the company’s board of directors (or persons performing the equivalent functions):
(a)All significant deficiencies and material weaknesses in the design or operation of internal control over financial reporting which are reasonably likely to adversely affect the company’s ability to record, process, summarize and report financial information; and
(b)Any fraud, whether or not material, that involves management or other employees who have a significant role in the company’s internal control over financial reporting.
Date:September 29, 2026
By:/s/ Anastasios Arima
Anastasios Arima
Chief Executive Officer and Managing Director
(principal executive officer)


Exhibit 12.2
CERTIFICATION PURSUANT TO RULES 13a-14(a) AND 15d-14(a)
UNDER THE SECURITIES EXCHANGE ACT OF 1934
AS ADOPTED PURSUANT TO SECTION 302 OF THE SARBANES-OXLEY ACT OF 2002
I, Marcela Castro, certify that:
1.I have reviewed this annual report on Form 20-F of IperionX Limited;
2.Based on my knowledge, this report does not contain any untrue statement of a material fact or omit to state a material fact necessary to make the statements made, in light of the circumstances under which such statements were made, not misleading with respect to the period covered by this report;
3.Based on my knowledge, the financial statements, and other financial information included in this report, fairly present in all material respects the financial condition, results of operations and cash flows of the company as of, and for, the periods presented in this report;
4.The company’s other certifying officers and I are responsible for establishing and maintaining disclosure controls and procedures (as defined in Exchange Act Rules 13a-15(e) and 15d-15(e)) and internal control over financial reporting (as defined in Exchange Act Rules 13a-15(f) and 15d-15(f)) for the company and have:
(a)Designed such disclosure controls and procedures, or caused such disclosure controls and procedures to be designed under our supervision, to ensure that material information relating to the company, including its consolidated subsidiaries, is made known to us by others within those entities, particularly during the period in which this report is being prepared;
(b)Designed such internal control over financial reporting, or caused such internal control over financial reporting to be designed under our supervision, to provide reasonable assurance regarding the reliability of financial reporting and the preparation of financial statements for external purposes in accordance with generally accepted accounting principles;
(c)Evaluated the effectiveness of the company’s disclosure controls and procedures and presented in this report our conclusions about the effectiveness of the disclosure controls and procedures, as of the end of the period covered by this report based on such evaluation; and
(d)Disclosed in this report any change in the company’s internal control over financial reporting that occurred during the period covered by the annual report that has materially affected, or is reasonably likely to materially affect, the company’s internal control over financial reporting; and
5.The company’s other certifying officer(s) and I have disclosed, based on our most recent evaluation of internal control over financial reporting, to the company’s auditors and the audit committee of the company’s board of directors (or persons performing the equivalent functions):
(a)All significant deficiencies and material weaknesses in the design or operation of internal control over financial reporting which are reasonably likely to adversely affect the company’s ability to record, process, summarize and report financial information; and
(b)Any fraud, whether or not material, that involves management or other employees who have a significant role in the company’s internal control over financial reporting.
Date:September 29, 2026
By:/s/ Marcela Castro
Marcela Castro
Chief Financial Officer
(principal financial officer)


Exhibit 13.1
CERTIFICATION PURSUANT TO 18 U.S.C. SECTION 1350,
AS ADOPTED PURSUANT TO
SECTION 906 OF THE SARBANES-OXLEY ACT OF 2002
In connection with the Annual Report of IperionX Limited (the “Company”) on Form 20-F for the fiscal year ended June 30, 2026 (the “Annual Report”) as filed with the Securities and Exchange Commission on the date hereof, I, Anastasios Arima, certify pursuant to 18 U.S.C. Section 1350, as adopted pursuant to Section 906 of the Sarbanes-Oxley Act of 2002, that to my knowledge:
1.the Annual Report fully complies with the requirements of Section 13(a) or 15(d) of the Exchange Act, as amended; and
2.the information contained in the Annual Report fairly presents, in all material respects, the financial condition and results of operations of IperionX Limited.
Date:September 29, 2026
By:/s/ Anastasios Arima
Anastasios Arima
Chief Executive Officer and Managing Director
(principal executive officer)


Exhibit 13.2
CERTIFICATION PURSUANT TO 18 U.S.C. SECTION 1350,
AS ADOPTED PURSUANT TO
SECTION 906 OF THE SARBANES-OXLEY ACT OF 2002
In connection with the Annual Report of IperionX Limited (the “Company”) on Form 20-F for the fiscal year ended June 30, 2026 (the “Annual Report”) as filed with the Securities and Exchange Commission on the date hereof, I, Marcela Castro, certify pursuant to 18 U.S.C. Section 1350, as adopted pursuant to Section 906 of the Sarbanes-Oxley Act of 2002, that to my knowledge:
1.the Annual Report fully complies with the requirements of Section 13(a) or 15(d) of the Exchange Act, as amended; and
2.the information contained in the Annual Report fairly presents, in all material respects, the financial condition and results of operations of IperionX Limited.
Date:September 29, 2026
By:/s/ Marcela Castro
Marcela Castro
Chief Financial Officer
(principal financial officer)

non-process infrastructure (NPI) TITAN PROJECT TENNESSEE, U.S. TECHNICAL REPORT SUMMARY ON FEASIBILITY STUDY Report prepared for: IperionX Limited Report current at: June 4, 2026 Report prepared by the following Qualified Persons: Etienne Raffaillac, MAusIMM Karst Geo Solutions, LLC. Marshall Miller & Associates, Inc. Primero Group Americas Inc. TITAN PROJECT TENNESSEE, U.S. TECHNICAL REPORT SUMMARY ON FEASIBILITY STUDY Page 2 Technical Report Summary for Titan Project Forward-Looking Information This Technical Report Summary contains forward-looking statements within the meaning of the United States Securities Act of 1933 and the US Securities Exchange Act of 1934, which are intended to be covered by the safe harbor created by such sections. Such forward-looking statements include, without limitation, statements regarding mineral resource and mineral reserve estimates, recoveries and grade, future mineralization, future adjustments, and sensitivities and other statements that are not historical facts. These statements are not guarantees of future performance and undue reliance should not be placed on them. The assumptions used to develop forward-looking information and the risks that could cause the actual results to differ materially are detailed in the body of this report. Forward-looking statements address activities, events, or developments that IperionX Limited (IperionX) expects or anticipates will or may occur in the future and are based on current expectations and assumptions. Although IperionX’s management believes that its expectations are based on reasonable assumptions, it can give no assurance that these expectations will prove correct. Such assumptions, include, but are not limited to: (i) there being no significant change to current geotechnical, metallurgical, hydrological and other physical condition assumptions; (ii) permitting being consistent with current expectations (iii) political developments being consistent with its current expectations; (iv) certain exchange rate assumptions being approximately consistent with current levels; (v) certain price assumptions for zircon, rutile, ilmenite, and rare earth elements; and (vii) other planning assumptions. Important factors that could cause actual results to differ materially from those in the forward-looking statements include, among others, risks that estimates of mineral resources and mineral reserves are uncertain and the volume and grade of mineralization actually recovered may vary from the estimates presented in this report, risks relating to fluctuations in commodity prices; risks due to the inherently hazardous nature of mining-related activities; risks related to the jurisdiction in which IperionX operates, uncertainties due to health and safety considerations, uncertainties related to environmental considerations, including, without limitation, climate change, uncertainties relating to obtaining approvals and permits, including renewals, from governmental regulatory authorities; and uncertainties related to changes in law; as well as those factors discussed in IperionX’s filings with the US Securities and Exchange Commission, including IperionX’s latest Annual Report on Form 20-F for the period ended June 30, 2025, which is available on EDGAR. IperionX does not undertake any obligation to release publicly revisions to any “forward-looking statement,” to reflect events or circumstances after the date of this report, or to reflect the occurrence of unanticipated events, except as may be required under applicable securities laws. Investors should not assume that any lack of update to a previously issued “forward-looking statement” constitutes a reaffirmation of that statement. Continued reliance on “forward-looking statements” is at investors’ own risk. TITAN PROJECT TENNESSEE, U.S. TECHNICAL REPORT SUMMARY ON FEASIBILITY STUDY Page 3 Table of Contents Technical Report Summary for Titan Project ......................................................................................... 2 Table of Contents .................................................................................................................................. 3 1 Executive Summary ...................................................................................................................... 20 1.1 Introduction .................................................................................................................... 20 1.2 Terms of Reference ......................................................................................................... 20 1.3 Property Description and Ownership ............................................................................... 20 1.4 Accessibility, Climate, Local Resources, Infrastructure and Physiography ........................ 21 1.5 History ............................................................................................................................. 21 1.6 Geological Setting, Mineralization, and Deposit............................................................... 22 1.7 Exploration Drilling .......................................................................................................... 22 1.8 Sample Preparation, Analyses, and Security .................................................................... 24 1.9 Data Verification.............................................................................................................. 25 1.10 Mineral Processing and Metallurgical Testing .................................................................. 25 1.11 Mineral Resource Estimates ............................................................................................ 26 1.11.1 Estimation Methodology ........................................................................................ 26 1.11.2 Mineral Resources Statement ................................................................................ 29 1.12 Mineral Reserve Estimates .............................................................................................. 29 1.12.1 Estimation Methodology ........................................................................................ 29 1.12.2 Mineral Reserves Statement .................................................................................. 32 1.13 Mining Methods .............................................................................................................. 33 1.14 Processing and Recovery Methods .................................................................................. 35 1.15 Infrastructure .................................................................................................................. 41 1.16 Market Studies ................................................................................................................ 41 1.16.1 Market Studies Used .............................................................................................. 41 1.16.2 Commodity Pricing ................................................................................................. 42 1.16.2.1 Mineral Sands Product Pricing ................................................................................... 42 1.16.2.2 Heavy Rare Earth Concentrate Pricing ........................................................................ 42 1.17 Environmental, Permitting and Social Considerations ...................................................... 43 1.17.1 Environmental Studies and Monitoring .................................................................. 43 1.17.2 Permitting .............................................................................................................. 44 1.17.3 Mine Reclamation and Closure, Tailings and Water Management .......................... 44 1.17.4 Social Considerations, Plans, Negotiations and Agreements ................................... 45 1.18 Capital Cost Estimates ..................................................................................................... 45 1.19 Operating Cost Estimates ................................................................................................ 46 1.20 Economic Analysis ........................................................................................................... 46 TITAN PROJECT TENNESSEE, U.S. TECHNICAL REPORT SUMMARY ON FEASIBILITY STUDY Page 4 1.20.1 Forward-Looking Information Caution ................................................................... 46 1.20.2 Methodology and Assumptions.............................................................................. 47 1.20.3 Economic Analysis Results ...................................................................................... 47 1.20.4 Sensitivity Analysis ................................................................................................. 48 1.21 Risks and Opportunities ................................................................................................... 50 1.21.1 Risks ....................................................................................................................... 50 1.21.2 Opportunities......................................................................................................... 51 1.21.2.1 Project Area ............................................................................................................... 51 1.21.2.2 Processing ................................................................................................................. 51 1.22 Conclusions ..................................................................................................................... 52 1.23 Recommendations .......................................................................................................... 53 1.23.1 Mining ................................................................................................................... 53 1.23.2 Processing .............................................................................................................. 54 2 Introduction ................................................................................................................................. 56 2.1 Introduction .................................................................................................................... 56 2.2 Terms of Reference ......................................................................................................... 56 2.2.1 Report Purpose ...................................................................................................... 56 2.2.2 Terms of Reference ................................................................................................ 56 2.3 Qualified Persons ............................................................................................................ 57 2.4 Qualified Person Site Visits .............................................................................................. 57 2.4.1 MM&A ................................................................................................................... 57 2.4.2 KGS ........................................................................................................................ 57 2.5 Report Date ..................................................................................................................... 58 2.6 Information Sources and References ............................................................................... 58 2.7 Previously Filed Technical Report Summaries .................................................................. 58 3 Property Description .................................................................................................................... 59 3.1 Location .......................................................................................................................... 59 3.2 Ownership ....................................................................................................................... 61 3.3 Mineral Title .................................................................................................................... 61 3.4 Surface Rights and Water Rights ...................................................................................... 65 3.5 Royalties .......................................................................................................................... 65 3.6 Encumbrances ................................................................................................................. 65 3.7 Significant Factors and Risks That May Affect Access, Title or Work Programs ................. 65 4 Accessibility, Climate, Local Resources, Infrastructure and Physiography ................................... 66 4.1 Accessibility ..................................................................................................................... 66 4.2 Climate and Length of Operating Season ......................................................................... 66 4.3 Local Resources and Infrastructure .................................................................................. 66



 
TITAN PROJECT TENNESSEE, U.S. TECHNICAL REPORT SUMMARY ON FEASIBILITY STUDY Page 5 4.4 Topography, Elevation and Vegetation ............................................................................ 67 5 History .......................................................................................................................................... 68 6 Geological Setting, Mineralization, and Deposit .......................................................................... 69 6.1 Deposit Model ................................................................................................................. 69 6.2 Regional Geology ............................................................................................................. 69 6.3 Local Geology .................................................................................................................. 71 6.4 Deposit Geology .............................................................................................................. 72 6.4.1 Lithologies ............................................................................................................. 72 6.4.2 Structure ................................................................................................................ 73 6.4.3 Mineralization ........................................................................................................ 73 7 Exploration ................................................................................................................................... 75 7.1 Exploration ...................................................................................................................... 75 7.1.1 Grids and Surveys .................................................................................................. 75 7.1.2 Exploration Sampling ............................................................................................. 75 7.1.3 Exploration Potential ............................................................................................. 75 7.2 Drilling ............................................................................................................................. 75 7.2.1 Overview ............................................................................................................... 75 7.2.2 Drilling Used in Mineral Resource Estimate ............................................................ 76 7.2.3 Drilling Excluded for Estimation Purposes .............................................................. 77 7.2.4 Metallurgical Drilling .............................................................................................. 78 7.2.5 Drill Methods ......................................................................................................... 79 7.2.6 Core Logging .......................................................................................................... 80 7.2.7 Core Recovery ........................................................................................................ 81 7.2.8 Collar Surveys ........................................................................................................ 81 7.2.9 Downhole Surveys ................................................................................................. 81 7.2.10 Drilled Versus True Thickness ................................................................................. 81 7.2.11 Comment on Material Results and Interpretation .................................................. 82 7.3 Hydrogeology .................................................................................................................. 82 7.3.1 Aquifer Properties .................................................................................................. 84 7.3.2 Groundwater ......................................................................................................... 84 7.3.3 Surface Water ........................................................................................................ 86 7.3.4 Groundwater Flow Model ...................................................................................... 86 7.3.5 Site-Wide Water Balance ....................................................................................... 89 7.3.6 Opinion of Qualified Person ................................................................................... 93 7.4 Geotechnical Data ........................................................................................................... 93 7.4.1 Pit Slopes ............................................................................................................... 93 7.4.2 Pit Backfill .............................................................................................................. 96 TITAN PROJECT TENNESSEE, U.S. TECHNICAL REPORT SUMMARY ON FEASIBILITY STUDY Page 6 7.4.3 Infrastructure Sites ................................................................................................ 97 7.4.4 Opinion of Qualified Person ................................................................................... 97 8 Sample Preparation, Analyses, and Security ................................................................................ 98 8.1 Sample Collection ............................................................................................................ 98 8.2 Security ........................................................................................................................... 98 8.3 Density/Specific Gravity Determinations ......................................................................... 98 8.3.1 Collection Methods ................................................................................................ 98 8.3.2 Analysis and Results ............................................................................................... 98 8.4 Laboratory Procedures .................................................................................................... 99 8.4.1 Sample Data Analysis ............................................................................................. 99 8.4.2 Mineral Assemblage Assay Data ........................................................................... 100 8.5 Quality Assurance and Quality Controls ......................................................................... 101 8.6 Database ....................................................................................................................... 102 8.7 Opinion of Qualified Person........................................................................................... 102 9 Data Verification ........................................................................................................................ 103 9.1 Data Verification Completed by the Qualified Person .................................................... 103 9.1.1 KGS ...................................................................................................................... 103 9.1.2 MM&A ................................................................................................................. 103 9.2 Mineral Assemblage ...................................................................................................... 103 9.2.1 General Statistics ................................................................................................. 103 9.2.2 Comparative Composites ..................................................................................... 104 9.3 Limitations Placed on Data Verification ......................................................................... 104 9.4 Opinion of Qualified Person........................................................................................... 104 10 Mineral Processing and Metallurgical Testing ............................................................................ 105 10.1 2021 Metallurgical Test Results ..................................................................................... 105 10.1.1 Sample Preparation and Deslime Circuit .............................................................. 106 10.1.2 Wet Process Circuit .............................................................................................. 107 10.1.3 Dry Process Circuit ............................................................................................... 108 10.2 2023 Metallurgical Test Results ..................................................................................... 108 10.2.1 Feed Preparation ................................................................................................. 109 10.2.2 Wet Gravity Separation ........................................................................................ 109 10.2.3 Rare Earth Mineral Flotation and Gravity Upgrade ............................................... 111 10.2.4 Dry Mineral Separation ........................................................................................ 111 10.2.4.1 Fine HMC Mineral Separation Circuit ....................................................................... 111 10.2.4.1.1 Fine Primary Dry Circuit ..................................................................................... 112 10.2.4.1.2 Fine Non-Conductor Circuit ............................................................................... 112 10.2.4.1.3 Fine Conductor Circuit ....................................................................................... 113 TITAN PROJECT TENNESSEE, U.S. TECHNICAL REPORT SUMMARY ON FEASIBILITY STUDY Page 7 10.2.4.2 Coarse HMC Mineral Separation Circuit ................................................................... 113 10.2.5 Product Grades .................................................................................................... 114 10.3 Preliminary Flowsheet Development ............................................................................. 115 10.4 Metallurgical Recovery Forecasts .................................................................................. 116 10.5 Metallurgical Variability ................................................................................................. 117 10.6 Deleterious Elements .................................................................................................... 117 10.7 Opinion of Qualified Person........................................................................................... 117 11 Mineral Resource Estimates ....................................................................................................... 118 11.1 Introduction .................................................................................................................. 118 11.2 Geologic Model ............................................................................................................. 118 11.3 Model Method .............................................................................................................. 118 11.4 McNairy Formation THM% and Thickness...................................................................... 121 11.5 Density Assignment ....................................................................................................... 122 11.6 Variography ................................................................................................................... 122 11.6.1 Data Domain ........................................................................................................ 122 11.6.2 Geostatistical Analysis .......................................................................................... 123 11.7 Block Model Development and Validation ..................................................................... 124 11.7.1 Block Model Construction .................................................................................... 124 11.8 Grade Capping/Outlier Restrictions ............................................................................... 125 11.9 Compositing .................................................................................................................. 125 11.10 Estimation/Interpolation Methods ................................................................................ 125 11.11 Classification of Mineral Resources ............................................................................... 128 11.11.1 Mineral Resource Confidence Classification ......................................................... 128 11.11.2 Uncertainties Considered During Confidence Classification .................................. 129 11.12 In situ Tonnage by Formation ........................................................................................ 130 11.12.1 In-situ Mineral Assemblage .................................................................................. 131 11.13 Reasonable Prospects for Economic Extraction ............................................................. 131 11.13.1 Initial Assessment Assumptions ........................................................................... 131 11.13.2 Input Assumptions Used to Constrain the Mineral Resource Estimates ................ 132 11.13.3 Cut-off Grade ....................................................................................................... 132 11.13.4 QP Statement ...................................................................................................... 133 11.14 Mineral Resource Estimates .......................................................................................... 133 11.15 Qualified Person’s Opinion ............................................................................................ 134 11.16 Factors That May Affect the Mineral Resource Estimates .............................................. 134 12 Mineral Reserve Estimates ......................................................................................................... 135 12.1 Assumptions, Parameters and Methodology ................................................................. 135 12.1.1 Optimization Methodology .................................................................................. 135 TITAN PROJECT TENNESSEE, U.S. TECHNICAL REPORT SUMMARY ON FEASIBILITY STUDY Page 8 12.1.1.1 Block Model & Cutoff Grade .................................................................................... 135 12.1.2 Optimization Parameters ..................................................................................... 135 12.2 Mineral Reserve Statement ........................................................................................... 137 12.3 Qualified Person’s Opinion ............................................................................................ 138 12.4 Factors That May Affect the Mineral Reserve Estimates ................................................ 138 13 Mining Methods ......................................................................................................................... 139 13.1 Pit Slope Assumptions ................................................................................................... 139 13.2 Tailings Geotechnical Assessment ................................................................................. 148 13.3 Hydrogeological Assessment ......................................................................................... 150 13.4 Mining Related Requirements ....................................................................................... 151 13.5 Mine Plan ...................................................................................................................... 151 13.6 Mining Method Selection .............................................................................................. 151 13.6.1 Mining Method Determination ............................................................................ 151 13.6.2 Mining Method Details ........................................................................................ 152 13.7 Labor and Equipment .................................................................................................... 158 13.7.1 Equipment ........................................................................................................... 159 13.7.2 Labor ................................................................................................................... 159 13.8 Internal Roads ............................................................................................................... 159 13.9 Production Rates ........................................................................................................... 161 14 Processing and Recovery Methods ............................................................................................. 179 14.1 High-level Process Design Decisions .............................................................................. 179 14.1.1 Design Decisions .................................................................................................. 179 14.1.2 Tails Dewatering Trade-off Study ......................................................................... 180 14.1.3 Zircon Trade-off Study ......................................................................................... 181 14.2 Process Flowsheet ......................................................................................................... 181 14.3 Process Design Criteria .................................................................................................. 184 14.4 Process Plant Throughput, Equipment and Design Basis ................................................ 184 14.5 Process Modelling ......................................................................................................... 186 14.6 Utility and Resource Requirements ............................................................................... 187 14.7 Process Plant ................................................................................................................. 188 14.7.1 Wet Concentrator Plant Site ................................................................................ 188 14.7.1.1 Introduction ............................................................................................................ 188 14.7.1.2 Mining Unit Plant ..................................................................................................... 189 14.7.1.3 Feed Preparation Plant ............................................................................................ 190 14.7.1.4 Wet Concentrator Plant ........................................................................................... 191 14.7.1.5 Concentrate Upgrade Plant...................................................................................... 194 14.7.1.6 Tailings Dewatering Circuit ...................................................................................... 196


TITAN PROJECT TENNESSEE, U.S. TECHNICAL REPORT SUMMARY ON FEASIBILITY STUDY Page 9 14.7.1.7 Process Water and Reagents Storage ....................................................................... 197 14.7.2 Mineral Separation Plant Site ............................................................................... 198 14.7.2.1 Introduction ............................................................................................................ 198 14.7.2.2 Rare Earth Plant ....................................................................................................... 201 14.7.2.2.1 HMC (REP Feed) Stockpile and Reclaim Circuit ................................................... 202 14.7.2.2.2 Feed Attritioning and Desliming Circuit .............................................................. 203 14.7.2.2.3 Feed Desliming Circuit ....................................................................................... 204 14.7.2.2.4 Flotation Circuit ................................................................................................. 205 14.7.2.2.5 Wet Shaking Tables Circuit ................................................................................ 206 14.7.2.2.6 MSP Rejects Reclaim and Spiral Separation Circuits ........................................... 207 14.7.2.2.7 HREC Product Dewatering and Packaging Circuits .............................................. 209 14.7.2.2.8 REP HMC Dewatering and Stockpiling Circuits ................................................... 210 14.7.2.2.9 REP Tails Dewatering and Stockpiling Circuits .................................................... 211 14.7.2.2.10 REP Process Water Circuit ................................................................................. 212 14.7.2.2.11 REP Reagents Circuit .......................................................................................... 213 14.7.2.3 Mineral Separation Plant ......................................................................................... 215 14.7.2.3.1 MSP Feed and Drying Circuit.............................................................................. 217 14.7.2.3.2 Primary Dry Circuit ............................................................................................ 218 14.7.2.3.3 Primary Non-Conductor Circuit .......................................................................... 219 14.7.2.3.4 Primary Conductor Circuit ................................................................................. 220 14.7.2.3.5 MSP Product Storage and Loadout Circuit ......................................................... 222 14.7.2.3.6 MSP Rejects Dewatering and Stockpiling Circuit ................................................ 223 14.7.3 Electrical Infrastructure ........................................................................................ 223 14.7.3.1 WCP Plant Area ....................................................................................................... 223 14.7.3.2 Mineral Separation Plant Area ................................................................................. 224 15 Infrastructure ............................................................................................................................. 226 15.1 Roads and Logistics........................................................................................................ 227 15.1.1 Roads ................................................................................................................... 227 15.1.2 Rail ....................................................................................................................... 227 15.2 ROM and Tailings Transportation .................................................................................. 228 15.2.1 Production Conveyor System ............................................................................... 228 15.2.2 Tailings Belt System ............................................................................................. 229 15.2.3 Plant Site Belt Systems ......................................................................................... 230 15.2.4 Additional Materials Handling Equipment ............................................................ 230 15.3 Water Handling Systems................................................................................................ 231 15.3.1.1 Dewatering System .................................................................................................. 231 15.3.1.2 Plant Water Supply System ...................................................................................... 231 15.4 Civil Design .................................................................................................................... 231 15.4.1 Wet Concentrator Plant (WCP) ............................................................................ 232 15.4.2 Mineral Separation Plant ..................................................................................... 234 15.5 Power Supply ................................................................................................................ 234 15.6 Natural Gas ................................................................................................................... 234 TITAN PROJECT TENNESSEE, U.S. TECHNICAL REPORT SUMMARY ON FEASIBILITY STUDY Page 10 15.7 Water Supply ................................................................................................................. 234 15.7.1 Raw Water Supply ................................................................................................ 234 15.7.2 Potable Water Supply .......................................................................................... 235 15.8 Communications Systems .............................................................................................. 236 15.9 Non-Process Infrastructure ............................................................................................ 236 15.10 Tailings Backfill and Waste Disposal ............................................................................... 237 16 Market Studies ........................................................................................................................... 239 16.1 Overview ....................................................................................................................... 239 16.2 Product Market Summaries ........................................................................................... 239 16.2.1 Ilmenite ............................................................................................................... 239 16.2.2 Rutile ................................................................................................................... 240 16.2.3 Zircon ................................................................................................................... 241 16.2.4 Rare Earths .......................................................................................................... 241 16.3 Strategic Importance of the Titan Project to the United States ...................................... 242 16.4 Products and Sales Assumptions ................................................................................... 243 16.4.1 Project Products, Specifications, and Quality ....................................................... 243 16.5 Market Overview and Demand ...................................................................................... 244 16.5.1 Market Studies Used ............................................................................................ 244 16.5.2 Titanium Feedstock Market (Ilmenite and Rutile) ................................................. 244 16.5.3 Zircon Market ...................................................................................................... 246 16.5.4 Rare Earth Market ................................................................................................ 246 16.6 Product Pricing Assumptions and Methodology ............................................................ 248 16.6.1 Mineral Sands Product Pricing.............................................................................. 248 16.6.2 Heavy Rare Earth Concentrate Pricing .................................................................. 249 16.6.3 Historical and Forecast Prices ............................................................................... 250 16.7 Material Contracts and Market Engagement ................................................................. 251 16.7.1 Material Contracts ............................................................................................... 251 16.7.2 Historical Market Engagement ............................................................................. 251 16.7.3 Marketing Plan and Planned Sales Channels ........................................................ 252 17 Environmental Studies and Permitting, and Plans, Negotiations, or Agreements with Local Individuals or Groups ........................................................................................................ 253 17.1 Mine and WCP Site – Regulatory Approval Process........................................................ 253 17.1.1 Overview ............................................................................................................. 253 17.1.2 Environmental Baseline Studies ........................................................................... 253 17.1.2.1 Environmental Baseline Studies – Mine Site ............................................................. 253 17.1.3 Federal Statutes and Approvals ............................................................................ 257 17.1.3.1 Clean Water Act Section 404 – Mine Site ................................................................... 257 TITAN PROJECT TENNESSEE, U.S. TECHNICAL REPORT SUMMARY ON FEASIBILITY STUDY Page 11 17.1.3.1.1 Jurisdictional Determination .............................................................................. 257 17.1.3.1.2 Recommendations ............................................................................................ 257 17.1.3.2 National Historical Preservation Act ......................................................................... 257 17.1.3.2.1 Recommendations ............................................................................................ 258 17.1.3.3 Endangered Species Act Section 7 or 10 ................................................................... 258 17.1.3.3.1 Recommendations ............................................................................................ 258 17.1.3.4 Migratory Birds Treaty Act 16 USC 703-712; The Bald and Golden Eagle Protection Act ........................................................................................................................... 259 17.1.3.4.1 Recommendations ............................................................................................ 259 17.1.4 State Statutes and Approvals ................................................................................ 260 17.1.4.1 Clean Water Act Section 401 .................................................................................... 260 17.1.4.1.1 Hydrologic Determination ................................................................................. 260 17.1.4.1.2 Recommendations ............................................................................................ 260 17.1.4.2 Clean Water Act Section 402 .................................................................................... 261 17.1.4.2.1 Recommendations ............................................................................................ 261 17.1.4.3 Tennessee Nongame and Endangered or Threatened Wildlife Species Conservation Act of 1974 .............................................................................................................. 261 17.1.4.3.1 Recommendations ............................................................................................ 262 17.1.4.4 Clean Air Act ............................................................................................................ 262 17.1.4.4.1 Recommendations ............................................................................................ 263 17.1.4.5 Tennessee Mineral Surface Mining Law .................................................................... 263 17.1.4.5.1 Recommendations ............................................................................................ 263 17.1.4.6 Water Resources Information Act ............................................................................. 263 17.1.4.6.1 Recommendations ............................................................................................ 263 17.1.5 Local Considerations ............................................................................................ 264 17.1.6 Mine Reclamation & Closure ................................................................................ 264 17.2 Mineral Separation Plant Site – Regulatory Approval Process ........................................ 264 17.2.1 Overview ............................................................................................................. 264 17.2.2 Baseline Studies ................................................................................................... 266 17.2.3 Federal Statutes and Approvals ............................................................................ 267 17.2.3.1 Clean Water Act Section 404 – Mineral Separation Plant Site ................................... 267 17.2.3.1.1 Recommendations ............................................................................................ 267 17.2.3.2 National Historical Preservation Act ......................................................................... 268 17.2.3.2.1 Recommendations ............................................................................................ 268 17.2.3.3 Endangered Species Act Section 7 or 10 ................................................................... 268 17.2.3.3.1 Recommendations ............................................................................................ 268 17.2.3.4 Migratory Birds Treaty Act 16 USC 703-712; The Bald and Golden Eagle Protection Act ........................................................................................................................... 269 17.2.4 State Statutes and Approvals ............................................................................... 269 17.2.4.1 Clean Air Act ............................................................................................................ 269 17.2.4.2 Clean Water Act Section 401 .................................................................................... 270 17.2.4.3 Tennessee Nongame and Endangered or Threatened Wildlife Species Conservation Act of 1974 .............................................................................................................. 270 TITAN PROJECT TENNESSEE, U.S. TECHNICAL REPORT SUMMARY ON FEASIBILITY STUDY Page 12 17.2.4.4 Clean Water Act Section 402 .................................................................................... 270 17.2.4.5 Tennessee Mineral Surface Mining Law .................................................................... 271 17.2.4.6 Safe Drinking Water Act of 1974 ............................................................................... 271 17.2.4.6.1 Recommendations ............................................................................................ 271 17.2.4.7 Water Resources Information Act ............................................................................. 271 17.2.4.8 Resource Conservation and Recovery Act ................................................................. 271 17.2.4.8.1 Recommendations ............................................................................................ 272 17.2.4.9 TDEC Rules Chapter 0400-20-10 – Licensing and Registration .................................. 272 17.2.4.9.1 Recommendations ............................................................................................ 272 17.2.5 Local Considerations ............................................................................................ 272 17.3 Summary and Conclusions for Mine Site and MSP Regulatory and Approval Process ..... 272 17.3.1 Mine and WCP Site .............................................................................................. 273 17.3.2 Mineral Separation Plant Site ............................................................................... 273 17.4 Waste and Tailings Disposal ........................................................................................... 274 17.4.1 Overview ............................................................................................................. 274 17.4.2 Tailings Placement ............................................................................................... 275 17.4.3 Tailings and Waste Material Characterization ...................................................... 275 17.5 Site Monitoring ............................................................................................................. 277 17.6 Partnership with University of Tennessee’s Institute of Agriculture ............................... 279 17.7 Community Relations .................................................................................................... 280 17.8 Social Considerations, Plans, Negotiations and Agreements .......................................... 285 17.8.1 Plans, Negotiations, or Agreements with Local Individuals or Groups .................. 285 17.8.2 Commitments to Ensure Loal Procurement and Hiring ......................................... 285 17.9 Qualified Person’s Opinion ............................................................................................ 286 18 Capital and Operating Costs ....................................................................................................... 287 18.1 Introduction .................................................................................................................. 287 18.2 Capital Cost Estimates ................................................................................................... 287 18.2.1 CAPEX General ..................................................................................................... 287 18.2.1.1 Introduction ............................................................................................................ 287 18.2.1.2 Working Capital and Sustaining Capital .................................................................... 287 18.2.1.3 Currency .................................................................................................................. 288 18.2.1.4 Engineering and Design ........................................................................................... 288 18.2.1.5 Capital Cost Estimate Inclusions ............................................................................... 288 18.2.1.6 Capital Cost Estimate Summaries ............................................................................. 289 18.2.2 Direct Cost Estimate ............................................................................................. 290 18.2.2.1 Bulk Materials and Equipment ................................................................................. 290 18.2.2.1.1 Structural Steel .................................................................................................. 290 18.2.2.1.2 Concrete ........................................................................................................... 291 18.2.2.1.3 Architecture ...................................................................................................... 291 18.2.2.1.4 Earthworks and Surface Water Drainage ........................................................... 292


TITAN PROJECT TENNESSEE, U.S. TECHNICAL REPORT SUMMARY ON FEASIBILITY STUDY Page 13 18.2.2.1.4.a. Bulk Earthworks Development ..................................................................... 292 18.2.2.1.4.b. Surface Water Drainage ............................................................................... 293 18.2.2.1.4.c. Roads and Access Infrastructure................................................................... 293 18.2.2.1.5 Mechanical Equipment ...................................................................................... 293 18.2.2.1.6 Platework .......................................................................................................... 294 18.2.2.1.7 Piping ................................................................................................................ 295 18.2.2.1.8 Electrical and Instrumentation & Control ........................................................... 296 18.2.2.1.9 Mine Development ............................................................................................ 296 18.2.2.1.10 Cranage for Module Installation ........................................................................ 297 18.2.2.1.11 Modular Installation Manhour Approach ........................................................... 297 18.2.2.2 Labor Rates.............................................................................................................. 297 18.2.2.3 Procurement Strategy .............................................................................................. 298 18.2.2.4 Freight ..................................................................................................................... 298 18.2.2.5 Growth Factors ........................................................................................................ 299 18.2.2.6 Productivity Factors ................................................................................................. 299 18.2.3 Indirect Cost Estimate .......................................................................................... 299 18.2.3.1 Engineering, Procurement, Construction, and Management .................................... 300 18.2.3.2 Temporary Facilities and Services ............................................................................ 300 18.2.3.3 Pre-Commissioning Contractor Support ................................................................... 300 18.2.3.4 Commissioning and Testing ..................................................................................... 300 18.2.3.5 First Fills .................................................................................................................. 300 18.2.3.6 Capital Spares .......................................................................................................... 301 18.2.3.7 Vendor Representatives........................................................................................... 301 18.2.4 Owner’s Costs ...................................................................................................... 301 18.2.5 Contingency ......................................................................................................... 301 18.3 Operating Cost Estimates .............................................................................................. 302 18.3.1 OPEX General ....................................................................................................... 302 18.3.2 Mining OPEX ........................................................................................................ 302 18.3.3 Process Plant OPEX .............................................................................................. 304 18.3.3.1 Power ...................................................................................................................... 305 18.3.3.2 Plant Labor .............................................................................................................. 305 18.3.3.3 Operating Spares and Consumables ......................................................................... 305 18.3.3.4 Plant Maintenance .................................................................................................. 305 18.3.3.5 Reagents and Utilities .............................................................................................. 306 18.3.3.6 Mobile Equipment ................................................................................................... 306 18.3.3.7 Laboratory ............................................................................................................... 306 18.3.3.8 General and Administration ..................................................................................... 306 18.3.4 Product Transport Cost ........................................................................................ 306 18.3.5 Royalties .............................................................................................................. 306 19 Economic Analysis ...................................................................................................................... 307 19.1 Introduction .................................................................................................................. 307 TITAN PROJECT TENNESSEE, U.S. TECHNICAL REPORT SUMMARY ON FEASIBILITY STUDY Page 14 19.2 DCF Methodology .......................................................................................................... 307 19.2.1 Key Assumptions .................................................................................................. 307 19.2.2 Revenue ............................................................................................................... 309 19.2.3 Taxes and Royalties .............................................................................................. 310 19.3 Financial Projections ...................................................................................................... 311 19.3.1 Summary ............................................................................................................. 311 19.3.2 Cash Flow ............................................................................................................. 311 19.3.3 Sensitivity Analysis ............................................................................................... 314 20 Adjacent Properties .................................................................................................................... 316 21 Other Relevant Data and Information ........................................................................................ 317 22 Interpretation and Conclusions .................................................................................................. 318 22.1 Introduction .................................................................................................................. 318 22.2 Property Setting ............................................................................................................ 318 22.3 Ownership ..................................................................................................................... 318 22.4 Mineral Tenure, Surface Rights, Water Rights, Royalties and Agreements ..................... 318 22.5 Geology and Mineralization ........................................................................................... 319 22.6 History ........................................................................................................................... 319 22.7 Exploration, Drilling, and Sampling ................................................................................ 320 22.8 Data Verification............................................................................................................ 320 22.9 Metallurgical Testwork .................................................................................................. 320 22.10 Mineral Resource Estimates .......................................................................................... 321 22.11 Mineral Reserve Estimates ............................................................................................ 321 22.12 Mining Methods ............................................................................................................ 322 22.13 Processing and Recovery Methods ................................................................................ 322 22.14 Infrastructure ................................................................................................................ 324 22.15 Market Studies .............................................................................................................. 324 22.16 Environmental, Permitting and Social Considerations .................................................... 325 22.17 Capital Cost Estimates ................................................................................................... 326 22.18 Operating Cost Estimates .............................................................................................. 326 22.19 Economic Analysis ......................................................................................................... 326 22.20 Risks .............................................................................................................................. 327 22.21 Opportunities ................................................................................................................ 328 22.21.1 Project Area ......................................................................................................... 328 22.21.2 Processing ............................................................................................................ 328 22.22 Conclusions ................................................................................................................... 329 23 Recommendations ..................................................................................................................... 330 TITAN PROJECT TENNESSEE, U.S. TECHNICAL REPORT SUMMARY ON FEASIBILITY STUDY Page 15 23.1 Mining ........................................................................................................................... 330 23.2 Processing ..................................................................................................................... 331 23.2.1 Recommendations ............................................................................................... 331 23.2.1.1 Recommended Metallurgical Testwork .................................................................... 332 23.2.1.2 Feed Preparation Plant ............................................................................................ 332 23.2.1.3 Tailings Dewatering Circuit ...................................................................................... 332 23.2.1.4 Wet Concentrator Plant and Concentrate Upgrade Plant ......................................... 333 23.2.2 Estimated Cost of Process Recommendations ...................................................... 333 24 References .................................................................................................................................. 334 24.1 Bibliography .................................................................................................................. 334 24.2 Abbreviations, Acronyms and Units of Measure ............................................................ 335 24.3 Glossary of Terms .......................................................................................................... 339 25 Reliance on Information Provided by the Registrant ................................................................. 343 List of Figures (in Report) Figure 1-1: Titan Mine Production Timing Map ................................................................................... 34 Figure 1-2: Annual Ore Production Tonnes and THM% ........................................................................ 35 Figure 1-3: FS Process Flowsheet – Block Flow Diagram (FPP, TDC, WCP & CUP) ................................. 38 Figure 1-4: FS Process Flowsheet – Block Flow Diagram (REP & MSP) .................................................. 39 Figure 1-5: Mineral Sands Products Pricing Forecast (US$/t, Real 2026) .............................................. 42 Figure 1-6: TREO Basket Price and HREC Price Forecast (US$/kg, Real 2026) ....................................... 43 Figure 1-7: Titan Project After Tax Real Cash Flows ............................................................................. 48 Figure 1-8: Titan Project Sensitivity Analysis – After Tax IRR ................................................................ 48 Figure 1-9: Titan Project Sensitivity Analysis – After Tax NPV8 ............................................................ 49 Figure 3-1: Titan Property Location ..................................................................................................... 60 Figure 3-2: Study Area ......................................................................................................................... 61 Figure 3-3: Parcels Status of the Study Area ........................................................................................ 64 Figure 6-1: East Gulf Plain ................................................................................................................... 70 Figure 6-2: Regional Geologic Map Encompassing Titan Project .......................................................... 71 Figure 6-3: Idealized Stratigraphic Column .......................................................................................... 72 Figure 6-4: Example of Mineralization in Relation to Stratigraphy ........................................................ 74 Figure 7-1: Titan Exploration Drilling Summary in Study Area .............................................................. 77 Figure 7-2: Bulk Sample Location Map ................................................................................................. 79 Figure 7-3: Groundwater and Surface Water Sampling Locations ........................................................ 83 Figure 7-4: Groundwater Model Area for 2022 HDR Model (Yellow) Compared to 2026 HDR Model (Blue) ............................................................................................................................... 87 Figure 7-5: Graph of Estimated Mine Inflow Over Life of Mine ............................................................ 89 Figure 7-6: Site-Wide Water Balance for 400 tph Production (Mine Years 1 through 4) ....................... 91 Figure 7-7: Site-Wide Water Balance for 1,200 tph Production (Mine Years 5 through 14) .................. 92 Figure 7-8: Geotechnical Drill Location Map ........................................................................................ 94 Figure 8-1: Summary of Analysis Process ........................................................................................... 100 Figure 10-1: 2021 Metallurgical Testwork Block Flow Diagram .......................................................... 106 TITAN PROJECT TENNESSEE, U.S. TECHNICAL REPORT SUMMARY ON FEASIBILITY STUDY Page 16 Figure 10-2: 2023 Feed Preparation and Wet Gravity Processing Testwork Block Flow Diagram........ 110 Figure 10-3: 2023 Fine Mineral Separation Testwork Block Flow Diagram ......................................... 112 Figure 10-4: Coarse Mineral Separation Testwork Block Flow Diagram .............................................. 114 Figure 10-5: Proposed Flowsheet Based on Metallurgical Testwork ................................................... 115 Figure 11-1: Study Area and Cross Section Locations ......................................................................... 119 Figure 11-2: Model Cross Section A ................................................................................................... 120 Figure 11-3: Model Cross Section B ................................................................................................... 120 Figure 11-4: McNairy Formation THM% and Thickness ...................................................................... 121 Figure 11-5: Data Domain ................................................................................................................. 123 Figure 11-6: Block Model Profile A-A’ Colored by Geologic Units ....................................................... 125 Figure 11-7: THM% Profiles A-A’ and C- C’ ......................................................................................... 127 Figure 11-8: Resource by Classification.............................................................................................. 129 Figure 11-9: Grade Cutoff vs. Tonnage Curve .................................................................................... 131 Figure 13-1: Pit Slope Geometric Parameters ..................................................................................... 140 Figure 13-2: RS2 Pit Wall Seepage Modelling – Horizontal and Vertical Hydraulic Conductivity Inputs ............................................................................................................................. 141 Figure 13-3: RS2 Pit Wall Seepage Modelling – Sequenced Model Results for Water Surface Changes Over Time with Only Pit Excavation .................................................................. 141 Figure 13-4: RS2 Pit Wall Seepage Modelling – Sequenced Model Results for Water Surface Changes Over Time with Pit Perimeter Pumping Well and Pit Excavation ....................... 142 Figure 13-5: Approximate Total Wall Height Variations ..................................................................... 143 Figure 13-6: Pit Wall Contours for 3D Slope Stability Model of Western Side of Overall Pit ............... 144 Figure 13-7: Western Pit Wall Depiction in 3D Slope Stability Modelling Software (SLIDE3) .............. 144 Figure 13-8: Western Pit Wall Depiction in 3D Slope Stability Modelling Software (SLIDE3) .............. 145 Figure 13-9: Example Photograph 1 of Working Face Excavation into Overburden and Upper McNairy ......................................................................................................................... 146 Figure 13-10: Example Photograph 2 of Working Face Excavation into Overburden and Upper McNairy ......................................................................................................................... 146 Figure 13-11: Example Photograph 3 of Working Face Excavation into Overburden and Upper McNairy ......................................................................................................................... 147 Figure 13-12: Example Topographic Section Line through 40-Foot Highwall at Nearby Excavation into Upper McNairy ........................................................................................................ 148 Figure 13-13: Example Screen Shot of 3-D Modeling of Backfilled Tailings Assuming Reduced Strength Due to Potential Less-than-Optimal Compaction (Potential Failure Surface with Water Level at 30 feet deep and Seepage at Toe of Tailings) .................................. 150 Figure 13-14: Mining Method Selection Decision Matrix ................................................................... 152 Figure 13-15: Waste & ROM Pile Plan and Profile Views .................................................................... 153 Figure 13-16: Schematic Pit Diagram ................................................................................................. 154 Figure 13-17: Year 1 Mine Pit, ROM Pile, Waste Pile and Backfill Surfaces ......................................... 155 Figure 13-18: Year 4 Mine Pit, ROM Pile, Waste Pile and Backfill Surfaces ......................................... 156 Figure 13-19: Year 11 Mine Pit, ROM Pile, Waste Pile and Backfill Surfaces ....................................... 157 Figure 13-20: Year 14 Showing Final LOM Backfill Surfaces ............................................................... 158 Figure 13-21: Typical Roadway Design............................................................................................... 160 Figure 13-22: Internal Haulage Road Network ................................................................................... 160 Figure 13-23: Titan Mine LOM Production Timing Map ..................................................................... 161


TITAN PROJECT TENNESSEE, U.S. TECHNICAL REPORT SUMMARY ON FEASIBILITY STUDY Page 17 Figure 13-24: Annual Ore Production Tonnes and THM% .................................................................. 162 Figure 13-25: Year 01 Mine Plan Surfaces .......................................................................................... 164 Figure 13-26: Year 02 Mine Plan Surfaces .......................................................................................... 165 Figure 13-27: Year 03 Mine Plan Surfaces .......................................................................................... 166 Figure 13-28: Year 04 Mine Plan Surfaces .......................................................................................... 167 Figure 13-29: Year 05 Mine Plan Surfaces .......................................................................................... 168 Figure 13-30: Year 06 Mine Plan Surfaces .......................................................................................... 169 Figure 13-31: Year 07 Mine Plan Surfaces .......................................................................................... 170 Figure 13-32: Year 08 Mine Plan Surfaces .......................................................................................... 171 Figure 13-33: Year 09 Mine Plan Surfaces .......................................................................................... 172 Figure 13-34: Year 10 Mine Plan Surfaces .......................................................................................... 173 Figure 13-35: Year 11 Mine Plan Surfaces .......................................................................................... 174 Figure 13-36: Year 12 Mine Plan Surfaces .......................................................................................... 175 Figure 13-37: Year 13 Mine Plan Surfaces .......................................................................................... 176 Figure 13-38: Year 14 Mine Plan Surfaces .......................................................................................... 177 Figure 13-39: Example of Interburden Areas ..................................................................................... 178 Figure 14-1: Block Flow Diagram (FPP, TDC, WCP CUP) ..................................................................... 182 Figure 14-2: FS Process Flowsheet – Block Flow Diagram (REP & MSP) .............................................. 183 Figure 14-3 - WCP Site Layout 3D Model ............................................................................................ 189 Figure 14-4: Mining Unit Plants 3D Model ......................................................................................... 190 Figure 14-5: FPP Feed Screens 3D Model........................................................................................... 191 Figure 14-6: 400 tph WCP Spiral Building 3D Model .......................................................................... 194 Figure 14-7: CUP and HMC Dewatering 3D Model ............................................................................. 195 Figure 14-8: TDC Buildings 3D Model ................................................................................................ 197 Figure 14-9: Settling and Process Water Ponds and Process Water Pumps 3D Model........................ 198 Figure 14-10: MSP Site Boundary ...................................................................................................... 199 Figure 14-11: MSP Site Layout 3D Model ........................................................................................... 201 Figure 14-12: REP Building Layout 3D Model ..................................................................................... 202 Figure 14-13:- HMC (REP Feed) Stockpile and Reclaim Circuit 3D Model ............................................ 203 Figure 14-14: REP Feed Antirationing Circuit 3D Model ..................................................................... 204 Figure 14-15: REP Feed Desliming Circuit 3D Model .......................................................................... 205 Figure 14-16: REP Flotation Circuit 3D Model .................................................................................... 206 Figure 14-17: MSP Rejects Scavenger Spirals and REP Shaking Tables 3D Model ............................... 207 Figure 14-18: MSP Rejects Reclaim Circuit 3D Model ........................................................................ 208 Figure 14-19: MSP Rejects Scavenger Spiral Separation Circuit 3D Model ......................................... 209 Figure 14-20: HREC Product Dewatering and Packaging Circuits 3D Model........................................ 210 Figure 14-21: REP HMC Dewatering and Stockpiling Circuits 3D Model ............................................. 211 Figure 14-22: REP HMC Dewatering and Stockpiling Circuits 3D Model ............................................. 212 Figure 14-23: REP Process Water Circuit 3D Model ........................................................................... 213 Figure 14-24: REP Reagents Circuit 3D Model .................................................................................... 214 Figure 14-25: MSP Buildings – Elevation 3D Model ............................................................................ 216 Figure 14-26: MSP Buildings – Plan View 3D Model ........................................................................... 217 Figure 14-27 - MSP Feed Dryer 3D Model........................................................................................... 218 Figure 14-28: MSP PDC 3D Model ..................................................................................................... 219 Figure 14-29: MSP PNCC 3D Model ................................................................................................... 220 TITAN PROJECT TENNESSEE, U.S. TECHNICAL REPORT SUMMARY ON FEASIBILITY STUDY Page 18 Figure 14-30: MSP PCC 3D Model ...................................................................................................... 222 Figure 14-31: MSP Product Storage and Loadout Area 3D Model ...................................................... 223 Figure 15-1: Titan Project Mine Site .................................................................................................. 226 Figure 15-2: Titan FS Overall Site Layout ........................................................................................... 227 Figure 15-3: Overview of Belt Corridor .............................................................................................. 228 Figure 15-4: Yearly ROM Stockpile Locations ..................................................................................... 229 Figure 15-5: WCP Geotech Bore Locations ........................................................................................ 233 Figure 15-6: Proposed Freshwater Withdrawal Location ................................................................... 235 Figure 15-7: Year 14 Showing Finalized Mine Plan LOM Backfill Surfaces .......................................... 237 Figure 16-1: Titanium Feedstock Supply & Demand (Million TiO2 Units) ............................................ 245 Figure 16-2: Magnet REO Market Supply / Demand Balance (t) ......................................................... 247 Figure 16-3: Mineral Sands Products Pricing Forecast(US$/t, Real 2026) ........................................... 248 Figure 16-4: TREO Basket Price and HREC Price Forecast (US$/kg, Real 2026) .................................... 250 Figure 17-1: Mine and WCP Site Boundaries ..................................................................................... 255 Figure 17-2: Mineral Separation Plant Boundary ............................................................................... 265 Figure 17-3: Map of Mine Plan Sequence Indicating Locations for Temporary Waste Piles ................ 275 Figure 19-1: Titan Project Production Profile ..................................................................................... 309 Figure 19-2: Titan Project Revenue by Product % .............................................................................. 310 Figure 19-3: Titan Project After Tax Real Cash Flows ......................................................................... 312 Figure 19-4: Titan Project Sensitivity Analysis – After Tax IRR ............................................................ 314 Figure 19-5: Titan Project Sensitivity Analysis – After Tax NPV8......................................................... 314 List of Tables (in Report) Table 1-1: Assumptions Used in Defining Prospects of Economic Extraction ........................................ 28 Table 1-2: Mineral Resource Estimate and Total Heavy Minerals (THM) Assemblage .......................... 29 Table 1-3: Optimization Parameters .................................................................................................... 30 Table 1-4 - Titan Project – Estimate of Mineral Reserves, ROM Basis ................................................... 32 Table 1-5: Capital Cost Summary (Phase 1 – 400 tph and Phase 2 – incremental 800 tph) ................... 45 Table 1-6: Operating Costs Summary .................................................................................................. 46 Table 1-7: FS Financial Results ............................................................................................................. 47 Table 2-1: QPs Responsible by Section ................................................................................................ 57 Table 2-2: KGS Site and Laboratory Visits Summary ............................................................................. 58 Table 3-1: Property Land List ................................................................................................................ 62 Table 7-1: Titan Exploration Drilling Summary ..................................................................................... 76 Table 7-2: Geotechnical Characterization Summary by Geologic Unit .................................................. 96 Table 8-1: Unit Density Summary ........................................................................................................ 99 Table 11-1: Lower McNairy THM% Sill Range .................................................................................... 124 Table 11-2: Table of Search Regions for Grade Estimations ............................................................... 126 Table 11-3: Sources of Uncertainties Considered During Confidence Classification ........................... 130 Table 11-4: In-situ Resource Summary Table by Formation (0.4 THM% COG) .................................... 130 Table 11-5: In-situ THM Assemblage Summary, by 0.4 THM% COG .................................................... 131 Table 11-6: Assumptions Used in Defining Reasonable Prospects of Economic Extraction ................. 132 Table 11-7: Mineral Resource Estimate and Total Heavy Minerals Assemblage .................................. 133 Table 12-1: Optimization Parameters ................................................................................................ 136 TITAN PROJECT TENNESSEE, U.S. TECHNICAL REPORT SUMMARY ON FEASIBILITY STUDY Page 19 Table 12-2: Titan Project – Estimate of Mineral Reserves, ROM Basis................................................ 137 Table 13-1: Required Equipment to be Provided by Contractors ....................................................... 159 Table 13-2: LOM Production Schedule............................................................................................... 163 Table 15-1: Additional Main Belt Lengths Necessary and Associated Years........................................ 229 Table 15-2: Non-Process Infrastructure ............................................................................................. 236 Table 15-3: Tailings and Wast Material Balance (volumes in cubic meters) ....................................... 238 Table 16-1: Titan FS Production Forecast........................................................................................... 243 Table 16-2: Titan FS Product Estimated Specifications ....................................................................... 243 Table 16-3: Titan HREC Estimated TREO Distribution (%) ................................................................... 244 Table 16-4: Historic and Forecast Prices (US$/t, real 2026 terms) ..................................................... 250 Table 16-5: Historic and Forecast REO Prices (US$/kg, real 2026 terms) ............................................ 251 Table 17-1: Titan Minerals IperionX Environmental Permits Required for the Proposed Mine Site .... 256 Table 17-2: Titan Minerals IperionX Potential Environmental Permits/Authorizations for the MSP Site* ............................................................................................................................... 266 Table 17-3: Summary of Acid-Base Accounting (ABA) Test Results .................................................... 276 Table 17-4: Summary of TCLP Testing with EPA D List “Toxicity” Threshold Values............................. 277 Table 17-5: Monitoring Point Summary for Current NPDES Permit (TN0070711) ............................... 278 Table 17-6: Outfall Locations for Current NPDES Permit (TN0070711) ............................................... 278 Table 17-7: Wastewater Limitations for NPDES Outfalls as Defined in Current Permit ........................ 278 Table 17-8: Stormwater Discharge Requirements .............................................................................. 279 Table 17-9: Community Relations Activities List ................................................................................ 281 Table 18-1: Currency Conversion Rates ............................................................................................. 288 Table 18-2: Capital Cost Summary (Phase 1 – 400 tph and Phase 2 – Incremental 800 tph) ............... 289 Table 18-3: Operating Cost Estimate Summary ................................................................................. 302 Table 18-4: Summary of Mine Contractor Services from RFP dated February 20, 2026...................... 302 Table 18-5: Summary of Mining Labor Cost (Not included in Contract Mining) .................................. 304 Table 18-6: LOM Mining Operating Cost Summary ............................................................................ 304 Table 18-7: Process Plant Operating Cost Summary .......................................................................... 304 Table 19-1: Key Milestones ............................................................................................................... 307 Table 19-2: Key Financial Assumptions .............................................................................................. 308 Table 19-3: Key Production Inputs ..................................................................................................... 308 Table 19-4: Product Revenue Forecast .............................................................................................. 309 Table 19-5: FS Financial Results ......................................................................................................... 311 Table 19-6: Annual Cash Flow............................................................................................................ 313 Table 24-1: Abbreviations, acronyms, and units of measure. ............................................................. 335 Table 25-1: Information from Registrant Relied Upon by QPs ............................................................ 343 TITAN PROJECT TENNESSEE, U.S. TECHNICAL REPORT SUMMARY ON FEASIBILITY STUDY Page 20 1 Executive Summary 1.1 Introduction This Feasibility Study (the FS or the Study) on the Titan Project (the Project) was prepared for IperionX Limited (IperionX) by Marshall Miller & Associates, Inc. (MM&A). While MM&A fulfilled the responsibility as the integrator of the FS, other consulting firms also completed vital aspects of the Study. Karst Geo Solutions, LLC (KGS) was responsible for exploration results for the Project. Mineral Technologies Pty Ltd (MT) completed the process plant design and related modular plant cost estimation, Primero Group Americas Inc. (Primero) completed the non-process infrastructure (NPI) design and related cost estimates, and was responsible for integrating the mining, process and NPI costs into a comprehensive discounted cash flow financial model for the FS. The Project is located near Camden, Tennessee in the United States (US). Per the definitions in Section 24.3, a “feasibility study” is equivalent to a “definitive feasibility study”. 1.2 Terms of Reference Mineral Resources and Mineral Reserves in this Technical Report Summary (TRS) are reported for the Titan deposit using the definitions in Regulation S-K 1300 (S-K 1300), under Item 1300 promulgated by the US Securities and Exchange Commission (SEC). The TRS was prepared to be attached as an exhibit to support mineral property disclosure, including mineral resource estimates, for the Titan Project as at June 4, 2026. Herein, the Study Area stated mineral resource area and mineral resource, and mineral reserve estimates are restricted to Project parcels of the Titan properties formerly identified as Little Benton. The Project resource and reserve area is identified in Figure 3-2 below. All units of measurement used in this report use the International System of Units (SI) metric system unless otherwise stated. Mineral resources are reported in metric tonnes. Million metric tonnes are reported as “Mt” throughout. Currency is expressed in United States dollars (US$) as identified in the text. The Report uses US English. 1.3 Property Description and Ownership The Titan Project is located near Camden, Tennessee, US, approximately 128 kilometers (km) (80 miles) west of Nashville, Tennessee and approximately 11 km (7 miles) northwest of Camden, Tennessee. The Study Area is centered at approximately 36.147349N, -88.20974W. The Project is located on the Mansfield, Manleyville, Vale and Bruceton US Geological Survey (USGS) Quadrangles. The Project is owned by IperionX Critical Minerals, LLC (IXCM), a wholly owned subsidiary of IperionX.


TITAN PROJECT TENNESSEE, U.S. TECHNICAL REPORT SUMMARY ON FEASIBILITY STUDY Page 21 As at June 4, 2026 , the Titan Project comprised approximately 40.8 square kilometers (km2) (10,091 acres) of surface and associated mineral rights in Tennessee, of which approximately 6.0 km2 (1,490 acres) are owned by IperionX, approximately 5.9 km2 (1,457 acres) are subject to long-term lease by IperionX, and approximately 28.9 km2 (7,144 acres) are subject to exclusive option agreements with IperionX. These exclusive option agreements, upon exercise, allow IperionX to the surface property and associated mineral rights. IperionX has acquired surface, subsurface and water rights to the properties within the resource area. For the optioned and leased land, IperionX will pay the landowner the greater of 1) US$75 per acre of the property per year, or 2) the production royalty, generally 5% of net revenues from products mined and removed from the property. All properties owned by IperionX or its subsidiary (TN Exploration, LLC) will not incur a royalty. There are no known encumbrances. 1.4 Accessibility, Climate, Local Resources, Infrastructure and Physiography General access to the Study Area is via a well-developed network of primary and secondary roads. The Study site can be accessed via Highway 641 north 41.0 km (25.5 miles) from Interstate 40 near the town of Camden, Tennessee, Reynoldsburg Road for 1.6 km (1.0 mile), Pleasant Hill Road for 1.6 km (1.0 mile) and the Little Benton Road, a gravel road, for 4.8 km (3.0 miles). Little Benton Road goes through the Study Area. The climate is temperate with warm summers and cold winters including the potential for snow and ice. Annual rainfall for the area is 136.6 centimeters (cm) (54 inches). It is expected that any future mining activity will operate year-round. The existing infrastructure includes power and gas, with 161-kilovolt (kV) transmission lines near the Project area. IperionX intends to implement fully renewable power sourcing options for the Titan Project, including the assessment of existing on-grid solutions currently provided by existing power generators and suppliers in the general Study Area. Additional communications will be required with the Tennessee Valley Authority (TVA), local power supplier, and gas suppliers. Water supply could be sourced from nearby surface water bodies or from shallow groundwater sources. Personnel are assumed to live in surrounding communities. No accommodations camp would be required. Local active sand mining, gravel mining and timber operations could be sources of recruiting experienced operators. 1.5 History No previous heavy mineral sands mining has occurred in the region. TITAN PROJECT TENNESSEE, U.S. TECHNICAL REPORT SUMMARY ON FEASIBILITY STUDY Page 22 The general Titan Project area has been explored for heavy mineral sands since the 1950s as the McNairy Formation was known to contain high concentrations of heavy minerals based on work by federal and state agencies. DuPont de Nemours, Inc., Kerr-McGee Corporation, RGC Mineral Sands Inc., Iluka Resources Inc., Altair International Inc., and Astron Corporation Limited are known to have evaluated the McNairy Formation deposits in the Titan Project region at various times. 1.6 Geological Setting, Mineralization, and Deposit Heavy mineral sands are created through physical and mechanical concentration of detrital minerals liberated through weathering. This weathering portion of this process occurs inland, while the deposition of these minerals ultimately occurs along coastlines through features such as deltas, foreshore, shoreface, barrier islands, dunes, and tidal lagoons. The Study Area location in western Tennessee represents the eastern flank of the Mississippi Embayment, a large, southward-plunging syncline within the Gulf Coastal Plain. The McNairy Formation represents a pro-grading deltaic environment during a regressive marine sequence. This deposition model is supported by the coarsening upward sequence grading from the glauconitic clay-rich Coon Creek Formation to the finer grained lower member of the McNairy Formation to the coarser grained upper member of the McNairy Formation. The main mineralized zone at the Study Area is hosted stratigraphically in the lower member of the McNairy Formation, which dips gently to the west in the Study Area. The upper zone is also mineralized in some areas. Mineralization in the lower member had been traced at the TRS date, for over 6.0 km along strike. The base of mineralization range is relatively level from 81 meters (m) to 112 m (266 feet to 367 feet) above current sea level. Mineralization varies from 5 m to 67 m (16 feet to 220 feet) thick and averages 28 m (92 feet) in thickness. Mineralization primarily occurs in two zones within the McNairy Formation. The main mineralized zones are interrupted by low-grade sand. The primary minerals associated with the mineralized horizons are altered ilmenite, zircon, rutile, staurolite, kyanite, monazite and xenotime. The Gangue minerals are predominantly quartz and clays. Though extensive basement faulting is present in the region, it does not appear to impact the stratigraphy at the scale of this Project. 1.7 Exploration Drilling Drilling on the Study Area comprises 156 drill holes. This includes 16 reverse circulation holes (total drilled length of 837 m or 2,746 feet) and 140 roto-sonic drill holes (total drilled length of 5,644 m or 18,517 feet). Across all Titan properties, including those outside of the Study, IperionX has drilled 313 holes (total drilled length of 11,382 m or 37,343 feet). All exploration drilling was completed by IperionX. TITAN PROJECT TENNESSEE, U.S. TECHNICAL REPORT SUMMARY ON FEASIBILITY STUDY Page 23 The area covered by the drilling is roughly 6.6 km (4.1 miles) (north-south) by 3.7 km (2.3 miles) (east- west); the area that hosts the mineral resource estimate is further broken up into several areas based on land holdings (land agreements). These range from 1.58 hectare (ha) (3.9 acres) for the smallest area to 161 Ha (397 acres) for the largest area. Drill hole spacing is generally 150 x 300 m (492 x 984 feet). Some areas have difficult access and drill spacing in those areas is wider spaced, approximately up to 300 x 600 m (984 x 1,969 feet). There are an additional 11 roto-sonic drill holes completed as part of a hydrogeological study by HDR Engineering, Inc. (HDR). These holes were drilled on IperionX’s behalf. In 2025, an additional 62 holes were drilled by S&ME, Inc. (S&ME) for geotechnical evaluations. A total of 89 drill holes were excluded from mineral resource estimation. They included 11 holes that were drilled in association with a hydrogeological study, the 62 holes drilled for geotechnical studies which were drilled concurrent with the development of the geological model in 2025 and 16 reverse circulation drill holes because of the high likelihood of down-hole sample contaminations. Drill companies included M&W Drilling of Knoxville, Tennessee; Drillwise USA of Holladay, Tennessee; and Betts Drilling of Atlanta, Georgia. Drill rigs included a Geoprobe 5140LS roto-sonic drill rig (Geoprobe) a Terrasonic 150c rig (Terrasonic), and a Wallis RC rig (Wallis). The Geoprobe core barrel was 3 m (9.8 feet) long, and 10 cm (3.9 inches) in diameter with a 15-cm (5.9 inches) diameter outer casing. The Terrasonic core barrel was 3 m (9.8 feet) long and had a 10-cm (3.9 inches) diameter core barrel. Drill casing was used periodically when re- entering drill holes that had caved. Select drill holes were re-drilled and re-analyzed as part of data validation. All drilling for the Study Area that is used in mineral resource estimation has been roto-sonic. This method alternates advancement of a core barrel and a removeable casing (casing is used when needed to maintain sample integrity). The sonic drilling method has been shown to provide representative unconsolidated mineral sands samples across a variety of deposits as it is a direct sampling method of the formation(s). At times, water is used to create a head to reduce the expansion of the clay-rich Coon Creek Formation sediments. Expansion of the Coon Creek Formation lithologies by up to 0.9 m (2.9 feet) length in the core barrel has been observed. In the field, procedures included coring 3-m (9.8 feet) sections of material at a time with the Geoprobe. Drill teams set the rig on the proposed drill sites, and each hole was drilled at a 90-degree angle, which is essentially perpendicular to mineralization. Generally, holes are drilled without the use of water and typically without the use of casing. After each 3-m (9.8 feet) section was extracted, drill teams recovered the core in equal length plastic sleeves. Geologists then divided the core into two 1.5-m (4.9 feet) sections that were analyzed for lithologic significance and heavy mineral potential. TITAN PROJECT TENNESSEE, U.S. TECHNICAL REPORT SUMMARY ON FEASIBILITY STUDY Page 24 After termination, holes were backfilled, and global positioning system coordinates were taken once the rig was moved from the hole. Field notes were recorded in the database. At times, water was used during drilling to create a head on the formation by lubricating the hole. This assisted in allowing core to be brought to the surface. However, it can inadvertently also create a more homogenized core, which may not reflect the subsurface. 1.8 Sample Preparation, Analyses, and Security Geoprobe drill core samples, typically 3 m (9.8 feet) in length, were collected directly from the plastic sample sleeves at the drill site. Some interpretation was involved as the material could expand or compact as it was recovered from the core barrel into the plastic sleeve. Samples were collected at regular 1.5-m (4.9-foot) intervals unless geological contacts were encountered. Sample length ranged from 0.3 m (1.0 foot) to 4.5 m (14.8 feet). The unconsolidated sonic cores were sampled by splitting the core in half lengthwise using a machete, then recovering an even split with a trowel along the entire length of the sample interval. The sample volume weights were about 2 kilograms (kg) (4.4 pounds (lbs)) and were appropriate for the analytical method(s) being used. Samples were collected directly to pre-labeled/pre-tagged sample bags; the remaining sample was further split into a replicate/archival sample. What sample remained after these steps was used to backfill the drill hole. Sample bags were sealed with a zip tie at the drill site, placed in rice bags, and remained in the custody of the field geologist from time of collection until delivery to the Project’s temporary storage location. This was either a secure third-party storage unit or a leased barn. A red security tag was used to secure the top of each rice bag, and these tags were verified by the laboratory to confirm all sample bags were intact when received by the laboratory. Drill samples were sent to the SGS facility in Lakefield, ON, Canada and Bureau Veritas in Perth, Australia. SGS is a qualified third-party laboratory that is independent of IperionX. SGS Lakefield is accredited as an ISO 17025 facility for selected analytical techniques. Samples were subjected to standard mineral sand industry assay procedures of size fraction analysis, heavy-liquid separation, and chemical analysis. Accuracy monitoring was addressed by submission of in-house heavy mineral sands standards developed specifically for the Project. There is no commercially available standard reference material for heavy mineral sands. It is a common practice within heavy mineral sands exploration and operations to generate standards that represent a matrix match to the target material being analyzed.


TITAN PROJECT TENNESSEE, U.S. TECHNICAL REPORT SUMMARY ON FEASIBILITY STUDY Page 25 1.9 Data Verification IperionX was engaged with KGS who conducted several site visits throughout the drilling campaigns, visited the MT laboratory and SGS Lakefield and observed metallurgical testing programs. KGS reported that “The site visits provided visual confirmation of mineralization, drill hole locations, bulk sample collection and logging and sampling procedures. KGS is satisfied with the metallurgical testing procedures as witnessed during the Mineral Technologies laboratory inspection. The laboratory procedures witnessed during the KGS inspection of SGS Lakefield are considered acceptable.” KGS provided IperionX with training on logging, sampling, material interpretations, and density measurements. KGS and IperionX staff had regular database validations to ensure data quality was sufficient. MM&A was introduced to the Titan Project after the exploration drilling was completed. QPs from MM&A conducted a site visit to the Project area on April 15th and 16th of 2025. Led by IperionX personnel, MM&A explored the Study Area, visited McNairy Formation outcrops and exploration hole locations, reviewed chip trays with sands collected from exploration hole sample intervals and observed the sample storage barrels. At the time of the visit, S&ME geotechnical drilling was in progress. At the working drill rig, MM&A observed and collected samples from the Upper and Lower McNairy Formations and the Coon Creek Formation. 1.10 Mineral Processing and Metallurgical Testing Two testwork programs were conducted for the mineral resource area, one in 2021 and the second in 2023. All testwork was completed on behalf of IperionX. Testwork was completed by, or under, the supervision of MT. The company is a reputable testing organization, with laboratories with significant experience in mineral sands flowsheet development located in Florida, and in Queensland, Australia. The laboratories are ISO 9001, 45001 and 14001 accredited. MT is independent of IperionX. A portion of the testwork was completed at IperionX’s Camden mineral demonstration facility, under the supervision of MT personnel. Neither facility is accredited for metallurgical testwork procedures; this is routine for metallurgical testing facilities as there is not currently an organization that certifies laboratories specifically for metallurgical testwork. Assays were conducted by SGS Lakefield, and Bureau Veritas in Perth, Australia, using X-ray fluorescence (XRF), laser ablation/inductively-coupled plasma mass spectrometry (ICP–MS) and quantitative evaluation of materials by scanning electron microscopy (QEMSCAN) analytical methods. Bureau Veritas is independent of IperionX and holds ISO 17025 accreditations for selected analytical techniques. The final products, ilmenite, rutile, zircon, rare earth mineral concentrate, were produced from the 2023 testwork. Ilmenite graded 64.9% TiO2, and the rutile graded 91.2% TiO2. The zircon graded 66.8% ZrSiO4. The rare earth mineral concentrate had a total rare earth oxide (TREO) grade of 59.1%. The product grades generally align with 2021 scoping testwork results and were considered to be saleable products. TITAN PROJECT TENNESSEE, U.S. TECHNICAL REPORT SUMMARY ON FEASIBILITY STUDY Page 26 The testwork showed that high-quality ilmenite, rutile, zircon products could be achieved using conventional separation equipment through a typical wet concentrator plant (WCP), and fine and coarse mineral separation plant (MSP) flowsheet. A rare earth mineral concentrate product was created at a high monazite recovery using a wet rare earth mineral concentrate circuit. Circuit simulation models were generated for the wet concentration plant, rare earth mineral plant, and mineral separation plant flowsheets to evaluate recycled streams and resultant mass flows. The expected future performance of the processing plant was based on metallurgical testwork results and benchmarked against other deposits that have similar characteristics to the Titan deposit. The simulated recoveries for in-size samples (+45-micron material) from ROM to products are: rare earth mineral recovery of 82.6%; ilmenite recovery of 79.7%; rutile recovery of 66.9%; zircon recovery of 77.6%. The three variability samples used in the 2023 metallurgical testwork were composite samples representative of the different types and styles of mineralization within the Titan deposit. The variability bulk samples included coarse- and fine-grained mineralization as well as areas of differing assemblage. 1.11 Mineral Resource Estimates 1.11.1 Estimation Methodology The resource database contains sonic drill data collected in years 2020, 2021 and 2022. Data are from 140 drill holes with 5,123 m (16,808 feet) drilled and 3,360 total heavy mineral assay samples (heavy liquid) and 269 total HMC mineralogy (QEMSCAN) determinations. Geological interpretations were compiled using Vulcan software version 2025.1, as was variography and grade interpolation for this TRS. A parent block size of 25 x 25 x 1.524 (Xm x Ym x Zm) was used. This smallish block size for the Project hole spacing was utilized to accommodate greater refinement of pit optimization and pit shell development. No block sub-cells were used. The geological model was based on the geological interpretations of lithology and mineralization from recorded downhole drill records. Using cross section analysis, MM&A verified the continuity of recorded lithologic units. MM&A interpreted five lithological units. The McNairy Formation Upper and Lower units were the units with the largest volumes; the fine-grained Lower McNairy unit was preferentially mineralized with respect to heavy minerals. MM&A modeled an overburden zone, a ‘waste’ material zone overlying the Upper McNairy and beneath the recorded overburden, the Upper McNairy member, the Lower McNairy member, and the Coon Creek Formation zone. The topsoil profile on the property is too thin to separate with the selected vertical block size and is captured in the overburden thickness. The Lower McNairy unit accounts for most of the mineralized volume at approximately 68%, the remaining 32% percent of mineralized material is captured TITAN PROJECT TENNESSEE, U.S. TECHNICAL REPORT SUMMARY ON FEASIBILITY STUDY Page 27 within the Upper McNairy Formation zone. No grade was attributed to the soil or Coon Creek Formation zones. MM&A compared unit horizons, thickness isopachs, block slices, and sections with logged data from drill holes to verify an acceptable three-dimensional (3-D) interpretation of the lithology and mineral type records. Testing for bulk density was performed by S&ME from samples collected from drilling. ASTM International (ASTM) analysis involved drying and weighing the samples to calculate the percent moisture and weighing. The density value was developed from a collection of 17 samples from both the Upper and Lower McNairy Formation sand units. Bulk density measurements collected range between 1.39 tonnes per cubic meter (t/m3) and 1.76 t/m3. The soil density analyses show the Upper McNairy and Lower McNairy units have a consistent average density of 1.57 grams per cubic centimeter (g/cm³) which were used for the resource evaluation. No total heavy mineral top cut was used, nor was it considered necessary for this deposit due to the geology, style, and consistency of mineralization. Variograms were run to test spatial continuity within the selected geological domains. Grade, slimes, and assemblage estimations were completed using inverse distance weighting to the second power (ID2) interpolation, which is appropriate for this style of mineralization. Drill hole sample data were flagged with domain (zone) codes corresponding to the geological structure of the deposit and the domains were imprinted on the model from 3-D surfaces generated from geological interpretations. A primary ellipsoid search dimension of 212 x 425 x 3 m (semi-major, major, minor) was used for all assay data where the major axis was oriented to 30-degrees east of north to align with the approximate trend of mineralization. Successive search volume factors with increased search volumes were adopted to interpolate grade in areas of lower data density. No consistent plunge was apparent in mineralization. No dip or plunge angles were assigned to the search ellipsoids. Visual validation compared the estimated grades in the block model to composite grades and composites along drill hole traces in both section and plan views. The block grades were considered to reasonably reflect the composite grades. The resource classification was determined based on drill hole density reflecting geological confidence. The reasonable prospects for economic extraction for the mineral resources were based on the parameters listed in Table 1-1. An assumed vertical slope was used for the basis of the in-place resource TITAN PROJECT TENNESSEE, U.S. TECHNICAL REPORT SUMMARY ON FEASIBILITY STUDY Page 28 estimates. Product prices were provided by IperionX based on “TZMI Titanium Feedstock Price Forecast to 2029, Issue 2, 2025” and Adamas Intelligence “Value of IperionX Monazite Concentrate, Q3, 2025” Market Reports. These product prices are more conservative than those included in the economic model and sensitivity analysis (Section 19) of the FS. Table 1-1: Assumptions Used in Defining Prospects of Economic Extraction Parameter Units Value Commodity price Rutile US$/t 1,425 Ilmenite US$/t 340 Rare earth mineral concentrate US$/t 10,678 Zircon Concentrate US$/t 912 Metallurgical recovery Rutile % 70.6 (81.2% mineral in product) Ilmenite % 85.0 (95.8% mineral in product) Heavy rare earth concentrate % 89.5 (87.8% mineral in product) Zircon concentrate % 91.2 (46.9% mineral in product) Operating costs Mining cost US$/m3 7.23 Processing cost US$/ROM t 3.09 Transport cost US$/ROM t 1.00 Reclaim/rehandle US$/ROM t Included in Mining cost Incremental in pit management US$/ROM t Included in Mining cost General and administrative cost US$/ROM t 0.95 Dewatering US$/ROM t 0.30 Wetlands mitigation cost US$/Ha 60,000 Stream mitigation cost US$/linear m 1,425 Royalty % 5 Note: ROM = run of mine Mineral resources are reported using the mineral resource definitions set out in S-K 1300 on a 100% basis. The reference point for the estimate is in situ and are inclusive of reserves. Mineral resources are current as at June 4, 2026. The third-party firm responsible for the estimate is MM&A. The mineral resource estimates are provided in Table 1-2.


TITAN PROJECT TENNESSEE, U.S. TECHNICAL REPORT SUMMARY ON FEASIBILITY STUDY Page 29 1.11.2 Mineral Resources Statement Table 1-2: Mineral Resource Estimate and Total Heavy Minerals (THM) Assemblage Mineral THM Assemblage Resource In situ THM THM Zircon Rutile Ilmenite REE Estimate Tonnes (%) (t) (%) (%) (%) (%) Inclusive of Reserve Measured (M) 120,434,000 2.5 3,060,000 11.1 9.5 40.9 1.5 Indicated (I) 28,388,000 2.9 828,000 11.8 9.2 52.0 1.5 Total M+I 148,823,000 2.6 3,887,000 11.2 9.4 43.2 1.5 Inferred (Inf) 0 0.0 0 0.0 0.0 0.0 0.0 Total M+I+Inf 148,823,000 2.6 3,887,000 11.2 9.4 43.2 1.5 Exclusive of Reserve Measured (M) 96,851,000 1.5 1,489,000 10.4 9.2 40.1 1.2 Indicated (I) 102,190,000 2.0 2,013,000 9.8 10.2 38.9 1.5 Total M+I 199,041,000 1.8 3,502,000 10.0 9.8 39.4 1.4 Inferred (Inf) 97,832,000 1.8 1,774,000 9.3 9.6 38.0 1.2 Total M+I+Inf 296,872,000 1.8 5,276,000 9.8 9.7 39.0 1.3 Grand Total Measured (M) 217,285,000 2.1 4,548,000 10.8 9.4 40.6 1.4 Indicated (I) 130,578,000 2.2 2,841,000 10.4 9.9 42.7 1.5 Total M+I 347,863,000 2.1 7,389,000 10.6 9.6 41.4 1.4 Inferred (Inf) 97,832,000 1.8 1,774,000 9.3 9.6 38.0 1.2 Total M+I+Inf 445,695,000 2.1 9,163,000 10.4 9.6 40.8 1.4 Notes to accompany mineral resource table: 1. Mineral resources are reported using the definitions set out in Regulation S-K 1300 and are current as at June 4, 2026. Mineral resources are reported on an in situ basis, inclusive of reserves. 2. The third-party firm responsible for the estimate is MM&A. 3. Mineral resources are reported within a conceptual pit shell that uses the key assumptions summarized in Table 1-1 above. 4. Mineral resources are reported above a COG of 0.4% THM. 5. Property contains 199.0 Mt of mineral resources (Measured + Indicated) exclusive of mineral reserves (Figure 11-8). 6. Estimates have been rounded. Specific factors that may affect the estimates include: > changes to forecast commodity and final product price assumptions > changes in local interpretations of mineralization geometry and continuity of mineralized zones > changes to metallurgical recovery assumptions > changes to assumptions as to deleterious elements > changes to the input assumptions used to derive the conceptual open pit shell that is used to constrain the estimates > changes to the cut-off values applied to the estimates > variations in geotechnical, hydrogeological, and mining assumptions > changes to environmental, permitting, and social license assumptions 1.12 Mineral Reserve Estimates 1.12.1 Estimation Methodology Beginning with the geologic block model described in Section 11, MM&A developed a mine plan and reserve estimate using K-MINE Group’s (K-MINE) Planning and Optimal Pit Boundaries modules. The initial cutoff grade (COG) for mineral reserve estimation was set at 0.4% THM based on previous work. TITAN PROJECT TENNESSEE, U.S. TECHNICAL REPORT SUMMARY ON FEASIBILITY STUDY Page 30 Upon coordination with process engineers designing the wet concentrator plant (WCP), it was determined that a COG yielding a rougher feed grade of 3.2% THM would yield better recoveries through the process plant. A detailed COG analysis was completed whereby additional optimizations were run at COGs of 0.6% THM, 0.7% THM, 0.8% THM, and 0.85% THM to arrive at 3.2% THM grade feed to the WCP. Final COG used for optimization, scheduling, and mine planning was set at 0.85% THM. This selection was supported by a sensitivity analysis. Price coefficients (or revenue factors) were set up as part of the optimization process with a range of 20% to 110% with a 10% price correlation step for the final products. The decision was made to proceed using the number 8 step or 90% price coefficient, which provides the best correlation between maximizing profit while obtaining the highest mineral reserves possible. Optimization parameters for the project are shown in Table 1-3. Geotechnical assessment resulted in a final wall berm (batter) height of 10 m with a batter angle 35 degrees and 5-m benches, resulting in an overall 27.4-degree slope wall (see additional discussion in Section 13.1). Due to the geometry of the mining pits, small amounts of economic material may have been excluded from the mine plan tonnages, while small amounts of sub-economic/low-grade material may have been included and account for the dilution included as part of the mineral reserve estimate. Table 1-3: Optimization Parameters Group / Item Unit Value Geometry Coordinate System - UTM-16N Overburden slope ° 26.6 Face slopes ° 35 Inter-ramp slope ° 29 Overall slope ° 27.4 Berm width m 5 Batter angle ° 35 Berm (batter) height (working) m 10 Berm (batter) height (final wall) m 10 Minimum mining width m 25 Ramp width m 25 Total depth m 55 Block dimension X m 25 Block dimension Y m 25 Block dimension Z m 1.524 Mining Production rate tonne/year 3,529,000 to 10,588,000 Production schedule Hours/Year 8760 Production schedule efficiency % 85 Ramp grade % 10 Concentrator recovery Rutile % 70.6 (81.2% mineral in product) Ilmenite % 85.0 (95.8% mineral in product) Heavy rare earth concentrate % 89.5 (87.8% mineral in product) Zircon % 91.2 (46.9% mineral in product) Cutoff grade (COG) % 0.85 THM Specific gravity (ore) - 1.57 TITAN PROJECT TENNESSEE, U.S. TECHNICAL REPORT SUMMARY ON FEASIBILITY STUDY Page 31 Group / Item Unit Value Specific gravity (waste rock) - 1.72 Specific gravity (Coon Creek Formation) - 1.54 Specific gravity (soil) - 1.72 Restrictions - floodplain & wetlands Swell factor % 12 Pit Loss/Dilution % 10 (in addition to low-grade interburden) Vertical rate of advance m 90 Battery limits location ROM Pile Financial Mining cost US$/m3 7.23 Transportation cost US$/ROM t 1.00 Processing cost US$/ROM t 3.09 Reclaim/rehandle US$/ROM t Included in mining cost Incremental in pit management US$/ROM t Included in mining cost General and administrative cost US$/ROM t 0.95 Dewatering US$/ROM t 0.30 Wetlands mitigation cost US$/ha 60,000 Stream mitigation cost US$/ linear m 1,425 Royalty % 5 Sales price rutile US$/t 1,425 Sales price ilmenite US$/t 340 Sales price rare earth concentrate US$/t 10,678 Sales price zircon concentrate US$/t 912 All floodplain restrictions were observed for the optimization process. Production requirements for the Titan Property were based on the target production of 3.5 Mt per year for Phase 1 (Years 1-4) and 10.0 Mt per year for Phase 2 (Years 5-14). Results of the Optimization and detailed mine schedule for the Titan Property yielded 117 Mt of ROM ore at a THM of 3.2 percent. Revenue streams as projected in the economic portions of the report assume a sales realization (FOB- mine) of US$1,425 per tonne for Rutile final product, US$340 per tonne for Ilmenite final product, US$912 per tonne for Zircon concentrate, and US$10,678 for Rare Earth Elements concentrate. Product prices were provided by IperionX based on “TZMI Titanium Feedstock Price Forecast to 2029, Issue 2, 2025” and Adamas Intelligence “Value of IperionX Monazite Concentrate, Q3, 2025” Market Reports. The FS economic analysis utilizes higher overall commodity prices in aggregate than Mineral Reserve price assumption. This difference reflects updated market information available at the time of completion of the FS economic model. A separate pit optimization economic review and sensitivity analysis demonstrates that the project remains economically viable at the Mineral Reserve commodity price assumption. The conversion of mineral reserves (ROM-basis) via concentration and chemical processing to final products or concentrates are included in IperionX’s business plan, and as such, the costs of such processes and appropriate revenue streams are included in financial modeling. Resource modeling and mine optimization as described in the report was used as a basis for the reserve estimate using the geologic model described in Section 11 as the basis of the conversion from mineral resources to mineral reserves. Proven and Probable mineral reserves were derived from the defined resource considering relevant processing, economic (including technical estimates of capital, revenue, and cost), marketing, legal, environmental, socio-economic, and regulatory factors. TITAN PROJECT TENNESSEE, U.S. TECHNICAL REPORT SUMMARY ON FEASIBILITY STUDY Page 32 1.12.2 Mineral Reserves Statement Mineral reserves are reported using the mineral reserve definitions set out in S-K 1300 on a 100% basis. Mineral reserves are current as at June 4, 2026. The reference point for the mineral reserve estimate is as delivered to the process facilities. The third-party firm responsible for the estimate is MM&A. The Mineral Reserve estimate is based only on Measured and Indicated Mineral Resources. Inferred Mineral Resources were treated as waste and were not used to support Mineral Reserves or economic viability. The mineral reserves are shown in Table 1-4. Table 1-4 - Titan Project – Estimate of Mineral Reserves, ROM Basis Grand Total ROM Tonnes THM Assemblage THM THM Zircon Rutile Ilmenite REE Unit Proven Probable Total (%) (t) (%) (%) (%) (%) Upper McNairy 24,565,000 2,415,000 26,980,000 2.3 620,000 6.2 6.2 23.6 0.2 Lower McNairy 68,740,000 21,307,000 90,047,000 3.4 3,086,000 12.7 10.5 48.3 1.9 Total 93,306,000 23,722,000 117,027,000 3.2 3,706,000 11.6 9.8 44.2 1.6 Notes to accompany mineral reserve table: 1. Mineral reserves are reported using the definitions set out in Regulation S-K 1300 and are current as at June 4, 2026. Mineral reserves are reported on a ROM basis. 2. The third-party firm responsible for the estimate is MM&A. 3. Mineral reserves are reported within a finalized mine design pit shell that uses the key assumptions summarized in Table 1-3 above. 4. Mineral reserves are reported above a COG of 0.85% THM. 5. Ilmenite includes leucoxene, pseudorutile, and ilmenite and REE includes monazite, xenotime, and unclassified REE. 6. Estimates have been rounded. Mineral reserves are reported using the definitions in S-K 1300. The Qualified Persons considered pertinent modifying factors, inclusive of geological, environmental, regulatory, and legal factors, in converting a portion of the measured and indicated mineral resources to mineral reserves. Specific factors that may affect the estimates include: > changes to property control (i.e., owned, leased, or optioned tracts) > changes to forecast commodity and final product price assumptions > changes in local interpretations of mineralization and continuity of mineralized zones > changes to metallurgical recovery assumptions > changes to assumptions as to deleterious elements > changes to the input assumptions used to derive the finalized mine design open pit shell that is used to constrain the estimates > changes to the cut-off values applied to the estimates > variations in geotechnical, hydrogeological, and mining assumptions > changes to pit optimization assumptions > changes to mine design > changes to environmental, permitting, and social license assumptions


TITAN PROJECT TENNESSEE, U.S. TECHNICAL REPORT SUMMARY ON FEASIBILITY STUDY Page 33 1.13 Mining Methods Mine planning involved geotechnical and hydrogeological assessment. The geotechnical assessment completed for the project considered both pit slope stability and reclaimed, backfilled tailings stability. The geotechnical assessments incorporated hydrogeological modeling results. Based on a review of the key criteria (productivity, flexibility, separating plant-pit operations, operating cost, capital cost, ore selectivity and sensitivity to potentially wet pit floor), MM&A recommended an excavator and truck mining method, with mining activities completed by a contractor. Mining contractors will provide all labor and material for support equipment including all mobile mining equipment, water truck, dozer capable of maintaining the waste disposal volumes, motor grader, utility loader backhoe, fixed or portable lights, pumps, and a utility articulated haul truck (for erosion control measures, cleaning, etc.). The cost of the initial capital cost for all mobile equipment, in addition to equipment rebuilds and/or replacement throughout the life of the mines, will be incurred by the Contractor. A combination of excavators and articulated trucks will be utilized to mine the ROM ore as well as all topsoil, overburden and interburden waste material. ROM stockpiles and initial waste disposal areas are designed to minimize haul distances. Conveyors will be utilized to transport ROM ore from the mine area to the WCP, and dewatered tailings from the WCP back to the pits for disposal in the final backfill. A finalized FS mine plan was created using K-MINE’s Dynamic Design module for multiple years based on nested pits created from initial optimizations in order to create route profiles for equipment sizing and scheduling. These plans were developed by MM&A in order to allow mining contractors to match production requirements by year to excavators, articulated haul trucks and fixed and mobile conveyors which ultimately resulted in preparing cost analysis data used in mining cost modeling. Mining operations for the Titan project site are based on providing 3.5 Mt per year for Phase 1 (Years 1- 4) and 10.0 Mt per year for Phase 2 (Years 5-14) to the WCP from the mining pits within the Titan project boundary and disposing of dewatered tailings and waste material (non-ore sand and soils) in the Waste Storage Areas, Topsoil Storage Area, and Pit backfill areas. Production scheduling was performed using K-MINE’s scheduling module software and shown in Table 13-2. The Titan LOM production schedule shown below goes through 14 years. TITAN PROJECT TENNESSEE, U.S. TECHNICAL REPORT SUMMARY ON FEASIBILITY STUDY Page 34 Figure 1-1: Titan Mine Production Timing Map Note: Figure prepared by MM&A, 2026. Results of the detailed mine schedule for the Titan project yielded 117 Mt of ROM ore with 3.2% THM over the 14-year mine life (see Figure 1-2). Production scheduling was based on providing 400 tph rougher feed, roughly 3.5 Mt per year of ROM ore to the WCP during Phase 1 (Years 1-4) and 1,200 tph rougher feed, roughly 10.0 Mt per year of ROM ore during Phase 2 (Years 5-14) and includes Proven and Probable Mineral Reserves only for all years of operations. The Mineral Reserve estimate and production target is approximately 117 million ROM tonnes over the 14-year mine period at a THM of 3.2 percent. Approximately 93.3 million tonnes or 80% of the Mineral Reserves and production target estimates are Proven, while 23.7 million tonnes or 20% of the Mineral Reserves and production target estimates are Probable. All Mineral Reserves were converted from Measured and Indicated Mineral Resources. Inferred Mineral Resources were treated as waste. TITAN PROJECT TENNESSEE, U.S. TECHNICAL REPORT SUMMARY ON FEASIBILITY STUDY Page 35 Figure 1-2: Annual Ore Production Tonnes and THM% 1.14 Processing and Recovery Methods The proposed process and recovery methods outlined in the sections below were selected based on well- established and conventional approaches to processing mineral sands, including recovery of heavy mineral content using wet gravity separation equipment (such as spiral separators and up-current classifiers) followed by dry separation of titanium (ilmenite and rutile) and zircon minerals using electrostatic and magnetic separation equipment. With the increased focus on recovery of rare earth mineral content from mineral sand deposits, the use of flotation to extract these minerals (prior to dry mineral separation), and wet shaking tables to upgrade them, has become a more conventional approach and was selected for this flowsheet. The process plant is divided across two sites, namely the WCP site and the MSP site. The process plant layout is broken down further within each site into specific areas as follows: > WCP Site: - mining unit plant (MUP) - feed preparation plant (FPP) - wet concentrator plant (WCP) - concentrate upgrade plant (CUP) - tailing dewatering circuit (TDC) > MSP Site: - rare earth plant (REP) - mineral separation plant (MSP) TITAN PROJECT TENNESSEE, U.S. TECHNICAL REPORT SUMMARY ON FEASIBILITY STUDY Page 36 Each site has been designed to first accommodate the 400-tph plant and then cater for the future expansion to 1,200 tph of rougher spiral head feed by adding a parallel 800-tph plant. The method for expansion for each area was considered individually to provide the most flexibility during operations, whilst also considering economies of scale in construction, and minimizing the variation of required spare parts for each plant area. The upstream wet concentrator plant (WCP) and associated feed preparation plant (FPP) are designed to operate continuously at the nominated throughput rates, producing a heavy mineral concentrate (HMC) for downstream processing. The rare earth plant (REP) and mineral separation plant (MSP) are designed to process the full expanded HMC throughput of up to 1,200 tph from commencement of operations. During Phase 1, the REP and MSP operate at reduced utilization, supported by stockpiling and reclaim systems that decouple upstream and downstream operations and enable stable plant operation during staged ramp‑up. The overall process flowsheet comprises conventional mineral sands processing circuits, supported by established equipment types and configurations. The principal process facilities include the feed preparation plant (FPP), wet concentrator plant (WCP), concentrate upgrade plant (CUP), rare earth plant (REP), mineral separation plant (MSP), and tailings dewatering circuit (TDC). The FPP incorporates scrubbing, screening, and desliming equipment, including trommels, vibrating screens, and hydrocyclones, to prepare the run‑of‑mine material for downstream separation and to remove oversize and slimes fractions. The WCP comprises multi‑stage wet gravity separation circuits utilizing spiral concentrators arranged in rougher, scavenger, cleaner, and recleaner stages to produce a heavy mineral concentrate (HMC). Spiral circuits are configured in modular banks, allowing duplication for the expansion from 400 tph to 1,200 tph throughput. The CUP includes classification, additional spiral separation, and dewatering equipment such as up‑current classifiers, screens, and dewatering cyclones to upgrade and condition the HMC prior to downstream processing. The REP incorporates attritioning tanks, flotation cells, and gravity separation equipment, including wet shaking tables, to recover a heavy rare earth concentrate, HREE-dominant by value (HREC). The REP is designed for a nominal throughput capacity aligned with the full expanded HMC production rate (equivalent to 1,200 tph WCP feed basis), providing sufficient capacity to accommodate peak production rates and operational variability. The MSP utilizes conventional dry processing equipment, including feed dryers, electrostatic separators, and magnetic separation circuits, to produce final ilmenite, rutile, and zircon products. The MSP is configured in staged processing lines corresponding to Phase 1 and Phase 2 throughput, with overall installed capacity aligned to the full 1,200-tph upstream plant throughput.


TITAN PROJECT TENNESSEE, U.S. TECHNICAL REPORT SUMMARY ON FEASIBILITY STUDY Page 37 The TDC includes thickeners, belt filter presses, dewatering cyclones, and screens to achieve a target tailings moisture content suitable for transport and in‑pit backfilling. Equipment selection across all process areas is based on proven mineral sands technologies, with capacities, duty points, and configurations aligned to the design throughput and supported by metallurgical testwork, process modelling, and industry operating experience. The use of modular equipment configurations enables staged expansion, reduces construction risk, and maintains consistency in equipment types across development phases. Key equipment has been sized and selected based on the defined process duty, including slurry handling rates, solids loading, and separation efficiency requirements, with capacities aligned to both nominal and peak throughput conditions for each process area. Trade-off studies completed for tailings dewatering and zircon product pathways have informed key design decisions. The selected tailings dewatering configuration comprising thickening, belt filter presses, dewatering cyclones, and dewatering screens is considered feasible at FS level to meet the project’s moisture targets necessary to support progressive landform rehabilitation. The zircon trade-off study identified a medium‑grade zircon concentrate as the preferred product pathway that balances metallurgical performance, regulatory compliance, processing simplicity, and market acceptance. TITAN PROJECT TENNESSEE, U.S. TECHNICAL REPORT SUMMARY ON FEASIBILITY STUDY Page 38 Figure 1-3: FS Process Flowsheet – Block Flow Diagram (FPP, TDC, WCP & CUP) Note: Figure prepared by MT, 2026. TITAN PROJECT TENNESSEE, U.S. TECHNICAL REPORT SUMMARY ON FEASIBILITY STUDY Page 39 Figure 1-4: FS Process Flowsheet – Block Flow Diagram (REP & MSP) Note: Figure prepared by MT, 2026. TITAN PROJECT TENNESSEE, U.S. TECHNICAL REPORT SUMMARY ON FEASIBILITY STUDY Page 40 The overall performance estimates were also made for the process plant being fed with ROM material containing nominally: > 3.2% (in-size) heavy mineral (HM) (with 11.7% zircon, 9.8% rutile, 44.1% ilmenite and 1.6% rare earth elements) > 1.3% oversize (>600 microns) > 14.8% slimes (<44 microns) These overall performance estimates used the modelled grades and recoveries, as well as data estimated from metallurgical testwork for distribution of TiO2 between ilmenite/leucoxene and rutile and ratio of CeO2 to TREO, and are outlined below: > Heavy mineral concentrate (HMC) (from wet concentrator plant (WCP) / concentrate upgrade plant (CUP)) - approximately 3% mass of ROM feed - approximately 97% THM grade - approximately 90% HM (in-size) recovery > HREC product - approximately 0.05% mass of ROM feed - approximately 25% CeO2 (approximately 61.4% TREO) grade - approximately 91.4% CeO2 recovery > Rutile product - approximately 0.25% mass of ROM feed - approximately 91.1% TiO2 (approximately 81.2% rutile) grade - approximately 64.3% rutile recovery > Ilmenite/leucoxene product - approximately 1.2% mass of ROM feed - approximately 62.5% TiO2 (approximately 95.8% ilmenite/leucoxene) grade - approximately 80.7% ilmenite/leucoxene recovery > Zircon concentrate product - approximately 0.67% mass of ROM feed - approximately 34.4% ZrO2 (approximately 51.1% zircon) grade - approximately 91.8% zircon recovery


TITAN PROJECT TENNESSEE, U.S. TECHNICAL REPORT SUMMARY ON FEASIBILITY STUDY Page 41 1.15 Infrastructure The property for the WCP and mining pits associated with the Titan project is split between Benton and Carroll Counties in Tennessee with the proposed WCP to reside in Carroll County. The proposed rare earth plant (REP) and mineral separation plant (MSP) will reside in Benton County outside the municipal limits of Camden, Tennessee. Distance between the WCP and REP/MSP is approximately 29 km (18 miles) utilizing both county, state, and US routes. CSX Transportation (CSX) operates a railyard approximately 11 km (7 miles) from the MSP/REP site. Transportation of material between the MSP/REP and the railyard will be conducted by over-the-road trucking. Similarly, the movement of product from the WCP to the MSP/REP will be conducted through over-the-road trucking. Transportation of ROM and tailings materials between the mine pits and the processing plants will be conducted by conveyor belts. The main transportation belt will be dual purpose with the top belt taking ROM material from the pits to the plant and the bottom belt returning to the pits with the tailings. Electricity is supplied via 161-kV transmission lines near the Project area. The power supply assumes a 100% renewable power supply from TVA. Sources of raw water will be needed in the mining and ROM material processing. The majority of the raw water supply will come from a mixture of water withdrawn from a nearby river and groundwater inflow to the pits, with the primary source being the water withdrawal point. Current estimations of groundwater inflow to the pits indicate that, if required, the pit inflow could provide most of the required flow, but an additional source of water would be necessary for the processing plant during different points of the 14-year mine plan. To accommodate the need for a potable water supply at the WCP, a potable water well will be drilled adjacent to the personnel facilities. At the MSP site, water will be supplied by the City of Camden. NPI buildings will be located at the WCP and MSP facilities for all operations and maintenance personnel either as vendor-supplied modular buildings or engineered structures. NPI at the WCP includes control room, warehouse and ablutions building. NPI at the MSP includes control room, administration building, warehouse and laboratory and sample preparation building. 1.16 Market Studies 1.16.1 Market Studies Used Market analysis and commodity price projections provided by IperionX are derived from independent third-party market studies. Titanium and zircon mineral sands market conditions and price forecasts are based on the Titanium Feedstock Price Forecast (Issue 3, 2025) prepared by TZ Minerals International Pty Ltd (TZMI). HREC pricing is based on the IperionX Rare Earth Concentrate Calculations (April 2026) prepared by Argus Media TITAN PROJECT TENNESSEE, U.S. TECHNICAL REPORT SUMMARY ON FEASIBILITY STUDY Page 42 and Expected Payability for Rare Earth Concentrates from IperionX's Titan Project (April 30, 2026) prepared by Mine Value Partners (MVP). Magnet rare earth oxide supply and demand data referenced in this sub-section are based on the ‘Rare Earth Magnet Market Outlook to 2040’ report (Q4 2025) prepared by Adamas Intelligence (Adamas). 1.16.2 Commodity Pricing 1.16.2.1 Mineral Sands Product Pricing Ilmenite, rutile, and zircon price forecasts are based on the TZMI Titanium Feedstock Price Forecast (Issue 3, 2025) base case scenario. From 2026 to 2029, annual base case forecast prices are applied, after adjusting for inflation in IperionX’s analysis. From 2030 onward, TZMI long-term inducement prices, converted to real 2026 US dollars, are held flat through the remainder of the mine life. The mineral sands pricing assumptions are illustrated in Figure 1-5. Figure 1-5: Mineral Sands Products Pricing Forecast (US$/t, Real 2026) Source: TZMI and IperionX analysis, 2026 1.16.2.2 Heavy Rare Earth Concentrate Pricing The IperionX Rare Earth Concentrate Calculations (April 2026) Report prepared by Argus Media provides forecast for 15 individual rare earth oxide prices and the resulting TREO basket value for the Project HREC, expressed in real 2026 US dollars over the 2020-2040 horizon. IperionX engaged Mine Value Partners (MVP), an independent mining consultancy with significant expertise in commodity markets, mineral development operations, and commercial analysis, to undertake an assessment of the payability of IperionX Heavy Rare Earth Concentrate, HREE-dominant by value (HREC). MVP's analysis concluded that the implied sustainable payability for a rare earth concentrate like Titan's is expected to sit between 46% $0 $500 $1,000 $1,500 $2,000 2025 2026 2027 2028 2029 2030 2031 2032 2033 2034 2035 2036 2037 2038 2039 2040 P ri ce ( U S$ /t ) Rutile Zircon Chloride Ilmenite TITAN PROJECT TENNESSEE, U.S. TECHNICAL REPORT SUMMARY ON FEASIBILITY STUDY Page 43 and 65% of theoretical basket value, dependent on pricing assumptions. The range supports downstream capital recovery while allowing upstream rents to be allocated in line with long-run economic theory for commodities and represents a return to economically sustainable value sharing where both upstream and downstream participants can invest with confidence and continuity. For financial modelling purposes, a 50% payability assumption is considered a reasonable assumption that is not anomalous or aggressive, and one that is well supported by projected netback economics and other Western precedents. The basket price below was generated by applying a 50% payability factor to the TREO basket value to derive the IperionX HREC price. The FS LOM average price of HREC is US$41,759 per tonne based on the financial model. The forecast TREO basket value and IperionX HREC price are illustrated in Figure 1-6. Figure 1-6: TREO Basket Price and HREC Price Forecast (US$/kg, Real 2026) Source: Argus Media, IperionX Rare Earth Concentrate Calculation, Issue 1, April 2026. IperionX HREC price reflects the payability assumption, supported by Mine Value Partners' April 2026 analysis ("Expected Payability for Rare Earth Concentrates from IperionX's Titan Project") 1.17 Environmental, Permitting and Social Considerations 1.17.1 Environmental Studies and Monitoring Environmental studies were completed from 2020 to 2025 covering aspects such as: Critical Issue Analysis, US Army Corps of Engineers (USACE) Wetland Delineation and Tennessee Department of Environment and Conservation (TDEC) Hydrologic Determination Field Work, Federal and State TITAN PROJECT TENNESSEE, U.S. TECHNICAL REPORT SUMMARY ON FEASIBILITY STUDY Page 44 Threatened and Endangered Habitat Survey, Cultural Resources Background Research and Baseline Groundwater and Surface Water Study. 1.17.2 Permitting TDEC granted IperionX the required state Surface Mining Permit (OM-70711-01) and National Pollutant Discharge Elimination System (NPDES) Permit (TN0070711) on August 14, 2023. The Tennessee Surface Mining Permit is a five-year permit and will need to be renewed and updated every five years. The first renewal will be required by August 14, 2028. Neither the MSP nor the REP are currently permitted. TDEC also determined that IperionX’s proposed sand processing operations would constitute an insignificant activity or insignificant emissions unit, as defined in part 1200-03-09-.04(2)(a)3 of the Tennessee Air Pollution Control Regulations. As mining planning progresses, the existing permits and agency approvals noted above will require modification to incorporate the entirety of the Mine Site in the future. Additionally, though there have been environmental due diligence studies performed within the Environmental Due Diligence Study Area that cover the majority of the Mine Site, they are outdated and will require appropriate re-reviews, updates, and field work as applicable. It should be noted that Section 17 assumes full disturbance within the Estimated Future Mine Area, although there is currently no work proposed in Federal Emergency Management Agency (FEMA) floodplains. In addition to the permitting needs for the Mine Site, the REP and MSP sites require permitting. 1.17.3 Mine Reclamation and Closure, Tailings and Water Management Tennessee state regulations require mines to be properly closed, and reclamation commenced immediately upon abandonment. The financial model for the Titan Project includes cost for mine reclamation and closure within the Contract Mining operating cost of US$5.23 per cubic meter. The waste and tailings disposal plan is fully integrated with the overall mine plan. At the beginning of mining, waste and tailings material will be placed, as needed, in temporary waste piles on the ground surface located 1.) in the Year 11 mining area and 2.) in the area northeast of the WCP. Tailings material will be filtered at the WCP to an optimum moisture content of approximately 16 to 18 percent, as defined by laboratory tests of representative tailings samples conducted by S&ME. The use of filtered tailings allows the material to be placed like soil in backfilled lifts in the pits as mining progresses, thus minimizing the tailings storage footprint and reclaiming the pit areas to near their original surface elevations. The temporary, out-of-pit waste storage areas are estimated to only be required through approximately Year 5 of mining, after which all tailings and waste material will be backfilled into the pit as mining progresses. Water management on the site will be important for dewatering the mine pits, supplying the WCP, ensuring stability of the in-pit backfill material, and ensuring compliant discharge at the NPDES outfalls. Expected groundwater inflow to the pits has been estimated via groundwater modeling conducted by HDR. Groundwater that enters the pit will be collected in a sump near the mining face and pumped into settling ponds on the perimeter of the property. Water that is pumped to the ponds will be settled to


TITAN PROJECT TENNESSEE, U.S. TECHNICAL REPORT SUMMARY ON FEASIBILITY STUDY Page 45 remove turbidity and suspended solids. If necessary, pH control of the water will be conducted within the settling ponds. 1.17.4 Social Considerations, Plans, Negotiations and Agreements IperionX has actively engaged with TDEC, TVA, Tennessee state government officials, community members, business owners, local government officials, local school systems, universities, technical schools, and local and state government groups. IperionX will continue identifying and engaging with new groups and stakeholders as the mine is developed. 1.18 Capital Cost Estimates The objective of developing the CAPEX and OPEX cost estimates is to provide substantiated costs feeding into the FS pertaining to the Project. The initial CAPEX estimate includes all of the Project’s direct and indirect costs to be expended during the implementation phase of the Project. Initial CAPEX is deemed to cover the period starting from the approval date by IperionX of this FS report and finishing at the successful completion of the commissioning phase. Any cost to be expended beyond the commissioning phase, i.e., transfer to operations, performance tests, start-up/ramp-up and operations of the Titan facilities will be included with sustaining CAPEX or OPEX. The CAPEX summaries have been prepared and reported in accordance with the project’s phased development approach, comprising Phase 1 – 400 tph rougher feed and Phase 2 – incremental 800 tph rougher feed configurations. The summaries present the capital cost estimate at a consolidated level for each phase, consistent with the scope definitions for this study. Total CAPEX for Phase 1 is US$228.1 million, while total CAPEX for Phase 2 is US$153.2 million, for a total Project CAPEX of US$381.3 million. In keeping with the intended Class 3 estimate maturity, the estimate has been prepared to reach a target accuracy range of ±15%. Table 1-5 shows the Consolidated, the Phase 1 – 400 tph, and the Phase 2 – incremental 800 tph capital cost summaries, respectively. Table 1-5: Capital Cost Summary (Phase 1 – 400 tph and Phase 2 – incremental 800 tph) Item Phase 1 400 tph (US$) Phase 2 – Incremental 800 tph (US$) Total Phase 1+ Phase 2 (US$) Direct Costs 1000 - Site Wide - Mining $23,237,857 $347,042 $23,584,929 1000 - Site Wide - NPI $18,316,630 $0 $18,316,630 1000 - Site Wide - Balance of Scope $18,499,189 $3,191,001 $21,690,190 2000 - Feed Preparation Plant $10,086,726 $15,587,107 $25,673,833 3000 - Wet Concentrator Plant $44,143,921 $62,212,480 $106,356,401 4000 - Mineral Separation Plant $25,058,422 $33,435,617 $58,494,039 5000 - Rare Earth Plant $33,181,069 $1,240,555 $34,421,625 8000 - Mining Unit Plant $1,304,793 $2,133,248 $3,438,041 Direct Costs Sub-total $173,828,608 $118,147,079 $291,975,688 (Continued below) TITAN PROJECT TENNESSEE, U.S. TECHNICAL REPORT SUMMARY ON FEASIBILITY STUDY Page 46 Item Phase 1 400 tph (US$) Phase 2 – Incremental 800 tph (US$) Total Phase 1+ Phase 2 (US$) Indirect Costs EPCM $22,414,018 $14,663,588 $37,077,606 Temporary Facilities and Services $2,240,370 $1,247,800 $3,488,170 Vendor's ME Installation Assistance $250,000 $190,000 $440,000 Contractor's Pre-Commissioning Assistance $186,342 $244,769 $431,111 Commissioning & Testing $1,898,000 $1,620,320 $3,518,320 Spare Parts $928,893 $1,196,017 $2,124,910 First Fills $143,330 $223,407 $366,737 Indirect Costs Sub-total $28,060,953 $19,385,901 $47,446,854 TOTAL No CONTINGENCY nor OWNER'S COSTS $201,889,562 $137,532,980 $339,422,542 Owner's Costs $5,598,338 $1,637,627 $7,235,964 Contingency $20,638,419 $14,027,432 $34,665,851 TOTAL CAPEX 400tph and 800tph $228,126,319 $153,198,038 $381,324,357 Note: Totals may not sum due to rounding. 1.19 Operating Cost Estimates OPEX has been performed for Mining, Process Plant, Product Transport and Royalties. The following list of cost centers were used for the Process Plant OPEX estimation: salaries; General & Administrative (G&A); reagents; consumables; utilities (electricity, fuel, water, etc.); maintenance; and mobile equipment. The estimates have an accuracy of ±15%. The estimate base date is Q2, 2026, and the estimate was prepared using US$. Table 1-6 below summarizes the average OPEX costs per year for the Project. Table 1-6: Operating Costs Summary Operating Costs US$/year US$/t ore Phase 1 Average Phase 2 Average Phase 1 Average Phase 2 Average Mining 21,505,614 64,334,874 6.32 6.22 Process Plant 15,520,852 27,967,350 4.56 2.70 Product Transport 3,558,600 8,900,738 1.05 0.86 Royalties 4,747,628 8,052,134 1.39 0.78 Total Operating Costs 45,332,694 109,255,096 13.31 10.57 Note: Totals may not sum due to rounding. 1.20 Economic Analysis 1.20.1 Forward-Looking Information Caution This FS contains forward-looking statements within the meaning of the US Securities Act of 1933 and the US Securities Exchange Act of 1934, which are intended to be covered by the safe harbor created by such sections. Such forward-looking statements include, without limitation, statements regarding mineral resource and mineral reserve estimates, recoveries and grade, future mineralization, future adjustments, and sensitivities and other statements that are not historical facts. These statements are not guarantees of future performance and undue reliance should not be placed on them. The assumptions used to TITAN PROJECT TENNESSEE, U.S. TECHNICAL REPORT SUMMARY ON FEASIBILITY STUDY Page 47 develop forward-looking information and the risks that could cause the actual results to differ materially are detailed in the body of this report. 1.20.2 Methodology and Assumptions The financial model was developed using second-quarter 2026 (Q2 2026) price forecasts and cost estimates, with all figures presented in US dollars and expressed in real terms. The analysis was performed on an unlevered basis, assuming 100% equity financing. A real discount rate of 8% was applied, consistent with industry benchmarks for mining projects in the US. No escalation was applied to operating costs or revenues over the life of the model. 1.20.3 Economic Analysis Results The economic analysis demonstrates a robust financial profile based on a 2-phase construction and operation approach producing on average of approximately 86,000 tpa in Phase 1 and 214,000 tpa during Phase 2 over a 14-year mine life. Using variable product pricing based on external market studies, the project generates US$1.93 billion free cash flow and the post-tax financial model, developed on an unlevered basis, yields a strong net present value at an 8% discount rate (NPV8) of US$813 million and Internal rate of return (IRR) of 39.4%, with a payback period of 3.63 years. The key economic outcomes of the DCF based on the detailed key assumptions are outlined the Table 1-7. Table 1-7: FS Financial Results FS Financial Results UoM Value Total EBITDA US$ million 2,804 Pre-Tax NPV8 US$ million 1,016 Pre-Tax IRR % 42.6 Pre-Tax Payback Period Year 3.49 After-Tax NPV8 US$ million 813 After-Tax IRR % 39.4 After-Tax Payback Period Year 3.63 NPV/Initial Capital US$ 3.56 NPV/Total Capital US$ 2.13 The yearly real cash flows are demonstrated in Figure 1-7. TITAN PROJECT TENNESSEE, U.S. TECHNICAL REPORT SUMMARY ON FEASIBILITY STUDY Page 48 Figure 1-7: Titan Project After Tax Real Cash Flows Note: Figure prepared by Primero, 2026. 1.20.4 Sensitivity Analysis A sensitivity analysis was performed to assess Project sensitivity to: capital cost estimates, operating cost estimates, grade, and product pricing. The results are summarized in Figure 1-8 and Figure 1-9 and demonstrate that the project is most sensitive to sales prices followed by grade. Figure 1-8: Titan Project Sensitivity Analysis – After Tax IRR Note: Figure prepared by Primero, 2026.


TITAN PROJECT TENNESSEE, U.S. TECHNICAL REPORT SUMMARY ON FEASIBILITY STUDY Page 49 Figure 1-9: Titan Project Sensitivity Analysis – After Tax NPV8 Note: Figure prepared by Primero, 2026. In terms of IRR, the Project is most sensitive, in order from most to least sensitive, to: > product pricing > grade > Phase 1 capital costs > operating costs > Phase 2 capital costs In terms of the NPV, the Project is most sensitive, in order from most to least sensitive, to: > product pricing > grade > operating cost estimates > Phase 1 capital costs > Phase 2 capital costs TITAN PROJECT TENNESSEE, U.S. TECHNICAL REPORT SUMMARY ON FEASIBILITY STUDY Page 50 1.21 Risks and Opportunities 1.21.1 Risks MT, Primero, and MM&A contributed to a Project risk register and risk workshop. Following completion of the workshop, Primero carried out a Monte Carlo simulation to quantify the potential cost impact of the identified risks and to support the development of an appropriate contingency allowance. Noteable project risks identified by the QPs that could potentially impact the Titan mining and processing operations include: 1. Commodity pricing drops unexpectedly, due to overseas competition and flooding of the market. 2. Discharged water does not meet permit requirements for discharge from site, which may result in permit violations and public protests or environmental incidents. 3. Underperformance of the mining contractor may lead to lower-than-expected production levels. 4. Permits and/or mitigation measures related to mining through streams and wetlands are unsuccessful and prohibit full extraction of reserves within mine plan. 5. TVA is unable to provide the necessary electrical power to service the mine and plant operations prior to Phase 2 of the project. 6. Desliming circuit may allow slimes through to the WCP which will result throughput reduction or restriction. 7. Periods of high slimes may slow plant throughput, due to thickener constraint on load handling capability. 8. Inability to maintain MSP building temperature and humidity impacting plant performance and recovery. A nominal 10% contingency allowance was used for the direct and indirect costs of the design and supply estimate. Contingency allowance was not added to the budget estimate items. This was considered contractor’s contingency which would be applicable to a fixed price design and supply contract. This contingency allowance sits outside of the Owner’s contingency risk. It is recommended the Owner’s contingency account for the following additional key risks that are not accounted for in the design and supply cost estimate: 1. Cost escalation resulting from time and economic events 2. Movement in foreign exchange rates 3. Escalation and uncertainty in logistics costs due to timing being a long way out from contract execution 4. Escalation resulting from changing suppliers from low-cost country vendors TITAN PROJECT TENNESSEE, U.S. TECHNICAL REPORT SUMMARY ON FEASIBILITY STUDY Page 51 5. Escalation resulting from restriction in trade or changes to import tariffs 6. Process performance not being achieved due to equipment supplied from low-cost countries not performing as intended 7. Unable to obtain enforceable process and throughput performance guarantees from vendors 8. Unable to use low-cost equipment and manufacturing supply chain due to sanctions on supply of equipment into international projects associated with rare earths 9. Tailings dewatering equipment proves to be ineffective as planned and additional CAPEX/OPEX is necessary to achieve required moisture contents 1.21.2 Opportunities 1.21.2.1 Project Area Opportunities include: > potential to add to the property holdings and increase the exploration potential for the mineral tenure to host prospective McNairy Formation units > if the mineralization currently classified as Inferred can be upgraded with additional drilling and mining study support > review of the mining area vs floodplain buffer allocations to determine if a portion of the buffer area can be included in the mine plan > varying the COG, thereby increasing annual ROM ore tonnage > increasing the Revenue Factor, thereby expanding the optimized pit shell and increasing annual ROM ore tonnage > outside the Project area, the “Camden area” mineral tenure drill results suggest the potential to support mineral resource estimation. The area is favorable because erosion has removed the Upper McNairy Formation unit, exposing Lower McNairy Formation sands. 1.21.2.2 Processing The following opportunities have been identified for further exploration in subsequent project phases: > increase extent of modularization, particularly around the belt filter press once preferred vendor has been selected > further optimize the extent of piping pre-assembly and balance the use of pipe racks to minimize site construction costs > complete a transport study to investigate inland transport options to reduce risk and costs of freight to site TITAN PROJECT TENNESSEE, U.S. TECHNICAL REPORT SUMMARY ON FEASIBILITY STUDY Page 52 1.22 Conclusions Sufficient data has been obtained through various exploration and sampling programs to support the geological interpretations of the mineral deposits situated on the Property. The data is of sufficient quantity and reliability to reasonably support the mineral resource and mineral reserve estimates in this TRS. The geological data and FS, which consider mining plans, revenue, and operating and capital cost estimates are sufficient to support the classification of mineral reserves provided herein. This geologic evaluation conducted in conjunction with the FS is sufficient to conclude that the 117 Mt of mineral reserves identified on the Property are economically mineable under reasonable expectations of market prices for HREC products, estimated operation costs, and capital expenditures. The FS defines a technically feasible processing flowsheet and plant configuration for the Titan Project based on available metallurgical data and engineering studies. The process design supports staged- throughput development and incorporates conventional technologies that are widely applied in mineral sands operations. The FS has defined a technically robust and scalable process design for the Titan Project, accommodating both the initial 400 tph development and the planned expansion to 1,200 tph. The selected flowsheet, equipment selections, and plant layouts are based on conventional, well-proven mineral sands processing technologies and are supported by extensive prior testwork, process modelling and MT’s operational experience. Further testwork is required to confirm equipment selections prior to commencement of detailed design as outlined in the recommendations section of this report. The adopted design provides a clear execution pathway for staged development while maintaining a high degree of equipment commonality between the initial and expanded plant phases. This approach reduces operation complexity, improves maintainability, and supports efficient capital deployment across the life of the project. The extensive use of modularization across the WCP, REP and MSP is expected to reduce site construction risk, improve schedule certainty, and enhance overall cost control. Trade-off studies completed for tailings dewatering and zircon product pathways have informed key design decisions. The selected tailings dewatering configuration is considered feasible at FS-level to meet the project’s moisture targets necessary to support progressive landform rehabilitation. The zircon trade-off study identified a preferred product pathway that balances metallurgical performance, regulatory compliance, processing simplicity, and market acceptance. The WCP and MSP layouts have been developed to optimize operability, maintainability, traffic management, and future expansion, while aligning with permitting constraints, local utilities, and site topography. Power, gas, water, and reagent demands have been quantified to FS accuracy. Overall, the engineering completed provides a sound and credible basis for advancement into the next phase of project development, subject to completion of the recommended work outlined below.


TITAN PROJECT TENNESSEE, U.S. TECHNICAL REPORT SUMMARY ON FEASIBILITY STUDY Page 53 1.23 Recommendations 1.23.1 Mining 1. TDEC permit modification, wetlands and stream mitigation analysis, permitting and construction (approximately US$17.2 million) 2. Update of baseline surface water and groundwater studies (approximately US$100,000) 3. Permitting recommendations for the mine site (approximately US$0.75 million total): a. re-review existing field delineation of federal and state waters and add area not yet investigated b. re-review existing field habitat assessments of federal and state protected species and add area not yet investigated; species-specific surveys may be included c. update desktop-level cultural resources assessment d. conduct informal consultations with US Fish and Wildlife Service (USFWS), TDEC, and Tennessee Historical Commission (THC) (possible increased costs dependent on results of review) e. update USACE Approved Jurisdictional Determination (AJD) verification (Waters of the US [WoTUS]) f. update TDEC Division of Water Resources (TDEC-DWR) HD concurrence (waters of the state) g. conduct pre-application meeting with USACE and TDEC-DWR as the Mine Site will likely result in Section 404/401 Individual Permit and thus trigger a National Environmental Policy Act (NEPA) review 4. Permitting for the MSP (approximately US$0.25 million total): a. obtain NPDES construction and industrial permits b. conduct field delineation of federal and state waters c. conduct field habitat assessments of federal and state protected species d. conduct desktop-level cultural resources assessment (possible increased costs dependent on results of review) e. complete informal consultations with USFWS, TDEC, and THC f. after completion of the above-mentioned studies at the MSP, complete the following: i. USACE AJD verification (WoTUS) ii. TDEC-DWR HD concurrence (waters of the state) iii. USFWS informal consultation, including Migratory Bird Treaty Act (MBTA) and Bald and Golden Eagle Protection Act (BGEPA) TITAN PROJECT TENNESSEE, U.S. TECHNICAL REPORT SUMMARY ON FEASIBILITY STUDY Page 54 iv. THC coordination 5. Waste and tailings disposal: a. if possible, continue to pursue the opportunity to sell tailings as by-product to further reduce tailings handling in early years of mining (to be completed by IperionX staff) 6. Social considerations, plans, negotiations and agreements (approximately $US40,000 per year): a. continue engagement activities with local groups and individuals as the Project advances, consistent with applicable laws and regulations, and in a manner customary for heavy mineral sands projects development b. consider qualified local individuals and businesses in hiring and procurement processes, consistent with standard industry practice, applicable laws, and operational needs 1.23.2 Processing Based on the outcomes of the FS, the following high-level actions are recommended prior to progressing the Titan Project into detailed design and execution. The estimated cost of the recommended work programs outlined above has been developed at an order‑of‑magnitude level consistent with FS definition. The total cost is estimated to be in the range of approximately US$5 million to US$7 million. 1. Confirmatory Metallurgical and Process Testwork - Undertake the recommended confirmatory metallurgical testwork program to validate the revised FS flowsheet, equipment selections, and key design assumptions, particularly where the final design differs from earlier pilot‑scale testwork. Outcomes should be used to confirm achievable recoveries, moisture targets, operating parameters, and equipment sizing, and to support vendor performance guarantees. 2. Low‑Cost Country Vendor Verification - Implement a structured verification and risk mitigation program for major equipment proposed to be sourced from low‑cost country vendors. This should include performance verification, reference plant assessments where available, and evaluation of quality assurance, warranties, spare parts availability, and long‑term vendor support. 3. Tailings Dewatering and Deposition Validation - Further validate the ability of the selected tailings dewatering circuit to consistently achieve the target combined tailings moisture content (≤16% weight/weight [w/w], not to exceed 20% w/w) under full‑scale operating conditions. Where practical, pilot scale vendor testwork should be undertaken, with findings incorporated into final equipment selection, sizing, and operating philosophy. 4. Logistics, Transport, and Route Assessment - Complete a detailed logistics and transportation study to de‑risk the modular delivery strategy. The study should confirm optimal shipping methodology, preferred destination port(s), inland transport routes, over‑dimensional constraints, permitting requirements, and maximum practical module sizes and weights, and be used to inform final module design and fabrication strategy. TITAN PROJECT TENNESSEE, U.S. TECHNICAL REPORT SUMMARY ON FEASIBILITY STUDY Page 55 5. Detailed Design Interface Definition - Clearly define and progress detailed design interfaces and battery limits between various contract scopes. Focus should be placed on civil, structural, mechanical, and utility interfaces to minimize the risk of scope gaps, rework, or constructability issues during execution. 6. Bridging Engineering and Execution Readiness - Proceed with a structured bridging engineering phase to finalize process design, complete HAZOP and risk reviews, refine capital and operating cost estimates, and advance engineering definition to support fixed‑price contracting. This phase should also be used to further identify and implement value‑engineering opportunities. TITAN PROJECT TENNESSEE, U.S. TECHNICAL REPORT SUMMARY ON FEASIBILITY STUDY Page 56 2 Introduction 2.1 Introduction This Technical Report Summary (the TRS or the Report) on the Titan Project (the Project) was prepared for IperionX Limited (IperionX) by Marshall Miller & Associates, Inc. (MM&A), Karst Geo Solutions, LLC (KGS), Mineral Technologies Pty Ltd (MT), and Primero Group Americas Inc. (Primero). MM&A compiled the Report document, with contributions from the other consulting firms. While MM&A fulfilled the responsibility as the integrator of the FS and was responsible for mineral resource and mineral reserve estimates along with mine plan and mining cost estimation, other consulting firms also completed vital aspects of the Study. KGS was responsible for historical exploration results for the Project. MT completed the wet and dry process design and related modular plant cost estimation. Primero completed the non- process infrastructure (NPI) design and related cost estimates, and was responsible for integrating the mining, process, and NPI costs into a comprehensive discounted cash flow financial model for the FS. The Project is located near Camden, Tennessee, in the United States (US). Per the definitions in Section 24.3, a “feasibility study” is equivalent to a “definitive feasibility study”. 2.2 Terms of Reference 2.2.1 Report Purpose The Report was prepared to be attached as an exhibit to support mineral property disclosure, including mineral resource and mineral reserve estimates, for the Titan Project. Information in the Report is current at June 4, 2026. 2.2.2 Terms of Reference Mineral resources and mineral reserves in this Report are reported using the definitions in Regulation S- K 1300 (S-K 1300), under Item 1300. IperionX has a large regional ground holding, of which a small subset of the mineral tenure hosts the mineral resource and mineral reserve estimates. For the purposes of this Report, the term “property” is used for the larger ground holding, and the term “Study Area” is used for the area that hosts the mineral resource and mineral reserve estimates and is the subject of the feasibility study. The Study Area has also been referred to as the Little Benton deposit; however, this nomenclature is not used in this Report. All units of measurement used in this report use the International System of Units (SI) metric system unless otherwise stated. Mineral resources and mineral reserves are reported in metric tonnes. Million metric tonnes are reported as “Mt” throughout. Currency is expressed in United States dollars (US$) as identified in the text.


TITAN PROJECT TENNESSEE, U.S. TECHNICAL REPORT SUMMARY ON FEASIBILITY STUDY Page 57 The Report uses US English. 2.3 Qualified Persons MM&A, KGS, and Primero are using the allowance for a third-party firm consisting of mining and related experts to date and sign the TRS, whereas MT’s designated Qualified Person (QP) is Etienne Raffaillac, MAusIMM (Table 2-1). Table 2-1: QPs Responsible by Section Qualified Person Section Responsibility Marshall Miller & Associates, Inc. (MM&A) (Third-Party Firm) 1, 2, 3, 4, 5, 6, 7, 8, 9, 11, 12, 13, 15, 16,17, 18, 20, 21, 22, 23, 24, 25 Karst Geo Solutions, LLC (KGS) (Third-Party Firm) 1, 2, 7, 8, 9 Etienne Raffaillac, MAusIMM (Individual) 1, 2, 10, 14, 22, 23, 24, 25 Primero Group Americas Inc. (Primero) (Third-Party Firm) 1, 2, 15, 18, 19, 22, 23, 24, 25 Note: For Sections 7, 8 and 9 KGS is responsible for Exploration Results while MM&A is responsible for all other content. For Section 15, MM&A is responsible for mining infrastructure and Primero is responsible for non-process plant infrastructure. For Section 18, MM&A is responsible for mining cost estimate and Primero is responsible for process plant cost estimate. All QPs are responsible for subject matter in their individual disciplines for Sections 1, 2, 22, 23, 24 and 25. MM&A, KGS, MT, and Primero had appropriate individual QPs prepare the content that is summarized in this Report. 2.4 Qualified Person Site Visits 2.4.1 MM&A MM&A’s QPs conducted a site visit to the property from April 15–16, 2025. During the visit, they observed McNairy Formation outcrops and exploration drill hole locations, reviewed chip trays with sands collected from exploration drill hole sample intervals and observed the sample storage barrels. At the time of the visit, S&ME geotechnical drilling was in progress. From the working drill rig, MM&A observed and collected samples from the Upper and Lower McNairy Formation members and the Coon Creek Formation. 2.4.2 KGS KGS conducted site visits and observations of exploration drilling to verify the drilling methods, sample collection, bulk sample collection, bulk processing and quality assurance and quality control (QAQC). Exploration drilling was completed before MM&A became involved with the Project. Table 2-2 documents site and laboratory visits conducted by KGS. TITAN PROJECT TENNESSEE, U.S. TECHNICAL REPORT SUMMARY ON FEASIBILITY STUDY Page 58 Table 2-2: KGS Site and Laboratory Visits Summary Visit Start Date Visit End Date Location Scope 14-Oct-2020 16-Oct-2020 Mansfield, TN Initial drilling support and procedure development 24-Feb-2021 26-Feb-2021 Mansfield, TN Phase 2 drilling support and procedures check 5-Apr-2021 5-Apr-2021 Starke, FL Oversight of metallurgical testing process 19-Apr-2021 21-Apr-2021 Mansfield, TN Drilling and sampling review, geochemistry and metallurgical review of results, Initial modelling 15-Jun-2021 17-Jun-2021 Mansfield, TN Bulk density testing, review of results, resource modelling 17-Aug-2021 20-Aug-2021 Mansfield, TN Drilling and sampling review, review of results 1-Dec-2021 5-Dec-2021 Mansfield, TN Drilling and sampling review and support 21-Feb-2022 25-Feb-2022 Mansfield, TN Drilling and sampling review and support 2-May-2022 6-May-2022 Mansfield, TN Drilling and sampling review and support 26-Jun-2022 30-Jun-2022 Mansfield, TN Drilling and sampling review and support 24-Apr-2023 25-Apr-2023 Lakefield, Canada Oversight of analytical procedures 2.5 Report Date Information in the Report is current as at June 4, 2026. 2.6 Information Sources and References The reports and documents listed in Section 24 and Section 25 of this Report were used to support report preparation. The QPs relied upon information provided by IperionX as identified in Section 25. 2.7 Previously Filed Technical Report Summaries IperionX has previously filed a technical report summary on the Project: “Technical Report Summary for Titan Project”, “6-K (Current report) EX-99.2” filed on EDGAR on July 1, 2022; “Technical Report Summary for Titan Project”, “20-F (Annual report - foreign issuer) EX-15.1” filed on EDGAR on October 30, 2024. The report was current as at June 30, 2024. TITAN PROJECT TENNESSEE, U.S. TECHNICAL REPORT SUMMARY ON FEASIBILITY STUDY Page 59 3 Property Description 3.1 Location The Titan Project is located near Camden, Tennessee, US, approximately 128 kilometers (km) (80 miles) west of Nashville, Tennessee, and approximately 11 km (7 miles) northwest of Camden, Tennessee. IperionX has a large regional ground holding (see Figure 3-1), of which a small subset of the mineral tenure hosts the mineral resource and mineral reserve estimates (Figure 3-2). For the purposes of this Report, the term “property” is used for the larger ground holding, and the term “Study Area” for the area that hosts the mineral resource and mineral reserve estimates and is the subject of the feasibility study. TITAN PROJECT TENNESSEE, U.S. TECHNICAL REPORT SUMMARY ON FEASIBILITY STUDY Page 60 Figure 3-1: Titan Property Location


TITAN PROJECT TENNESSEE, U.S. TECHNICAL REPORT SUMMARY ON FEASIBILITY STUDY Page 61 Figure 3-2: Study Area Note: Figure prepared by MM&A, 2026. The Study Area is centered at approximately 36.147349N, -88.20974W. The Study Area is located on the Mansfield, Manleyville, Vale and Bruceton US Geological Survey (USGS) Quadrangles. 3.2 Ownership The Study Area is owned by IperionX Critical Minerals, LLC (IXCM), a wholly-owned subsidiary of IperionX. 3.3 Mineral Title As at June 4, 2026, the property consists of approximately 40.8 square kilometers (km2) (10,091 acres) of surface and associated mineral rights in Tennessee, of which approximately 6.0 km2 (1,490 acres) are TITAN PROJECT TENNESSEE, U.S. TECHNICAL REPORT SUMMARY ON FEASIBILITY STUDY Page 62 owned by IperionX, approximately 5.9 km2 (1,457 acres) are subject to long-term lease by IperionX, and approximately 28.9 km2 (7,144 acres) are subject to exclusive option agreements with IperionX. These exclusive option agreements, upon exercise, allow IperionX access to the surface property and associated mineral rights. The property land list is provided as Table 3-1. The claim locations of the Study Area are shown in Figure 3-3. Table 3-1: Property Land List Land Status km² Acreage* Owner Parcel # (s) County Ownership Interest Grant Date Expiry Date Owned 6.03 1,490 IperionX Critical Minerals LLC 168.014.03 167.006.00 171.009.00 171.009.01 171 005.03 171.009.03 171.009.04 005 002.00 044 016.01 171 002.00 171 003.00 Carroll Henry Surface, Mineral, Water - N/A Leased 0.024 6 Holcomb, W 171 009.02 Henry Surface, Mineral, Water 21-May-26 30-Oct-49 Leased 0.37 91 Borchert 171 013.00 Henry Surface, Mineral, Water 29-Aug-24 30-Oct-49 Leased 0.34 84 Pettyjohn 171 008.00 Henry Surface, Mineral, Water 31-Jan-25 31-Jan-50 Leased 0.98 242 Whistling Wings, LLC 171 011.00 175 013.01 023 002.0 Carroll Henry Surface, Mineral, Water 24-Oct-23 24-Oct-43 Leased 1.02 252 Wilson 171 010.01 005 003.00 171 010.00 Carroll Henry Surface, Mineral, Water 17-Jul-25 30-Nov-49 Leased 3.03 748 Dolan 006.030.00 026.009.00 025.017.00 171.001.00 022.020.00 Carroll Henry Surface, Mineral, Water 31-Mar-26 31-Mar-51 Leased 0.14 34 Holcomb, RE 168.005.02 Henry Surface, Mineral, Water 10-Apr-26 02-Jan-51 Optioned 0.59 146 Farmer 168.011.00 Henry Surface, Mineral, Water 15-Jan-21 15-Jan-27 Optioned 2.80 693 Sanders, Timothy 134.014.01 150.008.05 151.008.03 152.009.00 152.011.00 152.013.03 152.020.01 168.018.01 168.019.04 168.013.00 005.002.01 Carroll Henry Surface, Mineral, Water 30-Nov-20 15-Jan-27 TITAN PROJECT TENNESSEE, U.S. TECHNICAL REPORT SUMMARY ON FEASIBILITY STUDY Page 63 Land Status km² Acreage* Owner Parcel # (s) County Ownership Interest Grant Date Expiry Date Optioned 0.26 65 Holcomb, Richard JD 168.005.00 168.005.01 Henry Surface, Mineral, Water 15-Jan-21 15-Jan-32 Optioned 0.59 147 Palmer, Kyle 064.022.00 063.005.01 Benton Surface, Mineral, Water 1-June-21 1-June-27 Optioned 2.42 599 Palmer, Mark & Jackie 063.005.00 063.006.00 061.010.00 064.020.00 064.021.00 Benton Surface, Mineral, Water 30-May-21 30-May-27 Optioned 1.72 424 Patterson/Medema 171.005.00 168.017.00 171.005.01 048.017.00 171.005.02 171.005.04 169.017.01 Benton Henry Surface, Mineral, Water 30-May-21 30-May-27 Optioned 0.42 103 Hudson/Plant 060.001.00 Benton Surface, Mineral, Water 4-Mar-21 4-Mar-32 Optioned 2.52 622 Noles, Kenneth & Mary 129.027.00 129.027.01 135.005.01 129.028.00 Henry Surface, Mineral, Water 21-Apr-21 21-Apr-32 Optioned 9.12 2,254 McDonald. Michael 162.009.001 162.018.00 163.009.00 162.009.00 McNairy Surface, Mineral, Water 30-Oct-21 30-Oct-32 Optioned 2.01 497 Todd, Gary 165.019.00 010.001.00 Carroll Henderson Surface, Mineral, Water 15-Sep-21 15-Sep-32 Optioned 0.55 136 Wright, Anita 050.020.00 050.036.01 Benton Surface, Mineral, Water 15-Jun-21 15-Jun-32 Optioned 4.72 1,166 Olive, Bobby, Tiffany 166.011.00 010.014.00 010.013.00 011.037.03 010.014.01 Carroll Henderson Surface, Mineral, Water 30-Aug-21 30-Aug-32 Optioned 0.63 155 Sanders, Weldon & Betty 151.008.00 151.009.00 151.009.04 151.009.03 Henry Surface, Mineral, Water 15-Jan-21 15-Jan-27 Optioned 0.55 137 Markham, Donnal 064.010.00 064.007.00 Benton Surface, Mineral, Water 15-Nov-21 15-Nov-32 *The areas are rounded to the nearest whole number. N/A = not applicable. IperionX’s option to lease agreements, upon exercise, allow IperionX to lease the surface property and associated mineral rights from the local landowners, and generally have expiration dates between 2027 and 2032. During the option period, the option to lease agreements provide for annual option payments and bonus payments during periods when drilling is conducted. IperionX’s annual option payments are US$75.00 per acre and the drilling bonuses generally average approximately US$1.00 per drill foot. IperionX’s obligation to make annual option payments and drilling bonus payments cease if the company exercises the option to lease. TITAN PROJECT TENNESSEE, U.S. TECHNICAL REPORT SUMMARY ON FEASIBILITY STUDY Page 64 As at June 4, 2026, the Study area is comprised of approximately 13.4 km2 (3,317 acres) of surface and associated mineral rights, of which approximately 4.9 km2 (1,212 acres) are owned by IperionX, approximately 4.6 km2 (1,147 acres) are subject to long-term lease by IperionX, and approximately 3.9 km2 (958 acres) are subject to exclusive option agreements with IperionX. The Study area holdings are shown in Figure 3-3. Figure 3-3: Parcels Status of the Study Area Note: Figure prepared by MM&A, 2026.


TITAN PROJECT TENNESSEE, U.S. TECHNICAL REPORT SUMMARY ON FEASIBILITY STUDY Page 65 3.4 Surface Rights and Water Rights IperionX has acquired surface, subsurface and water rights to the properties within the area that hosts the mineral resource estimates. Some of the properties have been acquired in fee simple by IperionX, with IperionX now being the sole owner of the surface, subsurface and water rights for such properties. IperionX has entered into long-term ground leases for other properties, with the right to control the surface, subsurface and water rights related to those properties for the term of the respective ground leases. For the rest of the properties, IperionX holds an option to lease such properties conditioned on annual option payments that are current and ongoing. The option agreements grant IperionX the right to evaluate the surface, subsurface and water rights to such optioned properties. 3.5 Royalties For the optioned and leased land, IperionX will pay the landowner the greater of 1) US$75 per acre of the property per year, or 2) the production royalty, generally 5% of net revenues from products mined and removed from the property. All properties owned by IperionX or its subsidiary (TN Exploration, LLC) will not incur a royalty. 3.6 Encumbrances There are no known encumbrances. There are no current material violations and fines, as imposed in the mining regulatory context of the US Department of Labor Mine Safety and Health Administration in the US that apply to the Titan Project. 3.7 Significant Factors and Risks That May Affect Access, Title or Work Programs To the extent known to MM&A, there are no other significant factors and risks that may affect access, title, or the right or ability to perform work on the Study Area that are not discussed in this Report. TITAN PROJECT TENNESSEE, U.S. TECHNICAL REPORT SUMMARY ON FEASIBILITY STUDY Page 66 4 Accessibility, Climate, Local Resources, Infrastructure and Physiography 4.1 Accessibility General access to the Study Area is via a well-developed network of primary and secondary roads. The site can be accessed via Highway 641 north 41 km (25 miles) from Interstate 40 near the town of Camden, Tennessee, Reynoldsburg Road for 1.6 km (1.0 mile), Pleasant Hill Road for 1.6 km (1.0 mile) and Little Benton Rd, a gravel road, for 4.8 km (3.0 miles). Little Benton Road goes through the Study Area. US Interstate I-80 is 35.4 km (22 miles) to the south of the Study Area. Tennessee overall has a network of highways, including eight interstate highways, which can provide ready access to most of the US consumer markets. Tennessee is the third largest rail center in the US. The CSX Transportation (CSX) Memphis subdivision mainline runs through Camden (approximately 4.8 km [3.0 miles] south of the Titan Project). The Kentucky-West Tennessee Railway connects to this mainline approximately 2.4 km (1.5 miles) east of the Titan Project. There are more than 1,600 km (994 miles) of navigable waterways in Tennessee, which access all other major waterways in the eastern US. A major barge-loading point is located 24 km (15 miles) from the Titan Project. There are four commercial airports near Camden, including two international airports at Memphis (approximately 217 km [135 miles] to the southwest) and Nashville (approximately 137 km [85 miles] to the east). 4.2 Climate and Length of Operating Season Camden has a humid subtropical climate with hot and muggy summers and cold and wet winters. The temperature typically varies from -0.5 degrees Celsius (°C) to 32.7°C and is rarely below -8°C or above 36°C. August is the hottest month for Camden with an average high temperature of 31.6°C. Annual rainfall for the area is 136.6 centimeters (cm) (53.8 inches). Considering the climate of the Camden area, mine operations at Little Benton should be possible year- round. Severe weather events may briefly interrupt mine operations. 4.3 Local Resources and Infrastructure The Study Area is located near the towns of Camden and Paris, Tennessee. The existing infrastructure includes power and gas, with 161-kilovolt (kV) transmission lines near the Study Area. IperionX intends to implement fully renewable power sourcing options for the Titan Project, TITAN PROJECT TENNESSEE, U.S. TECHNICAL REPORT SUMMARY ON FEASIBILITY STUDY Page 67 including the assessment of existing on-grid solutions currently provided by existing power generators and suppliers in the general Project area. Additional communications will be required with the Tennessee Valley Authority (TVA), local power supplier, and gas suppliers. Water supply is planned to be sourced from nearby surface water bodies, with additional water from shallow groundwater sources. Personnel are assumed to live in surrounding communities. No accommodations camp will be required. Local active sand mining, gravel mining and timber operations could be sources of recruiting experienced operators. Infrastructure required for the mining operations envisaged in this Report is discussed in Section 13, Section 14, and Section 15. These Report sections also discuss water sources, electricity, personnel, and supplies. 4.4 Topography, Elevation and Vegetation The Property is in the south-central portion of the United States. The terrain includes gently rolling hills beside level drainages of the Big Sandy River and Bear Creek that dissect the Study Area. Surface elevations at the Study Area range from approximately 175 meters (m) (574 feet) above sea level in the upland regions to approximately 100 m (328 feet) at the stream level. Trees common to wooded areas of the property include several classic hardwood oaks (white, black, red, and chestnut), hickory, and maple trees. Other common trees include tulip poplar, American beech, and black gum. Understory trees include dogwood and eastern redbuds. Common plants and flowers of wooded or non-wooded property include ferns, asters, goldenrod, ironweed, cardinal flower, and beebalms. Agricultural fields are also common in this region. TITAN PROJECT TENNESSEE, U.S. TECHNICAL REPORT SUMMARY ON FEASIBILITY STUDY Page 68 5 History No previous heavy mineral sand mining has occurred in the region. Reportedly, the general Study Area has been explored for heavy mineral sands since the 1950s, as the McNairy Formation was known to contain high concentrations of heavy minerals such as rutile, zircon, rare earth minerals, and others based on work by federal and state agencies. DuPont de Nemours, Inc., Kerr-McGee Corporation, RGC Mineral Sands Inc., Iluka Resources Inc., Altair International Inc., and Astron Corporation Limited are known to have evaluated the McNairy Formation- hosted deposits in the Titan Project region at various times. IperionX conducted exploration drilling in 2020, 2021 and 2022 across the Titan Property which provided the drill and samples records for mineral resource estimates (Figure 3-2 and see Section 7.2). An initial mineral resource estimate was prepared in 2021 by KGS, with an update in 2023 by MM&A. In 2025, IperionX commissioned 130 quantitative evaluations of materials by scanning electron microscopy (QEMSCAN) analyses from 43 existing drill hole locations mainly on the owned and leased Study Area tracts.


TITAN PROJECT TENNESSEE, U.S. TECHNICAL REPORT SUMMARY ON FEASIBILITY STUDY Page 69 6 Geological Setting, Mineralization, and Deposit 6.1 Deposit Model Heavy mineral sands are created through physical and mechanical concentration of detrital minerals liberated through weathering. The weathering portion of this process occurs inland, while the deposition of these minerals ultimately occurs along coastlines through features such as deltas, foreshore, shoreface, barrier islands, dunes, and tidal lagoons. The McNairy Formation is an example of a deltaic sequence. 6.2 Regional Geology Regionally, the Project Area is situated in the East Gulf Plain within the Atlantic Coastal Plain Physiographic Province of the US. The East Gulf Plain syncline of the Mississippi Embayment has a shallow southward plunge, exists east of the Mississippi River, and extends from southern Illinois south into Mississippi and Alabama (Figure 6-1). Locally, the basin is filled with Cretaceous to recent Quaternary age sedimentary rocks and sediments. The deposition represents a pro-grading deltaic environment during a regressive (sea-level lowering) sequence. TITAN PROJECT TENNESSEE, U.S. TECHNICAL REPORT SUMMARY ON FEASIBILITY STUDY Page 70 Figure 6-1: East Gulf Plain Note: Figure prepared by MM&A, 2026. Figure 6-2 shows the regional geology encompassing the Titan Project. TITAN PROJECT TENNESSEE, U.S. TECHNICAL REPORT SUMMARY ON FEASIBILITY STUDY Page 71 Figure 6-2: Regional Geologic Map Encompassing Titan Project Geologic Map Key: Qal- Quaternary, Tcw- Claiborne and Wilcox Formation, Tm- Midway Group including Porters Creek Clay and Clayton Formation, Km- McNairy Sand, Kcc- Coon Creek Formation, Kc- Coffee Sand. Source: mrdata.usgs.gov/geology/state/. Published [2017] 6.3 Local Geology The local near-surface geology represents a pro-grading deltaic environment during a regressive marine sequence (Figure 6-3). This is evidenced by the coarsening upward sequence grading from the glauconitic clay-rich Coon Creek Formation to the finer-grained lower member of the McNairy Formation, to the coarser-grained upper member of the McNairy Formation. TITAN PROJECT TENNESSEE, U.S. TECHNICAL REPORT SUMMARY ON FEASIBILITY STUDY Page 72 Figure 6-3: Idealized Stratigraphic Column 6.4 Deposit Geology 6.4.1 Lithologies Stratigraphically, the subsurface of the Study Area consists of the McNairy and Coon Creek Formations (refer to Figure 6-3) underlying a thin brown topsoil layer plus alluvial deposits that are often light to burnt orange in color. The McNairy Formation dips gently to the west and consists of two members, the Upper McNairy Formation member (a beige sand) and the Lower McNairy Formation member (a beige, or beige-orange or white clayey sand). In some drill holes, the Lower McNairy Formation sand becomes grayer in color closer to the top of the Coon Creek Formation.


TITAN PROJECT TENNESSEE, U.S. TECHNICAL REPORT SUMMARY ON FEASIBILITY STUDY Page 73 The top of the Coon Creek Formation is often clayey sand or clay, usually gray or black in color, occasionally beige in color. Drill records indicate the average thicknesses of the Upper and Lower McNairy Formation members in the Study Area are approximately 18 m (59 feet) and 19 m (62 feet), respectively. The McNairy Formation thickness can vary with topography. In the Study Area, the formation thickness ranges from 5 m to 67 m (16 feet to 220 feet) with the greatest thicknesses to the west. Where the formation thins, commonly the Upper McNairy Formation member is commonly thin or absent, and the Lower McNairy occurs directly below the overburden. The average elevation of the McNairy Formation ranges between near 136 m (446 feet) at the top of the Upper McNairy Formation to near 106 m (348 feet) at the base of the Lower McNairy Formation. In the exploration drill logs, material above the Upper McNairy Formation was logged as alluvium and topsoil. In many cases, topsoil was assigned to material other than the thin organic topsoil that actually existed. On review of the geotechnical drill hole logs and soils reports, the topsoil interval of the area is approximately 7.62 cm to 30.48 cm thick (3 to 12 inches). 6.4.2 Structure Though basement faulting is present in the region, it does not appear to impact the sedimentary stratigraphy at the Project scale. 6.4.3 Mineralization The heavy mineral sands are hosted in the McNairy Formation sands, with the higher heavy minerals grades mainly in the lower portion of the Lower McNairy Formation member. Titan mineral sands consist mainly of two principal product streams, titanium (Ti) [rutile (TiO2), ilmenite (FeTiO3), pseudorutile (Fe2Ti3O9)] minerals and zircon (ZrSiO4) but also contain rare earth elements [monazite, xenotime], staurolite (Fe2+ 2Al9O6(SiO4)4(O,OH)2) and other products of lesser amounts [tourmaline]. The McNairy Formation upper member mineralized extent is more limited at the Project and in places is separated from the Lower McNairy Formation member by a barren coarse sand (Figure 6-4). Mineralization in both members had been traced for over 6.0 km along strike. The host McNairy Formation varies from 5 m to 67 m thick (16 to 220 feet), averages 28 m (92 feet) in thickness. The mineralization generally consists of thick zones of stacked heavy mineral sand laminations; however, some more massive bands of mineralization are present where individual laminations are not present. The primary minerals associated with the mineralized horizons are altered ilmenite, zircon, rutile, staurolite, kyanite, monazite and xenotime with some variation in the proportion of these minerals between the upper and lower members. Generally, the finer-grained Lower McNairy Formation member contains more high-value heavy mineral sands including rutile, zircon, monazite, and xenotime than the upper coarser-grained McNairy Formation member. The gangue minerals are predominantly quartz and clays. TITAN PROJECT TENNESSEE, U.S. TECHNICAL REPORT SUMMARY ON FEASIBILITY STUDY Page 74 The range of samples collected by drillhole through the deposit are seen in Figure 6-4. The sand intercept assay trace indicates the range of samples collected for analysis. The high-grade assay trace represents samples with greater than 1.0 percent Total Heavy Minerals (% THM). Figure 6-4: Example of Mineralization in Relation to Stratigraphy Note: Figure prepared by MM&A, 2026. TITAN PROJECT TENNESSEE, U.S. TECHNICAL REPORT SUMMARY ON FEASIBILITY STUDY Page 75 7 Exploration 7.1 Exploration 7.1.1 Grids and Surveys The coordinate system and datum used for mineral resource modeling is UTMZ16N, NAD83. A topographic surface was generated from the state of Tennessee’s TN LiDAR program. In March of 2025, G-Squared L.L.C. (G-Squared) provided IperionX with mapping of features of the Study Area which included aerial topography from June 9, 2023. The aerial topography has a vertical compliance of +/- 0.5 feet. The digital contours, provided in 0.7-m (2-foot) contours, were converted to meters for use in the geologic and block model process. The digital topography covered Study Area property tracts, but not the full extent of the resource block model. Additional digital elevation topography from USDA:NRCS:Geospacial Data Gateway-Home [2017], with a vertical compliance of +/- 15 cm (5.9 inches), was spliced to the supplied topography for complete coverage of the block model extent. Both topographies are suitable for FS reporting. The elevation of the topography ranges from a high near 177 m (580 feet) to a low near 110 m (361 feet). The G-Squared topography was spliced into the TN Lidar topography for the geologic model development. The Lidar has a resolution of +/-1 m (3.28 feet) and the G-Squared topography has a lateral accuracy of 1 m (3.28 feet) and vertical accuracy of 15 cm (5.9 inches). 7.1.2 Exploration Sampling IperionX has completed no geological mapping or geophysical surveys in the Project area. All exploration is conducted using drill methods. The property retains exploration potential to the north, east, and south. 7.1.3 Exploration Potential Exploration potential could include additional drill holes east of the Big Sandy River and along strike to the southwest and northeast of the Study Area. 7.2 Drilling 7.2.1 Overview Drilling in the overall property area occurred in 2020, 2021, and 2022 and totals 313 holes (11,382 m or 37,342 feet), as summarized in Table 7-1. All drilling was completed by IperionX. TITAN PROJECT TENNESSEE, U.S. TECHNICAL REPORT SUMMARY ON FEASIBILITY STUDY Page 76 Table 7-1: Titan Exploration Drilling Summary Resource Area IperionX HLS Sample Count Mineral Composition Analysis Type Drill Hole Count % Length (m) Length (Avg. m) Analyzed Count % of Area Hole Count Study RC 16 5 837 52 - - - Study Sonic 140 45 5,645 40 4,130 84 60 Property (Camden) Sonic 86 27 1,960 23 1,282 13 15 Property (North) Sonic 64 20 2,630 41 1,687 3 5 Property (Other tracts) Sonic 7 2 311 44 687 0 0 313 - 11,383 - 7,786 100 - Note: HLS - Heavy Liquid Separation RC - Reverse Circulation There are an additional 11 roto-sonic drill holes that were completed as part of a hydrogeological study by HDR. In 2025, S&ME, Inc. (S&ME) drilled an additional 44 holes with a total drilled depth of 1,693 meters (5,554 feet) for mine pit slope geotechnical evaluations and 18 holes with a total drilled depth of 160 meters (525 feet) for wet concentrator plant (WCP) geotechnical assessment, simultaneous to the geological model development for this TRS. Like the HDR holes, the S&ME holes were not used for resource development. 7.2.2 Drilling Used in Mineral Resource Estimate Drilling in the Study Area comprises 156 drill holes, this includes 16 reverse circulation (RC) drill holes (837 m or 2,746 feet) and 140 roto-sonic drill holes (5,645 m or 18,520 feet) (see Table 7-1). Drill hole collar locations are shown in Figure 7-1.


TITAN PROJECT TENNESSEE, U.S. TECHNICAL REPORT SUMMARY ON FEASIBILITY STUDY Page 77 Figure 7-1: Titan Exploration Drilling Summary in Study Area Note: Figure prepared by MM&A, 2026. The area covered by the drilling is roughly 6.6 km (4.1 miles) (north-south) by 3.7 km (2.3 miles) (east- west). The area that hosts the mineral resource estimate is further broken up into several areas based on land holdings (land agreements). These range from 1.58 ha (3.9 acres) for the smallest area to 161 ha (397 acres) for the largest area (refer to Figure 3-3). Figure 7-1 shows the drill hole locations of the Study Area. 7.2.3 Drilling Excluded for Estimation Purposes A total of 89 drill holes were excluded from the mineral resource estimation. TITAN PROJECT TENNESSEE, U.S. TECHNICAL REPORT SUMMARY ON FEASIBILITY STUDY Page 78 Sixteen RC drill holes drilled in 2021 were not used because of the high likelihood of down-hole sample contamination. Eleven roto-sonic drill holes were completed as part of a hydrogeological study for IperionX by HDR. These drilled holes were not used for resource estimation purposes. In 2025, S&ME, Inc. (S&ME) drilled an additional 44 holes with a total drilled depth of 1,693 m (5,554 feet) for mine pit slope geotechnical evaluation purposes and 18 holes with a total drilled depth of 160 m (525 feet) for the wet concentrator plant geotechnical assessment. 7.2.4 Metallurgical Drilling The location of bulk samples taken for metallurgical testwork is indicated in Figure 7-2. These samples were taken via a roto-sonic drill rig from twinned holes adjacent to previously analyzed holes. TITAN PROJECT TENNESSEE, U.S. TECHNICAL REPORT SUMMARY ON FEASIBILITY STUDY Page 79 Figure 7-2: Bulk Sample Location Map Note: Figure prepared by MM&A, 2026. 7.2.5 Drill Methods Drill companies included M&W Drilling of Knoxville, TN; Drillwise USA of Holladay, Tennessee; and Betts Drilling of Atlanta, Georgia. Drill rigs included a Geoprobe 5140LS roto-sonic drill rig (Geoprobe) a Terrasonic 150c rig (Terrasonic), and a Wallis RC rig. The Geoprobe core barrel was 3-m (9.8 feet) long, and 10 cm (3.9 inch) in diameter with a 15-cm (5.9 inch) diameter outer casing. The Terrasonic core barrel was 3-m (9.8 feet) long and had a 10-cm (3.9 inch) diameter core barrel. Drill casing was used periodically when re-entering drill holes that had caved. Select drill holes were re-drilled and re-analyzed as part of data validation. TITAN PROJECT TENNESSEE, U.S. TECHNICAL REPORT SUMMARY ON FEASIBILITY STUDY Page 80 All drilling for the Study Area that is used in mineral resource estimation has been roto sonic. The roto- sonic method alternates advancement of a core barrel and a removeable casing (casing is used when needed to maintain sample integrity). The sonic drilling method has been shown to provide representative unconsolidated mineral sands samples across a variety of deposits as it is a direct sampling method of the formation(s). At times, water was used to create a head to reduce the expansion of the clay-rich Coon Creek Formation sediments. Expansion of the Coon Creek Formation lithologies by up to 0.9 m (2.9 feet) length in the core barrel has been observed. Field procedures included coring 3-m (9.8-foot) sections of material at a time with a roto-sonic drill rig. All holes were drilled at a 90-degree angle to horizontal (vertical holes), which is essentially perpendicular to mineralization. Generally, holes are drilled without the use of water and typically without the use of casing. After each 3-m (9.8-foot) section was extracted, drill teams recovered the core in equal length plastic sleeves. Geologists then divided the core into two 1.5-m (4.9-foot) sections that were prepared for laboratory testing for lithologic significance and heavy mineral potential. After termination, holes were backfilled, and global positioning system (GPS) coordinates were taken once the drill rig was moved from the drill hole. Field notes were recorded in the database. 7.2.6 Core Logging Core logging core material characteristics were both qualitative (physical characteristics) and quantitative (estimation of THM% and the percent slimes (%Slimes)). Once the core was divided into 1.5-m (4.9-foot) sections, core samples were photographed and logged on paper tickets with lithological and mineralogical parameters to determine a main geological unit, and mineralized zone.  Qualitative parameters included lithology, grain-size, roundedness, sorting, color, and formation, while the quantitative parameter consisted of heavy mineral percent (HM%) estimates. The combined log parameters were used to help determine the depositional environment. Field analysis included the geologist panning samples for heavy mineral percentages using samples collected down the center of each 1.5-m (4.9-foot) section and molded into spheres approximately 4 cm (1.6 inch) in diameter. This was done for a first approximation of THM %. After categorization, two 2-kilogram (kg) samples were taken down the center of each section, mimicking the panning sample. One sample was kept for IperionX records, and one was used for laboratory tests including Heavy Liquid Separation. Quality check samples were taken 2% of the time and duplicates were taken 3% of the time. Holes were terminated 3 m (13 feet) into the Coon Creek Formation, which was identified by its dark grey color and sticky clay texture. Total depth of each drill hole was recorded, as well as any drilling issues/concerns that could impact sample representativeness.  All pertinent sample information (geology, sample ID, etc.) was collected on sequentially numbered tag books provided by the laboratory. The tag was inserted into the sample bag and the information from


TITAN PROJECT TENNESSEE, U.S. TECHNICAL REPORT SUMMARY ON FEASIBILITY STUDY Page 81 the tag book was entered nightly into the GeoSpark Consulting Inc. (GeoSpark) database. A chip tray was maintained for each drill hole to keep a representative sample for each interval for later use during geological interpretation. Heavy mineral estimations can be impacted by several factors in the field, so it was important to implement procedures that addressed this possible occurrence. High-grade bands within a section can significantly increase overall HM%. This was avoided by taking an equal distribution of a panning sample in a line down the middle of a core section. High clay content can also affect the portrayal of heavy minerals in the pan. This is caused by unprocessed clay fragments that can contain heavy minerals that were not liberated. To prevent this issue, IperionX’s geologists made sure to wear down all clay bits through water and mechanical movements. Material such as “sluff” or sand that had fallen into, or down the hole and was then retrieved as part of the next 3-m (9.8 feet) core interval, can create an erroneous view of lithology. To prevent this issue, geologists were briefed on what sluff looked like in the core, particularly because homogenized sludge may look like a previously retrieved section. Sluff was usually only about 0.3 m (0.9 feet) of material in the 3-m (9.8 feet) length. Where sluff was identified, it was cut from the core section. 7.2.7 Core Recovery Each core was measured, and the recovery was calculated as length of recovered core divided by length drilled (typically 3 m [9.8 feet]). Recovery was generally greater than (>) 95%. 7.2.8 Collar Surveys Drill collars were surveyed by IperionX personnel using a Trimble hand-held GPS instrument. Drill hole collars have an accuracy of approximately 10 m (32.8 feet). 7.2.9 Downhole Surveys All drilling was vertical. As the drill holes are short (<40 m depth on average), no down-hole surveys were taken as there was limited chance that in the short core run in unconsolidated sediments that the drill holes would deviate significantly. 7.2.10 Drilled Versus True Thickness The intercepts were reported as apparent thicknesses. These intercept thicknesses are typically slightly greater than the true widths. The mineralized units dip at approximately one degree to the west and mineralized horizons generally follow this orientation. TITAN PROJECT TENNESSEE, U.S. TECHNICAL REPORT SUMMARY ON FEASIBILITY STUDY Page 82 7.2.11 Comment on Material Results and Interpretation Drill hole spacing is generally 150 x 300 m (492 x 984 feet). Some areas have difficult access and drill spacing in those areas is wider spaced, approximately up to 300 x 600 m (984 x 1,968 feet). The shorter hole spacing distances are aligned with the structural dip direction, and the longer spaced holes are aligned with strike direction (approximately 30 degrees east of north). The mineralogical assemblage data are constrained to drill hole sample composites. Though this approximates the expected assemblage well, it also presents a lack of vertical granularity input into the resource model. A lack of down-hole surveys represents a reduction in confidence in the drill strings; however, this risk is very minimal as the material is unconsolidated and the holes average a depth of 40 m (131 feet). Overall, the drill data are adequate to support mineral resource estimation. 7.3 Hydrogeology Baseline groundwater and surface water assessment data collection was completed in 2021 by HDR. This included installation of monitoring and aquifer test wells, together with a 72-hour aquifer pumping test conducted in June 2021. HDR completed six bi-monthly groundwater and surface water monitoring events from June 2021 to April 2022. Figure 7-3 indicates the groundwater and surface water sampling locations. TITAN PROJECT TENNESSEE, U.S. TECHNICAL REPORT SUMMARY ON FEASIBILITY STUDY Page 83 Figure 7-3: Groundwater and Surface Water Sampling Locations Note: Figure prepared by HDR, 2022. TITAN PROJECT TENNESSEE, U.S. TECHNICAL REPORT SUMMARY ON FEASIBILITY STUDY Page 84 7.3.1 Aquifer Properties The aquifers had the following properties: > Transmissivity ranged from 130 to 223 square meters per day (m2/day) in the shallow aquifer (shallow) and 167 to 223 m2/day in the deeper portion of the unconsolidated aquifer (deep). > Hydraulic conductivity ranged from 4.8 to 8.1 m/day (shallow) and 6.1 to 8.1 meters per day (m/day) (deep). > Storativity ranged from 1.5 x 10⁻¹ – 8.8 x 10⁻² (shallow) and 2.1 x 10⁻¹ – 4.6 x 10⁻⁵ (deep). 7.3.2 Groundwater The groundwater monitoring network consisted of eight monitoring wells (MW-1 through MW-8), one aquifer test pumping well (PW-1), and four paired (shallow and deep) observation wells (OW-1S, OW-1D, OW-2S, and OW-2D). Monitoring wells were installed to provide baseline groundwater quality data. The pumping and observation wells were installed to facilitate a 72-hour aquifer test. Subsequent to well installation, HDR conducted a 72-hour aquifer pumping test from June 8 to 11, 2022, at pumping well PW-1. The aquifer test was used to estimate the physical parameters of the aquifer to understand information on well frequency and pumping rates for potential dewatering. Test results were analyzed using the Cooper-Jacob and Theis straight line methods for time drawdown, residual drawdown/recovery, and distance drawdown. Six bi-monthly groundwater level gauging tests were conducted from June 2021 to April 2022. Depth to water from the top of well casing was recorded using an electronic water-level meter. Depths to water ranged from 2.12 m (6.96 ft) below the top of the casing in MW-6 (February 2022) to 26.7 m (87.6 feet) below the top of the casing in OW-2D (April 2022). Based on the groundwater elevational data obtained between June 2021 and April 2022, potentiometric surface maps were generated for each gauging event. In general, groundwater flows from an elevational high at MW-7 toward topographic lows near MW-1, MW-4, MW-6, and MW-8. The predominant direction of local groundwater flow is east–southeast toward the Big Sandy River. Groundwater samples were collected by HDR during six sampling programs between June 2021 and April 2022. Purging was conducted via low-flow methods and was considered complete when the water table and field parameters had stabilized in accordance with the criteria specified below. Field measurements were obtained using a calibrated water quality meter, and included: > Turbidity (10% for values >5 nephelometric turbidity units (NTUs) (if three turbidity values are <5 NTUs, the values are considered stabilized). > Dissolved oxygen (DO) (10% for values >0.5 mg/L, if three DO values are <0.5 mg/L, the values are considered stabilized). > Specific conductance (3%).


TITAN PROJECT TENNESSEE, U.S. TECHNICAL REPORT SUMMARY ON FEASIBILITY STUDY Page 85 > Temperature (3%). > pH (± 0.1 unit). > Oxidation reduction potential (ORP) (± 10 millivolts). Samples were placed on ice and shipped under chain of custody procedures to Pace Analytical Services LLC (Pace) for analysis. Sample handling and custody were performed in accordance with the US Environmental Protection Agency (EPA) Guidance for Field Samplers. Groundwater sample results of analyses were compared to the TDEC General Water Quality Criteria standards established in Rule 0400-40-03.03(1)(j) for protection of domestic water supplies. A summary of the results is as follows: > In MW-2, chromium exceeded the criteria of 100 micrograms per liter (μg/L) with a concentration of 153 μg/L during the February 2022 sampling event. > In MW-3, chromium exceeded the criteria of 100 μg/L with a concentration of 368 μg/L during the February 2022 sampling event. > In MW-4, arsenic exceeded the criteria of 10 μg/L with a concentration of 10.4 μg/L during the June 2021 event. Lead exceeded the criteria of 5 μg/L with concentrations of 17.5 μg/L and 8.4 μg/L during the June 2021 and August 2021 sampling events, respectively. > In MW-8, cadmium slightly exceeded the criteria of 5 μg/L with a concentration of 6.5 μg/L during the June 2021 sampling event. Chromium exceeded the criteria of 100 μg/L with a concentration of 182 μg/L during the June 2021 sampling event. > In OW-1D, chromium exceeded the criteria of 100 μg/L with concentrations of 442 μg/L (October 2021), 363 μg/L (December 2021), 406 μg/L (February 2022), and 170 μg/L (April 2022). Lead slightly exceeded the criteria of 5 μg/L with a concentration of 7.8 μg/L during the June 2021 sampling event. Nickel exceeded the criteria of 100 μg/L with concentrations of 214 μg/L (October 2021), 200 μg/L (December 2021), and 245 μg/L (February 2022). > In OW-2D, chromium exceeded the criteria of 100 μg/L with a concentration of 160 μg/L during the August 2021 sampling event. Nickel slightly exceeded the criteria of 100 μg/L with a concentration of 103 μg/L during the August 2021 sampling event. > In PW-1, lead slightly exceeded the criteria of 5 μg/L with a concentration of 5.2 μg/L during the August 2021 sampling event. > No exceedances were reported during the six sampling events between June 2021 and April 2022 in the samples collected from wells MW-1, MW-5, MW-6, MW-7, OW-1S, and OW-2S. > Field parameters were generally consistent for each well throughout the monitoring period. Groundwater is slightly acidic in the Project area, and pH was below the TDEC General Water Quality Criteria standard of 6.0 during at least one, if not all, sampling events at each location. TITAN PROJECT TENNESSEE, U.S. TECHNICAL REPORT SUMMARY ON FEASIBILITY STUDY Page 86 The presence of naturally-occurring metals at concentrations exceeding TDEC General Water Quality Criteria standards is common in the Highland Rim Physiographic Provence of Tennessee. Exceedances likely do not represent anthropogenic effects or groundwater quality violations, given the relatively undeveloped nature of the Project area. 7.3.3 Surface Water HDR measured stream flow from six surface water locations (SW-1 through SW-6) during four programs between October 2021 and April 2022. Flow measurements at each surface water location were taken using the float method and ranged from 274 liters per second (L/sec) at SW-4 in February 2022 to 5 L/sec at SW-1 in December 2021. SW-1, SW-5, and SW-6 were observed to be either stagnant or dry during at least one monitoring program. Grab samples were collected from each surface water sampling location bi-monthly from October 2021 to February 2022 (SW-6 was also sampled in April 2022). Prior to sample collection, field parameters (including temperature, conductivity, pH, ORP, and DO) were measured with a water quality meter. Samples collected were analyzed by Pace Analytical Services, LLC of Huntersville, North Carolina, for the following: > metals using EPA method 6010D > mercury using EPA Method 7470A > alkalinity using standard method (SM) 2320B > total dissolved solids (TDS) using SM 2540C > total Kjeldahl nitrogen using EPA Method 351.2 > nitrate and nitrite using EPA Method 353.2 > total nitrogen (calculation) > chloride, fluoride, sulfate using EPA Method 300.0 > cyanide using SM 4500-CN Samples collected were compared to the TDEC General Water Quality Criteria standards and no exceedances were observed during the sampling programs. 7.3.4 Groundwater Flow Model HDR developed an initial groundwater model in December 2022 to estimate the amount of water that would be expected to be encountered to allow future mining activities, and the effects of the associated drawdown on groundwater levels in the area. HDR’s 2022 model only considered mining of the currently TITAN PROJECT TENNESSEE, U.S. TECHNICAL REPORT SUMMARY ON FEASIBILITY STUDY Page 87 permitted mine area. In late 2025 and early 2026, HDR developed a second, larger hydrogeological model and completed two separate model iterations, as described in a report titled “Groundwater Flow Model Addendum, IPX, Henry and Carroll Counties, TN”, submitted to IperionX on March 30, 2026. The 2026 model was an expansion of the 2022 model, extended to cover the entire expected life-of-mine area (see Figure 7-4). Figure 7-4: Groundwater Model Area for 2022 HDR Model (Yellow) Compared to 2026 HDR Model (Blue) Note: Figure prepared by HDR, 2026. For both models, dewatering and its effects on regional groundwater resources were simulated using a three-dimensional (3-D) groundwater flow model using the USGS groundwater modeling software MODFLOW-USG. HDR compiled hydrogeological data to create a digital conceptual site model using Aquaveo GMS, a 3-D groundwater model pre-processing software, as well as ArcGIS Pro 3.4.4. Once the model reasonably reproduced measured conditions (e.g., aquifer tests conducted at the site), the model was used to simulate future dewatering conditions. Data from on-site testing and drilling, as well as from regional and national sources such as the Tennessee Geological Survey, National Oceanic and Atmospheric Administration, and the USGS, were compiled into a 3-D database to develop the digital conceptual site model. Groundwater modeling assumptions include the following: TITAN PROJECT TENNESSEE, U.S. TECHNICAL REPORT SUMMARY ON FEASIBILITY STUDY Page 88 > The 2026 model included updated geological unit surfaces based on 44 geotechnical exploration drill holes completed by S&ME in 2025. The unit surface edits resulted in model layer thickness updates that enhanced the representative nature of hydraulic conductivity in the units, as compared to the previous model. > The 2026 model involved grid refinement to extend the model to fit the larger mining area, while providing more detail in the pit areas. > The 2026 model was calibrated to mean water levels measured in 12 monitoring wells at the Site, using the same calibration targets as the 2022 model. > Model calibration targets represent the limited period when monitoring was undertaken. The variability of conditions could be larger than represented by the monitoring data and the monitoring data could represent outlier conditions which bias the model outcome. This potential for bias creates some uncertainty in the model outcome. > The 2026 model included an update of the modelling sequence to match the larger proposed mining area. > Heterogeneity in the subsurface conditions may not be fully captured by the geological data used to create the model and is necessarily generalized in the model. Such varying conditions result in uncertainty in the model outcome. > It is assumed that constant-density Darcian-flow conditions occur throughout the model domain at all times such that MODFLOW is an acceptable code to simulate the movement of groundwater in the shallow subsurface. Conditions may occur occasionally in which these assumptions do not hold. Examples would include: 1) seasonal temperature changes of the Big Sandy River affecting groundwater temperatures, thereby changing the viscosity and density of water, and thus the assumed constant hydraulic conductivity of the aquifer materials; and 2) when the same effects occur due to increase of concentrations of dissolved mass in the groundwater system. These conditions likely contribute to uncertainty in the model; however, other factors such as unknown heterogeneous subsurface conditions and time variability in aquifer stresses and recharge are likely larger sources of uncertainty. The groundwater model shows the effects of dewatering on the streams, wells and wetlands vary over time depending on the position of mining activity and are overall minimal and transient. There is one wetland, WD9, which is excavated and portions of five stream reaches that are excavated during the mine life. Based on the results of the model, the identified wells that are not within the mine extent, should not have any noticeable changes to their yield. The impacts on baseflow to the wetlands and streams will be dependent upon what time of year the greatest effects of the dewatering are seen (i.e., the effects of baseflow can be offset by runoff during wetter periods of the year). Overall, the effects on surface water features are transient and once the dewatering operations are completed the streams, wetlands, and wells should return to their pre-mine dewatering states, except for the wetland, wells and streams that are excavated during mining operations.


TITAN PROJECT TENNESSEE, U.S. TECHNICAL REPORT SUMMARY ON FEASIBILITY STUDY Page 89 HDR completed groundwater models for two separate dewatering scenarios, one considering dewatering wells along the pit perimeter and another considering a reduced number of dewatering wells along the pit perimeter in combination with a series of slurry walls also along the pit perimeter. Project scheduling and necessary model iterations resulted in the groundwater flow modeling being conducted on a slightly different mine plan, as compared to the final mine plan used for the FS. The mine plan that was used for the groundwater modeling and the final mine plan relied upon for the FS are nearly identical in location and similar in overall pit size, with some variation in mining sequence in the first five years of the mine life. To match the estimated groundwater inflow results from HDR’s model to the final pit layout and mining sequence, each groundwater-modeled pit area was coupled with the associated model-estimated inflow to determine an average groundwater inflow rate per acre mined for each area. The final mine plan area and sequencing was overlain onto the inflow areas defined by the HDR modeling, and inflows were estimated for each final mine plan sequence area by applying the model-determined gallon per minute per acre values. The final mine plan considers that no dewatering wells or slurry walls are necessary to maintain adequately stable pit walls, so the total inflow values estimated by the HDR modeling are utilized (total of estimated flow from dewatering wells and toe drains within the bottom of the advancing pit). A graph of the estimated total pit groundwater inflow variations over the life of mine, as determined via the process described above, is presented in the figure below. Figure 7-5: Graph of Estimated Mine Inflow Over Life of Mine Note: Figure prepared by HDR, 2026. 7.3.5 Site-Wide Water Balance Water management on the site will involve dewatering the mine pits, supplying the WCP, ensuring stability of the in-pit backfill material, and ensuring compliant discharge at the NPDES outfalls. Groundwater that enters the pit will be collected in a sump near the mining face and pumped into settling TITAN PROJECT TENNESSEE, U.S. TECHNICAL REPORT SUMMARY ON FEASIBILITY STUDY Page 90 ponds on the perimeter of the property. Water that is pumped to the ponds will be settled to remove turbidity and suspended solids. If necessary, pH control of the water will be conducted within the settling ponds. Water from the ponds will either be pumped to the WCP to be used for processing (if necessary) or it will be discharged through permitted NPDES outfalls. The water management plan includes a proposed water withdrawal point to be established near the south end of the Titan property, along the Big Sandy River Drainage Canal. Inflow water from the mine pits and water from the water withdrawal point on the Big Sandy River provide two potential sources of water to supply the WCP. The water withdrawal point along the river is considered the primary source, with the pit inflow water considered as supplemental (as needed) or backup. A small potable water supply at the WCP site will be provided via a drilled water well. Water removed from the tailings via filtering will be recycled in the WCP process or discharged through the permitted NPDES outfall at the WCP. The moisture remaining in the tailings will be returned to the pits during backfilling. Water level in the backfilled tailings structure will be monitored and pumped, as necessary, to maintain water table levels to ensure backfilled tailings slope stability in the pit. Water pumped from the backfilled tailings in the pit for backfill stability reasons will be collected in the pit sump. Site-wide water balance diagrams for the planned 400-tph and 1,200-tph mine production phases are presented in Figure 7-6 and Figure 7-7. TITAN PROJECT TENNESSEE, U.S. TECHNICAL REPORT SUMMARY ON FEASIBILITY STUDY Page 91 Figure 7-6: Site-Wide Water Balance for 400 tph Production (Mine Years 1 through 4) Note: Prepared by MM&A, 2026 TITAN PROJECT TENNESSEE, U.S. TECHNICAL REPORT SUMMARY ON FEASIBILITY STUDY Page 92 Figure 7-7: Site-Wide Water Balance for 1,200 tph Production (Mine Years 5 through 14) Note: Prepared by MM&A, 2026


TITAN PROJECT TENNESSEE, U.S. TECHNICAL REPORT SUMMARY ON FEASIBILITY STUDY Page 93 The water balance diagrams include maximum, average, and minimum flow rate values that are based on the estimated mine pit inflow rates over the course of the mine life. If the planned water withdrawal point along Big Sandy River is capable of providing the full water demand to the WCP, the use of the pit inflows will be minimized or eliminated. The water balance diagrams include general water usage requirements for the rare earth plant (REP) / mineral separation plant (MSP). The water demands at the REP/MSP will be supplied by municipal water. 7.3.6 Opinion of Qualified Person Baseline groundwater and surface water monitoring and sampling completed thus far is adequate to provide an understanding of the expected hydrogeologic conditions to be encountered during mining. The baseline data provides sufficient information for completion of groundwater modeling and site-wide water balance planning. 7.4 Geotechnical Data 7.4.1 Pit Slopes Geotechnical data for the project was collected via a drilling and laboratory testing campaign managed in the field by S&ME, with input from both MM&A and IperionX. A total of 44 geotechnical drill holes were completed as shown in Figure 7-8. TITAN PROJECT TENNESSEE, U.S. TECHNICAL REPORT SUMMARY ON FEASIBILITY STUDY Page 94 Figure 7-8: Geotechnical Drill Location Map Note: Figure prepared by S&ME, 2025. TITAN PROJECT TENNESSEE, U.S. TECHNICAL REPORT SUMMARY ON FEASIBILITY STUDY Page 95 Mine pit wall stability data and results are included in a report titled “Report of Geotechnical Exploration, Titan Heavy Mineral Sands Project, Mine Pit Side Wall Slopes, Camden, Tennessee, S&ME Project No. 22350271B”, submitted to IperionX on August 21, 2025. S&ME managed all of the drilling activities and performed all of the laboratory testing. Hole locations were established using a hand-held GPS unit and ground surface elevations were estimated to the nearest 0.3 m (1 foot) based on approximate locations; therefore, ground surface elevations for the borings should be considered to be approximate. Due to the dense nature of the McNairy Sands at this site and the depth of the borings, the soil test borings for this exploration were advanced using mud rotary drilling techniques (in general accordance with ASTM D5783). Soil samples were obtained at approximately 0.76-m (2.5-foot) intervals in the upper 3 m (10 feet) and at 1.5-m (5-foot) intervals thereafter, in general accordance with ASTM D1586. In addition to split-barrel sampling, relatively undisturbed Shelby tube samples were obtained from selected boring locations and depths, in general accordance with ASTM D1587-00. Samples obtained during the field exploration were visually classified in the field by S&ME field staff in general accordance with ASTM D2488 and transported to the laboratory on a regular basis by S&ME staff. Samples were subjected to one or more of the following test procedures: > moisture content testing (ASTM D2216) > Atterberg limits testing (ASTM D4318) > sieve analysis of soils - No. 200 sieve (ASTM D6913) > determination of density (unit weight) of soil specimens (ASTM D7263) > consolidated-undrained (CU) triaxial shear with pore pressure (ASTM D4767) > standard proctor moisture-density relationship (ASTM D698) A combination of Standard Penetration Test (SPT) and laboratory test results were used to define the properties of the geologic units. Geological unit characterization is summarized in Table 7-2. TITAN PROJECT TENNESSEE, U.S. TECHNICAL REPORT SUMMARY ON FEASIBILITY STUDY Page 96 Table 7-2: Geotechnical Characterization Summary by Geologic Unit Unit Name Unit Weight Effective Cohesion Effective Friction Angle lbs/ft3 (pcf) kg/m3 lbs/ft2 (psf) kPa degrees Overburden/Alluvium – Fat Clay (CH) or Lean Clay (CL) 120 1,922 75-100 517-689 28-33 Overburden/Alluvium – Clayey Sand (SC) 120 1,922 50 345 33-36 Upper McNairy – Well Graded Sand (SW) 120 1,922 50 345 34-42 Lower McNairy – Poorly Graded Sand (SP) 125 2,002 50 345 37-42 Lower McNairy – Poorly Graded Sand (SP) – Transition to Coon Creek 120-125 1,922-2,002 50 345 33-35 Coon Creek – Fat Clay (CH) 115-120 1842-1,922 100-300 689-2,068 30-33 S&ME completed a series of initial two-dimensional (2-D) pit slope stability models to provide general guidelines for pit slope stability considerations. The S&ME report concluded with general recommendations for stable pit slope wall parameters, with an emphasis on overall pit slope angles. Recommended pit slope configuration parameters include a 35-degree batter (bench) angle and 27.4- degree overall wall angle, with 10-meter (32.8 feet) batter (bench) height and 5-meter (16.4 feet) berm (bench) width. Additional discussion of mine pit slope geotechnical assessment completed is included in Section 13.1 of this Report. 7.4.2 Pit Backfill Geotechnical testing and analysis of tailings material is documented in a report titled “Report of Engineering Services, Titan Heavy Mineral Sands Project, Tailings Slope, Camden, Tennessee, S&ME Project No. 22350271B”, submitted to IperionX on August 27, 2025. The mine plan assumes that the filtered/dried tailings material from the wet concentrator plant (WCP) will be backfilled into the mine pit as mining progresses. The pit backfill will also include waste material moved directly from the mining face to the backfill. The backfilled tailings are expected to be placed closely behind the advancing open pit mine face. Laboratory testing was completed for two separate samples of tailings material representative of the approximate mixtures of sand tailings and slimes material to be placed in the backfill (samples included 13.1% slimes to 86.9% sand and 23.1% slimes to 76.9% sand). The test results from the tailings samples are considered to be reasonably representative of the direct waste material, given that much of the waste material is Upper McNairy sand that contains some clay material. The S&ME report indicates that the tailings are expected to have a unit weight of 100 pounds per cubic ft (pcf), an effective cohesion of 0 pounds per square foot (psf), and a friction angle of 33 degrees. The S&ME testing did not indicate a significant difference in geotechnical properties related to the variation in the percentage of slimes composition from the two samples tested. S&ME also provided an expected hydraulic conductivity value for the tailings of 1 x 10⁻⁴ centimeters per second or greater. The laboratory analysis results were used by S&ME to conduct initial slope stability modeling for the backfilled tailings and waste material. The results of S&ME’s modeling indicate that bench angles of 21.8-degrees (2.5H:1V) in the tailings are expected to be stable with factor of safety


TITAN PROJECT TENNESSEE, U.S. TECHNICAL REPORT SUMMARY ON FEASIBILITY STUDY Page 97 values ranging from approximately 1.4 to 1.6. Additional discussion of tailings geotechnical assessment is included in Section 13 of this report. 7.4.3 Infrastructure Sites Lastly, geotechnical information associated with shallow subsurface conditions at the WCP area is documented in a report titled “Report of Geotechnical Exploration, Titan Heavy Mineral Sands Project, Wet/Dry Plant, Camden, Tennessee, S&ME Project No. 22350271B”, submitted to IperionX on August 14, 2025. Overall, the S&ME report on the planned WCP area concluded that, based on the subsurface conditions encountered during the geotechnical exploration and industry experience with similar projects, the site is acceptable for the proposed construction provided recommendations presented in the Report are followed. 7.4.4 Opinion of Qualified Person The results of the geotechnical drilling, testing, and reporting are sufficient to support the mine slope design, tailings disposal design and assessment of the WCP subsurface conditions for the purposes of the FS. TITAN PROJECT TENNESSEE, U.S. TECHNICAL REPORT SUMMARY ON FEASIBILITY STUDY Page 98 8 Sample Preparation, Analyses, and Security 8.1 Sample Collection Roto-sonic drill core samples, typically 3 m (9.8 feet) in length, were collected directly from the plastic sample sleeve at the drill site. Some interpretation was involved as the material could expand or compact as it was recovered from the core barrel into the plastic sleeve. Samples were collected at regular 1.5-m (4.9-foot) intervals unless geological contacts were encountered. Sample length ranged from 0.3 m (1.0 feet) to 4.5 m (14.8 feet). The unconsolidated sonic cores were sampled by splitting the core in half lengthwise using a machete, then recovering an even split with a trowel along the entire length of the sample interval. The sample weights were about 2 kg (4.4 lbs) and were appropriate for the analytical method(s) being used and ensured adequate sample volume was collected. Samples were collected directly to pre-labeled/pre- tagged sample bags. The remaining sample material was further split into a replicate/archival sample. Left over sample material after these steps was used to backfill the drill hole. 8.2 Security Sample bags were sealed with a zip tie at the drill site, placed in rice bags, and kept in the custody of the field geologist from time of collection until delivery to the Project’s temporary storage location, either a secure third-party storage unit or a leased barn. A red security tag was used to secure the top of each rice bag, and these tags were verified by the laboratory to confirm all sample bags were intact when received by the laboratory. 8.3 Density/Specific Gravity Determinations Soil samples were collected by S&ME during a geotechnical drilling campaign. 8.3.1 Collection Methods Target depth intervals were provided to the S&ME drill team to collect samples from the Upper and Lower McNairy members, and the Coon Creek Formation. In the field, sample depths and intervals were logged with the percent sample recovery. Soil samples were collected from 10 holes of the 44 holes S&ME drilled for geotechnical purposes. From the ten holes, 40 soil sample intervals were logged in the boring logs. Of the 40 samples logged, 23 samples had adequate recovery for density analysis. Poor core recovery was the main reason that logged samples did not report a density value. 8.3.2 Analysis and Results Density results were provided by S&ME in Laboratory Determination of Density of Soil Specimens forms, which include ASTM International (ASTM) test D7263. TITAN PROJECT TENNESSEE, U.S. TECHNICAL REPORT SUMMARY ON FEASIBILITY STUDY Page 99 After identifying the geologic units by depth, MM&A compiled the available density results from the laboratory forms and computed a weighted-average density. Below is a summary of the density information. The soil density analysis shows the Upper McNairy and Lower McNairy units have a consistent density of 1.57 tonnes per cubic meter (t/m³), see Table 8-1. Table 8-1: Unit Density Summary No. of Dry Unit Wt. Geology Samples (t/m³) Drill Hole Numbers Overburden 2 1.72 MB-04, MB-10, Upper McNairy Formation unit 7 1.57 MB-04, MB-12, MB-13, MB-16, MB-21, MB-25, MB-34 Lower McNairy Formation unit 10 1.57 MB-04, MB-12 (2), MB-16 (2), MB-21, MB-24, MB-25, MB-34, MB-36 Coon Creek Formation 4 1.54 MB-04, MB-10, MB-13, MB-25 8.4 Laboratory Procedures Exploration drilling samples were sent to the SGS facility in Lakefield, ON, Canada (SGS Lakefield) and Bureau Veritas in Perth, Australia. SGS Lakefield is a qualified third-party laboratory that is independent of IperionX. SGS Lakefield is accredited as an ISO 17025 facility for selected analytical techniques. Bureau Veritas holds ISO 17025 accreditations for selected analytical techniques. 8.4.1 Sample Data Analysis Samples were subjected to standard mineral sand industry assay procedures of size fraction analysis and heavy-liquid separation. Samples were initially weighed, homogenized and an approximate 1 kg subsample was submitted for analysis. The remaining material was retained for potential later testwork. The subsamples were dry screened at 44 microns (325 mesh) for slimes and 595 microns (30 mesh) for oversize. The oversize material was weighed, and the remaining mass was attributed to the slimes fraction. An 85-gram aliquot of the -30/+325 sand was submitted to heavy-liquid separation via methylene iodide diluted with acetone to target a specific gravity of 2.95 gram per cubic centimeter (g/cm3), as this is more dense than non-valuable minerals and less dense than the target heavy minerals, allowing for the target minerals to sink in the solution. The >2.95 g/cm3 portion was dried and weighed to calculate the percent heavy minerals within this size fraction by dividing the mass of heavy minerals by the total mass of the - 30/+325 aliquot. The THM content was calculated by adding the percent slimes and oversize to the total using the formula: Heavy minerals mass = -30/+325 mass+(-30/+325 mass * % slimes)+(-30/+325 mass * % oversize) TITAN PROJECT TENNESSEE, U.S. TECHNICAL REPORT SUMMARY ON FEASIBILITY STUDY Page 100 Samples from all drill holes were analyzed through this analysis process. Figure 8-1 summarizes the sampling process. Results of laboratory sample analysis were compiled into digital files. Figure 8-1: Summary of Analysis Process Sample Screening HLS THM Mineralogy Sample 600-micron (+30 mesh) OS -30 mesh -30/+325 mesh 85 g aliquot submitted to Methylene iodide diluted with acetone to target spec. gravity 2.95 g/cm3 float <2.95 g/cm3 sink >2.95 g/cm3 dried and weighed for % HMS HMS samples composited downhole by geologic unit and analyzed by QEMSCAN 45-micron (+325 mesh) -325 mesh Slime Note: HLS - heavy liquid separation; THM -heavy mineral in the total sample; SL -Slimes; OS – Oversize material. HMS -heavy mineral in the sand fraction. 8.4.2 Mineral Assemblage Assay Data Of the 140 roto-sonic holes drilled on the Study area, composite samples from 84 holes were analyzed for mineral composition. From 84 holes, 1,669 m (5,476 feet) sampled are from the Lower McNairy Formation. Samples from the Upper McNairy Formation include 1,344 m (4,409 feet) from 71 holes. Composites based on geological domains were submitted for QEMSCAN analysis for mineralogical assemblage data. The mineral species determined using QEMSCAN by SGS Lakefield were further combined and/or divided into groups representing anticipated products based on metallurgical testwork for inclusion in the geological block model. Drill holes with QEMSCAN analysis were identified in Figure 7-1. Composite samples of the Upper and Lower McNairy Formation geologic units were analyzed separately. The sample composites were selected by IperionX based on THM percent from the drill hole sample assays. IperionX grouped the samples into two groups, mineralized (UM_M, LM_M) or background (UM_B, LM_B) based on a 1.0- percent average THM division. Mineralized composite sample groups yielded an average THM percent >1.0 (UM_M, LM_M) and background sample groups yielded an average THM percent less than (<) 1.0 (UM_B, LM_B). Because the mineralized zones of the Upper McNairy and Lower McNairy Formation units are often near the top and at bottom of the respective units with lower (background) grades in between, the order of composite samples by depth, per drill hole is UM_B / UM_M / UM_B / LM_B / LM_M or some combination of this order. For each composite, the average THM% was calculated from the samples and then labeled as either background or mineralized. The THM% composite average is calculated for the sample interval from a weighted average of the sample THM%, to the cumulative composite THM% value. Therefore, a


TITAN PROJECT TENNESSEE, U.S. TECHNICAL REPORT SUMMARY ON FEASIBILITY STUDY Page 101 laboratory QEMSCAN composite is comprised of greater measured quantities of individual samples with higher THM percent than those from lower THM percent samples. The assemblage minerals include titanium minerals (rutile, leucoxene, pseudorutile and ilmenite; the zirconium mineral zircon; rare earth element minerals (monazite, xenotime, and unclassified rare earth element minerals); and other minerals (staurolite, tourmaline, aluminum-silicates, quartz, other-silicates, and other minerals). 8.5 Quality Assurance and Quality Controls Accuracy monitoring was addressed by submission of in-house heavy mineral sands standards developed specifically for the Project. There is no commercially-available standard reference material for heavy mineral sands deposits. It is a common method within heavy mineral sands exploration and operations to generate standards that represent a matrix match to the target material being analyzed. A low-grade (~1% heavy minerals) and a high-grade (>2% heavy minerals) standard were produced with materials (heavy mineral and silica sands) from the Study Area to ensure matrix and mineralogical representativeness. Each material was analyzed by SGS Lakefield to generate mean and standard deviations. Standards and blanks were inserted at a 2.5% rate (one for every 40 samples). These standards and blanks were placed loose in a standard sample bag that was labeled sequentially as to mimic a typical drill sample and passed through the laboratory process “blind”. A record of the standards inserted, and the sample IDs are kept in the project database so that data can be matched up and reviewed. Standards were created multiple times during the project and each time a new dataset was generated to compare against. A quality control standard failure was considered to be any single standard three standard deviations from the true value for the comparison for each sample, or two out of three consecutive samples between two and three standard deviations, on the same side of the mean value (i.e., both above or both below the mean value). Should the errors for a particular batch exceed these limits, the section of a batch bracketed by the standard samples (i.e., number samples on either side) were reviewed to determine if the standard failures were material to the overall data for that batch or if the laboratory had had any procedural issues that need to be addressed. If necessary, samples were re‐analyzed. Eleven standards (six high- and five low-grade) were submitted during the drilling campaign for analysis and results were all within three standard deviations of the mean of the standard. Sampling precision was monitored by selecting a sample interval at a 3% rate (three for every 100 samples) and taking a second sample from the replicate over the same sample interval. These samples were consecutively numbered after the primary sample and recorded in the sample database as “field duplicates” and the primary sample number recorded. Field duplicates were ideally collected when sampling mineralized sonic core intervals containing visible THMs (panning). A total of 71% of the duplicate samples were in samples grading 0.5% THM or higher. TITAN PROJECT TENNESSEE, U.S. TECHNICAL REPORT SUMMARY ON FEASIBILITY STUDY Page 102 IperionX considered that field duplicates should have an average coefficient of variation of <10%, whereas laboratory duplicates should have an average coefficient of variation of <5%. For the drilling results reported, 83 field duplicates were submitted to the laboratory with results showing a coefficient of variation of <10%. Analysis of field duplicates indicates a relative precision of 31, indicating that the drill sampling was the greatest source of uncertainty in the sampling procedure. Analytical precision was monitored using HLS duplicates that the laboratory produced at a rate of approximately three in 100 samples. The use of an 85 g sub-sample for HLS resulted in a relative precision of 4% based on repeat analyses of standard reference materials at SGS Lakefield. This sub-sample mass was considered to be appropriate for the grain size being sampled. Titan Project QAQC activities and procedures were observed by KGS. 8.6 Database For data cataloging, IperionX uses GeoSpark’s database systems to host the Titan Project drill records collected in the field, sample data, and mineral assemblage analysis results. The structure of the Benton GeoSpark’s database records is organized by data tables (e.g., header, lithology, sample data, mineral composition). Database entry was completed after every field day. Field data, including geology, notes on mineralogy, sample type, and collar information (coordinates, landowner, hole length, status, drill rig used, geologist, and date drilled) were manually input into a GeoSpark’s database from field logging booklets and checked for accuracy. Daily backups were completed. Laboratory assay reports from SGS Lakefield were delivered in an Excel worksheet format and total heavy mineral percentages were calculated using a designated formula: HLS sink/(Total+(Total*Oversize/100) + (Total*slimes/100))*100 Assay values were validated using Excel-based conditional formatting. Results were then uploaded directly to GeoSpark in a designated “assays” tab. Mineral composition data was similarly delivered from SGS Lakefield in Excel format and uploaded to a “mineral composition” tab in GeoSpark. Logging booklets were kept in ascending order at the field site. 8.7 Opinion of Qualified Person MM&A is of the opinion that the sample preparation, security, and analytical procedures are reasonably sufficient to support mineral resource and reserve estimation. TITAN PROJECT TENNESSEE, U.S. TECHNICAL REPORT SUMMARY ON FEASIBILITY STUDY Page 103 9 Data Verification 9.1 Data Verification Completed by the Qualified Person 9.1.1 KGS During drill exploration, KGS conducted several site visits throughout the drilling campaigns, visited the MT laboratory and the SGS Lakefield facility, and observed metallurgical testing programs. KGS reported that: “The site visits provided visual confirmation of mineralization, drill hole locations, bulk sample collection and logging and sampling procedures. KGS is satisfied with the metallurgical testing procedures as witnessed during the Mineral Technologies laboratory inspection. The laboratory procedures witnessed during the KGS inspection of SGS Lakefield are considered acceptable.” 9.1.2 MM&A QPs from MM&A conducted a site visit to the Project area from April 15–16, 2025 (see Section 2.4.1). MM&A received geologist’s lithological data logs for 31 exploration holes from the 2021-2022 drilling campaigns. The log information was recorded on logging tickets, each with a laboratory sample number. In review of the log records, MM&A found them to be consistent in format and content. Core photos for 177 holes were also provided. Core photos included the sample ticket numbers that matched the geologist log ticket. For each sample, the ticket number and associated lithologic and depth information were recorded in the GeoSpark database, by hole. For 15 holes, MM&A paired drill logs with the core photo in Microsoft® PowerPoint slides). The pairings provided a manageable screening of each geologist log and photo together. 9.2 Mineral Assemblage QEMSCAM laboratory records were provided by IperionX, and MM&A used the QEMSCAN laboratory sheets to review mineral assemblage records or values. 9.2.1 General Statistics MM&A reviewed the THM and the mineral assemblage results from QEMSCAN composite sample analysis of two tested batches referred to as 2023 and 2025. All drill hole samples were collected during exploration drilling (2020, 2021 & 2022) for the IperionX Titan Project prior to 2023 and saved for subsequent testing. Samples of both batches were screened (-600 microns / +44 microns) to exclude oversized and undersized material. The 2023 drill holes with mineral assemblage composites are mostly located in or just west of the mine permit, with eight drill holes located north of the Bear Creek floodplain that divides the Study Area. The 2025 drill holes infilled gaps between the selected 2023 drill holes and included drill holes sited further TITAN PROJECT TENNESSEE, U.S. TECHNICAL REPORT SUMMARY ON FEASIBILITY STUDY Page 104 west of the mine permit. There is both geographic overlap and separation of the 2023 and 2025 data sets. Composites were selected if they were within the Lower McNairy Formation unit, were above a 0.4% THM cutoff, and were from the 2023 or 2025 drill campaigns. This resulted in selection of 60 composites and 66 composites for 2023 and 2025, respectively. The review consisted of construction of histograms (THM%, rutile, ilmenite group (ilmenite, leucoxene and pseudorutile), zircon, rare earth elements (rare earth %, monazite % and xenotime %), and tourmaline) and basic statistical analysis (minimum, maximum, average and median composite values for the two data sets and for the combined data). 9.2.2 Comparative Composites Comparison of the 2023 values to the 2025 results showed a decrease of the REE* percent values. This resulted in 10 drill hole samples from 10 drill holes that intersected the Lower McNairy Formation being sent for re-testing using QEMSCAN. The re-test results for the mineral assemblage compared well with the original values, except for tourmaline and the REE*. (REE* equals monazite + xenotime + unclassified REE.) SGS Lakefield attributed the difference to software processing for the 2025 results. SGS subsequently revised QEMSCAN results for all the 2025 composites to correct the tourmaline and monazite results. After the data procedures review, MM&A accepted the SGS Lakefield re-testing results and deemed it appropriate to include both the 2023 and 2025 QEMSCAN results for use in mineral resource estimation. In review of the xenotime assay comparison, with 2025 and 2025R (resampled) values being lower than the 2023 values, SGS Lakefield was asked to further review the xenotime percent calculation for the 2025 composites. Unlike the monzonite and tourmaline values, the xenotime results for 2025 were not revised. 9.3 Limitations Placed on Data Verification No limitations were requested by IperionX of MM&A when verifying data. MM&A performed and reviewed data verification appropriately to support mineral resource and reserve estimation. 9.4 Opinion of Qualified Person MM&A is of the opinion that sufficient data have been obtained through Titan exploration and sampling programs to support the geological interpretations of the mineral sands deposit situated on the Project. The data are of sufficient quantity and reliability to reasonably support the mineral resource and mineral reserve estimates in this Report.


TITAN PROJECT TENNESSEE, U.S. TECHNICAL REPORT SUMMARY ON FEASIBILITY STUDY Page 105 10 Mineral Processing and Metallurgical Testing Two testwork programs were conducted within the mineral resource estimate area, one in 2021 and the second in 2023. All testwork was completed on behalf of IperionX. Testwork was completed by, or under the supervision of, MT. The company is a reputable testing organization with significant experience in mineral sands flowsheet development, with laboratories located in Florida, US, and in Queensland, Australia. The laboratories are ISO 9001, 45001 and 14001 accredited. MT is independent of IperionX. A portion of the testwork was completed at IperionX’s Camden mineral demonstration facility, under the supervision of MT personnel. Neither facility is accredited for metallurgical testwork procedures; this is routine for metallurgical testing facilities as there is currently no organization that certifies laboratories specifically for metallurgical testwork. Assays were conducted by SGS Lakefield, and Bureau Veritas in Perth, Australia, using X-ray fluorescence (XRF), laser ablation/inductively-couple plasma mass spectrometry (ICP–MS) and QEMSCAN analytical methods. Bureau Veritas is independent of IperionX and holds ISO 17025 accreditations for selected analytical techniques. 10.1 2021 Metallurgical Test Results Three bulk samples were processed by MT through pilot equipment designed to emulate a full-scale feed preparation plant, WCP, monazite flotation/concentrate upgrade plant and a mineral separation plant (MSP). The samples were taken from drill holes 20-SWW-004 (B004), 21-SBF-047 (B047), and 20-SWW-014 (B014). The B004 and B047 samples were sourced from the Lower McNairy Formation. B014 was sourced from the Upper McNairy Formation. Mineralization in the Upper McNairy Formation is significantly coarser than mineralization in the Lower McNairy Formation. The approximate mass of each sample was: > B004: approximately 512 kg of sample > B047: approximately 496 kg of sample > B014: approximately 483 kg of sample Testwork demonstrated that the Upper and Lower McNairy Formation mineralized zones could be separated using processing stages common to most mineral sands operations. The 2021 metallurgical testwork block flow diagram is depicted in Figure 10-1. TITAN PROJECT TENNESSEE, U.S. TECHNICAL REPORT SUMMARY ON FEASIBILITY STUDY Page 106 Figure 10-1: 2021 Metallurgical Testwork Block Flow Diagram Note: Figure prepared by MT, 2026. 10.1.1 Sample Preparation and Deslime Circuit Samples B004 and B047 were fluidized in a drum before being pumped via submersible pump to a deslime circuit. The material was then pumped to a 100-millimeter (mm) hydrocyclone fitted with a 20-mm apex and 35-mm vortex finder. Based on visual observation during closed loop testing, this combination resulted in the most reliable performance with minimal loss of +45-micron solids to the overflow stream as determined by test sieving at 325 mesh. Timed samples were collected, consolidated, dried, weighed, and submitted for assay. The deslime circuit was then converted to open circuit operation, and the entire bulk sample was processed. TITAN PROJECT TENNESSEE, U.S. TECHNICAL REPORT SUMMARY ON FEASIBILITY STUDY Page 107 Sample B014 was processed using conventional preparation equipment, including a feed belt and rotary trommel fitted with a 2-mm screen. The 20-mm apex and 35-mm vortex finder combination were used for sample B014. After identifying the appropriate operating conditions, the deslime circuit was converted to open circuit, and the entire bulk sample was processed. The preparation and deslime testwork demonstrated that: > Both the Lower McNairy Formation (B004 and B047) and Upper McNairy Formation (B014) samples contained elevated slimes, primarily highly cohesive clays. > The deslime process liberated clays and ultra-fines from the mineralization. All three samples showed reduction in -45-micron content when comparing the analysis to the deslime underflow. > The deslime process resulted in a modest increase in titanium dioxide (TiO2)/zircon dioxide (ZrO2) grade for samples B047 and B014. Sample B004 saw a minor increase in ZrO2 grade and a minor decrease in titanium dioxide (TiO2) grade. 10.1.2 Wet Process Circuit After desliming, each sample was subjected to release curve testing and bulk processing through the general flowsheet. Each stage of spiral testing followed the same general process: material was pumped over the spiral on the test rig in a closed-circuit loop at a desired flow rate and pulp density. Multiple tests were conducted at a similar mass flow rate and pulp density while varying splitter positions to generate sets of product samples. These samples were then assayed giving rise to a suite of grade and recovery data points, which were used to generate spiral release curves for each combination of mineralization and operating conditions. After release curve testing was completed for each stage, the entirety of each feed material was processed at the estimated best spiral operating conditions, based on experience with similar mineralization, as well as in-process observations. Care was taken to ensure the addition rate of new feed material matched the product withdrawal rate. The wet process circuit testwork demonstrated that: > After desliming, both the Lower and Upper McNairy Formation samples were amenable to conventional wet gravity separation via spiral separators. > The MG12 spiral is superior to the FM1 spiral for rougher stage processing of Lower McNairy Formation mineralization. The MG12 showed the highest separation efficiency for both samples at higher capacity than is achievable on an FM1 spiral. > The MG12 spiral is better for rougher stage processing of Upper McNairy Formation mineralization. > The MG12 spiral performed well in the cleaner stage for all samples. > Additional upgrade stages will be required to reach generally acceptable heavy mineral concentrate (HMC) grades on finer Lower McNairy Formation mineralization. TITAN PROJECT TENNESSEE, U.S. TECHNICAL REPORT SUMMARY ON FEASIBILITY STUDY Page 108 10.1.3 Dry Process Circuit HMC generated from the B004, B047, and B014 samples was used for dry process evaluation. After attrition, scrubbing, and drying, each HMC sample was subjected to dry processing through the flowsheet. The B004 and B047 samples were processed using the same conventional flowsheet, however additional separation stages were added to the B014 flowsheet due to elevated aluminosilicate mineral content. The dry process circuit testwork demonstrated that the Lower McNairy and Upper McNairy Formation samples were amenable to conventional dry physical separation via: > screening > MT Carrara HTR400 high-tension roll separator > MT Carrara electrostatic plate separator > MT Readings rare earth drum magnetic separator > MT Readings rare earth roll magnetic separator > MT Readings induced roll magnetic separator The following conclusions were drawn from the 2021 testwork: > Both the Lower and Upper McNairy Formation mineralization will require thorough desliming to properly prepare the ore for wet gravity processing. > Both the Lower and Upper McNairy Formation mineralization types are amendable to conventional wet gravity processing via spiral separators. The MG12 is the better spiral model for rougher and cleaner duty. > Ilmenite, rutile, zircon, and monazite concentrate products can be produced from both Lower and Upper McNairy Formation mineralization. > Further testing is required to outline wet processing flowsheets and equipment configurations to maximize recovery, particularly of the fine Lower McNairy Formation mineralization. > The finer Lower McNairy Formation mineralization poses a challenge in dry processing. Additional processing stages will likely be required to improve ilmenite, rutile, and zircon recovery. 10.2 2023 Metallurgical Test Results MT completed additional metallurgical testwork in early 2023. The testwork was based on one bulk sample and three variability samples. The main bulk sample of 12.7 tonnes (t) was composed of approximately 30% Upper McNairy and 70% Lower McNairy Formation mineralization, representing the average material that might be mined in the


TITAN PROJECT TENNESSEE, U.S. TECHNICAL REPORT SUMMARY ON FEASIBILITY STUDY Page 109 initial years of any future mining operations. Samples used to make up the bulk sample were taken from drill holes 20-SWW-014, 20-SDW-020, 20-SDW-021, 21-SGH-034,21-SGH-035, 21-SGH-037, 21-SDW- 054,21-SDS-055, 21-SWW-069, 21-SSP-083, 21-SGH-084, and 21-SGH-086. Three bulk composite samples ranging from 2 to 3 t were prepared for the variability testwork, taken from drill holes 20-STV-008, 20-STS-016, and 21-SDS-058. The composites consisted of different ratios of Upper McNairy and Lower McNairy Formation material, with the mass percentage of Upper McNairy Formation in the three composites being 0%, 37.5% and 50%. The objective of the variability testwork was to quantitatively assess potential product quality with qualitative estimates of recovery of three composite samples that reflected different mineralized domains. 10.2.1 Feed Preparation The feed preparation process was conducted at IperionX’s mineral demonstration facility near Camden with the supervision of MT personnel. The 10 t (dry) of raw test sample material was packed into 208-liter (55-gallon) drums. The contents of the drums were washed through a 0.635 cm (¼ inch) punch plate into a mixing tank. Any oversize from the punch plate was collected and dried. Sufficient material and water were added until a cyclone feed pump discharge density of 15% to 20% (estimated using a Marcy scale with an approximate 2.7 specific gravity) was achieved in closed circuit. Upon achieving steady state, the cyclone overflow was diverted to a settling pond in which effluent overflowed into a reservoir. The circuit was continually supplied with make-up water to maintain the level of the tank. Once the recirculating material was sufficiently deslimed, the cyclone underflow was diverted to the screw classifier before being discharged into new 208-liter (55-gallon) drums. This semi-batch operation was repeated until all the feed material was processed through the feed preparation circuit. Frequent sub-samples of the feed and cyclone overflow were taken throughout the process to form representative composites for further characterization and analysis. 10.2.2 Wet Gravity Separation The wet gravity processing up to the recleaner stage was completed at MT’s Florida laboratory. The material received was processed through a continuous trommel/screen and spiral circuit. The trommel discharged any oversize material >2 mm. The undersize from the trommel was pumped to a distributor which fed into a single-stack spiral circuit. The bulk products up to the recleaner stage were freighted to MT’s metallurgical testing facility in Queensland, Australia, where subsequent wet gravity processing was completed. Damp material was conveyed into a spiral rig sump which was pumped into a single-stack spiral circuit. The block flow diagram shown in Figure 10-2 was used for feed preparation and wet gravity processing. TITAN PROJECT TENNESSEE, U.S. TECHNICAL REPORT SUMMARY ON FEASIBILITY STUDY Page 110 Figure 10-2: 2023 Feed Preparation and Wet Gravity Processing Testwork Block Flow Diagram Note: Figure prepared by MT, 2026. TITAN PROJECT TENNESSEE, U.S. TECHNICAL REPORT SUMMARY ON FEASIBILITY STUDY Page 111 This testwork incorporated a total of eight stages, three of which were laboratory evaluations to emulate how particular recycle streams would perform in a plant scenario. For each of the spiral stages, except the rougher, the middlings streams were recirculated with the feed to maximize recovery of heavy minerals. Prior to bulk processing of the mineralization through each spiral stage, several lots of release tests were conducted in closed circuit. The results from release tests are used in MT’s proprietary modelling software to provide stage grade/recovery models and incorporate them into overall mass balances. Two mass loadings of 1.5 and 2.0 tonnes per hour (tph) solids per start were selected for release tests for each of the main spiral stages, with a pulp density target range of 30-40% weight/weight (w/w) solids. For the bulk processing, a 1.5-tph per start was selected as the operating loading to increase mineral retention time on the spiral and allow for better separation. 10.2.3 Rare Earth Mineral Flotation and Gravity Upgrade The main objective of the flotation stage was to extract all available rare earth minerals from a fine HMC stream, leaving an HMC (flotation sinks) barren of monazite. The following steps outline the procedure for flotation testwork for both sighter and bulk batch tests: > pretreatment > depressant addition > pH modification > collector addition > water level adjustment > product collection Successive iterations of collector addition, conditioning, frothing, and recovery were conducted until either no further mineral was floating, or non-selective minerals started to float. The number of iterations and collector quantities varied from test to test. Post flotation, both concentrate and tailings were washed and attritioned to remove residual chemical reagents prior to wet shaking table testwork. Samples were dried, weighed, and sub-samples extracted for analysis. 10.2.4 Dry Mineral Separation The coarse HMC and fine HMC (post rare earth flotation) products were dried and processed separately through further stages of dry and wet mineral separation. 10.2.4.1 Fine HMC Mineral Separation Circuit The fine HMC mineral separation circuit is shown in the testwork block flow diagram in Figure 10-3. TITAN PROJECT TENNESSEE, U.S. TECHNICAL REPORT SUMMARY ON FEASIBILITY STUDY Page 112 Figure 10-3: 2023 Fine Mineral Separation Testwork Block Flow Diagram Note: Figure prepared by MT, 2026. 10.2.4.1.1 Fine Primary Dry Circuit A conventional primary high-tension roll separator (HTRS) circuit was used, involving rougher, non- conductor cleaner, conductor cleaner, and scavenger stages. A Carrara HT400 (400 mm diameter roll) was used for high-tension roll (HTR) stages in the primary dry circuit, as well as all other circuits. The laboratory unit is a single roll unit, but fractions were re-passed to simulate a three-roll production unit. 10.2.4.1.2 Fine Non-Conductor Circuit The non-conductors from the primary dry circuit were processed through a stage of dry magnetic separation to separate out magnetic silicates, such as staurolite.


TITAN PROJECT TENNESSEE, U.S. TECHNICAL REPORT SUMMARY ON FEASIBILITY STUDY Page 113 Previous testwork showed a high degree of separation was achieved using a rare earth roll magnetic separator (RERS) on the non-conductor fraction. A single roll RERS unit was used with fractions re-passed to simulate a three-roll production unit. The non-magnetic fraction from the RERS was fed to the zircon wet circuit for the removal of quartz and aluminum silicates. An up current classifier (UCC) was tested for the initial stage of separation as it was hoped an underflow could be produced that would be sufficiently low in silicon dioxide (SiO2) and aluminum oxide (Al2O3) to not require further gravity upgrading, thus reducing the size of the wet circuit. The UCC underflow and overflow fractions were each processed separately through a wet shaking table circuit. The dried Zircon concentrate was processed through a two-stage (rougher-scavenger) HTRS circuit to reject residual conductive material, using similar settings to those used in the primary dry circuit. 10.2.4.1.3 Fine Conductor Circuit The conductors from the primary dry circuit were processed through a dry conductor circuit to produce Ilmenite/Leucoxene and Rutile products. Previous scoping testwork on similar Camden feed material showed the RERS was effective at fractionation of titanium minerals, so a single roll RERS unit was used in the first stage of this circuit with fractions re-passed to simulate a three-roll production unit. The non-magnetic fraction from the RERS was processed through a single stage HTRS, using similar settings to those used in the primary dry circuit, to extract non-conductive impurities from rutile. The combined HTRS conductors were processed through two stages of magnetic separation, using an induced roll magnetic separator (IRMS), to remove any magnetic impurities from the rutile product. The combined RERS and IRMS magnetic streams formed the final ilmenite/leucoxene product. 10.2.4.2 Coarse HMC Mineral Separation Circuit The coarse HMC mineral separation circuit is shown in the testwork block flow diagram in Figure 10-4. TITAN PROJECT TENNESSEE, U.S. TECHNICAL REPORT SUMMARY ON FEASIBILITY STUDY Page 114 Figure 10-4: Coarse Mineral Separation Testwork Block Flow Diagram Note: Figure prepared by MT, 2026. The coarse HMC had a total heavy minerals content of approximately 89%. At the time of the testwork, additional upgrading prior to the primary dry circuit was deemed unnecessary. An identical testwork procedure to that used for the fine HMC was used for the coarse HMC, with the exception of an additional screen being used at the head of the conductor circuit to remove coarse (>0.25 mm) non-conductor particles (typically contained in a primary conductor produced from coarser feed) and prevent them from misreporting to conductor products. The operating conditions were adjusted as necessary through each circuit/stage to accommodate for the coarser feed and different mineralogy. 10.2.5 Product Grades The final products from the 2023 testwork were: > ilmenite – at a grade of 64.9% titanium dioxide (TiO2) > rutile – at a grade of 91.2% titanium dioxide (TiO2) > zircon – at a grade of 66.8% zirconium dioxide (ZrO2) TITAN PROJECT TENNESSEE, U.S. TECHNICAL REPORT SUMMARY ON FEASIBILITY STUDY Page 115 > heavy rare earth concentrate, HREE-dominant by value (HREC) – at a grade of 59.1% total rare earth oxides (TREO) The product grades generally align with 2021 scoping testwork results and were considered to be saleable products. 10.3 Preliminary Flowsheet Development The testwork showed that high-quality Ilmenite, Rutile and Zircon products could be achieved using conventional separation equipment through a typical WCP and fine and coarse MSP flowsheet. A HREC product was created at a high monazite recovery using flotation and gravity separation processing. Flowsheet development was conducted based on the main sample testwork. The variability testwork mirrored the flowsheet of the main sample where practical. Despite the variance in the flowsheet procedure, mineralogy and feed grades, the variability testwork showed that high-grade Ilmenite, Rutile and Zircon products could be achieved using the process flowsheet developed during testing. The process flowsheet proposed from testwork is shown in Figure 10-5. Figure 10-5: Proposed Flowsheet Based on Metallurgical Testwork Note: ROM: Run-of-Mine; FPP: Feed Preparation Plant; WCP: Wet Concentration Plant; HMC: Heavy Mineral Concentrate; REMP: Rare Earth Mineral Plant; REMC: Rare Earth Mineral Concentrate; CUP: Concentrate Upgrade Plant; MSP: Mineral Separation Plant TITAN PROJECT TENNESSEE, U.S. TECHNICAL REPORT SUMMARY ON FEASIBILITY STUDY Page 116 This proposed process flowsheet would include the following conventional process steps: > Mining unit plant: - Run-of-mine (ROM) material will be delivered for primary deagglomeration through scrubbing and removal of large oversize to allow long-distance pumping. > Feed preparation plant: - The sand fraction containing the potentially valuable minerals (nominal -2.0+0.045 mm) will be separated from slimes (-45 microns) and oversize waste (+2.0 mm). > WCP: - The potentially valuable minerals contained in the sand fraction would be recovered in a wet concentration plant using a conventional multi-stage gravity separation circuit. Intermediate size classification would be included to reject other oversize waste. - The recovered potentially valuable minerals would constitute the THM concentrate, which would be screened at a nominal 130 microns to prepare coarse and fine HMC streams. - Gangue minerals would be collected with oversize and slimes from the feed preparation plant and then disposed as tailings backfilling the mining area. > Rare earth mineral plant: - The fine HMC would be subjected to mechanical attrition and conditioned with specific reagents in readiness for processing by froth flotation and additional gravity concentration. - Scrubbing stages would be included to remove residual reagents from the flotation circuit outputs. - Products would be a HREC and a (post rare earth flotation) fine HMC. > Concentrate upgrade plant: - The fine flotation HMC would be processed by wet gravity separation to produce a zircon- and titanium-rich stream to feed the MSP. > MSP: - The coarse and (post rare earth flotation) fine HMCs would be fractionated by multiple dry electrostatic and magnetic separation stages to produce final ilmenite and rutile products from conductors. - The non-conductors would be processed by wet gravity then further dry electrostatic and magnetic separations to produce a final zircon product. 10.4 Metallurgical Recovery Forecasts Circuit simulation models were generated for the WCP, the rare earth plant (REP) and MSP flowsheets to evaluate recycle streams and resultant mass flows. The expected future performance of the processing


TITAN PROJECT TENNESSEE, U.S. TECHNICAL REPORT SUMMARY ON FEASIBILITY STUDY Page 117 plant was based on metallurgical testwork results and benchmarked against other deposits that have similar characteristics to the Titan deposit. The simulated recoveries for in-size sample (+45-micron material) from ROM to products are: rare earth mineral recovery of 82.6%; ilmenite recovery of 79.7%; rutile recovery of 66.9%; zircon recovery of 77.6%. 10.5 Metallurgical Variability The three variability samples used in the 2023 metallurgical testwork were composite samples representative of the different types and styles of mineralization within the Titan deposit. The variability bulk samples included coarse- and fine-grained mineralization as well as areas of differing mineral assemblage. 10.6 Deleterious Elements Deleterious elements such as iron, magnesium, uranium, thorium, chromium, and vanadium are present at low levels and can negatively impact the marketability of heavy mineral sands products, especially uranium and thorium. High levels of these contaminants may reduce product quality, result in regulatory penalties, or require additional processing, which increases costs. Environmental considerations, particularly tailings management and the potential presence of radioactive or toxic elements, can add complexity and expenses due to stricter regulations, water management, and the need for site rehabilitation after mining operations. 10.7 Opinion of Qualified Person The QP has relevant experience in mineral processing and mineral sands operations, including interpretation of metallurgical testwork and process design. The testwork programs were acceptable for the mineralization type. The proposed flowsheet configuration, mass balance, and recovery assumptions are based on available testwork data, supported by industry experience and appropriate engineering design for the level of study. The process solution is considered conventional industry practice. In the opinion of the QP, the data, methodologies, assumptions, and conclusions used in the technical report summary are appropriate reasonable and suitable for reporting purposes, and consent is provided for the inclusion of this information in the form and context in which it appears. TITAN PROJECT TENNESSEE, U.S. TECHNICAL REPORT SUMMARY ON FEASIBILITY STUDY Page 118 11 Mineral Resource Estimates 11.1 Introduction The resource database contains sonic drill data collected between 2020, 2021 and 2022. Laboratory analyzed samples from these holes occurred between 2020 and 2025. Data are from 140 drill holes (5,645 m or 18,520 feet of total drilled length) and includes 3,360 THM assay samples (heavy liquid) and 269 THM composite mineralogy (QEMSCAN) determinations. Of these totals, 56% of the heavy mineral assay samples and 59% of the mineral composites are from the Lower McNairy Formation member. Geological interpretations were compiled using Vulcan software version 2021.1. Variography of heavy mineral samples was completed using Vulcan software version 2025.1, which was also used for model development and grade interpolation. 11.2 Geologic Model Data were provided to MM&A by IperionX in Excel format. Digital elevation topography of the Study Area was supplied by IperionX. The designated floodplain area of the Big Sandy River and the Bear Creek tributary impact the mineral resources. Floodplains are excluded from the resource estimate area. The floodplain exclusion area crosses the Study Area, isolating resource blocks to the north. A zone of overburden above the Upper McNairy is incorporated into the model. Slight and normal near- surface weathering is evident on the property from average annual precipitation. Weathering may affect the clays and sand material on the property, mostly at shallow depths or exposed areas, but does not affect the mineral representation in the geologic model. 11.3 Model Method The top of the Upper McNairy Formation unit, the base of the Upper McNairy Formation/top of the Lower McNairy Formation unit and the base of the Lower McNairy Formation units were modeled from drill intercepts extracted from the lithologic database records. The material between the top of the Upper McNairy Formation and the topography was designated as overburden and waste. Overburden material thickness (topsoil and alluvium) was modeled from drill hole data, then subtracted from the topographic surface to create the base of overburden. Any remaining material above the Upper McNairy Formation was designated as waste material. The top of the Coon Creek Formation shares the same contact surface as the base of the Lower McNairy Formation. The thin topsoil interval is included in the overburden and is not separated in the block model due to its thin interval (0.03 m or 0.1 feet) relative to the minimum vertical block dimension (1.524 m or 5 feet). TITAN PROJECT TENNESSEE, U.S. TECHNICAL REPORT SUMMARY ON FEASIBILITY STUDY Page 119 Geologic model cross sections A-A’ and B-B’ in Figure 11-2 and Figure 11-3 demonstrate the McNairy and Coon Creek units of the geologic model. Drill hole traces are color-coded by geologic units in each cross section. The locations of the two cross sections are shown on Figure 11-1. Figure 11-1: Study Area and Cross Section Locations Note: Figure prepared by MM&A, 2026. TITAN PROJECT TENNESSEE, U.S. TECHNICAL REPORT SUMMARY ON FEASIBILITY STUDY Page 120 Figure 11-2: Model Cross Section A Note: Figure prepared by MM&A, 2026. Figure 11-3: Model Cross Section B Note: Figure prepared by MM&A, 2026.


TITAN PROJECT TENNESSEE, U.S. TECHNICAL REPORT SUMMARY ON FEASIBILITY STUDY Page 121 11.4 McNairy Formation THM% and Thickness Figure 11-4 includes the weighted-average sample THM% of the McNairy Formation (Upper and Lower combined) and the formation thickness in meters. The THM% isopleth (blue lines) shows an increase of weighted-average THM% from <2% in the west to >3% to the east and near the rivers. The rose shade identifies areas with >3% average THM which increases to more than 6% average THM in a few drill holes proximate to the Big Sandy River. Alternatively, the formation thickness isopach shows a thickening trend westward, from <20 m near the river, mainly due to the absence of the Upper McNairy member of the formation, to more than 60 m thick beneath the west side of the mining permit (proposed processing plant location). The implication is that mining extraction ratios of higher grade THM% of the Lower McNairy Formation member become less favorable moving westward from the river. Figure 11-4: McNairy Formation THM% and Thickness Note: Figure prepared by MM&A, 2026. TITAN PROJECT TENNESSEE, U.S. TECHNICAL REPORT SUMMARY ON FEASIBILITY STUDY Page 122 11.5 Density Assignment Bulk densities were assigned globally by unit based on the densities in Table 8-1. 11.6 Variography Variograms were run to test spatial continuity within selected geological domains. Assayed samples of THM% in the Lower McNairy Formation were used to derive variograms. Variogram features exhibit the spatial continuity of the sample spacing. The variogram sill factor along with the known drill hole spacing were used to support the mineral resource confidence classification ranges of the deposit. 11.6.1 Data Domain Drill holes were selected from within a domain boundary established to include drill holes within the anticipated reserve and eliminate outlier sample locations. The data domain boundary is identified in Figure 11-5. TITAN PROJECT TENNESSEE, U.S. TECHNICAL REPORT SUMMARY ON FEASIBILITY STUDY Page 123 Figure 11-5: Data Domain Note: Figure prepared by MM&A, 2026. 11.6.2 Geostatistical Analysis A fan variogram was utilized to establish and confirm a major direction of continuity for the sample data. The result produced an azimuth orientation of 33.75 degrees (N33.75E), with zero-degree plunge in the strike orientation. The dip plane showed slightly less continuity of sample data in the semi-major direction. Table 11-1 is a summary of the variogram orientation and sill ranges for separate 3-dimensional axis directions. TITAN PROJECT TENNESSEE, U.S. TECHNICAL REPORT SUMMARY ON FEASIBILITY STUDY Page 124 Table 11-1: Lower McNairy THM% Sill Range Range (m) Orientation Azimuth (deg.) Plunge (deg.) 80% of sill 90% of sill 100% of sill Strike Plane Major 33.7 0 258 308 875 Dip Plane Semi-major 123.7 0 230 275 764 Minor 123.7 90 78 93 259 11.7 Block Model Development and Validation 11.7.1 Block Model Construction A block model was created to encompass the Study Area extent and estimate the mineral sands deposit resources. The model was oriented with a bearing of 30 degrees east of north, an orientation near the apparent depositional trend of the mineral sands. Block cell dimensions of the model are 25-m*25- m*1.524-m (X*Y*Z). For block model development, the digital topographic surface established the overlying bounding surface. Blocks above the topography were coded as air and excluded from any resource or volume estimates. Gap spaces that exist between the base of the overburden and the top of the Upper McNairy Formation were assigned to waste material (and were therefore handled with the overburden). Stored attributes or codes in each block of the model include geocodes, samples data, assay values estimated for the blocks, and other variables such as property assignment, resource classification, counts factored from grade estimates such as distance to the nearest assay sample or the number of holes or assay samples selected for the grade estimation. To check the block model structures, slices displaying the geologic units, both vertical and horizontal, were viewed and compared to the database and structural surfaces used for block model development. Figure 11-6 is an example of a block model slice showing geologic units. The location of Profile A-A’ is shown on the map inset in the figure.


TITAN PROJECT TENNESSEE, U.S. TECHNICAL REPORT SUMMARY ON FEASIBILITY STUDY Page 125 Figure 11-6: Block Model Profile A-A’ Colored by Geologic Units Note: Figure prepared by MM&A, 2026. 11.8 Grade Capping/Outlier Restrictions No total heavy mineral top cut was used, nor was it considered necessary for this deposit considering the geology, type, and consistency of mineralization. 11.9 Compositing No sample compositing was used for Samples Assay Data estimations. The straight sample method did honor the identified geologic formation breaks of the data records. Mineral assemblage composites of mineralized and background samples are covered in Section 8.4.2. 11.10 Estimation/Interpolation Methods Grade estimations were conducted for the Upper McNairy and Lower McNairy geologic units separately. Units were identified by geologic codes within the block model. The overlying topsoil and alluvium, and the underlying Coon Creek Formation, have low concentrations of heavy minerals, are not considered of economic value and have been excluded from THM estimates. Grade interpolations were completed using an inverse distance weighting to the second power (ID2) algorithm. MM&A used a primary ellipsoid TITAN PROJECT TENNESSEE, U.S. TECHNICAL REPORT SUMMARY ON FEASIBILITY STUDY Page 126 search dimension (Pass 1) of 212-m*425-m*3-m (X*Y*Z) to interpolate all the assay data (THM, oversized material, slime). No dip or plunge angles were assigned to the search ellipsoid. When data were insufficient for a block estimate from the first pass ellipsoid, a secondary, tertiary, and quaternary search ellipsoid were used with increased search volumes (see Table 11-2). Table 11-2: Table of Search Regions for Grade Estimations Samples Assay Data Mineral Assemblage Data Axis & Search Distance (m) Search Orientation Axis & Search Distance (m) Search Orientation Pass Major Semi-m Minor-x Bearing Plunge Dip Major Semi-m Minor-x Bearing Plunge Dip 1 425 212 3 30 0 0 425 212 3 30 0 0 2 610 305 4.3 30 0 0 610 305 6 30 0 0 3 1220 610 6 30 0 0 2440 1220 9 30 0 0 4 2440 1220 9 30 0 0 3660 1830 18 30 0 0 An octant search option was selected with sample data parameters that include a minimum of 2 and a maximum of 8 samples and a maximum of 3 samples per octant for each block estimate. A maximum of 2 samples per drill hole was applied to Passes 1, 2 and 3. For Pass 4, sample data parameters were adjusted to a minimum of 1 and maximum of 4 samples with a maximum of 2 samples per drill hole. The mineral assemblage data set is smaller (84) holes than the sample assay data (140 holes), hence the mineral assay composites were modeled separately from the sample assay data, but each used the same approach. A run-length composite method was applied, creating a data file of 1.524 m intervals (mostly duplicate values for the composite range). Subsequently, grade estimations were run in the same manner as the sample assay data; however, the octant search option was not selected. Grade estimation results were checked in Vulcan with individual block inquiries to review the suite of variable estimates, by block model slices with appropriate color schemes for individual attributes, by 3-D block views and other queries. Variable minimum values and maximum values were reported during estimation to review for non-estimated blocks that were commonly assigned a default value ‘flag’ of -9 or -99. Figure 11-7 includes two profile examples, A-A’ and C-C’, that demonstrate the THM% of the model by block. Each block is colored based on the THM percent in the legend beside profile A-A’. The profiles indicate the low or non-mineralized zone that exists between the heavy mineral zones of the Upper McNairy and Lower McNairy Formations, and also the absence of any mineral interpolation of the overburden and Coon Creek Formations. TITAN PROJECT TENNESSEE, U.S. TECHNICAL REPORT SUMMARY ON FEASIBILITY STUDY Page 127 Figure 11-7: THM% Profiles A-A’ and C- C’ Note: Figure prepared by MM&A, 2026. TITAN PROJECT TENNESSEE, U.S. TECHNICAL REPORT SUMMARY ON FEASIBILITY STUDY Page 128 Additional model attributes, which involve counts derived from grade estimates such as distance to the nearest assay sample or the number of holes or assay samples selected for the grade estimation, were also included in the estimate. 11.11 Classification of Mineral Resources 11.11.1 Mineral Resource Confidence Classification The resource classification was determined based on drill hole density reflecting the geological confidence; firstly, from hole locations with QEMSCAN analysis and secondly from all drill holes with total heavy minerals and the geostatistical variogram model. No drilling has been completed for exploration or resource estimation purposes since 2022. There is, however, additional QEMSCAN analyses of existing drill holes that were completed in 2023 and 2025. > Blocks within a 212-m (696-foot) radius of drill holes having sufficient mineralogical data (QEMSCAN analysis) were assigned a measured classification. The distance is based upon drill hole spacing and is unchanged from prior evaluations. However, the current estimate has additional QEMSCAN data than previous estimates, and the extent of the measured footprint has increased. > Material with a radius between 212 m and 244 m (696 feet and 800 feet) from THM% samples were assigned an indicated classification. The 244-m (800-foot) maximum range was calculated from an average of 80% of the sill range for both the strike direction (258 m or 846 feet) and the dip direction (230 m or 755 feet) variogram model. > Material with a radius between 244 m and 610 m (696 feet and 2,001 feet) from THM samples were assigned an inferred classification. Inferred tonnes were derived from the lesser extent of a 610-m (2,001-foot) radius from a point of measurement, or the resource limit boundary, whichever came first. The resource limit boundary was derived from the footprint extent of a 0.4 THM% grade shell (wire frame). To prevent stand-alone classification pods, radial arcs from points of measurement were required to intersect with an adjacent arc of the same classification. Therefore, isolated, stand-alone drill holes with QEMSCAN samples were not assigned measured classification and similarly, stand-alone drill holes with total heavy minerals were not assigned an indicated classification.


TITAN PROJECT TENNESSEE, U.S. TECHNICAL REPORT SUMMARY ON FEASIBILITY STUDY Page 129 Figure 11-8: Resource by Classification Note: Figure prepared by MM&A, 2026. 11.11.2 Uncertainties Considered During Confidence Classification Table 11-3 summarizes the sources of uncertainties considered during confidence classification. TITAN PROJECT TENNESSEE, U.S. TECHNICAL REPORT SUMMARY ON FEASIBILITY STUDY Page 130 Table 11-3: Sources of Uncertainties Considered During Confidence Classification Source of Uncertainty Discussion Drilling All drilling has been roto-sonic drilling. The roto-sonic drill rig provides a representative sample, with sufficient recoveries of unconsolidated sand, in order to represent the in-ground material and is suitable for use in mineral resource estimation. Sampling Field duplicates are taken at a rate of 3% to identify biases or inconsistencies. Examination of these duplicates indicates satisfactory sampling performance. Geological Modelling The geological model is supported by sufficient drill data. The Coon Creek Formation is reached in >95% of the holes used the model. This provides a sufficient base for the extractable mineralization. Discrimination between the upper and lower members of the McNairy Formation is easily identified by the relative difference in grain size and the presence of micas within the lower member. Estimation The estimation techniques used are suitable for the deposit type and mineralization style. All data are log transformed and show normally distributed grade data. A validation would provide additional confidence in the estimation. 11.12 In situ Tonnage by Formation In-situ tonnage are estimated for the reported controlled mineral tracts of the Study Area excluding areas within the designated floodplain (Figure 11-8). In-situ tonnes are reported by the Upper McNairy and Lower McNairy Formation geologic units separately for THM percentage COG at 0.4 percent. Results of the Study Area define an estimated 347.9 million in-situ tonnes of mineral resource with 2.1% THM using a 0.4% THM COG (Table 11-4). Of the total, an estimated 68 percent of the THM in-situ tonnes exist in the Lower McNairy geologic unit. In addition, there are 97.8 million in-situ inferred tonnes. Laboratory analysis reported either REE percent only, or monazite and xenotime percentages separately, or all three. Throughout the report, the REE represented in the THM assemblage is the combination of the Monazite plus Xenotime plus unclassified REE percentages by sample. From current information, the highest grade of REE appears to exist as a thin zone near the lower portion of the Lower McNairy. Table 11-4: In-situ Resource Summary Table by Formation (0.4 THM% COG) Formation Total In-Situ Tonnes THM* THM* Measured Indicated Total Inferred Grand Total (%) (t) Inclusive of Reserve Upper McNairy 39,810,000 6,106,000 45,917,000 0 45,917,000 1.6 725,000 Lower McNairy 80,624,000 22,282,000 102,906,000 0 102,906,000 3.1 3,162,000 Total 120,434,000 28,388,000 148,823,000 0 148,823,000 2.6 3,887,000 Exclusive of Reserve Upper McNairy 37,248,000 28,921,000 66,169,000 40,080,000 106,249,000 1.1 706,000 Lower McNairy 59,603,000 73,268,000 132,871,000 57,752,000 190,623,000 2.1 2,796,000 Total 96,851,000 102,189,000 199,040,000 97,832,000 296,872,000 1.8 3,502,000 Grand Total Upper McNairy 77,058,000 35,027,000 112,086,000 40,080,000 152,166,000 1.3 1,431,000 Lower McNairy 140,227,000 95,550,000 235,777,000 57,752,000 293,529,000 2.5 5,958,000 Total 217,285,000 130,577,000 347,863,000 97,832,000 445,695,000 2.1 7,389,000 *THM% and THM (Mt) do not include inferred classification. Note: Totals may not add due to rounding. Figure 11-9 compares in-situ tonnes vs. THM%, by grade cut-off. TITAN PROJECT TENNESSEE, U.S. TECHNICAL REPORT SUMMARY ON FEASIBILITY STUDY Page 131 Figure 11-9: Grade Cutoff vs. Tonnage Curve Note: THM% and THM (Mt) do not include inferred classification. 11.12.1 In-situ Mineral Assemblage For an overview of the mineral assemblage, the source data values are included in Table 11-5. The calculated average values are weighted by sample interval length for measured and indicated classifications. Table 11-5: In-situ THM Assemblage Summary, by 0.4 THM% COG THM Assemblage THM Zircon Rutile Ilmenite REE (t) (%) (%) (%) (%) Upper McNairy 1,431,000 5.5 6.7 21.2 0.2 Lower McNairy 5,958,000 11.8 10.3 46.0 1.7 Total 7,389,000 10.6 9.6 41.2 1.4 Note: Totals may not add due to rounding. THM (t) and THM Assemblage do not include inferred classification. 11.13 Reasonable Prospects for Economic Extraction 11.13.1 Initial Assessment Assumptions To meet the content requirements of an initial assessment to support the mineral resource estimates, MM&A evaluated the content requirements set out in Table 1 of §229.1302 (Item 1302) “Qualified person, technical report summary, and technical studies”. As part of the initial assessment, MM&A incorporated reasonable sales price estimates for the various commodities anticipated for the Titan project. Product prices were provided by IperionX based on “TZMI Titanium Feedstock Price Forecast to 2029, Issue 2, 2025” and Adamas Intelligence “Value of IperionX Monazite Concentrate, Q3, 2025” Market TITAN PROJECT TENNESSEE, U.S. TECHNICAL REPORT SUMMARY ON FEASIBILITY STUDY Page 132 Reports. These product prices are more conservative than those included in the economic model and sensitivity analysis (Section 19) of the FS. Mining costs used in the initial assessment are based on both input from prospective mining contractors along with estimates of projected processing, transportation, dewatering, wetlands and stream mitigation, general and administrative, and royalty costs. 11.13.2 Input Assumptions Used to Constrain the Mineral Resource Estimates The reasonable prospects for economic extraction for the mineral resources were based on the parameters listed in Table 11-6. An assumed vertical slope was used for the basis of the in-place resource estimates. Table 11-6: Assumptions Used in Defining Reasonable Prospects of Economic Extraction Parameter Units Value Commodity price Rutile US$/t 1,425 Ilmenite US$/t 340 Rare earth mineral concentrate US$/t 10,678 Zircon concentrate US$/t 912 Metallurgical recovery Rutile % 70.6 (81.2% mineral in product) Ilmenite % 85.0 (95.8% mineral in product) Heavy rare earth concentrate % 89.5 (87.8% mineral in product) Zircon % 91.2 (46.9% mineral in product) Operating costs Mining cost US$/m3 7.23 Processing cost US$/ROM t 3.09 Transport cost US$/ROM t 1.00 Reclaim/rehandle US$/ROM t Included in mining cost Incremental in pit management US$/ROM t Included in mining cost General and administrative cost US$/ROM t 0.95 Dewatering US$/ROM t 0.30 Wetlands mitigation cost US$/ha 60,000 Stream mitigation cost US$/ linear m 1,425 Royalty % 5 The operating cost assumptions are based on a scenario where material is mined, transported to a process plant using a conveyor belt, immediately processed, and the process residue is dewatered and immediately returned to the mined area as backfill via a conveyor belt. Under the assumptions listed above, mineral resources estimated herein are considered to meet reasonable prospects for economic extraction using a COG of 0.4% THM. 11.13.3 Cut-off Grade A bottom COG of 0.4% THM was used in the constraining pit shell, on the basis that the incremental cost of selectively extracting this material, hauling it to a long-term stockpile, and subsequently reclaiming and re-placing the material into a mine void for progressive rehabilitation would be higher than the net cost (operating cost less revenue) of the central case method. The central case method is the processing of this material, extracting the contained valuable critical minerals for sale and immediately returning the remaining material, mostly silica sand, back to the deposit void. As discussed in Section 12, an additional


TITAN PROJECT TENNESSEE, U.S. TECHNICAL REPORT SUMMARY ON FEASIBILITY STUDY Page 133 pit optimization was completed to generate the finalized mine plan pit shell used in the conversion of mineral resources to mineral reserves. Based on the aforementioned initial assessment results in Section 11.13.1, MM&A considers those blocks within the constraining resource pit shell, and above the cut-off applied, to have reasonable prospects for economic extraction. 11.13.4 QP Statement Based on the data review, the attendant work done to verify the data integrity and the creation of an independent geologic model, MM&A believes this to be a fair and accurate representation of the IperionX mineral resources. 11.14 Mineral Resource Estimates Mineral resources are reported using the mineral resource definitions set out in S-K 1300 on a 100% basis. The reference point for the estimate is in situ and are inclusive of reserves. Mineral resources are current as at June 4, 2026. The third-party firm responsible for the estimate is MM&A. The mineral resource estimates are provided in Table 11-7. Assemblage percentage values are reasonably consistent among the measured and indicated classes. The interpolated inferred class is also provided. Table 11-7: Mineral Resource Estimate and Total Heavy Minerals Assemblage Mineral THM Assemblage Resource In situ THM THM Zircon Rutile Ilmenite REE Estimate Tonnes (%) (t) (%) (%) (%) (%) Inclusive of Reserve Measured (M) 120,434,000 2.5 3,060,000 11.1 9.5 40.9 1.5 Indicated (I) 28,388,000 2.9 828,000 11.8 9.2 52.0 1.5 Total M+I 148,823,000 2.6 3,887,000 11.2 9.4 43.2 1.5 Inferred (Inf) 0 0.0 0 0.0 0.0 0.0 0.0 Total M+I+Inf 148,823,000 2.6 3,887,000 11.2 9.4 43.2 1.5 Exclusive of Reserve Measured (M) 96,851,000 1.5 1,489,000 10.4 9.2 40.1 1.2 Indicated (I) 102,190,000 2.0 2,013,000 9.8 10.2 38.9 1.5 Total M+I 199,041,000 1.8 3,502,000 10.0 9.8 39.4 1.4 Inferred (Inf) 97,832,000 1.8 1,774,000 9.3 9.6 38.0 1.2 Total M+I+Inf 296,872,000 1.8 5,276,000 9.8 9.7 39.0 1.3 Grand Total Measured (M) 217,285,000 2.1 4,548,000 10.8 9.4 40.6 1.4 Indicated (I) 130,578,000 2.2 2,841,000 10.4 9.9 42.7 1.5 Total M+I 347,863,000 2.1 7,389,000 10.6 9.6 41.4 1.4 Inferred (Inf) 97,832,000 1.8 1,774,000 9.3 9.6 38.0 1.2 Total M+I+Inf 445,695,000 2.1 9,163,000 10.4 9.6 40.8 1.4 Notes to accompany mineral resource table: 1. Mineral resources are reported using the definitions set out in Regulation S-K 1300 and are current as at June 4, 2026. Mineral resources are reported on an in situ basis, inclusive of reserves. 2. The third-party firm responsible for the estimate is MM&A. 3. Mineral resources are reported within a conceptual pit shell that uses the key assumptions summarized in Table 11-6 above. 4. Mineral resources are reported above a COG of 0.4% THM. 5. Property contains 199.0 Mt of mineral resources (Measured + Indicated) exclusive of mineral reserves (Figure 11-8). 6. Estimates have been rounded. TITAN PROJECT TENNESSEE, U.S. TECHNICAL REPORT SUMMARY ON FEASIBILITY STUDY Page 134 11.15 Qualified Person’s Opinion Based on the data review, the attendant work done to verify the data integrity and the creation of an independent geologic model, MM&A believes this to be a fair and accurate representation of the IperionX mineral resources. Moreover, MM&A opines that additional exploration, mine planning and financial analysis could result in conversion of additional resources to reserves in the future; however, there is no guarantee that such will be the case until the additional work is completed. 11.16 Factors That May Affect the Mineral Resource Estimates Specific factors that may affect the estimates include: > changes to property control (i.e., owned, leased, or optioned tracts) > changes to forecast commodity and final product price assumptions > changes in local interpretations of mineralization geometry and continuity of mineralized zones > changes to metallurgical recovery assumptions > changes to assumptions as to deleterious elements > changes to the input assumptions used to derive the conceptual open pit shell that is used to constrain the estimates > changes to the cut-off values applied to the estimates > variations in geotechnical, hydrogeological, and mining assumptions > changes to environmental, permitting, and social license assumptions TITAN PROJECT TENNESSEE, U.S. TECHNICAL REPORT SUMMARY ON FEASIBILITY STUDY Page 135 12 Mineral Reserve Estimates 12.1 Assumptions, Parameters and Methodology Mineral reserves were converted from measured and indicated mineral resources. Inferred mineral resources were treated as waste. 12.1.1 Optimization Methodology 12.1.1.1 Block Model & Cutoff Grade Beginning with the geologic block model described in Section 11, MM&A developed a mine plan and reserve estimate using K-MINE Group’s (K-MINE) Planning and Optimal Pit Boundaries modules. The initial cutoff grade (COG) for mineral reserve estimation was set at 0.4% THM based on previous work. Upon coordination with process engineers designing the WCP, it was determined that a COG yielding a rougher feed grade of 3.2% THM would yield better recoveries through the process plant. A detailed COG analysis was completed whereby additional optimizations were run at COGs of 0.6% THM, 0.7% THM, 0.8% THM, and 0.85% THM to arrive at 3.2% THM grade feed to the WCP. Final COG used for optimization, scheduling, and mine planning was set at 0.85% THM. This selection was supported by a sensitivity analysis. Price coefficients (or revenue factors) were set up as part of the optimization process with a range of 20% to 110% with a 10% price correlation step for the final products. It was decided to proceed using a 90% price coefficient, which provides the best correlation between maximizing profit and maximizing the mineral reserves mined. Floodplain restrictions were observed for the optimization process. Production requirements were based on the target production of 3.5 Mt per year for Phase 1 (Years 1-4) and 10.0 Mt per year for Phase 2 (Years 5-14). 12.1.2 Optimization Parameters Optimization parameters for the project were compiled using input from IperionX, S&ME, and MM&A and are shown in Table 12-1. Geotechnical assessment resulted in a final wall berm (batter) height of 10 m with a batter angle 35 degrees and 5-m benches, resulting in an overall 27.4-degree slope wall (see additional discussion in Section 13.1). Due to the geometry of the mining pits, small amounts of economic material may have been excluded from the mine plan tonnages, while small amounts of sub-economic/low-grade material may have been included and account for the dilution included as part of the mineral reserve estimate. TITAN PROJECT TENNESSEE, U.S. TECHNICAL REPORT SUMMARY ON FEASIBILITY STUDY Page 136 Table 12-1: Optimization Parameters Group / Item Unit Value Geometry Coordinate System - UTM-16N Overburden slope ° 26.6 Face slopes ° 35 Inter-ramp slope ° 29 Overall slope ° 27.4 Berm width m 5 Batter angle ° 35 Berm (batter) height (working) m 10 Berm (batter) height (final wall) m 10 Minimum mining width m 25 Ramp width m 25 Total depth m 55 Block dimension X m 25 Block dimension Y m 25 Block dimension Z m 1.524 Mining Production rate tonne/year 3,529,000 to 10,588,000 Production schedule Hours/Year 8760 Production schedule efficiency % 85 Ramp grade % 10 Concentrator recovery Rutile % 70.6 (81.2% mineral in product) Ilmenite % 85.0 (95.8% mineral in product) Heavy rare earth concentrate % 89.5 (87.8% mineral in product) Zircon % 91.2 (46.9% mineral in product) Cutoff grade (COG) % 0.85 THM Specific gravity (ore) - 1.57 Specific gravity (waste rock) - 1.72 Specific gravity (Coon Creek Formation) - 1.54 Specific gravity (soil) - 1.72 Restrictions - floodplain & wetlands Swell factor % 12 Pit Loss/Dilution % 10 (in addition to low-grade interburden) Vertical rate of advance m 90 Battery limits location ROM Pile Financial Mining cost US$/m3 7.23 Transportation cost US$/ROM t 1.00 Processing cost US$/ROM t 3.09 Reclaim/rehandle US$/ROM t Included in mining cost Incremental in pit management US$/ROM t Included in mining cost General and administrative cost US$/ROM t 0.95 Dewatering US$/ROM t 0.30 Wetlands mitigation cost US$/ha 60,000 Stream mitigation cost US$/ linear m 1,425 Royalty % 5 Sales price rutile US$/t 1,425 Sales price ilmenite US$/t 340 Sales price rare earth concentrate US$/t 10,678 Sales price zircon concentrate US$/t 912 Production data outputs from LOM plan sequencing were processed into Microsoft® Excel spreadsheets and summarized on an annual basis for incorporation into the economic model.


TITAN PROJECT TENNESSEE, U.S. TECHNICAL REPORT SUMMARY ON FEASIBILITY STUDY Page 137 Revenue streams as projected in the economic portions of the report assume a sales realization (FOB- mine) of US$1,425 per tonne for rutile final product, US$340 per tonne for ilmenite final product, US$912 per tonne for zircon concentrate, and US$10,678 for rare earth elements concentrate. Product prices were provided by IperionX based on “TZMI Titanium Feedstock Price Forecast to 2029, Issue 2, 2025” and Adamas Intelligence “Value of IperionX Monazite Concentrate, Q3, 2025” Market Reports. The FS economic analysis in Section 19 utilizes higher overall commodity prices in aggregate than Mineral Reserve price assumption. This difference reflects updated market information available at the time of completion of the FS economic model. A separate pit optimization economic review and sensitivity analysis demonstrates that the project remains economically viable at the Mineral Reserve commodity price assumption. The conversion of mineral reserves (ROM-basis) via concentration and chemical processing to final products or concentrates are included in IperionX’s business plan, and as such, the costs of such processes and appropriate revenue streams are included in financial modeling. Resource modeling and mine optimization as described in the report were used as a basis for the reserve estimate using the geologic model described in Section 11 as the basis of the conversion from mineral resources to mineral reserves. Proven and Probable mineral reserves were derived from the defined resource considering relevant processing, economic (including technical estimates of capital, revenue, and cost), marketing, legal, environmental, socio-economic, and regulatory factors. 12.2 Mineral Reserve Statement Mineral reserves are reported using the mineral reserve definitions set out in S-K 1300 on a 100% basis. Mineral reserves are current as at June 4, 2026. The reference point for the mineral reserve estimate is as delivered to the process facilities. The third-party firm responsible for the estimate is MM&A. The Mineral Reserve estimate is based only on Measured and Indicated Mineral Resources. Inferred Mineral Resources were treated as waste and were not used to support Mineral Reserves or economic viability. The mineral reserve estimates are provided in Table 12-2. Table 12-2: Titan Project – Estimate of Mineral Reserves, ROM Basis Grand Total ROM Tonnes THM Assemblage THM THM Zircon Rutile Ilmenite REE Unit Proven Probable Total (%) (t) (%) (%) (%) (%) Upper McNairy 24,565,000 2,415,000 26,980,000 2.3 620,000 6.2 6.2 23.6 0.2 Lower McNairy 68,740,000 21,307,000 90,047,000 3.4 3,086,000 12.7 10.5 48.3 1.9 Total 93,306,000 23,722,000 117,027,000 3.2 3,706,000 11.6 9.8 44.2 1.6 Notes to accompany mineral reserve table: 1. Mineral reserves are reported using the definitions set out in Regulation S-K 1300 and are current as at June 4, 2026. Mineral reserves are reported on a ROM basis. 2. The third-party firm responsible for the estimate is MM&A. 3. Mineral reserves are reported within a finalized mine design pit shell that uses the key assumptions summarized in Table 12-1 above. 4. Mineral reserves are reported above a COG of 0.85% THM. 5. Ilmenite includes leucoxene, pseudorutile, and ilmenite and REE includes monazite, xenotime, and unclassified REE. 6. Estimates have been rounded. TITAN PROJECT TENNESSEE, U.S. TECHNICAL REPORT SUMMARY ON FEASIBILITY STUDY Page 138 12.3 Qualified Person’s Opinion Mineral reserves are reported using the definitions in S-K 1300. The Qualified Person’s considered pertinent modifying factors, inclusive of geological, environmental, regulatory, and legal factors, in converting a portion of the measured and indicated mineral resources to mineral reserves. 12.4 Factors That May Affect the Mineral Reserve Estimates Specific factors that may affect the estimates include: > changes to property control (i.e., owned, leased, or optioned tracts) > changes to forecast commodity and final product price assumptions > changes in local interpretations of mineralization geometry and continuity of mineralized zones > changes to metallurgical recovery assumptions > changes to assumptions as to deleterious elements > changes to the input assumptions used to derive the finalized mine design open pit shell that was used to constrain the estimates > changes to the cut-off value applied to the estimates > variations in geotechnical, hydrogeological, and mining assumptions > changes to pit optimization assumptions > changes to mine designs > changes to environmental, permitting, and social license assumptions TITAN PROJECT TENNESSEE, U.S. TECHNICAL REPORT SUMMARY ON FEASIBILITY STUDY Page 139 13 Mining Methods 13.1 Pit Slope Assumptions The pit slope stability information for the project is based primarily on field and laboratory data presented in a geotechnical report completed by S&ME titled “Report of Geotechnical Exploration – Titan Heavy Mineral Sands Project – Mine Pit Side Wall Slopes – Camden Tennessee, S&ME Project No. 22350271B”, dated August 21, 2025. The pit slope geotechnical assessment includes data collected from 44 geotechnical borings that were planned, drilled, and tested specifically for the Titan project. The layout of the geotechnical borings is included in the figure below, which is excerpted from S&ME’s 2025 report. Planning for the geotechnical exploration drilling was a collaborative effort amongst S&ME, MM&A, and IperionX. S&ME managed all of the drilling activities and performed all of the laboratory testing. In addition, S&ME completed a series of initial two-dimensional (2-D) pit slope stability models to provide general guidelines for pit slope stability considerations. The S&ME report concluded with general recommendations for stable pit slope wall parameters, with an emphasis on overall pit slope angles. S&ME’s 2-D stability modeling relied upon estimated pit wall water table positions, as model results for pit slope dewatering were not available at the conclusion of S&ME’s study. Geotechnical characterization, by geologic unit, as determined by S&ME’s investigation, is summarized in Table 7-2. The S&ME mine pit wall slope stability report presented six representative pit slope cross-sections from within the planned mine area for geotechnical modeling purposes. The stability analyses relied upon assumed water levels, and S&ME concluded that water tables in the mine pit slopes would be a critical factor for pit wall stability. S&ME conducted the initial pit slope stability assessments based on a desired factor of safety of 1.5, a value that is often used in the mining industry for long-term slopes. Overall, a range of factors of safety of 1.3 to 1.5 for slope stability is common within the mining industry and suitable for the Titan Project, with variability dependent upon location of potential failures, size of potential failures, consequences of failures, exposure time of pit walls, and the number of uncertainties associated with the calculation of the factor of safety. The pit slope parameters tested by the stability assessment and used for the current pit optimization results are summarized in Figure 13-1. TITAN PROJECT TENNESSEE, U.S. TECHNICAL REPORT SUMMARY ON FEASIBILITY STUDY Page 140 Figure 13-1: Pit Slope Geometric Parameters Note: Figure prepared by MM&A, 2026. Additional confirmation of the stability of the planned pit slopes was achieved via a combination of hydrogeologic modeling, additional 2-D slope stability assessment, and subsequent 3-D slope stability modeling. Large-scale, 3-D groundwater modeling for the proposed pit development over the life of mining was completed by HDR (see Section 7.3). While the results from the HDR modeling provided an estimate of groundwater inflow to the pits over the life of the mine, more detailed, slope-specific groundwater simulation was completed by MM&A, using Rocscience’s RS2 software, to evaluate the expected water table surfaces in the mine pit slopes for various potential dewatering scenarios. The RS2 modeling allowed for evaluation and comparison of the effects on the water table of pit excavation only, pit excavation with dewatering wells, and pit excavation with dewatering wells and addition of slurry wall sections along the perimeter of the pits in the context of pit slope stability. Modeling was completed using hydrogeologic parameters determined by a pump test conducted by HDR and the models were run assuming transient conditions. The diagram below summarizes the hydraulic conductivity values, both horizontal and vertical, applied to the RS2 modeling, consistent with information provided by HDR.


TITAN PROJECT TENNESSEE, U.S. TECHNICAL REPORT SUMMARY ON FEASIBILITY STUDY Page 141 Figure 13-2: RS2 Pit Wall Seepage Modelling – Horizontal and Vertical Hydraulic Conductivity Inputs Note: Figure prepared by MM&A, 2026. Results consistently demonstrated the effects of the lower vertical conductivities estimated for the first and second halves of the Lower McNairy Formation unit, as compared to the higher-conductivity overburden and Upper McNairy Formation units. Regardless of the dewatering approach applied, modeling suggests that groundwater seepage in the pit walls is expected to emerge from near the base of the first half of the Upper McNairy Formation or the top of the second half of the Upper McNairy Formation, even after significant time periods. The first figure below demonstrates model results for expected change to the water table in the pit wall assuming that no special dewatering activities are conducted other than excavation of the pit. As is evident from the figure, seepage is expected to emerge near the middle of the Upper McNairy, even after two years. Figure 13-3: RS2 Pit Wall Seepage Modelling – Sequenced Model Results for Water Surface Changes Over Time with Only Pit Excavation Note: Figure prepared by MM&A, 2026. TITAN PROJECT TENNESSEE, U.S. TECHNICAL REPORT SUMMARY ON FEASIBILITY STUDY Page 142 In comparison to the pit excavation only case, the next figure demonstrates the water table modeling results including pumping from a pit perimeter well and excavation of the pit. Step 2 in the figure indicates the drawdown expected from the well after three months of pumping and Step 3 is the water table after one year of pumping. Steps 4 through 6 indicate the expected water table response associated with the pumping coupled with sequenced excavation of the pit over time, out to 18 months. Finally, Step 7 indicates that the water table, despite 36 months of pumping in addition to the excavated pit, is still expected to seep at the middle of the Upper McNairy unit. Figure 13-4: RS2 Pit Wall Seepage Modelling – Sequenced Model Results for Water Surface Changes Over Time with Pit Perimeter Pumping Well and Pit Excavation Note: Figure prepared by MM&A, 2026. Additional models, including simulation of deeper wells placed to dewater from the first and second halves of the Lower McNairy Formation, indicated that the wells had minimal effect on dewatering those units within a reasonable timeframe relative to the anticipated pace of mining. The anticipated difficulty of dewatering the Lower McNairy Formation unit, as well as the underlying Coon Creek, resulted in lower than desired factors of safety when evaluating the slopes along two-dimensional cross-section lines. To enable more accurate slope stability assessment of the actual planned pit walls considering the overall pit shapes and placement of tailings as mining progresses, 3-D slope stability assessment was completed using Rocscience’s SLIDE3 software. Due to the anticipated challenges of dewatering the Lower McNairy Formation unit, the 3-D stability modeling was completed assuming pit excavation would proceed with dewatering occurring via only a sump and pump in the advancing pit. To simulate worst-case groundwater inflow conditions, the 3-D stability models assumed a water table surface very close to the pit wall surface (approximately 0.3 to 0.6 meters or 1 to 2 feet below the pit wall surface). The 3-D stability models were completed for numerous locations within the life of mine pit TITAN PROJECT TENNESSEE, U.S. TECHNICAL REPORT SUMMARY ON FEASIBILITY STUDY Page 143 shells, with specific attention given to areas where the pit walls are expected to be the highest. By analyzing the stability of the highest expected pit walls and assuming a water table position very close to the final pit wall ground surface, the assessment accounts for conditions that may result from large precipitation events. Example visuals from the 3-D slope stability modeling are included in the figures below. The largest area of greatest pit wall height for the proposed pit shell is located on the western side of the project (see first figure below). Figure 13-5: Approximate Total Wall Height Variations Note: Figure prepared by MM&A, 2026. Images from the 3-D slope stability modeling conducted for the western side of the pit, where the walls will be the greatest in height, are included below. The first figure below depicts the modeled area with the pit wall contours indicated. The second figure is the modeled area as represented in the 3-D modeling software. As shown, the 3-D water table for the model was assumed to be very near the surface of the ground, with numerous places where the water surface actually emerges from the pit wall. TITAN PROJECT TENNESSEE, U.S. TECHNICAL REPORT SUMMARY ON FEASIBILITY STUDY Page 144 Figure 13-6: Pit Wall Contours for 3D Slope Stability Model of Western Side of Overall Pit Note: Figure prepared by MM&A, 2026. Figure 13-7: Western Pit Wall Depiction in 3D Slope Stability Modelling Software (SLIDE3) Note: Figure prepared by MM&A, 2026. The figure below summarizes the 3-D slope stability modeling results for the western slopes of the planned pits, where the wall height is expected to be the greatest. As indicated by the results, the lowest


TITAN PROJECT TENNESSEE, U.S. TECHNICAL REPORT SUMMARY ON FEASIBILITY STUDY Page 145 factor of safety computed (global minimum) is 1.4, with the wall area generally ranging in safety factor from approximately 1.4 to 1.8. Figure 13-8: Western Pit Wall Depiction in 3D Slope Stability Modelling Software (SLIDE3) Note: Figure prepared by MM&A, 2026. Results indicate that typical minimum pit wall stability factors of safety are expected to be in the range of 1.3 to 1.5, with smaller failures more often associated with the lower end of the factors of safety range and larger potential failures often exhibiting factors of safety values of 1.4 to 1.5. The 3-D pit wall modeling did not include the planned tailings backfill. Tailings backfill, which is planned to closely follow with the advancing mining face, will provide buttressing support to the pit slope walls, further increasing the wall stability. To supplement the modelling efforts, MM&A and IperionX collected observations from nearby excavations in the Upper McNairy formation for general reference. Available topographic mapping was also reviewed in those mining areas to estimate the current wall angles being used. The proposed designs were within ranges seen at the existing operations. The photographs below provide examples of conditions encountered during excavation of the Upper McNairy formation at mine locations within the region. TITAN PROJECT TENNESSEE, U.S. TECHNICAL REPORT SUMMARY ON FEASIBILITY STUDY Page 146 Figure 13-9: Example Photograph 1 of Working Face Excavation into Overburden and Upper McNairy Figure 13-10: Example Photograph 2 of Working Face Excavation into Overburden and Upper McNairy The nearby excavations observed reportedly do not have perimeter dewatering wells and/or slurry wall configurations. TITAN PROJECT TENNESSEE, U.S. TECHNICAL REPORT SUMMARY ON FEASIBILITY STUDY Page 147 Figure 13-11: Example Photograph 3 of Working Face Excavation into Overburden and Upper McNairy In addition to observations collected at other mines in the area where the Upper McNairy is being excavated, available topographic mapping was reviewed in those mining areas to estimate the current wall angles being used. The figure below is an example topographic section from a mine site west of Camden, Tennessee, where the overburden and Upper McNairy materials are exposed in the cut. While the cut is only about 40 feet high, it provides some insight into wall slope angles for the Upper McNairy. The lower part of the slope is at a 58-degree angle, and the upper portion of the slope is at 40 degrees, with an overall slope of approximately 47 degrees. In comparison, maximum bench angles used for the Titan Project design are 35 degrees with the overall angle of the slope at 27 degrees. TITAN PROJECT TENNESSEE, U.S. TECHNICAL REPORT SUMMARY ON FEASIBILITY STUDY Page 148 Figure 13-12: Example Topographic Section Line through 40-Foot Highwall at Nearby Excavation into Upper McNairy Note: Figure prepared by MM&A, 2026. 13.2 Tailings Geotechnical Assessment The mine plan requires that the filtered/dried tailings material from the WCP will be backfilled into the mine pit as mining progresses. The backfilling in the pits will also include waste material moved directly from the mining face to the backfill. The backfilled tailings structure is expected to follow closely behind the advancing open pit mine face. The expected geotechnical properties of the tailings material were assessed as described in a report by S&ME titled “Report of Engineering Services – Titan Heavy Mineral Sands Project – Tailings Slope, Camden Tennessee, S&ME Project No. 22350271B”, submitted to IperionX on August 27, 2025. Laboratory testing was completed for two separate samples of tailings material representative of the approximate mixtures of sand tailings and slimes material to be placed in the backfill (samples included 13.1% slimes to 86.9% sand and 23.1% slimes to 76.9% sand). The test results from the tailings samples are considered to be reasonably representative of the direct waste material, given that much of the waste material is Upper McNairy sand that contains some clay material. The S&ME report indicates that the tailings are expected to have a unit weight of 100 pcf, an effective cohesion of 0 psf, and a friction angle of 33 degrees. The S&ME testing did not indicate a significant difference in geotechnical properties related to the variation in the percentage of slimes composition. S&ME also provided an expected hydraulic conductivity value for the tailings of 1 x 10⁻⁴ cm/sec (2.8 ft/day) or greater.


TITAN PROJECT TENNESSEE, U.S. TECHNICAL REPORT SUMMARY ON FEASIBILITY STUDY Page 149 The laboratory analysis results were used by S&ME to conduct initial slope stability modeling (four representative cross-section) for the backfilled tailings and waste material. The results of S&ME’s modeling indicate that bench angles of 21.8-degrees (2.5H:1V) in the tailings are expected to be stable with FS values ranging from approximately 1.4 to 1.6. Laboratory strength testing was conducted on tailings samples that had been compacted to at least 92- percent of the material’s maximum dry density as determined by the standard Proctor compaction test (ASTM D698). To reach this level of compaction in the field, S&ME’s recommendation is to place an initial 0.9-m (3-foot) lift thickness of tailings on top of the Coon Creek Formation at the bottom of the pit and then to subsequently place 0.3-m (12-inch) lifts as the tailings backfill is developed. The tailings material is assumed to be at a moisture content of approximately 16% to 18% for stability reasons as placement and compaction is occurring. In the context of the Titan Project, the actual compaction for the backfilled tailings may be less than the recommended 92-percent as a result of the rate of backfilling and the equipment to be used for the backfilling and reclamation. Additional 3-D slope tailings stability modeling was completed. The modeling assumed a significantly reduced strength for the tailings, as compared to the parameters determined by S&ME’s laboratory testing. To test a conceptual “worst case”, the 3-D modeling assumed the strength of the tailings to be represented as loose sand. Modeling assumed a tailings density of 70 pcf (a value representative of the low-end range of density for loose, dry sand (SME, 2002)) and a reduced friction angle of 28-degrees (also a low-end range value for loose sand). The use of loose sand parameters to model the backfilled tailings is a conservative approach and the actual strength conditions for the tailings are expected to be more similar to the optimal compaction than to loose sand. The results indicate that, even assuming very little compaction (simulated by using loose sand strength conditions for the tailings) and assuming the water table is allowed to build-up to 9m (30 feet) below the top of the backfilled tailings, the tailings slope still is expected to have a factor of safety of just under 1.2 (Figure 13-13). The same model was run assuming that the water level in the tailings is maintained at approximately 12 m (40 feet) below the top of the backfilled tailings and the factor of safety for a potential large-scale failure in the tailings slope increased to 1.6. The 3-D tailings slope stability modeling demonstrates that the backfilled tailings is expected to be stable, even if less-than-optimal compaction is achieved. Due to the sensitivity of the “worst case” tailings backfill slope stability to water level build up in the tailings, monitoring/pumping wells will periodically be installed in the backfilled tailings to ensure that the water table does not build to an adverse level. TITAN PROJECT TENNESSEE, U.S. TECHNICAL REPORT SUMMARY ON FEASIBILITY STUDY Page 150 Figure 13-13: Example Screen Shot of 3-D Modeling of Backfilled Tailings Assuming Reduced Strength Due to Potential Less-than-Optimal Compaction (Potential Failure Surface with Water Level at 30 feet deep and Seepage at Toe of Tailings) Note: Figure prepared by MM&A, 2026. 13.3 Hydrogeological Assessment Groundwater modeling for the life of mine was completed by HDR (see Section 7.4). The following discussion summarizes the basic components of the modeling and describes how the results of the hydrogeologic modeling were used for the project. Details of the modeling are available by reviewing the report titled “Groundwater Flow Model Addendum – IPX”. The March 2026 report was presented as an addendum to a previous report completed by HDR in 2022, titled “Groundwater Flow Model – IPX, Henry and Carroll Counties, TN”, submitted to IperionX December 14, 2022. HDR completed groundwater models for two separate dewatering scenarios, one considering dewatering wells along the pit perimeter and another considering a reduced number of dewatering wells along the pit perimeter in combination with a series of slurry walls also along the pit perimeter. Project scheduling and necessary iterations that occurred through the life of the Titan Project resulted in the groundwater flow modeling being conducted on a slightly different mine plan, as compared to the finalized mine plan used for this FS. The mine plan that was used for the groundwater modeling and the finalized mine plan TITAN PROJECT TENNESSEE, U.S. TECHNICAL REPORT SUMMARY ON FEASIBILITY STUDY Page 151 relied upon for the FS are nearly identical in location and similar in overall pit size, with some variation in mining sequence in the first five years of the mine life. To match the estimated groundwater inflow results from HDR’s model to the finalized pit layout and mining sequence, each groundwater-modeled pit area was coupled with the associated model-estimated inflow to determine an average groundwater inflow rate per acre mined for each area. Then the finalized mine plan area and sequencing was overlain onto the inflow areas defined by the HDR modeling, and inflows were estimated for each final mine plan sequence area by applying the model-determined gallon per minute per acre values. The final mine plan considers that no dewatering wells or slurry walls are necessary to maintain adequate stable pit walls, so the total inflow values estimated by the HDR modeling are utilized (total of estimated flow from dewatering wells and toe drains within the bottom of the advancing pit). A graph of the estimated total pit groundwater inflow variations over the life of mine is presented in Figure 7-5. 13.4 Mining Related Requirements Mining operations for the Titan project site are based on providing 3.5 Mt per year for Phase 1 (Years 1- 4) and 10.0 Mt per year for Phase 2 (Years 5-14) to the WCP from the mining pits within the Titan project boundary and disposing of dewatered tailings and waste material (non-ore sand and soils) in the Waste Storage Areas, Topsoil Storage Area, and Pit backfill areas. Final estimates for fleet equipment size and mine costs were generated by the mining contractors from the production schedule. 13.5 Mine Plan A finalized FS mine plan was created using K-MINE’s Dynamic Design module for multiple years based on nested pits created from initial optimizations in order to create route profiles for equipment sizing and scheduling. These plans were developed by MM&A in order to allow mining contractors to match production requirements by year to excavators, articulated haul trucks and fixed and mobile conveyors, which ultimately resulted in preparing cost analysis data used in mining cost modeling and are examples of typical mine plan sections and haulage profiles, respectively. Yearly plans incorporated ore production to the WCP, waste production to on-site waste dumps, and the associated conveyor lines for each destination. Ore production was primarily dictated by WCP ROM feed requirements and secondarily dictated by pit size and scheduling of exhausted pits for tailings and waste backfill. Detailed drawings of the mine plan showing pit contours, backfill contours, pit sections, haulage profiles, and ore waste sections are included in the February 2026 contract mining package prepared by MM&A titled “Request for Mine Prices – IperionX Limited Titan Project near Camden, Tennessee”. 13.6 Mining Method Selection 13.6.1 Mining Method Determination MM&A prepared a qualitative decision matrix presented in Figure 13-14 below. Based on a review of the key criteria (productivity, flexibility, separating plant-pit operations, operating cost, capital cost, ore TITAN PROJECT TENNESSEE, U.S. TECHNICAL REPORT SUMMARY ON FEASIBILITY STUDY Page 152 selectivity, and sensitivity to potentially wet pit floor), MM&A recommended an excavator and truck mining method, with mining activities completed by a contractor. This assumes the mobile equipment fleet is owned by the contractor. This option had the lowest initial and overall life-of-mine capital, and lowest net present value (NPV) for the three methods evaluated. Figure 13-14: Mining Method Selection Decision Matrix Option 1 Option 2 Option 3 Criteria Mobile Mining Unit Excavator & Articulated Truck Combination Dozer Push & Excavator w/Conveyors Productivity Flexibility Separate Plant - Pit Operations Operating Cost Capital Cost Ore Selectivity Sensitivity to Wet Pit Floor Legend Good OK Bad 13.6.2 Mining Method Details A combination of excavators and articulated trucks will be used to mine the ROM ore as well as all topsoil, overburden and interburden waste material. ROM stockpiles and initial waste disposal areas were designed to minimize haul distances. Conveyors will be used to transport ROM ore from the mine area to the WCP, and dewatered tailings from the WCP back to the pits for disposal in the final backfill. Backfill locations are shown in Figure 13-15.


TITAN PROJECT TENNESSEE, U.S. TECHNICAL REPORT SUMMARY ON FEASIBILITY STUDY Page 153 Figure 13-15: Waste & ROM Pile Plan and Profile Views Note: Figure prepared by MM&A, 2026. Articulated trucks will transport ROM ore from the excavator to the ROM stockpile where it will be screened to remove oversize material and conveyed to the WCP. A contractor will load ROM ore from the stockpile into the hopper that feeds the conveyor. Tailings material will be dewatered as part of the WCP process and transported back to the mined pits and storage areas via conveyors for dry stacking. Figure 13-16 below shows a typical profile of the proposed mining method. TITAN PROJECT TENNESSEE, U.S. TECHNICAL REPORT SUMMARY ON FEASIBILITY STUDY Page 154 Figure 13-16: Schematic Pit Diagram Note: Figure prepared by MM&A, 2026. After dewatering as part of the WCP processing operations, combined (sand and slimes) tailings will be disposed of by stacking within the pit void behind the mining face. Tailings in Year 1 are to be stored in the Waste Pile East and pit waste (interburden) is to be backfilled into the pit area. Tailings will be transported from the plant area to Waste Pile East by conveyor and the contractor will place tailings with dozers. Pit waste will be hauled by the contractor from the working face to the pit backfill areas and spread with dozers. A mine layout showing the Year 1 ROM pile, waste pile and backfill surface locations is provided in Figure 13-17. TITAN PROJECT TENNESSEE, U.S. TECHNICAL REPORT SUMMARY ON FEASIBILITY STUDY Page 155 Figure 13-17: Year 1 Mine Pit, ROM Pile, Waste Pile and Backfill Surfaces Note: Figure prepared by MM&A, 2026. Tailings in Years 2-4 are to be stored in the Waste Pile North near the plant area and pit waste is to be backfilled into the pit areas. Permitting for the Waste Pile North has not been completed at this time, but the FS financial model includes capital cost (CAPEX) to permit this area. Tailings disposal in Years 2-4 will be transported by conveyor to Waste Pile North and the contractor will place the tailings with dozers. Pit waste will be hauled by the contractor from the working face to the pit backfill areas and spread with dozers. A mine layout showing the Year 4 ROM pile, waste pile and backfill surface locations is provided in Figure 13-18. TITAN PROJECT TENNESSEE, U.S. TECHNICAL REPORT SUMMARY ON FEASIBILITY STUDY Page 156 Figure 13-18: Year 4 Mine Pit, ROM Pile, Waste Pile and Backfill Surfaces Note: Figure prepared by MM&A, 2026. Beginning in Year 5 there is sufficient room for tailings and waste to be backfilled into the pit areas. Tailings will be hauled by the contractor from a bin located at the ROM pile to the pit backfill areas. Pit waste will be hauled by the contractor from the working face to the pit backfill areas and spread with dozers. Tailings from Year 1 stored in the Waste Pile East will need to be moved to pit backfill in Year 10 so the area can be mined in Year 11. The volume of material to be rehandled by the contractor in Year 10 is approximately 2,077,000 m3. A mine layout showing the Year 11 ROM pile, waste pile and backfill surface locations is provided in Figure 13-19.


TITAN PROJECT TENNESSEE, U.S. TECHNICAL REPORT SUMMARY ON FEASIBILITY STUDY Page 157 Figure 13-19: Year 11 Mine Pit, ROM Pile, Waste Pile and Backfill Surfaces Note: Figure prepared by MM&A, 2026. All final mine and backfill surfaces are completed in Year 14 (see Figure 13-20 below). TITAN PROJECT TENNESSEE, U.S. TECHNICAL REPORT SUMMARY ON FEASIBILITY STUDY Page 158 Figure 13-20: Year 14 Showing Final LOM Backfill Surfaces Note: Figure prepared by MM&A, 2026. 13.7 Labor and Equipment Mining contractors will provide all labor and material to support equipment, including all mobile mining equipment, water truck, dozer capable of maintaining the waste disposal volumes, motor grader, utility loader backhoe, fixed or portable lights, pumps, and a utility articulated haul truck (for erosion control measures, cleaning, etc.). The cost of the initial capital cost for all mobile equipment, in addition to equipment rebuilds and/or replacement throughout the life of the mine, will be incurred by the Contractor. The Contractor is responsible for selecting and sizing the equipment fleet in order to execute the mine plan in the most efficient, cost-effective manner possible. Equipment consumables, repairs, maintenance, and labor costs are included in Contractor pricing to supply mine services including waste mobile conveyors, loaders for ore, loaders for waste, dozers for ore and interburden material, dozers for waste spreading & compaction, dozers for reclamation, and support equipment. TITAN PROJECT TENNESSEE, U.S. TECHNICAL REPORT SUMMARY ON FEASIBILITY STUDY Page 159 13.7.1 Equipment Mining equipment planned to be used by the contractor in the execution of the finalized mine plan consists of a combination of excavators and wheel loaders with articulated haul trucks, in addition to dozers. Table 13-1 below summarizes the expected major mining equipment to support the proposed mine plan. Support equipment will consist of mid-size excavators, agricultural loaders, track loaders, compactors, diesel pumps, custom maintenance trucks, fuel/lubrication trucks, road management tractors or graders and water trucks. Table 13-1: Required Equipment to be Provided by Contractors Make Type Model Phase 1 Phase 2 Caterpillar Hydraulic Excavator Cat 395 2 6 Caterpillar Articulated Haul Truck Cat 745 18 32 Caterpillar Dozer D8 2 4 Caterpillar Dozer D6XE 1 1 Caterpillar Articulated Truck 725 Water Truck 1 1 Caterpillar Scraper Tractor & Box 1 1 Caterpillar Dozer D11T 2 5 Caterpillar Wheel Loader 982XE 8 10 Caterpillar Hydraulic Excavator Cat 352 2 2 Caterpillar Compactor 825 Compactor 1 1 Kenworth Support Mechanic/Service Truck 2 5 Caterpillar Grader 16G/H Motor Grader 1 1 Kenworth Support Fuel/Lube Truck 1 2 13.7.2 Labor All labor necessary to operate the mobile mining equipment and conveyor movement at the Titan project will be provided by a mining contractor. The contractor will be responsible for all overburden removal, mining and loading of raw ore material onto conveyors, and handling and placement of all waste and tailings material in the final backfill. The contractor will also handle movement and maintenance activities for the materials handling and conveyor system at the mine. IperionX labor at the mine is projected to include an engineering manager, geologists, and drafting personnel to support the necessary engineering, planning and grade control activities. An average of 25 contract mining equipment operators plus 4 IperionX employees (29 total people) are projected for Phase 1 (Years 1-4), to as many as 84 contract mining equipment operators plus 6 IperionX employees (90 total people) for Phase 2 (Years 5-14). 13.8 Internal Roads MM&A completed design of internal roads capable of handling ore conveyors, waste conveyors, maintenance access roads, as well as the associated erosion control structures. Mine roads will provide access to the various pits and waste disposal areas and provide connections to off-site transportation routes (Figure 13-22). Roadways were designed to be 25 m (82 feet) wide to accommodate two-way traffic, including runoff ditches and safety berms where required by MSHA (Figure 13-21). TITAN PROJECT TENNESSEE, U.S. TECHNICAL REPORT SUMMARY ON FEASIBILITY STUDY Page 160 Figure 13-21: Typical Roadway Design Note: Figure prepared by MM&A, 2026. Figure 13-22: Internal Haulage Road Network Note: Figure prepared by MM&A, 2026.


TITAN PROJECT TENNESSEE, U.S. TECHNICAL REPORT SUMMARY ON FEASIBILITY STUDY Page 161 13.9 Production Rates Production scheduling was based on providing 400 tph rougher feed, roughly 3.5 Mt per year of ROM ore to the WCP during Phase 1 (Years 1-4) and 1,200 tph rougher feed, roughly 10.0 Mt per year of ROM ore during Phase 2 (Years 5-14). The following parameters were used for production scheduling: > concentrator ROM feed of approximately 3.5 Mt to 10.0 Mt ROM ore per year > Proven and Probable mineral reserves only for all years of operations > target output of 3.2% THM over the LOM > minor amounts of sub-economic material that report in the design shells add planned dilution to the projected ROM material Production scheduling was performed using K-MINE’s scheduling module software over a 14-year mine life and is shown in Figure 13-23 and Table 13-2. Figure 13-25 through Figure 13-38 shows the mining excavation area, pit backfill surface, ROM pile location and tailings disposal area by year for the entire 14- year mine life. Figure 13-23: Titan Mine LOM Production Timing Map Note: Figure prepared by MM&A, 2026. Outer boundaries of the pits denote the designed finalized outline of the mine. TITAN PROJECT TENNESSEE, U.S. TECHNICAL REPORT SUMMARY ON FEASIBILITY STUDY Page 162 Results of the detailed mine schedule for the Titan project yielded 117 Mt of ROM ore with 3.2% THM over the 14-year mine life (see Figure 13-24). Production scheduling was based on providing 400 tph rougher feed, roughly 3.5 Mt per year of ROM ore to the WCP during Phase 1 (Years 1-4) and 1,200 tph rougher feed, roughly 10.0 Mt per year of ROM ore during Phase 2 (Years 5-14) and includes Proven and Probable Mineral Reserves only for all years of operations. The Mineral Reserve estimate and production target is approximately 117 million ROM tonnes over the 14-year mine period at a THM of 3.2 percent. Approximately 93.3 million tonnes or 80% of the Mineral Reserves and production target estimates are Proven, while 23.7 million tonnes or 20% of the Mineral Reserves and production target estimates are Probable. All Mineral Reserves were converted from Measured and Indicated Mineral Resources. Inferred Mineral Resources were treated as waste. Figure 13-24: Annual Ore Production Tonnes and THM% The anticipated schedule is to run 24 hours per day 7 days per week (8,760 hours/year). The resulting Titan project production forecast is summarized in Table 13-2. TITAN PROJECT TENNESSEE, U.S. TECHNICAL REPORT SUMMARY ON FEASIBILITY STUDY Page 163 Table 13-2: LOM Production Schedule Tonnage Breakout Volume Breakout Ore Breakout Period Location Total Weight (Mt) Total Ore Weight (Mt) Total Waste Weight (Mt) Stripping Ratio by Weight Total Volume (Millon m3) Total Ore Volume (Millon m3) Total Waste Volume (Millon m3) Tailings Volume from Mineral (Millon m3) UM Proven & Probable (Mt) LM Proven & Probable (Mt) Total Proven & Probable Ore Mineral (Mt) Year01 Southeast 6.25 3.43 2.82 0.82 3.92 2.19 1.74 2.08 0.27 3.16 3.43 Year02 Southeast 6.26 3.37 2.89 0.86 3.91 2.15 1.77 2.06 1.51 1.86 3.37 Year03 Southeast 5.48 3.42 2.06 0.60 3.44 2.18 1.26 2.11 2.13 1.29 3.42 Year04 Southeast 8.31 3.40 4.91 1.45 5.23 2.16 3.07 2.08 0.90 2.49 3.40 Year05 Southeast 25.31 10.28 15.02 1.46 15.97 6.55 9.42 6.34 2.51 7.77 10.28 Year06 Southwest 20.02 10.11 9.91 0.98 12.61 6.44 6.17 6.23 5.44 4.67 10.11 Year07 Southwest 19.08 10.02 9.06 0.90 12.04 6.38 5.65 6.17 4.98 5.04 10.02 Year08 Southwest 21.09 10.16 10.93 1.08 13.31 6.47 6.83 6.28 3.96 6.21 10.16 Year09 Central 18.84 10.25 8.60 0.84 11.90 6.53 5.37 6.36 1.78 8.47 10.25 Year10 Central 18.27 10.39 7.88 0.76 11.54 6.62 4.93 6.43 0.98 9.41 10.39 Year11 Central 17.92 10.01 7.91 0.79 11.21 6.37 4.84 6.17 0.69 9.31 10.01 Year12 East 15.07 10.49 4.58 0.44 9.45 6.68 2.77 6.50 0.48 10.01 10.49 Year13 Northeast 17.18 11.62 5.56 0.48 10.76 7.40 3.36 7.14 0.39 11.23 11.62 Year14 Northeast 13.52 10.09 3.44 0.34 8.50 6.42 2.08 6.21 0.95 9.14 10.09 Totals: 212.60 117.03 95.58 0.84 133.79 74.54 59.25 72.18 26.98 90.05 117.03 Note: UM = Upper McNairy LM = Lower McNairy TITAN PROJECT TENNESSEE, U.S. TECHNICAL REPORT SUMMARY ON FEASIBILITY STUDY Page 164 Figure 13-25: Year 01 Mine Plan Surfaces Note: Figure prepared by MM&A, 2026.


TITAN PROJECT TENNESSEE, U.S. TECHNICAL REPORT SUMMARY ON FEASIBILITY STUDY Page 165 Figure 13-26: Year 02 Mine Plan Surfaces Note: Figure prepared by MM&A, 2026. TITAN PROJECT TENNESSEE, U.S. TECHNICAL REPORT SUMMARY ON FEASIBILITY STUDY Page 166 Figure 13-27: Year 03 Mine Plan Surfaces Note: Figure prepared by MM&A, 2026. TITAN PROJECT TENNESSEE, U.S. TECHNICAL REPORT SUMMARY ON FEASIBILITY STUDY Page 167 Figure 13-28: Year 04 Mine Plan Surfaces Note: Figure prepared by MM&A, 2026. TITAN PROJECT TENNESSEE, U.S. TECHNICAL REPORT SUMMARY ON FEASIBILITY STUDY Page 168 Figure 13-29: Year 05 Mine Plan Surfaces Note: Figure prepared by MM&A, 2026.


TITAN PROJECT TENNESSEE, U.S. TECHNICAL REPORT SUMMARY ON FEASIBILITY STUDY Page 169 Figure 13-30: Year 06 Mine Plan Surfaces Note: Figure prepared by MM&A, 2026. TITAN PROJECT TENNESSEE, U.S. TECHNICAL REPORT SUMMARY ON FEASIBILITY STUDY Page 170 Figure 13-31: Year 07 Mine Plan Surfaces Note: Figure prepared by MM&A, 2026. TITAN PROJECT TENNESSEE, U.S. TECHNICAL REPORT SUMMARY ON FEASIBILITY STUDY Page 171 Figure 13-32: Year 08 Mine Plan Surfaces Note: Figure prepared by MM&A, 2026. TITAN PROJECT TENNESSEE, U.S. TECHNICAL REPORT SUMMARY ON FEASIBILITY STUDY Page 172 Figure 13-33: Year 09 Mine Plan Surfaces Note: Figure prepared by MM&A, 2026.


TITAN PROJECT TENNESSEE, U.S. TECHNICAL REPORT SUMMARY ON FEASIBILITY STUDY Page 173 Figure 13-34: Year 10 Mine Plan Surfaces Note: Figure prepared by MM&A, 2026. TITAN PROJECT TENNESSEE, U.S. TECHNICAL REPORT SUMMARY ON FEASIBILITY STUDY Page 174 Figure 13-35: Year 11 Mine Plan Surfaces Note: Figure prepared by MM&A, 2026. TITAN PROJECT TENNESSEE, U.S. TECHNICAL REPORT SUMMARY ON FEASIBILITY STUDY Page 175 Figure 13-36: Year 12 Mine Plan Surfaces Note: Figure prepared by MM&A, 2026. TITAN PROJECT TENNESSEE, U.S. TECHNICAL REPORT SUMMARY ON FEASIBILITY STUDY Page 176 Figure 13-37: Year 13 Mine Plan Surfaces Note: Figure prepared by MM&A, 2026.


TITAN PROJECT TENNESSEE, U.S. TECHNICAL REPORT SUMMARY ON FEASIBILITY STUDY Page 177 Figure 13-38: Year 14 Mine Plan Surfaces Note: Figure prepared by MM&A, 2026. TITAN PROJECT TENNESSEE, U.S. TECHNICAL REPORT SUMMARY ON FEASIBILITY STUDY Page 178 Due to the geometry of the mining pits, small amounts of economic material may have been excluded from the mine plan tonnages, while small amounts of sub-economic/low-grade material may have been included. This provides an opportunity during mining operations under the supervision of grade control geologists to improve recovery and grade of the production. An example of the interburden (low-grade) waste zones within the orebody is shown below. Note that only large areas of interburden (approximately 6-ha or 15-acre areas, approximately 9 m or 30 feet thick) will be removed and placed in the same waste disposal manner as the WCP tailings. Smaller areas of interburden will be mined and processed through the WCP. Figure 13-39: Example of Interburden Areas Note: Figure prepared by MM&A, 2026. TITAN PROJECT TENNESSEE, U.S. TECHNICAL REPORT SUMMARY ON FEASIBILITY STUDY Page 179 14 Processing and Recovery Methods Based on earlier flowsheet development testwork (see Section 10), MT worked closely with IperionX and their metallurgical consultant (McKeon Mining LLC) to develop a final process flowsheet and associated design criteria for the FS processing plant design. The proposed process and recovery methods outlined in the sections below were selected based on well- established and conventional approaches to processing mineral sands, including recovery of heavy mineral content using wet gravity separation equipment (such as spiral separators and up-current classifiers) followed by dry separation of titanium (ilmenite and rutile) and zircon minerals using electrostatic and magnetic separation equipment. With the increased focus on recovery of rare earth mineral content from mineral sand deposits, the use of flotation to extract these minerals (prior to dry mineral separation), and wet shaking tables to upgrade them, has become a more conventional approach and was selected for this flowsheet. 14.1 High-level Process Design Decisions 14.1.1 Design Decisions At the commencement of the FS, some key decisions were made by IperionX, which impacted on the FS high-level process and plant design criteria, and which were considered in terms of flowsheet development. These decisions included: > Design should be based on the REP being co-located with the MSP in the Benton Industrial Park area, rather than with the WCP in the current mine permit area, which impacted plant design, particularly with respect to the transfer of products and tailings between the WCP and REP. > The concentrate upgrade plant (CUP) should be incorporated into the backend of the WCP circuit, rather than the backend of the REP circuit (as in the metallurgical testwork), and consist of a conventional UCC and overflow spirals circuit, reducing the amount of HMC to be screened, dewatered and transported to the REP and reducing the complexity of the REP/MSP circuit. > The design should be based on processing of a single WCP HMC product through the REP and MSP, rather than processing coarse HMC through the MSP only and fine HMC through the REP and MSP separately (as per the metallurgical testwork program). Additional decisions were made by IperionX during the study regarding the proposed throughputs for the initial plant, and the subsequent plant expansion, with these decisions impacting flowsheet development: > Generally, the initial plant throughput will be based on a WCP rougher spirals feed of nominally 400 tph solids, with the expansion plant throughput being based on 800 tph solids to achieve a total nominal rate of 1,200 tph solids. TITAN PROJECT TENNESSEE, U.S. TECHNICAL REPORT SUMMARY ON FEASIBILITY STUDY Page 180 > However, the initial REP is to be designed to process HMC from the WCP at a rate equivalent to that produced from the full WCP operating at 1,200 tph solids, with operating hours reduced during the initial plant operation, resulting in additional decoupling stockpiles and reclaim systems being required in the REP and MSP flowsheet/plant design. > Design throughput to the initial MSP will be based on processing HMC at a rate equivalent to that produced in the WCP operating at a rougher spirals feed rate of nominally 400 tph solids and processing ROM feed material at a grade of 3.8% HM. The expansion MSP will have a design throughput based on processing HMC at a rate equivalent to the difference between that produced in the WCP operating at a rougher spirals feed rate of nominally 1,200 tph solids and processing ROM feed material at a grade of 3.4% HM, and the rate processed through the initial MSP. > Two trade-off studies were also conducted on tailings dewatering and zircon product. 14.1.2 Tails Dewatering Trade-off Study A key environmental and operational requirement is the restoration of the land to its original profile post- mining. This necessitates a tailings deposition strategy that ensures high ground stability, which is only achievable through low-moisture tailings. It was identified that the coarse sand tailings and slimes tailings streams are separated through the desliming processes in the feed preparation plant (FPP), which presented an opportunity to treat each stream independently. To meet the stability requirements for land restoration, the recommended moisture content for the combined slimes and sand tailings discharge was set at ≤16% (±2%) with a not to exceed moisture specified at 20% w/w. Achieving this low moisture level is critical for enabling direct profiling of the land without the need for extensive post-deposition handling. However, technologies capable of reaching this target are significantly more expensive and complex than traditional tailings depositions methods, prompting consideration of alternative approaches. Evaluation of the technology options concluded that the recommended configuration for the tailings system consists of the following equipment: > primary coarse tailings dewatering: dewatering cyclones > secondary coarse tailings dewatering: dewatering screens > primary slimes tailings dewatering: high density thickener > secondary slimes tailings dewatering: belt press The dewatered coarse and slimes tailings will discharge directly onto a conveyor system for transport to the tailings deposition area. All dewatering equipment will be centrally located at the WCP. It should be noted that no testwork program was carried out to confirm estimated performance of the various dewatering technologies, and comparisons were made based on typical estimated performance


TITAN PROJECT TENNESSEE, U.S. TECHNICAL REPORT SUMMARY ON FEASIBILITY STUDY Page 181 in similar duties with feedback from equipment suppliers. The study also recommended that a testwork campaign should be conducted in subsequent project phases to verify the equipment selections, equipment sizing and suitability of technology for the intended application. 14.1.3 Zircon Trade-off Study During the design process, a trade-off assessment of potential zircon product streams produced from the testwork was undertaken. The assessment evaluated the metallurgical performance and product quality, based on metallurgical testwork results, and the subsequent implications on equipment and processing options to upgrade zircon streams. The assessment focused on uranium and thorium concentrations in zircon products related to both processing considerations and regulatory compliance. While elevated uranium and thorium levels (approaching or exceeding 500 ppm) generally do not impede standard zircon processing or end-use applications, they carry significant regulatory implications. In North America, materials with combined uranium and thorium content above this threshold are classified as radioactive under transport regulations [49 CFR § 173.403], triggering stricter packaging, licensing, and handling requirements. As a result, even technically suitable zircon products may face marketability challenges to meet compliance thresholds. Several options were identified with varying levels of complexity, offering a balance of different costs, compliance, and marketability. The selected option offers a practical compromise between metallurgical performance and processing simplicity, while maintaining market access and minimizing project risk, whilst also offering the highest relative revenue. The subsequent outcome from this study was that the MSP primary dry circuit non-conductor stream would only be processed through a single stage of magnetic separation to produce a (non-magnetic) zircon concentrate product and a (magnetic) MSP rejects stream. 14.2 Process Flowsheet An FS design flowsheet was generated and is depicted in the block flow diagrams shown in Figure 14-1 and Figure 14-2, as well as being outlined further in the sections below. TITAN PROJECT TENNESSEE, U.S. TECHNICAL REPORT SUMMARY ON FEASIBILITY STUDY Page 182 Figure 14-1: Block Flow Diagram (FPP, TDC, WCP CUP) Note: Figure prepared by MT, 2026. TITAN PROJECT TENNESSEE, U.S. TECHNICAL REPORT SUMMARY ON FEASIBILITY STUDY Page 183 Figure 14-2: FS Process Flowsheet – Block Flow Diagram (REP & MSP) Note: Figure prepared by MT, 2026. TITAN PROJECT TENNESSEE, U.S. TECHNICAL REPORT SUMMARY ON FEASIBILITY STUDY Page 184 14.3 Process Design Criteria Detailed process design criteria were developed as part of the FS based on reference to testwork data and other available information and consultation with IperionX. Key overall design criteria regarding the ROM feed to the Titan plant are outlined below: > ROM feed grade (in-size HM = heavy mineral content with particle size between 44-600 microns) - nominal (life of mine) 3.2% - high grade for initial MSP design 3.8% - high grade for expansion MSP design 3.4% - maximum grade 4.2% (with rate reduced to match HMC production rate at 3.8% HM) - low grade 2.5% > ROM feed (in-size HM) mineralogy - 11.7% zircon - 9.8% rutile - 44.1% ilmenite - 1.6% rare earth minerals > ROM feed oversize (>600 microns) content - nominal 1.3% - maximum 2% - minimum 0.9% > ROM feed slimes (<44 microns) content - nominal 14.8% - maximum 26.9% - minimum 8.6% 14.4 Process Plant Throughput, Equipment and Design Basis The process plant has been designed to support staged throughput development, commencing with a nominal 400 tonnes per hour (tph) rougher feed rate during Phase 1 and increasing to 1,200 tph during Phase 2 through the addition of parallel processing modules. The upstream wet concentrator plant (WCP) and associated feed preparation plant (FPP) are designed to operate continuously at the nominated throughput rates, producing a heavy mineral concentrate (HMC) for downstream processing. The rare earth plant (REP) and mineral separation plant (MSP) are designed to process the full expanded HMC throughput of up to 1,200 tph from commencement of operations. During Phase 1, the REP and MSP operate at reduced utilization, supported by stockpiling and reclaim


TITAN PROJECT TENNESSEE, U.S. TECHNICAL REPORT SUMMARY ON FEASIBILITY STUDY Page 185 systems that decouple upstream and downstream operations and enable stable plant operation during staged ramp‑up. The overall process flowsheet comprises conventional mineral sands processing circuits, supported by established equipment types and configurations. The principal process facilities include the feed preparation plant (FPP), wet concentrator plant (WCP), concentrate upgrade plant (CUP), rare earth plant (REP), mineral separation plant (MSP), and tailings dewatering circuit (TDC). The FPP incorporates scrubbing, screening, and desliming equipment, including trommels, vibrating screens, and hydrocyclones, to prepare the run‑of‑mine material for downstream separation and to remove oversize and slimes fractions. The WCP comprises multi‑stage wet gravity separation circuits utilizing spiral concentrators arranged in rougher, scavenger, cleaner, and recleaner stages to produce a heavy mineral concentrate (HMC). Spiral circuits are configured in modular banks, allowing duplication for the expansion from 400 tph to 1,200 tph throughput. The CUP includes classification, additional spiral separation, and dewatering equipment such as up‑current classifiers, screens, and dewatering cyclones to upgrade and condition the HMC prior to downstream processing. The REP incorporates attritioning tanks, flotation cells, and gravity separation equipment, including wet shaking tables, to recover a heavy rare earth concentrate (HREC). The REP is designed for a nominal throughput capacity aligned with the full expanded HMC production rate (equivalent to 1,200 tph WCP feed basis), providing sufficient capacity to accommodate peak production rates and operational variability. The MSP utilizes conventional dry processing equipment, including feed dryers, electrostatic separators, and magnetic separation circuits, to produce final ilmenite, rutile, and zircon products. The MSP is configured in staged processing lines corresponding to Phase 1 and Phase 2 throughput, with overall installed capacity aligned to the full 1,200 tph upstream plant throughput. The TDC includes thickeners, belt filter presses, dewatering cyclones, and screens to achieve a target tailings moisture content suitable for transport and in‑pit backfilling. Equipment selection across all process areas is based on proven mineral sands technologies, with capacities, duty points, and configurations aligned to the design throughput and supported by metallurgical testwork, process modelling, and industry operating experience. The use of modular equipment configurations enables staged expansion, reduces construction risk, and maintains consistency in equipment types across development phases. TITAN PROJECT TENNESSEE, U.S. TECHNICAL REPORT SUMMARY ON FEASIBILITY STUDY Page 186 Key equipment has been sized and selected based on the defined process duty, including slurry handling rates, solids loading, and separation efficiency requirements, with capacities aligned to both nominal and peak throughput conditions for each process area. 14.5 Process Modelling ROM feed grades were estimated based on the latest ROM (in-size) HM and mineralogy data provided by IperionX and relevant ratios from metallurgical testwork were used to estimate these feed grades in terms of cerium (IV) oxide (CeO2), titanium dioxide (TiO2) and zirconium dioxide (ZrO2) content. The FS flowsheet was then modelled based on these feed grades and other established process design criteria to determine mass and water balances for design, as well as estimating grades and recoveries for (in-size) HM (through the FPP, WCP, CUP and TDC), cerium dioxide (CeO2) (through the FPP, WCP, CUP and REP) and titanium dioxide (TiO2) and zirconium dioxide (ZrO2 ) (through the FPP, WCP, CUP, REP and MSP). Indicative overall performance estimates were also made for the process plant being fed with ROM material containing nominally: > 3.2% (in-size) HM (with 11.7% zircon, 9.8% rutile, 44.1% ilmenite and 1.6% rare earth minerals) > 1.3% oversize (>600 microns) > 14.8% slimes (<44 microns) These indicative overall performance estimates used the modelled grades and recoveries, as well as data estimated from metallurgical testwork for distribution of titanium dioxide (TiO2) between ilmenite/leucoxene and rutile and ratio of cerium dioxide (CeO2) to TREO, and are outlined below: > HMC (from WCP/CUP) - approximately 3% mass of ROM feed - approximately 97% THM grade - approximately 90% HM (in-size) recovery > HREC product - approximately 0.05% mass of ROM feed - approximately 25% cerium dioxide (CeO2) (approximately 61.4% TREO) grade - approximately 91.4% cerium dioxide (CeO2) recovery > Rutile product - approximately 0.25% mass of ROM feed - approximately 91.1% titanium dioxide (TiO2) (approximately 81.2% rutile) grade - approximately 64.3% rutile recovery TITAN PROJECT TENNESSEE, U.S. TECHNICAL REPORT SUMMARY ON FEASIBILITY STUDY Page 187 > Ilmenite/leucoxene product - approximately 1.2% mass of ROM feed - approximately 62.5% TiO2 (approximately 95.8% ilmenite/leucoxene) grade - approximately 80.7% ilmenite/leucoxene recovery > Zircon concentrate product - approximately 0.67% mass of ROM feed - approximately 34.4% zirconium dioxide (ZrO2) (approximately 51.1% zircon) grade - approximately 91.8% zircon recovery 14.6 Utility and Resource Requirements The operating cost estimates incorporate defined requirements for energy, water, process reagents, and personnel based on the FS design criteria and process modelling outputs. At the initial 400-tph development, the wet concentrator plant (WCP) has an average electrical demand of approximately 4.3 MVA, with a further 2.0 MVA required for the rare earth plant (REP) and mineral separation plant (MSP). At expanded throughput of 1,200 tph, total average demand increases to approximately 10.9 MVA for the WCP and 3.5 MVA for the REP and MSP, reflecting the staged development approach. Process water requirements have been defined to support steady‑state operation, with freshwater demand of approximately 32 gallons per minute (gpm) for the WCP and 92 gpm for the REP at 400 tonnes per hour (tph), increasing to approximately 97 gpm and 276 gpm respectively at 1,200 tph. Raw water make‑up is primarily associated with the WCP process water pond and scales proportionally with throughput. Process reagent consumption has been established from metallurgical testwork and process modelling, with key consumables including fatty acid collectors, sodium silicate, sodium hydroxide, sulfuric acid, starch/dextrin, and flocculants. Reagent usage is generally proportional to heavy mineral concentrate feed rate, with total consumption increasing to approximately 90 kilograms per hour (kg/h) at full 1,200- tph operation. Personnel requirements have been developed based on continuous WCP operation and partially decoupled REP/MSP operations. In Phase 1 (400 tph), the WCP operates on a four‑crew rotating shift basis comprising supervisory, control room, operator, and mobile equipment roles, resulting in approximately 20 operations personnel supported by maintenance and technical staff, for a total WCP workforce of approximately 30 personnel. The REP and MSP operate at reduced utilization during this phase, with daytime and support-based staffing including operations, laboratory, maintenance, and logistics personnel, resulting in a combined REP/MSP workforce of approximately 22 personnel, with certain functions shared across plant areas. In Phase 2 (1,200 tph), personnel requirements increase to support full plant utilization. The WCP workforce increases to approximately 42 personnel, reflecting additional operators, maintenance TITAN PROJECT TENNESSEE, U.S. TECHNICAL REPORT SUMMARY ON FEASIBILITY STUDY Page 188 coverage, and supervisory support across the expanded plant. The REP and MSP transition to full operational staffing aligned with increased throughput and continuous or extended operation, with a combined workforce of approximately 44 personnel, including operations, maintenance, laboratory, and logistics functions. These inputs form the basis of the operating cost estimate and are considered appropriate for feasibility study level assessment, with allowances made for staged expansion, operational variability, and supporting infrastructure requirements. 14.7 Process Plant The process is divided across two sites, namely the WCP site and the MSP site. The process plant layout is broken down further within each site into specific areas as follows: > WCP Site: - mining unit plant (MUP) - feed preparation plant (FPP) - wet concentrator plant (WCP) - concentrate upgrade plant (CUP) - tailing dewatering circuit (TDC) > MSP Site: - rare earth plant (REP) - mineral separation plant (MSP) Each site has been designed to first accommodate the 400 tph plant and then cater for the future expansion to 1,200 tph of rougher spiral head feed by adding the 800 tph plant. The method for expansion for each area was considered individually to provide the most flexibility during operations, whilst also considering economies of scale in construction, and minimizing the variation of required spare parts for each plant area. 14.7.1 Wet Concentrator Plant Site 14.7.1.1 Introduction The WCP and the supporting infrastructure are to be located within the permit boundary as identified on the drawing prepared by Innovative Reclamation Technologies & Engineering Co., Inc. (Irtec). The layout of the proposed WCP site is shown in Figure 14-3 within the site disturbance boundary, with the general access road entering the site from the southeast, the process water storage facility to the northeast, and the power supply connection on the south side of the site. The 400-tph plant and NPI are positioned on the southeast of the site to minimize the civil/earthworks required in the initial phase of


TITAN PROJECT TENNESSEE, U.S. TECHNICAL REPORT SUMMARY ON FEASIBILITY STUDY Page 189 plant construction. The future expansion to a 1,200-tph plant will then include construction of the 800- tph plant separate to the 400-tph plant on the west side of the site. Figure 14-3 - WCP Site Layout 3D Model Note: Figure prepared by MT, 2026. 14.7.1.2 Mining Unit Plant The mining contractor will extract ROM material from the mine area and place it on a stockpile before depositing it onto an overland conveying system to be conveyed (along the southern side of the access road from Pleasant Hill Road) to the first stage of the process plant, the MUP. The MUP will consist of a scrubber/trommel designed to scrub the ROM material to liberate any valuable minerals that may be bound in larger agglomerates and then screen the scrubbed material at 25 mm to remove any remaining genuine oversize waste. Oversize waste will discharge to a transfer conveyor and then to a combined tails placement conveyor. Undersize slurry will be pumped to the FPP. It is expected that pumping the undersize material from the scrubber/trommel will generate further attrition of -25 mm agglomerates and subsequent liberation of valuable minerals within the ROM. The design of the MUP scrubber/trommel allows for one unit sized for the 400 tph plant and a second unit twice the size of this for the future 800 tph plant expansion. Both MUP scrubber/trommel facilities TITAN PROJECT TENNESSEE, U.S. TECHNICAL REPORT SUMMARY ON FEASIBILITY STUDY Page 190 are designed to be located outside and next to the TDC buildings, such that oversize can be collected on common conveyors. Figure 14-4: Mining Unit Plants 3D Model Note: Figure prepared by MT, 2026. 14.7.1.3 Feed Preparation Plant The feed preparation plant (FPP) consists of feed screening, desliming and a surge bin to provide buffer capacity between the mining unit plant and wet concentrator plant. Vibrating feed screens remove material >2 mm to oversize from the scrubber/trommel undersize, and the feed screen undersize is then deslimed using hydrocyclones. Screen oversize will discharge to a transfer conveyor and then to a combined tails placement conveyor, while the deslimed feed material will gravitate to a Lyons Feed Control Unit (LFCU)-style surge bin ahead of the WCP. The overflows from the deslime cyclones and surge bin will gravitate to the thickener feed box and the underflow from the surge bin will be pumped to the rougher spirals in the WCP. TITAN PROJECT TENNESSEE, U.S. TECHNICAL REPORT SUMMARY ON FEASIBILITY STUDY Page 191 The design of the FPP for the 400-tph plant allows for one feed screen, deslime cyclones cluster and surge bin. The future 800-tph plant expansion will then include an additional two feed screens and deslime cyclone clusters of the same size, plus a surge bin unit with twice the capacity of the 400-tph unit. The FPP feed screens will be located within the TDC buildings, such that oversize can be collected on common conveyors Figure 14-5. Figure 14-5: FPP Feed Screens 3D Model Note: Figure prepared by MT, 2026. The FPP deslime cyclones will be located directly above the WCP surge bins and close to the thickeners, to facilitate gravitation of overflows to the thickeners and minimize pumping distance to the rougher spirals. 14.7.1.4 Wet Concentrator Plant Each stage of the spiral circuit operates on a similar separation principle, producing concentrate, middlings, and tailings streams appropriate to the stage function. TITAN PROJECT TENNESSEE, U.S. TECHNICAL REPORT SUMMARY ON FEASIBILITY STUDY Page 192 The WCP consists of a 5-stage spiral separator circuit, including rougher, mid scavenger, cleaner, recleaner and finisher stages. The rougher spirals feed pump will draw feed from the WCP surge bin and pump it to the rougher spirals via primary and secondary feed distributors. The LFCU-style WCP surge bin will enable this feed to be maintained at a constant flow and density which will optimize the separation efficiency of the rougher spirals. The 400-tph plant design includes a single rougher spirals feed pump feeding a single spiral circuit housed within one building, while the 800-tph plant design includes two rougher spirals feed pumps, each feeding a spiral circuit the same size as that in the 400-tph plant design housed in two separate buildings. Each rougher spiral stage will separate the deslimed feed material into the following four streams: > super-concentrate, for further processing in the recleaner spirals stage > concentrate, for further processing in the cleaner spirals stage > middlings, for further processing in the mid scavenger spirals stage > tailings, for further processing in the tailings dewatering circuit Each mid scavenger spiral circuit will process rougher spiral middlings and recirculated mid scavenger spiral middlings, separating this feed material into the following four streams: > super-concentrate, for further processing in the recleaner spirals stage > concentrate, for further processing in the cleaner spirals stage > middlings, for further processing in the mid scavenger spirals stage > tailings, for further processing in the tailings dewatering circuit Each cleaner spiral circuit will process rougher and mid scavenger spiral concentrate, recirculated cleaner spiral middlings, and recleaner spiral tailings, separating this feed material into the following four streams: > super-concentrate, for further processing in the recleaner spirals stage > concentrate, for further processing in the recleaner spirals stage > middlings, for further processing in the cleaner spirals stage > tailings, for further processing in the rougher spirals stage Each recleaner spiral circuit will process rougher and mid scavenger spiral super-concentrate, cleaner spiral super-concentrate and concentrate, recirculated recleaner spiral middlings and finisher and CUP UCC Over/Flow spiral tailings, separating this feed material into the following four streams:


TITAN PROJECT TENNESSEE, U.S. TECHNICAL REPORT SUMMARY ON FEASIBILITY STUDY Page 193 > super-concentrate, for further processing in the finisher spirals stage > concentrate, for further processing in the finisher spirals stage > middlings, for further processing in the recleaner spirals stage > tailings, for further processing in the cleaner spirals stage Each finisher spiral circuit will process recleaner spiral super-concentrate and concentrate and recirculated finisher spiral middlings, separating this feed material into the following three streams: > concentrate, for further processing in the CUP circuit > middlings, for further processing in the finisher spirals stage > tailings, for further processing in the recleaner spirals stage Each spiral circuit will be housed in a separate six-story building along with associated sumps, pumps, and pipework. The design allows for as much modular construction as possible and the overall buildings are designed to be able to be clad and with a pitched roof, to reduce the risk of ice build-up in cold conditions. The top floor will house secondary spiral feed distributors, with the spiral modules including product launders spanning across the next three lower levels. The next level down will house some cross launders and tops of sumps and also serves as the main floor for sampling. The bottom floor will contain almost exclusively sumps and pumps, with provision for a simple gantry crane and winch to operate over the pumps. The layout is designed so that the pumps are all on each side of the building making maintenance and installation and removal easier. Stair towers will be included at each end of the building for personnel access and egress, with only one combined stair tower between the two circuits which will make up the 800-tph plant design. Figure 14-6 shows the 400-tph WCP plant spiral building. TITAN PROJECT TENNESSEE, U.S. TECHNICAL REPORT SUMMARY ON FEASIBILITY STUDY Page 194 Figure 14-6: 400 tph WCP Spiral Building 3D Model Note: Figure prepared by MT, 2026. Pipe racks will be installed along the side of the spiral building to enable pipework to run to and from each of the process facilities. This is also where the 400-tph plant control room will be located (above the pipe rack, on the same level as the spirals) due to its central location and position relative to the spiral circuits. The current design assumes that the 400-tph control room will be used for the 800-tph plant. 14.7.1.5 Concentrate Upgrade Plant The CUP circuit will consist of up-current classification, spiral separation, and oversize screening to further upgrade the HMC from the WCP, as well as final HMC dewatering and stacking. As with the WCP, the CUP circuit for the 800-tph plant will consist of two circuits. Each UCC circuit will process finisher spiral concentrate, separating this feed material (after cyclone dewatering to control feed density) into the following two streams: > underflow, for further processing in the oversize screening stage > overflow, for further processing in the UCC O/F spirals stage Each UCC O/F spiral circuit will process UCC underflow and recirculated UCC O/F spiral middlings, separating this feed material (after cyclone dewatering to control feed density) into the following three streams: TITAN PROJECT TENNESSEE, U.S. TECHNICAL REPORT SUMMARY ON FEASIBILITY STUDY Page 195 > concentrate, for further processing in the oversize screening stage > middlings, for further processing in the UCC O/F spirals stage > tailings, for further processing in the WCP recleaner spirals stage Each oversize screening circuit will process UCC underflow and UCC O/F spirals concentrate, separating this feed material into the following three streams: > oversize (>250-micron material), for further processing in the WCP recleaner spirals stage > undersize, for further processing in the HMC dewatering and stacking circuit Each HMC dewatering and stacking circuit will consist of a dewatering cyclone and screen, transfer conveyor, and radial stacker. The screened (<250 micron) HMC will be fed to the dewatering cyclone, with overflow returned to the head of the CUP circuit and underflow gravitating to the dewatering screen. Screen undersize will be recirculated to the dewatering cyclone and oversize will be transferred to a radial stacker to be stockpiled. Each CUP circuit (Figure 14-7) will be incorporated into the same building as the associated WCP circuit to optimize laundering between these two circuits and minimize building footprint. The current 800-tph plant design assumes two HMC dewatering circuits, each the same size as that in the 400-tph plant, but with both dewatering screens discharging oversize to a common transfer conveyor and radial stacker. Figure 14-7: CUP and HMC Dewatering 3D Model Note: Figure prepared by MT, 2026. TITAN PROJECT TENNESSEE, U.S. TECHNICAL REPORT SUMMARY ON FEASIBILITY STUDY Page 196 14.7.1.6 Tailings Dewatering Circuit The tailings dewatering circuit (TDC) consists of slimes thickening via high density thickener and belt filter presses, as well as sand tails dewatering via dewatering cyclones and dewatering screen circuits. Primary dewatering of the slimes contained in the overflow streams from the FPP desliming cyclones and the WCP surge bin will be conducted using a thickener, which also serves to clarify the contained process water (to thickener overflow) for reuse in the system (via settling and process water ponds). Thickener underflow of approximately 40% w/w solids will be sent to secondary dewatering using belt presses, with filtrate and spillage from the belt filter presses returning to the thickener, and filter cake of approximately 70% w/w solids being discharged to a transfer conveyor and then to a combined tails placement conveyor. Flocculant addition to the thickener and to the belt presses will be used to aggregate fine slimes particles and enhance their settling rate and subsequent removal from the dilute slurry to thickener underflow and filter cake. Primary dewatering of the spiral circuit (sand) tailings will be conducted with dewatering cyclones, which then feed underflow of approximately 60% w/w solids to dewatering screens for secondary dewatering. Dewatering screen undersize will be recirculated to the dewatering cyclones and cyclone overflow will be returned to the thickener to remove and dewater any remnant slimes. Dewatering screen oversize of approximately 85% w/w solids will be discharged to a transfer conveyor and then to a combined tails placement conveyor. Design of the TDC for the 800-tph plant was based on having a thickener with twice the capacity and twice the number of dewatering belt presses, dewatering cyclones, and dewatering screens as those in the 400- tph plant TDC design. For each of the 400-tph and 800-tph plants, the thickeners will be located between the WCP surge bin and the process water settling pond, with flocculant storage and make up plants placed in a location close to the thickeners and readily accessible from the roadway for ease of delivery by third parties, while the rest of the TDC equipment will be housed in a cladded building, which will also contain the FPP feed screen(s).


TITAN PROJECT TENNESSEE, U.S. TECHNICAL REPORT SUMMARY ON FEASIBILITY STUDY Page 197 Figure 14-8: TDC Buildings 3D Model Note: Figure prepared by MT, 2026. 14.7.1.7 Process Water and Reagents Storage The process water storage will be located in the northeastern corner of the WCP site and was sized for the full 1,200-tph throughput. This was done in consultation with IperionX to take advantage of the local topography and site discharge constraints of the environmental permits. Overflow from the TDC thickeners will gravitate to a settlement pond to enable further settling (and periodically removal) of remnant solids, with overflow going to the process water pond for reuse in the process. A turkey’s nest design will be used for all process water pumps to increase the hydraulic efficiency of the pump suction network. These process water pumps will be located on the eastern side of the process water pond to limit the chances of the area flooding by using the topography of the site in this location. TITAN PROJECT TENNESSEE, U.S. TECHNICAL REPORT SUMMARY ON FEASIBILITY STUDY Page 198 A flocculant plant(s) will be located near the thickener(s) and consist of a silo for storing powdered flocculant, mixing and storage tanks for producing and storing primary diluted flocculant slurry, and dosing pumps to deliver the primary diluted flocculant slurry to the thickeners and belt presses, via secondary dilution points. Figure 14-9 below shows the layout / location of the settling and process water ponds and the process water pumps, as well as the flocculant plants close to the thickeners. Figure 14-9: Settling and Process Water Ponds and Process Water Pumps 3D Model Note: Figure prepared by MT, 2026. 14.7.2 Mineral Separation Plant Site 14.7.2.1 Introduction The physical location for this site will be in the Benton County Industrial Park at 650 Divider and Natchez Trace Road. TITAN PROJECT TENNESSEE, U.S. TECHNICAL REPORT SUMMARY ON FEASIBILITY STUDY Page 199 Figure 14-10: MSP Site Boundary Figure: Prepared by MM&A, 2026. The MSP site will consist of the following two major process plants: REP and MSP. The REP will be designed and constructed at full scale (sized to process HMC from the expanded 1,200- tph WCP) from the start and operate initially as required to process the HMC produced from the 400-tph WCP. The MSP will be designed in two phases (as per the WCP), but with the first phase sized to handle HMC produced from the 400-tph WCP processing high grade ROM feed, and the second phase sized to handle the additional HMC (above what the 400tph MSP can handle) produced from the combined 1,200- tph WCP. TITAN PROJECT TENNESSEE, U.S. TECHNICAL REPORT SUMMARY ON FEASIBILITY STUDY Page 200 MSP site layout considerations include: > managing the flow of material through the REP and MSP plants, including the need for final product storage and loadout > allowing space for stockpiling (decoupling) between the WCP, REP and MSP plants > allowing space for expansion of the MSP plant > designing for good operability and maintainability The layout of the MSP site is shown in Figure 14-11, with the brown background showing part of the overall site and boundary, including Divider and Natchez Trace Road on the western side. The MSP site has been placed within the irregularly-shaped overall site to minimize civil/earthworks. The NPI is shown near the western side entrance off Divider and Natchez Trace Road. The HMC (REP feed) stockpile will be located to the south of the MSP site, allowing for trucks delivering the HMC and backloading REP tailings to enter and leave the site without moving through the main process plant area. The REP and MSP plants will be located along the northern side of the MSP site, with the second phase MSP plant in the northeastern corner of the site. REP HMC (MSP feed), MSP rejects and REP tailings stockpiles, as well as associated reclaim systems, will be located to the south of the REP and MSP buildings, such that loader movements will all be in a similar location. All final REP and MSP products will be discharged/stored on the northern side of the REP and MSP buildings for loadout to trucks on a ring road around the plant. The reagents area will be located on the western side of the REP plant and serviced from the same product collection ring road.


TITAN PROJECT TENNESSEE, U.S. TECHNICAL REPORT SUMMARY ON FEASIBILITY STUDY Page 201 Figure 14-11: MSP Site Layout 3D Model Note: Figure prepared by MT, 2026. 14.7.2.2 Rare Earth Plant The REP plant will be designed and constructed at full scale (sized to process HMC from the expanded 1,200-tph WCP) from the start and consists of the following key process circuits: > feed attritioning circuit > feed desliming circuit > flotation circuit > wet shaking tables circuit > MSP rejects spiral separation circuit > HREC product dewatering circuit > HREC product packaging circuit > REP HMC dewatering circuit > REP TDC TITAN PROJECT TENNESSEE, U.S. TECHNICAL REPORT SUMMARY ON FEASIBILITY STUDY Page 202 Each of these circuits was designed as a plant module and all modules were arranged to suit process flows and located within an overall cladded building, allowing protection from the elements, limiting the possibility of contamination of the final products, and controlling potential noise from the equipment. Figure 14-12 shows the planned layout of the REP building. Figure 14-12: REP Building Layout 3D Model Note: Figure prepared by MT, 2026. The following circuits are also included in the REP plant design but located outside of the main REP building: > HMC (REP feed) stockpile and reclaim circuit > MSP rejects reclaim circuit > REP HMC stockpiling circuit > REP tails stockpiling circuit > REP process water circuit > REP reagents circuit The REP plant will be controlled from the MSP control room, with a remote Human-Machine Interface or tablets in the REP. 14.7.2.2.1 HMC (REP Feed) Stockpile and Reclaim Circuit HMC will be received at the MSP site via trucks from the WCP. A stockpile area was designed so that the delivery trucks can be either side or rear tipping, with a one-way circuit designed for the delivery trucks only and for good traffic management. It is expected that the stockpiles will be managed by an onsite TITAN PROJECT TENNESSEE, U.S. TECHNICAL REPORT SUMMARY ON FEASIBILITY STUDY Page 203 front-end loader (FEL) while also feeding the material into the REP. Runoff from the stockpile area will be collected in the REP turkey’s nest which will capture any solids for periodic return to the stockpile. The HMC (REP feed) reclaim circuit will consist of a feed hopper to be fed by FEL and a feed conveyor which will draw material from the hopper and transfer it to a slurrying chute in the feed attritioning circuit. Figure 14-13 shows the large HMC stockpile and ring road to the south and associated reclaim system feeding into the REP attritioners near the middle of the REP building. Figure 14-13:- HMC (REP Feed) Stockpile and Reclaim Circuit 3D Model Note: Figure prepared by MT, 2026. 14.7.2.2.2 Feed Attritioning and Desliming Circuit REP feed from the HMC reclaim conveyor will be discharged via a slurrying chute into the first attritioner cell. Concentrate from the MSP rejects scavenger spirals will also be pumped to the same slurrying chute. The attritioner will serve to further liberate HMC from any remnant slimes, as well as preparing the surfaces of rare earth minerals for optimum flotation performance. Optional pH modifier (acid) reagent can be added to the attritioner if required to enhance attritioner performance. Dispersant reagent will be added to the attritioner to enhance the removal of slimes from mineral surfaces. TITAN PROJECT TENNESSEE, U.S. TECHNICAL REPORT SUMMARY ON FEASIBILITY STUDY Page 204 Attritioner discharge will gravitate to a trash screen (in the feed desliming circuit) to remove any oversize material that may have entered the feed during stockpiling and/or reclaim with heavy machinery such as the FEL. The attritioner is expected to be a stand-alone vendor supplied item, with the feed slurrying chute and associated structure and access walkways to be built around it. Figure 14-14 shows the feed attritioning circuit. Figure 14-14: REP Feed Antirationing Circuit 3D Model Note: Figure prepared by MT, 2026. 14.7.2.2.3 Feed Desliming Circuit Attritioner discharge will gravitate to the feed desliming circuit via a trash screen located above the deslime cyclone feed sump. Screened material will be fed to the deslime cyclone to remove remnant slimes and/or slimes generated in attritioning ahead of flotation. Cyclone overflow will be collected in a sump and pumped to a sand trap in the REP process water circuit, while underflow will be collected in a sump and pumped to the flotation circuit. Flotation concentrate (floats) will also be dewatered (by cyclone) and washed (by UCC) in this circuit, as the overflows from both these stages will then gravitate to the same sump as the deslimed feed material. The washed floats will be collected in a sump and pumped to the wet shaking tables circuit.


TITAN PROJECT TENNESSEE, U.S. TECHNICAL REPORT SUMMARY ON FEASIBILITY STUDY Page 205 It is envisaged that this feed desliming circuit will be built as a stand-alone module. Figure 14-15: REP Feed Desliming Circuit 3D Model Note: Figure prepared by MT, 2026. 14.7.2.2.4 Flotation Circuit Deslimed feed material (and overflows from floats dewatering and washing) will be pumped to the first of two rougher flotation conditioning tanks, which will then discharge to the second conditioning tank. Various reagents will be added to the conditioning tanks in preparation for flotation of rare earth minerals, with discharge from the second conditioning tank cascading to the first of three rougher flotation cells. Tailings (sinks) from each rougher flotation cell will cascade to the next cell and then into the scavenger flotation conditioning tank, where more regents will be added as required, before discharging to the first of two scavenger flotation cells. Tailings (sinks) from each scavenger flotation cell will cascade to the next cell and then into a sump to be pumped to the REP HMC dewatering circuit. Concentrate from the rougher flotation cell launders will be collected in a sump and pumped to a dewatering cyclone and wash UCC in the feed desliming circuit, before being pumped to the wet shaking tables circuit. Concentrate from the scavenger flotation cell launders will be collected in a sump and pumped to the MSP rejects scavenger spiral concentrate sump in the wet shaking tables circuit, before being recirculated to the feed attritioner circuit. With the flotation circuit and the wet shaking table circuit located next to each other, the flotation circuit sumps will all be located under the wet shaking tables, while the wet shaking table will feed distributors and a dewatering cyclone located on the upper level of the flotation circuit. TITAN PROJECT TENNESSEE, U.S. TECHNICAL REPORT SUMMARY ON FEASIBILITY STUDY Page 206 Figure 14-16 shows the flotation circuit, which has been designed to be able to be either stick-built or to be modularized for off-site fabrication and assembly prior to delivery to site, depending on final sizing of equipment. Figure 14-16: REP Flotation Circuit 3D Model Note: Figure prepared by MT, 2026. 14.7.2.2.5 Wet Shaking Tables Circuit The wet shaking tables circuit will consist of three stages of tabling, including: > Rougher tables, processing/separating dewatered and washed flotation concentrate (floats) into: - concentrate, for further processing in the cleaner tables stage - middlings, for recirculation to the rougher tables stage - tailings, for further processing in the scavenger tables stage > Cleaner tables, processing/separating rougher table concentrate and recirculated cleaner table middlings into: - concentrate, for further processing in the HREC dewatering circuit - middlings, for recirculation to the cleaner tables stage - tailings, for recirculation to the rougher tables stage > Scavenger tables, processing/separating rougher table tailings, and recirculated scavenger table middlings (after cyclone dewatering) into: - concentrate, for recirculation to the rougher tables stage - middlings, for recirculation to the scavenger tables stage - tailings, for further processing in the REP HMC dewatering circuit (combined with scavenger flotation sinks) TITAN PROJECT TENNESSEE, U.S. TECHNICAL REPORT SUMMARY ON FEASIBILITY STUDY Page 207 The design allows for a concrete support structure for the wet shaking tables. Sumps and pumps in this circuit can be designed/supplied on skids to provide benefits of off-site assembly and testing before site installation. As the flotation circuit and the wet shaking table circuit will be located next to each other, the flotation circuit sumps will all be located under the wet shaking tables, while the wet shaking table feed distributors and dewatering cyclone will be located on the upper level of the flotation circuit. Figure 14-17 shows the wet shaking tables circuit. Figure 14-17: MSP Rejects Scavenger Spirals and REP Shaking Tables 3D Model Note: Figure prepared by MT, 2026. 14.7.2.2.6 MSP Rejects Reclaim and Spiral Separation Circuits MSP Rejects will be dewatered and stockpiled near the REP and then fed (via the MSP rejects reclaim circuit) to the MSP rejects scavenger spiral separation circuit to recover any valuable minerals that have misreported to this stream. The MSP rejects reclaim circuit will consist of a feed hopper, feed conveyor, slurrying chute, sump, and pump. The feed hopper will be fed by FEL and the feed conveyer will draw material from the hopper and transfer it to the slurrying chute. The MSP rejects slurry will then be pumped to the MSP rejects scavenger spiral separation circuit. Figure 14-18 shows the MSP rejects reclaim circuit beside the MSP rejects dewatering cyclone and stockpile. TITAN PROJECT TENNESSEE, U.S. TECHNICAL REPORT SUMMARY ON FEASIBILITY STUDY Page 208 Figure 14-18: MSP Rejects Reclaim Circuit 3D Model Note: Figure prepared by MT, 2026. The MSP rejects scavenger spiral separation circuit will consist of a single stage of spirals processing / separating MSP rejects and recirculated spiral middlings into: > concentrate, for further processing in the REP via the feed attritioning circuit > middlings, for recirculation to the spiral feed > tailings, for further processing in the REP tails dewatering and stockpiling circuit The spiral structure was designed based on a standard MT FlexSeries spiral plant (Figure 14-13), which is a system of plant design and packaging of spirals that is economical and scalable and allows for either stick-built construction or a modular construction approach. Figure 14-19 shows the MSP rejects reclaim circuit beside the MSP rejects dewatering cyclone and stockpile.


TITAN PROJECT TENNESSEE, U.S. TECHNICAL REPORT SUMMARY ON FEASIBILITY STUDY Page 209 Figure 14-19: MSP Rejects Scavenger Spiral Separation Circuit 3D Model Note: Figure prepared by MT, 2026. 14.7.2.2.7 HREC Product Dewatering and Packaging Circuits The HREC product from the REP wet shaking tables circuit will be pumped to the HREC product dewatering circuit, which will include a dewatering cone and vacuum belt filter. The dewatering cone will be used to reduce the moisture content and volume of the dilute HREC slurry ahead of the vacuum belt filter, which will further reduce the moisture level as much as possible and enable the HREC product to be washed with fresh (ex-vacuum pump seal) water (using a 2-stage counter-current wash arrangement). Filter cake will be collected in a product bin before being conveyed to the HREC product packaging circuit. Dewatering cone overflow and filtrate will be pumped to the sand trap in the REP process water circuit, TITAN PROJECT TENNESSEE, U.S. TECHNICAL REPORT SUMMARY ON FEASIBILITY STUDY Page 210 while wash and spillage from the filter and packaging areas will be pumped back to the dewatering cone feed. The plant design has the vacuum belt filter positioned at a height which will enable the filter cake to gravitate to the product bin (minimizing conveying and footprint within the REP building) and will enable a barometric leg arrangement to be used for the vacuum system. The HREC product packaging circuit design is based on a vendor supplied package, that consists of a small feed hopper above a sealed metering and drum filling system, as well as a hygiene dedusting system. Drums of HREC product will be stored inside the building before being loaded onto trucks. Figure 14-20 shows the HREC product dewatering and product packaging circuits. Figure 14-20: HREC Product Dewatering and Packaging Circuits 3D Model Note: Figure prepared by MT, 2026. 14.7.2.2.8 REP HMC Dewatering and Stockpiling Circuits REP HMC from the flotation circuit will be pumped to the REP HMC dewatering circuit, which will include a dewatering cyclone and vacuum belt filter. The dewatering cyclone will be used to reduce the moisture content and volume of the dilute REP HMC slurry ahead of the vacuum belt filter, which will further reduce the moisture level as much as possible and enable the REP HMC to be washed with fresh (ex- vacuum pump seal) water (using a 2-stage counter-current wash arrangement). Filter cake will be conveyed to the REP HMC stockpile outside the building, with runoff from the stockpile collected and pumped to the REP turkey’s nest. Dewatering cyclone overflow and filtrate will be pumped to the sand trap in the REP process water circuit, while wash and spillage from the filter area will be pumped back to the dewatering cyclone feed. TITAN PROJECT TENNESSEE, U.S. TECHNICAL REPORT SUMMARY ON FEASIBILITY STUDY Page 211 The plant design has the vacuum belt filter positioned at a height which will enable the filter cake to be conveyed and discharged to a stockpile relatively close to the building (minimizing conveyor length and footprint) and enable a barometric leg arrangement to be used for the vacuum system. Figure 14-21 shows the REP HMC dewatering and stockpiling circuits. Figure 14-21: REP HMC Dewatering and Stockpiling Circuits 3D Model Note: Figure prepared by MT, 2026. 14.7.2.2.9 REP Tails Dewatering and Stockpiling Circuits Tailings from the MSP rejects scavenger spiral separation circuit will be pumped to the REP tails dewatering circuit, which includes a dewatering cyclone and vacuum belt filter. The dewatering cyclone will be used to reduce the moisture content and volume of the dilute MSP rejects scavenger spiral tailings slurry ahead of the vacuum belt filter, which will further reduce the moisture level as much as possible. Underflow from the clarifier in the REP process water circuit will also be pumped directly to the cyclone underflow launder ahead of the vacuum belt filter. Filter cake will be conveyed to the REP tails stockpile outside the building, with runoff from the stockpile collected and pumped to the REP turkey’s nest. Dewatering cyclone overflow and filtrate will be pumped to the sand trap in the REP process water circuit, while wash and spillage from the filter area will be pumped back to the dewatering cyclone feed. The plant design has the vacuum belt filter positioned at a height which will enable the filter cake to be conveyed and discharged to a stockpile relatively close to the building (minimizing conveyor length and footprint) and enable a barometric leg arrangement to be used for the vacuum system. Figure 14-22 shows the REP tails dewatering and stockpiling circuits. TITAN PROJECT TENNESSEE, U.S. TECHNICAL REPORT SUMMARY ON FEASIBILITY STUDY Page 212 Figure 14-22: REP HMC Dewatering and Stockpiling Circuits 3D Model Note: Figure prepared by MT, 2026. 14.7.2.2.10 REP Process Water Circuit The FS process flowsheet for the REP process water circuit includes: > a sand trap to collect overflow from the feed desliming circuit and cone/cyclone overflow and filtrate from all the vacuum belt filters in the REP and to recover any misreporting heavy minerals to underflow - underflow is collected and pumped to the REP turkey’s nest, along with several other streams from floor sumps, etc. within the REP and MSP, to capture and periodically recover solids for reprocessing through the REP and return decanted water to the sand trap > a clarifier to remove fine solids particles from sand trap overflow (with flocculant addition), with underflow being pumped to the REP tails vacuum belt filter for further dewatering > a flotation process water (FPW) tank receiving clarifier overflow for reuse within the relevant stages of the REP and for discharge of excess water > a freshwater tank to service the relevant stages in the REP and to be used for wash down water and dust suppression in the REP and MSP plants


TITAN PROJECT TENNESSEE, U.S. TECHNICAL REPORT SUMMARY ON FEASIBILITY STUDY Page 213 Figure 14-23: REP Process Water Circuit 3D Model Note: Figure prepared by MT, 2026. 14.7.2.2.11 REP Reagents Circuit The FS process flowsheet for the REP reagent storage and dosing circuits includes: > Clarifier Flocculant - IBC, storage tank, and dosing pumps for receiving, storing and dispensing liquid flocculant emulsion to the REP clarifier to enhance solids settling and process water clarity > pH Modifier (Acid) - IBC, storage tank, and dosing pumps for receiving, storing and dispensing sulphuric acid (H₂SO₄) to the REP attritioner to facilitate effective surface cleaning of mineral particles and prevent agglomeration during the feed preparation process > pH Modifier (Caustic) - IBC, storage tank, and dosing pumps for receiving, storing and dispensing sodium hydroxide (NaOH) to the REP flotation conditioning tanks to control pulp chemistry by adjusting surface charge, promoting selective collector adsorption, and enhancing gangue mineral depression during flotation - part of the caustic flow is diverted into the REP starch/dextrin mixing tank (see below) > Dispersant and Secondary Depressant - IBC, storage tank and dosing pumps for receiving, storing and dispensing sodium silicate (Na₂SiO₃) to the REP attritioner as a dispersant to facilitate dispersion of fine particles and TITAN PROJECT TENNESSEE, U.S. TECHNICAL REPORT SUMMARY ON FEASIBILITY STUDY Page 214 slimes and prevent re-agglomeration or coating of mineral surfaces during the feed preparation process, and to the REP flotation conditioning tanks as a secondary depressant to facilitate dispersion of fine gangue particles and prevent their entrainment or unintended flotation, thereby improving selectivity and recovery of the target minerals during the flotation process > Primary Depressant - silo, screw feeder, blower, tanks and pumps for receiving, storing, preparing (including addition of fresh water and sodium hydroxide) and dispensing of starch/dextrin solution to the REP flotation conditioning tanks as the primary depressant to facilitate selective depression of gangue minerals, preventing their unintended flotation and enhancing the overall flotation selectivity for the target mineral - addition of sodium hydroxide during preparation facilitates alkaline activation and pH adjustment of the starch/dextrin solution, ensuring optimal depressant performance in the flotation circuit > Collector - tank and pumps for receiving, storing, preparing and dispensing of liquid fatty acid collector to the REP flotation conditioning tanks to assist in the flotation of rare earth minerals by forming a thin hydrophobic layer on the surface of these minerals > Frother - IBC, storage tank, and dosing pumps for receiving, storing and dispensing liquid chemical frother to the REP flotation conditioning tanks to assist in strengthening the surface tension of the air that is injected into the flotation cells to form a froth The REP reagents circuit will be housed in a separate building (Figure 14-24) that will be located close to the road to facilitate reagent delivery. Figure 14-24: REP Reagents Circuit 3D Model Note: Figure prepared by MT, 2026. TITAN PROJECT TENNESSEE, U.S. TECHNICAL REPORT SUMMARY ON FEASIBILITY STUDY Page 215 14.7.2.3 Mineral Separation Plant The MSP plant consists of the following key process circuits: > MSP feed and drying circuit > MSP primary dry circuit (PDC) > MSP primary non-conductor circuit (PNCC) > MSP primary conductor circuit (PCC) > MSP product storage and loadout circuit > MSP rejects dewatering and stockpiling circuit The initial stage MSP (400 tph MSP) plant was sized with the capacity to process HMC at a rate equivalent to that produced from the 400-tph WCP plant (when feeding 3.8% HM grade ROM feed material) after processing through the REP (for an appropriate run time at the full capacity rate). The second (expansion) stage MSP (800 tph MSP) plant was sized with the capacity to process HMC at a rate equivalent to that produced from the 1,200-tph WCP plant (when feeding 3.4% HM grade ROM feed material) after processing through the REP (at the full capacity), less the amount of HMC processed through the initial stage MSP. This approach was taken to cater for the higher-grade ROM material to be processed in the initial years of operation while optimizing loading to the dry magnetic and electrostatic separation equipment in both MSPs. A modular approach was taken to the design each of the (400 tph and 800 tph) MSP main buildings, incorporating the PDC, PNCC and PCC, with horizontally oriented modules containing process equipment and vertically oriented (split) modules containing bucket elevators (one central line for feeding process equipment and another line on the outside to discharge products to storage bins). These modules will be incorporated into an overall multi-level MSP building which is clad and has a hygiene dust extraction system. Process equipment will be located across two main (upper and lower) levels, allowing gravity laundering between stages where appropriate, and (vertical) bucket elevators and (horizontal) conveyors will be used to feed material through the plant and to minimize the plant footprint. This modular approach will enable each floor to be set at the same level within the 400-tph and 800-tph MSP buildings. The top floor of each MSP main building will house and provide access to the bucket elevator drive heads and feed distributors (with a monorail above for maintenance), with the next floor down containing feed launder pipework. The upper level of process equipment will house the re-heaters (and feed distributors) and the product bin feed bucket elevator drive heads and product weigh feeders, with the level below this containing product launder lines with good access for sampling. The lower level of process equipment will include HTRS, which will be fed from re-heaters on the upper level of process equipment, with the level below this again containing product launder lines with good access for sampling, as well as the rutile product screen (and conveyors in the 800-tph MSP) and pencil bins within the bucket elevator modules. TITAN PROJECT TENNESSEE, U.S. TECHNICAL REPORT SUMMARY ON FEASIBILITY STUDY Page 216 The second lowest level will house conveyors, and the ground floor level will house the bucket elevator boots, with both levels also containing product launder pipework. The 400-tph MSP will have stair access at each end and the 800-tph MSP will share one of these stair towers. The 400-tph MSP control room will be placed between the 400-tph MSP and 800-tph MSP and service both plants, as well as the REP. Figure 14-25 shows an elevation 3-D model of the 400-tph and 800-tph MSPs from the side, showing the separate modules for the process equipment and bucket elevators, while Figure 14-26 shows a plan view of the MSPs side by side. Figure 14-25: MSP Buildings – Elevation 3D Model Note: Figure prepared by MT, 2026.


TITAN PROJECT TENNESSEE, U.S. TECHNICAL REPORT SUMMARY ON FEASIBILITY STUDY Page 217 Figure 14-26: MSP Buildings – Plan View 3D Model Note: Figure prepared by MT, 2026. 14.7.2.3.1 MSP Feed and Drying Circuit Stockpiled REP HMC for each MSP plant will be reclaimed and fed to an MSP feed dryer via a reclaim feed hopper and feed conveyor. The feed dryers were designed to be operated using natural gas fuel and will use a wet scrubber for management of dust. Due to generating humid conditions, the dryers and scrubbers were located in annexes next to the main MSP buildings, which will enable the exhaust stacks to be external of the main building structures and the dry separation equipment to be isolated from potential moisture. TITAN PROJECT TENNESSEE, U.S. TECHNICAL REPORT SUMMARY ON FEASIBILITY STUDY Page 218 Figure 14-27 - MSP Feed Dryer 3D Model Note: Figure prepared by MT, 2026. 14.7.2.3.2 Primary Dry Circuit Dried HMC will discharge from the feed dryer into a feed screen feeder (which will remove any coarse trash oversize material picked up from the stockpile or dryer refractory lining) and undersize feed will be fed to the first stage of the PDC via a bucket elevator. The PDC will consists of four stages of electrostatic separation (each fed from a bucket elevator via re- heater, where required, and a distributor), including: > Primary rougher HTRS, processing / separating dried REP HMC into: - conductors, for further processing in the primary conductor cleaner HTRS - middlings, for further processing in the primary mid scavenger HTRS - non-conductors, for further processing in the primary non-conductor cleaner HTRS > Primary mid scavenger HTRS, processing / separating primary rougher HTRS middlings, primary conductor cleaner HTRS non-conductors, primary non-conductor cleaner HTRS conductors and other non-conductor streams from the PCC (after passing through a re-heater) into: - conductors, for further processing in the primary conductor cleaner HTRS - non-conductors, for further processing in the primary non-conductor cleaner HTRS > Primary conductor cleaner HTRS, processing / separating primary rougher HTRS conductors and primary mid scavenger HTRS conductors into: - conductors, for further processing in the PCC - non-conductors, for recirculation to the primary mid scavenger HTRS TITAN PROJECT TENNESSEE, U.S. TECHNICAL REPORT SUMMARY ON FEASIBILITY STUDY Page 219 > Primary non-conductor cleaner HTRS, processing / separating primary rougher HTRS non- conductors and primary mid scavenger HTRS non-conductors into: - conductors, for recirculation to the primary mid scavenger HTRS - non-conductors, for further processing in the PNCC Figure 14-28 shows the 400tph MSP (with the feed dryer section hidden for clarity) highlighting the main parts of the PDC. Figure 14-28: MSP PDC 3D Model Note: Figure prepared by MT, 2026. 14.7.2.3.3 Primary Non-Conductor Circuit The PNCC will consist of a single stage of magnetic separation (fed from a bucket elevator via a distributor), with: > Primary non-conductor RERS processing / separating primary non-conductor cleaner HTRS non- conductors into: TITAN PROJECT TENNESSEE, U.S. TECHNICAL REPORT SUMMARY ON FEASIBILITY STUDY Page 220 - magnetics, forming the MSP rejects stream which is collected in a sump, diluted and pumped to the MSP rejects dewatering and stockpiling circuit before being reprocessed in the REP MSP rejects scavenger spiral separation circuit - non-magnetics, forming the zircon concentrate product which is transferred to the MSP product storage and loadout circuit Figure 14-29 shows the 400-tph MSP (with the feed dryer section and stair tower hidden for clarity) highlighting the main parts of the PNCC. Figure 14-29: MSP PNCC 3D Model Note: Figure prepared by MT, 2026. 14.7.2.3.4 Primary Conductor Circuit The PCC will consist of three stages of magnetic separation, two stages of electrostatic separation and a stage of screening, including: > Primary conductor REDS (fed from a bucket elevator via a distributor), processing / separating primary conductor cleaner HTRS conductors into:


TITAN PROJECT TENNESSEE, U.S. TECHNICAL REPORT SUMMARY ON FEASIBILITY STUDY Page 221 - magnetics, forming part of the ilmenite/leucoxene product which is transferred to the MSP product storage and loadout circuit - non-magnetics, for further processing in the rutile rougher HTRS > Rutile rougher HTRS (fed from a bucket elevator via a re-heater and distributor), processing / separating primary conductor REDS non-magnetics into: - conductors, for further processing in the rutile rougher IRMS - non-conductors, for recirculation to the PDC (primary mid scavenger HTRS) > Rutile rougher IRMS (fed from a bucket elevator via a distributor), processing / separating Rutile rougher HTRS conductors into: - magnetics, for further processing in the rutile scavenger IRMS - non-magnetics, for further processing in the rutile cleaner HTRS > Rutile scavenger IRMS (fed from the rutile scavenger IRMS via a collector), processing / separating rutile scavenger IRMS magnetics into: - magnetics, forming part of the ilmenite/leucoxene product which is transferred to the MSP product storage and loadout circuit - non-magnetics, for further processing in the rutile cleaner HTRS > Rutile cleaner HTRS (fed from a bucket elevator via a re-heater and distributor), processing / separating rutile rougher and scavenger IRMS non-magnetics into: - conductors, for further processing on the rutile product screen - non-conductors, for recirculation to the PDC (primary mid scavenger HTRS) > Rutile product screen (fed from the rutile cleaner HTRS), processing / separating rutile cleaner HTRS conductors into: - oversize, for recirculation to the PDC (primary mid scavenger HTRS) - undersize, forming the rutile product which is transferred to the MSP product storage and loadout circuit Figure 14-30 shows the 400-tph MSP (with the feed dryer section hidden for clarity) highlighting the main parts of the PCC. TITAN PROJECT TENNESSEE, U.S. TECHNICAL REPORT SUMMARY ON FEASIBILITY STUDY Page 222 Figure 14-30: MSP PCC 3D Model Note: Figure prepared by MT, 2026. 14.7.2.3.5 MSP Product Storage and Loadout Circuit The MSP product storage and loadout circuit will consist of storage bins fed by bucket elevators for the following products: zircon concentrate, ilmenite/leucoxene, and rutile. The bucket elevators feeding each of these bins will be housed in similar (but shorter) modules to the main MSP building bucket elevators and these modules will be integrated into the main building with dust extraction (Figure 14-31 is a side view of the 400-tph MSP showing the relative location of the MSP product bucket elevators and bins). Each product bucket elevator will discharge product to the bin via a weigh feeder. Products will then be loaded out to trucks from the bins as required. TITAN PROJECT TENNESSEE, U.S. TECHNICAL REPORT SUMMARY ON FEASIBILITY STUDY Page 223 Figure 14-31: MSP Product Storage and Loadout Area 3D Model Note: Figure prepared by MT, 2026. 14.7.2.3.6 MSP Rejects Dewatering and Stockpiling Circuit The MSP rejects dewatering and stockpiling circuit will include a stacking cyclone for dewatering and stockpiling of dewatered MSP rejects. The stacking cyclone and stockpile will be located near the REP building (see Figure 14-13 and Figure 14-18) and is fed from the sump/pump in the PNCC, located in a bund next to the MSP building (see Figure 14-29). 14.7.3 Electrical Infrastructure Power supply is discussed in Section 15. 14.7.3.1 WCP Plant Area The electrical design for the WCP site was developed to FS level to define the overall power supply philosophy, major electrical infrastructure requirements, and allowance for staged expansion from the initial 400-tph plant to the ultimate 1,200-tph configuration. Electrical load estimates were developed from the mechanical equipment list, incorporating motor power requirements, allowance for variable speed drives (VSDs), lighting, auxiliary services, and non‑process infrastructure based on MT’s experience with similar facilities. Single line diagrams, general electrical arrangements, instrument lists, input/output (I/O) lists, cable schedules and supporting material takeoffs (MTOs) have been prepared to support load definition and capital cost estimating. The WCP site power supply is expected to be sourced from existing transmission infrastructure located approximately 213 meters (700 feet) south‑west of the WCP site. A high‑voltage (HV) switchyard, to be TITAN PROJECT TENNESSEE, U.S. TECHNICAL REPORT SUMMARY ON FEASIBILITY STUDY Page 224 designed and supplied by others, has been conceptually included to facilitate connection to the utility supply and distribution of power to the site. Final supply voltage, connection configuration, and redundancy arrangements will be confirmed in consultation with the utility provider during the next project phase. HV power will be distributed to step‑down transformers supplying low‑voltage switchrooms and motor control centers (MCCs). Two primary switchrooms are envisaged for the WCP site: > a switchroom servicing the FPP and WCP for the initial 400-tph installation. > a separate switchroom sized to support the future 800-tph expansion. Each switchroom will house MCCs, variable speed drives, protection systems, and distribution boards for general power and lighting. Major process drives, including pumps, conveyors, and selected process equipment, will utilize variable speed drives to improve operability, control, and energy efficiency. Motor starting philosophy, harmonic performance, power factor correction requirements, and voltage drop assessments have not been undertaken at FS level and will be completed during detailed design. The electrical infrastructure has been configured to support staged expansion. The initial 400-tph electrical installation will be designed to operate independently, with additional transformers, switchrooms, MCCs, and feeders required for the 800-tph expansion. Final expansion tie-in strategy, including outage requirements and integration with the initial electrical systems, will be defined during detailed design. Electrical design at this stage is intended to support load definition, spatial allowance, and cost estimation. Detailed studies including short-circuit analysis, protection coordination, earthing design, hazardous area classification, power quality assessment, and system redundancy evaluation will be completed during subsequent engineering phases. 14.7.3.2 Mineral Separation Plant Area Electrical design is conceptual and intended to support load definition, spatial allowance, and cost estimation. Detailed studies including short‑circuit analysis, protection coordination, earthing design, hazardous area classification, power quality assessment, and system redundancy evaluation will be completed in subsequent engineering phases. The MSP site is expected to be supplied from a local municipal electrical network at a nominal voltage of approximately 12 kV. A dedicated substation, to be designed and provided by others, is anticipated to be installed within or adjacent to the MSP site boundary. The substation will distribute power to plant‑specific transformers supplying the REP, initial 400-tph MSP, future 800-tph MSP, and non‑process infrastructure.


TITAN PROJECT TENNESSEE, U.S. TECHNICAL REPORT SUMMARY ON FEASIBILITY STUDY Page 225 Each major plant area will be served by its own transformer and dedicated switchroom to provide operational independence and assist with staged commissioning and expansion. Dedicated switchrooms are planned for: REP, initial 400-tph MSP, expansion 800-tph MSP, and NPI. Each switchroom will house MCCs, VSD panels, protection relays, and distribution boards relevant to the associated plant area. Some specialist separation equipment within the MSP, such as electrostatic and magnetic separators, is expected to be supplied with vendor‑specific power and control cabinets. These will be integrated into the overall electrical and control system during detailed design. The MSP electrical infrastructure was conceptually arranged to support staged expansion while maintaining separation between the initial and expanded plant installations. This approach limits operational disruption during expansion and allows progressive commissioning of additional capacity. Final redundancy philosophy, system reliability targets, and outage management strategies will be defined during detailed design. TITAN PROJECT TENNESSEE, U.S. TECHNICAL REPORT SUMMARY ON FEASIBILITY STUDY Page 226 15 Infrastructure MM&A prepared a finalized site plan which includes property boundaries supplied by IperionX; offset boundaries for intended use as required by TDEC; floodplains, wetlands, and streams as delineated by HDR; concentrator facilities designed by MT; tailings and waste disposal areas; and planned pit areas (Figure 15-1). Figure 15-1: Titan Project Mine Site Note: Figure prepared by MM&A, 2026. TITAN PROJECT TENNESSEE, U.S. TECHNICAL REPORT SUMMARY ON FEASIBILITY STUDY Page 227 15.1 Roads and Logistics 15.1.1 Roads General access to the Project area was discussed in Section 4.1. The proposed mine and WCP plant sites will be accessed using paved and maintained state and county roads. The MSP and REP sites will be accessed primarily from US Route 70 which is about 1.6 km (1.0 mile) from the planned sites. Direct access to the site will be using County Highway 891. The proposed mine and WCP sites are about 29 km (18 miles) apart by road from the planned MSP and REP sites (Figure 15-2). Figure 15-2: Titan FS Overall Site Layout Note: Figure prepared by MM&A, 2026. 15.1.2 Rail CSX operates a railyard approximately 11 km (7 miles) from the MSP/REP site. Transportation of material between the MSP/REP and the railyard will be conducted by over-the-road trucking. Similarly, the movement of product from the WCP to the MSP/REP will be conducted through over-the-road trucking. TITAN PROJECT TENNESSEE, U.S. TECHNICAL REPORT SUMMARY ON FEASIBILITY STUDY Page 228 15.2 ROM and Tailings Transportation Transportation of ROM and tailings materials between the mine pits and the processing plants will be conducted by conveyor belts. 15.2.1 Production Conveyor System The main production belt will serve as a dual-purpose belt with ROM material traveling to the plant on the top belt and processed/filtered tailings returning to the mine on the bottom belt. This system will require the belt to flip over after passing around the tail roller so that the carrying surface of the top belt becomes the carrying surface of the bottom belt. Special belt structures will be necessary to achieve this flip over at both the plant and mine ends of the belt. Due to the constraints of the current mine permit, the corridor that the main belt will follow has a bend in it that will require the belt to be broken into two segments. The segments may require a transfer tower at the apex of the bend to connect the belts. This transfer tower will likely be necessary in later years depending on belt configuration. The topography at the site is relatively flat, therefore the belt does not need to traverse any significant slopes. This is reflected in the power requirements for the main belt. Figure 15-3 is a plan view of the conceptual belt corridor illustrating the bend requiring the transfer tower. The overall estimated length of the main belt will be approximately 1,620 m (5,315 feet) as initially designed. Figure 15-3: Overview of Belt Corridor Note: Figure prepared by MT, 2026. Up through Year 9, the main belt initially purchased will be able to reach the ROM stockpile locations. During several mining years, the belt will need to be shortened as the stockpiles will be in close proximity to the plant. Once mine production passes Year 9, the distance from the pits to the plant will surpass the total length of belt materials initially purchased. Due to this, additional belt and appropriate infrastructure will need to be purchased and installed starting in Year 10 and continuing through Year 13. Table 15-1 summarizes the amount of additional length that needs to be acquired and the year it needs to be available.


TITAN PROJECT TENNESSEE, U.S. TECHNICAL REPORT SUMMARY ON FEASIBILITY STUDY Page 229 Table 15-1: Additional Main Belt Lengths Necessary and Associated Years Year Distance (m) 10 277 12 546 13 1120 Figure 15-4 depicts the proposed yearly positions of the ROM stockpiles to accommodate the finalized 14-year mine plan. Figure 15-4: Yearly ROM Stockpile Locations Note: Figure prepared by MM&A, 2026. To accommodate the production increase planned for Year 5, the belt will be constructed initially to handle the higher full production rate. This is to avoid additional capital and potential downtime once the mine is ready to begin full production. 15.2.2 Tailings Belt System In the initial four years of mine production, additional space will be needed for tailings material storage. This period is necessary until the pits have progressed enough to allow room for placement back into the pits for all material. An additional belt will need to be installed to carry processed materials returned from the plant into designated, temporary surface storage areas. The storage area used during Year 1 will be northeast of the initial pits and the area for Years 2 through 4 will be to the west of the processing plant. To reach the first storage area, the tailings belt will need to be approximately 2,000 m (6,562 feet) long. Following Year 1, the belt will be moved to the west of the plant to start depositing material in the second area. The belt length for the second configuration will be approximately 1,500 m (4,921 feet). TITAN PROJECT TENNESSEE, U.S. TECHNICAL REPORT SUMMARY ON FEASIBILITY STUDY Page 230 15.2.3 Plant Site Belt Systems Feed to each of the 400-tph and 800-tph modules in the processing plant will be handled by a trommel that will slurry the ROM material. Each of these trommels will be fed by its own feeder belt. These feeder belts will draw from a 600-t surge bin designed to handle 30 minutes of belt residence time. This is designed to prevent material overflows in the case of shutdowns in the plant. The bin will also meter the feed appropriately to the two plant modules which each need to be fed at different tonnes per hour rates. A short transfer belt is to be installed to take the ROM material from the main belt and place it into the surge bin. This belt is designed to handle the full 1,200 tph from initial construction in anticipation of full production after Year 4. Coming from the bottom of the surge bin will be two transfer belts sized for feeding the 400-tph plant module and the 800-tph plant module. The 400-tph module belt will be approximately 60 m (197 feet) in length and the 800-tph module belt will be approximately 130 m (427 feet) in length depending on final plant design. A truck belt crossover will be needed for the 800-tph module belt as well as the main production belt to accommodate truck traffic entering and exiting the plant to pick up processed material. These trucks will haul this material to the MSP/REP for further processing. Feed rates to the trommels of each plant will be controlled by weigh bridges. Each of the WCP units will have a set of two tailings belts that will transfer the dewatered tailings materials back to the bottom main belt to be sent to the pits for reclamation. One of the belts will handle the sandy tailings materials while the second will handle the slimes that were separated in process. Each of the individual belts will be approximately 50 to 60 m (164 to 197 feet) in length depending on final configuration. 15.2.4 Additional Materials Handling Equipment Before being loaded onto the main belts, ROM material will need to be screened to remove any oversized material or residual vegetation remnants. At the belt loading point, a feed hopper with grizzly bars will be installed along with the appropriate skirting, guards, and liners. Screen aperture sizes will be designed to accommodate final feed size requirements based on plant design. To assist with the handling of the tailings material at the mine pits, two 500-t bins will be installed to receive material from the tailings belt. These bins are designed to be elevated to allow mobile equipment to drive beneath the bin for loading before returning to the pits for deposition of the material. These bins will also act as surge bins to accommodate the belt running down in the event of shutdowns. The bins are designed to be on skids to allow ease of movement, as the belts will be moved to accommodate the changing pits and stockpile areas. TITAN PROJECT TENNESSEE, U.S. TECHNICAL REPORT SUMMARY ON FEASIBILITY STUDY Page 231 15.3 Water Handling Systems 15.3.1.1 Dewatering System Slope stability analysis conducted by MM&A has shown that groundwater levels are not expected to cause significant slope stability issues as a result of the designed pit slope angles. Water entering the pits via seepage from the pit walls will make its way through the sandy material (overburden and Upper McNairy unit) and down the faces of the lower, more clayey levels (Lower McNairy unit). This water will then be collected in sumps on the pit floor and pumped out of the pit via large mobile diesel pumps. Based on the water flows estimated by HDR, the maximum inflow to be expected in the pits will be approximately 2,400 gallons per minute (gpm). The pumps selected to dewater the pits have sufficient capacity to handle inflows to the pits. A spare pump will be purchased in the event the main pump is down for maintenance or if there are storm events that overload the main pump. The main pit dewatering pump will move the collected water from the pit into a constructed combined settling/clarifying pond. This pond is designed to allow the solids to settle out of the pit water for use in the processing plant. The ponds will be constructed in the overburden material when possible or if they have to be constructed on reclaimed material, liners may be utilized as necessary to prevent unintentional leakage. 15.3.1.2 Plant Water Supply System From the settling/clarifying pond, the water will be sent to the plant via a 1,000-gpm pump combined with six-inch piping. An additional 1,000-gpm pump will be installed inline to act as a booster pump to help push the water to the plant in the years where the distances from the plant to the pit grow longer. The pits may not always be able to provide the required water for the WCP. To supplement the water from the pits, a permitted withdrawal point will be required to allow the mine to pull water from a nearby location on Sandy Creek. It is assumed that this withdrawal point will have a 1,000-gpm pump installed to ensure it has enough capacity to meet demands. A 2,621-m (8,599 feet) long of water supply pipe will be needed to reach the plant. This includes the pipe running between the plant and the settling ponds and the pipe from the initial proposed withdrawal point. The estimated dewatering pipe length required will increase to approximately 3,353 m (11,000 feet) as mining progresses and moves further away from the plant site. 15.4 Civil Design The design of the civil layout for each site required multiple considerations. While the final civil design was not in MT’s scope, there is a significant interface between different contract battery limits and care must be taken to ensure the final design considers the overall site restrictions and requirements. For both the WCP and MSP sites, the civil design and plant layout accounts for the final 1,200-tph plant, incorporating the initial 400-tph plants and the 800-tph expansion plants into one layout. TITAN PROJECT TENNESSEE, U.S. TECHNICAL REPORT SUMMARY ON FEASIBILITY STUDY Page 232 15.4.1 Wet Concentrator Plant (WCP) The civil design was conducted by Primero with inputs from MT. For the WCP site, it was important that all the infrastructure was located within the site permit boundary. Careful consideration was given to buffer zones between the infrastructure and the permit boundary to ensure compliance, but also to ensure construction activities also remain within the permit constraints. The local topography was exploited to minimize cut/fill requirements; however, the final cut/fill design is to be confirmed by the civil designer in detailed design. A one-way fall was adopted by the civil designer, with stormwater to be directed to the approved discharge point in the depression located on the eastern boundary of the site. Geotechnical investigations were conducted by S&ME to confirm the suitability of the ground conditions for the potential LFCU and thickener locations and spiral building locations, and results are published in their report S&ME Project No. 22350271B. The geotechnical boring locations for the WCP are shown in Figure 15-5 below.


TITAN PROJECT TENNESSEE, U.S. TECHNICAL REPORT SUMMARY ON FEASIBILITY STUDY Page 233 Figure 15-5: WCP Geotech Bore Locations TITAN PROJECT TENNESSEE, U.S. TECHNICAL REPORT SUMMARY ON FEASIBILITY STUDY Page 234 15.4.2 Mineral Separation Plant The MSP site layout had its own restrictions. The plant will be located in what is designated as an industrial park, however there are local residences and a memorial site near the location. With this in mind, the major infrastructure has been positioned away from the existing residential buildings as practicable within the site boundary. Operability was also considered for the civil design of the MSP site. HMC will be trucked from the WCP to the MSP, and the final products will be trucked out from the MSP site to market. There are also reagents and other consumables to be delivered to site on a regular basis, as well as maintenance vehicles that require access separate to that of general employee transport. The current topography of the site indicates that the site is relatively flat, with a sudden fall to the eastern boundary. The final finished surface level will be decided in the detailed design phase, however the current design considers an overall one-way fall from the West to the East to allow for stormwater collection and runoff. Final civil design with be completed during the detailed design phase of the Project. 15.5 Power Supply The existing utilities available to the Project include electric power, natural gas, and water. Electricity is supplied via 161-kV transmission lines near the Project area. The power supply assumes 100% renewable power supply from TVA. The grid connection to TVA will supply the MSP and REP site substation with redundant 12.47-kV distribution lines. The existing electrical distribution system to the WCP will undergo a system upgrade to supply electricity to the WCP substation with redundant 12.47-kV distribution lines. The associated cost for this upgrade has been incorporated in the estimated capital expenditure. This will offer a stable power supply to the plant sites, and on-site power generation will provide backup power. There will be a 12.47-kV switchgear that distributes power radially at each site substation to 12.47/0.480 kV stepdown transformers and in turn 480 V e-houses with 480V MCCs in the various plant areas. The primary distribution voltage will be 12.47 kV, three phase, 60 Hz. The secondary distribution voltage will be 480 V, three phase, 60 Hz for all loads. Lighting and small power will be stepped down to 120/208 V, single phase, 60 Hz. 15.6 Natural Gas Natural gas will be provided by West Tennessee Public Utility District to the site tie-in point through the NPI to the MSP. 15.7 Water Supply 15.7.1 Raw Water Supply Sources of raw water will be needed for mining and ROM material processing. Water in the mining process will primarily be used for dust suppression. No public water supplies exist in the Project area so the raw water will need to be sourced from in situ sources. The Project area sits between several TITAN PROJECT TENNESSEE, U.S. TECHNICAL REPORT SUMMARY ON FEASIBILITY STUDY Page 235 floodplains associated with large marshy areas and rivers. This combined with the sandy soil that makes up the surrounding area, allows for the groundwater table to be close to the surface, and creates an aquifer with sufficient quantity to support the operation for the bulk of the processing needs. Raw water supply for the WCP will primarily come from a permitted withdrawal point along Big Sand River with a secondary source being groundwater seeping into the pit from the working face and the side walls of the mine pits, with a lesser quantity from the tailings being placed during reclamation. Water will be collected into sumps in the bottom of the pits and then pumped with a portable diesel pump into collection ponds adjacent to the pits for settling and clarifying before being pumped to the WCP for use in processing the ROM material, as necessary. Figure 15-6 shows the location of the proposed water withdrawal point along Big Sandy River. The permit application will be for a max draw rate that exceeds the maximum expected amount of make-up water required. This will ensure that the operation of the processing facility will be able to operate at full capacity throughout the 14-year plan. At the MSP site, water will be supplied by the City of Camden. Figure 15-6: Proposed Freshwater Withdrawal Location Note: Figure prepared by MM&A, 2026. The WCP process plant distribution network will supply water to the NPI facilities whereas at the MSP site water will be supplied by the City of Camden to the NPI facilities. 15.7.2 Potable Water Supply There is no permanent infrastructure within the Project area to supply potable water for the WCP site. A potable water well will be drilled adjacent to the personnel facilities at the WCP. Current pumping tests indicate that a single well should be able to supply all of the potable water needs of the site when used TITAN PROJECT TENNESSEE, U.S. TECHNICAL REPORT SUMMARY ON FEASIBILITY STUDY Page 236 in conjunction with a storage tank. From the well, a 21,000-gallon storage tank will distribute the potable water to the necessary fixtures and supply points. At the MSP site, water will be supplied by the City of Camden. 15.8 Communications Systems Communications at the project site will have to be facilitated by cellular and/or satellite provided data communication equipment, as permanent phone and/or data infrastructure is not available. Communication around the mine pits and processing plant will be accomplished through radio devices that are either vehicle-mounted or handheld. 15.9 Non-Process Infrastructure NPI buildings will be located at the WCP and MSP facilities for all operations and maintenance personnel either as vendor supplied modular buildings or engineered structures. NPI at the WCP includes control room, warehouse and ablutions building. NPI at the MSP includes control room, administration building, warehouse and laboratory and sample preparation building. The design developed in this FS is based on established design precedents from facilities with similar functions and requirements and is consistent with the approved Basis of Design for this Project. This approach ensures that the NPI at both the WCP and MSP reflect proven layouts and operational needs while maintaining alignment with regulatory, safety, and project standards. Key elements are summarized in Table 15-2 Table 15-2: Non-Process Infrastructure Item Note Control room Identical for WCP and MSP. Will include 2 operators’ rooms and a breakroom. Sized at 7.6 x 4.6 m and will be 3.1 m high. Warehouse Identical for WCP and MSP. Will include 3 open offices space, 1 caged storage area, a space for 50 pallet racks, 2 roller doors, 1 restroom, a fenced outdoor laydown yard adjacent to the warehouse and outdoor veranda. WCP warehouse sized at 24.4 x 15.2 m; 6.1 m high with 10- degree slope. MSP warehouse sized at 21 x 17.7 m, 6.1 m high with 10-degree slope Ablutions WCP site. Will include 5 men’s toilets 4 men’s showers block with changing area, bench, and lockers, 3 female toilets, 2 female showers block with changing area and lockers. Sized at 12.2 x 7.3 m; 2.7 m high with 5-degree slope. Administration MSP site. Will include includes 4 open office spaces, 1 janitor closet, 4 restrooms, 1 kitchen and dining room, 1 telecommunications room, 15 open offices, 1 reception, 1 conference room and an outdoor veranda. Sized at 30.5 x 15.2 m; 2.7 m high with 10-degree slope. Laboratory and sample preparation MSP site. Will include 3 open office spaces, 1 utility room, 1 sample reception and storage room, 1 chemical storage room, 1 chemistry laboratory, 1 laboratory storage room, 1 laundry room, 1 server room and 1 electrical room, 1 sample preparation room and 1 mechanical room. Sized at 21 x 17.7 m; 6.1 m high with 10-degree slope. Weigh bridge Designed for up to 109 t. Weighing Increments as per NIST Handbook 44 (typically 9 kg or 23 kg). 12-axle B-train configuration of Weigh bridge platform Concrete deck surface. Sized at 42 m twin; platform width of 3.5 m. Mine access road Mine access road connecting the WCP and the mine will follow the typical cross-section design Sewage The WCP is located outside of the town limits of Camden and does not have direct access to the municipal sewer network, Septic tank(s) will be required to be installed to service the NPI facilities. From time to time, the septic tanks would be emptied by vacuum trucks as required. For the MSP, the sewers servicing the NPI facilities will connect to the sewer network of the City of Camden


TITAN PROJECT TENNESSEE, U.S. TECHNICAL REPORT SUMMARY ON FEASIBILITY STUDY Page 237 15.10 Tailings Backfill and Waste Disposal Tailings material will be conveyed from the WCP to the mining pits, where the contractor will compact the tailings in lifts. Tailings will be placed in relatively level lifts and compacted to at least 92 to 95 percent of the material’s maximum dry density as determined by the standard Proctor compaction test (ASTM D698). Tailings will be placed such that outer slopes are minimum 2.5H:1V (21.7 degrees) slope angle. It is anticipated that the tailings material will have an approximate 10 to 12 percent swell factor. Figure 15-7 shows the tailings backfill area required for the Project. Section 13 describes the waste and tailings disposal method in more detail. Figure 15-7: Year 14 Showing Finalized Mine Plan LOM Backfill Surfaces Note: Figure prepared by MM&A, 2026. As shown in Table 15-3, all waste and tailings backfill can be placed in the mined-out pits beginning in Year 5. TITAN PROJECT TENNESSEE, U.S. TECHNICAL REPORT SUMMARY ON FEASIBILITY STUDY Page 238 Table 15-3: Tailings and Wast Material Balance (volumes in cubic meters) Year Ore Volume (m3) Grade (%THM) Tailings Volume (m3) Waste Volume (m3) Total Volume (m3) Swell Disposal Volume (m3) Capacity (m3) Delta (m3) 1 2,187,000 5.0 2,077,000 1,737,000 3,815,000 0.12 4,272,000 2,287,000 (1,985,000) 2 2,147,000 3.9 2,064,000 1,768,000 3,831,000 0.12 8,564,000 5,080,000 (3,484,000) 3 2,177,000 3.1 2,109,000 1,260,000 3,369,000 0.12 12,337,000 7,641,000 (4,697,000) 4 2,163,000 3.7 2,083,000 3,065,000 5,148,000 0.12 18,103,000 11,130,000 (6,973,000) 5 6,549,000 3.1 6,344,000 9,417,000 15,761,000 0.12 35,755,000 38,461,000 2,706,000 6 6,439,000 3.2 6,235,000 6,168,000 12,403,000 0.12 49,647,000 49,755,000 109,000 7 6,381,000 3.3 6,170,000 5,655,000 11,825,000 0.12 62,891,000 62,916,000 25,000 8 6,474,000 2.9 6,284,000 6,832,000 13,116,000 0.12 77,581,000 78,491,000 910,000 9 6,528,000 2.6 6,359,000 5,374,000 11,733,000 0.12 90,722,000 91,126,000 404,000 10 6,616,000 2.8 6,434,000 4,925,000 11,360,000 0.12 103,444,000 103,460,000 16,000 11 6,373,000 3.1 6,173,000 4,837,000 11,010,000 0.12 115,775,000 118,436,000 2,660,000 12 6,681,000 2.7 6,500,000 2,774,000 9,273,000 0.12 126,162,000 126,030,000 (132,000) 13 7,400,000 3.5 7,141,000 3,358,000 10,499,000 0.12 137,920,000 137,444,000 (476,000) 14 6,424,000 3.4 6,208,000 2,076,000 8,285,000 0.12 147,199,000 147,648,000 448,000 Total 74,540,000 72,180,000 59,247,000 131,428,000 TITAN PROJECT TENNESSEE, U.S. TECHNICAL REPORT SUMMARY ON FEASIBILITY STUDY Page 239 16 Market Studies 16.1 Overview The market studies and product sales price assumptions used to support the FS were provided by IperionX to MM&A, which is filling the role of QP for Section 16. The Titan Project is differentiated within the US critical minerals landscape by its ability to produce multiple saleable mineral products from a single mineral sands project. On the current FS design basis, Titan is planned to produce ilmenite, rutile, and zircon concentrates and a HREC, providing exposure to titanium feedstocks, zirconium-bearing minerals, and strategically important rare earth oxides from one domestic source. This product mix is commercially important because it serves multiple large and established end markets, while also aligning with the strategic objective of rebuilding secure US supply chains for critical minerals presently dominated by foreign producers, and in particular by China. The Titan Project’s strategic relevance is not limited to commodity diversification. It lies in the combination of: (i) a large US resource base; (ii) saleable mineral products with existing global end uses; and (iii) exposure to the parts of the critical minerals value chain where the US and its allies remain structurally import dependent. In market terms, Titan is not attempting to create demand for new products. Rather, it is positioned to introduce new US supply into established global markets that are already large, liquid enough to absorb Titan’s forecast production, and increasingly influenced by security- of-supply considerations. US Government policy is increasingly treating critical minerals as a matter of national security, industrial resilience, and strategic competitiveness. The USGS’s critical minerals list identifies multiple mineral commodities relevant to the Titan Project’s product suite and downstream value chains, including zirconium, hafnium and numerous individual REEs such as yttrium, dysprosium, terbium, neodymium, and praseodymium. More broadly, recent White House and Department of Energy policy actions have emphasized the need to expand secure domestic mining, processing and downstream manufacturing capacity for critical minerals in order to reduce reliance on foreign adversaries and strengthen US defense, energy and advanced manufacturing supply chains. 16.2 Product Market Summaries 16.2.1 Ilmenite Ilmenite is the dominant titanium-bearing mineral feedstock for the global TiO2 industry. TiO2 pigment is primarily consumed in paints, coatings, plastics, paper, and other applications where whiteness, opacity, brightness, and durability are required. As a result, ilmenite demand is ultimately linked to broad industrial production, consumer products, construction activity, packaging, and manufacturing output. TITAN PROJECT TENNESSEE, U.S. TECHNICAL REPORT SUMMARY ON FEASIBILITY STUDY Page 240 The titanium feedstock market is large and globally established, but it is not static, with global titanium feedstock demand project to grow, moving from near-term surplus toward tighter conditions, with deficits forecast from 2026 onward, widening toward the end of the decade as demand recovery outpaces supply additions and inventories are drawn down. This tightening outlook is important for new projects because it suggests that replacement and growth supply will be required from new entrants as existing operations mature, curtail, or fail to expand sufficiently. The planned ilmenite product from the Project sits within the commercially-traded titanium feedstock spectrum. On the FS design basis, the ilmenite is specified at 62.5% TiO2, which places it within a standard chloride ilmenite range, enabling its use as a chloride feedstock, which typically serve higher-value segments of the TiO2 value chain and are subject to tighter supply conditions than lower-grade sulfate feedstocks. Chloride ilmenite demand is projected to grow materially faster than supply over the medium term, supporting the view that well-specified new chloride ilmenite supply should be absorbable by the market. From a US strategic perspective, ilmenite matters for more than pigment. Titanium minerals are the upstream raw materials for broader titanium chemical and metal value chains. While ilmenite from the Project would likely initially be sold into conventional feedstock channels, a domestic heavy mineral sands operation in Tennessee also has strategic value in strengthening the raw-material base available to support US titanium processing capacity over time. In a policy environment increasingly focused on resilient domestic supply chains, that has strategic importance. The Project’s Tennessee location, forecast production scale and ability to serve both domestic and export customers give the Project logistical and strategic advantages relative to more remote offshore supply. 16.2.2 Rutile Rutile is a higher-grade titanium feedstock than ilmenite, typically used in chloride-route TiO2 pigment production and in certain titanium metal applications. In mineral sands markets, rutile is structurally valuable because it delivers high TiO2 content in a naturally upgraded form and is therefore relevant to consumers seeking high-grade feedstocks with lower processing intensity. Rutile is a strategically important feedstock for the production of titanium metal, particularly via the chloride route used by leading titanium sponge producers. High-grade natural rutile is preferred in this process due to its elevated TiO2 content and low impurity profile, which supports efficient conversion to titanium tetrachloride (TiCl4) and ultimately high-quality titanium sponge suitable for aerospace and defense applications. Japan is widely recognized as a world leading producer of premium-grade titanium sponge, with Japanese producers supplying a significant proportion of the titanium sponge used in US aerospace and defense supply chains. The US remains reliant on imports of high-quality titanium sponge, with Japan representing the most critical and reliable allied supplier for defense applications requiring stringent metallurgical specifications. As a result, secure supply of high-grade titanium feedstocks such as rutile is directly linked to the resilience of US titanium metal supply chains. In this context, new sources of high-quality rutile feedstock


TITAN PROJECT TENNESSEE, U.S. TECHNICAL REPORT SUMMARY ON FEASIBILITY STUDY Page 241 from stable jurisdictions, including the US, may contribute to strengthening allied titanium supply chains that underpin aerospace, defense, and advanced manufacturing capabilities. 16.2.3 Zircon Zircon is a distinct and well-established market within the broader mineral sands sector. It is highly resistant to heat, abrasion, water, and chemical attack, which underpins its use in ceramics, refractories, foundry applications, specialty chemicals as well as defense applications including hypersonic missiles. Ceramics account for approximately 50% of global zircon consumption, with additional established demand from refractory linings and foundry castings. These are mature, industrial end uses with long- standing technical requirements. The zircon market is also attractive from a supply-side perspective, with global zircon demand having remained broadly stable since 2020 but expected to move from near-term surplus toward tighter conditions later in the decade and into slight deficit beyond 2030 as mine depletions are expected to reduce supply. In the US, zircon has importance that extends beyond the conventional ceramics market, including the aerospace, defense and nuclear relevance for zircon and zircon-based materials, including use in heat- shielding and advanced alloys. Zircon is also a vital domestic feedstock for zircon-based supply chains linked to nuclear and ultra-high-temperature alloys and emphasizing the Project’s ability to pair zircon production with yttrium supply for yttria-stabilized zirconia (YSZ) applications. This pairing is strategically important because YSZ is a critical high-temperature ceramic used in advanced turbine and aerospace coatings, hypersonic missiles, and related high-performance applications. In this respect, zircon that would be produced from the Project is not merely a ceramic raw material; it is also part of a potentially strategic US advanced materials platform. 16.2.4 Rare Earths The rare earth market is structurally different from the titanium feedstock and zircon markets. It is more concentrated, more opaque, more influenced by government policy, and more strategically sensitive. This is especially true for the magnet rare earth oxides used in NdFeB permanent magnets and for the heavy rare earths and Yttrium used in advanced defense, aerospace, semiconductor, and high- temperature material applications. Strong projected demand is underpinned by long-duration structural trends rather than short-cycle commodity demand alone. NdFeB magnets are central to electric vehicles, wind turbines, robotics, industrial automation, electronics, and defense systems. Dysprosium and terbium are especially important because they are used to improve magnetic coercivity and performance under heat and stress, which is why they matter disproportionately applications operating under elevated temperatures, including EVs, wind power generators, robotics, and advanced air mobility, where appreciable concentrations of dysprosium and terbium help protect against demagnetization... TITAN PROJECT TENNESSEE, U.S. TECHNICAL REPORT SUMMARY ON FEASIBILITY STUDY Page 242 China occupies a dominant position across the global rare earth value chain, spanning mining, chemical separation, refining, and downstream magnet production. While China’s share of global rare earth mining is significant, its control is most pronounced in the midstream and downstream segments, where it accounts for the majority of global rare earth oxide separation capacity and an even larger share of NdFeB permanent magnet production. This concentration has enabled China to influence global supply availability, pricing dynamics and trade flows, particularly for high-value Heavy Rare Earth Elements (HREE) such as dysprosium and terbium. Recent policy developments, including export controls and quota systems governing rare earth mining and processing, have further consolidated this position by tightening oversight of supply and limiting the availability of material to international markets. As a result, global rare earth supply chains, especially for magnet materials and HREEs, remain highly exposed to a single jurisdiction, creating structural supply risk for consuming nations. The strategic importance of the Titan Project must be understood within this context of concentrated supply and growing demand for secure, ex-China sources of critical minerals. The US remains heavily reliant on imported rare earth materials, particularly for separated oxides and magnet feedstocks, and is acutely exposed in the case of heavy rare earths and yttrium, where domestic supply is minimal to non- existent. The Project is differentiated among emerging projects by its heavy rare earth and yttrium-rich mineral assemblage, providing potential exposure to the most supply-constrained and strategically important elements within the rare earth suite. Titan’s forecast production has the potential to represent a meaningful domestic contribution to US supply of dysprosium, terbium, and yttrium, particularly when considered alongside the limited number of advanced-stage projects in allied jurisdictions. In combination with ongoing US Government initiatives to develop domestic and allied rare earth processing and magnet manufacturing capacity, the Project represents a potential upstream cornerstone in establishing a more resilient and diversified US rare earth supply chain. 16.3 Strategic Importance of the Titan Project to the United States The strategic importance of the Titan Project is underpinned by a clear and sustained shift in US Government policy toward securing domestic and allied supply chains for critical minerals. The USGS, under direction from the Department of the Interior, has formally designated a range of minerals as “critical” to the economic and national security of the US, including rare earth elements, yttrium, zirconium, and hafnium. These designations reflect both the essential role of these materials in advanced technologies and the high degree of supply risk arising from import dependence and geographic concentration of production. US policy frameworks consistently emphasize that critical minerals are not only industrial inputs, but foundational components of defense systems, energy infrastructure, semiconductors, and advanced manufacturing. Recent Federal policy actions have further elevated the urgency of developing domestic supply. In March 2025, the White House issued executive actions calling for “immediate measures to increase American mineral production,” explicitly linking domestic mineral development to national security and economic resilience objectives. Subsequent policy measures, including Section 232 investigations and actions on processed critical minerals, have highlighted that the United States remains 100% net import reliant for TITAN PROJECT TENNESSEE, U.S. TECHNICAL REPORT SUMMARY ON FEASIBILITY STUDY Page 243 a number of critical minerals and substantially import reliant for many others, particularly in downstream processing and refined materials. These policy statements emphasize that vulnerability is not limited to mining but extends across the full value chain from extraction through to refined products and advanced materials. Within this policy context, the Project is strategically differentiated as a permitted, near-term development opportunity capable of supplying multiple mineral products linked to US-designated critical minerals and strategic supply chains. In particular, the Project’s heavy rare earth and yttrium-rich concentrate provide potential exposure to dysprosium, terbium and yttrium, elements that are essential for high-performance permanent magnets, advanced ceramics, radar systems, semiconductors, and other defense-critical applications, and for which the US currently has limited domestic supply. In parallel, zircon production from the Project provides upstream feedstock relevant to zirconium- and hafnium- related value chains, which are also identified as critical under US policy frameworks and are important for nuclear, aerospace, and high-temperature materials applications. The Project also aligns with broader US Government initiatives to develop end-to-end domestic and allied critical mineral supply chains. The US Department of Defense has committed significant funding to establish “mine-to-magnet” rare earth supply chains, while the Department of Energy has articulated a strategy to build secure and resilient domestic critical mineral supply systems. In this context, the Project has the potential to function as an upstream cornerstone project, supplying critical mineral concentrates into emerging US and allied processing and manufacturing capacity. 16.4 Products and Sales Assumptions The proposed production schedule comprises two phases, and the concentrate production tonnages for each phase based on financial model are summarized in Table 16-1. Table 16-1: Titan FS Production Forecast Product Life of Mine Total (t) Phase 1 (Years 1-4) (tpa) Phase 2 (Years 5-14) (tpa) Ilmenite 1,371,495 46,228 118,658 Rutile 285,651 9,772 24,656 Zircon concentrate 767,168 27,622 65,668 HREC 60,790 1,981 5,287 16.4.1 Project Products, Specifications, and Quality The Project is designed to produce four saleable mineral concentrate products from the processing of heavy mineral sands. The products and their estimated specifications used in the FS are summarized in Table 16-2. Table 16-2: Titan FS Product Estimated Specifications Titan FS Product Key Specification FS Design Value Ilmenite TiO2 content 62.5% Rutile TiO2 content 91.1% Zircon concentrate ZrO2 content 34.4% Heavy Rare Earth Concentrate TREO content 61.4% TITAN PROJECT TENNESSEE, U.S. TECHNICAL REPORT SUMMARY ON FEASIBILITY STUDY Page 244 The HREC specification of 61.4% TREO is based on assay data incorporated into the FS design basis. The estimated distribution of individual rare earth oxides within the TREO used for pricing assumptions is summarized in Table 16-3. Table 16-3: Titan HREC Estimated TREO Distribution (%) CeO₂ Dy₂O₃ Er₂O₃ Eu₂O₃ Gd₂O₃ Ho₂O₃ La₂O₃ Lu₂O₃ Nd₂O₃ Pr₆O₁₁ Sc2O3 Sm₂O₃ Tb₄O₇ Tm₂O₃ Y₂O₃ Yb₂O₃ TREO 25.15 0.90 0.39 0.16 1.49 0.16 11.72 0.04 11.30 3.08 0.004 2.05 0.20 0.05 4.39 0.32 61.40 The specifications presented above represent the FS design grades used in the production schedule and revenue modeling. Product grades may vary during operations and will be subject to offtake and sales agreement specifications. 16.5 Market Overview and Demand 16.5.1 Market Studies Used Market analysis and commodity price projections used in this Section are derived from independent third- party market studies. Titanium and zircon mineral sands market conditions and price forecasts are based on the Titanium Feedstock Price Forecast (Issue 3, 2025) prepared by TZ Minerals International Pty Ltd (TZMI). HREC pricing is based on the IperionX Rare Earth Concentrate Calculations (April 2026) prepared by Argus Media and Expected Payability for Rare Earth Concentrates from IperionX's Titan Project (April 30, 2026) prepared by Mine Value Partners (MVP). Magnet rare earth oxide supply and demand data referenced in this sub-section are based on the ‘Rare Earth Magnet Market Outlook to 2040’ report (Q4 2025) prepared by Adamas Intelligence (Adamas). 16.5.2 Titanium Feedstock Market (Ilmenite and Rutile) Global titanium feedstock demand is primarily driven by the pigment industry, which accounts for approximately 90% of TiO2 consumption. The TZMI study provides global supply and demand forecasts for titanium feedstocks from 2024 to 2029. Supply is composed of sulfate ilmenite, chloride slag, chloride ilmenite, and other feedstocks including rutile, synthetic rutile, upgraded slag, and leucoxene. The supply composition and demand outlook are summarized in Figure 16-1.


TITAN PROJECT TENNESSEE, U.S. TECHNICAL REPORT SUMMARY ON FEASIBILITY STUDY Page 245 Figure 16-1: Titanium Feedstock Supply & Demand (Million TiO2 Units) Source: TZMI and IperionX analysis, 2026 Global titanium feedstock market demand is projected to grow at a 5-year compound annual growth rate (CAGR) of 1.7% from 2024 through 2029. TZMI’s analysis forecasts a transition from modest surplus to modest deficit in global titanium feedstock markets, beginning in 2026. The market is estimated to have been in modest surplus in 2024 and 2025. This trend of softening demand continued into early 2026, and the market is expected to remain in modest surplus through early 2027, before consumption growth begins to increase in 2028 and 2029. This structural shift underpins the favorable outlook for new titanium feedstock supply and is projected to help incentivize new supply to enter the market. Near-term supply growth is expected to remain constrained, driven by project delays, existing mines ceasing operations, and production decreases in Asia. Longer-term supply response is expected to grow at a slower pace than demand, with a 5-year CAGR of 0.8%, resulting in the market remaining in modest deficit in 2029. Ilmenite markets are projected to change from modest surplus in the near-term to modest deficit in 2029, with surpluses primarily localized to specific Asian jurisdictions. Chloride ilmenite demand is projected to grow at a CAGR of 4.2% over the forecast period against supply growing at 1.3%, driving the switch from surplus to deficit. The rutile market is estimated to remain balanced in the near term before shifting to modest deficit in 2029, primarily driven by year over year decreases in global supply. New supply is expected to remain tight, requiring higher commodity prices to incentivize new projects. The forecast Phase 2 ilmenite production from the Project of approximately 118,658 tonnes per annum (tpa) and rutile production of approximately 24,656 tpa were evaluated relative to a global titanium feedstock market measured in the millions of tonnes per annum. The Project’s combined titanium feedstock production represents approximately 1% of forecast global demand. TITAN PROJECT TENNESSEE, U.S. TECHNICAL REPORT SUMMARY ON FEASIBILITY STUDY Page 246 The 62.5% TiO2 ilmenite specification used in the FS design basis falls within the range of commercially traded ilmenite feedstocks described in the TZMI study. The 91.1% TiO2 rutile specification is consistent with commercially traded rutile concentrates. At the FS stage, ilmenite and rutile are assumed to be marketed to titanium feedstock consumers or intermediaries active in the TiO2 supply chain. IperionX has previously engaged in non-binding memoranda of understanding with potential titanium feedstock counterparties (refer to Section 16.7). 16.5.3 Zircon Market The forecasted annual average zircon production from the Project represents about 2% of 2025 global zircon demand. Demand has been relatively unchanged in the 1.0-1.3 Mtpa range since 2020, and global zircon markets are expected to enter modest surplus in the near term, before returning through balance in the late 2020s and into slight deficit in the long term beyond 2030. The market is expected to enter deficit towards the end of the decade due to limited new supply, as demand growth is projected to remain relatively modest through 2030 and beyond. China’s zircon consumption for its construction industry remains a core driver for global zircon market growth. Recent tempering of China’s economy is expected to tip near-term market balance towards modest surplus, and major zircon suppliers such as Iluka Resources have reduced zircon production targets in response in the first half of 2026. In the medium term, the zircon market is expected to tighten towards balance and modest deficit beyond 2030, driven in part by supply side reductions and in part by a projected demand CAGR of 3% through 2030. Zircon price projections used in the FS are based on the Titanium Feedstock Price Forecast (Issue 3, 2025) prepared by TZMI. The global supply of zircon is forecast to decline due to mine depletions, with new projects required to meet predicted demand. Zircon pricing assumptions are illustrated in Figure 16-3. The forecast Phase 2 zircon concentrate production from the Project of approximately 65,668 tpa (equivalent to approximately 34,000 tpa on a premium zircon basis) represents a marginal fraction of global zircon demand, positioning the project as a highly absorbable new entrant in a supply-constrained market. At the FS stage, zircon concentrate is assumed to be marketed to zircon processors or intermediaries active in the ceramics and refractory supply chain (refer to Section 16.7). 16.5.4 Rare Earth Market The FS contemplates production of a HREC with a design basis grade of 61.4% TREO, with oxide distribution as presented in Section 16.1. Demand for select rare earth oxides used in the manufacturing of NdFeB magnets is forecast to grow significantly through 2040, driven primarily by the electrification of transport, expansion of renewable energy generation, and the emergence of robotics, which is expected to become the largest global demand driver by 2040. Overall REE market growth is driven by magnet REOs— demand for the NdPr oxides are projected to increase at a CAGR of 8.2% from 2024 through 2040, and global demand for TITAN PROJECT TENNESSEE, U.S. TECHNICAL REPORT SUMMARY ON FEASIBILITY STUDY Page 247 dysprosium and terbium oxides are projected to increase at a CAGR of 7.0% and 6.7%, respectively, during the same period. Demand growth for non-magnet REOs is projected to be more modest, leading to projected market surpluses for some of in these elements. Mine production growth in dysprosium and terbium oxides is expected to increase at a CAGR of 4.4% and 4.9% respectively through the forecast period, implying a widening supply deficit for these heavy rare earth oxides. The Adamas Intelligence’s ‘Rare Earth Magnet Market Outlook to 2040’ report provides global magnet rare earth oxide supply and demand scenarios. As illustrated in Figure 16-2, total supply (comprising both mine production and secondary recycling from China and non-Chinese sources) is forecast to fall materially short of demand from approximately 2027 onward, with the deficit widening through 2040. Figure 16-2: Magnet REO Market Supply / Demand Balance (t) Source: Adamas and IperionX analysis, 2026 From 2015 to 2024, China's share of global magnet REO mine production fell from approximately 82% to 65%, with most of the diversification occurring to other Asian jurisdictions. China is expected to remain the dominant source of supply over the forecast period. Chinese supply is subject to government quotas and export restrictions, which can result in structural uncertainty for consumers outside China. Over the same period, the US has emerged as an increasingly important supply source of NdPr oxides via the Mountain Pass mine, but remains supply-constrained on heavy rare earths. Global supply of dysprosium and terbium was dominated by Myanmar in 2024. TITAN PROJECT TENNESSEE, U.S. TECHNICAL REPORT SUMMARY ON FEASIBILITY STUDY Page 248 As of 2024, supply sources outside Asia are estimated to provide less than 20% of global NdPr mine production, less than 5% of global dysprosium mine production and less than 10% of global terbium mine production. The US is estimated to account for <10% of global magnet REO supply, and notably, <2% of global dysprosium and terbium supply, but represents >15% of estimated demand for end-use NdFeB magnets. Table 16-2 Titan's forecast Phase 2 (operating years 5 through 14, approximately 2032 through 2041) HREC production of approximately 5,287 tonnes per annum contains approximately 48 tonnes per annum of dysprosium oxide (Dy₂O₃) and approximately 11 tonnes per annum of terbium oxide (Tb₄O₇), based on the TREO distribution in Table 16- 2. With the United States highly reliant on imports for separated heavy rare earths, Titan's forecast of approximately 58 tonnes per annum of combined dysprosium and terbium oxide production represents a meaningful domestic supply contribution to emerging US rare earth supply chains. 16.6 Product Pricing Assumptions and Methodology 16.6.1 Mineral Sands Product Pricing Ilmenite, rutile, and zircon price forecasts are based on the TZMI Titanium Feedstock Price Forecast (Issue 3, 2025) base case scenario. From 2026 to 2029, annual base case forecast prices were applied, after adjusting for inflation in IperionX’s analysis. From 2030 onward, TZMI long-term inducement prices, converted to real 2026 US dollars, were held flat through the remainder of the mine life. The mineral sands product pricing assumptions are illustrated in Figure 16-3. Figure 16-3: Mineral Sands Products Pricing Forecast(US$/t, Real 2026) Source: TZMI and IperionX analysis, 2026 $0 $500 $1,000 $1,500 $2,000 2025 2026 2027 2028 2029 2030 2031 2032 2033 2034 2035 2036 2037 2038 2039 2040 P ri ce ( U S$ /t ) Rutile Zircon Chloride Ilmenite


TITAN PROJECT TENNESSEE, U.S. TECHNICAL REPORT SUMMARY ON FEASIBILITY STUDY Page 249 16.6.2 Heavy Rare Earth Concentrate Pricing The IperionX Rare Earth Concentrate Calculations (April 2026) Report prepared by Argus Media provides forecast for 15 individual rare earth oxide prices and the resulting TREO basket value for the Project HREC, expressed in real 2026 US dollars over the 2020-2040 horizon. IperionX engaged Mine Value Partners (MVP), an independent mining consultancy with significant expertise in commodity markets, mineral development operations, and commercial analysis, to undertake an assessment of the payability of IperionX Heavy Rare Earth Concentrate. MVP's analysis concluded that the implied sustainable payability for a rare earth concentrate like Titan's is expected to sit between 46% and 65% of theoretical basket value, dependent on pricing assumptions. The range supports downstream capital recovery while allowing upstream rents to be allocated in line with long-run economic theory for commodities and represents a return to economically sustainable value sharing where both upstream and downstream participants can invest with confidence and continuity. For financial modelling purposes, a 50% payability assumption is considered a reasonable assumption that is not anomalous or aggressive, and one that is well supported by projected netback economics and other Western precedents. The basket price below was generated by applying a 50% payability factor to the TREO basket value to derive the IperionX HREC price. The FS LOM average price of HREC is US$41,759 per tonne based on the financial model. Based on the Argus 2026 forecast prices, heavy rare earth elements (notably yttrium, dysprosium, and terbium) account for the majority of the TREO basket value. Despite representing approximately 13% of TREO content by mass, these heavy rare earth elements contribute over 70% of basket value across the forecast period, making the Titan HREC heavy-rare-earth-dominant by value. The TREO basket price and HREC price forecast are illustrated in Figure 16-4. TITAN PROJECT TENNESSEE, U.S. TECHNICAL REPORT SUMMARY ON FEASIBILITY STUDY Page 250 Figure 16-4: TREO Basket Price and HREC Price Forecast (US$/kg, Real 2026) Source: Argus Media, IperionX Rare Earth Concentrate Calculation, Issue 1, April 2026. IperionX HREC price reflects the payability assumption, supported by Mine Value Partners' April 2026 analysis ("Expected Payability for Rare Earth Concentrates from IperionX's Titan Project"). 16.6.3 Historical and Forecast Prices Historical commodity prices for the five-year period preceding the FS (2021-2025) and the corresponding forecast averages are presented in Table 16-4. Table 16-4: Historic and Forecast Prices (US$/t, real 2026 terms) Product Historic 2021-2025 (annual avg. US$/t) Forecast 2028-2042 (annual avg. US$/t) Rutile 1,335 1,471 Chloride ilmenite 318 353 Zircon* 1,818 1,907* Source: TZMI and Argus Media. Historic prices converted to real 2026 US dollars. Forecast averages derived from TZMI (Issue 3, 2025) base case. *Zircon prices were used to calculate zircon concentrate prices. Historical individual rare earth oxide prices used as context for the HREC pricing assumptions are summarized in Table 16-5. TITAN PROJECT TENNESSEE, U.S. TECHNICAL REPORT SUMMARY ON FEASIBILITY STUDY Page 251 Table 16-5: Historic and Forecast REO Prices (US$/kg, real 2026 terms) Rare Earth Oxide Historic 2021-2025 (annual avg, US$/kg) Forecast 2028-2042 (annual avg. US$/kg) La₂O₃ 1.0 0.70 CeO₂ 1.3 2.24 Pr₆O₁₁ 93.7 158.64 Nd₂O₃ 97.3 151.98 Sm₂O₃ 2.6 7.65 Eu2O3 30.1 17.32 Gd₂O₃ 46.4 692.41 Tb₄O₇ 1,429 3,462 Dy₂O₃ 355 952.07 Ho₂O₃ 123 73.99 Er₂O₃ 45.9 66.14 Yb₂O₃ 15.5 20.53 Lu₂O₃ 871 1,074 Y₂O₃ 8.2 778.96 Source: Historic REO prices from Argus Media (2021-2025 annual averages, real 2026 US dollars); Forecasted prices from Argus Media, IperionX Rare Earth Concentrate Calculations (April 2026), 2028-2042 simple average with 2041-2042 held flat at 2040 values. 16.7 Material Contracts and Market Engagement 16.7.1 Material Contracts Project development is expected to require material contracts related to contract mining, WCP and MSP equipment and services, transportation and logistics, utilities, and product handling; no material contracts required for Project development have been executed. Mining is planned to be performed under a contract mining arrangement, and the WCP and MSP are planned to be owned and operated by IperionX, with equipment, reagents, and specialist services to be procured under standard commercial contracts at a later stage. Transportation of concentrates and final products, as well as power, water supply, tailings handling, and other site services, are expected to be provided by third parties, but no binding transportation, offtake, or utility agreements are currently in place. The economic analysis in Section 19 assumes that required contracts will be secured prior to construction and operations on commercially reasonable terms consistent with industry practice. 16.7.2 Historical Market Engagement IperionX had previously engaged in non-binding memoranda of understanding (MOUs) with major domestic and international counterparties across both the titanium feedstock and HREC markets: > Energy Fuels Inc. (April 2021): Non-binding MOU for the potential supply of monazite sands from the Titan Project to Energy Fuels’ White Mesa Mill in Utah for rare earth processing. Energy Fuels’ evaluation of Titan HREC samples indicated suitability as a high-quality feedstock. TITAN PROJECT TENNESSEE, U.S. TECHNICAL REPORT SUMMARY ON FEASIBILITY STUDY Page 252 > The Chemours Company (December 2021): Non-binding MOU for the potential supply of Ilmenite and Rutile from the Titan Project to Chemours, one of the world’s largest producers of TiO2. This MOU has since reached its initial expiration date. > Mario Pilato BLAT S.A. (February 2022): Non-binding MOU for the potential supply of Zircon products. Mario Pilato is a leading international supplier of raw materials for ceramics, glass, and refractory industries. These engagements, while non-binding, demonstrate commercial interest from established market participants and support IperionX’s market entry strategy for the proposed Project product suite. In addition to the historical engagements, IperionX engaged in substantive discussions with major Japanese industrial counterparties regarding potential offtake arrangements and strategic investment in the Project. Several counterparties have made preliminary investments to evaluate the product suite, including a major Japanese conglomerate self-funding independent bulk sample and subsequent metallurgical testwork to evaluate IperionX’s product suite. IperionX is also in active discussions with US and Japanese government agencies regarding potential project funding support. These discussions are indicative of the strategic importance of domestic titanium and rare earth supply chains to national security and industrial policy. 16.7.3 Marketing Plan and Planned Sales Channels The overarching marketing strategy for the product suite is to pursue all realistic, high-value options by leveraging the forecasted structural supply deficits across both mineral sands and rare earth markets. > Heavy mineral sands: IperionX intends to target direct sales to global TiO2 pigment producers, chloride slag producers, and independent zircon millers. The sales and logistics strategy is formulated around securing long-term, multi-year contracts with creditworthy counterparties to underpin project financing. The Project location in Tennessee provides logistical advantages for serving both domestic US and export markets. > HREC: IperionX is actively evaluating downstream refining partnerships and domestic offtake channels to ensure the HREC supports the development of a secure, ex-China rare earth supply chain in the United States. IperionX’s existing relationship with Energy Fuels and its White Mesa Mill provides a potential domestic processing pathway for the HREC production. The final quantity of production committed under future binding offtake agreements, and the counterparties with whom those contracts are established, will ultimately be determined in conjunction with the requirements of debt providers during project financing.


TITAN PROJECT TENNESSEE, U.S. TECHNICAL REPORT SUMMARY ON FEASIBILITY STUDY Page 253 17 Environmental Studies and Permitting, and Plans, Negotiations, or Agreements with Local Individuals or Groups 17.1 Mine and WCP Site – Regulatory Approval Process 17.1.1 Overview The proposed mine site location analyzed in this sub-section is the estimated future permit boundary depicted in Figure 17-1, is approximately 570 ha (1,409 acres), and consists of forested land, active silviculture and agricultural land, and a maintained utility right-of-way (ROW). The proposed mine site includes the existing 125-ha (308-acre) permit area. An environmental due diligence study area was subject to desktop analyses and field investigations from 2021 to 2023. IperionX secured the following permits and agency approvals for the existing permit area (refer to Figure 17-1): > mining permit (surface mining of titanium and mineral sands) > NPDES permit (to discharge treated mine wastewater and stormwater) > insignificant activity registration (air quality registration for sources of insignificant emissions) > approved jurisdictional determination (from the USACE) > hydrological determination (from the TDEC) As mining planning progresses, these permits and agency approvals will require modification to incorporate the entirety of the future mine site. Environmental due diligence studies will also require appropriate re-reviews, updates, and field work as applicable. The assessment in this sub-section assumes full disturbance within the estimated future mine area, although there is currently no work proposed in Federal Emergency Management Act (FEMA) floodplains. 17.1.2 Environmental Baseline Studies 17.1.2.1 Environmental Baseline Studies – Mine Site HDR has conducted desktop and on-site environmental due diligence in 2021 to 2022 for a 909-ha (2,245- acre) environmental due diligence study area that encompasses a majority of the estimated future permit boundary (see Figure 17-1). The following studies were completed and will require review/update for to support grant of the estimated future permit boundary: > desktop cultural resources background investigation – June 2021 > desktop and on-site protected species habitat investigation – June 2021 > stream and wetland delineation – June 2021 TITAN PROJECT TENNESSEE, U.S. TECHNICAL REPORT SUMMARY ON FEASIBILITY STUDY Page 254 > groundwater well installation and baseline groundwater monitoring – July 2021 > baseline groundwater and surface water assessment – July 2022 A groundwater flow model (December 2022) was completed for the existing permit area and was updated in March 2026 to include the estimated future permit boundary. The following regulatory determinations and permits were acquired for the existing permit area and will need to be reviewed, updated and modified to incorporate the estimated future permit area: > TDEC hydrologic determination – January 2023 > USACE jurisdictional determination – April 2023 (Note: The HD and AJD areas consist of a nearly identical, but slightly larger 312 ac. area, than the existing permit area of 308 ac.) > TDEC Individual NPDES and surface mining permit – August 2023 Full build out of the planned mine site (i.e., the estimated future permit area) will likely require the following permits and compliance items: > TDEC air quality construction permit > TDEC air quality operating permit > Clean Water Act Section 401 Water Quality Certification – individual TDEC aquatic resources alteration permit (ARAP) > Clean Water Act Section 404 – USACE individual permit - National Environmental Policy Act review per the USACE’s CWA Section 404(b)(1) guidelines - Endangered Species Act compliance to include species specific surveys for threatened and endangered species - National Historic Preservation Act compliance to include an archaeological and architectural survey - Migratory Bird Treaty Act compliance to include site habitat assessment of the full estimated future permit area. Table 17-1 provides a list of the key environmental permits that will be required for the proposed mine area. TITAN PROJECT TENNESSEE, U.S. TECHNICAL REPORT SUMMARY ON FEASIBILITY STUDY Page 255 Figure 17-1: Mine and WCP Site Boundaries Note: Prepared by HDR, 2026. TITAN PROJECT TENNESSEE, U.S. TECHNICAL REPORT SUMMARY ON FEASIBILITY STUDY Page 256 Table 17-1: Titan Minerals IperionX Environmental Permits Required for the Proposed Mine Site Reviewed and Issued By Permit/Authorization Existing Mine Permit Area Estimated Future Mine Boundary (based on current mine plan) Permit Status Expiration Date Future Actions Estimated Timeline Federal (United States) United States Army Corps of Engineers (USACE) 404 Jurisdictional Determination Approved JD issued April 2023 (LRN-2022-00661) April 2028 Submittal of JD required for USACE review/verification of stream and wetland locations; JD required for CWA 404/401 permitting. 3 to 8 months (From start of new/updated delineation to issuance of JD) 404 Nationwide Permit or Individual Permit N/A (Existing Mine Permit Area includes only uplands) Individual Permit (IP) required for more than 0.5 acre of impacts to streams and wetlands per USACE Nashville Regulatory District Regional Conditions 12 to 18 months (From start of permit preparation to issuance of 404 IP) National Environmental Policy Act (Environmental Assessment) N/A (no federal nexus) NEPA EA (USACE lead federal agency) required for more than minimal impacts (IP) to streams and wetlands 12 to 18 months (Concurrent to 404 IP process) Stream and Wetland Mitigation N/A Required for more than minimal impacts to streams and wetlands; must be acquired/purchased prior to impacts to streams and wetlands occurring. Concurrent with 404 IP process. United States Fish and Wildlife Service (USFWS) Consultation regarding Endangered Species Occurs concurrently with USACE and/or NPDES Permit process Required due to federal nexus with USACE (species-specific surveys likely required) and interagency consultation during NEPA review. 1-3 months for field work. Should specific-specific survey be required and survey windows are missed in said calendar, completion of surveys could take up to 1 year. Consultation concurrent with 404 IP/NPDES Permit processes. Tennessee Historical Commission (THC) Consultation regarding Architectural and Archaeological Resources Occurs concurrently with USACE and NPDES Permit process Required due to federal nexus with USACE (archaeological and architectural survey likely required) and interagency consultation during NEPA review. 1-3 months for field work. Consultation concurrent with 404 IP/NPDES Permit processes State (Tennessee) TN Department of Environment and Conservation (TDEC) Mineral and Geologic Resources TDEC Surface Mining Permit and Individual NPDES Effective September 2023 (Mining Permit: OM-70711-01) (NPDES Permit: TN0070711) August 2028 Current mine permit amendment required Variable and depends on level of amendment complexity; there is no statutory review timeline for surface mine permit amendments. TDEC Air Pollution Control Insignificant Emission Notification August 2023 (Emission Source Reference No. 09-0175-01) N/A or until emission sources are modified 1 month for emission documentation; no review timeline. Air Quality Construction Permit (Minor or Major) N/A as emission sources are insignificant emission activities Unknown until emissions for Expected Future Permit Boundary have been estimated Minor: 2-4 months (agency review) Major: 5-12 months (agency review) Air Quality Operating Permit (Title V or non-Title V) N/A as emission sources are less than Title V thresholds Unknown until emissions for Expected Future Permit Boundary have been estimated Non-Title V: 2-4 months (agency review) Title V: 9-18 months (agency review) TDEC Division of Water Resources TDEC Hydrologic Determination (HD) Issued January 2023 (TDEC No. 31454) No expiration listed, but typically 3-5 years Submittal of HD required for TDEC DWR review/concurrence of stream and wetland locations; HD concurrence required for CWA 404/401 permitting. 3 to 6 months (From start of new/updated delineation to issuance of HD) Clean Water Act Section 401 Water Quality Certification/Aquatic Resources Alteration Permit (ARAP) N/A (Existing Mine Permit Area includes only uplands) Individual ARAP required for more than minimal impacts to streams and wetlands. 3 to 6 months (From start of permit preparation to issuance of ARAP) N/A ARAP required for long term water withdrawals; 7Q10 flow needs to be determined for applicability of permit coverage; otherwise will be covered under Individual ARAP. 3 to 6 months (From start of permit preparation to issuance of ARAP) Water Withdrawal Registration N/A Required for more than 10,000 gallons of surface or groundwater withdrawal. 1 month (for registration preparation; registration submittal only, permit review/issuance process). TDEC Division of Radiological Health Radioactive Material License Preparing application Update application and RPP for Estimated Future Permit Boundary 60-120+ days depending on level of complexity (agency review) Local (unincorporated Henry and Carroll counties) No local environmental permitting is anticipated.


TITAN PROJECT TENNESSEE, U.S. TECHNICAL REPORT SUMMARY ON FEASIBILITY STUDY Page 257 17.1.3 Federal Statutes and Approvals 17.1.3.1 Clean Water Act Section 404 – Mine Site The discharge of dredged or fill material into a WoTUS is regulated by the USACE and requires authorization under Section 404 of the Clean Water Act (Section 404 permit). Given the extensive scope of the mine activities proposed within the estimated future permit boundary (i.e., full disturbance within the estimated future mine area), it is highly likely that an Individual Permit (IP) and a companion Section 404(b)(1) National Environmental Policy Act (NEPA) document will be necessary for this project. USACE would conduct a NEPA review for more than minimal impacts to stream and wetland resources due to mining activities. Mitigation for stream and wetland impacts would be determined. 17.1.3.1.1 Jurisdictional Determination HDR performed a stream and wetland delineation in 2021 within the environmental due diligence study area (excluding FEMA floodplains) (refer to Figure 17-1). HDR submitted a jurisdictional determination (JD) request for the delineated areas within the environmental due diligence study area in July 2022; however, that application was rescinded per IperionX’s request and was resubmitted as the smaller existing permit area in December 2022. The USACE issued an approved jurisdictional determination (AJD) for the existing permit area in April 2023. The AJD will expire on April 28, 2028. The No delineated waters were formally reviewed by the USACE since the existing permit area is comprised entirely of uplands. 17.1.3.1.2 Recommendations HDR recommends a re-review of WoTUS previously delineated in the environmental due diligence study area where it overlaps the estimated future permit boundary. Additionally, there is an area within the estimated future permit boundary where no environmental due diligence was previously conducted in which WoTUS investigations should also be performed. An AJD or PJD Verification of WoTUS from the USACE Nashville District is required for the development of future Section 404 permit applications. The USACE will view parcels that will be mined as part of a “Larger Plan of Development” and prefers to view potential projects at an overall level as opposed to piecemealing parcels. Pre-application coordination is recommended with the USACE well before the date of the permit application submittal. 17.1.3.2 National Historical Preservation Act The NHPA defines historic properties as buildings, structures, sites, districts, or objects listed or eligible for listing in the NRHP. Under Section 106 of the NHPA, federal agencies are required to assess the effects of a project on historic properties. If a project has a federal nexus, the lead federal agency is required to initiate Section 106 consultation with a state’s Historic Preservation Office (HPO), which in Tennessee is the THC. If a project does not have a federal nexus, informal consultation with THC may be requested to verify no historical properties or cultural resources would be impacted by the project; however, as of early 2026, THC is not providing concurrence or review unless requested by a lead agency. Given the size of TITAN PROJECT TENNESSEE, U.S. TECHNICAL REPORT SUMMARY ON FEASIBILITY STUDY Page 258 the site, its proximity to floodplains, and potential magnitude of disturbance, it is likely that the THC would require archaeological survey of the site as part of the NEPA review (404 IP process). 17.1.3.2.1 Recommendations HDR performed a cultural desktop review in 2021 within the environmental due diligence study area (see Figure 17-1). No archaeological sites or cemeteries were found to exist within that area at the time of review; however, six archaeological sites and five cemeteries were found within 1.61 km (1 mile) of the site. Given the close proximity of known sites and amount of time that has passed since the initial review, a re-review of the existing 2021 review that should also incorporate new area within the estimated future mine area that has not yet been previously reviewed is recommended. A THC review of the desktop study and informal consultation can also be requested. Findings from these studies will be included in the NPDES and Section 404 permit application. 17.1.3.3 Endangered Species Act Section 7 or 10 Federally listed species are protected by the US Fish and Wildlife Service (USFWS) under the Endangered Species Act (ESA). If a project has a federal nexus, such as requiring a Section 404 permit from the USACE, the lead federal agency is required to consult with the USFWS under Section 7 of the ESA. A project without a federal nexus does not require formal Section 7 consultation; however, it may still require an Incidental Take Authorization under Section 10 of the ESA to allow for the “take” of a federally listed species. An applicant may also initiate informal consultation at any time with the USFWS to verify a project is compliant with the ESA and will have “no effect” or “may affect but is not likely to adversely affect” federally protected species. 17.1.3.3.1 Recommendations Per the USFWS Information for Planning and Consultation (IPaC) website, the following federally protected species may occur within the MSP area: > gray bat (Myotis grisescens, endangered) > northern long-eared bat (Myotis septentrionalis, endangered) > Indiana bat (Myotis sodalist, endangered) > tricolored bat (Perimyotis subflavus, proposed endangered) > whooping crane (Grus americana, experimental population/non-essential) > alligator snapping turtle (Macrochelys temminckii, proposed threatened) > monarch butterfly (Danaus Plexippus, proposed threatened) HDR performed habitat assessments in 2021 within the environmental due diligence study area. In the time since this initial work, the tricolored bat and alligator snapping turtle have been added as potentially occurring species for both the environmental due diligence study and expected future permit areas, with TITAN PROJECT TENNESSEE, U.S. TECHNICAL REPORT SUMMARY ON FEASIBILITY STUDY Page 259 the statuses of proposed endangered and proposed threatened, respectively. Field habitat assessments are recommended for the full estimated future mine area, including those areas previously investigated in the environmental due diligence study area. If species-specific bat surveys are pursued, they would have to occur during summer occupancy window in which bats are roosting in trees in their summer ranges (April 1-Sept 30) (USFWS. 2025). The USFWS will view parcels that will be mined as part of a “Larger Plan of Development” and prefers to view potential projects at an overall level as opposed to piecemealing parcels. Findings from these studies will be included in the NPDES and Section 404 permit application. Formal Section 7 consultation with the USFWS is not required until the Project triggers a federal nexus, typically through impacts to WoTUS that require a Section 404/401 permit. However, TDEC-DWR may provide the USFWS with the joint Mine Permit/NPDES application for its review and comment during the public comment period. HDR recommends informal consultation with the USFWS occur early in Project development and prior to CWA Section 404 and Mine/NPDES permitting to determine if the Project will have “no effect” or “may affect but will not adversely affect” protected species and does not violate the ESA. Informal consultation with the USFWS typically concludes within three to four months. It is recommended that tree clearing occurs only in winter months (November 16 to March 31) to avoid affecting federally protected bat species potential habitat. Further, it is recommended that any necessary mitigation be done to avoid interaction with any other potentially occurring federally protected species. Otherwise, a formal biological assessment would have to be submitted to the USFWS to obtain an incidental take permit. 17.1.3.4 Migratory Birds Treaty Act 16 USC 703-712; The Bald and Golden Eagle Protection Act The Migratory Bird Treaty Act (MBTA) prohibits the taking of protected migratory bird species without prior authorization by the USFWS. Similarly, the Bald and Golden Eagle Protection Act (BGEPA) prohibits the taking of bald or golden eagles, including their parts, nests, or eggs, without prior authorization by the USFWS. Coordination with the USFWS regarding the MBTA and BGEPA typically occurs with Section 7 consultation when there is a federal nexus, such as a Section 404 permit. 17.1.3.4.1 Recommendations HDR performed habitat assessments in 2021 within the environmental due diligence study area. Because of the added parcels within the estimated future permit boundary and the length of time that has passed since the assessment within the existing permit area, HDR recommends field habitat assessments for the full estimated future permit area, including those areas previously investigated in the environmental due diligence study area. The USFWS will view parcels that will be mined as part of a “Larger Plan of Development” and prefers to view potential projects at an overall level as opposed to piecemealing parcels. Findings from these studies will be included in the NPDES and Clean Water Act (CWA) Section 404 permit application. TITAN PROJECT TENNESSEE, U.S. TECHNICAL REPORT SUMMARY ON FEASIBILITY STUDY Page 260 Typical best practice consists of tree clearing occurring outside the migratory bird nesting season (September 1 to April 1) to avoid affecting migratory birds and their nests and eggs. In addition, bald or golden eagle nests should be avoided. If tree clearing must occur within the migratory bird nesting season, USFWS may request (or require if there is a federal nexus) MBTA surveys be conducted within one week (seven days) of tree clearing activities to identify active nests and avoidance buffers. Formal Section 7 consultation with the USFWS is not required until the Project triggers a federal nexus. However, the USFWS will be pulled in for comment during the CWA Section 404 and NPDES public comment period. HDR recommends that informal consultation with the USFWS occur early in Project development and prior to 404 or NPDES permitting to verify compliance with the MBTA and BGEPA. 17.1.4 State Statutes and Approvals There are some state statutes and approvals conducted under federal acts or sections for which compliance has been mandated to the states for implementation, hence their listing under this sub- section. 17.1.4.1 Clean Water Act Section 401 The TDEC-DWR regulates impacts to state waters (streams, rivers, lakes, wetlands, and groundwater) under Section 401 of the CWA. Impacts may include, and are not limited to, physical alterations to state waters such as dredging, excavation, channel widening, water diversions, or water withdrawals. The appropriate Section 401 permit is dependent upon the project activities and magnitude of impacts to state waters from a project. TDEC-DWR’s general aquatic resource alteration permits (ARAPs) authorize multiple minor impacts depending on scope and cumulative impacts from the project. If impacts exceed the general ARAP requirements, an Individual ARAP would be required. A general ARAP is typically issued within three months whereas authorization under an individual ARAP can take six months. Given the scope of the mine activities proposed within the estimated future permit boundary, it is likely that an individual ARAP would be required for this project. A separate ARAP for water withdrawal will also be needed, however the 7Q10 flow needs to be determined for applicability of general ARAP coverage. Otherwise, coverage under an individual ARAP would be necessary. 17.1.4.1.1 Hydrologic Determination A hydrologic determination (HD) concurrence from TDEC-DWR is required for ARAP/Section 401 permit applications. HDR submitted an HD request for the delineated areas within the environmental due diligence study area in July 2022; however, that application was rescinded per IperionX’s request and was resubmitted as the smaller existing permit area in December 2022. TDEC-DWR issued an HD concurrence for the existing permit area in January 2023. The existing permit area contained uplands only (i.e., no surface waters are located within the existing permit area). 17.1.4.1.2 Recommendations HDR performed a stream and wetland delineation in 2021 within the environmental due diligence study area; however, TDEC-DWR issued an HD concurrence for only the existing permit area. Thus, due to the


TITAN PROJECT TENNESSEE, U.S. TECHNICAL REPORT SUMMARY ON FEASIBILITY STUDY Page 261 age of the field data collected for the environmental due diligence study area and no HD concurrence for the larger area, a re-review (updated field data collection) would be required in order to submit another HD request to TDEC-DWR to cover the estimated future permit boundary. 17.1.4.2 Clean Water Act Section 402 The TDEC-DWR currently regulates construction stormwater, industrial stormwater during facility operations, and process wastewater discharge during facility operations from industrial sites under Section 402 of the Clean Water Act. An industrial facility must apply for an NPDES permit to authorize discharge of process wastewater at the site to the ground as well as stormwater runoff during operations of the facility. Process wastewater is also defined as stormwater runoff from process materials (i.e., dewatered processed tailings). The necessary NPDES permitting for the existing permit area site was conducted through a joint mine permit and individual NPDES permit application package covering construction, industrial, and process wastewater discharge. This permit was issued in August 2023 and will expire in August 2028. 17.1.4.2.1 Recommendations An amendment to the existing joint Mine/NPDES Permit is required for the ultimate build out of the estimated future permit boundary. To renew and/or modify the existing NDPES permit to encompass the estimated future permit boundary, the following is recommended: > An update to the issued USACE AJD/TDEC-DWR HD. > An updated informal consultation with USFWS and TDEC-Division of Natural Areas regarding state and federally protected species. > Because THC will also be offered a chance to review the application regarding historical properties and cultural resources near the project; HDR recommends the cultural desktop review mentioned above be included in the application. In addition, an alternatives analysis; site plan; water balance diagram; mining sequence and phasing layout; and erosion and sediment control measures, including treatment capacity calculations, identification of discharge locations, stormwater pollution prevention plan (SWPPP), and proposed water treatment methods will need to be provided to complete the NPDES part of the application. Results from evaluation of hazardous substances within process wastewater or processed tailings (i.e., dewatered tails or slimes) would be necessary as listed on the EPA Application Form 2D. 17.1.4.3 Tennessee Nongame and Endangered or Threatened Wildlife Species Conservation Act of 1974 Tennessee state-listed species are protected by the TDEC-Division of Natural Areas under the Tennessee Nongame and Endangered or Threatened Wildlife Species Conservation Act (TNWSCA). If a project has a state nexus, such as requiring a Section 401/ARAP permit from TDEC or state mining permit, the lead state agency is required to consult with the TDEC under the TNWSCA. A project without a state nexus TITAN PROJECT TENNESSEE, U.S. TECHNICAL REPORT SUMMARY ON FEASIBILITY STUDY Page 262 does not require TDEC consultation; however, it may still require a take authorization from TDEC. An applicant may also initiate informal consultation at any time with the TDEC to verify a project is compliant with the TNWSCA and whether the project might affect a state listed species. 17.1.4.3.1 Recommendations HDR performed habitat assessments in 2021 within the environmental due diligence study area. Because of the time that has passed since the initial assessment and because the estimated future permit area contains previously uninvestigated areas, HDR recommends field habitat assessments for the full estimated future mine area, including those areas previously investigated in the environmental due diligence study area. The TDEC will view parcels that will be mined as part of a “Larger Plan of Development” and prefers to view potential projects at an overall level as opposed to piecemealing parcels. Findings from these studies will be included in the NPDES/state mining permit and Section 401/ARAP permit applications. Formal consultation with the TDEC is not required until the Project triggers a state nexus, typically through impacts to waters of the state that require a Section 401/ARAP permit, or a NPDES/state mining permit. HDR recommends informal consultation with the TDEC occur early in Project development and prior to state permitting to determine if the Project will have an effect on state protected species and does not violate the TNWSCA. Informal consultation with the TDEC typically concludes within three to four months. 17.1.4.4 Clean Air Act The Tennessee Division of Air Pollution Control (TN APC) requires an entity proposing to construct an air contaminant source or modify an existing air contaminant source to obtain an air quality construction permit. Air contaminant sources are classified as major or minor sources depending on their potential to emit pollutants. Major sources include sites such as TVA power plants, chemical manufacturers, and large printing operations. The TN APC also requires an operating permit for facilities that have the potential to emit air pollutants. There are two operating permits, Title V and Non-Title V, and the appropriate permit is dependent upon the amount of air pollutants being produced by the facility. Emissions for the existing permit boundary were determined by TDEC to be below permitting thresholds (e.g., insignificant emission notification), however emissions projections for the expected future permit boundary have not been determined. Detailed Project operation scope is needed to clearly identify air contaminant sources and emission points (construction permit) as well as expected air pollutant emissions per year (operating permit). This information is required to determine which air permits are required and would be used to develop the TN APC air construction and operating permit application. As of the date of this FS, the Project is in a county that is in attainment for All Criteria Pollutants. TITAN PROJECT TENNESSEE, U.S. TECHNICAL REPORT SUMMARY ON FEASIBILITY STUDY Page 263 17.1.4.4.1 Recommendations Depending on the Project’s operation scope, a minor or major air construction permit may be required, and a Title V or Non-Title V operating permit may be required. HDR recommends coordinating with the TN APC to determine if, and which level of, air permitting is required. 17.1.4.5 Tennessee Mineral Surface Mining Law A facility that engages in mining and surface disturbance related to mining of certain minerals (clay, stone, phosphate rock, metallic ore, and other solid material or substances of commercial value found in natural deposits on or in the earth) must obtain a surface mining permit from the TDEC-DWR, Mining Section. The surface mining permit review typically takes 45 to 60 days after the application is deemed complete; however, its review and approval is tied to the longer NPDES permitting process. 17.1.4.5.1 Recommendations A surface mining permit has been acquired for the existing permit area boundary, along with the Individual NPDES permit. However, it will need to be amended to encompass the estimated future mine area. Concurrent submittal of the updated estimated future permit area NPDES individual permit and surface mining permit should occur. As part of a surface mining permit application, applicants must provide a copy or document source for the applicant’s legal right to enter and mine minerals on the land covered within the mine permit boundary. 17.1.4.6 Water Resources Information Act The TDEC-DWR monitors the withdrawal of surface water and groundwater within Tennessee. Water withdrawals of 10,000 gallons or more per day from either surface or groundwater must be registered with TDEC-DWR via their water withdrawal registration program. Estimated water needs for the full mine buildout within the Estimated Future Permit Boundary indicate that a water withdrawal exceeding 10,000 gallons per day from Big Sandy Creek will be necessary. An additional ARAP covering the water withdrawal will be necessary, and because the water will be drawn from a public surface water, Big Sandy Creek, an annual water withdrawal registration will be required. 17.1.4.6.1 Recommendations Water balance modeling has been completed for the estimated future permit boundary. Results show that the expected pit inflow has the potential to cover a significant portion of the process water needs (HDR, 2026), but the current water management plan assumes that the pit inflow water will be used as a secondary option to supplement water planned to be sourced from a water withdrawal point to be permitted along Big Sandy Creek. The water withdrawal registration permit will cover the greatest anticipated site need, with the pit inflow considered as supplemental. Further, 7Q10 flow of Big Sandy Creek needs to be determined for applicability of the general ARAP permit coverage; otherwise the Project would be covered under an individual ARAP. TITAN PROJECT TENNESSEE, U.S. TECHNICAL REPORT SUMMARY ON FEASIBILITY STUDY Page 264 17.1.5 Local Considerations The proposed mine site is located in unincorporated areas of Henry and Carroll Counties. These counties have no environmental ordinances governing erosion and sediment control or riparian buffer preservation. Floodplain development permitting would be obtained through a county floodplain administrator; however, the proposed mine site is not located within the 100-year floodplain and will not require floodplain permitting. 17.1.6 Mine Reclamation & Closure Tennessee state regulations require mines to be properly closed and reclamation commenced immediately upon abandonment. In general, site reclamation includes removal of structures, backfilling and replacement of topsoil, regrading, and revegetation of disturbed areas in accordance with the approved post-mining land use for the permit. Reclamation of surface mines includes backfilling and grading operations typically associated with the final pit. Reclamation requirements were incorporated into the contract mining operating costs based on information provided from permit maps, documents, and other information supplied by IperionX along with the mine plan prepared by MM&A. Reclamation requirements were based on both the currently approved permit associated with the proposed Titan Mine operations, as well as those future planned disturbance areas. None of the reclamation liabilities are expected to require perpetual treatment. The financial model for the Titan Project includes cost for mine reclamation and closure within the contract mining operating cost of US$5.23 per cubic meter. 17.2 Mineral Separation Plant Site – Regulatory Approval Process 17.2.1 Overview The MSP parcel, located in unincorporated Benton County, Tennessee, is approximately 21 Ha (52 acres) in extent. It is part of an industrial park; however significant development has yet to occur within the MSP parcel boundary. The MSP parcel boundary currently consists of active agricultural land and unmaintained forest. Land use in the vicinity of the area consists of industrial, agricultural, undeveloped forested land, and low-density residential land (Figure 17-2).


TITAN PROJECT TENNESSEE, U.S. TECHNICAL REPORT SUMMARY ON FEASIBILITY STUDY Page 265 Figure 17-2: Mineral Separation Plant Boundary Note: Prepared by HDR, 2026 TITAN PROJECT TENNESSEE, U.S. TECHNICAL REPORT SUMMARY ON FEASIBILITY STUDY Page 266 17.2.2 Baseline Studies A Phase I Environmental Assessment has been conducted for the MSP parcel, by the Breland Group, LLC dated February 12, 2024. Other than the 2024 study, no environmental due diligence studies have conducted for the MSP site. Given the lack of information of on-site conditions, all permitting should be considered potentially required and dependent on ground-truthed investigations. Site due diligence investigations that need to be completed for the MSP site to more accurately assess environmental permitting needs/risk are listed below with additional detail summarized in are summarized in Table 17-2: > stream and wetland delineation > cultural resources assessment > threatened and endangered species assessment Table 17-2: Titan Minerals IperionX Potential Environmental Permits/Authorizations for the MSP Site* Reviewed and Issued By: Permit /Authorization Name Anticipated Actions Estimated Timeline (If required) Federal (United States) United States Army Corps of Engineers (USACE) 404 Jurisdictional Determination Submittal of JD required for USACE review/verification of stream and wetland locations; JD required for CWA 404/401 permitting. 3 to 6 months (From start of delineation to issuance of JD) 404 Nationwide Permit (NWP) or Individual Permit (IP) Nationwide Permit required for impacts of up to 0.5 acres of WOTUS losses Individual Permit (IP) required for more than 0.5 acre of impacts to streams and wetlands per USACE Nashville Regulatory District Regional Conditions NWP: 3 to 6 months (From start of permit preparation to issuance) IP: 12 to 18 months (From start of permit preparation to issuance) United States Fish and Wildlife Service (USFWS) Consultation regarding Endangered Species Consultation occurs as part of the 404/NPDES Process Occurs concurrently with USACE and NPDES Permit process Tennessee Historical Commission Consultation regarding Architectural and Archaeological Resources Consultation occurs as part of the 404/NPDES Process Occurs concurrently with USACE and NPDES Permit process State (Tennessee) TDEC Division of Water Resources NPDES Construction Stormwater Permit An industrial facility must apply for a NPDES general permit to authorize stormwater runoff during construction (e.g., ES&C phase). 1-3 months from start of permit prep to Notice of Coverage issuance TDEC Division of Water Resources NPDES Multi-Sector General Permit for Industrial Activities An industrial facility must apply for a NPDES general permit to authorize discharge of process wastewater at the site to the ground as well as stormwater runoff during operations of the facility. 1-3 months from start of permit prep to Notice of Coverage issuance TITAN PROJECT TENNESSEE, U.S. TECHNICAL REPORT SUMMARY ON FEASIBILITY STUDY Page 267 Reviewed and Issued By: Permit /Authorization Name Anticipated Actions Estimated Timeline (If required) TDEC Air Pollution Control Insignificant Emission Documentation 1 month for emission documentation; No review timeline. Air Quality Construction Permit (Minor or major) Minor: 2-4 months (agency review) Major: 5-12 months (agency review) Air Quality Operating Permit (Title V or non-Title V) Non-Title V: 2-4 months (agency review) Title V: 9-18 months (agency review) TDEC Division of Water Resources TDEC Hydrologic Determination (HD) Delineate site and apply for HD 3 to 6 months (From start of new/updated delineation to issuance of HD) TDEC Division of Water Resources Clean Water Act Section 401 Water Quality Certification/Aquatic Resources Alteration Permit (ARAP) 3 to 6 months (From start of permit preparation to issuance of ARAP) TDEC Division of Water Resources Underground Injection Control Permit 60 days to 6 months Tennessee Division of Radiological Health Radioactive Material License 60-120+ days depending on level of complexity (agency review) Tennessee Division of Solid Waste Management Treatment, Storage, and Disposal Facility Permit Identify volume and composition of waste slimes and sand tailings OR contract with licensed disposal facility 6-21 months (From start of permit preparation to issuance of TSDF permit) Local (unincorporated Benton County) No local environmental permitting will be necessary * Studies and permit applicability are dependent on, at a minimum, the recommended baseline studies being performed and final design of the MSP facility. 17.2.3 Federal Statutes and Approvals 17.2.3.1 Clean Water Act Section 404 – Mineral Separation Plant Site The discharge of dredged or fill material into a WoTUS is regulated by the USACE and requires authorization under Section 404 of the Clean Water Act (Section 404 permit). The appropriate Section 404 permit (NWP or IP) is dependent upon the magnitude of impacts to WoTUS from a project. Impacts must be below a minimum threshold to qualify for coverage under the NWP program. Impacts that exceed NWP thresholds require an IP. Note, the USACE has the discretion to elevate projects to an IP; however, it would be unlikely if a project can be authorized under an NWP. Verification under a NWP typically takes three to six months whereas authorization under an IP can take eight to 18 months. 17.2.3.1.1 Recommendations A review of aerial imagery and the USGS 7.5-minute 24,000 topographic quadrangle (Dyersburg, TN) reveals a series of ponds within a drainage in the central portion of the MSP boundary that appears to drain to Cain Creek, which runs along the eastern MSP boundary. The preliminary MSP layout appears to be located in an upland area based on a review of aerial imagery and available site topography (refer to Figure 17-2); however no onsite stream/wetland delineation has been conducted, so the exact location of any potentially jurisdictional waters is unknown, and the ultimate jurisdictional status of any on-site waters has yet to be determined by the USACE. A CWA 404 permit may still be required for the MSP depending on the results of the field delineation, USACE determination, and ultimate MSP site disturbance. Delineation field work and USACE verification are recommended prior to any significant TITAN PROJECT TENNESSEE, U.S. TECHNICAL REPORT SUMMARY ON FEASIBILITY STUDY Page 268 design and permitting pursuits. Verification of potential WoTUS from the USACE Nashville District will expedite the development of future Section 404 permit applications if design cannot avoid WOTUS impacts. 17.2.3.2 National Historical Preservation Act The NHPA defines historic properties as buildings, structures, sites, districts, or objects listed or eligible for listing in the NRHP. Under Section 106 of the NHPA, federal agencies are required to assess the effects of a project on historic properties. As such, if a project has a federal nexus, the lead federal agency is required to initiate Section 106 consultation with a state’s HPO, which in Tennessee is the THC. If a project does not have a federal nexus, informal consultation with THC may be requested to verify no historical properties or cultural resources would be impacted by the project; however, as of early 2026, THC is not providing concurrence or review unless requested by a lead agency. 17.2.3.2.1 Recommendations Desktop-level cultural resource studies should be performed on parcels where impacts from the Project are anticipated. Findings from these studies will include recommendations for NHPA compliance, if applicable, once MSP design progresses (e.g., site layout). This information may be included in the NPDES and Section 404 permit application, if applicable. 17.2.3.3 Endangered Species Act Section 7 or 10 Federally listed species are protected by the USFWS under the ESA. If a project has a federal nexus, such as requiring a Section 404 permit from the USACE, the lead federal agency is required to consult with the USFWS under Section 7 of the ESA. A project without a federal nexus does not require formal Section 7 consultation; however, it may still require an Incidental Take Authorization under Section 10 of the ESA to allow for the “take” of a federally listed species. An applicant may also initiate informal consultation at any time with the USFWS to verify a project is compliant with the ESA and will have “no effect” or “may affect and is not likely to adversely affect” federally protected species. 17.2.3.3.1 Recommendations Per the USFWS IPaC website, the following federally protected species may occur within the MSP site or surrounding area: > gray bat (Myotis grisescens, endangered) > tricolored bat (Perimyotis subflavus, proposed endangered) > whooping crane (Grus americana, experimental population/non-essential) > alligator snapping turtle (Macrochelys temminckii, proposed threatened) > longsolid (freshwater mussel, Fusconaia subrotunda, threatened) > pink mucket (freshwater mussel, Lampsilis abrupta, endangered) > monarch butterfly (Danaus Plexippus, proposed threatened)


TITAN PROJECT TENNESSEE, U.S. TECHNICAL REPORT SUMMARY ON FEASIBILITY STUDY Page 269 No field habitat assessments have been performed in the MSP site. Formal Section 7 consultation with the USFWS is not required until the Project triggers a federal nexus, typically through impacts to WoTUS that require a Section 404/401 permit. However, TDEC-DWR may provide the USFWS with the NPDES application for its review and comment during the public comment period. Therefore, HDR recommends informal consultation with the USFWS occur early in Project development and prior to NPDES permitting to determine if the Project will have “no effect” or “may affect and will not adversely affect” protected species and does not violate the ESA. HDR recommends tree clearing occurs only in winter months (November 16 to March 31) to avoid affecting federally protected bat species. Informal consultation with the USFWS typically concludes within three to four months. Field habitat assessments for MSP area are recommended, and findings from these studies would include recommendations for species-specific surveys should potential habitat for federally listed species be identified within the MSP Site. The results will also detail out the specific survey window(s) (e.g., a specific time of year) during which species-species surveys must be performed. This data may be included in the NPDES and Section 404 permit application, if applicable. Further, it is recommended that design-based strategies be implemented to avoid impacts to federally protected species’ habitat and/or their habitat. Should there be impacts to a federally listed species or their habitat, a formal consultation with USFWS may be required. Formal consultation may require a Biological Assessment to evaluate applicability of an incidental take permit. 17.2.3.4 Migratory Birds Treaty Act 16 USC 703-712; The Bald and Golden Eagle Protection Act The MBTA was discussed in Section 17.1.3.4. No field habitat assessments were performed in the MSP site. Formal Section 7 consultation with the USFWS is not required until the Project triggers a federal nexus. The USFWS may be pulled in for comment during the NPDES public comment period. HDR recommends informal consultation with the USFWS occur early in Project development and prior to USACE permitting to verify compliance with the MBTA and BGEPA. This data may be included in the NPDES and Section 404 permit application, if applicable. According to the USFWS IPaC, the migratory bird nesting season is September 1 to April 1. USFWS would recommend avoiding tree clearing during this window as a best management practice to avoid/reduce affecting migratory birds and their nests and eggs. In addition, bald or golden eagle nests should be avoided. If tree clearing must occur within the migratory bird nesting season, USFWS may request (or require if there is a federal nexus) MBTA surveys be conducted within one week (seven days) of tree clearing activities to identify active nests and avoidance buffers. 17.2.4 State Statutes and Approvals 17.2.4.1 Clean Air Act The requirements under the TN APC were summarized in Section 17.1.4.4. TITAN PROJECT TENNESSEE, U.S. TECHNICAL REPORT SUMMARY ON FEASIBILITY STUDY Page 270 Detailed Project operation scope is needed to clearly identify air contaminant sources and emission points (construction permit) as well as expected air pollutant emissions per year (operating permit). The required air permitting for the MSP will be dependent on final MSP feed capacity, ore inputs, point source emissions, fugitive sources, and associated mitigative technologies. This information will be used to develop the applicable TN APC air construction and operating permit application. As of the date of this Report, the Project is in a county that is in attainment for All Criteria Pollutants. Depending on the final MSP operations, a minor or major air construction permit may be required, and a Title V or Non-Title V operating permit may be required. HDR recommends coordinating with the TN APC to determine if, and which level of, air permitting is required. 17.2.4.2 Clean Water Act Section 401 The TDEC-DWR requirements were summarized in Section 17.1.4.1. Recommendations made in Section 17.2.3.1.1 also apply to this sub-section. The exact location of any potentially jurisdictional waters is unknown, and the ultimate jurisdictional status of any on-site waters has yet to be determined by TDEC. A CWA 401 permit/ARAP may still be required for the MSP depending on the results of the field delineation, TDEC hydrologic determination, and ultimate MSP site disturbance. Delineation field work and TDEC verification are recommended prior to any significant design and permitting pursuits. Verification of potential waters of the state from the TDEC will expedite the development of future Section 401 permit/ARAP applications if design cannot avoid waters of the state impacts. 17.2.4.3 Tennessee Nongame and Endangered or Threatened Wildlife Species Conservation Act of 1974 A summary of the TNWSCA was provided in Section 17.1.4.3. Field habitat assessments within the MSP boundary have not been performed. A field habitat assessment is recommended prior to any significant permitting and design pursuit. Findings from the habitat assessment may be included in the NPDES/state mining permit and Section 401/ARAP permit applications, if applicable. Formal consultation with the TDEC is not required until the Project triggers a state nexus, typically through impacts to waters of the state that require a Section 401/ARAP permit, or a NPDES/state mining permit. Therefore, it’s recommended that informal consultation with the TDEC occur early in Project development and prior to state permitting to determine if the Project will have an effect on state protected species and does not violate the TNWSCA. Informal consultation with the TDEC typically concludes within three to four months. 17.2.4.4 Clean Water Act Section 402 A summary of the requirements under the TDEC DWR was provided in Section 17.1.4.2. TITAN PROJECT TENNESSEE, U.S. TECHNICAL REPORT SUMMARY ON FEASIBILITY STUDY Page 271 Neither NPDES construction nor industrial permitting has occurred for the MSP site. To apply for NDPES permit coverage for MSP Boundary, the following is recommended: > a field stream and wetland delineation and USACE AJD/TDEC-DWR HD > informal consultation with USFWS and TDEC-Division of Natural Areas regarding federal and state protected species, respectively > because THC will also be offered a chance to review the application regarding historical properties and cultural resources near the project; HDR recommends a cultural desktop review mentioned above be included in the application In addition, an alternatives analysis; site plan; and erosion and sediment control measures, including treatment capacity calculations, identification of discharge locations, stormwater pollution prevention plan, and proposed water treatment methods will need to be provided for a complete NPDES permit application. It is recommended that the NPDES permit application includes a final operational process flow diagram. 17.2.4.5 Tennessee Mineral Surface Mining Law A Tennessee surface mining permit will not be required for the MSP as it does not involve mining activity. 17.2.4.6 Safe Drinking Water Act of 1974 The discharge of industrial or commercial waste or stormwater into a subsurface system is required to obtain an underground injection control permit from the TDEC-DWR. Well injection types are classified into six classes: (I) deep well industrial, (II) oil field brine, (II) mineral extraction, (IV) hazardous waste, (V) shallow and non-hazardous, and (VI) geo-sequestration of carbon dioxide. Class I, III, or V permits may be applicable to the Project depending on the operation scope. Depending on well injection type (class), the permit could be issued within 60 days to six months. 17.2.4.6.1 Recommendations As there is a nearby sewer available and assuming the MSP liquid effluent meets discharge standards, an injection permit is unlikely to be needed. 17.2.4.7 Water Resources Information Act A summary of the requirements under this Act was provided in Section 17.1.4.6. Municipal water is available at the site, so a water withdrawal registration will not be required. 17.2.4.8 Resource Conservation and Recovery Act A Phase I Environmental Assessment was conducted for the MSP parcel, by the Breland Group, LLC dated February 12, 2024. It included an exhaustive review of documents related to the existence of hazardous TITAN PROJECT TENNESSEE, U.S. TECHNICAL REPORT SUMMARY ON FEASIBILITY STUDY Page 272 materials on or near the MSP site. No records of hazardous material releases were documented, and no recognized environmental conditions were noted (RECs). The potential for production of hazardous waste exists, depending upon the ultimate composition of waste slimes and sand tailings and final monthly generation rates, the MSP could be classified as a very small, small, or large quantity generator (VSQG, SQG, LQG), which determines allowable on-site storage time limits for generated hazardous wastes (RCRA Hazardous Waste Disposal in Tennessee). Storage beyond accumulation limits and on-site treatment and disposal of produced hazardous waste would require the MSP to be permitted via a treatment, storage, and disposal facility (TSDF). 17.2.4.8.1 Recommendations Because pre-application planning for a TSDF permit can take anywhere from 6-18 months and the logistical difficulty of operating the MSP as a TSDF, a TSDF permit is not recommended for the MSP It is recommended that IperionX contracts with a licensed and permitted TSDF for the storage and disposal of any hazardous waste produced beyond the VSQG, SQG, or LQC allowable limits, if applicable. 17.2.4.9 TDEC Rules Chapter 0400-20-10 – Licensing and Registration In Tennessee, obtaining a Radioactive Material License depends mainly on which type of license is needed and the complexity of the proposed use. Tennessee is a US Nuclear Regulatory Commission (NRC) Agreement State, so licenses are issued by TDEC’s Division of Radiological Health (DRH) under state regulations (Chapter 0400-20-10). 17.2.4.9.1 Recommendations IperionX previously engaged Perma-Fix to develop radiation management plans and a radiation protection program procedure. Typically, a Specific Radioactive Material License will be issued within 60 days of receipt of an adequate application and/or adequate response(s) from the applicant as determined by the reviewer, IperionX plans to apply for a radioactive material license upon the start of construction. 17.2.5 Local Considerations The MSP is proposed for an unincorporated portion of Benton County. This county has no environmental ordinances governing erosion and sediment control or riparian buffer preservation. Floodplain development permitting would be obtained through a county floodplain administrator; however, the MSP is not located within the 100-year floodplain and will not require floodplain permitting. 17.3 Summary and Conclusions for Mine Site and MSP Regulatory and Approval Process The permits likely required for the Mine Site’s Estimated Future Permit Area are summarized in Table 17-1 (Section 17.1.1). Table 17-2 provides a summary of permits that should be evaluated for the MSP site.


TITAN PROJECT TENNESSEE, U.S. TECHNICAL REPORT SUMMARY ON FEASIBILITY STUDY Page 273 17.3.1 Mine and WCP Site The following studies are recommended for the Mine and WCP Site: > re-review of existing field delineation of federal and state waters and add area not yet investigated > re-review of existing field habitat assessments of federal and state protected species and add area not yet investigated; species-specific surveys may be recommended > update of desktop level cultural resources assessment > informal consultations with USFWS, TDEC, and THC > update to USACE AJD verification (WoTUS) > update to TDEC-DWR HD concurrence (waters of the state) > pre-application meeting with USACE and TDEC-DWR as the Mine Site will likely result in Section 404/401 Individual Permit, and thus trigger a NEPA review 17.3.2 Mineral Separation Plant Site The MSP area is expected to require, at minimum, NPDES construction and industrial permits. The following studies are recommended to assist with the progression of site layout design and to avoid and/or minimize permits that may be required: > field delineation of federal and state waters > field habitat assessments of federal and state protected species > desktop level cultural resources assessment > informal consultations with USFWS, TDEC, and THC As part of the NPDES permitting process, TDEC-DWR will post a Public Notice and provide a comment period during which the USACE, USFWS, THC, and other state agencies may review and comment on the project. As such, HDR recommends the following be obtained following completion of the above recommended studies for the MSP: > USACE AJD verification (WoTUS) > TDEC-DWR HD concurrence (waters of the state) > USFWS informal consultation, including MBTA and BGEPA > THC coordination (Please note as mentioned above, THC will not likely provide a determination or concurrence until requested by a lead agency; however, by providing the finished desktop review, it should streamline THC’s review and alleviate questions during the commenting period.) > Determine ultimate composition and volume of waste slimes and sand tailings TITAN PROJECT TENNESSEE, U.S. TECHNICAL REPORT SUMMARY ON FEASIBILITY STUDY Page 274 A more accurate evaluation of the potentially required permits will be possible following consideration of results from the recommended studies and meetings with the associated agencies. Given that IperionX has been granted a mining permit (OM-70711-01), including NPDES outfall locations (TN0070711), within the last five years (August 2023) for the area encompassing approximately the first five years of mining, it is reasonable to conclude that future permits will be attainable. While there is risk associated with future permitting of the project, as there is with all mining projects, the currently available information does not suggest that permitting will be unattainable. In order to more accurately evaluate the potential required permits for the MSP, a site civil design, stormwater management plan, and final process flow diagrams depicting final operational inputs/outputs for solids, liquids, and air are needed. 17.4 Waste and Tailings Disposal 17.4.1 Overview The waste and tailings disposal plan is fully integrated with the overall mine plan. IperionX is committed to responsible tailings management through implementation of the Global Industry Standard on Tailings Management (GISTM), adherence to leading international standards and best practices for Tailings Storage Facility (TSF) management during temporary storage periods, and the minimization of impacts and risks through responsible site selection, design, construction, operation, and closure practices. IperionX also commits to avoiding riverine and submarine tailings disposal methods, as all tailings are expected to be backfilled into the pit as the mining progresses. At the beginning of mining, waste and tailings material will be placed, as needed, in temporary waste piles on the ground surface located 1.) in the Year 11 mining area and 2.) in the area northeast of the WCP (Figure 17-3). Tailings material will be filtered at the WCP to an optimum moisture content of approximately 16 to 18 percent. Temporary, out-of-pit waste storage areas are estimated to only be required up to approximately Year 5 of mining, after which all tailings and waste material will be backfilled into the pit as mining progresses. Material identified in the pit as waste will be trucked directly to the pit area that is being backfilled at the time. Ore material will be extracted, trucked out of the pit to a stockpile near the edge of the mine, and then placed on a two-way conveyor to be transported to the plant. Filtered tailings will be placed on the two-way conveyor at the plant and transported back to the edge of the pit, from which the tailings will be loaded into trucks and transported into the backfilling area of the pit. Backfilling with waste and tailings material will be done in lifts of approximately up to 1.22 m (4 feet) or larger. The backfilled waste and tailings will be confined by the edges of the pit and the open face of the tailings backfill structure will be maintained according to geotechnical standards defined in this report. As needed, buildup of groundwater in the tailings backfill structure will be monitored and pumped down with wells in the tailings. Water seepage from the toe of the tailings face will be collected in the pit sump and pumped out to settling/pit discharge ponds where it will either be pumped to the WCP, if needed, or discharged through permitted NPDES points. TITAN PROJECT TENNESSEE, U.S. TECHNICAL REPORT SUMMARY ON FEASIBILITY STUDY Page 275 Figure 17-3: Map of Mine Plan Sequence Indicating Locations for Temporary Waste Piles Note: Figure prepared by MM&A, 2026. 17.4.2 Tailings Placement A detailed description of geotechnical assessment of the tailings is included in Section 13. The expected geotechnical properties of the tailings material were assessed as described in a report by S&ME titled “Report of Engineering Services – Titan Heavy Mineral Sands Project – Tailings Slope, Camden Tennessee, S&ME Project No. 22350271B”, submitted to IperionX on August 27, 2025. The tailings placement will be completed using lifts of approximately up to four feet (1.22 m) or thicker, which are expected to be stable at bench slopes of 2.5 horizontal:1 vertical (21.8-degrees). Placement in five to ten feet thick lifts may not achieve the optimum compaction estimated by laboratory analysis; however, 3D slope stability analysis of the tailings indicates that the material will be stable as long as the water table in the tailings is not allowed to build up to within approximately 12.2 m (40 feet) of the tailings surface. Water level monitoring in the tailings structure and pumping, as necessary, will be implemented in the advancing pit. 17.4.3 Tailings and Waste Material Characterization Waste and tailings material were classified using both standard static testing procedures, as well as analyzing water associated with the planned material processing (from a pilot plant). The planned mine has already received a mining permit from the State of Tennessee, including NPDES outfalls. The permitted outfalls are authorized for discharge of treated mine wastewater and stormwater, TITAN PROJECT TENNESSEE, U.S. TECHNICAL REPORT SUMMARY ON FEASIBILITY STUDY Page 276 with limits for total suspended solids (TSS), pH, iron (total), zinc (total), and flow rate (report only). The requirements for the permitted NPDES outfalls are based on detailed water quality analysis conducted on process water produced from a pilot plant. The analysis of the process water constitutes a kinetic test of potential environmentally available contaminants from the proposed operation. In addition to the testing of process water completed for the currently permitted NPDES outfalls, acid base accounting (ABA) and toxicity characteristic leaching potential (TCLP) tests were completed on samples of representative material from each major geologic unit, as well as sand and slimes tailings samples. Samples of sand and slimes tailings were collected from materials produced from pilot plant work completed by IperionX. Representative, composite samples of the major geologic units were collected during geotechnical exploration work completed by S&ME in 2025. Table 17-3: Summary of Acid-Base Accounting (ABA) Test Results Sample Depth Interval (ft) Notes Paste pH NP tons CaCO3/1000 tons AP or MPA tons CaCO3/1000 tons NNP NP/AP Ratio Total Sulfur (%) Sulfide (%) Sand Tailings NA - 8.8 1 0.31 0.69 3.2 0.017 <0.01 Slimes Tailings NA - 6.99 1.7 0.31 1.39 5.44 0.005 <0.01 MB-34-Overburden 1-6.5 Orange unit noted just below; likely weathered 5.67 -0.9 0.44 -1.34 -2.06 <0.005 0.01 MB-46-Overburden 0-8.0 Brown and orange-brown 5.44 -4 0.31 -4.31 -12.8 0.016 <0.01 MB-34-Upper McNairy 8.5-15 Shallow; likely weathered; orange and yellow noted in unit 6.33 0 0.31 -0.31 0 <0.005 <0.01 MB-46-Upper McNairy 8.0-92.0 Orange-brown to light gray white 6.8 -0.4 0.31 -0.71 -1.28 <0.005 <0.01 MB-34-Lower McNairy 23.5-50 Mica and orange noted in interval 6.49 -0.5 0.31 -0.81 -1.6 <0.005 <0.01 MB-46-Lower McNairy 92-167 Light gray, white to yellow gray 6.39 -0.9 0.31 -1.21 -2.88 0.006 <0.01 MB-12-Coon Creek 103.5-120 Sample interval is base of Lower McNairy and top of Coon Creek 5.83 0.5 2.09 -1.59 0.24 0.073 0.07 MB-34-Coon Creek 58.5-65 soft and dark gray 4.94 -1.1 13 -14.13 -0.08 0.487 0.42 MB-46-Coon Creek 167-175 dark gray 5.54 4.2 5.41 -1.21 0.78 0.225 0.17 Notes: NP = Neutralization Potential AP = Acid Potential MPA = Max Potential Acidity NNP = Net Neutralization Potential (NP-AP=NNP) Total Sulfur% = Includes Sulfide, Sulfate, and Organic Sulfide % = Reacts to Form AMD: Basis for AP Results of the ABA testing indicate that the tailings, overburden, and McNairy Formation sands do not have much, or in many cases, any alkaline buffering capacity, but they also do not contain problematic sulfur (sulfide). The tailings, overburden, and McNairy Formation sands are not expected to result in problematic conditions, including acid rock drainage (ARD). The Coon Creek Formation has no alkalinity, but also contains some sulfide. While the ABA testing indicates that the Coon Creek Formation has the potential to create some acidic drainage, the unit will


TITAN PROJECT TENNESSEE, U.S. TECHNICAL REPORT SUMMARY ON FEASIBILITY STUDY Page 277 only be exposed at the bottom of the pits and mining will intentionally avoid it in most cases due to higher slimes. During mining, there may be need for some pH control for water that contacts the Coon Creek Formation at the pit bottom as part of the comprehensive ARD management. The pH control, if necessary, would be applied in ponds that collect the pit discharge. Under post-mining conditions, the Coon Creek Formation at the bottom of the pits will be covered with tailings and water and will be in a predominantly anoxic environment that will inhibit the potential for acidic drainage generation. TCLP results for the major geologic units, sand tailings, and slimes tailings are summarized in the table below. TCLP testing is frequently used to assess parameter leachability and for classification of waste material as hazardous or non-hazardous under the Resource Conservation and Recovery Act (RCRA). The TCLP test involves acceleration of the leaching process in a controlled environment. It is often considered a "worst case" test and the results can be compared to the EPA's D List. Determination that a material is "non-hazardous" via the TCLP test provides important information for assessing environmental risk associated with the waste/tailings disposal facility. Table 17-4: Summary of TCLP Testing with EPA D List “Toxicity” Threshold Values Sample Depth Interval (ft) Mercury (Hg) (mg/L) Arsenic (As) (mg/L) Barium (Ba) (mg/L) Cadmium (Cd) (mg/L) Chromium (Cr) (mg/L) Lead (Pb) (mg/L) Selenium (Se) (mg/L) Sand Tailings NA <0.00001 <0.002 0.0148 0.00005 0.0026 0.0039 <0.0004 Slimes Tailings NA <0.00001 <0.002 0.315 0.00015 0.0017 0.003 <0.0004 MB-34-Overburden 1-6.5 <0.00001 0.002 0.506 0.00005 0.0018 0.0032 0.0005 MB-34-Upper McNairy 8.5-15 <0.00001 <0.002 0.0511 0.00003 0.001 0.0032 0.0004 MB-34-Lower McNairy 23.5-50 <0.00001 <0.002 0.0444 0.00003 0.0026 0.0036 <0.0004 MB-34-Coon Creek 58.5-65 <0.00001 0.003 0.138 0.00074 0.0016 0.012 0.0027 EPA D List - Thresholds for "Toxicity" 0.2 5.0 100.0 1.0 5.0 5.0 1.0 Results of the TCLP testing indicate that all of the subject materials exhibit concentrations that are well below D List threshold values for typical parameters of concern. In addition to the characterization testing described above, IperionX has conducted detailed mineral analyses of hundreds of samples via QEMSCAN. 17.5 Site Monitoring IperionX has already acquired a mining permit with NPDES outfalls for the initial area of mining (see “RE: Issuance of NPDES Permit and Mining Permit” from State of Tennessee Department of Environment and Conservation – Knoxville Environmental Field Office – Mining Section, with permit documentation received by IperionX on August 14, 2023). As discussed in other sections of this report, the mining permit and permitted NPDES outfalls will require renewal and expansion over the life of the mine. Anticipated monitoring for the mine site includes the NPDES outfalls that are, or will be (future mine area), located in positions that allow for both pumping of water from the mining pits to the ponds and discharge of water from the ponds through the NPDES outfalls. As described in the current permit information, the NPDES outfalls will be monitored with limits for TSS, pH, iron (total), zinc (total), and flow rate (report only). Monitoring points authorized in the current permit are described in the tables below. TITAN PROJECT TENNESSEE, U.S. TECHNICAL REPORT SUMMARY ON FEASIBILITY STUDY Page 278 Table 17-5: Monitoring Point Summary for Current NPDES Permit (TN0070711) Monitoring Point Type of Monitoring Point Receiving Stream 001, 002, 003, 004 Wastewater (See Part I.A) Unnamed Tributary to Big Sandy River 005 Wastewater (See Part I.A) Unnamed Tributary to Bear Creek SW-1 Storm Water (See Part 1.B) Unnamed Tributaries to Big Sandy River Table 17-6: Outfall Locations for Current NPDES Permit (TN0070711) Outfall No. Receiving Water Name Latitude Longitude 001 WWC-UNT Big Sandy 36° 07' 42.57" N 88° 12' 32.61" W 002 WWC-UNT Big Sandy 36° 08' 02.40" N 88° 11' 59.33" W 003 WWC-UNT Big Sandy 36° 08' 13.80" N 88° 11' 49.78" W 004 WWC-UNT Big Sandy 36° 08' 11.25" N 88° 11' 42.10" W 005 WWC-UNT Bear Creek 36° 08' 36.58" N 88° 13' 08.50" W SW1 WWC-UNT Big Sandy 36° 08' 24.72" N 88° 11' 58.08" W Wastewater limitations, as defined in the current permit, are as follows. Table 17-7: Wastewater Limitations for NPDES Outfalls as Defined in Current Permit Parameter Daily Minimum Daily Maximum Monthly Average Monitoring Frequency Sample Type Outfalls 001, 002, 003 & 004 Total Suspended Solids N/A 30 mg/L 20 mg/L Twice per Month Grab pH 6.0 SU 9.0 SU N/A Twice per Month Grab Iron, Total N/A 2.0 mg/L 1.0 mg/L Twice per Month Grab Zinc, Total N/A 1.0 mg/L 0.50 mg/L Twice per Month Grab Flow Report (MGD) Report (MGD) Report (MGD) Twice per Month Instantaneous Outfall 005* Total Suspended Solids N/A 30 Mg/L 20 mg/L Twice per Month Grab pH 6.0 SU 9.0 SU N/A Twice per Month Grab Iron, Total N/A 2.0 mg/L 1.0 mg/L Twice per Month Grab Zinc, Total N/A 1.0 mg/L 0.50 mg/L Twice per Month Grab Whole Effluent Toxicity (IC25) Survival and reproduction in 100% Effluent Once per Year Composite Flow Report (MGD) Report (MGD) Report (MGD) Twice per Month Instantaneous *No later than six months after the commencement of discharge from the processing area (Outfall 5), the permittee is required to collect an effluent sample from Outfall 005 and have it analyzed for the parameters in EPA Form 2C, Table B, Section 1 (Toxic Metals, Cyanide, and Total Phenols) and Section 3 (Organic Toxic Pollutants (GC/MS Fraction – Acid Compounds)). These sample results shall be submitted to the Division for RPA analysis as soon as practicable. Sampling at the NPDES outfalls will be done at the following sampling frequencies, as defined in the permit. > Twice a month samples shall be taken once during the first half and once during the second half of the month (e.g., second and fourth Wednesdays) unless a discharge occurs prior to the sampling period. > Quarterly samples of the discharge shall be taken on any one day of the quarter. > Twice per year samples shall be taken once during the first half of the calendar year (January to June) and once during the second half of the year (July to December). > Yearly samples of the discharge shall be taken on any one day of the calendar year. In addition to wastewater monitoring, the existing permit requires monitoring and reporting of stormwater discharges. Requirements for stormwater discharge sampling are summarized in the table below. TITAN PROJECT TENNESSEE, U.S. TECHNICAL REPORT SUMMARY ON FEASIBILITY STUDY Page 279 Table 17-8: Stormwater Discharge Requirements Parameter Benchmark Minimum Benchmark Maximum Monitoring Frequency Sample Type SW1 Total Suspended Solids N/A 150 mg/L Annually Grab pH 6.0 SU 9.0 SU Annually Grab Oil and Grease* N/A 15 mg/L Annually Grab *Note: If the storm water discharge is from an area not associated with an access road or haul road or is not a source for vehicular traffic, monitoring for Oil and Grease is not required. Sampling of stormwater is to be done according to the following guidelines: > Samples shall be collected from discharges resulting from a storm event that is greater than 0.1 inch in magnitude and that occurs at least seventy-two (72) hours after any previous storm event of 0.1 inch or greater. > Grab samples shall be collected as soon as practicable during a storm event discharge. > The exact location of the sampling must be recorded. > The duration (in hours), starting and ending times, and magnitude (in inches) of the storm event must be recorded. Reporting of results for all monitoring and sampling should include: > date, exact place, and time > name of person collecting the sample > date analyses were performed > names of people involved in the analyses > analytical techniques and methods > result values Additional details for wastewater and stormwater limitations, monitoring requirements, and reporting requirements are included in the permit documentation. The current permit also specifies that IperionX will conduct 7-day static renewal chronic whole effluent toxicity (wet) tests annually on samples of final effluent from a specified outfall (Outfall 005), in compliance with EPA-821-R-02-013 (or most current edition). 17.6 Partnership with University of Tennessee’s Institute of Agriculture IperionX is partnering with the University of Tennessee Institute of Agriculture (UTIA) to research the implementation of sustainable operating and rehabilitation practices at the Titan Project in West TITAN PROJECT TENNESSEE, U.S. TECHNICAL REPORT SUMMARY ON FEASIBILITY STUDY Page 280 Tennessee. The University of Tennessee (UT) is the flagship university in the state of Tennessee, and UTIA is at the forefront of agribusiness research, education, and community outreach. The Titan Project will include programs focused on post-mineral extraction practices and carbon sequestration opportunities for generational land-use benefits for local landowners. The initial scope of work will focus upon the elimination of invasive vegetation and subsequent improved ecological revegetation using native warm season grasses, undertaken on IperionX’s owned properties. IperionX and UTIA, with aid from county UT extension offices, has established a 2.8-Ha (7-acre) native site at the Titan Project for UTIA’s use for the initial scope of work, with the potential for the site to be used for additional sustainability investigations, including the use of biochars, gypsum and other soil amendments to aid in higher crop yields and the carbon sequestration. Activities include: > soil sampling of site to assess soil pH and fertilizer needs: sampling implemented in June 2022; fertilizer to be applied after stand-establishment > labor and custom hire for herbicide application for elimination of native and exotic weed populations over Titan site in preparation for seeding: implemented in July 2023 and May 2024 > labor and custom hire for site preparation and tillage for seed bed: implemented in August 2023 and May 2024 > labor and custom hire for seeding of 3 species native warm season grass mix; big blue stem, little bluestem, Indian grass: implemented in August 2023 and May 2024 > control of weed species on an as necessary basis after germination: not necessary in 2024 > application of biochar as a soil amendment: implemented in August 2025 17.7 Community Relations IperionX continues to maintain relationships with the Tennessee Valley Authority (TVA), TDEC, local and state government representatives, local educational systems, universities, technical institutes, business owners, local municipalities, and community members. IperionX will continue discovering and establishing relationships with new groups and stakeholders. IperionX informed MM&A that the company's goal is to leave a legacy of operational excellence by maintaining positive and sustainable industry standards, trustworthy communications, and mutually beneficial opportunities, with a focus on local employment and workforce training. IperionX has funded Science, Technology, Engineering, and Mathematics (STEM)-related projects, awarded scholarships, supported a number of community projects, held discussions at local educational institutions, and various community groups. IperionX stated that it intends to maintain its open-door and transparent standards. Table 17-9 provides a summary of the community relations activities completed as of the Report date.


TITAN PROJECT TENNESSEE, U.S. TECHNICAL REPORT SUMMARY ON FEASIBILITY STUDY Page 281 Table 17-9: Community Relations Activities List Date Organization/Event IperionX Community Relations Activity 20-Jan-2021 Benton County officials First introduction to IperionX 29-Jan-2021 WRJB radio Interview 15-Feb-2021 Benton County Commission Meeting with County Commission 10-Mar-2021 Carroll County officials Meeting with Carroll County officials 11-Mar-2021 Henry County officials Meeting with Henry County officials 17-Mar-2021 Community IperionX office grand opening 28-Mar-2021 Veterans Honor Guard Donation 20-Apr-2021 Benton County school officials Meeting with school officials 25-May-2021 Benton County officials Meeting with Benton County officials 8-Jun-2021 West TN Bass Tournament IperionX information booth/sponsor 1-Jul-2021 Governors Meeting with TN government 20-Jul-2021 PGS Community Forum hosted by PGS 1-Aug-2021 TN Achieves Mentor Program Volunteer 4-Aug-2021 TN Governors Conference Attendance at the TN Governors Conference 18-Aug-2021 Benton County High School Academic Banquet Attendance 24-Aug-2021 Benton County Fair IperionX Information booth/lawnmower race sponsor 1-Sep-2021 University of Knoxville Meeting with President Randy Boyd 12-Oct-2021 University of Knoxville Meeting with UTK Professors 28-Oct-2021 First Responders Dinner Hosted dinner 31-Oct-2021 IperionX Halloween IperionX Halloween event 5-Dec-2021 University of Knoxville Visited the UTK campus and dinner 10-Dec-2021 TN Chamber/Manufactures and Industry roundtable Attended the round table 18-Dec-2021 Senior Citizens home Adopt a Senior 20-Dec-2021 Benton County Christmas parade IperionX truck in parade 5-Feb-2022 District Director Sam Neinow at Congressman Mark Green Sam Neinow brief for Congressman Green 10-Feb-2022 Congressman Green Meeting with Congressman Green 5-Feb-2022 Agricultural Commission Board IperionX CEO addressed Agricultural Commission Board members 8-Mar-2022 Carroll County government Attendance at Carroll County government meeting 14-Mar-2022 Carroll County Prodigy softball Donation for softball team 28-Mar-2022 Benton County teacher in-service Presentation 6-Apr-2022 Benton County Public Q&A session Information and update 10-Apr-2022 Henry County fish fry IperionX tent demonstration 16-Apr-2022 Fishing rodeo Attendance and donation 24-Apr-2022 Scotts Hill career day Presentation 10-May-2022 Carroll County golf tournament IperionX tent/sponsorship 1-Jun-2022 Forever Communications Interview with Henry County radio 6-Jun-2022 Carroll County schools Academic sponsorship 12-Jun-2022 Get Loaded Tea IperionX promotion and sponsorship 18-Jun-2022 Senator Hagerty/Benton County Mayor Meeting with Senator Hagerty/Benton County Mayor 20-Jun-2022 Benton County STEM camp STEM camp presentation 22-Jun-2022 Henry County Carl Perkins Center for Child Abuse Table sponsorship 26-Jun-2022 Magic Valley Golf/Buccaneers Attended and sponsored the Pro Golf tournament 29-Jun-2022 Benton County Drug Prevention/UT Ag Children Yoga sponsorship 3-Jul-2022 Birdsong Resort & Marina 4th of July attendance/sponsorship 7-Jul-2022 Tennessee Department of Economic and Community Development Meeting with several groups 12-Jul-2022 University of Tennessee at Martin Campus tour 15-Jul-2022 UT Martin Director IperionX information discussion 18-Jul-2022 Henry County Mike Weatherford show IperionX interview 20-Jul-2022 West TN football/cheer Sponsorship 24-Jul-2022 County officials Meeting with several groups 30-Jul-2022 Benton County Drug Prevention Coalition Attendance at the Red Sand event TITAN PROJECT TENNESSEE, U.S. TECHNICAL REPORT SUMMARY ON FEASIBILITY STUDY Page 282 Date Organization/Event IperionX Community Relations Activity 4-Aug-2022 UT Extension Donation for new agriculture silos 9-Aug-2022 District Director Sam Neinow at Congressman Mark Green /Benton County Mayor Meeting with Sam Neinow/Benton County Mayor 13-Aug-2022 Henry County Terra Recycling event Sponsored an electronics recycling drive in Henry County 15-Aug-2022 Benton County Fair Salute to First Responders Attendance 22-Aug-2022 Henry County Fair Attendance and IperionX booth/demonstration 26-Aug-2022 Benton County Fair Attendance and IperionX booth/demonstration 27-Aug-2022 STEAM Garden Donated to the new STEAM Garden 4-Sep-2022 Mckenzie sweet tea festival IperionX tent demonstration 9-Sep-2022 Forever Communications IperionX CEO interview 9-Sep-2022 Native American Indian Association of Tennessee Donation 10-Sep-2022 One Community One Heart Benton County Volunteer Day event 11-Sep-2022 911 Memorial Walk IperionX Attendance 12-Sep-2022 Benton County Prevention Coalition Attended /hosted luncheon 20-Sep-2022 Camden Masonic Lodge Donation for food plates 20-Sep-2022 West TN Veterans bike ride Donation 21-Sep-2022 IperionX Media Day at Demo Site IperionX information update to several groups 15-Oct-2022 West TN Saddle Club Sponsorship 16-Oct-2022 Native American Indian Association of Tennessee Pow Wow sponsorship 27-Oct-2022 Carroll County Boo Bash Halloween Trunk or Treat 29-Oct-2022 Henry County Spooktacular Halloween Trunk or Treat 31-Oct-2022 Benton County IperionX Halloween Bash Annual office Halloween event 2-Nov-2022 University of Tennessee at Martin Geo Sciences Club meeting attendance 8-Nov-2022 All American Cheer Purchased coupon book 9-Nov-2022 Henry County Noon on the square Attendance 11-Nov-2022 American Legion Veterans Volunteer 2-Dec-2022 Henry County Shop with a Cop Donation 5-Dec-2022 Benton County Manufactures Day Presentation 15-Dec-2022 Carroll County Toys for Tots Toy donation 15-Dec-2022 Benton County Toys for Tots Toy donation 18-Dec-2022 Henry County Christmas parade IperionX truck in parade 18-Dec-2022 St Vincent DePaul Donation for flood victims 1-Jan-2023 TN Achieves Mentor Meeting Meeting at Bethel University 14-Jan-2023 Beta Club 5-kilometer run 25-Jan-2023 Benton County School Board Attendance 30-Jan-2023 Carroll County Career & Technical Ed Attendance/IperionX discussion 31-Jan-2023 American Legion Girls State Scholarship donation 1-Feb-2023 Big Sandy Q&A Community Q&A 8-Feb-2023 Carroll County Chamber Coffee Attendance/networking 16-Feb-2023 Carroll County Q&A Community Q&A 17-Feb-2023 Henry County Q&A Community Q&A 18-Feb-2023 American Legion Veterans Chili dinner 6-Mar-2023 Benton County Animal Shelter Sponsorship of a dog adoption fee 6-Mar-2023 Benton County Garden Club IperionX attendance and presentation 9-Mar-2023 IperionX Children’s Book Launch Introduction of the children’s book in Henry County 25-Mar-2023 Henry County Elementary Book reading/presentation 25-Mar-2023 Carroll County Elementary Book reading/presentation 28-Mar-2023 Benton County Elementary Book reading/presentation 30-Mar-2023 Henry County Library Book presentation/donation 30-Mar-2023 Carroll County Library Book presentation/donation 14-Apr-2023 Scotts Hill High School Career Day presentation 26-Apr-2023 Henry County High School Project Graduation donation 26-Apr-2023 Benton County High School Project Graduation donation 26-Apr-2023 Carroll County High School Project Graduation donation 28-Apr-2023 Henry County fish fry Attendance/networking 15-May-2023 West TN Boy Scouts Tour of Boy Scouts of America Camp TITAN PROJECT TENNESSEE, U.S. TECHNICAL REPORT SUMMARY ON FEASIBILITY STUDY Page 283 Date Organization/Event IperionX Community Relations Activity 30-May-2023 Native American Indian Association Scholarship donation 10-Jun-2023 TN Kids fishing rodeo Awards sponsorship 11-Jun-2023 TN Mining Association Conference sponsorship 28-Jun-2023 Camden Elementary School STEM summer camp presentation/donation 9-Jul-2023 Native American Indian Association of Tennessee Pow Wow sponsorship 20-Jul-2023 West TN STEM Scholarship Scholarship donation 2-Sep-2023 WRAP Jam IperionX Tent 6-Sep-2023 West TN Public Utility Luncheon attendance/networking 7-Sep-2023 Camden Elementary School Outdoor Garden Open House 29-Sep-2023 Camden Masonic Lodge Dinner attendance 19-Oct-2023 Carroll County Career & Technical Ed Meeting attendance/discussion 19-Oct-2023 United Way Radio Auction Guest Auctioneer/donation 20-Oct-2023 TMA Conference in Gatlinburg Attendance/sponsorship 21-Oct-2023 Native American Indian Association of Tennessee Attendance at the Pow Wow 25-Oct-2023 Carroll County Career Fair Attendance IperionX tent booth 28-Oct-2023 Henry County Trunk or Treat Handed out candy 29-Oct-2023 Elementary schools Delivered Halloween coloring pages/safety checklist 31-Oct-2023 IperionX Halloween event Annual office Halloween event 9-Nov-2023 Darkhorse Veterans Lodge Volunteer 17-Nov-2023 Carroll County Veterans Art Exhibit Volunteer 5-Dec-2023 Mckenzie Rotary Club IperionX Presentation 5-Dec-2023 Mckenzie Industrial Board Toured Mckenzie Industrial Site Commercial Facility 12-Dec-2023 Carroll County Toys for Tots Donation 12-Dec-2023 Henry County Toys for Tots Donation 13-Dec-2023 IperionX holiday cards 100 cards mailed to key county personnel and all IperionX Landowners 14-Dec-2023 Benton County Senior Citizen Holiday Holiday Basket donation to senior citizen 3-Jan-2024 Senator Marsha Blackburn Meeting Drop-in meeting held at Second Harvest Food Bank 12-Jan-2024 Henry County Helping Hands Donation to Pleasant Hill community 25-Jan-2024 Northwest Economic Development Food Boxing Volunteer 14-Feb-2024 Tennessee Mining Association Joined TMA on Capitol Hill in Nashville 12-Mar-2024 TN Achieves Lunch and Tennessee Colleges of Applied Technology Mentor lunch and TCAT tech school tour 19-Mar-2024 Forever Communications Visit to Henry County 19-Mar-2024 Henry County Real Hope Youth Center Visit to Henry County 20-Mar-2024 Carroll County Career Day IperionX tent/demonstration for career day 26-Mar-2024 Benton County Volunteer Program Presentation/IperionX Information 27-Apr-2024 Henry County fish fry Attendance/networking 27-Apr-2024 Darkhorse Veterans Lodge Donation 28-Apr-2024 Tennessee Mining Association Conference sponsorship 2-May-2024 Scotts Hill Career Day Presentation/IperionX Information 4-May-2024 Benton County Drug Prevention Awareness Day IperionX tent 18-Jun-2024 TN Health Connect Overdose prevention training 20-Jun-2024 2024 Scholarship Presentation Scholarship 25-Jun-2024 Tennessee College of Applied Technology Groundbreaking ceremony 4-Jul-2024 University of Tennessee Institute of Agriculture (UTIA) Visit/interview at team house with UTIA 24-Jul-2024 Henry County Fair Visit 10-Aug-2024 Outdoor open house IperionX tent/demonstration 13-Aug-2024 Roundtable with Congressman Green Meeting attendance 20-Aug-2024 2024 IperionX Honey Harvest Honey harvest 4-Sep-2024 Law Enforcement/First Responders Appreciation Stop 21-Sep-2024 Officials & Key Personnel Meeting and site tour 23-Sep-2024 Elks Lodge Donation 26-Sep-2024 West TN Public Utilities Luncheon Attendance/networking TITAN PROJECT TENNESSEE, U.S. TECHNICAL REPORT SUMMARY ON FEASIBILITY STUDY Page 284 Date Organization/Event IperionX Community Relations Activity 17-Oct-2024 Native American Indian Association of Tennessee (NAIA) Pow WoW Attendance 19-Oct-2024 Carroll County Boo Bash IperionX Trunk or Treat 26-Oct-2024 Henry County Spooktacular IperionX Trunk or Treat 28-Oct-2024 IperionX Annual Halloween Event Halloween at IperionX Office 31-Oct-2024 Carroll County Career Fair IperionX info on careers 6-Nov-2024 Henry County Toys for Tots Donation 15-Dec-2024 Carroll County Toys for Tots Donation 15-Dec-2024 Benton County Toys for Tots Donation 15-Dec-2024 West TN Career Fair Attendance/booth 6-Mar-2025 Family STEM Night Attendance 15-Apr-2025 MM&A Site visit 15-Apr-2025 Henry County Fish Fry Attendance/networking 25-Apr-2025 Tennessee Mining Association Attendance/Booth/Sponsorship 28-Apr-2025 Carroll County Ag Day Attendance/Booth 12-May-2025 Scotts Hill Career Day Presentation/IperionX information 15-May-2025 TDEC Site visit 12-Jun-2025 Benton County Chamber Open House attendance 28-Jun-2025 Tractor Supply Attended grand opening 8-Jun-2025 UTIA Site visit 1-Jul-2025 Benton County Fair Attendance/lunch 22-Jul-2025 Henry County Chamber Coffee Attendance/networking 7-Jul-2025 BC Road Superintendent Retirement Attendance/networking 3-Jul-2025 Chamber Coffee Second Harvest Food Bank Attendance/networking 6-Aug-2025 Benton County Free Watermelon Day Gave away free watermelons to the Benton County community 7-Aug-2025 Carroll County Sheriffs Dept Delivered free watermelons to Carroll County Sheriff's Dept 7-Aug-2025 Henry County Watermelon Donation Delivered free watermelons to first responders in Henry County 8-Aug-2025 Henry County Fair Attendance/lunch 8-Aug-2025 Carroll County Fair Attendance/lunch 9-Aug-2025 Benton County Fair Attendance/lunch 10-Aug-2025 Congressman Kustoff Meeting 18-Aug-2025 Palmer Tool Office Meeting 18-Aug-2025 MaxSteel Tour of MaxSteel Facility in Henry County 18.Aug-2025 Benton County Officials Meeting 19-Aug-2025 Carroll Count Officials Meeting 20-Aug-2025 West TN Public Utilities Luncheon Luncheon attendance 26-Aug-2025 Landowners Meeting 26-Aug-2025 Community member Office visit 27-Aug-2025 Community member Office visit 16-Sep-2025 L.I. Smith Surveying Office visit 17-Sep-2025 NAIA Pow Wow Attendance/networking 18-Oct-2025 Benton County Rotary Attendance/networking 22-Oct-2025 Carroll County Boo Bash Carroll County Trunk or Treat 23-Oct-2025 Henry County Spooktacular Henry County Trunk or Treat 25-Oct-2025 IperionX Annual Halloween Office Halloween 31-Oct-2025 CAT Office visit 13-Nov-2025 TDEC Site inspection 14-Nov-2025 Veterans Day Memorial Attendance 23-Jan-2026 Benton County, Carrol County, Henry County Donation 18-Feb-2026 Geological Society of America (GSA) Field trip agenda visit 24-Feb-2026 GSA Field trip dry run 7-Mar-2026 TDEC/GSA Field trip 7-Mar-2026 Civil and Environmental Consultants Meeting 18-Mar-2026 Carroll County STEM /Career Day Info booth 20-Mar-2026 Co-Op Coffee Attendance/networking 23-Mar-2026 Powering Paris Community Celebration Attendance/networking


TITAN PROJECT TENNESSEE, U.S. TECHNICAL REPORT SUMMARY ON FEASIBILITY STUDY Page 285 Date Organization/Event IperionX Community Relations Activity 26-Mar-2026 Benton County Courthouse Life-Line Peer Project Attendance/networking 26-Mar-2026 Henry Count After Hours Social Attendance/networking 1-Apr-2026 Benton County Fair Volunteer Appreciation Lunch Attendance/networking 3-Apr-2026 UT Ag Coffee Social Attendance/networking 9-Apr-2026 Benton County 2nd annual STEAM Night IperionX Booth STEM Activity 10-Apr-2026 Carroll County Ag Plant Sale Attendance 11-Apr-2026 Benton County Ag Plant Sale Attendance 21-Apr-2026 Fish Fry Welcome Coffee Attendance 24-Apr-2026 Henry County World's Biggest Fish Fry Attendance 28-Apr-2026 TMA Mining Conference Conference 30-Apr-2026 Camden High School Career Fair IperionX Booth/Activities 12-May-2026 Scotts Hill Career Fair IperionX Booth 13-May-2026 Carroll County High School Career Fair IperionX Booth 17.8 Social Considerations, Plans, Negotiations and Agreements 17.8.1 Plans, Negotiations, or Agreements with Local Individuals or Groups IperionX has undertaken preliminary engagement with local stakeholders in the Project area, including landowners, community representatives, and local or regional authorities, to support Project planning and to identify social, land access, and community considerations relevant to development. At the Report date, no material agreements with local individuals or groups have been finalized. IperionX intends to continue engagement activities as the Project advances, consistent with applicable laws and regulations, and in a manner customary for heavy mineral sands projects development. Where required or considered appropriate, future discussions or agreements may address matters such as land access, community relations, employment opportunities, and local services. Any such agreements would be negotiated in accordance with applicable regulatory requirements and would be disclosed in future filings if determined to be material. 17.8.2 Commitments to Ensure Loal Procurement and Hiring IperionX currently anticipates that, during construction and operations, labor, goods, and services will be sourced from a combination of local, regional, and national suppliers, subject to availability, qualifications, commercial terms, and compliance with Project requirements. While no binding commitments to local procurement or hiring have been made as of the Report date, IperionX generally intends to consider qualified local individuals and businesses in its hiring and procurement processes, consistent with standard industry practice, applicable laws, and operational needs. Employment levels, workforce composition, and procurement strategies will ultimately depend on Project design, contractor selection, and prevailing market conditions. No reliance on preferential hiring or local procurement was incorporated into mineral resource or mineral reserve estimates, capital cost estimates, or economic analyses presented in this FS. TITAN PROJECT TENNESSEE, U.S. TECHNICAL REPORT SUMMARY ON FEASIBILITY STUDY Page 286 17.9 Qualified Person’s Opinion MM&A is of the opinion that the current plans presented in Section 17 are reasonably adequate to address any issues related to environmental compliance, permitting, and local individuals or groups. While significant permitting requirements will be required to progress the Project, IperionX has already demonstrated the ability to work with regulators to successfully acquire mining and discharge-related permits. TITAN PROJECT TENNESSEE, U.S. TECHNICAL REPORT SUMMARY ON FEASIBILITY STUDY Page 287 18 Capital and Operating Costs 18.1 Introduction The objective of developing the capital and operating cost estimates is to provide substantiated costs feeding into the FS pertaining to the Project. The initial capital expenditure estimate includes all Project direct and indirect costs to be expended during the Project implementation phase. It is deemed to cover the period starting from the approval date by IperionX of this Report and finishing at the successful completion of the commissioning phase. Any cost to be expended beyond the commissioning phase, i.e., transfer to operations, performance tests, start-up/ramp-up and operations of the Project facilities will be included with sustaining capital cost or operating cost estimates. 18.2 Capital Cost Estimates 18.2.1 CAPEX General 18.2.1.1 Introduction The capital costs were developed in accordance with the requirements of a Class 3 estimate, consistent with the Association for the Advancement of Cost Engineering (AACE) Cost Estimating Classification System, as defined in AACE International Recommended Practice No. 17R-97. In keeping with the intended Class 3 estimate maturity, the estimate has been prepared to reach a target accuracy range of ±15%. The estimate is based on an estimate base date of Q2 2026 and is expressed in United States Dollars (US$). No allowance was made for escalation. 18.2.1.2 Working Capital and Sustaining Capital The Discounted Cash Flow (DCF) model includes an allowance for sustaining capital expenditure over the anticipated 14-year operating life of the facility. Sustaining capital was estimated by Primero at 2.5% per annum of the mechanical equipment. This estimate was derived from Primero’s proprietary cost database, as well as benchmarking against comparable rare earth processing operations, particularly those utilizing similar technologies. Over the full project life, this equates to a total sustaining capital requirement of approximately US$23.3 million. All initial working capital required for the commissioning phase has been incorporated into the initial capital expenditure. This includes upfront costs associated with commissioning labor, consumables, reagents, power, and initial spare parts necessary to support plant start-up and early operations. Post-commissioning, ongoing working capital requirements are incorporated into the DCF model based on IperionX operational assumptions. These include: TITAN PROJECT TENNESSEE, U.S. TECHNICAL REPORT SUMMARY ON FEASIBILITY STUDY Page 288 > account receivable assumed to be collected on a 30-day basis, reflecting anticipated customer payment terms > accounts payable assumed to be settled within 30 days, in line with supplier expectations > a maintained ore feedstock inventory of two weeks of material, representing a strategic buffer to ensure continuous plant operation and mitigate mining disruptions These working capital assumptions ensure that the model accurately captures the cash flow timing dynamics of the operation, reflecting realistic liquidity requirements for day-to-day operations and supporting the Project's overall financial feasibility. 18.2.1.3 Currency The capital cost estimate is presented in US$. Major procurement pricing provided by MT was originally developed in Australian Dollars (AUD) and has been converted to US$ for incorporation into the CAPEX. The exchange rate used is shown in Table 18-1. Pricing developed by Primero was already prepared in US$ and was carried through the estimate on that basis. Table 18-1: Currency Conversion Rates AUD US$ 1 AUD 0.6957 US$ The exchange rate used is the Reserve Bank of Australia’s 3-month daily average for January, February, and March 2026. 18.2.1.4 Engineering and Design MTOs used for the capital cost estimate were developed by Primero, MT, and MM&A, and were, for the most part, subsequently estimated by Primero as part of the overall capital cost development. Estimated quantities and scope definitions for civil, structural, mechanical, piping, electrical, instrumentation, and other applicable disciplines were derived from these deliverables and used as the primary basis for the development of direct costs. Where applicable, selected cost inputs, pricing assumptions, and scope information provided by all parties were also incorporated into the estimate. The estimate was developed on the basis of the engineering and design information available at the time of preparation, supplemented where necessary by estimating assumptions and inputs provided by all team members to complete the capital cost assessment on a consistent basis. 18.2.1.5 Capital Cost Estimate Inclusions The capital cost estimate includes the direct and indirect costs required to execute the defined project scope in accordance with the basis, assumptions, and design information available at the time of estimate preparation. Direct costs generally comprise labor, materials, equipment, and subcontracted services associated with the supply, installation, and construction of the project facilities. These costs were


TITAN PROJECT TENNESSEE, U.S. TECHNICAL REPORT SUMMARY ON FEASIBILITY STUDY Page 289 developed from the relevant MTOs, scope definitions, vendor and contractor inputs, and estimating assumptions applicable to each discipline. The estimate also includes indirect costs necessary to support overall project execution. These generally comprise the temporary facilities, construction support, supervision, field management, and other project-related costs required to plan, manage, and deliver the work within the defined execution framework. Given the availability of local construction workers, there is no requirement for living out allowance. 18.2.1.6 Capital Cost Estimate Summaries The capital cost estimate summaries have been prepared and reported in accordance with the project’s phased development approach, comprising Phase 1 – 400 tph and Phase 2 – Incremental 800 tph configurations. The summaries present the capital cost estimate at a consolidated level for each phase, consistent with the scope definitions for this study. For reporting purposes, the NPI scope has been incorporated into the Phase 1 – 400 tph scope of work and is reflected within that phase’s cost estimate summary accordingly. Table 18-2 shows the consolidated, the Phase 1 – 400 tph, and the Phase 2 – Incremental 800 tph cost summaries, respectively. Table 18-2: Capital Cost Summary (Phase 1 – 400 tph and Phase 2 – Incremental 800 tph) Item Phase 1 400 tph (US$) Phase 2 – Incremental 800 tph (US$) Total Phase 1+ Phase 2 (US$) Direct Costs 1000 - Site Wide - Mining $23,237,857 $347,042 $23,584,929 1000 - Site Wide - NPI $18,316,630 $0 $18,316,630 1000 - Site Wide - Balance of Scope $18,499,189 $3,191,001 $21,690,190 2000 - Feed Preparation Plant $10,086,726 $15,587,107 $25,673,833 3000 - Wet Concentrator Plant $44,143,921 $62,212,480 $106,356,401 4000 - Mineral Separation Plant $25,058,422 $33,435,617 $58,494,039 5000 - Rare Earth Plant $33,181,069 $1,240,555 $34,421,625 8000 - Mining Unit Plant $1,304,793 $2,133,248 $3,438,041 Direct Costs Sub-total $173,828,608 $118,147,079 $291,975,688 INDIRECT COSTS EPCM $22,414,018 $14,663,588 $37,077,606 Temporary Facilities and Services $2,240,370 $1,247,800 $3,488,170 Vendor's ME Installation Assistance $250,000 $190,000 $440,000 Contractor's Pre-Commissioning Assistance $186,342 $244,769 $431,111 Commissioning & Testing $1,898,000 $1,620,320 $3,518,320 Spare Parts $928,893 $1,196,017 $2,124,910 First Fills $143,330 $223,407 $366,737 Indirect Costs Sub-total $28,060,953 $19,385,901 $47,446,854 TOTAL No CONTINGENCY nor OWNER'S COSTS $201,889,562 $137,532,980 $339,422,542 Owner's Costs $5,598,338 $1,637,627 $7,235,964 Contingency $20,638,419 $14,027,432 $34,665,851 TOTAL CAPEX 400tph and 800tph $228,126,319 $153,198,038 $381,324,357 Note: Totals may not sum due to rounding. TITAN PROJECT TENNESSEE, U.S. TECHNICAL REPORT SUMMARY ON FEASIBILITY STUDY Page 290 18.2.2 Direct Cost Estimate The direct cost estimate was developed by discipline using the latest available engineering and design deliverables, including MTOs prepared by Primero, MT, and MM&A. These inputs formed the basis for quantifying and pricing the defined scope of work across the relevant disciplines. The effects of the project’s value engineering phase were incorporated into the applicable MTOs, scope definitions, design inputs, and pricing basis provided by the respective parties, and were reflected in the direct cost estimate. Direct costs included the labor, materials, equipment, and subcontracted scope directly attributable to the physical supply, construction, and installation of the project facilities. The estimate was prepared to reflect the scope and level of design definition available at the time of estimate development, consistent with the overall basis adopted for the capital cost estimate. As part of a value engineering optimization, the Project execution approach was also reviewed and, where practical, construction was planned to be modularized to maximize installation efficiencies and realize cost savings. This approach principally involved structural steel, mechanical equipment, platework, and piping scope. 18.2.2.1 Bulk Materials and Equipment Bulk materials and equipment costs were developed as part of the direct cost estimate using the latest available material take-offs, equipment lists, vendor budget pricing, historical benchmarks, and selected Owner-provided inputs, where applicable. 18.2.2.1.1 Structural Steel Structural steel quantities were developed from MTO information provided by MT. For the stick-built scope, MT provided a structural steel MTO derived from the project’s structural design model, with quantities extracted from Space GASS and inclusive of engineering allowances for items such as end connections, omitted secondary members, and other minor design development allowances, together with an allowance for temporary transport steel where applicable. As part of a value engineering optimization, a significant portion of the Project was planned to be modularized to improve construction efficiency and reduce site installation costs. For the modular scope, structural steel quantities were provided separately by MT on a total module weight basis rather than as a conventional field-installed steel MTO. In this case, the structural steel installation component was not estimated in isolation but instead formed part of the overall installed module mass, which also included associated piping, platework, and mechanical equipment incorporated within each module. Installation costs for the stick-built structural steel scope were estimated by Primero on a manhour basis, using its recent historical cost database and benchmark information from comparable industrial and mining projects. These manhours formed the basis for the calculation of field installation costs for the applicable structural steel components included within the estimate. TITAN PROJECT TENNESSEE, U.S. TECHNICAL REPORT SUMMARY ON FEASIBILITY STUDY Page 291 Installation costs for the modular structural steel scope were estimated by Primero on a manhour basis, with module weight and geometry used as the primary basis for assessing installation effort. These factors also governed the crane size and lifting configuration required for module installation. The resulting manhours formed the basis for the calculation of field installation costs for the modular structural steel scope included within the estimate. Consistent with the adopted procurement strategy, the supply and fabrication of structural steel was sourced by MT from the Chinese market, with module fabrication and pre-assembly forming part of the overall modular execution approach reflected in the estimate. 18.2.2.1.2 Concrete The concrete scope was developed on a stick-built basis. Concrete quantities were derived from MTO information provided by MT, which formed the basis for Primero’s estimate of the associated direct costs. Installation costs for the concrete scope were estimated by Primero on a manhour basis, using its recent historical cost database and benchmark information from comparable industrial and mining projects. These manhours formed the basis for the calculation of field installation costs for the applicable concrete works included within the estimate. The associated bulk material pricing for concrete-related items was developed from Primero’s in-house historical cost database, using recent internal benchmark information applicable to comparable industrial and mining projects. 18.2.2.1.3 Architecture Architectural elements associated with the NPI buildings were considered at a FS level through the pricing and scope allowances provided by the contractors responsible for delivering these facilities. Rather than developing stand-alone architectural designs at this stage, the study relies on the contractors’ standard building specifications, typical layouts, and integrated architectural provisions embedded within their proposed solutions. As a result, architectural requirements—such as building envelopes, internal finishes, functional layouts, and code-compliant features—are indirectly captured within the contractors’ pricing and form part of their overall NPI building supply. More detailed architectural design development will occur in subsequent project phases once the preferred building suppliers are confirmed. The architectural scope for the process buildings was developed on a stick-built basis. Architectural quantities were derived from MTO information provided by MT, which formed the basis for Primero’s estimate of the associated direct costs. Installation costs for the architectural scope were estimated by Primero on a manhour basis, using its recent historical cost database and benchmark information from comparable industrial and mining projects. These manhours formed the basis for the calculation of field installation costs for the applicable architectural works included within the estimate. The associated material pricing for architectural items was developed from Primero’s in-house historical cost database, using recent internal benchmark information applicable to comparable industrial and mining projects. TITAN PROJECT TENNESSEE, U.S. TECHNICAL REPORT SUMMARY ON FEASIBILITY STUDY Page 292 18.2.2.1.4 Earthworks and Surface Water Drainage The earthworks and surface water drainage scope was developed using Project-specific quantity information derived from the site layout and development assumptions. Quantities were generated through material take-offs from the 3-D model and used as the basis for the bulk earthworks estimate. The level of definition reflects FS-stage requirements, with detailed design, geotechnical verification, and regulatory confirmation to be undertaken in subsequent phases. Note: A distinction exists between the two sites in terms of available baseline information. Environmental and geotechnical studies were available for the WCP site and informed the development of the bulk earthworks and surface water drainage concepts. For the MSP site, such studies were not yet available, and the earthworks and drainage design were therefore developed based on reasonable engineering assumptions appropriate for an FS level of definition. Installation costs for the earthworks scope were initially estimated by Primero on a manhour basis, using its recent historical cost database and benchmark information from comparable industrial and mining projects. The associated supply and installation cost basis was subsequently aligned to a budget quotation received from a US-based contractor, to better reflect current market conditions and project- specific pricing applicable to the site location. For estimate reporting purposes, the bulk earthworks quantities for the WCP were allocated between Phase 1 and Phase 2, while the MSP earthworks scope was retained within Phase 1. 18.2.2.1.4.a. Bulk Earthworks Development The bulk earthworks concept for both the WCP and MSP sites was developed with the objective of minimizing cut-and-fill volumes while maximizing the reuse of suitable cut material within fill areas, consistent with the basis of design. For FS purposes, all excavated material was assumed to be suitable for reuse as general fill and structural fill within the facility extents, eliminating the need for imported material. Structural fill and basecourse were assumed to be sourced from mine overburden, with a borrow location approximately 4.8 km (3 miles) from the project site. Site preparation assumptions include clearing, grubbing, and topsoil removal extending 3 m (10 feet) beyond the toe of earthworks extents, and the application of a 20.3-cm (8-inch) capping layer across bulk earthworks areas to promote sheet flow and allow light vehicle access. Stage 1 earthworks include the mine access road, the initial bulk pad (including conveyor pad), and the detention pond, with Stage 2 expanding the pad extents. Value-engineering reviews undertaken during the study resulted in refinements to plant elevations, reductions in selected fill volumes, adjustments to cut volumes, and optimization of the overall footprint to improve earthworks efficiency. Additional optimization opportunities—such as pond sizing, road and culvert arrangements, and conveyor and ramp alignments—were also assessed.


TITAN PROJECT TENNESSEE, U.S. TECHNICAL REPORT SUMMARY ON FEASIBILITY STUDY Page 293 18.2.2.1.4.b. Surface Water Drainage The drainage strategy was developed in alignment with permitting requirements and environmental constraints identified for each site. WCP Site The drainage concept was governed by the requirement to maintain a single permitted outfall at the northeast corner of the site. Runoff will be collected and conveyed to a sedimentation pond designed for a 10-year, 24-hour storm event before controlled discharge. Uncontaminated runoff will be routed to this system, supported by Best Management Practices such as revegetation, sediment traps, and erosion control measures. External flows will be intercepted along the southern boundary and diverted around the site to prevent uncontrolled inflows. MSP Site The drainage strategy will be based on collecting uncontaminated stormwater in a detention pond for controlled release to maintain pre-development flow conditions. In accordance with environmental constraints, no runoff will be directed toward the wetland area west of the site. In the absence of a confirmed legal outfall, runoff was assumed to be discharged to the nearest receiving stream, with an 18- m (59-foot) buffer maintained along the impaired stream on the eastern boundary. The bulk earthworks concept promotes sheet flow across a sloped pad, with no buried drainage pipes assumed. 18.2.2.1.4.c. Roads and Access Infrastructure Road pavement was assumed to be asphalt, with pavement design based on traffic load information provided by the technological contractor. Sealed roads were assumed to comprise a two-layer asphalt system (5-cm (2-inch) binding and 3.8-cm (1.5-inch) wearing course) over a 15-cm (5.9-inch) basecourse. The mine access road will be unsealed. For conveyor crossings, a double-barrel reinforced concrete box culvert arrangement was assumed. The mine access road corridor was reduced to 12 m (39 feet) to remain within the environmental permit boundaries. Future design phases will require refinement of the road and conveyor layouts to balance operational requirements with spatial and permitting constraints. 18.2.2.1.5 Mechanical Equipment The mechanical equipment scope was developed using a mechanical equipment list provided by MT and amended to reflect revised process flow diagrams (PFDs) and the outcomes of the Value Engineering phase. As part of this process, MT identified the equipment to be site assembled and the equipment to be incorporated into the modular installation strategy. Budgetary equipment pricing was sourced by MT from the market on a project-specific basis, including both domestic and international suppliers. Following technical and commercial adjudication, the pricing from the selected vendor(s) was incorporated into the estimate. In support of the value engineering initiatives, equipment pricing was sourced from tier 2 and tier 3 suppliers, predominantly from China and TITAN PROJECT TENNESSEE, U.S. TECHNICAL REPORT SUMMARY ON FEASIBILITY STUDY Page 294 India, to identify potential capital cost savings. At this stage, technical bid evaluations were completed to confirm general alignment with datasheet performance requirements; however, detailed verification of full specification compliance and long-term operational suitability remains subject to further review in subsequent project phases. As part of the modular execution strategy, selected items of mechanical equipment were designated to be supplied by MT as free issue to the module fabricator for pre-assembly into the relevant modules. This modularized equipment scope included items such as cyclones, spirals complete with launders and feed piping, stilling mats, pumps, screens, magnetic separators, belt filters, attritioners, flotation cells, samplers, washdown hose reels, and fire hose reels and sprinklers. Allowance was made in the estimate for delivery of these select items to the module fabricator’s premises for incorporation into the modules, with the balance of the mechanical equipment delivered directly to site for field installation. Installation costs for the site-assembled mechanical equipment scope were estimated by Primero on a manhour basis, using its recent historical cost database and benchmark information from comparable industrial and mining projects. These manhours formed the basis for the calculation of field installation costs for the applicable mechanical equipment items included within the estimate. For the modular mechanical equipment scope, installation costs were also estimated by Primero on a manhour basis, with module weight and geometry used as the primary basis for assessing installation effort. These factors also governed the crane size and lifting configuration required for module installation. The resulting manhours formed the basis for the calculation of field installation costs for the modular mechanical equipment scope included within the estimate. The estimate also reflects the Project’s adopted logistics strategy. Allowances were made for freight where required, including delivery of selected items to the module fabricator for pre-assembly and direct delivery of larger site-installed equipment to site where vendor pricing did not already include transportation. 18.2.2.1.6 Platework The platework scope was developed using MTO information provided by MT. The MTOs for the various sumps, stilling boxes, energy dissipators, and other similar platework items were prepared by MT based on standard designs or bespoke designs, as required by the project scope. These quantities formed the basis for Primero’s development of the associated direct costs. Consistent with the adopted value engineering and modularization strategy, fabricated platework items were planned to be pre-assembled into modules where applicable. This approach was adopted to improve construction efficiency and reduce site installation effort. Supply and fabrication pricing for the platework scope was sourced from the Chinese market, in line with the overall project procurement strategy adopted for modularized bulk materials. This pricing basis TITAN PROJECT TENNESSEE, U.S. TECHNICAL REPORT SUMMARY ON FEASIBILITY STUDY Page 295 reflects the project approach of maximizing offsite fabrication and pre-assembly to support the Value Engineering objectives. Installation costs for the site-installed platework scope were estimated by Primero on a manhour basis, using its recent historical cost database and benchmark information from comparable industrial and mining projects. These manhours formed the basis for the calculation of field installation costs for the applicable platework items included within the estimate. For the modular platework scope, installation costs were also estimated by Primero on a manhour basis, with module weight and geometry used as the primary basis for assessing installation effort. These factors also governed the crane size and lifting configuration required for module installation. The resulting manhours formed the basis for the calculation of field installation costs for the modular platework scope included within the estimate. Allowance was also made where required for the transport of fabricated platework and pre-assembled modules from the fabricator’s premises through to site, consistent with the logistics basis adopted for the estimate. 18.2.2.1.7 Piping The piping scope was developed using MTO information provided by MT. For the stick-built piping scope, MT provided piping MTOs covering piping lengths, valves, and piping special items, which formed the basis for Primero’s estimate of the associated direct costs. In accordance with the broader piping basis for the project, the underlying piping quantities were based on the FS MTOs, adjusted as required to reflect the revised flowsheets and plant layout. The lists for valves, mining hoses, and expansion joints were based on the current P&IDs, with additional mining hoses and expansion joints included where required to suit the modularized execution strategy. Supply and fabrication of piping was sourced from the Chinese market, including carbon steel piping (lined and unlined) and HDPE piping, consistent with the overall procurement strategy adopted for the project. The supply and fabrication of all piping was based on a Chinese fabricator. Allowance was made to freight selected specialized piping items, such as valves, expansion bellows, and other specialty components, sourced outside China to the fabricator for incorporation into the piping modules. Installation costs for the stick-built piping scope were estimated by Primero on a manhour basis, using its recent historical cost database and benchmark information from comparable industrial and mining projects. These manhours formed the basis for the calculation of field installation costs for the applicable piping items included within the estimate. The balance of the piping scope formed part of the modular MTO and was estimated as part of the overall modular installation strategy. For this modular piping scope, installation costs were also estimated by Primero on a manhour basis, with module weight and geometry used as the primary basis for assessing installation effort. These factors also governed the crane size and lifting configuration required for TITAN PROJECT TENNESSEE, U.S. TECHNICAL REPORT SUMMARY ON FEASIBILITY STUDY Page 296 module installation. The resulting manhours formed the basis for the calculation of field installation costs for the modular piping scope included within the estimate. Where vendor pricing did not include freight to China for pre-assembly into modules, a factored allowance was included in the estimate. In addition, budgetary pricing was obtained for the transport of all pre-assembled modules and fabricated piping items from the fabricator’s premises in China through to site. 18.2.2.1.8 Electrical and Instrumentation & Control The electrical and instrumentation and control scope was developed using a combination of bulk material take-offs prepared by MT and equipment type and quantity information developed by Primero, depending on the specific scope item. Together, these formed the basis for Primero’s estimate of the associated direct costs. For the electrical and instrumentation bulk materials scope, the relevant MTOs were prepared by MT. Installation costs for this scope were estimated by Primero on a manhour basis, using its recent historical cost database and benchmark information from comparable industrial and mining projects. These manhours formed the basis for the calculation of field installation costs for the applicable electrical and instrumentation bulk items included within the estimate. Bulk material pricing was developed from a combination of pricing from other recent Primero projects and market pricing obtained from a US-based contractor, to reflect current project-specific pricing conditions. For electrical equipment such as Motor Control Centers (MCCs), generators, switchgear, and other major packaged electrical items, the applicable quantity basis was developed by Primero. Pricing for these items was established using vendor budget quotations, which were subjected to technical and commercial review prior to incorporation into the estimate. This approach was adopted to ensure that the selected pricing basis was representative of the intended project requirements and aligned with the overall CAPEX development methodology. The electrical and instrumentation and control estimate was developed using MT-provided bulk MTOs, Primero-developed equipment quantity inputs, Primero-developed installation manhours, and a pricing basis derived from a combination of recent Primero benchmark data, contractor budget pricing, and vendor quotations, as applicable to the relevant scope components. 18.2.2.1.9 Mine Development The mine development scope, including the associated material take-off and cost estimate development, was prepared by MM&A. In developing this estimate, MM&A relied on a combination of equipment vendor quotations and mining contractor budget quotations to establish the applicable pricing basis for the scope.


TITAN PROJECT TENNESSEE, U.S. TECHNICAL REPORT SUMMARY ON FEASIBILITY STUDY Page 297 Following MM&A’s review of the contractor pricing received, a representative bid was selected as the basis for the mine development cost estimate. This information was then provided to Primero for incorporation into the overall Project capital cost estimate. Primero’s role in relation to this scope was limited to the integration of the MM&A-developed mine development estimate into the consolidated capital cost estimate, in accordance with direction provided by IperionX. Accordingly, the mine development costs included in the estimate reflect the scope, pricing basis, and commercial inputs developed by MM&A for this portion of the Project. 18.2.2.1.10 Cranage for Module Installation Crane selection for module installation was developed as a budget-level basis of estimate using the module weight bands and overall module geometries provided, rather than by preparing individual engineered lift studies for every module. A two-crane approach was considered the best balance between technical adequacy, estimating consistency, and crane-utilization efficiency, while recognizing that final crane selection for construction execution would remain subject to detailed lift planning using actual site layout, lift radii, boom lengths, crane charts, and ground conditions. 18.2.2.1.11 Modular Installation Manhour Approach For the modularized scope, installation manhours were not developed separately by individual discipline within each module. The modular installation manhours were developed using a three-stage installation methodology (Stage 1 – receiving and setting, Stage 2 – work inside modules, and Stage 3 – external module tie-ins), representing the principal site activities required to complete the module installation scope. Accordingly, the modular installation manhours were developed as an integrated field installation allowance based on module characteristics and staged installation activities, rather than as a conventional commodity-by-commodity field erection estimate. This methodology reflects the Project’s modular execution philosophy and the associated value engineering objective of shifting labor from site to offsite assembly in order to improve installation efficiency and reduce overall field labor requirements. 18.2.2.2 Labor Rates Primero developed its own burdened labor rates for incorporation into the estimate. The primary labor rate basis was established using burdened rates for a 50-hour work week provided by a US-based contractor with whom Primero has worked on previous projects. This work schedule basis was adopted in accordance with confirmation provided by IperionX that a 50-hour per week construction shift would apply to the Project. TITAN PROJECT TENNESSEE, U.S. TECHNICAL REPORT SUMMARY ON FEASIBILITY STUDY Page 298 The labor rate basis adopted in the capital cost estimate reflects a reviewed and optimized position informed by contractor market input, recent comparable project experience, and alignment with the confirmed Project work schedule. 18.2.2.3 Procurement Strategy The procurement strategy adopted was developed to support the value engineering objectives, with particular emphasis on reducing installed costs through a combination of international sourcing, offsite fabrication, and modular pre-assembly where practical. The strategy reflected a blended approach under which bulk materials and equipment were sourced from the most commercially advantageous markets, while also aligning with the planned modular execution methodology adopted for the project. In general, material pricing incorporated into the estimate was based on recent market-sourced quotations, with smaller quantity or lower-value items priced using recent benchmark rates. Major equipment pricing was developed from Project-specific vendor quotations sourced from both domestic and international suppliers. Following technical and commercial adjudication, the selected pricing was incorporated into the estimate. As part of the adopted sourcing strategy, the supply and fabrication of selected bulk materials was sourced from the Chinese market, including structural steel, platework, carbon steel piping (lined and unlined), and High-Density Polyethylene (HDPE) piping. The modular procurement strategy also included the provision of selected equipment by MT as free issue to the module fabricator for pre-assembly into the relevant modules. This applied to various mechanical and associated items designated for module incorporation. In addition, allowances were included for the delivery of selected items to the module fabricator’s premises, with the balance of equipment delivered directly to site where intended for field installation rather than module assembly. The procurement strategy reflects a cost-optimized approach aligned with the Project’s modular execution philosophy, while recognizing that the selected international sourcing model carries some residual risk with respect to future price escalation, supplier qualification, and potential supply chain restrictions in later Project phases. 18.2.2.4 Freight Freight costs were included in the estimate where required to support the delivery of materials, fabricated items, modules, and equipment to their intended point of assembly or installation. The freight basis was developed to reflect the specific logistics allowances necessary to support the project execution approach adopted for this stage of the estimate. Where vendor pricing did not include delivery of goods to the relevant destination, separate freight allowances were incorporated into the estimate. This included allowances for selected specialized items required to be delivered to the module fabricator, as well as allowances for large equipment items to be delivered directly to site where freight had not been included in the vendor’s pricing. TITAN PROJECT TENNESSEE, U.S. TECHNICAL REPORT SUMMARY ON FEASIBILITY STUDY Page 299 For the modularized scope, budgetary pricing was obtained for the transportation of pre-assembled modules and other fabricated items from the fabricator’s premises in China through to the project site. Consistent with the estimate basis adopted for this phase of work, this cost was treated as a Provisional Sum. 18.2.2.5 Growth Factors MTOs issued represent the base, or “neat,” quantities derived from the current level of design definition. As part of the capital cost estimate development process, quantity growth allowances were applied to selected discipline MTOs to account for the expected progression of the design as engineering advances and further detailing, constructability requirements, and interface development are incorporated into the project. Growth allowances were developed as discipline-specific percentage factors and were used to establish the final estimate quantities carried in the estimate. These allowances were applied as quantity adjustments within the estimate build-up and were treated separately from contingency. The initial growth factors were proposed by Primero and were subsequently reviewed and confirmed by MT and/or Primero internally, as appropriate, depending on the relevant discipline and MTO development responsibility. This review process was undertaken to ensure the adopted factors were aligned with the current level of design maturity and the anticipated evolution of the scope. 18.2.2.6 Productivity Factors Productivity factors were applied to the base installation manhours to account for the effect of anticipated site-specific execution conditions on labor efficiency. These factors were applied solely as a labor adjustment mechanism within the capital cost estimate build-up and were treated separately from contingency. Base manhours were developed using benchmark installation rates derived from Primero’s historical database and comparable project experience and were then adjusted by the applicable productivity factors to reflect the expected project environment and construction conditions. Productivity factors >1.0 were applied where site conditions were expected to reduce labor efficiency relative to favorable base conditions. 18.2.3 Indirect Cost Estimate The indirect cost estimate was developed based primarily on budget quotations, supplemented only minimally by factored allowances and internal Primero developed bottom-up estimates where budgetary pricing was not available. This approach was adopted in consideration of the current level of project definition and the intended execution strategy and provides a stronger level of confidence in the indirect cost estimate than would be achieved through a predominantly factored build-up. TITAN PROJECT TENNESSEE, U.S. TECHNICAL REPORT SUMMARY ON FEASIBILITY STUDY Page 300 Indirect costs comprise the project support and execution-related costs required to deliver the defined scope, but which are not directly attributable to a specific installed asset, material quantity, or discipline take-off. 18.2.3.1 Engineering, Procurement, Construction, and Management The engineering, procurement, construction, and management (EPCM) cost allowance included in the estimate represents the detailed engineering, project management, coordination, field technical support, and construction oversight services required to plan, administer, and control execution of the defined project scope. At a high level, this scope covered the management and support functions necessary to carry out detailed design, coordinate contractors, disciplines, packages, quality, site activities, and construction controls through the execution phase. 18.2.3.2 Temporary Facilities and Services Temporary facilities and services covered the temporary site infrastructure, facilities, equipment, and support services required to establish and maintain the construction site for the duration of project execution. A budget quotation for the temporary facilities and services scope was received and was used as the basis for this component of the estimate. This quotation covered the full temporary facilities and services scope required to support project execution. 18.2.3.3 Pre-Commissioning Contractor Support Pre-commissioning contractor support covered the contractor labor, supervision, and site support required to assist with pre-commissioning activities following completion of construction and installation. The allowance was developed on a factored basis at 0.75% of mechanical equipment supply cost, in accordance with Primero’s historical project benchmarks. 18.2.3.4 Commissioning and Testing Commissioning and testing covered the activities required to verify that the installed plant systems, equipment, and supporting infrastructure have been constructed correctly, operate as intended, and are ready for safe and reliable handover into operations. It included planning, supervision, labor, consumables, temporary services, and specialist support required to carry out commissioning preparation, system checks, functional verification, energization support, dry and wet commissioning activities, and performance testing of the relevant plant areas and equipment packages. A budget quotation was received and was used as the basis for this component of the estimate. 18.2.3.5 First Fills First fills covered the initial supply of consumable materials, fluids, and process media required to charge the plant systems and prepare the facilities for commissioning, testing, and initial operation. It included


TITAN PROJECT TENNESSEE, U.S. TECHNICAL REPORT SUMMARY ON FEASIBILITY STUDY Page 301 items such as lubricants, oils, greases, hydraulic fluids, reagents, filter media, and other initial charge materials required for equipment, utility systems, and process circuits prior to handover to operations. The first fills allowance carried in the estimate was based on Primero’s bottoms-up estimate developed during the FS phase. 18.2.3.6 Capital Spares Capital spares covered the initial supply of selected spare parts and replacement components required to support early plant operation and maintain equipment availability during the initial operating period. It included critical mechanical, electrical, instrumentation, and process-related spare parts that are required to have on hand at start-up due to their operational importance, anticipated wear, or longer lead times for replacement. The capital spares allowance carried in the estimate was based on Primero’s bottoms-up estimate developed during the FS phase. 18.2.3.7 Vendor Representatives Vendor representatives covered the specialist field support provided by equipment vendors during commissioning, testing, start-up, and early operational readiness. This scope included vendor attendance for activities such as inspection of installed equipment, verification of installation readiness, supervision of start-up procedures, functional checks, adjustment and tuning, troubleshooting, and confirmation that equipment is commissioned in accordance with the vendor’s requirements and intended operating basis. A budget quotation for vendor representatives was provided by Performance Industries and used in the capital cost estimate. 18.2.4 Owner’s Costs Owner’s costs were provided by IperionX to Primero for inclusion in the capital cost estimate. Costs included comprise the Owner’s project team, environmental/permits, fees/taxes/duties/bonds, and the power distribution line upgrade for Phase 1 only. Project Insurance was also included within Owner’s costs. An insurance quotation was provided by Gallaher and carried in the CAPEX. 18.2.5 Contingency A contingency allowance of 10%, assumed by the Company, has been applied to the sum of Direct Costs, Indirect Costs, and Owner’s Costs. This has been reviewed and considered reasonable by the Qualified Person for a Feasibility Study-level estimate. TITAN PROJECT TENNESSEE, U.S. TECHNICAL REPORT SUMMARY ON FEASIBILITY STUDY Page 302 18.3 Operating Cost Estimates 18.3.1 OPEX General The operating cost estimate (OPEX) has been performed for Mining, Process Plant, Product Transport and Royalties. The following list of cost centers were used for the Process Plant OPEX estimation: salaries; General & Administrative (G&A); reagents; consumables; utilities (electricity, fuel, water, etc.); maintenance; and mobile equipment. The estimates have an accuracy of ±15%. The estimate base date is Q2, 2026, and the estimate was prepared using US$. The operating costs are summarized in Table 18-3. Table 18-3: Operating Cost Estimate Summary Operating Costs US$/year US$/t ore Phase 1 Average Phase 2 Average Phase 1 Average Phase 2 Average Mining 21,505,614 64,334,874 6.32 6.22 Process Plant 15,520,852 27,967,350 4.56 2.70 Product Transport 3,558,600 8,900,738 1.05 0.86 Royalties 4,747,628 8,052,134 1.39 0.78 Total Operating Costs 45,332,694 109,255,096 13.31 10.57 Note: Totals may not sum due to rounding. 18.3.2 Mining OPEX MM&A solicited Request for Prices for Mine Contractor Services from three independent contractors for the mine plan including the pits, tailings and waste pile backfill areas, and internal haul roads. Operating costs were based on prices from mine contractor services for moving ROM ore material from the pits to the WCP and dewatered tailings and waste material back to the pits to the disposal areas and all associated work. Equipment consumables, repairs, maintenance, and labor costs were included in the contractor pricing to supply mine services including waste mobile conveyors, loaders for ore, loaders for waste, dozers for ore and interburden material, dozers for waste spreading and compaction, dozers for reclamation, and support equipment. A summary of the tasks required under the mine contractor services as provided in the Request for Proposal dated February 20, 2026, is provided in the table below. Table 18-4: Summary of Mine Contractor Services from RFP dated February 20, 2026 Task Contractor Other Comment Purchase or leasing of all mobile equipment X Note: Contractor may submit cost quotation assuming all mobile equipment is provided by Contractor, provided quotation clearly identifies those details in the quotation. Maintenance & repair of all mobile equipment X Rebuilds and/or replacement of all mobile equipment X Labor, fuel, and all operating supplies X Site security services X TITAN PROJECT TENNESSEE, U.S. TECHNICAL REPORT SUMMARY ON FEASIBILITY STUDY Page 303 Task Contractor Other Comment Removal of timber X Landowner responsibility; however, Contractor will be responsible for any trees not removed by Landowner. Removal and disposal of sumps, limbs, and roots X All woody debris to be handled and/or disposed of in accordance with IperionX permit, TDEC or other local requirements. If no burn permit can be acquired, debris must be hauled off site and properly disposed of. Initial and ongoing internal site road development associated with life-of-mine plan X Removal and placement of topsoil in berms or other storage areas X Approximately 221,000 cubic meters of topsoil is expected to be removed and placed in berms according to the IperionX permit. Installation & maintenance of erosion and sediment control structures X Must be in accordance with IperionX permit or TDEC requirements. Installation & maintenance of diversion ditches X Must be in accordance with IperionX permit or TDEC requirements. Mining of the Upper McNairy ROM ore and hauling to ROM stockpile X Removal, transport & placement of the interburden material in tailings area X A typical geologic cross section showing the interburden material is shown below. Mining of the Lower McNairy ROM ore and hauling to ROM stockpile X Transport tailings from WCP X Via conveyor belt to waste pile, then via articulated trucks Placement & compaction of WCP tailings in pit X Tailings must be placed on minimum 2.5H:1V (21.7 degrees) slope and compacted to a relative compaction of 92 to 95 percent as compared to the material’s maximum dry density as determined by standard Proctor testing. Contractor is responsible for compaction testing and record keeping. Construction of berms, diversions, and perforated pipe for pit dewatering X Pit dewatering equipment supply, maintenance, and management X Reclamation backfilling, grading, topsoil placement & vegetation X Must be in accordance with IperionX permit or TDEC requirements. Removal and reclamation of sediment control structures X Must be in accordance with IperionX permit or TDEC requirements. MM&A solicited bid prices for contract mining from three independent contractors and received prices back from all three contractors for this FS. Following MM&A’s review of the contractor pricing received, a representative bid was selected as the basis for the mine operating cost estimate. Reclamation and mine closure, waste pile rehandling and maintenance costs are all included in the Contract Mining rate of US$5.23 per cubic meter. Mine power costs were required to operate the system of conveyor belts to transport ROM material to the WCP, and dewatered tailings from the WCP back to the mine pits. A unit cost of US$0.07 per kWh was used in the cost estimate. TITAN PROJECT TENNESSEE, U.S. TECHNICAL REPORT SUMMARY ON FEASIBILITY STUDY Page 304 Labor costs were based on general support personnel required to support the Project beyond the mine contractor services. The burden rate of 25% is assumed. A breakdown of the assumed labor costs is provided in the following table. Table 18-5: Summary of Mining Labor Cost (Not included in Contract Mining) Engineering Manpower # of Employees Total Cost # of Employees Total Cost LOM Total Cost Summary Table Years 1-4 Years 1-4 (US$) Years 5-14 Years 5-14 (US$) 14 Years (US$) Engineering Manager 1 681,600 1 1,704,000 2,385,600 Planning Geologist 1 479,400 1 1,198,500 1,677,901 In-Pit Geologist 1 479,400 3 3,595,500 4,074,903 Drafter/Designer 1 279,425 1 698,563 977,989 Total Cost 1,919,825 7,196,563 9,116,388 Permitting and mitigation costs were based on information provided by Irtec related to the future permitting and stream/wetlands mitigation requirements, and total US$17.1 million over the LOM. LOM mine operating costs for the Titan project are summarized in Table 18-6. Table 18-6: LOM Mining Operating Cost Summary Mining OPEX LOM Cost (US$) % of Total Contract Mining $696,286,361 95.5% Mine Power $6,848,689 0.9% Labor $9,116,388 1.2% Permitting & Mitigation Cost $17,119,762 2.3% Total Variable $729,371,200 100.0% 18.3.3 Process Plant OPEX Table 18-7 presents a summary of the operating costs for the Phase 1 and Phase 2 minerals plant. Phase 1 encompasses the 400 tph WCP, 400 tph MSP and 1,200 tph REP and Phase 2 is the total 1,200-tph WCP, MSP and REP. Table 18-7 assumes annual ore tonnage to be 3,472,534 t for Phase 1 and 10,417,575 t for Phase 2. Table 18-7: Process Plant Operating Cost Summary Cost Center Cost Breakout US$/year US$/tonne Ore Phase 1 Power $2,644,984 $0.76 Plant Labor $6,523,677 $1.88 Consumables $1,038,813 $0.30 General Maintenance $1,518,174 $0.44 Reagents and Utilities $1,453,744 $0.42 Mobile Equipment $998,811 $0.29 Laboratory $324,000 $0.09 General and Administration $1,156,140 $0.33 Total Phase 1 $15,658,344 $4.51 (Continued below)


TITAN PROJECT TENNESSEE, U.S. TECHNICAL REPORT SUMMARY ON FEASIBILITY STUDY Page 305 Cost Center Cost Breakout US$/year US$/tonne Ore Phase 2 Power $6,010,313 $0.58 Plant Labor $9,115,828 $0.88 Consumables $2,597,295 $0.25 General Maintenance $3,196,900 $0.31 Reagents and Utilities $4,194,773 $0.40 Mobile Equipment $1,246,792 $0.12 Laboratory $972,000 $0.09 General and Administration $1,229,920 $0.12 Total Phase 2 $28,563,822 $2.74 18.3.3.1 Power The power operating cost assumptions were 7.04 cents per kWh for Phase 1 and 7 cents per kWh for Phase 2. The rates were based upon an estimate provided by TVA and supplied by IperionX and a load factor of 0.8 and a power factor of 0.9. Power consumption and costs were determined based on calculated plant utilization and a mechanical equipment list provided by MT. The estimated Phase 1 installed power will be 5.0 MW for the WCP and 2.2 MW for the REP and MSP. The Phase 2 installed power will be 13.0 MW for the WCP and 3.8 MW for the REP and MSP. Overall, power consumption for the process plant is expected to be 37.6 Gigawatt-hour (GWh) per year for a total power cost of US$2.6 million per year for Phase 1 and 85.9 GWh per year and US$6.0 million per year for Phase 2. 18.3.3.2 Plant Labor The plant labor cost was estimated to be US$6.5 million for Phase 1 and US$9.1 million for Phase 2 with a total staffing of 62 and 96 people, respectively. The process plant manning plan was provided by MT and G&A of 10 people for each phase was estimated by Primero, and the labor costs were estimated as the sum of supplied salaries by Turner Staffing, and an additional labor cost burden provided by IperionX. Staffing rosters varied and included 14 days on/14 days off, 4 days on/3 days off and weekly rosters. 18.3.3.3 Operating Spares and Consumables The operating spares and consumable costs were estimated to be US$1.0 million for Phase 1 and US$2.6 million for Phase 2. The spares and consumables wear rates and prices were built from vendor quotes and Primero’s previous experience. Spares were provided for all major packages. 18.3.3.4 Plant Maintenance Maintenance costs were estimated at US$1.5 million per year for Phase 1 and US$3.2 million for Phase 2 to account for major planned shutdowns, chute work, piping, valving, operator tools, and other maintenance items. TITAN PROJECT TENNESSEE, U.S. TECHNICAL REPORT SUMMARY ON FEASIBILITY STUDY Page 306 18.3.3.5 Reagents and Utilities Reagents and utilities costs were estimated to be US$1.5 million for Phase 1 and US$4.2 million for Phase 2. These costs were primarily driven by the material transport contract between sites, followed by utilities and reagent supply. Consumption rates for reagents and utilities were provided by MT, while water and sewage unit costs were provided by IperionX. 18.3.3.6 Mobile Equipment The mobile equipment cost summary was split between fuel cost and maintenance and repair costs. The yearly mobile equipment costs for the plant were estimated as $1.0M for Phase 1 and $1.2M for Phase 2. 18.3.3.7 Laboratory Laboratory sample, general analysis, and maintenance operating expenses were priced at US$0.32 million for Phase 1 and US$0.97 million for Phase 2. The laboratory expense rates were provided by MT. 18.3.3.8 General and Administration The general and administration costs included first aid, medicals, PPE, recruitment, IT, cleaning, security, waste management, and training. The yearly general and administration costs were US$1.15 million for Phase 1 and US$1.22 million for Phase 2. 18.3.4 Product Transport Cost The product transport cost was priced based on contractor quotes. The average yearly product transport costs were estimated to be approximately US$3.6 million for Phase 1 and US$8.5 million for Phase 2. 18.3.5 Royalties For the optioned and leased land, IperionX will pay the landowner the greater of 1) US$75 per acre of the property per year, or 2) the production royalty, generally 5% of net revenues from products mined and removed from the property. All properties owned by IperionX or its subsidiary (TN Exploration, LLC) will not incur a royalty. The average yearly royalties were estimated to be approximately US$4.7 million for Phase 1 and US$8.1 million for Phase 2. TITAN PROJECT TENNESSEE, U.S. TECHNICAL REPORT SUMMARY ON FEASIBILITY STUDY Page 307 19 Economic Analysis 19.1 Introduction A discounted cash flow model was developed to evaluate the economic viability of the Project. This financial assessment is based on a 14-year mine life and two-phase approach to construction and production. Phase 1 is based on a feed to the rougher circuit of 400 tph and a duration of 4 years and Phase 2 is based on a feed to the rougher circuit of 1,200 tph and a duration of 10 years. The plant is assumed to operate with a plant availability factor of 95% and utilization factor of 90% annually. All costs and revenues are presented in real terms and denominated in US dollars, with no escalation for inflation). 19.2 DCF Methodology 19.2.1 Key Assumptions The financial model was developed using second-quarter 2026 (Q2 2026) price forecasts and cost estimates, with all figures presented in US dollars and expressed in real terms. The analysis was performed on an unlevered basis, assuming 100% equity financing. A real discount rate of 8% was applied, consistent with industry benchmarks for mining projects in the US. No escalation was applied to operating costs or revenues over the life of the model. The total initial capital cost for Phase 1 is spread over a 20-month period taking into account construction and commissioning, consistent with the execution schedule developed by Primero during the FS phase. Key milestones are summarized in Table 19-1. Table 19-1: Key Milestones Key Milestones Date Phase 1 Construction Start January 2027 Phase 1 Modular Plant Procurement Start January 2027 Phase 1 Commissioning Start June 2028 Phase 1 Production Ramp Up Complete September 2028 Phase 2 Construction Start June 2031 Phase 2 Production Ramp Up Complete September 2032 The model also incorporates assumptions for working capital, government incentives, applicable taxes, operating cost build-up, and inventory turnover, ensuring a comprehensive reflection of the project's early cash flow dynamics. A summary of the key financial assumptions is included in Table 19-2, and the key production inputs are summarized in Table 19-3. TITAN PROJECT TENNESSEE, U.S. TECHNICAL REPORT SUMMARY ON FEASIBILITY STUDY Page 308 Table 19-2: Key Financial Assumptions Key Financial Assumptions Unit of Measure Value Ilmenite LOM Average Sale Price US$/t 353 Rutile LOM Average Sale Price US$/t 1,471 HREC LOM Average Sale Price US$/t 41,759 Zircon Concentrate LOM Average Sale Price US$/t 829 Ilmenite Transport Cost US$/t 11.85 Rutile Transport Cost US$/t 11.85 HREC Transport Cost US$/t 555 Zircon Concentrate Logistics Cost US$/t 65 Discount Rate % 8 Royalties (leased and optioned land) % 5 Federal corporate income tax rate % 21 Tennessee state corporate tax rate % 6.5 Ilmenite Depletion % 22 Rutile Depletion % 22 REE/Monazite Depletion % 14 Zircon Concentrate % 22 Depreciation 100% (OBBBA guidelines) Table 19-3: Key Production Inputs Key Production Inputs Units FS Total Ore Mt 117.0 Total Waste Mt 95.6 Total mine Mt 212.6 Mine life years 14 Strip ratio (w/o) 0.82 Rougher Feed tph 400/1,200 (Phase 1/Phase 2) HMC Produced Mt 3.44 Ilmenite Production Mt 1.37 Rutile Production Mt 0.29 HREC Production Mt 0.06 Zircon Concentrate Production Mt 0.77 LOM Average In Situ HM grade % HM 3.17 Average Ilmenite product recovery % 80.7 Average Rutile product recovery % 64.3 Average REE/Monazite product recovery % 91.4 Average Zircon Concentrate product recovery % 91.8 The annual production data is summarized in Figure 19-1. This production data is based on operating years instead of calendar years with Year 1 commencing in September 2028 through to August 2029.


TITAN PROJECT TENNESSEE, U.S. TECHNICAL REPORT SUMMARY ON FEASIBILITY STUDY Page 309 Figure 19-1: Titan Project Production Profile Note: Figure prepared by Primero, 2026. 19.2.2 Revenue Project revenue was calculated based on a long-term product pricing projection by year that has been provided by TZMI (ilmenite, rutile, zircon), Argus Media (HREC) and Mine Value Partners (MVP) through the life of the Project. Based on this pricing and the projected lifetime production of approximately 2.5 Mt of concentrate production, total gross revenue for the life of the project is estimated at US$4.08 billion. This assumes an increase in production in Phase 2 commencing in Year 5 of operations. The detailed breakdown of revenue by product is detailed in Table 19-4, and broken out in Figure 19-2. Table 19-4: Product Revenue Forecast Product Revenue Total Revenue (US$ million) Production Phase 1 (tpa) Production Phase 2 (tpa) Ilmenite 483 46,228 118,658 Rutile 420 9,772 24,656 HREC 2,539 1,981 5,287 Zircon concentrate 635 27,622 65,668 Total Revenue 4,078 85,603 214,269 TITAN PROJECT TENNESSEE, U.S. TECHNICAL REPORT SUMMARY ON FEASIBILITY STUDY Page 310 Figure 19-2: Titan Project Revenue by Product % Note: Figure prepared by Primero, 2026. 19.2.3 Taxes and Royalties The Titan Project will be subject to standard US federal and Tennessee state corporate taxation regimes. The financial model incorporates a federal corporate income tax rate of 21% and a state corporate tax rate of 6.5%, applied to taxable income as defined under applicable US tax laws. In addition to standard tax provisions, the model includes applicable tax incentives and credits relevant to the project’s critical minerals operation such as depletion tax credits for the applicable mineral. In addition, under the One Big Beautiful Bill Act (OBBBA) the Project is eligible for the 100% first year depreciation deduction. An allowance for depletion has been made to the taxable income based on 22% for heavy mineral sands (ilmenite, rutile, zircon) and 14% for heavy rare earths. The depletion allowance is limited to a maximum of 50% of the taxable income before depletion. For the optioned and leased land, IperionX will pay the landowner the greater of 1) US$75 per acre of the property per year, or 2) the production royalty, generally 5% of net revenues from products mined and removed from the property. TITAN PROJECT TENNESSEE, U.S. TECHNICAL REPORT SUMMARY ON FEASIBILITY STUDY Page 311 19.3 Financial Projections 19.3.1 Summary The economic analysis demonstrates a robust financial profile based on a 2-phase construction and operation approach producing an average of approximately 86,000 tpa in Phase 1 and 214,000 tpa during Phase 2 over a 14-year mine life. Using variable product pricing based on external market studies the project generates US$1.93 billion free cash flow and the post-tax financial model, developed on an unlevered basis, yields a strong net present value at an 8% discount rate (NPV8) of US$813 million and Internal rate of return (IRR) of 39.4%, with a payback period of 3.63 years. The model reflects conservative assumptions on pricing, operating costs, and ramp-up, and indicates that the Project is economically attractive under current market conditions The key economic outcomes of the DCF are outlined in Table 19-5. Table 19-5: FS Financial Results FS Financial Results UoM Value Total EBITDA US$ million 2,804 Pre-Tax NPV8 US$ million 1,016 Pre-Tax IRR % 42.6 Pre-Tax Payback Period Year 3.49 After-Tax NPV8 US$ million 813 After-Tax IRR % 39.4 After-Tax Payback Period Year 3.63 NPV/Initial Capital US$ 3.56 NPV/Total Capital US$ 2.13 19.3.2 Cash Flow Total cash generated by the Project at the end of project life is US$1.93 billion and the after-tax payback period equates to 3.63 years. The real cash flow forecasts provided on an annualized basis in Figure 19-3 and Table 19-6. TITAN PROJECT TENNESSEE, U.S. TECHNICAL REPORT SUMMARY ON FEASIBILITY STUDY Page 312 Figure 19-3: Titan Project After Tax Real Cash Flows Note: Figure prepared by Primero, 2026.


TITAN PROJECT TENNESSEE, U.S. TECHNICAL REPORT SUMMARY ON FEASIBILITY STUDY Page 313 Table 19-6: Annual Cash Flow Items Units Total 2028 2029 2030 2031 2032 2033 2034 2035 2036 2037 2038 2039 2040 2041 2042 Production - Mining Total Material Moved t 212,603,220 2,084,435 6,255,607 5,998,664 6,420,656 13,975,785 23,544,193 19,706,434 19,748,608 20,342,977 18,653,309 18,153,526 16,970,480 15,772,486 15,959,738 9,016,321 Total Ore t 117,027,474 1,144,499 3,412,560 3,386,639 3,411,064 5,691,588 10,224,719 10,078,666 10,066,703 10,192,817 10,295,503 10,260,111 10,166,896 10,865,260 11,107,020 6,723,431 Total Waste t 95,575,745 939,937 2,843,047 2,612,025 3,009,592 8,284,197 13,319,474 9,627,768 9,681,905 10,150,161 8,357,806 7,893,415 6,803,584 4,907,226 4,852,718 2,292,890 Stripping Ratio - 0.82 0.82 0.83 0.77 0.88 1.46 1.30 0.96 0.96 1.00 0.81 0.77 0.67 0.45 0.44 0.34 In situ Grade % 3.17 5.02 4.65 3.63 3.33 3.38 3.15 3.21 3.18 2.83 2.65 2.88 2.99 3.00 3.45 3.35 Production - Process Plant HMC Produced t 3,443,653 51,622 145,345 116,085 106,116 175,783 296,192 307,433 297,938 268,143 253,295 274,542 282,941 302,542 356,387 209,291 Final Products t 2,485,104 39,313 105,535 73,312 67,299 127,238 201,129 184,836 188,189 185,231 186,801 208,637 206,373 245,394 304,422 161,394 Ilmenite t 1,371,495 21,491 58,242 40,480 34,791 65,197 100,090 91,533 96,487 98,067 105,553 122,848 122,000 141,980 178,872 93,862 Rutile t 285,651 4,745 12,717 8,704 7,292 12,810 22,438 25,107 27,309 27,917 24,517 24,240 24,868 23,449 25,202 14,338 HREC t 60,790 1,017 2,501 1,304 1,526 4,139 6,764 4,704 4,103 3,751 3,596 4,164 4,645 5,623 7,526 5,427 Zircon Concentrate t 767,168 12,060 32,076 22,824 23,689 45,092 71,837 63,491 60,289 55,496 53,135 57,386 54,861 74,342 92,822 47,767 Gross Revenue Ilmenite US$ 483,464,848 6,667,592 19,040,460 14,344,777 12,328,866 23,103,693 35,468,685 32,436,361 34,191,804 34,751,581 37,404,364 43,533,302 43,232,617 50,313,051 63,386,137 33,261,557 Rutile US$ 420,183,495 6,704,064 19,240,948 12,795,338 10,719,511 18,830,148 32,983,312 36,906,870 40,143,920 41,037,658 36,040,261 35,632,222 36,555,306 34,470,024 37,047,492 21,076,421 HREC US$ 2,538,526,706 44,087,311 107,857,157 55,689,738 64,508,562 173,426,876 281,435,032 195,613,075 170,594,308 156,999,364 149,560,196 172,558,774 192,495,483 234,197,867 313,454,427 226,048,536 Zircon Concentrate US$ 635,806,508 7,206,613 20,186,539 19,205,635 19,934,011 37,944,125 60,449,399 53,426,462 50,732,034 46,698,481 44,711,676 48,288,682 46,164,066 62,556,707 78,107,285 40,194,792 Gross Revenue US$ 4,077,981,557 64,665,581 166,325,103 102,035,489 107,490,950 253,304,842 410,336,428 318,382,769 295,662,067 279,487,083 267,716,498 300,012,980 318,447,471 381,537,649 491,995,342 320,581,305 Operating Expenditure Total Mining Costs US$ 729,371,200 5,956,670 18,993,631 20,427,618 21,904,226 47,761,076 80,550,647 66,615,478 67,418,284 71,213,445 66,855,870 63,356,427 59,251,227 54,853,878 53,649,322 30,563,400 Total Phase I Plant OPEX US$ 62,083,407 5,096,499 15,412,447 15,658,344 15,584,078 10,332,039 - - - - - - - - - - Total Phase 2 Plant OPEX US$ 279,673,505 - - - - 9,249,097 28,019,468 28,563,822 28,231,285 28,223,919 28,193,557 28,169,106 28,250,027 27,757,830 27,020,966 17,994,429 Total Transport Costs US$ 103,241,780 1,659,207 4,313,656 2,790,216 2,885,567 6,152,622 9,875,208 8,119,936 7,663,063 7,182,014 6,990,861 7,784,007 7,884,336 9,913,311 12,628,581 7,399,196 Total Cost of Sales US$ 1,174,369,892 12,712,376 38,719,733 38,876,178 40,373,871 73,494,834 118,445,323 103,299,235 103,312,632 106,619,378 102,040,288 99,309,540 95,385,589 92,525,020 93,298,869 55,957,025 Royalties % 99,511,847 2,597,660 6,380,268 3,157,966 3,355,854 8,990,500 13,583,249 7,052,987 4,035,683 1,482,463 96,718 1,837,044 4,817,972 8,957,445 19,934,824 13,231,214 Total Operating Expenses US$ 1,273,881,739 15,310,037 45,100,002 42,034,143 43,729,725 82,485,335 132,028,571 110,352,222 107,348,315 108,101,841 102,137,006 101,146,584 100,203,562 101,482,465 113,233,692 69,188,239 Operating Cash Flow - EBITDA US$ 2,804,099,818 49,355,545 121,225,101 60,001,345 63,761,225 170,819,508 278,307,856 208,030,547 188,313,752 171,385,243 165,579,491 198,866,396 218,243,910 280,055,184 378,761,649 251,393,066 Capital Expenditure Phase 1 US$ 228,126,319 81,983,477 - - - - - - - - - - - - - - Phase 2 US$ 153,198,038 - - - 70,336,161 82,861,877 - - - - - - - - - - Total CAPEX US$ 381,324,357 81,983,477 - - 70,336,161 82,861,877 - - - - - - - - - - Sustaining Capital Total Sustaining Capital US$ 23,331,518 195,743 577,814 571,500 584,016 1,103,212 2,018,031 1,375,318 983,360 1,352,233 1,279,779 1,515,785 2,584,110 4,403,635 4,213,638 573,341 Production Working Capital Working Capital US$ - 13,033,831 -7,049,320 -1,408,945 4,895,900 20,000,044 -9,088,243 -1,349,035 -1,249,794 -2,378,338 3,125,745 1,611,195 1,045,241 12,682,970 -664,253 -33,206,998 Taxable Income US$ 1,780,049,975 -17,721,504 3,622,841 8,414,247 21,734,704 57,611,147 171,697,382 140,377,184 133,223,706 121,879,919 119,081,329 147,758,155 164,488,541 215,201,906 295,379,985 197,300,433 Tax Paid US$ 466,717,862 - - - 5,676,070 15,058,417 44,873,111 36,687,577 34,818,016 31,853,317 31,121,905 38,616,594 42,989,080 56,243,018 77,197,559 51,583,198 NPAT (includes add back of depletion) US$ 1,932,726,082 -17,721,504 16,532,039 22,782,769 33,091,846 69,411,149 191,195,522 155,365,012 147,233,895 136,507,451 132,545,597 158,729,807 173,425,326 220,901,219 297,186,916 195,539,038 Free Cash Flows US$ 1,932,726,082 -45,857,507 127,696,607 60,838,790 -17,730,923 51,795,957 240,504,957 171,316,686 153,762,170 140,558,031 130,052,062 157,122,822 171,625,479 206,725,561 298,014,705 232,443,525 TITAN PROJECT TENNESSEE, U.S. TECHNICAL REPORT SUMMARY ON FEASIBILITY STUDY Page 314 19.3.3 Sensitivity Analysis A sensitivity analysis was performed to assess Project sensitivity to: capital cost estimates, operating cost estimates, grade, and product pricing. The results are summarized in Figure 19-4 and Figure 19-5 and demonstrate that the project is most sensitive to sales prices followed by grade. Figure 19-4: Titan Project Sensitivity Analysis – After Tax IRR Note: Figure prepared by Primero, 2026. Figure 19-5: Titan Project Sensitivity Analysis – After Tax NPV8 Note: Figure prepared by Primero, 2026. TITAN PROJECT TENNESSEE, U.S. TECHNICAL REPORT SUMMARY ON FEASIBILITY STUDY Page 315 In terms of IRR, the Project is most sensitive, in order from most to least sensitive, to: > product pricing > grade > Phase 1 capital costs > operating costs > Phase 2 capital costs In terms of the NPV, the Project is most sensitive, in order from most to least sensitive, to: > product pricing > grade > operating cost estimates > Phase 1 capital costs > Phase 2 capital costs TITAN PROJECT TENNESSEE, U.S. TECHNICAL REPORT SUMMARY ON FEASIBILITY STUDY Page 316 20 Adjacent Properties This section is not relevant to this Report.


TITAN PROJECT TENNESSEE, U.S. TECHNICAL REPORT SUMMARY ON FEASIBILITY STUDY Page 317 21 Other Relevant Data and Information This section is not relevant to this Report. TITAN PROJECT TENNESSEE, U.S. TECHNICAL REPORT SUMMARY ON FEASIBILITY STUDY Page 318 22 Interpretation and Conclusions 22.1 Introduction The QPs note the following interpretations and conclusions, based on the review of data and information available for this Report. 22.2 Property Setting The Project is located in an area with good local and regional infrastructure and the ability to supply goods to support mining operations is well-established. Personnel with experience in mining-related activities are available in the district. There are transportation routes that access the Project area. There are no significant topographic issues that would affect the proposed Project. The designated floodplain areas of the Big Sandy River and the Bear Creek tributary cross the Property, and a floodplain exclusion was used in the Study. 22.3 Ownership The Project is owned by IXCM, a wholly-owned subsidiary of IperionX Limited. 22.4 Mineral Tenure, Surface Rights, Water Rights, Royalties and Agreements As of June 4, 2026, the Titan Project is comprised of approximately 40.8 km2 (10,091 acres) of surface and associated mineral rights in Tennessee, of which approximately 6.0 km2 (1,490 acres) are owned by IperionX, approximately 5.9 km2 (1,457 acres) are subject to long-term lease by IperionX, and approximately 28.9 km2 (7,144 acres) are subject to exclusive option agreements with IperionX. These exclusive option agreements, upon exercise, allow IperionX access to the surface property and associated mineral rights. IperionX’s option to lease agreements, upon exercise, allow IperionX to lease the surface property and associated mineral rights from the local landowners, and generally have expiry dates between 2027 to 2032. During the option period, the option to lease agreements provide for annual option payments and bonus payments during periods when drilling is conducted. IperionX’s annual option payments are US$75.00 per acre and the drilling bonuses generally average approximately US$1.00 per drill foot. IperionX’s obligation to make annual option payments and drilling bonus payments cease if the company exercises the option to lease. IperionX has acquired surface, subsurface and water rights to the properties within the resource area. Some of the properties have been acquired in fee simple by IperionX, with IperionX now being the sole owner of the surface, subsurface and water rights for such properties. IperionX has entered into long- term ground leases for other properties, with the right to control the surface, subsurface and water rights TITAN PROJECT TENNESSEE, U.S. TECHNICAL REPORT SUMMARY ON FEASIBILITY STUDY Page 319 related to those properties for the term of the respective ground leases. For the rest of the properties, IperionX holds an option to lease such properties conditioned on annual option payments that are current and ongoing. The option agreements grant IperionX the right to evaluate the surface, subsurface and water rights to such optioned properties. For the optioned and leased land, IperionX will pay the landowner the greater of 1) US$75 per acre of the property per year, or 2) the production royalty, generally 5% of net revenues from products mined and removed from the property. All properties owned by IperionX or its subsidiary (TN Exploration, LLC) will not incur a royalty. 22.5 Geology and Mineralization The deposit is an example of a heavy mineral sands deltaic sequence deposit. The Study Area is situated in the East Gulf Plain within the Atlantic Coastal Plain Physiographic Province of the US. The East Gulf Plain syncline of the Mississippi Embayment has a shallow southward plunge, exists east of the Mississippi River, and extends from southern Illinois south into Mississippi and Alabama. Locally the basin is filled with Cretaceous to recent Quaternary age sedimentary rocks and sediments. The deposition represents a pro-grading deltaic environment during a regressive (sea level lowering) sequence. The local near-surface geology represents a pro-grading deltaic environment during a regressive marine sequence. This is evidenced by the coarsening upward sequence grading from the glauconitic clay-rich Coon Creek Formation to the finer grained lower member of the McNairy Formation to the coarser grained upper member of the McNairy Formation. The heavy mineral sands are hosted in McNairy Formation sand units, with the higher heavy mineral grades mainly in the lower portion of the Lower McNairy Formation member. Titan mineral sands consist of TiO2 minerals and ZrSiO4 and REE and other elements. The geological understanding of the settings, lithologies, and structural and alteration controls on mineralization in the different zones is sufficient to support estimation of mineral resources and mineral reserves. The geological knowledge of the area is also considered sufficiently acceptable to reliably inform mine planning. The mineralization style and setting are well understood and can support declaration of mineral resources and mineral reserves. 22.6 History No previous heavy mineral sand mining has occurred in the region. TITAN PROJECT TENNESSEE, U.S. TECHNICAL REPORT SUMMARY ON FEASIBILITY STUDY Page 320 Reportedly, the general Project area has been explored for heavy mineral sands since the 1950s as the McNairy Formation was known to contain high concentrations of heavy minerals based on work by federal and state agencies. IperionX conducted drilling campaigns in 2020, 2021 and 2022 to explore the Titan Project. 22.7 Exploration, Drilling, and Sampling IperionX has completed no geological mapping or geophysical surveys in the Project area. All exploration is conducted using drill methods. The property retains exploration potential to the east across Big Sandy River and to the southeast along strike, with additional potential to the northeast along strike. Across all Titan properties including those outside of the Project, IperionX has drilled 313 holes (11,382 meters or 37,343 feet). Drilling in the Study Area comprises 156 drill holes, this including 16 RC holes (837 meters or 2,746 feet) and 140 roto-sonic drill holes (5,644 meters or 18,517 feet). The quantity and quality of the lithological, geotechnical, collar and down-hole survey data collected during the drill programs are sufficient to support mineral resource and mineral reserve estimation. The collected sample data adequately reflects deposit dimensions, true widths of mineralization, and the deposit style. Sampling is representative of the deposit grades, reflecting areas of higher and lower grades. Drill samples were sent to SGS Lakefield. SGS Lakefield is a qualified third-party laboratory that is independent of IperionX. SGS Lakefield is accredited as an ISO 17025 facility for selected analytical techniques. Sample preparation and analytical methods are in line with industry standards for heavy mineral sands deposits. The QA/QC programs adequately address issues of precision, accuracy, and contamination. Drilling programs typically included blanks, duplicates, and standards. QA/QC submission rates meet industry- accepted standards. 22.8 Data Verification MM&A QPs conducted a site visit to the Project area. The QP reviewed lithological data logs, THM and QEMSCAN results. Sufficient data have been obtained through Titan exploration and sampling programs to support the geological interpretations of the mineral sands deposit situated on the Project. The data are of sufficient quantity and reliability to reasonably support the mineral resource and mineral reserve estimates. 22.9 Metallurgical Testwork The processing flowsheet was based on metallurgical testwork programs conducted in 2021 and 2023 on representative Upper and Lower McNairy Formation mineralization.


TITAN PROJECT TENNESSEE, U.S. TECHNICAL REPORT SUMMARY ON FEASIBILITY STUDY Page 321 Testwork demonstrated that the mineralization is amenable to conventional mineral sands processing techniques, including desliming, wet gravity separation, flotation, and dry electrostatic and magnetic separation. Indicative metallurgical recoveries were estimated through process modelling informed by metallurgical testwork results. On an in-size (+45 micron) basis, estimated recoveries from run-of-mine feed to final products are approximately 82.6% for rare earth minerals, 79.7% for ilmenite, 66.9% for rutile, and 77.6% for zircon. Product grades achieved during testwork are considered saleable, subject to further confirmation and optimization during subsequent project phases. Deleterious elements such as iron, magnesium, uranium, thorium, chromium, and vanadium are present at low levels and can negatively impact the marketability of heavy mineral sands products, especially uranium and thorium. High levels of these contaminants may reduce product quality, result in regulatory penalties, or require additional processing, which increases costs. Environmental considerations, particularly tailings management and the potential presence of radioactive or toxic elements, can add complexity and expenses due to stricter regulations, water management, and the need for site rehabilitation after mining operations. 22.10 Mineral Resource Estimates Mineral resources are reported using the mineral resource definitions set out in SK-1300 and are reported inclusive of those mineral resources converted to mineral reserves. Mineral resources are estimated for the reported controlled mineral tracts of the Project excluding areas within the designated floodplain. Based on the data review, the attendant work done to verify the data integrity and the creation of an independent geologic model, MM&A believes this to be a fair and accurate representation of the IperionX mineral resources. Factors that may affect the estimates include changes to property control; changes to forecast commodity and final product price assumptions; changes in local interpretations of mineralization geometry and continuity of mineralized zones; changes to metallurgical recovery assumptions; changes to assumptions as to deleterious elements; changes to the input assumptions used to derive the conceptual open pit shell that is used to constrain the estimates; changes to the cut-off values applied to the estimates; variations in geotechnical, hydrogeological and mining assumptions; changes to pit optimization assumptions; changes to mine design; and changes to environmental, permitting and social license assumptions. 22.11 Mineral Reserve Estimates Measured and indicated mineral resources were converted to mineral reserves. Inferred mineral resources were treated as waste. TITAN PROJECT TENNESSEE, U.S. TECHNICAL REPORT SUMMARY ON FEASIBILITY STUDY Page 322 Mineral reserves are reported using the mineral reserve definitions set out in SK-1300. The reference point for the estimate is the point of delivery to the process plant. Factors that may affect the estimates include changes to property control (i.e., owned, leased and optioned tracts); changes to forecast commodity and final product price assumptions; changes in local interpretations of mineralization geometry and continuity of mineralized zones; changes to metallurgical recovery assumptions; changes to assumptions as to deleterious elements; changes to the input assumptions used to derive the conceptual open pit shell that is used to constrain the estimates; changes to the cut-off values applied to the estimates; variations in geotechnical, hydrogeological and mining assumptions; changes to pit optimization assumptions; changes to mine design; and changes to environmental, permitting and social license assumptions. 22.12 Mining Methods Mine planning involved geotechnical and hydrogeological assessment. The geotechnical assessment completed considered both pit slope stability and reclaimed, backfilled tailings stability, and incorporated hydrogeological modeling results. The study assumes that mining contractors will provide all labor and material for support equipment including all mobile mining equipment, water truck, dozer(s) capable of maintaining the waste disposal volumes, motor grader, utility loader backhoe, fixed or portable lights, pumps, and a utility articulated haul truck (for erosion control measures cleaning, etc.). The cost of the initial capital cost for all mobile equipment, in addition to equipment rebuilds and/or replacement throughout the life of the mines, will be incurred by the mining contractor. A combination of excavators and articulated trucks will be used to mine the ROM ore as well as all topsoil, overburden and interburden waste material. ROM stockpiles and initial waste disposal areas are designed to minimize haul distances. Conveyors will be used to transport ROM ore from the mine area to the WCP, and dewatered tailings from the WCP back to the pits for disposal in the final backfill. A finalized mine plan was created based on nested pits created from initial optimizations to create route profiles for equipment sizing and scheduling. These plans were developed by MM&A to allow mining contractors to match production requirements by year to excavators, articulated haul trucks and fixed and mobile conveyors which ultimately resulted in preparing cost analysis data used in mining cost modeling. Mining operations are based on providing approximately 3.5 Mt per year for Phase 1 (Years 1-4) and approximately 10.0 Mt per year for Phase 2 (Years 5-14) to the WCP. 22.13 Processing and Recovery Methods The FS defined a technically robust and scalable process design for the Project, accommodating both the initial 400-tph development and the planned expansion to 1,200 tph. The selected flowsheet, equipment TITAN PROJECT TENNESSEE, U.S. TECHNICAL REPORT SUMMARY ON FEASIBILITY STUDY Page 323 selections, and plant layouts are based on conventional, well-proven mineral sands processing technologies and are supported by extensive prior testwork, process modelling and MT’s operational experience. The proposed flowsheet incorporates configuration, scale, and operational changes relative to the flowsheets tested during the metallurgical programs. As such, the final process design represents a combination of demonstrated testwork performance, experience from comparable operations, vendor data, and process modelling. The adopted process configuration includes: > feed preparation with scrubbing, screening, and desliming > multi-stage wet gravity separation to produce an HMC > rare earth mineral recovery using attritioning, flotation, and gravity upgrading to produce a HREC > dry electrostatic and magnetic separation to produce ilmenite, rutile, and zircon concentrates The adopted design provided a clear execution pathway for staged development while maintaining a high degree of equipment commonality between the initial and expanded plant phases. This approach reduced operation complexity, improved maintainability, and supported efficient capital deployment across the LOM. The extensive use of modularization is expected to reduce site construction risk, improve schedule certainty, and enhance overall cost control. Trade-off studies completed for tailings dewatering and zircon product pathways informed key design decisions. The selected tailings dewatering configuration is considered feasible. The zircon trade-off study identified a preferred product pathway that balances metallurgical performance, regulatory compliance, processing simplicity, and market acceptance. Process plant layouts for both the WCP and MSP sites incorporate allowances for staged expansion, operability, maintenance access, and material handling. A modular construction strategy is adopted across the major plant areas to reduce site construction duration and execution risk. Development of the WCP and the MSP will be carried out in two phases, Phase 1 and Phase 2. The REP will be carried out in Phase 1. The phases will consist of: > Phase 1– 400 tph rougher feed to WCP and MSP from year 1 to year 4 > Phase 1– up to 1,200 tph to REP from year 1 to Mine life (14 years) > Phase 2– 1,200 tph rougher feed to WCP and MSP from Year 5 through year 14 (end of mine) TITAN PROJECT TENNESSEE, U.S. TECHNICAL REPORT SUMMARY ON FEASIBILITY STUDY Page 324 22.14 Infrastructure The Project is split between Benton and Carrol Counties with the proposed WCP to reside in Carroll County. CSX operates a railyard approximately 11 km (7 miles) from the MSP/REP site. Transportation of material between the MSP/REP and the railyard will be conducted by over-the-road trucking. Similarly, the movement of product from the WCP to the MSP/REP will be conducted through over-the-road trucking. Transportation of ROM and tailings materials between the mine pits and the processing plants will be conducted by conveyor belts. The main transportation belt will be dual purpose with the top belt taking ROM material from the pits to the plant and the bottom belt returning to the pits with the tailings. NPI buildings will be located at the WCP and MSP facilities for all operations and maintenance personnel either as vendor supplied modular buildings or engineered structures. NPI at the WCP will include a warehouse and ablutions building. NPI at the MSP will include an administration building, warehouse and laboratory and sample preparation building. Established design precedents from facilities with similar functions and requirements were used and the designs are consistent with the approved basis of design. This approach will ensure that the NPI at both the WCP and MSP reflect proven layouts and operational needs while maintaining alignment with regulatory, safety, and project standards. 22.15 Market Studies The Titan Project is differentiated within the US critical minerals landscape by its ability to produce multiple saleable mineral products from a single mineral sands project. On the current FS design basis, the Project is planned to produce ilmenite, rutile, and zircon concentrates and an HREC, providing exposure to titanium feedstocks, zirconium-bearing minerals, and strategically important rare earth oxides from one domestic source. This product mix is commercially important because it serves multiple large and established end markets, while also aligning with the strategic objective of rebuilding secure US supply chains for critical minerals presently dominated by foreign producers, and in particular by China. Revenue assumptions were provided by IperionX and were based on independent third-party commodity price forecasts and concentrate valuation methodologies incorporated into the consolidated FS commodity pricing tables and applied in the financial model. All prices were modeled in real 2026 US dollars. Titanium and zircon mineral sands market conditions and price forecasts are based on the Titanium Feedstock Price Forecast (Issue 3, 2025) prepared by TZ Minerals International Pty Ltd (TZMI). HREC pricing is based on the IperionX Rare Earth Concentrate Calculations (April 2026) prepared by Argus Media and Expected Payability for Rare Earth Concentrates from IperionX's Titan Project (April 30, 2026) prepared by Mine Value Partners (MVP). Magnet rare earth oxide supply and demand data referenced in this sub-section are based on the ‘Rare Earth Magnet Market Outlook to 2040’ report (Q4 2025) prepared by Adamas Intelligence (Adamas).


TITAN PROJECT TENNESSEE, U.S. TECHNICAL REPORT SUMMARY ON FEASIBILITY STUDY Page 325 22.16 Environmental, Permitting and Social Considerations IperionX has secured the following permits and agency approvals for the existing permit area: Mining Permit (surface mining of titanium and mineral sands), NPDES Permit (to discharge treated mine wastewater and stormwater), Insignificant Activity Registration (air quality registration for sources of insignificant emissions), Approved Jurisdictional Determination (from the USACE), and Hydrological Determination (from the TDEC). As mining planning progresses, the existing permits and agency approvals will require modification to incorporate the entirety of the proposed mine site. Although there have been environmental due diligence studies performed within the environmental due diligence study area that cover the majority of the proposed mine site, they are outdated and will require appropriate re-reviews, updates, and field work as applicable. Tennessee state regulations require mines to be properly closed, and reclamation commenced immediately upon abandonment. The financial model for the Titan Project includes cost for mine reclamation and closure within the contract mining operating cost of US$5.23 per cubic meter. The MSP parcel, located in unincorporated Benton County is part of an industrial park; however, significant development has yet to occur within the MSP parcel boundary. Neither the MSP nor the REP are currently permitted. The waste and tailings disposal plan is fully integrated with the overall mine plan. At the beginning of mining, waste and tailings material will be placed, as needed, in temporary waste piles on the ground surface located 1.) in the Year 11 mining area and 2.) in the area northeast of the WCP. Tailings material will be filtered at the WCP to an optimum moisture content of approximately 16% to 18%. The use of filtered tailings allows the material to be placed like soil in backfilled lifts in the pits as mining progresses, thus minimizing the tailings storage footprint, and reclaiming the pit areas to near their original surface elevations. The temporary, out-of-pit waste storage areas are estimated to only be required through approximately Year 5 of mining, after which all tailings and waste material will be backfilled into the pit as mining progresses. Water management on the site will be important for dewatering the mine pits, supplying the WCP, ensuring stability of the in-pit backfill material, and ensuring compliant discharge at the NPDES outfalls. Expected groundwater inflow to the pits has been estimated via groundwater modeling conducted by HDR. Groundwater that enters the pit will be collected in a sump near the mining face and pumped into settling ponds on the perimeter of the property. Water that is pumped to the ponds will be settled to remove turbidity and suspended solids. If necessary, pH control of the water will be conducted within the settling ponds. IperionX has undertaken preliminary engagement with local stakeholders in the Project area, including landowners, community representatives, and local or regional authorities, to support Project planning and to identify social, land access, and community considerations relevant to development. TITAN PROJECT TENNESSEE, U.S. TECHNICAL REPORT SUMMARY ON FEASIBILITY STUDY Page 326 22.17 Capital Cost Estimates Capital cost estimates are at a minimum at a feasibility level of confidence, having an accuracy level of ±15% and a contingency of 10%. Estimated quantities and scope definitions for civil, structural, mechanical, piping, electrical, instrumentation, and other applicable disciplines were derived from these deliverables and used as the primary basis for the development of direct costs. Where applicable, selected cost inputs, pricing assumptions, and scope information provided by all parties contributing to the estimate were also incorporated into the estimate. Direct costs generally comprise labor, materials, equipment, and subcontracted services associated with the supply, installation, and construction of the project facilities. These costs were developed from the relevant MTOs, scope definitions, vendor and contractor inputs, and estimating assumptions applicable to each discipline. The estimate also includes the indirect costs necessary to support overall project execution. These generally comprise the temporary facilities, construction support, supervision, field management, and other project-related costs required to plan, manage, and deliver the work within the defined execution framework. The total capital cost estimate for Phase 1 is US$228.1 million, and the total capital cost estimate for Phase 2 is US$153.2 million, for a total Project capital cost estimate of US$381.3 million. 22.18 Operating Cost Estimates The operating cost estimate (OPEX) has been performed for Mining, Process Plant, Product Transport and Royalties. The following list of cost centers were used for the Process Plant OPEX estimation: salaries; General & Administrative (G&A); reagents; consumables; utilities (electricity, fuel, water, etc.); maintenance; and mobile equipment. The estimates have an accuracy of ±15%. The estimate base date is Q2, 2026. Total operating costs average US$45.3 M per annum for Phase 1 and US$109.3 M per annum for Phase 2. This equates to US$13.31/t ore for Phase 1 and US$10.57/t ore for Phase 2. 22.19 Economic Analysis A DCF model was based on a 14-year mine life and two-phase approach to construction and production. Using variable product pricing based on external market studies, the Project generates US$1.93 billion free cash flow and the post-tax financial model, developed on an unlevered basis, has an NPV of US$813 million at an 8% discount rate and IRR of 39.4%, with a payback period of 3.63 years. TITAN PROJECT TENNESSEE, U.S. TECHNICAL REPORT SUMMARY ON FEASIBILITY STUDY Page 327 A sensitivity analysis was undertaken to determine the Project sensitivity for variations in product pricing, grade, capital cost estimates, and operating cost estimates. The sensitivity analysis demonstrates that the project is most sensitive to sales prices followed by grade. 22.20 Risks MT, Primero, and MM&A contributed to a Project risk register and risk workshop. Following completion of the workshop, Primero carried out a Monte Carlo simulation to quantify the potential cost impact of the identified risks and to support the development of an appropriate contingency allowance. Noteable project risks identified by the QPs that could potentially impact the Titan mining and processing operations include: 1. Commodity pricing drops unexpectedly, due to overseas competition and flooding of the market 2. Discharged water does not meet permit requirements for discharge from site, which may result in permit violations and public protests or environmental incidents 3. Underperformance of the mining contractor may lead to lower-than-expected production levels 4. Permits and/or mitigation measures related to mining through streams and wetlands are unsuccessful and prohibit full extraction of reserves within mine plan 5. TVA is unable to provide the necessary electrical power to service the mine and plant operations prior to Phase 2 of the project 6. Desliming circuit may allow slimes through to the WCP which will result throughput reduction or restriction 7. Periods of high slimes may slow plant throughput, due to thickener constraint on load handling capability 8. Inability to maintain MSP building temperature and humidity impacting plant performance and recovery A nominal 10% contingency allowance was used for the direct and indirect costs of the design and supply estimate. Contingency allowance was not added to the budget estimate items. This was considered contractor’s contingency which would be applicable to a fixed price design and supply contract. This contingency allowance sits outside of the Owner’s contingency risk. It is recommended the Owner’s contingency account for the following additional key risks that are not accounted for in the design and supply cost estimate: 1. Cost escalation resulting from time and economic events 2. Movement in foreign exchange rates 3. Escalation and uncertainty in logistics costs due to timing being a long way out from contract execution TITAN PROJECT TENNESSEE, U.S. TECHNICAL REPORT SUMMARY ON FEASIBILITY STUDY Page 328 4. Escalation resulting from changing suppliers from low-cost country vendors 5. Escalation resulting from restriction in trade or changes to import tariffs 6. Process performance not being achieved due to equipment supplied from low-cost countries not performing as intended 7. Unable to obtain enforceable process and throughput performance guarantees from vendors 8. Unable to use low-cost equipment and manufacturing supply chain due to sanctions on supply of equipment into international projects associated with rare earths 9. Tailings dewatering equipment proves to be ineffective as planned and additional CAPEX/OPEX is necessary to achieve required moisture contents 22.21 Opportunities 22.21.1 Project Area Opportunities include: > potential to add to the property holdings and increase the exploration potential for the mineral tenure to host prospective McNairy Formation units > if the mineralization currently classified as Inferred can be upgraded with additional drilling and mining study support > review of the mining area vs floodplain buffer allocations to determine if a portion of the buffer area can be included in the mine plan > varying the COG, thereby increasing annual ROM ore tonnage > increasing the Revenue Factor, thereby expanding the optimized pit shell and increasing annual ROM ore tonnage > outside the Project area, the “Camden area” mineral tenure drill results suggest the potential to support mineral resource estimation. The area is favorable because erosion has removed the Upper McNairy Formation unit, exposing Lower McNairy Formation sands. 22.21.2 Processing The following opportunities have been identified for further exploration in subsequent project phases: > increase extent of modularization, particularly around the belt filter press once preferred vendor has been selected > further optimize the extent of piping pre-assembly and balance the use of pipe racks to minimize site construction costs > complete a transport study to investigate inland transport options to reduce risk and costs of freight to site


TITAN PROJECT TENNESSEE, U.S. TECHNICAL REPORT SUMMARY ON FEASIBILITY STUDY Page 329 22.22 Conclusions Under the assumptions presented in this Report, the Project has a mine plan that is technically feasible and economically viable. The positive net present value of the Project supports the mineral reserve estimates. TITAN PROJECT TENNESSEE, U.S. TECHNICAL REPORT SUMMARY ON FEASIBILITY STUDY Page 330 23 Recommendations The recommended work programs from the QPs include: 23.1 Mining 1. Complete TDEC permit modification, wetlands and stream mitigation analysis, permitting and construction (approximately US$17.2 million) 2. Update of baseline surface water and groundwater studies (approximately US$100,000) 3. Permitting recommendations for the mine site (approximately US$0.75 million total): a. re-review existing field delineation of federal and state waters and add area not yet investigated b. re-review existing field habitat assessments of federal and state protected species and add area not yet investigated; species-specific surveys may be included c. update desktop-level cultural resources assessment d. conduct informal consultations with USFWS, TDEC, and THC (possible increased costs dependent on results of review) e. update USACE AJD verification (WoTUS) f. update TDEC-DWR HD concurrence (waters of the state) g. conduct pre-application meeting with USACE and TDEC-DWR as the Mine Site will likely result in Section 404/401 Individual Permit and thus trigger a NEPA review 4. Permitting for the MSP (approximately US$0.25 million total): a. obtain NPDES construction and industrial permits b. conduct field delineation of federal and state waters c. conduct field habitat assessments of federal and state protected species d. conduct desktop-level cultural resources assessment (possible increased costs dependent on results of review) e. complete informal consultations with USFWS, TDEC, and THC f. after completion of the above-mentioned studies at the MSP, complete the following: i. USACE AJD verification (WoTUS) ii. TDEC-DWR HD concurrence (waters of the state) iii. USFWS informal consultation, including MBTA and BGEPA iv. THC coordination TITAN PROJECT TENNESSEE, U.S. TECHNICAL REPORT SUMMARY ON FEASIBILITY STUDY Page 331 5. Waste and tailings disposal: a. if possible, continue to pursue the opportunity to sell tailings as by-product to further reduce tailings handling in early years of mining (to be completed by IperionX staff) 6. Social considerations, plans, negotiations and agreements (approximately $US40,000 per year): a. continue engagement activities with local groups and individuals as the Project advances, consistent with applicable laws and regulations, and in a manner customary for heavy mineral sands projects development b. consider qualified local individuals and businesses in hiring and procurement processes, consistent with standard industry practice, applicable laws, and operational needs 23.2 Processing 23.2.1 Recommendations Prior to progressing the Titan Project into detailed design and execution, it is recommended that the following activities be completed: 1. Confirmatory Metallurgical and Process Testwork - Undertake the recommended confirmatory metallurgical testwork program to validate the revised FS flowsheet, equipment selections, and key design assumptions, particularly where the final design differs from earlier pilot‑scale testwork. Outcomes should be used to confirm achievable recoveries, moisture targets, operating parameters, and equipment sizing, and to support vendor performance guarantees. 2. Low‑Cost Country Vendor Verification - Implement a structured verification and risk mitigation program for major equipment proposed to be sourced from low‑cost country vendors. This should include performance verification, reference plant assessments where available, and evaluation of quality assurance, warranties, spare parts availability, and long‑term vendor support. 3. Tailings Dewatering and Deposition Validation - Further validate the ability of the selected tailings dewatering circuit to consistently achieve the target combined tailings moisture content (≤16% w/w, not to exceed 20% w/w) under full‑scale operating conditions. Where practical, pilot scale vendor testwork should be undertaken, with findings incorporated into final equipment selection, sizing, and operating philosophy. 4. Logistics, Transport, and Route Assessment - Complete a detailed logistics and transportation study to de‑risk the modular delivery strategy. The study should confirm optimal shipping methodology, preferred destination port(s), inland transport routes, over‑dimensional constraints, permitting requirements, and maximum practical module sizes and weights, and be used to inform final module design and fabrication strategy. 5. Detailed Design Interface Definition - Clearly define and progress detailed design interfaces and battery limits between various contract scopes. Focus should be placed on civil, structural, TITAN PROJECT TENNESSEE, U.S. TECHNICAL REPORT SUMMARY ON FEASIBILITY STUDY Page 332 mechanical, and utility interfaces to minimize the risk of scope gaps, rework, or constructability issues during execution. 6. Bridging Engineering and Execution Readiness - Proceed with a structured bridging engineering phase to finalize process design, complete hazard and operability study (HAZOP) and risk reviews, refine capital and operating cost estimates, and advance engineering definition to support fixed‑price contracting. This phase should also be used to further identify and implement value‑engineering opportunities. 23.2.1.1 Recommended Metallurgical Testwork The FS process flowsheet was developed from reference to metallurgical flowsheet development testwork results on Titan material, as well as experience with other similar applications. Modelling of this flowsheet was conducted based on agreed process design criteria (using metallurgical testwork results where available/appropriate but also many assumptions and estimates) to determine mass and water and elemental balances for design, equipment sizing, and overall performance estimates. Given that there were significant changes made to the FS design process flowsheet compared to the flowsheet developed from completed metallurgical testwork and that some of the equipment included in the flowsheet was not tested and instead relied on experience or vendor estimates, it is recommended that further confirmatory metallurgical testwork is undertaken by IperionX before the next design phase of the project. It is recommended that the testwork outlined in the following sub-sections be considered. 23.2.1.2 Feed Preparation Plant > Scrubber/trommel testwork to confirm sizing (vendor estimate may be considered sufficient for design but may be required for performance guarantee). > Feed screen testwork to confirm sizing (vendor estimate may be considered sufficient for design but may be required for performance guarantee). > Deslime cyclone testwork to confirm sizing and optimum set-up, as well as achievable mass split to overflow and underflow density (vendor simulations may be considered sufficient for design). > Surge bin testwork, including mass flow property testwork, to confirm wall angles and surface coating, as well as achievable solids consolidation density in bin. Sizing will be confirmed based on designated cut point to overflow and/or minimum surge capacity required. 23.2.1.3 Tailings Dewatering Circuit > Thickener testwork to confirm flocculant type and addition rate and maximum feed density, solids flux rate and overflow rise rate for sizing, as well as achievable underflow density. > Belt filter press testwork to confirm flocculant type and addition rate, and maximum unit solids and volumetric feed rates and recirculating load of solids to cloth wash for sizing, as well as achievable filter cake moisture.


TITAN PROJECT TENNESSEE, U.S. TECHNICAL REPORT SUMMARY ON FEASIBILITY STUDY Page 333 > Sand tails dewatering cyclone and screen testwork to confirm maximum unit solids and volumetric feed rates and recirculating load of solids to screen undersize for sizing, as well as achievable screen oversize moisture (vendor estimate may be considered sufficient for design but may be required for performance guarantee). 23.2.1.4 Wet Concentrator Plant and Concentrate Upgrade Plant > Bulk testwork program to confirm performance estimates for design of the latest 5-stage (rougher, mid scavenger, cleaner, recleaner and finisher) WCP spirals circuit, with designated spiral types and loadings in each stage, rougher and mid scavenger spiral super-concentrates going to recleaner spirals, no finisher spiral tails oversize removal (screens) and recirculation of cleaner spirals stage tailings to the rougher spirals stage to maximize HM recovery. > Bulk testwork program to confirm performance estimates for design of the latest CUP circuit, including UCC, UCC overflow spirals and HMC oversize screen. > UCC and UCC overflow spirals feed cyclones testwork to confirm sizing and optimum set-up, as well as achievable mass splits to overflow and underflow densities (vendor simulations may be considered sufficient for design). 23.2.2 Estimated Cost of Process Recommendations The estimated cost of the recommended work programs outlined above has been developed at an order‑of‑magnitude level consistent with FS definition. The total cost is estimated to be in the range of approximately US$5 million to US$7 million. This estimate reflects the targeted nature of the recommended activities, which are focused on confirmation and validation of key design assumptions rather than development of a fundamentally new process flowsheet. The primary cost components are associated with confirmatory metallurgical testwork, including bulk pilot programs and tailings dewatering validation using vendor‑supported test facilities, together with a structured bridging engineering phase to advance the design to execution readiness. The bridging engineering phase is expected to comprise the largest single component of this cost range and includes process design refinement, equipment definition, layout development, and completion of key risk reviews such as HAZOP. The remaining costs are associated with focused unit‑operation testwork (e.g., cyclones, screening, and dewatering equipment), targeted vendor verification activities for major equipment suppliers, and completion of logistics and transport studies to support the modular execution strategy. The estimated cost range reflects the use of existing metallurgical testwork data, reliance on vendor‑supported test programs in lieu of full‑scale pilot campaigns, and a targeted approach to engineering progression. These estimates are based on benchmarking against comparable mineral sands projects at a similar stage of development and are considered appropriate for inclusion in the TRS. TITAN PROJECT TENNESSEE, U.S. TECHNICAL REPORT SUMMARY ON FEASIBILITY STUDY Page 334 24 References 24.1 Bibliography 1 Mineral Technologies Report, Titan Mineral Sands Project – Benton Ore, Conventional Wet Gravity and Dry Physical Separation Testwork Including Creation of Ilmenite, Rutile, Zircon, and Monazite Concentrate from Provided Ore Samples, MTNA21069, Rev.2, September 22, 2021. 2 Mineral Technologies Report, Titan Mineral Sands Project – Camden Ore, Scoping Testwork for Wet Gravity, Rare Earth Mineral Flotation and Dry Physical Separation to Produce Concentrates of Zircon, Monazite and Titanium Minerals, MS21/3394979/1, Rev.2, February 16, 2022. 3 Primero Scoping Study Report, Titan Heavy Mineral Sands Project, 40501-REP-GE-002, June 2022. 4 HDR, Technical Memo, IperionX Baseline Groundwater and Surface Water Assessment, July 15, 2022. 5 HDR, IperionX Groundwater Flow Model, December 14, 2022. 6 State of Tennessee Department of Environment and Conservation “Issuance of NPDES Permit and Mining Permit, NPDES Permit TN0070711, Mining Permit OM-70711-01, IperionX Critical Minerals LLC, Titan Project, Carroll and Henry Counties” approved August 14, 2023. 7 IperionX Titan Project Technical Report Summary, October 6, 2021. 8 IperionX “Technical Report Summary for Titan Project”, submitted by IperionX as of June 30, 2024. 9 S&ME - “Report of Geotechnical Exploration – Titan Heavy Mineral Sands Project – Wet/Dry Plant, Camden Tennessee, S&ME Project No. 22350271B”, submitted to IperionX on August 14, 2025. 10 S&ME - “Report of Geotechnical Exploration – Titan Heavy Mineral Sands Project – Mine Pit Side Wall Slopes, Camden Tennessee, S&ME Project No. 22350271B”, submitted to IperionX on August 21, 2025. 11 S&ME - “Report of Engineering Services – Titan Heavy Mineral Sands Project – Tailings Slope, Camden Tennessee, S&ME Project No. 22350271B”, submitted to IperionX on August 27, 2025. 12 HDR - “Groundwater Flow Model Addendum, IPX, Henry and Carroll Counties, TN” submitted to IperionX on March 30, 2026. 13 MM&A –“Request for Mine Prices – IperionX Limited Titan Project near Camden, Tennessee” submitted to mining contractors February 20, 2026. 14 Mineral Technologies Report - “Titan Feasibility Study Report, IperionX Critical Minerals LLC” April 16, 2026. 15 Perma - Fix Environmental Services, Inc., “Radiation Management Plan for the IperionX Titan Heavy Mineral Sands Project, Tennessee – Draft”, submitted to IperionX July 2022. TITAN PROJECT TENNESSEE, U.S. TECHNICAL REPORT SUMMARY ON FEASIBILITY STUDY Page 335 16 Primero - “Project Risk Register – Titan Heavy Miner Sand Feasibility Study” December 2, 2025. 17 MM&A - SME Mining Reference Handbook, (2002), published by the Society for Mining, Metallurgy, and Exploration, Inc., Edited by Lowrie, R.L. 18 USEPA. Ecoregions of Mississippi - https://www3.epa.gov/airquality/greenbook/ancl.html 19 https://web.archive.org/web/20220119153425/https://gaftp.epa.gov/EPADataCommons/ORD/ Ecoregions/ms/ms_front.pdf 20 RCRA Hazardous Waste Disposal in Tennessee https://encamp.com/rcra-hazardous-waste- compliance/tennessee/ 21 Treatment, Storage, and Disposal Facilities. https://www.tn.gov/environment/program- areas/solid-waste/hw/tsd-facilities.html 22 2023.04.20_IperionX application package updated: Application document prepared by IRTEC for a new source NPDES permit and new Surface Minig Permit for WCP site. 23 Titan Permit Area -SPM 5 1_IRTEC: A map showing the extent of permit boundary for WCP site and mine. 24 IPX103 Mineral Separation Plant Location 25 650 Divider and Natchez Trace Road ESA Final _Phase 1 Environmental Site Assessment. The Breland Group 2024. 26 Mine Value Partners – “Expected Payability for Rare Earth Concentrates from IperionX’s Titan project”, 30 April 2026. 27 TZ Minerals International Pty Ltd (TZMI) - Titanium Feedstock Price Forecast (Issue 3, 2025) 28 Argus Media - IperionX Rare Earth Concentrate Calculations (April 2026) 29 Adamas Intelligence - Rare Earth Magnet Market Outlook to 2040 (Q4 2025) 30 USEPA. Ecoregions of Mississippi. https://web.archive.org/web/20220119153425/https://gaftp.epa.gov/EPADataCommons/ORD/ Ecoregions/ms/ms_front.pdf 31 USFWS. 2025. Northern Long-eared Bat and Tricolored Bat Voluntary Environmental Review Process for Development Projects. https://www.fws.gov/sites/default/files/documents/2025- 04/nleb_tcb_consultation_guidance_version-1.1_final_.pdf. 32 EPA Application Form 2D. https://www.epa.gov/sites/default/files/2019- 05/documents/form_2d_epa_form_3510-2d.pdf 24.2 Abbreviations, Acronyms and Units of Measure Table 24-1: Abbreviations, acronyms, and units of measure. Acronym Definition 2-D Two-dimensional 3-D Three-dimensional AACE Advancement of Cost Engineering TITAN PROJECT TENNESSEE, U.S. TECHNICAL REPORT SUMMARY ON FEASIBILITY STUDY Page 336 Acronym Definition ABA Acid Base Accounting Adamas Adamas Intelligence AISC All In Sustaining Costs AJD Approved Jurisdictional Determination AlO3 Aluminum oxide AP Acid Potential ARAP Aquatic Resource Alteration Permit ARD Acid rock drainage Argus Argus Media ASTM ASTM International AUD Australian Dollar BGEPA Bald and Golden Eagle Protection Act CAGR Compound Annual Growth Rate CAPEX Capital cost CeO2 Cerium (IV) oxide cm centimeters COG Cut-Off Grade CSX CSX Transportation CUP Concentrate Upgrade Plant CWA Clean Water Act DCF Discounted Cash Flow DO Dissolved oxygen DRH Division of Radiological Health Dy2O3 Dysprosium oxide EPA US Environmental Protection Agency EPCM Engineering, Procurement, Construction, and Management ESA Endangered Species Act FEL front-end loader FEMA Federal Emergency Management Agency FPP Feed Preparation Plant FPW Flotation process water FS Feasibility Study G&A General and Administrative costs g/cm³ grams per cubic centimeter GARAP General Aquatic Resource Alteration Permit Geoprobe Geoprobe 5140LS roto-sonic drill rig GeoSpark GeoSpark Consulting Inc. GIS Geographic information system gpd Gallons per day gpm Gallons per minute G-Squared L.L.C. G-Squared HAZOP Hazard and operability study Ha Hectare HDR HDR Engineering, Inc. HLS Heavy Liquid Separation HM% Heavy mineral percent HMC Heavy Mineral Concentrate HMS Heavy mineral sands hp Horsepower HPO Historic Preservation Office


TITAN PROJECT TENNESSEE, U.S. TECHNICAL REPORT SUMMARY ON FEASIBILITY STUDY Page 337 Acronym Definition HREC Heavy rare earth concentrate, HREE-dominant by value HREE Heavy rare earth elements HTRS High-tension roll separator HV High voltage I/O Input/output ICP-MS Inductively-couple plasma mass spectrometry ID2 Second power interpolation IP Individual Permit IPaC USFWS Information for Planning and Consultation IperionX IperionX Limited IRMS Induced roll magnetic separator IRR Internal Rate of Return Irtec Innovative Reclamation Technologies & Engineering Co., Inc. IXCM IperionX Critical Minerals, LLC kg Kilograms KGS Karst Geo Solutions, LLC km Kilometers km² Square kilometers K-MINE K-MINE Group kV Kilovolt KWT Kentucky-West Tennessee Railway lbs Pounds LED Light-Emitting Diode LFCU Lyons Feed control Unit LOA Living out allowance LOM Life of mine m/day Meters per day m²/day Square meters per day MBTA Migratory Bird Treaty Act MCCs Motor control centers MinComp Mineral composition MM&A Marshall Miller & Associates, Inc. MOUs Memoranda of Understanding MPA Max Potential Acidity MRE Mineral resource estimate MSHA US Department of Labor Mine Safety and Health Administration MSP Mineral Separation Plant MT Mineral Technologies Pty Ltd Mt Million metric tonnes MTO's Material takeoffs Mtpa Million tonnes per annum MUP Mining Unit Plant NEPA National Environmental Policy Act NHP TDEC Natural Heritage Program NHPA National Historic Preservation Act NNP Net Neutralization Potential NP Neutralization Potential NPDES National Pollutant Discharge Elimination System NPI Non-process infrastructure NPV Net Present Value TITAN PROJECT TENNESSEE, U.S. TECHNICAL REPORT SUMMARY ON FEASIBILITY STUDY Page 338 Acronym Definition NPV8 Net Present Value at 8% discount rate NRC United States Nuclear Regulatory Commission NRHP National Register of Historic Places NTUs Nephelometric turbidity units NWP Nationwide permit O/F Overflow OBBBA One Big Beautiful Bill Act OLED Organic Light-Emitting Diode OPEX Operating cost ORP Oxidation reduction potential OSHA Occupational Safety and Health Administration Pace Pace Analytical Services LLC PCC Primary Conductor Circuit PDC Primary Dry Circuit PFDs Process Flow Diagrams PNCC Primary Non-conductor Circuit PPE personal protective equipment Primero Primero Group Americas Inc. QAQC Quality assurance and quality control QEMSCAN Quantitative evaluation of materials by scanning electron microscopy QPs Qualified Persons RC Reverse Circulation RCRA Resource Conservation and Recovery Act REDS Rare earth drum separator REE Rare earth elements REE* the combined rare earth %, Monazite % and Xenotime % REP Rare Earth Plant RERS rare earth roll magnetic separator RF Revenue Factor RIO Remote I/O ROM Run of mine ROW Right-of-way S&ME S&ME, Inc. SEC US Securities and Exchange Commission SGS Lakefield SGS - Canada - Lakefield SI International System of Units metric System SiO2 Silicon dioxide S-K1300 Regulation S-K 1300 %Slimes Percent slime STEM Science, Technology, Engineering, and Mathematics SWPPP Stormwater pollution prevention plan t/m³ Tonnes per cubic meter Tb4O7 Terbium oxide TCLP Toxicity Characteristic Leaching Potential TDC Tailings dewatering circuit TDEC Tennessee Department of Environment and Conservation TDEC-DWR TDEC Division of Water Resources TDOA Tennessee Division of Archaeology TDS Total dissolved solids Terrasonic Terrasonic 150c rig TITAN PROJECT TENNESSEE, U.S. TECHNICAL REPORT SUMMARY ON FEASIBILITY STUDY Page 339 Acronym Definition THC Tennessee Historical Commission the Project the Titan Product the Study Definitive Feasibility Study THM Total Heavy Minerals THM% Percent of total heavy minerals TiCl4 Titanium Tetrachloride TiO2 Titanium Dioxide TN APC Tennessee Division of Air Pollution Control TNGenWeb Tennessee Cemetery Database TNWSCA Threatened Wildlife Species Conservation Act tonnes Metric tonnes tpa Tonnes per annum tph Tonnes per hour TREO Total Rare Earth Oxides TRS Technical Report Summary TVA Tennessee Valley Authority TZMI TZ Minerals International Pty Ltd UCC Up Current Classifier US United States US$ United States Dollars US$/t US Dollar per tonne USACE US Army Corps of Engineers USFWS United States Fish and Wildlife Service USGS US Geological Survey UT University of Tennessee UTIA University of Tennessee Institute of Agriculture UV Ultra-violet VAC Volt alternating current VSDs Variable speed drives Wallis Wallis RC rig WBS Work Breakdown Structure WCP Wet Concentrator Plant WET Whole Effluent Toxicity WoTUS Waters of the US XRF X-ray fusion YSZ Yttria-stabilized Zirconia ZrO2 Zirconium Dioxide 24.3 Glossary of Terms Term Definition block Model A 3-dimensional grid of cells used to represent spatial, geological, or economic data, primarily in mining for modeling ore bodies. concentrate The concentrate is the valuable product from mineral processing, as opposed to the tailing, which contains the waste minerals. cut-off grade The grade (i.e., the concentration of metal or mineral in rock) that determines the destination of the material during mining. data verification The process of confirming that data has been generated with proper procedures, has been accurately transcribed from the original source and is suitable to be used for mineral resource estimation. TITAN PROJECT TENNESSEE, U.S. TECHNICAL REPORT SUMMARY ON FEASIBILITY STUDY Page 340 Term Definition feasibility study A comprehensive technical and economic study of the selected development option for a mineral project, which includes detailed assessments of all applicable modifying factors, as defined by this section, together with any other relevant operational factors, and detailed financial analysis that are necessary to demonstrate, at the time of reporting, that extraction is economically viable. The results of the study may serve as the basis for a final decision by a proponent or financial institution to proceed with, or finance, the development of the project. (1) A feasibility study is more comprehensive, and with a higher degree of accuracy, than a pre-feasibility study. It must contain mining, infrastructure, and process designs completed with sufficient rigor to serve as the basis for an investment decision or to support project financing. (2) The confidence level in the results of a feasibility study is higher than the confidence level in the results of a pre-feasibility study. Terms such as full, final, comprehensive, bankable, or definitive feasibility study are equivalent to a feasibility study. encumbrance An interest or partial right in real property which diminished the value of ownership but does not prevent the transfer of ownership. Mortgages, taxes, and judgements are encumbrances known as liens. Restrictions, easements, and reservations are also encumbrances, although not liens. gangue minerals The commercially worthless, unwanted rock or mineral materials associated with valuable ore deposits. heavy liquid separation Heavy liquid separation is an analytical laboratory-based float-sink test to separate minerals based on their density by means of a high-density liquid to aid in prediction of mineral grades from future gravity-based processing circuitry. heavy minerals Heavy minerals are defined as minerals having a higher density than quartz, the most common rock-forming soil mineral with a density of 2.65 g/cm3. indicated mineral resource An indicated mineral resource is that part of a mineral resource for which quantity and grade or quality are estimated on the basis of adequate geological evidence and sampling. The level of geological certainty associated with an indicated mineral resource is sufficient to allow a qualified person to apply modifying factors in sufficient detail to support mine planning and evaluation of the economic viability of the deposit. Because an indicated mineral resource has a lower level of confidence than the level of confidence of a measured mineral resource, an indicated mineral resource may only be converted to a probable mineral reserve. induced roll magnetic separator A mineral processing device that uses electromagnetically generated high intensity magnetic fields in order to continuously separate small paramagnetic particles (ranging from less than 2 microns to 45 microns) from non-magnetic materials. inferred mineral resource An inferred mineral resource is that part of a mineral resource for which quantity and grade or quality are estimated on the basis of limited geological evidence and sampling. The level of geological uncertainty associated with an inferred mineral resource is too high to apply relevant technical and economic factors likely to influence the prospects of economic extraction in a manner useful for evaluation of economic viability. Because an inferred mineral resource has the lowest level of geological confidence of all mineral resources, which prevents the application of the modifying factors in a manner useful for evaluation of economic viability, an inferred mineral resource may not be considered when assessing the economic viability of a mining project, and may not be converted to a mineral reserve. A qualified person must have a reasonable expectation that the majority of inferred mineral resources could be upgraded to indicated or measured mineral resources with continued exploration; and should be able to defend the basis of this expectation before his or her peers.


TITAN PROJECT TENNESSEE, U.S. TECHNICAL REPORT SUMMARY ON FEASIBILITY STUDY Page 341 Term Definition initial assessment An initial assessment is a preliminary technical and economic study of the economic potential of all or parts of mineralization to support the disclosure of mineral resources. The initial assessment must be prepared by a qualified person and must include appropriate assessments of reasonably assumed technical and economic factors, together with any other relevant operational factors, that are necessary to demonstrate at the time of reporting that there are reasonable prospects for economic extraction. An initial assessment is required for disclosure of mineral resources but cannot be used as the basis for disclosure of mineral reserves. measured mineral resource That part of a mineral resource for which quantity and grade or quality are estimated on the basis of conclusive geological evidence and sampling. The level of geological certainty associated with a measured mineral resource is sufficient to allow a qualified person to apply modifying factors, as defined in this section, in sufficient detail to support detailed mine planning and final evaluation of the economic viability of the deposit. Because a measured mineral resource has a higher level of confidence than the level of confidence of either an indicated mineral resource or an inferred mineral resource, a measured mineral resource may be converted to a proven mineral reserve or to a probable mineral reserve. mineral reserve A mineral reserve is an estimate of tonnage and grade or quality of indicated and measured mineral resources that, in the opinion of the qualified person, can be the basis of an economically viable project. More specifically, it is the economically mineable part of a measured or indicated mineral resource, which includes diluting materials and allowances for losses that may occur when the material is mined or extracted. mineral resource A mineral resource is a concentration or occurrence of material of economic interest in or on the Earth's crust in such form, grade or quality, and quantity that there are reasonable prospects for economic extraction. A mineral resource is a reasonable estimate of mineralization, taking into account relevant factors such as cut-off grade, likely mining dimensions, location, or continuity, that, with the assumed and justifiable technical and economic conditions, is likely to, in whole or in part, become economically extractable. It is not merely an inventory of all mineralization drilled or sampled. mineral sands Concentrations of heavy minerals in an alluvial (old beach or river system) environment. mineral separation plant Using screening, magnetic, electrostatic and gravity separation circuits to separate valuable minerals from non-valuable minerals, and to make different ilmenite, rutile, leucoxene, and zircon product grades for specific customer requirements. modifying factors the factors that a qualified person must apply to indicated and measured mineral resources and then evaluate in order to establish the economic viability of mineral reserves. A qualified person must apply and evaluate modifying factors to convert measured and indicated mineral resources to proven and probable mineral reserves. These factors include, but are not restricted to: Mining; processing; metallurgical; infrastructure; economic; marketing; legal; environmental compliance; plans, negotiations, or agreements with local individuals or groups; and governmental factors. The number, type and specific characteristics of the modifying factors applied will necessarily be a function of and depend upon the mineral, mine, property, or project. open pit A mine that is entirely on the surface. Also referred to as open-cut or open-cast mine. probable mineral reserve A probable mineral reserve the economically mineable part of an indicated and, in some cases, a measured mineral resource. TITAN PROJECT TENNESSEE, U.S. TECHNICAL REPORT SUMMARY ON FEASIBILITY STUDY Page 342 Term Definition proven mineral reserve A proven mineral reserve is the economically mineable part of a measured mineral resource and can only result from conversion of a measured mineral resource. qualified person A qualified person under SEC S-K 1300 regulations as a person who is a mineral industry professional with at least five years of relevant experience in the type of mineralization and type of deposit under consideration and in the specific type of activity that person is undertaking on. In addition, a qualified person is required to be an eligible member or licensee in good standing of a recognized professional organization at the time the technical report is prepared. The rules provide that a third-party firm, which employs a qualified person, may sign the technical report summary and provide the written consent required for an expert under Section 11 of the Securities Act, without naming the individual qualified person. If the qualified person is an employee of the registrant, however, he or she must provide the written consent on an individual basis. rare earth roll magnetic separator A dry, permanent magnetic separator used to remove or concentrate weak paramagnetic particles (ranging from 15mm to 75mm) from non-magnetic materials, particularly in mineral processing, ceramics, and recycling industries. reclamation The restoration of a site after mining or exploration activity is completed. royalty An amount of money paid at regular intervals by the lessee or operator of an exploration or mining property to the owner of the ground. Generally based on a specific amount per tonne or a percentage of the total production or profits. Also, the fee paid for the right to use a patented process. run-of-mine material Raw, unprocessed ore immediately after extraction from a mine. specific gravity The weight of a substance compared with the weight of an equal volume of pure water at 4°C. total heavy minerals Total volume of heavy minerals within a deposit. up current classifier A mineral processing device that separates particles based on size and density using an upward flow of water to create a teeter-bed (fluidized bed). variogram A graphical tool in geostatistics utilized to measure how data points differ as the distances between the points increase. The method plots the average squared difference between pairs of data points against their separation distance and serves as a base for mapping spatial continuity and modeling spatial correlation for techniques like kriging. wet concentration plant Utilizing sizing and gravity differentiation between heavy minerals, valuable heavy minerals, clay and quartz to produce a high-grade (between 85 and 98 per cent) heavy mineral concentrate, retaining valuable minerals, and minimizing gangue within the concentrate. TITAN PROJECT TENNESSEE, U.S. TECHNICAL REPORT SUMMARY ON FEASIBILITY STUDY Page 343 25 Reliance on Information Provided by the Registrant A summary of the information provided by IperionX relied upon by the QPs for the purposes of this TRS is provided in Table 25-1. Table 25-1: Information from Registrant Relied Upon by QPs Category Information Provided by IperionX Report Section Marketing Long-term price forecast used in financial projections, information relating to market studies for different products, market strategies, marketing, and sales contracts. 16 Legal Mineral control and surface control rights as shown on maps, including information relating to the ownership, the mineral tenure, surface rights, water rights, royalties, encumbrances, permitting requirements. 3.2, 3.3, 3.4, 3.5 Stakeholder Accommodations Information relating to community relations. 3.9, 17.6, 17.7, 17.8 Environmental Information relating to baseline and supporting studies for environmental permitting, permit and bonding information. 3.7, 3.8, 17


Exhibit 15.2
CONSENT OF INDEPENDENT REGISTERED PUBLIC ACCOUNTING FIRM
We hereby consent to the incorporation by reference in the Registration Statement on Form Form S-8 (No. 333-267088) of IperionX Limited our report dated September 29, 2026 relating to the consolidated financial statements and the effectiveness of internal control over financial reporting of IperionX Limited, which appears in this Form 20-F.
/s/ PricewaterhouseCoopers

Melbourne, Australia
September 29, 2026


Exhibit 15.3
Consent of Qualified Person

I, Etienne Raffaillac, in connection with the annual report on Form 20-F of IperionX Limited (the “Company”) for the year ended June 30, 2026 and any further amendments or supplements and/or exhibits thereto (collectively, the “Form 20-F”), consent to:
    
•the incorporation by reference and use of the technical report summary titled “Technical Report Summary for Titan Project” (as amended, the “Technical Report Summary”), as an exhibit to the Form 20-F;

•the incorporation by reference of the Technical Report Summary into the Company's Registration Statement on Form S-8 (No. 333-267088);

•the use of and references to my, including my status as an expert or “qualified person” (as defined in Subpart 1300 of Regulation S-K promulgated by the Securities and Exchange Commission), in connection with the Form 20-F and the Technical Report Summary; and

•any extracts from, or summaries of, the Technical Report Summary in the Form 20-F and the use of information derived, summarized, quoted or referenced from the Technical Report Summary, or portions thereof, that was prepared by me, that I supervised the preparation of and/or that was reviewed and approved by me, that is included or incorporated by reference in the Form 20-F.

I am responsible for authoring, and this consent pertains to the particular sections identified in the Technical Report Summary as having been prepared by me and the corresponding sections of the Executive Summary.

Date: September 29, 2026
    
By: /s/ Etienne Raffaillac
Name: Etienne Raffaillac


Exhibit 15.4
Consent of Qualified Person

Marshall Miller & Associates, Inc., in connection with the annual report on Form 20-F of IperionX Limited (the “Company”) for the year ended June 30, 2026 and any further amendments or supplements and/or exhibits thereto (collectively, the “Form 20-F”), consent to:
    
•the incorporation by reference and use of the technical report summary titled “Technical Report Summary for Titan Project” (as amended, the “Technical Report Summary”), as an exhibit to the Form 20-F;

•the incorporation by reference of the Technical Report Summary into the Company's Registration Statement on Form S-8 (No. 333-267088);

•the use of and references to our name, including our status as an expert or “qualified person” (as defined in Subpart 1300 of Regulation S-K promulgated by the Securities and Exchange Commission), in connection with the Form 20-F and the Technical Report Summary; and

•any extracts from, or summaries of, the Technical Report Summary in the Form 20-F and the use of information derived, summarized, quoted or referenced from the Technical Report Summary, or portions thereof, that was prepared by us, that we supervised the preparation of and/or that was reviewed and approved by us, that is included or incorporated by reference in the Form 20-F.

Marshall Miller & Associates, Inc. is responsible for authoring, and this consent pertains to the particular sections identified in the Technical Report Summary as having been prepared by Marshall Miller & Associates, Inc. and the corresponding sections of the Executive Summary.

Date: September 29, 2026
    
By: /s/ Marshall Miller & Associates, Inc.
Name: Marshall Miller & Associates, Inc.


Exhibit 15.5
Consent of Qualified Person

Primero Group Americas Inc., in connection with the annual report on Form 20-F of IperionX Limited (the “Company”) for the year ended June 30, 2026 and any further amendments or supplements and/or exhibits thereto (collectively, the “Form 20-F”), consent to:
    
•the incorporation by reference and use of the technical report summary titled “Technical Report Summary for Titan Project” (as amended, the “Technical Report Summary”), as an exhibit to the Form 20-F;

•the incorporation by reference of the Technical Report Summary into the Company's Registration Statement on Form S-8 (No. 333-267088);

•the use of and references to our name, including our status as an expert or “qualified person” (as defined in Subpart 1300 of Regulation S-K promulgated by the Securities and Exchange Commission), in connection with the Form 20-F and the Technical Report Summary; and

•any extracts from, or summaries of, the Technical Report Summary in the Form 20-F and the use of information derived, summarized, quoted or referenced from the Technical Report Summary, or portions thereof, that was prepared by us, that we supervised the preparation of and/or that was reviewed and approved by us, that is included or incorporated by reference in the Form 20-F.


Primero Group Americas Inc. is responsible for authoring, and this consent pertains to the particular sections identified in the Technical Report Summary as having been prepared by Primero Group Americas Inc. and the corresponding sections of the Executive Summary.


Date: September 29, 2026
    
By: /s/ Primero Group Americas Inc.
Name: Primero Group Americas Inc.


Exhibit 15.6
Consent of Qualified Person

Karst Geo Solutions, LLC, in connection with the annual report on Form 20-F of IperionX Limited (the “Company”) for the year ended June 30, 2026 and any further amendments or supplements and/or exhibits thereto (collectively, the “Form 20-F”), consent to:
    
•the incorporation by reference and use of the technical report summary titled “Technical Report Summary for Titan Project” (as amended, the “Technical Report Summary”), as an exhibit to the Form 20-F;

•the incorporation by reference of the Technical Report Summary into the Company's Registration Statement on Form S-8 (No. 333-267088);

•the use of and references to our name, including our status as an expert or “qualified person” (as defined in Subpart 1300 of Regulation S-K promulgated by the Securities and Exchange Commission), in connection with the Form 20-F and the Technical Report Summary; and

•any extracts from, or summaries of, the Technical Report Summary in the Form 20-F and the use of information derived, summarized, quoted or referenced from the Technical Report Summary, or portions thereof, that was prepared by us, that we supervised the preparation of and/or that was reviewed and approved by us, that is included or incorporated by reference in the Form 20-F.

Karst Geo Solutions, LLC is responsible for authoring, and this consent pertains to the particular sections identified in the Technical Report Summary as having been prepared by Karst Geo Solutions, LLC and the corresponding sections of the Executive Summary.

Date: September 29, 2026
    
By: /s/ Karst Geo Solutions, LLC
Name: Karst Geo Solutions, LLC