Supplemental Financial Information Fourth Quarter 2019 investors.ironmountain.com
Safe Harbor Statement Under the Private Securities Litigation Reform Act of 1995: Safe Harbor Statement Under the Private Securities Litigation Reform Act of 1995: This release contains certain forward-looking statements within the meaning of the Private Securities Litigation Reform Act of 1995 and other securities laws and is subject to the safe-harbor created by such Act. Forward-looking statements include, but are not limited to, our financial performance outlook and statements concerning our operations, economic performance, financial condition, goals, beliefs, future growth strategies, investment objectives, plans and current expectations, such as 2020 guidance, expected benefits, costs and actions related to Project Summit, and statements about our investments, dividend policy, leverage, and other goals. These forward- looking statements are subject to various known and unknown risks, uncertainties and other factors. When we use words such as "believes," "expects," "anticipates," "estimates" or similar expressions, we are making forward-looking statements. Although we believe that our forward-looking statements are based on reasonable assumptions, our expected results may not be achieved, and actual results may differ materially from our expectations. In addition important factors that could cause actual results to differ from expectations include, among others: (i) our ability to remain qualified for taxation as a real estate investment trust for U.S. federal income tax purposes; (ii) the adoption of alternative technologies and shifts by our customers to storage of data through non-paper based technologies; (iii) changes in customer preferences and demand for our storage and information management services; (iv) the cost and our ability to comply with laws, regulations and customer demands relating to data security and privacy issues, as well as fire and safety standards; (v) our ability or inability to execute our strategic growth plan, expand internationally, complete acquisitions on satisfactory terms, and to integrate acquired companies efficiently; (vi) changes in the amount of our growth and recurring capital expenditures and our ability to raise capital and invest according to plan; (vii) the impact of litigation or disputes that may arise in connection with incidents in which we fail to protect our customers' information or our internal records or IT systems and the impact of such incidents on our reputation and ability to compete; and (viii) our ability to execute on Project Summit and the potential impacts of Project Summit on our ability to retain and recruit employees and execute on our strategy; (ix) changes in the price for our storage and information management services relative to the cost of providing such storage and information management services; (x) changes in the political and economic environments in the countries in which our international subsidiaries operate and changes in the global political climate; (xi) the impact of executing on our growth strategy through joint ventures; (xii) our ability to comply with our existing debt obligations and restrictions on our debt instruments or to obtain additional financing to meet our working capital needs; (xiii) the impact of service interruptions or equipment damage and the cost of power on our data center operations; (xiv) changes in the cost of our debt; (xv) the impact of alternative, more attractive investments on dividends; (xvi) the cost or potential liabilities associated with real estate necessary for our business; (xvii) the performance of business partners upon whom we depend for technical assistance or management expertise; (xviii) other trends in competitive or economic conditions affecting our financial condition or results of operations not presently contemplated; and (xix) other risks described more fully in our filings with the Securities and Exchange Commission, including under the caption “Risk Factors” in our periodic reports or incorporated therein. You should not rely upon forward-looking statements except as statements of our present intentions and of our present expectations, which may or may not occur. Except as required by law, we undertake no obligation to release publicly the result of any revision to these forward- looking statements that may be made to reflect events or circumstances after the date hereof or to reflect the occurrence of unanticipated events. Reconciliation of Non-GAAP Measures: Throughout this presentation, Iron Mountain will discuss (1) Adjusted EBITDA, (2) Adjusted Earnings per Share (“Adjusted EPS”), (3) Funds from Operations (“FFO Nareit”), (4) FFO (Normalized) and (5) Adjusted Funds from Operations (“AFFO”). These measures do not conform to accounting principles generally accepted in the United States (“GAAP”). These non-GAAP measures are supplemental metrics designed to enhance our disclosure and to provide additional information that we believe to be important for investors to consider in addition to, but not as a substitute for, other measures of financial performance reported in accordance with GAAP, such as operating income, income (loss) from continuing operations, net income (loss) attributable to Iron Mountain Incorporated or cash flows from operating activities from continuing operations (as determined in accordance with GAAP). The reconciliation of these measures to the appropriate GAAP measure, as required by Regulation G under the Securities Exchange Act of 1934, as amended, and their definitions are included later in this document (see Table of Contents). Iron Mountain does not provide a reconciliation of non-GAAP measures that it discusses as part of its annual guidance or long term outlook because certain significant information required for such reconciliation is not available without unreasonable efforts or at all, including, most notably, the impact of exchange rates on Iron Mountain’s transactions, loss or gain related to the disposition of property, plant and equipment (including of real estate) and other income or expense. Without this information, Iron Mountain does not believe that a reconciliation would be meaningful. Investor Relations Contacts: Greer Aviv, 617-535-2887 Nathan McCurren, 617-535-2997 Senior Vice President, Investor Relations Director, Investor Relations [email protected] [email protected] investors.ironmountain.com 2
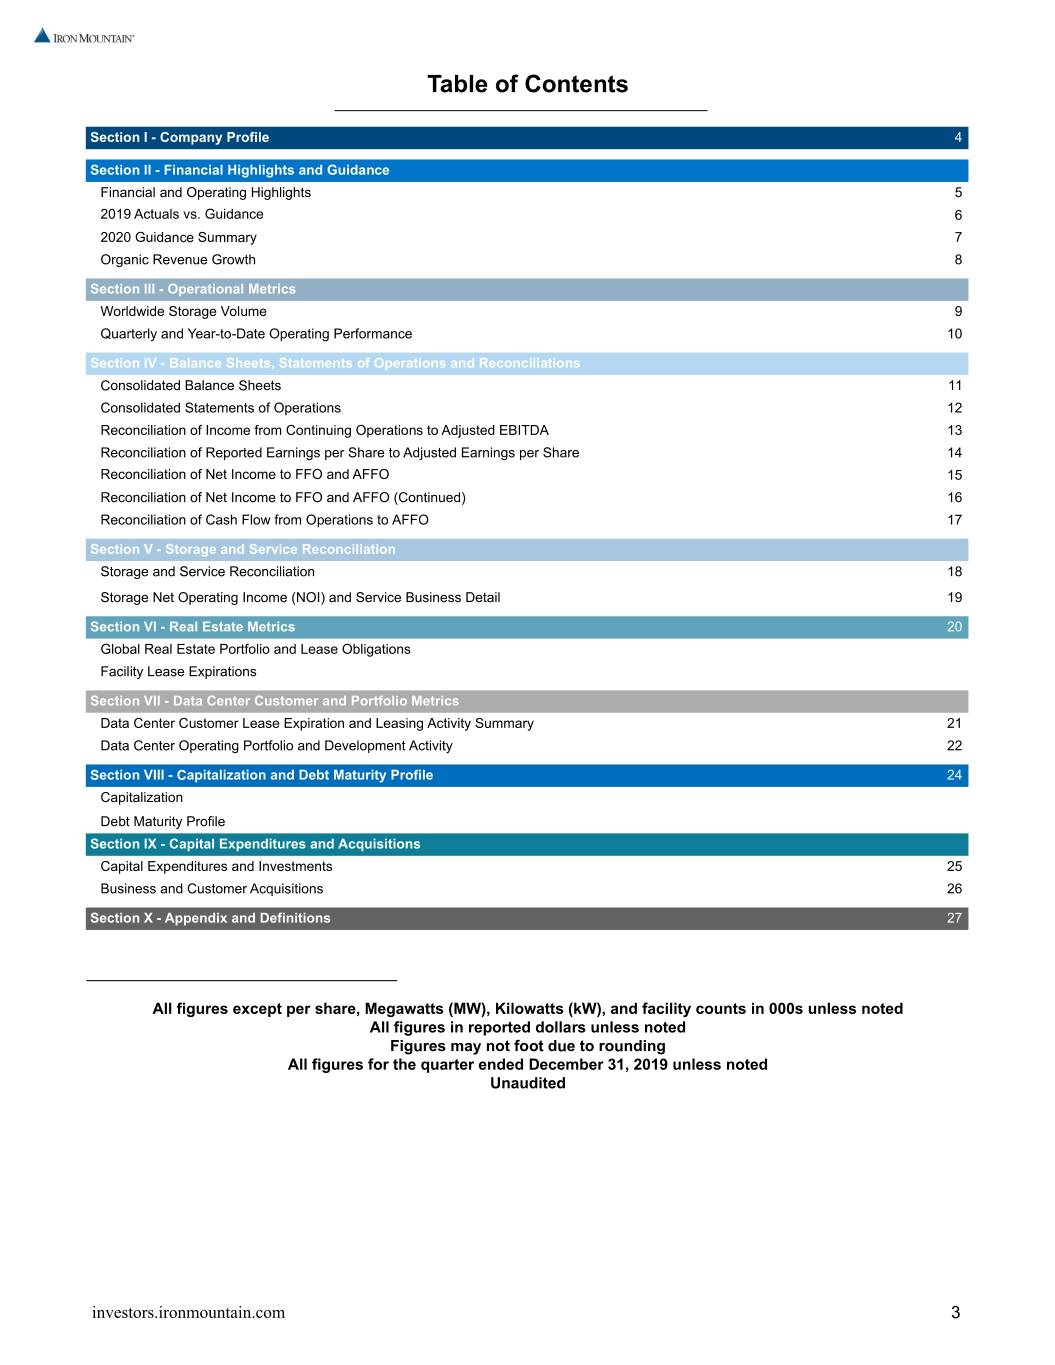
Table of Contents Section I - Company Profile 4 Section II - Financial Highlights and Guidance Financial and Operating Highlights 5 2019 Actuals vs. Guidance 6 2020 Guidance Summary 7 Organic Revenue Growth 8 Section III - Operational Metrics Worldwide Storage Volume 9 Quarterly and Year-to-Date Operating Performance 10 Section IV - Balance Sheets, Statements of Operations and Reconciliations Consolidated Balance Sheets 11 Consolidated Statements of Operations 12 Reconciliation of Income from Continuing Operations to Adjusted EBITDA 13 Reconciliation of Reported Earnings per Share to Adjusted Earnings per Share 14 Reconciliation of Net Income to FFO and AFFO 15 Reconciliation of Net Income to FFO and AFFO (Continued) 16 Reconciliation of Cash Flow from Operations to AFFO 17 Section V - Storage and Service Reconciliation Storage and Service Reconciliation 18 Storage Net Operating Income (NOI) and Service Business Detail 19 Section VI - Real Estate Metrics 20 Global Real Estate Portfolio and Lease Obligations Facility Lease Expirations Section VII - Data Center Customer and Portfolio Metrics Data Center Customer Lease Expiration and Leasing Activity Summary 21 Data Center Operating Portfolio and Development Activity 22 Section VIII - Capitalization and Debt Maturity Profile 24 Capitalization Debt Maturity Profile Section IX - Capital Expenditures and Acquisitions Capital Expenditures and Investments 25 Business and Customer Acquisitions 26 Section X - Appendix and Definitions 27 All figures except per share, Megawatts (MW), Kilowatts (kW), and facility counts in 000s unless noted All figures in reported dollars unless noted Figures may not foot due to rounding All figures for the quarter ended December 31, 2019 unless noted Unaudited investors.ironmountain.com 3
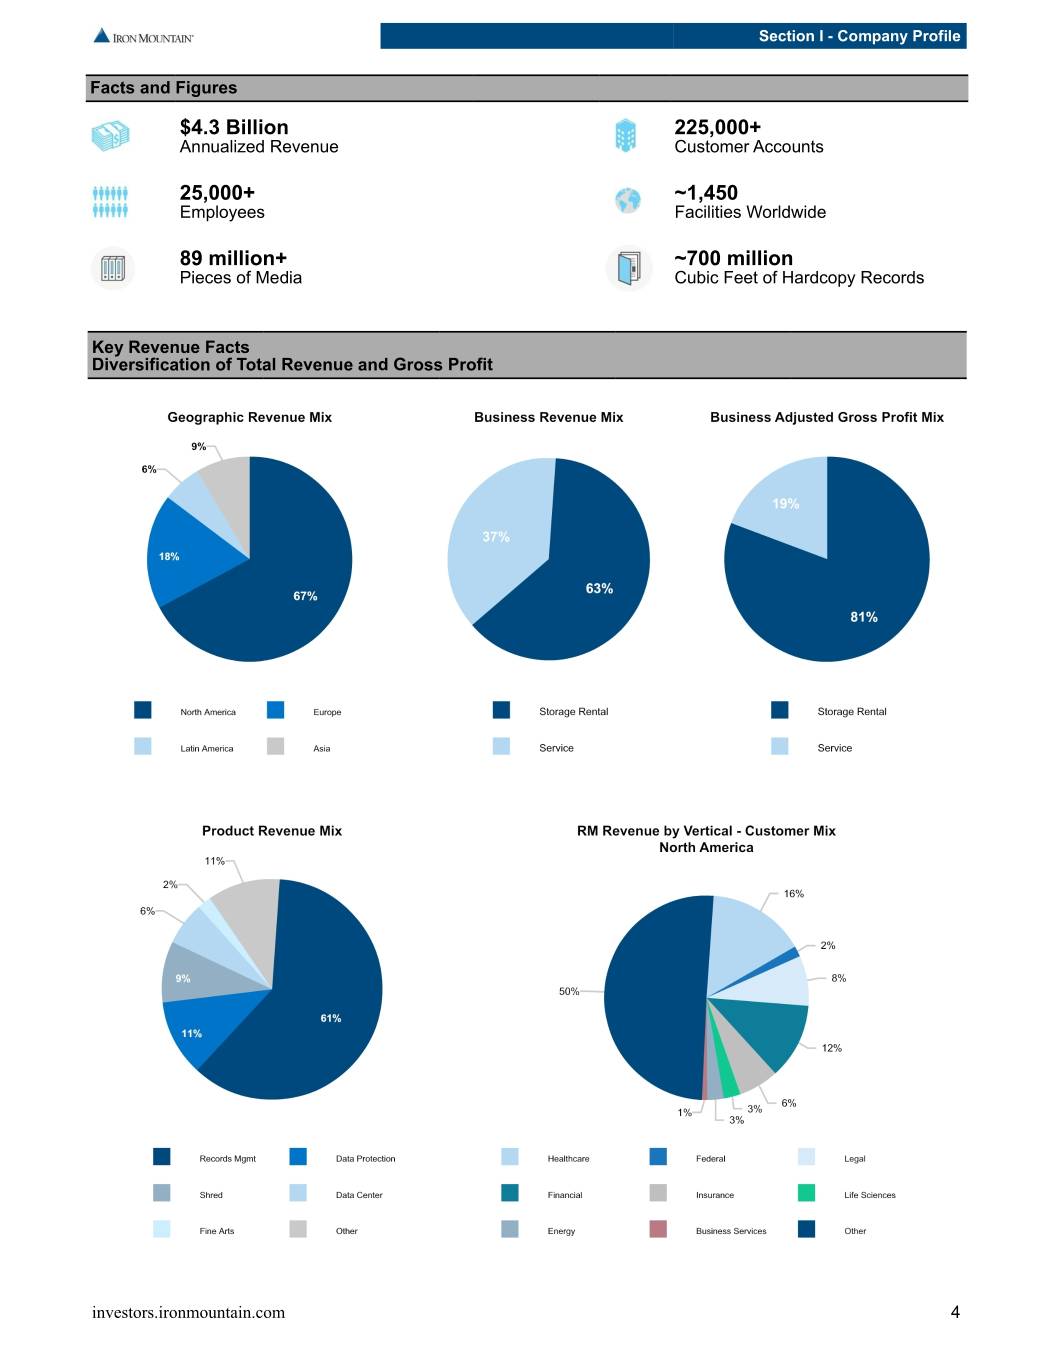
Section I - Company Profile Facts and Figures $4.3 Billion 225,000+ Annualized Revenue Customer Accounts 25,000+ ~1,450 Employees Facilities Worldwide 89 million+ ~700 million Pieces of Media Cubic Feet of Hardcopy Records Key Revenue Facts Diversification of Total Revenue and Gross Profit investors.ironmountain.com 4
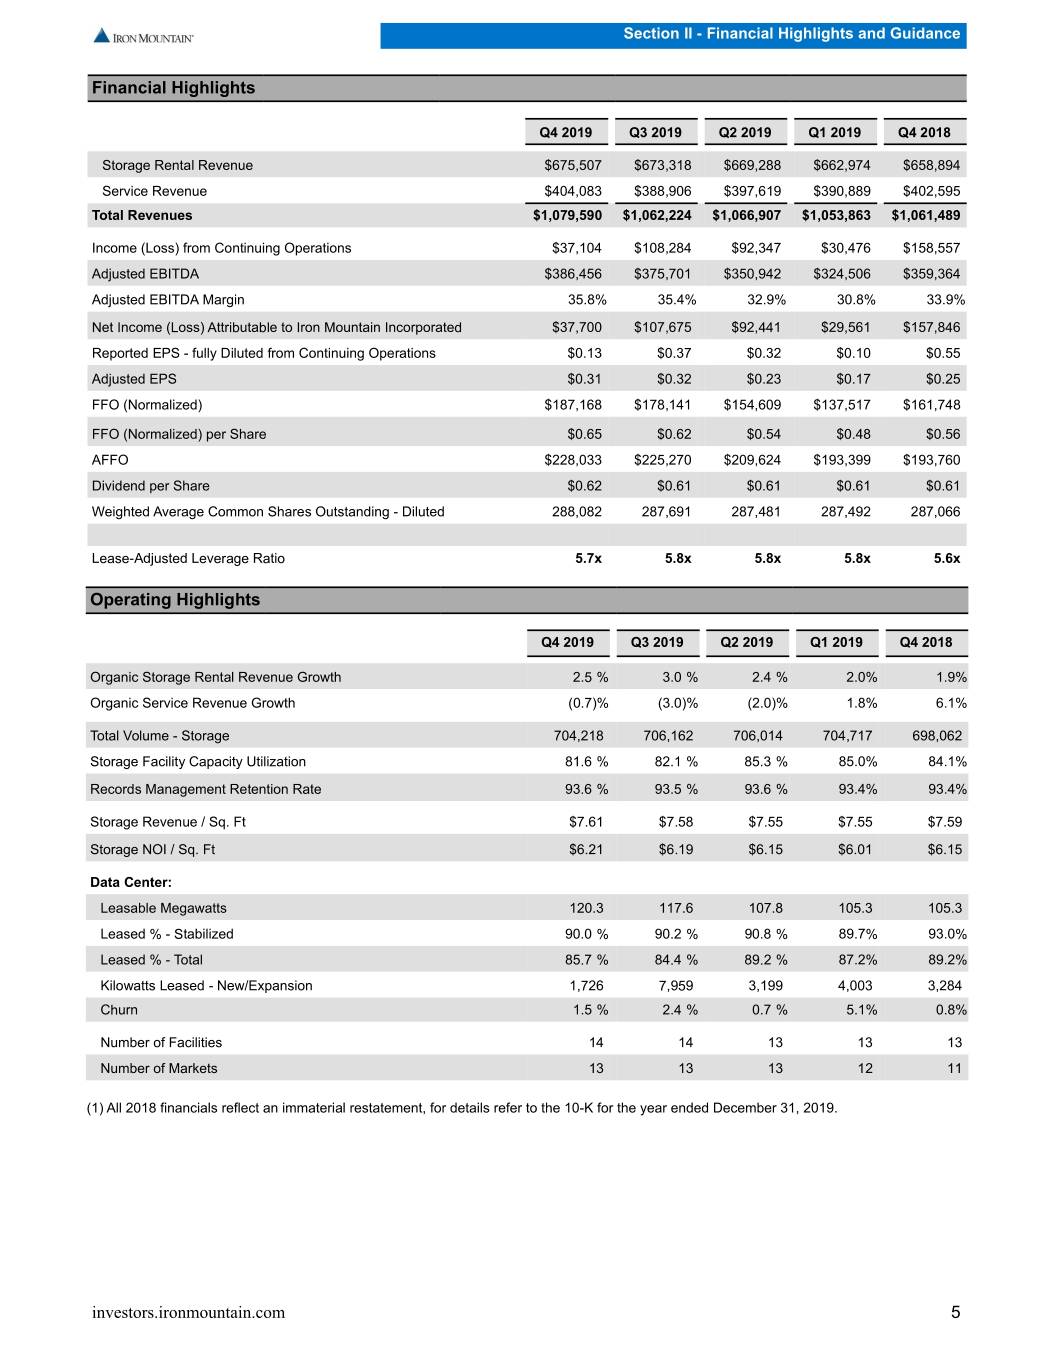
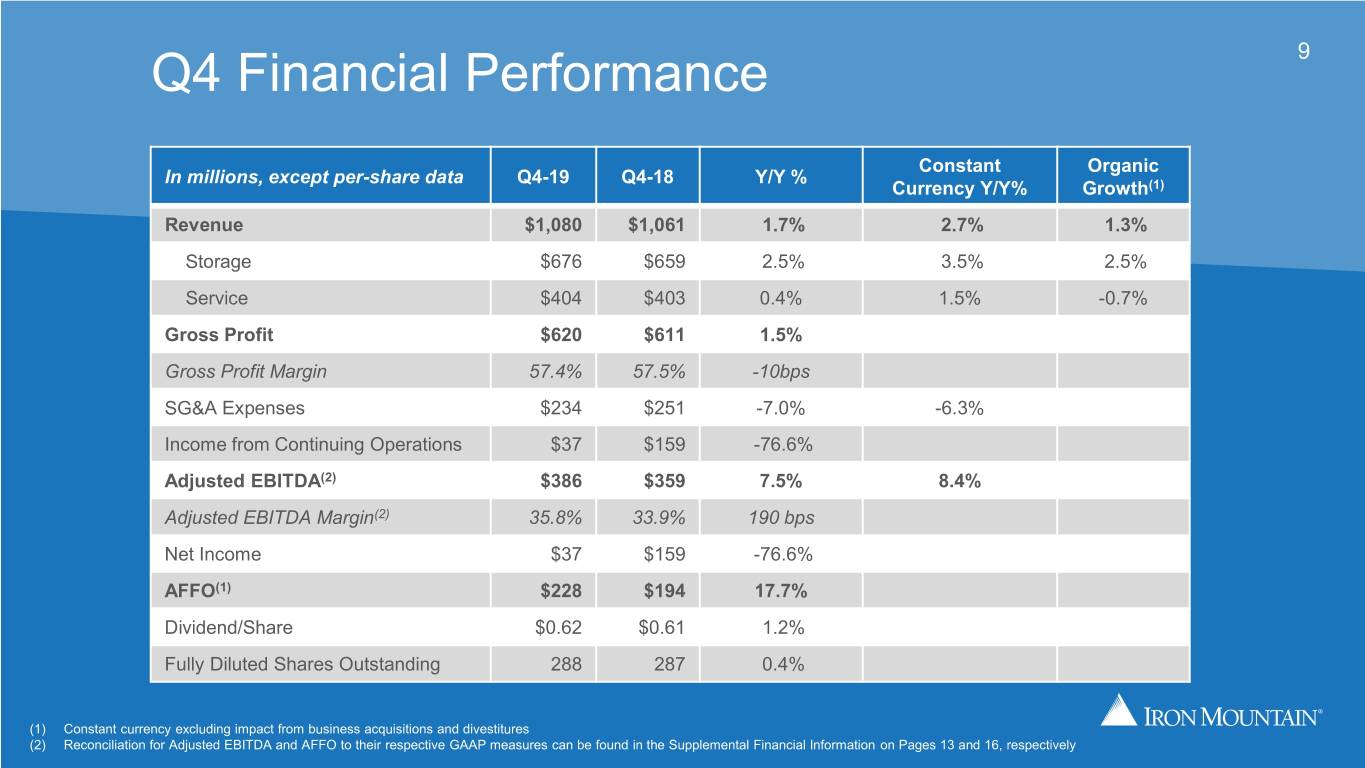
Section II - Financial Highlights and Guidance Financial Highlights Q4 2019 Q3 2019 Q2 2019 Q1 2019 Q4 2018 Storage Rental Revenue $675,507 $673,318 $669,288 $662,974 $658,894 Service Revenue $404,083 $388,906 $397,619 $390,889 $402,595 Total Revenues $1,079,590 $1,062,224 $1,066,907 $1,053,863 $1,061,489 Income (Loss) from Continuing Operations $37,104 $108,284 $92,347 $30,476 $158,557 Adjusted EBITDA $386,456 $375,701 $350,942 $324,506 $359,364 Adjusted EBITDA Margin 35.8% 35.4% 32.9% 30.8% 33.9% Net Income (Loss) Attributable to Iron Mountain Incorporated $37,700 $107,675 $92,441 $29,561 $157,846 Reported EPS - fully Diluted from Continuing Operations $0.13 $0.37 $0.32 $0.10 $0.55 Adjusted EPS $0.31 $0.32 $0.23 $0.17 $0.25 FFO (Normalized) $187,168 $178,141 $154,609 $137,517 $161,748 FFO (Normalized) per Share $0.65 $0.62 $0.54 $0.48 $0.56 AFFO $228,033 $225,270 $209,624 $193,399 $193,760 Dividend per Share $0.62 $0.61 $0.61 $0.61 $0.61 Weighted Average Common Shares Outstanding - Diluted 288,082 287,691 287,481 287,492 287,066 Lease-Adjusted Leverage Ratio 5.7x 5.8x 5.8x 5.8x 5.6x Operating Highlights Q4 2019 Q3 2019 Q2 2019 Q1 2019 Q4 2018 Organic Storage Rental Revenue Growth 2.5 % 3.0 % 2.4 % 2.0% 1.9% Organic Service Revenue Growth (0.7)% (3.0)% (2.0)% 1.8% 6.1% Total Volume - Storage 704,218 706,162 706,014 704,717 698,062 Storage Facility Capacity Utilization 81.6 % 82.1 % 85.3 % 85.0% 84.1% Records Management Retention Rate 93.6 % 93.5 % 93.6 % 93.4% 93.4% Storage Revenue / Sq. Ft $7.61 $7.58 $7.55 $7.55 $7.59 Storage NOI / Sq. Ft $6.21 $6.19 $6.15 $6.01 $6.15 Data Center: Leasable Megawatts 120.3 117.6 107.8 105.3 105.3 Leased % - Stabilized 90.0 % 90.2 % 90.8 % 89.7% 93.0% Leased % - Total 85.7 % 84.4 % 89.2 % 87.2% 89.2% Kilowatts Leased - New/Expansion 1,726 7,959 3,199 4,003 3,284 Churn 1.5 % 2.4 % 0.7 % 5.1% 0.8% Number of Facilities 14 14 13 13 13 Number of Markets 13 13 13 12 11 (1) All 2018 financials reflect an immaterial restatement, for details refer to the 10-K for the year ended December 31, 2019. investors.ironmountain.com 5
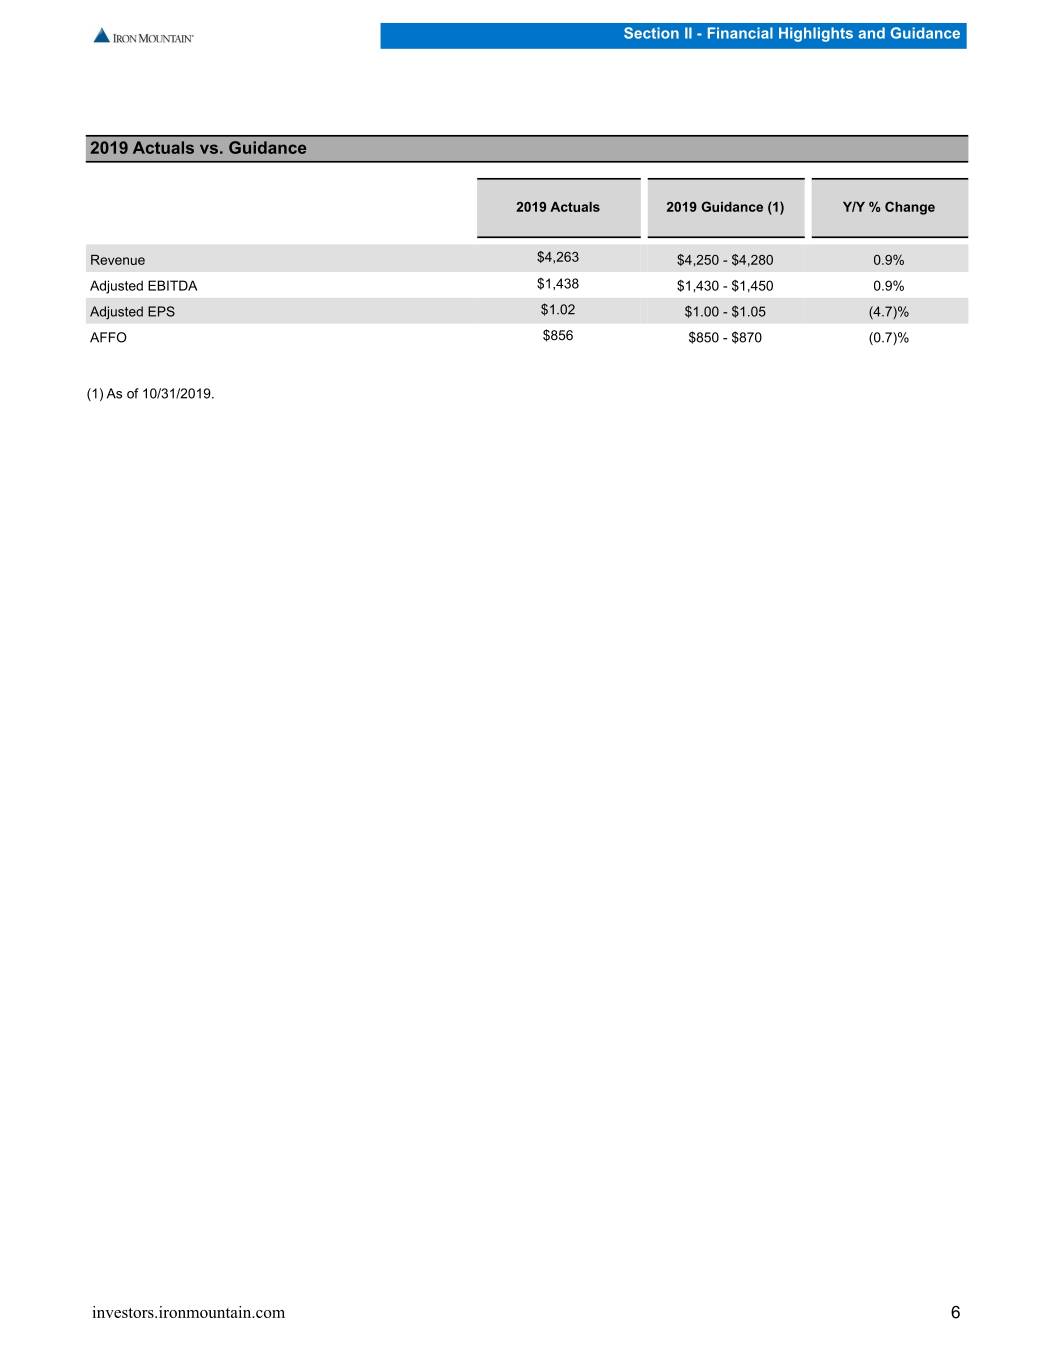
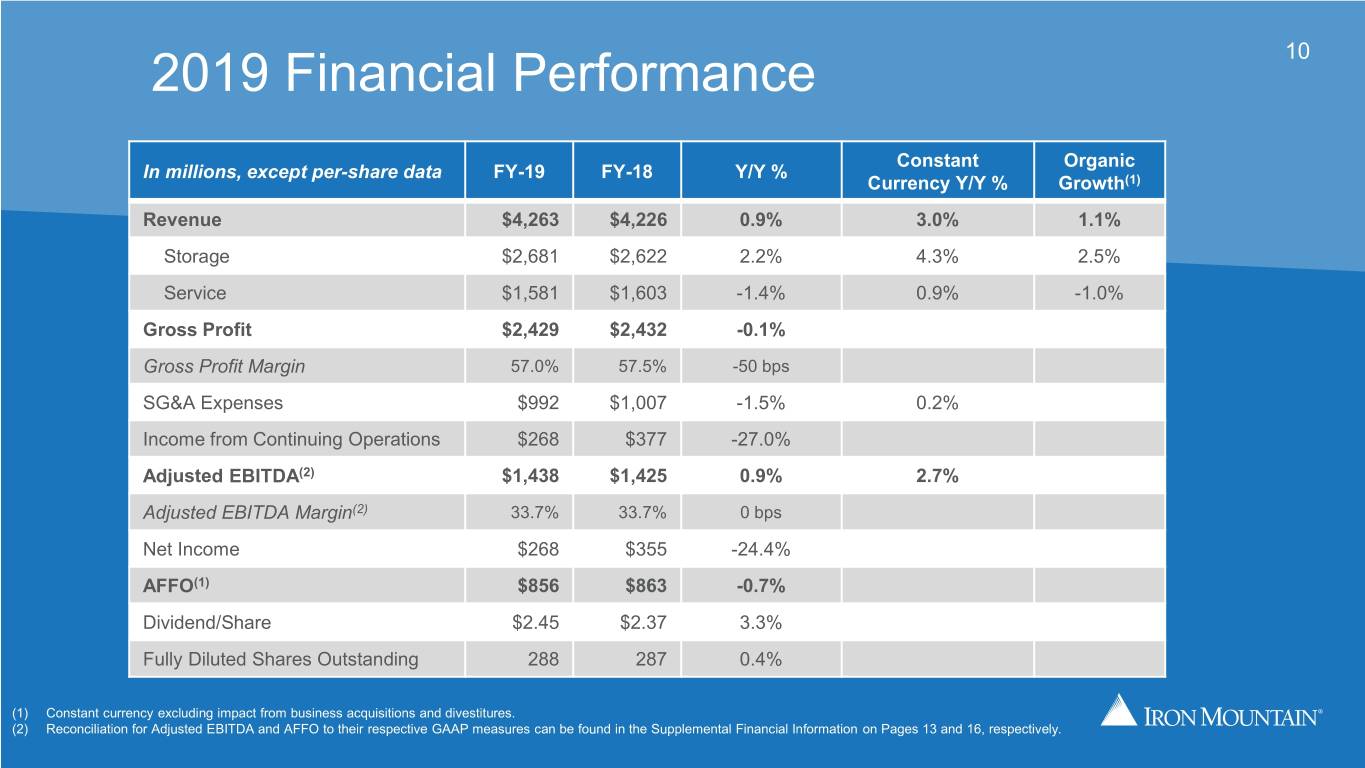
Section II - Financial Highlights and Guidance 2019 Actuals vs. Guidance 2019 Actuals 2019 Guidance (1) Y/Y % Change Revenue $4,263 $4,250 - $4,280 0.9% Adjusted EBITDA $1,438 $1,430 - $1,450 0.9% Adjusted EPS $1.02 $1.00 - $1.05 (4.7)% AFFO $856 $850 - $870 (0.7)% (1) As of 10/31/2019. investors.ironmountain.com 6
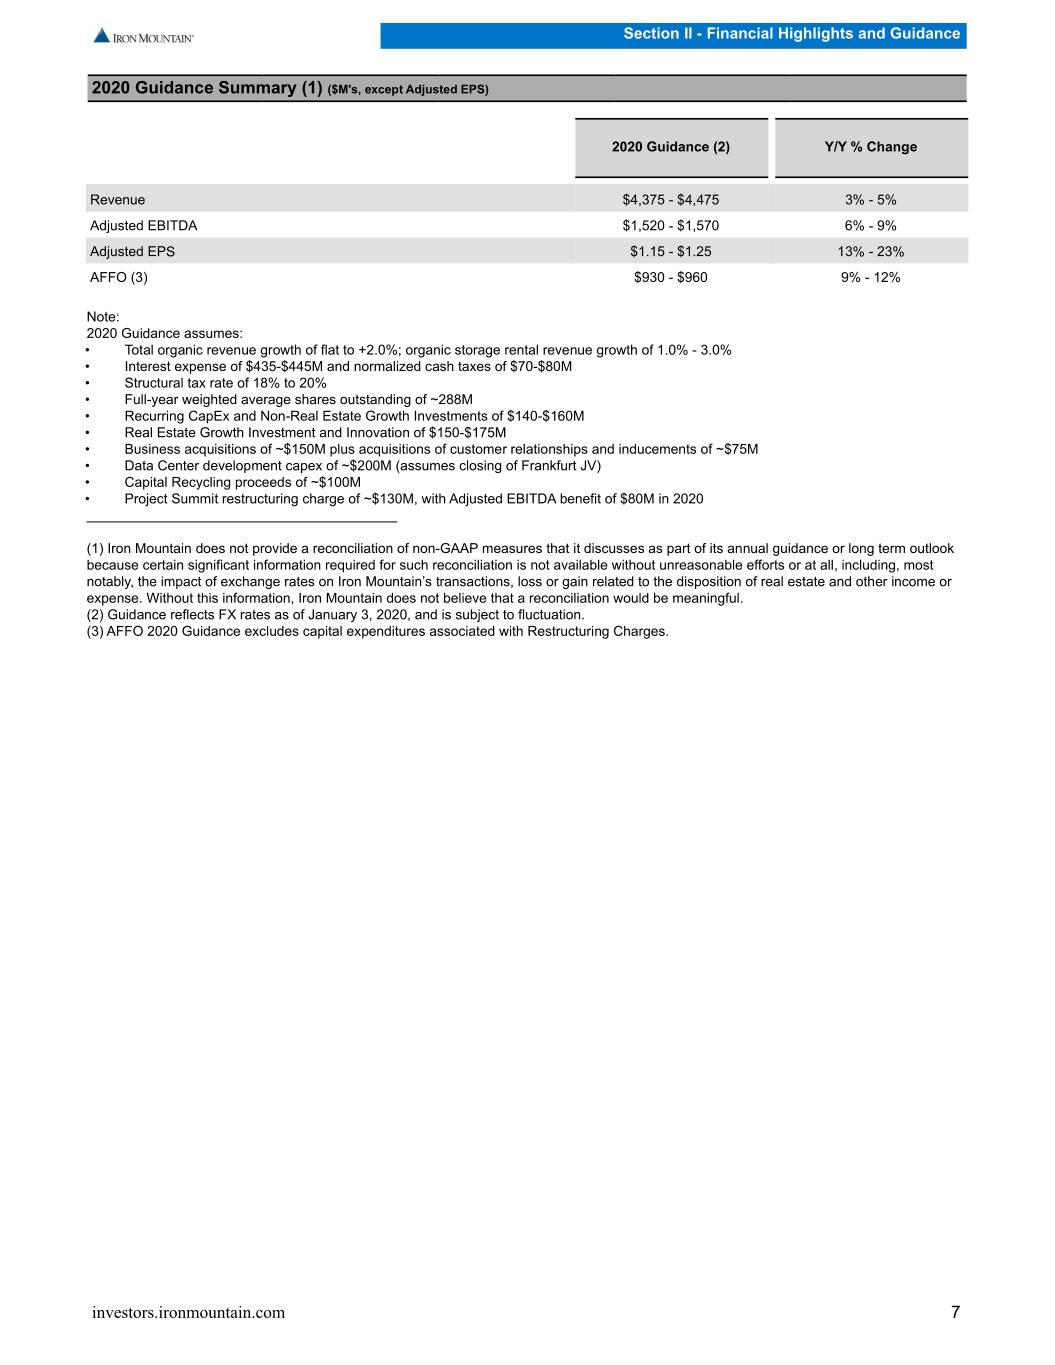
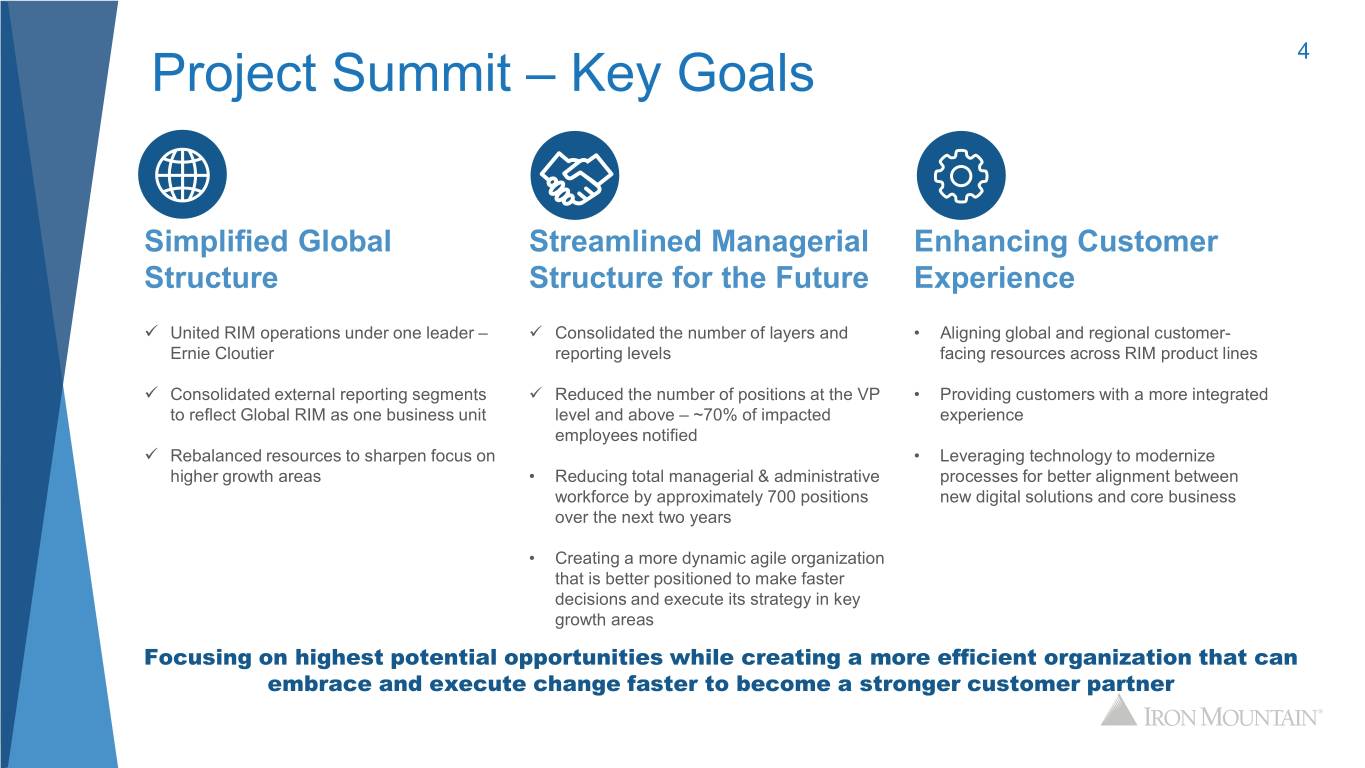
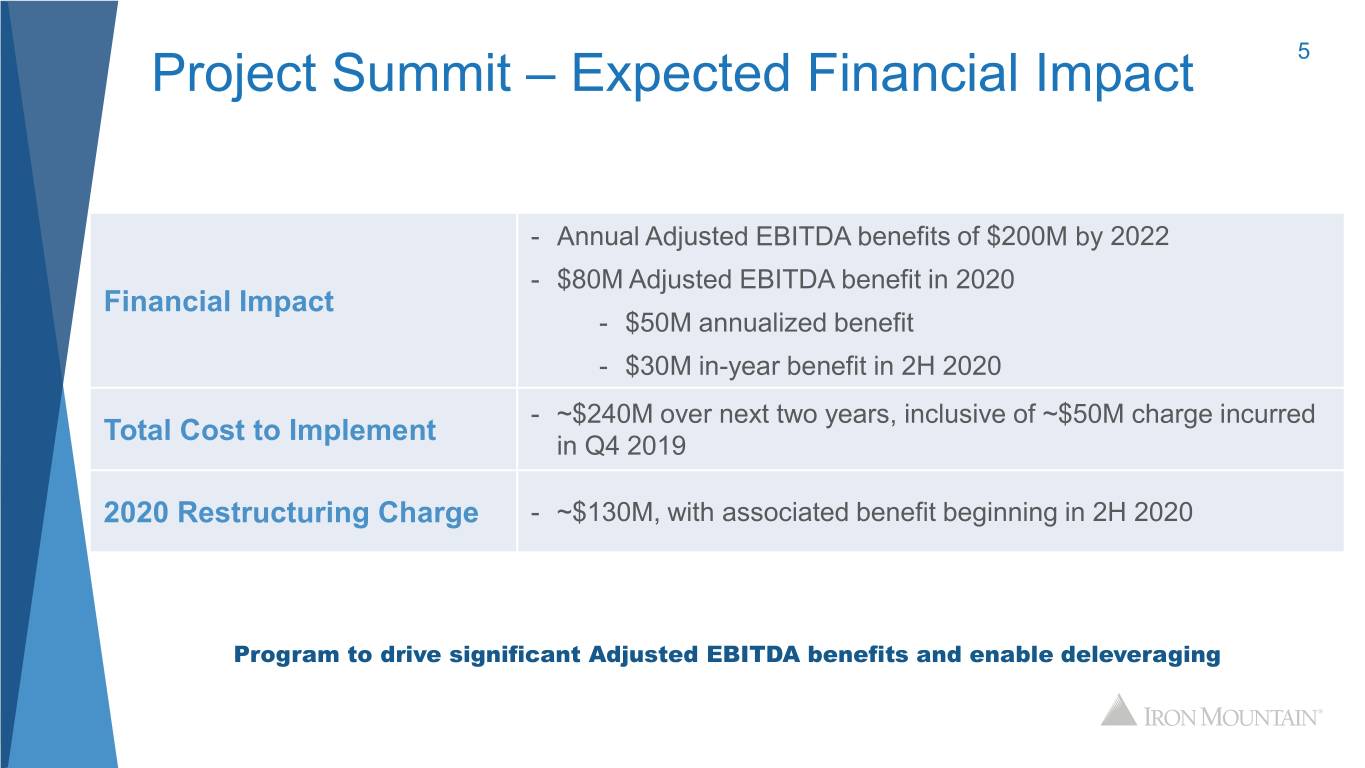
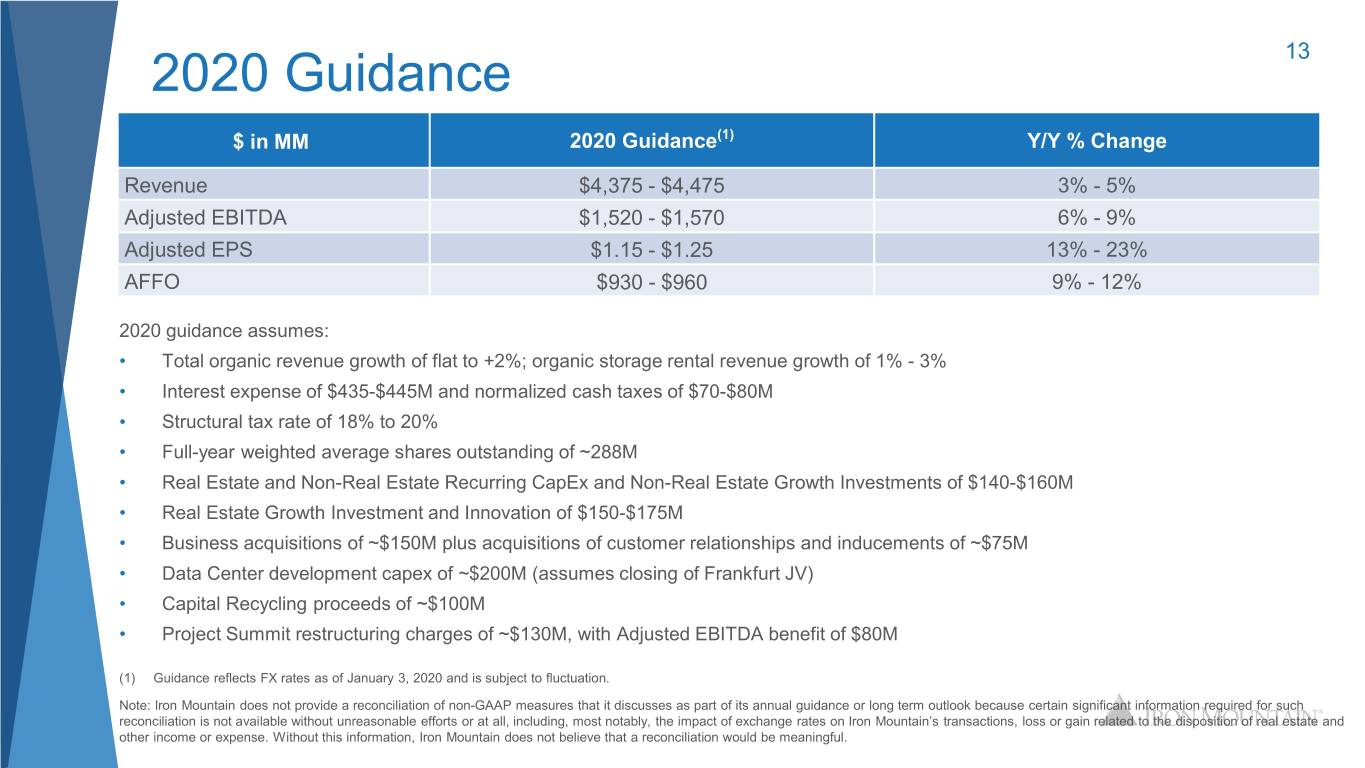
Section II - Financial Highlights and Guidance 2020 Guidance Summary (1) ($M's, except Adjusted EPS) 2020 Guidance (2) Y/Y % Change Revenue $4,375 - $4,475 3% - 5% Adjusted EBITDA $1,520 - $1,570 6% - 9% Adjusted EPS $1.15 - $1.25 13% - 23% AFFO (3) $930 - $960 9% - 12% Note: 2020 Guidance assumes: • Total organic revenue growth of flat to +2.0%; organic storage rental revenue growth of 1.0% - 3.0% • Interest expense of $435-$445M and normalized cash taxes of $70-$80M • Structural tax rate of 18% to 20% • Full-year weighted average shares outstanding of ~288M • Recurring CapEx and Non-Real Estate Growth Investments of $140-$160M • Real Estate Growth Investment and Innovation of $150-$175M • Business acquisitions of ~$150M plus acquisitions of customer relationships and inducements of ~$75M • Data Center development capex of ~$200M (assumes closing of Frankfurt JV) • Capital Recycling proceeds of ~$100M • Project Summit restructuring charge of ~$130M, with Adjusted EBITDA benefit of $80M in 2020 (1) Iron Mountain does not provide a reconciliation of non-GAAP measures that it discusses as part of its annual guidance or long term outlook because certain significant information required for such reconciliation is not available without unreasonable efforts or at all, including, most notably, the impact of exchange rates on Iron Mountain’s transactions, loss or gain related to the disposition of real estate and other income or expense. Without this information, Iron Mountain does not believe that a reconciliation would be meaningful. (2) Guidance reflects FX rates as of January 3, 2020, and is subject to fluctuation. (3) AFFO 2020 Guidance excludes capital expenditures associated with Restructuring Charges. investors.ironmountain.com 7
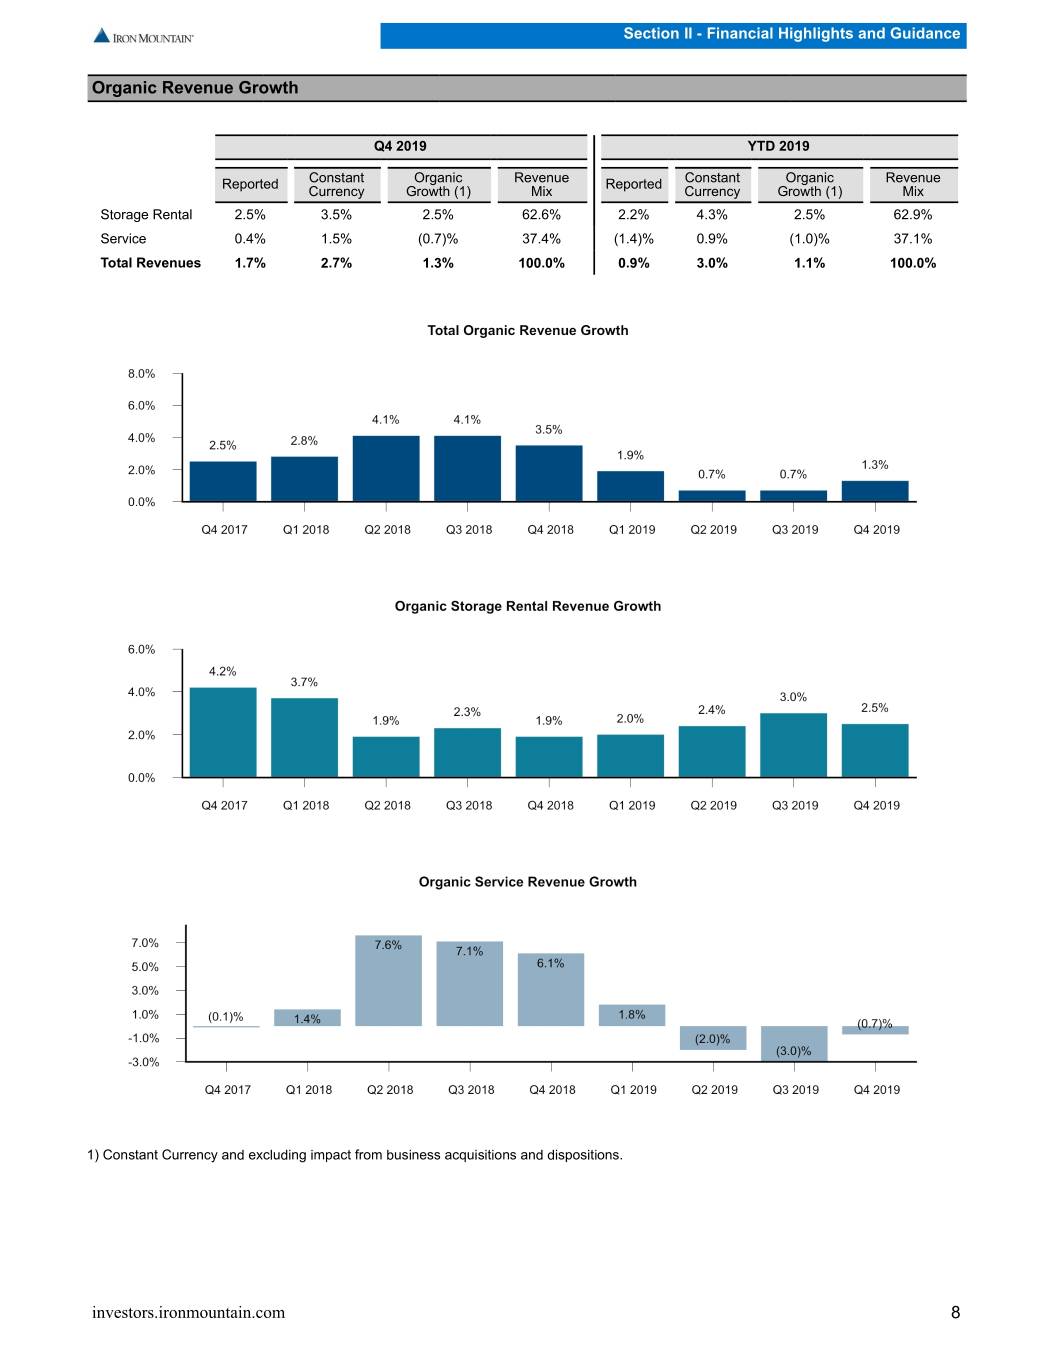
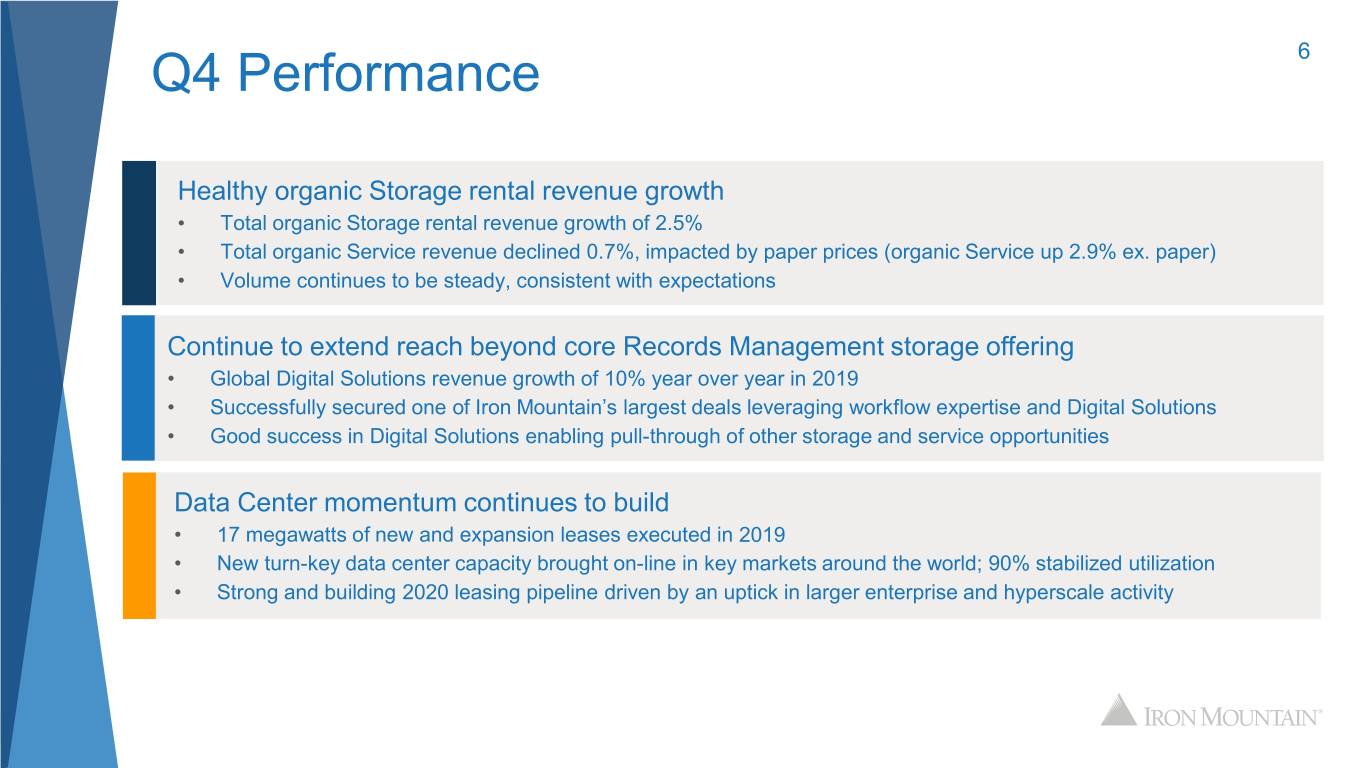
Section II - Financial Highlights and Guidance Organic Revenue Growth Q4 2019 YTD 2019 Reported Constant Organic Revenue Reported Constant Organic Revenue Currency Growth (1) Mix Currency Growth (1) Mix Storage Rental 2.5% 3.5% 2.5% 62.6% 2.2% 4.3% 2.5% 62.9% Service 0.4% 1.5% (0.7)% 37.4% (1.4)% 0.9% (1.0)% 37.1% Total Revenues 1.7% 2.7% 1.3% 100.0% 0.9% 3.0% 1.1% 100.0% 1) Constant Currency and excluding impact from business acquisitions and dispositions. investors.ironmountain.com 8
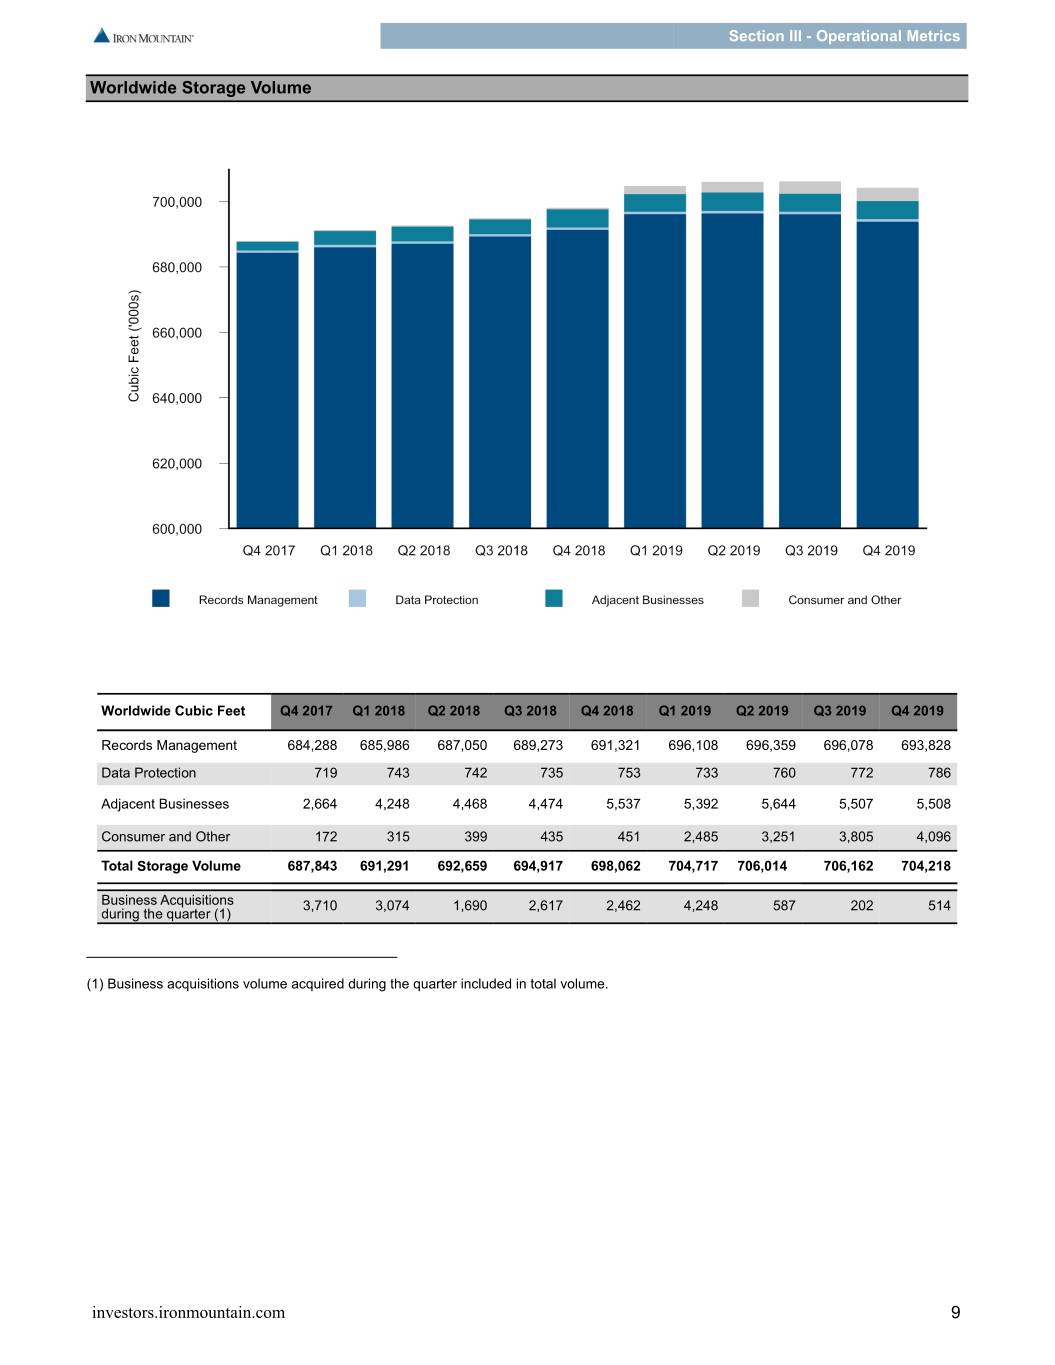
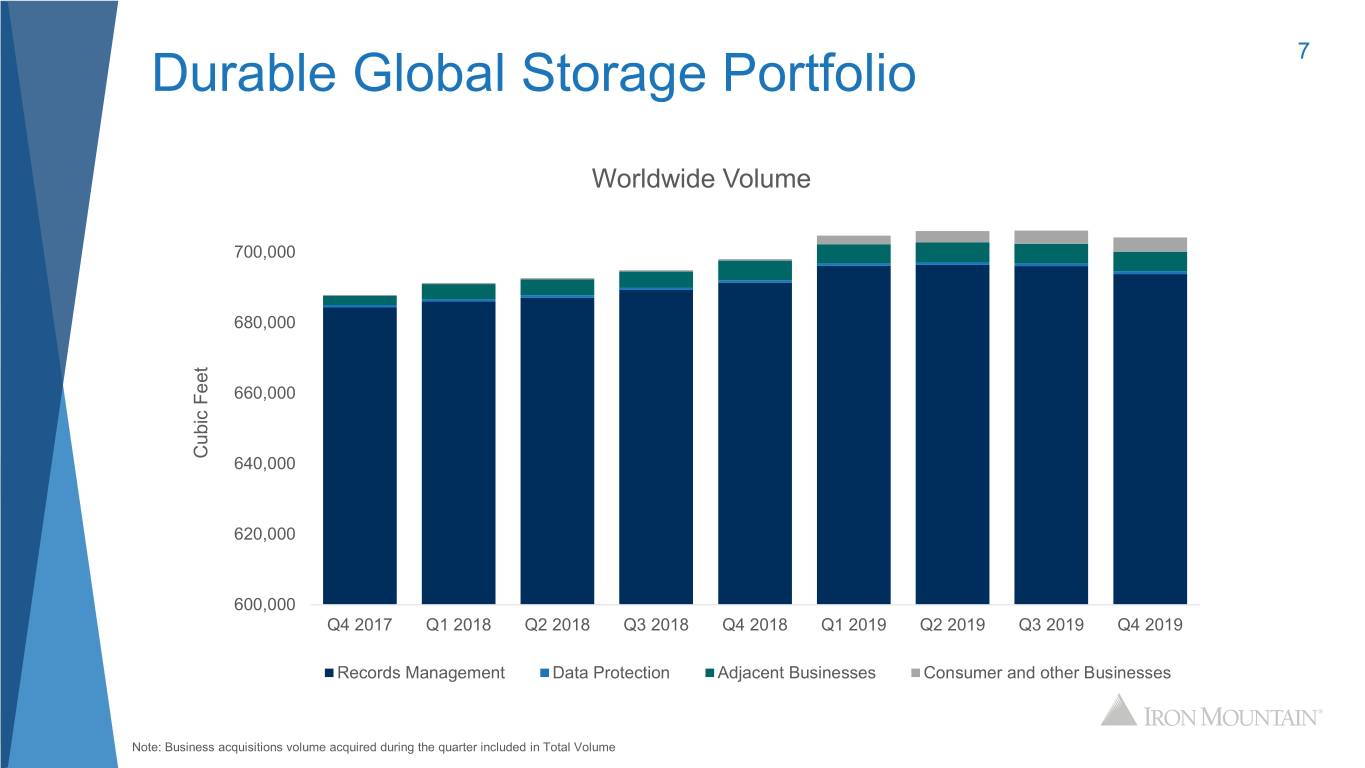
Section III - Operational Metrics Worldwide Storage Volume Worldwide Cubic Feet Q4 2017 Q1 2018 Q2 2018 Q3 2018 Q4 2018 Q1 2019 Q2 2019 Q3 2019 Q4 2019 Records Management 684,288 685,986 687,050 689,273 691,321 696,108 696,359 696,078 693,828 Data Protection 719 743 742 735 753 733 760 772 786 Adjacent Businesses 2,664 4,248 4,468 4,474 5,537 5,392 5,644 5,507 5,508 Consumer and Other 172 315 399 435 451 2,485 3,251 3,805 4,096 Total Storage Volume 687,843 691,291 692,659 694,917 698,062 704,717 706,014 706,162 704,218 Business Acquisitions 3,710 3,074 1,690 2,617 2,462 4,248 587 202 514 during the quarter (1) (1) Business acquisitions volume acquired during the quarter included in total volume. investors.ironmountain.com 9
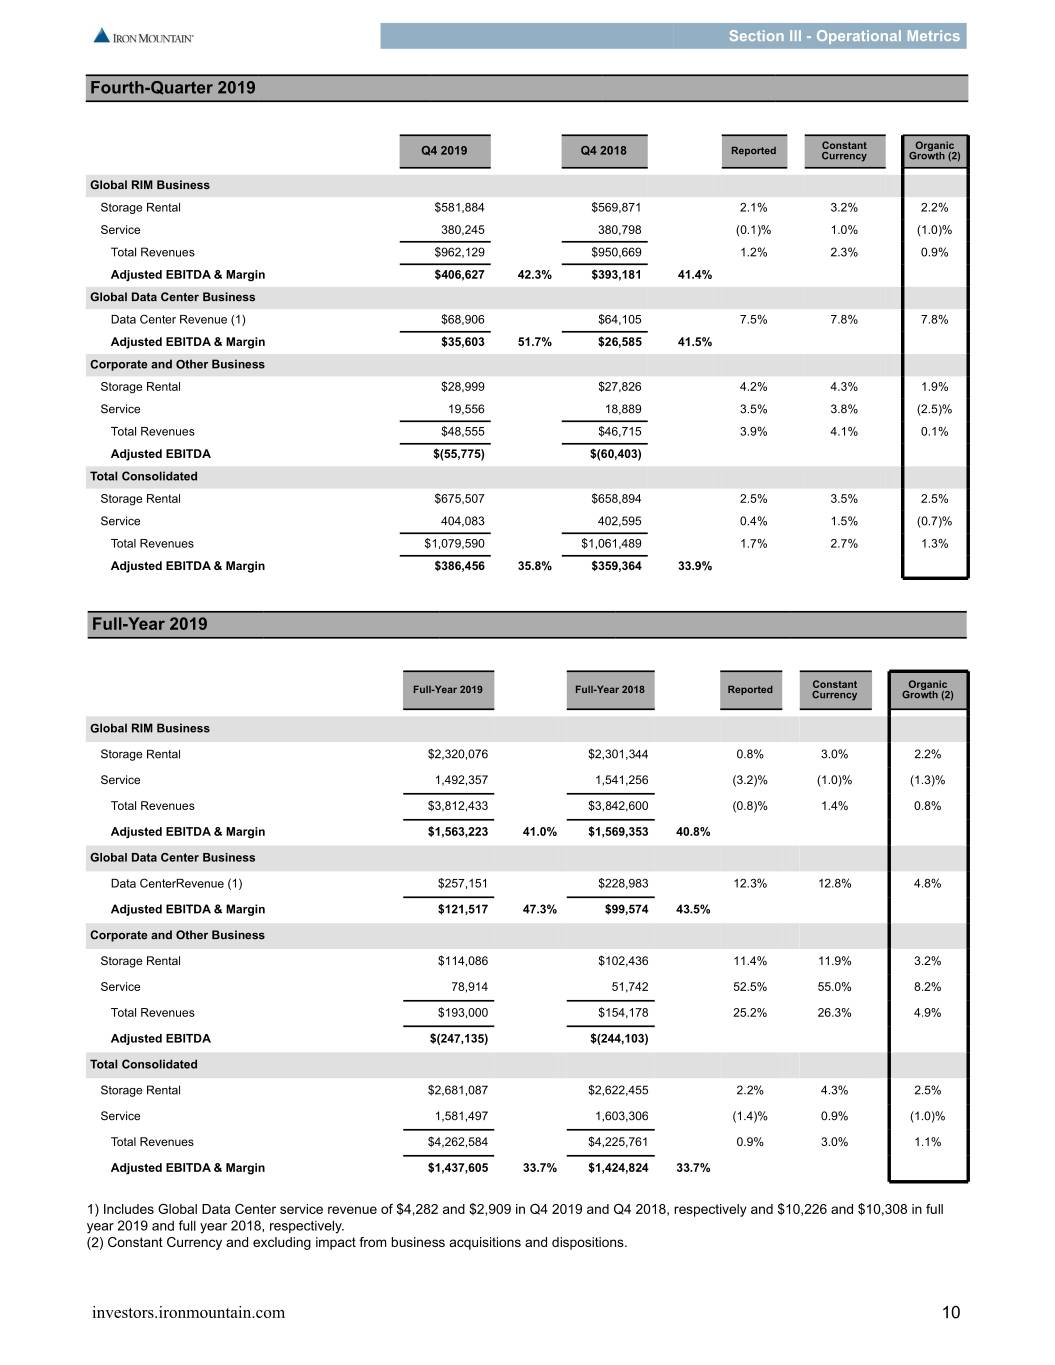
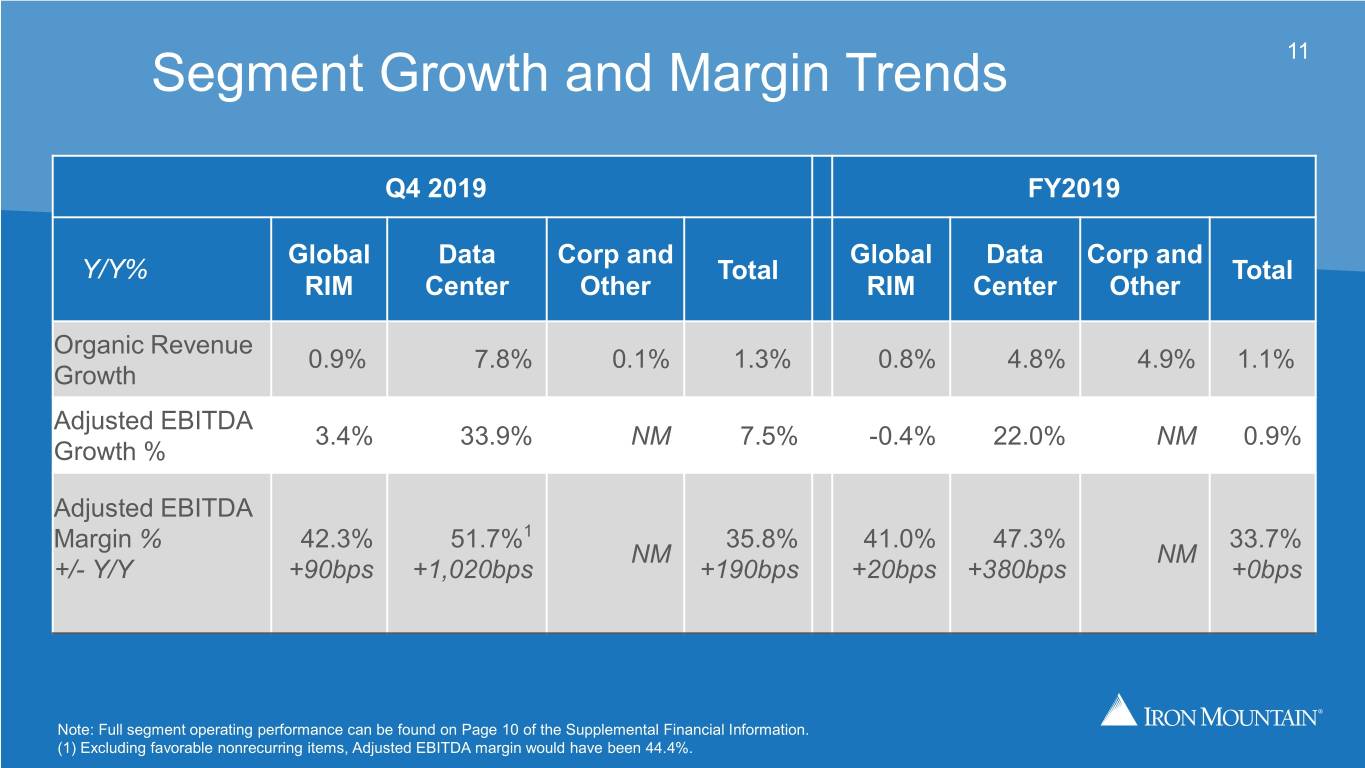
Section III - Operational Metrics Fourth-Quarter 2019 Constant Organic Q4 2019 Q4 2018 Reported Currency Growth (2) Global RIM Business Storage Rental $581,884 $569,871 2.1% 3.2% 2.2% Service 380,245 380,798 (0.1)% 1.0% (1.0)% Total Revenues $962,129 $950,669 1.2% 2.3% 0.9% Adjusted EBITDA & Margin $406,627 42.3% $393,181 41.4% Global Data Center Business Data Center Revenue (1) $68,906 $64,105 7.5% 7.8% 7.8% Adjusted EBITDA & Margin $35,603 51.7% $26,585 41.5% Corporate and Other Business Storage Rental $28,999 $27,826 4.2% 4.3% 1.9% Service 19,556 18,889 3.5% 3.8% (2.5)% Total Revenues $48,555 $46,715 3.9% 4.1% 0.1% Adjusted EBITDA $(55,775) $(60,403) Total Consolidated Storage Rental $675,507 $658,894 2.5% 3.5% 2.5% Service 404,083 402,595 0.4% 1.5% (0.7)% Total Revenues $1,079,590 $1,061,489 1.7% 2.7% 1.3% Adjusted EBITDA & Margin $386,456 35.8% $359,364 33.9% Full-Year 2019 Constant Organic Full-Year 2019 Full-Year 2018 Reported Currency Growth (2) Global RIM Business Storage Rental $2,320,076 $2,301,344 0.8% 3.0% 2.2% Service 1,492,357 1,541,256 (3.2)% (1.0)% (1.3)% Total Revenues $3,812,433 $3,842,600 (0.8)% 1.4% 0.8% Adjusted EBITDA & Margin $1,563,223 41.0% $1,569,353 40.8% Global Data Center Business Data CenterRevenue (1) $257,151 $228,983 12.3% 12.8% 4.8% Adjusted EBITDA & Margin $121,517 47.3% $99,574 43.5% Corporate and Other Business Storage Rental $114,086 $102,436 11.4% 11.9% 3.2% Service 78,914 51,742 52.5% 55.0% 8.2% Total Revenues $193,000 $154,178 25.2% 26.3% 4.9% Adjusted EBITDA $(247,135) $(244,103) Total Consolidated Storage Rental $2,681,087 $2,622,455 2.2% 4.3% 2.5% Service 1,581,497 1,603,306 (1.4)% 0.9% (1.0)% Total Revenues $4,262,584 $4,225,761 0.9% 3.0% 1.1% Adjusted EBITDA & Margin $1,437,605 33.7% $1,424,824 33.7% 1) Includes Global Data Center service revenue of $4,282 and $2,909 in Q4 2019 and Q4 2018, respectively and $10,226 and $10,308 in full year 2019 and full year 2018, respectively. (2) Constant Currency and excluding impact from business acquisitions and dispositions. investors.ironmountain.com 10
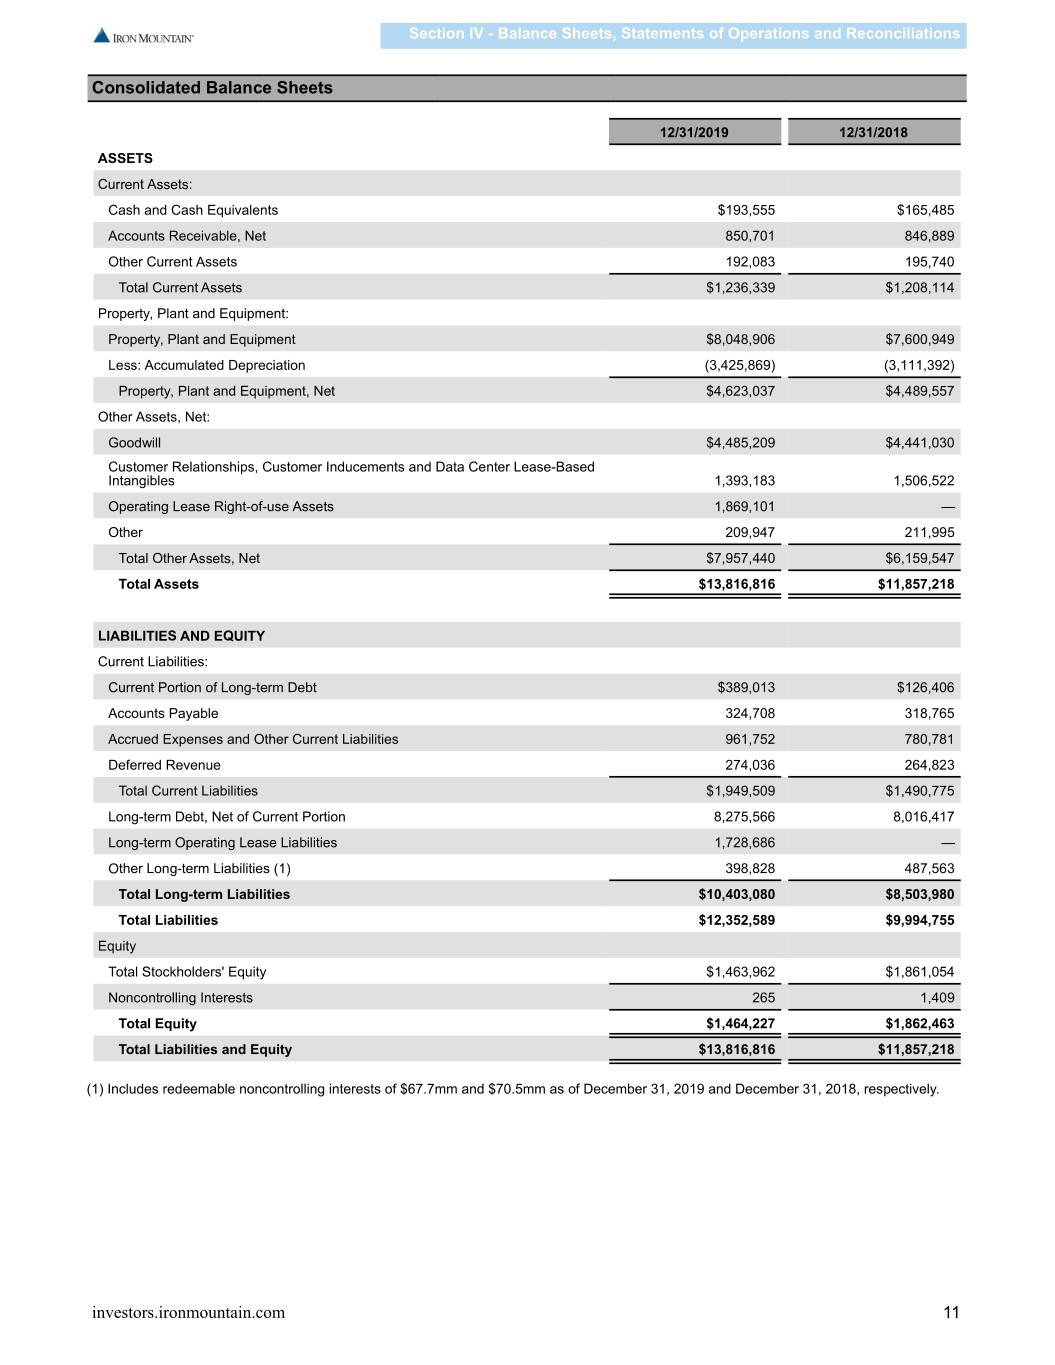
Section IV - Balance Sheets, Statements of Operations and Reconciliations Consolidated Balance Sheets 12/31/2019 12/31/2018 ASSETS Current Assets: Cash and Cash Equivalents $193,555 $165,485 Accounts Receivable, Net 850,701 846,889 Other Current Assets 192,083 195,740 Total Current Assets $1,236,339 $1,208,114 Property, Plant and Equipment: Property, Plant and Equipment $8,048,906 $7,600,949 Less: Accumulated Depreciation (3,425,869) (3,111,392) Property, Plant and Equipment, Net $4,623,037 $4,489,557 Other Assets, Net: Goodwill $4,485,209 $4,441,030 Customer Relationships, Customer Inducements and Data Center Lease-Based Intangibles 1,393,183 1,506,522 Operating Lease Right-of-use Assets 1,869,101 — Other 209,947 211,995 Total Other Assets, Net $7,957,440 $6,159,547 Total Assets $13,816,816 $11,857,218 LIABILITIES AND EQUITY Current Liabilities: Current Portion of Long-term Debt $389,013 $126,406 Accounts Payable 324,708 318,765 Accrued Expenses and Other Current Liabilities 961,752 780,781 Deferred Revenue 274,036 264,823 Total Current Liabilities $1,949,509 $1,490,775 Long-term Debt, Net of Current Portion 8,275,566 8,016,417 Long-term Operating Lease Liabilities 1,728,686 — Other Long-term Liabilities (1) 398,828 487,563 Total Long-term Liabilities $10,403,080 $8,503,980 Total Liabilities $12,352,589 $9,994,755 Equity Total Stockholders' Equity $1,463,962 $1,861,054 Noncontrolling Interests 265 1,409 Total Equity $1,464,227 $1,862,463 Total Liabilities and Equity $13,816,816 $11,857,218 (1) Includes redeemable noncontrolling interests of $67.7mm and $70.5mm as of December 31, 2019 and December 31, 2018, respectively. investors.ironmountain.com 11
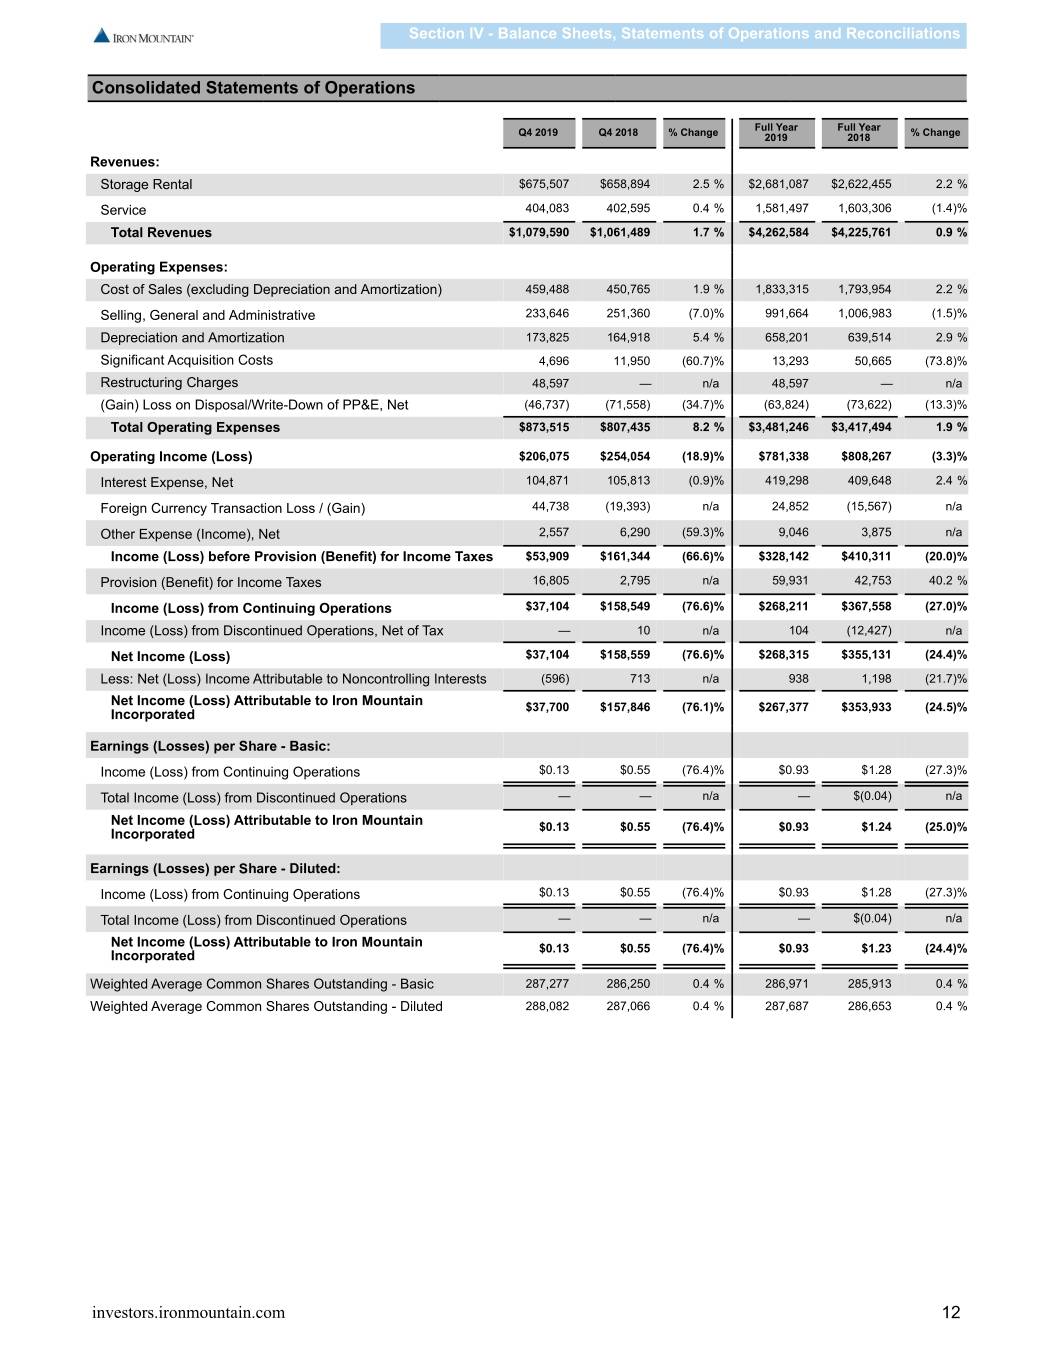
Section IV - Balance Sheets, Statements of Operations and Reconciliations Consolidated Statements of Operations Full Year Full Year Q4 2019 Q4 2018 % Change 2019 2018 % Change Revenues: Storage Rental $675,507 $658,894 2.5 % $2,681,087 $2,622,455 2.2 % Service 404,083 402,595 0.4 % 1,581,497 1,603,306 (1.4)% Total Revenues $1,079,590 $1,061,489 1.7 % $4,262,584 $4,225,761 0.9 % Operating Expenses: Cost of Sales (excluding Depreciation and Amortization) 459,488 450,765 1.9 % 1,833,315 1,793,954 2.2 % Selling, General and Administrative 233,646 251,360 (7.0)% 991,664 1,006,983 (1.5)% Depreciation and Amortization 173,825 164,918 5.4 % 658,201 639,514 2.9 % Significant Acquisition Costs 4,696 11,950 (60.7)% 13,293 50,665 (73.8)% Restructuring Charges 48,597 — n/a 48,597 — n/a (Gain) Loss on Disposal/Write-Down of PP&E, Net (46,737) (71,558) (34.7)% (63,824) (73,622) (13.3)% Total Operating Expenses $873,515 $807,435 8.2 % $3,481,246 $3,417,494 1.9 % Operating Income (Loss) $206,075 $254,054 (18.9)% $781,338 $808,267 (3.3)% Interest Expense, Net 104,871 105,813 (0.9)% 419,298 409,648 2.4 % Foreign Currency Transaction Loss / (Gain) 44,738 (19,393) n/a 24,852 (15,567) n/a Other Expense (Income), Net 2,557 6,290 (59.3)% 9,046 3,875 n/a Income (Loss) before Provision (Benefit) for Income Taxes $53,909 $161,344 (66.6)% $328,142 $410,311 (20.0)% Provision (Benefit) for Income Taxes 16,805 2,795 n/a 59,931 42,753 40.2 % Income (Loss) from Continuing Operations $37,104 $158,549 (76.6)% $268,211 $367,558 (27.0)% Income (Loss) from Discontinued Operations, Net of Tax — 10 n/a 104 (12,427) n/a Net Income (Loss) $37,104 $158,559 (76.6)% $268,315 $355,131 (24.4)% Less: Net (Loss) Income Attributable to Noncontrolling Interests (596) 713 n/a 938 1,198 (21.7)% Net Income (Loss) Attributable to Iron Mountain $37,700 $157,846 (76.1)% $267,377 $353,933 (24.5)% Incorporated Earnings (Losses) per Share - Basic: Income (Loss) from Continuing Operations $0.13 $0.55 (76.4)% $0.93 $1.28 (27.3)% Total Income (Loss) from Discontinued Operations — — n/a — $(0.04) n/a Net Income (Loss) Attributable to Iron Mountain $0.13 $0.55 (76.4)% $0.93 $1.24 (25.0)% Incorporated Earnings (Losses) per Share - Diluted: Income (Loss) from Continuing Operations $0.13 $0.55 (76.4)% $0.93 $1.28 (27.3)% Total Income (Loss) from Discontinued Operations — — n/a — $(0.04) n/a Net Income (Loss) Attributable to Iron Mountain $0.13 $0.55 (76.4)% $0.93 $1.23 (24.4)% Incorporated Weighted Average Common Shares Outstanding - Basic 287,277 286,250 0.4 % 286,971 285,913 0.4 % Weighted Average Common Shares Outstanding - Diluted 288,082 287,066 0.4 % 287,687 286,653 0.4 % investors.ironmountain.com 12
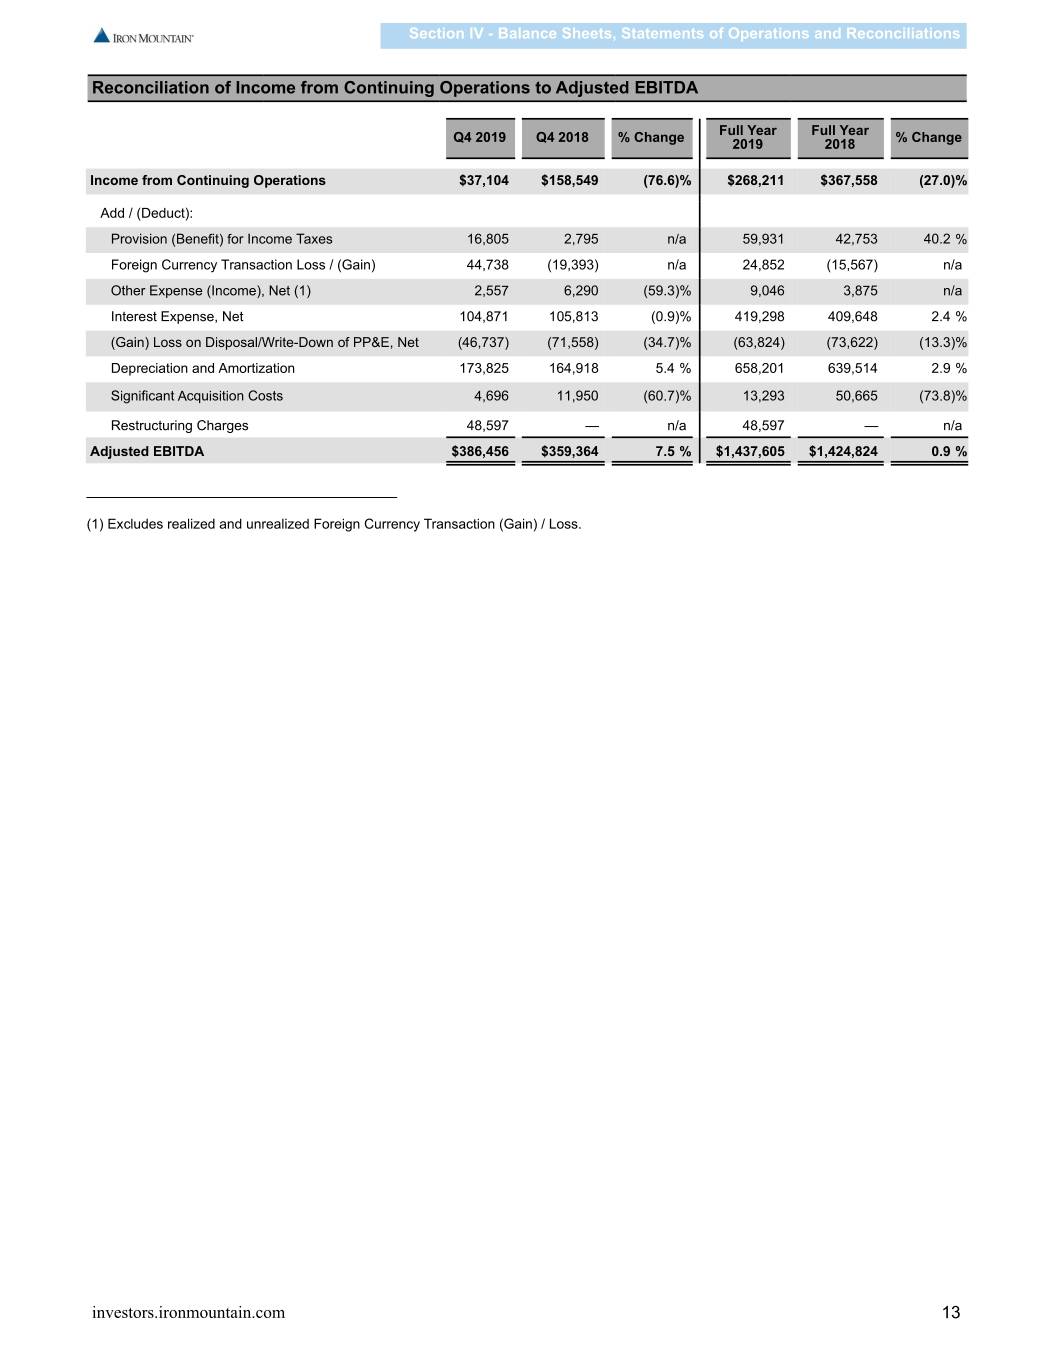
Section IV - Balance Sheets, Statements of Operations and Reconciliations Reconciliation of Income from Continuing Operations to Adjusted EBITDA Full Year Full Year Q4 2019 Q4 2018 % Change 2019 2018 % Change Income from Continuing Operations $37,104 $158,549 (76.6)% $268,211 $367,558 (27.0)% Add / (Deduct): Provision (Benefit) for Income Taxes 16,805 2,795 n/a 59,931 42,753 40.2 % Foreign Currency Transaction Loss / (Gain) 44,738 (19,393) n/a 24,852 (15,567) n/a Other Expense (Income), Net (1) 2,557 6,290 (59.3)% 9,046 3,875 n/a Interest Expense, Net 104,871 105,813 (0.9)% 419,298 409,648 2.4 % (Gain) Loss on Disposal/Write-Down of PP&E, Net (46,737) (71,558) (34.7)% (63,824) (73,622) (13.3)% Depreciation and Amortization 173,825 164,918 5.4 % 658,201 639,514 2.9 % Significant Acquisition Costs 4,696 11,950 (60.7)% 13,293 50,665 (73.8)% Restructuring Charges 48,597 — n/a 48,597 — n/a Adjusted EBITDA $386,456 $359,364 7.5 % $1,437,605 $1,424,824 0.9 % (1) Excludes realized and unrealized Foreign Currency Transaction (Gain) / Loss. investors.ironmountain.com 13
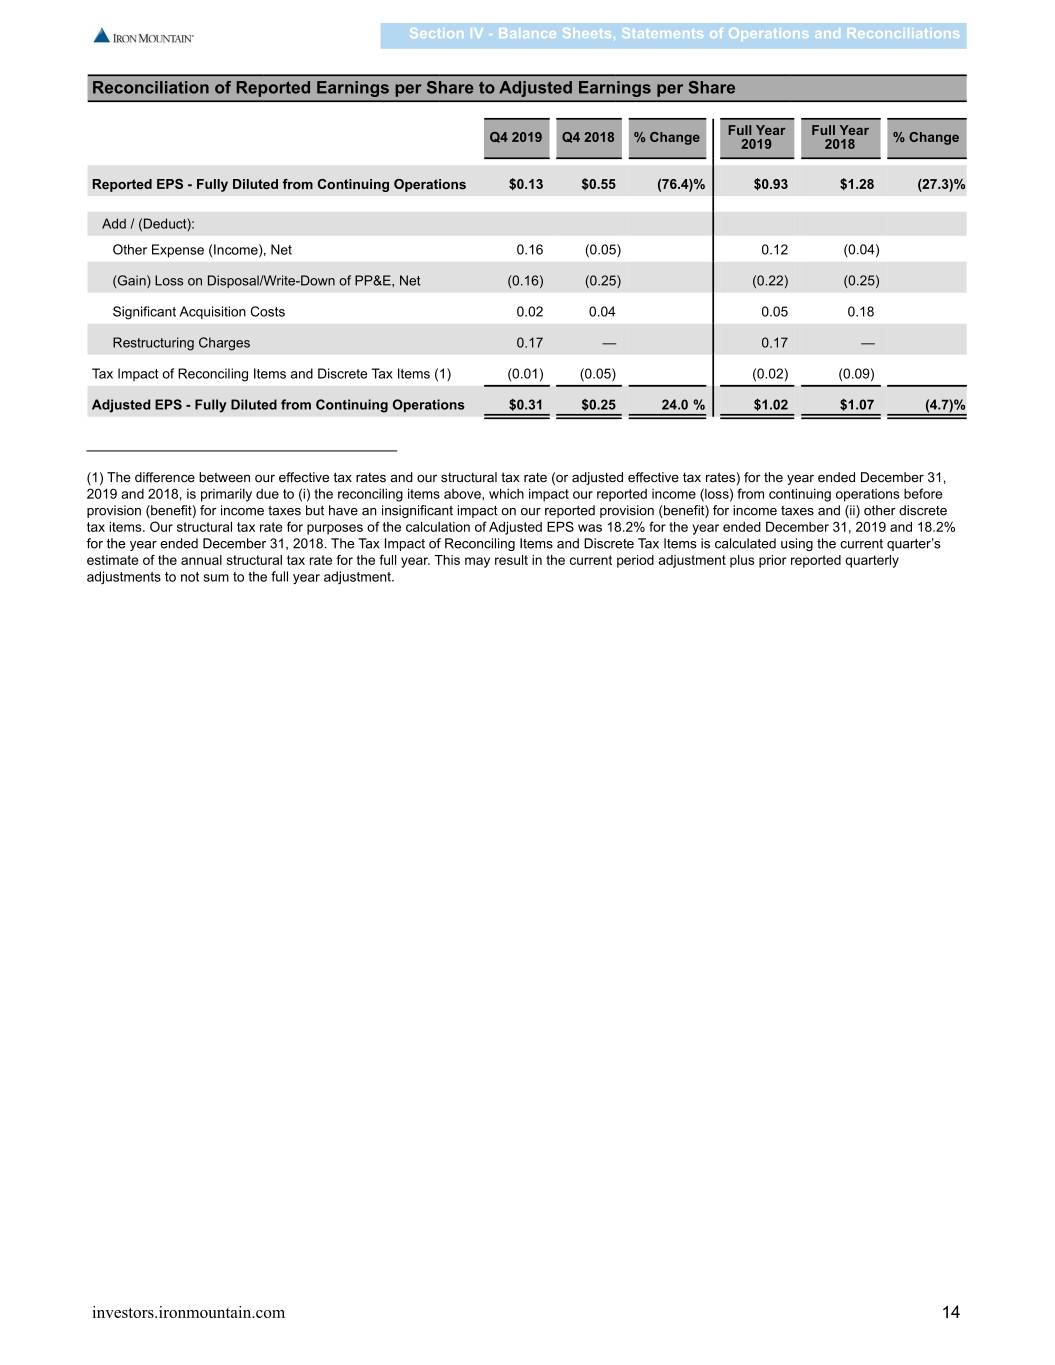
Section IV - Balance Sheets, Statements of Operations and Reconciliations Reconciliation of Reported Earnings per Share to Adjusted Earnings per Share Full Year Full Year Q4 2019 Q4 2018 % Change 2019 2018 % Change Reported EPS - Fully Diluted from Continuing Operations $0.13 $0.55 (76.4)% $0.93 $1.28 (27.3)% Add / (Deduct): Other Expense (Income), Net 0.16 (0.05) 0.12 (0.04) (Gain) Loss on Disposal/Write-Down of PP&E, Net (0.16) (0.25) (0.22) (0.25) Significant Acquisition Costs 0.02 0.04 0.05 0.18 Restructuring Charges 0.17 — 0.17 — Tax Impact of Reconciling Items and Discrete Tax Items (1) (0.01) (0.05) (0.02) (0.09) Adjusted EPS - Fully Diluted from Continuing Operations $0.31 $0.25 24.0 % $1.02 $1.07 (4.7)% (1) The difference between our effective tax rates and our structural tax rate (or adjusted effective tax rates) for the year ended December 31, 2019 and 2018, is primarily due to (i) the reconciling items above, which impact our reported income (loss) from continuing operations before provision (benefit) for income taxes but have an insignificant impact on our reported provision (benefit) for income taxes and (ii) other discrete tax items. Our structural tax rate for purposes of the calculation of Adjusted EPS was 18.2% for the year ended December 31, 2019 and 18.2% for the year ended December 31, 2018. The Tax Impact of Reconciling Items and Discrete Tax Items is calculated using the current quarter’s estimate of the annual structural tax rate for the full year. This may result in the current period adjustment plus prior reported quarterly adjustments to not sum to the full year adjustment. investors.ironmountain.com 14
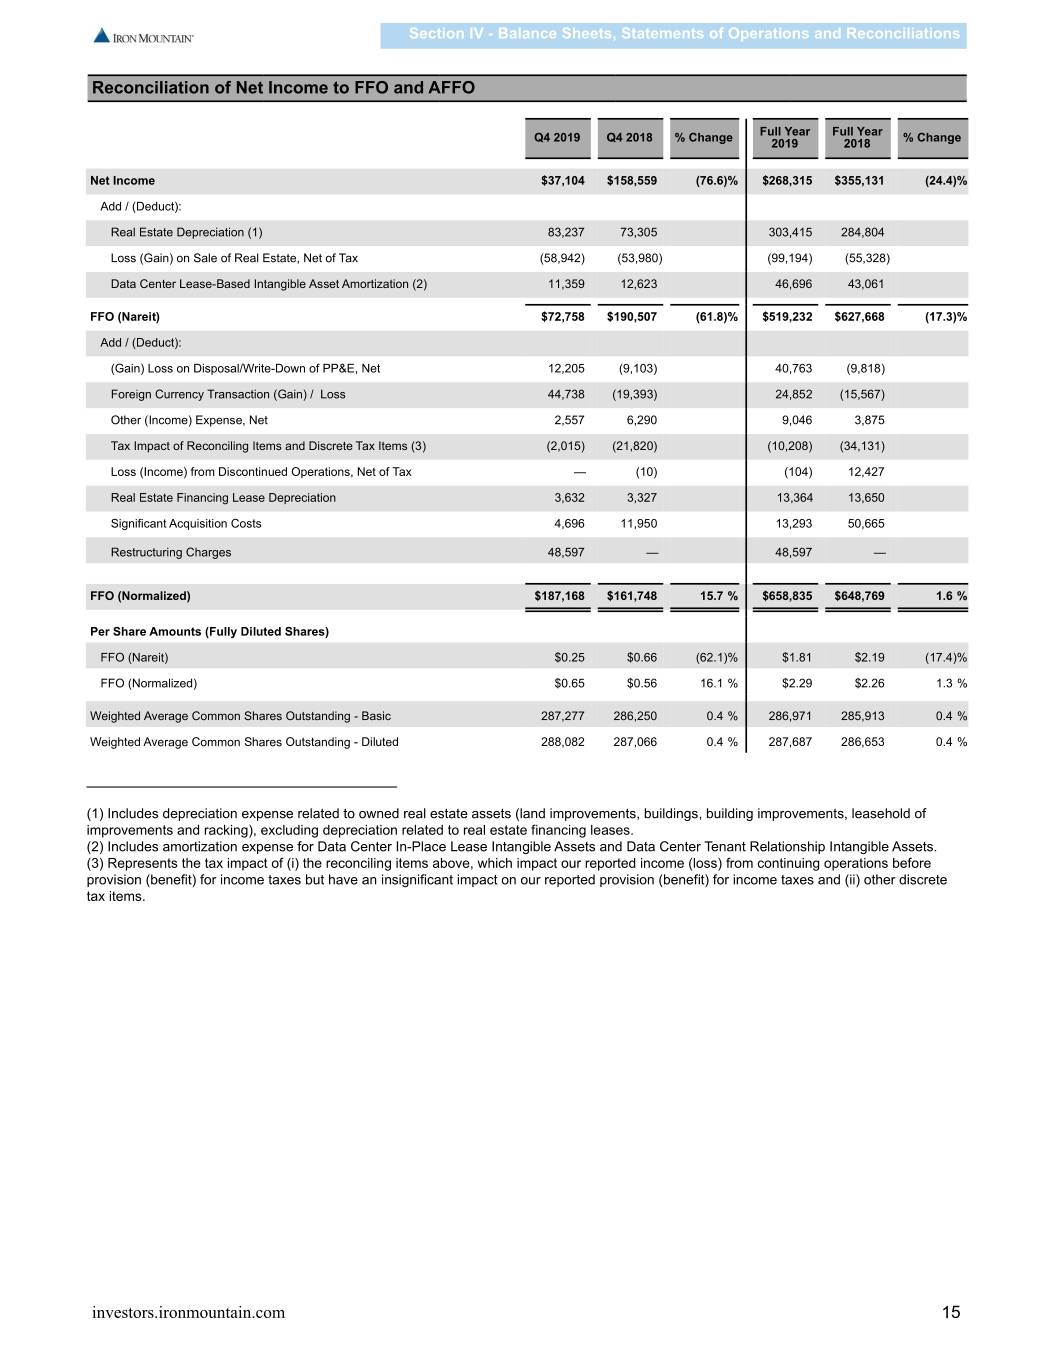
Section IV - Balance Sheets, Statements of Operations and Reconciliations Reconciliation of Net Income to FFO and AFFO Full Year Full Year Q4 2019 Q4 2018 % Change 2019 2018 % Change Net Income $37,104 $158,559 (76.6)% $268,315 $355,131 (24.4)% Add / (Deduct): Real Estate Depreciation (1) 83,237 73,305 303,415 284,804 Loss (Gain) on Sale of Real Estate, Net of Tax (58,942) (53,980) (99,194) (55,328) Data Center Lease-Based Intangible Asset Amortization (2) 11,359 12,623 46,696 43,061 FFO (Nareit) $72,758 $190,507 (61.8)% $519,232 $627,668 (17.3)% Add / (Deduct): (Gain) Loss on Disposal/Write-Down of PP&E, Net 12,205 (9,103) 40,763 (9,818) Foreign Currency Transaction (Gain) / Loss 44,738 (19,393) 24,852 (15,567) Other (Income) Expense, Net 2,557 6,290 9,046 3,875 Tax Impact of Reconciling Items and Discrete Tax Items (3) (2,015) (21,820) (10,208) (34,131) Loss (Income) from Discontinued Operations, Net of Tax — (10) (104) 12,427 Real Estate Financing Lease Depreciation 3,632 3,327 13,364 13,650 Significant Acquisition Costs 4,696 11,950 13,293 50,665 Restructuring Charges 48,597 — 48,597 — FFO (Normalized) $187,168 $161,748 15.7 % $658,835 $648,769 1.6 % Per Share Amounts (Fully Diluted Shares) FFO (Nareit) $0.25 $0.66 (62.1)% $1.81 $2.19 (17.4)% FFO (Normalized) $0.65 $0.56 16.1 % $2.29 $2.26 1.3 % Weighted Average Common Shares Outstanding - Basic 287,277 286,250 0.4 % 286,971 285,913 0.4 % Weighted Average Common Shares Outstanding - Diluted 288,082 287,066 0.4 % 287,687 286,653 0.4 % (1) Includes depreciation expense related to owned real estate assets (land improvements, buildings, building improvements, leasehold of improvements and racking), excluding depreciation related to real estate financing leases. (2) Includes amortization expense for Data Center In-Place Lease Intangible Assets and Data Center Tenant Relationship Intangible Assets. (3) Represents the tax impact of (i) the reconciling items above, which impact our reported income (loss) from continuing operations before provision (benefit) for income taxes but have an insignificant impact on our reported provision (benefit) for income taxes and (ii) other discrete tax items. investors.ironmountain.com 15
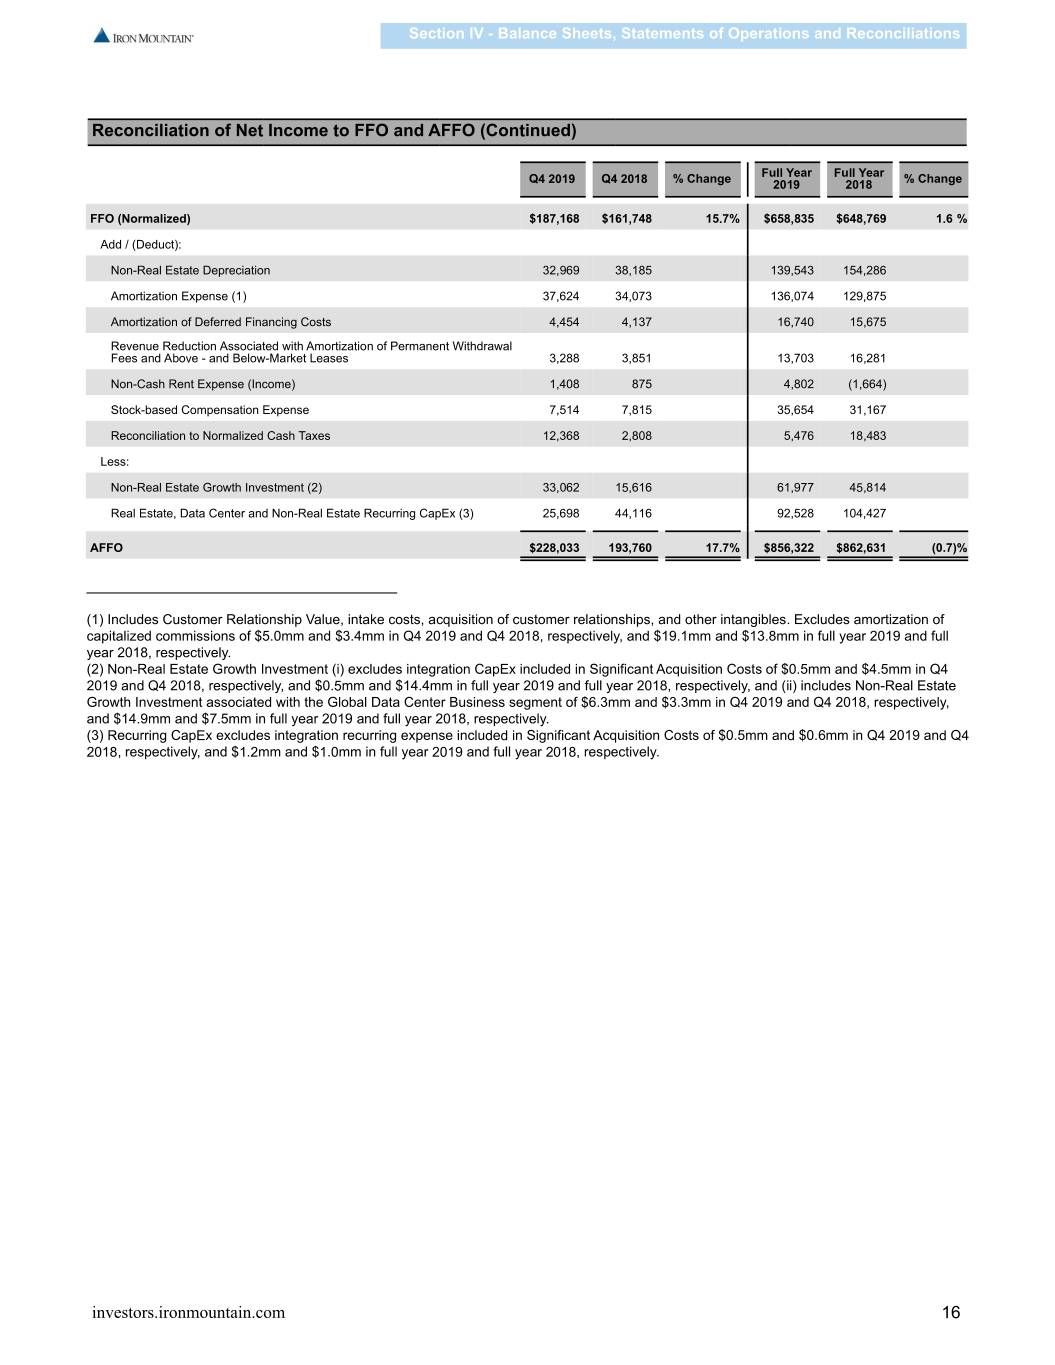
Section IV - Balance Sheets, Statements of Operations and Reconciliations Reconciliation of Net Income to FFO and AFFO (Continued) Full Year Full Year Q4 2019 Q4 2018 % Change 2019 2018 % Change FFO (Normalized) $187,168 $161,748 15.7% $658,835 $648,769 1.6 % Add / (Deduct): Non-Real Estate Depreciation 32,969 38,185 139,543 154,286 Amortization Expense (1) 37,624 34,073 136,074 129,875 Amortization of Deferred Financing Costs 4,454 4,137 16,740 15,675 Revenue Reduction Associated with Amortization of Permanent Withdrawal Fees and Above - and Below-Market Leases 3,288 3,851 13,703 16,281 Non-Cash Rent Expense (Income) 1,408 875 4,802 (1,664) Stock-based Compensation Expense 7,514 7,815 35,654 31,167 Reconciliation to Normalized Cash Taxes 12,368 2,808 5,476 18,483 Less: Non-Real Estate Growth Investment (2) 33,062 15,616 61,977 45,814 Real Estate, Data Center and Non-Real Estate Recurring CapEx (3) 25,698 44,116 92,528 104,427 AFFO $228,033 193,760 17.7% $856,322 $862,631 (0.7)% (1) Includes Customer Relationship Value, intake costs, acquisition of customer relationships, and other intangibles. Excludes amortization of capitalized commissions of $5.0mm and $3.4mm in Q4 2019 and Q4 2018, respectively, and $19.1mm and $13.8mm in full year 2019 and full year 2018, respectively. (2) Non-Real Estate Growth Investment (i) excludes integration CapEx included in Significant Acquisition Costs of $0.5mm and $4.5mm in Q4 2019 and Q4 2018, respectively, and $0.5mm and $14.4mm in full year 2019 and full year 2018, respectively, and (ii) includes Non-Real Estate Growth Investment associated with the Global Data Center Business segment of $6.3mm and $3.3mm in Q4 2019 and Q4 2018, respectively, and $14.9mm and $7.5mm in full year 2019 and full year 2018, respectively. (3) Recurring CapEx excludes integration recurring expense included in Significant Acquisition Costs of $0.5mm and $0.6mm in Q4 2019 and Q4 2018, respectively, and $1.2mm and $1.0mm in full year 2019 and full year 2018, respectively. investors.ironmountain.com 16
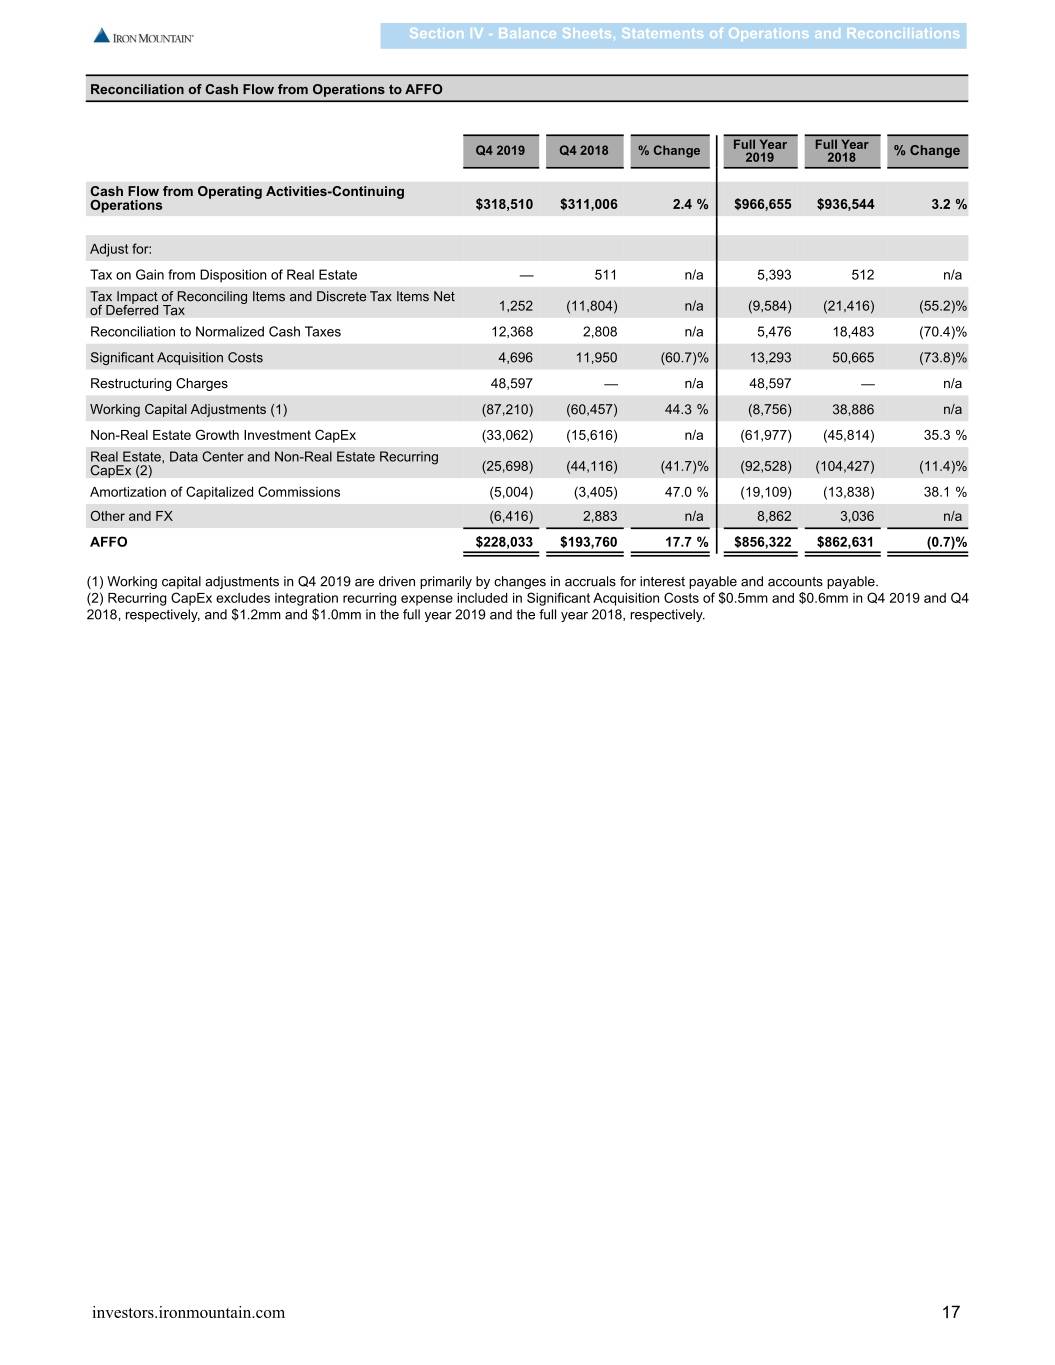
Section IV - Balance Sheets, Statements of Operations and Reconciliations Reconciliation of Cash Flow from Operations to AFFO Q4 2019 Q4 2018 % Change Full Year Full Year % Change 2019 2018 Cash Flow from Operating Activities-Continuing Operations $318,510 $311,006 2.4 % $966,655 $936,544 3.2 % Adjust for: Tax on Gain from Disposition of Real Estate — 511 n/a 5,393 512 n/a Tax Impact of Reconciling Items and Discrete Tax Items Net of Deferred Tax 1,252 (11,804) n/a (9,584) (21,416) (55.2)% Reconciliation to Normalized Cash Taxes 12,368 2,808 n/a 5,476 18,483 (70.4)% Significant Acquisition Costs 4,696 11,950 (60.7)% 13,293 50,665 (73.8)% Restructuring Charges 48,597 — n/a 48,597 — n/a Working Capital Adjustments (1) (87,210) (60,457) 44.3 % (8,756) 38,886 n/a Non-Real Estate Growth Investment CapEx (33,062) (15,616) n/a (61,977) (45,814) 35.3 % Real Estate, Data Center and Non-Real Estate Recurring CapEx (2) (25,698) (44,116) (41.7)% (92,528) (104,427) (11.4)% Amortization of Capitalized Commissions (5,004) (3,405) 47.0 % (19,109) (13,838) 38.1 % Other and FX (6,416) 2,883 n/a 8,862 3,036 n/a AFFO $228,033 $193,760 17.7 % $856,322 $862,631 (0.7)% (1) Working capital adjustments in Q4 2019 are driven primarily by changes in accruals for interest payable and accounts payable. (2) Recurring CapEx excludes integration recurring expense included in Significant Acquisition Costs of $0.5mm and $0.6mm in Q4 2019 and Q4 2018, respectively, and $1.2mm and $1.0mm in the full year 2019 and the full year 2018, respectively. investors.ironmountain.com 17
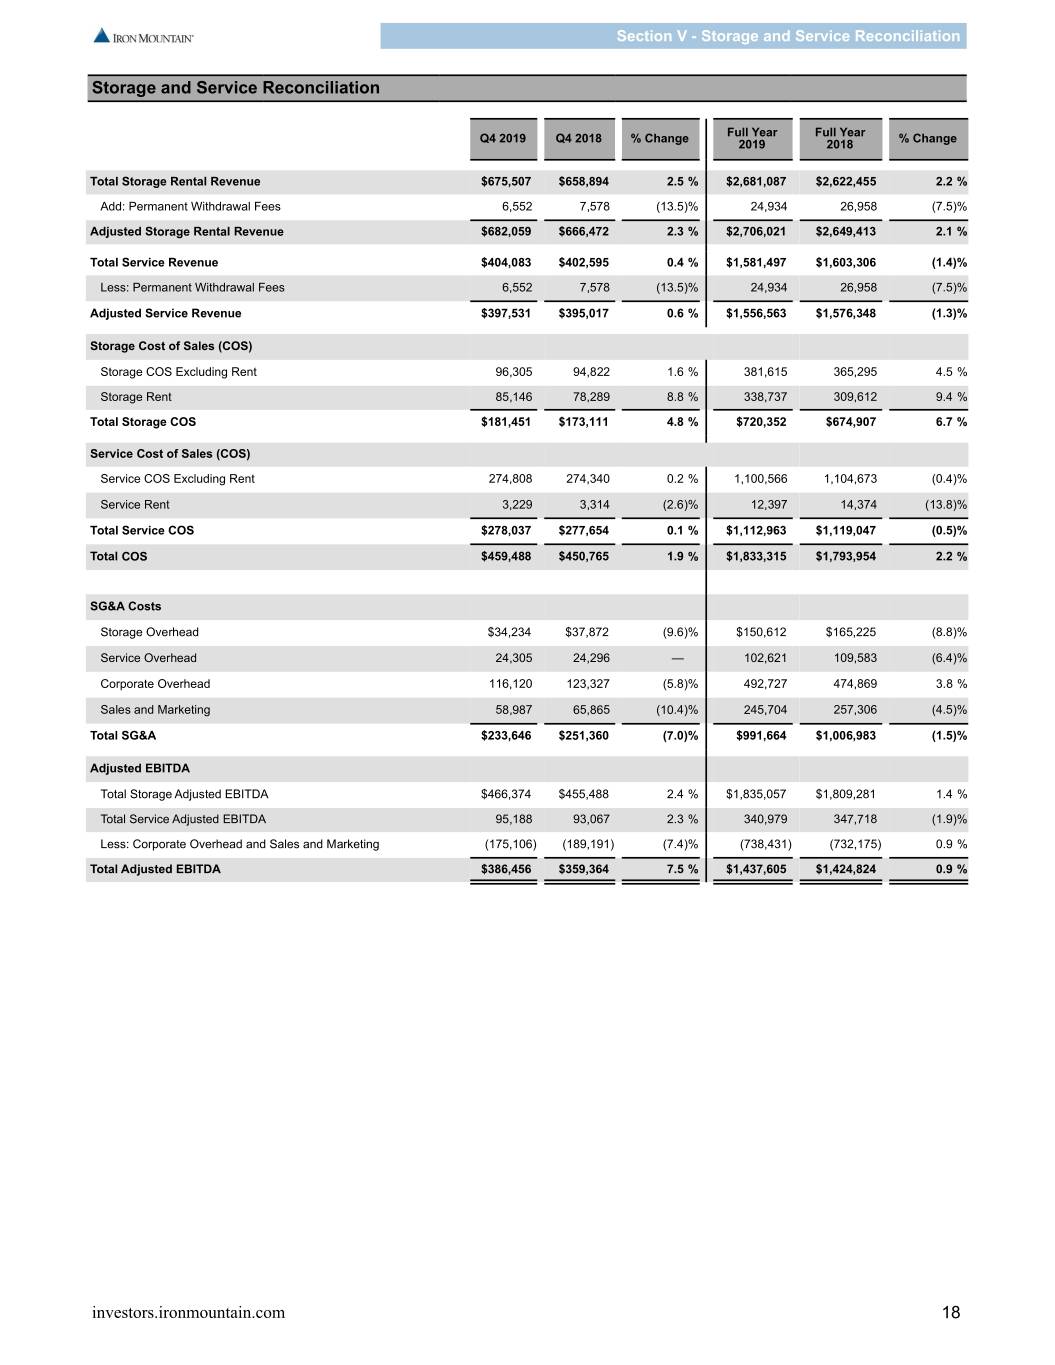
Section V - Storage and Service Reconciliation Storage and Service Reconciliation Full Year Full Year Q4 2019 Q4 2018 % Change 2019 2018 % Change Total Storage Rental Revenue $675,507 $658,894 2.5 % $2,681,087 $2,622,455 2.2 % Add: Permanent Withdrawal Fees 6,552 7,578 (13.5)% 24,934 26,958 (7.5)% Adjusted Storage Rental Revenue $682,059 $666,472 2.3 % $2,706,021 $2,649,413 2.1 % Total Service Revenue $404,083 $402,595 0.4 % $1,581,497 $1,603,306 (1.4)% Less: Permanent Withdrawal Fees 6,552 7,578 (13.5)% 24,934 26,958 (7.5)% Adjusted Service Revenue $397,531 $395,017 0.6 % $1,556,563 $1,576,348 (1.3)% Storage Cost of Sales (COS) Storage COS Excluding Rent 96,305 94,822 1.6 % 381,615 365,295 4.5 % Storage Rent 85,146 78,289 8.8 % 338,737 309,612 9.4 % Total Storage COS $181,451 $173,111 4.8 % $720,352 $674,907 6.7 % Service Cost of Sales (COS) Service COS Excluding Rent 274,808 274,340 0.2 % 1,100,566 1,104,673 (0.4)% Service Rent 3,229 3,314 (2.6)% 12,397 14,374 (13.8)% Total Service COS $278,037 $277,654 0.1 % $1,112,963 $1,119,047 (0.5)% Total COS $459,488 $450,765 1.9 % $1,833,315 $1,793,954 2.2 % SG&A Costs Storage Overhead $34,234 $37,872 (9.6)% $150,612 $165,225 (8.8)% Service Overhead 24,305 24,296 — 102,621 109,583 (6.4)% Corporate Overhead 116,120 123,327 (5.8)% 492,727 474,869 3.8 % Sales and Marketing 58,987 65,865 (10.4)% 245,704 257,306 (4.5)% Total SG&A $233,646 $251,360 (7.0)% $991,664 $1,006,983 (1.5)% Adjusted EBITDA Total Storage Adjusted EBITDA $466,374 $455,488 2.4 % $1,835,057 $1,809,281 1.4 % Total Service Adjusted EBITDA 95,188 93,067 2.3 % 340,979 347,718 (1.9)% Less: Corporate Overhead and Sales and Marketing (175,106) (189,191) (7.4)% (738,431) (732,175) 0.9 % Total Adjusted EBITDA $386,456 $359,364 7.5 % $1,437,605 $1,424,824 0.9 % investors.ironmountain.com 18
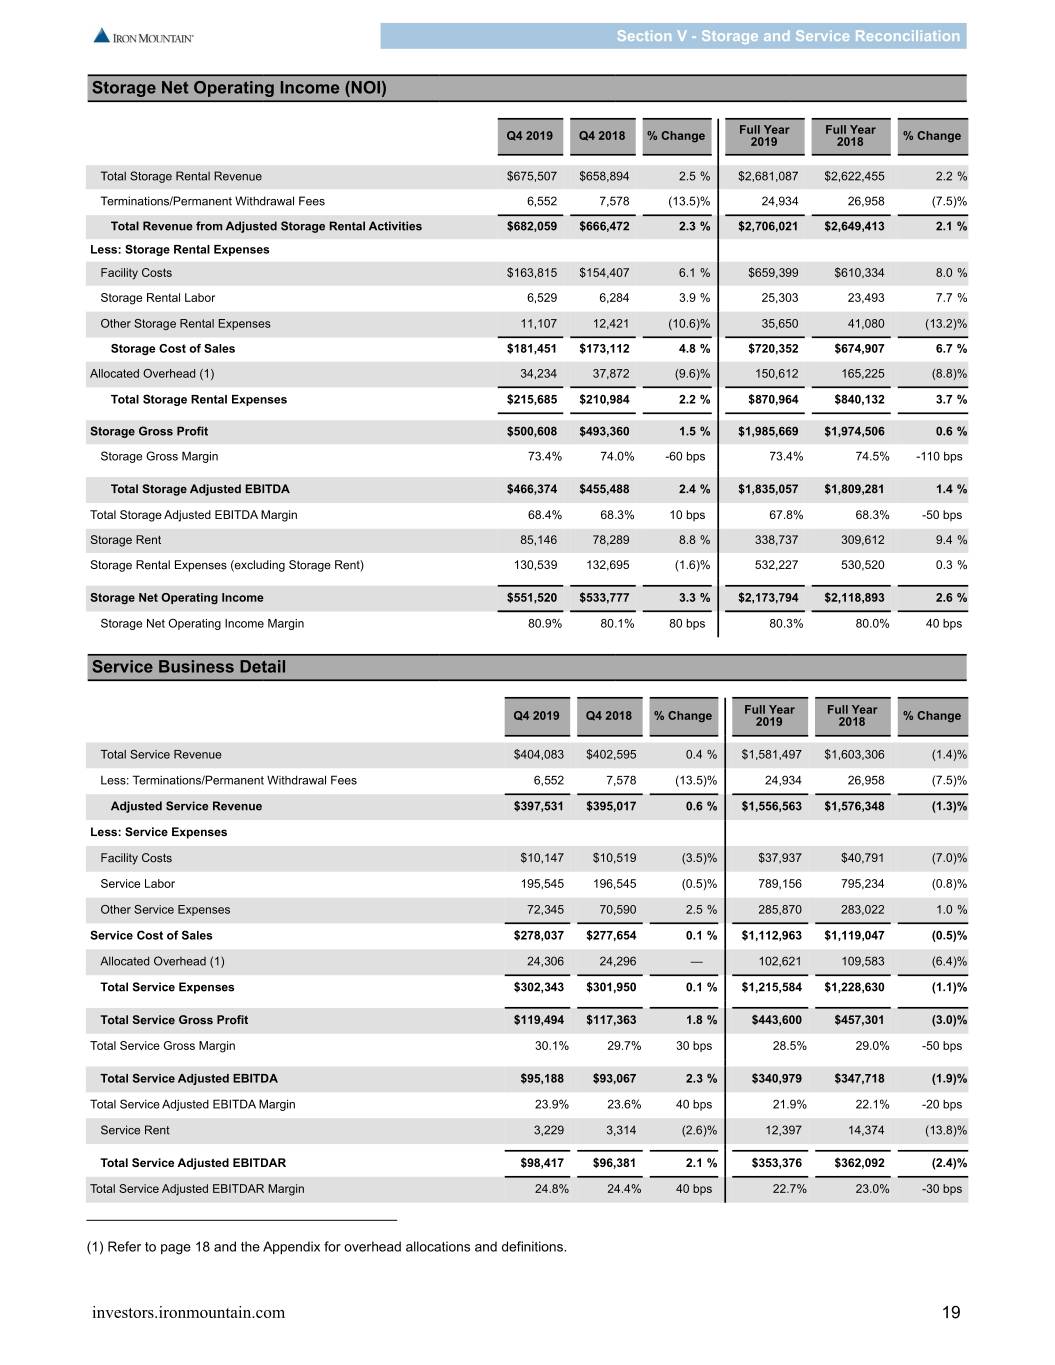
Section V - Storage and Service Reconciliation Storage Net Operating Income (NOI) Full Year Full Year Q4 2019 Q4 2018 % Change 2019 2018 % Change Total Storage Rental Revenue $675,507 $658,894 2.5 % $2,681,087 $2,622,455 2.2 % Terminations/Permanent Withdrawal Fees 6,552 7,578 (13.5)% 24,934 26,958 (7.5)% Total Revenue from Adjusted Storage Rental Activities $682,059 $666,472 2.3 % $2,706,021 $2,649,413 2.1 % Less: Storage Rental Expenses Facility Costs $163,815 $154,407 6.1 % $659,399 $610,334 8.0 % Storage Rental Labor 6,529 6,284 3.9 % 25,303 23,493 7.7 % Other Storage Rental Expenses 11,107 12,421 (10.6)% 35,650 41,080 (13.2)% Storage Cost of Sales $181,451 $173,112 4.8 % $720,352 $674,907 6.7 % Allocated Overhead (1) 34,234 37,872 (9.6)% 150,612 165,225 (8.8)% Total Storage Rental Expenses $215,685 $210,984 2.2 % $870,964 $840,132 3.7 % Storage Gross Profit $500,608 $493,360 1.5 % $1,985,669 $1,974,506 0.6 % Storage Gross Margin 73.4% 74.0% -60 bps 73.4% 74.5% -110 bps Total Storage Adjusted EBITDA $466,374 $455,488 2.4 % $1,835,057 $1,809,281 1.4 % Total Storage Adjusted EBITDA Margin 68.4% 68.3% 10 bps 67.8% 68.3% -50 bps Storage Rent 85,146 78,289 8.8 % 338,737 309,612 9.4 % Storage Rental Expenses (excluding Storage Rent) 130,539 132,695 (1.6)% 532,227 530,520 0.3 % Storage Net Operating Income $551,520 $533,777 3.3 % $2,173,794 $2,118,893 2.6 % Storage Net Operating Income Margin 80.9% 80.1% 80 bps 80.3% 80.0% 40 bps Service Business Detail Full Year Full Year Q4 2019 Q4 2018 % Change 2019 2018 % Change Total Service Revenue $404,083 $402,595 0.4 % $1,581,497 $1,603,306 (1.4)% Less: Terminations/Permanent Withdrawal Fees 6,552 7,578 (13.5)% 24,934 26,958 (7.5)% Adjusted Service Revenue $397,531 $395,017 0.6 % $1,556,563 $1,576,348 (1.3)% Less: Service Expenses Facility Costs $10,147 $10,519 (3.5)% $37,937 $40,791 (7.0)% Service Labor 195,545 196,545 (0.5)% 789,156 795,234 (0.8)% Other Service Expenses 72,345 70,590 2.5 % 285,870 283,022 1.0 % Service Cost of Sales $278,037 $277,654 0.1 % $1,112,963 $1,119,047 (0.5)% Allocated Overhead (1) 24,306 24,296 — 102,621 109,583 (6.4)% Total Service Expenses $302,343 $301,950 0.1 % $1,215,584 $1,228,630 (1.1)% Total Service Gross Profit $119,494 $117,363 1.8 % $443,600 $457,301 (3.0)% Total Service Gross Margin 30.1% 29.7% 30 bps 28.5% 29.0% -50 bps Total Service Adjusted EBITDA $95,188 $93,067 2.3 % $340,979 $347,718 (1.9)% Total Service Adjusted EBITDA Margin 23.9% 23.6% 40 bps 21.9% 22.1% -20 bps Service Rent 3,229 3,314 (2.6)% 12,397 14,374 (13.8)% Total Service Adjusted EBITDAR $98,417 $96,381 2.1 % $353,376 $362,092 (2.4)% Total Service Adjusted EBITDAR Margin 24.8% 24.4% 40 bps 22.7% 23.0% -30 bps (1) Refer to page 18 and the Appendix for overhead allocations and definitions. investors.ironmountain.com 19
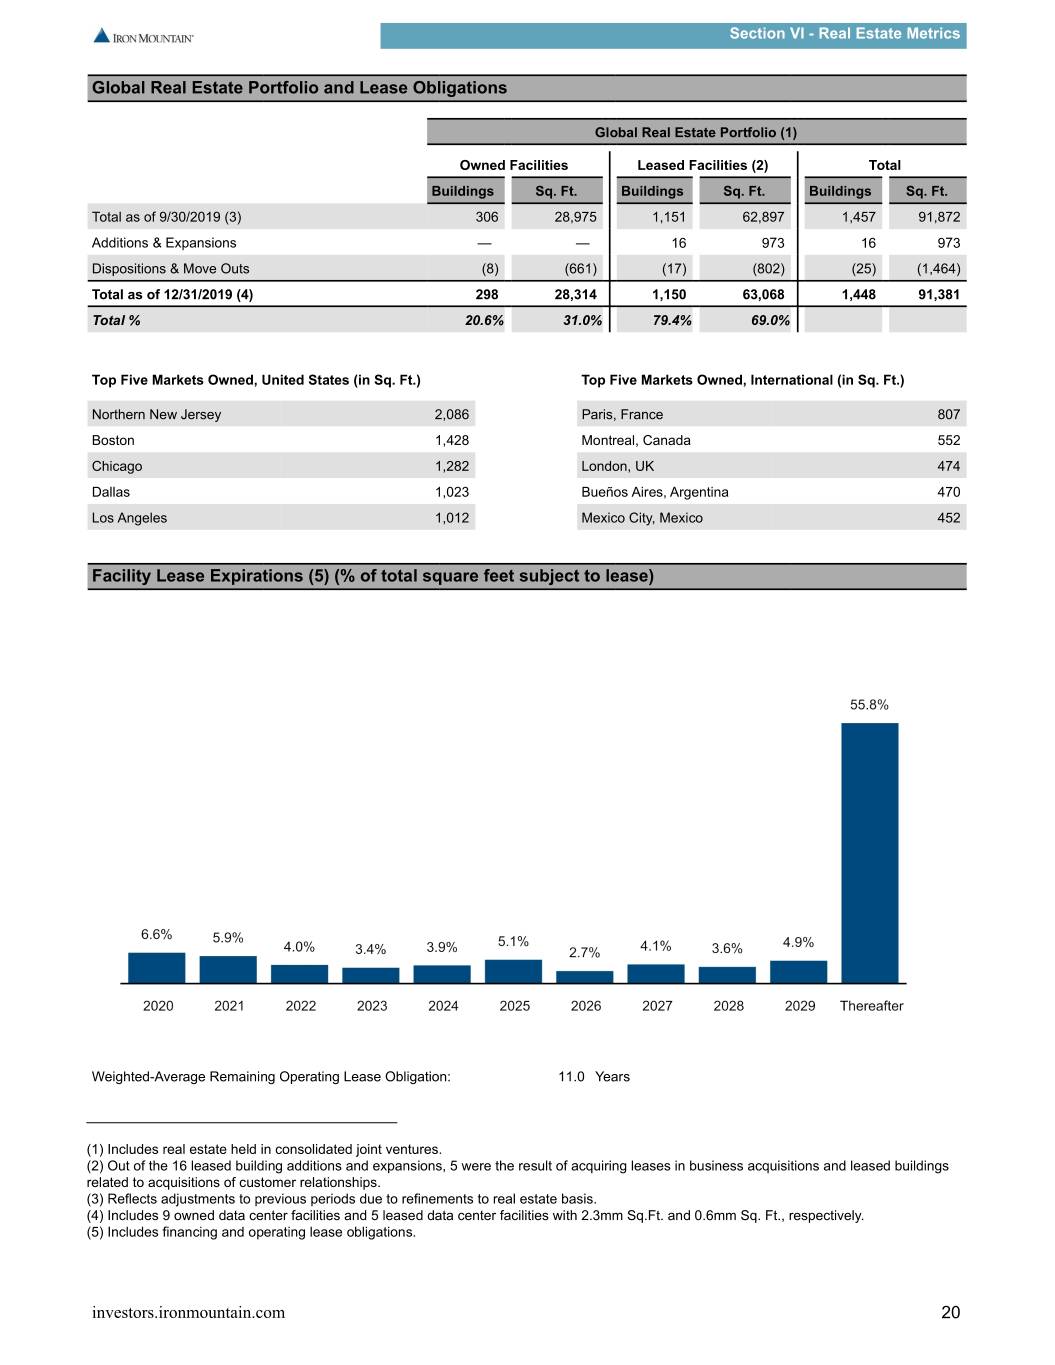
Section VI - Real Estate Metrics Global Real Estate Portfolio and Lease Obligations Global Real Estate Portfolio (1) Owned Facilities Leased Facilities (2) Total Buildings Sq. Ft. Buildings Sq. Ft. Buildings Sq. Ft. Total as of 9/30/2019 (3) 306 28,975 1,151 62,897 1,457 91,872 Additions & Expansions — — 16 973 16 973 Dispositions & Move Outs (8) (661) (17) (802) (25) (1,464) Total as of 12/31/2019 (4) 298 28,314 1,150 63,068 1,448 91,381 Total % 20.6% 31.0% 79.4% 69.0% Top Five Markets Owned, United States (in Sq. Ft.) Top Five Markets Owned, International (in Sq. Ft.) Northern New Jersey 2,086 Paris, France 807 Boston 1,428 Montreal, Canada 552 Chicago 1,282 London, UK 474 Dallas 1,023 Bueños Aires, Argentina 470 Los Angeles 1,012 Mexico City, Mexico 452 Facility Lease Expirations (5) (% of total square feet subject to lease) Weighted-Average Remaining Operating Lease Obligation: 11.0 Years (1) Includes real estate held in consolidated joint ventures. (2) Out of the 16 leased building additions and expansions, 5 were the result of acquiring leases in business acquisitions and leased buildings related to acquisitions of customer relationships. (3) Reflects adjustments to previous periods due to refinements to real estate basis. (4) Includes 9 owned data center facilities and 5 leased data center facilities with 2.3mm Sq.Ft. and 0.6mm Sq. Ft., respectively. (5) Includes financing and operating lease obligations. investors.ironmountain.com 20
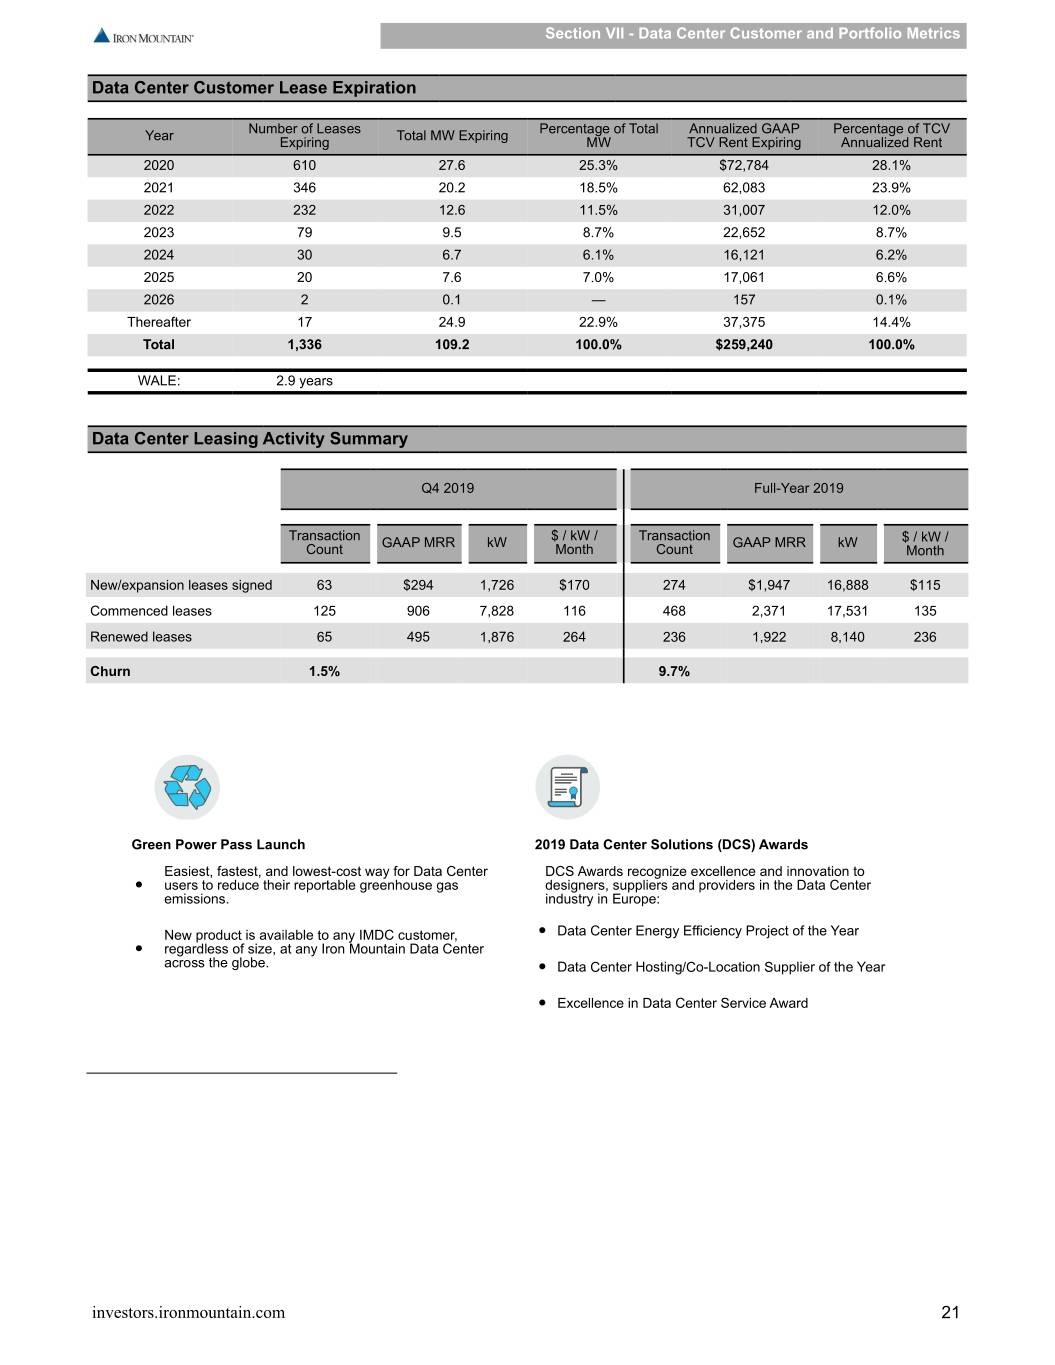
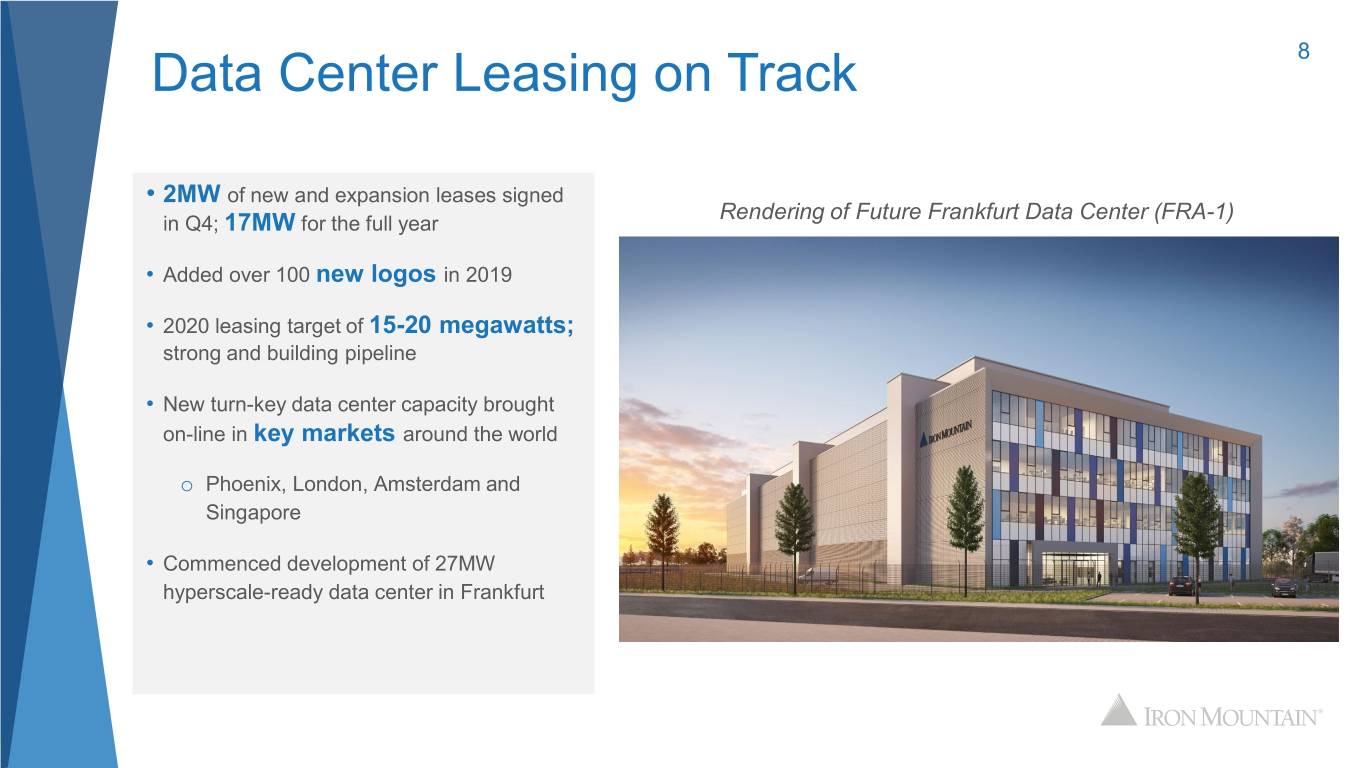
Section VII - Data Center Customer and Portfolio Metrics Data Center Customer Lease Expiration Number of Leases Percentage of Total Annualized GAAP Percentage of TCV Year Expiring Total MW Expiring MW TCV Rent Expiring Annualized Rent 2020 610 27.6 25.3% $72,784 28.1% 2021 346 20.2 18.5% 62,083 23.9% 2022 232 12.6 11.5% 31,007 12.0% 2023 79 9.5 8.7% 22,652 8.7% 2024 30 6.7 6.1% 16,121 6.2% 2025 20 7.6 7.0% 17,061 6.6% 2026 2 0.1 — 157 0.1% Thereafter 17 24.9 22.9% 37,375 14.4% Total 1,336 109.2 100.0% $259,240 100.0% WALE: 2.9 years Data Center Leasing Activity Summary Q4 2019 Full-Year 2019 Transaction GAAP MRR kW $ / kW / Transaction GAAP MRR kW $ / kW / Count Month Count Month New/expansion leases signed 63 $294 1,726 $170 274 $1,947 16,888 $115 Commenced leases 125 906 7,828 116 468 2,371 17,531 135 Renewed leases 65 495 1,876 264 236 1,922 8,140 236 Churn 1.5% 9.7% Green Power Pass Launch 2019 Data Center Solutions (DCS) Awards Easiest, fastest, and lowest-cost way for Data Center DCS Awards recognize excellence and innovation to users to reduce their reportable greenhouse gas designers, suppliers and providers in the Data Center emissions. industry in Europe: New product is available to any IMDC customer, Data Center Energy Efficiency Project of the Year regardless of size, at any Iron Mountain Data Center across the globe. Data Center Hosting/Co-Location Supplier of the Year Excellence in Data Center Service Award investors.ironmountain.com 21
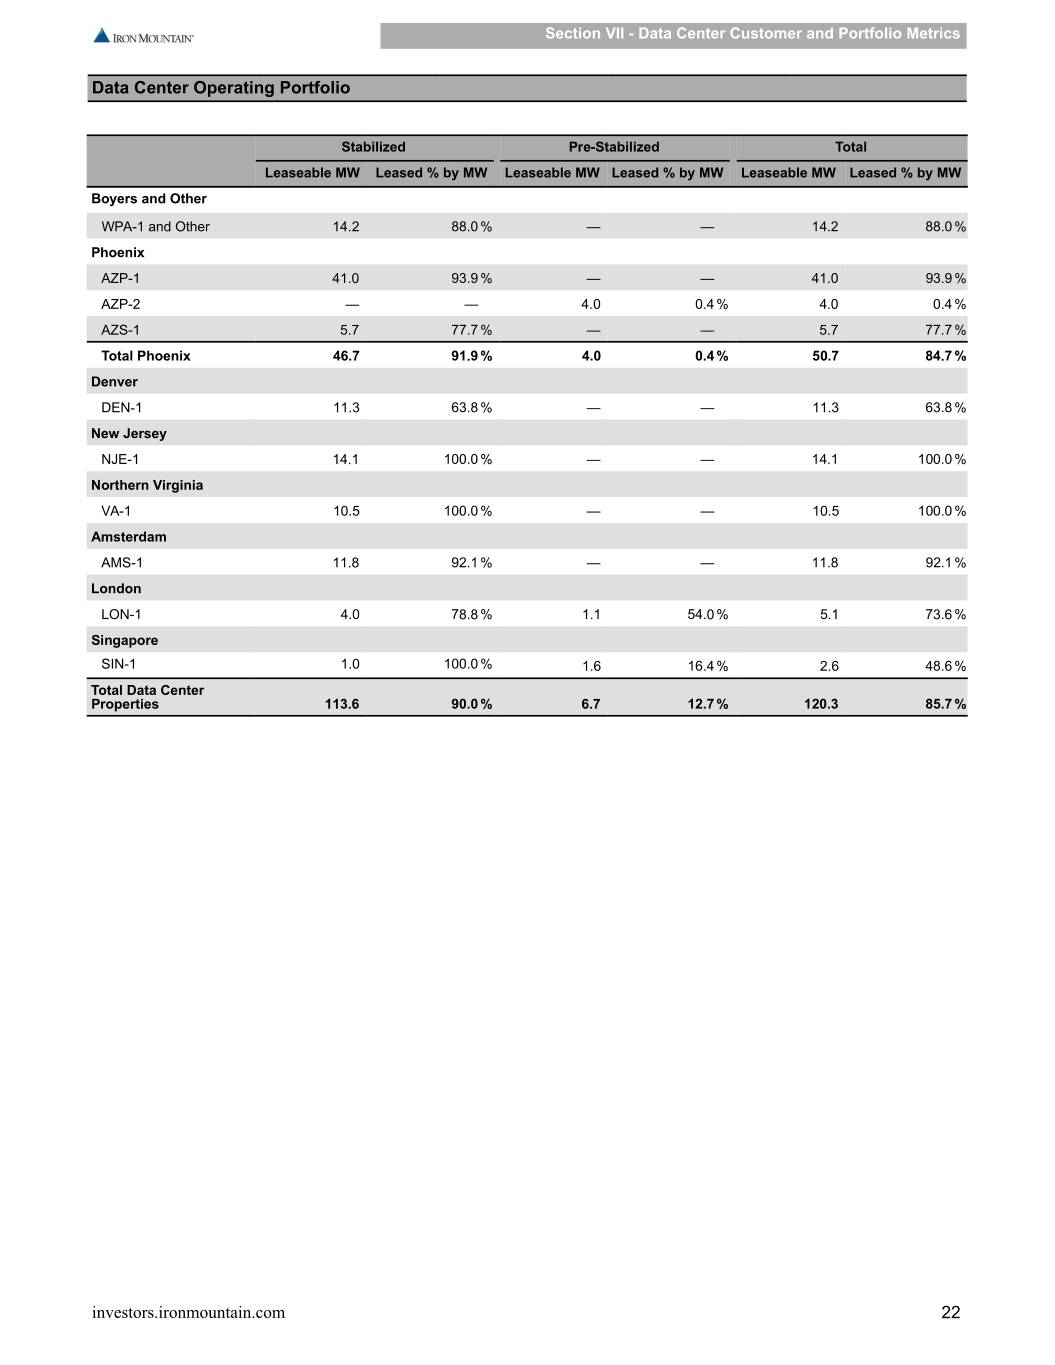
Section VII - Data Center Customer and Portfolio Metrics Data Center Operating Portfolio Stabilized Pre-Stabilized Total Leaseable MW Leased % by MW Leaseable MW Leased % by MW Leaseable MW Leased % by MW Boyers and Other WPA-1 and Other 14.2 88.0 % — — 14.2 88.0 % Phoenix AZP-1 41.0 93.9 % — — 41.0 93.9 % AZP-2 — — 4.0 0.4 % 4.0 0.4 % AZS-1 5.7 77.7 % — — 5.7 77.7 % Total Phoenix 46.7 91.9 % 4.0 0.4 % 50.7 84.7 % Denver DEN-1 11.3 63.8 % — — 11.3 63.8 % New Jersey NJE-1 14.1 100.0 % — — 14.1 100.0 % Northern Virginia VA-1 10.5 100.0 % — — 10.5 100.0 % Amsterdam AMS-1 11.8 92.1 % — — 11.8 92.1 % London LON-1 4.0 78.8 % 1.1 54.0 % 5.1 73.6 % Singapore SIN-1 1.0 100.0 % 1.6 16.4 % 2.6 48.6 % Total Data Center Properties 113.6 90.0 % 6.7 12.7 % 120.3 85.7 % investors.ironmountain.com 22
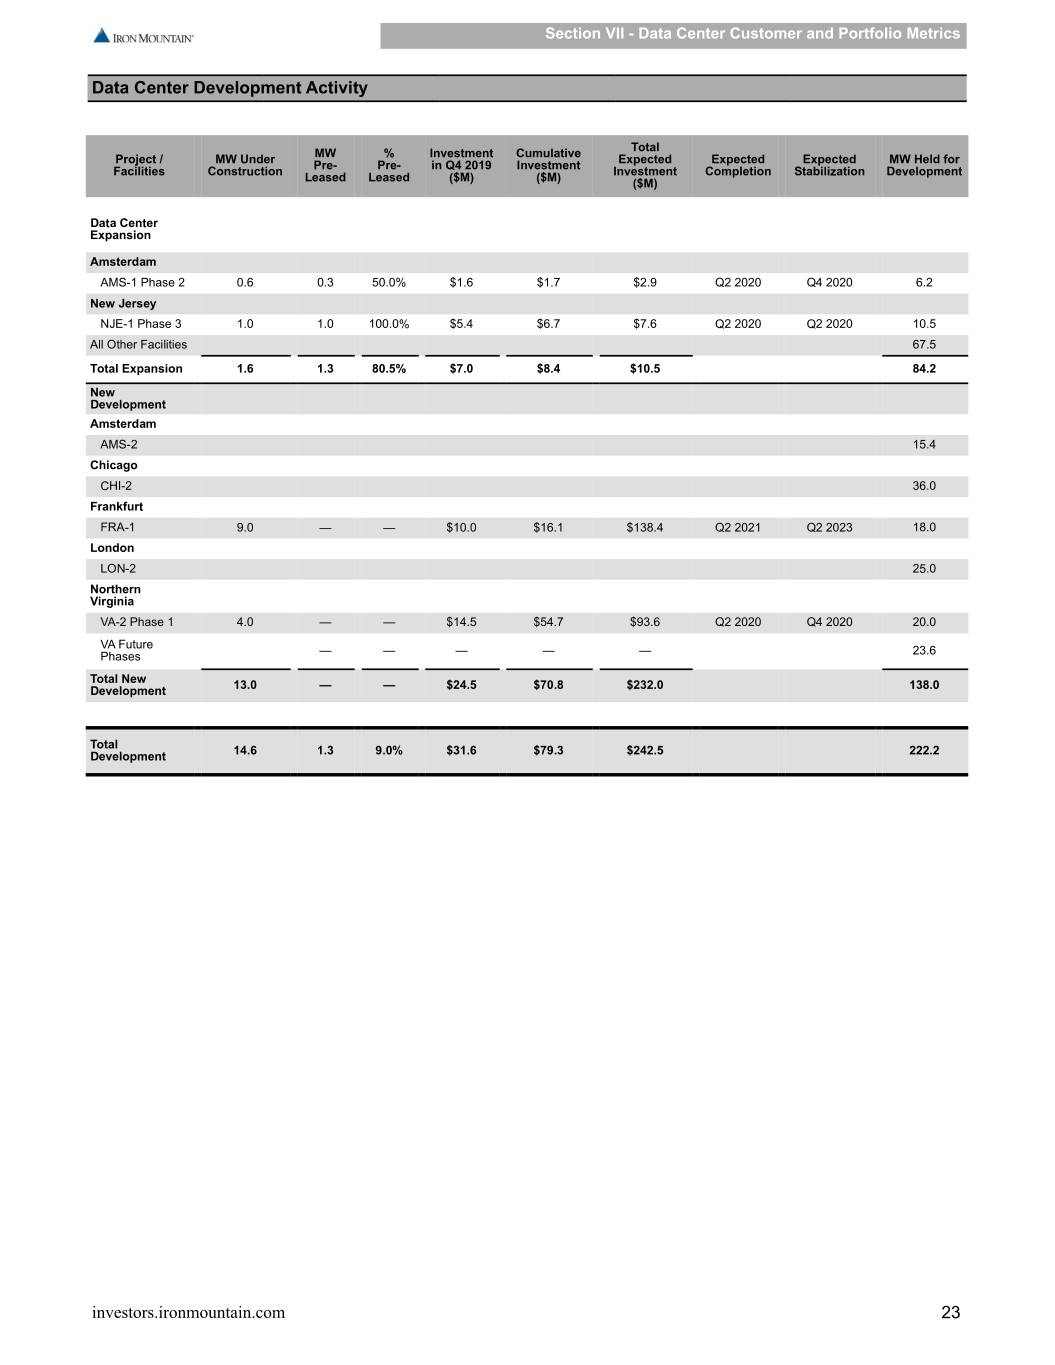
Section VII - Data Center Customer and Portfolio Metrics Data Center Development Activity Total Project / MW Under MW % Investment Cumulative Expected Expected Expected MW Held for Facilities Construction Pre- Pre- in Q4 2019 Investment Investment Completion Stabilization Development Leased Leased ($M) ($M) ($M) Data Center Expansion Amsterdam AMS-1 Phase 2 0.6 0.3 50.0% $1.6 $1.7 $2.9 Q2 2020 Q4 2020 6.2 New Jersey NJE-1 Phase 3 1.0 1.0 100.0% $5.4 $6.7 $7.6 Q2 2020 Q2 2020 10.5 All Other Facilities 67.5 Total Expansion 1.6 1.3 80.5% $7.0 $8.4 $10.5 84.2 New Development Amsterdam AMS-2 15.4 Chicago CHI-2 36.0 Frankfurt FRA-1 9.0 — — $10.0 $16.1 $138.4 Q2 2021 Q2 2023 18.0 London LON-2 25.0 Northern Virginia VA-2 Phase 1 4.0 — — $14.5 $54.7 $93.6 Q2 2020 Q4 2020 20.0 VA Future Phases — — — — — 23.6 Total New Development 13.0 — — $24.5 $70.8 $232.0 138.0 Total Development 14.6 1.3 9.0% $31.6 $79.3 $242.5 222.2 investors.ironmountain.com 23
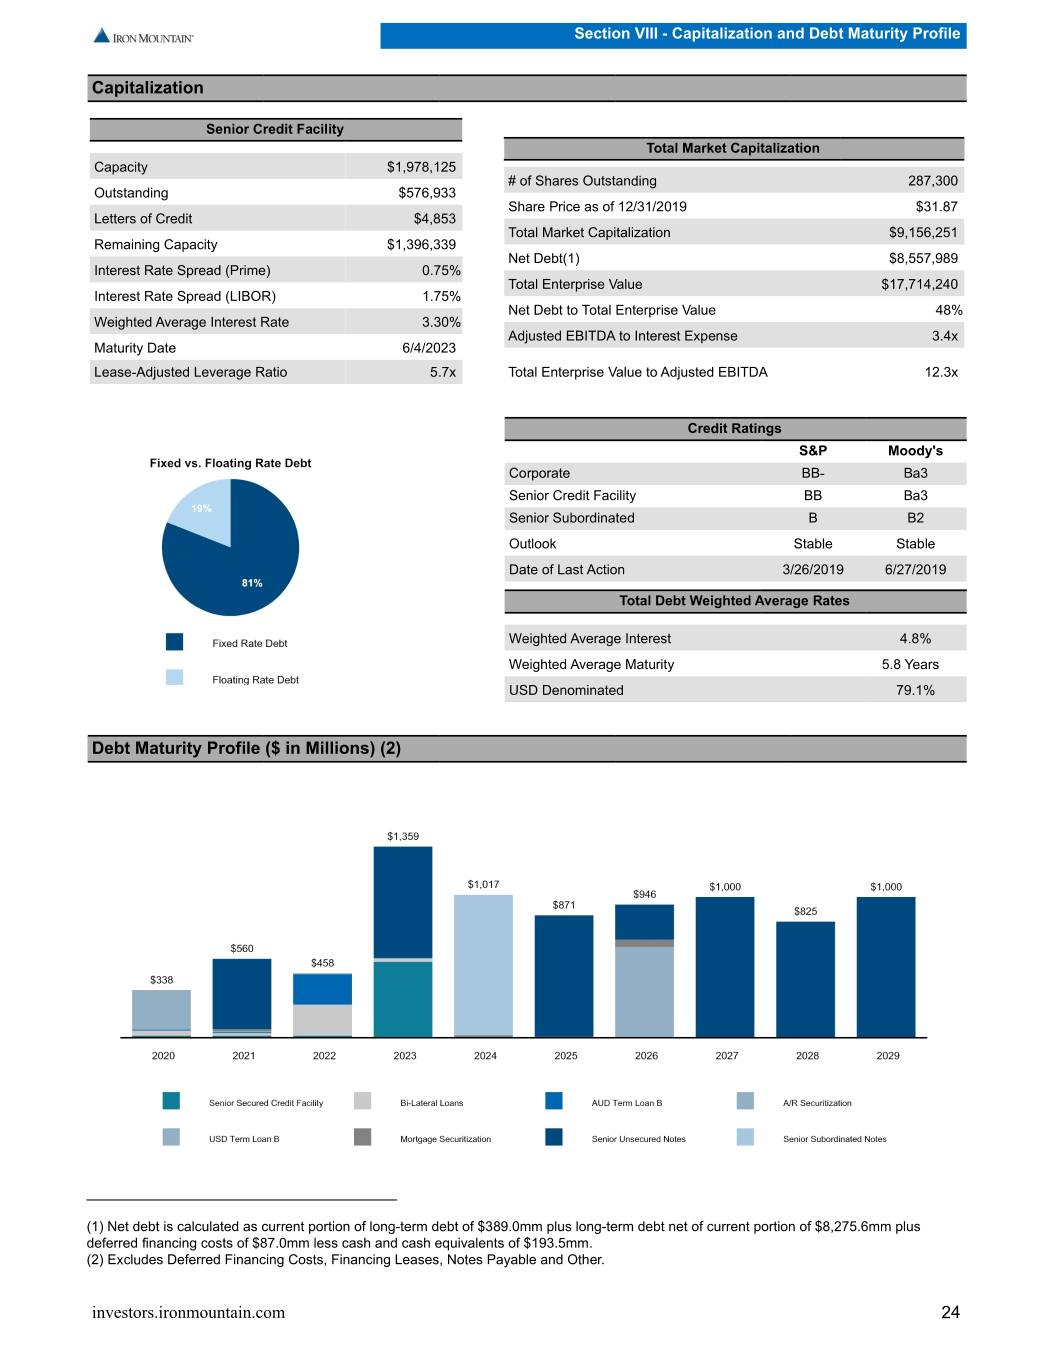
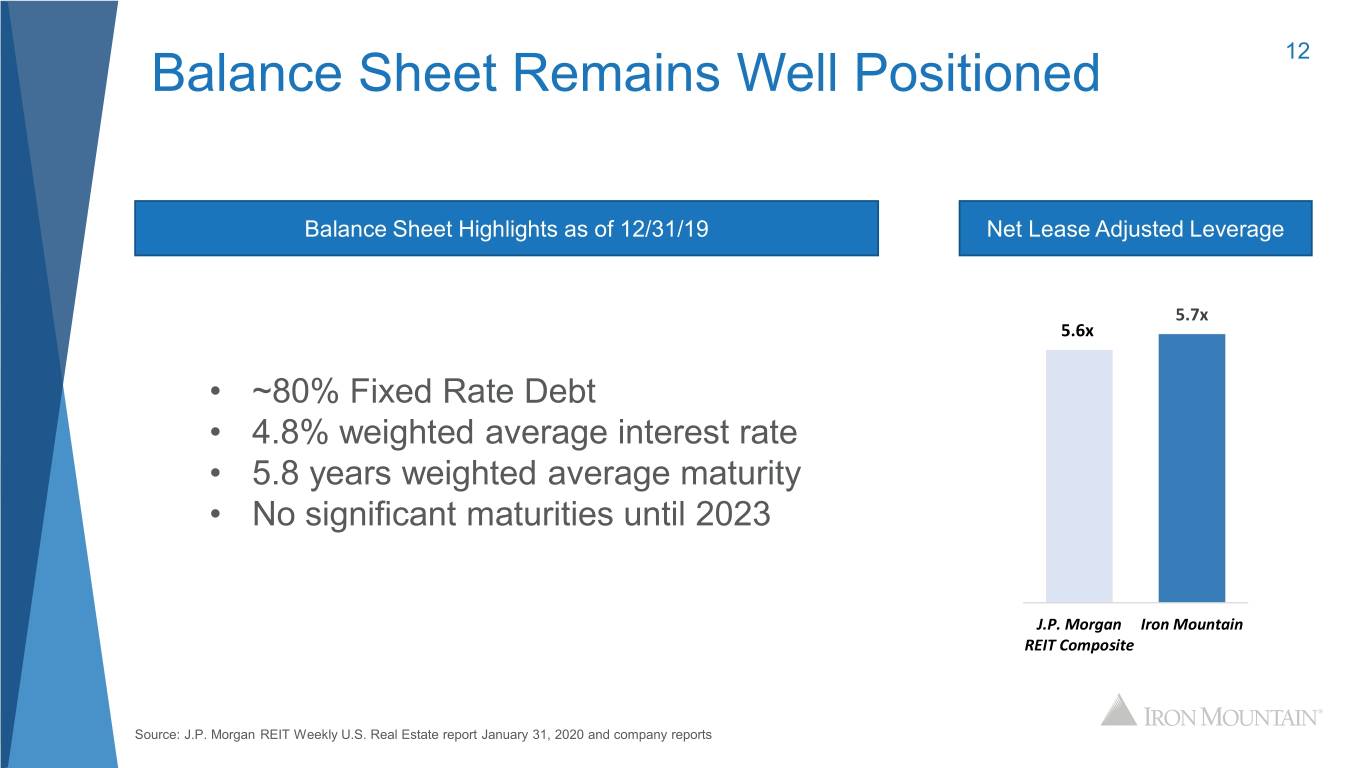
Section VIII - Capitalization and Debt Maturity Profile Capitalization Senior Credit Facility Total Market Capitalization Capacity $1,978,125 # of Shares Outstanding 287,300 Outstanding $576,933 Share Price as of 12/31/2019 $31.87 Letters of Credit $4,853 Total Market Capitalization $9,156,251 Remaining Capacity $1,396,339 Net Debt(1) $8,557,989 Interest Rate Spread (Prime) 0.75% Total Enterprise Value $17,714,240 Interest Rate Spread (LIBOR) 1.75% Net Debt to Total Enterprise Value 48% Weighted Average Interest Rate 3.30% Adjusted EBITDA to Interest Expense 3.4x Maturity Date 6/4/2023 Lease-Adjusted Leverage Ratio 5.7x Total Enterprise Value to Adjusted EBITDA 12.3x Credit Ratings S&P Moody's Corporate BB- Ba3 Senior Credit Facility BB Ba3 Senior Subordinated B B2 Outlook Stable Stable Date of Last Action 3/26/2019 6/27/2019 Total Debt Weighted Average Rates Weighted Average Interest 4.8% Weighted Average Maturity 5.8 Years USD Denominated 79.1% Debt Maturity Profile ($ in Millions) (2) (1) Net debt is calculated as current portion of long-term debt of $389.0mm plus long-term debt net of current portion of $8,275.6mm plus deferred financing costs of $87.0mm less cash and cash equivalents of $193.5mm. (2) Excludes Deferred Financing Costs, Financing Leases, Notes Payable and Other. investors.ironmountain.com 24
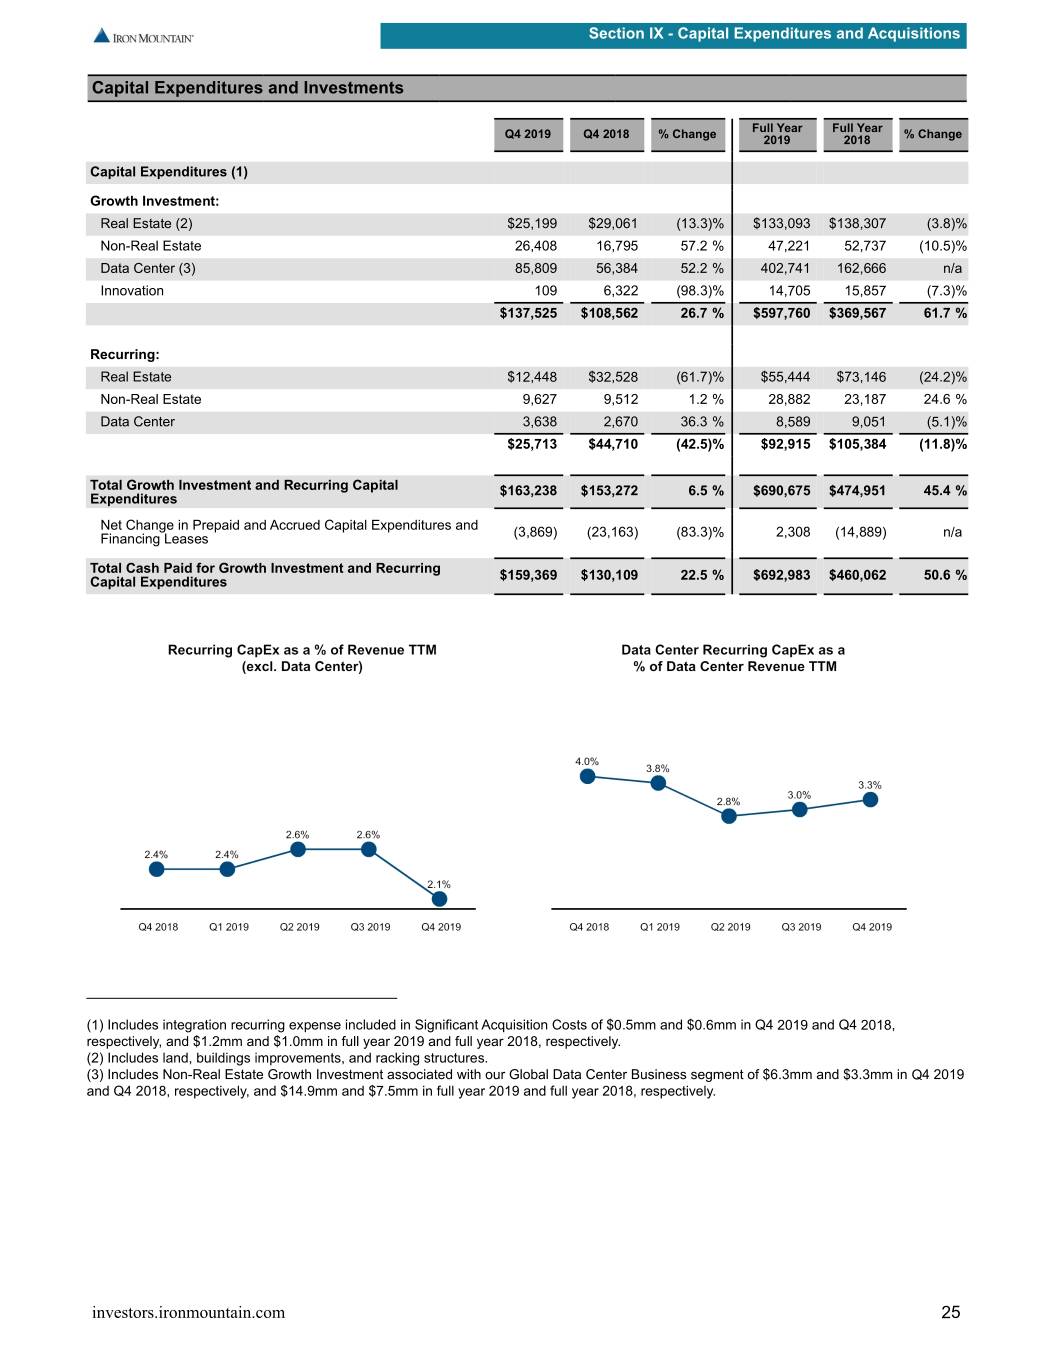
Section IX - Capital Expenditures and Acquisitions Capital Expenditures and Investments Full Year Full Year Q4 2019 Q4 2018 % Change 2019 2018 % Change Capital Expenditures (1) Growth Investment: Real Estate (2) $25,199 $29,061 (13.3)% $133,093 $138,307 (3.8)% Non-Real Estate 26,408 16,795 57.2 % 47,221 52,737 (10.5)% Data Center (3) 85,809 56,384 52.2 % 402,741 162,666 n/a Innovation 109 6,322 (98.3)% 14,705 15,857 (7.3)% $137,525 $108,562 26.7 % $597,760 $369,567 61.7 % Recurring: Real Estate $12,448 $32,528 (61.7)% $55,444 $73,146 (24.2)% Non-Real Estate 9,627 9,512 1.2 % 28,882 23,187 24.6 % Data Center 3,638 2,670 36.3 % 8,589 9,051 (5.1)% $25,713 $44,710 (42.5)% $92,915 $105,384 (11.8)% Total Growth Investment and Recurring Capital $163,238 $153,272 6.5 % $690,675 $474,951 45.4 % Expenditures Net Change in Prepaid and Accrued Capital Expenditures and Financing Leases (3,869) (23,163) (83.3)% 2,308 (14,889) n/a Total Cash Paid for Growth Investment and Recurring 50.6 Capital Expenditures $159,369 $130,109 22.5 % $692,983 $460,062 % (1) Includes integration recurring expense included in Significant Acquisition Costs of $0.5mm and $0.6mm in Q4 2019 and Q4 2018, respectively, and $1.2mm and $1.0mm in full year 2019 and full year 2018, respectively. (2) Includes land, buildings improvements, and racking structures. (3) Includes Non-Real Estate Growth Investment associated with our Global Data Center Business segment of $6.3mm and $3.3mm in Q4 2019 and Q4 2018, respectively, and $14.9mm and $7.5mm in full year 2019 and full year 2018, respectively. investors.ironmountain.com 25
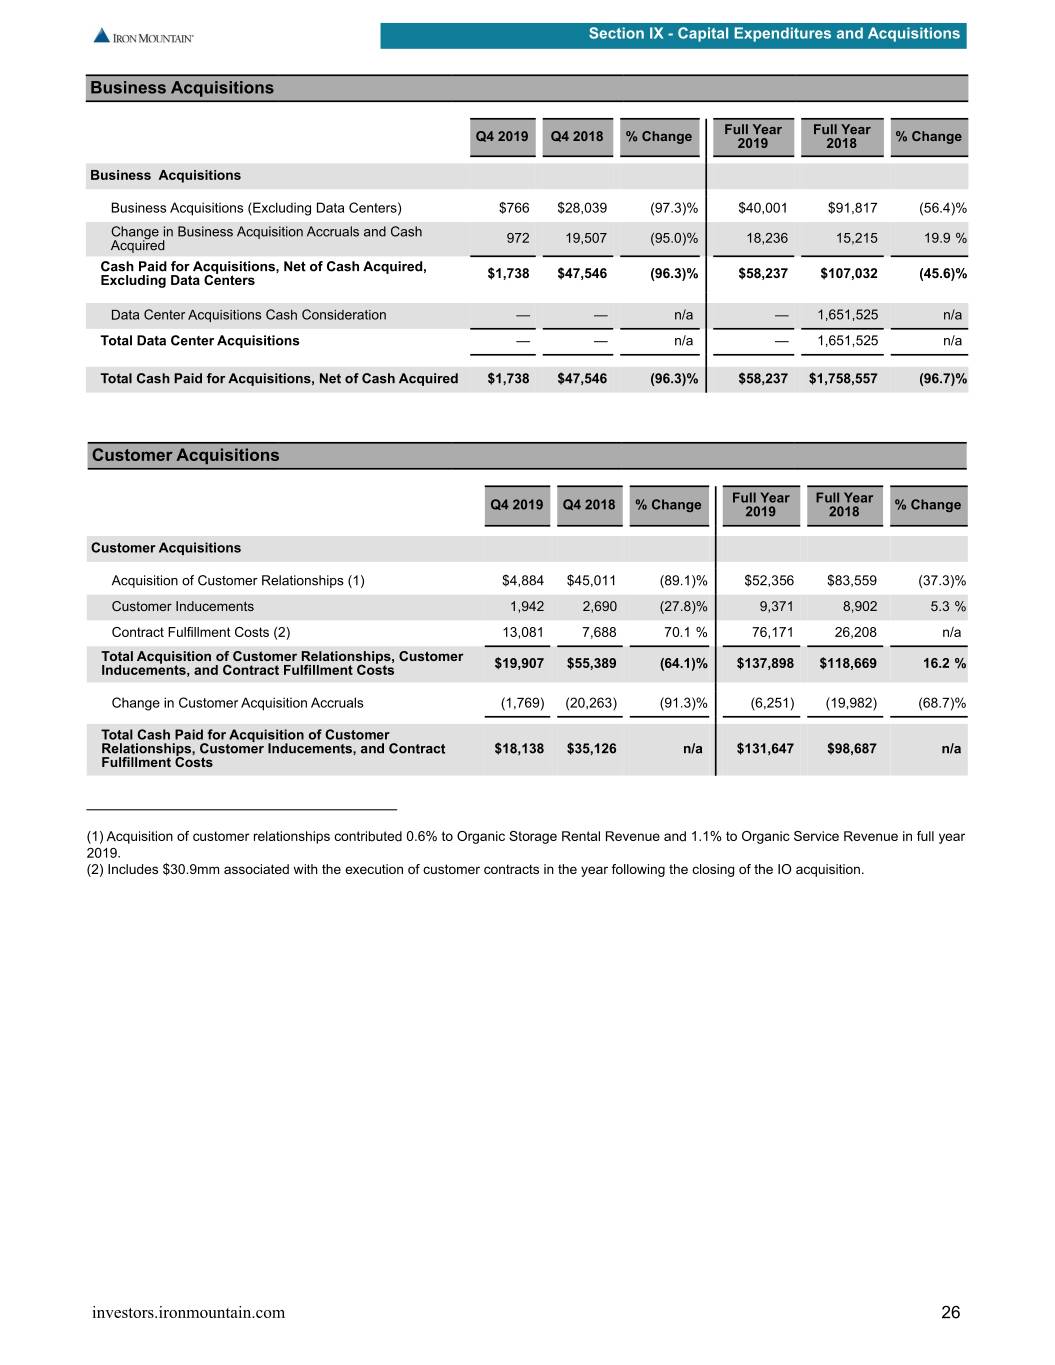
Section IX - Capital Expenditures and Acquisitions Business Acquisitions Full Year Full Year Q4 2019 Q4 2018 % Change 2019 2018 % Change Business Acquisitions Business Acquisitions (Excluding Data Centers) $766 $28,039 (97.3)% $40,001 $91,817 (56.4)% Change in Business Acquisition Accruals and Cash 972 19,507 (95.0)% 18,236 15,215 19.9 % Acquired Cash Paid for Acquisitions, Net of Cash Acquired, Excluding Data Centers $1,738 $47,546 (96.3)% $58,237 $107,032 (45.6)% Data Center Acquisitions Cash Consideration — — n/a — 1,651,525 n/a Total Data Center Acquisitions — — n/a — 1,651,525 n/a Total Cash Paid for Acquisitions, Net of Cash Acquired $1,738 $47,546 (96.3)% $58,237 $1,758,557 (96.7)% Customer Acquisitions Full Year Full Year Q4 2019 Q4 2018 % Change 2019 2018 % Change Customer Acquisitions Acquisition of Customer Relationships (1) $4,884 $45,011 (89.1)% $52,356 $83,559 (37.3)% Customer Inducements 1,942 2,690 (27.8)% 9,371 8,902 5.3 % Contract Fulfillment Costs (2) 13,081 7,688 70.1 % 76,171 26,208 n/a Total Acquisition of Customer Relationships, Customer 16.2 Inducements, and Contract Fulfillment Costs $19,907 $55,389 (64.1)% $137,898 $118,669 % Change in Customer Acquisition Accruals (1,769) (20,263) (91.3)% (6,251) (19,982) (68.7)% Total Cash Paid for Acquisition of Customer Relationships, Customer Inducements, and Contract $18,138 $35,126 n/a $131,647 $98,687 n/a Fulfillment Costs (1) Acquisition of customer relationships contributed 0.6% to Organic Storage Rental Revenue and 1.1% to Organic Service Revenue in full year 2019. (2) Includes $30.9mm associated with the execution of customer contracts in the year following the closing of the IO acquisition. investors.ironmountain.com 26
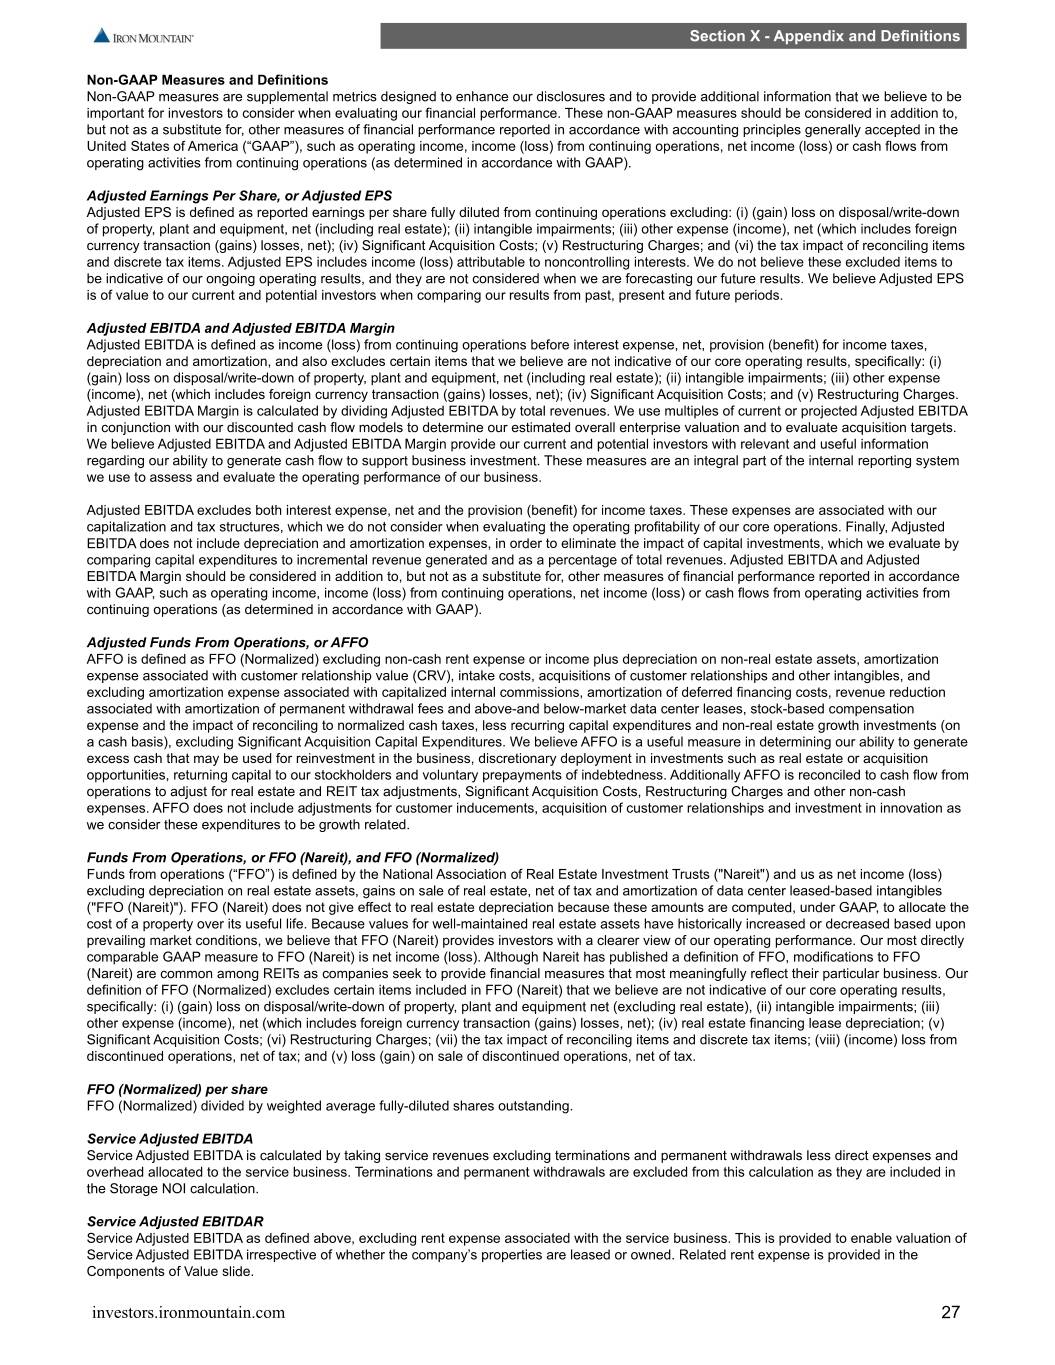
Section X - Appendix and Definitions Non-GAAP Measures and Definitions Non-GAAP measures are supplemental metrics designed to enhance our disclosures and to provide additional information that we believe to be important for investors to consider when evaluating our financial performance. These non-GAAP measures should be considered in addition to, but not as a substitute for, other measures of financial performance reported in accordance with accounting principles generally accepted in the United States of America (“GAAP”), such as operating income, income (loss) from continuing operations, net income (loss) or cash flows from operating activities from continuing operations (as determined in accordance with GAAP). Adjusted Earnings Per Share, or Adjusted EPS Adjusted EPS is defined as reported earnings per share fully diluted from continuing operations excluding: (i) (gain) loss on disposal/write-down of property, plant and equipment, net (including real estate); (ii) intangible impairments; (iii) other expense (income), net (which includes foreign currency transaction (gains) losses, net); (iv) Significant Acquisition Costs; (v) Restructuring Charges; and (vi) the tax impact of reconciling items and discrete tax items. Adjusted EPS includes income (loss) attributable to noncontrolling interests. We do not believe these excluded items to be indicative of our ongoing operating results, and they are not considered when we are forecasting our future results. We believe Adjusted EPS is of value to our current and potential investors when comparing our results from past, present and future periods. Adjusted EBITDA and Adjusted EBITDA Margin Adjusted EBITDA is defined as income (loss) from continuing operations before interest expense, net, provision (benefit) for income taxes, depreciation and amortization, and also excludes certain items that we believe are not indicative of our core operating results, specifically: (i) (gain) loss on disposal/write-down of property, plant and equipment, net (including real estate); (ii) intangible impairments; (iii) other expense (income), net (which includes foreign currency transaction (gains) losses, net); (iv) Significant Acquisition Costs; and (v) Restructuring Charges. Adjusted EBITDA Margin is calculated by dividing Adjusted EBITDA by total revenues. We use multiples of current or projected Adjusted EBITDA in conjunction with our discounted cash flow models to determine our estimated overall enterprise valuation and to evaluate acquisition targets. We believe Adjusted EBITDA and Adjusted EBITDA Margin provide our current and potential investors with relevant and useful information regarding our ability to generate cash flow to support business investment. These measures are an integral part of the internal reporting system we use to assess and evaluate the operating performance of our business. Adjusted EBITDA excludes both interest expense, net and the provision (benefit) for income taxes. These expenses are associated with our capitalization and tax structures, which we do not consider when evaluating the operating profitability of our core operations. Finally, Adjusted EBITDA does not include depreciation and amortization expenses, in order to eliminate the impact of capital investments, which we evaluate by comparing capital expenditures to incremental revenue generated and as a percentage of total revenues. Adjusted EBITDA and Adjusted EBITDA Margin should be considered in addition to, but not as a substitute for, other measures of financial performance reported in accordance with GAAP, such as operating income, income (loss) from continuing operations, net income (loss) or cash flows from operating activities from continuing operations (as determined in accordance with GAAP). Adjusted Funds From Operations, or AFFO AFFO is defined as FFO (Normalized) excluding non-cash rent expense or income plus depreciation on non-real estate assets, amortization expense associated with customer relationship value (CRV), intake costs, acquisitions of customer relationships and other intangibles, and excluding amortization expense associated with capitalized internal commissions, amortization of deferred financing costs, revenue reduction associated with amortization of permanent withdrawal fees and above-and below-market data center leases, stock-based compensation expense and the impact of reconciling to normalized cash taxes, less recurring capital expenditures and non-real estate growth investments (on a cash basis), excluding Significant Acquisition Capital Expenditures. We believe AFFO is a useful measure in determining our ability to generate excess cash that may be used for reinvestment in the business, discretionary deployment in investments such as real estate or acquisition opportunities, returning capital to our stockholders and voluntary prepayments of indebtedness. Additionally AFFO is reconciled to cash flow from operations to adjust for real estate and REIT tax adjustments, Significant Acquisition Costs, Restructuring Charges and other non-cash expenses. AFFO does not include adjustments for customer inducements, acquisition of customer relationships and investment in innovation as we consider these expenditures to be growth related. Funds From Operations, or FFO (Nareit), and FFO (Normalized) Funds from operations (“FFO”) is defined by the National Association of Real Estate Investment Trusts ("Nareit") and us as net income (loss) excluding depreciation on real estate assets, gains on sale of real estate, net of tax and amortization of data center leased-based intangibles ("FFO (Nareit)"). FFO (Nareit) does not give effect to real estate depreciation because these amounts are computed, under GAAP, to allocate the cost of a property over its useful life. Because values for well-maintained real estate assets have historically increased or decreased based upon prevailing market conditions, we believe that FFO (Nareit) provides investors with a clearer view of our operating performance. Our most directly comparable GAAP measure to FFO (Nareit) is net income (loss). Although Nareit has published a definition of FFO, modifications to FFO (Nareit) are common among REITs as companies seek to provide financial measures that most meaningfully reflect their particular business. Our definition of FFO (Normalized) excludes certain items included in FFO (Nareit) that we believe are not indicative of our core operating results, specifically: (i) (gain) loss on disposal/write-down of property, plant and equipment net (excluding real estate), (ii) intangible impairments; (iii) other expense (income), net (which includes foreign currency transaction (gains) losses, net); (iv) real estate financing lease depreciation; (v) Significant Acquisition Costs; (vi) Restructuring Charges; (vii) the tax impact of reconciling items and discrete tax items; (viii) (income) loss from discontinued operations, net of tax; and (v) loss (gain) on sale of discontinued operations, net of tax. FFO (Normalized) per share FFO (Normalized) divided by weighted average fully-diluted shares outstanding. Service Adjusted EBITDA Service Adjusted EBITDA is calculated by taking service revenues excluding terminations and permanent withdrawals less direct expenses and overhead allocated to the service business. Terminations and permanent withdrawals are excluded from this calculation as they are included in the Storage NOI calculation. Service Adjusted EBITDAR Service Adjusted EBITDA as defined above, excluding rent expense associated with the service business. This is provided to enable valuation of Service Adjusted EBITDA irrespective of whether the company’s properties are leased or owned. Related rent expense is provided in the Components of Value slide. investors.ironmountain.com 27
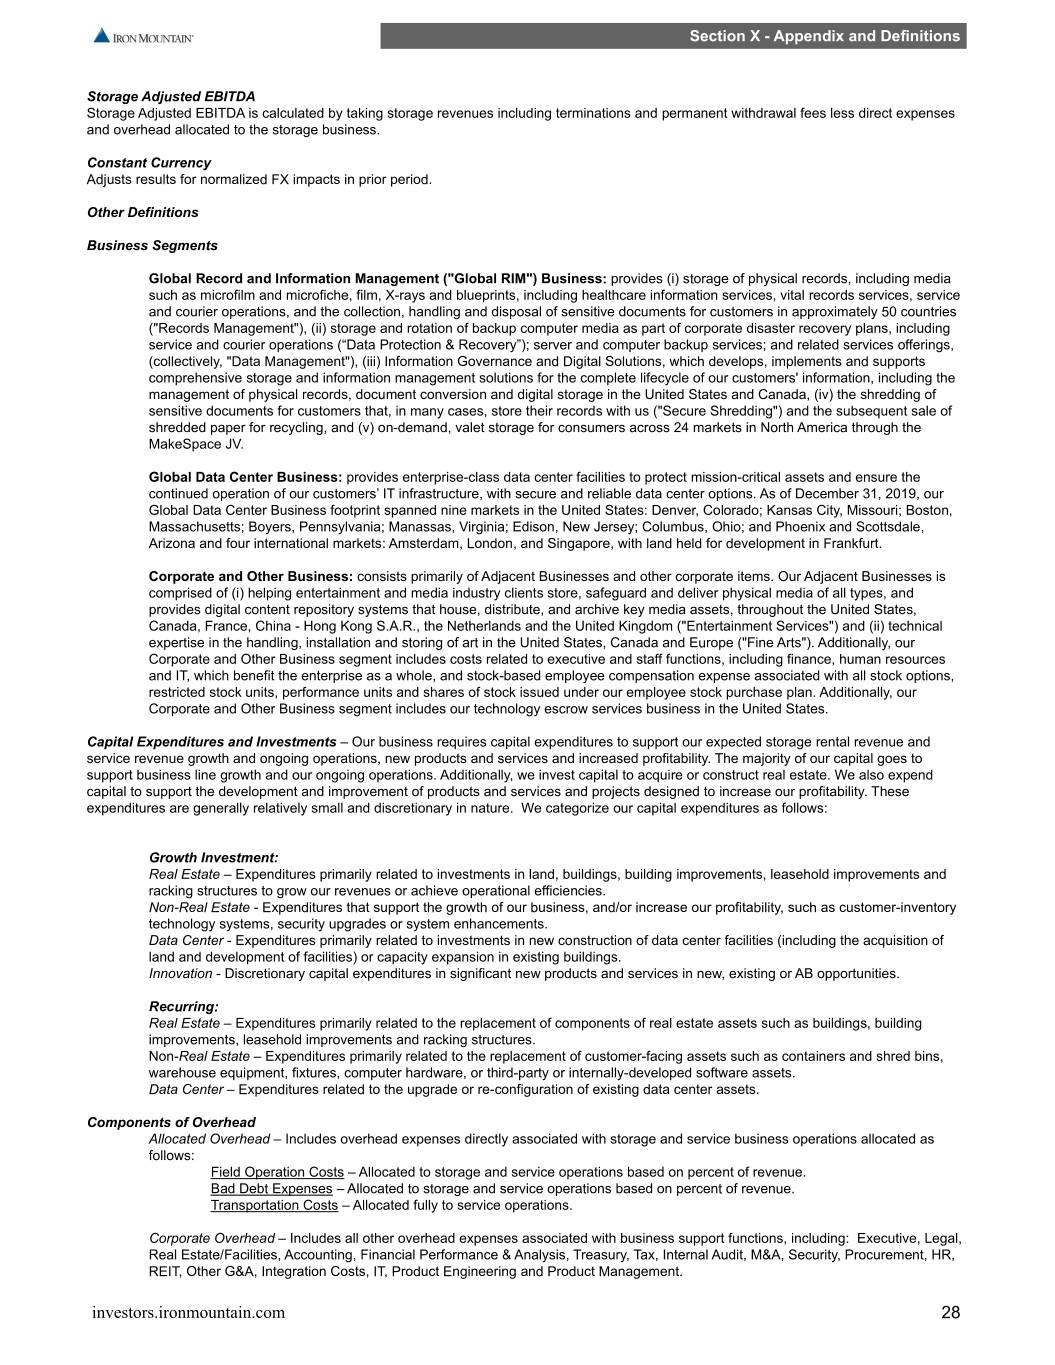
Section X - Appendix and Definitions Storage Adjusted EBITDA Storage Adjusted EBITDA is calculated by taking storage revenues including terminations and permanent withdrawal fees less direct expenses and overhead allocated to the storage business. Constant Currency Adjusts results for normalized FX impacts in prior period. Other Definitions Business Segments Global Record and Information Management ("Global RIM") Business: provides (i) storage of physical records, including media such as microfilm and microfiche, film, X-rays and blueprints, including healthcare information services, vital records services, service and courier operations, and the collection, handling and disposal of sensitive documents for customers in approximately 50 countries ("Records Management"), (ii) storage and rotation of backup computer media as part of corporate disaster recovery plans, including service and courier operations (“Data Protection & Recovery”); server and computer backup services; and related services offerings, (collectively, "Data Management"), (iii) Information Governance and Digital Solutions, which develops, implements and supports comprehensive storage and information management solutions for the complete lifecycle of our customers' information, including the management of physical records, document conversion and digital storage in the United States and Canada, (iv) the shredding of sensitive documents for customers that, in many cases, store their records with us ("Secure Shredding") and the subsequent sale of shredded paper for recycling, and (v) on-demand, valet storage for consumers across 24 markets in North America through the MakeSpace JV. Global Data Center Business: provides enterprise-class data center facilities to protect mission-critical assets and ensure the continued operation of our customers’ IT infrastructure, with secure and reliable data center options. As of December 31, 2019, our Global Data Center Business footprint spanned nine markets in the United States: Denver, Colorado; Kansas City, Missouri; Boston, Massachusetts; Boyers, Pennsylvania; Manassas, Virginia; Edison, New Jersey; Columbus, Ohio; and Phoenix and Scottsdale, Arizona and four international markets: Amsterdam, London, and Singapore, with land held for development in Frankfurt. Corporate and Other Business: consists primarily of Adjacent Businesses and other corporate items. Our Adjacent Businesses is comprised of (i) helping entertainment and media industry clients store, safeguard and deliver physical media of all types, and provides digital content repository systems that house, distribute, and archive key media assets, throughout the United States, Canada, France, China - Hong Kong S.A.R., the Netherlands and the United Kingdom ("Entertainment Services") and (ii) technical expertise in the handling, installation and storing of art in the United States, Canada and Europe ("Fine Arts"). Additionally, our Corporate and Other Business segment includes costs related to executive and staff functions, including finance, human resources and IT, which benefit the enterprise as a whole, and stock-based employee compensation expense associated with all stock options, restricted stock units, performance units and shares of stock issued under our employee stock purchase plan. Additionally, our Corporate and Other Business segment includes our technology escrow services business in the United States. Capital Expenditures and Investments – Our business requires capital expenditures to support our expected storage rental revenue and service revenue growth and ongoing operations, new products and services and increased profitability. The majority of our capital goes to support business line growth and our ongoing operations. Additionally, we invest capital to acquire or construct real estate. We also expend capital to support the development and improvement of products and services and projects designed to increase our profitability. These expenditures are generally relatively small and discretionary in nature. We categorize our capital expenditures as follows: Growth Investment: Real Estate – Expenditures primarily related to investments in land, buildings, building improvements, leasehold improvements and racking structures to grow our revenues or achieve operational efficiencies. Non-Real Estate - Expenditures that support the growth of our business, and/or increase our profitability, such as customer-inventory technology systems, security upgrades or system enhancements. Data Center - Expenditures primarily related to investments in new construction of data center facilities (including the acquisition of land and development of facilities) or capacity expansion in existing buildings. Innovation - Discretionary capital expenditures in significant new products and services in new, existing or AB opportunities. Recurring: Real Estate – Expenditures primarily related to the replacement of components of real estate assets such as buildings, building improvements, leasehold improvements and racking structures. Non-Real Estate – Expenditures primarily related to the replacement of customer-facing assets such as containers and shred bins, warehouse equipment, fixtures, computer hardware, or third-party or internally-developed software assets. Data Center – Expenditures related to the upgrade or re-configuration of existing data center assets. Components of Overhead Allocated Overhead – Includes overhead expenses directly associated with storage and service business operations allocated as follows: Field Operation Costs – Allocated to storage and service operations based on percent of revenue. Bad Debt Expenses – Allocated to storage and service operations based on percent of revenue. Transportation Costs – Allocated fully to service operations. Corporate Overhead – Includes all other overhead expenses associated with business support functions, including: Executive, Legal, Real Estate/Facilities, Accounting, Financial Performance & Analysis, Treasury, Tax, Internal Audit, M&A, Security, Procurement, HR, REIT, Other G&A, Integration Costs, IT, Product Engineering and Product Management. investors.ironmountain.com 28
Section X - Appendix and Definitions Customer Turnover Overhead – Overhead associated with customer acquisition and retention including Sales, Marketing and Account Management expenses. Customer Inducements – Represents Move Costs and Permanent Withdrawal Fees. Data Center Business Definitions Leasable MW – Represents the amount of critical power capacity available for customer use, measured in megawatts. Leased % Calculation – Calculated as the megawatts under contract divided by the leasable megawatts. Monthly Recurring Revenue (MRR) - defined as recurring contractual revenue under existing commenced customer leases, including rent, power, and other recurring data center services. Pre-leased - A lease on data center capacity that is signed before construction has completed. Pre-Stabilized - A building recently placed in service which has not yet reached 85% leased or 24 months in service. Rental Churn Rate - represents data center leases which are not renewed or are terminated during the period. Rental churn is calculated based on the MRR terminated in the period, compared with total MRR at the beginning of the period. TCV – “Total Contract Value” represents total revenue contracted for active contracts through the contract term, not including renewals or extensions, but including fixed power charges. Total potential MW - Total amount of existing and planned critical power capacity at full build-out, measured in megawatts. WALE – “Weighted Average Lease Expiry” (in years) is calculated on a revenue basis, using annual GAAP revenue of all in-place contracts, excluding utility reimbursements. Lease-Adjusted Leverage Ratio - The calculation for this ratio is net debt including the capitalized value of lease obligations plus six times rent expenses divided by EBITDA plus rent expenses. Organic Revenue Growth - Our organic revenue growth rate, which is a non-GAAP measure, represents the year-over-year growth rate of our revenues excluding the impact of business acquisitions, divestitures and foreign currency exchange rate fluctuations. Our organic revenue growth rates includes the impact of acquisitions of customer relationships. Records Management Retention Rate – One minus the result of dividing the total number of cubic feet of records removed from inventory due to customer terminations and destructions in a one-year period by the total number of cubic feet of records in storage at the beginning of the period. Restructuring Charges - Operating expenditures associated with Project Summit, our transformation program announced in Q4 2019 which is designed to accelerate execution of Iron Mountain's Strategy. Storage Rev/NOI per Sq.Ft. - Storage revenue (or storage NOI) divided by the quarterly building sq ft average for storage products. Significant Acquisition Capital Expenditures – Represents capitalized expenditures associated with the May 2, 2016 acquisition of Recall Holdings Limited ("Recall") pursuant to the Scheme Implementation Deed, as amended with Recall (the "Recall Transaction") and the acquisition of IO Data Centers, LLC. Significant Acquisition Costs – Represents operating expenditures associated with (1) our acquisition of Recall including: (i) advisory and professional fees to complete the Recall Transaction; (ii) costs associated with the divestments required in connection with receipt of regulatory approvals in connection with the Recall transaction (including transitional services); and (iii) costs to integrate Recall with our existing operations, including moving, severance, facility upgrade, REIT conversion and system upgrade costs, as well as certain costs associated with our shared service center initiative for our finance, human resources and information technology functions; and (2) the advisory and professional fees to complete the acquisition of IO Data Centers, LLC. Service Profit and Margin – The Gross Profit and Margin attributable to the worldwide service business. Calculated as follows: Services Adjusted EBITDA + Allocated Overhead Expenses + Termination and Permanent Withdrawal Fees = Service Profit ($) / Total Service Revenues (including Termination and Permanent Withdrawal Fees) = Service Margin (%) Storage Net Operating Income, or Storage NOI Storage NOI is defined as revenue from rental activities (storage rental revenue, termination fees and permanent withdrawal fees) less storage rental costs. Storage rental costs include facility costs (excluding rent), storage rental labor, other storage costs and allocated overhead. Storage NOI is commonly used in the REIT industry and enables investors to understand and value the income generated from the company’s real estate. Rent expense is excluded to enable valuation of this income irrespective of whether the company’s properties are leased or owned. Related rent expense is provided in the Components of Value slide. Storage Profit and Margin – The Gross Profit and Margin attributable to the worldwide storage business. Calculated as follows: Storage Net Operating Income + Allocated Overhead Expenses - Storage Rent - Termination and Permanent Withdrawal Fees = Storage Profit ($) / Total Storage Revenues (excluding Termination and Permanent Withdrawal Fees) = Storage Margin (%) investors.ironmountain.com 29

Section X - Appendix and Definitions Tax Rates Effective Tax Rate – GAAP tax rate for the period calculated as tax expense or benefit for the quarter (total of current and deferred tax provisions), including discrete items, and divided by profit before tax for the period. Structural Tax Rate – Estimated tax rate for the full fiscal year based on forecasted ordinary income and forecasted tax expense/ benefit excluding any significant unusual or infrequently occurring items (i.e., discrete items) and items recognized net of tax on the financials (i.e., discontinued operations). Total Physical Storage Volume - Comprised of Iron Mountain’s comprehensive portfolio of physical storage, including Records Management hardcopy records, data protection tapes, Consumer and Other, and Adjacent Businesses (Fine Art and Entertainment Services), measured on an absolute basis in cubic feet. investors.ironmountain.com 30