irm-20201105
0001020569false00010205692020-11-052020-11-05


UNITED STATES
SECURITIES AND EXCHANGE COMMISSION
WASHINGTON, DC 20549

FORM 8-K

CURRENT REPORT PURSUANT
TO SECTION 13 OR 15(d) OF THE
SECURITIES EXCHANGE ACT OF 1934

Date of report (Date of earliest event reported): November 5, 2020

IRON MOUNTAIN INCORPORATED
(Exact Name of Registrant as Specified in Its Charter)

Delaware
(State or Other Jurisdiction of Incorporation)

1-13045
23-2588479
(Commission File Number)
(IRS Employer Identification No.)

One Federal Street, Boston, Massachusetts
(Address of Principal Executive Offices)
2110
(Zip Code)

(617) 535-4766
(Registrant’s Telephone Number, Including Area Code)

Check the appropriate box below if the Form 8-K filing is intended to simultaneously satisfy the filing obligation of the registrant under any of the following provisions:

    Written communications pursuant to Rule 425 under the Securities Act (17 CFR 230.425)

    Soliciting material pursuant to Rule 14a-12 under the Exchange Act (17 CFR 240.14a-12)

    Pre-commencement communications pursuant to Rule 14d-2(b) under the Exchange Act (17 CFR 240.14d-2(b))

    Pre-commencement communications pursuant to Rule 13e-4(c) under the Exchange Act (17 CFR 240.13e-4(c))


Securities Registered Pursuant to Section 12(b) of the Act:
Title of Each Class
Trading Symbol(s)
Name Of Each Exchange On Which Registered
Common Stock, $.01 par value per share
IRM
New York Stock Exchange

Indicate by check mark whether the registrant is an emerging growth company as defined in Rule 405 of the Securities Act of 1933 (§230.405 of this chapter) or Rule 12b-2 of the Securities Exchange Act of 1934 (§240.12b-2 of this chapter).
Emerging growth company
If an emerging growth company, indicate by check mark if the registrant has elected not to use the extended transition period for complying with any new or revised financial accounting standards provided pursuant to Section 13(a) of the Exchange Act.

Item 2.02.    Results of Operations and Financial Condition.
On November 5, 2020, Iron Mountain Incorporated, or the Company, issued an earnings press release and supplemental financial information for the quarter ended September 30, 2020. In addition, the Company will be using a slide presentation during its earnings conference call. Copies of the earnings press release, slide presentation and supplemental financial information are furnished as Exhibits 99.1, 99.2 and 99.3, respectively, hereto and posted on the Company’s website, www.ironmountain.com, under “Investors.”
Item 9.01.    Financial Statements and Exhibits.
(d) Exhibits
99.1    Third Quarter 2020 Earnings Press Release. (Furnished herewith.)
99.2    Third Quarter 2020 Earnings Conference Call Presentation. (Furnished herewith.)
99.3    Third Quarter 2020 Supplemental Financial Information. (Furnished herewith)
101    Cover Page Interactive Data File - the cover page XBRL tags are embedded within the Inline XBRL document.
104    The cover page from this Current Report on Form 8-K, formatted as Inline XBRL.
The information in this report, including Exhibits 99.1, 99.2 and 99.3 is furnished in accordance with SEC Release No. 33-8216 and shall not be deemed “filed” for purposes of Section 18 of the Securities Exchange Act of 1934 (the “Exchange Act”) or otherwise subject to the liabilities of that section, nor shall it be deemed incorporated by


reference in any filing under the Securities Act of 1933 or the Exchange Act, regardless of any general incorporation language in such filing.


SIGNATURES
Pursuant to the requirements of the Securities Exchange Act of 1934, the registrant has duly caused this report to be signed on its behalf by the undersigned hereunto duly authorized.
                    
IRON MOUNTAIN INCORPORATED
By:
/s/ Barry Hytinen
Name:
Barry Hytinen
Title:
Executive Vice President and Chief Financial Officer


Date: November 5, 2020


q42018earningspressre_imaga.jpg

FOR IMMEDIATE RELEASE

Iron Mountain Reports Third Quarter 2020 Results
BOSTON – November 5, 2020 – Iron Mountain Incorporated (NYSE: IRM), the storage and information management services company, announces financial and operating results for the third quarter of 2020. The conference call / webcast details, earnings call presentation and supplemental financial information, which includes definitions of certain capitalized terms used in this release, are available on Iron Mountain’s Investor Relations website. Reconciliations of non-GAAP measures to the appropriate GAAP measures are included herein.
“The third quarter provided us with a great opportunity to demonstrate the significance of the measures we have taken over the last few months in response to the pandemic, and set a marker of out-performance through top-line resilience in our physical storage business, Adjusted EBITDA margin expansion, and by maintaining our strong cash generation track record,” said William L. Meaney, president and CEO of Iron Mountain. "Despite lingering uncertainty related to the global COVID-19 pandemic, we are seeing improvement - albeit gradual - in key U.S. and international markets as it relates to our service activity levels whilst showing continued strong performance in both our physical storage business and our Global Data Center business. I continue to be inspired by the tireless efforts of our teams as they support and care for our customers, each other, and our communities, whilst accelerating progress on our strategic priorities."
Meaney commented on the results, “Adjusted EBITDA margins expanded 30 and 80 basis points year-over-year and sequentially, respectively. The strength for margin expansion performance is even more impactful in the context of the continued investments we are making in innovation and product development, as well as a slight top-line decline, driven entirely by our service business. I would like to thank all of our Mountaineers for this remarkable performance and for their steadfast focus on safety and execution. Whilst this has been a very difficult time, we are proving to be very resilient. We are financially healthy with strong and reliable cash flow, driven in part by our brand and customer loyalty. This is evident in how we've managed the heightened uncertainty of the past 8 months. We quickly aligned on the right mix of priorities to maintain strong near-term momentum whilst continuing our investments in innovation and new products as we execute our plan for long-term value creation. This, combined with benefits from Project Summit, has allowed us to continue to invest in transforming and modernizing our company. As demonstrated by our nine-month constant currency year-over-year Adjusted EBITDA and organic storage revenue growth, we can already see the evidence supporting our belief that we will emerge from this pandemic as a stronger company on all dimensions."

Financial Performance Highlights for the Third Quarter and Year-to-Date 2020
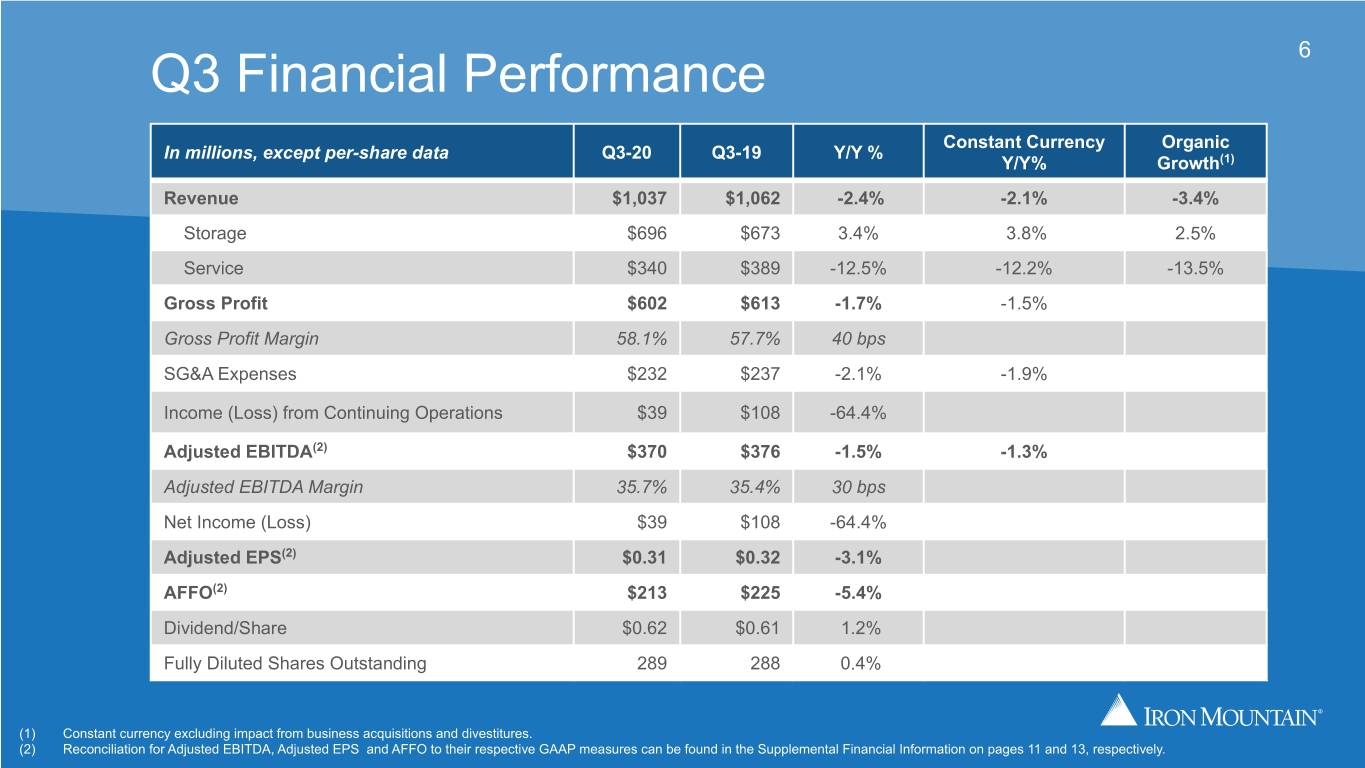
Total reported Revenues for the third quarter were $1.04 billion, compared with $1.06 billion in the third quarter of 2019, a decrease of 2.4%. Excluding the impact of foreign currency exchange (FX), total reported Revenues declined 2.1% compared to the prior year, driven by a 12.2% decline in Service revenue, partially offset by a 3.8% increase in Storage revenue. Year to date, total reported Revenues decreased 3.0%, or 1.5%, excluding the impact of FX.
Income from Continuing Operations for the third quarter was $38.6 million, compared with $108.3 million in the third quarter of 2019. Income from Continuing Operations in the third quarter of 2020 included Restructuring Charges of $48.4 million associated with the implementation of Project Summit and a debt extinguishment charge of $51.3 million related to the early extinguishment of several of the Company's Notes. Income from Continuing Operations included $4.0 million of Significant Acquisition Costs in the third quarter of 2019. Year to date, Income from Continuing Operations was $96.3 million, compared with $231.1 million in 2019. Income from Continuing Operations in 2020 included Restructuring Charges of $128.7 million and Income from Continuing Operations in 2019 included Significant Acquisition Costs of $8.6 million.
Adjusted EBITDA for the third quarter was $370.0 million, compared with $375.7 million in the third quarter of 2019, a decrease of 1.5%, and includes direct and incremental costs related to COVID-19. On a constant currency basis, Adjusted EBITDA decreased by 1.3%, driven in part by the aforementioned decline in Service revenue, partially offset
1

    
by the benefits of Project Summit and the flow through from revenue management. Year to date, Adjusted EBITDA was $1.08 billion, compared with $1.05 billion in 2019, an increase of 2.4%, and excludes $9.3 million of direct and incremental costs related to COVID-19 incurred in the second quarter, as previously disclosed. Excluding the impact of FX, Adjusted EBITDA increased 3.7% year to date.
Reported EPS - Fully Diluted from Continuing Operations for the third quarter was $0.13, compared with $0.37 in the third quarter of 2019. Year to date, Reported EPS - Fully Diluted from Continuing Operations was $0.33, compared with $0.80 in 2019.
Adjusted EPS for the third quarter was $0.31, compared with $0.32 in the third quarter of 2019. Year to date, Adjusted EPS was $0.80, compared with $0.71 in 2019. Iron Mountain's structural tax rate was 16.8% in the third quarter of 2020, compared with 18.6% in the third quarter of 2019.
Net Income for the third quarter was $38.6 million compared with $108.3 million in the third quarter of 2019. Net Income in the third quarter of 2020 included the aforementioned Restructuring Charges related to Project Summit and debt extinguishment charge. Year to date, Net Income was $96.3 million compared with $231.2 million in 2019.
FFO (Normalized) per share was $0.61 for the third quarter, compared with $0.62 in the third quarter of 2019, or a decrease of 1.5%. Year to date, FFO (Normalized) per share was $1.73, compared with $1.64 in 2019, an increase of 5.6%.
AFFO was $213.1 million for the third quarter, compared with $225.3 million in the third quarter of 2019, a decrease of 5.4%. Year to date, AFFO was $693.8 million, compared with $628.3 million in 2019, an increase of 10.4%.

Project Summit Update

Iron Mountain now expects Project Summit will generate $165 million in Adjusted EBITDA benefits in 2020, an increase from the previous expectation of $150 million, as some initiatives have been accelerated. Iron Mountain expects to spend approximately $200 million in 2020. There is no change to the overall scope and size of the total program. Iron Mountain continues to expect Project Summit to generate $375 million of Adjusted EBITDA benefits exiting 2021, with a cost to implement of approximately $450 million.

Dividend

On November 4, 2020, Iron Mountain's board of directors declared a quarterly cash dividend of $0.6185 per share for the fourth quarter. The fourth-quarter 2020 dividend is payable on January 6, 2021, for shareholders of record on December 15, 2020.

About Iron Mountain
Iron Mountain Incorporated (NYSE: IRM), founded in 1951, is the global leader for storage and information management services. Trusted by more than 225,000 organizations around the world, and with a real estate network of more than 90 million square feet across approximately 1,450 facilities in approximately 50 countries, Iron Mountain stores and protects billions of valued assets, including critical business information, highly sensitive data, and cultural and historical artifacts. Providing solutions that include secure records storage, information management, digital transformation, secure destruction, as well as data centers, cloud services and art storage and logistics, Iron Mountain helps customers lower cost and risk, comply with regulations, recover from disaster, and enable a more digital way of working. Visit www.ironmountain.com for more information.
Investor Relations Contacts:
Greer Aviv
Nathan McCurren
Senior Vice President, Investor Relations
Director, Investor Relations
(617) 535-2887
(617) 535-2997

2

    
Forward Looking Statements
We have made statements in this press release that constitute "forward-looking statements" as that term is defined in the Private Securities Litigation Reform Act of 1995 and other securities laws. These forward-looking statements concern our operations, economic performance, financial condition, goals, beliefs, future growth strategies, investment objectives, plans and current expectations, such as our (1) expectations and assumptions regarding the possible impact from the COVID-19 pandemic on us and our customers, including on our businesses, financial position, results of operations and cash flows and the goodwill associated with our reporting units, (2) expected benefits, costs and actions related to, and timing of, Project Summit, (3) anticipated capital expenditures and possible funding sources and (4) other forward-looking statements related to our business, results of operations and financial condition.

These forward-looking statements are subject to various known and unknown risks, uncertainties and other factors, and you should not rely upon them except as statements of our present intentions and of our present expectations, which may or may not occur. When we use words such as "believes," "expects," "anticipates," "estimates" or similar expressions, we are making forward-looking statements. Although we believe that our forward-looking statements are based on reasonable assumptions, our expected results may not be achieved, and actual results may differ materially from our expectations. In addition, important factors that could cause actual results to differ from expectations include, among others: (i) the severity and duration of the COVID-19 pandemic and its effects on the global economy, including its effects on us, the markets we serve and our customers and the third parties with whom we do business within those markets, (ii) our ability to execute on Project Summit and the potential impacts of Project Summit on our ability to retain and recruit employees and execute on our strategic growth plan, (iii) our ability to remain qualified for taxation as a real estate investment trust for United States federal income tax purposes, (iv) changes in customer preferences and demand for our storage and information management services, including as a result of the adoption of alternative technologies and shifts to storage of data through non-paper based technologies, (v) our ability or inability to execute our strategic growth plan, including our ability to invest according to plan, expand internationally, complete acquisitions on satisfactory terms, integrate acquired companies efficiently and grow our business through joint ventures, (vi) changes in the amount of our capital expenditures, (vii) our ability to raise debt or equity capital and changes in the cost of our debt, (viii) the cost and our ability to comply with laws, regulations and customer demands, including those relating to data security and privacy issues, as well as fire and safety standards, (ix) the impact of litigation or disputes that may arise in connection with incidents in which we fail to protect our customers' information or our internal records or information technology systems and the impact of such incidents on our reputation and ability to compete; (x) changes in the price for our storage and information management services relative to the cost of providing such storage and information management services;(xii) changes in the political and economic environments in the countries in which our international subsidiaries operate and changes in the global political climate; (xiii) our ability to comply with our existing debt obligations and restrictions in our debt instruments; (xi) the impact of service interruptions or equipment damage and the cost of power on our data center operations; (xv) the cost or potential liabilities associated with real estate necessary for our business; (xvi) the performance of business partners upon whom we depend for technical assistance or management expertise; (xvii) other trends in competitive or economic conditions affecting our financial condition or results of operations not presently contemplated; and (xviii) the other risks described in our periodic reports filed with the SEC, including under the caption “Risk Factors” in Part I, Item 1A of our Annual Report and in Part II, Item 1A of our Quarterly Report on Form 10-Q for the quarter ended March 31, 2020. Except as required by law, we undertake no obligation to update any forward-looking statements appearing in this report.

Reconciliation of Non-GAAP Measures:

Throughout this release, Iron Mountain discusses (1) Adjusted EBITDA, (2) Adjusted Earnings per Share (“Adjusted EPS”), (3) Funds from Operations (“FFO Nareit”), (4) FFO (Normalized) and (5) Adjusted Funds from Operations (“AFFO”). These measures do not conform to accounting principles generally accepted in the United States (“GAAP”). These non-GAAP measures are supplemental metrics designed to enhance our disclosure and to provide additional information that we believe to be important for investors to consider in addition to, but not as a substitute for, other measures of financial performance reported in accordance with GAAP, such as operating income, income (loss) from continuing operations, net income (loss) attributable to Iron Mountain Incorporated or cash flows from operating activities from continuing operations (as determined in accordance with GAAP). The reconciliation of these measures to the
3

    
appropriate GAAP measure, as required by Regulation G under the Securities Exchange Act of 1934, as amended, and their definitions are included later in this release.

4

    
Consolidated Balance Sheets
(Unaudited; dollars in thousands)
9/30/202012/31/2019
ASSETS
Current Assets:
Cash and Cash Equivalents$151,972$193,555
Accounts Receivable, Net791,859 850,701 
Other Current Assets190,194 192,083 
Total Current Assets$1,134,025$1,236,339
Property, Plant and Equipment:
Property, Plant and Equipment$8,100,871$8,048,906
Less: Accumulated Depreciation(3,641,804)(3,425,869)
Property, Plant and Equipment, Net$4,459,067$4,623,037
Other Assets, Net:
Goodwill$4,461,529$4,485,209
Customer Relationships, Customer Inducements and Data Center Lease-Based Intangibles1,317,399 1,393,183 
Operating Lease Right-of-use Assets1,963,019 1,869,101 
Other347,621 209,947 
Total Other Assets, Net$8,089,568$7,957,440
Total Assets$13,682,660$13,816,816
LIABILITIES AND EQUITY
Current Liabilities:
Current Portion of Long-term Debt$392,586$389,013
Accounts Payable302,618 324,708 
Accrued Expenses and Other Current Liabilities951,269 961,752 
Deferred Revenue244,430 274,036 
Total Current Liabilities$1,890,903$1,949,509
Long-term Debt, Net of Current Portion8,618,856 8,275,566 
Long-term Operating Lease Liabilities1,818,844 1,728,686 
Other Long-term Liabilities (1)416,811 398,828 
Total Long-term Liabilities$10,854,511$10,403,080
Total Liabilities$12,745,414$12,352,589
Equity
Total Stockholders' Equity$937,359$1,463,962
Noncontrolling Interests(113)265 
Total Equity$937,246$1,464,227
Total Liabilities and Equity$13,682,660$13,816,816
(1) Includes redeemable noncontrolling interests of $63.7M and $67.7M as of September 30, 2020 and December 31, 2019, respectively.


5

    
Consolidated Statements of Operations
(Unaudited; dollars in thousands, except per-share data)
Q3 2020Q3 2019% ChangeYTD 2020YTD 2019% Change
Revenues:
Storage Rental$696,294$673,3183.4 %$2,056,797$2,005,5802.6 %
Service340,353 388,906 (12.5)%1,030,820 1,177,414 (12.5)%
Total Revenues$1,036,647$1,062,224(2.4)%$3,087,617$3,182,994(3.0)%
Operating Expenses:
Cost of Sales (excluding Depreciation and Amortization) (1)$434,505$449,372(3.3)%$1,308,119$1,373,827(4.8)%
Selling, General and Administrative (2)232,095237,151(2.1)%712,775758,018(6.0)%
Depreciation and Amortization157,252157,561(0.2)%483,686484,375(0.1)%
Significant Acquisition Costs— 3,950n/a— 8,597n/a
Restructuring Charges48,371— n/a128,715— n/a
Intangible Impairments— — n/a23,000— n/a
(Gain) Loss on Disposal/Write-Down of PP&E, Net(75,840)(9,284)n/a(78,170)(17,087)n/a
Total Operating Expenses$796,383$838,750(5.1)%$2,578,125$2,607,730(1.1)%
Operating Income (Loss)$240,264$223,4747.5 %$509,492$575,264(11.4)%
Interest Expense, Net104303.287476062106676.580563092(2.2)%313408.069823066314427.239517368(0.3)%
Foreign Currency Transaction Loss / (Gain)29635.0875201993(18,251)n/a(6,293)(19,885)(68.4)%
Debt Extinguishment Expense51,260— n/a68,300— n/a
Other Expense (Income), Net2,5704,836(46.9)%4,4326,488(31.7)%
Income (Loss) before Provision (Benefit) for Income Taxes$52,496$130,212(59.7)%$129,645$274,234(52.7)%
Provision (Benefit) for Income Taxes13,93421,928(36.5)%33,30443,127(22.8)%
Gain (Loss) on Sale of Real Estate, Net of Tax— — n/a— — n/a
Income (Loss) from Continuing Operations$38,562$108,284(64.4)%$96,341$231,107(58.3)%
Income (Loss) from Discontinued Operations, Net of Tax— — n/a— 104n/a
Net Income (Loss)$38,562$108,284(64.4)%$96,341$231,211(58.3)%
Less: Net Income (Loss) Attributable to Noncontrolling Interests168609(72.4)%1,0581,534(31.0)%
Net Income (Loss) Attributable to Iron Mountain Incorporated$38,394$107,675(64.3)%$95,283$229,677(58.5)%
Earnings (Losses) per Share - Basic:
Income (Loss) from Continuing Operations$0.13$0.37(64.9)%$0.33$0.80(58.8)%
Total Income (Loss) from Discontinued Operations— — n/a— — n/a
Net Income (Loss) Attributable to Iron Mountain Incorporated$0.13$0.37(64.9)%$0.33$0.80(58.8)%
Earnings (Losses) per Share - Diluted:
Income (Loss) from Continuing Operations$0.13$0.37(64.9)%$0.33$0.80(58.8)%
Total Income (Loss) from Discontinued Operations— — n/a— — n/a
Net Income (Loss) Attributable to Iron Mountain Incorporated$0.13$0.37(64.9)%$0.33$0.80(58.8)%
Weighted Average Common Shares Outstanding - Basic288,403 287,152 0.4 %288,105 286,869 0.4 %
Weighted Average Common Shares Outstanding - Diluted288,811 287,691 0.4 %288,471 287,555 0.3 %

(1) Includes $7.6M of direct and incremental costs related to COVID-19 in YTD 2020.
(2) Includes $1.6M of direct and incremental costs related to COVID-19 in YTD 2020.


6

    
Reconciliation of Income from Continuing Operations to Adjusted EBITDA
(Dollars in thousands)
Q3 2020Q3 2019% ChangeYTD 2020YTD 2019% Change
Income (Loss) from Continuing Operations$38,562$108,284(64.4)%$96,341$231,107(58.3)%
Add / (Deduct):
Intangible Impairments— n/a23,000n/a
Provision (Benefit) for Income Taxes13,93421,928(36.5)%33,30443,127(22.8)%
Foreign Currency Transaction Loss / (Gain)29,635(18,251)n/a(6,293)(19,885)n/a
Other Expense (Income), Net2,5704,836(46.9)%4,4326,488(31.7)
Debt Extinguishment Expense51,260n/a68,300n/a
Interest Expense, Net104,303106,677(2.2)%313,408314,427(0.3)%
(Gain) Loss on Disposal/Write-Down of PP&E, Net(75,840)(9,284)n/a(78,170)(17,087)n/a
Depreciation and Amortization157,252 157,561 (0.2)%483,686484,375(0.1)%
Significant Acquisition Costs3,950 n/a8,597 n/a
Restructuring Charges48,371n/a128,715n/a
COVID-19 Costs— — n/a9,285n/a
Adjusted EBITDA$370,047$375,701(1.5)%$1,076,008$1,051,1492.4 %
Adjusted EBITDA
Adjusted EBITDA is defined as income (loss) from continuing operations before interest expense, net, provision (benefit) for income taxes, depreciation and amortization, and also excludes certain items that we believe are not indicative of our core operating results, specifically: (i) (gain) loss on disposal/write-down of property, plant and equipment, net (including real estate); (ii) intangible impairments; (iii) other expense (income), net (which includes foreign currency transaction (gains) losses, net, and debt extinguishment expense); (iv) Significant Acquisition Costs; (v) Restructuring Charges; and (vi) COVID-19 Costs. Adjusted EBITDA Margin is calculated by dividing Adjusted EBITDA by total revenues. We use multiples of current or projected Adjusted EBITDA in conjunction with our discounted cash flow models to determine our estimated overall enterprise valuation and to evaluate acquisition targets. We believe Adjusted EBITDA and Adjusted EBITDA Margin provide our current and potential investors with relevant and useful information regarding our ability to generate cash flows to support business investment. These measures are an integral part of the internal reporting system we use to assess and evaluate the operating performance of our business.

Adjusted EBITDA excludes both interest expense, net and the provision (benefit) for income taxes. These expenses are associated with our capitalization and tax structures, which we do not consider when evaluating the operating profitability of our core operations. Finally, Adjusted EBITDA does not include depreciation and amortization expenses, in order to eliminate the impact of capital investments, which we evaluate by comparing capital expenditures to incremental revenue generated and as a percentage of total revenues. Adjusted EBITDA and Adjusted EBITDA Margin should be considered in addition to, but not as a substitute for, other measures of financial performance reported in accordance with GAAP, such as operating income, income (loss) from continuing operations, net income (loss) or cash flows from operating activities from continuing operations (as determined in accordance with GAAP).


7

    
Reconciliation of Reported Earnings per Share to Adjusted Earnings per Share
Q3 2020Q3 2019% ChangeYTD 2020YTD 2019% Change
Reported EPS - Fully Diluted from Continuing Operations$0.13$0.37(64.9)%$0.33$0.80(58.8)%
Add / (Deduct):
Intangible Impairments0.08
Other Expense (Income), Net0.29(0.05)0.23(0.05)
Loss (Gain) on Disposal/Write-Down of PP&E, Net(0.26)(0.03)(0.27)(0.06)
Significant Acquisition Costs0.010.03
Restructuring Charges0.17 0.45
COVID-19 Costs— 0.03
Tax Impact of Reconciling Items and Discrete Tax Items (1)(0.01)— (0.05)(0.01)
Net Income (Loss) Attributable to Noncontrolling Interests— 0.01
Adjusted EPS - Fully Diluted from Continuing Operations$0.31$0.32(3.1)%$0.80$0.7112.7 %
(1) The difference between our effective tax rates and our structural tax rate (or adjusted effective tax rates) for the nine months ended September 30, 2020 and 2019, respectively, is primarily due to (i) the reconciling items above, which impact our reported income (loss) from continuing operations before provision (benefit) for income taxes but have an insignificant impact on our reported provision (benefit) for income taxes and (ii) other discrete tax items. Our structural tax rate for purposes of the calculation of Adjusted EPS was 16.8% for the nine months ended September 30, 2020 and 18.6% for the nine months ended September 30, 2019. The Tax Impact of Reconciling Items and Discrete Tax Items is calculated using the current quarter’s estimate of the annual structural tax rate for both the three month and YTD periods. This may result in the current period adjustment plus prior reported quarterly adjustments to not sum to the full year adjustment.
Adjusted Earnings Per Share, or Adjusted EPS
Adjusted EPS is defined as reported earnings per share fully diluted from continuing operations excluding: (i) (gain) loss on disposal/write-down of property, plant and equipment, net (including real estate); (ii) intangible impairments; (iii) other expense (income), net (which includes foreign currency transaction (gains) losses, net, and debt extinguishment expense); (iv) Significant Acquisition Costs; (v) Restructuring Charges; (vi) COVID-19 Costs; and (vii) the tax impact of reconciling items and discrete tax items. Adjusted EPS includes income (loss) attributable to noncontrolling interests. We do not believe these excluded items to be indicative of our ongoing operating results, and they are not considered when we are forecasting our future results. We believe Adjusted EPS is of value to our current and potential investors when comparing our results from past, present and future periods.


8

    
Reconciliation of Net Income Attributable to IRM to FFO and AFFO

(Dollars in thousands, except per-share data)
Q3 2020Q3 2019% ChangeYTD 2020YTD 2019% Change
Net Income$38,562$108,284(64.4)%$96,341$231,211(58.3)%
Add / (Deduct):
Real Estate Depreciation (1)72,01972,939(1.3)%224,325220,1791.9 %
(Gain) Loss on Sale of Real Estate, Net of Tax(75,880)(9,740)n/a(77,461)(40,252)92.4 %
Data Center Lease-Based Intangible Asset Amortization (2)10,44111,356(8.1)%32,17335,337(9.0)%
FFO (Nareit)$45,142$182,839(75.3)%$275,378$446,475(38.3)%
Add / (Deduct):
Loss (Gain) on Disposal/Write-Down of PP&E, Net40369(89.2)%(359)28,558n/a
Foreign Currency Transaction Loss / (Gain)29,635(18,251)n/a(6,293)(19,885)(68.4)%
Debt Extinguishment Expense51,260n/a68,300n/a
Other Expense (Income) , Net2,5704,836(46.9)%4,4326,488(31.7)%
Intangible Impairmentsn/a23,000n/a
Tax Impact of Reconciling Items and Discrete Tax Items (3)(4,314)1,283n/a(13,959)(9,202)51.7 %
(Income) Loss from Discontinued Operations, Net of Taxn/a(104)n/a
Real Estate Financing Lease Depreciation3,5013,11512.4 %10,0959,7323.7 %
Significant Acquisition Costs3,950n/a8,597n/a
Restructuring Charges48,371n/a128,715n/a
FFO (Normalized)$176,205$178,141(1.1)%$498,594$470,6595.9 %
Per Share Amounts (Fully Diluted Shares)
FFO (Nareit)$0.16$0.64(75.1)%$0.95$1.55(38.7)%
FFO (Normalized)$0.61$0.62(1.5)%$1.73$1.645.6 %
Weighted Average Common Shares Outstanding - Basic288,403287,1520.4 %288,105286,8690.4 %
Weighted Average Common Shares Outstanding - Diluted288,811287,6910.4 %288,471287,5550.3 %
(1) Includes depreciation expense related to owned real estate assets (land improvements, buildings, building improvements, leasehold improvements and racking), excluding depreciation related to financing leases.
(2) Includes amortization expense for Data Center In-Place Lease Intangible Assets and Data Center Tenant Relationship Intangible Assets.
(3) Represents the tax impact of (i) the reconciling items above, which impact our reported income (loss) from continuing operations before provision (benefit) for income taxes but have an insignificant impact on our reported provision (benefit) from income taxes and (ii) other discrete tax items.
Funds From Operations, or FFO (Nareit), and FFO (Normalized)
Funds from operations (“FFO”) is defined by the National Association of Real Estate Investment Trusts ("Nareit") and us as net income (loss) excluding depreciation on real estate assets, gains on sale of real estate, net of tax and amortization of data center leased-based intangibles ("FFO (Nareit)"). FFO (Nareit) does not give effect to real estate depreciation because these amounts are computed, under GAAP, to allocate the cost of a property over its useful life. Because values for well-maintained real estate assets have historically increased or decreased based upon prevailing market conditions, we believe that FFO (Nareit) provides investors with a clearer view of our operating performance. Our most directly comparable GAAP measure to FFO (Nareit) is net (loss) income. Although Nareit has published a definition of FFO, modifications to FFO (Nareit) are common among REITs as companies seek to provide financial measures that most meaningfully reflect their particular business. Our definition of FFO (Normalized) excludes certain items included in FFO (Nareit) that we believe are not indicative of our core operating results, specifically: (i) (gain) loss on disposal/write-down of property, plant and equipment (excluding real estate), net; (ii) intangible impairments; (iii) other expense (income), net (which includes foreign currency transaction (gains) losses, net, and debt extinguishment expense); (iv) real estate financing lease depreciation; (v) Significant Acquisition Costs; (vi) Restructuring Charges; (vii) COVID-19 Costs; (viii) the tax impact of reconciling items and discrete tax items; (ix) loss (income) from discontinued operations, net of tax; and (x) loss (gain) on sale of discontinued operations, net of tax.
FFO (Normalized) per share
FFO (Normalized) divided by weighted average fully-diluted shares outstanding.
9

    
Reconciliation of Net Income Attributable to IRM to FFO and AFFO (continued)

(Dollars in thousands)
Q3 2020Q3 2019% ChangeYTD 2020YTD 2019% Change
FFO (Normalized)$176,205$178,141(1.1)%$498,594$470,6595.9 %
Add / (Deduct):
Non-Real Estate Depreciation32,62932,0991.7 %100,357106,574(5.8)%
Amortization Expense (1)33,27133,830(1.7)%99,70498,4511.3 %
Amortization of Deferred Financing Costs4,1494,0781.8 %13,15012,2867.0 %
Revenue Reduction Associated with Amortization of Permanent Withdrawal Fees and Above - and Below-Market Leases2,3633,237(27.0)%7,61210,417(26.9)%
Non-Cash Rent Expense (Income)2,779 1,379 n/a8,276 3,394 n/a
Stock-based Compensation Expense8,0557,12013.1 %31,99828,14013.7 %
Reconciliation to Normalized Cash Taxes(5,441)4,641n/a23,375(5,882)n/a
Less:
Non-Real Estate Growth Investment CapEx (2)20,65815,82230.6 %40,80028,91541.1 %
Real Estate, Data Center and Non-Real Estate Recurring CapEx20,30123,433(13.4)%48,50866,830(27.4)%
AFFO$213,051$225,270(5.4)%$693,758$628,29310.4 %

(1) Includes Customer Relationship Value, intake costs, acquisition of customer relationships, and other intangibles. Excludes amortization of capitalized commissions of $5.4M and $4.2M in Q3 2020 and Q3 2019, respectively, and $17.0M and $14.1M in YTD 2020 and YTD 2019, respectively.
(2) Non-Real Estate Growth CapEx excludes Summit CapEx included in the Summit Transformation project of $2.5M and $4.5M in Q3 2020 and
YTD 2020, respectively.
Adjusted Funds From Operations, or AFFO
AFFO is defined as FFO (Normalized) excluding non-cash rent expense or income plus depreciation on non-real estate assets, amortization expense associated with customer relationship value (CRV), intake costs, acquisitions of customer relationships and other intangibles, and excluding amortization expense associated with capitalized internal commissions, amortization of deferred financing costs, revenue reduction associated with amortization of permanent withdrawal fees and above-and below-market data center leases, stock-based compensation expense and the impact of reconciling to normalized cash taxes, less recurring capital expenditures and non-real estate growth investments (on a cash basis), excluding Significant Acquisition Capital Expenditures. We believe AFFO is a useful measure in determining our ability to generate excess cash that may be used for reinvestment in the business, discretionary deployment in investments such as real estate or acquisition opportunities, returning capital to our stockholders and voluntary prepayments of indebtedness. Additionally AFFO is reconciled to cash flow from operations to adjust for real estate and REIT tax adjustments, Significant Acquisition Costs, Restructuring Charges, and other non-cash expenses. AFFO does not include adjustments for customer inducements, acquisition of customer relationships and investment in innovation as we consider these expenditures to be growth related.


10

Q3 2020 Earnings Call November 5, 2020


Forward Looking Statements 2 We have made statements in this presentation lease that constitute "forward-looking statements" as that term is defined in the Private Securities Litigation Reform Act of 1995 and other securities laws. These forward-looking statements concern our operations, economic performance, financial condition, goals, beliefs, future growth strategies, investment objectives, plans and current expectations, such as our (1) expectations and assumptions regarding the possible impact from the COVID-19 pandemic on us and our customers, including on our businesses, financial position, results of operations and cash flows and the goodwill associated with our reporting units, (2) expected benefits, costs and actions related to, and timing of, Project Summit, (3) anticipated capital expenditures and possible funding sources, (4) expected data center leasing, (5) expected results of operations, including revenue and Adjusted EBITDA, (6) targeted leverage ratio and dividend goals, and (7) other forward-looking statements related to our business, results of operations and financial condition. These forward-looking statements are subject to various known and unknown risks, uncertainties and other factors, and you should not rely upon them except as statements of our present intentions and of our present expectations, which may or may not occur. When we use words such as "believes," "expects," "anticipates," "estimates" or similar expressions, we are making forward-looking statements. Although we believe that our forward-looking statements are based on reasonable assumptions, our expected results may not be achieved, and actual results may differ materially from our expectations. In addition, important factors that could cause actual results to differ from expectations include, among others: (i) the severity and duration of the COVID-19 pandemic and its effects on the global economy, including its effects on us, the markets we serve and our customers and the third parties with whom we do business within those markets, (ii) our ability to execute on Project Summit and the potential impacts of Project Summit on our ability to retain and recruit employees and execute on our strategic growth plan, (iii) our ability to remain qualified for taxation as a real estate investment trust for United States federal income tax purposes, (iv) changes in customer preferences and demand for our storage and information management services, including as a result of the adoption of alternative technologies and shifts to storage of data through non-paper based technologies, (v) our ability or inability to execute our strategic growth plan, including our ability to invest according to plan, expand internationally, complete acquisitions on satisfactory terms, integrate acquired companies efficiently and grow our business through joint ventures, (vi) changes in the amount of our capital expenditures, (vii) our ability to raise debt or equity capital and changes in the cost of our debt, (viii) the cost and our ability to comply with laws, regulations and customer demands, including those relating to data security and privacy issues, as well as fire and safety standards, (ix) the impact of litigation or disputes that may arise in connection with incidents in which we fail to protect our customers' information or our internal records or information technology systems and the impact of such incidents on our reputation and ability to compete; (x) changes in the price for our storage and information management services relative to the cost of providing such storage and information management services;(xii) changes in the political and economic environments in the countries in which our international subsidiaries operate and changes in the global political climate; (xiii) our ability to comply with our existing debt obligations and restrictions in our debt instruments; (xi) the impact of service interruptions or equipment damage and the cost of power on our data center operations; (xv) the cost or potential liabilities associated with real estate necessary for our business; (xvi) the performance of business partners upon whom we depend for technical assistance or management expertise; (xvii) other trends in competitive or economic conditions affecting our financial condition or results of operations not presently contemplated; and (xviii) the other risks described in our periodic reports filed with the SEC, including under the caption “Risk Factors” in Part I, Item 1A of our Annual Report and in Part II, Item 1A of our Quarterly Report on Form 10-Q for the quarter ended March 31, 2020. Except as required by law, we undertake no obligation to update any forward-looking statements appearing in this report. "Reconciliation of Non-GAAP Measures: Throughout this presentation, Iron Mountain will discuss (1) Adjusted EBITDA, (2) Adjusted Earnings per Share (“Adjusted EPS”), (3) Funds from Operations (“FFO Nareit”), (4) FFO (Normalized) and (5) Adjusted Funds from Operations (“AFFO”). These measures do not conform to accounting principles generally accepted in the United States (“GAAP”). These non-GAAP measures are supplemental metrics designed to enhance our disclosure and to provide additional information that we believe to be important for investors to consider in addition to, but not as a substitute for, other measures of financial performance reported in accordance with GAAP, such as operating income, income (loss) from continuing operations, net income (loss) attributable to Iron Mountain Incorporated or cash flows from operating activities from continuing operations (as determined in accordance with GAAP). The reconciliation of these measures to the appropriate GAAP measure, as required by Regulation G under the Securities Exchange Act of 1934, as amended, and their definitions are included in the Supplemental Reporting Information.


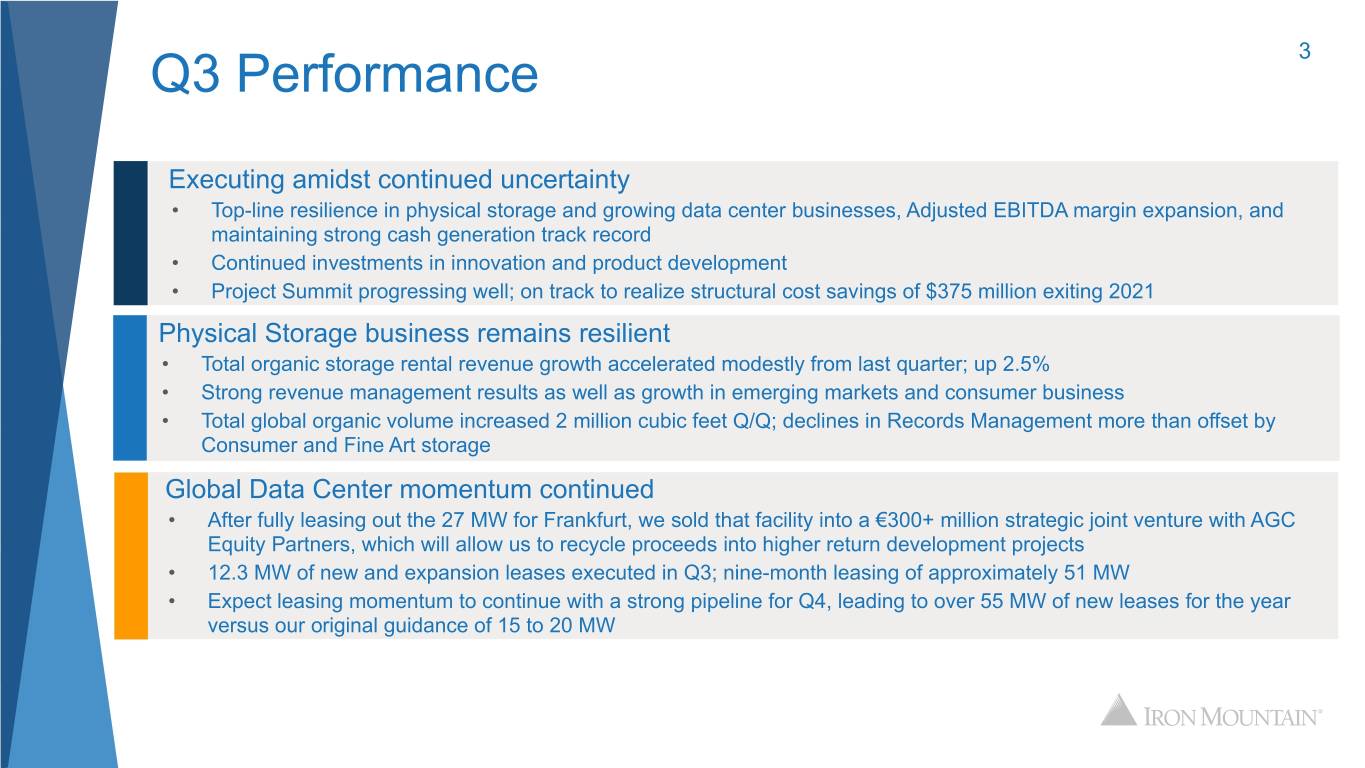
Q3 Performance 3 Executing amidst continued uncertainty • Top-line resilience in physical storage and growing data center businesses, Adjusted EBITDA margin expansion, and maintaining strong cash generation track record • Continued investments in innovation and product development • Project Summit progressing well; on track to realize structural cost savings of $375 million exiting 2021 Physical Storage business remains resilient • Total organic storage rental revenue growth accelerated modestly from last quarter; up 2.5% • Strong revenue management results as well as growth in emerging markets and consumer business • Total global organic volume increased 2 million cubic feet Q/Q; declines in Records Management more than offset by Consumer and Fine Art storage Global Data Center momentum continued • After fully leasing out the 27 MW for Frankfurt, we sold that facility into a €300+ million strategic joint venture with AGC Equity Partners, which will allow us to recycle proceeds into higher return development projects • 12.3 MW of new and expansion leases executed in Q3; nine-month leasing of approximately 51 MW • Expect leasing momentum to continue with a strong pipeline for Q4, leading to over 55 MW of new leases for the year versus our original guidance of 15 to 20 MW


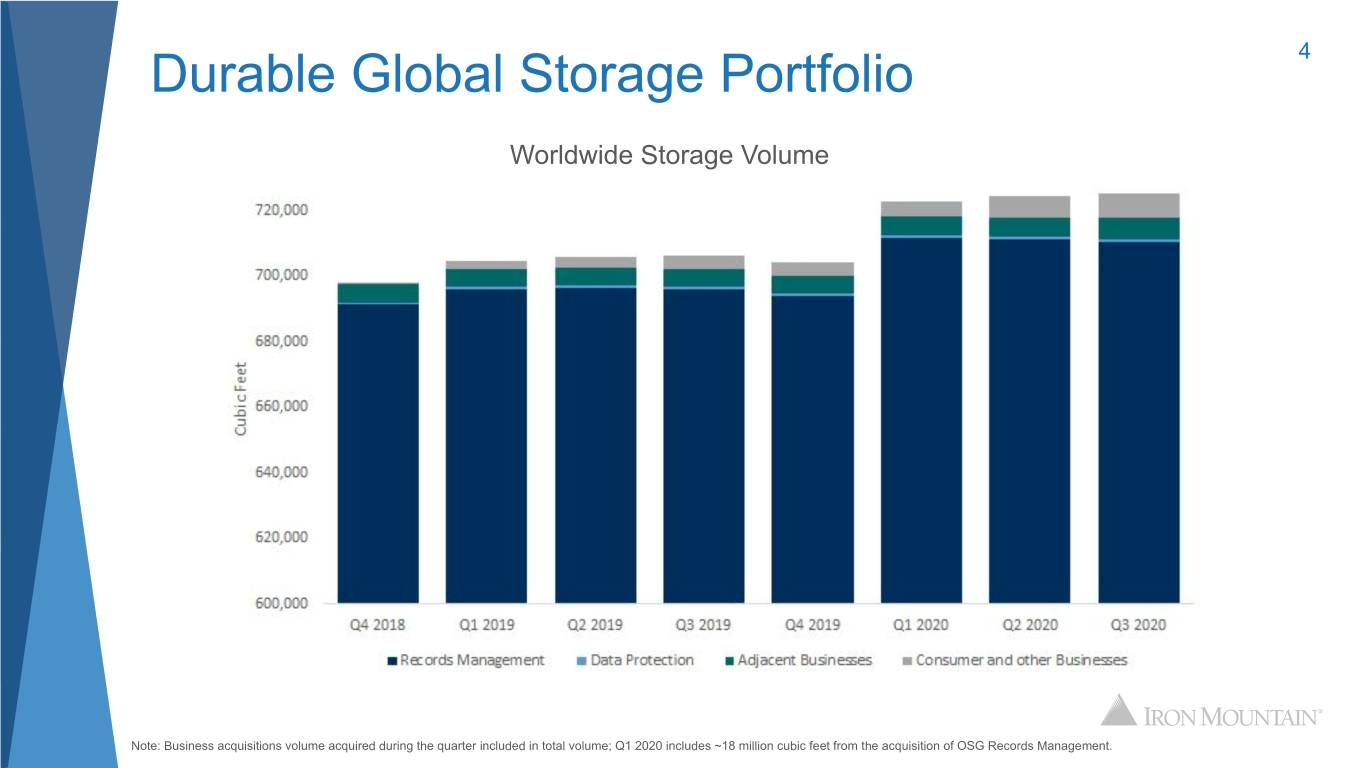
Durable Global Storage Portfolio 4 Worldwide Storage Volume Note: Business acquisitions volume acquired during the quarter included in total volume; Q1 2020 includes ~18 million cubic feet from the acquisition of OSG Records Management.


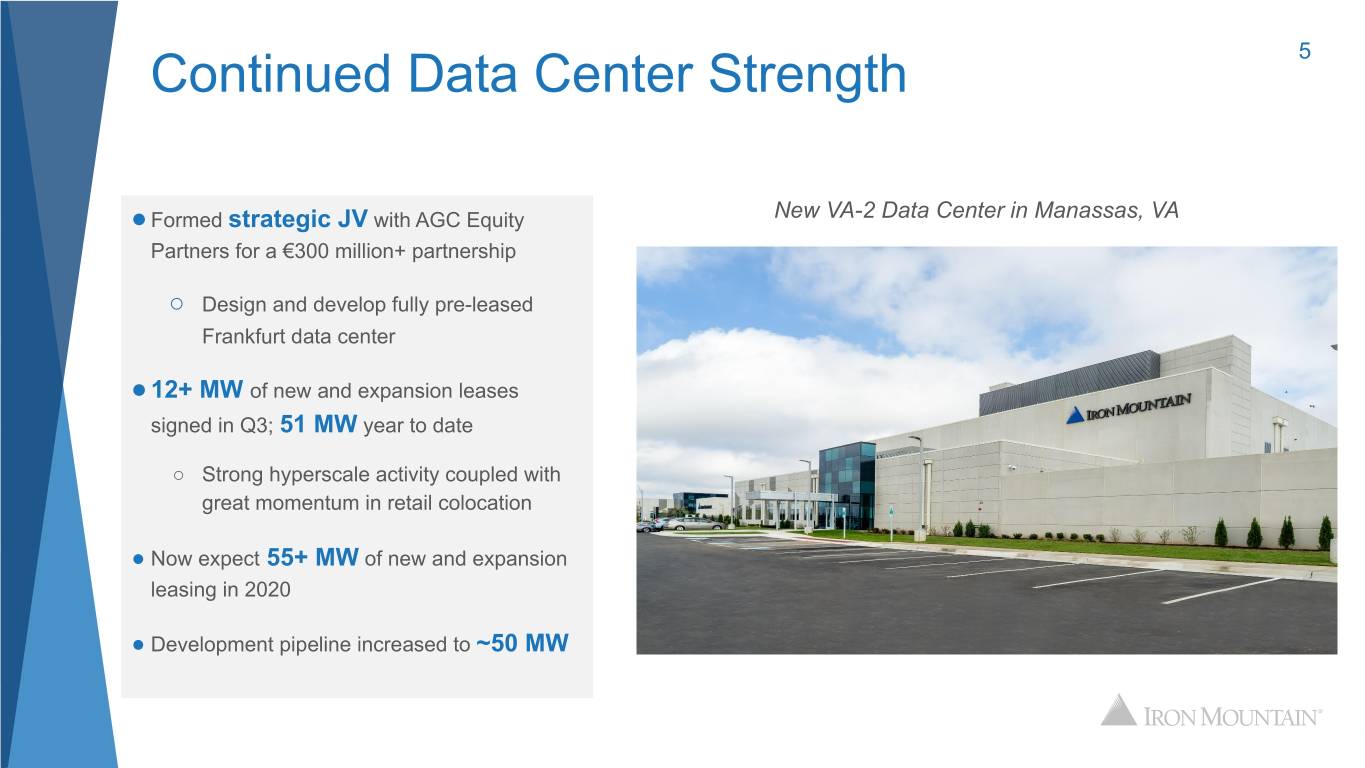
Continued Data Center Strength 5 ● Formed strategic JV with AGC Equity New VA-2 Data Center in Manassas, VA Partners for a €300 million+ partnership ○ Design and develop fully pre-leased Frankfurt data center ● 12+ MW of new and expansion leases signed in Q3; 51 MW year to date ○ Strong hyperscale activity coupled with great momentum in retail colocation ● Now expect 55+ MW of new and expansion leasing in 2020 ● Development pipeline increased to ~50 MW


Q3 Financial Performance 6 Constant Currency Organic In millions, except per-share data Q3-20 Q3-19 Y/Y % Y/Y% Growth(1) Revenue $1,037 $1,062 -2.4% -2.1% -3.4% Storage $696 $673 3.4% 3.8% 2.5% Service $340 $389 -12.5% -12.2% -13.5% Gross Profit $602 $613 -1.7% -1.5% Gross Profit Margin 58.1% 57.7% 40 bps SG&A Expenses $232 $237 -2.1% -1.9% Income (Loss) from Continuing Operations $39 $108 -64.4% Adjusted EBITDA(2) $370 $376 -1.5% -1.3% Adjusted EBITDA Margin 35.7% 35.4% 30 bps Net Income (Loss) $39 $108 -64.4% Adjusted EPS(2) $0.31 $0.32 -3.1% AFFO(2) $213 $225 -5.4% Dividend/Share $0.62 $0.61 1.2% Fully Diluted Shares Outstanding 289 288 0.4% (1) Constant currency excluding impact from business acquisitions and divestitures. (2) Reconciliation for Adjusted EBITDA, Adjusted EPS and AFFO to their respective GAAP measures can be found in the Supplemental Financial Information on pages 11 and 13, respectively.


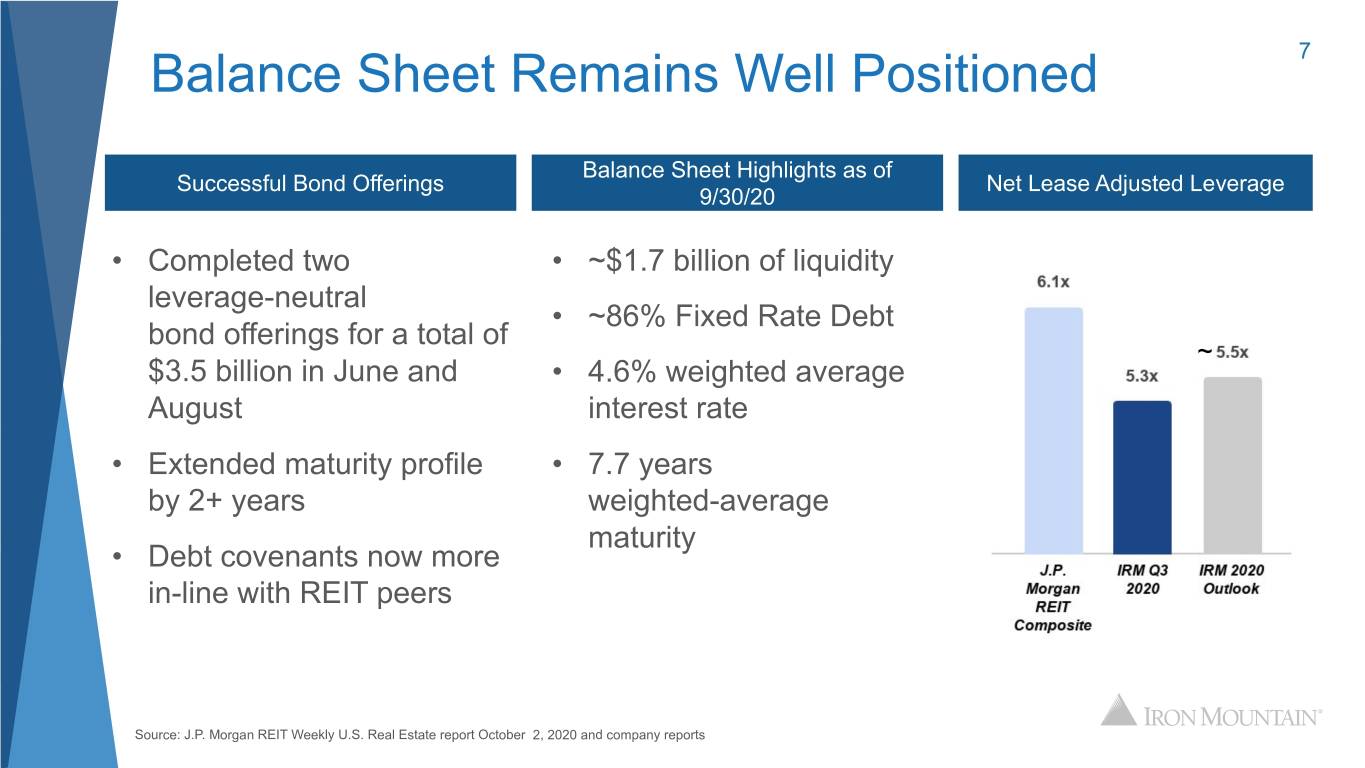
Balance Sheet Remains Well Positioned 7 Balance Sheet Highlights as of Successful Bond Offerings Net Lease Adjusted Leverage 9/30/20 • Completed two • ~$1.7 billion of liquidity leverage-neutral • ~86% Fixed Rate Debt bond offerings for a total of ~ $3.5 billion in June and • 4.6% weighted average August interest rate • Extended maturity profile • 7.7 years by 2+ years weighted-average maturity • Debt covenants now more in-line with REIT peers Source: J.P. Morgan REIT Weekly U.S. Real Estate report October 2, 2020 and company reports


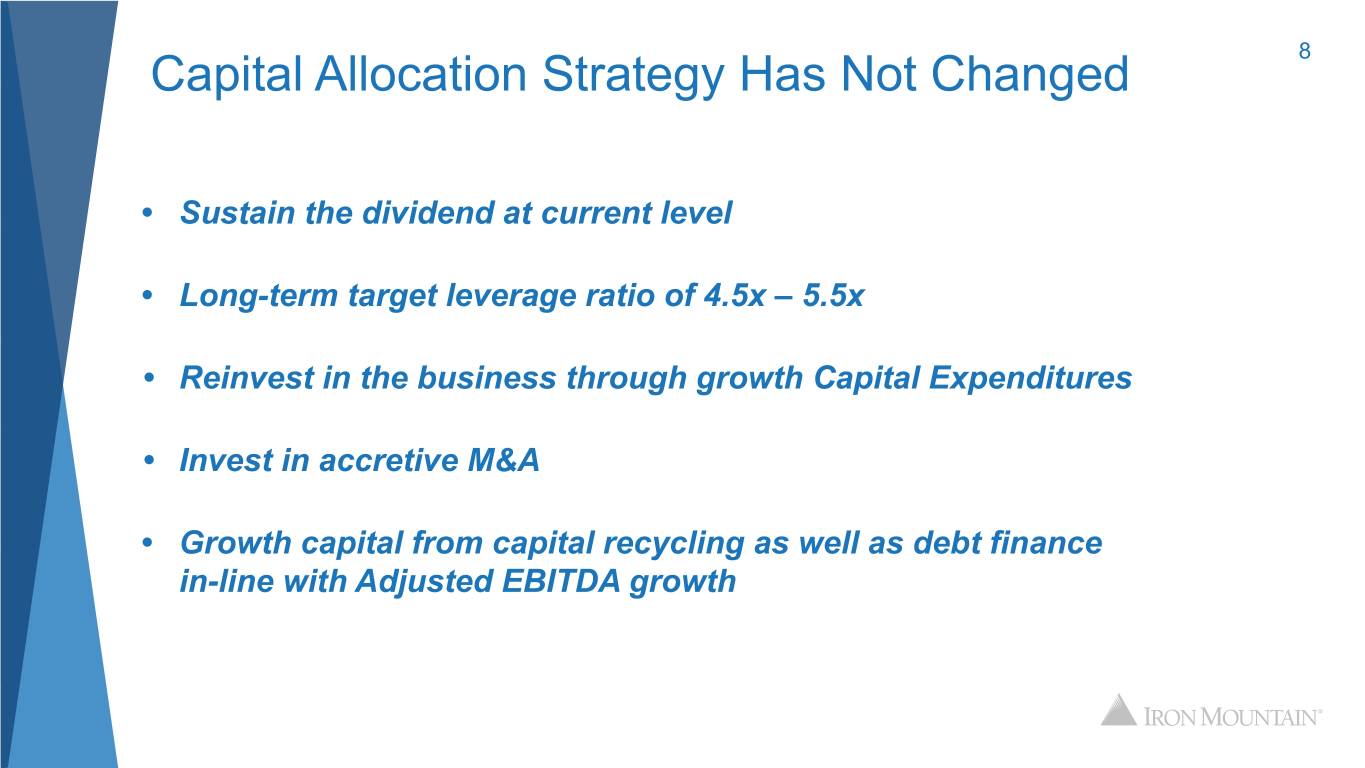
Capital Allocation Strategy Has Not Changed 8 • Sustain the dividend at current level • Long-term target leverage ratio of 4.5x – 5.5x • Reinvest in the business through growth Capital Expenditures • Invest in accretive M&A • Growth capital from capital recycling as well as debt finance in-line with Adjusted EBITDA growth


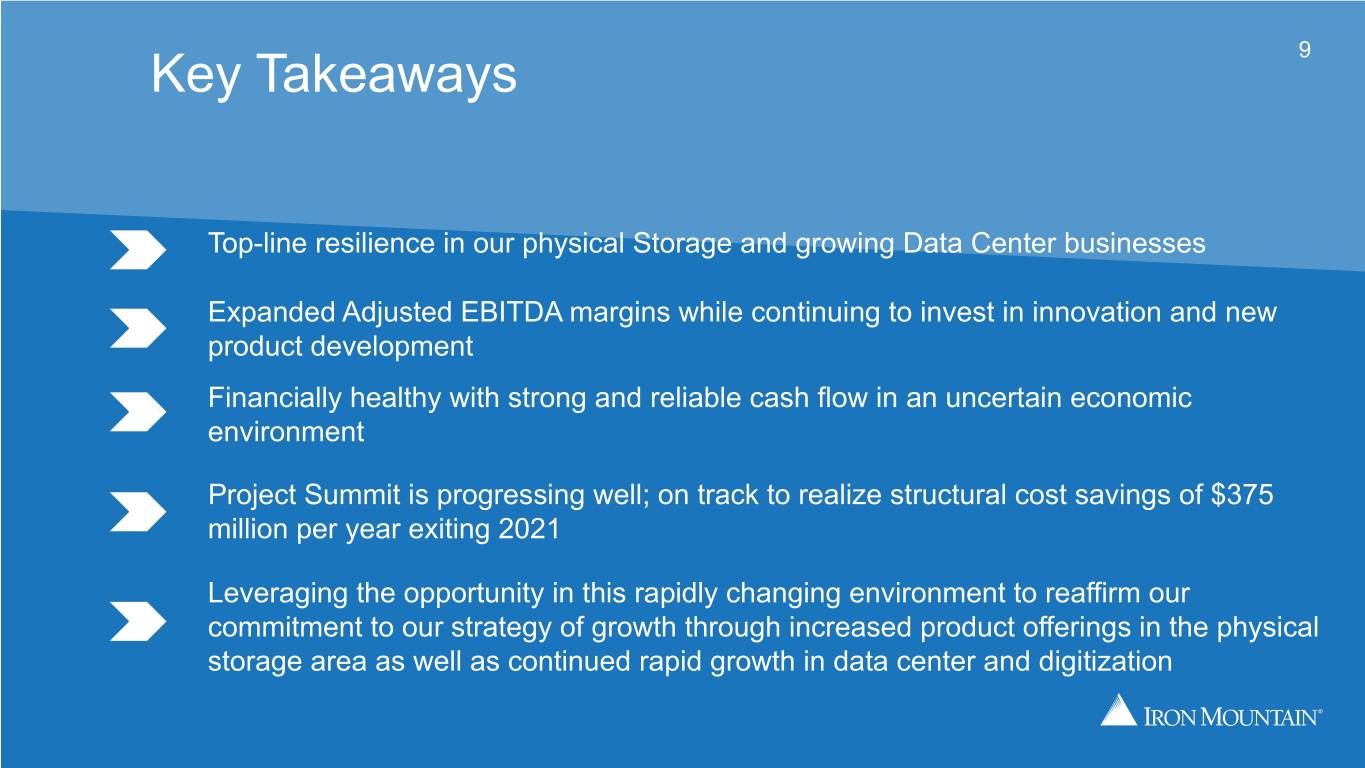
Key Takeaways 9 Top-line resilience in our physical Storage and growing Data Center businesses Expanded Adjusted EBITDA margins while continuing to invest in innovation and new product development Financially healthy with strong and reliable cash flow in an uncertain economic environment Project Summit is progressing well; on track to realize structural cost savings of $375 million per year exiting 2021 Leveraging the opportunity in this rapidly changing environment to reaffirm our commitment to our strategy of growth through increased product offerings in the physical storage area as well as continued rapid growth in data center and digitization


Supplemental Financial Information Third Quarter 2020 investors.ironmountain.com


Safe Harbor Statement Under the Private Securities Litigation Reform Act of 1995: We have made statements in this presentation that constitute "forward-looking statements" as that term is defined in the Private Securities Litigation Reform Act of 1995 and other securities laws. These forward-looking statements concern our operations, economic performance, financial condition, goals, beliefs, future growth strategies, investment objectives, plans and current expectations, such as our (1) expectations and assumptions regarding the possible impact from the COVID-19 pandemic on us and our customers, including on our businesses, financial position, results of operations and cash flows and the goodwill associated with our reporting units, (2) expected benefits, costs and actions related to, and timing of, Project Summit, (3) anticipated capital expenditures, (4) expected total consolidated revenue declines in 2020 and (5) other forward-looking statements related to our business, results of operations and financial condition. These forward-looking statements are subject to various known and unknown risks, uncertainties and other factors, and you should not rely upon them except as statements of our present intentions and of our present expectations, which may or may not occur. When we use words such as "believes," "expects," "anticipates," "estimates" or similar expressions, we are making forward-looking statements. Although we believe that our forward-looking statements are based on reasonable assumptions, our expected results may not be achieved, and actual results may differ materially from our expectations. In addition, important factors that could cause actual results to differ from expectations include, among others: (i) the severity and duration of the COVID-19 pandemic and its effects on the global economy, including its effects on us, the markets we serve and our customers and the third parties with whom we do business within those markets, (ii) our ability to execute on Project Summit and the potential impacts of Project Summit on our ability to retain and recruit employees and execute on our strategic growth plan, (iii) our ability to remain qualified for taxation as a real estate investment trust for United States federal income tax purposes, (iv) changes in customer preferences and demand for our storage and information management services, including as a result of the adoption of alternative technologies and shifts to storage of data through non-paper based technologies, (v) our ability or inability to execute our strategic growth plan, including our ability to invest according to plan, expand internationally, complete acquisitions on satisfactory terms, integrate acquired companies efficiently and grow our business through joint ventures, (vi) changes in the amount of our capital expenditures, (vii) our ability to raise debt or equity capital and changes in the cost of our debt, (viii) the cost and our ability to comply with laws, regulations and customer demands, including those relating to data security and privacy issues, as well as fire and safety standards, (ix) the impact of litigation or disputes that may arise in connection with incidents in which we fail to protect our customers' information or our internal records or information technology systems and the impact of such incidents on our reputation and ability to compete; (x) changes in the price for our storage and information management services relative to the cost of providing such storage and information management services; (xii) changes in the political and economic environments in the countries in which our international subsidiaries operate and changes in the global political climate; (xiii) our ability to comply with our existing debt obligations and restrictions in our debt instruments; (xi) the impact of service interruptions or equipment damage and the cost of power on our data center operations; (xv) the cost or potential liabilities associated with real estate necessary for our business; (xvi) the performance of business partners upon whom we depend for technical assistance or management expertise; (xvii) other trends in competitive or economic conditions affecting our financial condition or results of operations not presently contemplated; and (xviii) the other risks described in our periodic reports filed with the SEC, including under the caption “Risk Factors” in Part I, Item 1A of our Annual Report and in Part II, Item 1A of our Quarterly Report on Form 10-Q for the quarter ended March 31, 2020. Except as required by law, we undertake no obligation to update any forward-looking statements appearing in this report. Reconciliation of Non-GAAP Measures: Throughout this presentation, Iron Mountain will discuss (1) Adjusted EBITDA, (2) Adjusted Earnings per Share (“Adjusted EPS”), (3) Funds from Operations (“FFO Nareit”), (4) FFO (Normalized) and (5) Adjusted Funds from Operations (“AFFO”). These measures do not conform to accounting principles generally accepted in the United States (“GAAP”). These non-GAAP measures are supplemental metrics designed to enhance our disclosure and to provide additional information that we believe to be important for investors to consider in addition to, but not as a substitute for, other measures of financial performance reported in accordance with GAAP, such as operating income, income (loss) from continuing operations, net income (loss) attributable to Iron Mountain Incorporated or cash flows from operating activities from continuing operations (as determined in accordance with GAAP). The reconciliation of these measures to the appropriate GAAP measure, as required by Regulation G under the Securities Exchange Act of 1934, as amended, and their definitions are included later in this document (see Table of Contents). Investor Relations Contacts: Greer Aviv, 617-535-2887 Nathan McCurren, 617-535-2997 Senior Vice President, Investor Relations Director, Investor Relations [email protected] [email protected] investors.ironmountain.com 2


Table of Contents Section I - Company Profile 4 Section II - Financial Highlights and Outlook Financial and Operating Highlights 5 Organic Revenue Growth 6 Section III - Operational Metrics Worldwide Storage Volume 7 Quarterly and Year-to-Date Operating Performance 8 Section IV - Balance Sheets, Statements of Operations and Reconciliations Consolidated Balance Sheets 9 Consolidated Statements of Operations 10 Reconciliation of Income from Continuing Operations to Adjusted EBITDA & Reported Earnings per Share to Adjusted 11 Earnings per Share Reconciliation of Net Income to FFO and AFFO 12 Reconciliation of Net Income to FFO and AFFO (Continued) 13 Reconciliation of Cash Flow from Operations to AFFO 14 Section V - Storage and Service Reconciliation Storage and Service Business Detail 15 Section VI - Real Estate Metrics 16 Global Real Estate Portfolio and Lease Obligations Facility Lease Expirations Section VII - Data Center Customer and Portfolio Metrics Data Center Customer Lease Expiration and Leasing Activity Summary 17 Data Center Operating Portfolio 18 Data Center Expansion and Development Activity 19 Section VIII - Capitalization and Debt Maturity Profile 20 Capitalization Debt Maturity Profile Section IX - Capital Expenditures and Acquisitions Capital Expenditures and Investments 21 Business and Customer Acquisitions 22 Section X - Appendix and Definitions 23 All figures except per share, megawatts (MW), kilowatts (kW), and facility counts in 000s unless noted All figures in reported dollars unless noted Figures may not foot due to rounding All figures for the quarter ended September 30, 2020 unless noted Unaudited investors.ironmountain.com 3


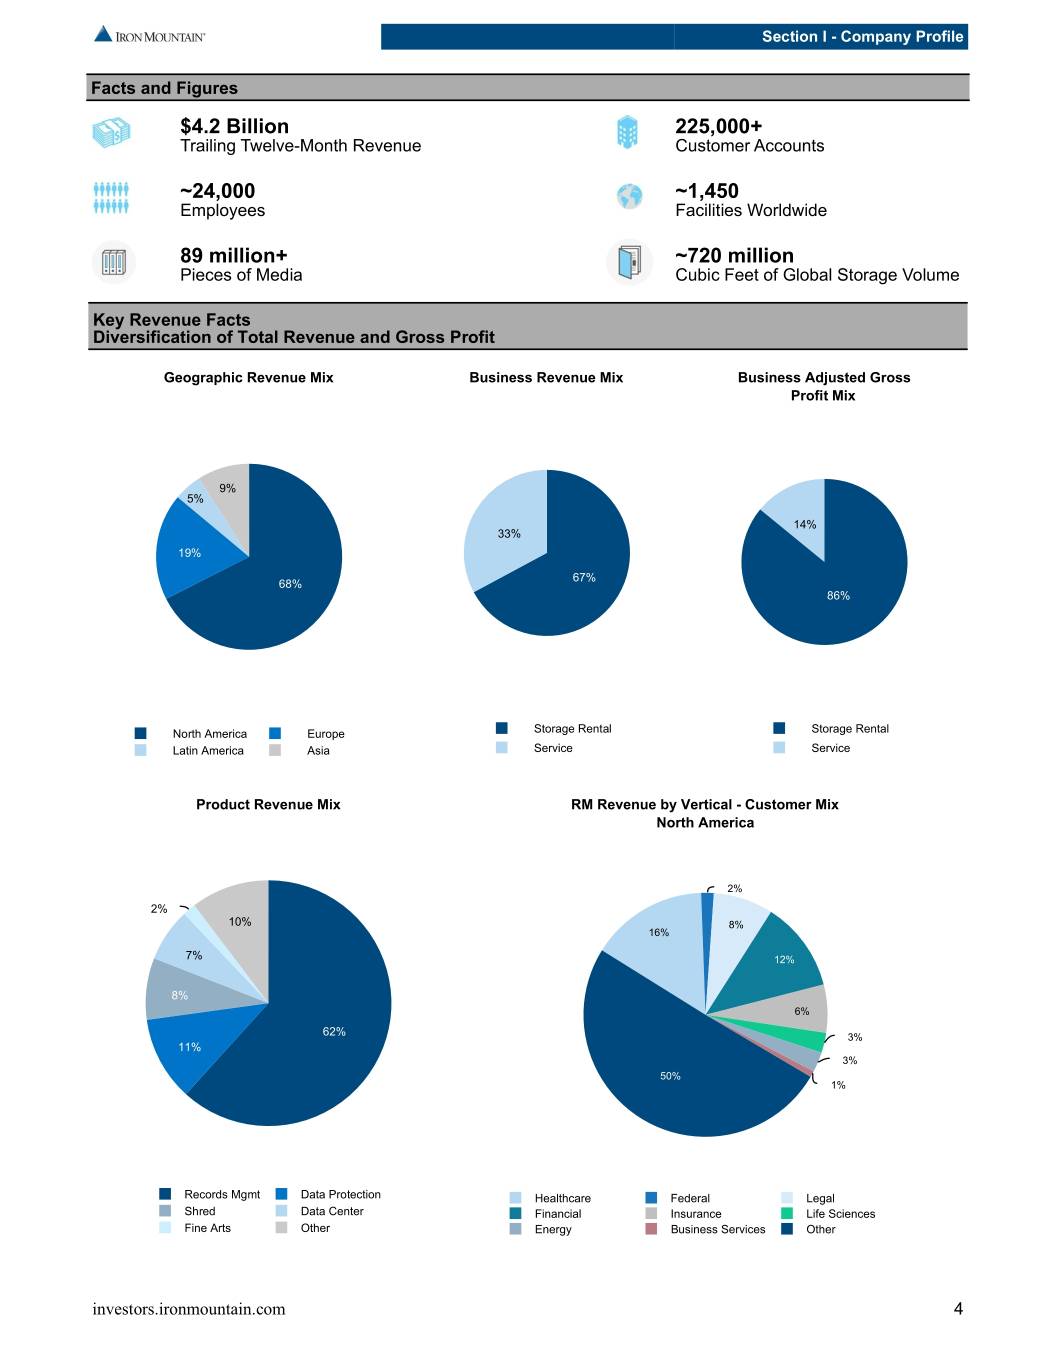
Section I - Company Profile Facts and Figures $4.2 Billion 225,000+ Trailing Twelve-Month Revenue Customer Accounts ~24,000 ~1,450 Employees Facilities Worldwide 89 million+ ~720 million Pieces of Media Cubic Feet of Global Storage Volume Key Revenue Facts Diversification of Total Revenue and Gross Profit Geographic Revenue Mix Business Revenue Mix Business Adjusted Gross Profit Mix 9% 5% 14% 33% 19% 67% 68% 86% North America Europe Storage Rental Storage Rental Latin America Asia Service Service Product Revenue Mix RM Revenue by Vertical - Customer Mix North America 2% 2% 10% 8% 16% 7% 12% 8% 6% 62% 3% 11% 3% 50% 1% Records Mgmt Data Protection Healthcare Federal Legal Shred Data Center Financial Insurance Life Sciences Fine Arts Other Energy Business Services Other investors.ironmountain.com 4


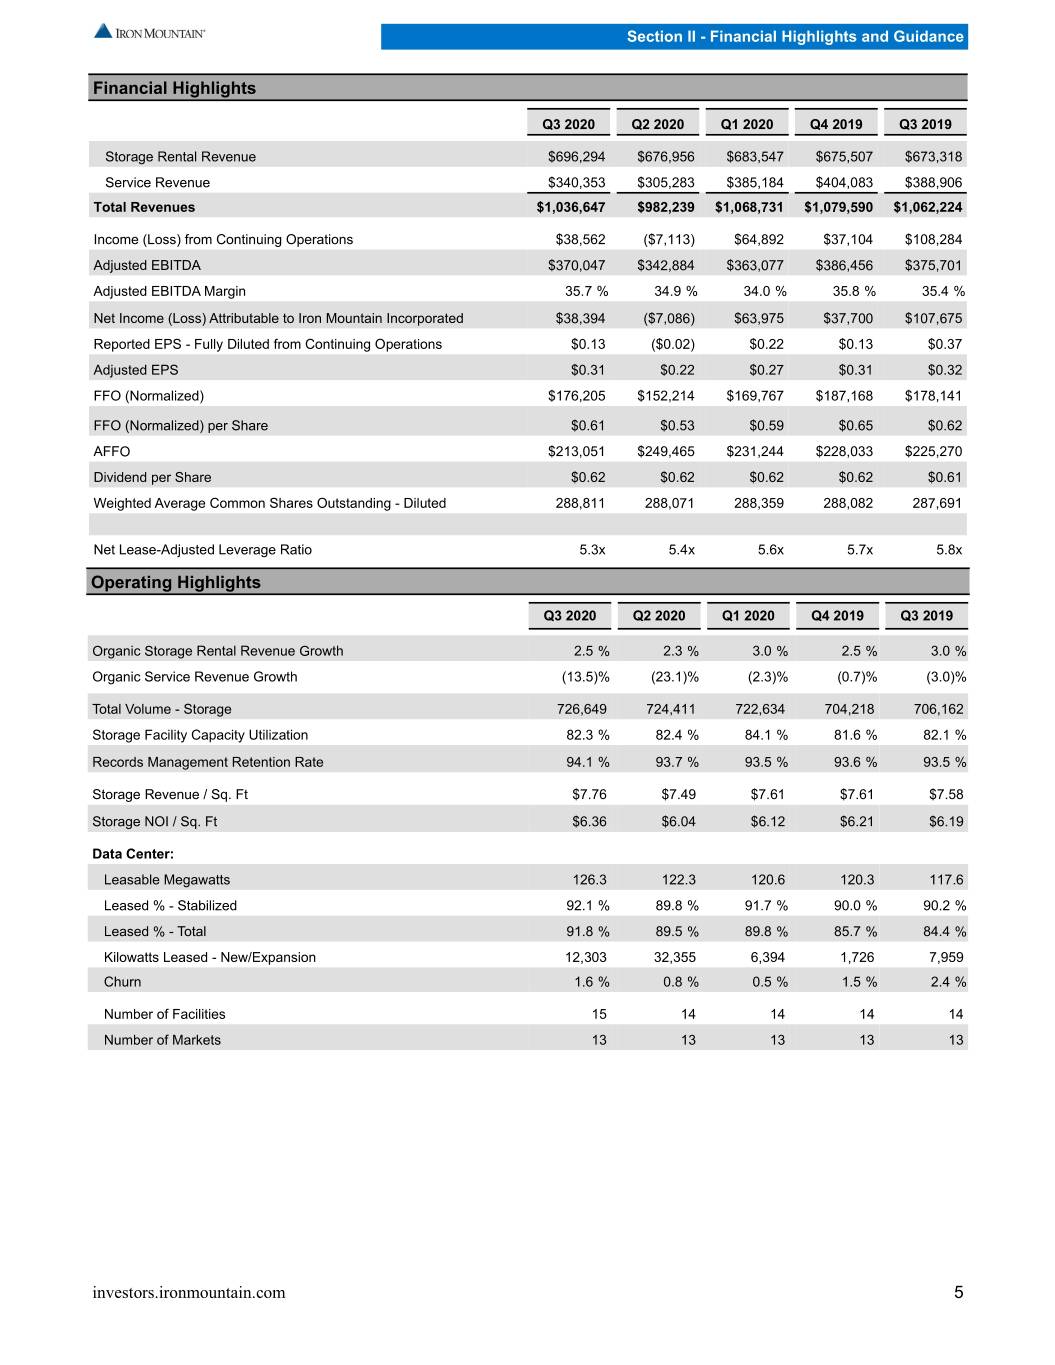
Section II - Financial Highlights and Guidance Financial Highlights Q3 2020 Q2 2020 Q1 2020 Q4 2019 Q3 2019 Storage Rental Revenue $696,294 $676,956 $683,547 $675,507 $673,318 Service Revenue $340,353 $305,283 $385,184 $404,083 $388,906 Total Revenues $1,036,647 $982,239 $1,068,731 $1,079,590 $1,062,224 Income (Loss) from Continuing Operations $38,562 ($7,113) $64,892 $37,104 $108,284 Adjusted EBITDA $370,047 $342,884 $363,077 $386,456 $375,701 Adjusted EBITDA Margin 35.7 % 34.9 % 34.0 % 35.8 % 35.4 % Net Income (Loss) Attributable to Iron Mountain Incorporated $38,394 ($7,086) $63,975 $37,700 $107,675 Reported EPS - Fully Diluted from Continuing Operations $0.13 ($0.02) $0.22 $0.13 $0.37 Adjusted EPS $0.31 $0.22 $0.27 $0.31 $0.32 FFO (Normalized) $176,205 $152,214 $169,767 $187,168 $178,141 FFO (Normalized) per Share $0.61 $0.53 $0.59 $0.65 $0.62 AFFO $213,051 $249,465 $231,244 $228,033 $225,270 Dividend per Share $0.62 $0.62 $0.62 $0.62 $0.61 Weighted Average Common Shares Outstanding - Diluted 288,811 288,071 288,359 288,082 287,691 Net Lease-Adjusted Leverage Ratio 5.3x 5.4x 5.6x 5.7x 5.8x Operating Highlights Q3 2020 Q2 2020 Q1 2020 Q4 2019 Q3 2019 Organic Storage Rental Revenue Growth 2.5 % 2.3 % 3.0 % 2.5 % 3.0 % Organic Service Revenue Growth (13.5) % (23.1) % (2.3) % (0.7) % (3.0) % Total Volume - Storage 726,649 724,411 722,634 704,218 706,162 Storage Facility Capacity Utilization 82.3 % 82.4 % 84.1 % 81.6 % 82.1 % Records Management Retention Rate 94.1 % 93.7 % 93.5 % 93.6 % 93.5 % Storage Revenue / Sq. Ft $7.76 $7.49 $7.61 $7.61 $7.58 Storage NOI / Sq. Ft $6.36 $6.04 $6.12 $6.21 $6.19 Data Center: Leasable Megawatts 126.3 122.3 120.6 120.3 117.6 Leased % - Stabilized 92.1 % 89.8 % 91.7 % 90.0 % 90.2 % Leased % - Total 91.8 % 89.5 % 89.8 % 85.7 % 84.4 % Kilowatts Leased - New/Expansion 12,303 32,355 6,394 1,726 7,959 Churn 1.6 % 0.8 % 0.5 % 1.5 % 2.4 % Number of Facilities 15 14 14 14 14 Number of Markets 13 13 13 13 13 investors.ironmountain.com 5


Section II - Financial Highlights and Guidance Organic Revenue Growth Q3 2020 YTD 2020 Constant Organic Revenue Constant Organic Revenue Reported Currency Revenue Mix Reported Currency Revenue Mix Storage Rental 3.4% 3.8% 2.5% 67.2% 2.6% 4.2% 2.6% 66.6% Service (12.5)% (12.2)% (13.5)% 32.8% (12.5)% (11.1)% (13.0)% 33.4% Total Revenues (2.4)% (2.1)% (3.4)% 100.0% (3.0)% (1.5)% (3.2)% 100.0% Total Organic Revenue Growth 8.0% 3.5% 4.0% 1.9% 0.7% 0.7% 1.3% 1.0% 0.0% (3.4)% (4.0)% (7.2)% (8.0)% Q4 2018 Q1 2019 Q2 2019 Q3 2019 Q4 2019 Q1 2020 Q2 2020 Q3 2020 Organic Storage Rental Revenue Growth 6.0% 4.0% 3.0% 3.0% 2.4% 2.5% 2.3% 2.5% 1.9% 2.0% 2.0% 0.0% Q4 2018 Q1 2019 Q2 2019 Q3 2019 Q4 2019 Q1 2020 Q2 2020 Q3 2020 Organic Service Revenue Growth 6.1% 5.5% 1.8% 0.0% (0.7)% (5.5)% (2.0)% (3.0)% (2.3)% (11.0)% (13.5)% (16.5)% (23.1)% (22.0)% Q4 2018 Q1 2019 Q2 2019 Q3 2019 Q4 2019 Q1 2020 Q2 2020 Q3 2020 (1) Constant Currency and excluding impact from business acquisitions and dispositions. investors.ironmountain.com 6


Section III - Operational Metrics Worldwide Storage Volume 720,000 700,000 680,000 660,000 Cu bic Feet 640,000 620,000 600,000 Q4 2018 Q1 2019 Q2 2019 Q3 2019 Q4 2019 Q1 2020 Q2 2020 Q3 2020 Records Management Data Protection Adjacent Businesses Consumer and Other Worldwide Cubic Feet Q4 2018 Q1 2019 Q2 2019 Q3 2019 Q4 2019 Q1 2020 Q2 2020 Q3 2020 Records Management 691,321 696,108 696,359 696,078 693,828 711,589 711,206 710,340 Data Protection 753 733 760 772 786 799 803 808 Adjacent Businesses 5,537 5,392 5,644 5,507 5,508 5,938 5,906 6,534 Consumer and Other 451 2,485 3,251 3,805 4,096 4,308 6,495 8,967 Total Storage Volume 698,062 704,717 706,014 706,162 704,218 722,634 724,411 726,649 Business Acquisitions during the quarter (1) 2,462 4,248 587 202 514 18,389 3,555 272 (1) Business acquisitions volume acquired during the quarter included in total volume. investors.ironmountain.com 7


Section III - Operational Metrics Third Quarter 2020 Constant Organic Q3 2020 Q3 2019 Reported Currency Growth (2) Global RIM Business Storage Rental $598,949 $582,844 2.8% 3.4% 1.8% Service 322,824 366,720 (12.0)% (11.7)% (13.0)% Total Revenues $921,773 $949,564 (2.9)% (2.5)% (3.9)% Adjusted EBITDA & Margin $393,883 42.7 % $395,181 41.6 % Global Data Center Business Data Center Revenue (1) $72,814 $64,418 13.0% 12.1% 12.1% Adjusted EBITDA & Margin $33,359 45.8 % $32,261 50.1 % Corporate and Other Business Storage Rental $28,929 $28,473 1.6% 1.0% 1.1% Service 13,131 19,769 (33.6)% (34.1)% (34.0)% Total Revenues $42,060 $48,242 (12.8)% (13.4)% (13.3)% Adjusted EBITDA $(57,195) $(51,741) Total Consolidated Storage Rental $696,294 $673,318 3.4% 3.8% 2.5% Service 340,353 388,906 (12.5)% (12.2)% (13.5)% Total Revenues $1,036,647 $1,062,224 (2.4)% (2.1)% (3.4)% Adjusted EBITDA & Margin $370,047 35.7 % $375,701 35.4 % Year to Date 2020 Constant Organic YTD 2020 YTD 2019 Reported Currency Growth (2) Global RIM Business Storage Rental $1,773,364 $1,738,192 2.0% 3.9% 2.0% Service 981,930 1,112,111 (11.7)% (10.3)% (12.3)% Total Revenues $2,755,294 $2,850,303 (3.3)% (1.7)% (3.6)% Adjusted EBITDA & Margin $1,169,671 42.5 % $1,156,596 40.6 % Global Data Center Business Data Center Revenue (1) $206,939 $188,245 9.9% 9.9% 9.9% Adjusted EBITDA & Margin $94,812 45.8 % $85,913 45.6 % Corporate and Other Business Storage Rental $86,610 $85,087 1.8% 1.8% 3.3% Service 38,774 59,359 (34.7)% (34.4)% (34.9)% Total Revenues $125,384 $144,446 (13.2)% (13.0)% (12.5)% Adjusted EBITDA $(188,475) $(191,360) Total Consolidated Storage Rental $2,056,797 $2,005,580 2.6% 4.2% 2.6% Service 1,030,820 1,177,414 (12.5)% (11.1)% (13.0)% Total Revenues $3,087,617 $3,182,994 (3.0)% (1.5)% (3.2)% Adjusted EBITDA & Margin $1,076,008 34.8 % $1,051,149 33.0 % (1) Includes Global Data Center service revenue of $4.4M and $2.4M in Q3 2020 and Q3 2019, respectively, and $10.1M and $5.9M in YTD 2020 and YTD 2019, respectively. (2) Constant Currency and excluding impact from business acquisitions and dispositions. investors.ironmountain.com 8


Section IV - Balance Sheets, Statements of Operations and Reconciliations Consolidated Balance Sheets 9/30/2020 12/31/2019 ASSETS Current Assets: Cash and Cash Equivalents $151,972 $193,555 Accounts Receivable, Net 791,859 850,701 Other Current Assets 190,194 192,083 Total Current Assets $1,134,025 $1,236,339 Property, Plant and Equipment: Property, Plant and Equipment $8,100,871 $8,048,906 Less: Accumulated Depreciation (3,641,804) (3,425,869) Property, Plant and Equipment, Net $4,459,067 $4,623,037 Other Assets, Net: Goodwill $4,461,529 $4,485,209 Customer Relationships, Customer Inducements and Data Center Lease-Based Intangibles 1,317,399 1,393,183 Operating Lease Right-of-use Assets 1,963,019 1,869,101 Other 347,621 209,947 Total Other Assets, Net $8,089,568 $7,957,440 Total Assets $13,682,660 $13,816,816 LIABILITIES AND EQUITY Current Liabilities: Current Portion of Long-term Debt $392,586 $389,013 Accounts Payable 302,618 324,708 Accrued Expenses and Other Current Liabilities 951,269 961,752 Deferred Revenue 244,430 274,036 Total Current Liabilities $1,890,903 $1,949,509 Long-term Debt, Net of Current Portion 8,618,856 8,275,566 Long-term Operating Lease Liabilities 1,818,844 1,728,686 Other Long-term Liabilities (1) 416,811 398,828 Total Long-term Liabilities $10,854,511 $10,403,080 Total Liabilities $12,745,414 $12,352,589 Equity Total Stockholders' Equity $937,359 $1,463,962 Noncontrolling Interests (113) 265 Total Equity $937,246 $1,464,227 Total Liabilities and Equity $13,682,660 $13,816,816 (1) Includes redeemable noncontrolling interest of $63.7M and $67.7M as of September 30, 2020 and December 31, 2019, respectively. investors.ironmountain.com 9


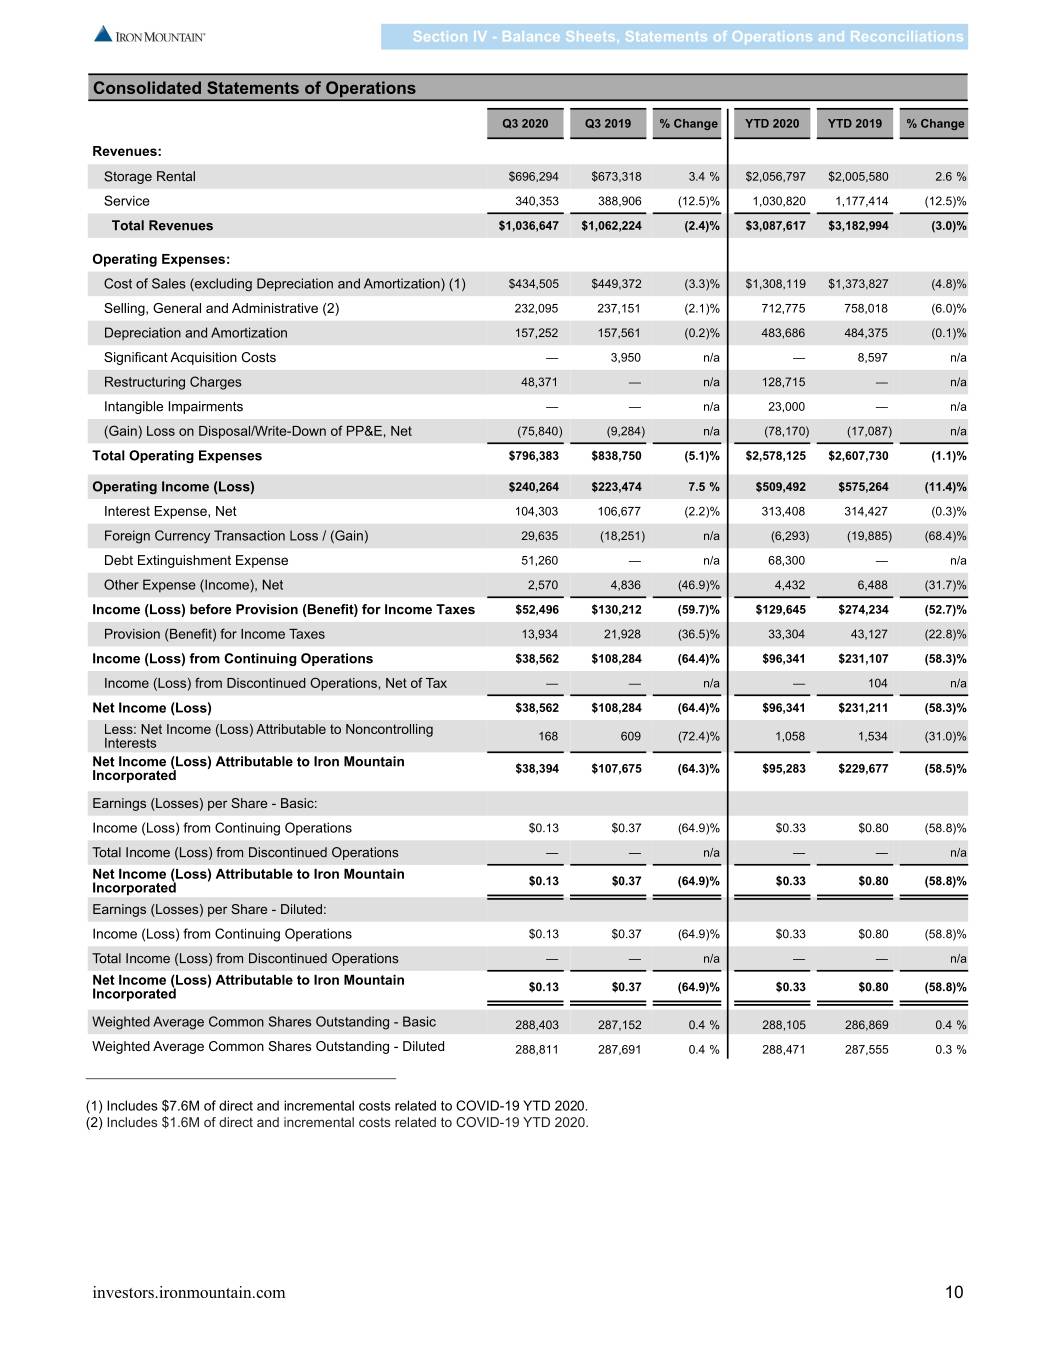
Section IV - Balance Sheets, Statements of Operations and Reconciliations Consolidated Statements of Operations Q3 2020 Q3 2019 % Change YTD 2020 YTD 2019 % Change Revenues: Storage Rental $696,294 $673,318 3.4 % $2,056,797 $2,005,580 2.6 % Service 340,353 388,906 (12.5) % 1,030,820 1,177,414 (12.5) % Total Revenues $1,036,647 $1,062,224 (2.4) % $3,087,617 $3,182,994 (3.0) % Operating Expenses: Cost of Sales (excluding Depreciation and Amortization) (1) $434,505 $449,372 (3.3) % $1,308,119 $1,373,827 (4.8) % Selling, General and Administrative (2) 232,095 237,151 (2.1) % 712,775 758,018 (6.0) % Depreciation and Amortization 157,252 157,561 (0.2) % 483,686 484,375 (0.1) % Significant Acquisition Costs — 3,950 n/a — 8,597 n/a Restructuring Charges 48,371 — n/a 128,715 — n/a Intangible Impairments — — n/a 23,000 — n/a (Gain) Loss on Disposal/Write-Down of PP&E, Net (75,840) (9,284) n/a (78,170) (17,087) n/a Total Operating Expenses $796,383 $838,750 (5.1) % $2,578,125 $2,607,730 (1.1) % Operating Income (Loss) $240,264 $223,474 7.5 % $509,492 $575,264 (11.4) % Interest Expense, Net 104,303 106,677 (2.2) % 313,408 314,427 (0.3) % Foreign Currency Transaction Loss / (Gain) 29,635 (18,251) n/a (6,293) (19,885) (68.4) % Debt Extinguishment Expense 51,260 — n/a 68,300 — n/a Other Expense (Income), Net 2,570 4,836 (46.9) % 4,432 6,488 (31.7) % Income (Loss) before Provision (Benefit) for Income Taxes $52,496 $130,212 (59.7) % $129,645 $274,234 (52.7) % Provision (Benefit) for Income Taxes 13,934 21,928 (36.5) % 33,304 43,127 (22.8) % Income (Loss) from Continuing Operations $38,562 $108,284 (64.4) % $96,341 $231,107 (58.3) % Income (Loss) from Discontinued Operations, Net of Tax — — n/a — 104 n/a Net Income (Loss) $38,562 $108,284 (64.4) % $96,341 $231,211 (58.3) % Less: Net Income (Loss) Attributable to Noncontrolling Interests 168 609 (72.4) % 1,058 1,534 (31.0) % Net Income (Loss) Attributable to Iron Mountain Incorporated $38,394 $107,675 (64.3) % $95,283 $229,677 (58.5) % Earnings (Losses) per Share - Basic: Income (Loss) from Continuing Operations $0.13 $0.37 (64.9) % $0.33 $0.80 (58.8) % Total Income (Loss) from Discontinued Operations — — n/a — — n/a Net Income (Loss) Attributable to Iron Mountain Incorporated $0.13 $0.37 (64.9) % $0.33 $0.80 (58.8) % Earnings (Losses) per Share - Diluted: Income (Loss) from Continuing Operations $0.13 $0.37 (64.9) % $0.33 $0.80 (58.8) % Total Income (Loss) from Discontinued Operations — — n/a — — n/a Net Income (Loss) Attributable to Iron Mountain Incorporated $0.13 $0.37 (64.9) % $0.33 $0.80 (58.8) % Weighted Average Common Shares Outstanding - Basic 288,403 287,152 0.4 % 288,105 286,869 0.4 % Weighted Average Common Shares Outstanding - Diluted 288,811 287,691 0.4 % 288,471 287,555 0.3 % (1) Includes $7.6M of direct and incremental costs related to COVID-19 YTD 2020. (2) Includes $1.6M of direct and incremental costs related to COVID-19 YTD 2020. investors.ironmountain.com 10


Section IV - Balance Sheets, Statements of Operations and Reconciliations Reconciliation of Income (Loss) from Continuing Operations to Adjusted EBITDA Q3 2020 Q3 2019 % Change YTD 2020 YTD 2019 % Change Income (Loss) from Continuing Operations $38,562 $108,284 (64.4) % $96,341 $231,107 (58.3) % Add / (Deduct): Intangible Impairments — — n/a 23,000 — n/a Provision (Benefit) for Income Taxes 13,934 21,928 (36.5) % 33,304 43,127 (22.8) % Foreign Currency Transaction Loss / (Gain) 29,635 (18,251) n/a (6,293) (19,885) n/a Other Expense (Income), Net 2,570 4,836 (46.9) % 4,432 6,488 (31.7) % Debt Extinguishment Expense 51,260 — n/a 68,300 — n/a Interest Expense, Net 104,303 106,677 (2.2) % 313,408 314,427 (0.3) % (Gain) Loss on Disposal/Write-Down of PP&E, Net (75,840) (9,284) n/a (78,170) (17,087) n/a Depreciation and Amortization 157,252 157,561 (0.2) % 483,686 484,375 (0.1) % Significant Acquisition Costs — 3,950 n/a — 8,597 n/a Restructuring Charges 48,371 — n/a 128,715 — n/a COVID-19 Costs — — n/a 9,285 — n/a Adjusted EBITDA $370,047 $375,701 (1.5) % $1,076,008 $1,051,149 2.4 % Reconciliation of Reported Earnings per Share to Adjusted Earnings per Share Q3 2020 Q3 2019 % Change YTD 2020 YTD 2019 % Change Reported EPS - Fully Diluted from Continuing Operations $0.13 $0.37 (64.9) % $0.33 $0.80 (58.8) % Intangible Impairments — — 0.08 — Other Expense (Income), Net 0.29 (0.05) 0.23 (0.05) (Gain) Loss on Disposal/Write-Down of PP&E, Net (0.26) (0.03) (0.27) (0.06) Significant Acquisition Costs — 0.01 — 0.03 Restructuring Charges 0.17 — 0.45 — COVID-19 Costs — — 0.03 — Tax Impact of Reconciling Items and Discrete Tax Items (1) (0.01) — (0.05) (0.01) Net Income (Loss) Attributable to Noncontrolling Interests — — — 0.01 Adjusted EPS - Fully Diluted from Continuing Operations $0.31 $0.32 (3.1) % $0.80 $0.71 12.7 % (1) The difference between our effective tax rates and our structural tax rate (or adjusted effective tax rates) for the quarters ended September 30, 2020 and 2019, is primarily due to (i) the reconciling items above, which impact our reported income (loss) from continuing operations before provision (benefit) for income taxes but have an insignificant impact on our reported provision (benefit) for income taxes and (ii) other discrete tax items. Our structural tax rate for purposes of the calculation of Adjusted EPS for the three and nine months ended September 30, 2020 and 2019 was 16.8% and 18.6%, respectively. The Tax Impact of Reconciling Items and Discrete Tax Items is calculated using the current quarter’s estimate of the annual structural tax rate for the full year. This may result in the current period adjustment plus prior reported quarterly adjustments to not sum to the full year adjustment. investors.ironmountain.com 11


Section IV - Balance Sheets, Statements of Operations and Reconciliations Reconciliation of Net Income to FFO and AFFO Q3 2020 Q3 2019 % Change YTD 2020 YTD 2019 % Change Net Income $38,562 $108,284 (64.4) % $96,341 $231,211 (58.3) % Add / (Deduct): Real Estate Depreciation (1) 72,019 72,939 (1.3) % 224,325 220,179 1.9 % (Gain) Loss on Sale of Real Estate, Net of Tax (75,880) (9,740) n/a (77,461) (40,252) 92.4 % Data Center Lease-Based Intangible Asset Amortization (2) 10,441 11,356 (8.1) % 32,173 35,337 (9.0) % FFO (Nareit) $45,142 $182,839 (75.3) % $275,378 $446,475 (38.3) % Add / (Deduct): Loss (Gain) on Disposal/Write-Down of PP&E, Net 40 369 (89.2) % (359) 28,558 n/a Foreign Currency Transaction Loss / (Gain) 29,635 (18,251) n/a (6,293) (19,885) (68.4) % Debt Extinguishment Expense 51,260 — n/a 68,300 — n/a Other Expense (Income), Net 2,570 4,836 (46.9) % 4,432 6,488 (31.7) % Intangible Impairments — — n/a 23,000 — n/a Tax Impact of Reconciling Items and Discrete Tax Items (3) (4,314) 1,283 n/a (13,959) (9,202) 51.7 % (Income) Loss from Discontinued Operations, Net of Tax — — n/a — (104) n/a Real Estate Financing Lease Depreciation 3,501 3,115 12.4 % 10,095 9,732 3.7 % Significant Acquisition Costs — 3,950 n/a — 8,597 n/a Restructuring Charges 48,371 — n/a 128,715 — n/a COVID-19 Costs — — n/a 9,285 — n/a FFO (Normalized) $176,205 $178,141 (1.1) % $498,594 $470,659 5.9 % Per Share Amounts (Fully Diluted Shares) FFO (Nareit) $0.16 $0.64 (75.1) % $0.95 $1.55 (38.7) % FFO (Normalized) $0.61 $0.62 (1.5) % $1.73 $1.64 5.6 % Weighted Average Common Shares Outstanding - Basic 288,403 287,152 0.4 % 288,105 286,869 0.4 % Weighted Average Common Shares Outstanding - Diluted 288,811 287,691 0.4 % 288,471 287,555 0.3 % (1) Includes depreciation expense related to owned real estate assets (land improvements, buildings, building improvements, leasehold of improvements and racking), excluding depreciation related to real estate financing leases. (2) Includes amortization expense for Data Center In-Place Lease Intangible Assets and Data Center Tenant Relationship Intangible Assets. (3) Represents the tax impact of (i) the reconciling items above, which impact our reported income (loss) from continuing operations before provision (benefit) for income taxes but have an insignificant impact on our reported provision (benefit) for income taxes and (ii) other discrete tax items. investors.ironmountain.com 12


Section IV - Balance Sheets, Statements of Operations and Reconciliations Reconciliation of Net Income to FFO and AFFO (Continued) Q3 2020 Q3 2019 % Change YTD 2020 YTD 2019 % Change FFO (Normalized) $176,205 $178,141 (1.1) % $498,594 $470,659 5.9 % Add / (Deduct): Non-Real Estate Depreciation 32,629 32,099 1.7 % 100,357 106,574 (5.8) % Amortization Expense (1) 33,271 33,830 (1.7) % 99,704 98,451 1.3 % Amortization of Deferred Financing Costs 4,149 4,078 1.8 % 13,150 12,286 7.0 % Revenue Reduction Associated with Amortization of Permanent Withdrawal Fees and Above and Below-Market Leases 2,363 3,237 (27.0) % 7,612 10,417 (26.9) % Non-Cash Rent Expense (Income) 2,779 1,379 n/a 8,276 3,394 n/a Stock-Based Compensation Expense 8,055 7,120 13.1 % 31,998 28,140 13.7 % Reconciliation to Normalized Cash Taxes (5,441) 4,641 n/a 23,375 (5,882) n/a Less: Non-Real Estate Growth Investment CapEx (2) 20,658 15,822 30.6 % 40,800 28,915 41.1 % Real Estate, Data Center and Non-Real Estate Recurring CapEx (3) 20,301 23,433 (13.4) % 48,508 66,830 (27.4) % AFFO $213,051 $225,270 (5.4) % $693,758 $628,293 10.4 % (1) Includes Customer Relationship Value, intake costs, acquisition of customer relationships, and other intangibles. Excludes amortization of capitalized commissions of $5.4M and $4.2M in Q3 2020 and Q3 2019, respectively, and $17.0M and $14.1M in YTD 2020 and YTD 2019, respectively. (2) Non-Real Estate Growth Investment CapEx excludes CapEx associated with Project Summit of $2.5M and $4.5M in Q3 2020 and YTD 2020, respectively. (3) Recurring CapEx excludes integration recurring expense included in Significant Acquisition Costs of $0.3M and $0.4M in Q3 and YTD 2019, respectively. investors.ironmountain.com 13


Section IV - Balance Sheets, Statements of Operations and Reconciliations Reconciliation of Cash Flow from Operations to AFFO Q3 2020 Q3 2019 % Change YTD 2020 YTD 2019 % Change Cash Flow from Operating Activities-Continuing Operations $187,448 $218,414 (14.2) % $627,218 $648,145 (3.2) % Adjust for: Tax on Gain from Disposition of Real Estate — (87) n/a 350 5,393 (93.5) % Tax Impact of Reconciling Items and Discrete Tax Items Net of Deferred Tax (3,653) 1,393 n/a (10,885) (11,845) (8.1) % Reconciliation to Normalized Cash Taxes (5,441) 4,641 n/a 23,375 (5,882) n/a Significant Acquisition Costs — 3,950 n/a — 8,597 n/a Restructuring Charges 48,371 — n/a 128,715 — n/a COVID-19 Costs — — n/a 9,285 — n/a Working Capital Adjustments (1) 32,486 34,698 (6.4) % 23,289 78,454 (70.3) % Non-Real Estate Growth Investment CapEx (2) (20,658) (15,822) 30.6 % (40,800) (28,915) 41.1 % Real Estate, Data Center and Non-Real Estate Recurring CapEx (3) (20,301) (23,433) (13.4) % (48,508) (66,830) (27.4) % Amortization of Capitalized Commissions (5,391) (4,222) 27.7 % (17,032) (14,105) 20.8 % Other and FX 189 5,737 (96.7) % (1,249) 15,279 n/a AFFO $213,051 $225,270 (5.4) % $693,758 $628,293 10.4 % (1) Working capital adjustments in Q3 2020 are driven primarily by changes in accruals for interest payable and accrued expense. (2) Non-Real Estate Growth CapEx excludes Summit CapEx included in the Summit Transformation project of $2.5M and $4.5M in Q3 2020 and YTD 2020, respectively. (3) Recurring CapEx excludes integration recurring expense included in Significant Acquisition Costs of $0.3M and $0.4M in Q3 and YTD 2019, respectively. investors.ironmountain.com 14


Section V - Storage and Service Reconciliation Storage Rental and Service Business Detail Q3 2020 Q3 2019 % Change YTD 2020 YTD 2019 % Change Total Storage Rental Revenue $696,294 $673,318 3.4 % $2,056,797 $2,005,580 2.6 % Terminations/Permanent Withdrawal Fees 5,237 5,827 (10.1) % 15,261 18,382 (17.0) % Total Revenue from Adjusted Storage Rental Activities $701,531 $679,145 3.3 % $2,072,058 $2,023,962 2.4 % Less: Storage Rental Expenses Storage Rent 90,460 84,845 6.6 % 269,339 253,591 6.2 % Other Facility Costs 79,170 77,938 1.6 % 240,003 241,993 (0.8) % Storage Rental Labor 6,475 5,744 12.7 % 18,174 18,774 (3.2) % Other Storage Rental Expenses 8,034 8,163 (1.6) % 29,191 24,543 18.9 % Storage Rental Cost of Sales $184,139 $176,690 4.2 % $556,707 $538,901 3.3 % Storage Rental Gross Profit $517,392 $502,455 3.0 % $1,515,351 $1,485,061 2.0 % Storage Rental Gross Margin 73.8 % 74.0 % (0.3) % 73.1 % 73.4 % (0.3) % Storage Rental Allocated Overhead 36,902 37,894 (2.6) % 118,358 116,394 1.7 % Total Storage Rental Adjusted EBITDA $480,491 $464,560 3.4 % $1,396,994 $1,368,666 2.1 % Storage Rent 90,460 84,845 6.6 % 269,339 253,591 6.2 % Storage Rental Net Operating Income $570,951 $549,405 3.9 % $1,666,333 $1,622,257 2.7 % Total Service Revenue $340,353 $388,906 (12.5) % $1,030,820 $1,177,414 (12.5) % Terminations/Permanent Withdrawal Fees 5,237 5,827 (10.1) % 15,261 18,382 (17.0) % Total Revenue from Adjusted Service Activities $335,115 $383,079 (12.5) % $1,015,559 $1,159,032 (12.4) % Less: Service Expenses Service Rent 3,203 2,803 14.3 % 9,322 9,168 1.7 % Other Facility Costs 6,200 6,112 1.4 % 18,518 18,623 (0.6) % Service Labor 177,403 194,728 (8.9) % 534,221 593,611 (10.0) % Other Service Expenses 63,561 69,038 (7.9) % 181,703 213,525 (14.9) % Service Cost of Sales $250,367 $272,680 (8.2) % $743,764 $834,927 (10.9) % Service Gross Profit $84,748 $110,399 (23.2) % $271,796 $324,105 (16.1) % Service Gross Margin 25.3 % 28.8 % (12.2) % 26.8 % 28.0 % (4.3) % Service Allocated Overhead 20,830 26,014 (19.9) % 68,368 78,299 (12.7) % Total Service Adjusted EBITDA $63,919 $84,385 (24.3) % $203,428 $245,806 (17.2) % COVID-19 Costs — — n/a 7,648 — n/a Total Cost of Sales $434,505 $449,372 (3.3) % $1,308,119 $1,373,827 (4.8) % SG&A Costs Storage Overhead 36,902 37,894 (2.6) % 118,358 116,394 1.7 % Service Overhead 20,830 26,014 (19.9) % 68,368 78,299 (12.7) % Corporate Overhead 119,069 115,233 3.3 % 357,275 376,608 (5.1) % Sales and Marketing 55,294 58,010 (4.7) % 167,138 186,717 (10.5) % COVID-19 Costs — — n/a 1,637 — n/a Total SG&A $232,095 $237,151 (2.1) % $712,775 $758,018 (6.0) % Total Adjusted EBITDA $370,047 $375,701 (1.5) % $1,076,008 $1,051,149 2.4 % investors.ironmountain.com 15


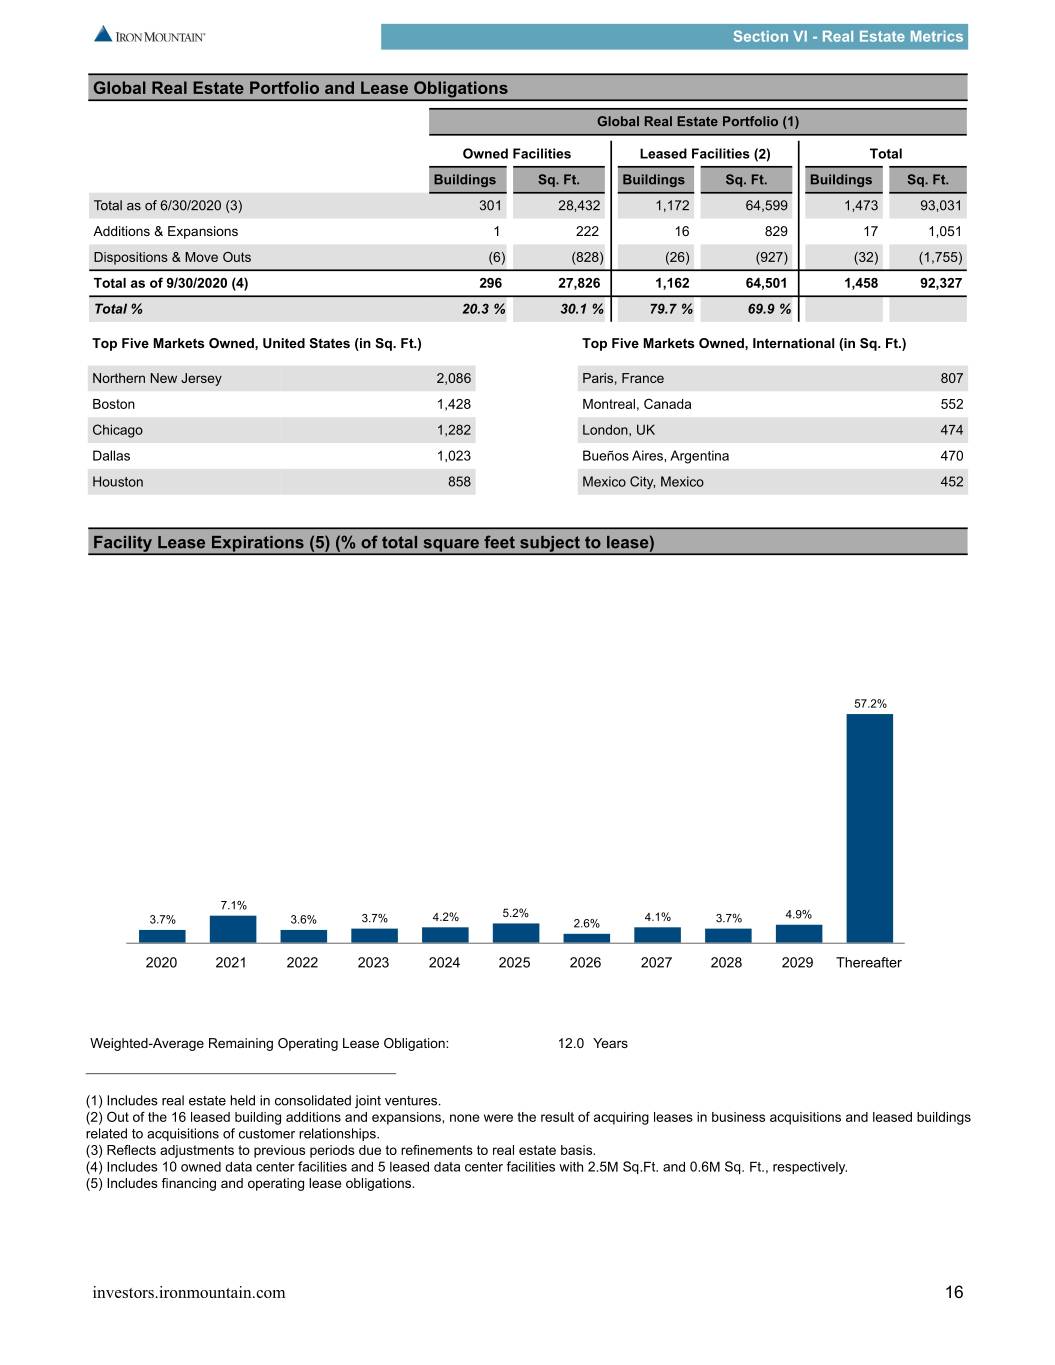
Section VI - Real Estate Metrics Global Real Estate Portfolio and Lease Obligations Global Real Estate Portfolio (1) Owned Facilities Leased Facilities (2) Total Buildings Sq. Ft. Buildings Sq. Ft. Buildings Sq. Ft. Total as of 6/30/2020 (3) 301 28,432 1,172 64,599 1,473 93,031 Additions & Expansions 1 222 16 829 17 1,051 Dispositions & Move Outs (6) (828) (26) (927) (32) (1,755) Total as of 9/30/2020 (4) 296 27,826 1,162 64,501 1,458 92,327 Total % 20.3 % 30.1 % 79.7 % 69.9 % Top Five Markets Owned, United States (in Sq. Ft.) Top Five Markets Owned, International (in Sq. Ft.) Northern New Jersey 2,086 Paris, France 807 Boston 1,428 Montreal, Canada 552 Chicago 1,282 London, UK 474 Dallas 1,023 Bueños Aires, Argentina 470 Houston 858 Mexico City, Mexico 452 Facility Lease Expirations (5) (% of total square feet subject to lease) 57.2% 7.1% 4.2% 5.2% 4.1% 4.9% 3.7% 3.6% 3.7% 2.6% 3.7% 2020 2021 2022 2023 2024 2025 2026 2027 2028 2029 Thereafter Weighted-Average Remaining Operating Lease Obligation: 12.0 Years (1) Includes real estate held in consolidated joint ventures. (2) Out of the 16 leased building additions and expansions, none were the result of acquiring leases in business acquisitions and leased buildings related to acquisitions of customer relationships. (3) Reflects adjustments to previous periods due to refinements to real estate basis. (4) Includes 10 owned data center facilities and 5 leased data center facilities with 2.5M Sq.Ft. and 0.6M Sq. Ft., respectively. (5) Includes financing and operating lease obligations. investors.ironmountain.com 16


Section VII - Data Center Customer and Portfolio Metrics Data Center Customer Lease Expiration Number of Leases Percentage of Total Annualized GAAP Percentage of TCV Year Expiring Total MW Expiring MW TCV Rent Expiring Annualized Rent 2020 100 8.5 5.4% $16,878 5.5% 2021 593 18.8 12.0% 59,676 19.3% 2022 284 15.6 10.0% 41,777 13.5% 2023 238 18.5 11.9% 51,377 16.6% 2024 57 7.4 4.8% 20,364 6.6% 2025 42 11.5 7.4% 24,978 8.1% 2026 9 7.4 4.7% 15,473 5.0% Thereafter 23 68.3 43.9% 78,850 25.5% Total 1,346 156.0 100.0% $309,373 100.0% WALE: 4.0 years Data Center Leasing Activity Summary Q3 2020 YTD 2020 Transaction GAAP $ / kW / Transaction GAAP $ / kW / Count MRR kW Month Count MRR kW Month New/expansion leases signed 71 $1,278 12,303 $104 188 4,387 (1) 51,052 89 (1) Commenced leases 87 805 5,086 158 276 1,783 11,496 155 Renewed leases 90 1,310 4,822 272 268 4,164 18,882 221 Churn 1.6% 2.9% Cash Mark to Market (1.2)% (5.5)% GAAP Mark to Market 0.7% (3.5)% New VA-2 Data Center in Manassas VA (1) GAAP MRR includes contractual payments related to reserved dedicated expansion space, which is excluded from the rate. investors.ironmountain.com 17


Section VII - Data Center Customer and Portfolio Metrics Data Center Operating Portfolio Stabilized Pre-Stabilized Total Leasable MW Leased % by MW Leasable MW Leased % by MW Leasable MW Leased % by MW Boyers and Other WPA-1 and Other 14.2 89.8 % — — 14.2 89.8 % Phoenix AZP-1 41.0 92.0 % — — 41.0 92.0 % AZP-2 4.0 100.0 % — — 4.0 100.0 % AZS-1 5.7 63.7 % — — 5.7 63.7 % Total Phoenix 50.7 89.4 % — — 50.7 89.4 % Denver DEN-1 11.3 83.4 % — — 11.3 83.4 % New Jersey NJE-1 15.1 100.0 % — — 15.1 100.0 % Northern Virginia VA-1 10.9 100.0 % — — 10.9 100.0 % VA-2 4.0 100.0 % — — 4.0 100.0 % Amsterdam AMS-1 12.4 90.4 % — — 12.4 90.4 % London LON-1 3.2 100.0 % 1.9 72.1 % 5.1 89.5 % Singapore SIN-1 2.6 100.0 % — — 2.6 100.0 % Total Data Center Properties 124.4 92.1 % 1.9 72.1 % 126.3 91.8 % Total Potential Capacity - Megawatts Q3 2020 Q3 2019 Leasable 126.3 117.6 Under Construction 48.5 9.5 Held for Development 201.2 204.5 Total Data Center Portfolio 376.0 331.6 investors.ironmountain.com 18


Section VII - Data Center Customer and Portfolio Metrics Data Center Expansion and Development Activity Total Project / MW Under MW Pre- % Investment in Cumulative Expected Expected Expected MW Held for Facilities Construction leased Pre- Q3 2020 ($M) Investment Investment Completion Stabilization Development Leased ($M) ($M) Data Center Expansion Amsterdam AMS-1 Phase 2b 0.3 — — $0.3 $2.1 $2.6 Q4 2020 Q4 2020 — AMS-1 Phase 3 1.1 — — $5.5 $6.5 $17.3 Q1 2021 Q3 2021 — AMS-1 Phase 4 5.0 — — $0.9 $1.0 $45.0 Q4 2021 Q4 2023 4.6 Denver DEN-1 Phase 1 2.7 2.7 100.0% — — $11.2 Q2 2021 Q2 2021 0.4 London LON-1 Phase 2 2.0 — — $9.0 $11.1 $14.9 Q4 2020 Q2 2022 — LON-1 Phase 3 2.0 — — $2.2 $2.2 $13.7 Q1 2021 Q2 2023 — New Jersey NJE-1 Phase 3b 0.2 — — $0.3 $1.5 $6.7 Q4 2020 Q4 2020 — NJE-1 Phase 4 1.0 — — $2.1 $2.3 $4.5 Q4 2020 Q2 2021 9.3 Northern Virginia VA-1 Phase 4b 1.5 1.5 100.0% $1.5 $5.4 $5.7 Q4 2020 Q4 2020 — VA-2 Phase 2 6.0 4.0 66.7% $0.1 $0.5 $30.0 Q2 2021 Q3 2021 14.0 Phoenix — AZP-2 Phase 2 6.0 6.0 100.0% $0.3 $0.4 $62.0 Q3 2021 Q3 2021 38.0 Singapore SIN-1 Phase 2 2.8 2.0 72.7% $10.1 $10.4 $18.6 Q4 2020 Q1 2021 1.5 All Other Facilities 11.2 Total Expansion 30.5 16.2 53.1% $32.3 $43.4 $232.3 79.0 New Development Amsterdam AMS-2 — — — — — — 10.6 Chicago CHI-2 — — — — — — 36.0 Frankfurt FRA-1 Phase 1 9.0 9.0 100.0% $11.4 $42.5 $129.2 Q2 2021 Q2 2021 18.0 London LON-2 9.0 — — $1.5 $1.5 $70.7 Q2 2022 Q2 2023 18.0 Northern Virginia VA Future Phases — — — — — — 39.6 Total New Development 18.0 9.0 50.0% $12.9 $44.1 $199.9 122.2 Total Development 48.5 25.2 52.0% $45.2 $87.4 $432.1 201.2 investors.ironmountain.com 19


Section VIII - Capitalization and Debt Maturity Profile Capitalization Total Market Capitalization as of 9/30/2020 Senior Credit Facility # of Shares Outstanding 288,163 Capacity $1,968,750 Share Price as of 9/30/2020 $26.79 Outstanding $391,353 Total Market Capitalization $7,719,887 Letters of Credit $3,202 Total Debt, Net of Cash(1) $8,956,963 Remaining Capacity $1,574,195 Total Enterprise Value $16,676,850 Interest Rate Spread (Prime) 0.75 % Net Debt to Total Enterprise Value 53.7 % Interest Rate Spread (LIBOR) 1.75 % Adjusted EBITDA to Interest Expense 3.5x Weighted Average Interest Rate 2.35 % Credit Facility Fixed Charge Coverage Ratio 2.4x Maturity Date 6/3/2023 Bond Fixed Charge Coverage Ratio 3.3x Net Lease-Adjusted Leverage Ratio 5.3x Total Enterprise Value to Adjusted EBITDA (2) 11.4x Credit Rating Fixed vs. Floating Rate Debt S&P Moody's Corporate BB- Ba3 Senior Credit Facility BB Ba3 Outlook Negative Stable 14% Latest Update 5/13/2020 7/1/2020 Total Debt Weighted Average Rates 86% Weighted Average Interest 4.6 % Weighted Average Maturity 7.7 Years USD Denominated 81.8 % Fixed Rate Debt Floating Rate Debt Debt Maturity Profile ($ in Millions) (3) $1,325 $1,300 $1,100 $1,000 $1,000 $691 $600 $451 $522 $317 $377 $45 $17 2020 2021 2022 2023 2024 2025 2026 2027 2028 2029 2030 2031 2032 Senior Secured Credit Facility Bi-Lateral Loans AUD Term Loan B A/R Securitization USD Term Loan B Mortgage Securitization Senior Unsecured Notes (1) Net debt is calculated as current portion of long-term debt of $392.6M plus long-term debt net of current portion of $8,618.9M plus deferred financing costs of $97.5M less cash and cash equivalents of $152.0M. (2) Total Enterprise Value to Adjusted EBITDA is calculated on a trailing twelve-month basis. (3) Excludes Deferred Financing Costs, Financing Leases, Notes Payable and Other. investors.ironmountain.com 20


Section IX - Capital Expenditures and Acquisitions Capital Expenditures and Investments Q3 2020 Q3 2019 % Change YTD 2020 YTD 2019 % Change Capital Expenditures Growth Investment: Real Estate (1) $17,264 $55,919 (69.1) % $45,888 $107,895 (57.5) % Non-Real Estate (2) 17,626 13,337 32.2 % 35,538 20,813 70.7 % Data Center (3) 59,861 81,762 (26.8) % 151,692 316,932 (52.1) % Innovation 644 3,916 (83.6) % 1,145 14,596 (92.2) % $95,395 $154,934 (38.4) % $234,263 $460,236 (49.1) % Recurring: Real Estate $10,948 $15,433 (29.1) % $28,242 $42,997 (34.3) % Non-Real Estate 5,517 6,995 (21.1) % 12,183 19,255 (36.7) % Data Center 3,836 1,345 n/a 8,083 4,951 63.3 % $20,301 $23,773 (14.6) % $48,508 $67,203 (27.8) % Total Growth Investment and Recurring Capital Expenditures $115,695 $178,707 (35.3) % $282,771 $527,439 (46.4) % Net Change in Prepaid and Accrued Capital Expenditures and Financing Leases (7,387) (12,224) (39.6) % 26,391 6,176 n/a Total Cash Paid for Growth Investment and Recurring Capital Expenditures $108,308 $166,483 (34.9) % $309,162 $533,614 (42.1) % Capital Expenditures Outlook Total Capital Expenditures expected to be ~$450 million in 2020; a reduction of $75 million, reflecting the recent Frankfurt Data Center Joint Venture agreement. Recurring CapEx as a % of Revenue Data Center Recurring CapEx as a TTM % of Data Center Revenue TTM (excl. Data Center) 2.6% 4.7% 4.5% 2.3% 2.1% 3.3% 3.5% 3.0% 1.8% 1.6% Q3 2019 Q4 2019 Q1 2020 Q2 2020 Q3 2020 Q3 2019 Q4 2019 Q1 2020 Q2 2020 Q3 2020 (1) Includes land, buildings improvements, and racking structures. (2) Non-Real Estate Growth CapEx includes Summit CapEx included in the Summit Transformation project of $2.5M and $4.5M in Q3 2020 and YTD 2020, respectively. (3) Includes Non-Real Estate Growth Investment CapEx associated with our Global Data Center Business segment of $5.6M and $3.0M in Q3 2020 and 2019, respectively, and $9.7M and $8.6M in YTD 2020 and 2019, respectively. investors.ironmountain.com 21


Section IX - Capital Expenditures and Acquisitions Business Acquisitions Q3 2020 Q3 2019 % Change YTD 2020 YTD 2019 % Change Business Acquisitions Business Acquisitions — $11,928 n/a $118,496 $39,235 n/a Change in Business Acquisition Accruals and Cash Acquired 69 (80) n/a 85 17,264 (99.5) % Cash Paid for Acquisitions, Net of Cash Acquired $69 $11,848 (99.4) % $118,581 $56,499 109.9 % Customer Acquisitions Q3 2020 Q3 2019 % Change YTD 2020 YTD 2019 % Change Customer Acquisitions Acquisition of Customer Relationships (1) $644 $4,590 (86.0) % $3,529 $47,472 (92.6) % Customer Inducements 1,299 1,578 (17.7) % 8,269 7,429 11.3 % Contract Fulfillment Costs (2) 11,968 11,744 1.9 % 30,706 63,090 (51.3) % Total Acquisition of Customer Relationships, Customer Inducements, and Contract Fulfillment $13,911 $17,912 (22.3) % $42,503 $117,991 (64.0) % Costs Change in Customer Acquisition Accruals (1) 5,035 n/a — (4,482) n/a Total Cash Paid for Acquisition of Customer Relationships, Customer Inducements, and Contract $13,910 $22,947 (39.4) % $42,503 $113,509 (62.6) % Fulfillment Costs (1) Acquisition of customer relationships contributed 0.1% to Organic Storage Rental Revenue and 0.1% to Organic Service Revenue in Q3 2020. (2) Includes $30.9M associated with the execution of customer contracts in Q1 2019 following the closing of IO Data Centers, LLC. investors.ironmountain.com 22


Section X - Appendix and Definitions Non-GAAP Measures and Definitions Non-GAAP measures are supplemental metrics designed to enhance our disclosures and to provide additional information that we believe to be important for investors to consider when evaluating our financial performance. These non-GAAP measures should be considered in addition to, but not as a substitute for, other measures of financial performance reported in accordance with accounting principles generally accepted in the United States of America (“GAAP”), such as operating income, (loss) income from continuing operations, net income (loss) or cash flows from operating activities from continuing operations (as determined in accordance with GAAP). Adjusted Earnings Per Share, or Adjusted EPS Adjusted EPS is defined as reported earnings per share fully diluted from continuing operations excluding: (i) (gain) loss on disposal/write-down of property, plant and equipment, net (including real estate); (ii) intangible impairments; (iii) other expense (income), net (which includes foreign currency transaction (gains) losses, net and debt extinguishment expense); (iv) Significant Acquisition Costs; (v) Restructuring Charges; (vi) COVID-19 Costs; and (vii) the tax impact of reconciling items and discrete tax items. Adjusted EPS includes income (loss) attributable to noncontrolling interests. We do not believe these excluded items to be indicative of our ongoing operating results, and they are not considered when we are forecasting our future results. We believe Adjusted EPS is of value to our current and potential investors when comparing our results from past, present and future periods. Adjusted EBITDA and Adjusted EBITDA Margin Adjusted EBITDA is defined as (loss) income from continuing operations before interest expense, net, provision (benefit) for income taxes, depreciation and amortization, and also excludes certain items that we believe are not indicative of our core operating results, specifically: (i) (gain) loss on disposal/write-down of property, plant and equipment, net (including real estate); (ii) intangible impairments; (iii) other expense (income), net (which includes foreign currency transaction (gains) losses, net and debt extinguishment expense); (iv) Significant Acquisition Costs; (v) Restructuring Charges; and (vi) COVID-19 Costs. Adjusted EBITDA Margin is calculated by dividing Adjusted EBITDA by total revenues. We use multiples of current or projected Adjusted EBITDA in conjunction with our discounted cash flow models to determine our estimated overall enterprise valuation and to evaluate acquisition targets. We believe Adjusted EBITDA and Adjusted EBITDA Margin provide our current and potential investors with relevant and useful information regarding our ability to generate cash flows to support business investment. These measures are an integral part of the internal reporting system we use to assess and evaluate the operating performance of our business. Adjusted EBITDA excludes both interest expense, net and the provision (benefit) for income taxes. These expenses are associated with our capitalization and tax structures, which we do not consider when evaluating the operating profitability of our core operations. Finally, Adjusted EBITDA does not include depreciation and amortization expenses, in order to eliminate the impact of capital investments, which we evaluate by comparing capital expenditures to incremental revenue generated and as a percentage of total revenues. Adjusted EBITDA and Adjusted EBITDA Margin should be considered in addition to, but not as a substitute for, other measures of financial performance reported in accordance with GAAP, such as operating income, (loss) income from continuing operations, net (loss) income or cash flows from operating activities from continuing operations (as determined in accordance with GAAP). Adjusted Funds From Operations, or AFFO AFFO is defined as FFO (Normalized) excluding non-cash rent expense or income plus depreciation on non-real estate assets, amortization expense associated with customer relationship value (CRV), intake costs, acquisitions of customer relationships and other intangibles, and excluding amortization expense associated with capitalized internal commissions, amortization of deferred financing costs, revenue reduction associated with amortization of permanent withdrawal fees and above-and below-market data center leases, stock-based compensation expense and the impact of reconciling to normalized cash taxes, less recurring capital expenditures and non-real estate growth investments, excluding Significant Acquisition Capital Expenditures. We believe AFFO is a useful measure in determining our ability to generate excess cash that may be used for reinvestment in the business, discretionary deployment in investments such as real estate or acquisition opportunities, returning capital to our stockholders and voluntary prepayments of indebtedness. Additionally AFFO is reconciled to cash flow from operations to adjust for real estate and REIT tax adjustments, Significant Acquisition Costs, Restructuring Charges and other non-cash expenses. AFFO does not include adjustments for Customer Inducements, acquisition of customer relationships and investment in innovation as we consider these expenditures to be growth related. Funds From Operations, or FFO (Nareit), and FFO (Normalized) Funds from operations (“FFO”) is defined by the National Association of Real Estate Investment Trusts ("Nareit") and us as net income (loss) excluding depreciation on real estate assets, gains on sale of real estate, net of tax and amortization of data center leased-based intangibles ("FFO (Nareit)"). FFO (Nareit) does not give effect to real estate depreciation because these amounts are computed, under GAAP, to allocate the cost of a property over its useful life. Because values for well-maintained real estate assets have historically increased or decreased based upon prevailing market conditions, we believe that FFO (Nareit) provides investors with a clearer view of our operating performance. Our most directly comparable GAAP measure to FFO (Nareit) is net (loss) income. Although Nareit has published a definition of FFO, modifications to FFO (Nareit) are common among REITs as companies seek to provide financial measures that most meaningfully reflect their particular business. Our definition of FFO (Normalized) excludes certain items included in FFO (Nareit) that we believe are not indicative of our core operating results, specifically: (i) (gain) loss on disposal/write-down of property, plant and equipment, (excluding real estate, net); (ii) intangible impairments; (iii) other expense (income), net (which includes foreign currency transaction (gains) losses, net and debt extinguishment expense); (iv) real estate financing lease depreciation; (v) Significant Acquisition Costs; (vi) Restructuring Charges; (vii) COVID-19 Costs; (viii) the tax impact of reconciling items and discrete tax items; (ix) loss (income) from discontinued operations, net of tax; and (x) loss (gain) on sale of discontinued operations, net of tax. FFO (Normalized) per share FFO (Normalized) divided by weighted average fully-diluted shares outstanding. Service Adjusted EBITDA Service Adjusted EBITDA is calculated by taking service revenues excluding terminations and permanent withdrawals less direct expenses and overhead allocated to the service business. Terminations and permanent withdrawals are excluded from this calculation as they are included in the Storage NOI calculation. investors.ironmountain.com 23


Section X - Appendix and Definitions Storage Adjusted EBITDA Storage Adjusted EBITDA is calculated by taking storage revenues including terminations and permanent withdrawal fees less direct expenses and overhead allocated to the storage business. Constant Currency Adjusts results for normalized FX impacts in prior period. Other Definitions Business Segments Global Record and Information Management ("Global RIM") Business: provides (i) storage of physical records, including media such as microfilm and microfiche, film, X-rays and blueprints, including healthcare information services, vital records services, service and courier operations, and the collection, handling and disposal of sensitive documents for customers in approximately 50 countries ("Records Management"), (ii) storage and rotation of backup computer media as part of corporate disaster recovery plans, including service and courier operations (“Data Protection & Recovery”); server and computer backup services; and related services offerings, (collectively, "Data Management"), (iii) Information Governance and Digital Solutions, which develops, implements and supports comprehensive storage and information management solutions for the complete lifecycle of our customers' information, including the management of physical records, document conversion and digital storage in the United States and Canada, (iv) the shredding of sensitive documents for customers that, in many cases, store their records with us ("Secure Shredding") and the subsequent sale of shredded paper for recycling, and (v) on-demand, valet storage for consumers across 24 markets in North America through the MakeSpace JV. Global Data Center Business: provides enterprise-class data center facilities to protect mission-critical assets and ensure the continued operation of our customers’ IT infrastructure, with secure and reliable data center options. As of December 31, 2019, our Global Data Center Business footprint spanned nine markets in the United States: Denver, Colorado; Kansas City, Missouri; Boston, Massachusetts; Boyers, Pennsylvania; Manassas, Virginia; Edison, New Jersey; Columbus, Ohio; and Phoenix and Scottsdale, Arizona and four international markets: Amsterdam, London, and Singapore, with land held for development in Frankfurt. Corporate and Other Business: consists primarily of Adjacent Businesses and other corporate items. Our Adjacent Businesses is comprised of (i) helping entertainment and media industry clients store, safeguard and deliver physical media of all types, and provides digital content repository systems that house, distribute, and archive key media assets, throughout the United States, Canada, France, China - Hong Kong S.A.R., the Netherlands and the United Kingdom ("Entertainment Services") and (ii) technical expertise in the handling, installation and storing of art in the United States, Canada and Europe ("Fine Arts"). Additionally, our Corporate and Other Business segment includes costs related to executive and staff functions, including finance, human resources and IT, which benefit the enterprise as a whole, and stock-based employee compensation expense associated with all stock options, restricted stock units, performance units and shares of stock issued under our employee stock purchase plan. Additionally, our Corporate and Other Business segment includes our technology escrow services business in the United States. Capital Expenditures and Investments – Our business requires capital expenditures to support our expected storage rental revenue and service revenue growth and ongoing operations, new products and services and increased profitability. The majority of our capital goes to support business line growth and our ongoing operations. Additionally, we invest capital to acquire or construct real estate. We also expend capital to support the development and improvement of products and services and projects designed to increase our profitability. These expenditures are generally relatively small and discretionary in nature. We categorize our capital expenditures as follows: Growth Investment: Real Estate – Expenditures primarily related to investments in land, buildings, building improvements, leasehold improvements and racking structures to grow our revenues or achieve operational efficiencies. Non-Real Estate - Expenditures that support the growth of our business, and/or increase our profitability, such as customer-inventory technology systems, security upgrades or system enhancements. Data Center - Expenditures primarily related to investments in new construction of data center facilities (including the acquisition of land and development of facilities) or capacity expansion in existing buildings. Innovation - Discretionary capital expenditures in significant new products and services in new, existing or AB opportunities. Recurring: Real Estate – Expenditures primarily related to the replacement of components of real estate assets such as buildings, building improvements, leasehold improvements and racking structures. Non-Real Estate – Expenditures primarily related to the replacement of customer-facing assets such as containers and shred bins, warehouse equipment, fixtures, computer hardware, or third-party or internally-developed software assets. Data Center – Expenditures related to the upgrade or re-configuration of existing data center assets. Components of Overhead Allocated Overhead – Includes overhead expenses directly associated with storage and service business operations allocated as follows: Field Operation Costs – Allocated to storage and service operations based on percent of revenue. Bad Debt Expenses – Allocated to storage and service operations based on percent of revenue. Transportation Costs – Allocated fully to service operations. Corporate Overhead – Includes all other overhead expenses associated with business support functions, including: Executive, Legal, Real Estate/Facilities, Accounting, Financial Performance & Analysis, Treasury, Tax, Internal Audit, M&A, Security, Procurement, HR, REIT, Other G&A, Integration Costs, IT, Product Engineering and Product Management. investors.ironmountain.com 24


Section X - Appendix and Definitions Customer Turnover Overhead – Overhead associated with customer acquisition and retention including Sales, Marketing and Account Management expenses. COVID-19 Costs: Costs that are incremental and directly attributable to the COVID-19 pandemic which are not expected to reoccur once the pandemic ends. Bond Fixed Charge Coverage Ratio - is calculated as LTM Adjusted EBITDA divided by scheduled amortization, interest expense related to outstanding debt. Customer Inducements – Represents Free Move Costs and Permanent Withdrawal Fees. Data Center Business Definitions Leasable MW – Represents the amount of critical power capacity available for customer use, measured in megawatts. Leased % Calculation – Calculated as the megawatts under contract divided by the leasable megawatts. Monthly Recurring Revenue (MRR) - defined as recurring contractual revenue under existing commenced customer leases, including rent, power, and other recurring data center services. Pre-leased - A lease on data center capacity that is signed before construction has completed. Pre-Stabilized - A building recently placed in service which has not yet reached 85% leased or 24 months in service. Rental Churn Rate - represents data center leases which are not renewed or are terminated during the period. Rental churn is calculated based on the MRR terminated in the period, compared with total MRR at the beginning of the period. TCV – “Total Contract Value” represents total revenue contracted for active contracts through the contract term, not including renewals or extensions, but including fixed power charges. Total potential MW - Total amount of existing and planned critical power capacity at full build-out, measured in megawatts. WALE – “Weighted Average Lease Expiry” (in years) is calculated on a revenue basis, using annual GAAP revenue of all in-place contracts, excluding utility reimbursements. Credit Facility Fixed Charge Coverage Ratio - The Credit Facility Fixed Charge Coverage Ratio is calculated as LTM Adjusted EBITDA plus rent expenses divided by scheduled amortization, interest expense related to outstanding debt and preferred equity, if any, and rent expenses. Net Lease-Adjusted Leverage Ratio - The calculation for this ratio is net debt including the capitalized value of lease obligations plus six times rent expenses divided by EBITDA plus rent expenses. Organic Revenue Growth - Our organic revenue growth rate, which is a non-GAAP measure, represents the year-over-year growth rate of our revenues excluding the impact of business acquisitions, divestitures and foreign currency exchange rate fluctuations. Our organic revenue growth rates includes the impact of acquisitions of customer relationships. Records Management Retention Rate – One minus the result of dividing the total number of cubic feet of records removed from inventory due to customer terminations and destructions in a one-year period by the total number of cubic feet of records in storage at the beginning of the period. Restructuring Charges - Operating expenditures associated with Project Summit, our transformation program announced in Q4 2019 which is designed to accelerate execution of Iron Mountain's Strategy. Storage Rev/NOI per Sq.Ft. - Storage revenue (or storage NOI) divided by the quarterly building sq ft average for storage products. Significant Acquisition Capital Expenditures – Represents capitalized expenditures associated with the May 2, 2016 acquisition of Recall Holdings Limited ("Recall") pursuant to the Scheme Implementation Deed, as amended with Recall (the "Recall Transaction") and the acquisition of IO Data Centers, LLC. Significant Acquisition Costs – Represents operating expenditures associated with (1) our acquisition of Recall including: (i) advisory and professional fees to complete the Recall Transaction; (ii) costs associated with the divestments required in connection with receipt of regulatory approvals in connection with the Recall Transaction (including transitional services); and (iii) costs to integrate Recall with our existing operations, including moving, severance, facility upgrade, REIT integration and system upgrade costs, as well as certain costs associated with our shared service center initiative for our finance, human resources and information technology functions; and (2) the advisory and professional fees to complete the acquisition of IO Data Centers, LLC. Service Profit and Margin – The Gross Profit and Margin attributable to the worldwide service business. Calculated as follows: Services Adjusted EBITDA + Allocated Overhead Expenses + Termination and Permanent Withdrawal Fees = Service Profit ($) / Total Service Revenues (including Termination and Permanent Withdrawal Fees) = Service Margin (%) Storage Net Operating Income, or Storage NOI Storage NOI is defined as revenue from rental activities (storage rental revenue, termination fees and permanent withdrawal fees) less storage rental costs. Storage rental costs include facility costs (excluding rent), storage rental labor, other storage costs and allocated overhead. Storage NOI is commonly used in the REIT industry and enables investors to understand and value the income generated from the company’s real estate. Storage Profit and Margin – The Gross Profit and Margin attributable to the worldwide storage business. Calculated as follows: Storage Net Operating Income investors.ironmountain.com 25


Section X - Appendix and Definitions + Allocated Overhead Expenses - Storage Rent - Termination and Permanent Withdrawal Fees = Storage Profit ($) / Total Storage Revenues (excluding Termination and Permanent Withdrawal Fees) = Storage Margin (%) Tax Rates Effective Tax Rate – GAAP tax rate for the period calculated as tax expense or benefit for the quarter (total of current and deferred tax provisions), including discrete items, and divided by profit before tax for the period. Structural Tax Rate – Estimated tax rate for the full fiscal year based on forecasted ordinary income and forecasted tax expense/ benefit excluding any significant unusual or infrequently occurring items (i.e., discrete items) and items recognized net of tax on the financials (i.e., discontinued operations). Total Physical Storage Volume - Comprised of Iron Mountain’s comprehensive portfolio of physical storage, including Records Management hardcopy records, data protection tapes, Consumer and Other, and Adjacent Businesses (Fine Art and Entertainment Services), measured on an absolute basis in cubic feet. investors.ironmountain.com 26