Document
false0001158463 0001158463 2020-01-23 2020-01-23
UNITED STATES
SECURITIES AND EXCHANGE COMMISSION
Washington, D.C. 20549 
FORM 8-K
CURRENT REPORT
PURSUANT TO SECTION 13 OR 15(d) OF THE
SECURITIES EXCHANGE ACT OF 1934
Date of Report (Date of earliest event reported): January 23, 2020
jetblue-logob76.jpg
JETBLUE AIRWAYS CORPORATION
(Exact name of registrant as specified in its charter)
 
Delaware
000-49728
87-0617894
(State or other jurisdiction of incorporation)
 (Commission File Number)
(I.R.S. Employer Identification No.)


27-01 Queens Plaza North
Long Island City
New York
11101
(Address of principal executive offices) 
 (Zip Code)
(718) 286-7900
(Registrant’s telephone number, including area code)

N/A
(Former name or former address, if changed since last report.)

Check the appropriate box below if the Form 8-K filing is intended to simultaneously satisfy the filing obligation of the registrant under any of the following provisions:

Written communications pursuant to Rule 425 under the Securities Act (17 CFR 230.425)
Soliciting material pursuant to Rule 14a-12 under the Exchange Act (17 CFR 240.14a-12)
Pre-commencement communications pursuant to Rule 14d-2(b) under the Exchange Act (17 CFR 240.14d-2(b))
Pre-commencement communications pursuant to Rule 13e-4(c) under the Exchange Act (17 CFR 240.13e-4(c))

Securities registered pursuant to Section 12(b) of the Act:
Title of each class
Trading Symbol
Name of each exchange on which registered
Common Stock, $0.01 par value
JBLU
The NASDAQ Stock Market LLC

Indicate by check mark whether the registrant is an emerging growth company as defined in Rule 405 of the Securities Act of 1933 (17 CFR 230.405) or Rule 12b-2 of the Securities Exchange Act of 1934 (17 CFR 240.12b-2).

Emerging growth company

If an emerging growth company, indicate by check mark if the registrant has elected not to use the extended transition period for complying with any new or revised financial accounting standards provided pursuant to Section 13(a) of the Exchange Act.


Item 2.02 Results of Operations and Financial Condition.
On January 23, 2020 we issued a press release announcing our financial results for the fourth quarter ended December 31, 2019. A copy of the press release is attached to this report as Exhibit 99.1 and is incorporated herein by reference.
The information included under Item 2.02 of this report (including the exhibits) is being furnished and shall not be deemed “filed” for purposes of Section 18 of the Securities Exchange Act of 1934, nor shall such information be deemed incorporated by reference in any filing under the Securities Act of 1933.

Item 7.01 Regulation FD Disclosure.
On January 23, 2020 we provided an update for investors presenting information relating to our financial outlook for the first quarter ending March 31, 2020 and full year 2020, and other information regarding our business. The update and materials to be used in conjunction with the presentation are furnished herewith as Exhibit 99.2 and Exhibit 99.3 and are incorporated herein by reference.
The information included under Item 7.01 of this report (including the exhibits) is being furnished and shall not be deemed “filed” for purposes of Section 18 of the Securities Exchange Act of 1934, nor shall such information be deemed incorporated by reference in any filing under the Securities Act of 1933.


Item 9.01 Financial Statements and Exhibits.
(d) Exhibits


Exhibit
Number

  
Description
99.1

  
99.2

 
99.3

 
104

 
Cover Page Interactive Data File (embedded within the Inline XBRL document)


SIGNATURE
Pursuant to the requirements of the Securities Exchange Act of 1934, the registrant has duly caused this report to be signed on its behalf by the undersigned thereunto duly authorized.


JETBLUE AIRWAYS CORPORATION


(Registrant)


Date:
January 23, 2020
By:
/s/ Alexander Chatkewitz


Vice President, Controller, and Chief Accounting Officer
(Principal Accounting Officer)


jetblue-logob76.jpg     Earnings Release


JETBLUE ANNOUNCES FOURTH QUARTER 2019 RESULTS


NEW YORK (January 23, 2020) -- JetBlue Airways Corporation (NASDAQ: JBLU) today reported its results for the fourth quarter 2019:

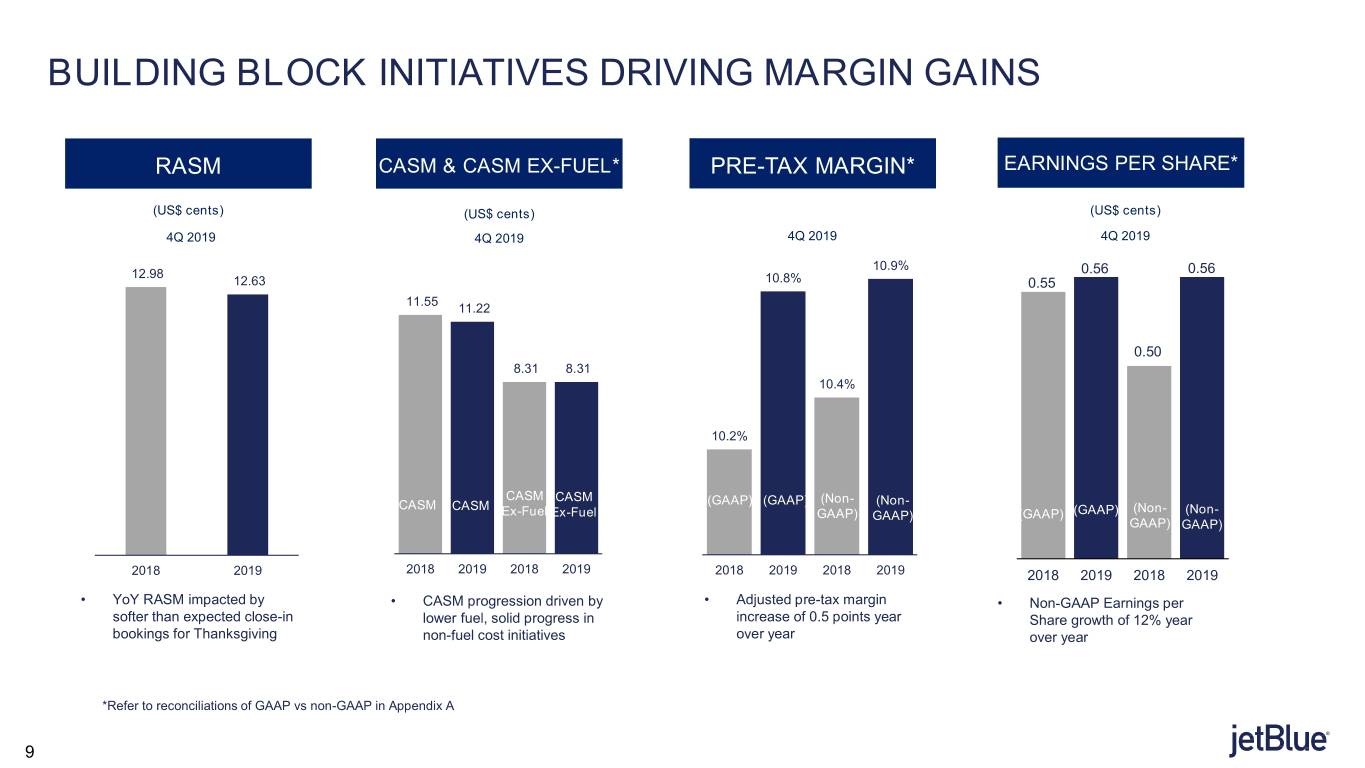
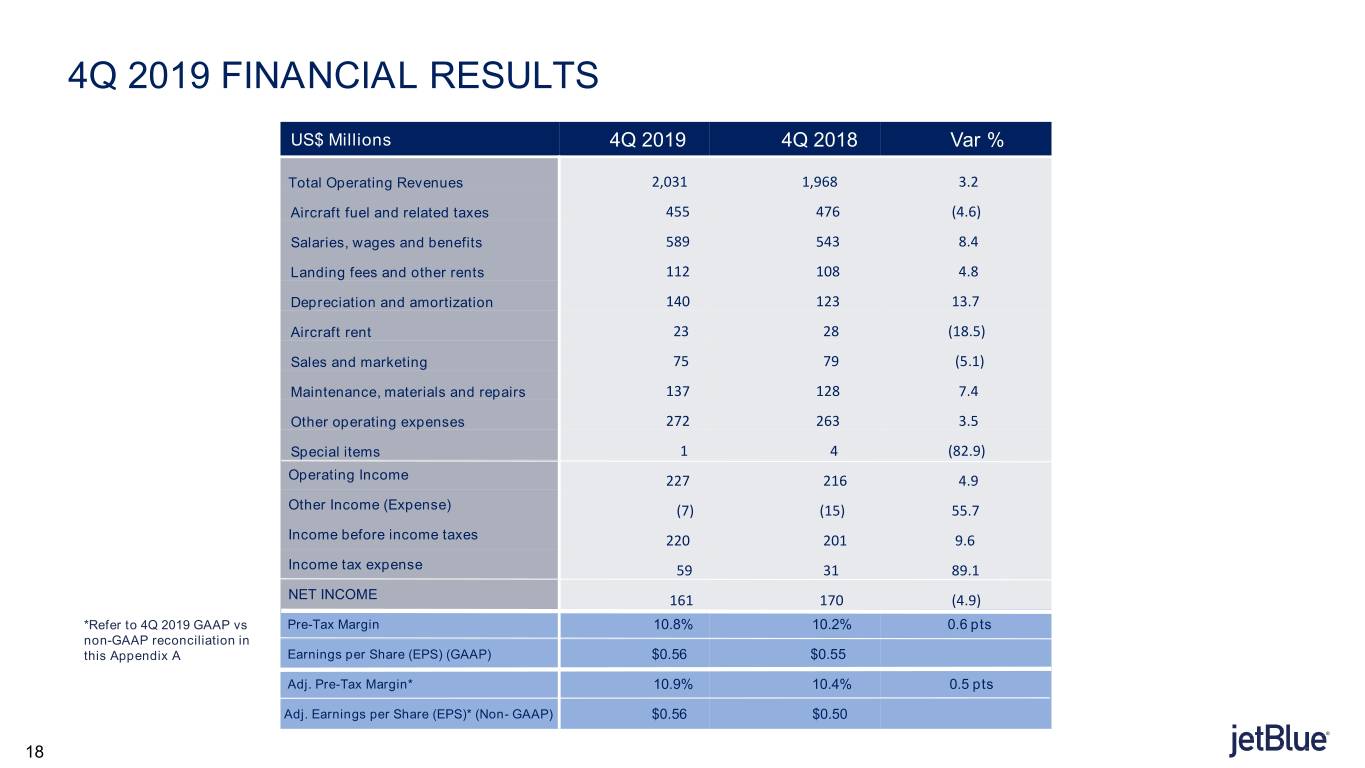
Reported diluted earnings per share of $0.56 in the fourth quarter of 2019 compared to a diluted earnings per share of $0.55 in the fourth quarter of 2018. Adjusted diluted earnings per share was $0.56(1) in the fourth quarter of 2019 versus $0.50(1) in the fourth quarter of 2018.  Note A to this earnings release includes the GAAP to Non-GAAP reconciliation between reported and adjusted diluted earnings per share.

GAAP pre-tax income of $220 million in the fourth quarter of 2019, compared to a pre-tax income of $201 million in the fourth quarter of 2018. Excluding the one-time items, adjusted pre-tax income of $221 million(1), up 8% from a pre-tax income of $205 million(1) in the fourth quarter of 2018.

Pre-tax margin of 10.8%, up 0.6 percentage points from a pre-tax margin of 10.2% in the fourth quarter of 2018. Adjusted pre-tax margin of 10.9%(1), a 0.5 percentage point increase year over year from a pre-tax margin of 10.4%(1), exclusive of the one-time costs.


Highlights from the Fourth Quarter 2019

Fourth quarter 2019 revenue per available seat mile (RASM) declined (2.7)% year over year. This decline is largely in-line with our updated guidance range of (3.5)% to (1.5)%.

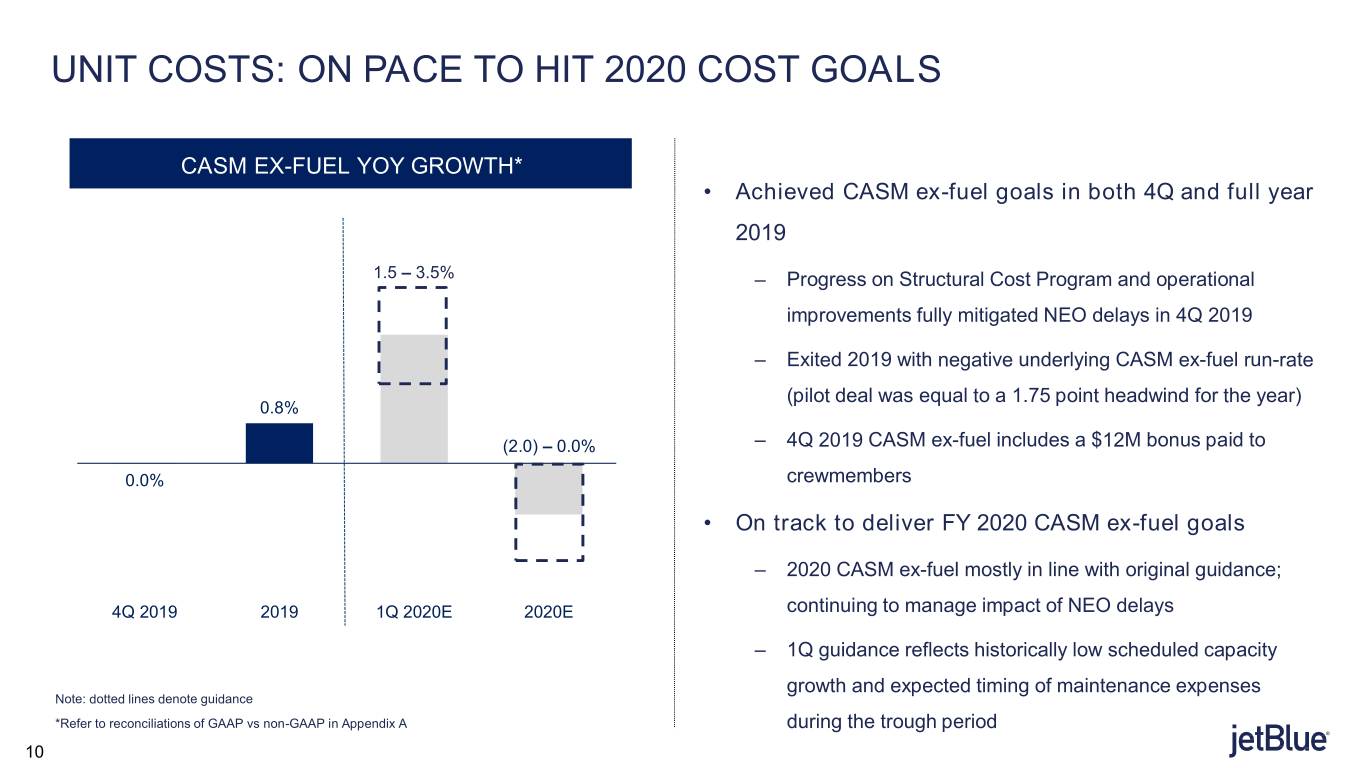
Operating expenses per available seat mile, excluding fuel (CASM ex-fuel)(1) was flat year over year, at the midpoint of our guidance range of (1.0)% to 1.0%. This was mainly driven by the compounding benefits of the Structural Cost Program.


Key Guidance for the First Quarter and Full Year 2020:

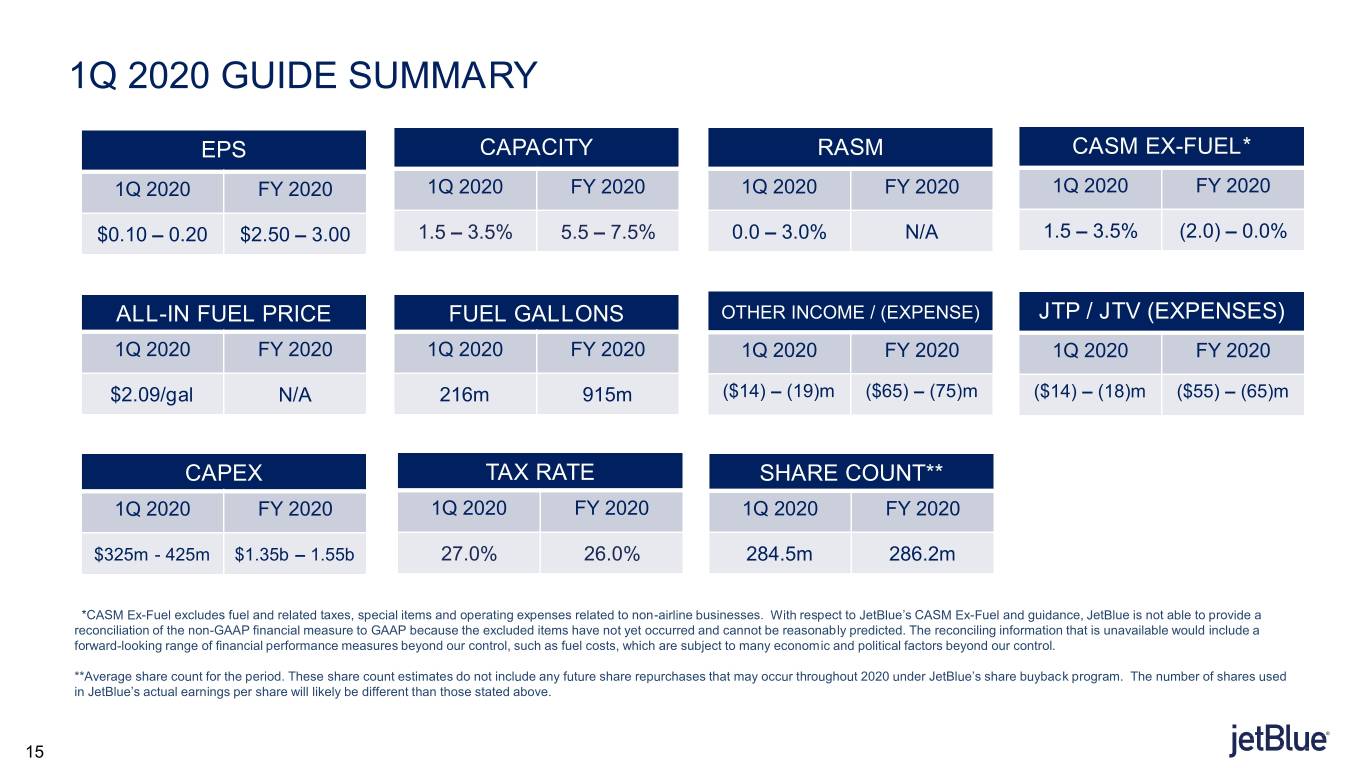
Earnings per share is expected to range between $0.10 and $0.20 in the first quarter 2020. For the full year, JetBlue expects earnings per share to range between $2.50 and $3.00.

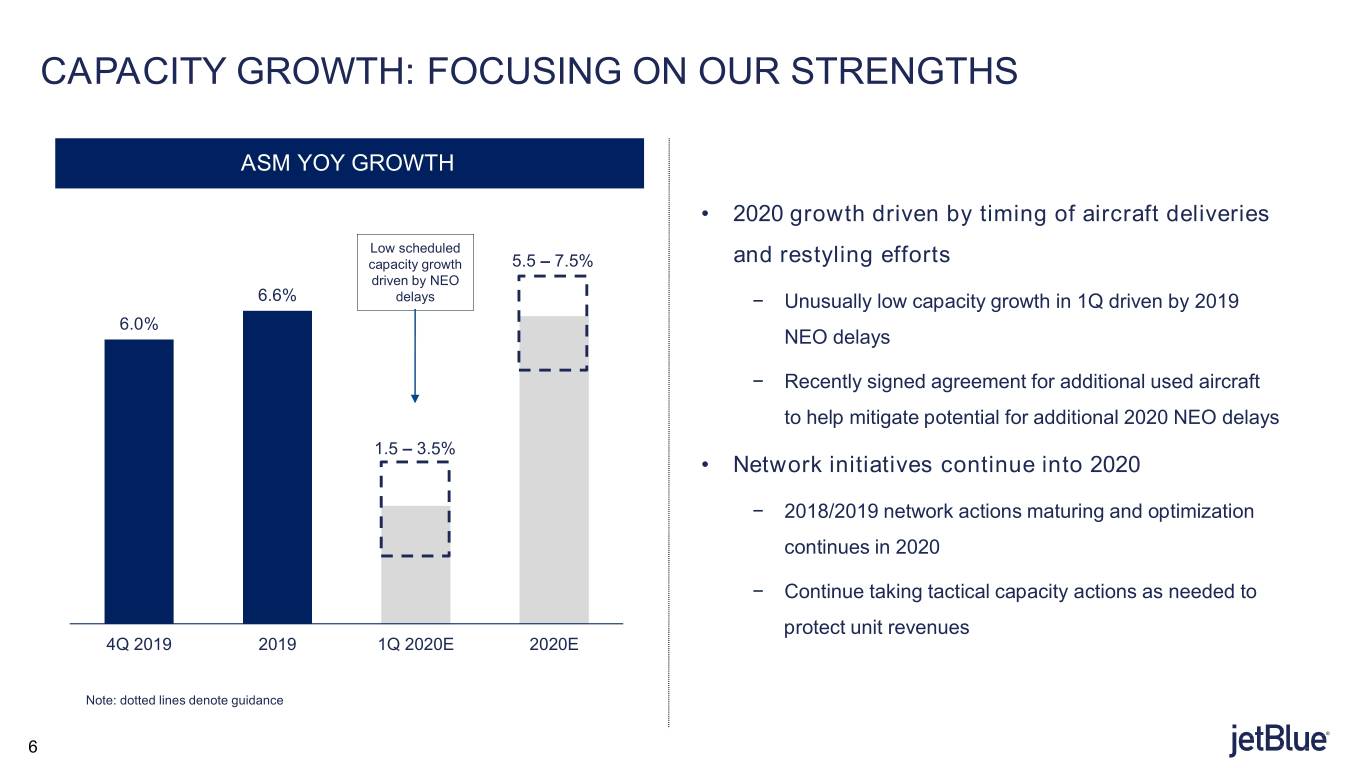
Capacity is expected to increase between 1.5% and 3.5% year over year in the first quarter 2020. For the full year 2020, JetBlue expects capacity to increase between 5.5% and 7.5%.

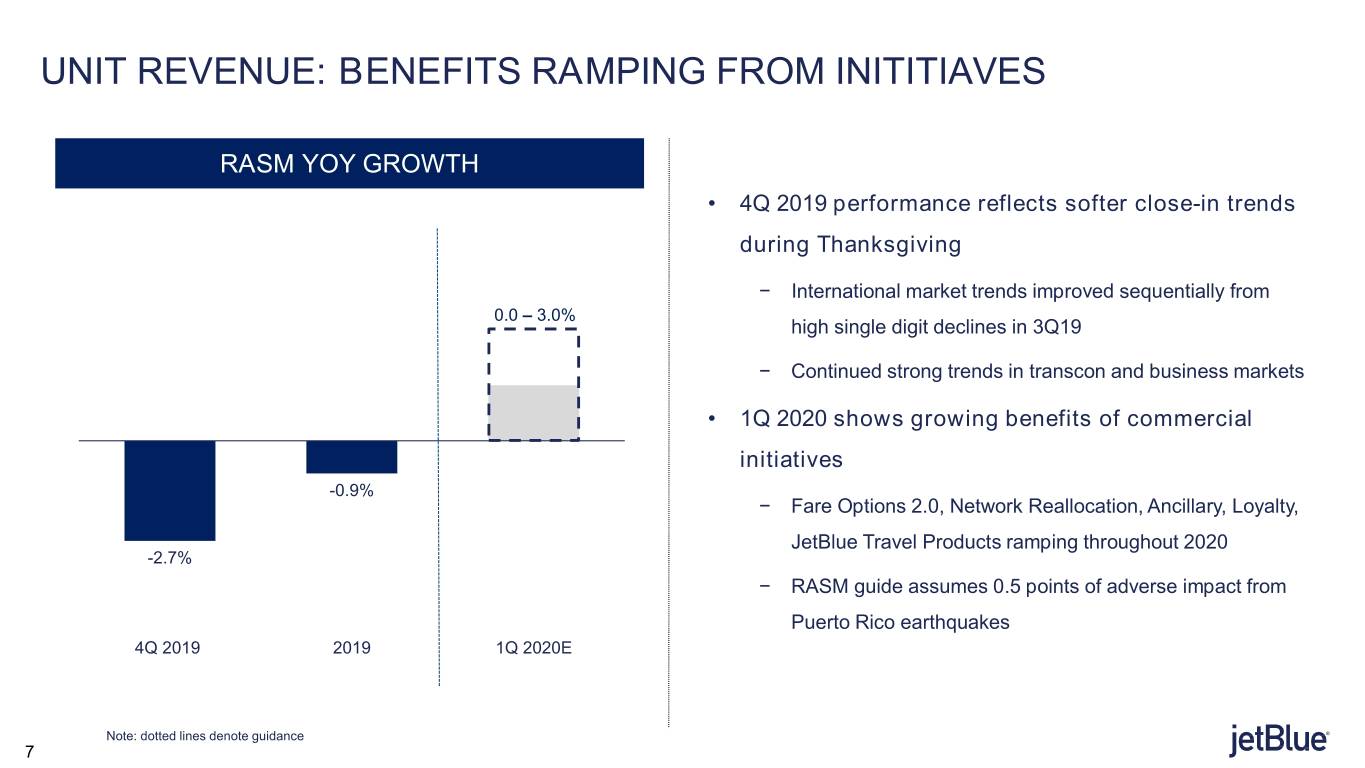
RASM growth is expected to range between 0.0% and 3.0% for the first quarter 2020 compared to the same period in 2019.

CASM ex-fuel is expected to increase between 1.5% and 3.5% for the first quarter of 2020. For the full year 2020, JetBlue expects year over year CASM ex-fuel growth to range between (2.0)% and 0.0%.

For further details see the latest Investor Update and the Fourth Quarter 2019 Earnings Presentation available via the internet at http://investor.jetblue.com.


- 1 -


JetBlue will conduct a conference call to discuss its quarterly earnings today, January 23, 2020 at 10:00 a.m. Eastern Time. A live broadcast of the conference call will also be available via the internet at http://investor.jetblue.com.


Executing our Plan to Reach our EPS Commitments

“I could not be prouder of the accomplishments of the JetBlue family over two decades. Over 20 years, we have become a “force for good” in our industry. We have worked hard to improve our balance sheet, expand and strengthen our network, and have made investments in our fleet to improve margins and returns. More recently, we focused our efforts to reset our cost structure - and return to our roots as a low-cost airline,” said Robin Hayes, JetBlue’s Chief Executive Officer.

“2019 saw an unusually volatile year in our Latin and Caribbean markets, which masked some of the progress we have made in our ‘building blocks’. We are confident in our plan to strengthen our RASM, and expect over two thirds of our revenue initiatives will mature throughout this year. Our progress is showing a significant sequential improvement in our expected RASM growth for the first quarter of 2020.

We are pleased that our business is responding to the actions we've been taking in our network, and this year we expect to continue reaping the benefits of our commercial actions. This gives us confidence in our ability to deliver our 2020 EPS goals.”

Revenue Performance and Outlook

“Our fourth quarter and full year 2019 capacity grew in the upper half of our guidance range due to improved completion factor, in addition to shifting the timing of our cabin restyling program to make up for NEO delivery delays,” said Joanna Geraghty, JetBlue’s President and Chief Operating Officer. “Our first quarter 2020 growth is unusually low, and our annual growth is over 2 points lower than our plan from our 2018 Investor Day, reflecting our current expectations of Airbus deliveries.

Our fourth quarter RASM decreased 2.7 percent year over year, in line with our December update range of (3.5) to (1.5) percent, driven by softer than expected close-in bookings for Thanksgiving peak.

For the first quarter, we expect strong sequential improvement in RASM in both our domestic and Latin markets, resulting from our capacity actions, our revenue initiatives, easier comps and lower scheduled growth. Our first quarter guidance of 0 to 3 percent includes a headwind of approximately one half point to our system RASM, due to earthquakes in Puerto Rico.”


Cost Performance, Outlook and Balance Sheet

“CASM ex-fuel for the fourth quarter was flat, in line with the mid-point of our guidance range, and for the full year CASM ex-fuel grew 0.8%, beating the mid-point of our initial full year guidance of 0 to 2 percent,” said Steve Priest, JetBlue’s EVP Chief Financial Officer.

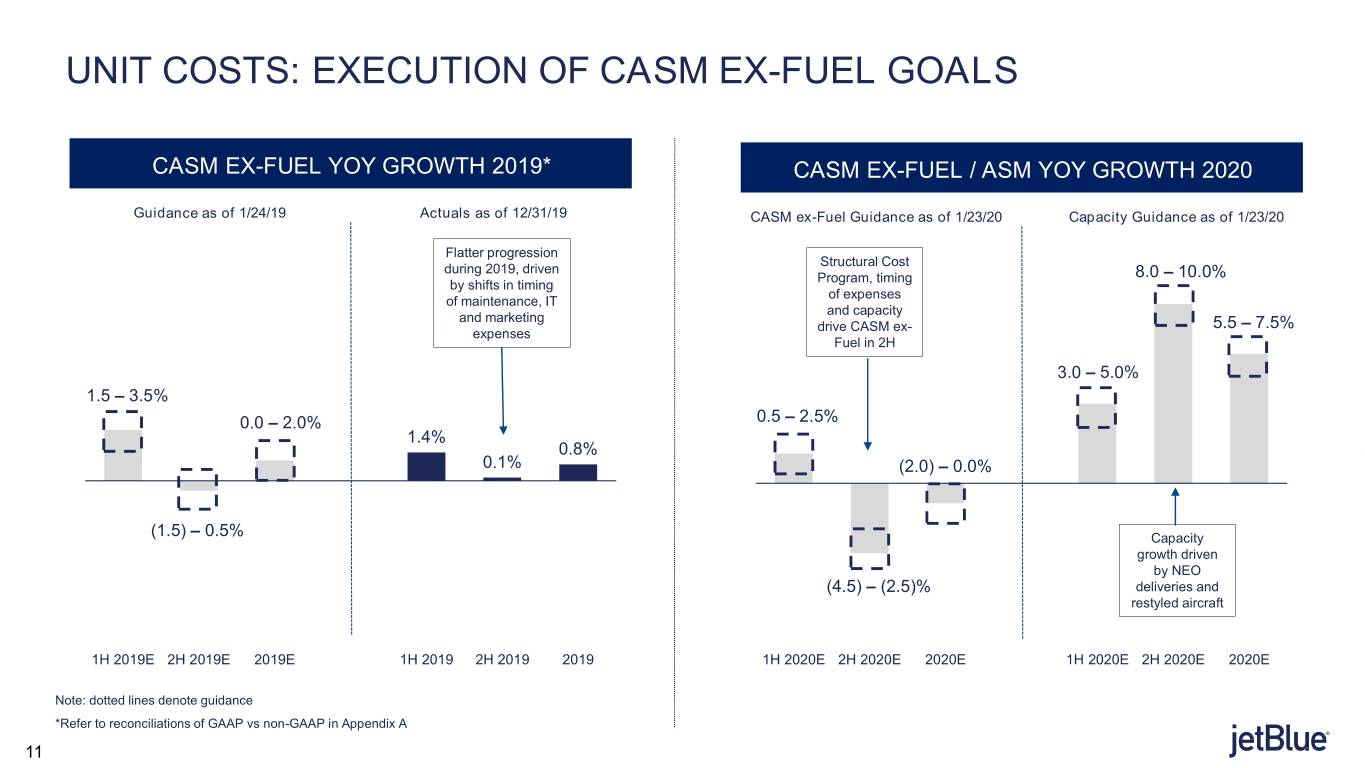
“For the first quarter of 2020, we expect CASM ex-fuel growth to range between 1.5 and 3.5 percent. The year over year progression in unit costs this quarter is mainly driven by unusually low scheduled capacity growth, given the timing of 2019 deliveries. In addition, we have scheduled maintenance events during the trough period that result in expenses shifting into the quarter.

Our updated 2020 CASM ex-Fuel guidance is now between minus (2) and 0 percent. We are pleased that despite the capacity constraints tied to the NEO delays, our 2020 goal is very much in line with

- 2 -


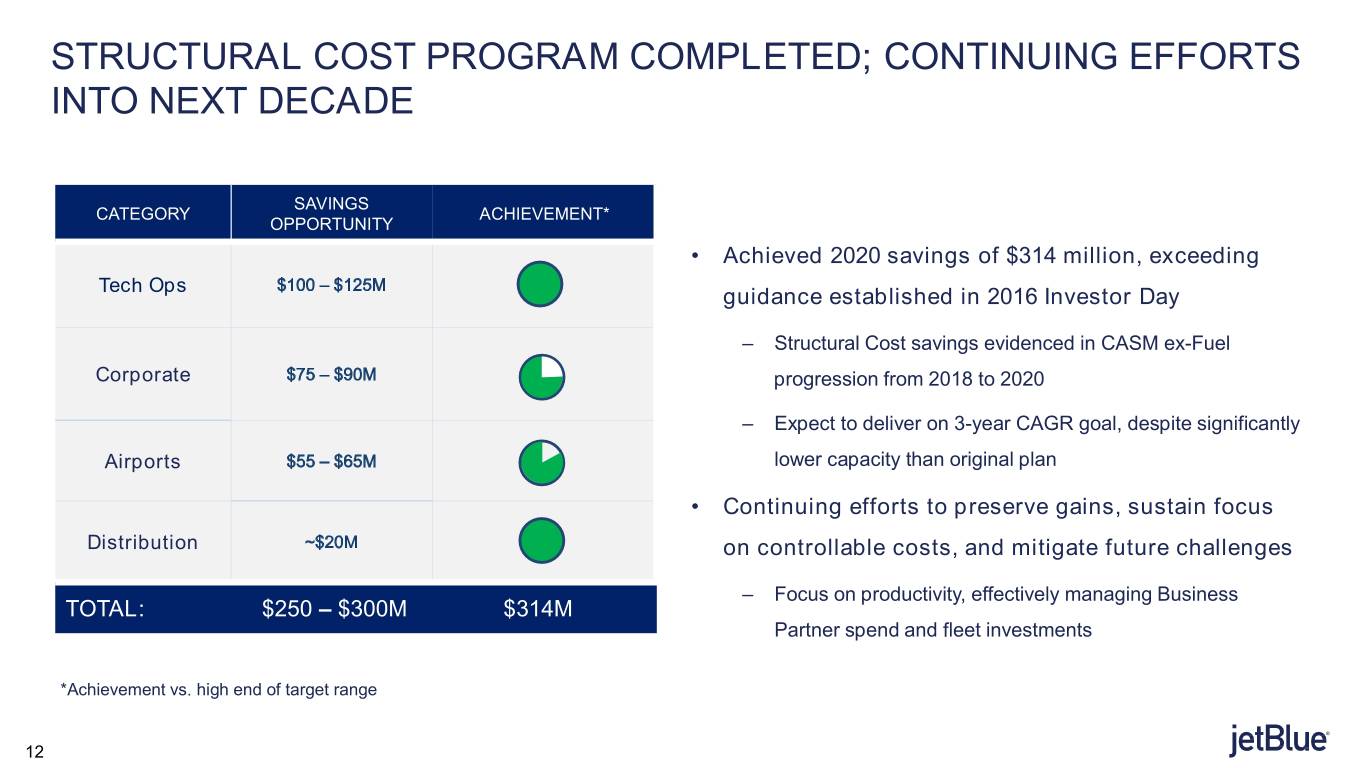
the original CASM-ex Fuel goal we announced at our last Investor Day. Furthermore, our 2020 plan reflects our commitment to deliver on our 3-year CAGR goal of 0 to 1 percent.”

Capital Allocation and Liquidity

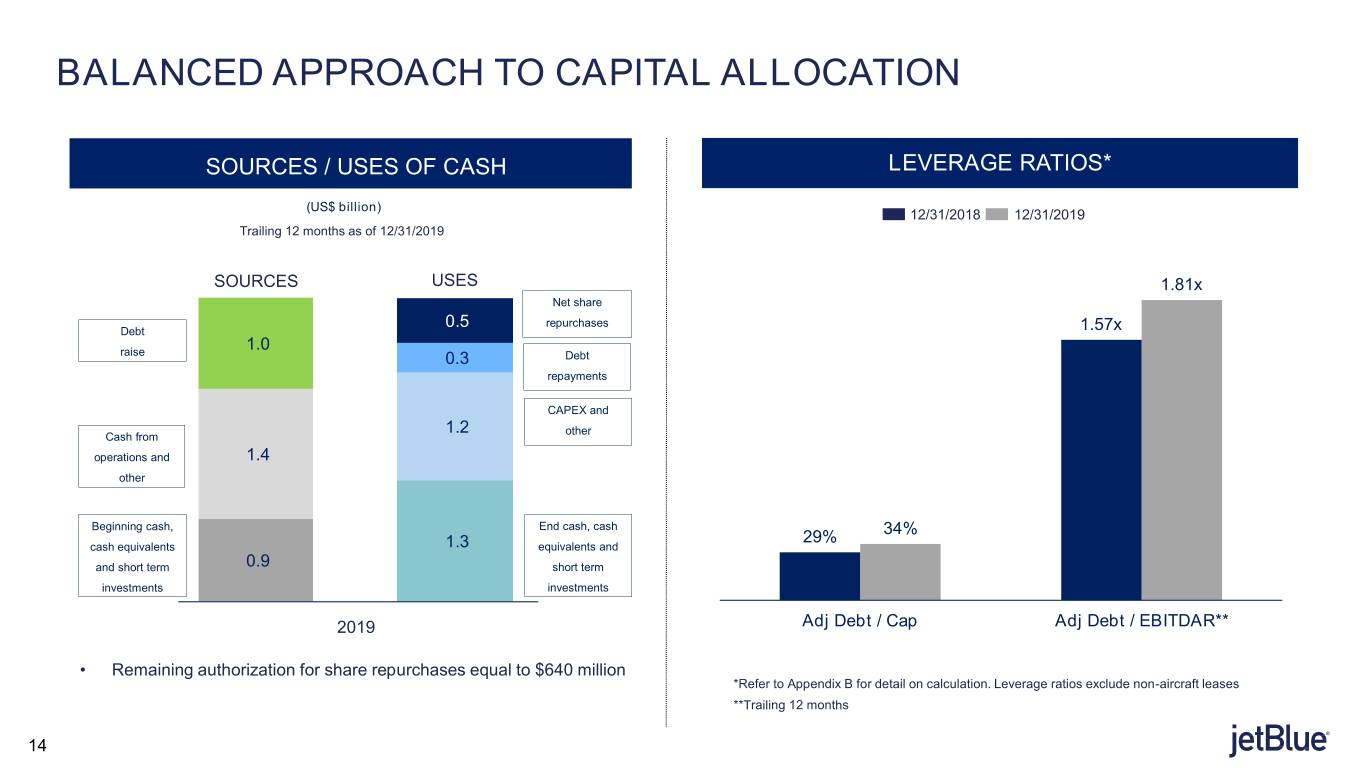
JetBlue ended the quarter with approximately $1.3 billion in unrestricted cash, cash equivalents, and short term investments, or 16.4% of trailing twelve month revenue. JetBlue repaid $65 million in regularly scheduled debt and capital lease obligations during the fourth quarter of 2019.

Fuel Expense and Hedging

The realized fuel price in the quarter was $2.07 per gallon, a 7.6% decline versus fourth quarter 2018 realized fuel price of $2.24.

JetBlue has entered into forward fuel derivative contracts to hedge its fuel consumption for the first and second quarters of 2020.  Based on the forward curve as of January 10th, JetBlue expects an average all-in price per gallon of fuel of $2.09 in the first quarter of 2020.


About JetBlue
JetBlue is New York's Hometown Airline®, and a leading carrier in Boston, Fort Lauderdale-Hollywood, Los Angeles (Long Beach), Orlando, and San Juan. JetBlue carries more than 42 million customers a year to nearly 100 cities in the U.S., Caribbean, and Latin America with an average of more than 1,000 daily flights. For more information, please visit jetblue.com.

Notes
(1)
Note A provides a reconciliation of non-GAAP financial measures used in this release and provides the reasons management uses those measures.


Forward Looking Statements
Statements in this earnings release contain various forward-looking statements within the meaning of Section 27A of the Securities Act of 1933, as amended, or the Securities Act, and Section 21E of the Securities Exchange Act of 1934, as amended, or the Exchange Act, which represent our management’s beliefs and assumptions concerning future events. When used in this document and in documents incorporated herein by reference, the words “expects,” “plans,” “anticipates,” “indicates,” “believes,” “forecast,” “guidance,” “outlook,” “may,” “will,” “should,” “seeks,” “targets” and similar expressions are intended to identify forward-looking statements. Forward-looking statements involve risks, uncertainties and assumptions, and are based on information currently available to us. Actual results may differ materially from those expressed in the forward-looking statements due to many factors, including, without limitation, our extremely competitive industry; volatility in financial and credit markets which could affect our ability to obtain debt and/or lease financing or to raise funds through debt or equity issuances; our significant fixed obligations and substantial indebtedness; volatility in fuel prices, maintenance costs and interest rates; our reliance on high daily aircraft utilization; our ability to implement our growth strategy; our ability to attract and retain qualified personnel and maintain our culture as we grow; our reliance on a limited number of suppliers, including for aircraft, aircraft engines and parts and vulnerability to delays by those suppliers; our dependence on the New York and Boston metropolitan markets and the effect of increased congestion in these markets; our reliance on automated systems and technology; our being subject to potential unionization, work stoppages, slowdowns or increased labor costs; our presence in some international emerging markets that may experience political or economic instability or may subject us to legal risk; reputational and business risk from information security breaches or cyber-attacks; changes in or additional domestic or foreign government regulation, including new or increased tariffs; changes in our industry due to other airlines' financial condition;

- 3 -


acts of war or terrorism; global economic conditions or an economic downturn leading to a continuing or accelerated decrease in demand for air travel; the spread of infectious diseases; adverse weather conditions or natural disasters; and external geopolitical events and conditions. It is routine for our internal projections and expectations to change as the year or each quarter in the year progresses, and therefore it should be clearly understood that the internal projections, beliefs and assumptions upon which we base our expectations may change prior to the end of each quarter or year.

Given the risks and uncertainties surrounding forward-looking statements, you should not place undue reliance on these statements. Further information concerning these and other factors is contained in the Company's Securities and Exchange Commission filings, including but not limited to, the Company's 2018 Annual Report on Form 10-K and its Quarterly Reports on Form 10-Q. In light of these risks and uncertainties, the forward-looking events discussed in this release might not occur. Our forward-looking statements speak only as of the date of this release. Other than as required by law, we undertake no obligation to update or revise forward-looking statements, whether as a result of new information, future events, or otherwise.

This release also includes certain “non-GAAP financial measures” as defined under the Exchange Act and in accordance with Regulation G. We have included reconciliations of these non-GAAP financial measures to the most directly comparable financial measures calculated and provided in accordance with U.S. GAAP within this release.


- 4 -


JETBLUE AIRWAYS CORPORATION
CONSOLIDATED STATEMENTS OF OPERATIONS
(in millions, except per share amounts)
(unaudited)


Three Months Ended


Twelve Months Ended


December 31,
 
Percent
 
December 31,
 
Percent
 
 
2019
 
2018(1)
 
Change
 
2019
 
2018(1)
 
Change
 
OPERATING REVENUES


Passenger
$
1,948

 
$
1,891

 
3.0

 
$
7,786

 
$
7,381

 
5.5

 
Other
83

 
77

 
6.3

 
308

 
277

 
11.0

 
Total operating revenues
2,031

 
1,968

 
3.2

 
8,094

 
7,658

 
5.7


OPERATING EXPENSES


Aircraft fuel and related taxes
455

 
476

 
(4.6
)
 
1,847

 
1,899

 
(2.7
)
 
Salaries, wages and benefits
589

 
543

 
8.4

 
2,320

 
2,044

 
13.5

 
Landing fees and other rents
112

 
108

 
4.8

 
474

 
462

 
2.6

 
Depreciation and amortization
140

 
123

 
13.7

 
525

 
469

 
12.1

 
Aircraft rent
23

 
28

 
(18.5
)
 
99

 
104

 
(5.1
)
 
Sales and marketing
75

 
79

 
(5.1
)
 
290

 
294

 
(1.1
)
 
Maintenance, materials and repairs
137

 
128

 
7.4

 
619

 
625

 
(1.0
)
 
Other operating expenses
272

 
263

 
3.5

 
1,106

 
1,060

 
4.2

 
Special items
1

 
4

 
(82.9
)
 
14

 
435

 
(96.7
)
 
Total operating expenses
1,804

 
1,752

 
3.0

 
7,294

 
7,392

 
(1.3
)


OPERATING INCOME
227

 
216

 
4.9

 
800

 
266

 
200.1


Operating margin
11.2
%
 
11.0
%
 
0.2

pts.
9.9
%
 
3.5
%
 
6.4

pts.


OTHER INCOME (EXPENSE)


Interest expense
(22
)
 
(20
)
 
10.3

 
(79
)
 
(70
)
 
13.5

 
Capitalized interest
4

 
3

 
42.3

 
14

 
10

 
40.9

 
Gain on equity method investments


 n/a

 
15


 n/a

 
Interest income and other
11

 
2

 
519.8

 
18

 
13

 
42.3

 
Total other income (expense)
(7
)
 
(15
)
 
55.7

 
(32
)
 
(47
)
 
32.6


INCOME BEFORE INCOME TAXES
220

 
201

 
9.6

 
768

 
219

 
250.2


Pre-tax margin
10.8
%
 
10.2
%
 
0.6

pts.
9.5
%
 
2.9
%
 
6.6

pts.


Income tax expense
59

 
31

 
89.1

 
199

 
30

 
552.2


NET INCOME
$
161

 
$
170

 
(4.9
)
 
$
569

 
$
189

 
201.4


EARNINGS PER COMMON SHARE:


Basic
$
0.56

 
$
0.55


$
1.92

 
$
0.60


Diluted
$
0.56

 
$
0.55


$
1.91

 
$
0.60


WEIGHTED AVERAGE SHARES OUTSTANDING:


Basic
285.8

 
306.1


296.6

 
312.9


Diluted
287.9

 
307.8


298.4

 
314.5


(1) Prior period results have been recast to reflect the adoption of ASC 842 Leases.


- 5 -


JETBLUE AIRWAYS CORPORATION
COMPARATIVE OPERATING STATISTICS
(unaudited)


Three Months Ended


Twelve Months Ended


December 31,
 
Percent
 
December 31,
 
Percent
 
 
2019
 
2018
 
Change
 
2019
 
2018
 
Change
 
Revenue passengers (thousands)
10,476

 
10,296

 
1.7

 
42,728

 
42,150

 
1.4

 
Revenue passenger miles (millions)
13,171

 
12,519

 
5.2

 
53,617

 
50,790

 
5.6

 
Available seat miles (ASMs) (millions)
16,079

 
15,168

 
6.0

 
63,841

 
59,881

 
6.6

 
Load factor
81.9
%
 
82.5
%
 
(0.6
)
pts.
84.0
%
 
84.8
%
 
(0.8
)
pts.
Aircraft utilization (hours per day)
11.6

 
11.5

 
0.9

 
11.9

 
11.8

 
0.8


Average fare
$
185.96

 
$
183.62

 
1.3

 
$
182.23

 
$
175.11

 
4.1

 
Yield per passenger mile (cents)
14.79

 
15.10

 
(2.1
)
 
14.52

 
14.53

 
(0.1
)
 
Passenger revenue per ASM (cents)
12.12

 
12.46

 
(2.8
)
 
12.20

 
12.33

 
(1.1
)
 
Revenue per ASM (cents)
12.63

 
12.98

 
(2.7
)
 
12.68

 
12.79

 
(0.9
)
 
Operating expense per ASM (cents)(2)
11.22

 
11.55

 
(2.9
)
 
11.43

 
12.34

 
(7.4
)
 
Operating expense per ASM, excluding fuel (cents)(1)(2)
8.31

 
8.31


8.44

 
8.37

 
0.8


Departures
91,888

 
91,766

 
0.1

 
368,355

 
366,619

 
0.5

 
Average stage length (miles)
1,142

 
1,105

 
3.3

 
1,140

 
1,096

 
4.0

 
Average number of operating aircraft during period
255.2

 
250.2

 
2.0

 
253.6

 
246.8

 
2.8

 
Average fuel cost per gallon, including fuel taxes
$
2.07

 
$
2.24

 
(7.6
)
 
$
2.09

 
$
2.24

 
(6.7
)
 
Fuel gallons consumed (millions)
219

 
212

 
3.2

 
885

 
849

 
4.3

 
Average number of full-time equivalent crewmembers


18,535

 
17,766


(1) Refer to Note A at the end of our Earnings Release for more information on this non-GAAP financial measure. Operating expense per available seat mile, excluding fuel (“CASM Ex-Fuel”) excludes fuel and related taxes, other non-airline operating expenses, and special items.


(2) Recast to reflect the adoption of ASC 842 Leases.


- 6 -


JETBLUE AIRWAYS CORPORATION
SELECTED CONSOLIDATED BALANCE SHEET DATA
(in millions)
 
December 31,
 
December 31,
 
2019
 
2018
 
(unaudited)
 
 
Cash and cash equivalents
$
929

 
$
474

Total investment securities
402

 
416

Total assets(1)
11,918

 
10,959

Total debt
2,334

 
1,670

Stockholders' equity(1)
4,799

 
4,685


(1) Prior period results have been recast to reflect the adoption of ASC 842 Leases.

- 7 -


Note A - Non-GAAP Financial Measures

JetBlue sometimes uses non-GAAP financial measures in this press release. Non-GAAP financial measures are financial measures that are derived from the consolidated financial statements, but that are not presented in accordance with generally accepted accounting principles in the United States, or GAAP. We believe these non-GAAP financial measures provide a meaningful comparison of our results to others in the airline industry and our prior year results. Investors should consider these non-GAAP financial measures in addition to, and not as a substitute for, our financial performance measures prepared in accordance with GAAP. Further, our non-GAAP information may be different from the non-GAAP information provided by other companies. The information below provides an explanation of each non-GAAP financial measure and shows a reconciliation of non-GAAP financial measures used in this press release to the most directly comparable GAAP financial measures.


- 8 -


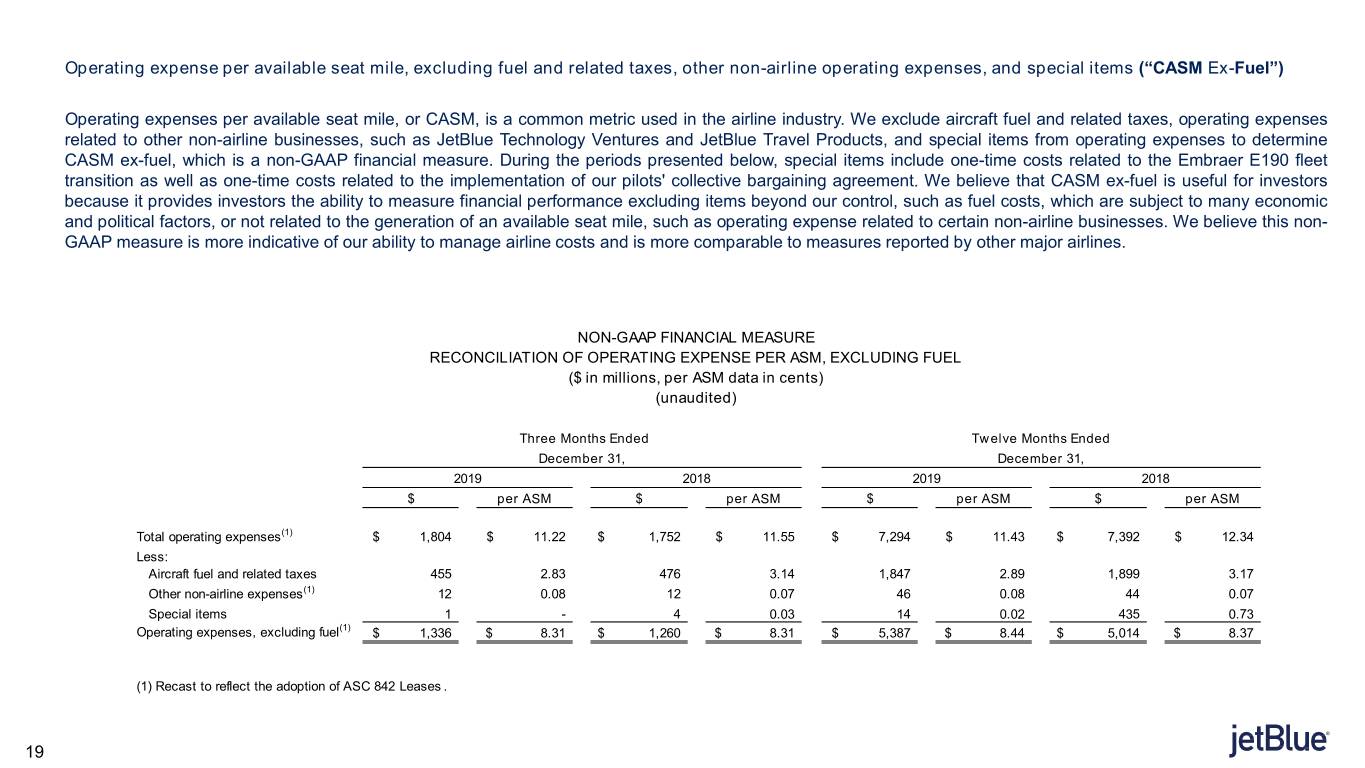
Operating expense per available seat mile, excluding fuel and related taxes, other non-airline operating expenses, and special items (“CASM Ex-Fuel”)

Operating expenses per available seat mile, or CASM, is a common metric used in the airline industry. We exclude aircraft fuel and related taxes, operating expenses related to other non-airline businesses, such as JetBlue Technology Ventures and JetBlue Travel Products, and special items from operating expenses to determine CASM ex-fuel, which is a non-GAAP financial measure. During the periods presented below, special items include one-time costs related to the Embraer E190 fleet transition as well as one-time costs related to the implementation of our pilots' collective bargaining agreement. We believe that CASM ex-fuel is useful for investors because it provides investors the ability to measure financial performance excluding items beyond our control, such as fuel costs, which are subject to many economic and political factors, or not related to the generation of an available seat mile, such as operating expense related to certain non-airline businesses. We believe this non-GAAP measure is more indicative of our ability to manage airline costs and is more comparable to measures reported by other major airlines.


NON-GAAP FINANCIAL MEASURE
RECONCILIATION OF OPERATING EXPENSE PER ASM, EXCLUDING FUEL
($ in millions, per ASM data in cents)
(unaudited)


 Three Months Ended
 
Twelve Months Ended
 
December 31,
 
December 31,
 
2019
 
2018
 
2019
 
2018
 
$
 
per ASM
 
$
 
per ASM
 
$
 
per ASM
 
$
 
per ASM


Total operating expenses(1)
$
1,804

 
$
11.22

 
$
1,752

 
$
11.55

 
$
7,294

 
$
11.43

 
$
7,392

 
$
12.34

Less:


Aircraft fuel and related taxes
455

 
2.83

 
476

 
3.14

 
1,847

 
2.89

 
1,899

 
3.17

Other non-airline expenses(1)
12

 
0.08

 
12

 
0.07

 
46

 
0.08

 
44

 
0.07

Special items
1


4

 
0.03

 
14

 
0.02

 
435

 
0.73

Operating expenses, excluding fuel(1)
$
1,336

 
$
8.31

 
$
1,260

 
$
8.31

 
$
5,387

 
$
8.44

 
$
5,014

 
$
8.37


(1) Recast to reflect the adoption of ASC 842 Leases.


- 9 -


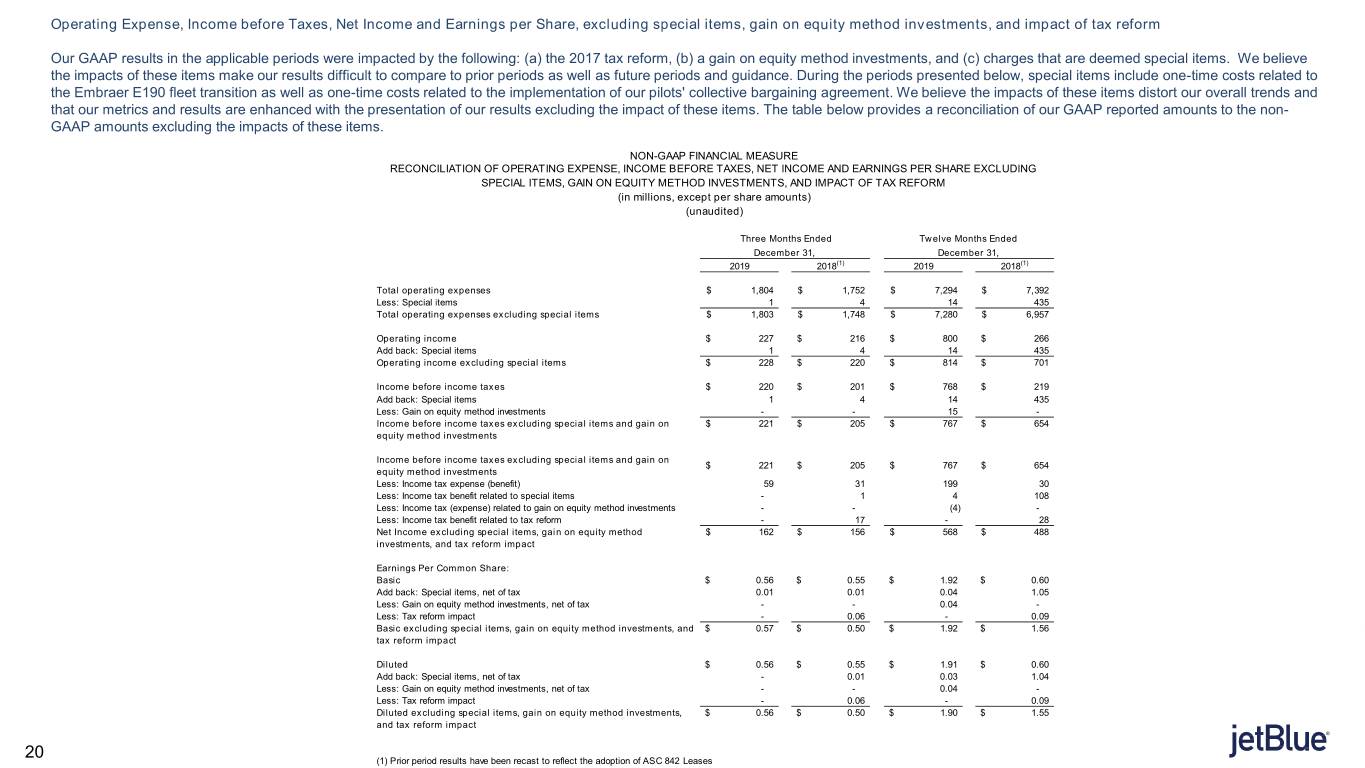
Operating Expense, Income before Taxes, Net Income and Earnings per Share, excluding special items, gain on equity method investments, and impact of tax reform

Our GAAP results in the applicable periods were impacted by the following: (a) the 2017 tax reform, (b) a gain on equity method investments, and (c) charges that are deemed special items. We believe the impacts of these items make our results difficult to compare to prior periods as well as future periods and guidance. During the periods presented below, special items include one-time costs related to the Embraer E190 fleet transition as well as one-time costs related to the implementation of our pilots' collective bargaining agreement. We believe the impacts of these items distort our overall trends and that our metrics and results are enhanced with the presentation of our results excluding the impact of these items. The table below provides a reconciliation of our GAAP reported amounts to the non-GAAP amounts excluding the impacts of these items.
NON-GAAP FINANCIAL MEASURE
RECONCILIATION OF OPERATING EXPENSE, INCOME BEFORE TAXES, NET INCOME AND EARNINGS PER SHARE EXCLUDING SPECIAL ITEMS, GAIN ON EQUITY METHOD INVESTMENTS, AND IMPACT OF TAX REFORM
(in millions, except per share amounts)
(unaudited)


 Three Months Ended
 
Twelve Months Ended
 
December 31,
 
December 31,
 
2019
 
2018(1)
 
2019
 
2018(1)
Total operating expenses
$
1,804

 
$
1,752

 
$
7,294

 
$
7,392

Less: Special items
1

 
4

 
14

 
435

Total operating expenses excluding special items
$
1,803

 
$
1,748

 
$
7,280

 
$
6,957


Operating income
$
227

 
$
216

 
$
800

 
$
266

Add back: Special items
1

 
4

 
14

 
435

Operating income excluding special items
$
228

 
$
220

 
$
814

 
$
701


Income before income taxes
$
220

 
$
201

 
$
768

 
$
219

Add back: Special items
1

 
4

 
14

 
435

Less: Gain on equity method investments


15


Income before income taxes excluding special items and gain on equity method investments
$
221

 
$
205

 
$
767

 
$
654


Income before income taxes excluding special items and gain on equity method investments
$
221

 
$
205

 
$
767

 
$
654

Less: Income tax expense
59

 
31

 
199

 
30

Less: Income tax benefit related to special items

 
1

 
4

 
108

Less: Income tax (expense) related to gain on equity method investments


(4
)
 

Less: Income tax benefit related to tax reform

 
17


28

Net Income excluding special items, gain on equity method investments, and tax reform impact
$
162

 
$
156

 
$
568

 
$
488


Earnings Per Common Share:


Basic
$
0.56

 
$
0.55

 
$
1.92

 
$
0.60

Add back: Special items, net of tax
0.01

 
0.01

 
0.04

 
1.05

Less: Gain on equity method investments, net of tax


0.04


Less: Tax reform impact

 
0.06


0.09

Basic excluding special items, gain on equity method investments, and tax reform impact
$
0.57

 
$
0.50

 
$
1.92

 
$
1.56


Diluted
$
0.56

 
$
0.55

 
$
1.91

 
$
0.60

Add back: Special items, net of tax

 
0.01

 
0.03

 
1.04

Less: Gain on equity method investments, net of tax


0.04


Less: Tax reform impact

 
0.06


0.09

Diluted excluding special items, gain on equity method investments, and tax reform impact
$
0.56

 
$
0.50

 
$
1.90

 
$
1.55


(1) Prior period results have been recast to reflect the adoption of ASC 842 Leases.


- 10 -


Return on Invested Capital

Return on invested capital, or ROIC, is an important financial metric, which we believe provides meaningful information as to how well we generate returns relative to the capital invested in our business. We believe this non-GAAP measure provides a meaningful comparison of our results to the airline industry and our prior year results.

NON-GAAP FINANCIAL MEASURE
RECONCILIATION OF RETURN ON INVESTED CAPITAL
(in millions) (unaudited)


Twelve Months Ended
 
December 31,
 
2019
 
2018(1)
Operating income
$
800

 
$
266

     Add: Interest income
19

 
11

     Add: Interest component of aircraft lease commitments (1)
17

 
22

     Add: Special items (2)
14

 
435

Subtotal
850

 
734

     Less: Income tax expense impact
219

 
186

Operating Income After Tax, Adjusted
631

 
548


Average stockholders' equity
$
4,710

 
$
4,660

Average total debt
1,735

 
1,389

Average aircraft lease commitments
229

 
287

Invested Capital
6,674

 
6,336


Return on Invested Capital
9.5
%
 
8.6
%


(1) Interest component of aircraft lease commitments


Average aircraft lease commitments
229

 
287

Interest component of aircraft lease commitments (Imputed interest at 7.5%)
17

 
22


(2) Special items include one-time costs related to the Embraer E190 fleet transition as well as one-time costs related to the implementation of our pilots' collective bargaining agreement.


(3) Prior period results have been recast to reflect the adoption of ASC 842 Leases.


CONTACTS
JetBlue Investor Relations
Tel: +1 718 709 2202
[email protected]

JetBlue Corporate Communications
Tel: +1 718 709 3089

[email protected]

- 11 -

jetblue-logob76.jpg Investor Update


Investor Update: January 23, 2020

This update provides JetBlue’s investor guidance for the first quarter ending March 31, 2020 and full year 2020.


First Quarter and Full-Year 2020 Outlook
Estimated 1Q 2020
Estimated FY 2020
Earnings Per Share
$0.10 - $0.20
$2.50 - $3.00
Capacity and Revenue
 
 
Available Seat Miles (ASMs) Year-Over-Year
1.5 - 3.5%
5.5 - 7.5%
Revenue per Available Seat Mile Year-Over-Year
0.0 - 3.0%
N/A
Expense
 
 
CASM Ex-Fuel1 (Non-GAAP) Year-Over-Year
1.5 - 3.5%
(2.0) - 0.0%
Operating (Expenses) Related to Other Non-Airline Businesses
($14) - ($18) million
($55) - ($65) million
Estimated Fuel Consumption (gallons)
216 million
915 million
Estimated Fuel Price per Gallon, Net of Hedges2
$2.093
N/A
Other Income (Expense) (Non-GAAP)
($14) - ($19) million
($65) - ($75) million
Tax Rate
~27.0%
~26.0%
Diluted Share Count (excluding future share repurchases)4
284.5 million
286.2 million
Capital Expenditures
$325 - $425 million
$1.35 - $1.55 billion

1 CASM Ex-Fuel excludes fuel and related taxes, special items and operating expenses related to non-airline businesses. With respect to JetBlue’s CASM Ex-Fuel and guidance, JetBlue is not able to provide a reconciliation of the non-GAAP financial measure to GAAP because the excluded items have not yet occurred and cannot be reasonably predicted. The reconciling information that is unavailable would include a forward-looking range of financial performance measures beyond our control, such as fuel costs, which are subject to many economic and political factors beyond our control.
2 Includes fuel taxes.
3 JetBlue utilizes the forward Brent crude curve and the forward Brent crude to heating oil crack spread to calculate the unhedged portion of its prompt quarter. As of January 10, 2020, the forward Brent crude per barrel price was $65 and the crack spread averaged $17 per barrel for the first quarter of 2020.
4 Average share count for the period. These share count estimates do not include any future share repurchases that may occur throughout 2020 under JetBlue’s share buyback program. The number of shares used in JetBlue’s actual earnings per share will likely be different than those stated above.


1
JetBlue Airways Investor Relations • (718) 709-2202 • [email protected]

jetblue-logob76.jpg Investor Update


Fuel Hedges

As of January 10, 2020 JetBlue’s advanced fuel derivative contracts are as follows:


Fuel
Hedges
Gallons
Estimated % of Consumption
Price
Q1 2020
44 million
20.3%
20.3% in USGC Jet bull call spreads at an average strike price of $1.88/gal x $2.13/gal
Q2 2020
45 million
19.6%
19.6% in USGC Jet bull call spreads at an average strike price of $1.87/gal x $2.12/gal


Airbus Order Book

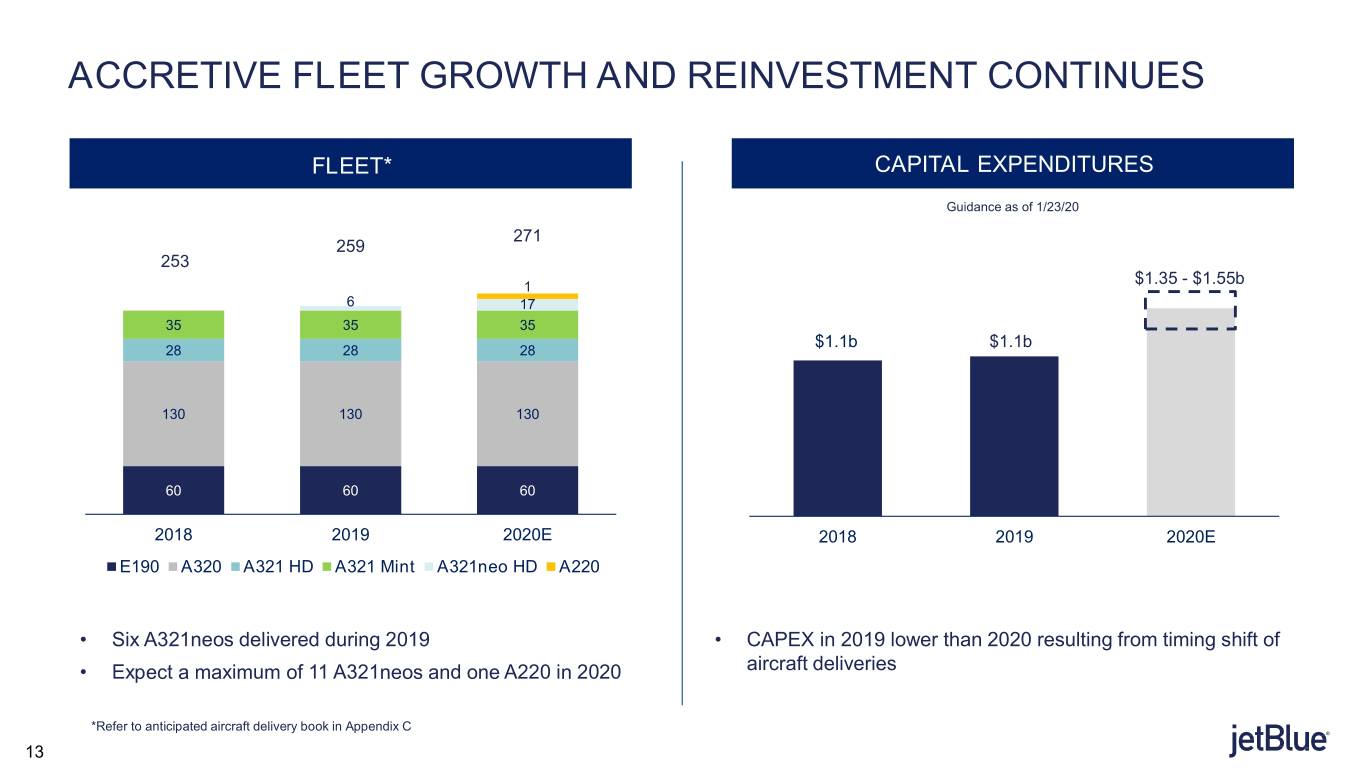
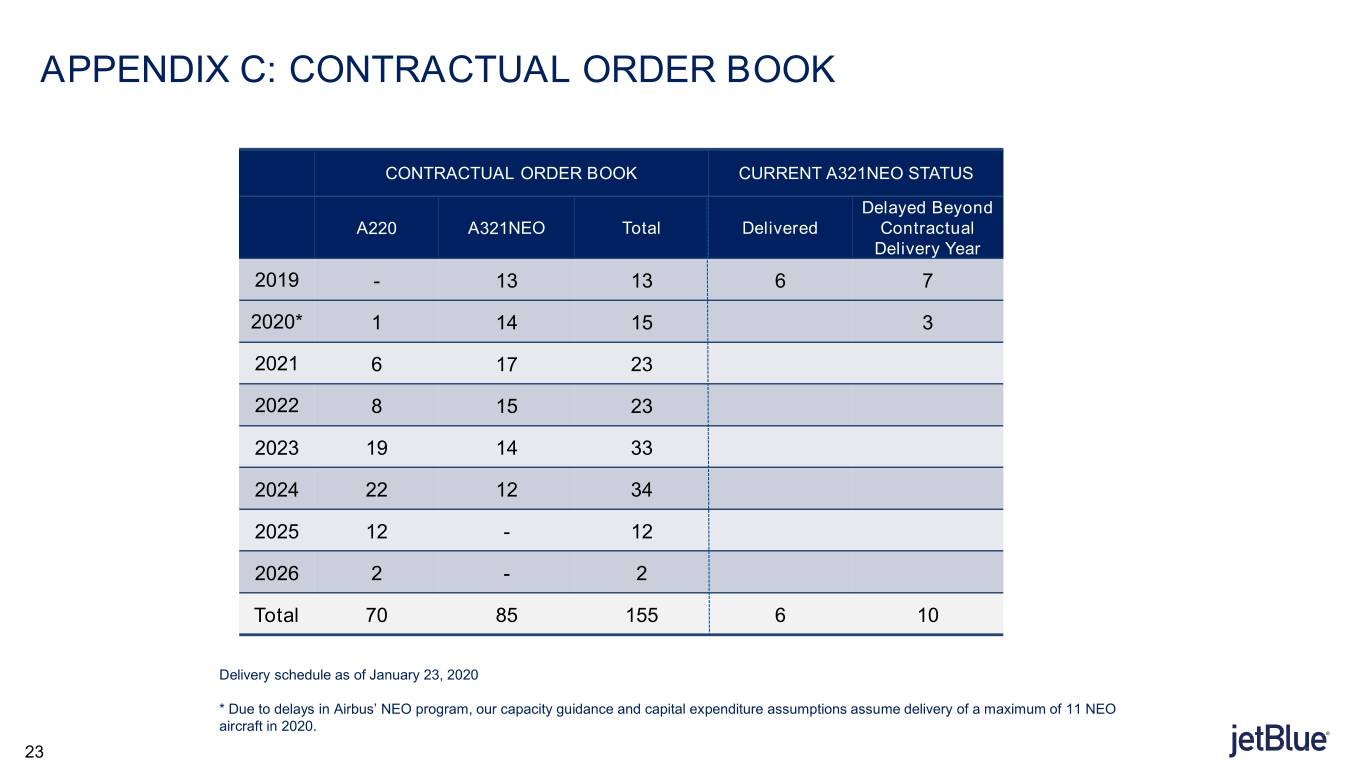
As of December 31, 2019 JetBlue’s fleet was comprised of 130 Airbus A320 aircraft, 28 Airbus A321 All-Core aircraft, 35 Airbus A321 Mint aircraft, 6 Airbus A321NEO All-Core aircraft, and 60 EMBRAER E190 aircraft, for a total of 259 aircraft.

JetBlue’s Airbus contractual order book and delivery status as of January 23, 2020:

 
Contractual Order Book
Current A321NEO Status
Year
A220
A321 NEO
Total
Delivered
Delayed Beyond Contractual Delivery Year
2019
13
13
6
7
2020*
1
14
15
 
3
2021
6
17
23
 
 
2022
8
15
23
 
 
2023
19
14
33
 
 
2024
22
12
34
 
 
2025
12
12
 
 
2026
2
2
 
 
Total
70
85
155
6
10

* Due to delays in Airbus’ NEO program, our capacity guidance and capital expenditure assumptions assume delivery of a maximum of 11 NEO aircraft in 2020


2
JetBlue Airways Investor Relations • (718) 709-2202 • [email protected]

jetblue-logob76.jpg Investor Update


Forward Looking Statements

Statements in this Investor Update (or otherwise made by JetBlue or on JetBlue’s behalf) contain various forward-looking statements within the meaning of Section 27A of the Securities Act of 1933, as amended, or the Securities Act, and Section 21E of the Securities Exchange Act of 1934, as amended, or the Exchange Act, which represent our management’s beliefs and assumptions concerning future events. When used in this document and in documents incorporated herein by reference, the words "expects," "plans," "anticipates," "indicates," "believes," "forecast," "guidance," "outlook," "may," "will," "should," "seeks," "targets" and similar expressions are intended to identify forward-looking statements. Forward-looking statements involve risks, uncertainties and assumptions, and are based on information currently available to us. Actual results may differ materially from those expressed in the forward-looking statements due to many factors, including, without limitation, our extremely competitive industry; volatility in financial and credit markets which could affect our ability to obtain debt and/or lease financing or to raise funds through debt or equity issuances; our significant fixed obligations and substantial indebtedness; volatility in fuel prices, maintenance costs and interest rates; our reliance on high daily aircraft utilization; our ability to implement our growth strategy; our ability to attract and retain qualified personnel and maintain our culture as we grow; our reliance on a limited number of suppliers, including for aircraft, aircraft engines and parts and vulnerability to delays by those suppliers; our dependence on the New York and Boston metropolitan markets and the effect of increased congestion in these markets; our reliance on automated systems and technology; our being subject to potential unionization, work stoppages, slowdowns or increased labor costs; our presence in some international emerging markets that may experience political or economic instability or may subject us to legal risk; reputational and business risk from information security breaches or cyber-attacks; changes in or additional domestic or foreign government regulation, including new or increased tariffs; changes in our industry due to other airlines' financial condition; acts of war or terrorism; global economic conditions or an economic downturn leading to a continuing or accelerated decrease in demand for air travel; the spread of infectious diseases; adverse weather conditions or natural disasters; and external geopolitical events and conditions. It is routine for our internal projections and expectations to change as the year or each quarter in the year progresses, and therefore it should be clearly understood that the internal projections, beliefs and assumptions upon which we base our expectations may change prior to the end of each quarter or year.

Given the risks and uncertainties surrounding forward-looking statements, you should not place undue reliance on these statements. Further information concerning these and other factors is contained in the Company's Securities and Exchange Commission filings, including but not limited to, the Company's 2018 Annual Report on Form 10-K and its Quarterly Reports on Form 10-Q. In light of these risks and uncertainties, the forward-looking events discussed in this Investor Update might not occur. Our forward-looking statements speak only as of the date of this Investor Update. Other than as required by law, we undertake no obligation to update or revise forward-looking statements, whether as a result of new information, future events, or otherwise.

This Investor Update also includes certain non-GAAP financial measures as defined under the Exchange Act and in accordance with Regulation G.


3
JetBlue Airways Investor Relations • (718) 709-2202 • [email protected]
4Q 2019 EARNINGS PRESENTATION JANUARY 23, 2020 1


SAFE HARBOR Statements in this presentation (or otherwise made by JetBlue or on JetBlue’s behalf) contain various forward-looking statements within the meaning of Section 27A of the Securities Act of 1933, as amended, or the Securities Act, and Section 21E of the Securities Exchange Act of 1934, as amended, or the Exchange Act, which represent our management’s beliefs and assumptions concerning future events. When used in this document and in documents incorporated herein by reference, the words “expects,” “plans,” “anticipates,” “indicates,” “believes,” “forecast,” “guidance,” “outlook,” “may,” “will,” “should,” “seeks,” “targets” and similar expressions are intended to identify forward-looking statements. Forward-looking statements involve risks, uncertainties and assumptions, and are based on information currently available to us. Actual results may differ materially from those expressed in the forward-looking statements due to many factors, including, without limitation, our extremely competitive industry; volatility in financial and credit markets which could affect our ability to obtain debt and/or lease financing or to raise funds through debt or equity issuances; our significant fixed obligations and substantial indebtedness; volatility in fuel prices, maintenance costs and interest rates; our reliance on high daily aircraft utilization; our ability to implement our growth strategy; our ability to attract and retain qualified personnel and maintain our culture as we grow; our reliance on a limited number of suppliers, including for aircraft, aircraft engines and parts and vulnerability to delays by those suppliers; our dependence on the New York and Boston metropolitan markets and the effect of increased congestion in these markets; our reliance on automated systems and technology; our being subject to potential unionization, work stoppages, slowdowns or increased labor costs; our presence in some international emerging markets that may experience political or economic instability or may subject us to legal risk; reputational and business risk from information security breaches or cyber- attacks; changes in or additional domestic or foreign government regulation, including new or increased tariffs; changes in our industry due to other airlines' financial condition; acts of war or terrorism; global economic conditions or an economic downturn leading to a continuing or accelerated decrease in demand for air travel; the spread of infectious diseases; adverse weather conditions or natural disasters; and external geopolitical events and conditions. It is routine for our internal projections and expectations to change as the year or each quarter in the year progresses, and therefore it should be clearly understood that the internal projections, beliefs and assumptions upon which we base our expectations may change prior to the end of each quarter or year. Given the risks and uncertainties surrounding forward-looking statements, you should not place undue reliance on these statements. Further information concerning these and other factors is contained in the Company's Securities and Exchange Commission filings, including but not limited to, the Company's 2018 Annual Report on Form 10-K and its Quarterly Reports on Form 10-Q. In light of these risks and uncertainties, the forward-looking events discussed in this presentation might not occur. Our forward-looking statements speak only as of the date of this presentation. Other than as required by law, we undertake no obligation to update or revise forward-looking statements, whether as a result of new information, future events, or otherwise. This presentation also includes certain “non-GAAP financial measures” as defined under the Exchange Act and in accordance with Regulation G. We have included reconciliations of these non-GAAP financial measures to the most directly comparable financial measures calculated and provided in accordance with U.S. GAAP within the Appendix A section of this presentation. 32


4Q 2019 EARNINGS UPDATE ROBIN HAYES CHIEF EXECUTIVE OFFICER


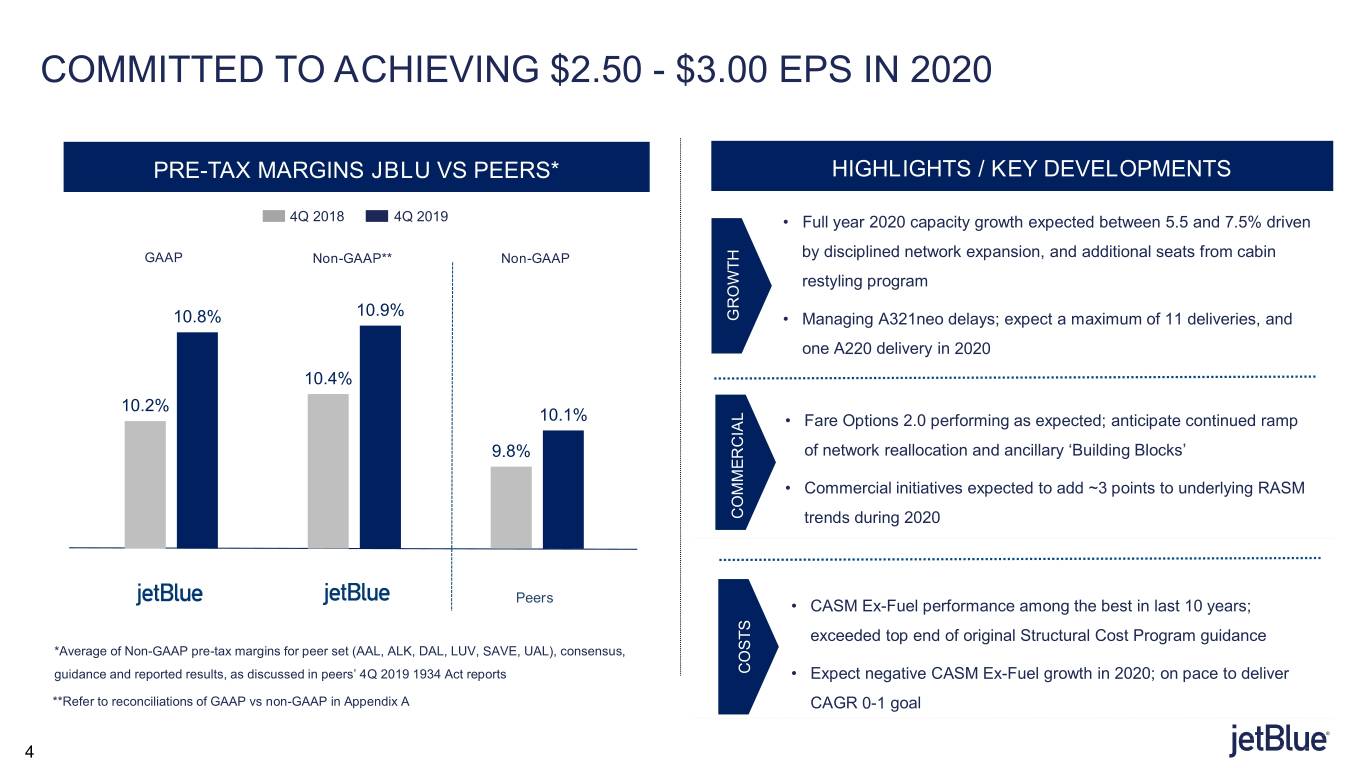
COMMITTED TO ACHIEVING $2.50 - $3.00 EPS IN 2020 PRE-TAX MARGINS JBLU VS PEERS* HIGHLIGHTS / KEY DEVELOPMENTS 4Q 2018 4Q 2019 • Full year 2020 capacity growth expected between 5.5 and 7.5% driven GAAP Non-GAAP** Non-GAAP by disciplined network expansion, and additional seats from cabin restyling program 10.9% 10.8% GROWTH • Managing A321neo delays; expect a maximum of 11 deliveries, and one A220 delivery in 2020 10.4% 10.2% 10.1% • Fare Options 2.0 performing as expected; anticipate continued ramp 9.8% of network reallocation and ancillary ‘Building Blocks’ • Commercial initiatives expected to add ~3 points to underlying RASM COMMERCIAL trends during 2020 Peers • CASM Ex-Fuel performance among the best in last 10 years; exceeded top end of original Structural Cost Program guidance *Average of Non-GAAP pre-tax margins for peer set (AAL, ALK, DAL, LUV, SAVE, UAL), consensus, guidance and reported results, as discussed in peers’ 4Q 2019 1934 Act reports COSTS • Expect negative CASM Ex-Fuel growth in 2020; on pace to deliver **Refer to reconciliations of GAAP vs non-GAAP in Appendix A CAGR 0-1 goal 44


COMMERCIAL UPDATE & OUTLOOK JOANNA GERAGHTY PRESIDENT & CHIEF OPERATING OFFICER


CAPACITY GROWTH: FOCUSING ON OUR STRENGTHS ASM YOY GROWTH • 2020 growth driven by timing of aircraft deliveries Low scheduled capacity growth 5.5 – 7.5% and restyling efforts driven by NEO 6.6% delays − Unusually low capacity growth in 1Q driven by 2019 6.0% NEO delays − Recently signed agreement for additional used aircraft to help mitigate potential for additional 2020 NEO delays 1.5 – 3.5% • Network initiatives continue into 2020 − 2018/2019 network actions maturing and optimization continues in 2020 − Continue taking tactical capacity actions as needed to protect unit revenues 4Q 2019 2019 1Q 2020E 2020E Note: dotted lines denote guidance 66


UNIT REVENUE: BENEFITS RAMPING FROM INITITIAVES RASM YOY GROWTH • 4Q 2019 performance reflects softer close-in trends during Thanksgiving − International market trends improved sequentially from 0.0 – 3.0% high single digit declines in 3Q19 − Continued strong trends in transcon and business markets • 1Q 2020 shows growing benefits of commercial initiatives -0.9% − Fare Options 2.0, Network Reallocation, Ancillary, Loyalty, JetBlue Travel Products ramping throughout 2020 -2.7% − RASM guide assumes 0.5 points of adverse impact from Puerto Rico earthquakes 4Q 2019 2019 1Q 2020E Note: dotted lines denote guidance 77


FINANCIAL UPDATE & OUTLOOK STEVE PRIEST CHIEF FINANCIAL OFFICER


BUILDING BLOCK INITIATIVES DRIVING MARGIN GAINS RASM CASM & CASM EX-FUEL* PRE-TAX MARGIN* EARNINGS PER SHARE* (US$ cents) (US$ cents) (US$ cents) 4Q 2019 4Q 2019 4Q 2019 4Q 2019 10.9% 12.98 0.56 0.56 12.63 10.8% 0.55 11.55 11.22 0.50 8.31 8.31 10.4% 10.2% CASM CASM (GAAP) (GAAP) (Non- (Non- CASM CASM (Non- (Non- Ex-Fuel Ex-Fuel GAAP) GAAP) (GAAP) (GAAP) GAAP) GAAP) 2018 2019 2018 2019 2018 2019 2018 2019 2018 2019 2018 2019 2018 2019 (GAAP) • YoY RASM impacted by • CASM progression driven by • Adjusted pre-tax margin • (GAAP)Non-GAAP Earnings per softer than expected close-in lower fuel, solid progress in increase of 0.5 points year Share growth of 12% year bookings for Thanksgiving non-fuel cost initiatives over year over year *Refer to reconciliations of GAAP vs non-GAAP in Appendix A 99


UNIT COSTS: ON PACE TO HIT 2020 COST GOALS CASM EX-FUEL YOY GROWTH* • Achieved CASM ex-fuel goals in both 4Q and full year 2019 1.5 – 3.5% ‒ Progress on Structural Cost Program and operational improvements fully mitigated NEO delays in 4Q 2019 ‒ Exited 2019 with negative underlying CASM ex-fuel run-rate (pilot deal was equal to a 1.75 point headwind for the year) 0.8% (2.0) – 0.0% ‒ 4Q 2019 CASM ex-fuel includes a $12M bonus paid to 0.0% crewmembers • On track to deliver FY 2020 CASM ex-fuel goals ‒ 2020 CASM ex-fuel mostly in line with original guidance; 4Q 2019 2019 1Q 2020E 2020E continuing to manage impact of NEO delays ‒ 1Q guidance reflects historically low scheduled capacity growth and expected timing of maintenance expenses Note: dotted lines denote guidance *Refer to reconciliations of GAAP vs non-GAAP in Appendix A during the trough period 10


UNIT COSTS: EXECUTION OF CASM EX-FUEL GOALS CASM EX-FUEL YOY GROWTH 2019* CASM EX-FUEL / ASM YOY GROWTH 2020 Guidance as of 1/24/19 Actuals as of 12/31/19 CASM ex-Fuel Guidance as of 1/23/20 Capacity Guidance as of 1/23/20 Flatter progression Structural Cost during 2019, driven Program, timing 8.0 – 10.0% by shifts in timing of expenses of maintenance, IT and capacity and marketing drive CASM ex- 5.5 – 7.5% expenses Fuel in 2H 3.0 – 5.0% 1.5 – 3.5% 0.0 – 2.0% 0.5 – 2.5% 1.4% 0.8% 0.1% (2.0) – 0.0% (1.5) – 0.5% Capacity growth driven by NEO (4.5) – (2.5)% deliveries and restyled aircraft 1H 2019E 2H 2019E 2019E 1H 2019 2H 2019 2019 1H 2020E 2H 2020E 2020E 1H 2020E 2H 2020E 2020E Note: dotted lines denote guidance *Refer to reconciliations of GAAP vs non-GAAP in Appendix A 11


STRUCTURAL COST PROGRAM COMPLETED; CONTINUING EFFORTS INTO NEXT DECADE SAVINGS CATEGORY ACHIEVEMENT* OPPORTUNITY • Achieved 2020 savings of $314 million, exceeding Tech Ops guidance established in 2016 Investor Day ‒ Structural Cost savings evidenced in CASM ex-Fuel Corporate progression from 2018 to 2020 ‒ Expect to deliver on 3-year CAGR goal, despite significantly Airports lower capacity than original plan • Continuing efforts to preserve gains, sustain focus Distribution on controllable costs, and mitigate future challenges ‒ Focus on productivity, effectively managing Business TOTAL: $250 – $300M $314M Partner spend and fleet investments *Achievement vs. high end of target range 12


ACCRETIVE FLEET GROWTH AND REINVESTMENT CONTINUES FLEET* CAPITAL EXPENDITURES Guidance as of 1/23/20 271 259 253 1 $1.35 - $1.55b 6 17 35 35 35 $1.1b $1.1b 28 28 28 130 130 130 60 60 60 2018 2019 2020E 2018 2019 2020E E190 A320 A321 HD A321 Mint A321neo HD A220 • Six A321neos delivered during 2019 • CAPEX in 2019 lower than 2020 resulting from timing shift of • Expect a maximum of 11 A321neos and one A220 in 2020 aircraft deliveries *Refer to anticipated aircraft delivery book in Appendix C 13


BALANCED APPROACH TO CAPITAL ALLOCATION SOURCES / USES OF CASH LEVERAGE RATIOS* (US$ billion) 12/31/2018 12/31/2019 Trailing 12 months as of 12/31/2019 SOURCES USES 1.81x Net share 0.5 repurchases Debt 1.57x 1.0 raise 0.3 Debt repayments CAPEX and 1.2 other Cash from operations and 1.4 other Beginning cash, End cash, cash 29% 34% cash equivalents 1.3 equivalents and and short term 0.9 short term investments investments 2019 Adj Debt / Cap Adj Debt / EBITDAR** • Remaining authorization for share repurchases equal to $640 million *Refer to Appendix B for detail on calculation. Leverage ratios exclude non-aircraft leases **Trailing 12 months 1414


1Q 2020 GUIDE SUMMARY EPS CAPACITY RASM CASM EX-FUEL* 1Q 2020 FY 2020 1Q 2020 FY 2020 1Q 2020 FY 2020 1Q 2020 FY 2020 $0.10 – 0.20 $2.50 – 3.00 1.5 – 3.5% 5.5 – 7.5% 0.0 – 3.0% N/A 1.5 – 3.5% (2.0) – 0.0% ALL-IN FUEL PRICE FUEL GALLONS OTHER INCOME / (EXPENSE) JTP / JTV (EXPENSES) 1Q 2020 FY 2020 1Q 2020 FY 2020 1Q 2020 FY 2020 1Q 2020 FY 2020 $2.09/gal N/A 216m 915m ($14) – (19)m ($65) – (75)m ($14) – (18)m ($55) – (65)m CAPEX TAX RATE SHARE COUNT** 1Q 2020 FY 2020 1Q 2020 FY 2020 1Q 2020 FY 2020 $325m - 425m $1.35b – 1.55b 27.0% 26.0% 284.5m 286.2m *CASM Ex-Fuel excludes fuel and related taxes, special items and operating expenses related to non-airline businesses. With respect to JetBlue’s CASM Ex-Fuel and guidance, JetBlue is not able to provide a reconciliation of the non-GAAP financial measure to GAAP because the excluded items have not yet occurred and cannot be reasonably predicted. The reconciling information that is unavailable would include a forward-looking range of financial performance measures beyond our control, such as fuel costs, which are subject to many economic and political factors beyond our control. **Average share count for the period. These share count estimates do not include any future share repurchases that may occur throughout 2020 under JetBlue’s share buyback program. The number of shares used in JetBlue’s actual earnings per share will likely be different than those stated above. 15


QUESTIONS?


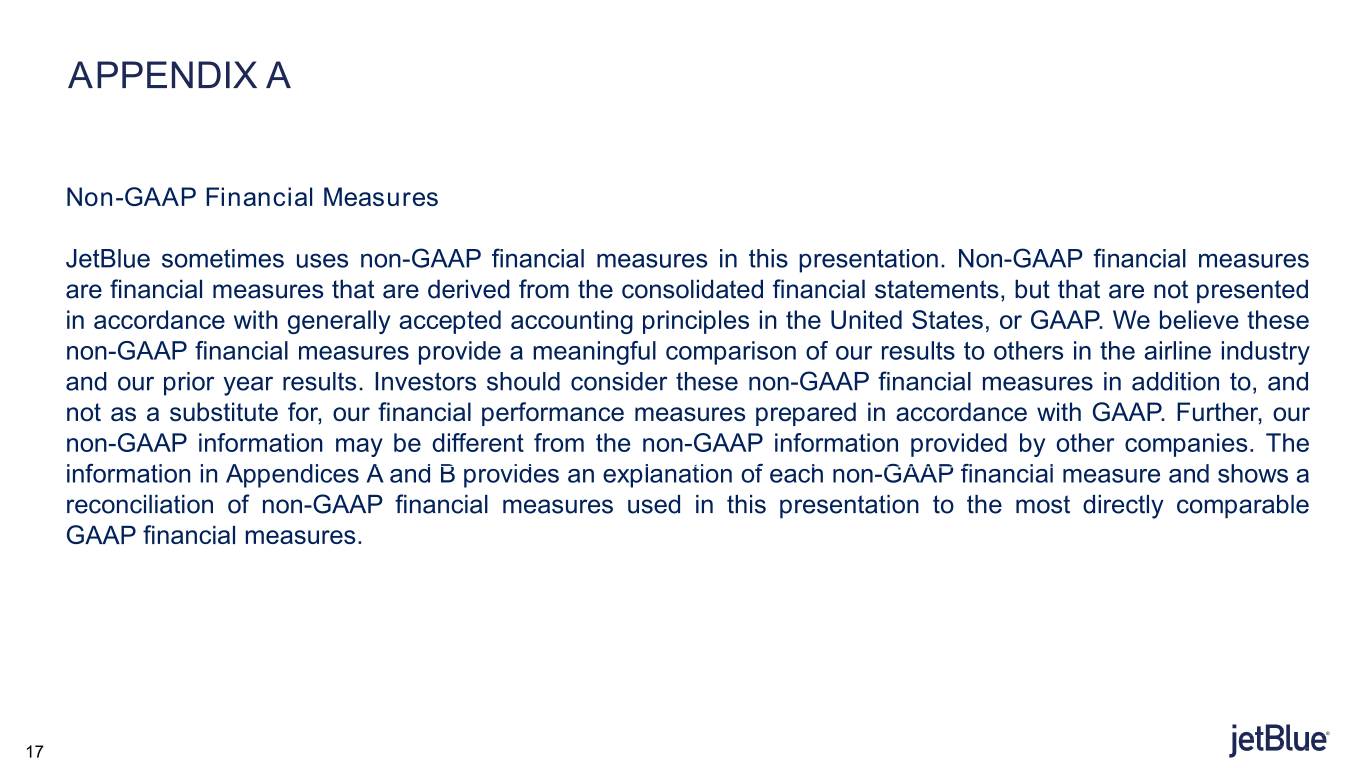
APPENDIX A Non-GAAP Financial Measures JetBlue sometimes uses non-GAAP financial measures in this presentation. Non-GAAP financial measures are financial measures that are derived from the consolidated financial statements, but that are not presented in accordance with generally accepted accounting principles in the United States, or GAAP. We believe these non-GAAP financial measures provide a meaningful comparison of our results to others in the airline industry and our prior year results. Investors should consider these non-GAAP financial measures in addition to, and not as a substitute for, our financial performance measures prepared in accordance with GAAP. Further, our non-GAAP information may be different from the non-GAAP information provided by other companies. The information in Appendices A and B provides an explanation of each non-GAAP financial measure and shows a reconciliation of non-GAAP financial measures used in this presentation to the most directly comparable GAAP financial measures. 17


4Q 2019 FINANCIAL RESULTS US$ Millions 4Q 2019 4Q 2018 Var % Total Operating Revenues 2,031 1,968 3.2 Aircraft fuel and related taxes 455 476 (4.6) Salaries, wages and benefits 589 543 8.4 Landing fees and other rents 112 108 4.8 Depreciation and amortization 140 123 13.7 Aircraft rent 23 28 (18.5) Sales and marketing 75 79 (5.1) Maintenance, materials and repairs 137 128 7.4 Other operating expenses 272 263 3.5 Special items 1 4 (82.9) Operating Income 227 216 4.9 Other Income (Expense) (7) (15) 55.7 Income before income taxes 220 201 9.6 Income tax expense 59 31 89.1 NET INCOME 161 170 (4.9) *Refer to 4Q 2019 GAAP vs Pre-Tax Margin 10.8% 10.2% 0.6 pts non-GAAP reconciliation in this Appendix A Earnings per Share (EPS) (GAAP) $0.56 $0.55 Adj. Pre-Tax Margin* 10.9% 10.4% 0.5 pts Adj. Earnings per Share (EPS)* (Non- GAAP) $0.56 $0.50 18


Operating expense per available seat mile, excluding fuel and related taxes, other non-airline operating expenses, and special items (“CASM Ex-Fuel”) Operating expenses per available seat mile, or CASM, is a common metric used in the airline industry. We exclude aircraft fuel and related taxes, operating expenses related to other non-airline businesses, such as JetBlue Technology Ventures and JetBlue Travel Products, and special items from operating expenses to determine CASM ex-fuel, which is a non-GAAP financial measure. During the periods presented below, special items include one-time costs related to the Embraer E190 fleet transition as well as one-time costs related to the implementation of our pilots' collective bargaining agreement. We believe that CASM ex-fuel is useful for investors because it provides investors the ability to measure financial performance excluding items beyond our control, such as fuel costs, which are subject to many economic and political factors, or not related to the generation of an available seat mile, such as operating expense related to certain non-airline businesses. We believe this non- GAAP measure is more indicative of our ability to manage airline costs and is moreLOCATIONcomparable to measures reported by other major airlines. NON-GAAP FINANCIAL MEASURE RECONCILIATION OF OPERATING EXPENSE PER ASM, EXCLUDING FUEL ($ in millions, per ASM data in cents) (unaudited) Three Months Ended Twelve Months Ended December 31, December 31, 2019 2018 2019 2018 $ per ASM $ per ASM $ per ASM $ per ASM Total operating expenses(1) $ 1,804 $ 11.22 $ 1,752 $ 11.55 $ 7,294 $ 11.43 $ 7,392 $ 12.34 Less: Aircraft fuel and related taxes 455 2.83 476 3.14 1,847 2.89 1,899 3.17 Other non-airline expenses(1) 12 0.08 12 0.07 46 0.08 44 0.07 Special items 1 - 4 0.03 14 0.02 435 0.73 Operating expenses, excluding fuel(1) $ 1,336 $ 8.31 $ 1,260 $ 8.31 $ 5,387 $ 8.44 $ 5,014 $ 8.37 (1) Recast to reflect the adoption of ASC 842 Leases . 19


Operating Expense, Income before Taxes, Net Income and Earnings per Share, excluding special items, gain on equity method investments, and impact of tax reform Our GAAP results in the applicable periods were impacted by the following: (a) the 2017 tax reform, (b) a gain on equity method investments, and (c) charges that are deemed special items. We believe the impacts of these items make our results difficult to compare to prior periods as well as future periods and guidance. During the periods presented below, special items include one-time costs related to the Embraer E190 fleet transition as well as one-time costs related to the implementation of our pilots' collective bargaining agreement. We believe the impacts of these items distort our overall trends and that our metrics and results are enhanced with the presentation of our results excluding the impact of these items. The table below provides a reconciliation of our GAAP reported amounts to the non- GAAP amounts excluding the impacts of these items. NON-GAAP FINANCIAL MEASURE RECONCILIATION OF OPERATING EXPENSE, INCOME BEFORE TAXES, NET INCOME AND EARNINGS PER SHARE EXCLUDING SPECIAL ITEMS, GAIN ON EQUITY METHOD INVESTMENTS, AND IMPACT OF TAX REFORM (in millions, except per share amounts) (unaudited) Three Months Ended Twelve Months Ended December 31, December 31, 2019 2018(1) 2019 2018(1) Total operating expenses $ 1,804 $ 1,752 $ 7,294 $ 7,392 Less: Special items 1 4 14 435 Total operating expenses excluding special items $ 1,803 $ 1,748 $ 7,280 $ 6,957 Operating income $ 227 $ 216 $ 800 $ 266 Add back: Special items 1 4 14 435 Operating income excluding special items $ 228 $ 220 $ 814 $ 701 Income before income taxes $ 220 $ 201 $ 768 $ 219 Add back: Special items 1 4 14 435 Less: Gain on equity method investments - - 15 - Income before income taxes excluding special items and gain on $ 221 $ 205 $ 767 $ 654 equity method investments Income before income taxes excluding special items and gain on $ 221 $ 205 $ 767 $ 654 equity method investments Less: Income tax expense (benefit) 59 31 199 30 Less: Income tax benefit related to special items - 1 4 108 Less: Income tax (expense) related to gain on equity method investments - - (4) - Less: Income tax benefit related to tax reform - 17 - 28 Net Income excluding special items, gain on equity method $ 162 $ 156 $ 568 $ 488 investments, and tax reform impact Earnings Per Common Share: Basic $ 0.56 $ 0.55 $ 1.92 $ 0.60 Add back: Special items, net of tax 0.01 0.01 0.04 1.05 Less: Gain on equity method investments, net of tax - - 0.04 - Less: Tax reform impact - 0.06 - 0.09 Basic excluding special items, gain on equity method investments, and $ 0.57 $ 0.50 $ 1.92 $ 1.56 tax reform impact Diluted $ 0.56 $ 0.55 $ 1.91 $ 0.60 Add back: Special items, net of tax - 0.01 0.03 1.04 Less: Gain on equity method investments, net of tax - - 0.04 - Less: Tax reform impact - 0.06 - 0.09 Diluted excluding special items, gain on equity method investments, $ 0.56 $ 0.50 $ 1.90 $ 1.55 and tax reform impact 20 (1) Prior period results have been recast to reflect the adoption of ASC 842 Leases


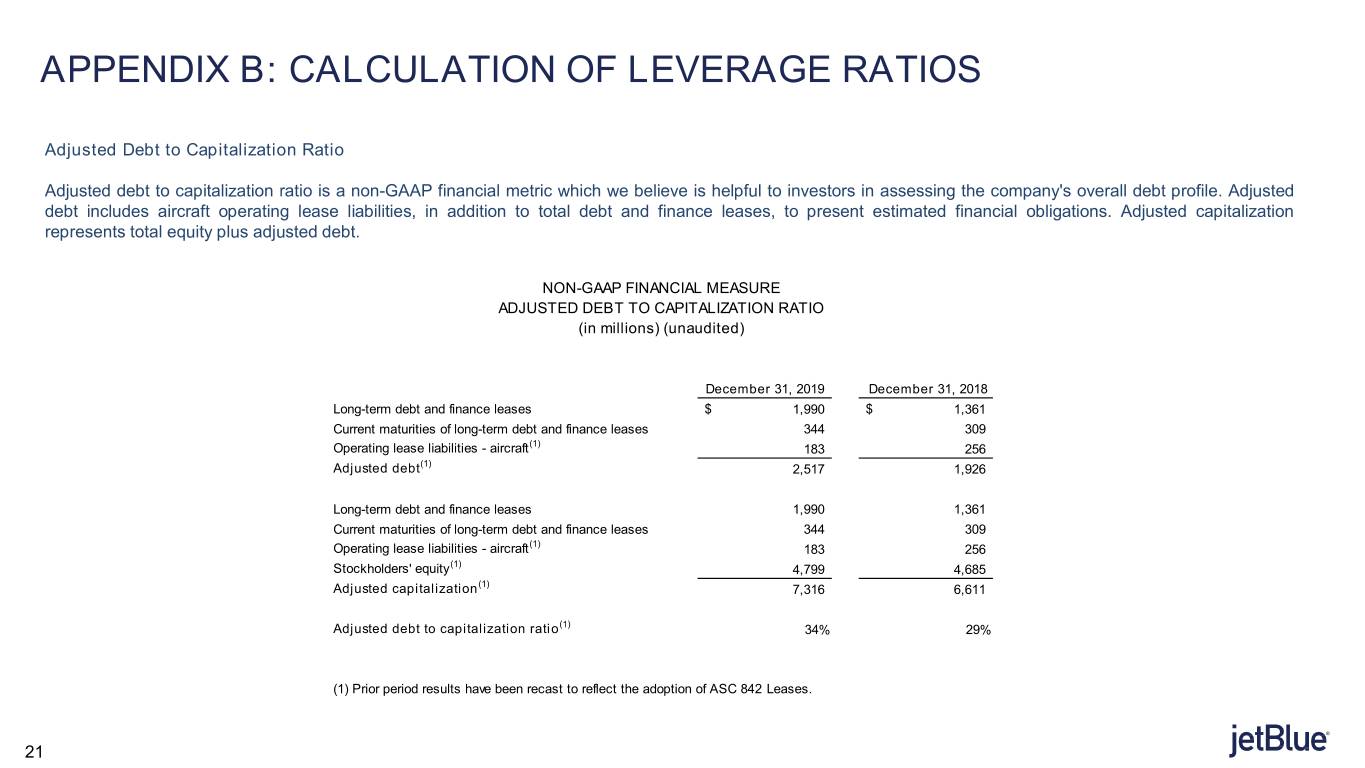
APPENDIX B: CALCULATION OF LEVERAGE RATIOS Adjusted Debt to Capitalization Ratio Adjusted debt to capitalization ratio is a non-GAAP financial metric which we believe is helpful to investors in assessing the company's overall debt profile. Adjusted debt includes aircraft operating lease liabilities, in addition to total debt and finance leases, to present estimated financial obligations. Adjusted capitalization represents total equity plus adjusted debt. LOCATION NON-GAAP FINANCIAL MEASURE ADJUSTED DEBT TO CAPITALIZATION RATIO (in millions) (unaudited) December 31, 2019 December 31, 2018 Long-term debt and finance leases $ 1,990 $ 1,361 Current maturities of long-term debt and finance leases 344 309 Operating lease liabilities - aircraft(1) 183 256 Adjusted debt(1) 2,517 1,926 Long-term debt and finance leases 1,990 1,361 Current maturities of long-term debt and finance leases 344 309 Operating lease liabilities - aircraft(1) 183 256 Stockholders' equity(1) 4,799 4,685 Adjusted capitalization(1) 7,316 6,611 Adjusted debt to capitalization ratio(1) 34% 29% (1) Prior period results have been recast to reflect the adoption of ASC 842 Leases. 21


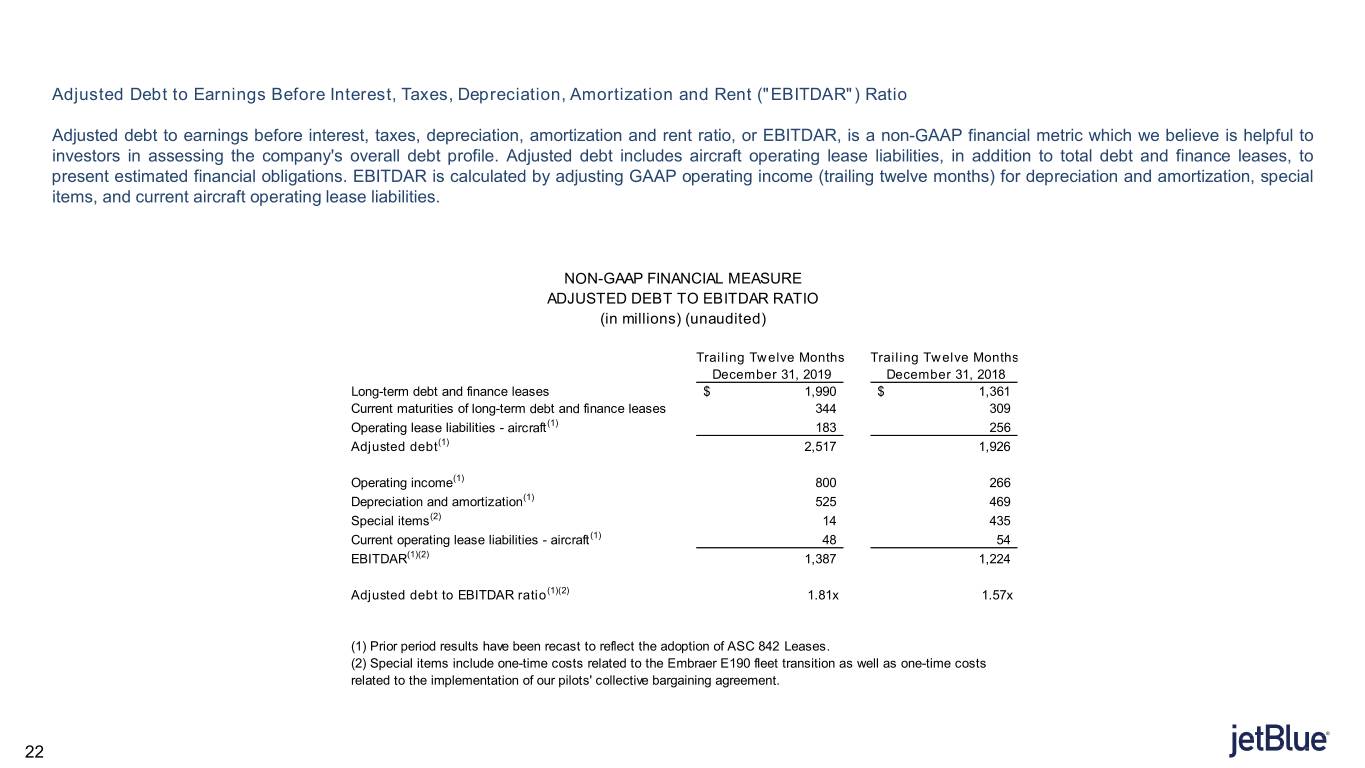
Adjusted Debt to Earnings Before Interest, Taxes, Depreciation, Amortization and Rent ("EBITDAR") Ratio Adjusted debt to earnings before interest, taxes, depreciation, amortization and rent ratio, or EBITDAR, is a non-GAAP financial metric which we believe is helpful to investors in assessing the company's overall debt profile. Adjusted debt includes aircraft operating lease liabilities, in addition to total debt and finance leases, to present estimated financial obligations. EBITDAR is calculated by adjusting GAAP operating income (trailing twelve months) for depreciation and amortization, special items, and current aircraft operating lease liabilities. DOCUMENT LOCATION NON-GAAP FINANCIAL MEASURE ADJUSTED DEBT TO EBITDAR RATIO (in millions) (unaudited) Trailing Twelve Months Trailing Twelve Months December 31, 2019 December 31, 2018 Long-term debt and finance leases $ 1,990 $ 1,361 Current maturities of long-term debt and finance leases 344 309 Operating lease liabilities - aircraft(1) 183 256 Adjusted debt(1) 2,517 1,926 Operating income(1) 800 266 Depreciation and amortization(1) 525 469 Special items(2) 14 435 Current operating lease liabilities - aircraft(1) 48 54 EBITDAR(1)(2) 1,387 1,224 Adjusted debt to EBITDAR ratio(1)(2) 1.81x 1.57x (1) Prior period results have been recast to reflect the adoption of ASC 842 Leases. (2) Special items include one-time costs related to the Embraer E190 fleet transition as well as one-time costs related to the implementation of our pilots' collective bargaining agreement. 22


APPENDIX C: CONTRACTUAL ORDER BOOK CONTRACTUAL ORDER BOOK CURRENT A321NEO STATUS Delayed Beyond A220 A321NEO Total Delivered Contractual Delivery Year 2019 - 13 13 6 7 2020* 1 14 15 3 2021 6 17 23 2022 8 15 23 2023 19 14 33 2024 22 12 34 2025 12 - 12 2026 2 - 2 Total 70 85 155 6 10 Delivery schedule as of January 23, 2020 * Due to delays in Airbus’ NEO program, our capacity guidance and capital expenditure assumptions assume delivery of a maximum of 11 NEO aircraft in 2020. 23


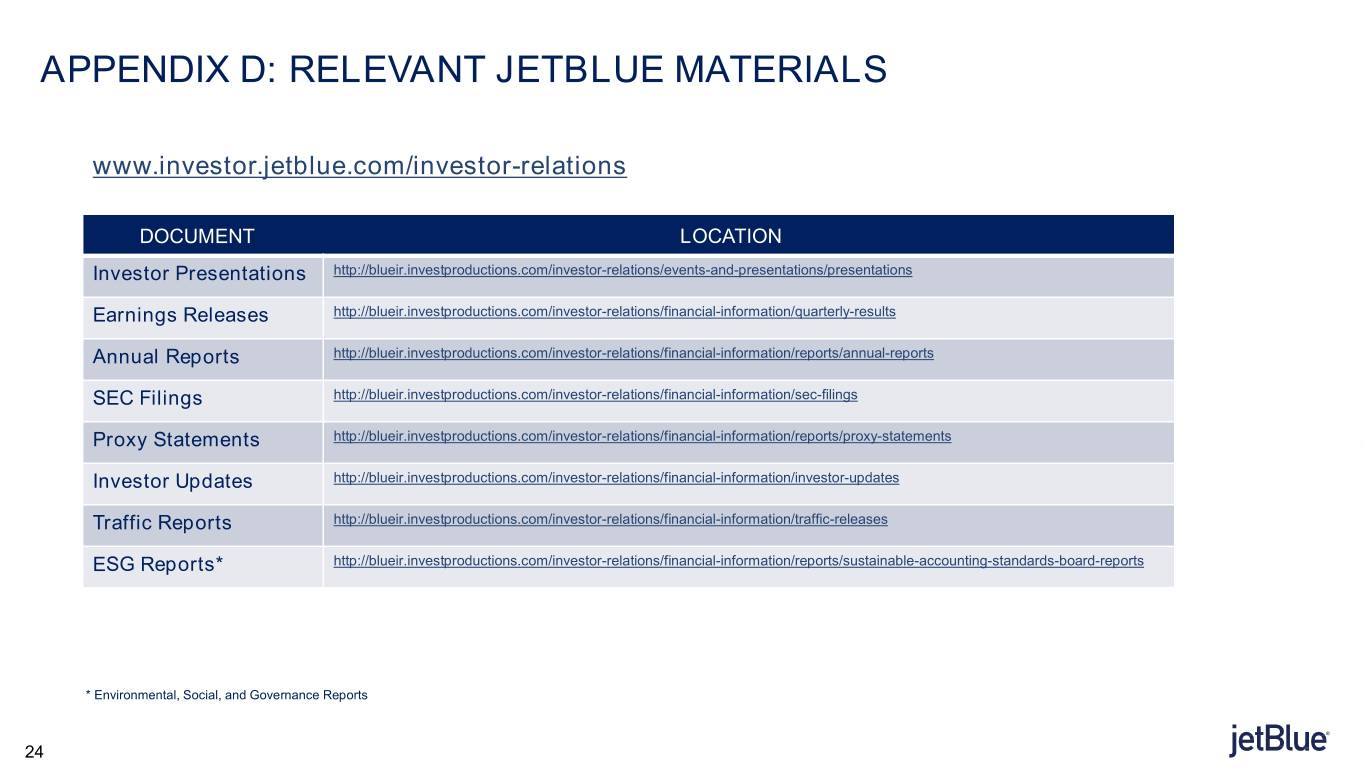
APPENDIX D: RELEVANT JETBLUE MATERIALS www.investor.jetblue.com/investor-relations DOCUMENT LOCATION Investor Presentations http://blueir.investproductions.com/investor-relations/events-and-presentations/presentations Earnings Releases http://blueir.investproductions.com/investor-relations/financial-information/quarterly-results Annual Reports http://blueir.investproductions.com/investor-relations/financial-information/reports/annual-reports SEC Filings http://blueir.investproductions.com/investor-relations/financial-information/sec-filings Proxy Statements http://blueir.investproductions.com/investor-relations/financial-information/reports/proxy-statements Investor Updates http://blueir.investproductions.com/investor-relations/financial-information/investor-updates Traffic Reports http://blueir.investproductions.com/investor-relations/financial-information/traffic-releases ESG Reports* http://blueir.investproductions.com/investor-relations/financial-information/reports/sustainable-accounting-standards-board-reports * Environmental, Social, and Governance Reports 24