JETBLUE ANNOUNCES FOURTH QUARTER 2021 RESULTS
NEW YORK (January 27, 2022) - JetBlue Airways Corporation (NASDAQ: JBLU) today reported its results for the fourth quarter of 2021:
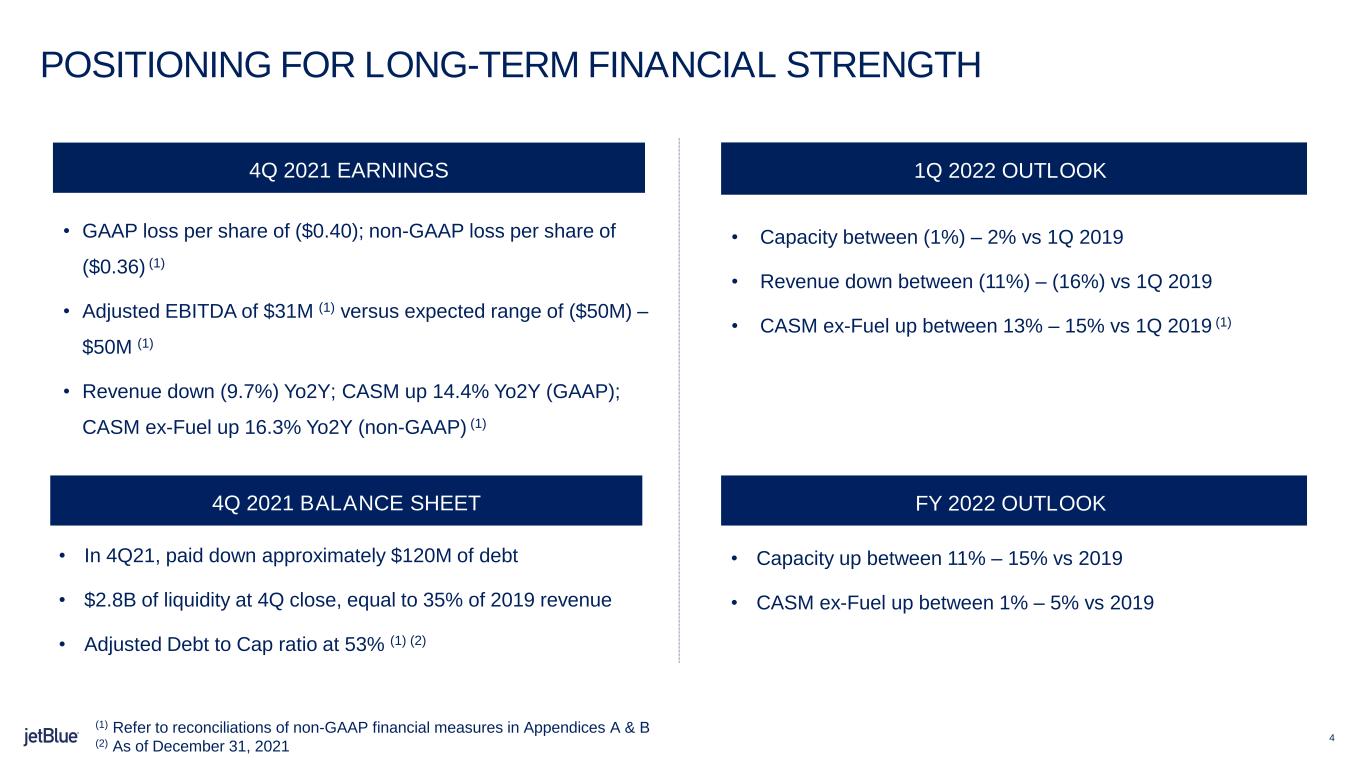
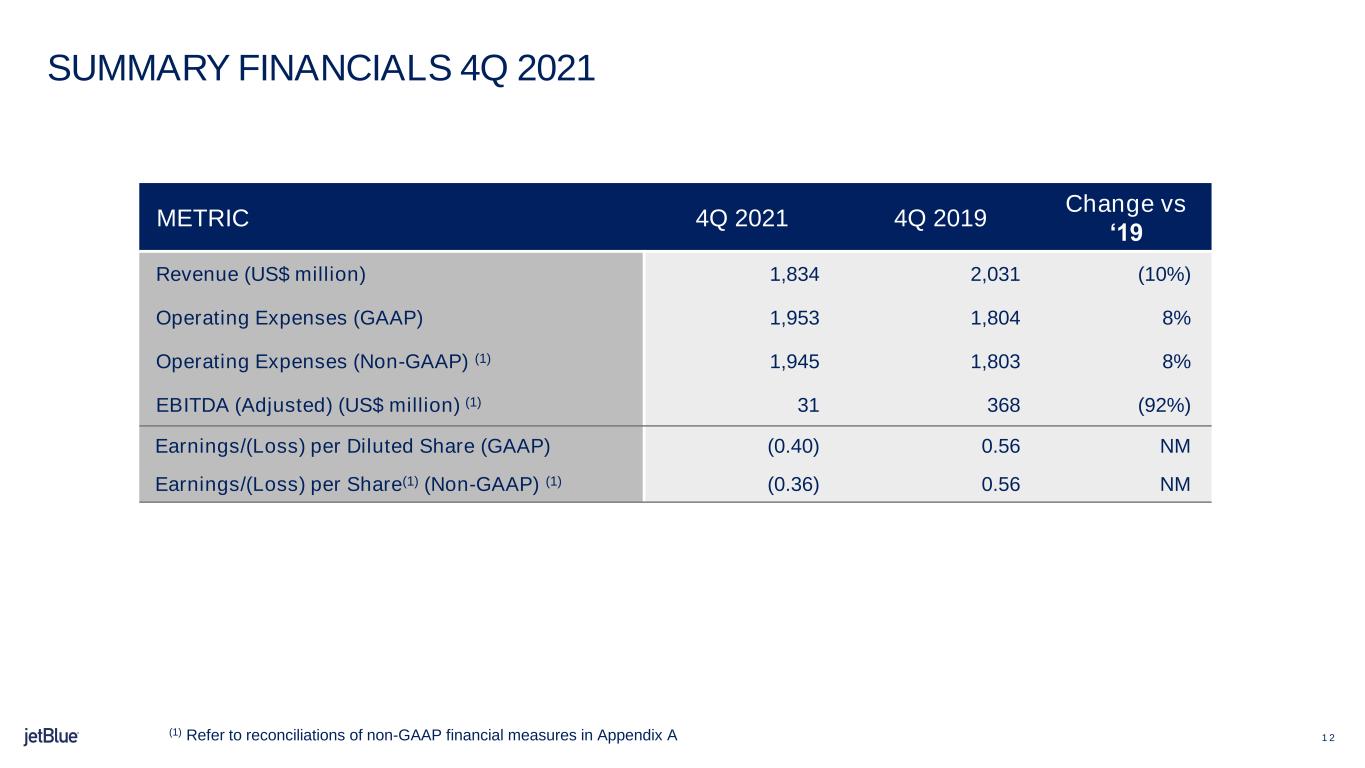
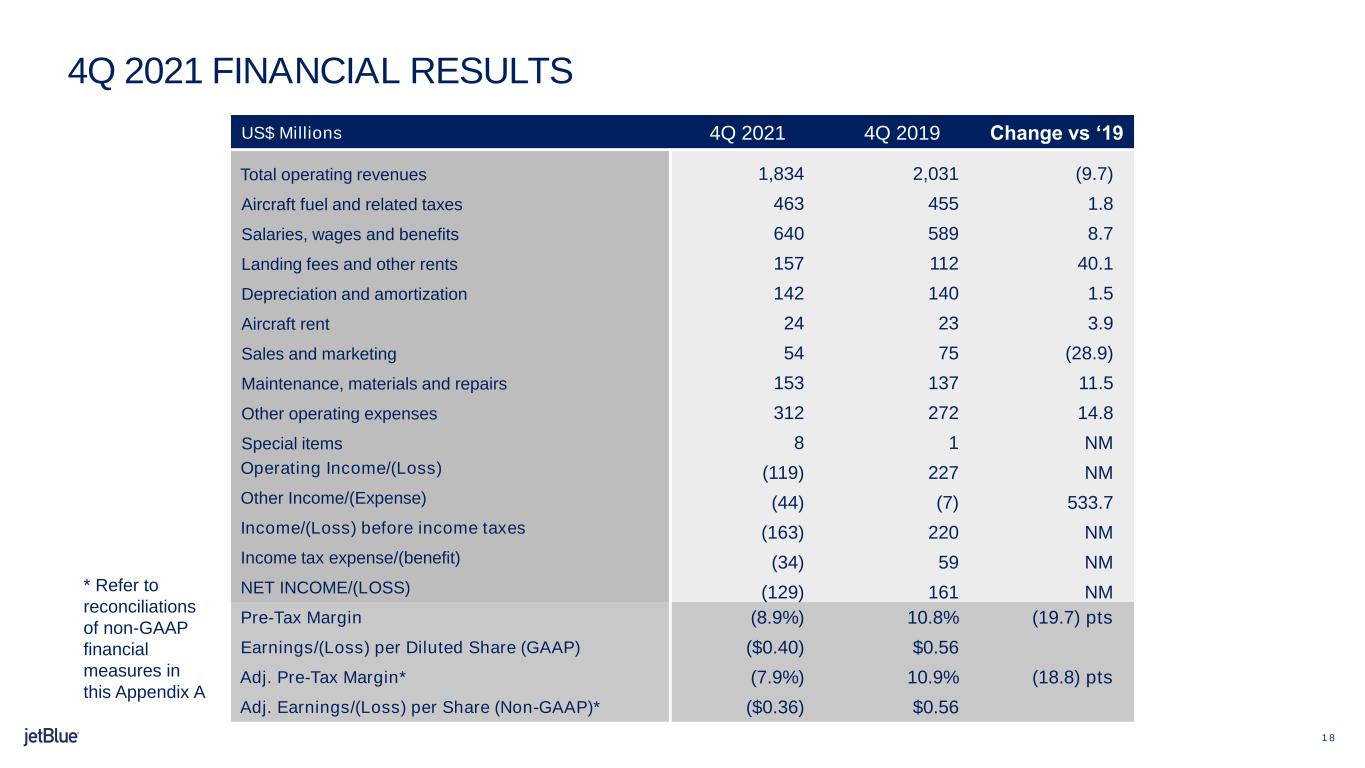
•Reported GAAP loss per share of ($0.40) in the fourth quarter of 2021 compared to diluted earnings per share of $0.56 in the fourth quarter of 2019. Adjusted loss per share was ($0.36)(1) in the fourth quarter of 2021 versus adjusted diluted earnings per share of $0.56(1) in the fourth quarter of 2019.
.
•GAAP pre-tax loss of ($163) million in the fourth quarter of 2021, compared to a pre-tax income of $220 million in the fourth quarter of 2019. Excluding one-time items, adjusted pre-tax loss of ($145) million(1) in the fourth quarter of 2021 versus adjusted pre-tax income of $221 million(1) in the fourth quarter of 2019.
Operational and Financial Highlights from the Fourth Quarter
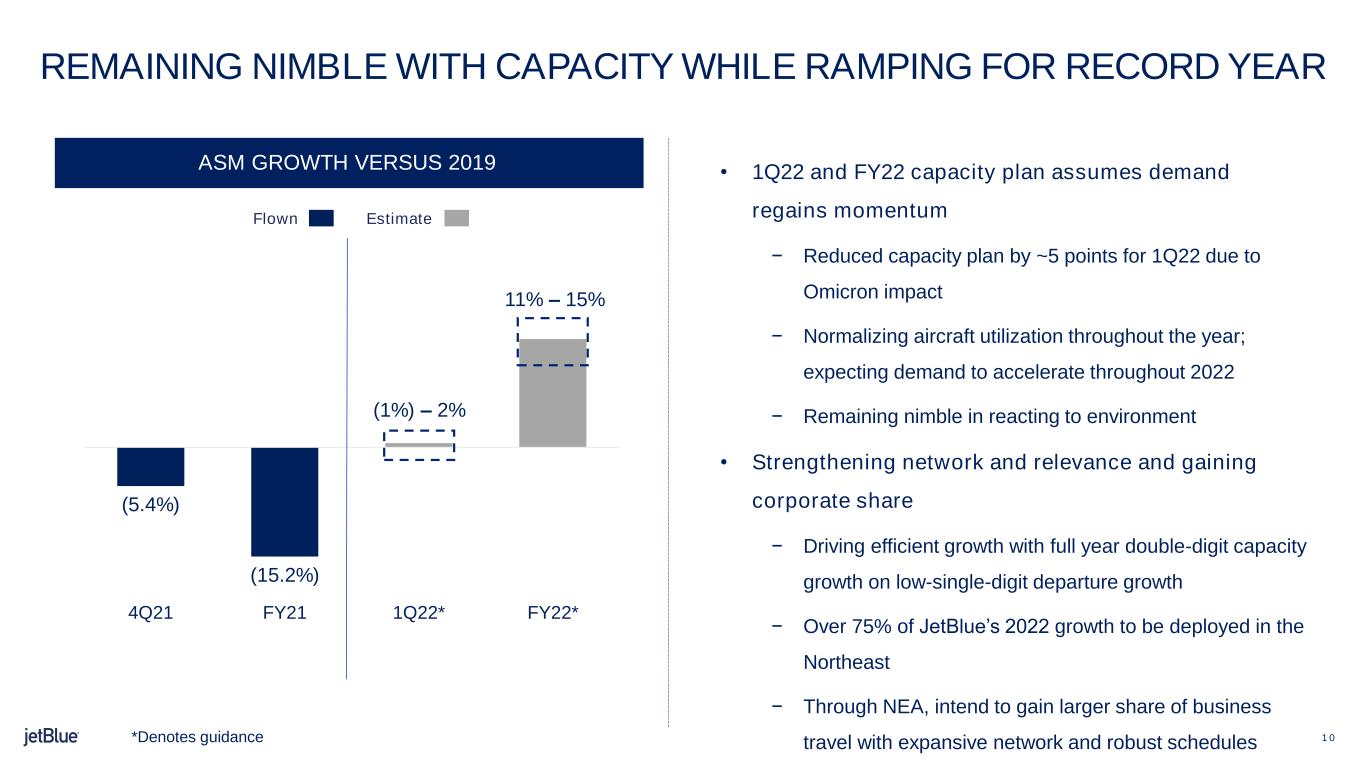
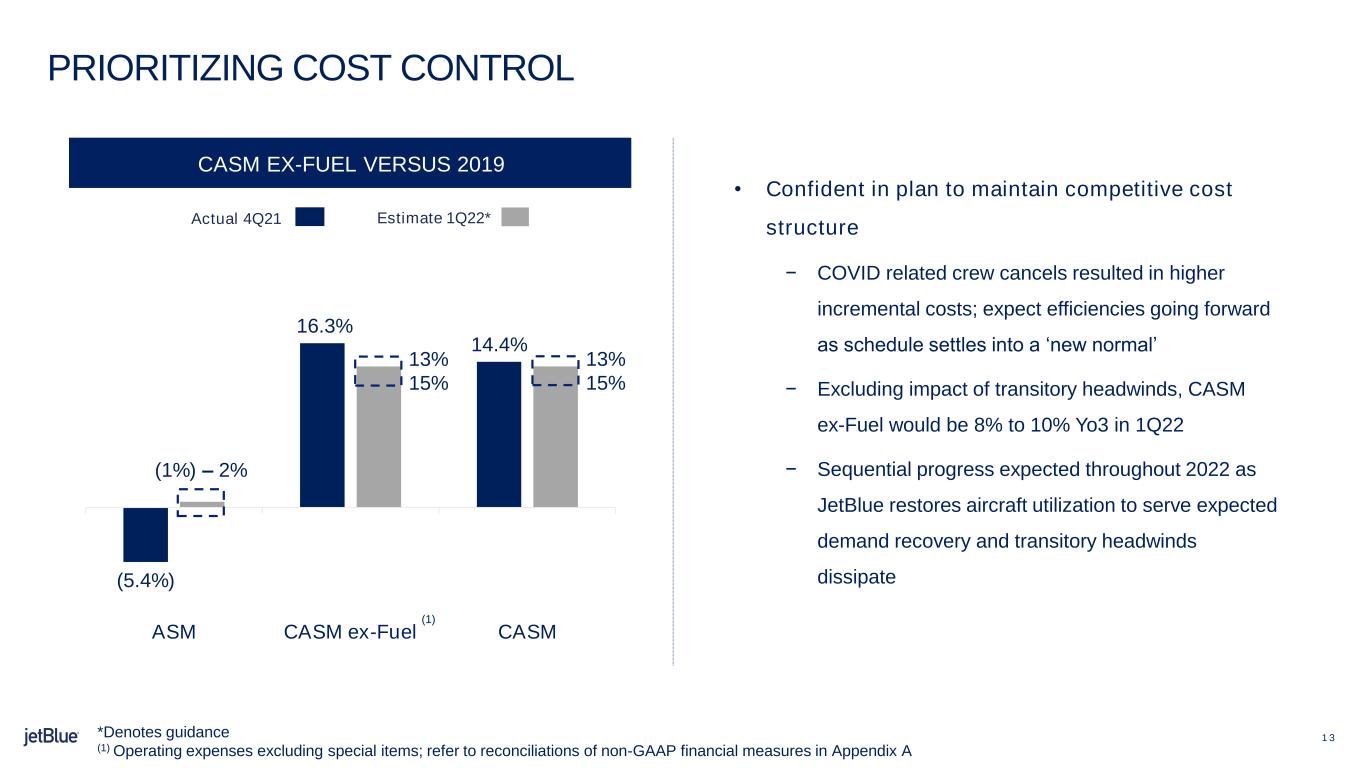
•Capacity declined by 5.4% year over two, in-line with our planning assumption of a 4% to 7% decline, year over two.
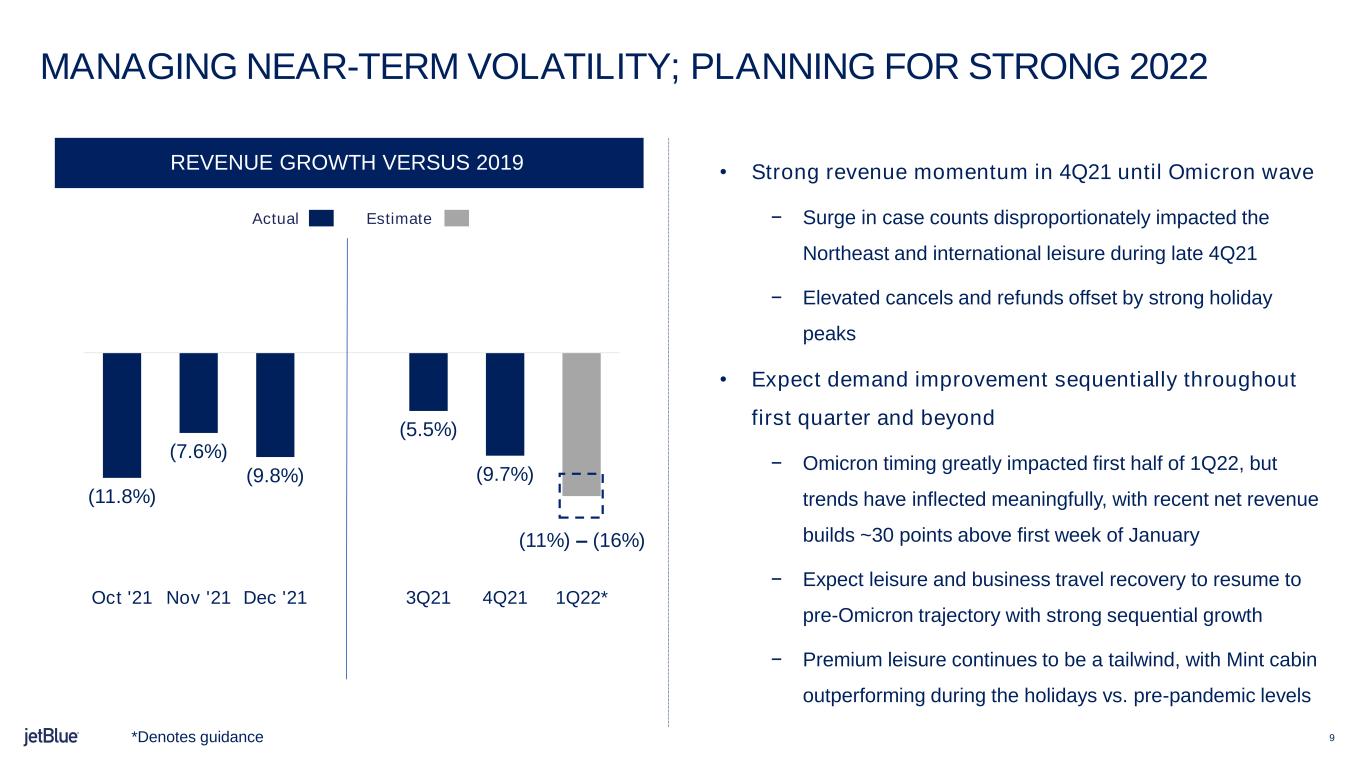
•Revenue declined 9.7% year over two, compared to our planning assumption of an 8% to 13% decline year over two. This was within the range of our initial assumptions despite a late quarter impact from the Omicron wave, driven by strong holiday peaks.
•Operating expenses per available seat mile increased 14.4% year over two. Operating expenses per available seat mile, excluding fuel and special items (CASM ex-fuel)(1) increased 16.3%(1) year over two. Consistent with the industry, our cost performance was impacted by incremental incentives and premium pay tied to the Omicron surge in case counts and the resulting operational impact, worth approximately two points of CASM ex-fuel in the quarter
•Adjusted Earnings Before Interest, Taxes, Depreciation, Amortization and Special Items (Adjusted EBITDA) in the fourth quarter of 2021 was $31 million(1), within our planning assumption range of $(50) to $50 million.
Balance Sheet and Liquidity
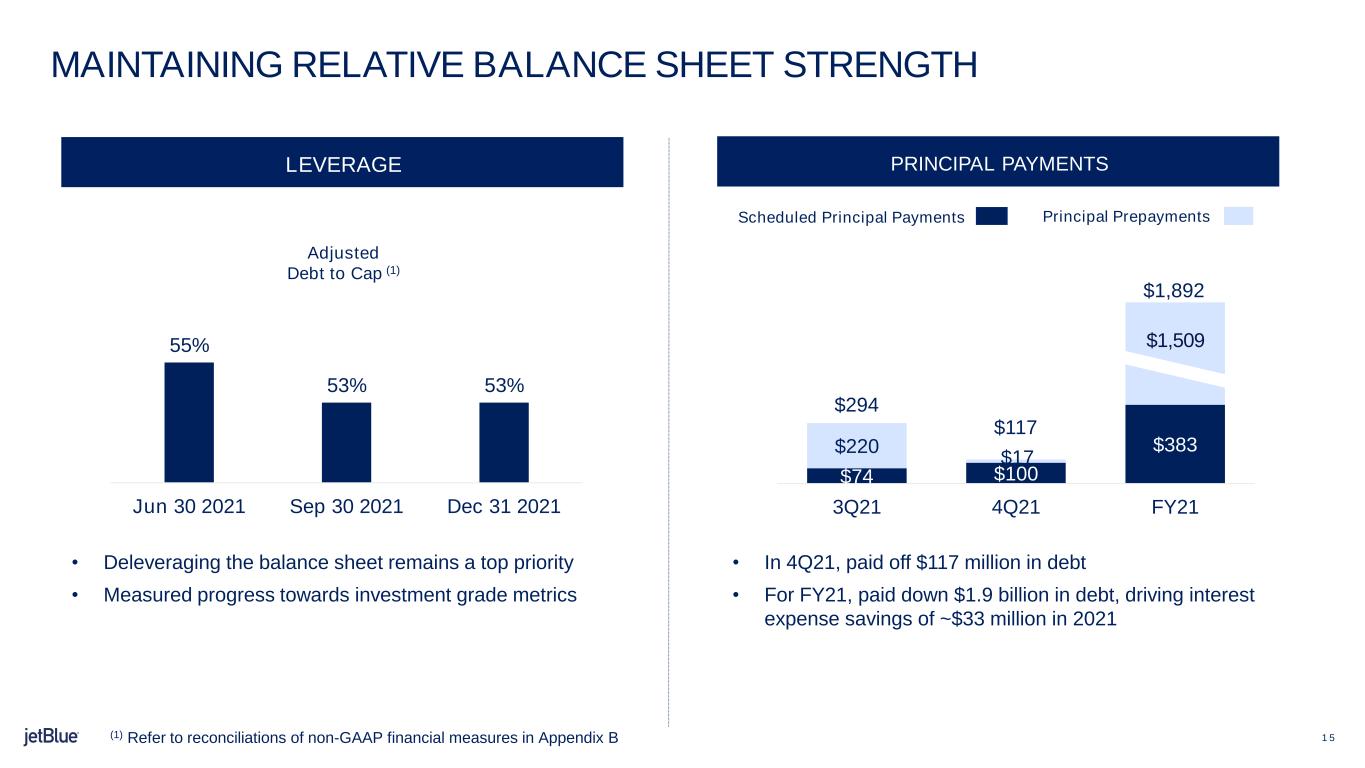
•As of December 31, 2021, JetBlue’s adjusted debt to capital ratio was 53%(1).
•JetBlue ended the fourth quarter of 2021 with approximately $2.8 billion in unrestricted cash, cash equivalents, and short-term investments, or 35% of 2019 revenue. This excludes our $550 million undrawn revolving credit facility.
•JetBlue paid down approximately $100 million in regularly scheduled debt and finance lease obligations, and prepaid approximately $20M in bank loans.
Fuel Expense and Hedging
•The realized fuel price in the fourth quarter 2021 was $2.37 per gallon, a 14.2% increase versus fourth quarter 2019 realized fuel price of $2.07.
•As of January 27, 2022, JetBlue has not entered into forward fuel derivative contracts to hedge its fuel consumption for the first quarter of 2022. Based on the forward curve as of
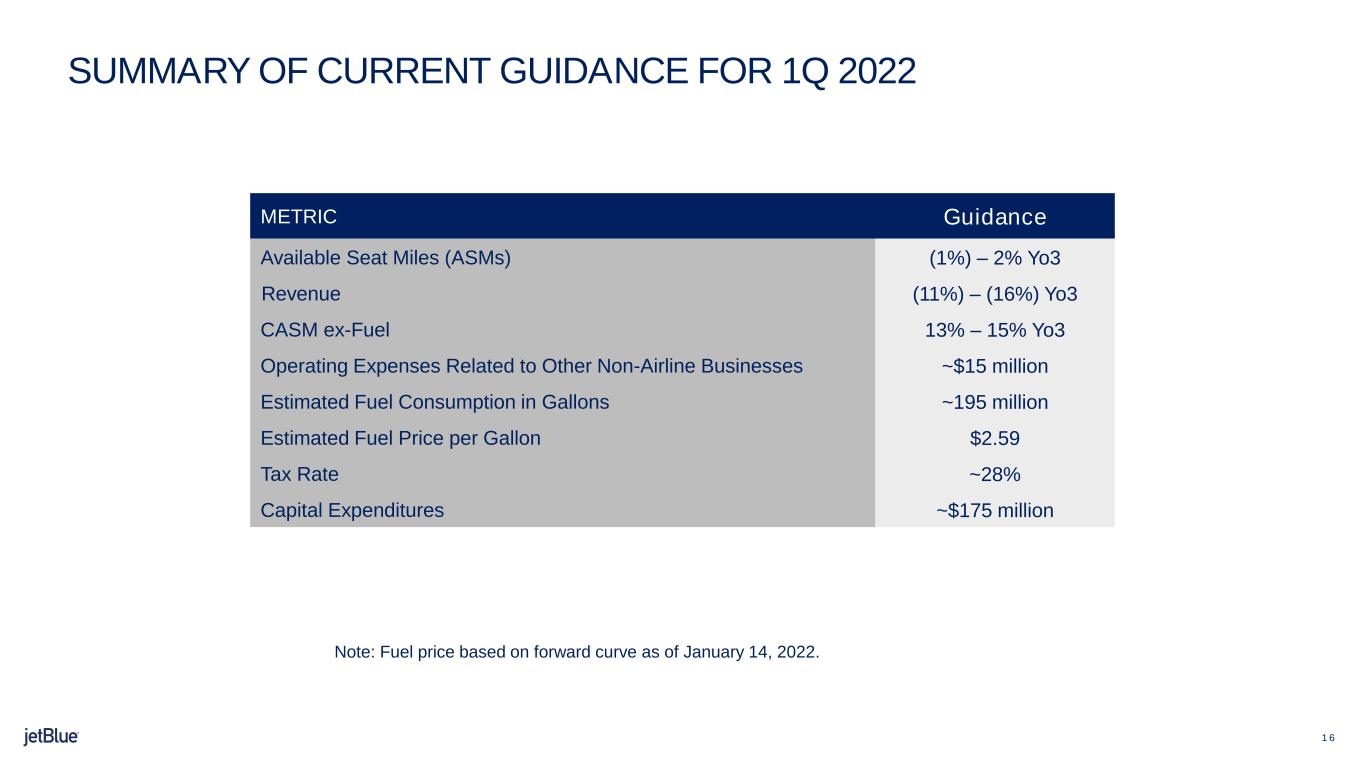
January 14, 2022, JetBlue expects an average all-in price per gallon of fuel of $2.59 in the first quarter of 2022.
Northeast Alliance Expected to Deliver Competition and Customer Choice
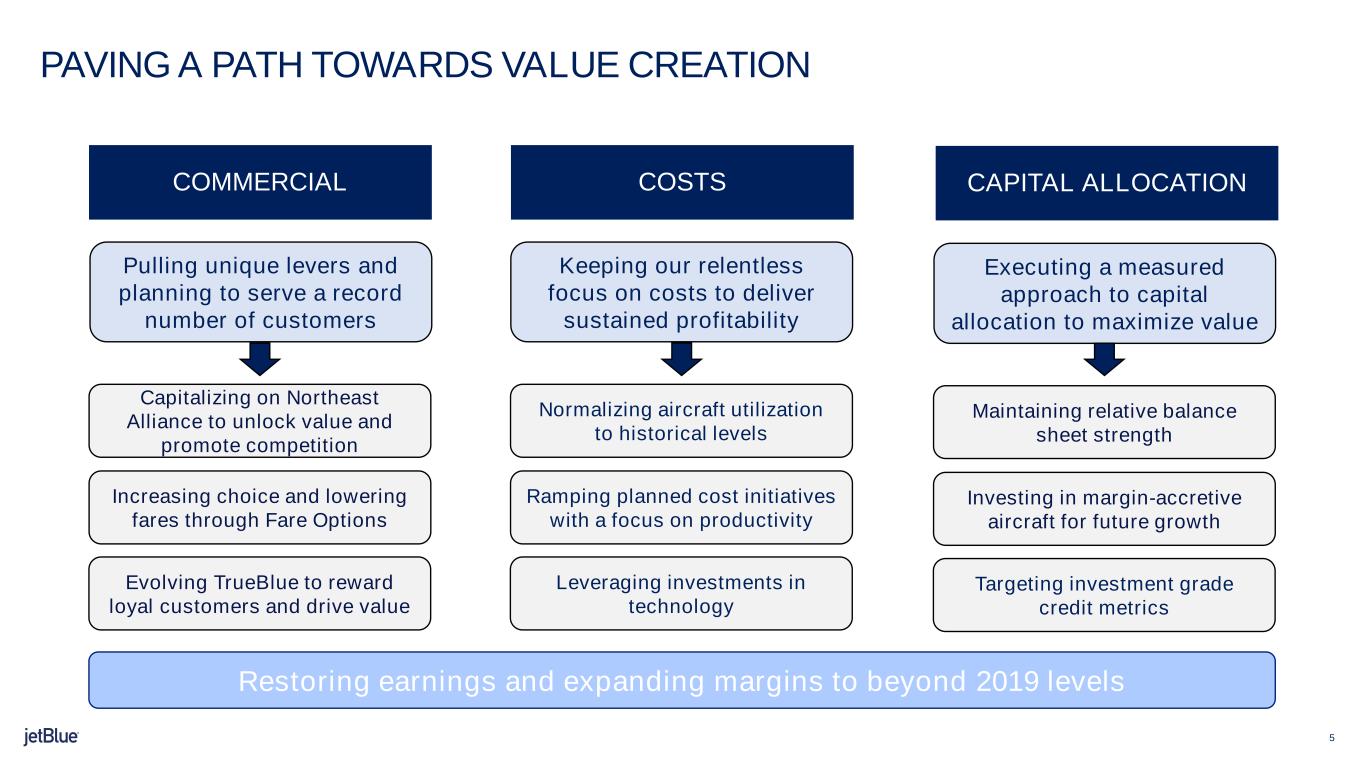
•Since the Northeast Alliance with American (NEA) was implemented in February 2021, JetBlue and American have collectively grown more quickly than the two largest competitors across New York and Boston. The airlines have launched the first phase of reciprocal loyalty benefits, are investing in a seamless travel experience and are now codesharing on 185 routes. Additionally, JetBlue will be fully operating out of LaGuardia’s (LGA) Terminal B when completed in summer 2022, providing easy connections for customers traveling on the Northeast Alliance.
•JetBlue plans to launch two new BlueCities this summer – Asheville (AVL) and Vancouver (YVR). As part of our 2022 growth plans, JetBlue and American plan to offer up to 300 daily departures at JFK Airport, 195 of those operated by JetBlue – more flights than ever before. At LGA, JetBlue plans to operate approximately 50 of nearly 200 daily departures with American, more than tripling our 2019 flight count.
Paving a Path Towards Value Creation
“While Omicron has temporarily weighed on demand in the very near-term, we expect sequential month-on-month improvement through the quarter, ultimately returning to sustained profitability in the spring and beyond. Furthermore, were it not for Omicron, we believe we would have generated higher revenue this quarter than the first quarter of 2019,” said Robin Hayes, JetBlue’s Chief Executive Officer.
“I firmly believe that 2022 will prove to be a transformational year for JetBlue's structural profitability, as we look to restore our earnings power and create value for our stakeholders. And we plan to achieve this by pulling meaningful commercial levers, keeping our relentless focus on costs, and maintaining our measured approach to capital allocation.”
Revenue and Capacity
“The surge in case counts disproportionately impacted the Northeast, hitting New York particularly hard, driving increased Customer cancellations and bookings softness during the most significant revenue weeks of the quarter, and also led to some Crew-related cancellations. Despite all of these challenges, our underlying revenue performance was very strong, which keeps us optimistic about the future as we continue to ramp up hiring efforts towards a fully staffed operation,” said Joanna Geraghty, JetBlue’s President and Chief Operating Officer.
“For the first quarter of 2022, we expect revenue to decrease between 11% and 16% year over three. This sequential slowdown reflects the large negative impact from Omicron on Q1 demand. However, trends have largely stabilized and are improving across all geographies. As quickly as the Omicron variant swept through the Northeast, we are seeing cases rapidly decline and we expect sequential month-on-month improvement leading to a profitable Q2 and a very strong summer peak.
For the first quarter of 2022, we expect capacity to range between (1%) and 2% year over three. For the full-year 2022, we are planning to grow capacity between 11% and 15% versus 2019 as we bring aircraft utilization back towards pre-pandemic levels, while retaining flexibility. We expect the demand recovery to regain steam following the temporary setback tied to the Omicron variant. We’ll continue to be nimble and react to the environment.”
Financial Performance and Outlook
“We’re confident that we’re on a path to sequential pre-tax margin improvement with sustained profitability in the spring and beyond. We expect to achieve greater operating leverage as we grow revenue while continuing to improve our unit cost performance,” said Ursula Hurley, JetBlue’s Chief Financial Officer.
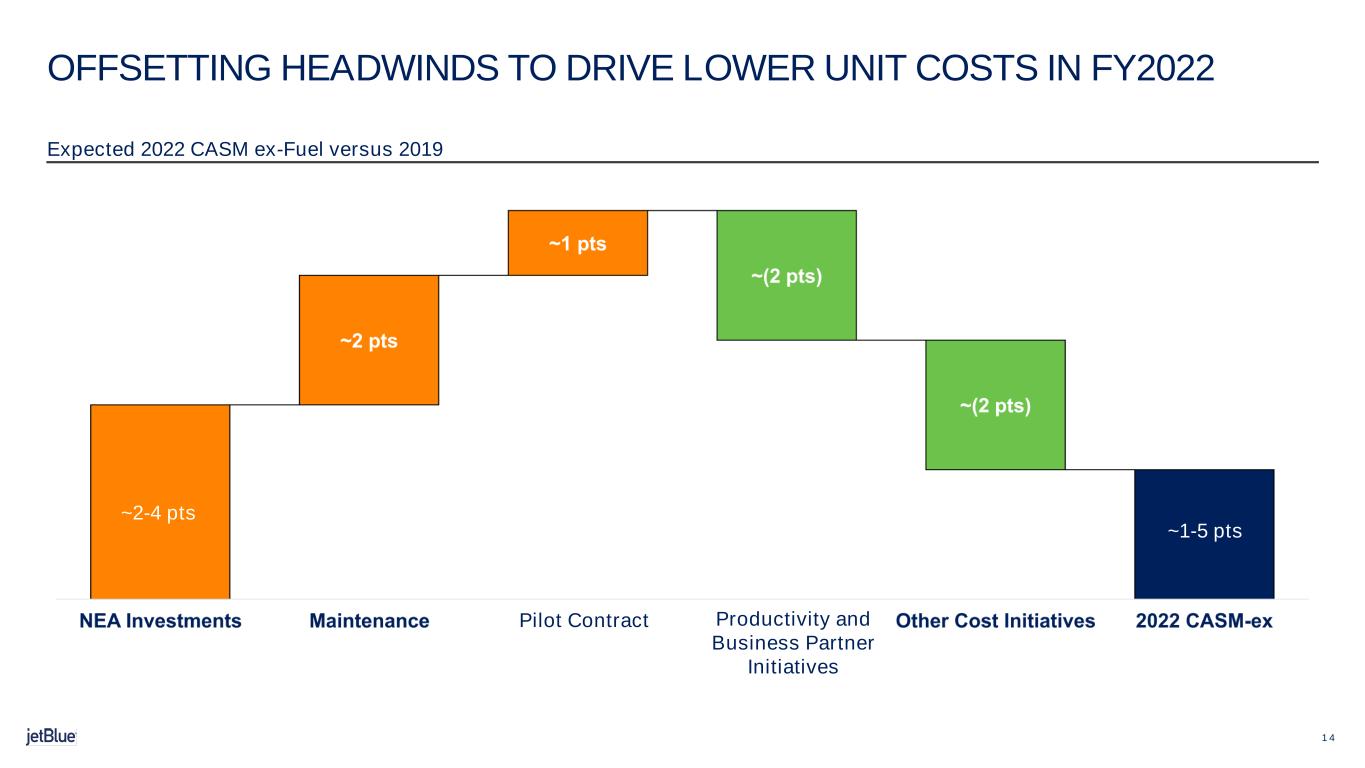
“For the first quarter of 2022, we estimate CASM ex-fuel(2) will increase between 13% to 15% year over three. For the full-year 2022, we expect CASM ex-fuel(2) to increase in the range of 1% to 5% versus 2019. We expect elevated unit costs in the first half, followed by a meaningful improvement in the second half of the year as we plan for our network, operation, and aircraft utilization to settle into a ‘new normal’ with optimal staffing levels, along with the ramp of our planned cost initiatives.
For the full-year, we have repaid a total of approximately $1.9 billion of debt. Our balance sheet continues to be among the strongest in the industry, and we’ll continue our balanced approach to capital allocation to drive shareholder value.”
Earnings Call Details
JetBlue will conduct a conference call to discuss its quarterly earnings today, January 27, 2022 at 10:00 a.m. Eastern Time. A live broadcast of the conference call will also be available via the internet at http://investor.jetblue.com. The webcast replay and presentation materials will be archived on the company’s website.
For further details see the Fourth Quarter 2021 Earnings Presentation available via the internet at http://investor.jetblue.com.
About JetBlue
JetBlue is New York's Hometown Airline®, and a leading carrier in Boston, Fort Lauderdale-Hollywood, Los Angeles, Orlando and San Juan. JetBlue carries customers across the U.S., Caribbean and Latin America, and between New York and London. For more information, visit jetblue.com.
Notes
(1)Non-GAAP financial measure; Note A provides a reconciliation of non-GAAP financial measures used in this release and explains the reasons management believes that presentation of these non-GAAP financial measure provides useful information to investors regarding JetBlue's financial condition and results of operations.
(2)With respect to JetBlue’s CASM ex-fuel guidance, JetBlue is unable to provide a reconciliation of the non-GAAP financial measure to GAAP because the excluded items have not yet occurred and cannot be reasonably predicted. The reconciling information that is unavailable would include a forward-looking range of financial performance measures beyond our control, such as fuel costs, which are subject to many economic and political factors. Accordingly, a reconciliation to CASM is not available without unreasonable effort.
Forward Looking Statements
This Earning Release (or otherwise made by JetBlue or on JetBlue’s behalf) contain various forward-looking statements within the meaning of Section 27A of the Securities Act of 1933, as amended, or the Securities Act, and Section 21E of the Securities Exchange Act of 1934, as amended, or the Exchange Act, which represent our management’s beliefs and assumptions concerning future events. These statements are intended to qualify for the “safe harbor” from liability established by the Private Securities Litigation Reform Act of 1995. When used in this document and in documents incorporated herein by reference, the words “expects,” “plans,” “anticipates,” “indicates,” “believes,” “forecast,” “guidance,” “outlook,” “may,” “will,” “should,” “seeks,” “targets” and similar expressions are intended to identify forward-looking statements. Forward-looking statements involve risks, uncertainties and assumptions, and are based on information currently available to us. Actual results may differ materially from those expressed in the forward-looking statements due to many factors, including, without limitation, the coronavirus (“COVID-19”) pandemic, and the outbreak of any other disease or similar public health threat that affects travel demand or behavior; restrictions on our business related to the financing we accepted under various federal government support programs such as the Coronavirus Aid, Relief, and Economic Security Act, the Consolidated Appropriations Act, and the American Rescue Plan Act; our significant fixed obligations and substantial indebtedness; risk associated with execution of our strategic operating plans in the near-term and long-term; the recording of a material impairment loss of tangible or intangible assets; our extremely competitive industry; volatility in financial and credit markets which could affect our ability to obtain debt and/or lease financing or to raise funds through debt or equity issuances; volatility in fuel prices, maintenance costs and interest rates; our reliance on high daily aircraft utilization; our ability to implement our growth strategy; our ability to attract and retain qualified personnel and maintain our culture as we grow; our reliance on a limited number of suppliers, including for aircraft, aircraft engines and parts and vulnerability to delays by those suppliers; our dependence on the New York and Boston metropolitan markets and the effect of increased congestion in these markets; our reliance on automated systems and technology; the outcome of the lawsuit filed by the Department of Justice and certain state Attorneys General against us related to our Northeast Alliance entered into with American Airlines, our being subject to potential unionization, work stoppages, slowdowns or increased labor costs; our presence in some international emerging markets that may experience political or economic instability or may subject us to legal risk; reputational and business risk from information security breaches or cyber-attacks; changes in or additional domestic or foreign government regulation, including new or increased tariffs; changes in our industry due to other airlines' financial condition; acts of war or terrorism; global economic conditions or an economic downturn leading to a continuing or accelerated decrease in demand for air travel; adverse weather conditions or natural disasters; and external geopolitical events and conditions. It is routine for our internal projections and expectations to change as the year or each quarter in the year progresses, and therefore it should be clearly understood that the internal projections, beliefs, and assumptions upon which we base our expectations may change prior to the end of each quarter or year.
Given the risks and uncertainties surrounding forward-looking statements, you should not place undue reliance on these statements. You should understand that many important factors, in addition to those discussed or incorporated by reference in this Earnings Release, could cause our results to differ materially from those expressed in the forward-looking statements. In light of these risks and uncertainties, the forward-looking events discussed in this Earnings Release might not occur. Our forward-looking statements speak only as of the date of this Earnings Release. Other than as required by law, we undertake no obligation to update or revise forward-looking statements, whether as a result of new information, future events, or otherwise.
This Earnings Release also includes certain “non-GAAP financial measures” as defined under the Exchange Act and in accordance with Regulation G. We have included reconciliations of these non-GAAP financial measures to the most directly comparable financial measures calculated and provided in accordance with U.S. GAAP within this Earnings Release.
| | | | | | | | | | | | | | | | | | | | | | | | | | | | | | | | | | | | | | | | | | | | |
| JETBLUE AIRWAYS CORPORATION |
| CONSOLIDATED STATEMENTS OF OPERATIONS |
| (in millions, except per share amounts) |
| (unaudited) |
| | | | | | | | | | | | | | | | | | |
| | | | | | | | | | | | |
| Three Months Ended
December 31, | | Twelve Months Ended
December 31, | | | | | |
| 2021 | | 2020 | | Percent Change | | 2021 | | 2020 | | Percent Change | | | | | | | |
| OPERATING REVENUES | | | | | | | | | | | | | | | | | | |
| Passenger | $ | 1,695 | | | $ | 606 | | | 179.6 | | | $ | 5,609 | | | $ | 2,733 | | | 105.3 | | | | | | | | |
| Other | 139 | | | 55 | | | 152.3 | | | 428 | | | 224 | | | 91.4 | | | | | | | | |
| Total operating revenues | 1,834 | | | 661 | | | 177.3 | | | 6,037 | | | 2,957 | | | 104.2 | | | | | | | | |
| | | | | | | | | | | | | | | | | | |
| OPERATING EXPENSES | | | | | | | | | | | | | | | | | | |
| Aircraft fuel and related taxes | 463 | | | 134 | | | 244.7 | | | 1,436 | | | 631 | | | 127.7 | | | | | | | | |
| Salaries, wages and benefits | 640 | | | 472 | | | 35.8 | | | 2,358 | | | 2,032 | | | 16.1 | | | | | | | | |
| Landing fees and other rents | 157 | | | 100 | | | 56.4 | | | 628 | | | 358 | | | 75.2 | | | | | | | | |
| Depreciation and amortization | 142 | | | 128 | | | 10.7 | | | 540 | | | 535 | | | 0.9 | | | | | | | | |
| Aircraft rent | 24 | | | 25 | | | (3.5) | | | 99 | | | 85 | | | 17.2 | | | | | | | | |
| Sales and marketing | 54 | | | 26 | | | 102.0 | | | 183 | | | 110 | | | 66.0 | | | | | | | | |
| Maintenance, materials and repairs | 153 | | | 97 | | | 58.0 | | | 626 | | | 441 | | | 42.0 | | | | | | | | |
| Other operating expenses | 312 | | | 202 | | | 54.7 | | | 1,080 | | | 762 | | | 41.8 | | | | | | | | |
| Special items | 8 | | | (69) | | | NM | | (833) | | | (283) | | | 194.8 | | | | | | | | |
| Total operating expenses | 1,953 | | | 1,115 | | | 75.1 | | | 6,117 | | | 4,671 | | | 31.0 | | | | | | | | |
| | | | | | | | | | | | | | | | | | |
| OPERATING (LOSS) | (119) | | | (454) | | | (73.8) | | | (80) | | | (1,714) | | | (95.3) | | | | | | | | |
| | | | | | | | | | | | | | | | | | |
| Operating margin | -6.5 | % | | -68.7 | % | | 62.2 | | pts. | -1.3 | % | | -58.0 | % | | 56.7 | | pts. | | | | | | |
| | | | | | | | | | | | | | | | | | |
| OTHER INCOME (EXPENSE) | | | | | | | | | | | | | | | | | | |
| Interest expense | (39) | | | (59) | | | (33.8) | | | (192) | | | (179) | | | 7.2 | | | | | | | | |
| Capitalized interest | 3 | | | 3 | | | (0.7) | | | 12 | | | 13 | | | (6.8) | | | | | | | | |
| Gain (Loss) on equity method investments | (10) | | | — | | | NM | | 44 | | | — | | | NM | | | | | | | |
| Interest income and other expenses | 2 | | | (2) | | | NM | | (47) | | | (13) | | | 267.5 | | | | | | | | |
| Total other income (expense) | (44) | | | (58) | | | (24.9) | | | (183) | | | (179) | | | 2.0 | | | | | | | | |
| | | | | | | | | | | | | | | | | | |
| (LOSS) BEFORE INCOME TAXES | (163) | | | (512) | | | (68.2) | | | (263) | | | (1,893) | | | (86.1) | | | | | | | | |
| | | | | | | | | | | | | | | | | | |
| Pre-tax margin | -8.9 | % | | -77.5 | % | | 68.6 | | pts. | -4.4 | % | | -64.0 | % | | 59.6 | | pts. | | | | | | |
| | | | | | | | | | | | | | | | | | |
| Income tax (benefit) | (34) | | | (139) | | | (75.6) | | | (81) | | | (539) | | | (85.1) | | | | | | | | |
| | | | | | | | | | | | | | | | | | |
| NET (LOSS) | $ | (129) | | | $ | (373) | | | (65.4) | | | $ | (182) | | | $ | (1,354) | | | (86.5) | | | | | | | | |
| | | | | | | | | | | | | | | | | | |
| (LOSS) PER COMMON SHARE: | | | | | | | | | | | | | | | | | | |
| Basic | $ | (0.40) | | | $ | (1.31) | | | | | $ | (0.57) | | | $ | (4.88) | | | | | | | | | | |
| Diluted | $ | (0.40) | | | $ | (1.31) | | | | | $ | (0.57) | | | $ | (4.88) | | | | | | | | | | |
| | | | | | | | | | | | | | | | | | |
| WEIGHTED AVERAGE SHARES OUTSTANDING: | | | | | | | | | | | | | | | | | |
| Basic | 319.6 | | | 284.1 | | | | | 318.0 | | | 277.5 | | | | | | | | | | |
| Diluted | 319.6 | | | 284.1 | | | | | 318.0 | | | 277.5 | | | | | | | | | | |
| | | | | | | | | | | | | | | | | | | | | | | | | | | | | | | | | | | | | | | | | | | | |
| JETBLUE AIRWAYS CORPORATION |
| COMPARATIVE OPERATING STATISTICS |
| (unaudited) |
| | | | | | | | | | | | | | | | | | |
| | | | | | | | | | | | |
| | | | | Three Months Ended
December 31, | | Twelve Months Ended
December 31, | |
| | | | | | | 2021 | | 2020 | | Percent Change | | 2021 | | 2020 | | Percent Change | |
| Revenue passengers (thousands) | | | | | | | 8,617 | | | 3,356 | | | 156.7 | | | 30,094 | | | 14,274 | | | 110.8 | | |
| Revenue passenger miles (RPMs) (millions) | | | | | | | 11,628 | | | 4,446 | | | 161.6 | | | 41,152 | | | 18,598 | | | 121.3 | | |
| Available seat miles (ASMs) (millions) | | | | | | | 15,211 | | | 8,480 | | | 79.4 | | | 54,113 | | | 32,689 | | | 65.5 | | |
| Load factor | | | | | | | 76.4 | % | | 52.4 | % | | 24.0 | | pts. | 76.0 | % | | 56.9 | % | | 19.1 | | pts. |
| Aircraft utilization (hours per day) | | | | | | | 9.5 | | 5.3 | | | 77.3 | | | 8.5 | | 5.4 | | 57.4 | | |
| | | | | | | | | | | | | | | | | | |
| Average fare | | | | | | | $ | 196.76 | | | $ | 180.54 | | | 9.0 | | | $ | 186.39 | | | $ | 191.42 | | | (2.6) | | |
| Yield per passenger mile (cents) | | | | | | | 14.58 | | | 13.63 | | | 7.0 | | | 13.63 | | | 14.69 | | | (7.2) | | |
| Passenger revenue per ASM (cents) | | | | | | | 11.15 | | | 7.15 | | | 55.9 | | | 10.37 | | | 8.36 | | | 24.0 | | |
| Revenue per ASM (cents) | | | | | | | 12.06 | | | 7.80 | | | 54.6 | | | 11.16 | | | 9.04 | | | 23.4 | | |
| Operating expense per ASM (cents) | | | | | | | 12.84 | | | 13.16 | | | (2.4) | | | 11.30 | | | 14.29 | | | (20.9) | | |
Operating expense per ASM, excluding fuel (cents)(1) | | | | | | | 9.66 | | | 12.31 | | | (21.5) | | | 10.11 | | | 13.12 | | | (22.9) | | |
| | | | | | | | | | | | | | | | | | |
| Departures | | | | | | | 76,165 | | | 40,321 | | | 88.9 | | | 264,385 | | | 168,636 | | | 56.8 | | |
| Average stage length (miles) | | | | | | | 1,253 | | | 1,290 | | | (2.9) | | | 1,283 | | | 1,222 | | | 5.0 | | |
| Average number of operating aircraft during period | | | | | | | 280.6 | | | 264.9 | | | 5.9 | | | 273.0 | | | 262.2 | | | 4.1 | | |
| Average fuel cost per gallon, including fuel taxes | | | | | | | $ | 2.37 | | | $ | 1.31 | | | 80.9 | | | $ | 2.06 | | | $ | 1.53 | | | 34.6 | | |
| Fuel gallons consumed (millions) | | | | | | | 195 | | | 102 | | | 90.7 | | | 696 | | | 412 | | | 68.9 | | |
| Average number of full-time equivalent crewmembers | | | | | | | | | | | | | 16,693 | | | 15,450 | | | | |
| | | | | | | | | | | | | | | | | | |
| (1) Refer to Note A at the end of our Earnings Release for more information on this non-GAAP financial measure. Operating expense per available seat mile, excluding fuel (“CASM Ex-Fuel”) excludes fuel and related taxes, other non-airline operating expenses, and special items. |
| | | | | | | | | | | |
| JETBLUE AIRWAYS CORPORATION |
| SELECTED CONSOLIDATED BALANCE SHEET DATA |
| (in millions) |
| | | |
| December 31, | | December 31, |
| 2021 | | 2020 |
| (unaudited) | | |
| Cash and cash equivalents | $ | 2,018 | | | $ | 1,918 | |
| Total investment securities | 863 | | | 1,137 | |
| Total assets | 13,642 | | | 13,406 | |
| Total debt | 4,006 | | | 4,863 | |
| Stockholders' equity | 3,849 | | | 3,951 | |
Note A - Non-GAAP Financial Measures
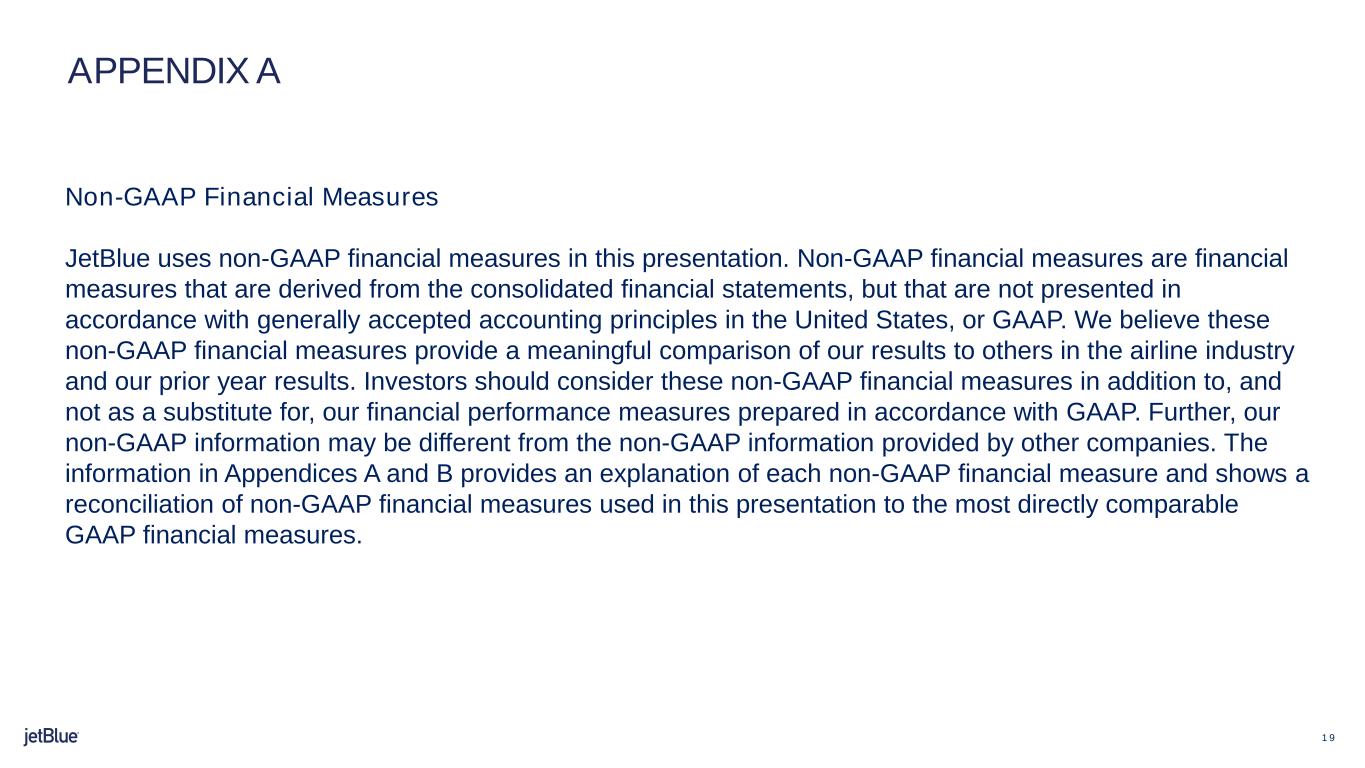
JetBlue uses non-GAAP financial measures in this press release. Non-GAAP financial measures are financial measures that are derived from the consolidated financial statements, but that are not presented in accordance with generally accepted accounting principles in the United States, or GAAP. We believe these non-GAAP financial measures provide a meaningful comparison of our results to others in the airline industry and our prior year results. Investors should consider these non-GAAP financial measures in addition to, and not as a substitute for, our financial performance measures prepared in accordance with GAAP. Further, our non-GAAP information may be different from the non-GAAP information provided by other companies. The information below provides an explanation of each non-GAAP financial measure and shows a reconciliation of non-GAAP financial measures used in this press release to the most directly comparable GAAP financial measures.
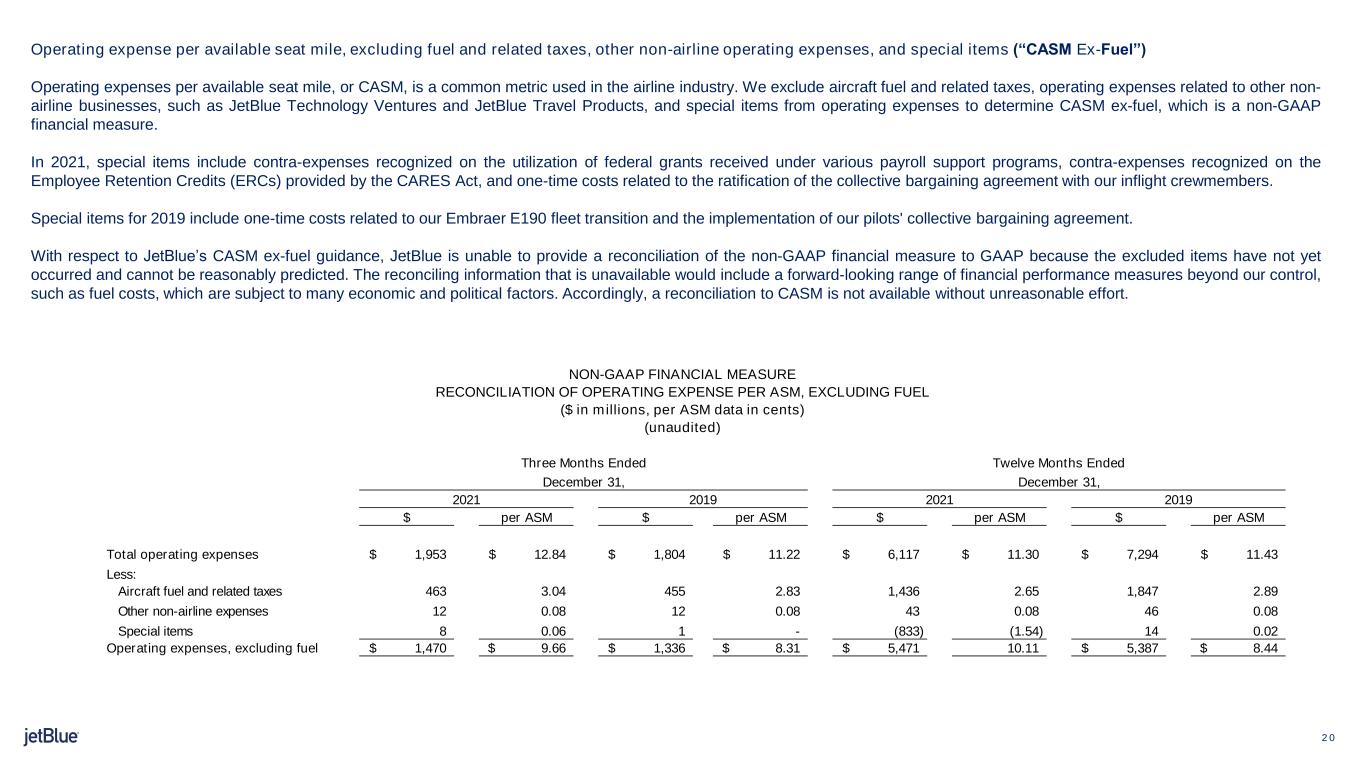
Operating expense per available seat mile, excluding fuel and related taxes, other non-airline operating expenses, and special items (“CASM Ex-Fuel”)
Operating expenses per available seat mile, or CASM, is a common metric used in the airline industry. We exclude aircraft fuel and related taxes, operating expenses related to other non-airline businesses, such as JetBlue Technology Ventures and JetBlue Travel Products, and special items from operating expenses to determine CASM ex-fuel, which is a non-GAAP financial measure.
In 2021, special items include contra-expenses recognized on the utilization of federal grants received under various payroll support programs, contra-expenses recognized on the Employee Retention Credits (ERCs) provided by the CARES Act, and one-time costs related to the ratification of the collective bargaining agreement with our inflight crewmembers.
Special items for 2019 include one-time costs related to our Embraer E190 fleet transition and the implementation of our pilots' collective bargaining agreement.
We believe that CASM ex-fuel is useful for investors because it provides investors the ability to measure financial performance excluding items beyond our control, such as fuel costs, which are subject to many economic and political factors, or not related to the generation of an available seat mile, such as operating expense related to certain non-airline businesses. We believe this non-GAAP measure is more indicative of our ability to manage airline costs and is more comparable to measures reported by other major airlines.
With respect to JetBlue’s CASM ex-fuel guidance, JetBlue is unable to provide a reconciliation of the non-GAAP financial measure to GAAP because the excluded items have not yet occurred and cannot be reasonably predicted. The reconciling information that is unavailable would include a forward-looking range of financial performance measures beyond our control, such as fuel costs, which are subject to many economic and political factors. Accordingly, a reconciliation to CASM is not available without unreasonable effort.
| | | | | | | | | | | | | | | | | | | | | | | | | | | | | | | | | | | | | | | | | | | | | | | | | | | |
| NON-GAAP FINANCIAL MEASURE |
| RECONCILIATION OF OPERATING EXPENSE PER ASM, EXCLUDING FUEL |
| ($ in millions, per ASM data in cents) |
| (unaudited) |
| | | | | | | | | | | | | | | | | | | |
| | | |
| Three Months Ended December 31, | | Twelve Months Ended December 31, |
| 2021 | | 2019 | | 2021 | | 2019 | | |
| $ | | per ASM | | $ | | per ASM | | $ | | per ASM | | $ | | per ASM | | | | |
| | | | | | | | | | | | | | | | | | | |
| Total operating expenses | $ | 1,953 | | | $ | 12.84 | | | $ | 1,804 | | | $ | 11.22 | | | $ | 6,117 | | | $ | 11.30 | | | $ | 7,294 | | | $ | 11.43 | | | | | |
| Less: | | | | | | | | | | | | | | | | | | | |
| Aircraft fuel and related taxes | 463 | | | 3.04 | | | 455 | | | 2.83 | | | 1,436 | | | 2.65 | | | 1,847 | | | 2.89 | | | | | |
| Other non-airline expenses | 12 | | | 0.08 | | | 12 | | | 0.08 | | | 43 | | | 0.08 | | | 46 | | | 0.08 | | | | | |
| Special items | 8 | | | 0.06 | | | 1 | | | — | | | (833) | | | (1.54) | | | 14 | | | 0.02 | | | | | |
| Operating expenses, excluding fuel | $ | 1,470 | | | $ | 9.66 | | | $ | 1,336 | | | $ | 8.31 | | | $ | 5,471 | | | $ | 10.11 | | | $ | 5,387 | | | $ | 8.44 | | | | | |
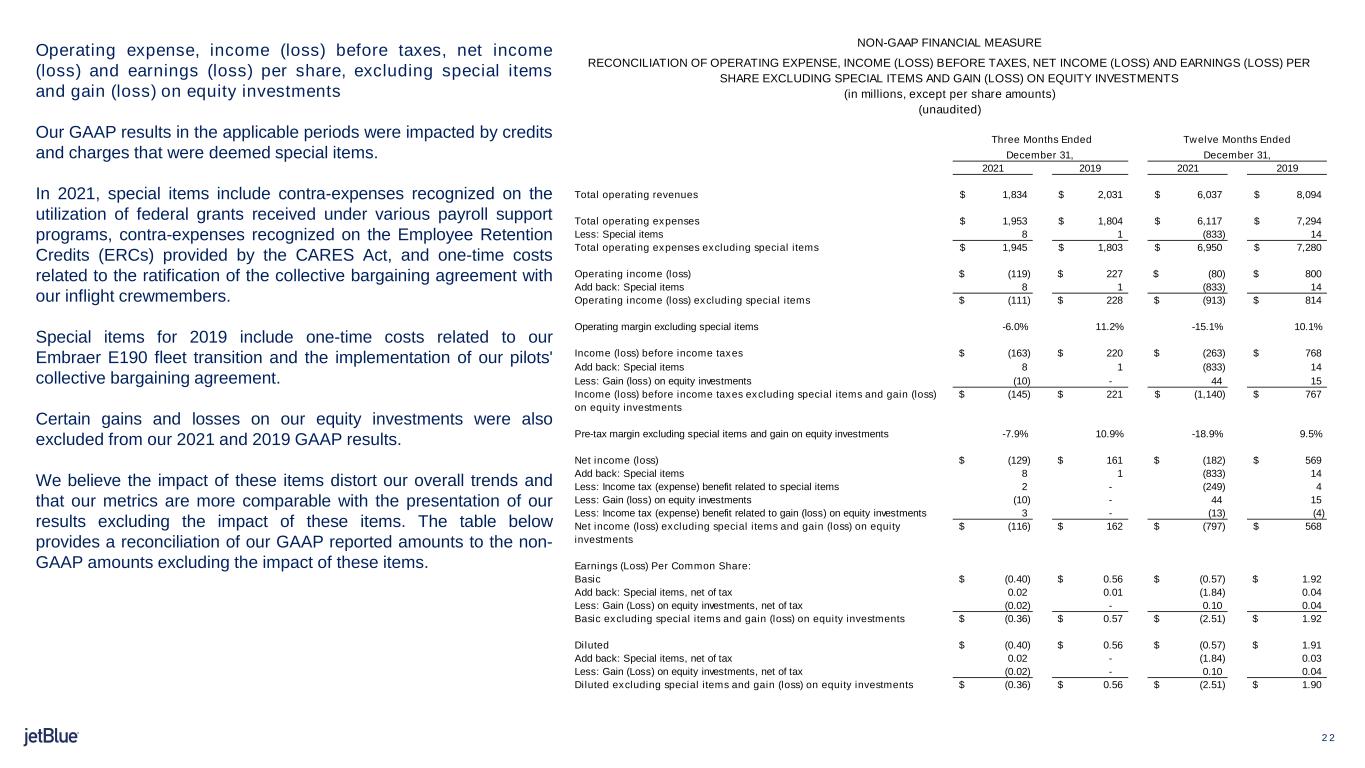
Operating expense, income (loss) before taxes, net income (loss) and earnings (loss) per share, excluding special items and gain (loss) on equity investments
Our GAAP results in the applicable periods were impacted by credits and charges that were deemed special items.
In 2021, special items include contra-expenses recognized on the utilization of federal grants received under various payroll support programs, contra-expenses recognized on the Employee Retention Credits (ERCs) provided by the CARES Act, and one-time costs related to the ratification of the collective bargaining agreement with our inflight crewmembers.
Special items for 2019 include one-time costs related to our Embraer E190 fleet transition and the implementation of our pilots' collective bargaining agreement.
Certain gains and losses on our equity investments were also excluded from our 2021 and 2019 GAAP results.
We believe the impact of these items distort our overall trends and that our metrics are more comparable with the presentation of our results excluding the impact of these items. The table below provides a reconciliation of our GAAP reported amounts to the non-GAAP amounts excluding the impact of these items.
| | | | | | | | | | | | | | | | | | | | | | | | |
| NON-GAAP FINANCIAL MEASURE |
| RECONCILIATION OF OPERATING EXPENSE, INCOME (LOSS) BEFORE TAXES, NET INCOME (LOSS) AND EARNINGS (LOSS) PER SHARE EXCLUDING SPECIAL ITEMS AND GAIN (LOSS) ON EQUITY INVESTMENTS |
| (in millions, except per share amounts) |
| (unaudited) |
| | | | | | | | |
| | | |
| Three Months Ended December 31, | | Twelve Months Ended
December 31, | |
| 2021 | | 2019 | | 2021 | | 2019 | |
| Total operating revenues | $ | 1,834 | | | $ | 2,031 | | | $ | 6,037 | | | $ | 8,094 | | |
| | | | | | | | |
| Total operating expenses | $ | 1,953 | | | $ | 1,804 | | | $ | 6,117 | | | $ | 7,294 | | |
| Less: Special items | 8 | | | 1 | | | (833) | | | 14 | | |
| Total operating expenses excluding special items | $ | 1,945 | | | $ | 1,803 | | | $ | 6,950 | | | $ | 7,280 | | |
| | | | | | | | |
| Operating income (loss) | $ | (119) | | | $ | 227 | | | $ | (80) | | | $ | 800 | | |
| Add back: Special items | 8 | | | 1 | | | (833) | | | 14 | | |
| Operating income (loss) excluding special items | $ | (111) | | | $ | 228 | | | $ | (913) | | | $ | 814 | | |
| | | | | | | | |
| Operating margin excluding special items | -6.0 | % | | 11.2 | % | | -15.1 | % | | 10.1 | % | |
| | | | | | | | |
| Income (loss) before income taxes | $ | (163) | | | $ | 220 | | | $ | (263) | | | $ | 768 | | |
| Add back: Special items | 8 | | | 1 | | | (833) | | | 14 | | |
| Less: Gain (loss) on equity investments | (10) | | | — | | | 44 | | | 15 | | |
| Income (loss) before income taxes excluding special items and gain (loss) on equity investments | $ | (145) | | | $ | 221 | | | $ | (1,140) | | | $ | 767 | | |
| | | | | | | | |
| Pre-tax margin excluding special items and gain (loss) on equity investments | -7.9 | % | | 10.9 | % | | (18.9) | % | | 9.5 | % | |
| | | | | | | | |
| Net income (loss) | $ | (129) | | | $ | 161 | | | $ | (182) | | | $ | 569 | | |
| Add back: Special items | 8 | | | 1 | | | (833) | | | 14 | | |
| Less: Income tax (expense) benefit related to special items | 2 | | | — | | | (249) | | | 4 | | |
| Less: Gain (loss) on equity investments | (10) | | | — | | | 44 | | | 15 | | |
| Less: Income tax (expense) benefit related to gain (loss) on equity investments | 3 | | | — | | | (13) | | | (4) | | |
| Net income (loss) excluding special items and gain (loss) on equity investments | $ | (116) | | | $ | 162 | | | $ | (797) | | | $ | 568 | | |
| | | | | | | | |
| Earnings (Loss) Per Common Share: | | | | | | | | |
| Basic | $ | (0.40) | | | $ | 0.56 | | | $ | (0.57) | | | $ | 1.92 | | |
| Add back: Special items, net of tax | 0.02 | | | 0.01 | | | (1.84) | | | 0.04 | | |
| Less: Gain (Loss) on equity investments, net of tax | (0.02) | | | — | | | 0.10 | | | 0.04 | | |
| Basic excluding special items and gain (loss) on equity investments | $ | (0.36) | | | $ | 0.57 | | | $ | (2.51) | | | $ | 1.92 | | |
| | | | | | | | |
| Diluted | $ | (0.40) | | | $ | 0.56 | | | $ | (0.57) | | | $ | 1.91 | | |
| Add back: Special items, net of tax | 0.02 | | | — | | | (1.84) | | | 0.03 | | |
| Less: Gain (Loss) on equity investments, net of tax | (0.02) | | | — | | | 0.10 | | | 0.04 | | |
| Diluted excluding special items and gain (loss) on equity investments | $ | (0.36) | | | $ | 0.56 | | | $ | (2.51) | | | $ | 1.90 | | |
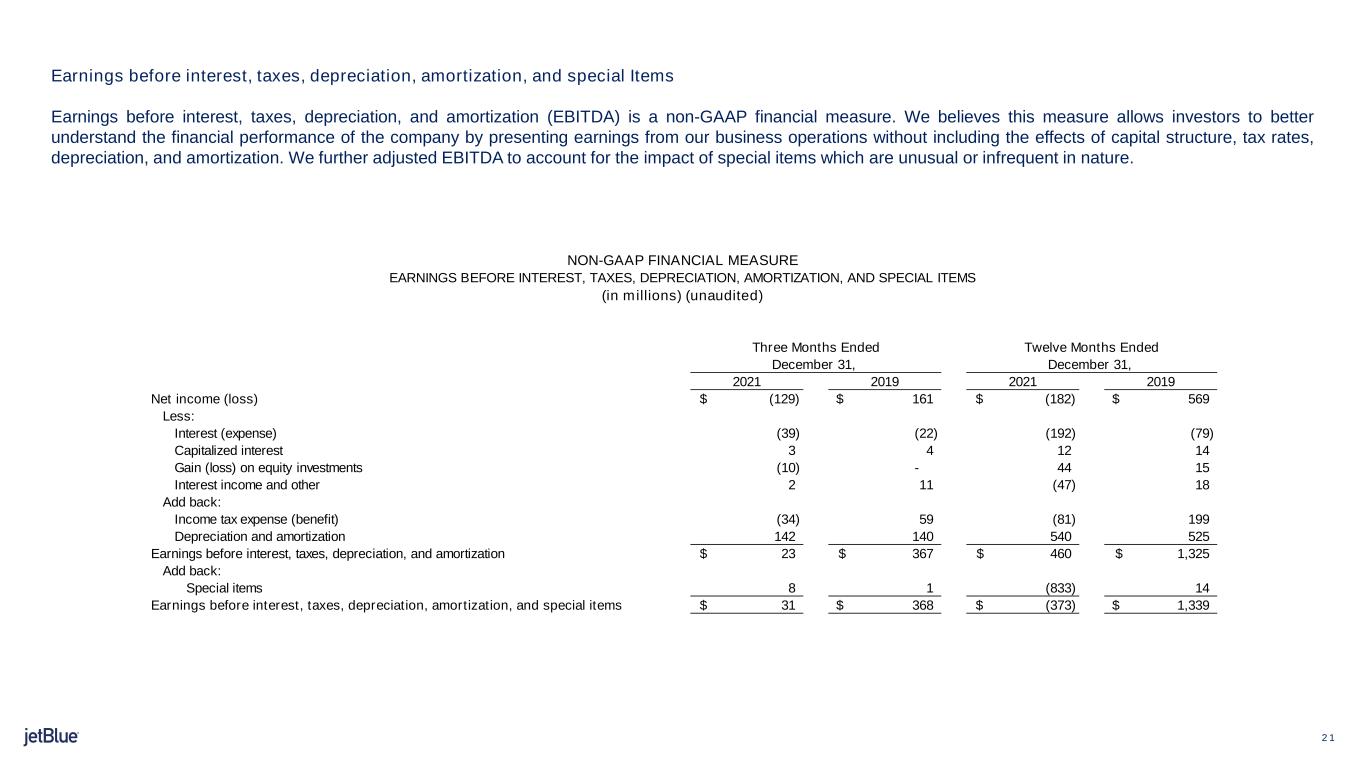
Earnings before interest, taxes, depreciation, amortization, and special Items
Earnings before interest, taxes, depreciation, and amortization (EBITDA) is a non-GAAP financial measure. We believe this measure allows investors to better understand the financial performance of the company by presenting earnings from our business operations without including the effects of capital structure, tax rates, depreciation, and amortization. We further adjusted EBITDA to account for the impact of special items which are unusual or infrequent in nature.
| | | | | | | | | | | | | | | | | | | | | | | |
| NON-GAAP FINANCIAL MEASURE |
| EARNINGS BEFORE INTEREST, TAXES, DEPRECIATION, AMORTIZATION, AND SPECIAL ITEMS |
| (in millions) (unaudited) |
| | | | | | | |
| | | | | | | |
| Three Months Ended December 31, | | Twelve Months Ended December 31, |
| 2021 | | 2019 | | 2021 | | 2019 |
| Net income (loss) | $ | (129) | | | $ | 161 | | | $ | (182) | | | $ | 569 | |
| Less: | | | | | | | |
| Interest (expense) | (39) | | | (22) | | | (192) | | | (79) | |
| Capitalized interest | 3 | | | 4 | | | 12 | | | 14 | |
| Gain (loss) on equity investment | (10) | | | — | | | 44 | | | 15 | |
| Interest income and other | 2 | | | 11 | | | (47) | | | 18 | |
| Add back: | | | | | | | |
| Income tax expense (benefit) | (34) | | | 59 | | | (81) | | | 199 | |
| Depreciation and amortization | 142 | | | 140 | | | 540 | | | 525 | |
| Earnings before interest, taxes, depreciation, and amortization | $ | 23 | | | $ | 367 | | | $ | 460 | | | $ | 1,325 | |
| Add back: | | | | | | | |
| Special items | 8 | | | 1 | | | (833) | | | 14 | |
| Earnings before interest, taxes, depreciation, amortization, and special items | $ | 31 | | | $ | 368 | | | $ | (373) | | | $ | 1,339 | |
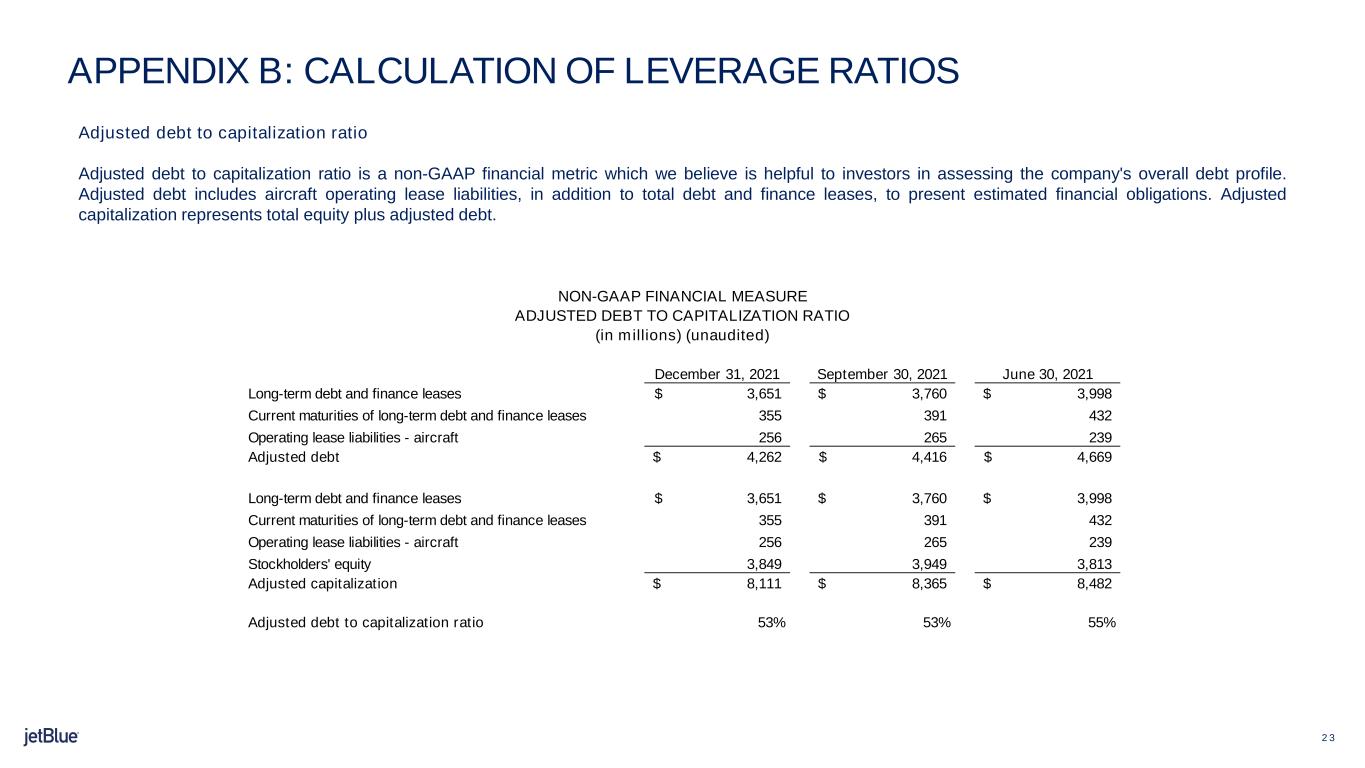
Adjusted debt to capitalization ratio
Adjusted debt to capitalization ratio is a non-GAAP financial metric which we believe is helpful to investors in assessing the company's overall debt profile. Adjusted debt includes aircraft operating lease liabilities, in addition to total debt and finance leases, to present estimated financial obligations. Adjusted capitalization represents total equity plus adjusted debt.
| | | | | | | | | | | | | | | | | |
| NON-GAAP FINANCIAL MEASURE |
| ADJUSTED DEBT TO CAPITALIZATION RATIO |
| (in millions) (unaudited) |
| | | | | |
| December 31, 2021 | | December 31, 2020 | | December 31, 2019 |
| | | | | |
| Long-term debt and finance leases | $ | 3,651 | | | $ | 4,413 | | | $ | 1,990 | |
| Current maturities of long-term debt and finance leases | 355 | | | 450 | | | 344 | |
| Operating lease liabilities - aircraft | 256 | | | 273 | | | 183 | |
| Adjusted debt | $ | 4,262 | | | $ | 5,136 | | | $ | 2,517 | |
| | | | | |
| Long-term debt and finance leases | $ | 3,651 | | | $ | 4,413 | | | $ | 1,990 | |
| Current maturities of long-term debt and finance leases | 355 | | | 450 | | | 344 | |
| Operating lease liabilities - aircraft | 256 | | | 273 | | | 183 | |
| Stockholders' equity | 3,849 | | | 3,951 | | | 4,799 | |
| Adjusted capitalization | $ | 8,111 | | | $ | 9,087 | | | $ | 7,316 | |
| | | | | |
| Adjusted debt to capitalization ratio | 53 | % | | 57 | % | | 34 | % |
CONTACTS
JetBlue Investor Relations
Tel: +1 718 709 2202
JetBlue Corporate Communications
Tel: +1 718 709 3089
 Investor Update
Investor Update: January 27, 2022
This update provides JetBlue’s investor guidance for the first quarter ending March 31, 2022 and full year 2022.
| | | | | | | | |
| First Quarter and Full-Year 2022 Outlook | Estimated 1Q 2022 | Estimated FY 2022 |
| | |
| Capacity and Revenue | | |
| Available Seat Miles (ASMs) vs 2019 | (1%) - 2% | 11% - 15% |
| Revenue vs 2019 | (11%) - (16%) | N/A |
| Expense | | |
CASM Ex-Fuel1 (Non-GAAP) vs 2019 | 13% - 15% | 1% - 5% |
| Operating (Expenses) Related to Other Non-Airline Businesses | ($15) million | ($50) - ($60) million |
| | |
Estimated Fuel Price per Gallon, Net of Hedges2 | $2.593 | N/A |
| Interest (Expense) | ($35) - ($40) million | ($140) - ($150) million |
| Tax Rate | ~28% | ~28% |
Diluted Share Count4 | ~320 million | ~326 million |
| Capital Expenditures | ~$175 million | ~$1 billion |
1 CASM Ex-Fuel excludes fuel and related taxes, special items and operating expenses related to non-airline businesses. With respect to JetBlue’s CASM Ex-Fuel and guidance, JetBlue is not able to provide a reconciliation of the non-GAAP financial measure to GAAP because the excluded items have not yet occurred and cannot be reasonably predicted. The reconciling information that is unavailable would include a forward-looking range of financial performance measures beyond our control, such as fuel costs, which are subject to many economic and political factors beyond our control.
2 Includes fuel taxes.
3 JetBlue utilizes the forward Brent crude curve and the forward Brent crude to heating oil crack spread to calculate the unhedged portion of its prompt quarter. As of January 14, 2022, the forward Brent crude per barrel price was $85 and the crack spread averaged $23 per barrel for the first quarter of 2022.
4 Average share count for the period. The number of shares used in JetBlue's actual earnings per share will likely be different than those stated above.
Investor Update
Fuel Hedges
As of January 27, 2022 JetBlue has not entered into any advanced fuel derivative contracts.
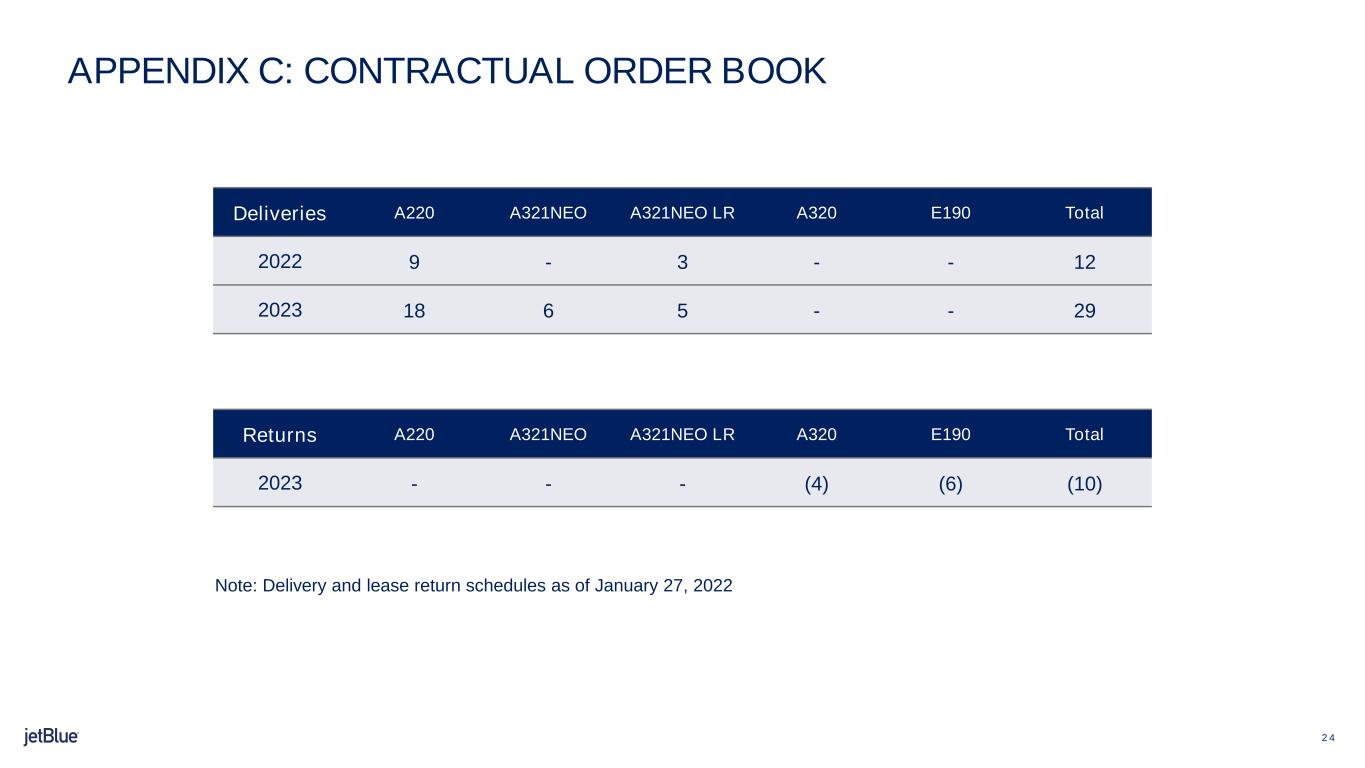
Order Book
As of December 31, 2021 JetBlue’s fleet was comprised of 130 Airbus A320 aircraft, 84 Airbus A321, 8 Airbus A220 and 60 EMBRAER E190 aircraft, for a total of 282 aircraft.
JetBlue’s contractual order book as of December 31, 2021:
| | | | | | | | | | | | | | | |
| | |
| Year | A220 | A321 NEO | A321NEO LR | TOTAL | |
| | | | | |
| | | | | |
| | | | | |
| | | | | |
| | | | | |
| | | | | |
| 2022 | 9 | — | 3 | 12 | |
| 2023 | 18 | 6 | 5 | 29 | |
| | | | | |
Investor Update
Forward Looking Statements
This Investor Update (or otherwise made by JetBlue or on JetBlue’s behalf) contain various forward-looking statements within the meaning of Section 27A of the Securities Act of 1933, as amended, or the Securities Act, and Section 21E of the Securities Exchange Act of 1934, as amended, or the Exchange Act, which represent our management’s beliefs and assumptions concerning future events. These statements are intended to qualify for the “safe harbor” from liability established by the Private Securities Litigation Reform Act of 1995. When used in this document and in documents incorporated herein by reference, the words “expects,” “plans,” “anticipates,” “indicates,” “believes,” “forecast,” “guidance,” “outlook,” “may,” “will,” “should,” “seeks,” “targets” and similar expressions are intended to identify forward-looking statements. Forward-looking statements involve risks, uncertainties and assumptions, and are based on information currently available to us. Actual results may differ materially from those expressed in the forward-looking statements due to many factors, including, without limitation, the coronavirus (“COVID-19”) pandemic, and the outbreak of any other disease or similar public health threat that affects travel demand or behavior; restrictions on our business related to the financing we accepted under various federal government support programs such as the Coronavirus Aid, Relief, and Economic Security Act, the Consolidated Appropriations Act, and the American Rescue Plan Act; our significant fixed obligations and substantial indebtedness; risk associated with execution of our strategic operating plans in the near-term and long-term; the recording of a material impairment loss of tangible or intangible assets; our extremely competitive industry; volatility in financial and credit markets which could affect our ability to obtain debt and/or lease financing or to raise funds through debt or equity issuances; volatility in fuel prices, maintenance costs and interest rates; our reliance on high daily aircraft utilization; our ability to implement our growth strategy; our ability to attract and retain qualified personnel and maintain our culture as we grow; our reliance on a limited number of suppliers, including for aircraft, aircraft engines and parts and vulnerability to delays by those suppliers; our dependence on the New York and Boston metropolitan markets and the effect of increased congestion in these markets; our reliance on automated systems and technology; the outcome of the lawsuit filed by the Department of Justice and certain state Attorneys General against us related to our Northeast Alliance entered into with American Airlines, our being subject to potential unionization, work stoppages, slowdowns or increased labor costs; our presence in some international emerging markets that may experience political or economic instability or may subject us to legal risk; reputational and business risk from information security breaches or cyber-attacks; changes in or additional domestic or foreign government regulation, including new or increased tariffs; changes in our industry due to other airlines' financial condition; acts of war or terrorism; global economic conditions or an economic downturn leading to a continuing or accelerated decrease in demand for air travel; adverse weather conditions or natural disasters; and external geopolitical events and conditions. It is routine for our internal projections and expectations to change as the year or each quarter in the year progresses, and therefore it should be clearly understood that the internal projections, beliefs, and assumptions upon which we base our expectations may change prior to the end of each quarter or year.
Given the risks and uncertainties surrounding forward-looking statements, you should not place undue reliance on these statements. You should understand that many important factors, in addition to those discussed or incorporated by reference in this Investor Update, could cause our results to differ materially from those expressed in the forward-looking statements. In light of these risks and uncertainties, the forward-looking events discussed in this Investor Update might not occur. Our forward-looking statements speak only as of the date of this Investor Update. Other than as required by law, we undertake no obligation to update or revise forward-looking statements, whether as a result of new information, future events, or otherwise.