Exhibit 99.1

NEWS RELEASE
Global Crossing Airlines Announces $31.5M in Revenue for Q2
with Adjusted EBITDAR of $5.3M
Updates Revenue Forecast to $150M in 2023
August 9, 2023
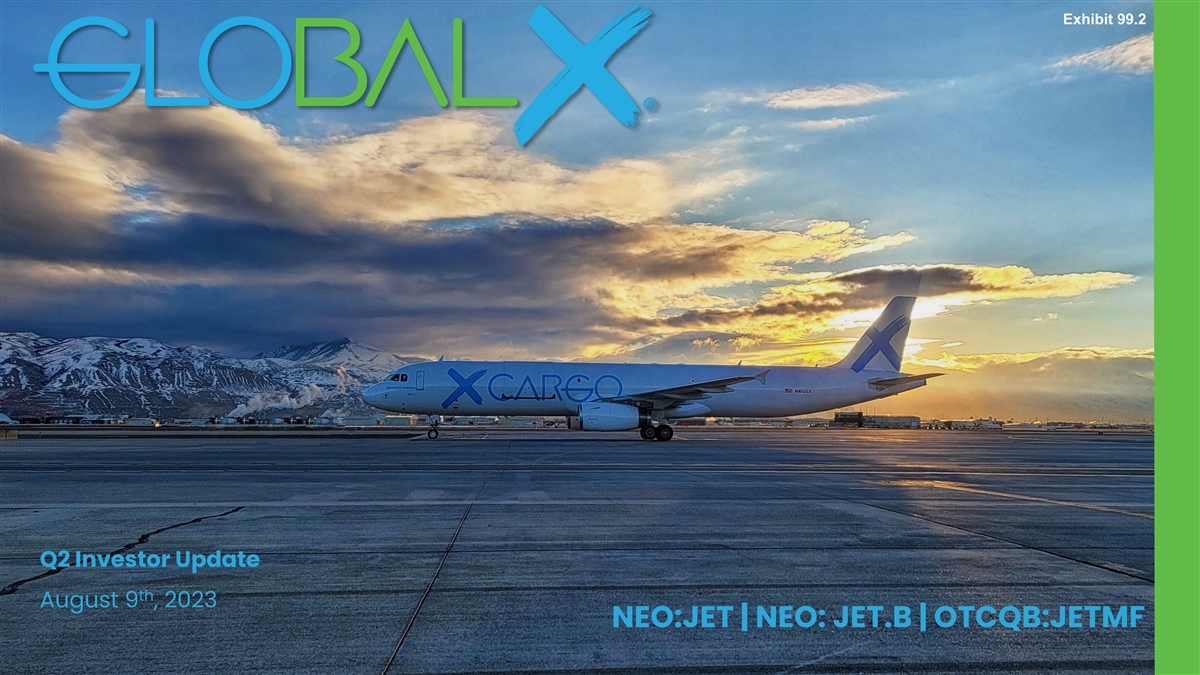
MIAMI, FL (GLOBE NEWSWIRE) — Global Crossing Airlines Group, Inc. (JET: NEO; JET.B: NEO; JETMF: OTCQB) (the “Company” or “GlobalX”) today reported second quarter 2023 financial results. All figures are in United States dollars and prepared in accordance with U.S. GAAP.
Second Quarter 2023 Financial Results
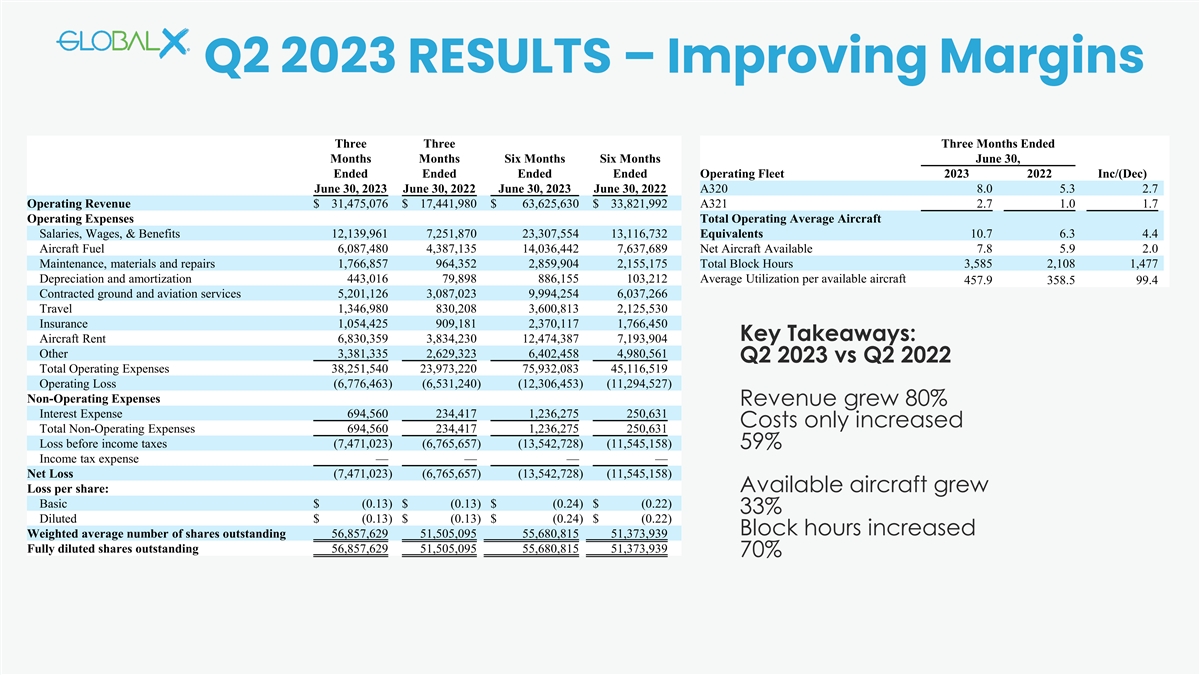
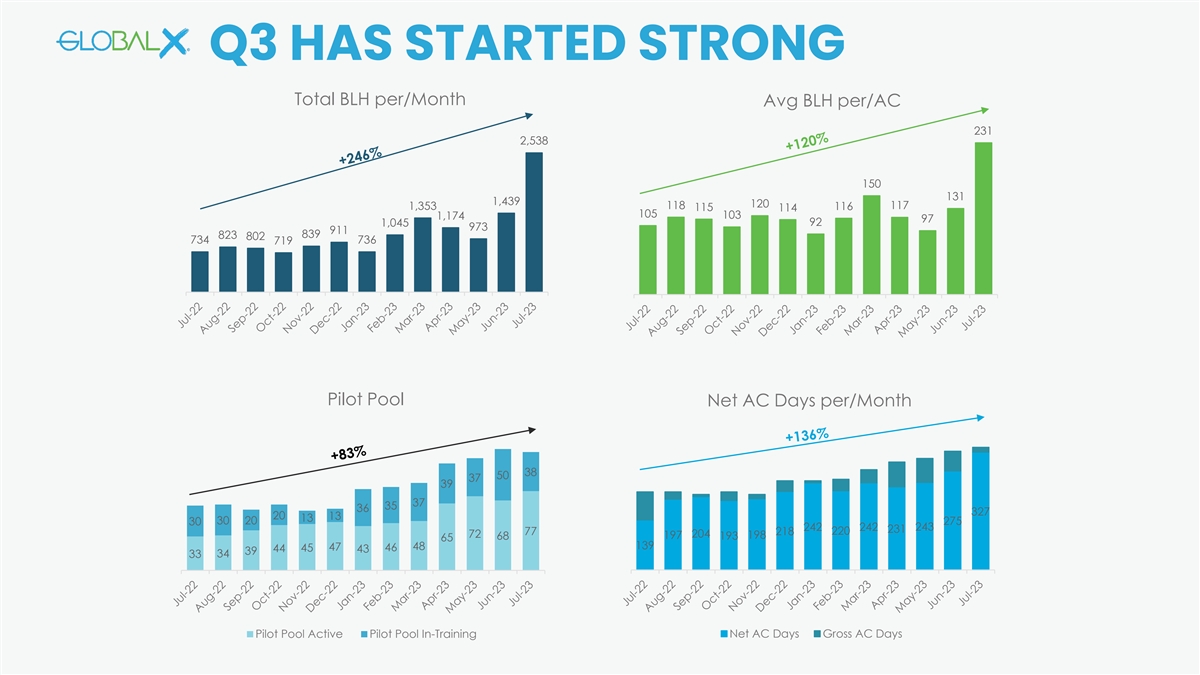
Total operating revenue for Q2 2023 was $31.5 million. This represents an increase of $14 million or 80.5% when compared to Q2 2022. In addition, GlobalX operated 3,585 revenue block hours in Q2 2023 representing an 70% increase over the number of block hours operated in Q2 2022. This also compares favorably to 3,134 block hours operated in Q1 2023, an increase of 14%.
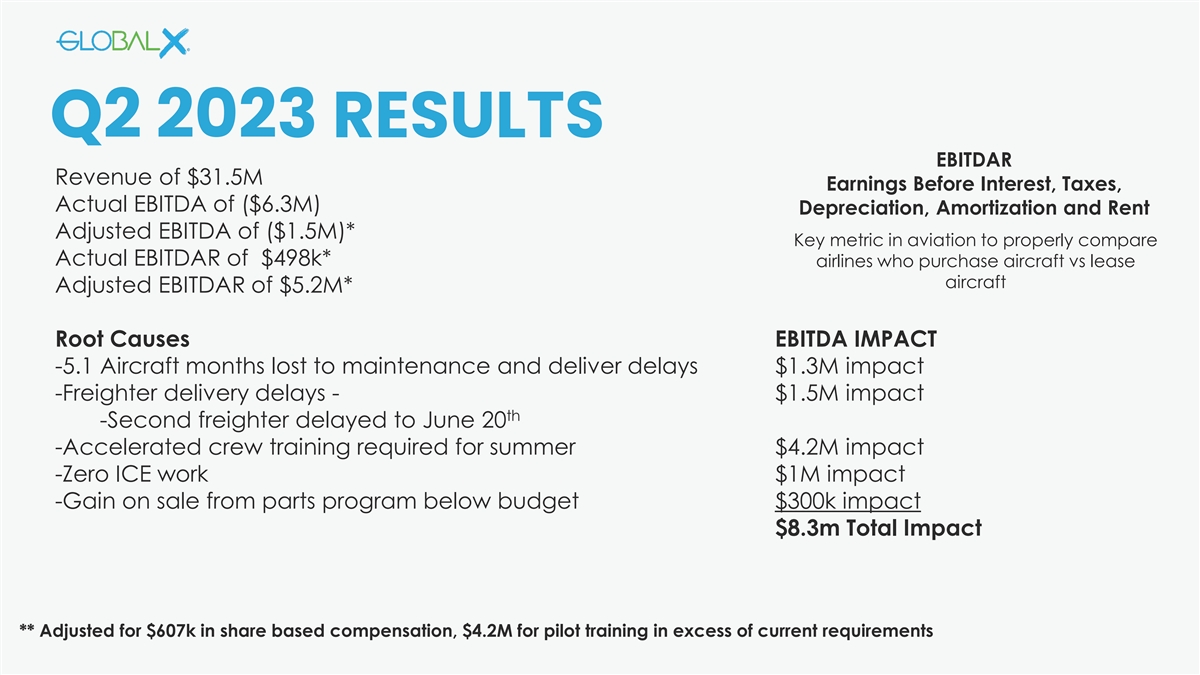
Q2 2023 results on an Adjusted EBITDAR(1) basis were $5.3 million, an Adjusted EBITDA(1) basis of approximately ($1.5) million and Adjusted EPS(1) of $(0.05). On a year over year basis the Company saw revenue increase by 80%, while costs only increased by 59%; driving substantial margin improvements as it ramps up to the scale required to generate sustainable and consistent profits.
The Company’s financial results were negatively impacted by a number of factors, including: (i) accelerated cockpit crew hiring and training to prepare for a busy 2023 summer schedule resulting in an increase of approximately $4.2 million in training expenses; (ii) continued delay in delivery of the Company’s second A321 freighter which resulted in lost ACMI revenue of approximately $2.4 million; and (iii) continued MRO delays in completing scheduled maintenance heavy checks on two of the Company’s A320s which resulted in 26% of the Company’s aircraft not being available for operations over the course of the quarter.
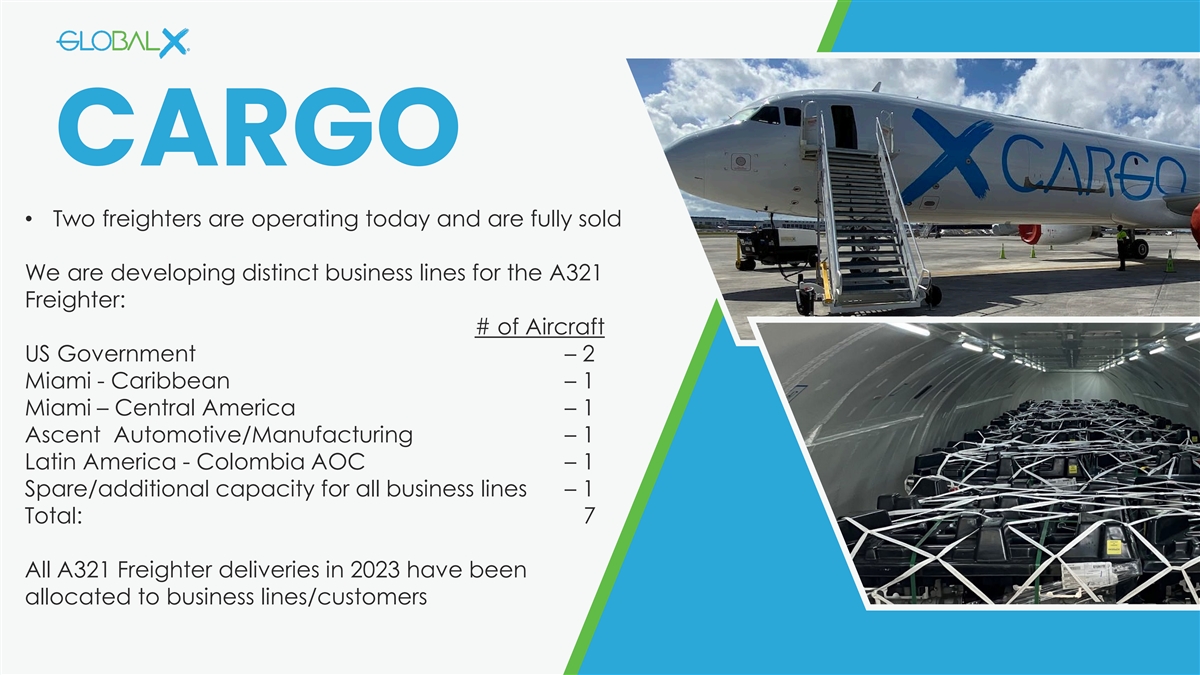
Ed Wegel, Chair and CEO of the Company stated “We made great progress in Q2 putting in place the people, systems and training for both the summer flying and to be prepared for the delivery of six additional aircraft in the second half of this year. This has allowed us to fly 2,538 block hours in July and keeps us on track to meet our block hour and revenue goals for the year. We have put systems and procedures in place to reduce the industry wide delays at MROs which will increase available aircraft time, and reduce freighter conversion time. Two of our next 4 freighters have already been converted to cargo, which will eliminate the delivery delays we experienced on our first two freighters.”
Q2 Highlights
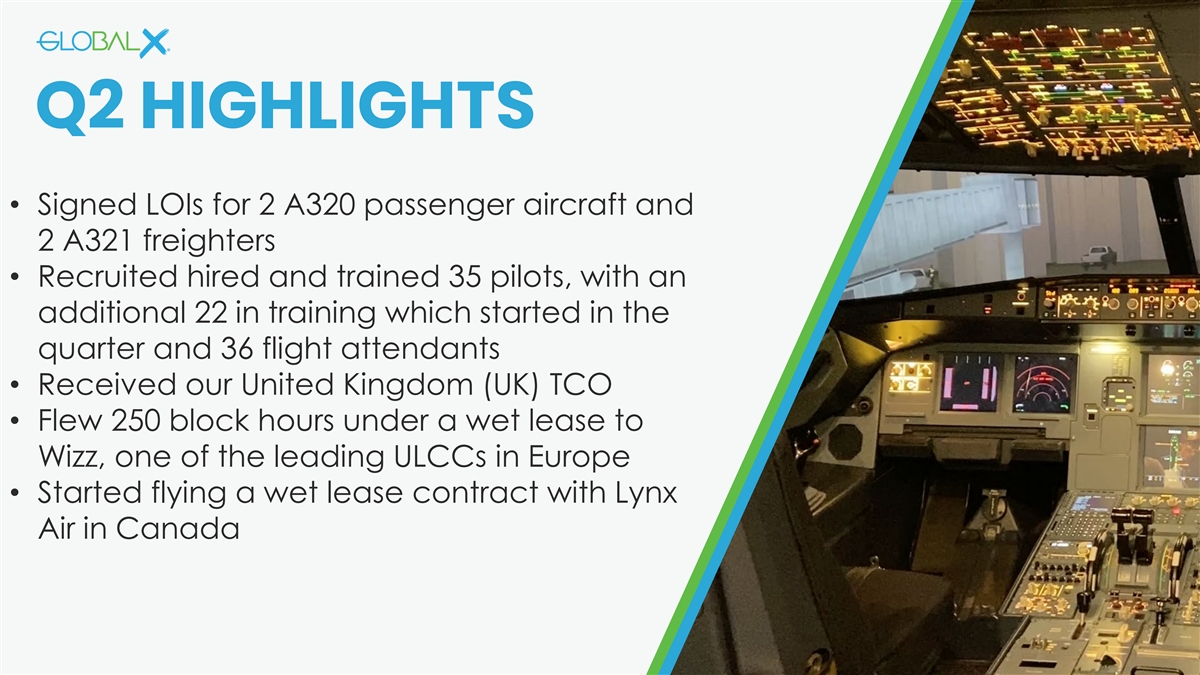
| • | Signed LOIs for two A320 passenger aircraft and two A321 freighters |
| • | Recruited hired and trained 35 pilots, with an additional 22 in training which started in the quarter and 36 flight attendants |
| • | The Company received its United Kingdom (UK) TCO |
| • | Flew 250 block hours under a wet lease to Wizz, one of the leading ULCCs in Europe |
| • | Started flying a wet lease contract with Lynx Air in Canada |
| • | A second A321 freighter entered revenue service in late June |
Liquidity
GlobalX ended the quarter with $8.4M in cash and restricted cash which is up 53% from the amount of cash and restricted cash available at December 31, 2022.
2023 Update and Outlook
Q3 Update
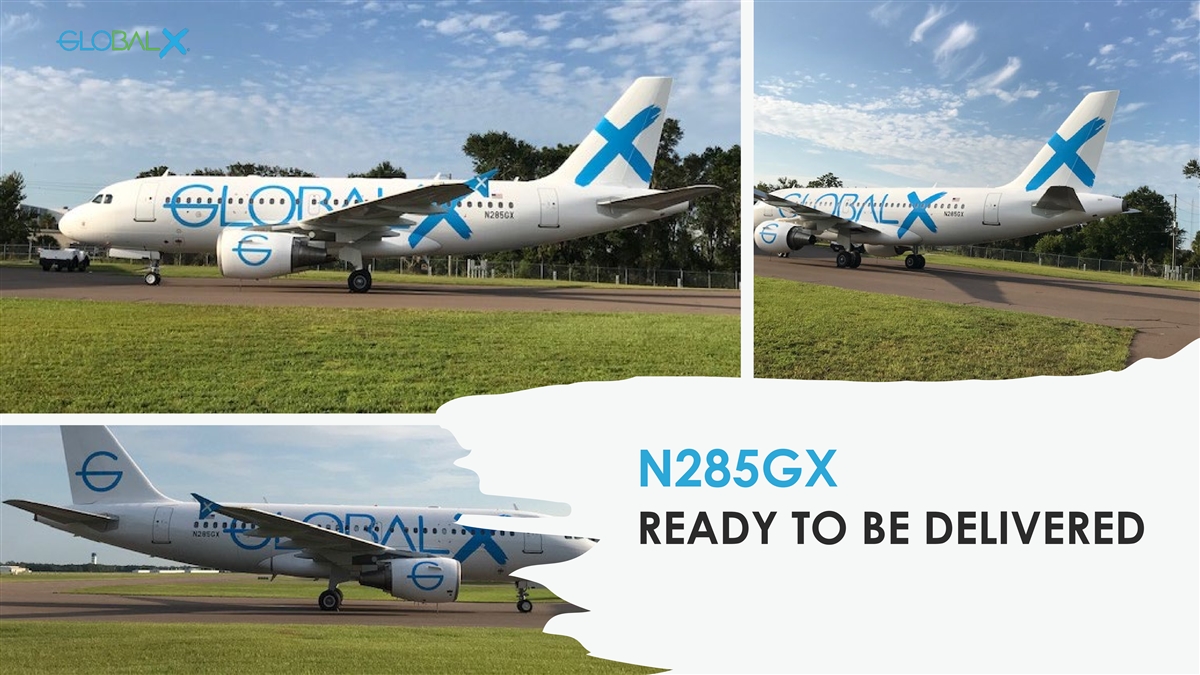
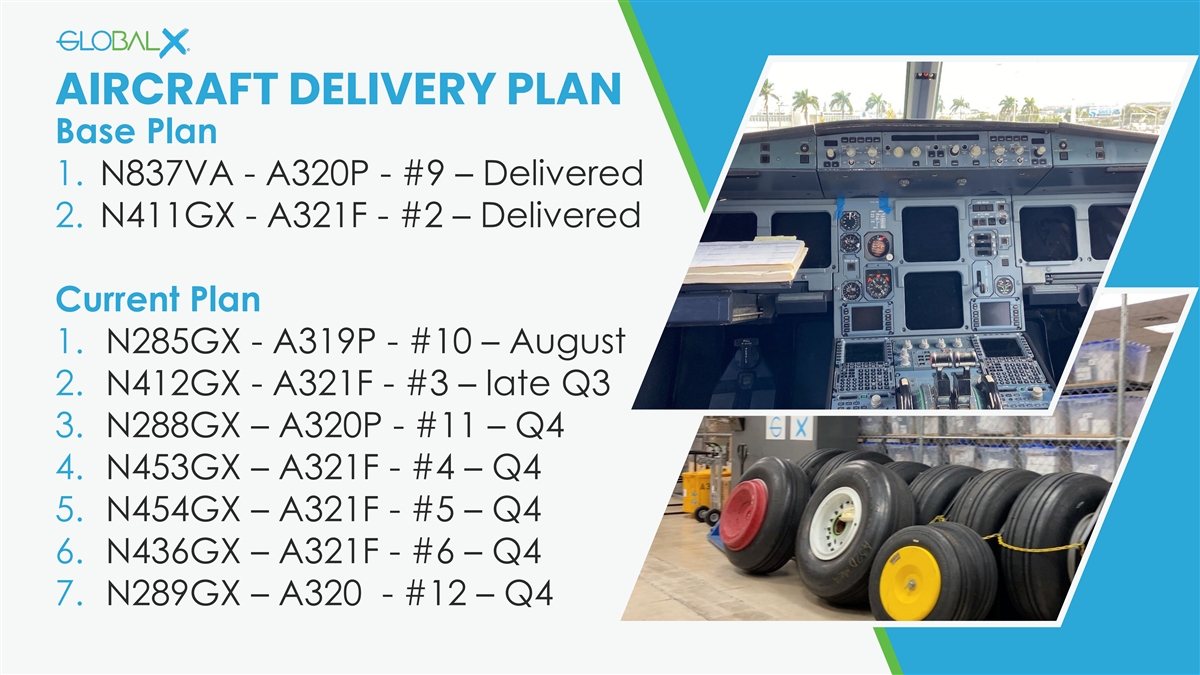
| • | Will take delivery of one A319, one A320 and one A321 freighter |
| • | Will complete the financing and sign the lease for the maintenance facility to be built at Ft. Lauderdale Int’l Airport |
| • | Projected to fly over 6,000 block hours in the quarter |
| • | Signed LOI for two additional A321 freighters for delivery this year |
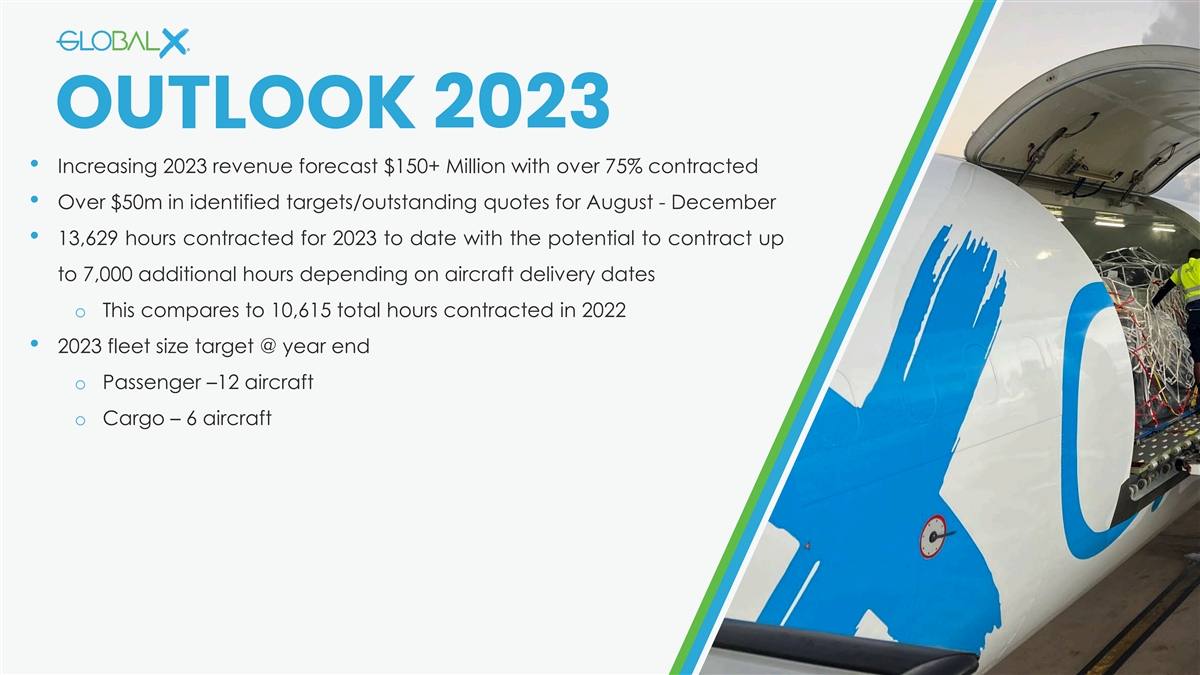
Guidance items provided in this release are based on Company’s current estimates and are not a guarantee of future performance. The Company expects to operate over 6,000 block hours in Q3 and is increasing its revenue guidance for 2023 to $150 million, a 54% increase over 2022. Currently $112 million of this revenue, or approximately 75%, is contracted. The Company is currently bidding on average $2M worth of contracts a day and has a current pipeline of potential contracts for 2023 of approx. $50M.
To support this growth, the Company is looking to take delivery of three more passenger aircraft in 2023 (August, October and December), plus up to four more A321F aircraft. To date for all of 2023, the Company has contracted for 13,629 block hours and expect to contract an additional 7,000 hours subject to actual aircraft delivery dates. This compares to 10,615 block hours contracted in all of 2022.
| (1) | Refer below to the section “Non-GAAP Financial Measures” for additional information. |
Conference Call/Webcast Detail
GlobalX will be hosting a webinar on August 9th, 2023 to provide a business update and discuss the Q2 results.
When: August 9, 2023, 01:00 PM Eastern Time (US and Canada)
Topic: Global Crossing Airlines – Q2 2023 Earnings Release & Management Update
Register in advance for this webinar:
https://us02web.zoom.us/webinar/register/WN_EyGijbQ9TcK0ycAng_UvKQ#/registration
After registering, you will receive a confirmation email containing information about joining the webinar.
For more information, please contact:
Ryan Goepel, Chief Financial Officer
Email: [email protected]
Tel: 786.751.8503
| JET: NEO | www.globalairlinesgroup.com | Page 2 of 8 |
GLOBAL CROSSING AIRLINES GROUP INC.
CONDENSED CONSOLIDATED BALANCE SHEETS
| June 30, 2023 (Unaudited) |
December 31, 2022 |
|||||||
| Current Assets |
||||||||
| Cash and cash equivalents |
$ | 4,157,386 | $ | 1,875,673 | ||||
| Restricted cash |
$ | 4,268,749 | $ | 3,585,261 | ||||
| Accounts receivable, net of allowance |
$ | 5,496,021 | $ | 2,664,174 | ||||
| Prepaid expenses and other current assets |
$ | 2,913,836 | $ | 2,193,449 | ||||
| Current assets held for sale |
$ | 704,777 | $ | 1,405,741 | ||||
|
|
|
|
|
|||||
| Total Current Assets |
$ | 17,540,769 | $ | 11,724,298 | ||||
| Property and equipment, net |
$ | 3,105,637 | $ | 2,441,288 | ||||
| Finance leases, net |
$ | 3,826,247 | $ | 2,710,899 | ||||
| Operating lease right-of-use assets |
$ | 61,602,362 | $ | 27,952,609 | ||||
| Deposits and other assets |
$ | 9,033,168 | $ | 6,334,878 | ||||
|
|
|
|
|
|||||
| Total Assets |
$ | 95,108,183 | $ | 51,163,973 | ||||
|
|
|
|
|
|||||
| Current liabilities |
||||||||
| Accounts payable |
$ | 9,913,030 | $ | 4,997,080 | ||||
| Accrued liabilities |
$ | 13,122,583 | $ | 9,458,629 | ||||
| Deferred revenue |
$ | 7,778,549 | $ | 3,200,664 | ||||
| Customer deposits |
$ | 5,875,991 | $ | 1,617,337 | ||||
| Current portion of notes payable |
$ | 8,507,869 | $ | 1,810,468 | ||||
| Current portion of long-term operating leases |
$ | 9,148,095 | $ | 6,445,915 | ||||
| Current portion of finance leases |
$ | 488,342 | $ | 335,527 | ||||
|
|
|
|
|
|||||
| Total current liabilities |
$ | 54,834,459 | $ | 27,865,621 | ||||
| Other liabilities |
||||||||
| Note payable |
$ | 596,572 | $ | 5,081,294 | ||||
| Long-term operating leases |
$ | 54,465,291 | $ | 23,189,835 | ||||
| Other liabilities |
$ | 3,307,364 | $ | 2,282,892 | ||||
|
|
|
|
|
|||||
| Total other liabilities |
$ | 58,369,227 | $ | 30,554,020 | ||||
| Commitments and Contingencies |
$ | — | $ | — | ||||
| Equity (Deficit) |
||||||||
| Common stock - $.001 par value; 200,000,000 authorized; 57,307,695 and 53,440,482 issued and outstanding as of June 30, 2023 and December 31, 2022, respectively |
$ | 57,308 | $ | 53,440 | ||||
| Additional paid-in capital |
$ | 33,473,220 | $ | 30,774,197 | ||||
| Retained deficit |
$ | (51,626,030 | ) | $ | (38,083,304 | ) | ||
|
|
|
|
|
|||||
| Total stockholders’ equity (Deficit) |
$ | (18,095,502 | ) | $ | (7,255,667 | ) | ||
|
|
|
|
|
|||||
| Total Liabilities and Equity (Deficit) |
$ | 95,108,183 | $ | 51,163,973 | ||||
|
|
|
|
|
|||||
See accompanying notes to condensed consolidated financial statements.
| JET: NEO | www.globalairlinesgroup.com | Page 3 of 8 |
GLOBAL CROSSING AIRLINES GROUP INC.
CONDENSED CONSOLIDATED STATEMENTS OF OPERATIONS
(UNAUDITED)
| Three Months Ended June 30, 2023 |
Three Months Ended June 30, 2022 |
Six Months Ended June 30, 2023 |
Six Months Ended June 30, 2022 |
|||||||||||||
| Operating Revenue |
$ | 31,475,076 | $ | 17,441,980 | $ | 63,625,630 | $ | 33,821,992 | ||||||||
| Operating Expenses |
||||||||||||||||
| Salaries, Wages, & Benefits |
12,139,960 | 7,251,870 | 23,307,554 | 13,116,732 | ||||||||||||
| Aircraft Fuel |
6,087,480 | 4,387,135 | 14,036,442 | 7,637,689 | ||||||||||||
| Maintenance, materials and repairs |
1,766,857 | 964,352 | 3,325,581 | 2,155,175 | ||||||||||||
| Depreciation and amortization |
443,016 | 79,898 | 886,155 | 103,212 | ||||||||||||
| Contracted ground and aviation services |
5,201,126 | 3,087,023 | 10,053,937 | 6,037,266 | ||||||||||||
| Travel |
1,346,980 | 830,208 | 3,600,813 | 2,125,530 | ||||||||||||
| Insurance |
1,245,258 | 909,181 | 2,370,117 | 1,766,450 | ||||||||||||
| Aircraft Rent |
6,830,359 | 3,834,230 | 12,474,387 | 7,193,904 | ||||||||||||
| Other |
3,190,502 | 2,629,323 | 5,994,566 | 4,980,561 | ||||||||||||
|
|
|
|
|
|
|
|
|
|||||||||
| Total Operating Expenses |
38,251,539 | 23,973,220 | 76,049,552 | 45,116,519 | ||||||||||||
| Operating Loss |
(6,776,462 | ) | (6,531,240 | ) | (12,423,922 | ) | (11,294,527 | ) | ||||||||
| Non-Operating Expenses |
||||||||||||||||
| Interest Expense |
694,560 | 234,417 | 1,118,806 | 250,631 | ||||||||||||
|
|
|
|
|
|
|
|
|
|||||||||
| Total Non-Operating Expenses |
694,560 | 234,417 | 1,118,806 | 250,631 | ||||||||||||
|
|
|
|
|
|
|
|
|
|||||||||
| Loss before income taxes |
(7,471,022 | ) | (6,765,657 | ) | (13,542,728 | ) | (11,545,158 | ) | ||||||||
| Income tax expense |
— | — | — | — | ||||||||||||
|
|
|
|
|
|
|
|
|
|||||||||
| Net Loss |
(7,471,022 | ) | (6,765,657 | ) | (13,542,728 | ) | (11,545,158 | ) | ||||||||
| Loss per share: |
||||||||||||||||
| Basic |
$ | (0.13 | ) | $ | (0.13 | ) | $ | (0.24 | ) | $ | (0.22 | ) | ||||
| Diluted |
$ | (0.13 | ) | $ | (0.13 | ) | $ | (0.24 | ) | $ | (0.22 | ) | ||||
| Weighted average number of shares outstanding |
56,857,629 | 51,505,095 | 55,680,815 | 51,373,939 | ||||||||||||
|
|
|
|
|
|
|
|
|
|||||||||
| Fully diluted shares outstanding |
56,857,629 | 51,505,095 | 55,680,815 | 51,373,939 | ||||||||||||
|
|
|
|
|
|
|
|
|
|||||||||
See accompanying notes to condensed consolidated financial statements.
| JET: NEO | www.globalairlinesgroup.com | Page 4 of 8 |
GLOBAL CROSSING AIRLINES GROUP INC.
CONDENSED CONSOLIDATED STATEMENTS OF STOCKHOLDERS’ EQUITY
(UNAUDITED)
| Common Stock Number of Shares |
Amount | Additional Paid in Capital |
Retained Deficit |
Total | ||||||||||||||||
| Beginning – January 1, 2022 |
51,237,876 | $ | 51,237 | $ | 26,456,900 | $ | (22,262,307 | ) | $ | 4,245,830 | ||||||||||
| Issuance of shares – warrants and options exercised |
20,700 | 21 | 9,909 | — | 9,930 | |||||||||||||||
| Warrants issued |
2,130,642 | 2,130,642 | ||||||||||||||||||
| Share based compensation on stock options or RSUs |
— | — | 382,612 | — | 382,612 | |||||||||||||||
| Loss for the period |
— | — | — | (4,779,502 | ) | (4,779,502 | ) | |||||||||||||
|
|
|
|
|
|
|
|
|
|
|
|||||||||||
| Ending – March 31, 2022 |
51,258,576 | $ | 51,258 | $ | 28,980,063 | $ | (27,041,809 | ) | $ | 1,989,512 | ||||||||||
|
|
|
|
|
|
|
|
|
|
|
|||||||||||
| Issuance of shares – warrants and options exercised |
1,305,362 | 1,306 | 633,006 | — | 634,312 | |||||||||||||||
| Warrants issued |
— | — | — | — | — | |||||||||||||||
| Share based compensation on stock options or RSUs |
— | — | 343,007 | — | 343,007 | |||||||||||||||
| Subscription receivable |
— | — | — | — | — | |||||||||||||||
| Loss for the period |
— | — | — | (6,765,657 | ) | (6,765,657 | ) | |||||||||||||
|
|
|
|
|
|
|
|
|
|
|
|||||||||||
| Ending – June 30, 2022 |
52,563,938 | $ | 52,564 | $ | 29,956,076 | $ | (33,807,466 | ) | $ | (3,798,826 | ) | |||||||||
|
|
|
|
|
|
|
|
|
|
|
|||||||||||
| Common Stock Number of Shares |
Amount | Additional Paid in Capital |
Retained Deficit |
Total | ||||||||||||||||
| Beginning – January 1, 2023 |
53,440,482 | $ | 53,440 | $ | 30,774,197 | $ | (38,083,304 | ) | $ | (7,255,667 | ) | |||||||||
| Issuance of shares – options exercised |
150,000 | 150 | 67,106 | — | 67,256 | |||||||||||||||
| Issuance of shares - warrants exercised |
2,499,453 | 2,499 | 1,133,802 | — | 1,136,301 | |||||||||||||||
| Issuance of shares - share based compensation on RSUs |
208,416 | 208 | 500,421 | — | 500,629 | |||||||||||||||
| Loss for the period |
— | — | — | (6,071,704 | ) | (6,071,704 | ) | |||||||||||||
|
|
|
|
|
|
|
|
|
|
|
|||||||||||
| Ending – March 31, 2023 |
56,298,351 | $ | 56,297 | $ | 32,475,526 | $ | (44,155,008 | ) | $ | (11,623,185 | ) | |||||||||
|
|
|
|
|
|
|
|
|
|
|
|||||||||||
| Issuance of shares – options exercised |
— | — | — | — | — | |||||||||||||||
| Issuance of shares - warrants exercised |
227,630 | 228 | 221,434 | — | 221,662 | |||||||||||||||
| Issuance of shares - share based compensation on RSUs |
481,593 | 482 | 577,580 | — | 578,062 | |||||||||||||||
| Issuance of shares - ESPP |
300,121 | 301 | 198,680 | — | 198,981 | |||||||||||||||
| Loss for the period |
— | — | — | (7,471,022 | ) | (7,471,022 | ) | |||||||||||||
|
|
|
|
|
|
|
|
|
|
|
|||||||||||
| Ending – June 30, 2023 |
57,307,695 | $ | 57,308 | $ | 33,473,220 | $ | (51,626,030 | ) | $ | (18,095,502 | ) | |||||||||
|
|
|
|
|
|
|
|
|
|
|
|||||||||||
See accompanying notes to condensed consolidated financial statements.
| JET: NEO | www.globalairlinesgroup.com | Page 5 of 8 |
GLOBAL CROSSING AIRLINES GROUP INC.
CONDENSED CONSOLIDATED STATEMENTS OF CASH FLOWS
(UNAUDITED)
| For The Six Months Ended June 30, |
||||||||
| 2023 | 2022 | |||||||
| CASH FLOWS FROM OPERATING ACTIVITIES |
||||||||
| Net loss |
$ | (13,542,728 | ) | $ | (11,545,158 | ) | ||
| Adjustments to reconcile net loss to net cash (used in) operating activities: |
||||||||
| Depreciation |
893,988 | 103,210 | ||||||
| Bad debt expense (recovery) |
(17,540 | ) | 51,356 | |||||
| Gain on sale of spare parts |
(107,117 | ) | — | |||||
| Amortization of debt issue costs |
530,729 | — | ||||||
| Amortization of operating lease right of use asset |
3,646,948 | 1,913,191 | ||||||
| Share-based payments |
1,108,538 | 725,619 | ||||||
| Foreign exchange loss |
1,200 | 4,652 | ||||||
| Loss on sale of property |
135,772 | — | ||||||
| Interest on finance leases |
202,064 | — | ||||||
| Changes in assets and liabilities |
||||||||
| Accounts receivable |
(2,931,205 | ) | (488,316 | ) | ||||
| Assets held for sale |
700,964 | — | ||||||
| Prepaid expenses and other current assets |
(684,068 | ) | (563,886 | ) | ||||
| Accounts payable |
4,767,261 | 1,362,684 | ||||||
| Accrued liabilities and other liabilities |
12,344,141 | 3,614,574 | ||||||
| Operating lease obligations |
(3,668,823 | ) | (1,387,700 | ) | ||||
| Other liabilities |
232,457 | — | ||||||
|
|
|
|
|
|||||
| Net cash provided (used) in operating activities |
3,612,581 | (6,209,774 | ) | |||||
|
|
|
|
|
|||||
| CASH FLOWS FROM INVESTING ACTIVITIES |
||||||||
| Purchases of property and equipment |
(1,068,839 | ) | (863,775 | ) | ||||
| Deposits, deferred costs and other assets |
(2,969,133 | ) | (1,889,235 | ) | ||||
|
|
|
|
|
|||||
| Net cash used in investing activities |
(4,037,972 | ) | (2,753,010 | ) | ||||
|
|
|
|
|
|||||
| CASH FLOWS FROM FINANCING ACTIVITIES |
||||||||
| Payments to related party |
— | (197,558 | ) | |||||
| Principal payments on finance leases |
(220,895 | ) | — | |||||
| Proceeds on issuance of shares |
1,594,353 | 644,242 | ||||||
| Proceeds from note payable |
2,017,134 | 5,925,529 | ||||||
|
|
|
|
|
|||||
| Net cash provided by financing activities |
3,390,592 | 6,372,213 | ||||||
|
|
|
|
|
|||||
| Net increase (decrease) in cash, cash equivalents and restricted cash |
2,965,201 | (2,590,571 | ) | |||||
| Cash, cash equivalents and restricted cash - beginning of the period |
5,460,934 | 7,994,001 | ||||||
|
|
|
|
|
|||||
| Cash, cash equivalents and restricted cash - end of the period |
$ | 8,426,135 | $ | 5,403,430 | ||||
|
|
|
|
|
|||||
| Non-cash transactions |
||||||||
| Right-of-use (ROU) assets acquired through operating leases |
$ | 37,296,700 | 5,390,848 | |||||
| Equipment acquired through finance leases |
1,334,004 | — | ||||||
| Note Payable reductions through accounts receivable from sale of Assets held for sale |
336,385 | — | ||||||
| Cash paid for |
||||||||
| Interest |
$ | 472,572 | 15,665 | |||||
| Taxes |
— | — | ||||||
See accompanying notes to condensed consolidated financial statements.
| JET: NEO | www.globalairlinesgroup.com | Page 6 of 8 |
Non-GAAP Financial Measures
The Company evaluates its financial performance utilizing various accounting principles generally accepted in the United States of America (“GAAP”) and non-GAAP financial measures, including Adjusted operating expenses, Adjusted operating income (loss), Adjusted operating margin, Adjusted pre-tax income (loss), Adjusted pre-tax margin, Adjusted net income (loss), Adjusted diluted earnings (loss) per share, adjusted EBITDA and adjusted EBITDAR. These non-GAAP financial measures are provided as supplemental information to the financial information presented in this press release that is calculated and presented in accordance with GAAP and these non-GAAP financial measures are presented because management believes that they supplement or enhance management’s, analysts’ and investors’ overall understanding of the Company’s underlying financial performance and trends and facilitate comparisons among current, past and future periods.
Because the non-GAAP financial measures are not calculated in accordance with GAAP, they should not be considered superior to and are not intended to be considered in isolation or as a substitute for the related GAAP financial measures presented in the press release and may not be the same as or comparable to similarly titled measures presented by other companies due to possible differences in the method of calculation and in the items being adjusted. We encourage investors to review our financial statements and other filings with the Securities and Exchange Commission in their entirety and not to rely on any single financial measure.
The information below provides an explanation of certain adjustments reflected in the non-GAAP financial measures and shows a reconciliation of non-GAAP financial measures reported in this press release (other than forward-looking non-GAAP financial measures) to the most directly comparable GAAP financial measures. Within the financial tables presented, certain columns and rows may not add due to the use of rounded numbers. Per unit amounts presented are calculated from the underlying amounts.
| EBITDAR Reconciliation | Three Months Ended June 30, 2023 |
Three Months Ended June 30, 2022 |
Six Months Ended June 30, 2023 |
Six Months Ended June 30, 2022 |
||||||||||||
| Operating Loss |
$ | (6,776,463 | ) | $ | (6,531,240 | ) | $ | (12,423,922 | ) | $ | (11,294,527 | ) | ||||
| Depreciation and amortization |
443,016 | 79,898 | 886,155 | 103,212 | ||||||||||||
|
|
|
|
|
|
|
|
|
|||||||||
| EBITDA |
(6,333,447 | ) | (6,451,342 | ) | (11,537,767 | ) | (11,191,315 | ) | ||||||||
| Share-based compensation |
607,908 | 359,265 | 1,108,538 | 725,619 | ||||||||||||
| Aircraft Cargo Pilots Training and Excess Wages |
4,200,000 | 2,080,800 | 5,635,433 | 3,664,114 | ||||||||||||
| A321F lease accounting adj |
— | — | 240,000 | — | ||||||||||||
|
|
|
|
|
|
|
|
|
|||||||||
| Adjusted EBITDA |
(1,525,539 | ) | (4,011,277 | ) | (4,553,796 | ) | (6,801,583 | ) | ||||||||
| Aircraft Rent |
6,830,359 | 3,834,230 | 12,474,387 | 7,193,904 | ||||||||||||
|
|
|
|
|
|
|
|
|
|||||||||
| Adjusted EBITDAR |
$ | 5,304,820 | $ | (177,047 | ) | $ | 7,920,592 | $ | 392,322 | |||||||
|
|
|
|
|
|
|
|
|
|||||||||
| Reconciliation of Net Loss to Adjusted EPS | Three Months Ended June 30, 2023 |
Three Months Ended June 30, 2022 |
Six Months Ended June 30, 2023 |
Six Months Ended June 30, 2022 |
||||||||||||
| Net Loss |
$ | (7,471,022 | ) | $ | (6,765,657 | ) | $ | (13,542,728 | ) | $ | (11,545,158 | ) | ||||
| Share-based compensation |
607,908 | 359,265 | 1,108,538 | 725,619 | ||||||||||||
| Aircraft Cargo Pilots Training and Excess Wages |
4,200,000 | 2,080,800 | 5,635,433 | 3,664,114 | ||||||||||||
| A321F lease accounting adj |
— | — | 240,000 | — | ||||||||||||
|
|
|
|
|
|
|
|
|
|||||||||
| Adjusted Net Loss |
$ | (2,663,114 | ) | $ | (4,325,592 | ) | $ | (6,558,757 | ) | $ | (7,155,426 | ) | ||||
| Weighted average number of shares outstanding |
56,857,629 | 51,505,095 | 55,680,815 | 51,373,939 | ||||||||||||
|
|
|
|
|
|
|
|
|
|||||||||
| Adjusted EPS |
$ | (0.05 | ) | $ | (0.08 | ) | $ | (0.12 | ) | $ | (0.14 | ) | ||||
|
|
|
|
|
|
|
|
|
|||||||||
| JET: NEO | www.globalairlinesgroup.com | Page 7 of 8 |
About Global Crossing Airlines
GlobalX is a US 121 domestic flag and supplemental Airline flying the Airbus A320 family aircraft. GlobalX flies as a passenger ACMI and charter airline serving the US, Caribbean, European and Latin American markets. GlobalX is also now operating ACMI cargo service flying the A321 freighter. For more information, please visit www.globalxair.com.
Cautionary Note Regarding Forward-Looking Statements
This news release contains certain “forward looking statements” and “forward-looking information”, as defined under applicable United States and Canadian securities laws, concerning anticipated developments and events that may occur in the future. Forward-looking statements contained in this news release include, but are not limited to, statements with respect to the Company’s aircraft fleet size, the destinations that the Company intends to service, the expected delivery timelines for aircraft, future demand, increased block hours, future capacity estimates, future revenue expectations, expectations related to future debt or equity financing and contracted revenue.
In certain cases, forward-looking statements can be identified by the use of words such as “plans”, “expects” “budget”, “scheduled”, “estimates”, “forecasts”, “intends”, “anticipates” or variations of such words and phrases or statements that certain actions, events or results “may”, “could”, “would”, “might” or “will be taken”, “occur” or “be achieved” suggesting future outcomes, or other expectations, beliefs, plans, objectives, assumptions, intentions or statements about future events or performance. Forward-looking statements contained in this news release is based on certain factors and assumptions regarding, among other things, the receipt of financing to continue airline operations, the accuracy, reliability and success of GlobalX’s business model; GlobalX’s ability to accurately forecast demand; GlobalX will be able to successfully conclude definitive agreements for transactions subject to LOI; the timely receipt of governmental approvals; the success of airline operations of GlobalX; GlobalX’s ability to successfully enter new geographic markets; the legislative and regulatory environments of the jurisdictions where GlobalX will carry on business or have operations; the Company has or will have sufficient aircraft to provide the service; the impact of competition and the competitive response to GlobalX’s business strategy; the future price of fuel, and the availability of aircraft. While the Company considers these assumptions to be reasonable based on information currently available to it, they may prove to be incorrect.
Forward-looking statements involve known and unknown risks, uncertainties and other factors which may cause the actual results, performance or achievements of the Company to be materially different from any future results, performance or achievements expressed or implied by the forward-looking statements. Such factors include risks related to, the ability to obtain financing at acceptable terms, the impact of general economic conditions, risks related to supply chain and labor disruptions, failure to retain or obtain sufficient aircraft, domestic and international airline industry conditions, failure to conclude definitive agreements for transactions subject to LOI, the effects of increased competition from our market competitors and new market entrants, passenger demand being less than anticipated, the impact of the global uncertainty created by COVID-19, future relations with shareholders, volatility of fuel prices, increases in operating costs, terrorism, pandemics, natural disasters, currency fluctuations, interest rates, risks specific to the airline industry, risks associated with doing business in foreign countries, the ability of management to implement GlobalX’s operational strategy, the ability to attract qualified management and staff, labor disputes, regulatory risks, including risks relating to the acquisition of the necessary licenses and permits; risks related to significant disruption in, or breach in security of GlobalX’s information technology systems and resultant interruptions in service and any related impact on its reputation; and the additional risks identified in the “Risk Factors” section of the Company’s reports and filings with applicable Canadian securities regulators and the U.S. Securities and Exchange Commission. Although the Company has attempted to identify important factors that could cause actual results to differ materially from those described in the forward-looking statements, there may be other factors that cause results not to be as anticipated, estimated or intended. Accordingly, readers should not place undue reliance on forward-looking statements. The forward-looking statements are made as of the date of this news release. Except as required by applicable securities laws, the Company does not undertake any obligation to publicly update any forward-looking statements. If GlobalX does update one or more forward-looking statements, no inference should be made that it will make additional updates with respect to those or other forward-looking statements.
| JET: NEO | www.globalairlinesgroup.com | Page 8 of 8 |