
jnj-20240123
0000200406false00002004062024-01-232024-01-230000200406us-gaap:CommonStockMember2024-01-232024-01-230000200406jnj:A0.650NotesDue2024Member2024-01-232024-01-230000200406jnj:A5.50NotesDue2024Member2024-01-232024-01-230000200406jnj:A1.150NotesDue2028Member2024-01-232024-01-230000200406jnj:A1.650NotesDue2035Member2024-01-232024-01-23


UNITED STATES
SECURITIES AND EXCHANGE COMMISSION
WASHINGTON, DC 20549

FORM 8-K

CURRENT REPORT
Pursuant to Section 13 or 15(d) of The
Securities Exchange Act of 1934
 
Date of report (Date of earliest event reported): 
January 23, 2024
Johnson & Johnson
 (Exact name of registrant as specified in its charter)
  
New Jersey1-321522-1024240
(State or Other Jurisdiction of Incorporation)(Commission File Number)(IRS Employer Identification No.)

One Johnson & Johnson Plaza, New Brunswick, New Jersey  08933 
(Address of Principal Executive Offices)
 (Zip Code) 
Registrant's telephone number, including area code:
732-524-0400
 
Check the appropriate box below if the Form 8-K filing is intended to simultaneously satisfy the filing obligation of the registrant under any of the following provisions:
 
            Written communications pursuant to Rule 425 under the Securities Act (17 CFR 230.425) 
            Soliciting material pursuant to Rule 14a-12 under the Exchange Act (17 CFR 240.14a-12) 
            Pre-commencement communications pursuant to Rule 14d-2(b) under the Exchange Act (17
               CFR 240.14d-2(b)) 
            Pre-commencement communications pursuant to Rule 13e-4(c) under the Exchange Act (17
               CFR 240.13e-4(c))

Indicate by check mark whether the registrant is an emerging growth company as defined in Rule 405 of the Securities Act of 1933 (§230.405 of this chapter) or Rule 12b-2 of the Securities Exchange Act of 1934 (§240.12b-2 of this chapter).
    Emerging growth company  

If an emerging growth company, indicate by check mark if the registrant has elected not to use the extended transition period for complying with any new or revised financial accounting standards provided pursuant to Section 13(a) of the Exchange Act. 

Securities registered pursuant to Section 12(b) of the Act:
Title of each classTrading Symbol(s)Name of each exchange on which registered
Common Stock, Par Value $1.00JNJNew York Stock Exchange
0.650% Notes Due May 2024JNJ24CNew York Stock Exchange
5.50% Notes Due November 2024JNJ24BPNew York Stock Exchange
1.150% Notes Due November 2028JNJ28New York Stock Exchange
1.650% Notes Due May 2035JNJ35New York Stock Exchange


Item 2.02     Results of Operations and Financial Condition

On January 23, 2024, Johnson & Johnson issued the attached press release (Exhibit 99.1) announcing its sales and earnings for the fourth quarter and full year ended December 31, 2023.
 
Item 9.01    Financial Statements and Exhibits

(d)     Exhibits. 
 
Exhibit No.
 
Description of Exhibit
 
104The cover page from this Current Report on Form 8-K, formatted in Inline XBRL.


SIGNATURES
 
Pursuant to the requirements of the Securities Exchange Act of 1934, the registrant has duly caused this report to be signed on its behalf by the undersigned hereunto duly authorized.
 
 Johnson & Johnson 
   (Registrant)


Date: January 23, 2024By:/s/ Robert J. Decker, Jr. 
  Robert J. Decker, Jr.
Controller
(Principal Accounting Officer)


Exhibit 99.1
logo.jpg
Media contact:
Tesia Williams
Investor contact:
Jessica Moore


Johnson & Johnson Reports Q4 and Full-Year 2023 Results

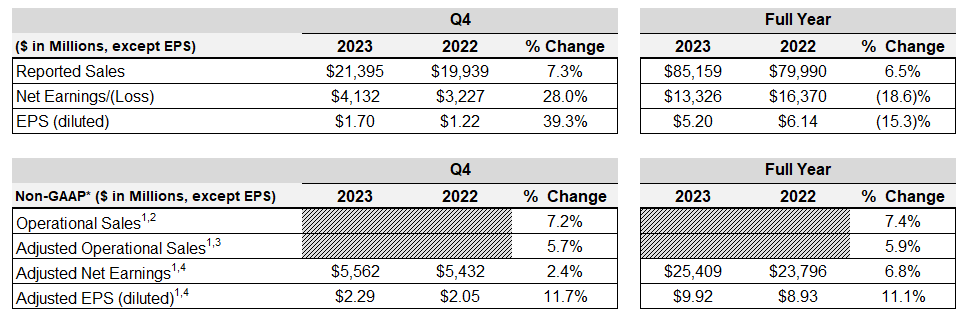
2023 Fourth-Quarter reported sales growth of 7.3% to $21.4 Billion with operational growth of 7.2%* and adjusted operational growth of 5.7%*. Operational growth excluding COVID-19 Vaccine of 10.9%*
2023 Fourth-Quarter Earnings per share (EPS) of $1.70 increasing 39.3% and adjusted EPS of $2.29 increasing by 11.7%*
2023 Full-Year reported sales growth of 6.5% to $85.2 Billion with operational growth of 7.4%* and adjusted operational growth of 5.9%*. Operational growth excluding COVID-19 Vaccine of 9.0%*
2023 Full-Year EPS of $5.20 decreasing 15.3% due to a special one-time charge in the First-Quarter, and adjusted EPS of $9.92 increasing by 11.1%*
Company re-confirms guidance for 2024 with operational sales5 growth of 5.0% - 6.0%* and adjusted operational EPS of $10.55 - $10.75, reflecting growth of 7.4%* at the mid-point

New Brunswick, N.J. (January 23, 2024) – Johnson & Johnson (NYSE: JNJ) today announced results for fourth-quarter and full year 2023. “Johnson & Johnson’s full year 2023 results reflect the breadth and competitiveness of our business and our relentless focus on delivering for patients,” said Joaquin Duato, Chairman and Chief Executive Officer. “We have entered 2024 from a position of strength, and I am confident in our ability to lead the next wave of health innovation.”

Unless otherwise noted, the financial results and earnings guidance included below reflect the continuing operations of Johnson & Johnson.

Overall Financial Results
a4q23overallresults.jpg
1 Non-GAAP financial measure; refer to reconciliations of non-GAAP financial measures included in accompanying schedules
2 Excludes the impact of translational currency
3 Excludes the net impact of acquisitions and divestitures and translational currency
4 Excludes intangible amortization expense and special items
5 Excludes COVID-19 Vaccine
Note: values may have been rounded


Regional Sales Results
a4q23regionalsalesresultsv2.jpg
1 Non-GAAP financial measure; refer to reconciliations of non-GAAP financial measures included in accompanying schedules
2 Excludes the impact of translational currency
3 Excludes the net impact of acquisitions and divestitures and translational currency
Note: values may have been rounded


Segment Sales Results
a4q23segmentsalesperforman.jpg
1 Non-GAAP financial measure; refer to reconciliations of non-GAAP financial measures included in accompanying schedules
2 Excludes the impact of translational currency
3 Excludes the net impact of acquisitions and divestitures and translational currency
Note: The Innovative Medicine segment was previously referred to as the Pharmaceutical segment
Values may have been rounded


Full Year 2023 Segment Commentary:
Operational sales* reflected below excludes the impact of translational currency. Adjusted operational sales* reflected below excludes the net impact of acquisitions and divestitures and translational currency.

Innovative Medicine
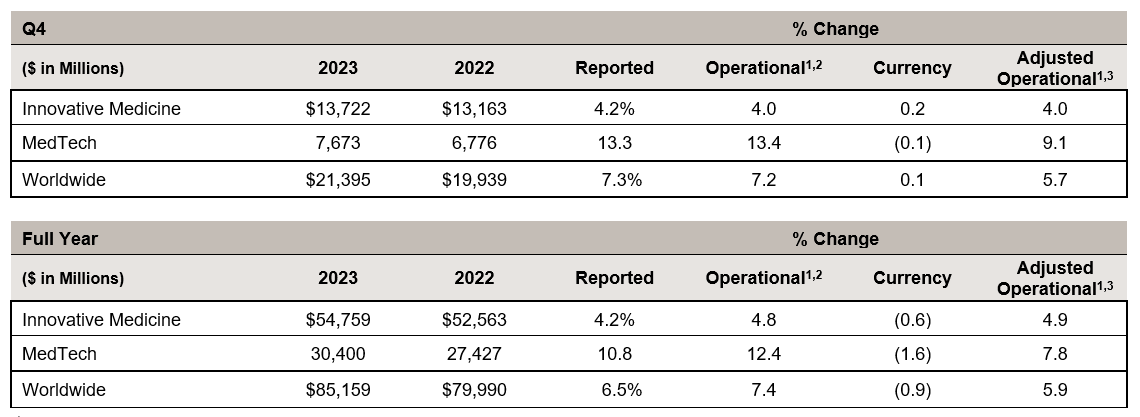
Innovative Medicine worldwide operational sales, excluding the COVID-19 Vaccine, grew 7.2%*. Growth was driven by DARZALEX (daratumumab), ERLEADA (apalutamide), TECVAYLI (teclistamab-cqyv) in Other Oncology, and CARVYKTI (ciltacabtagene autoleucel) in Oncology, STELARA (ustekinumab) and TREMFYA (guselkumab) in Immunology, and SPRAVATO (esketamine) in Neuroscience. Growth was partially offset by ZYTIGA (abiraterone acetate) and IMBRUVICA (ibrutinib) in Oncology, and REMICADE (infliximab) in Immunology. Including the COVID-19 Vaccine, Innovative Medicine worldwide operational sales grew 4.8%*.


MedTech
MedTech worldwide operational sales grew 12.4%*, with the acquisition of Abiomed contributing 4.7%. MedTech worldwide adjusted operational sales grew 7.8%*, driven primarily by electrophysiology products in Interventional Solutions, contact lenses in Vision, wound closure products in General Surgery, and biosurgery in Advanced Surgery.

Notable New Announcements in the Quarter:
The information contained in this section should be read together with Johnson & Johnson’s other disclosures filed with the Securities and Exchange Commission, including its Current Reports on Form 8-K, Quarterly Reports on Form 10-Q and Annual Reports on Form 10-K. Copies of these filings are available online at www.sec.gov, www.jnj.com or on request from Johnson & Johnson. The reader is also encouraged to review all other news releases and information available in the Investor Relations section of the company’s website at News Releases, as well as Innovative Medicine, MedTech, www.factsabouttalc.com, www.factsaboutourprescriptionopioids.com, and www.LLTManagementInformation.com.

Regulatory
U.S. Food and Drug Administration Grants Full Approval for BALVERSA to Treat Locally
Advanced or Metastatic Bladder Cancer with Select Genetic Alterations1
Press Release
Biosense Webster Announces Regulatory Approval of VARIPULSE Pulsed Field Ablation (PFA) Platform in Japan1
Press Release
Janssen Submits Marketing Authorisation Application to the European Medicines Agency Seeking Approval of Lazertinib, in combination with RYBREVANT (amivantamab), for the First-Line Treatment of Patients with EGFR-Mutated Non-Small Cell Lung CancerPress Release
Johnson & Johnson Submits Supplemental Biologics License Application and New Drug Application to U.S. FDA Seeking Approval of RYBREVANT (amivantamab-vmjw) Plus Lazertinib for the Treatment of Patients with EGFR-Mutated Non-Small Cell Lung Cancer (NSCLC)Press Release
Johnson & Johnson’s Investigational TAR-200 Granted U.S. FDA Breakthrough Therapy Designation for the Treatment of High-Risk Non-Muscle-Invasive Bladder CancerPress Release
Janssen Submits Application to the European Medicines Agency for RYBREVANT (amivantamab) in Combination with Chemotherapy for the Treatment of Adult Patients with Advanced EGFR-Mutated Non-Small Cell Lung Cancer After Failure of Prior TherapyPress Release
Janssen Submits Supplemental Biologics License Application to U.S. FDA Seeking Approval of RYBREVANT (amivantamab-vmjw) Plus Chemotherapy for the Treatment of Patients with EGFR-Mutated Non-Small Cell Lung Cancer Who Progressed on or after OsimertinibPress Release
MONARCH Platform for Bronchoscopy Receives Regulatory License for ChinaPress Release
Data ReleaseJohnson & Johnson highlights its preeminent leadership in hematology through differentiated blood cancer portfolio and pipeline with new clinical and real-world data at ASHPress Release
New Real-World Data Show TREMFYA (guselkumab) Was Associated With Clinically Meaningful Improvements in Patient-Reported Outcomes for Adults Living With Active Psoriatic ArthritisPress Release
Phase 2 Nipocalimab Data Establish Proof of Mechanism in Adults Living with Moderate to Severe Rheumatoid Arthritis, Supporting its Progression into a Combination StudyPress Release
New Biosense Webster QDOT MICRO Catheter Data Demonstrate Very High-Power, Short-Duration Ablations Improved Quality of Life and Reduced Healthcare Utilization for AFib PatientsPress Release
New Phase 3 TREMFYA (guselkumab) Results in Ulcerative Colitis Show a 77 Percent Overall Clinical Response Rate and Early Symptom ImprovementPress Release
Janssen Aims to Define New Standards of Care in the Treatment of Solid Tumor Cancers with Transformative Data Planned for Presentation at ESMOPress Release


Product LaunchEthicon Introduces ETHIZIA Hemostatic Sealing Patch, Clinically Proven to Stop Disruptive BleedingPress Release
Other
Johnson & Johnson to Acquire Ambrx, Advancing Next Generation Antibody Drug Conjugates to Transform the Treatment of Cancer1
Press Release
Johnson & Johnson Announces Key Drivers for Long-Term Competitive Growth at Enterprise Business ReviewPress Release
Johnson & Johnson Names Eugene A. Woods, Chief Executive Officer of Advocate Health, to its Board of DirectorsPress Release
Johnson & Johnson MedTech Acquires Laminar, Inc.Press Release
Johnson & Johnson MedTech Provides Details and Timeline for General Surgery RobotPress Release
Johnson & Johnson Announces Departure of Ashley McEvoy, Tim Schmid Named Executive Vice President, Worldwide Chairman of MedTechPress Release
1 Subsequent to the quarter


Full-Year 2024 Guidance:

Johnson & Johnson does not provide GAAP financial measures on a forward-looking basis because the company is unable to predict with reasonable certainty the ultimate outcome of legal proceedings, unusual gains and losses, acquisition-related expenses, and purchase accounting fair value adjustments without unreasonable effort. These items are uncertain, depend on various factors, and could be material to Johnson & Johnson's results computed in accordance with GAAP.

($ in Billions, except EPS)
January 2024
December 2023
Adjusted Operational Sales1,2,5
Change vs. Prior Year / Mid-point
5.0% – 6.0% / 5.5%
Operational Sales2,5/ Mid-point
Change vs. Prior Year / Mid-point
$88.2B – $89.0B / $88.6B
5.0% – 6.0% / 5.5%
5.0% – 6.0% / 5.5%
Estimated Reported Sales3,5/ Mid-point
Change vs. Prior Year / Mid-point
$87.8B – $88.6B / $88.2B
4.5% – 5.5% / 5.0%
Adjusted Operational EPS (Diluted)2,4/ Mid-point
Change vs. Prior Year / Mid-point
$10.55 – $10.75 / $10.65
6.4% – 8.4% / 7.4%
$10.55 – $10.75 / $10.65
7.3% Mid-point
Adjusted EPS (Diluted)3,4 / Mid-point
Change vs. Prior Year / Mid-point
$10.55 – $10.75 / $10.65
6.4% – 8.4% / 7.4%
Average Shares Outstanding (Diluted)6
~2,435 million
1 Non-GAAP financial measure; excludes the net impact of acquisitions and divestitures
2 Non-GAAP financial measure; excludes the impact of translational currency
3 Calculated using Euro Average Rate: January 2024 = $1.09 and December 2023 = $1.09 (Illustrative purposes only)
4 Non-GAAP financial measure; excludes intangible amortization expense and special items
5 Excludes COVID-19 Vaccine
6 Full Year 2024 Projected Average Shares Outstanding (Diluted) reflects impact from the Kenvue exchange offer
Note: percentages may have been rounded

Other modeling considerations will be provided on the webcast.


Webcast Information:
Johnson & Johnson will conduct a conference call with investors to discuss this earnings release today at 8:30 a.m., Eastern Time. A simultaneous webcast of the call for investors and other interested parties may be accessed by visiting the Johnson & Johnson website. A replay and podcast will be available approximately two hours after the live webcast in the Investor Relations section of the company's website at events-and-presentations.

About Johnson & Johnson:
At Johnson & Johnson, we believe health is everything. Our strength in healthcare innovation empowers us to build a world where complex diseases are prevented, treated, and cured, where treatments are smarter and less invasive, and solutions are personal. Through our expertise in Innovative Medicine and MedTech, we are uniquely positioned to innovate across the full spectrum of healthcare solutions today to deliver the breakthroughs of tomorrow, and profoundly impact health for humanity. Learn more at https://www.jnj.com/.

Non-GAAP Financial Measures:
* “Operational sales growth” excluding the impact of translational currency, “adjusted operational sales growth” excluding the net impact of acquisitions and divestitures and translational currency, as well as “adjusted net earnings”, “adjusted diluted earnings per share” and “adjusted operational diluted earnings per share” excluding after-tax intangible amortization expense and special items, are non-GAAP financial measures and should not be considered replacements for, and should be read together with, the most comparable GAAP financial measures. Except for guidance measures, reconciliations of these non-GAAP financial measures to the most directly comparable GAAP financial measures can be found in the accompanying financial schedules of the earnings release and the Investor Relations section of the company's website at quarterly results.
Copies of the financial schedules accompanying this earnings release are available on the company’s website at quarterly results. These schedules include supplementary sales data, a condensed consolidated statement of earnings, reconciliations of non-GAAP financial measures, and sales of key products/franchises. Additional information on Johnson & Johnson, including adjusted income before tax by segment, an Innovative Medicine pipeline of selected compounds in late stage development and a copy of today’s earnings call presentation can also be found in the Investor Relations section of the company's website at quarterly results.

Note to Investors Concerning Forward-Looking Statements:
This press release contains “forward-looking statements” as defined in the Private Securities Litigation Reform Act of 1995 regarding, among other things: future operating and financial performance, product development, and market position and business strategy. The reader is cautioned not to rely on these forward-looking statements. These statements are based on current expectations of future events. If underlying assumptions prove inaccurate or known or unknown risks or uncertainties materialize, actual results could vary materially from the expectations and projections of Johnson & Johnson. Risks and uncertainties include, but are not limited to: economic factors, such as interest rate and currency exchange rate fluctuations; competition, including technological advances, new products and patents attained by competitors; challenges inherent in new product research and development, including uncertainty of clinical success and obtaining regulatory approvals; uncertainty of commercial success for new and existing products; challenges to patents; the impact of patent expirations; the ability of the Company to successfully execute strategic plans, including restructuring plans; the impact of business combinations and divestitures; manufacturing difficulties or delays, internally or within the supply chain; product efficacy or safety concerns resulting in product recalls or regulatory action; significant adverse litigation or government action, including related to product liability claims; changes to applicable laws and regulations, including tax laws and global health care reforms; trends toward health care cost containment; changes in behavior and spending patterns of purchasers of health care products and services; financial instability of international economies and legal systems and sovereign risk; increased scrutiny of the health care industry by government agencies; the Company’s ability to realize the anticipated benefits from the separation of the Company’s Consumer Health business; and the New Consumer Health Company’s ability to succeed as a standalone publicly traded company. A further list and descriptions of these risks, uncertainties and other factors can be found in Johnson & Johnson’s Annual Report on Form 10-K for the fiscal year ended January 1, 2023, including in the sections captioned “Cautionary Note Regarding


Forward-Looking Statements” and “Item 1A. Risk Factors,” and in Johnson & Johnson’s subsequent Quarterly Reports on Form 10-Q and other filings with the Securities and Exchange Commission. Copies of these filings are available online at www.sec.gov, www.jnj.com or on request from Johnson & Johnson. Any forward-looking statement made in this release speaks only as of the date of this release. Johnson & Johnson does not undertake to update any forward-looking statement as a result of new information or future events or developments.


Exhibit 99.2


Johnson & Johnson and Subsidiaries
Supplementary Sales Data
(Unaudited; Dollars in Millions)
FOURTH QUARTER
Percent Change
20232022TotalOperationsCurrency
Sales to customers by
geographic area
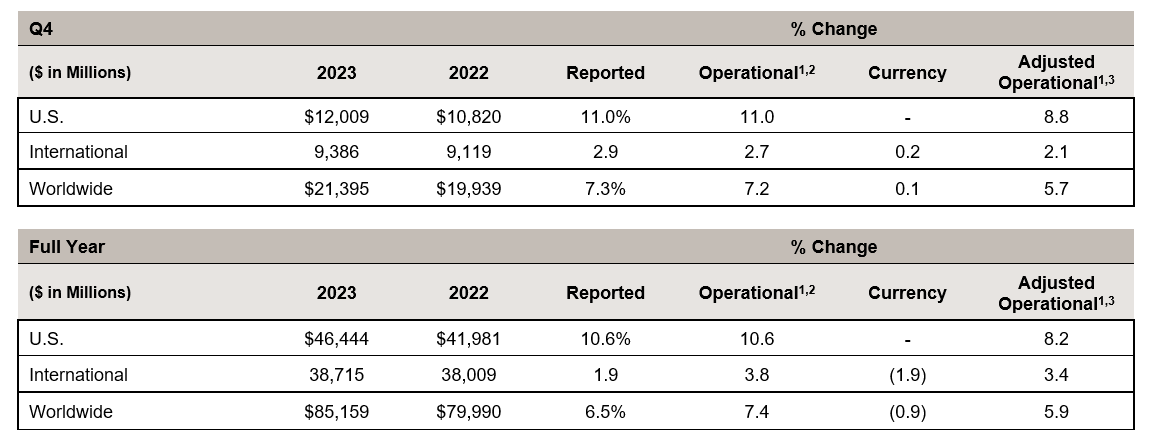
U.S.$12,009  10,820  11.0 % 11.0 — 
Europe 4,962  5,124 (3.2) (5.8) 2.6
Western Hemisphere excluding U.S. 1,166  1,024  14.0  18.1  (4.1)
Asia-Pacific, Africa 3,258  2,971  9.7  12.1  (2.4)
International 9,386  9,119  2.9  2.7  0.2
      
Worldwide$21,395  19,939  7.3 % 7.2  0.1
        
Note: Percentages have been calculated using actual, non-rounded figures and, therefore, may not recalculate precisely.


Johnson & Johnson and Subsidiaries
Supplementary Sales Data
(Unaudited; Dollars in Millions)
TWELVE MONTHS
Percent Change
20232022TotalOperationsCurrency
Sales to customers by
geographic area
U.S.$46,444  41,981  10.6 % 10.6 — 
Europe 20,410  20,664  (1.2) (2.2) 1.0
Western Hemisphere excluding U.S. 4,549  4,108  10.7  15.8  (5.1)
Asia-Pacific, Africa 13,756  13,237  3.9  9.5  (5.6)
International 38,715  38,009  1.9  3.8  (1.9)
      
Worldwide$85,159  79,990  6.5 % 7.4  (0.9)
Note: Percentages have been calculated using actual, non-rounded figures and, therefore, may not recalculate precisely.


Johnson & Johnson and Subsidiaries
Supplementary Sales Data
(Unaudited; Dollars in Millions)
FOURTH QUARTER
 Percent Change
20232022TotalOperationsCurrency
Sales to customers by
segment of business
Innovative Medicine (1,2)
    U.S.$8,079 7,375 9.5 %9.5 — 
    International5,643 5,788 (2.5)(3.1)0.6 
13,722    13,163 4.2 4.0 0.2 
Innovative Medicine excluding COVID-19 Vaccine (1,2)
     U.S.8,079 7,375 9.5 9.5— 
     International5,599 5,099 9.8 9.40.4 
13,678 12,474 9.7 9.50.2 
MedTech
    U.S.3,930    3,445 14.1 14.1 — 
    International3,743 3,331 12.4 12.8 (0.4)
 7,673    6,776 13.3 13.4 (0.1)
U.S.12,009 10,820 11.0 11.0 — 
International9,386 9,119 2.9 2.7 0.2 
Worldwide21,395 19,939 7.3 7.2 0.1 
      
U.S.12,009 10,820 11.0 11.0 — 
International9,342 8,430 10.8 10.7 0.1 
Worldwide excluding COVID-19 Vaccine (1)
$21,351 19,250 10.9 %10.9 0.0 
Note: Percentages have been calculated using actual, non-rounded figures and, therefore, may not recalculate precisely.
(1) Refer to supplemental sales reconciliation schedule.
(2) Previously referred to as Pharmaceutical.


Johnson & Johnson and Subsidiaries
Supplementary Sales Data
(Unaudited; Dollars in Millions)
TWELVE MONTHS
 Percent Change
20232022TotalOperationsCurrency
Sales to customers by
segment of business
Innovative Medicine (1,2)
    U.S.$31,169 28,604 9.0 %9.0 — 
    International23,590 23,959 (1.5)(0.2)(1.3)
54,759    52,563 4.2 4.8 (0.6)
Innovative Medicine excluding COVID-19 Vaccine (1,2)
     U.S.31,169 28,484 9.4 9.4— 
     International22,473 21,900 2.6 4.3(1.7)
53,642 50,384 6.5 7.2(0.7)
MedTech
    U.S.15,275    13,377 14.2 14.2 — 
    International15,125 14,050 7.7 10.6 (2.9)
 30,400    27,427 10.8 12.4 (1.6)
U.S.46,444 41,981 10.6 10.6 — 
International38,715 38,009 1.9 3.8 (1.9)
Worldwide85,159 79,990 6.5 7.4 (0.9)
      
U.S.46,444 41,861 10.9 10.9 — 
International37,598 35,950 4.6 6.7 (2.1)
Worldwide excluding COVID-19 Vaccine (1)
$84,042 77,811 8.0 %9.0 (1.0)
Note: Percentages have been calculated using actual, non-rounded figures and, therefore, may not recalculate precisely.
(1) Refer to supplemental sales reconciliation schedule.
(2) Previously referred to as Pharmaceutical.


Johnson & Johnson and Subsidiaries 
Condensed Consolidated Statement of Earnings  
(Unaudited; in Millions Except Per Share Figures)
FOURTH QUARTER
20232022Percent
PercentPercentIncrease
Amountto SalesAmountto Sales(Decrease)
Sales to customers$21,395 100.0 $19,939 100.0 7.3 
Cost of products sold6,798 31.8 6,084 30.5 11.7 
Gross Profit14,597 68.2 13,855 69.5 5.4 
Selling, marketing and administrative expenses5,810 27.1 5,339 26.8 8.8 
Research and development expense4,480 20.9 3,710 18.6 20.8 
In-process research and development impairments58 0.3 173 0.8 
Interest (income) expense, net(212)(1.0)(77)(0.4)
Other (income) expense, net(421)(2.0)795 4.0 
Restructuring56 0.3 75 0.4 
Earnings before provision for taxes on income4,826 22.6 3,840 19.3 25.7 
Provision for taxes on income694 3.3 613 3.1 13.2 
Net earnings from Continuing Operations$4,132 19.3 $3,227 16.2 28.0 
Net earnings/(loss) from Discontinued Operations, net of tax(83) 293  
Net earnings$4,049  $3,520  
Net earnings per share (Diluted) from Continuing Operations$1.70 $1.22 39.3 
Net earnings/(loss) per share (Basic/Diluted) from Discontinued Operations*$(0.03)$0.11  
Average shares outstanding (Diluted)2,430.7 2,650.1 
Effective tax rate from Continuing Operations14.4 %16.0 %
Adjusted earnings from Continuing Operations before provision for taxes and net earnings (1) (A)
Earnings before provision for taxes on income from Continuing Operations$6,237 29.2$6,482 32.5(3.8)
Net earnings from Continuing Operations$5,562 26.0$5,432 27.22.4 
Net earnings per share (Diluted) from Continuing Operations$2.29 $2.05 11.7 
Effective tax rate from Continuing Operations10.8 %16.2 %
* Basic shares of 2,407.2 are used to calculate loss per share in the fourth quarter of 2023 as use of diluted shares when in a loss position would be anti-dilutive.
(1) See Reconciliation of Non-GAAP Financial Measures.
(A) NON-GAAP FINANCIAL MEASURES "Adjusted earnings from continuing operations before provision for taxes on income," "adjusted net earnings from continuing operations," "adjusted net earnings per share (diluted) from continuing operations," and "adjusted effective tax rate from continuing operations" are non-GAAP financial measures and should not be considered replacements for GAAP results. The Company provides earnings from continuing operations before provision for taxes on income, net earnings from continuing operations, net earnings per share (diluted) from continuing operations, and effective tax rate from continuing operations on an adjusted basis because management believes that these measures provide useful information to investors. Among other things, these measures may assist investors in evaluating the Company's results of operations period over period. In various periods, these measures may exclude such items as intangible asset amortization expense, significant gains from divestitures, significant costs associated with acquisitions, restructuring, litigation, and changes in applicable laws and regulations (including significant accounting or tax matters). Special items may be highly variable, difficult to predict, and of a size that sometimes has substantial impact on the Company's reported results of operations for a period. Management uses these measures internally for planning, forecasting and evaluating the performances of the Company's businesses, including allocating resources and evaluating results relative to employee performance compensation targets. Unlike earnings from continuing operations before provision for taxes on income, net earnings from continuing operations, net earnings per share (diluted) from continuing operations, and effective tax rate from continuing operations prepared in accordance with GAAP, adjusted earnings from continuing operations before provision for taxes on income, adjusted net earnings from continuing operations, adjusted net earnings per share (diluted) from continuing operations, and adjusted effective tax rate from continuing operations may not be comparable with the calculation of similar measures for other companies. The limitations of using these non-GAAP financial measures as performance measures are that they provide a view of the Company's results of operations without including all events during a period, such as intangible asset amortization expense, significant gains from divestitures, the effects of an acquisition, restructuring, litigation, and changes in applicable laws and regulations (including significant accounting or tax matters) and do not provide a comparable view of the Company's performance to other companies in the health care industry. Investors should consider non-GAAP financial measures in addition to, and not as replacements for, or superior to, measures of financial performance prepared in accordance with GAAP.


Johnson & Johnson and Subsidiaries 
Condensed Consolidated Statement of Earnings  
(Unaudited; in Millions Except Per Share Figures)
TWELVE MONTHS
20232022Percent
PercentPercentIncrease
Amountto SalesAmountto Sales(Decrease)
Sales to customers$85,159 100.0 $79,990 100.0 6.5 
Cost of products sold26,553 31.2 24,596 30.7 8.0 
Gross Profit58,606 68.8 55,394 69.3 5.8 
Selling, marketing and administrative expenses21,512 25.2 20,246 25.3 6.3 
Research and development expense15,085 17.7 14,135 17.7 6.7 
In-process research and development impairments313 0.4 783 1.0  
Interest (income) expense, net(489)(0.6)(214)(0.3) 
Other (income) expense, net6,634 7.8 810 1.0  
Restructuring489 0.6 275 0.4 
Earnings before provision for taxes on income15,062 17.7 19,359 24.2 (22.2)
Provision for taxes on income1,736 2.1 2,989 3.7 (41.9)
Net earnings from Continuing Operations$13,326 15.6 $16,370 20.5 (18.6)
Net earnings from Discontinued Operations, net of tax21,827    1,571    
Net earnings$35,153    $17,941    
Net earnings per share (Diluted) from Continuing Operations$5.20 $6.14 (15.3)
Net earnings per share (Diluted) from Discontinued Operations$8.52 $0.59  
Average shares outstanding (Diluted)2,560.4 2,663.9 
Effective tax rate from Continuing Operations11.5 %15.4 %
Adjusted earnings from Continuing Operations before provision for taxes and net earnings (1) (A)
Earnings before provision for taxes on income from Continuing Operations$29,811 35.0$27,973 35.06.6 
Net earnings from Continuing Operations$25,409 29.8$23,796 29.76.8 
Net earnings per share (Diluted) from Continuing Operations$9.92 $8.93 11.1 
Effective tax rate from Continuing Operations14.8 %14.9 %
(1) See Reconciliation of Non-GAAP Financial Measures.
(A) NON-GAAP FINANCIAL MEASURES "Adjusted earnings from continuing operations before provision for taxes on income," "adjusted net earnings from continuing operations," "adjusted net earnings per share (diluted) from continuing operations," and "adjusted effective tax rate from continuing operations" are non-GAAP financial measures and should not be considered replacements for GAAP results. The Company provides earnings from continuing operations before provision for taxes on income, net earnings from continuing operations, net earnings per share (diluted) from continuing operations, and effective tax rate from continuing operations on an adjusted basis because management believes that these measures provide useful information to investors. Among other things, these measures may assist investors in evaluating the Company's results of operations period over period. In various periods, these measures may exclude such items as intangible asset amortization expense, significant gains from divestitures, significant costs associated with acquisitions, restructuring, litigation, and changes in applicable laws and regulations (including significant accounting or tax matters). Special items may be highly variable, difficult to predict, and of a size that sometimes has substantial impact on the Company's reported results of operations for a period. Management uses these measures internally for planning, forecasting and evaluating the performances of the Company's businesses, including allocating resources and evaluating results relative to employee performance compensation targets. Unlike earnings from continuing operations before provision for taxes on income, net earnings from continuing operations, net earnings per share (diluted) from continuing operations, and effective tax rate from continuing operations prepared in accordance with GAAP, adjusted earnings from continuing operations before provision for taxes on income, adjusted net earnings from continuing operations, adjusted net earnings per share (diluted) from continuing operations, and adjusted effective tax rate from continuing operations may not be comparable with the calculation of similar measures for other companies. The limitations of using these non-GAAP financial measures as performance measures are that they provide a view of the Company's results of operations without including all events during a period, such as intangible asset amortization expense, significant gains from divestitures, the effects of an acquisition, restructuring, litigation, and changes in applicable laws and regulations (including significant accounting or tax matters) and do not provide a comparable view of the Company's performance to other companies in the health care industry. Investors should consider non-GAAP financial measures in addition to, and not as replacements for, or superior to, measures of financial performance prepared in accordance with GAAP.


Johnson & Johnson and Subsidiaries
Reconciliation of Non-GAAP Financial Measures
Fourth Quarter
(Dollars in Millions Except Per Share Data)20232022
Net Earnings from Continuing Operations, after tax- as reported$4,132 $3,227 
Pre-tax Adjustments
Litigation related166 262
Intangible Asset Amortization expense1,148 977
COVID-19 Vaccine related costs 1
10  821
Restructuring related 2
139 119
Medical Device Regulation 3
88  88
Acquisition, integration and divestiture related  237  196
(Gains)/losses on securities (435)6
IPR&D impairments58  173
Tax Adjustments
Tax impact on special item adjustments 4
75 (394)
Tax legislation and other tax related(56) (43)
Adjusted Net Earnings from Continuing Operations, after tax$5,562 $5,432 
Average shares outstanding (Diluted)2,430.7 2,650.1 
Adjusted net earnings per share from Continuing Operations (Diluted)$2.29 $2.05 
Operational adjusted net earnings per share from Continuing Operations (Diluted)$2.28  
 
Notes:
1
COVID-19 Vaccine related costs include remaining commitments and obligations, including external manufacturing network exit costs and required clinical trial expenses, associated with the Company's completion of its COVID-19 vaccine contractual commitments.
2
In fiscal 2023, the company completed a prioritization of its research and development (R&D) investment within the Innovative Medicine segment to focus on the most promising medicines with the greatest benefit to patients. This resulted in the exit of certain programs within therapeutic areas. The R&D program exits are primarily in infectious diseases and vaccines including the discontinuation of its respiratory syncytial virus (RSV) adult vaccine program, hepatitis and HIV development.  The restructuring expenses of $55 million in the quarter ($479 million Q4 YTD) include the termination of partnered and non-partnered program costs and asset impairments.

In fiscal 2023, the company initiated a restructuring program of its Orthopaedics franchise within the MedTech segment to streamline operations by exiting certain markets, product lines and distribution network arrangements. The restructuring expenses of $84 million in the quarter ($319 million Q4 YTD) primarily includes inventory and instrument reserves related to the market and product exits.
3
European Medical Device Regulation (MDR) costs represent one-time compliance costs for the Company’s previously registered products. MDR is a replacement of the existing European Medical Devices Directive regulatory framework, and manufacturers of currently marketed medical devices were required to comply with EU MDR beginning in May 2021. The Company considers the adoption of EU MDR to be a significant one-time regulatory change and is not indicative of on-going operations. The Company has excluded only external third-party regulatory and consulting costs from its MedTech operating segments' measures of profit and loss used for making operating decisions and assessing performance which is expected to be completed during 2024.
4
The tax impact related to special item adjustments reflects the current and deferred income taxes associated with the above pre-tax special items in arriving at adjusted earnings.


Johnson & Johnson and Subsidiaries
Reconciliation of Non-GAAP Financial Measures
Twelve Months Ended
(Dollars in Millions Except Per Share Data)20232022
Net Earnings from Continuing Operations, after tax- as reported$13,326 $16,370 
Pre-tax Adjustments
Litigation related7,152 866
Intangible Asset Amortization expense4,532 3,944
COVID-19 Vaccine related costs 1
663  1,474
Restructuring related 2
798 372
Medical Device Regulation 3
311  296
Acquisition, integration and divestiture related 339  196
(Gains)/losses on securities641 690
IPR&D impairments313  783
Other - (7)
Tax Adjustments
Tax impact on special item adjustments 4
(2,694)(1,294)
Tax legislation and other tax related28  106
Adjusted Net Earnings from Continuing Operations, after tax$25,409 $23,796 
Average shares outstanding (Diluted)2,560.4 2,663.9 
Adjusted net earnings per share from Continuing Operations (Diluted)$9.92 $8.93 
Operational adjusted net earnings per share from Continuing Operations (Diluted)$9.89  
Notes:
1
COVID-19 Vaccine related costs include remaining commitments and obligations, including external manufacturing network exit costs and required clinical trial expenses, associated with the Company's completion of its COVID-19 vaccine contractual commitments.
2
In fiscal 2023, the company completed a prioritization of its research and development (R&D) investment within the Innovative Medicine segment to focus on the most promising medicines with the greatest benefit to patients. This resulted in the exit of certain programs within therapeutic areas. The R&D program exits are primarily in infectious diseases and vaccines including the discontinuation of its respiratory syncytial virus (RSV) adult vaccine program, hepatitis and HIV development.  The restructuring expenses of $55 million in the quarter ($479 million Q4 YTD) include the termination of partnered and non-partnered program costs and asset impairments.

In fiscal 2023, the company initiated a restructuring program of its Orthopaedics franchise within the MedTech segment to streamline operations by exiting certain markets, product lines and distribution network arrangements. The restructuring expenses of $84 million in the quarter ($319 million Q4 YTD) primarily includes inventory and instrument reserves related to the market and product exits.
3
European Medical Device Regulation (MDR) costs represent one-time compliance costs for the Company’s previously registered products. MDR is a replacement of the existing European Medical Devices Directive regulatory framework, and manufacturers of currently marketed medical devices were required to comply with EU MDR beginning in May 2021. The Company considers the adoption of EU MDR to be a significant one-time regulatory change and is not indicative of on-going operations. The Company has excluded only external third-party regulatory and consulting costs from its MedTech operating segments' measures of profit and loss used for making operating decisions and assessing performance which is expected to be completed during 2024.
4
The tax impact related to special item adjustments reflects the current and deferred income taxes associated with the above pre-tax special items in arriving at adjusted earnings.


Johnson & Johnson and Subsidiaries
Reconciliation of Non-GAAP Financial Measure
Adjusted Operational Sales Growth (A)
 FOURTH QUARTER 2023 ACTUAL vs. 2022 ACTUAL
 Segments
 Innovative Medicine MedTech  Total
 WW As Reported 4.2 %13.3 %7.3 %
 U.S. 9.5 %14.1 %11.0 %
 International (2.5)%12.4 %2.9 %
 WW Currency 0.2(0.1)0.1
 U.S.
 International 0.6(0.4)0.2
 WW Operational 4.0 %13.4 %7.2 %
 U.S. 9.5 %14.1 %11.0 %
 International(3.1)%12.8 %2.7 %
Abiomed (4.5)(1.6)
 U.S.(7.2)(2.3)
 International(1.9)(0.7)
All Other Acquisitions and Divestitures0.00.20.1
 U.S. 0.00.30.1
 International 0.10.10.1
WW Adjusted Operational4.0 %9.1 %5.7 %
 U.S. 9.5 %7.2 %8.8 %
 International (3.0)%11.0 %2.1 %
Note: Percentages are based on actual, non-rounded figures and may not sum
(A) NON-GAAP FINANCIAL MEASURE “Adjusted operational sales growth" excludes acquisitions, divestitures and translational currency and is a non-GAAP financial measure. Investors should consider non-GAAP financial measures in addition to, and not as replacements for, or superior to, measures of financial performance prepared in accordance with GAAP. Due to the variable nature of acquisitions and divestitures, and the impact they may have on the analysis of underlying business performance and trends, management believes that providing this measure enhances an investor’s understanding of the Company’s performance and may assist in the evaluation of ongoing business operations period over period. This non-GAAP financial measure is presented to permit investors to more fully understand how management assesses the performance of the Company, including for internal evaluation of the performance of the Company's businesses and planning and forecasting for future periods. The use of this non-GAAP financial measure as a performance measure is limited in that it provides a view of the Company's results of operations without including all events during a period and may not provide a comparable view of the Company's performance to that of other companies in the health care industry.


Johnson & Johnson and Subsidiaries
Reconciliation of Non-GAAP Financial Measure
Adjusted Operational Sales Growth (A)
TWELVE MONTHS 2023 ACTUAL vs. 2022 ACTUAL
Segments
Innovative MedicineMedTechTotal
WW As Reported4.2 %10.8 %6.5 %
U.S.9.0 %14.2 %10.6 %
International(1.5)%7.7 %1.9 %
WW Currency(0.6)(1.6)(0.9)
U.S.
International(1.3)(2.9)(1.9)
WW Operational4.8 %12.4 %7.4 %
U.S.9.0 %14.2 %10.6 %
International(0.2)%10.6 %3.8 %
Abiomed(4.7)(1.6)
U.S.(7.7)(2.5)
International(1.7)(0.6)
All Other Acquisitions and Divestitures0.10.10.1
U.S.0.00.10.1
International0.20.10.2
WW Adjusted Operational4.9 %7.8 %5.9 %
U.S.9.0 %6.6 %8.2 %
International0.0 %9.0 %3.4 %
Note: Percentages are based on actual, non-rounded figures and may not sum
(A) NON-GAAP FINANCIAL MEASURE “Adjusted operational sales growth" excludes acquisitions, divestitures and translational currency and is a non-GAAP financial measure. Investors should consider non-GAAP financial measures in addition to, and not as replacements for, or superior to, measures of financial performance prepared in accordance with GAAP. Due to the variable nature of acquisitions and divestitures, and the impact they may have on the analysis of underlying business performance and trends, management believes that providing this measure enhances an investor’s understanding of the Company’s performance and may assist in the evaluation of ongoing business operations period over period. This non-GAAP financial measure is presented to permit investors to more fully understand how management assesses the performance of the Company, including for internal evaluation of the performance of the Company's businesses and planning and forecasting for future periods. The use of this non-GAAP financial measure as a performance measure is limited in that it provides a view of the Company's results of operations without including all events during a period and may not provide a comparable view of the Company's performance to that of other companies in the health care industry.


Johnson & Johnson
Segment Sales
(Dollars in Millions)
FOURTH QUARTER
% Change
20232022Reported
Operational (1)
Currency
INNOVATIVE MEDICINE SEGMENT (2,3,4)
IMMUNOLOGY
US$3,0332,8058.1 %8.1 %— %
Intl1,5621,31219.0 17.7 1.3 
WW4,5954,11811.6 11.2 0.4 
     REMICADE
     US294318(7.4)(7.4)— 
     US Exports (5)
3541(15.1)(15.1)— 
     Intl100116(13.4)(12.4)(1.0)
     WW429475(9.6)(9.4)(0.2)
     SIMPONI / SIMPONI ARIA
     US258280(7.8)(7.8)— 
     Intl24422010.1 11.8 (1.7)
     WW5025010.1 0.8 (0.7)
     STELARA
     US1,7861,62110.1 10.1 — 
     Intl96776426.4 23.9 2.5 
     WW2,7532,38615.3 14.5 0.8 
     TREMFYA
     US657 541 21.6 21.6 — 
     Intl252 211 19.4 17.8 1.6 
     WW910 752 21.0 20.5 0.5 
     OTHER IMMUNOLOGY
     US2 3 (22.8)(22.8)— 
     Intl0 0 — 
     WW2 3 (22.8)(22.8)— 
INFECTIOUS DISEASES
US353414(14.6)(14.6)— 
Intl4981,127(55.8)(58.2)2.4 
WW8521,540(44.7)(46.5)1.8 
     COVID-19 VACCINE
     US0 0 — 
     Intl44689(93.7)(95.2)1.5
     WW44689(93.7)(95.2)1.5
     EDURANT / rilpivirine
     US9 9 (12.4)(12.4)— 
     Intl299 281 6.41.54.9 
     WW307 290 5.81.04.8 
     PREZISTA / PREZCOBIX / REZOLSTA / SYMTUZA
     US341398(14.4)(14.4)— 
     Intl98953.1(0.8)3.9 
     WW439493(11.0)(11.8)0.8 
     OTHER INFECTIOUS DISEASES
     US46(30.4)(30.4)— 
     Intl5861(5.6)(4.9)(0.7)
     WW6267(7.8)(7.1)(0.7)
See footnotes at end of schedule


Johnson & Johnson
Segment Sales
(Dollars in Millions)
FOURTH QUARTER
% Change
20232022Reported
Operational (1)
Currency
INNOVATIVE MEDICINE SEGMENT (2,3,4)(Continued)
NEUROSCIENCE
US$1,02291212.1%12.1%—%
Intl780825(5.5)(2.0)(3.5)
WW1,8011,7373.75.4(1.7)
     CONCERTA / methylphenidate
     US39375.75.7
     Intl1421317.99.2(1.3)
     WW1801687.48.5(1.1)
     INVEGA SUSTENNA / XEPLION / INVEGA
     TRINZA / TREVICTA
     US7336788.08.0
     Intl278329(15.5)(15.7)0.2
     WW1,0111,0080.30.30.0
     SPRAVATO
     US18010572.372.3
     Intl261487.183.43.7
     WW20611974.173.60.5
     OTHER NEUROSCIENCE
     US7191(23.0)(23.0)
     Intl334351(5.0)3.2(8.2)
     WW404442(8.7)(2.3)(6.4)
ONCOLOGY
US2,2851,85723.023.0
Intl2,3342,06912.812.00.8
WW4,6183,92717.617.20.4
     CARVYKTI
US145 54 **
Intl13  **
WW159 54 ***
     DARZALEX
     US1,395 1,139 22.522.5
     Intl1,155 944 22.321.80.5
     WW2,550 2,083 22.422.20.2
     ERLEADA
     US287 275 4.44.4
     Intl361 266 35.634.01.6
     WW647 541 19.819.00.8
     IMBRUVICA
     US255 318 (19.8)(19.8)
     Intl533 547 (2.6)(3.8)1.2
     WW788 866 (8.9)(9.7)0.8
     ZYTIGA / abiraterone acetate
     US920 (52.0)(52.0)
     Intl191250(23.6)(23.2)(0.4)
     WW201270(25.6)(25.3)(0.3)
     OTHER ONCOLOGY
     US192 52 **
     Intl826332.228.43.8
     WW274114***


Johnson & Johnson
Segment Sales
(Dollars in Millions)
FOURTH QUARTER
% Change
20232022Reported
Operational (1)
Currency
INNOVATIVE MEDICINE SEGMENT (2,3,4)(Continued)
PULMONARY HYPERTENSION
US$733 610 20.2 %20.2 %— %
Intl282 261 8.6 10.9 (2.3)
WW1,017 870 16.7 17.4 (0.7)
     OPSUMIT
     US368 305 20.5 20.5 — 
     Intl169 156 7.9 8.3 (0.4)
     WW536 461 16.2 16.3 (0.1)
     UPTRAVI
     US348 280 24.3 24.3 — 
     Intl70 56 26.4 31.4 (5.0)
     WW419 336 24.6 25.4 (0.8)
     OTHER PULMONARY HYPERTENSION
     US18 24 (29.4)(29.4)— 
     Intl45 48 (9.7)(3.9)(5.8)
     WW61 73 (16.2)(12.4)(3.8)
CARDIOVASCULAR / METABOLISM / OTHER
US652776(15.9)(15.9)— 
Intl185194(4.7)(6.7)2.0 
WW837971(13.7)(14.1)0.4 
     XARELTO
     US525 667 (21.2)(21.2)— 
     Intl  — — — 
     WW525 667 (21.2)(21.2)— 
     OTHER
     US127 110 15.9 15.9 — 
     Intl185 194 (4.7)(6.7)2.0 
     WW312 304 2.8 1.5 1.3 
TOTAL INNOVATIVE MEDICINE
US8,0797,3759.5 9.5  
Intl5,6435,788(2.5)(3.1)0.6 
WW$13,72213,1634.2 %4.0 %0.2 %


Johnson & Johnson
Segment Sales
(Dollars in Millions)
FOURTH QUARTER
% Change
20232022Reported
Operational (1)
Currency
MEDTECH SEGMENT (2,3)
INTERVENTIONAL SOLUTIONS
US$971 603 61.0 61.0 — 
Intl698 495 40.8 41.7 (0.9)
WW1,669 1,098 51.9 52.3 (0.4)
ELECTROPHYSIOLOGY
US667 547 22.0 22.0 — 
Intl572 447 28.0 29.0 (1.0)
WW1,239 994 24.7 25.2 (0.5)
ABIOMED
US276 31 **— 
Intl64  **— 
WW340 31 **— 
OTHER INTERVENTIONAL SOLUTIONS
US28 25 8.8 8.8 — 
Intl61 48 26.5 27.1 (0.6)
WW89 7320.4 20.7 (0.3)
ORTHOPAEDICS
US1,425 1,385 2.9 2.9 — 
Intl843 763 10.5 8.8 1.7 
WW2,268 2,148 5.6 5.0 0.6 
     HIPS
     US266 250 6.3 6.3 — 
     Intl132 135 (2.0)(3.9)1.9 
     WW398 385 3.4 2.7 0.7 
     KNEES
     US242 231 4.5 4.5 — 
     Intl144 122 18.1 15.6 2.5 
     WW387 354 9.2 8.4 0.8 
     TRAUMA
     US487 470 3.6 3.6 — 
     Intl255 240 5.9 4.1 1.8 
     WW741 710 4.4 3.8 0.6 
     SPINE, SPORTS & OTHER
     US430 434 (0.7)(0.7)— 
     Intl311 265 17.5 16.5 1.0 
     WW742 699 6.2 5.8 0.4 
See footnotes at end of schedule


Johnson & Johnson
Segment Sales
(Dollars in Millions)
FOURTH QUARTER
% Change
20232022Reported
Operational (1)
Currency
MEDTECH SEGMENT (2,3)(Continued)
SURGERY
US$1,047 1,000 4.6 %4.6 %— %
Intl1,484 1,383 7.2 7.8 (0.6)
WW2,530 2,384 6.1 6.4 (0.3)
     ADVANCED
US468 456 2.5 2.5  
Intl698 653 7.0 7.2 (0.2)
WW1,167 1,109 5.1 5.2 (0.1)
     GENERAL
US579 544 6.4 6.4  
Intl785 731 7.4 8.3 (0.9)
WW1,364 1,275 7.0 7.5 (0.5)
VISION
US487 456 6.8 6.8  
Intl721 689 4.6 6.4 (1.8)
WW1,208 1,145 5.5 6.6 (1.1)
     CONTACT LENSES / OTHER
US374 343 8.9 8.9  
Intl508 489 4.2 7.2 (3.0)
WW882 831 6.1 7.9 (1.8)
     SURGICAL
US114 113 0.40.4— 
Intl212 200 5.64.7 0.9 
WW326 314 3.73.10.6 
TOTAL MEDTECH
US3,930 3,445 14.1 14.1  
Intl3,743 3,331 12.4 12.8 (0.4)
WW$7,673 6,776 13.3 %13.4 %(0.1)%
See footnotes at end of schedule


Johnson & Johnson
Segment Sales
(Dollars in Millions)
TWELVE MONTHS
% Change
20232022Reported
Operational (1)
Currency
INNOVATIVE MEDICINE SEGMENT (2,3,4)
IMMUNOLOGY
US$11,53911,0364.6 %4.6 %— %
Intl6,5135,89910.4 12.0 (1.6)
WW18,05216,9356.6 7.1 (0.5)
     REMICADE
     US1,1431,417(19.3)(19.3)— 
     US Exports (5)
147204(28.0)(28.0)— 
     Intl549722(23.9)(21.3)(2.6)
     WW1,8392,343(21.5)(20.7)(0.8)
     SIMPONI / SIMPONI ARIA
     US1,1241,166(3.6)(3.6)— 
     Intl1,0731,0175.4 9.3 (3.9)
     WW2,1972,1840.6 2.4 (1.8)
     STELARA
     US6,9666,3889.0 9.0 — 
     Intl3,8923,33516.7 17.4 (0.7)
     WW10,8589,72311.7 11.9 (0.2)
     TREMFYA
     US2,147 1,844 16.5 16.5 — 
     Intl999 824 21.2 22.4 (1.2)
     WW3,147 2,668 17.9 18.3 (0.4)
     OTHER IMMUNOLOGY
     US11 17 (33.8)(33.8)— 
     Intl0 0 — 
     WW11 17 (33.8)(33.8)— 
INFECTIOUS DISEASES
US1,5001,680(10.7)(10.7)— 
Intl2,9183,769(22.6)(23.9)1.3 
WW4,4185,449(18.9)(19.8)0.9 
     COVID-19 VACCINE
     US0120**— 
     Intl1,1172,059(45.8)(47.2)1.4
     WW1,1172,179(48.8)(50.1)1.3
     EDURANT / rilpivirine
     US35 36 (3.7)(3.7)— 
     Intl1,115 972 14.812.12.7 
     WW1,150 1,008 14.111.52.6 
     PREZISTA / PREZCOBIX / REZOLSTA / SYMTUZA
     US1,4461,494(3.2)(3.2)— 
     Intl408449(9.2)(10.4)1.2 
     WW1,8541,943(4.6)(4.9)0.3 
     OTHER INFECTIOUS DISEASES
     US1930(34.5)(34.5)— 
     Intl278289(3.8)(0.4)(3.4)
     WW297318(6.7)(3.6)(3.1)
See footnotes at end of schedule


Johnson & Johnson
Segment Sales
(Dollars in Millions)
TWELVE MONTHS
% Change
20232022Reported
Operational (1)
Currency
INNOVATIVE MEDICINE SEGMENT (2,3,4)(Continued)
NEUROSCIENCE
US$4,0653,57013.9%13.9%—%
Intl3,0763,323(7.5)(3.7)(3.8)
WW7,1406,8933.65.4(1.8)
     CONCERTA / methylphenidate
     US23015152.552.5
     Intl55449312.216.4(4.2)
     WW78364421.624.9(3.3)
     INVEGA SUSTENNA / XEPLION / INVEGA
     TRINZA / TREVICTA
     US2,8972,7146.76.7
     Intl1,2181,426(14.6)(12.8)(1.8)
     WW4,1154,140(0.6)0.0(0.6)
     SPRAVATO
     US58932879.779.7
     Intl10046***
     WW68937484.184.00.1
     OTHER NEUROSCIENCE
     US349376(7.3)(7.3)
     Intl1,2041,358(11.3)(5.4)(5.9)
     WW1,5531,734(10.4)(5.9)(4.5)
ONCOLOGY
US8,4626,93022.122.1
Intl9,1999,0521.62.9(1.3)
WW17,66115,98310.511.2(0.7)
     CARVYKTI
US469 133 **
Intl30  **
WW500 133 ***
     DARZALEX
     US5,277 4,210 25.425.4
     Intl4,467 3,767 18.620.2(1.6)
     WW9,744 7,977 22.222.9(0.7)
     ERLEADA
     US1,065 968 10.010.0
     Intl1,322 913 44.846.0(1.2)
     WW2,387 1,881 26.927.5(0.6)
     IMBRUVICA
     US1,051 1,390 (24.4)(24.4)
     Intl2,214 2,394 (7.5)(6.7)(0.8)
     WW3,264 3,784 (13.7)(13.2)(0.5)
     ZYTIGA / abiraterone acetate
     US5074 (32.1)(32.1)
     Intl8371,696(50.7)(49.1)(1.6)
     WW8871,770(49.9)(48.4)(1.5)
     OTHER ONCOLOGY
     US549 156 **
     Intl33028316.917.0(0.1)
     WW879438***


Johnson & Johnson
Segment Sales
(Dollars in Millions)
TWELVE MONTHS
% Change
20232022Reported
Operational (1)
Currency
INNOVATIVE MEDICINE SEGMENT (2,3,4)(Continued)
PULMONARY HYPERTENSION
US$2,697 2,346 15.0 %15.0 %— %
Intl1,117 1,071 4.3 8.3 (4.0)
WW3,815 3,417 11.6 12.9 (1.3)
     OPSUMIT
     US1,292 1,132 14.1 14.1 — 
     Intl681 651 4.6 7.2 (2.6)
     WW1,973 1,783 10.6 11.6 (1.0)
     UPTRAVI
     US1,326 1,104 20.1 20.1 — 
     Intl255 218 17.3 21.8 (4.5)
     WW1,582 1,322 19.7 20.4 (0.7)
     OTHER PULMONARY HYPERTENSION
     US79 110 (28.6)(28.6)— 
     Intl182 202 (10.3)(2.9)(7.4)
     WW260 313 (16.7)(12.0)(4.7)
CARDIOVASCULAR / METABOLISM / OTHER
US2,9063,042(4.5)(4.5)— 
Intl765845(9.4)(9.1)(0.3)
WW3,6713,887(5.5)(5.5)0.0 
     XARELTO
     US2,365 2,473 (4.4)(4.4)— 
     Intl  — — — 
     WW2,365 2,473 (4.4)(4.4)— 
     OTHER
     US541 569 (5.0)(5.0)— 
     Intl765 845 (9.4)(9.1)(0.3)
     WW1,306 1,414 (7.6)(7.4)(0.2)
TOTAL INNOVATIVE MEDICINE
US31,16928,6049.0 9.0  
Intl23,59023,959(1.5)(0.2)(1.3)
WW$54,75952,5634.2 %4.8 %(0.6)%


Johnson & Johnson
Segment Sales
(Dollars in Millions)
TWELVE MONTHS
% Change
20232022Reported
Operational (1)
Currency
MEDTECH SEGMENT (2,3)
INTERVENTIONAL SOLUTIONS
US$3,633 2,169 67.5 %67.5 %— %
Intl2,717 2,13127.5 31.7 (4.2)
WW6,350 4,30047.7 49.8 (2.1)
ELECTROPHYSIOLOGY
US2,458 2,036 20.7 20.7 — 
Intl2,230 1,90117.3 21.5 (4.2)
WW4,688 3,93719.1 21.1 (2.0)
ABIOMED
US1,066 31**— 
Intl240 **— 
WW1,306 31**— 
OTHER INTERVENTIONAL SOLUTIONS
US109 102 6.7 6.7 — 
Intl247 2307.3 11.4 (4.1)
WW356 3327.1 9.9 (2.8)
ORTHOPAEDICS
US5,525 5,321 3.8 3.8 — 
Intl3,417 3,267 4.6 5.8 (1.2)
WW8,942 8,587 4.1 4.6 (0.5)
     HIPS
     US996 943 5.6 5.6 — 
     Intl564 571 (1.2)(0.1)(1.1)
     WW1,560 1,514 3.0 3.5 (0.5)
     KNEES
     US896 851 5.3 5.3 — 
     Intl559 508 10.2 11.1 (0.9)
     WW1,456 1,359 7.1 7.5 (0.4)
     TRAUMA
     US1,949 1,882 3.6 3.6 — 
     Intl1,030 989 4.1 4.8 (0.7)
     WW2,979 2,871 3.8 4.0 (0.2)
     SPINE, SPORTS & OTHER
     US1,684 1,645 2.4 2.4 — 
     Intl1,263 1,198 5.4 7.3 (1.9)
     WW2,947 2,843 3.7 4.5 (0.8)
See footnotes at end of schedule


Johnson & Johnson
Segment Sales
(Dollars in Millions)
TWELVE MONTHS
% Change
20232022Reported
Operational (1)
Currency
MEDTECH SEGMENT (2,3)(Continued)
SURGERY
US$4,031 3,897 3.4 %3.4 %— %
Intl6,006 5,793 3.7 7.0 (3.3)
WW10,037 9,690 3.6 5.5 (1.9)
     ADVANCED
US1,833 1,784 2.8 2.8  
Intl2,837 2,785 1.9 5.1 (3.2)
WW4,671 4,569 2.2 4.2 (2.0)
     GENERAL
US2,198 2,113 4.0 4.0  
Intl3,168 3,008 5.3 8.7 (3.4)
WW5,366 5,121 4.8 6.8 (2.0)
VISION
US2,086 1,990 4.8 4.8  
Intl2,986 2,859 4.5 7.9 (3.4)
WW5,072 4,849 4.6 6.6 (2.0)
     CONTACT LENSES / OTHER
US1,626 1,522 6.8 6.8  
Intl2,076 2,022 2.7 7.0 (4.3)
WW3,702 3,543 4.5 6.9 (2.4)
     SURGICAL
US460 468 (1.8)(1.8)— 
Intl910 837 8.610.0 (1.4)
WW1,370 1,306 4.95.8(0.9)
TOTAL MEDTECH
US15,275 13,377 14.2 14.2  
Intl15,125 14,050 7.7 10.6 (2.9)
WW$30,400 27,427 10.8 %12.4 %(1.6)%
Note: Column and rows within tables may not add due to rounding. Percentages have been calculated using actual, non-
rounded figures and, therefore, may not recalculate precisely.
* Percentage greater than 100% or not meaningful
(1) Operational growth excludes the effect of translational currency
(2) Unaudited
(3) Certain prior year amounts have been reclassified to conform to current year product disclosures
(4) Previously referred to as Pharmaceutical
(5) Reported as U.S. sales


Supplemental Sales Reconciliation (Unaudited)
(Dollars in Millions)
FOURTH QUARTER
% Change
20232022TotalOperationsCurrency
Innovative Medicine
U.S.$8,079  7,375  9.5 % 9.5  -
International 5,643  5,788  (2.5) (3.1) 0.6
Worldwide 13,722  13,163  4.2  4.0  0.2
COVID-19 Vaccine
U.S. -  -  -
International 44  689  (93.7) (95.2) 1.5
Worldwide 44  689  (93.7) (95.2) 1.5
Innovative Medicine excluding COVID-19 Vaccine
U.S. 8,079  7,375  9.5  9.5  -
International 5,599  5,099  9.8  9.4  0.4
Worldwide 13,678  12,474  9.7  9.5  0.2
Worldwide
U.S. 12,009  10,820  11.0  11.0  -
International 9,386  9,119  2.9  2.7  0.2
Worldwide 21,395  19,939  7.3  7.2  0.1
COVID-19 Vaccine
U.S. -  -  -
International 44  689  (93.7) (95.2) 1.5
Worldwide 44  689  (93.7) (95.2) 1.5
Worldwide
U.S. 12,009  10,820  11.0  11.0  -
International 9,342  8,430  10.8  10.7  0.1
Worldwide excluding COVID-19 Vaccine$21,351  19,250  10.9 % 10.9  -
Note: Columns and rows within tables may not add due to rounding


Supplemental Sales Reconciliation (Unaudited)
(Dollars in Millions)
TWELVE MONTHS
% Change
20232022TotalOperationsCurrency
Innovative Medicine
U.S.$31,169  28,604  9.0 % 9.0  -
International 23,590  23,959  (1.5) (0.2) (1.3)
Worldwide 54,759  52,563  4.2  4.8  (0.6)
COVID-19 Vaccine
U.S. -  120  *  *  -
International 1,117  2,059  (45.8) (47.2) 1.4
Worldwide 1,117  2,179  (48.8) (50.1) 1.3
Innovative Medicine excluding COVID-19 Vaccine
U.S. 31,169  28,484  9.4  9.4  -
International 22,473  21,900  2.6  4.3  (1.7)
Worldwide 53,642  50,384  6.5  7.2  (0.7)
Worldwide
U.S. 46,444  41,981  10.6  10.6  -
International 38,715  38,009  1.9  3.8  (1.9)
Worldwide 85,159  79,990  6.5  7.4  (0.9)
COVID-19 Vaccine
U.S. -  120  *  *  -
International 1,117  2,059  (45.8) (47.2) 1.4
Worldwide 1,117  2,179  (48.8) (50.1) 1.3
Worldwide
U.S. 46,444  41,861  10.9  10.9  -
International 37,598  35,950  4.6  6.7  (2.1)
Worldwide excluding COVID-19 Vaccine$84,042  77,811  8.0 % 9.0  (1.0)
Note: Columns and rows within tables may not add due to rounding
* Percentage greater than 100% or not meaningful