jnj-20230720
0000200406false00002004062023-07-202023-07-200000200406us-gaap:CommonStockMember2023-07-202023-07-200000200406jnj:A0.650NotesDue2024Member2023-07-202023-07-200000200406jnj:A5.50NotesDue2024Member2023-07-202023-07-200000200406jnj:A1.150NotesDue2028Member2023-07-202023-07-200000200406jnj:A1.650NotesDue2035Member2023-07-202023-07-20


UNITED STATES
SECURITIES AND EXCHANGE COMMISSION
WASHINGTON, DC 20549

FORM 8-K

CURRENT REPORT
Pursuant to Section 13 or 15(d) of The
Securities Exchange Act of 1934
 
Date of report (Date of earliest event reported): 
July 20, 2023
Johnson & Johnson
 (Exact name of registrant as specified in its charter)
  
New Jersey1-321522-1024240
(State or Other Jurisdiction of Incorporation)(Commission File Number)(IRS Employer Identification No.)

One Johnson & Johnson Plaza, New Brunswick, New Jersey  08933 
(Address of Principal Executive Offices)
 (Zip Code) 
Registrant's telephone number, including area code:
732-524-0400
 
Check the appropriate box below if the Form 8-K filing is intended to simultaneously satisfy the filing obligation of the registrant under any of the following provisions:
 
            Written communications pursuant to Rule 425 under the Securities Act (17 CFR 230.425) 
            Soliciting material pursuant to Rule 14a-12 under the Exchange Act (17 CFR 240.14a-12) 
            Pre-commencement communications pursuant to Rule 14d-2(b) under the Exchange Act (17
               CFR 240.14d-2(b)) 
            Pre-commencement communications pursuant to Rule 13e-4(c) under the Exchange Act (17
               CFR 240.13e-4(c))

Indicate by check mark whether the registrant is an emerging growth company as defined in Rule 405 of the Securities Act of 1933 (§230.405 of this chapter) or Rule 12b-2 of the Securities Exchange Act of 1934 (§240.12b-2 of this chapter).
    Emerging growth company  

If an emerging growth company, indicate by check mark if the registrant has elected not to use the extended transition period for complying with any new or revised financial accounting standards provided pursuant to Section 13(a) of the Exchange Act. 

Securities registered pursuant to Section 12(b) of the Act:
Title of each classTrading Symbol(s)Name of each exchange on which registered
Common Stock, Par Value $1.00JNJNew York Stock Exchange
0.650% Notes Due May 2024JNJ24CNew York Stock Exchange
5.50% Notes Due November 2024JNJ24BPNew York Stock Exchange
1.150% Notes Due November 2028JNJ28New York Stock Exchange
1.650% Notes Due May 2035JNJ35New York Stock Exchange


Item 2.02     Results of Operations and Financial Condition

On July 20, 2023, Johnson & Johnson issued the attached press release (Exhibit 99.1) announcing its sales and earnings for the second quarter ended July 2, 2023.
 
Item 9.01    Financial Statements and Exhibits

(d)     Exhibits. 
 
Exhibit No.
 
Description of Exhibit
 
104The cover page from this Current Report on Form 8-K, formatted in Inline XBRL.


SIGNATURES
 
Pursuant to the requirements of the Securities Exchange Act of 1934, the registrant has duly caused this report to be signed on its behalf by the undersigned hereunto duly authorized.
 
 Johnson & Johnson 
   (Registrant)


Date: July 20, 2023By:/s/ Robert J. Decker, Jr. 
  Robert J. Decker, Jr.
Controller
(Principal Accounting Officer)


Exhibit 99.1

JOHNSON & JOHNSON REPORTS 2023 SECOND-QUARTER RESULTS:
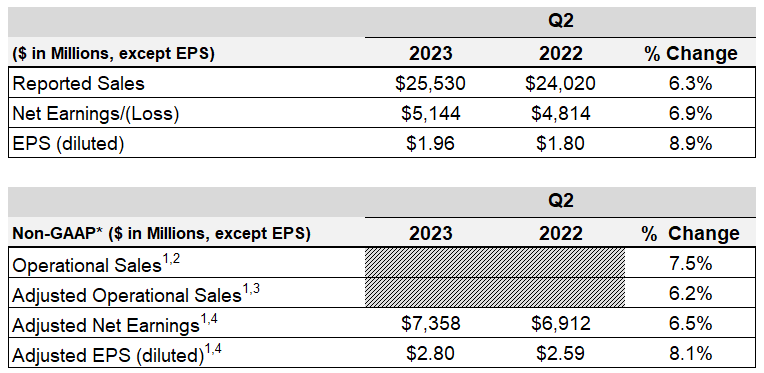
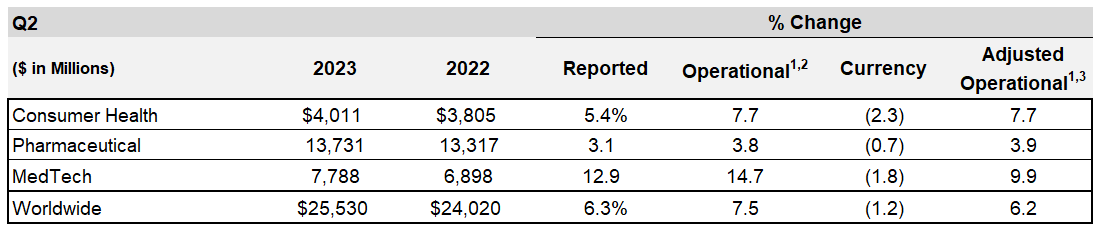
2023 Second-Quarter reported sales growth of 6.3% to $25.5 Billion with operational growth of 7.5%* and adjusted operational growth of 6.2%*. Operational growth excluding COVID-19 Vaccine of 8.9%*

Earnings per share (EPS) of $1.96 increasing 8.9% and adjusted EPS of $2.80 increasing by 8.1%*

Company is increasing 2023 full-year guidance midpoints for adjusted operational sales excluding COVID-19 Vaccine and adjusted operational EPS

Johnson & Johnson intends to "split off" Kenvue shares through an exchange offer as the form of its next step in the separation, subject to market conditions

New Brunswick, N.J. (July 20, 2023) – Johnson & Johnson (NYSE: JNJ) today announced results for second-quarter 2023. “Our robust performance in the second quarter and first half of 2023 is a testament to the hard work and commitment of our colleagues around the world,” said Joaquin Duato, Chairman of the Board and Chief Executive Officer. “We are entering the back half of the year from a position of strength with numerous catalysts, including becoming a two-sector company focused on Pharmaceutical and MedTech innovation.”

OVERALL FINANCIAL RESULTS:
overallresultsqtd.jpg
1 Non-GAAP financial measure; refer to reconciliations of non-GAAP financial measures included in accompanying schedules
2 Excludes the impact of translational currency
3 Excludes the net impact of acquisitions and divestitures and translational currency
4 Excludes intangible amortization expense and special items
Note: values may have been rounded


REGIONAL SALES RESULTS:

regionalsalesqtd.jpg
1 Non-GAAP financial measure; refer to reconciliations of non-GAAP financial measures included in accompanying schedules
2 Excludes the impact of translational currency
3 Excludes the net impact of acquisitions and divestitures and translational currency
Note: values may have been rounded


SEGMENT SALES RESULTS:
segmentsalesqtd.jpg
1 Non-GAAP financial measure; refer to reconciliations of non-GAAP financial measures included in accompanying schedules
2 Excludes the impact of translational currency
3 Excludes the net impact of acquisitions and divestitures and translational currency
Note: Values may have been rounded


SECOND QUARTER 2023 SEGMENT COMMENTARY:
Adjusted operational sales* reflected below excludes the net impact of acquisitions and divestitures and translational currency.

Pharmaceutical
Pharmaceutical worldwide adjusted operational sales grew 3.9%*. Excluding the COVID-19 Vaccine, adjusted operational sales grew 6.2%*. Growth was driven by DARZALEX (daratumumab), ERLEADA (apalutamide), and CARVYKTI (ciltacabtagene autoleucel) in Oncology, STELARA (ustekinumab) and TREMFYA (guselkumab) in Immunology, UPTRAVI (selexipag) and OPSUMIT (macitentan) in Pulmonary Hypertension, and SPRAVATO (esketamine) in Neuroscience. Growth was partially offset by ZYTIGA (abiraterone acetate) and IMBRUVICA (ibrutinib) in Oncology, COVID-19 Vaccine (Ad26.COV2.S) in Infectious Diseases, and REMICADE (infliximab) in Immunology.

MedTech
MedTech worldwide adjusted operational sales grew 9.9%*, driven primarily by electrophysiology products in Interventional Solutions, trauma in Orthopaedics, wound closure products in General Surgery, biosurgery in Advanced Surgery, and contact lenses in Vision. MedTech worldwide operational sales grew 14.7%*, with the acquisition of Abiomed contributing 4.8%.

Consumer Health
Consumer Health worldwide adjusted operational sales increased 7.7%* largely driven by over-the-counter (OTC) products. Major contributors to growth in OTC were TYLENOL and MOTRIN analgesics, upper respiratory products, international smoking cessation products, and IMODIUM in digestive health products. Additional contributors to growth were NEUTROGENA in Skin Health/Beauty products and Women’s Health products outside the United States.


NOTABLE NEW ANNOUNCEMENTS IN THE QUARTER:
The information contained in this section should be read in conjunction with Johnson & Johnson’s other disclosures filed with the Securities and Exchange Commission, including its Current Reports on Form 8-K, Quarterly Reports on Form 10-Q and Annual Reports on Form 10-K. Copies of these filings are available online at www.sec.gov, www.jnj.com or on request from Johnson & Johnson. The reader is also encouraged to review all other news releases and information available in the Investors section of the company’s website at news releases, as well as www.factsabouttalc.com, www.factsaboutourprescriptionopioids.com, and www.LTLManagementInformation.com.

RegulatoryJanssen Marks First Approval Worldwide for AKEEGA (Niraparib and Abiraterone Acetate Dual Action Tablet) with EC Authorisation for the Treatment of Patients with Metastatic Castration Resistant Prostate Cancer with BRCA1/2 MutationsPress Release
Milvexian Granted U.S. FDA Fast Track Designation for All Three Indications Under Evaluation in Phase 3 Librexia Program: Ischemic Stroke, Acute Coronary Syndrome and Atrial FibrillationPress Release
Janssen Submits New Drug Application to U.S. FDA Seeking Approval of Investigational Single Tablet Combination Therapy of Macitentan and Tadalafil for Treatment of Patients with Pulmonary Arterial Hypertension (PAH)Press Release
Janssen Submits Supplemental Biologics License Application to U.S. FDA Seeking Approval of CARVYKTI for the Earlier Treatment of Patients with Relapsed or Refractory Multiple MyelomaPress Release
Data ReleaseJanssen Reports First Results from Phase 2 SunRISe-1 Study of TAR-200 and Anti-PD-1 Antibody Cetrelimab in Patients with Bacillus Calmette-Guérin-Unresponsive Non-Muscle-Invasive Bladder CancerPress Release
First Phase 3 TREMFYA (guselkumab) Data in Inflammatory Bowel Disease Show Positive Induction Results Among Patients with Moderately to Severely Active Ulcerative ColitisPress Release
New Data Published on Biosense Webster QDOT MICRO Catheter – the Latest Advancement in Focal RF Ablation for Treating AFibPress Release
Janssen to Highlight Scientific Advances and Commitment to Transform Cancer Care at ASCO and EHA with More than 90 Presentations Showcasing Robust, Differentiated Portfolio and Pipeline in Hematologic Malignancies and Solid TumorsPress Release
New Phase 2 Data Demonstrate Potential Benefit of Nipocalimab for Pregnant Individuals at High Risk of Early-Onset Severe Hemolytic Disease of the Fetus and Newborn (HDFN)Press Release
Janssen Announces Positive Topline Results for JNJ-2113—a Novel, First and Only Oral IL-23 Receptor Antagonist Peptide in Development for Moderate-to-Severe Plaque Psoriasis1
Press Release
Treatment with RYBREVANT (amivantamab-vmjw) Plus Chemotherapy Resulted in Statistically Significant and Clinically Meaningful Improvement in Progression-Free Survival in Patients with Newly Diagnosed EGFR Exon 20 Insertion Mutation-Positive Non-Small Cell Lung Cancer1
Press Release

Other
Johnson & Johnson Announces Launch of Kenvue Inc. IPO RoadshowPress Release
Janssen Enters Worldwide Collaboration and License Agreement with Cellular Biomedicine Group to Develop Next Generation CAR-T TherapiesPress Release
1 Subsequent to the quarter


FULL-YEAR 2023 GUIDANCE:

Johnson & Johnson does not provide GAAP financial measures on a forward-looking basis because the company is unable to predict with reasonable certainty the ultimate outcome of legal proceedings, unusual gains and losses, acquisition-related expenses and purchase accounting fair value adjustments without unreasonable effort. These items are uncertain, depend on various factors, and could be material to Johnson & Johnson's results computed in accordance with GAAP.
($ in Billions, except EPS)
July 2023
April 2023
Adjusted Operational Sales1,2,5
Change vs. Prior Year / Mid-point
6.0% 7.0% / 6.5%
4.5% 5.5% / 5.0%
Operational Sales2,5/ Mid-point
Change vs. Prior Year / Mid-point
$99.3B $100.3B / $99.8B
7.0% 8.0% / 7.5%
$97.9B – $98.9B / $98.4B
5.5% – 6.5% / 6.0%
Estimated Reported Sales3,5/ Mid-point
Change vs. Prior Year / Mid-point
$98.8B $99.8B / $99.3B
6.5% – 7.5% / 7.0%
$97.9B – $98.9B / $98.4B
5.5% – 6.5% / 6.0%
Adjusted Operational EPS (Diluted)2,4/ Mid-point
Change vs. Prior Year / Mid-point
$10.60 – $10.70 / $10.65
4.5% – 5.5% / 5.0%
$10.50 – $10.60 / $10.55
3.5% – 4.5% / 4.0%
Adjusted EPS (Diluted)3,4 / Mid-point
Change vs. Prior Year / Mid-point
$10.70 – $10.80 / $10.75
5.5% – 6.5% / 6.0%
$10.60 – $10.70 / $10.65
4.5% – 5.5% / 5.0%

1 Non-GAAP financial measure; excludes the net impact of acquisitions and divestitures
2 Non-GAAP financial measure; excludes the impact of translational currency
3 Calculated using Euro Average Rate: July 2023 = $1.09 and April 2023 = $1.10 (Illustrative purposes only)
4 Non-GAAP financial measure; excludes intangible amortization expense and special items
5 Excludes COVID-19 Vaccine
Note: percentages may have been rounded

Other modeling considerations will be provided on the webcast.


WEBCAST INFORMATION:
Johnson & Johnson will conduct a conference call with investors to discuss this earnings release today at 8:30 a.m., Eastern Time. A simultaneous webcast of the call for investors and other interested parties may be accessed by visiting the Johnson & Johnson website. A replay and podcast will be available approximately two hours after the live webcast in the Investors section of the Company's website at events-and-presentations.

ABOUT JOHNSON & JOHNSON:
At Johnson & Johnson, we believe good health is the foundation of vibrant lives, thriving communities and forward progress. That’s why for more than 135 years, we have aimed to keep people well at every age and every stage of life. Today, as the world’s largest, most diversified healthcare products company, we are committed to using our reach and size for good. We strive to improve access and affordability, create healthier communities, and put a healthy mind, body and environment within reach of everyone, everywhere. We are blending our heart, science and ingenuity to profoundly change the trajectory of health for humanity.

NON-GAAP FINANCIAL MEASURES:
* “Operational sales growth” excluding the impact of translational currency, “adjusted operational sales growth” excluding the net impact of acquisitions and divestitures and translational currency, as well as “adjusted net earnings”, “adjusted diluted earnings per share” and “adjusted operational diluted earnings per share” excluding after-tax intangible amortization expense and special items, are non-GAAP financial measures and should not be considered replacements for, and should be read together with, the most comparable GAAP financial measures. Except for guidance measures, reconciliations of these non-GAAP financial measures to the most directly comparable GAAP financial measures can be found in the accompanying financial schedules of the earnings release and the Investors section of the company's website at quarterly-results.

Copies of the financial schedules accompanying this earnings release are available on the company’s website at quarterly-results. These schedules include supplementary sales data, a condensed consolidated statement of earnings, reconciliations of non-GAAP financial measures, and sales of key products/franchises. Additional information on Johnson & Johnson, including adjusted income before tax by segment, a pharmaceutical pipeline of selected compounds in late stage development and a copy of today’s earnings call presentation can also be found in the Investors section of the company's website at quarterly-results.


NOTE TO INVESTORS CONCERNING FORWARD-LOOKING STATEMENTS:
This press release contains “forward-looking statements” as defined in the Private Securities Litigation Reform Act of 1995 regarding, among other things: future operating and financial performance, product development, market position and business strategy, and the anticipated separation of the Company’s Consumer Health business. The reader is cautioned not to rely on these forward-looking statements. These statements are based on current expectations of future events. If underlying assumptions prove inaccurate or known or unknown risks or uncertainties materialize, actual results could vary materially from the expectations and projections of Johnson & Johnson. Risks and uncertainties include, but are not limited to: economic factors, such as interest rate and currency exchange rate fluctuations; competition, including technological advances, new products and patents attained by competitors; challenges inherent in new product research and development, including uncertainty of clinical success and obtaining regulatory approvals; uncertainty of commercial success for new and existing products; challenges to patents; the impact of patent expirations; the ability of the company to successfully execute strategic plans, including restructuring plans; the impact of business combinations and divestitures; manufacturing difficulties or delays, internally or within the supply chain; product efficacy or safety concerns resulting in product recalls or regulatory action; significant adverse litigation or government action, including related to product liability claims; changes to applicable laws and regulations, including tax laws and global health care reforms; trends toward health care cost containment; changes in behavior and spending patterns of purchasers of health care products and services; financial instability of international economies and legal systems and sovereign risk; increased scrutiny of the health care industry by government agencies; the Company’s ability to satisfy the necessary conditions to consummate the separation of the Company’s Consumer Health business on a timely basis or at all; the Company’s ability to successfully separate the Company’s Consumer Health business and realize the anticipated benefits from the separation; and the New Consumer Health Company’s ability to succeed as a standalone publicly traded company. A further list and descriptions of these risks, uncertainties and other factors can be found in Johnson & Johnson’s Annual Report on Form 10-K for the fiscal year ended January 1, 2023, including in the sections captioned “Cautionary Note Regarding Forward-Looking Statements” and “Item 1A. Risk Factors,” and in Johnson & Johnson’s subsequent Quarterly Reports on Form 10-Q and other filings with the Securities and Exchange Commission. Copies of these filings are available online at www.sec.gov, www.jnj.com or on request from Johnson & Johnson. Any forward-looking statement made in this release speaks only as of the date of this release. Johnson & Johnson does not undertake to update any forward-looking statement as a result of new information or future events or developments.


Press Contacts:Investor Contacts:
Tesia Williams Jessica Moore
[email protected] [email protected]


Exhibit 99.2


Johnson & Johnson and Subsidiaries
Supplementary Sales Data
(Unaudited; Dollars in Millions)
SECOND QUARTER
Percent Change
20232022TotalOperationsCurrency
Sales to customers by
geographic area
U.S.$13,444  12,197  10.2 % 10.2 — 
Europe 5,894  6,085 (3.1) (3.9) 0.8
Western Hemisphere excluding U.S. 1,713  1,536  11.5 17.7  (6.2)
Asia-Pacific, Africa 4,479  4,202  6.6  12.5  (5.9)
International 12,086  11,823  2.2  4.7  (2.5)
      
Worldwide$25,530  24,020  6.3 % 7.5  (1.2)
        
Note: Percentages have been calculated using actual, non-rounded figures and, therefore, may not recalculate precisely.


Johnson & Johnson and Subsidiaries
Supplementary Sales Data
(Unaudited; Dollars in Millions)
SIX MONTHS
Percent Change
20232022TotalOperationsCurrency
Sales to customers by
geographic area
U.S.$25,961  23,611 10.0 %10.0 — 
Europe 12,226  12,109  1.0  3.0  (2.0)
Western Hemisphere excluding U.S. 3,300  3,018  9.3  16.1  (6.8)
Asia-Pacific, Africa 8,789  8,708  0.9  8.2  (7.3)
International 24,315  23,835  2.0  6.5  (4.5)
      
Worldwide$50,276  47,446  6.0 % 8.2  (2.2)
Note: Percentages have been calculated using actual, non-rounded figures and, therefore, may not recalculate precisely.


Johnson & Johnson and Subsidiaries
Supplementary Sales Data
(Unaudited; Dollars in Millions)
SECOND QUARTER
 Percent Change
20232022TotalOperationsCurrency
Sales to customers by
segment of business
Consumer Health
    U.S.$1,787 1,687 6.0 %6.0 — 
    International2,224 2,118 5.0 9.0 (4.0)
4,011    3,805 5.4 7.7 (2.3)
Pharmaceutical (1)
    U.S.7,818 7,159 9.2 9.2 — 
    International5,913 6,158 (4.0)(2.5)(1.5)
13,731    13,317 3.1 3.8 (0.7)
Pharmaceutical excluding COVID-19 Vaccine (1)
     U.S.7,818 7,114 9.9 9.9— 
     International5,628 5,659 (0.5)1.5(2.0)
13,446 12,773 5.3 6.2(0.9)
MedTech
    U.S.3,839    3,351 14.6 14.6 — 
    International3,949 3,547 11.3 14.7 (3.4)
 7,788    6,898 12.9 14.7 (1.8)
U.S.13,444 12,197 10.2 10.2 — 
International12,086 11,823 2.2 4.7 (2.5)
Worldwide25,530 24,020 6.3 7.5 (1.2)
      
U.S.13,444 12,152 10.6 10.6 — 
International11,801 11,324 4.2 7.0 (2.8)
Worldwide excluding COVID-19 Vaccine (1)
$25,245 23,476 7.5 %8.9 (1.4)
Note: Percentages have been calculated using actual, non-rounded figures and, therefore, may not recalculate precisely.
(1) Refer to supplemental sales reconciliation schedules.


Johnson & Johnson and Subsidiaries
Supplementary Sales Data
(Unaudited; Dollars in Millions)
SIX MONTHS
 Percent Change
20222021TotalOperationsCurrency
Sales to customers by
segment of business
Consumer Health
    U.S.$3,522 3,244 8.6 %8.6 — 
    International4,341 4,147 4.7 10.1 (5.4)
7,863    7,391 6.4 9.5 (3.1)
Pharmaceutical (1)
    U.S.14,841 13,791 7.6 7.6 — 
    International12,303 12,395 (0.7)3.1 (3.8)
27,144    26,186 3.7 5.5 (1.8)
Pharmaceutical excluding COVID-19 Vaccine (1)
     U.S.14,841 13,671 8.6 8.6— 
     International11,271 11,514 (2.1)1.9(4.0)
26,112 25,185 3.7 5.5(1.8)
MedTech
    U.S.7,598    6,576 15.5 15.5 — 
    International7,671 7,293 5.2 10.3 (5.1)
 15,269    13,869 10.1 12.8 (2.7)
U.S.25,961 23,611 10.0 10.0 — 
International24,315 23,835 2.0 6.5 (4.5)
Worldwide50,276 47,446 6.0 8.2 (2.2)
      
U.S.25,961 23,491 10.5 10.5 — 
International23,283 22,954 1.4 6.1 (4.7)
Worldwide excluding COVID-19 Vaccine (1)
$49,244 46,445 6.0 %8.3 (2.3)
Note: Percentages have been calculated using actual, non-rounded figures and, therefore, may not recalculate precisely.
(1) Refer to supplemental sales reconciliation schedules.


Johnson & Johnson and Subsidiaries 
Condensed Consolidated Statement of Earnings  
(Unaudited; in Millions Except Per Share Figures)
SECOND QUARTER
20232022Percent
PercentPercentIncrease
Amountto SalesAmountto Sales(Decrease)
Sales to customers$25,530 100.0 $24,020 100.0 6.3 
Cost of products sold8,212 32.2 7,919 33.0 3.7 
Gross Profit17,318 67.8 16,101 67.0 7.6 
Selling, marketing and administrative expenses6,665 26.1 6,226 25.9 7.1 
Research and development expense3,829 15.0 3,703 15.4 3.4 
Interest (income) expense, net(23)(0.1)(26)(0.1) 
Other (income) expense, net*(60)(0.2)273 1.1  
Restructuring145 0.5 85 0.4  
Earnings before provision for taxes on income6,762 26.5 5,840 24.3 15.8 
Provision for taxes on income1,618 6.4 1,026 4.3 57.7 
Net earnings$5,144 20.1 $4,814 20.0 6.9 
Net earnings per share (Diluted)$1.96 $1.80 8.9 
Average shares outstanding (Diluted)2,625.7 2,667.9 
Effective tax rate23.9 %17.6 %
Adjusted earnings before provision for taxes and net earnings (1) (A)
Earnings before provision for taxes on income$8,824 34.6$8,171 34.08.0 
Net earnings$7,358 28.8$6,912 28.86.5 
Net earnings per share (Diluted)$2.80 $2.59 8.1 
Effective tax rate16.6 %15.4 %
* Fiscal second quarter Other (income) expense, net includes $37 million related to the Company's 10.4% non-controlling interest in Kenvue, Inc. from the time of the initial public offering on May 8, 2023 through the end of the fiscal second quarter.
(1) See Reconciliation of Non-GAAP Financial Measures.
(A) NON-GAAP FINANCIAL MEASURES "Adjusted earnings before provision for taxes on income," "adjusted net earnings," "adjusted net earnings per share (diluted)," and "adjusted effective tax rate" are non-GAAP financial measures and should not be considered replacements for GAAP results. The Company provides earnings before provision for taxes on income, net earnings, net earnings per share (diluted), and effective tax rate on an adjusted basis because management believes that these measures provide useful information to investors. Among other things, these measures may assist investors in evaluating the Company's results of operations period over period. In various periods, these measures may exclude such items as intangible asset amortization expense, significant gains from divestitures, significant costs associated with acquisitions, restructuring, litigation, and changes in applicable laws and regulations (including significant accounting or tax matters). Special items may be highly variable, difficult to predict, and of a size that sometimes has substantial impact on the Company's reported results of operations for a period. Management uses these measures internally for planning, forecasting and evaluating the performances of the Company's businesses, including allocating resources and evaluating results relative to employee performance compensation targets. Unlike earnings before provision for taxes on income, net earnings, net earnings per share (diluted), and effective tax rate prepared in accordance with GAAP, adjusted earnings before provision for taxes on income, adjusted net earnings, adjusted net earnings per share (diluted), and adjusted effective tax rate may not be comparable with the calculation of similar measures for other companies. The limitations of using these non-GAAP financial measures as performance measures are that they provide a view of the Company's results of operations without including all events during a period, such as intangible asset amortization expense, significant gains from divestitures, the effects of an acquisition, restructuring, litigation, and changes in applicable laws and regulations (including significant accounting or tax matters) and do not provide a comparable view of the Company's performance to other companies in the health care industry. Investors should consider non-GAAP financial measures in addition to, and not as replacements for, or superior to, measures of financial performance prepared in accordance with GAAP.


Johnson & Johnson and Subsidiaries 
Condensed Consolidated Statement of Earnings  
(Unaudited; in Millions Except Per Share Figures)
SIX MONTHS
20222021Percent
PercentPercentIncrease
Amountto SalesAmountto Sales(Decrease)
Sales to customers$50,276 100.0$47,446 100.06.0 
Cost of products sold16,607 33.015,517 32.77.0 
Gross Profit33,669 67.031,929 67.35.4 
Selling, marketing and administrative expenses12,803 25.512,164 25.65.3 
Research and development expense7,392 14.77,165 15.13.2 
In-process research and development490.1610 1.3 
Interest (income) expense, net(43)(0.1)(38)(0.1) 
Other (income) expense, net*7,168 14.3 171 0.4  
Restructuring275 0.5155 0.3 
Earnings before provision for taxes on income6,025 12.011,702 24.7(48.5)
Provision for taxes on income949 1.91,739 3.7 (45.4)
Net earnings$5,076 10.1$9,963 21.0(49.1)
Net earnings per share (Diluted)$1.93 $3.73 (48.3)
Average shares outstanding (Diluted)2,630.7 2,669.2 
Effective tax rate15.8 %14.9 %
Adjusted earnings before provision for taxes and net earnings (1) (A)
Earnings before provision for taxes on income$17,292 34.4$16,389 34.55.5 
Net earnings$14,426 28.7$14,041 29.62.7 
Net earnings per share (Diluted)$5.48 $5.26 4.2 
Effective tax rate16.6 %14.3 %
* Fiscal six months Other (income) expense, net includes $37 million related to the Company's 10.4% non-controlling interest in Kenvue, Inc. from the time of the initial public offering on May 8, 2023 through the end of the fiscal second quarter.
(1) See Reconciliation of Non-GAAP Financial Measures.
(A) NON-GAAP FINANCIAL MEASURES "Adjusted earnings before provision for taxes on income," "adjusted net earnings," "adjusted net earnings per share (diluted)," and "adjusted effective tax rate" are non-GAAP financial measures and should not be considered replacements for GAAP results. The Company provides earnings before provision for taxes on income, net earnings, net earnings per share (diluted), and effective tax rate on an adjusted basis because management believes that these measures provide useful information to investors. Among other things, these measures may assist investors in evaluating the Company's results of operations period over period. In various periods, these measures may exclude such items as intangible asset amortization expense, significant gains from divestitures, significant costs associated with acquisitions, restructuring, litigation, and changes in applicable laws and regulations (including significant accounting or tax matters). Special items may be highly variable, difficult to predict, and of a size that sometimes has substantial impact on the Company's reported results of operations for a period. Management uses these measures internally for planning, forecasting and evaluating the performances of the Company's businesses, including allocating resources and evaluating results relative to employee performance compensation targets. Unlike earnings before provision for taxes on income, net earnings, net earnings per share (diluted), and effective tax rate prepared in accordance with GAAP, adjusted earnings before provision for taxes on income, adjusted net earnings, adjusted net earnings per share (diluted), and adjusted effective tax rate may not be comparable with the calculation of similar measures for other companies. The limitations of using these non-GAAP financial measures as performance measures are that they provide a view of the Company's results of operations without including all events during a period, such as intangible asset amortization expense, significant gains from divestitures, the effects of an acquisition, restructuring, litigation, and changes in applicable laws and regulations (including significant accounting or tax matters) and do not provide a comparable view of the Company's performance to other companies in the health care industry. Investors should consider non-GAAP financial measures in addition to, and not as replacements for, or superior to, measures of financial performance prepared in accordance with GAAP.


Johnson & Johnson and Subsidiaries
Reconciliation of Non-GAAP Financial Measures
Second Quarter
(Dollars in Millions Except Per Share Data)20232022
Net Earnings, after tax- as reported$5,144 $4,814 
Pre-tax Adjustments
Litigation related137  385
Intangible Asset Amortization expense1,211 1,095
COVID-19 Vaccine related costs 1
 165  276
Consumer Health separation costs282 268
Restructuring related 2
 145 128
Medical Device Regulation 3
85 70
Acquisition, integration and divestiture related 38  -
(Gains)/losses on securities (1) 109
Tax Adjustments
Tax impact on special item adjustments 4
(373)(313)
Consumer Health separation tax related costs546  2
Tax legislation and other tax related(21) 78
Adjusted Net Earnings, after tax$7,358 $6,912 
Average shares outstanding (Diluted)2,625.7 2,667.9 
Adjusted net earnings per share (Diluted)$2.80 $2.59 
Operational adjusted net earnings per share (Diluted)$2.84  
Notes:
1
COVID-19 Vaccine related costs include remaining commitments and obligations, including external manufacturing network exit costs and required clinical trial expenses, associated with the Company's completion of its COVID-19 vaccine contractual commitments.
2
In the first and second quarter of 2023, the company completed a prioritization of its research and development (R&D) investment within the Pharmaceutical segment to focus on the most promising medicines with the greatest benefit to patients. This resulted in the exit of certain programs within therapeutic areas. The R&D program exits are primarily in infectious diseases and vaccines including the discontinuation of its respiratory syncytial virus (RSV) adult vaccine program, hepatitis and HIV development.  The restructuring expenses of $145 million in the quarter ($275 million Q2 YTD) include the termination of partnered and non-partnered program costs and asset impairments.
3
European Medical Device Regulation (MDR) costs represent one-time compliance costs for the Company’s previously registered products. MDR is a replacement of the existing European Medical Devices Directive regulatory framework, and manufacturers of currently marketed medical devices were required to comply with EU MDR beginning in May 2021. The Company considers the adoption of EU MDR to be a significant one-time regulatory change and is not indicative of on-going operations. The Company has excluded only external third-party regulatory and consulting costs from its MedTech operating segments' measures of profit and loss used for making operating decisions and assessing performance which is expected to be completed during 2024.
4
The tax impact related to special item adjustments reflects the current and deferred income taxes associated with the above pre-tax special items in arriving at adjusted earnings.


Johnson & Johnson and Subsidiaries
Reconciliation of Non-GAAP Financial Measures
Six Months Ended
(Dollars in Millions Except Per Share Data)20232022
Net Earnings, after tax- as reported$5,076 $9,963 
Pre-tax Adjustments
Litigation related7,037 385
Intangible Asset Amortization expense2,415 2,203
COVID-19 Vaccine related costs 1
 609  276
Consumer Health separation costs582 370
Restructuring related 2
 275 200
Medical Device Regulation 3
149 130
Acquisition, integration and divestiture related 80  -
(Gains)/losses on securities 71  520
IPR&D49  610
Other- (7)
Tax Adjustments
Tax impact on special item adjustments 4
(2,430)(706)
Consumer Health separation tax related costs557  98
Tax legislation and other tax related(44) (1)
Adjusted Net Earnings, after tax$14,426 $14,041 
Average shares outstanding (Diluted)2,630.7 2,669.2 
Adjusted net earnings per share (Diluted)$5.48 $5.26 
Operational adjusted net earnings per share (Diluted)$5.59  
Notes:
1
COVID-19 Vaccine related costs include remaining commitments and obligations, including external manufacturing network exit costs and required clinical trial expenses, associated with the Company's completion of its COVID-19 vaccine contractual commitments.
2
In the first and second quarter of 2023, the company completed a prioritization of its research and development (R&D) investment within the Pharmaceutical segment to focus on the most promising medicines with the greatest benefit to patients. This resulted in the exit of certain programs within therapeutic areas. The R&D program exits are primarily in infectious diseases and vaccines including the discontinuation of its respiratory syncytial virus (RSV) adult vaccine program, hepatitis and HIV development.  The restructuring expenses of $145 million in the quarter ($275 million Q2 YTD) include the termination of partnered and non-partnered program costs and asset impairments.
3
European Medical Device Regulation (MDR) costs represent one-time compliance costs for the Company’s previously registered products. MDR is a replacement of the existing European Medical Devices Directive regulatory framework, and manufacturers of currently marketed medical devices were required to comply with EU MDR beginning in May 2021. The Company considers the adoption of EU MDR to be a significant one-time regulatory change and is not indicative of on-going operations. The Company has excluded only external third-party regulatory and consulting costs from its MedTech operating segments' measures of profit and loss used for making operating decisions and assessing performance which is expected to be completed during 2024.
4
The tax impact related to special item adjustments reflects the current and deferred income taxes associated with the above pre-tax special items in arriving at adjusted earnings.


Johnson & Johnson and Subsidiaries
Reconciliation of Non-GAAP Financial Measure
Adjusted Operational Sales Growth (A)
 SECOND QUARTER 2023 ACTUAL vs. 2022 ACTUAL
 Segments
Consumer Health Pharmaceutical  MedTech  Total
 WW As Reported 5.4 %3.1 %12.9 %6.3 %
 U.S. 6.0 %9.2 %14.6 %10.2 %
 International 5.0 %(4.0)%11.3 %2.2 %
 WW Currency (2.3)(0.7)(1.8)(1.2)
 U.S.
 International (4.0)(1.5)(3.4)(2.5)
 WW Operational 7.7 %3.8 %14.7 %7.5 %
 U.S. 6.0 %9.2 %14.6 %10.2 %
 International9.0 %(2.5)%14.7 %4.7 %
Abiomed (4.8)(1.4)
 U.S.(8.1)(2.2)
 International(1.7)(0.5)
All Other Acquisitions and Divestitures0.00.10.00.1
 U.S. 0.00.00.00.0
 International 0.00.30.00.2
WW Adjusted Operational7.7 %3.9 %9.9 %6.2 %
 U.S. 6.0 %9.2 %6.5 %8.0 %
 International 9.0 %(2.2)%13.0 %4.4 %
Note: Percentages are based on actual, non-rounded figures and may not sum
(A) NON-GAAP FINANCIAL MEASURE “Adjusted operational sales growth" excludes acquisitions, divestitures and translational currency and is a non-GAAP financial measure. Investors should consider non-GAAP financial measures in addition to, and not as replacements for, or superior to, measures of financial performance prepared in accordance with GAAP. Due to the variable nature of acquisitions and divestitures, and the impact they may have on the analysis of underlying business performance and trends, management believes that providing this measure enhances an investor’s understanding of the Company’s performance and may assist in the evaluation of ongoing business operations period over period. This non-GAAP financial measure is presented to permit investors to more fully understand how management assesses the performance of the Company, including for internal evaluation of the performance of the Company's businesses and planning and forecasting for future periods. The use of this non-GAAP financial measure as a performance measure is limited in that it provides a view of the Company's results of operations without including all events during a period and may not provide a comparable view of the Company's performance to that of other companies in the health care industry.


Johnson & Johnson and Subsidiaries
Reconciliation of Non-GAAP Financial Measure
Adjusted Operational Sales Growth (A)
SIX MONTHS 2023 ACTUAL vs. 2022 ACTUAL
 Segments
Consumer Health Pharmaceutical MedTech Total
 WW As Reported 6.4 %3.7 %10.1 %6.0 %
 U.S. 8.6 %7.6 %15.5 %10.0 %
 International 4.7 %(0.7)%5.2 %2.0 %
 WW Currency (3.1)(1.8)(2.7)(2.2)
 U.S.
 International (5.4)(3.8)(5.1)(4.5)
 WW Operational 9.5 %5.5 %12.8 %8.2 %
 U.S. 8.6 %7.6 %15.5 %10.0 %
 International 10.1 %3.1 %10.3 %6.5 %
Abiomed(4.7)(1.4)
U.S.(8.2)(2.3)
International(1.6)(0.5)
All Other Acquisitions and Divestitures0.00.10.00.1
 U.S. 0.00.00.00.0
 International 0.00.30.00.2
WW Adjusted Operational9.5 %5.6 %8.1 %6.9 %
 U.S. 8.6 %7.6 %7.3 %7.7 %
 International 10.1 %3.4 %8.7 %6.2 %
Note: Percentages are based on actual, non-rounded figures and may not sum
(A) NON-GAAP FINANCIAL MEASURE “Adjusted operational sales growth" excludes acquisitions, divestitures and translational currency and is a non-GAAP financial measure. Investors should consider non-GAAP financial measures in addition to, and not as replacements for, or superior to, measures of financial performance prepared in accordance with GAAP. Due to the variable nature of acquisitions and divestitures, and the impact they may have on the analysis of underlying business performance and trends, management believes that providing this measure enhances an investor’s understanding of the Company’s performance and may assist in the evaluation of ongoing business operations period over period. This non-GAAP financial measure is presented to permit investors to more fully understand how management assesses the performance of the Company, including for internal evaluation of the performance of the Company's businesses and planning and forecasting for future periods. The use of this non-GAAP financial measure as a performance measure is limited in that it provides a view of the Company's results of operations without including all events during a period and may not provide a comparable view of the Company's performance to that of other companies in the health care industry.


Johnson & Johnson
Segment Sales
(Dollars in Millions)
SECOND QUARTER
% Change
20232022Reported
Operational (1)
Currency
CONSUMER HEALTH SEGMENT (2)
OTC
US$7126637.5 %7.5 %— %
Intl94781815.7 19.0 (3.3)
WW1,6591,48212.0 13.9 (1.9)
SKIN HEALTH / BEAUTY
US6506293.4 3.4 — 
Intl4984970.3 3.8 (3.5)
WW1,148 1,1262.0 3.5 (1.5)
ORAL CARE
US1731701.7 1.7 — 
Intl2252240.3 3.4 (3.1)
WW398 394 0.9 2.7 (1.8)
BABY CARE
US998812.5 12.5 — 
Intl261287(9.1)(4.0)(5.1)
WW360 375 (4.0)(0.2)(3.8)
WOMEN'S HEALTH
US43(2.1)(2.1)— 
Intl2352283.5 10.2 (6.7)
WW2382303.4 10.0 (6.6)
WOUND CARE / OTHER
US14913312.3 12.3 — 
Intl5865(10.3)(4.6)(5.7)
WW2071974.9 6.8 (1.9)
TOTAL CONSUMER HEALTH
US1,787 1,687 6.0 6.0  
Intl2,224 2,118 5.0 9.0 (4.0)
WW$4,011 3,805 5.4 %7.7 %(2.3)%
See footnotes at end of schedule


Johnson & Johnson
Segment Sales
(Dollars in Millions)
SECOND QUARTER
% Change
20232022Reported
Operational (1)
Currency
PHARMACEUTICAL SEGMENT (2) (3)
IMMUNOLOGY
US$2,8652,8530.4 %0.4 %— %
Intl1,6311,5594.7 6.6 (1.9)
WW4,4964,4111.9 2.6 (0.7)
     REMICADE
     US277391(29.3)(29.3)— 
     US Exports (4)
3344(24.9)(24.9)— 
     Intl152212(28.2)(25.2)(3.0)
     WW462647(28.6)(27.6)(1.0)
     SIMPONI / SIMPONI ARIA
     US285301(5.1)(5.1)— 
     Intl244266(8.2)(4.3)(3.9)
     WW529566(6.6)(4.7)(1.9)
     STELARA
     US1,8171,7314.9 4.9 — 
     Intl98186813.0 14.1 (1.1)
     WW2,7972,5997.6 8.0 (0.4)
     TREMFYA
     US450 382 17.8 17.8 — 
     Intl255 214 19.4 21.0 (1.6)
     WW706 597 18.3 18.9 (0.6)
     OTHER IMMUNOLOGY
     US4 3 17.817.8— 
     Intl0 0 — 
     WW4 3 17.817.8— 
INFECTIOUS DISEASES
US395415(4.9)(4.9)— 
Intl727901(19.4)(22.0)2.6 
WW1,1211,316(14.8)(16.6)1.8 
     COVID-19 VACCINE
     US 45**— 
     Intl285499(43.0)(47.4)4.4
     WW285544(47.7)(51.8)4.1
     EDURANT / rilpivirine
     US8 9 (9.0)(9.0)— 
     Intl258 215 19.917.32.6 
     WW266 225 18.616.22.4 
     PREZISTA / PREZCOBIX / REZOLSTA / SYMTUZA
     US3823557.67.6— 
     Intl109110(0.2)(1.0)0.8 
     WW4914645.85.60.2 
     OTHER INFECTIOUS DISEASES
     US56(27.2)(27.2)— 
     Intl7477(3.5)3.6(7.1)
     WW7983(5.2)1.3(6.5)
See footnotes at end of schedule


Johnson & Johnson
Segment Sales
(Dollars in Millions)
SECOND QUARTER
% Change
20232022Reported
Operational (1)
Currency
PHARMACEUTICAL SEGMENT (2) (3) (Continued)
NEUROSCIENCE
US$1,02989614.9%14.9%—%
Intl764837(8.8)(4.6)(4.2)
WW1,7931,7343.55.5(2.0)
     CONCERTA / methylphenidate
     US643868.268.2
     Intl14312316.321.3(5.0)
     WW20816128.632.4(3.8)
     INVEGA SUSTENNA / XEPLION / INVEGA
     TRINZA / TREVICTA
     US7216914.34.3
     Intl310362(14.4)(12.6)(1.8)
     WW1,0311,054(2.1)(1.5)(0.6)
     SPRAVATO
     US1447493.293.2
     Intl2511***
     WW1698598.298.5(0.3)
     OTHER NEUROSCIENCE
     US100939.39.3
     Intl286341(16.4)(9.9)(6.5)
     WW386433(10.9)(5.8)(5.1)
ONCOLOGY
US2,0691,67923.223.2
Intl2,3292,362(1.4)0.1(1.5)
WW4,3984,0428.89.7(0.9)
     CARVYKTI
US114 24 **
Intl3  ***
WW117 24 ***
     DARZALEX
     US1,322 1,021 29.529.5
     Intl1,110 965 15.017.0(2.0)
     WW2,431 1,986 22.423.4(1.0)
     ERLEADA
     US241 233 3.63.6
     Intl326 218 49.751.7(2.0)
     WW567 450 25.926.9(1.0)
     IMBRUVICA
     US262 349 (24.9)(24.9)
     Intl579 620 (6.7)(5.7)(1.0)
     WW841 970 (13.2)(12.6)(0.6)
     ZYTIGA / abiraterone acetate
     US919 (55.2)(55.2)
     Intl218486(55.1)(53.8)(1.3)
     WW227505(55.1)(53.8)(1.3)
     OTHER ONCOLOGY
     US122 33 **
     Intl927227.829.4(1.6)
     WW214106***
See footnotes at end of schedule


Johnson & Johnson
Segment Sales
(Dollars in Millions)
SECOND QUARTER
% Change
20232022Reported
Operational (1)
Currency
PHARMACEUTICAL SEGMENT (2) (3) (Continued)
PULMONARY HYPERTENSION
US$684 560 22.0 %22.0 %— %
Intl289 284 2.0 5.7 (3.7)
WW972 843 15.3 16.5 (1.2)
     OPSUMIT
     US328 265 23.7 23.7 — 
     Intl179 173 3.4 6.0 (2.6)
     WW507 438 15.7 16.7 (1.0)
     UPTRAVI
     US338 272 24.2 24.2 — 
     Intl61 56 10.0 14.1 (4.1)
     WW399 328 21.8 22.5 (0.7)
     OTHER PULMONARY HYPERTENSION
     US18 23 (23.8)(23.8)— 
     Intl48 55 (10.9)(3.7)(7.2)
     WW66 78 (14.7)(9.7)(5.0)
CARDIOVASCULAR / METABOLISM / OTHER
US7767572.6 2.6 — 
Intl174215(19.0)(18.3)(0.7)
WW950972(2.2)(2.0)(0.2)
     XARELTO
     US637 609 4.7 4.7 — 
     Intl  — — — 
     WW637 609 4.7 4.7 — 
     OTHER
     US138 148 (6.3)(6.3)— 
     Intl174 215 (19.0)(18.3)(0.7)
     WW313 363 (13.8)(13.4)(0.4)
TOTAL PHARMACEUTICAL
US7,8187,1599.2 9.2  
Intl5,9136,158(4.0)(2.5)(1.5)
WW$13,73113,3173.1 %3.8 %(0.7)%
See footnotes at end of schedule


Johnson & Johnson
Segment Sales
(Dollars in Millions)
SECOND QUARTER
% Change
20232022Reported
Operational (1)
Currency
MEDTECH SEGMENT (2) (3)
INTERVENTIONAL SOLUTIONS
US$908 525 73.1 %73.1 %— %
Intl712 52535.7 40.7 (5.0)
WW1,620 1,04954.4 56.9 (2.5)
ELECTROPHYSIOLOGY
US609 499 22.0 22.0 — 
Intl587 46925.1 30.0 (4.9)
WW1,196 96823.5 25.9 (2.4)
ABIOMED
US272 **— 
Intl59 ***
WW331 ***
OTHER INTERVENTIONAL SOLUTIONS
US27 26 4.5 4.5 — 
Intl67 56 20.0 25.3 (5.3)
WW93 8115.1 18.8 (3.7)
ORTHOPAEDICS
US1,388 1,338 3.7 3.7 — 
Intl878 820 7.0 9.0 (2.0)
WW2,265 2,157 5.0 5.7 (0.7)
     HIPS
     US250 240 4.1 4.1 — 
     Intl147 148 (0.8)1.2 (2.0)
     WW397 388 2.2 3.0 (0.8)
     KNEES
     US221 216 2.4 2.4 — 
     Intl142 133 6.3 8.0 (1.7)
     WW363 349 3.9 4.5 (0.6)
     TRAUMA
     US483 464 4.3 4.3 — 
     Intl255 232 9.9 10.9 (1.0)
     WW739 696 6.1 6.5 (0.4)
     SPINE, SPORTS & OTHER
     US433 418 3.5 3.5 — 
     Intl334 306 9.0 11.6 (2.6)
     WW766 724 5.8 7.0 (1.2)
See footnotes at end of schedule


Johnson & Johnson
Segment Sales
(Dollars in Millions)
SECOND QUARTER
% Change
20232022Reported
Operational (1)
Currency
MEDTECH SEGMENT (2) (3) (Continued)
SURGERY
US$1,015 992 2.2 %2.2 %— %
Intl1,580 1,458 8.4 12.6 (4.2)
WW2,594 2,450 5.9 8.4 (2.5)
     ADVANCED
US466 454 2.7 2.7  
Intl757 702 7.8 12.1 (4.3)
WW1,222 1,156 5.8 8.4 (2.6)
     GENERAL
US548 538 1.9 1.9  
Intl823 756 8.9 13.1 (4.2)
WW1,372 1,294 6.0 8.4 (2.4)
VISION
US529 496 6.6 6.6  
Intl778 745 4.6 7.1 (2.5)
WW1,308 1,241 5.4 6.9 (1.5)
     CONTACT LENSES / OTHER
US409 374 9.1 9.1  
Intl530 519 2.2 4.8 (2.6)
WW939 894 5.1 6.6 (1.5)
     SURGICAL
US120 122 (1.1)(1.1)— 
Intl249 225 10.112.3 (2.2)
WW369 347 6.27.6(1.4)
TOTAL MEDTECH
US3,839 3,351 14.6 14.6  
Intl3,949 3,547 11.3 14.7 (3.4)
WW$7,788 6,898 12.9 %14.7 %(1.8)%
See footnotes at end of schedule


Johnson & Johnson
Segment Sales
(Dollars in Millions)
SIX MONTHS
% Change
20232022Reported
Operational (1)
Currency
CONSUMER HEALTH SEGMENT (2)
OTC
US$1,4571,3339.3 %9.3 %— %
Intl1,8441,60914.6 19.4 (4.8)
WW3,3012,94312.2 14.8 (2.6)
SKIN HEALTH / BEAUTY
US1,2671,1738.0 8.0 — 
Intl9919652.7 8.1 (5.4)
WW2,258 2,1385.6 8.0 (2.4)
ORAL CARE
US3323136.2 6.2 — 
Intl427447(4.7)(0.3)(4.4)
WW759 760 (0.2)2.4 (2.6)
BABY CARE
US19517312.7 12.7 — 
Intl524557(6.0)0.1 (6.1)
WW719 730 (1.6)3.1 (4.7)
WOMEN'S HEALTH
US77(0.1)(0.1)— 
Intl449452(0.7)7.2 (7.9)
WW455458(0.6)7.1 (7.7)
WOUND CARE / OTHER
US2642457.9 7.9 — 
Intl107117(8.4)(1.5)(6.9)
WW3713612.6 4.9 (2.3)
TOTAL CONSUMER HEALTH
US3,522 3,244 8.6 8.6  
Intl4,341 4,147 4.7 10.1 (5.4)
WW$7,863 7,391 6.4 %9.5 %(3.1)%
See footnotes at end of schedule


Johnson & Johnson
Segment Sales
(Dollars in Millions)
SIX MONTHS
% Change
20232022Reported
Operational (1)
Currency
PHARMACEUTICAL SEGMENT (2) (3)
IMMUNOLOGY
US$5,3135,354(0.8)%(0.8)%— %
Intl3,2953,1763.8 8.2 (4.4)
WW8,6088,5300.9 2.6 (1.7)
     REMICADE
     US553749(26.2)(26.2)— 
     US Exports (4)
74124(40.3)(40.3)— 
     Intl322437(26.2)(22.5)(3.7)
     WW9491,310(27.5)(26.3)(1.2)
     SIMPONI / SIMPONI ARIA
     US556588(5.4)(5.4)— 
     Intl510549(7.1)(1.1)(6.0)
     WW1,0661,137(6.2)(3.3)(2.9)
     STELARA
     US3,2683,1105.1 5.1 — 
     Intl1,9741,77711.1 15.2 (4.1)
     WW5,2414,8877.2 8.7 (1.5)
     TREMFYA
     US856 773 10.7 10.7 — 
     Intl489 413 18.4 22.8 (4.4)
     WW1,346 1,187 13.4 15.0 (1.6)
     OTHER IMMUNOLOGY
     US7 9 (30.2)(30.2)— 
     Intl0 0 — 
     WW7 9 (30.2)(30.2)— 
INFECTIOUS DISEASES
US787876(10.2)(10.2)— 
Intl1,9201,73710.512.3(1.8)
WW2,7072,6133.64.7(1.1)
     COVID-19 VACCINE
     US120**— 
     Intl1,03288117.118.4(1.3)
     WW1,0321,0013.04.2(1.2)
     EDURANT / rilpivirine
     US17 18 (5.3)(5.3)— 
     Intl529 454 16.418.0(1.6)
     WW546 473 15.617.1(1.5)
     PREZISTA / PREZCOBIX / REZOLSTA / SYMTUZA
     US7607245.05.0— 
     Intl208242(13.9)(12.1)(1.8)
     WW9689650.30.7(0.4)
     OTHER INFECTIOUS DISEASES
     US1014(30.6)(30.6)— 
     Intl151160(5.6)(1.2)(4.4)
     WW161174(7.6)(3.6)(4.0)
See footnotes at end of schedule


Johnson & Johnson
Segment Sales
(Dollars in Millions)
SIX MONTHS
% Change
20232022Reported
Operational (1)
Currency
PHARMACEUTICAL SEGMENT (2) (3) (Continued)
NEUROSCIENCE
US$2,0071,73915.4%15.4%—%
Intl1,5901,735(8.4)(3.8)(4.6)
WW3,5973,4753.55.8(2.3)
     CONCERTA / methylphenidate
     US1347384.084.0
     Intl27924513.920.7(6.8)
     WW41431830.035.3(5.3)
     INVEGA SUSTENNA / XEPLION / INVEGA
     TRINZA / TREVICTA
     US1,4341,3526.06.0
     Intl641749(14.5)(10.7)(3.8)
     WW2,0752,102(1.3)0.1(1.4)
     SPRAVATO
     US25513588.388.3
     Intl4520***
     WW30015593.193.8(0.7)
     OTHER NEUROSCIENCE
     US1841793.13.1
     Intl625721(13.4)(8.7)(4.7)
     WW809900(10.1)(6.4)(3.7)
ONCOLOGY
US3,9583,26121.421.4
Intl4,5524,731(3.8)0.0(3.8)
WW8,5107,9926.58.8(2.3)
     CARVYKTI
US184 24 **
Intl5  ***
WW189 24 ***
     DARZALEX
     US2,513 1,974 27.327.3
     Intl2,182 1,868 16.821.5(4.7)
     WW4,695 3,842 22.224.5(2.3)
     ERLEADA
     US490 439 11.811.8
     Intl619 412 50.355.9(5.6)
     WW1,109 850 30.433.2(2.8)
     IMBRUVICA
     US532 719 (26.0)(26.0)
     Intl1,136 1,288 (11.8)(8.8)(3.0)
     WW1,668 2,008 (16.9)(15.0)(1.9)
     ZYTIGA / abiraterone acetate
     US2538 (34.7)(34.7)
     Intl4471,006(55.6)(53.0)(2.6)
     WW4721,044(54.8)(52.3)(2.5)
     OTHER ONCOLOGY
     US214 67 **
     Intl1621563.67.1(3.5)
     WW37622468.070.4(2.4)
See footnotes at end of schedule


Johnson & Johnson
Segment Sales
(Dollars in Millions)
SIX MONTHS
% Change
20232022Reported
Operational (1)
Currency
PHARMACEUTICAL SEGMENT (2) (3) (Continued)
PULMONARY HYPERTENSION
US$1,284 1,132 13.4 %13.4 %— %
Intl561 563 (0.4)5.5 (5.9)
WW1,844 1,695 8.8 10.8 (2.0)
     OPSUMIT
     US601 538 11.6 11.6 — 
     Intl346 343 0.9 6.1 (5.2)
     WW947 881 7.5 9.5 (2.0)
     UPTRAVI
     US642 541 18.7 18.7 — 
     Intl119 112 6.6 11.7 (5.1)
     WW761 653 16.6 17.5 (0.9)
     OTHER PULMONARY HYPERTENSION
     US41 53 (23.0)(23.0)— 
     Intl95 108 (11.7)(2.8)(8.9)
     WW136 161 (15.5)(9.5)(6.0)
CARDIOVASCULAR / METABOLISM / OTHER
US1,4911,4294.3 4.3 — 
Intl386453(14.7)(12.0)(2.7)
WW1,8771,882(0.3)0.4 (0.7)
     XARELTO
     US1,215 1,117 8.8 8.8 — 
     Intl  — — — 
     WW1,215 1,117 8.8 8.8 — 
     OTHER
     US275 312 (11.8)(11.8)— 
     Intl386 453 (14.7)(12.0)(2.7)
     WW662 765 (13.5)(11.9)(1.6)
TOTAL PHARMACEUTICAL
US14,84113,7917.6 7.6  
Intl12,30312,395(0.7)3.1 (3.8)
WW$27,14426,1863.7 %5.5 %(1.8)%
See footnotes at end of schedule


Johnson & Johnson
Segment Sales
(Dollars in Millions)
SIX MONTHS
% Change
20232022Reported
Operational (1)
Currency
MEDTECH SEGMENT (2) (3)
INTERVENTIONAL SOLUTIONS
US$1,771 1,019 73.8 %73.8 %— %
Intl1,352 1,12320.5 27.0 (6.5)
WW3,123 2,14145.8 49.3 (3.5)
ELECTROPHYSIOLOGY
US1,180 969 21.7 21.7 — 
Intl1,109 1,00110.8 17.3 (6.5)
WW2,288 1,97016.2 19.5 (3.3)
ABIOMED
US536  **— 
Intl119 ***
WW655 ***
OTHER INTERVENTIONAL SOLUTIONS
US55 51 10.8 10.8 — 
Intl125 1212.8 8.9 (6.1)
WW180 1715.1 9.5 (4.4)
ORTHOPAEDICS
US2,751 2,627 4.7 4.7 — 
Intl1,759 1,719 2.3 6.4 (4.1)
WW4,510 4,345 3.8 5.4 (1.6)
     HIPS
     US491 465 5.6 5.6 — 
     Intl296 312 (5.1)(1.3)(3.8)
     WW787 777 1.3 2.8 (1.5)
     KNEES
     US447 417 7.2 7.2 — 
     Intl284 271 4.8 8.8 (4.0)
     WW731 688 6.3 7.9 (1.6)
     TRAUMA
     US974 939 3.7 3.7 — 
     Intl522 505 3.2 7.0 (3.8)
     WW1,496 1,444 3.6 4.9 (1.3)
     SPINE, SPORTS & OTHER
     US839 805 4.1 4.1 — 
     Intl657 630 4.2 8.7 (4.5)
     WW1,495 1,436 4.2 6.1 (1.9)
See footnotes at end of schedule


Johnson & Johnson
Segment Sales
(Dollars in Millions)
SIX MONTHS
% Change
20232022Reported
Operational (1)
Currency
MEDTECH SEGMENT (2) (3) (Continued)
SURGERY
US$1,990 1,913 4.0 %4.0 %— %
Intl3,039 2,971 2.3 7.7 (5.4)
WW5,028 4,884 3.0 6.3 (3.3)
     ADVANCED
US910 871 4.5 4.5  
Intl1,430 1,431 0.0 5.3 (5.3)
WW2,340 2,302 1.7 5.0 (3.3)
     GENERAL
US1,079 1,042 3.6 3.6  
Intl1,608 1,540 4.5 10.0 (5.5)
WW2,688 2,582 4.1 7.4 (3.3)
VISION
US1,087 1,017 6.9 6.9  
Intl1,521 1,481 2.7 7.5 (4.8)
WW2,608 2,498 4.4 7.2 (2.8)
     CONTACT LENSES / OTHER
US853 774 10.1 10.1  
Intl1,039 1,030 0.9 6.3 (5.4)
WW1,892 1,804 4.9 8.0 (3.1)
     SURGICAL
US234 243 (3.6)(3.6)— 
Intl482 451 6.710.2 (3.5)
WW716 694 3.15.4(2.3)
TOTAL MEDTECH
US7,598 6,576 15.5 15.5  
Intl7,671 7,293 5.2 10.3 (5.1)
WW$15,269 13,869 10.1 %12.8 %(2.7)%
See footnotes at end of schedule
Note: Column and rows within tables may not add due to rounding. Percentages have been calculated using actual, non-
rounded figures and, therefore, may not recalculate precisely.
* Percentage greater than 100% or not meaningful
(1) Operational growth excludes the effect of translational currency
(2) Unaudited
(3) Certain prior year amounts have been reclassified to conform to current year product disclosures
(4) Reported as U.S. sales


Supplemental Sales Reconciliation (Unaudited)
(Dollars in Millions)
SECOND QUARTER
Percent Change
20232022TotalOperationsCurrency
Pharmaceutical
U.S.$7,818  7,159  9.2 %  9.2  -
International 5,913  6,158  (4.0) (2.5) (1.5)
Worldwide 13,731  13,317  3.1  3.8  (0.7)
COVID-19 Vaccine
U.S. -  45  *  *  -
International 285  499  (43.0) (47.4) 4.4
Worldwide 285  544  (47.7) (51.8) 4.1
Pharmaceutical excluding COVID-19 Vaccine
U.S. 7,818  7,114  9.9  9.9  -
International 5,628  5,659  (0.5) 1.5  (2.0)
Worldwide 13,446  12,773  5.3  6.2  (0.9)
Worldwide
U.S. 13,444  12,197  10.2  10.2  -
International 12,086  11,823  2.2  4.7  (2.5)
Worldwide 25,530  24,020  6.3  7.5  (1.2)
COVID-19 Vaccine
U.S. -  45  *  *  -
International 285  499  (43.0) (47.4) 4.4
Worldwide 285  544  (47.7) (51.8) 4.1
Worldwide
U.S. 13,444  12,152  10.6  10.6  -
International 11,801  11,324  4.2  7.0  (2.8)
Worldwide excluding COVID-19 Vaccine$25,245  23,476  7.5 % 8.9  (1.4)
Note: Columns and rows within tables may not add due to rounding
* Percentage greater than 100% or not meaningful


Supplemental Sales Reconciliation (Unaudited)
(Dollars in Millions)
SIX MONTHS
Percent Change
20222021TotalOperationsCurrency
Pharmaceutical
U.S.$14,841  13,791  7.6 % 7.6  -
International 12,303  12,395  (0.7) 3.1  (3.8)
Worldwide 27,144  26,186  3.7  5.5  (1.8)
COVID-19 Vaccine
U.S. -  120  *  *  -
International 1,032  881  17.1  18.4  (1.3)
Worldwide 1,032  1,001  3.0  4.2  (1.2)
Pharmaceutical excluding COVID-19 Vaccine
U.S. 14,841  13,671  8.6  8.6  -
International 11,271  11,514  (2.1) 1.9  (4.0)
Worldwide 26,112  25,185  3.7  5.5  (1.8)
Worldwide
U.S. 25,961  23,611  10.0  10.0  -
International 24,315  23,835  2.0  6.5  (4.5)
Worldwide 50,276  47,446  6.0  8.2  (2.2)
COVID-19 Vaccine
U.S. -  120  *  *  -
International 1,032  881  17.1  18.4  (1.3)
Worldwide 1,032  1,001  3.0  4.2  (1.2)
Worldwide
U.S. 25,961  23,491  10.5  10.5  -
International 23,283  22,954  1.4  6.1  (4.7)
Worldwide excluding COVID-19 Vaccine$49,244  46,445  6.0 % 8.3  (2.3)
Note: Columns and rows within tables may not add due to rounding
* Percentage greater than 100% or not meaningful